final summary report structural integrity assessment fly ... · aecom final summary report...
TRANSCRIPT

Submitted to Arizona Public Service Generation Engineering P.O. Box 53999 Phoenix, AZ 85072
Submitted by AECOM 7720 North 16
th Street
Suite 100 Phoenix, AZ 85020 August 26, 2016
Final Summary Report Structural Integrity Assessment
Fly Ash Pond Cholla Power Plant Joseph City, Arizona
Prepared for: Arizona Public Service
AECOM Job No. 60445840 August 2016
AECOM Final Summary Report
Structural Integrity Assessment
Fly Ash Pond
Cholla Power Plant
Arizona Public Service
i
August 2016
AECOM Job No. 60445840
Certification Statement .............................................................................................................................................................. 1 1 Introduction ......................................................................................................................................................................... 1-1
1.1 Report Purpose and Description .................................................................................................................................. 1-1 1.2 EPA Regulatory Requirements ..................................................................................................................................... 1-1 1.3 Report Organization ..................................................................................................................................................... 1-2 1.4 Facility Description ....................................................................................................................................................... 1-2
2 Hazard Potential Classification .......................................................................................................................................... 2-1
2.1 Methodology and Design Criteria ................................................................................................................................. 2-1 2.2 Hazard Potential Classification Results ........................................................................................................................ 2-1
3 History of Construction ...................................................................................................................................................... 3-1
3.1 Methodology ................................................................................................................................................................. 3-1 3.2 Fly Ash Pond Construction Summary ........................................................................................................................... 3-1
4 Structural Stability Assessment ........................................................................................................................................ 4-1
4.1 Foundation and Abutments .......................................................................................................................................... 4-1 4.2 Slope Protection ........................................................................................................................................................... 4-1 4.3 Dike Compaction .......................................................................................................................................................... 4-2 4.4 Slope Vegetation .......................................................................................................................................................... 4-2 4.5 Impoundment Capacity................................................................................................................................................. 4-2 4.6 Hydraulic Structures ..................................................................................................................................................... 4-3 4.7 Downstream Water Body.............................................................................................................................................. 4-3 4.8 Other Deficiencies ........................................................................................................................................................ 4-3 4.9 Structural Stability Assessment Results ....................................................................................................................... 4-3
5 Safety Factor Assessment ................................................................................................................................................. 5-1
5.1 Methodology and Design Criteria ................................................................................................................................. 5-1 5.2 Critical Cross Section ................................................................................................................................................... 5-1 5.3 Subsurface Stratigraphy ............................................................................................................................................... 5-2 5.4 Material Properties ....................................................................................................................................................... 5-2 5.5 Embankment Pore Pressure Distribution...................................................................................................................... 5-3 5.6 Embankment Loading Conditions ................................................................................................................................. 5-4 5.7 Safety Factor Assessment Results ............................................................................................................................... 5-5
6 Conclusions ........................................................................................................................................................................ 6-1 7 Limitations ........................................................................................................................................................................... 7-1 8 References ........................................................................................................................................................................... 8-1
Table of Contents

AECOM Final Summary Report
Structural Integrity Assessment
Fly Ash Pond
Cholla Power Plant
Arizona Public Service
ii
August 2016
AECOM Job No. 60445840
List of Appendices
Appendix A. Historic Drawings
Appendix B. Safety Factor Calculation
List of Tables
Table 3-1. History of Construction for Cholla Fly Ash Pond ...................................................................................................... 3-2
Table 5-1. Selected Material Parameters – Fly Ash Pond Safety Factor Assessment .............................................................. 5-3
Table 5-2. Range of Plasticity Index and Fines Content Values for Site Materials .................................................................... 5-5
Table 5-3. Summary of Calculated Safety Factors .................................................................................................................... 5-5
List of Figures
Figure 1-1. Site Vicinity Map ................................................................................................................................................. FIG-2
Figure 1-2. Fly Ash Pond Monitored Instrumentation and Seepage Location Map ............................................................... FIG-3
Figure 3-1. Site Topography Map .......................................................................................................................................... FIG-4
Figure 3-2. Area Capacity Curve ........................................................................................................................................... FIG-5
Figure 5-1. Cross Section Locations for Safety Factor Assessment...................................................................................... FIG-6
AECOM Final Summary Report
Structural Integrity Assessment
Fly Ash Pond
Cholla Power Plant
Arizona Public Service
iii
August 2016
AECOM Job No. 60445840
List of Acronyms
ADWR Arizona Department of Water Resources
APS Arizona Public Service
CCR Coal Combustion Residual
CFR Code of Federal Regulations
EAP Emergency Action Plan
EPA Environmental Protection Agency
ft feet
HPC Hazard Potential Classification
pcf pounds per cubic foot
PMF Probable Maximum Flood
USCS Unified Soil Classification System
USGS United States Geological Survey
AECOM Final Summary Report
Structural Integrity Assessment
Fly Ash Pond
Cholla Power Plant
Arizona Public Service
CS-1
August 2016
AECOM Job No. 60445840
Certification Statement for:
40 CFR § 257.73(a)(2)(ii) – Initial Hazard Potential Classification for an Existing CCR Surface Impoundment
40 CFR § 257.73(d)(3) – Initial Structural Stability Assessment for an Existing CCR Surface Impoundment
40 CFR § 257.73(e)(2) – Initial Safety Factor Assessment for an Existing CCR Surface Impoundment
CCR Unit: Arizona Public Service Company; Cholla Power Plant; Fly Ash Pond
I, Alexander Gourlay, being a Registered Professional Engineer in good standing in the State of New Mexico, do hereby
certify, to the best of my knowledge, information, and belief, that the information contained in this certification has been
prepared in accordance with the accepted practice of engineering. I certify, for the above-referenced CCR Unit, that the initial
hazard potential classification, initial structural stability assessment, and initial safety factor assessment as included in the
Structural Integrity Assessment Report dated August 26, 2016 was conducted in accordance with the requirements of 40 CFR
§ 257.73.
________________________________
Printed Name
________________________________
Date
Certification Statement
Alexander W. Gourlay, P.E.
August 26, 2016

AECOM Final Summary Report
Structural Integrity Assessment
Fly Ash Pond
Cholla Power Plant
Arizona Public Service
1-1
August 2016
AECOM Job No. 60445840
Arizona Public Service Company (APS) contracted URS Corporation, a wholly owned subsidiary of AECOM, to assist in the
initial structural integrity assessment of the existing coal combustion residual (CCR) surface impoundments at the Cholla
Power Plant in Joseph City, Arizona. Figure 1-1 shows the location of the CCR Impoundments at the Cholla Power Plant. This
Summary Report documents the AECOM structural integrity assessment for the Fly Ash Pond, Arizona Department of Water
Resources (ADWR) Dam No. 09.28. Assessments of other CCR Impoundments at the Cholla Power Plant are presented in
separate reports.
1.1 Report Purpose and Description
The purpose of this report is to document the initial structural integrity assessment for the Fly Ash Pond located at the Cholla
Power Plant. The Fly Ash Pond is an existing CCR surface impoundment owned and operated by APS that is regulated by the
Arizona Department of Water Resources (ADWR). In 2015, the United States Environmental Protection Agency (EPA)
finalized Federal Rule (Rule) 40 Code of Federal Regulations (CFR) § 257.73 (EPA, 2015) regulating CCRs under Subtitle D
of the Resource Conservation and Recovery Act. As part of this Rule, owners and operators of existing CCR surface
impoundments must complete initial and periodic structural integrity assessments to document whether the CCR unit poses a
reasonable probability of adverse effects on health and the environment.
1.2 EPA Regulatory Requirements
Pursuant to Rule 40 CFR § 257.73 (EPA, 2015), each existing CCR surface impoundment must have initial and periodic
structural integrity assessments to evaluate whether the CCR unit poses a reasonable probability of adverse effects on health
and the environment. The assessment must address the following elements:
Periodic Hazard Potential Classification Assessment (40 CFR § 257.73(a)(2)) - Document the hazard potential
classification of each CCR unit as either a high hazard, significant hazard, or low hazard potential CCR unit.
Emergency Action Plan (EAP) (40 CFR § 257.73(a)(3)) - Prepare and maintain a written EAP for high and significant
hazard CCR units. The EAP must be evaluated at least every five years and, if necessary, updated and revised to
maintain accurate information of current CCR unit conditions. The evaluation and certification of the EAP is provided
in a separate report.
In addition, the following elements must be addressed for CCR units, such as the Fly Ash Pond, that have a height of five feet
(ft) or more and a storage volume of 20 acre-ft or more, or have a height of 20 ft or more:
History of Construction (40 CFR § 257.73(c)(1)) - Compile a history of construction of the CCR unit including
elements of operation, location, design, monitoring instrumentation, maintenance and repair, and historic structural
instabilities.
Periodic Structural Stability Assessment (40 CFR § 257.73(d)) - Document whether the design, construction,
operation and maintenance of the CCR unit is consistent with recognized and generally accepted good engineering
practice for the maximum volume of CCR and CCR wastewater which can be impounded therein.
Periodic Safety Factor Assessment (40 CFR § 257.73(e)) - Document whether the calculated factors of safety for
each CCR unit achieve minimum safety factors for the critical cross section of the embankment under long-term,
maximum storage pool loading conditions, maximum surcharge loading conditions, seismic loading conditions, and
post-earthquake loading conditions for dikes constructed of soils susceptible to liquefaction.
1 Introduction

AECOM Final Summary Report
Structural Integrity Assessment
Fly Ash Pond
Cholla Power Plant
Arizona Public Service
1-2
August 2016
AECOM Job No. 60445840
Existing CCR surface impoundments, such as the Fly Ash Pond, are required to have an initial structural integrity assessment
within 18 months of publication of the EPA Rule on April 17, 2015 and subsequent periodic assessments performed every five
years thereafter.
1.3 Report Organization
This Summary Report has been organized into the following sections:
Report Section Applicable CFR 40 Part 257 Citation
Section 1 – Introduction
Section 2 – Hazard Potential Classification § 257.73(a)(2) Periodic hazard classification assessments
Section 3 – History of Construction § 257.73(c)(1) History of construction
Section 4 – Structural Stability Assessment § 257.73(d) Periodic structural stability assessment
Section 5 – Safety Factor Assessment § 257.73(e) Periodic safety factor assessment
Section 6 – Conclusions
Section 7 – Limitations
Section 8 – References
Figures
Appendix A – Historic Drawings
Appendix B – Safety Factor Calculation
1.4 Facility Description
The Cholla Power Plant is an electric generating station located in the town of Joseph City, Navajo County, Arizona. The
station consists of four coal-fired units. Units 1, 2 (decommissioned), and 3 are owned by APS and Unit 4 is owned by
PacifiCorp. CCR generated at the power plant are disposed of at two major surface impoundments located off-site; the Fly Ash
Pond located about one-and-a-half miles east of the plant and the Bottom Ash Pond located about two miles north of the plant.
Figure 1-1 shows the location of the Fly Ash Pond and Bottom Ash Pond in relation to the power plant. This assessment
evaluates the structural integrity of the Fly Ash Pond.
The Fly Ash Pond receives discharges from the following sources: Slurry Disposal; General Water Sump; Fly Ash Pond
Seepage Collection System; Sedimentation Pond Solids; Unit 3 and Unit 4 Cooling Tower(s) Basin Solids; General Water
Sump Solids; Unit 1, 2, 3, and 4 Oil Water Separator Solids; WARP Solids; CCR Wastes; Flue Gas Desulfurization Wastes;
and Fly Ash Pond Area Stormwater. The CCR and other wastes are pumped as slurry through three 6-inch diameter pipes into
the impoundment where the solids settle out and the remaining water evaporates. There is no means to return the excess
water to the plant for reuse.
The Fly Ash Pond has a total surface area of about 420 acres and storage capacity of about 16,500 acre-feet when at its
permitted maximum storage pool water level of EL 5,114 ft (ADWR, 1986). The impoundment is surrounded on its west, north,
and east sides by natural topography consisting of rock outcrops of mudstones, siltstones, and sandstones. On the south side,
the impoundment is enclosed by the Fly Ash Pond Dam, ADWR Dam No. 09.28, which spans the width of a natural wash. The
Fly Ash Pond has been classified under ADWR regulations as a high hazard impoundment due to the probable loss of human
life at the nearby U.S. Interstate 40 (I-40), Cholla Power Plant, freight railroad line, and downstream residences, in the event of
a dam breach.

AECOM Final Summary Report
Structural Integrity Assessment
Fly Ash Pond
Cholla Power Plant
Arizona Public Service
1-3
August 2016
AECOM Job No. 60445840
The Fly Ash Pond Dam is an earthen, zoned embankment dam consisting of a central clay core surrounded by an outer sand
and gravel shell (random material zone). Construction began on the dam in 1976 and it started receiving CCR materials in
1978. The dam is approximately 4,580 ft in length and is composed of two linear segments. The western most segment starts
at the right abutment and extends approximately 3,100 ft to a rock outcropping referred to as Geronimo Knob. At Geronimo
Knob the dam centerline pivots approximately 40 degrees to the north forming the second linear segment which extends to the
left abutment. The maximum height of the dam occurs between the right abutment and Geronimo Know with a maximum toe to
crest height of 80 ft and crest width of 24 ft. The top of crest elevation is 5,120 ft producing 6 ft of total freeboard above the
maximum permitted storage pool water level. Both the upstream and downstream slopes are inclined at a three horizontal to
one vertical (3H:1V) angle with riprap facing to prevent erosion.
To limit seepage beneath the foundation, the central clay core of the Fly Ash Pond Dam extends to bedrock at relatively
shallow depths, less than 20 ft. In the center portion of the dam where the depth to bedrock is greater than 20 ft, a slurry cutoff
wall extends from the clay core to into the bedrock. The Fly Ash Pond Dam has no internal drain system; however, where
seepage has been observed downstream of the dam, sumps have been installed to collect surface and groundwater and
return it to the pond. These include systems for the Geronimo and Hunt Seeps that collect and return the water back to the Fly
Ash Pond and the I-40 Seep that collects the water for evaporation.
The Fly Ash Pond has no intake or outlet water work structures. Water levels within the pond are controlled by varying the
pumping rate from the plant and seepage collection system to balance with seepage and evaporation from the pond. Sluiced
fly ash is pumped from the plant to the pond through three 6-inch diameter pressured discharge lines. The lines pass
underneath of I-40, proceed up the downstream face of the embankment, pass over the dam crest, and empty into the pond
basin. The dam was constructed without an overflow spillway channel. To prevent overtopping during the design storm event,
defined as the probable maximum flood (PMF), the pond was constructed to fully contain the storm runoff on top of the
maximum permitted storage pool water level. This water level, defined as the maximum surcharge pool water level, is
estimated at EL 5,116 ft based on an expected water level rise of 2.0 ft during the PMF (Ebasco, 1976).
Piezometers, settlement monuments, flow measurement devices, and water level gauges are installed at the Fly Ash Pond to
monitor the performance of the dam. Measurements from the monitoring instruments are reviewed and documented annually
in a data report. Starting on October 19, 2015, the piezometer, survey monuments, and flow totalizers are read at intervals not
exceeding 30 days per the requirements of 40 CFR § 257.83(a)(1)(iii). The locations of the monitored piezometers, survey
monuments, and flow totalizers are shown on Figure 1-2.
Inspections of the Fly Ash Pond are performed by a qualified person at intervals not exceeding seven days. The inspections
examine the Fly Ash Pond for actual or potential conditions that could disrupt the operation or safety of the impoundment and
documents the results of the inspection in the facility’s operating record. In addition, a more detailed annual inspection is
performed by a qualified professional engineer. The annual inspection includes a review of available information on the dam,
including the past year of monitoring data, a field inspection of the dam, abutment, and downstream toe and documentation of
findings and recommendations in a dam safety inspection report. The most recent annual inspection of the Fly Ash Pond was
performed on October 16, 2015 (AECOM & APS, 2016).
AECOM Final Summary Report
Structural Integrity Assessment
Fly Ash Pond
Cholla Power Plant
Arizona Public Service
2-1
August 2016
AECOM Job No. 60445840
This section summarizes the initial Hazard Potential Classification (HPC) for the Fly Ash Pond. This initial HPC is intended to
meet the requirement for periodic hazard potential classification assessment of existing CCR surface impoundments per Rule
40 CFR § 257.73(a)(2).
2.1 Methodology and Design Criteria
Per the Rule, the hazard potential classification provides an indication of the possible adverse incremental consequences that
result from the release of water or stored contents due to failure or mis-operation of the CCR surface impoundment. The
classification is based solely on the consequences of failure. As such, it is not dependent of the condition of the embankment
or the likelihood of failure. Classifications per the Rule are separate from relevant and/or applicable federal, state or local dam
safety regulatory standards, which may also include hazard classification definitions, and are not intended to substitute for
other regulatory hazard potential classifications.
Rule 40 CFR § 257.53 defines three hazard potential classifications as follows:
High hazard potential CCR surface impoundment – A diked surface impoundment where failure or mis-operation will
probably cause loss of human life.
Significant hazard potential CCR surface impoundment – A diked surface impoundment where failure or mis-operation
results in no probable loss of human life, but can cause economic loss, environmental damage, disruption of lifeline facilities,
or impact other concerns.
Low hazard potential CCR surface impoundment – A diked surface impoundment where failure or mis-operation results in
no probable loss of life and low economic and/or environmental losses. Losses are principally limited to the surface
impoundment’s owner’s property.
The hazard potential of the Fly Ash Pond was assessed qualitatively, per the above definitions. The qualitative assessment
process is generally performed in a step-wise manner by first determining whether the pond could be classified as low hazard
potential, based on immediately obvious factors such as proximity to property lines and/or surface water bodies. After
determining that a structure does not meet the criteria for a Low Hazard Potential classification, the structure is assessed to
determine whether it meets the criteria for High Hazard Potential. The potential for loss of life differentiates between high and
significant hazard potential in the Final CCR Rule; therefore, if the Dam does not meet the criteria for high hazard potential, it
would be classified as a Significant Hazard Potential structure.
The potential for downstream loss of life is assessed by reviewing land use in areas downstream (to the south) from the Dam,
where inundation is likely in the event of a release. No quantitative dam break or inundation studies were performed. The
United States Geological Survey (USGS) 7.5-Minute Quadrangle topographic map of Joseph City, Arizona and associated
digital orthoimage data (USGS, 2013) were used to review downstream areas for existing permanent and temporary land use.
Permanent land uses include permanently inhabited dwellings and worksite areas that would likely contain workers on a daily
basis (public utilities, power plants, water and sewage treatment plants, private industrial plants, sand and gravel plants, farm
operations, fish hatcheries). Temporary land uses include primary roads, established campgrounds, or other recreational
areas.
2.2 Hazard Potential Classification Results
Inspection of the Fly Ash Pond Dam and its immediate surrounding based on review of the USGS 7.5-Minute Quadrangle
topographic map of Joseph City, AZ (USGS, 2013) identifies that the downstream toe of the Fly Ash Pond Dam is located
within 100 ft of Interstate 40 (I-40), a major east-west route of the Interstate Highway System. A catastrophic and unexpected
2 Hazard Potential Classification

AECOM Final Summary Report
Structural Integrity Assessment
Fly Ash Pond
Cholla Power Plant
Arizona Public Service
2-2
August 2016
AECOM Job No. 60445840
failure of the Fly Ash Pond Dam would likely inundate the travel lanes of I-40 and could result in loss of life. The Fly Ash Pond
is therefore classified as a High Hazard Potential CCR surface impoundment.

AECOM Final Summary Report
Structural Integrity Assessment
Fly Ash Pond
Cholla Power Plant
Arizona Public Service
3-1
August 2016
AECOM Job No. 60445840
This section summarizes the history of construction for the Fly Ash Pond. This information is intended to meet the requirement
for compilation of the history of construction for each CCR surface impoundment per Rule 40 CFR § 257.73(c)(1).
3.1 Methodology
AECOM reviewed available documents obtained from APS, the ADWR Document Repository, or in-house resources for
information regarding the history of construction for the Fly Ash Pond. Per the Rule, the compiled history of construction
should include, to the extent feasible, the following information:
Information identifying the CCR Unit, its purpose and the name and address of the owner/operator;
The location of the CCR unit on the most recent USGS or other topographic map;
Name and size of the watershed within which the CCR unit is located;
A description of the physical and engineering properties of the foundation and abutment materials on which the CCR
unit was constructed;
A description of the type, size, and physical and engineering properties of each embankment zone;
Provide detailed engineering drawings;
A description of the type, purpose and location of existing instruments;
Area-capacity curves for the CCR unit;
A description of spillway and diversion design features;
Construction specifications and provisions for surveillance, maintenance, and repair of the CCR unit; and
Any record of knowledge of structural instability.
3.2 Fly Ash Pond Construction Summary
The history of construction dating back to the original construction that began in 1976 is summarized in Table 3-1 below.
3 History of Construction

AECOM Final Summary Report
Structural Integrity Assessment
Fly Ash Pond
Cholla Power Plant
Arizona Public Service
3-2
August 2016
AECOM Job No. 60445840
Table 3-1. History of Construction for Cholla Fly Ash Pond
Item As-Constructed/ Current Comments Reference Document
Name and Address of Owner Arizona Public Service Company (APS): P.O. Box 53999, Phoenix, Arizona 85072
--- ---
State ID No. 09.28 --- ADWR License of Approval dated October 8, 1986
Size Classification Intermediate --- Annual CCR Impoundment and Landfill Inspection Report 2015 (AECOM & APS, 2016)
Hazard Classification High --- Annual CCR Impoundment and Landfill Inspection Report 2015 (AECOM & APS, 2016)
Construction Date
Original: 1976 to 1977
Seepage Collection System: 1993
---
Ash Pond Construction Memorandum (Temchin, 1977)
As-built Drawings APS No. G-44557 and G-44558 (Ebasco, 1977)
Seepage Intercept System Drawings No. D-114438, Sheets 1, 3 and 4 of 4 (APS, 1993)
Location on USGS Quadrangle Map
Joseph City Quadrangle: Section 24/19 and 25/30, Township 18 North, Range 20 East
See Figure 3-1 Joseph City Quadrangle (USGS, 2013)
Statement of Purpose Fly ash containment Seepage and Foundation Studies: Volume I of II Engineering Report (Ebasco, 1975).
Name of Watershed --- --- ---
Size of Watershed (ac) 1,230 --- Seepage and Foundation Studies: Volume I of II
Engineering Report (Ebasco, 1975)
Flood Routing Report (Ebasco, 1976)
Area Capacity Curve See Figure 3-2 --- Seepage and Foundation Studies: Volume I of II Engineering Report (Ebasco, 1975)
Embankment Type Zoned earth fill dam consisting of a clay core and shell
--- As-built Drawing APS No. G-44558 (Ebasco, 1977)
Embankment Maximum Height (ft)
80 --- As-built Drawing APS No. G-44558 (Ebasco, 1977)
Design Total Freeboard (ft) 6 Minimum residual freeboard following PMP event is 4 ft
Summary of Review of Plans and Specifications (AWC, 1976)

AECOM Final Summary Report
Structural Integrity Assessment
Fly Ash Pond
Cholla Power Plant
Arizona Public Service
3-3
August 2016
AECOM Job No. 60445840
Item As-Constructed/ Current Comments Reference Document
Embankment Length (ft) 4,580 --- Drawing No. G-558, Rev. No. 7 (Ebasco, 1977)
Embankment Crest Elevation (ft)
5,120 As-built Drawing APS No. G-44558 (Ebasco, 1977)
Embankment Crest Width (ft) 24 --- As-built Drawing APS No. G-44558 (Ebasco, 1977)
Embankment Slopes 3H:1V (downstream & upstream) --- As-built Drawing APS No. G-44558 (Ebasco, 1977)
Slope Protection Riprap and random rock As-built Drawing APS No. G-44558 (Ebasco, 1977)
Maximum Operating Storage Level (ft)
5,114 Previous maximum storage levels were: 5,116 ft (1981)
Summary of Review of Plans and Specifications (AWC, 1976)
ADWR License dated October 8, 1986
Storage Capacity
(ac-ft) Original design: 16,500 Storage at EL 5,116 ft
Seepage and Foundation Studies: Volume I of II Engineering Report (Ebasco, 1975)
Surface Area (ac) 440 Area at EL 5,116 ft Seepage and Foundation Studies: Volume I of II
Engineering Report (Ebasco, 1975)
Flood Routing Report (Ebasco, 1976)
Clay Core Properties
Physical Properties The clay core consists of compacted sandy lean clay and sandy fat clay.
---
Seepage and Foundation Studies: Volume II of II Field and Laboratory Tests (Ebasco, 1975)
Safety Inspection Report (Harza, 1987)
Evaluation of Dam Embankment Crack (Dames & Moore, 1999)
Engineering Properties
Moist Unit Weight = 120 pounds per cubic foot (pcf)
Saturated Unit Weight = 125 pcf
Effective Cohesion = 0 pounds per square foot (psf)
Effective Friction Angle = 28o
Undrained strength ratio = 0.38
---
Shell (Random Zone) Properties
Physical Properties The shell consists of compacted silty or clayey sand and sandy lean clay.
--- Seepage and Foundation Studies: Volume II of II
Field and Laboratory Tests (Ebasco, 1975)
Safety Inspection Report (Harza, 1987)
Evaluation of Dam Embankment Crack (Dames & Moore, 1999) Engineering Properties
Moist Unit Weight = 125 pcf
Saturated Unit Weight = 130 pcf
Effective Cohesion = 0 psf
Effective Friction Angle = 33o
---

AECOM Final Summary Report
Structural Integrity Assessment
Fly Ash Pond
Cholla Power Plant
Arizona Public Service
3-4
August 2016
AECOM Job No. 60445840
Item As-Constructed/ Current Comments Reference Document
Foundation Conditions
Physical Properties
The embankment is founded on an engineered keyway consisting of the compacted clay core extending to competent bedrock. The exposed bedrock was cleaned and treated with grout or concrete prior to placement of fill material. Where bedrock is deeper than 20 ft, a soil-bentonite cutoff wall extends through the alluvium to bedrock or stiff clay. The alluvium is a Quaternary age wash deposit consisting of unconsolidated clays, silts, and sands. The underlying bedrock consists of mudstone, siltstone, and sandstone associated with the Chinle and Moenkopi Formations.
---
Seepage and Foundation Studies: Volume II of II Field and Laboratory Tests (Ebasco, 1975)
Various Construction Reports (Ebasco, 1977)
Safety Inspection Report (Harza, 1987)
Evaluation of Dam Embankment Crack (Dames & Moore, 1999)
Engineering Properties
Alluvium:
Moist Unit Weight = 120 pcf
Saturated Unit Weight = 120 pcf
Effective Cohesion = 0 psf
Effective Friction Angle = 26o
Bedrock:
Moist Unit Weight = 150 pcf
Saturated Unit Weight = 150 pcf
Effective Cohesion = 1,000 psf
Effective Friction Angle = 65o
Cutoff Wall:
Moist Unit Weight = 106 pcf
Saturated Unit Weight = 106 pcf
Effective Cohesion = 0 psf
Effective Friction Angle = 28o
Undrained Strength = 10 psf
---
AECOM Final Summary Report
Structural Integrity Assessment
Fly Ash Pond
Cholla Power Plant
Arizona Public Service
3-5
August 2016
AECOM Job No. 60445840
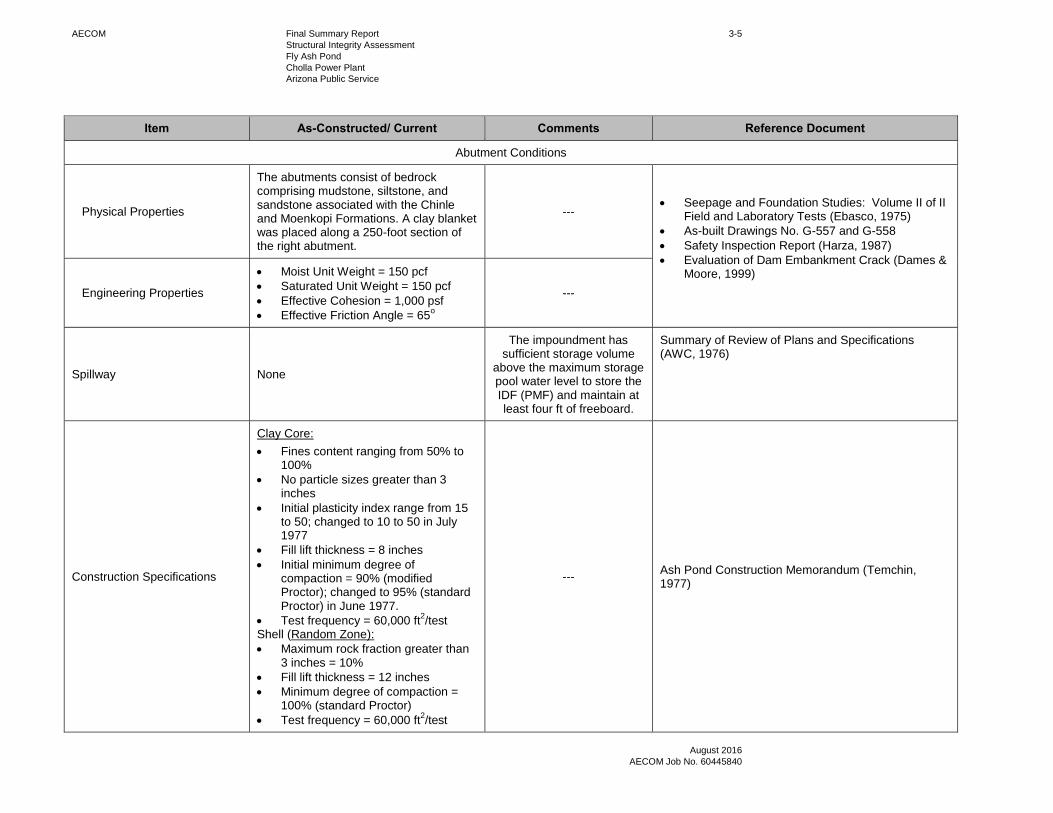
Item As-Constructed/ Current Comments Reference Document
Abutment Conditions
Physical Properties
The abutments consist of bedrock comprising mudstone, siltstone, and sandstone associated with the Chinle and Moenkopi Formations. A clay blanket was placed along a 250-foot section of the right abutment.
--- Seepage and Foundation Studies: Volume II of II
Field and Laboratory Tests (Ebasco, 1975)
As-built Drawings No. G-557 and G-558
Safety Inspection Report (Harza, 1987)
Evaluation of Dam Embankment Crack (Dames & Moore, 1999)
Engineering Properties
Moist Unit Weight = 150 pcf
Saturated Unit Weight = 150 pcf
Effective Cohesion = 1,000 psf
Effective Friction Angle = 65o
---
Spillway None
The impoundment has sufficient storage volume
above the maximum storage pool water level to store the IDF (PMF) and maintain at least four ft of freeboard.
Summary of Review of Plans and Specifications (AWC, 1976)
Construction Specifications
Clay Core:
Fines content ranging from 50% to 100%
No particle sizes greater than 3 inches
Initial plasticity index range from 15 to 50; changed to 10 to 50 in July 1977
Fill lift thickness = 8 inches
Initial minimum degree of compaction = 90% (modified Proctor); changed to 95% (standard Proctor) in June 1977.
Test frequency = 60,000 ft2/test
Shell (Random Zone):
Maximum rock fraction greater than 3 inches = 10%
Fill lift thickness = 12 inches
Minimum degree of compaction = 100% (standard Proctor)
Test frequency = 60,000 ft2/test
--- Ash Pond Construction Memorandum (Temchin, 1977)

AECOM Final Summary Report
Structural Integrity Assessment
Fly Ash Pond
Cholla Power Plant
Arizona Public Service
3-6
August 2016
AECOM Job No. 60445840
Item As-Constructed/ Current Comments Reference Document
Construction Specifications (continued)
Cutoff Wall:
Preparation: o Minimum unit weight = 1.02
grams/cubic centimeter (g/cm3)
o Minimum viscosity = 35 sec-marsh
o Maximum filtration loss = 30 cm3
o Minimum pH = 8
In Trench: o Unit weight range between 1.05
and 1.4 g/ cm3
Backfill Mix at Trench: o Slump ranging between 3 and 6
inches o Percent passing 3/8-inch
between 70 and 100% o Percent passing No. 20 sieve
between 40 and 80%
Fines content between 10 and 35%
--- Ash Pond Construction Memorandum (Temchin, 1977)
Detailed Drawings See Appendix A for drawings --- Original As-built (Ebasco, 1977)
Seepage Interception System (APS, 1993)
Existing Instrumentation
Type and Purpose of Instrumentation
Open standpipe piezometers and wells installed for monitoring the phreatic levels in the embankment, foundation, and surrounding area.
Settlement monuments for monitoring movement of the embankment.
Water level gauge for monitoring water level in reservoir.
Flowmeters measuring seepage rates.
--- Annual CCR Impoundment and Landfill Inspection
Report 2015 (AECOM & APS, 2016)

AECOM Final Summary Report
Structural Integrity Assessment
Fly Ash Pond
Cholla Power Plant
Arizona Public Service
3-7
August 2016
AECOM Job No. 60445840
Item As-Constructed/ Current Comments Reference Document
Location of Instrumentation
Open standpipe piezometers and wells located in and around the embankment.
Movement monuments located along the embankment crest.
Water level gauge located in the reservoir.
Seepage monitoring systems located along the downstream toe.
See Figure 1-2 Annual CCR Impoundment and Landfill Inspection
Report 2015 (AECOM & APS, 2016)
Provisions for Surveillance, Maintenance and Repair
Visual inspections of the dam by a qualified person on a frequency not exceeding seven days.
Visual inspections of the dam conducted annually by a qualified professional engineer.
Phreatic level behavior from piezometric measurements and reservoir water level from gauge collected on a frequency not exceeding 30 days.
Embankment settlement using movement monuments survey data collected on a frequency not exceeding 30 days.
Seepage monitoring at the downstream toe on a frequency not exceeding 30 days.
--- Annual CCR Impoundment and Landfill Inspection
Report 2015 (AECOM & APS, 2016)
Record of Structural Instability (See Section 4 for more details)
Historic seepage at downstream toe and right abutment. Seepage areas near the downstream toe are identified as Hunt Seep and Geronimo Seep, and I-40 Seep.
Crack within clay core near Geronimo Knob, generally between survey monuments M6 and M7.
See Figure 1-2 for the Hunt and Geronimo Seeps. The
seepage areas are captured and monitored by a seepage interceptor system near the
downstream toe.
Transverse Crack Evaluation (URS, 2001)
Annual CCR Impoundment and Landfill Inspection Report 2015 (AECOM & APS, 2016)
Notes: 1) Site elevations use National Geodetic Vertical Datum (NGVD) 1929

AECOM Final Summary Report
Structural Integrity Assessment
Fly Ash Pond
Cholla Power Plant
Arizona Public Service
4-1
August 2016
AECOM Job No. 60445840
This section summarizes the structural stability assessment for the Fly Ash Pond. This information is intended to satisfy the
requirement of Rule 40 CFR § 257.73(d).
4.1 Foundation and Abutments
Per the requirements of 40 CFR § 257.73(d)(1)(i), an existing CCR impoundments must be assessed for “Stable foundations
and abutments.”
The Fly Ash Pond Dam is founded on alluvium overburden associated with a local wash with both abutments resting on
bedrock consisting of mudstone, siltstone, and sandstone associated with the Chinle and Moenkopi Formations. Review of the
as-built design drawings of the dam (Ebasco, 1977) and construction inspection reports prepared by ADWR (formerly the
Arizona Water Commission) indicate a cut off trench was excavated at the abutments to extend the clay core to bedrock.
When the depth to bedrock was greater than 20 ft, a soil-bentonite slurry cut-off wall was installed to the bedrock which
extended to a maximum depth of about 40 ft below the original ground surface. In addition, an approximately 250-ft long clay
blanket was installed on the upstream slope of the right abutment directly adjacent to the embankment to help control seepage
through the surrounding Moenkopi bedrock formation. Review of construction records indicates that where the cutoff trench
was excavated to bedrock, loose rock was scaled from the foundation, dental concrete was applied to irregularities to create a
relatively level surface, and a thin lift of wet cement tack coat was applied to the bedrock surface before placement of the clay
core. For the shell of the dam, which is founded on alluvium overburden soils, the alluvium foundation was proof-compacted
using a heavy dynamic compactor and surface stringers of sandy soils that crossed the dam foundation were removed.
Several seepage locations have been observed downstream of the dam since the Fly Ash Pond went into operation. These
seeps are thought to occur due to a combination of normal flow through the embankment, discontinuities in the foundation
near the groin of the abutment at Geronimo Knob, and flow through gypsum seams in the Moenkopi Formation. Drain systems
have been installed at most of the seepage locations, typically consisting of underground French drains connected to a
collection sump. Two sumps have been installed at the following seeps: the Geronimo Seep and the Hunt Seep. The locations
of the seeps are shown in Figure 1-2. Flow from the sumps and weir installed at the seeps are monitored and presented in the
annual dam inspection reports. Flow rates ranging from 6 to 40 gallons per minute over the last ten years were measured at
the sumps (AECOM & APS, 2016), indicating low to moderate flow. The turbidity of the seep water observed at the sumps was
low. The long-term steady and low to moderate flow rate, combined with the lack of turbidity, indicate a low potential of internal
erosion of the dam embankment or foundation.
Review of the measured displacements of the survey monuments at the crest of the Fly Ash Pond Dam, as presented in the
2015 annual dam inspection report (AECOM & APS, 2016), indicates total settlements along the crest of the dam of four to
seven inches and horizontal movements of four inches or less in the last ten years. Settlement rates appear relatively
consistent over the last ten years at about one half of an inch per year, except in 2010 when recalibration of the survey base
point appears to have increased the reported settlement by one additional inch. The relatively small settlement and horizontal
movements measured at the Fly Ash Pond Dam are an indication of stability in the dam foundation and abutments.
4.2 Slope Protection
Per the requirements of 40 CFR § 257.73(d)(1)(ii), an existing CCR impoundments must be assessed for “Adequate slope
protection to protect against surface erosion, wave action, and adverse effects of sudden drawdown.”
A review on the as-built drawing of the Fly Ash Pond Dam (Ebasco, 1977), indicates the dam was constructed with a two foot
thick layer of random rock fill (riprap) to protect the upstream and downstream slopes against erosion. No specifications for
riprap size were shown on the drawings; however, visual observations performed during dam inspection suggest they are
cobble to boulder sized. The 2015 annual dam inspection report (AECOM & APS, 2016) reported no significant erosion of the
4 Structural Stability Assessment

AECOM Final Summary Report
Structural Integrity Assessment
Fly Ash Pond
Cholla Power Plant
Arizona Public Service
4-2
August 2016
AECOM Job No. 60445840
dam slopes indicating the riprap slope protection is performing adequately. Based on the inspection report and experience with
similar riprap slope protection designs, the Fly Ash Pond has adequate slope protection to protect against surface erosion,
wave action, and adverse effects of sudden drawdown.
4.3 Dike Compaction
Per the requirements 40 CFR § 257.73(d)(1)(iii), an existing CCR impoundments must be assessed for “Dikes mechanically
compacted to a density sufficient to withstand the range of loading conditions in the CCR unit.”
Based on review of a memorandum summarizing construction of the Fly Ash Pond Dam (Temchin, 1977), the dam (or dike)
was constructed by placement of soils in mechanically compacted thin lifts of a foot or less. Construction control of the
compaction process was maintained using a method procedure where the soil preparation, placement, watering, blading, final
watering, rolling, and lift thickness are specified based on the results of test fill pads conducted prior to start of earthwork
(Ebasco, 1977).
In addition to the method controls discussed above, quality control testing consisting of comparison of in-situ measurements of
soil density to Standard Proctor maximum dry density, American Society for Testing and MaterialsD 698, was performed at
intervals of once every 60,000 square ft of material placed. Results of quality control testing are summarized in Ebasco
Drawing APS-2742-SK-CH-J13 (Temchin 1977). The drawing indicates 622 tests were conducted on Clay Core materials with
609 of the tests measuring densities greater than 95 percent of the Standard Proctor maximum density and a mean percent
compaction of all tests of 98.9 percent of the standard proctor maximum density. The drawing indicates 811 tests were
conducted on the outer shell materials with 748 of the tests measuring densities greater than 100 percent of the Standard
Proctor maximum density and a mean percent compaction of all tests of 101.7 percent of the Standard Proctor maximum
density.
Based on the compaction method described in the construction summary memorandum and the quality control test results
presented in Drawing APS-2742-SK-CH-J13, the Fly Ash Pond Dam has been mechanically compacted to a density sufficient
to withstand the range of loading conditions expected at the Fly Ash Pond site.
4.4 Slope Vegetation
Per the requirements 40 CFR § 257.73(d)(1)(iv), an existing CCR impoundments must be assessed for “Vegetated slopes of
dikes and surrounding areas, except for slopes which have an alternate form or forms of slope protection.” Note that the
United States Court of Appeals for the District of Columbia Circuit remanded with vacatur the phrase “not to exceed a height of
six inches above the slope of the dike” from this subsection of the Rule.
As noted in Section 4.2, the dam was constructed with a two foot thick layer of random rock fill (riprap) slope protection;
therefore, the dam is excluded from the vegetated slope requirements since it uses an alternate form of slope protection.
4.5 Impoundment Capacity
Per the requirements 40 CFR § 257.73(d)(1)(v), an existing CCR impoundment must be assessed for “A single spillway or a
combination of spillways configured as specified in paragraph (d)(1)(v)(A) of this sections. The combined capacity of all
spillways must be designed, constructed, operated, and maintained to adequately manage flow during and following the peak
discharge from the event specified in paragraph (d)(1)(v)(B) of this section.”
The Fly Ash Pond Dam was constructed without a spillway or other water release structure. To manage flow during the design
storm event, the Fly Ash Pond has been designed, constructed, operated, and maintained with sufficient storage volume over
and above the maximum permitted storage pool water level at EL 5,114 ft to store the PMF storm water inflow at EL 5,116 ft
and to maintain an additional four ft of freeboard; therefore, the Fly Ash Pond impoundment is capable of adequately
managing (containing) the flow during and following the peak discharge from the PMF event as required for high hazard
potential CCR impoundments.

AECOM Final Summary Report
Structural Integrity Assessment
Fly Ash Pond
Cholla Power Plant
Arizona Public Service
4-3
August 2016
AECOM Job No. 60445840
4.6 Hydraulic Structures
Per the requirements 40 CFR § 257.73(d)(1)(vi), an existing CCR impoundments must be assessed for “Hydraulic structures
underlying the base of the CCR unit or passing through the dike of the CCR unit that maintain structural integrity and are free
of significant distortion, bedding deficiencies, sedimentation, and debris which may negatively affect the operation of the
hydraulic structures.”
No hydraulic structures are present that underlie the base of the Fly Ash Pond or pass through the Fly Ash Pond Dam.
4.7 Downstream Water Body
Per the requirements 40 CFR § 257.73(d)(1)(vii), an existing CCR impoundments must be assessed as follows “For CCR units
with downstream slope which can be inundated by the pool of an adjacent water body, such as a river, stream or lake,
downstream slopes that maintain structural stability during low pool of the adjacent water body or sudden drawdown of the
adjacent water body.”
No structural stability deficiencies are presently associated with inundation of the downstream slope of the Fly Ash Pond Dam
by an adjacent body of water since no pool of water, such as a river, stream or lake, is present downstream of the dam which
could inundate the downstream slope.
4.8 Other Issues
In July 1998, transverse and longitudinal cracking was observed along the Fly Ash Pond Dam crest in the vicinity of the
Geronimo Knob, the rock outcropping near the center of the dam. A subsequent study of the cracks, consisting of exploration
trenches and borings along the crest of the dam, exposed thirty-one (31) visible cracks with six (6) cracks considered
“significant” (defined as cracks with widths equal to or greater than ½-inch.) Crack depths ranged from 0.5 to 12 ft below the
top of crest (Dames & Moore, 1999). The study postulated the cracking was due to differential settlement of the dam
embankment on the sloping bedrock foundation created by the Geronimo Knob (URS, 2001). The dam crest was repaired by
re-compaction of the clay core spoils excavated during the trenching. As an additional precaution, the discharge to the
impoundment was changed so that deposited fly ash would create a beach that would prevent free water from ponding within
300 ft of the crack area. Since 2002, continued monitoring of the dam crest has noted only minor cracking, most likely
associated with surface desiccation typical for embankments in the arid US Southwest. While monitoring of the dam crest for
cracking is still performed during the annual dam inspections, the Geronimo Knob crack is considered to have been mitigated
by the changed deposition plan, has not reappeared, and it is not considered a continuing dam safety concern or structural
integrity deficiency.
No deficiencies were identified for the Fly Ash Pond that could affect the structural stability of the impoundment. However,
during the most recent dam inspection (AECOM & APS, 2016), observations of excessive vegetation consisting of small to
medium sized desert brush and small animal burrows were noted along the slopes and crest of the Fly Ash Pond Dam. APS
work crews subsequently removed part of the vegetation in the identified areas with the remainder scheduled for removal in
the upcoming year. Although both the vegetation and the animal burrows were not of sufficient size to cause concern for the
stability or erosion of the embankment, failure to promptly identify and correct these issues could lead to eventual deterioration
of the embankment slope. It is recommended, therefore, to continue inspection and maintenance activities of the impoundment
to identify and correct minor issues in order to prevent progressive deterioration of the embankment.
4.9 Structural Stability Assessment Results
AECOM did not identify any structural stability deficiencies that would affect the structural condition of the Fly Ash Pond CCR
Impoundment based on the documents provided and reviewed as part of this assessment. AECOM assesses that the design,
construction, operation and maintenance of the Fly Ash Pond are consistent with recognized and generally accepted good
engineering practice for the maximum volume of CCR and CCR wastewater which can be impounded therein.
AECOM Final Summary Report
Structural Integrity Assessment
Fly Ash Pond
Cholla Power Plant
Arizona Public Service
5-1
August 2016
AECOM Job No. 60445840
This section summarizes the safety factor assessment for the Fly Ash Pond. This assessment is intended to satisfy the
requirement of Rule 40 CFR § 257.73(e).
5.1 Methodology and Design Criteria
Slope stability analyses were performed to document minimum factors of safety for loading conditions identified by 40 CFR § 257.73(e) using the software program SLOPE/W (GEO-SLOPE International, 2012). The analyses were performed using
Spencer’s Method; a limit equilibrium method of slices that satisfies both force and moment equilibrium and incorporates the
effects of interslice forces. The analyses incorporate strength and density properties and pore pressure distributions described
in Sections 5.4 and 5.5. The slope stability models are presented in Appendix B.
5.2 Critical Cross Section
Safety factors were calculated for three cross sections of the Fly Ash Pond Dam selected to represent different embankment
geometries, heights, and stratigraphic conditions to provide confidence that the critical cross section was identified. The critical
cross section is the cross section that is anticipated to be most susceptible to structural failure for a given loading condition.
The critical cross section thus represents a “most-severe” case. Section locations were selected based on variation in the
embankment height, presence of cutoff trench/cutoff wall, and stratigraphic conditions. Subsurface soil profiles were
developed using as-built drawings and historical borings reported by Ebasco (1975) and Harza (1987). The locations of the
cross sections along the Fly Ash Pond Dam are shown in Figure 5.1. The three cross sections analyzed are:
Fly Ash Pond Cross Section 1: This cross-section corresponds approximately to Section B as shown in Figure 5-1 and on
the as-built section (Ebasco, 1977). This section represents the highest dam section where bedrock is shallow and, thus,
includes an extension of the embankment clay core forming a cutoff trench that is keyed into bedrock. The embankment is
approximately 80 ft high and the upstream and downstream slopes are at 3H:1V. The zoned embankment at this section
consists of a sandy lean clay core with an outer clayey sand shell and the foundation consists of about 20 ft of alluvial clays,
silts, and sands overlying bedrock consisting of mudstones, siltstones, and sandstones. The clay core extends to form a cutoff
trench that is keyed into the top of bedrock.
Approximately 60 ft of hydraulically-placed fly ash is impounded behind the embankment at the Cross Section 1 location,
based on comparison between pre-construction topographic survey data (Ebasco, 1975) and topographic survey data
collected in 2014 (APS, 2016).
Fly Ash Pond Cross Section 2: This cross-section corresponds approximately to Section D as shown on Figure 5-1 and the
as-built section (Ebasco, 1977). This section represents the section at the greatest depth to bedrock. The cross-section is
located approximately 50 ft west of a long-standing downstream seep, the Geronimo Seep, which lies near Geronimo Knob.
The section includes a cutoff slurry wall beneath the embankment clay core. The embankment is approximately 80 ft high and
the upstream and downstream slopes are at 3H:1V. The zoned embankment at this section consists of a sandy lean clay core
with an outer clayey sand shell and the foundation consists of approximately 52 ft of alluvial overburden (clays, silts, and
sands) overlying interbedded layers of mudstone, siltstone, and sandstone bedrock.
Approximately 60 ft of hydraulically-placed fly ash is impounded behind the embankment at the Cross Section 2 location,
based on comparison between pre-construction topographic survey data (Ebasco 1975) and topographic survey data collected
in 2014 (APS, 2016). Calculated factors of safety for Section 2 were lower than those calculated for Sections 1 and 3. Section
2 is, therefore, designated the critical cross section.
5 Safety Factor Assessment

AECOM Final Summary Report
Structural Integrity Assessment
Fly Ash Pond
Cholla Power Plant
Arizona Public Service
5-2
August 2016
AECOM Job No. 60445840
Fly Ash Pond Cross Section 3: This cross section corresponds approximately to Section E as shown on Figure 5-1 and the
as-built section (Ebasco, 1977). At this cross section location, the Fly Ash Pond intersects Geronimo Knob along its
downstream slope. This section includes an extension of the embankment clay core forming a cutoff trench that is keyed into
bedrock. The embankment is approximately 68 ft high and the upstream and downstream slopes are at 3H:1V. The zoned
embankment at this section consists of a sandy lean clay core with an outer clayey sand shell and the foundation consists of
approximately four to nine ft of alluvial overburden (clays, silts, and sands) overlying interbedded layers of mudstone, siltstone,
and sandstone bedrock.
Approximately 50 ft of hydraulically-placed fly ash is impounded behind the embankment at the Cross Section 3 location,
based on comparison between pre-construction topographic survey data (Ebasco, 1975) and topographic survey data
collected in 2014 (APS, 2016).
5.3 Subsurface Stratigraphy
Idealized models of subsurface stratigraphic conditions for each cross section were developed based on design drawings
(Ebasco, 1977) and previous geotechnical site investigations (Ebasco, 1975, Harza, 1987, and Dames & Moore, 1999). The
following stratigraphic units were used to develop SLOPE/W models for each cross section:
Embankment Core: The zoned embankment includes a central impervious clay core with 1H:1V side slopes and a clay cap
at the embankment crest. Fine-grained material was obtained from upstream borrow pits along the dam alignment and
mechanically compacted in lifts to construct the clay core. The clay core soils consist predominately of Sandy Lean Clay (CL)
with isolated zones of Sandy Fat Clay (CH) based on the Unified Soil Classification System (USCS).
Embankment Shell (Random Zone): The zoned embankment includes a more pervious zone of random material, or shell
that flanks the clay core to support and protect the impervious core. The shell provides stability against rapid drawdown
(upstream shell) and drainage (downstream shell). Shell material was obtained from upstream borrow pits along the dam
alignment and mechanically compacted in lifts. Shell soils consist predominately of Silty Sand (SM), Clayey Sand (SC), and
Sandy Lean Clay (CL) based on the USCS.
Alluvium: Alluvial deposits overlie the bedrock beneath the embankment and are the foundation bearing layer over most of
the embankment alignment. The alluvium consists of a Quaternary Age, heterogeneous mixture of unconsolidated clays, silts,
and sands deposited by flows in an unnamed tributary to the Little Colorado River prior to the construction of the Fly Ash
Pond.
Bedrock: Bedrock beneath the embankment consists of mudstones, siltstones, and sandstones of the Triassic-age Chinle
and Moenkopi Formations.
Slurry Cutoff Wall: A slurry cutoff wall was constructed using soil-bentonite slurry where the depth to bedrock is greater than
20 ft and extended into either the bedrock or dense clay soils.
Fly Ash: Fly ash waste product from the power generating process is pumped from the plant to the Fly Ash Pond and allowed
to settle hydraulically.
5.4 Material Properties
Material properties for soil, rock and embankment construction materials were developed based on an analysis and
interpretation of historical geologic and geotechnical data presented in:
Ebasco Services Inc., “Arizona Public Services Cholla Generating Station Ash Disposal Sites Seepage and
Foundation Studies: Volume I of II Engineering Report” (Ebasco, 1975),
Harza Engineering Company, “Safety Inspection Report on Fly Ash Dam, Bottom Ash Dam, and Cooling Dike”
(Harza, 1987), and
Dames & Moore, ” Interim Report, Geotechnical Investigation for Evaluation of Dam Embankment Crack, Fly Ash
Pond Dam, Cholla Power Plant, Joseph City, Arizona” (Dames & Moore, 1999).
AECOM Final Summary Report
Structural Integrity Assessment
Fly Ash Pond
Cholla Power Plant
Arizona Public Service
5-3
August 2016
AECOM Job No. 60445840
The material properties developed by the dam designers and subsequent investigators were assessed for reliability and
applicability to this safety factor assessment. The design report (Ebasco, 1975) indicated that soil strength parameters were
obtained from laboratory testing. Specific details of the soil strength property derivations used for the original design stability
analyses were not provided in the design report. The Harza investigation (1987) included more detailed documentation of the
laboratory testing, soil strength derivations, and stability analyses performed in 1987. The parameters developed by Harza
were used in subsequent stability analyses performed by Dames & Moore (1991). AECOM assessed the historical soil
strength data and parameters used by previous investigators and found the Harza (1987) data to be the most reliable and
applicable to this safety factor assessment.
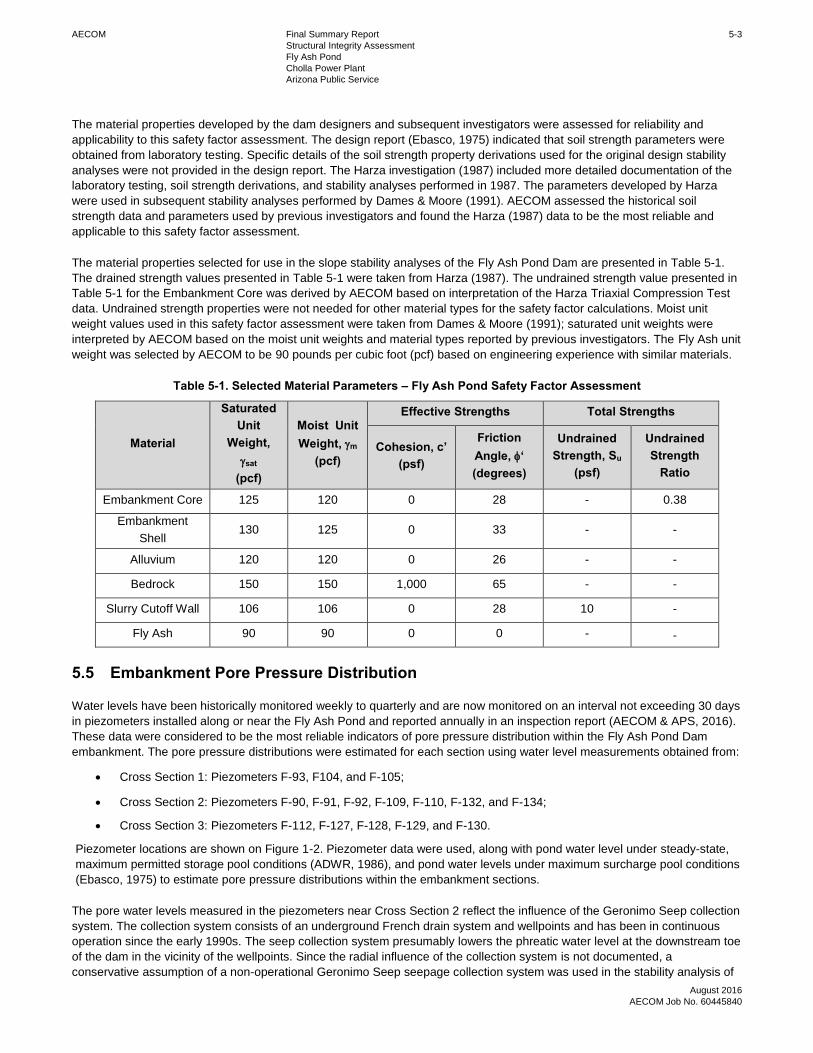
The material properties selected for use in the slope stability analyses of the Fly Ash Pond Dam are presented in Table 5-1.
The drained strength values presented in Table 5-1 were taken from Harza (1987). The undrained strength value presented in
Table 5-1 for the Embankment Core was derived by AECOM based on interpretation of the Harza Triaxial Compression Test
data. Undrained strength properties were not needed for other material types for the safety factor calculations. Moist unit
weight values used in this safety factor assessment were taken from Dames & Moore (1991); saturated unit weights were
interpreted by AECOM based on the moist unit weights and material types reported by previous investigators. The Fly Ash unit
weight was selected by AECOM to be 90 pounds per cubic foot (pcf) based on engineering experience with similar materials.
Table 5-1. Selected Material Parameters – Fly Ash Pond Safety Factor Assessment
Material
Saturated Unit
Weight, sat
(pcf)
Moist Unit Weight, m
(pcf)
Effective Strengths Total Strengths
Cohesion, c’ (psf)
Friction Angle, ‘ (degrees)
Undrained Strength, Su
(psf)
Undrained Strength
Ratio
Embankment Core 125 120 0 28 - 0.38
Embankment
Shell 130 125 0 33 - -
Alluvium 120 120 0 26 - -
Bedrock 150 150 1,000 65 - -
Slurry Cutoff Wall 106 106 0 28 10 -
Fly Ash 90 90 0 0 - -
5.5 Embankment Pore Pressure Distribution
Water levels have been historically monitored weekly to quarterly and are now monitored on an interval not exceeding 30 days
in piezometers installed along or near the Fly Ash Pond and reported annually in an inspection report (AECOM & APS, 2016).
These data were considered to be the most reliable indicators of pore pressure distribution within the Fly Ash Pond Dam
embankment. The pore pressure distributions were estimated for each section using water level measurements obtained from:
Cross Section 1: Piezometers F-93, F104, and F-105;
Cross Section 2: Piezometers F-90, F-91, F-92, F-109, F-110, F-132, and F-134;
Cross Section 3: Piezometers F-112, F-127, F-128, F-129, and F-130.
Piezometer locations are shown on Figure 1-2. Piezometer data were used, along with pond water level under steady-state,
maximum permitted storage pool conditions (ADWR, 1986), and pond water levels under maximum surcharge pool conditions
(Ebasco, 1975) to estimate pore pressure distributions within the embankment sections.
The pore water levels measured in the piezometers near Cross Section 2 reflect the influence of the Geronimo Seep collection
system. The collection system consists of an underground French drain system and wellpoints and has been in continuous
operation since the early 1990s. The seep collection system presumably lowers the phreatic water level at the downstream toe
of the dam in the vicinity of the wellpoints. Since the radial influence of the collection system is not documented, a
conservative assumption of a non-operational Geronimo Seep seepage collection system was used in the stability analysis of
AECOM Final Summary Report
Structural Integrity Assessment
Fly Ash Pond
Cholla Power Plant
Arizona Public Service
5-4
August 2016
AECOM Job No. 60445840
Cross Section 2. This assumption corresponds to the condition of raising the water level downstream of the dam to near the
ground surface.
5.6 Embankment Loading Conditions
Per 40 CFR § 257.73(e)(1)(i) through (iv), the following loading conditions were analyzed for each developed stability cross
section:
Long-term, maximum storage pool
Maximum surcharge pool
Seismic loading, and
Liquefaction
These loading conditions are described in the following sub-sections.
Long-Term, Maximum Storage Pool: The maximum storage pool loading is the maximum water level that will be maintained
for a sufficient length of time for steady-state seepage or hydrostatic conditions to develop within the embankment. This
loading condition is evaluated to document whether the CCR surface impoundment can withstand a maximum expected pool
elevation with full development of saturation in the embankment under long-term loading.
The long-term, maximum storage pool loading condition was evaluated using the permitted water level of the pond, as stated
in the ADWR operating license for the dam. Since the dam has no outlet structure and relies on pumping rate from plant,
seepage, and evaporation to control water levels, the maximum storage pool was set at the maximum ADWR-permitted water
levels. For the Fly Ash Pond, the safety factor was calculated for the long-term maximum storage pool at EL 5,114 ft (ADWR,
1985).
Maximum Surcharge Pool: The maximum surcharge pool loading is the temporary rise in pool elevation above the maximum
storage pool elevation to which the CCR surface impoundment could be subject under inflow design flood state. This loading
condition is evaluated to document whether the downstream slope of the CCR surface impoundment embankment can
withstand the short-term impact of a raised pool level.
The maximum surcharge pool considers a temporary pool elevation that is higher than the maximum storage pool that persists
for a length of time sufficient for steady-state seepage or hydrostatic conditions to fully develop within the embankment. The
maximum surcharge pool loading condition was evaluated using the expected water level raise during the design PMF of 2.0 ft
(Ebasco, 1976). For the Fly Ash Pond, the safety factor was calculated for the maximum surcharge pool at EL 5,116 ft.
Seismic Loading: Seismic loading is evaluated to document whether the embankment is capable of withstanding a design
earthquake without damage to the foundation or embankment that would cause a discharge of contents. The seismic loading
condition is assessed for a seismic loading event with a two percent probability of exceedance in 50 years, equivalent to a
return period of approximately 2,500 years. A pseudo-static analysis was used to represent the seismic loading condition.
The seismic response of soil embankments is incorporated into the analysis method by adding a horizontal force to simulate
the seismic force acting on the embankment during an earthquake. The horizontal force is applied in the pseudo-static
analyses through the addition of a seismic coefficient into the limit equilibrium calculations. The seismic coefficient was
selected using the following procedure:
1. Determine the peak horizontal ground acceleration (PGA) generated in bedrock at the site by an earthquake having
the 2% probability of exceedance in 50 years;
2. Select a Site Class, per International Building Code definitions, which incorporates the effects of seismic wave
propagation through the top 100 ft of the soil profile above bedrock, and calculate the adjusted for Site Class effects,
PGAM;
3. Calculate the maximum transverse acceleration at the crest of the embankment, PGAcrest, using the PGAM from step
two; and
AECOM Final Summary Report
Structural Integrity Assessment
Fly Ash Pond
Cholla Power Plant
Arizona Public Service
5-5
August 2016
AECOM Job No. 60445840
4. Adjust the PGAcrest using the method developed by Makdisi and Seed (1977) to account for the variation of induced
average acceleration with embankment depth to calculate the seismic coefficient.
Each of these steps is discussed in more detail in the calculation presented in Appendix B. The maximum average
acceleration for the potential sliding mass was incorporated into the pseudo-static safety factor analyses as the horizontal
seismic coefficient equal to 0.13, corresponding to the calculated, adjusted PGAcrest value.
The water level in the Fly Ash Pond for the seismic loading analysis was set to EL 5,114 ft to match the long-term, maximum
storage pool. The Clay Core and Cutoff Wall materials were assigned total strengths because it is anticipated that they would
behave in an undrained manner due to the relatively rapid loading induced during the seismic event and the relatively low
hydraulic conductivity of these materials. All, other materials used effective strength parameters.
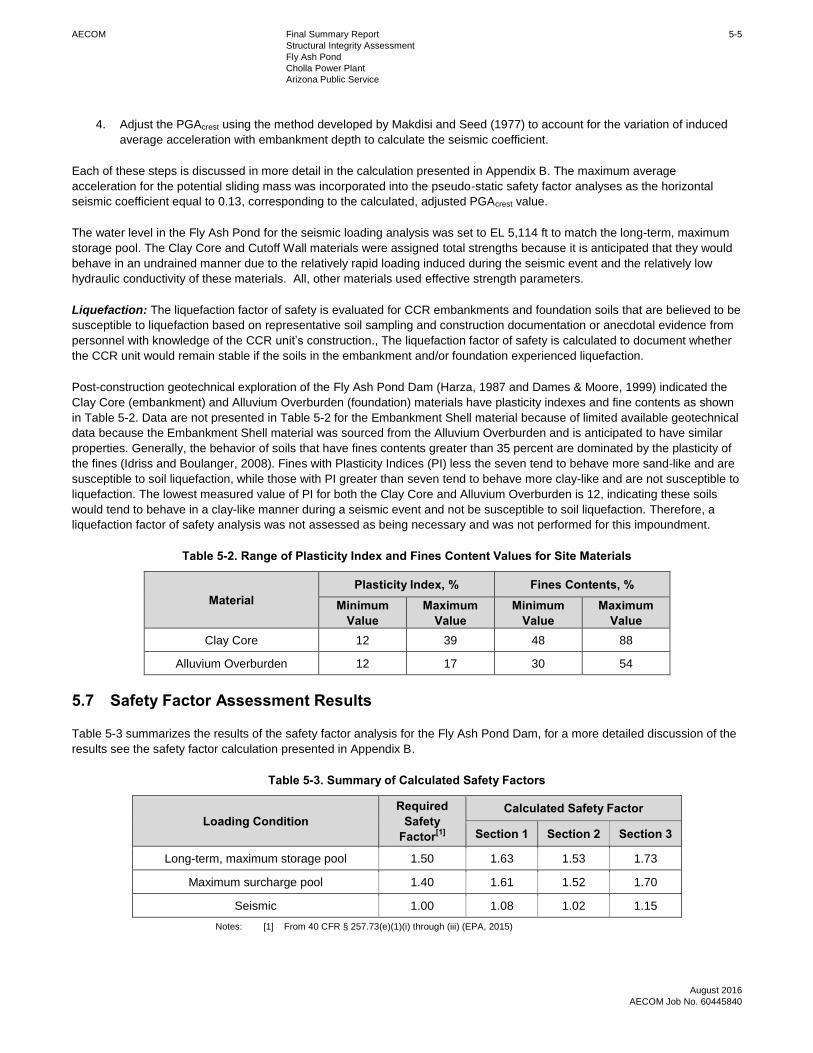
Liquefaction: The liquefaction factor of safety is evaluated for CCR embankments and foundation soils that are believed to be
susceptible to liquefaction based on representative soil sampling and construction documentation or anecdotal evidence from
personnel with knowledge of the CCR unit’s construction., The liquefaction factor of safety is calculated to document whether
the CCR unit would remain stable if the soils in the embankment and/or foundation experienced liquefaction.
Post-construction geotechnical exploration of the Fly Ash Pond Dam (Harza, 1987 and Dames & Moore, 1999) indicated the
Clay Core (embankment) and Alluvium Overburden (foundation) materials have plasticity indexes and fine contents as shown
in Table 5-2. Data are not presented in Table 5-2 for the Embankment Shell material because of limited available geotechnical
data because the Embankment Shell material was sourced from the Alluvium Overburden and is anticipated to have similar
properties. Generally, the behavior of soils that have fines contents greater than 35 percent are dominated by the plasticity of
the fines (Idriss and Boulanger, 2008). Fines with Plasticity Indices (PI) less the seven tend to behave more sand-like and are
susceptible to soil liquefaction, while those with PI greater than seven tend to behave more clay-like and are not susceptible to
liquefaction. The lowest measured value of PI for both the Clay Core and Alluvium Overburden is 12, indicating these soils
would tend to behave in a clay-like manner during a seismic event and not be susceptible to soil liquefaction. Therefore, a
liquefaction factor of safety analysis was not assessed as being necessary and was not performed for this impoundment.
Table 5-2. Range of Plasticity Index and Fines Content Values for Site Materials
Material Plasticity Index, % Fines Contents, %
Minimum Value
Maximum Value
Minimum Value
Maximum Value
Clay Core 12 39 48 88
Alluvium Overburden 12 17 30 54
5.7 Safety Factor Assessment Results
Table 5-3 summarizes the results of the safety factor analysis for the Fly Ash Pond Dam, for a more detailed discussion of the
results see the safety factor calculation presented in Appendix B.
Table 5-3. Summary of Calculated Safety Factors
Loading Condition Required
Safety Factor[1]
Calculated Safety Factor
Section 1 Section 2 Section 3
Long-term, maximum storage pool 1.50 1.63 1.53 1.73
Maximum surcharge pool 1.40 1.61 1.52 1.70
Seismic 1.00 1.08 1.02 1.15
Notes: [1] From 40 CFR § 257.73(e)(1)(i) through (iii) (EPA, 2015)

AECOM Final Summary Report
Structural Integrity Assessment
Fly Ash Pond
Cholla Power Plant
Arizona Public Service
5-6
August 2016
AECOM Job No. 60445840
The calculated factors of safety for the three critical cross sections along the Fly Ash Pond Dam exceeded the required
minimum values for the long-term, maximum storage pool; the maximum surcharge pool; and the seismic (pseudo-static)
loading conditions.

AECOM Final Summary Report
Structural Integrity Assessment
Fly Ash Pond
Cholla Power Plant
Arizona Public Service
6-1
August 2016
AECOM Job No. 60445840
Based on the findings and results of the structural integrity assessment, AECOM provides the following conclusions regarding
the structural integrity of the Fly Ash Pond at the Cholla Power Plant.
The Fly Ash Pond is classified as a High Hazard Potential CCR surface impoundment.
The embankment is founded on stable foundations and abutments. Seepage is limited by a clay core that extends to
the bedrock in shallow locations or a cutoff slurry wall where the depth to bedrock is greater than 20 ft. Downstream
seeps exist and are captured and monitored by drainage systems typically consisting of French drains connected to
sumps.
The embankment has adequate slope protection consisting of riprap on both the upstream and downstream slopes.
Based on the available quality control test results, the Fly Ash Pond Dam embankment was mechanically compacted
to a density sufficient to withstand the range of loading conditions anticipated at the site.
The Fly Ash Pond impoundment is capable of adequately managing the flow during and following the peak discharge
from the PMF event without a spillway or other water release structures because the pond has been designed,
constructed, operated, and maintained with sufficient storage volume above the maximum storage pool water level to
store the PMF inflow and maintain at least four ft of freeboard.
Factors of safety greater than the minimum values required by the CCR Rule were calculated for three cross sections
along the Fly Ash Pond Dam for loading conditions associated with the maximum storage pool water level, maximum
surcharge pool water level, and design level seismic event. The liquefaction factor of safety of the impoundment was
not analyzed due to the low potential for soil liquefaction of the embankment and foundation soils as determined from
index test results.
Based on review of available records concerning the Fly Ash Pond and the results of the stability analyses, no
deficiencies were noted that would affect the structural condition of the dam.
6 Conclusions
AECOM Final Summary Report
Structural Integrity Assessment
Fly Ash Pond
Cholla Power Plant
Arizona Public Service
7-1
August 2016
AECOM Job No. 60445840
This report is for the sole use of APS on this project only, and is not to be used for other projects. In the event that conclusions
based upon the data obtained in this report are made by others, such conclusions are the responsibility of others. The Initial
Structural Stability Assessment presented in this report was based on available information identified in Reference Section of
the report that AECOM has relied on but not independently verified. Therefore, the Certification of Professional Opinion is
limited to the information available to AECOM at the time the Assessment was performed in accordance with current practice
and the standard of care. Standard of care is defined as the ordinary diligence exercised by fellow practitioners in this area
performing the same services under similar circumstances during the same period. Professional judgments presented herein
are primarily based on information from previous reports that were assumed to be accurate, knowledge of the site, and partly
on our general experience with dam safety evaluations performed on other dams. No warranty or guarantee, either written or
implied, is applicable to this work.
The use of the words “certification” and/or “certify” in this document shall be interpreted and construed as a Statement of
Professional Opinion and is not and shall not be interpreted or construed as a guarantee, warranty, or legal opinion.
7 Limitations

AECOM Final Summary Report
Structural Integrity Assessment
Fly Ash Pond
Cholla Power Plant
Arizona Public Service
8-1
August 2016
AECOM Job No. 60445840
Arizona Department of Water Resources (ADWR), 1986, License of Approval, Cholla Fly Ash Pond Dam and Reservoir, State
File No. 09.28, October 21.
AECOM and Arizona Public Services Company (APS), 2016, “Cholla Power Plant Fly Ash Pond, Bottom Ash Pond,
Sedimentation Pond and Bottom Ash Monofill: Annual CCR Impoundment and Landfill Report 2015”, January.
APS, 2016, “Cholla Power Plant Bottom and Fly Ash Ponds & Cooling Reservoir Basic Data Report. “Cooper Aerial Surveys
Co., 2014, “Cholla Ash 2014: June 13, 2009 Topographic Mapping,” Prepared for Arizona Public Service Company,
Drawing No. 1, Sheet No. 1.
Arizona Water Commission, 1976, “Summary of Review of Plans and Specifications of Proposed Bottom Ash Dam (9-27) and
Fly Ash Dam (9-28) by J.D. Walters and W.C. Jenkins.” Division of Dam Safety, March 31.
Dames & Moore, 1999, “Interim Report, Geotechnical Investigation for Evaluation of Dam Embankment Crack, Fly Ash Pond
Dam, Cholla Power Plant, Joseph City, Arizona,” Prepared for Arizona Public Service Company, D&M Job No. 02353-
143-022, May 9.
Ebasco Services Inc. (Ebasco), 1975, “Arizona Public Services Cholla Generating Station Ash Disposal Sites Seepage and
Foundation Studies: Volume I of II Engineering Report,” Prepared for Arizona Public Service Company, August.
Ebasco, 1976, “Arizona Public Services Cholla Steam Electric Station, Flood Routing Studies for Bottom Ash and Fly Ash
Ponds,” May.
Ebasco, 1977, “Ash Disposal System: Fly Ash Pond Dike – Sections & Details,” Prepared for Arizona Public Service
Company, APS Drawing No. G-44558 Revision No. 10 (As Built), November 9.
Ebasco, 1977, “Arizona Public Services Cholla Steam Electric Station Units 2, 3, & 4 Ash Pond Construction, November 1977
– Final Report,” December 5.
GEOSLOPE International, 2012, GeoStudio 2012, Version 8.15.4.11512, August 2015 Release.
Harza Engineering Company (Harza), 1987, “Cholla S.G.S., Safety Inspection Report on Fly Ash Dam, Bottom Ash Dam, and
Cooling Dike,” Prepared for Arizona Public Service Company, February 27.
Idriss, I.M. and Boulanger, R.W., 2008, “Soil Liquefaction During Earthquakes,” Earthquake Engineering Research Institute,
Monograph No MNO-12.
Makdisi, F.I. and Seed, H.B., 1977, “A Simplified Procedure for Estimating Earthquake-Induced Deformations in Dams and
Embankments,” Report No. UCB/EERC-77/19, University of California, Berkeley, August.
Temchin, M., 1977, “Arizona Public Service Company Cholla Steam Electric Station Units 2, 3, & 4 Ash Pond Construction
November 1977 – Final Report,” Memorandum to G.W. Strengham of Arizona Public Service, Ebasco Services Inc.,
December 5.
United States Environmental Protection Agency (EPA), 2015, 40 CFR Parts 257 and 261 – Hazardous and Solid Waste
Management System; Disposal of Coal Combustion Residuals from Electric Utilities; Final Rule, Federal Register Vol. 80,
No. 74, April 17.
United States Geological Survey (USGS), 2013, 7.5-Minute Series Joseph City, AZ Quadrangle Map
8 References

AECOM Final Summary Report
Structural Integrity Assessment
Fly Ash Pond
Cholla Power Plant
Arizona Public Service
8-2
August 2016
AECOM Job No. 60445840
URS Corporation (URS), 2001, “Transverse Crack Evaluation and Monitoring for Fly Ash Pond Dam Arizona Public Services
Cholla Power Plant Joseph City, Arizona,” Prepared for Arizona Public Service Company, URS Job No. 02353-160-058,
October 12.

AECOM Final Summary Report
Structural Integrity Assessment
Fly Ash Pond
Cholla Power Plant
Arizona Public Service
FIG-1
August 2016
AECOM Job No. 60445840
Figures
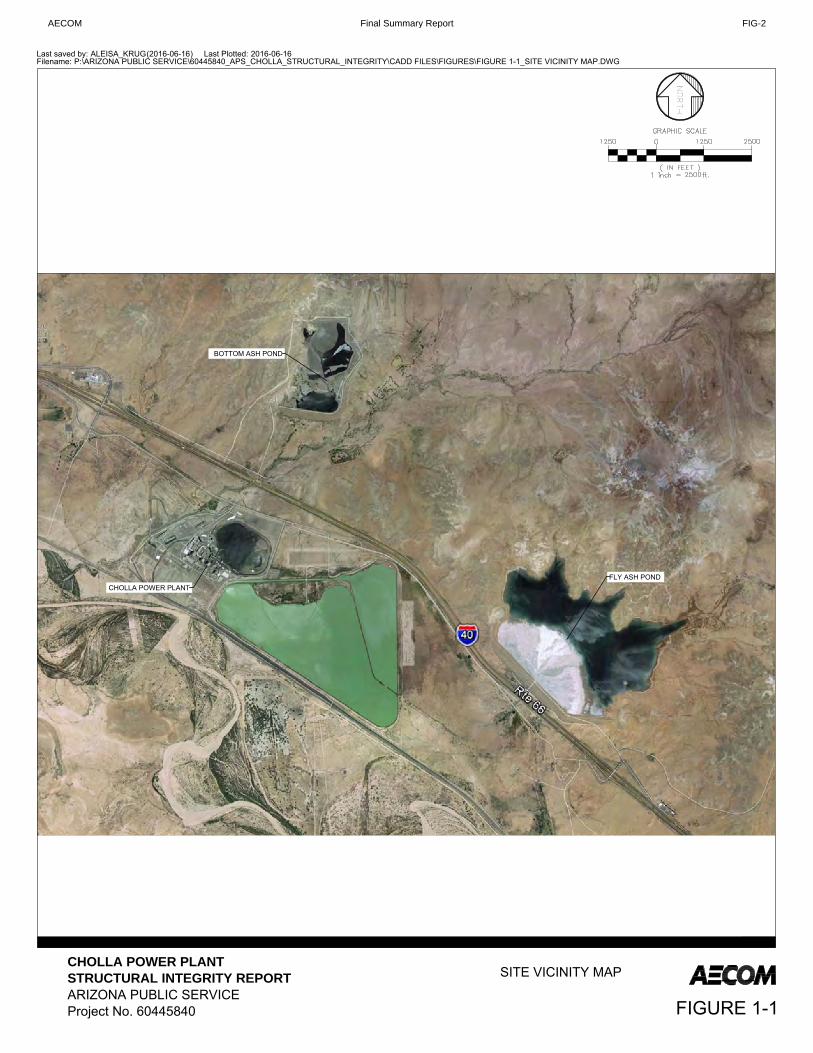
BOTTOM ASH POND
FLY ASH PONDCHOLLA POWER PLANT
Last saved by: ALEISA_KRUG(2016-06-16) Last Plotted: 2016-06-16Filename: P:\ARIZONA PUBLIC SERVICE\60445840_APS_CHOLLA_STRUCTURAL_INTEGRITY\CADD FILES\FIGURES\FIGURE 1-1_SITE VICINITY MAP.DWG
FIGURE 1-1
SITE VICINITY MAPCHOLLA POWER PLANT
STRUCTURAL INTEGRITY REPORT
ARIZONA PUBLIC SERVICEProject No. 60445840
AECOM Final Summary Report FIG-2

F-100
F-117
F-81
F-102
F-107
F-106
F-103
F-93
F-101
F-112W-123
F-92
F-91
F-90
F-111
F-113 F-114F-115
F-89
F-110
F-109
F-108
F-105
F-104
F-132
F-131
F-124
F-127
F-128
F-123
F-125F-126
F-129F-130
F-133
F-134
F-88
M-1
M-2
M-3
M-4 M-5
M-5A
M-5B
M-5C
M-6
M-6A
M-6BM-6C
M-7
M-8 M-9 M-10GERONIMO
HUNT
Last saved by: KING, JEREMY(2016-06-20) Last Plotted: 2016-06-20Filename: P:\ARIZONA PUBLIC SERVICE\60445840_APS_CHOLLA_STRUCTURAL_INTEGRITY\CADD FILES\FIGURES\FIGURE 1-2_FLY_ASH_INSTRUMENT_LOCATIONS.DWG
NORTH
FIGURE 1-2
FLY ASH PONDMONITORED INSTRUMENTATIONAND SEEPAGE LOCATION MAP
PIEZOMETERLOCATIONS AREAPPROXIMATE
CHOLLA POWER PLANT
STRUCTURAL INTEGRITY REPORT
ARIZONA PUBLIC SERVICEProject No. 60445840
AECOM Final Summary Report FIG-3

BOTTOM ASH POND
FLY ASH PONDCHOLLA POWER PLANT
Last saved by: ALEISA_KRUG(2016-06-16) Last Plotted: 2016-06-16Filename: P:\ARIZONA PUBLIC SERVICE\60445840_APS_CHOLLA_STRUCTURAL_INTEGRITY\CADD FILES\FIGURES\FIGURE 4-1_SITE TOPO MAP.DWG
SITE TOPOGRAPHIC MAPCHOLLA POWER PLANT
STRUCTURAL INTEGRITY REPORT
ARIZONA PUBLIC SERVICEProject No. 60445840 FIGURE 3-1
AECOM Final Summary Report FIG-4

Last saved by: KING, JEREMY(2016-06-20) Last Plotted: 2016-06-20Filename: P:\ARIZONA PUBLIC SERVICE\60445840_APS_CHOLLA_STRUCTURAL_INTEGRITY\CADD FILES\FIGURES\FIGURE 4-2_AREA CAPACITY CURVE_JSK.DWG
AREA CAPACITY CURVECHOLLA POWER PLANT
STRUCTURAL INTEGRITY REPORT
ARIZONA PUBLIC SERVICEProject No. 60445840 FIGURE 3-2
AECOM Final Summary Report FIG-5

FLY ASH POND(FAP)
SECTION 1
SECTION 2
SECTION 3
Last saved by: ALEISA_KRUG(2016-08-11) Last Plotted: 2016-08-11Filename: P:\ARIZONA PUBLIC SERVICE\60445840_APS_CHOLLA_STRUCTURAL_INTEGRITY\CADD FILES\FIGURES\FIGURE 5-1_CROSS SECTION LOCATIONS SFA - FAP.DWG
ANSI A 8.5" x 11"
CROSS SECTION LOCATIONSSAFETY FACTOR ASSESSMENT
FOUR CORNERS POWER PLANT
STRUCTURAL INTEGRITY REPORT
ARIZONA PUBLIC SERVICEProject No. 60445840 FIGURE 5-1
AECOM Final Summary Report FIG-6

AECOM Final Summary Report
Structural Integrity Assessment
Fly Ash Pond
Cholla Power Plant
Arizona Public Service
A-1
August 2016
AECOM Job No. 60445840
Appendix A. Historic Drawings

ORIGINAL AS-BUILT DRAWINGS
(Ebasco, 1977)
AECOM Final Summary Report A-2

AECOM Final Summary Report A-3

AECOM Final Summary Report A-4

AECOM Final Summary Report A-5
AECOM Final Summary Report A-6

AECOM Final Summary Report A-7

AECOM Final Summary Report A-8

AECOM Final Summary Report A-9

AECOM Final Summary Report A-10

SEEPAGE INTERCEPT SYSTEM DRAWINGS
(APS, 1993)
AECOM Final Summary Report A-11

AECOM Final Summary Report A-12

AECOM Final Summary Report A-13
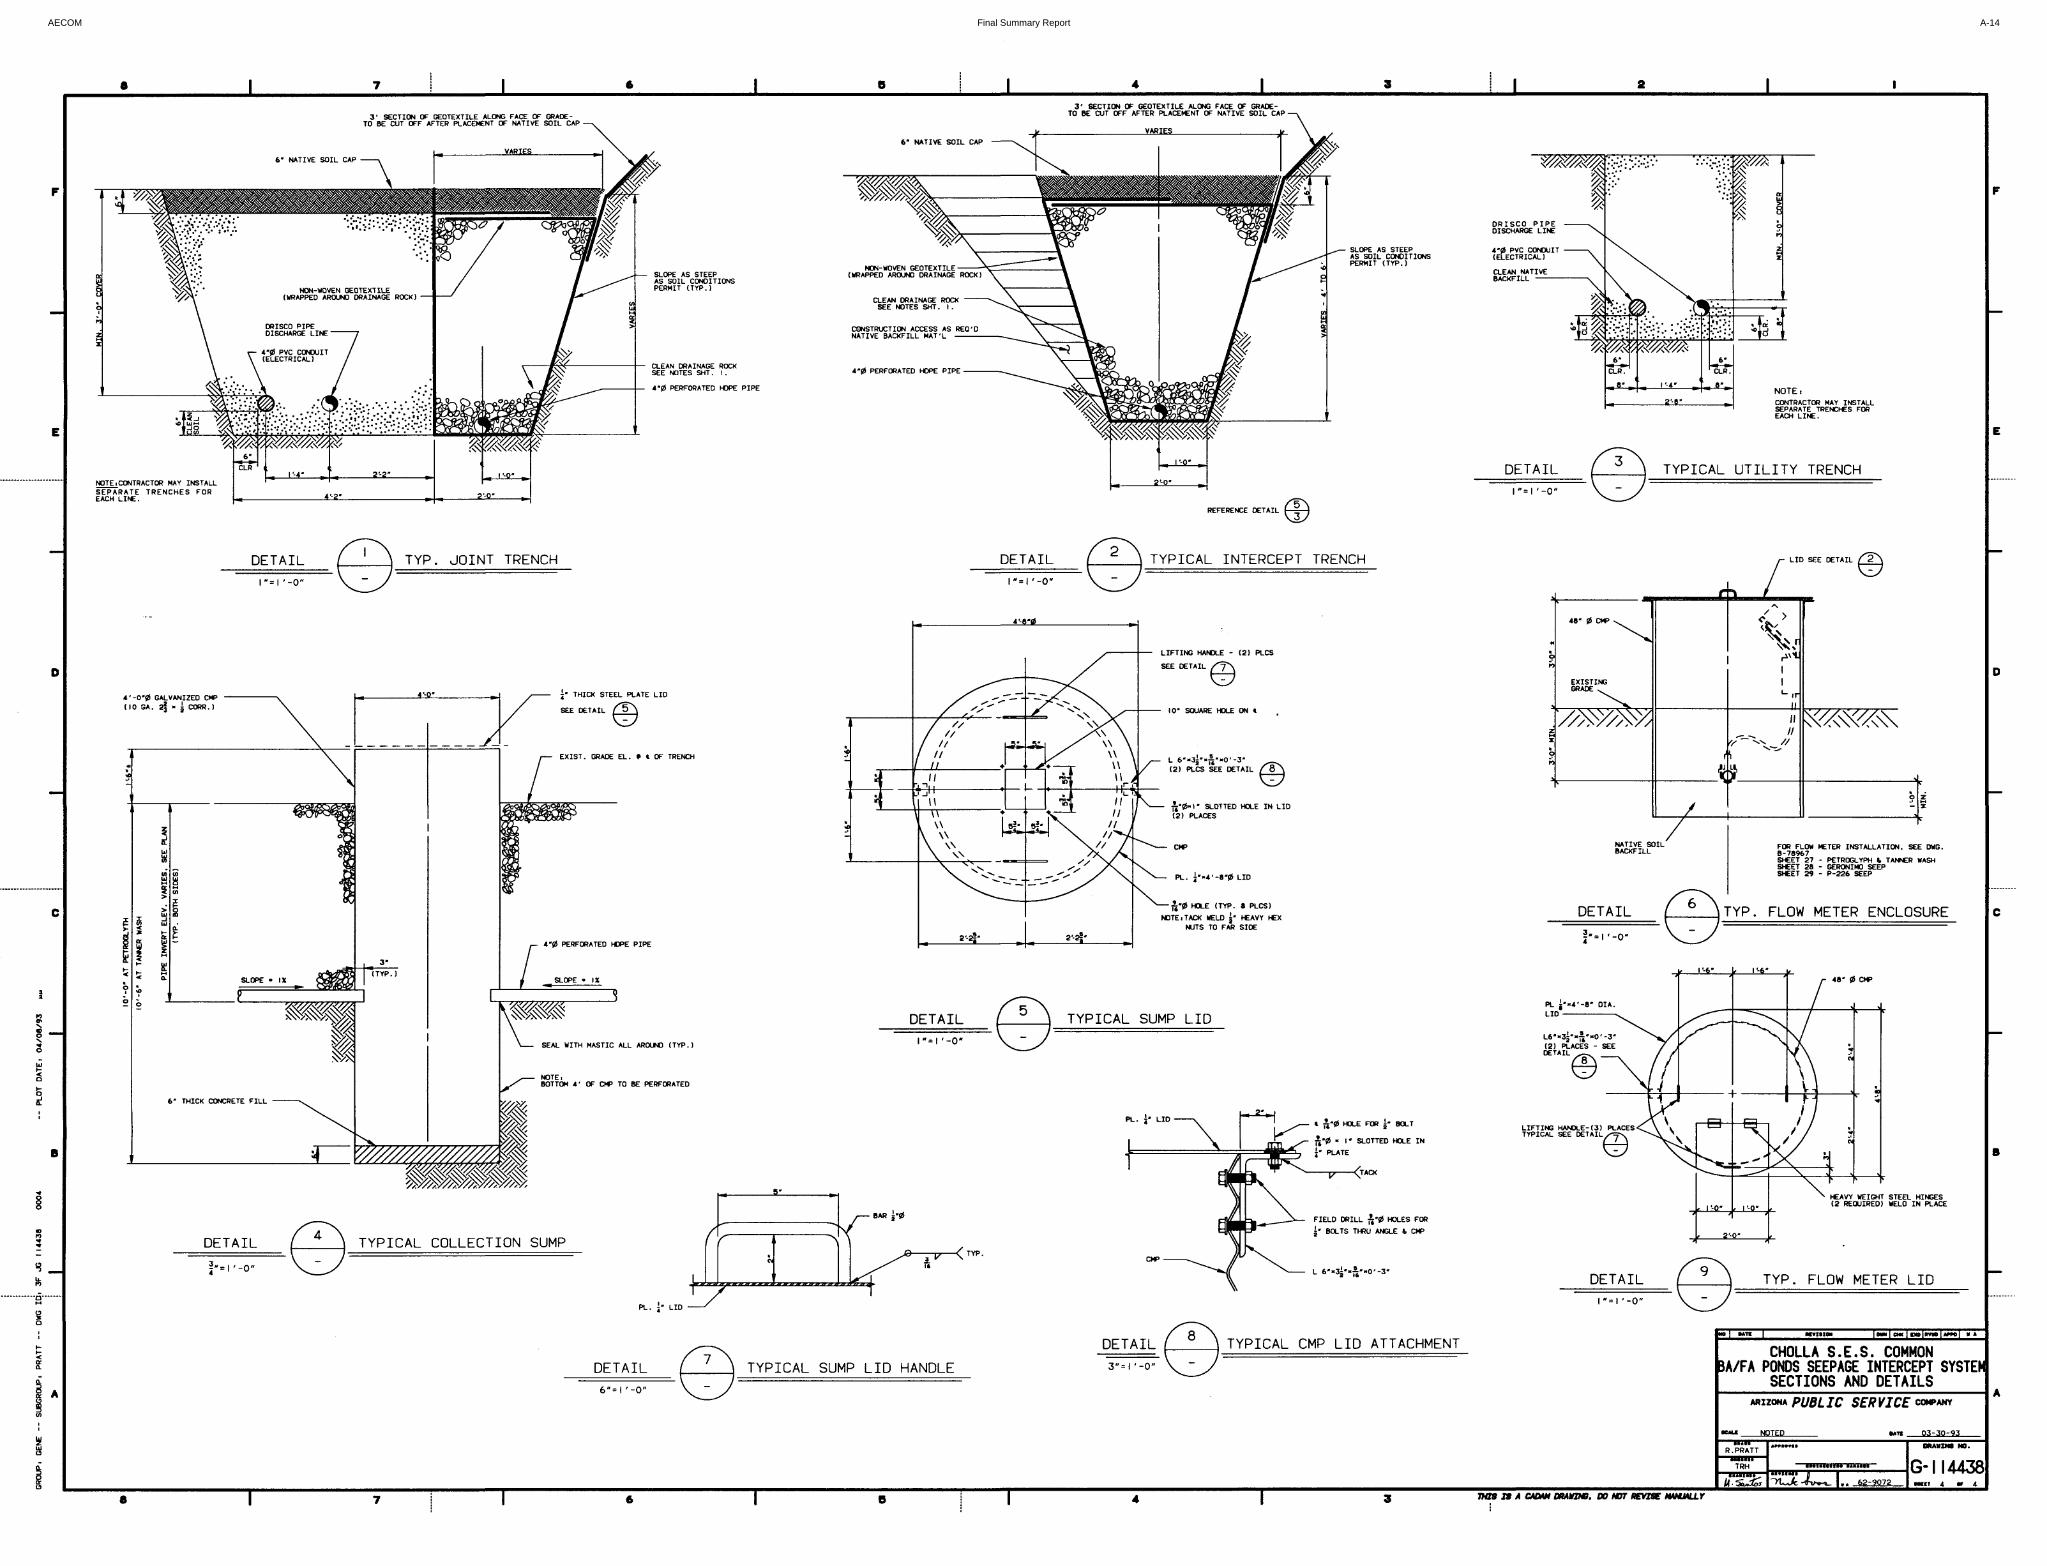
AECOM Final Summary Report A-14

EMBANKMENT MONITORING
(APS, 1999)
AECOM Final Summary Report A-15

AECOM Final Summary Report A-16
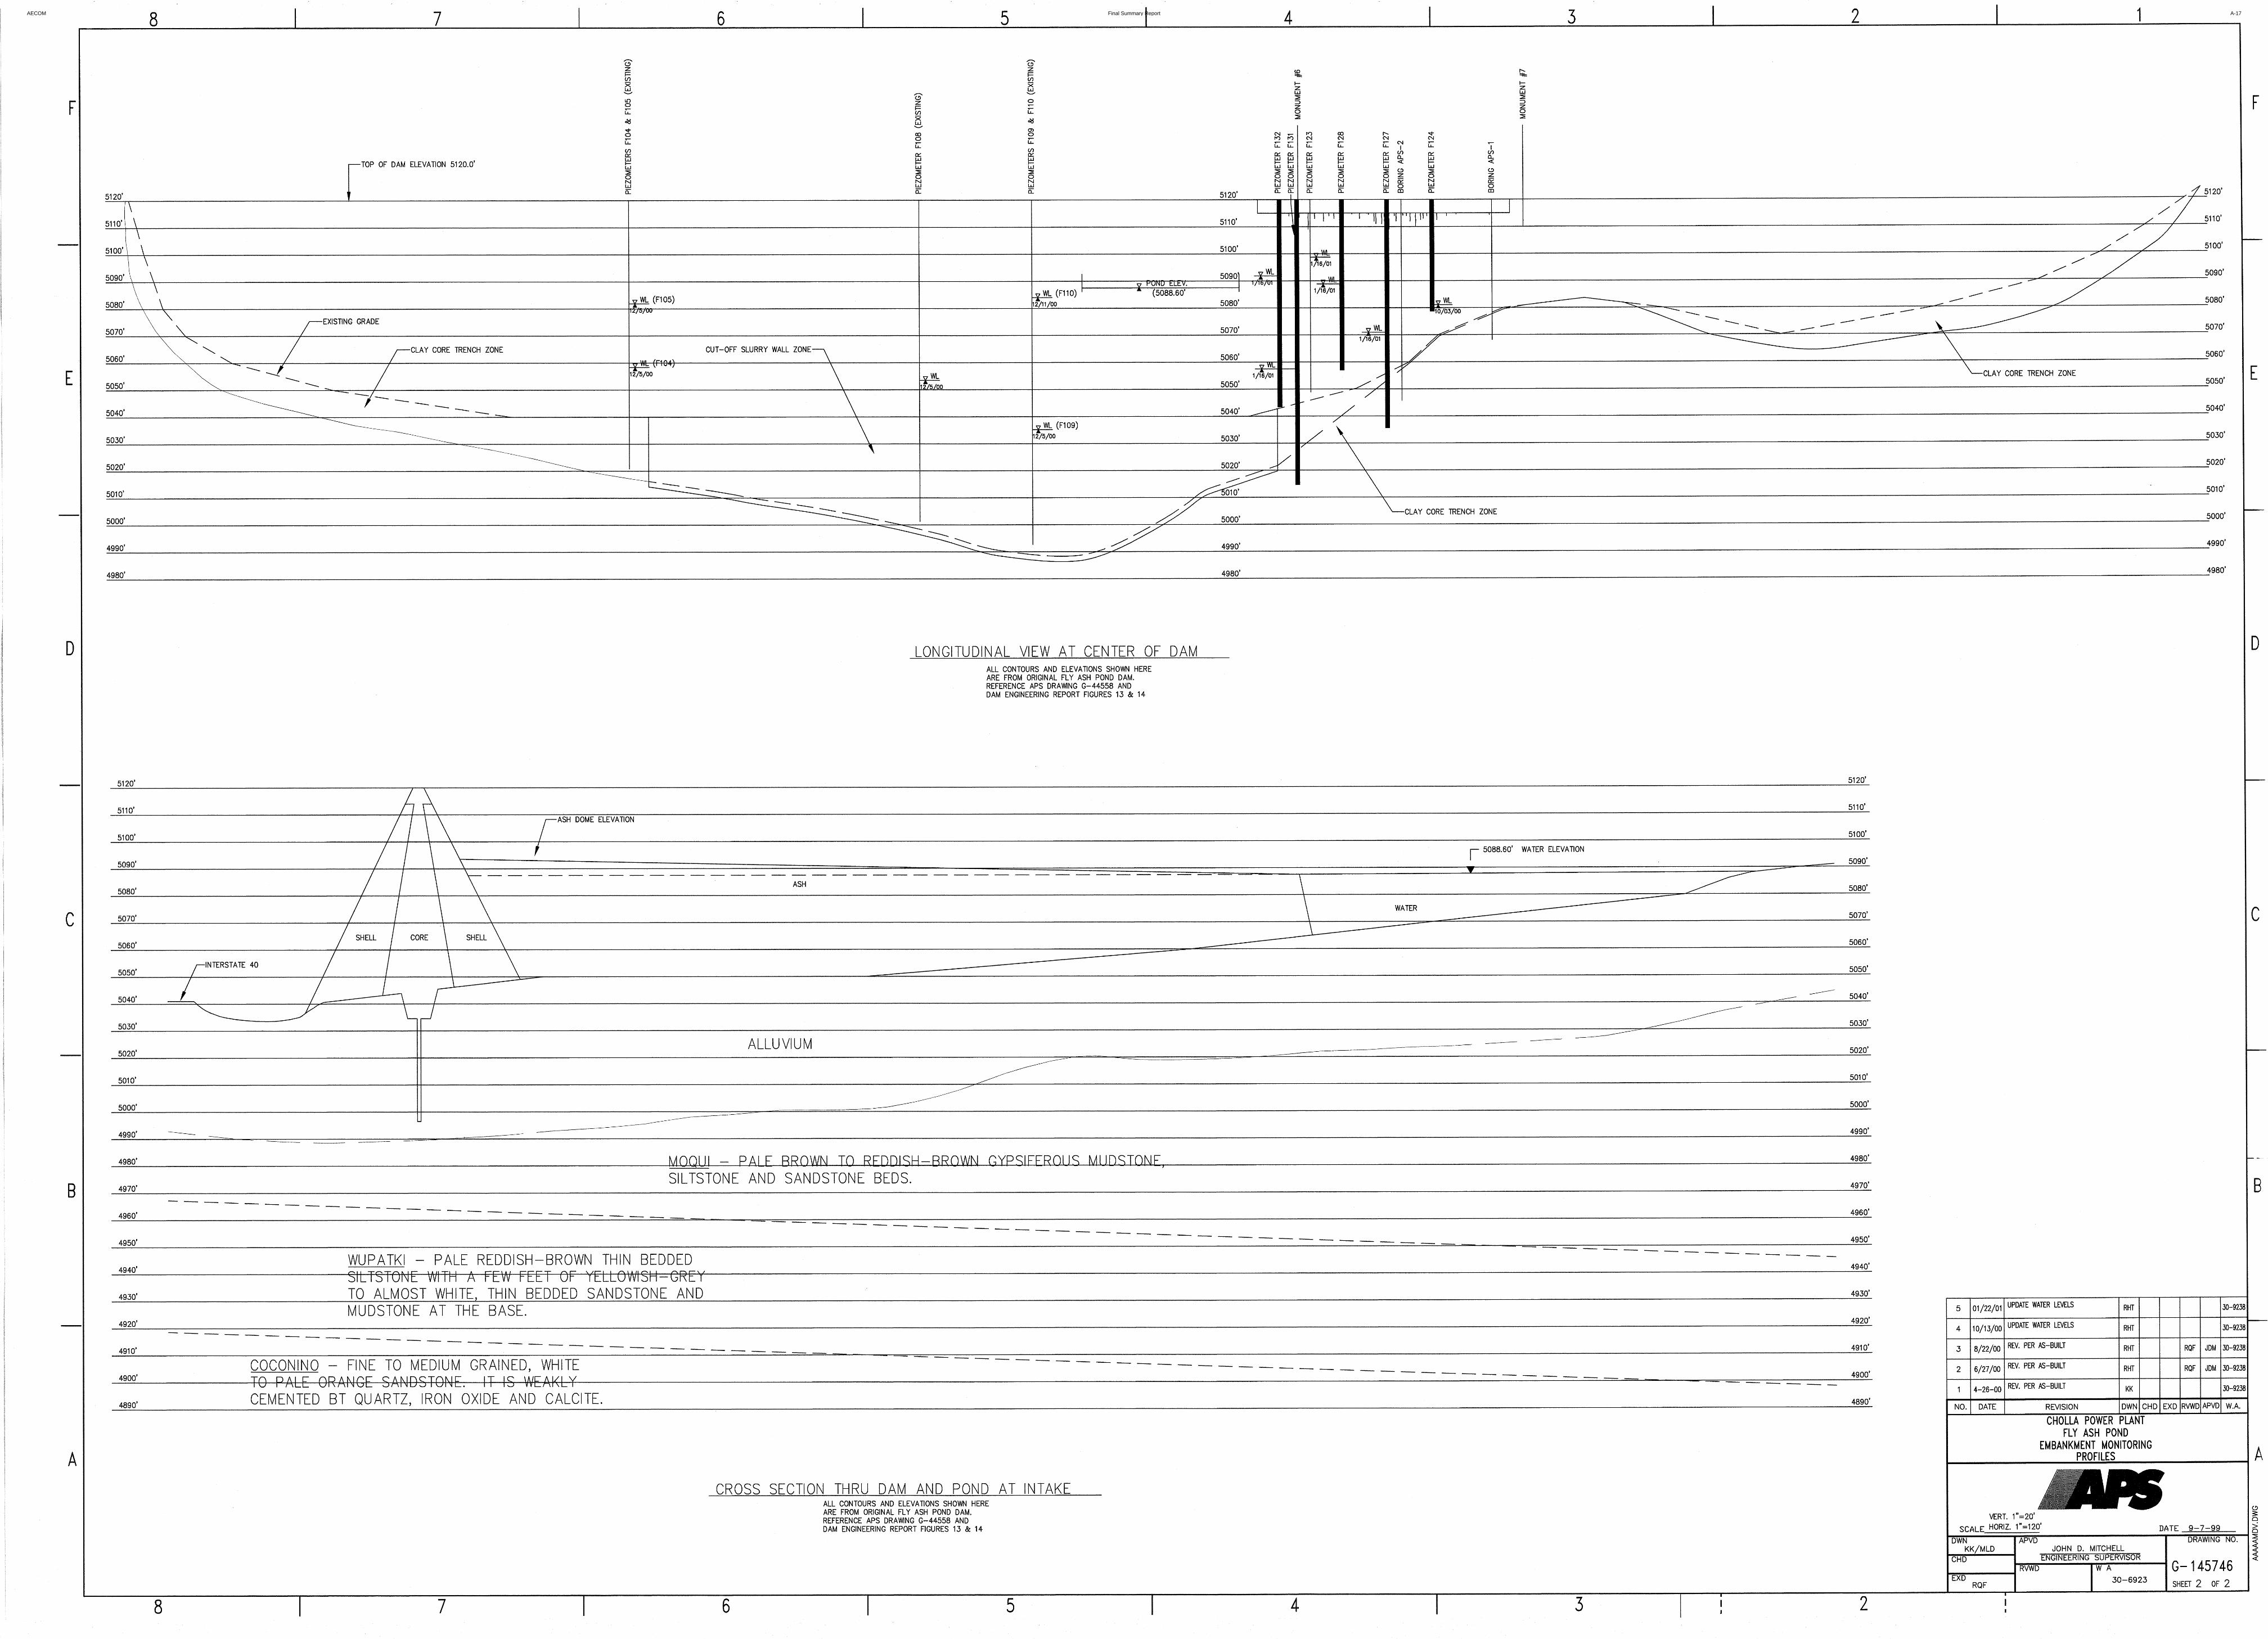
AECOM Final Summary Report A-17

DISCHARGE PIPE DRAWINGS
(APS, Rev. 2004)
AECOM Final Summary Report A-18

AECOM Final Summary Report A-19

AECOM Final Summary Report
Structural Integrity Assessment
Fly Ash Pond
Cholla Power Plant
Arizona Public Service
B-1
20 North 16th Street
Suite 100
Phoenix, AZ 85072
T (602) 371 1100
F (602) 371 1615
Appendix B. Safety Factor Calculation

AECOM Final Summary Report B-2

AECOM Final Summary Report B-3

DESIGN CALCULATION
Calculation Title: Project Title: Project No: Date: Page No:
Fly Ash Pond Safety Factor Assessment
APS Cholla Structural Integrity Assessment
60445840 4/13/16 Page 1 of 15
TABLE OF CONTENTS
1 Introduction ............................................................................................................ 2
2 Analysis Criteria..................................................................................................... 2
3 Analysis Inputs ....................................................................................................... 2
4 Assumptions ............................................................................................................ 3
5 Stability Analysis ................................................................................................... 3
5.1 Critical Stability Cross Sections ...................................................................................... 4
5.2 Material Properties .......................................................................................................... 6
5.3 Embankment Pore Pressure Distribution ........................................................................ 6
5.4 Embankment Loading Conditions .................................................................................... 7
6 Analysis Results and Conclusions .................................................................. 13
7 References ............................................................................................................. 14
8 Attachments .......................................................................................................... 15
Figures
Figure 1 Slope Stability Cross Section and Piezometer Locations Along the FAP Dam Figure 2 Table 1615.1.1Site Class Definitions (IBC, 2003) Figure 3 Table 11.8-1 (NEHRP, 2009) Figure 4 Variations of Peak Transverse Crest Acceleration v. Peak Transverse
Base Acceleration Based on Holzer (1998) Figure 5 Variation of “Maximum Acceleration Ratio” with Depth of Sliding Mass after
Makdisi and Seed (1977)
Tables
Table 1 Material Properties for the FAP Dam Safety Factor Analyses Table 2 Range of Plasticity Index and Fines Content Values for Site Materials Table 3 Safety Factor Results for the FAP Dam
AECOM Final Summary Report B-4
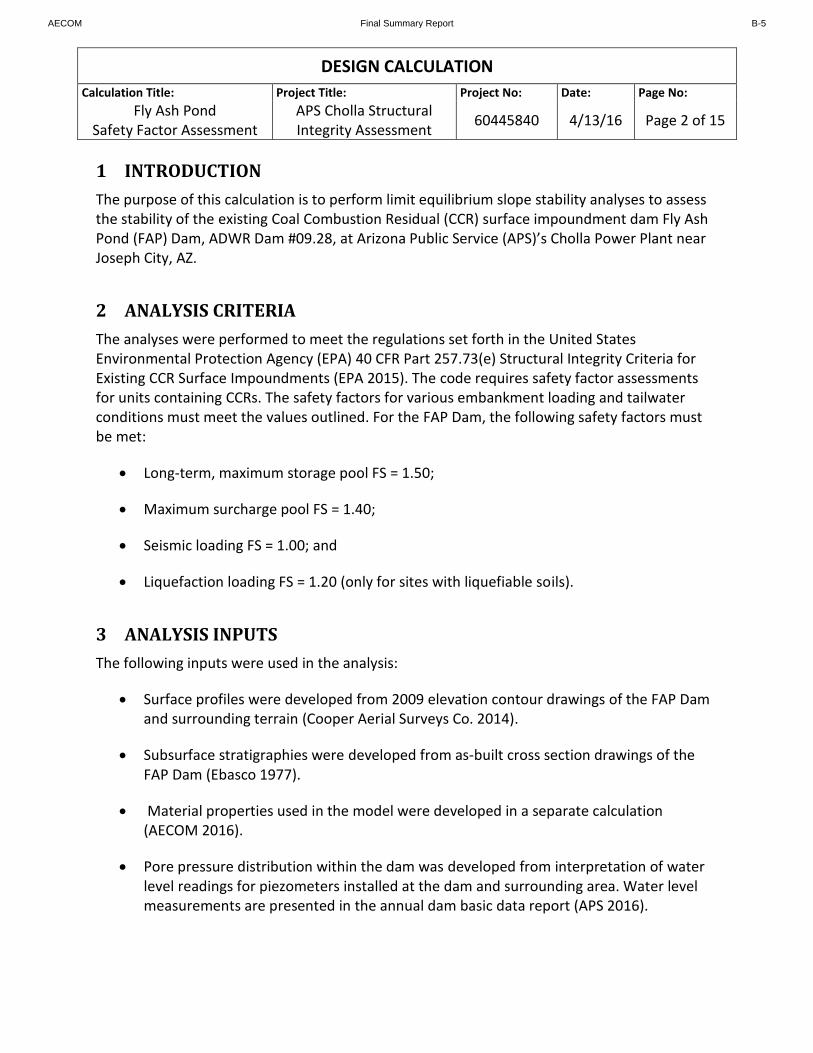
DESIGN CALCULATION
Calculation Title: Project Title: Project No: Date: Page No:
Fly Ash Pond Safety Factor Assessment
APS Cholla Structural Integrity Assessment
60445840 4/13/16 Page 2 of 15
1 INTRODUCTION
The purpose of this calculation is to perform limit equilibrium slope stability analyses to assess the stability of the existing Coal Combustion Residual (CCR) surface impoundment dam Fly Ash Pond (FAP) Dam, ADWR Dam #09.28, at Arizona Public Service (APS)’s Cholla Power Plant near Joseph City, AZ.
2 ANALYSIS CRITERIA
The analyses were performed to meet the regulations set forth in the United States Environmental Protection Agency (EPA) 40 CFR Part 257.73(e) Structural Integrity Criteria for Existing CCR Surface Impoundments (EPA 2015). The code requires safety factor assessments for units containing CCRs. The safety factors for various embankment loading and tailwater conditions must meet the values outlined. For the FAP Dam, the following safety factors must be met:
Long-term, maximum storage pool FS = 1.50;
Maximum surcharge pool FS = 1.40;
Seismic loading FS = 1.00; and
Liquefaction loading FS = 1.20 (only for sites with liquefiable soils).
3 ANALYSIS INPUTS
The following inputs were used in the analysis:
Surface profiles were developed from 2009 elevation contour drawings of the FAP Dam and surrounding terrain (Cooper Aerial Surveys Co. 2014).
Subsurface stratigraphies were developed from as-built cross section drawings of the FAP Dam (Ebasco 1977).
Material properties used in the model were developed in a separate calculation (AECOM 2016).
Pore pressure distribution within the dam was developed from interpretation of water level readings for piezometers installed at the dam and surrounding area. Water level measurements are presented in the annual dam basic data report (APS 2016).
AECOM Final Summary Report B-5

DESIGN CALCULATION
Calculation Title: Project Title: Project No: Date: Page No:
Fly Ash Pond Safety Factor Assessment
APS Cholla Structural Integrity Assessment
60445840 4/13/16 Page 3 of 15
The maximum storage pool water level of the CCR Pond was based on the maximum permissible water level stated in the permitting license for the FAP (ADWR 1986).
The surcharge pool water level of the CCR Pond was developed based on estimated water levels for the design probable maximum flood (PMF) of the FAP (Ebasco 1975).
The seismic loading for the FAP was developed from the deaggregated seismic hazard at the site based on the 2008 United States Geological Survey (USGS) National Earthquake Hazards Reduction Program (NEHRP) Provisions (USGS 2008).
The slope stability analyses were performed using the software program SLOPE/W, commercially available through GEO-SLOPE International, Ltd. (GEO-SLOPE International 2012).
4 ASSUMPTIONS
The following assumptions were used in the analysis:
The surface profile for the site was developed based on the most recent topographic survey available, from June of 2009. It is assumed that the surface topography shown in this survey is sufficiently representative of the current topography so as not to produce significant differences in the estimated safety factors. This seems reasonable since there have been no significant alterations to the FAP Dam or the immediate surrounding area since the survey was conducted, except for additional accumulation of fly ash within the impoundment.
The water level measured in the piezometers near Cross Section 2, reflect the influence of the Geronimo Seep collection system. The collection system consists of an underground french drain system and wellpoints and has been in continuous operation since the early 1990s. The seep collection system presumably lowers the phreatic water level at the downstream toe of the dam in the vicinity of the wellpoints. Since it is difficult to assess the radial influence of the collection system, it is assumed the Geronimo Seep seepage collection system is non-operational for the stability analysis of Cross Section 2. This has the effect of raising the water level downstream of the dam to near the ground surface.
5 STABILITY ANALYSIS
Slope stability analyses were performed to document minimum factors of safety for loading conditions identified by 40 CFR Section 257.73(e) using the software program SLOPE/W (GEO-SLOPE International, Ltd. 2012). The analyses were performed using Spencer’s Method, a limit
AECOM Final Summary Report B-6

DESIGN CALCULATION
Calculation Title: Project Title: Project No: Date: Page No:
Fly Ash Pond Safety Factor Assessment
APS Cholla Structural Integrity Assessment
60445840 4/13/16 Page 4 of 15
equilibrium method of slices that satisfies both force and moment equilibrium in addition to incorporating the effects of interslice forces.
5.1 Critical Stability Cross Sections
Factors of safety were calculated for critical cross-sections of the FAP Dam. The critical cross section is the cross section that is anticipated to be most susceptible to structural failure for a given loading condition. The critical cross section thus represents a “most-severe” case. Section locations were selected based on variation in the embankment height and stratigraphic conditions to represent the most-severe case.
The safety factor assessments were performed for three cross-sections along the FAP Dam:
FAP Dam Cross Sections
Figure 1. Slope Stability Cross Section and Piezometer Locations Along the FAP Dam
FAP Cross Section 1:
Cross Section 1 at the FAP was located along the western portion of the dam near piezometers F-93, F-104, and F-105. At this location, the dam is approximately 80 feet (ft) in height from EL 5,040 ft at the downstream toe to 5,120 ft at the crest; with upstream and downstream slope angles are about 3H:1V. The dam at this cross section consists of a sandy
AECOM Final Summary Report B-7

DESIGN CALCULATION
Calculation Title: Project Title: Project No: Date: Page No:
Fly Ash Pond Safety Factor Assessment
APS Cholla Structural Integrity Assessment
60445840 4/13/16 Page 5 of 15
lean clay core with an outer clayey sand shell. The dam lies on a foundation of alluvialoverburden consisting of clays, silts, and sands; overlying bedrock consisting of mudstones,siltstones, and sandstones. The depth to bedrock is about 20 ft below the ground surface(bgs). A cutoff trench filled with compacted clay extends from the clay core down to thebedrock and is used to control seepage beneath the dam, in lieu of a cutoff wall which isused for greater depths to bedrock. The upstream slope of the dam is confined byapproximately 60 ft of hydraulically-placed fly ash based on comparison between initialtopographic surveys of the area (Ebasco 1975) and 2009 surveys (Cooper Aerial Surveys2014).
FAP Cross Section 2:
Cross Section 2 at the FAP was located near the center of the dam near piezometers F-92, F-109, and F-110. At this location, the dam is approximately 80 ft in height from EL 5,040 ft atthe downstream toe to 5,120 ft at the crest; with upstream and downstream slope angles ofabout 3H:1V. Similar to Cross Section 1 described above, the dam consists of a sandy leanclay core with an outer clayey sand shell. At this location the depth to bedrock beneath thealluvial soils (same as those described for Section 1) is greatest along the dam atapproximately 52 ft bgs. A cement-bentonite cutoff wall extends from the clay core of thedam to approximately 2 ft into the bedrock and is used to control seepage beneath the damThe upstream slope of the dam is confined by approximately 60 ft of hydraulically-placed flyash based on comparison between initial topographic surveys of the area (Ebasco 1975) and2009 surveys (Cooper Aerial Surveys 2014).
FAP Cross Section 3:
Cross Section 3 at the FAP was located along the eastern portion of the dam nearpiezometers F-112, F-127, F-129, and F-130. At this location, the dam intersects a rockoutcropping commonly referred to as Geronimo Knob along its downstream slope. Conse-quently, the upstream and downstream slope heights are considerably different at approxi-mately 68 ft versus 51 ft, respectively, although both slope angles are about 3H:1V. Similar to other cross sections described above, the dam consists of a sandy lean clay core with an outer clayey sand shell. The depth to bedrock beneath the alluvial soils (same as those de-scribed for Section 1) is shallow at this section, approximately 4 to 9 ft bgs. Acutoff trench filled with compacted clay extending to the bedrock is used to controlseepage. The upstream slope of the dam is confined by approximately 50 ft ofhydraulically-placed fly ash based on comparison between initial topographic surveys of thearea (Ebasco 1975) and 2009 surveys (Cooper Aerial Surveys 2014).
AECOM Final Summary Report B-8

DESIGN CALCULATION
Calculation Title: Project Title: Project No: Date: Page No:
Fly Ash Pond Safety Factor Assessment
APS Cholla Structural Integrity Assessment
60445840 4/13/16 Page 6 of 15
5.2 Material Properties
A material properties calculation package was prepared to present the methods and information supporting the parameter selection for the materials at the FAP Dam (AECOM 2016). The material properties identified in the calculation and used in the slope stability analyses are presented in Table 1 below.
Table 1. Material Properties for the FAP Dam Safety Factor Analyses
Material
Sat. Unit Weight,
sat (pcf)
Moist Unit Weight,
m (pcf)
Drained Strengths Undrained Strengths
Cohesion, c’
(psf)
Friction
Angle, ‘ (degrees)
Undrained Strength, Su (psf)
Undrained Strength
Ratio
Clay Core 125 120 0 28 - 0.38
Shell 130 125 0 33 - -
Alluvium 120 120 0 26 - -
Bedrock 150 150 1,000 65 - -
Cutoff Wall 106 106 0 28 10 -
Fly Ash 90 90 0 0 - -
5.3 Embankment Pore Pressure Distribution
Based on guidance from the EPA Regulations (EPA 2015), pore-water pressures are estimated from the most reliable of the following: “1) Field measurements of pore pressures in existing slopes; 2) past experience and judgment of the Engineer; 3) hydrostatic pressures calculated for the no-flow condition; or 4) steady-state seepage analysis using flow nets or finite element analyses.” For the FAP analysis, the pore pressure distribution was assigned using water level readings obtained from piezometers located near the stability cross sections (APS 2014). This distribution was adjusted based on engineering judgement to correspond with pond water level under steady-state, maximum storage pool conditions (ADWR 1986), and pond water levels under maximum surcharge pool conditions (Ebasco 1975). The piezometers used to estimate the pore water pressure within the dam cross sections are shown in Figures 1.
The FAP (upstream) water level under maximum storage pool condition was based on the permitted water level of the pond as stated in the ADWR operating license for the dam. Since the dam has no outlet work structure and rely on pumping rate from plant, seepage, and evaporation to control water levels, the maximum storage pool was set at the maximum permitted water levels. For the FAP this is EL 5,114.0 ft (ADWR 1986). The surcharge pool level is based on the expected water level raise during the design PMF and is EL 5,116.0 ft for the FAP (Ebasco 1975).
AECOM Final Summary Report B-9

DESIGN CALCULATION
Calculation Title: Project Title: Project No: Date: Page No:
Fly Ash Pond Safety Factor Assessment
APS Cholla Structural Integrity Assessment
60445840 4/13/16 Page 7 of 15
5.4 Embankment Loading Conditions
Per 40 CFR Section 257.73(e), the following loading conditions were considered for each selected stability cross section:
Long-term, maximum storage pool;
Maximum surcharge pool;
Seismic loading; and
Liquefaction.
These loading conditions are described below.
Long-Term, Maximum Storage Pool
The maximum storage pool loading is the maximum water level that can be maintained that will result in the full development of a steady-state seepage condition. This loading condition is evaluated to document whether the CCR surface impoundments can withstand the maximum expected pool elevation with full development of saturation in the embankment under long-term loading. The maximum storage pool considers a pool elevation in the CCR unit that is equivalent to the maximum permitted water levels using shear strengths expressed as effective stress with pore water pressures that correspond to the long-term condition.
For this analysis, the long-term, maximum storage pool in the FAP was set at EL 5,114.0 ft. Since the piezometric conditions within the dam are at steady-state flow, drained material strengths were used in the analysis.
Maximum Surcharge Pool
The maximum surcharge pool loading is the temporary rise in pool elevation above the maximum storage pool elevation for which the CCR surface impoundment is normally subject under the inflow design flood state. This loading condition is evaluated to document whether the CCR surface impoundments can withstand a short-term impact of a raised pool level on the stability of the downstream slope. The maximum surcharge pool considers a temporary pool elevation that is higher than the maximum storage pool assuming that it persists for a length of time sufficient for steady-state seepage or hydrostatic conditions to fully develop within the embankment.
For this analysis, the maximum surcharge pool in the FAP was set at EL 5,116.0 ft. Since the piezometric conditions within the dam are at steady-state flow for this loading condition, drained material strengths were used in the analysis.
Seismic Loading
AECOM Final Summary Report B-10

DESIGN CALCULATION
Calculation Title: Project Title: Project No: Date: Page No:
Fly Ash Pond Safety Factor Assessment
APS Cholla Structural Integrity Assessment
60445840 4/13/16 Page 8 of 15
Seismic loading was evaluated to document whether the CCR surface impoundments are capable of withstanding a design earthquake without damage to the foundation or embankment that would cause a discharge of its contents. The seismic loading is assessed under seismic loading conditions for a seismic loading event with a 2% probability of exceedance in 50 years, equivalent to a return period of approximately 2,500 years. A pseudo-static analysis was used to represent the seismic loading.
The peak horizontal bedrock acceleration for a site classification of B “Rock” based on the USGS
2008 NEHRP seismic hazard map with a 2% probability of exceedance in 50 years is 0.0807g as
presented in Attachment A (USGS 2008). Based on previous site explorations, a sit classification
of D “Stiff Soil” was assigned to the site as illustrated in Table 1615.1.1 from the IBC (2003)
shown in Figure 2.
Figure 2. Table 161.1.1 Site Class Definitions (IBC 2003)
AECOM Final Summary Report B-11

DESIGN CALCULATION
Calculation Title: Project Title: Project No: Date: Page No:
Fly Ash Pond Safety Factor Assessment
APS Cholla Structural Integrity Assessment
60445840 4/13/16 Page 9 of 15
The PGA at the ground surface for Site Class D, or PGAM, was determined by amplifying the PGA for rock (Site Class B) using the following equation presented in NEHRP, 2009:
𝑃𝐺𝐴𝑀 = 𝐹𝑃𝐺𝐴(𝑃𝐺𝐴)
𝑃𝐺𝐴𝑀 = 1.6(0.0807𝑔)
𝑃𝐺𝐴𝑀 = 0.129𝑔
Where:
PGAM = Maximum considered earthquake geometric mean peak ground acceleration adjusted for Site Class effects
PGA = Mapped maximum considered earthquake geometric mean peak ground acceleration
FPGA = Site coefficient from Table 11.8-1 (Figure 3)
Figure 3. Table 11.8-1 Site Coefficient FPGA (NEHRP 2009)
The PGA at the ground surface for Site Class D (PGAM) was then used to estimate the peak transverse acceleration at the crest of the embankment, PGAcrest = 0.307g, as shown on Figure 4 and based on variations in recorded peak crest accelerations versus those recorded at the base of earth and rock fill dams by Idriss (2015) and on recorded values for Loma Prieta, and other earthquakes, by Holzer (USGS, 1998).
AECOM Final Summary Report B-12

DESIGN CALCULATION
Calculation Title: Project Title: Project No: Date: Page No:
Fly Ash Pond Safety Factor Assessment
APS Cholla Structural Integrity Assessment
60445840 4/13/16 Page 10 of 15
Figure 4. Variations of Peak Transverse Crest Acceleration vs. Peak Transverse
Base Acceleration Based on Holzer (1998)
Makdisi and Seed (1977) notes that the “maximum acceleration ratio” varies with the depth of
the sliding mass relative to the embankment height. Figure 5 (shown below) presents the
relationship between maximum acceleration ratio (kmax/umax) and depth of sliding mass (y/h).
For deep-seated failure surfaces that involve the entire vertical profile of the dam slope and
extend from the crest to the toe or below the toe of the embankment into the foundation soils,
the acceleration at the crest can be as low as approximately 34 percent of the maximum value:
AECOM Final Summary Report B-13

DESIGN CALCULATION
Calculation Title: Project Title: Project No: Date: Page No:
Fly Ash Pond Safety Factor Assessment
APS Cholla Structural Integrity Assessment
60445840 4/13/16 Page 11 of 15
Figure 5. Variation of “Maximum Acceleration Ratio” with
Depth of Sliding Mass after Makdisi and Seed (1977)
Therefore:
kmax
umax= 0.34
Where: kmax = the maximum average acceleration for the potential sliding mass
umax = the maximum crest acceleration
kmax = 0.34(umax)
kmax = 0.34(0.37g)
kmax = 0.13g
The pseudo-static analyses incorporated a horizontal seismic coefficient of 0.13g.
AECOM Final Summary Report B-14

DESIGN CALCULATION
Calculation Title: Project Title: Project No: Date: Page No:
Fly Ash Pond Safety Factor Assessment
APS Cholla Structural Integrity Assessment
60445840 4/13/16 Page 12 of 15
The water level in the FAP for the seismic loading analysis was set to EL 5,114.0 ft, to match the
long-term, maximum storage pool. The Clay Core and Cutoff Wall materials were assigned
undrained strength. Due to the relatively rapid loading induced during the seismic event and
these materials’ relatively low hydraulic conductivity, it is anticipated that the Clay Core and
Cutoff Wall materials would behave in an undrained manner. All, other materials used drained
strength parameters.
Liquefaction
The liquefaction factor of safety is evaluated for CCR units that show, through representative soil sampling and construction documentation that soils of the embankment and/or foundation are susceptible to liquefaction. The liquefaction factor of safety is calculated to document whether the CCR unit would remain stable if the soils in the embankment and/or foundation experienced liquefaction.
Post-construction geotechnical exploration of the FAP and Bottom Ash Pond Dams (Harza 1987 and D&M 1999) indicated the Clay Core (embankment) and Alluvium Overburden (foundation) materials have plasticity indexes and fine contents as shown in Table 2 below. Generally, the behavior of soils that have fines contents greater than 35 percent are dominated by the plasticity of their fines (Idriss and Boulanger 2008). Fines with Plasticity Index (PI) less the 7 tend to behave more sand-like and are susceptible to soil liquefaction, while those with PI greater than 7 tend to behave more clay-like and are not susceptible to liquefaction. The lowest measured value of PI for both the Clay Core and Alluvium Overburden is 12, indicating these soils would tend to behave in a clay-like manner during a seismic event and not be susceptible to soil liquefaction. Consequently, a liquefaction factor of safety analysis was not performed for the FAP.
Table 2. Range of Plasticity Index and Fines Content Values for Site Materials
Material
Plasticity Index Fines Contents, %
Minimum Value
Maximum Value
Minimum Value
Maximum Value
Clay Core 12 39 48 88
Alluvium Overburden 12 17 30 54
AECOM Final Summary Report B-15

DESIGN CALCULATION
Calculation Title: Project Title: Project No: Date: Page No:
Fly Ash Pond Safety Factor Assessment
APS Cholla Structural Integrity Assessment
60445840 4/13/16 Page 13 of 15
6 ANALYSIS RESULTS AND CONCLUSIONS
The results of the slope stability analysis are presented in Attachment B. Tables 3 below summarize the results of the safety factor analysis.
Table 3. Safety Factor Results for the FAP Dam
Loading Condition Required
Safety Factor
Calculated Minimum Safety Factor
Cross Section 1 Cross Section 2 Cross Section 3
Long-term, maximum storage pool
1.50 1.63 1.53 1.73
Maximum surcharge pool
1.40 1.61 1.52 1.70
Seismic (Pseudo-Static)
1.00 1.08 1.02 1.15
The results of the safety factor analyses show that the FAP Dam exceed the minimum required factors of safety for the long-term, maximum storage pool; the maximum surcharge pool; and the seismic (pseudo-static) loading conditions.
AECOM Final Summary Report B-16
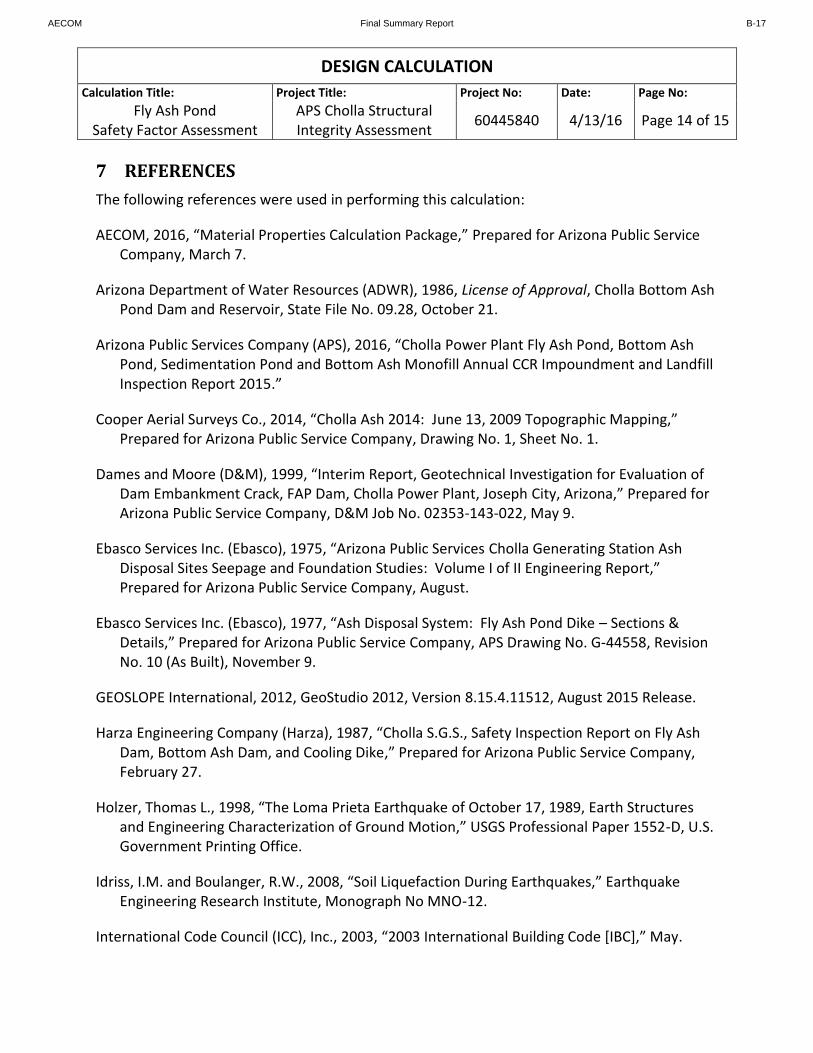
DESIGN CALCULATION
Calculation Title: Project Title: Project No: Date: Page No:
Fly Ash Pond Safety Factor Assessment
APS Cholla Structural Integrity Assessment
60445840 4/13/16 Page 14 of 15
7 REFERENCES
The following references were used in performing this calculation:
AECOM, 2016, “Material Properties Calculation Package,” Prepared for Arizona Public Service Company, March 7.
Arizona Department of Water Resources (ADWR), 1986, License of Approval, Cholla Bottom Ash Pond Dam and Reservoir, State File No. 09.28, October 21.
Arizona Public Services Company (APS), 2016, “Cholla Power Plant Fly Ash Pond, Bottom Ash Pond, Sedimentation Pond and Bottom Ash Monofill Annual CCR Impoundment and Landfill Inspection Report 2015.”
Cooper Aerial Surveys Co., 2014, “Cholla Ash 2014: June 13, 2009 Topographic Mapping,” Prepared for Arizona Public Service Company, Drawing No. 1, Sheet No. 1.
Dames and Moore (D&M), 1999, “Interim Report, Geotechnical Investigation for Evaluation of Dam Embankment Crack, FAP Dam, Cholla Power Plant, Joseph City, Arizona,” Prepared for Arizona Public Service Company, D&M Job No. 02353-143-022, May 9.
Ebasco Services Inc. (Ebasco), 1975, “Arizona Public Services Cholla Generating Station Ash Disposal Sites Seepage and Foundation Studies: Volume I of II Engineering Report,” Prepared for Arizona Public Service Company, August.
Ebasco Services Inc. (Ebasco), 1977, “Ash Disposal System: Fly Ash Pond Dike – Sections & Details,” Prepared for Arizona Public Service Company, APS Drawing No. G-44558, Revision No. 10 (As Built), November 9.
GEOSLOPE International, 2012, GeoStudio 2012, Version 8.15.4.11512, August 2015 Release.
Harza Engineering Company (Harza), 1987, “Cholla S.G.S., Safety Inspection Report on Fly Ash Dam, Bottom Ash Dam, and Cooling Dike,” Prepared for Arizona Public Service Company, February 27.
Holzer, Thomas L., 1998, “The Loma Prieta Earthquake of October 17, 1989, Earth Structures and Engineering Characterization of Ground Motion,” USGS Professional Paper 1552-D, U.S. Government Printing Office.
Idriss, I.M. and Boulanger, R.W., 2008, “Soil Liquefaction During Earthquakes,” Earthquake Engineering Research Institute, Monograph No MNO-12.
International Code Council (ICC), Inc., 2003, “2003 International Building Code [IBC],” May.
AECOM Final Summary Report B-17
DESIGN CALCULATION
Calculation Title: Project Title: Project No: Date: Page No:
Fly Ash Pond Safety Factor Assessment
APS Cholla Structural Integrity Assessment
60445840 4/13/16 Page 15 of 15
National Earthquake Hazard Reduction Program (NEHRP), 2009, “Recommended Seismic
Provisions for New and Other Structures,” Document No. FEMA P-750, 2009 Ed.
Makdisi, F.I. and Seed, H.B., 1977, “A Simplified Procedure for Estimating Earthquake-Induced Deformations in Dams and Embankments,” Report No. UCB/EERC-77/19, University of California, Berkeley, August.
United States Environmental Protection Agency (EPA), 2015, 40 CFR § 257 and 261 – Hazardous and Solid Waste Management System; Disposal of Coal Combustion Residuals from Electric Utilities; Final Rule, Federal Register Vol. 80, No. 74, April 17.
United States Geological Survey (USGS), 2008. 2008 Interactive Deaggregations. http://geohazards.usgs.gov/deaggint/2008/. Accessed March 11, 2016.
8 ATTACHMENTS
ATTACHMENT A USGS 2008 Seismic PSH Deaggregation
ATTACHMENT B Slope/W Output Figures
AECOM Final Summary Report B-18

ATTACHMENT A
USGS 2008 Seismic PSH Deaggregation
AECOM Final Summary Report B-19

0
50
100
150
200
250
300
350
400
Closest Distance, Rcd (km)0
50
100
150
200
250
300
350
400
Closest Distance, Rcd (km)
4.5
5.0
5.5
6.0
6.5
7.0
MAGNITUDE (Mw)
4.5
5.0
5.5
6.0
6.5
7.0
MAGNITUDE (Mw)
24
68
10
% C
ontr
ibutio
n to H
aza
rd
PSH Deaggregation on NEHRP BC rockCholla_PP 110.280o W, 34.941 N.Peak Horiz. Ground Accel.>=0.08068 gAnn. Exceedance Rate .405E-03. Mean Return Time 2475 yearsMean (R,M,ε0) 43.9 km, 5.95, 0.31Modal (R,M,ε0) = 33.2 km, 6.20, 0.19 (from peak R,M bin)Modal (R,M,ε*) = 31.4 km, 5.60, 1 to 2 sigma (from peak R,M,ε bin)Binning: DeltaR 25. km, deltaM=0.2, Deltaε=1.0
200910 UPDATE
ε0 < -2
-2 < ε0 < -1
-1 < ε0 <-0.5
-0.5 < ε0 < 0
0 < ε0 < 0.5
0.5 < ε0 < 1
1 < ε0 < 2
2 < ε0 < 3
Prob. SA, PGA
<median(R,M) >median
GMT 2016 Mar 11 23:50:39 Distance (R), magnitude (M), epsilon (E0,E) deaggregation for a site on rock with average vs= 760. m/s top 30 m. USGS CGHT PSHA2008 UPDATE Bins with lt 0.05% contrib. omitted
AECOM Final Summary Report B-20

ATTACHMENT B
Slope/W Output Figures
AECOM Final Summary Report B-21
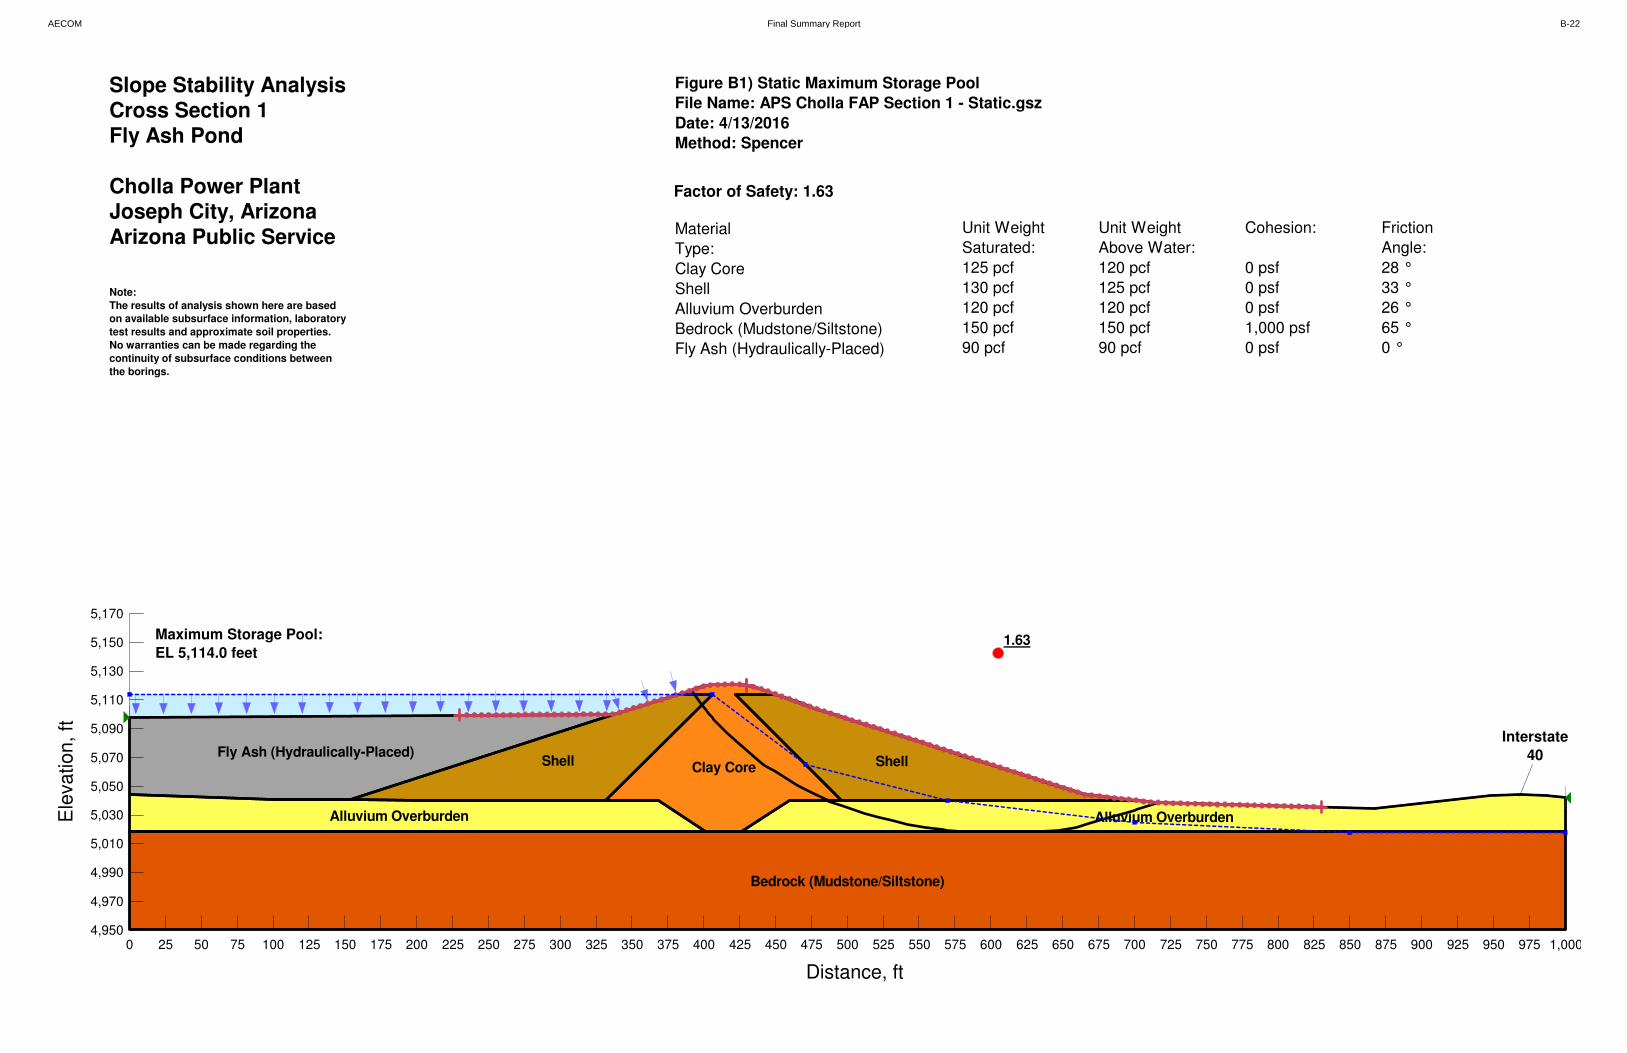
Clay CoreShellFly Ash (Hydraulically-Placed)
Alluvium Overburden
Shell
Alluvium Overburden
Bedrock (Mudstone/Siltstone)
1.63
Slope Stability AnalysisCross Section 1
Fly Ash Pond
Cholla Power PlantJoseph City, Arizona
Arizona Public Service
Note:
The results of analysis shown here are based
on available subsurface information, laboratory
test results and approximate soil properties.
No warranties can be made regarding the
continuity of subsurface conditions between
the borings.
Figure B1) Static Maximum Storage Pool
File Name: APS Cholla FAP Section 1 - Static.gsz
Date: 4/13/2016
Method: Spencer
Factor of Safety: 1.63
Material
Type:
Clay Core
Shell
Alluvium Overburden
Bedrock (Mudstone/Siltstone)
Fly Ash (Hydraulically-Placed)
Unit Weight
Saturated:
125 pcf
130 pcf
120 pcf
150 pcf
90 pcf
Unit Weight
Above Water:
120 pcf
125 pcf
120 pcf
150 pcf
90 pcf
Cohesion:
0 psf
0 psf
0 psf
1,000 psf
0 psf
Friction
Angle:
28 °
33 °
26 °
65 °
0 °
Maximum Storage Pool:
EL 5,114.0 feet
Interstate
40
Distance, ft
0 25 50 75 100 125 150 175 200 225 250 275 300 325 350 375 400 425 450 475 500 525 550 575 600 625 650 675 700 725 750 775 800 825 850 875 900 925 950 975 1,000
Ele
vation, ft
4,950
4,970
4,990
5,010
5,030
5,050
5,070
5,090
5,110
5,130
5,150
5,170
AECOM Final Summary Report B-22

Clay CoreShellFly Ash (Hydraulically-Placed)
Alluvium Overburden
Shell
Alluvium Overburden
Bedrock (Mudstone/Siltstone)
1.61
Slope Stability AnalysisCross Section 1
Fly Ash Pond
Cholla Power PlantJoseph City, Arizona
Arizona Public Service
Note:
The results of analysis shown here are based
on available subsurface information, laboratory
test results and approximate soil properties.
No warranties can be made regarding the
continuity of subsurface conditions between
the borings.
Figure B2) Static Maximum Surcharge Pool
File Name: APS Cholla FAP Section 1 - Static.gsz
Date: 4/13/2016
Method: Spencer
Factor of Safety: 1.61
Material
Type:
Clay Core
Shell
Alluvium Overburden
Bedrock (Mudstone/Siltstone)
Fly Ash (Hydraulically-Placed)
Unit Weight
Saturated:
125 pcf
130 pcf
120 pcf
150 pcf
90 pcf
Unit Weight
Above Water:
120 pcf
125 pcf
120 pcf
150 pcf
90 pcf
Cohesion:
0 psf
0 psf
0 psf
1,000 psf
0 psf
Friction
Angle:
28 °
33 °
26 °
65 °
0 °
Interstate
40
Maximum Surcharge Pool:
EL 5,116.0 feet
Distance, ft
0 25 50 75 100 125 150 175 200 225 250 275 300 325 350 375 400 425 450 475 500 525 550 575 600 625 650 675 700 725 750 775 800 825 850 875 900 925 950 975 1,000
Ele
vation, ft
4,950
4,970
4,990
5,010
5,030
5,050
5,070
5,090
5,110
5,130
5,150
5,170
AECOM Final Summary Report B-23

Clay CoreShellFly Ash (Hydraulically-Placed)
Alluvium Overburden
Shell
Alluvium Overburden
Bedrock (Mudstone/Siltstone)
1.08
Slope Stability AnalysisCross Section 1
Fly Ash Pond
Cholla Power PlantJoseph City, Arizona
Arizona Public Service
Note:
The results of analysis shown here are based
on available subsurface information, laboratory
test results and approximate soil properties.
No warranties can be made regarding the
continuity of subsurface conditions between
the borings.
Figure B3) Seismic Maximum Storage Pool
File Name: APS Cholla FAP Section 1 - Seismic.gsz
Date: 4/13/2016
Method: Spencer
Factor of Safety: 1.08
Material
Type:
Clay Core
Shell
Alluvium Overburden
Bedrock (Mudstone/Siltstone)
Fly Ash (Hydraulically-Placed)
Unit Weight
Saturated:
125 pcf
130 pcf
120 pcf
150 pcf
90 pcf
Unit Weight
Above Water:
120 pcf
125 pcf
120 pcf
150 pcf
90 pcf
Cohesion:
--
0 psf
0 psf
1,000 psf
0 psf
Friction
Angle:
--
33 °
26 °
65 °
0 °
Undrained
Strength Ratio:
0.38
--
--
--
--
Maximum Storage Pool:
EL 5,114.0 feet
Interstate
40
Horz Seismic Coef.: 0.13
Distance, ft
0 25 50 75 100 125 150 175 200 225 250 275 300 325 350 375 400 425 450 475 500 525 550 575 600 625 650 675 700 725 750 775 800 825 850 875 900 925 950 975 1,000
Ele
vation, ft
4,950
4,970
4,990
5,010
5,030
5,050
5,070
5,090
5,110
5,130
5,150
5,170
AECOM Final Summary Report B-24

Fly Ash (Hydraulically-Placed)Shell Clay Core Shell
Alluvium Overburden Alluvium Overburden
Bedrock (Mudstone/Siltstone)
Cutoff Wall
1.53
Slope Stability Analysis
Cross Section 2Fly Ash Pond
Cholla Power Plant
Joseph City, ArizonaArizona Public Service
Note:
The results of analysis shown here are based
on available subsurface information, laboratory
test results and approximate soil properties.
No warranties can be made regarding the
continuity of subsurface conditions between
the borings.
Figure B4) Static Maximum Storage Pool
File Name: APS Cholla FAP Section 2 - Static.gsz
Date: 6/20/2016
Method: Spencer
Factor of Safety: 1.53
Material
Type:
Clay Core
Shell
Alluvium Overburden
Bedrock (Mudstone/Siltstone)
Cutoff Wall
Fly Ash (Hydraulically-Placed)
Unit Weight
Saturated:
125 pcf
130 pcf
120 pcf
150 pcf
106 pcf
90 pcf
Unit Weight
Above Water:
120 pcf
125 pcf
120 pcf
150 pcf
106 pcf
90 pcf
Cohesion:
0 psf
0 psf
0 psf
1,000 psf
0 psf
0 psf
Friction
Angle:
28 °
33 °
26 °
65 °
28 °
0 °
Maximum Storage Pool:
EL 5,114.0 feet
Interstate
40
Distance, ft
0 25 50 75 100 125 150 175 200 225 250 275 300 325 350 375 400 425 450 475 500 525 550 575 600 625 650 675 700 725 750 775 800 825 850 875 900 925 950 975 1,000
Ele
vation, ft
4,950
4,970
4,990
5,010
5,030
5,050
5,070
5,090
5,110
5,130
5,150
5,170
AECOM Final Summary Report B-25

Fly Ash (Hydraulically-Placed)Shell Clay Core Shell
Alluvium Overburden Alluvium Overburden
Bedrock (Mudstone/Siltstone)
Cutoff Wall
1.52
Slope Stability Analysis
Cross Section 2Fly Ash Pond
Cholla Power Plant
Joseph City, ArizonaArizona Public Service
Note:
The results of analysis shown here are based
on available subsurface information, laboratory
test results and approximate soil properties.
No warranties can be made regarding the
continuity of subsurface conditions between
the borings.
Figure B5) Static Maximum Surcharge Pool
File Name: APS Cholla FAP Section 2 - Static.gsz
Date: 6/20/2016
Method: Spencer
Factor of Safety: 1.52
Material
Type:
Clay Core
Shell
Alluvium Overburden
Bedrock (Mudstone/Siltstone)
Cutoff Wall
Fly Ash (Hydraulically-Placed)
Unit Weight
Saturated:
125 pcf
130 pcf
120 pcf
150 pcf
106 pcf
90 pcf
Unit Weight
Above Water:
120 pcf
125 pcf
120 pcf
150 pcf
106 pcf
90 pcf
Cohesion:
0 psf
0 psf
0 psf
1,000 psf
0 psf
0 psf
Friction
Angle:
28 °
33 °
26 °
65 °
28 °
0 °
Interstate
40
Maximum Surcharge Pool:
EL 5,116.0 feet
Distance, ft
0 25 50 75 100 125 150 175 200 225 250 275 300 325 350 375 400 425 450 475 500 525 550 575 600 625 650 675 700 725 750 775 800 825 850 875 900 925 950 975 1,000
Ele
vation, ft
4,950
4,970
4,990
5,010
5,030
5,050
5,070
5,090
5,110
5,130
5,150
5,170
AECOM Final Summary Report B-26

Fly Ash (Hydraulically-Placed)Shell Clay Core Shell
Alluvium Overburden Alluvium Overburden
Bedrock (Mudstone/Siltstone)
Cutoff Wall
1.02
Slope Stability AnalysisCross Section 2
Fly Ash Pond
Cholla Power PlantJoseph City, Arizona
Arizona Public Service
Note:
The results of analysis shown here are based
on available subsurface information, laboratory
test results and approximate soil properties.
No warranties can be made regarding the
continuity of subsurface conditions between
the borings.
Figure B6) Seismic Maximum Storage Pool
File Name: APS Cholla FAP Section 2 - Seismic.gsz
Date: 6/20/2016
Method: Spencer
Factor of Safety: 1.02
Material
Type:
Clay Core
Shell
Alluvium Overburden
Bedrock (Mudstone/Siltstone)
Cutoff Wall
Fly Ash (Hydraulically-Placed)
Unit Weight
Saturated:
125 pcf
130 pcf
120 pcf
150 pcf
106 pcf
90 pcf
Unit Weight
Above Water:
120 pcf
125 pcf
120 pcf
150 pcf
106 pcf
90 pcf
Cohesion:
--
0 psf
0 psf
1,000 psf
10 psf
0 psf
Friction
Angle:
--
33 °
26 °
65 °
0 °
0 °
Undrained
Strength Ratio:
0.38
--
--
--
--
--
Maximum Storage Pool:
EL 5,114.0 feet
Interstate
40
Horz Seismic Coef.: 0.13
Distance, ft
0 25 50 75 100 125 150 175 200 225 250 275 300 325 350 375 400 425 450 475 500 525 550 575 600 625 650 675 700 725 750 775 800 825 850 875 900 925 950 975 1,000
Ele
vation, ft
4,950
4,970
4,990
5,010
5,030
5,050
5,070
5,090
5,110
5,130
5,150
5,170
AECOM Final Summary Report B-27

Fly Ash (Hydraulically-Placed) Shell Clay Core Shell
Alluvium OverburdenAlluvium Overburden
Alluvium Overburden
Bedrock (Mudstone/Siltstone)
1.73
Slope Stability AnalysisCross Section 3
Fly Ash Pond
Cholla Power PlantJoseph City, Arizona
Arizona Public Service
Note:
The results of analysis shown here are based
on available subsurface information, laboratory
test results and approximate soil properties.
No warranties can be made regarding the
continuity of subsurface conditions between
the borings.
Figure B7) Static Maximum Storage Pool
File Name: APS Cholla FAP Section 3 - StaticA.gsz
Date: 4/13/2016
Method: Spencer
Factor of Safety: 1.73
Material
Type:
Clay Core
Shell
Alluvium Overburden
Bedrock (Mudstone/Siltstone)
Fly Ash (Hydraulically-Placed)
Unit Weight
Saturated:
125 pcf
130 pcf
120 pcf
150 pcf
90 pcf
Unit Weight
Above Water:
120 pcf
125 pcf
120 pcf
150 pcf
90 pcf
Cohesion:
0 psf
0 psf
0 psf
1,000 psf
0 psf
Friction
Angle:
28 °
33 °
26 °
65 °
0 °
Maximum Storage Pool:
EL 5,114.0 feet
Interstate
40
Distance, ft
0 25 50 75 100 125 150 175 200 225 250 275 300 325 350 375 400 425 450 475 500 525 550 575 600 625 650 675 700 725 750 775 800 825 850 875 900 925 950 975 1,000
Ele
vation, ft
4,950
4,970
4,990
5,010
5,030
5,050
5,070
5,090
5,110
5,130
5,150
5,170
AECOM Final Summary Report B-28

Fly Ash (Hydraulically-Placed) Shell Clay Core Shell
Alluvium OverburdenAlluvium Overburden
Alluvium Overburden
Bedrock (Mudstone/Siltstone)
1.70
Slope Stability AnalysisCross Section 3
Fly Ash Pond
Cholla Power PlantJoseph City, Arizona
Arizona Public Service
Note:
The results of analysis shown here are based
on available subsurface information, laboratory
test results and approximate soil properties.
No warranties can be made regarding the
continuity of subsurface conditions between
the borings.
Figure B8) Static Maximum Surcharge Pool
File Name: APS Cholla FAP Section 3 - StaticA.gsz
Date: 4/13/2016
Method: Spencer
Factor of Safety: 1.70
Material
Type:
Clay Core
Shell
Alluvium Overburden
Bedrock (Mudstone/Siltstone)
Fly Ash (Hydraulically-Placed)
Unit Weight
Saturated:
125 pcf
130 pcf
120 pcf
150 pcf
90 pcf
Unit Weight
Above Water:
120 pcf
125 pcf
120 pcf
150 pcf
90 pcf
Cohesion:
0 psf
0 psf
0 psf
1,000 psf
0 psf
Friction
Angle:
28 °
33 °
26 °
65 °
0 °
Interstate
40
Maximum Surcharge Pool:
EL 5,116.0 feet
Distance, ft
0 25 50 75 100 125 150 175 200 225 250 275 300 325 350 375 400 425 450 475 500 525 550 575 600 625 650 675 700 725 750 775 800 825 850 875 900 925 950 975 1,000
Ele
vation, ft
4,950
4,970
4,990
5,010
5,030
5,050
5,070
5,090
5,110
5,130
5,150
5,170
AECOM Final Summary Report B-29
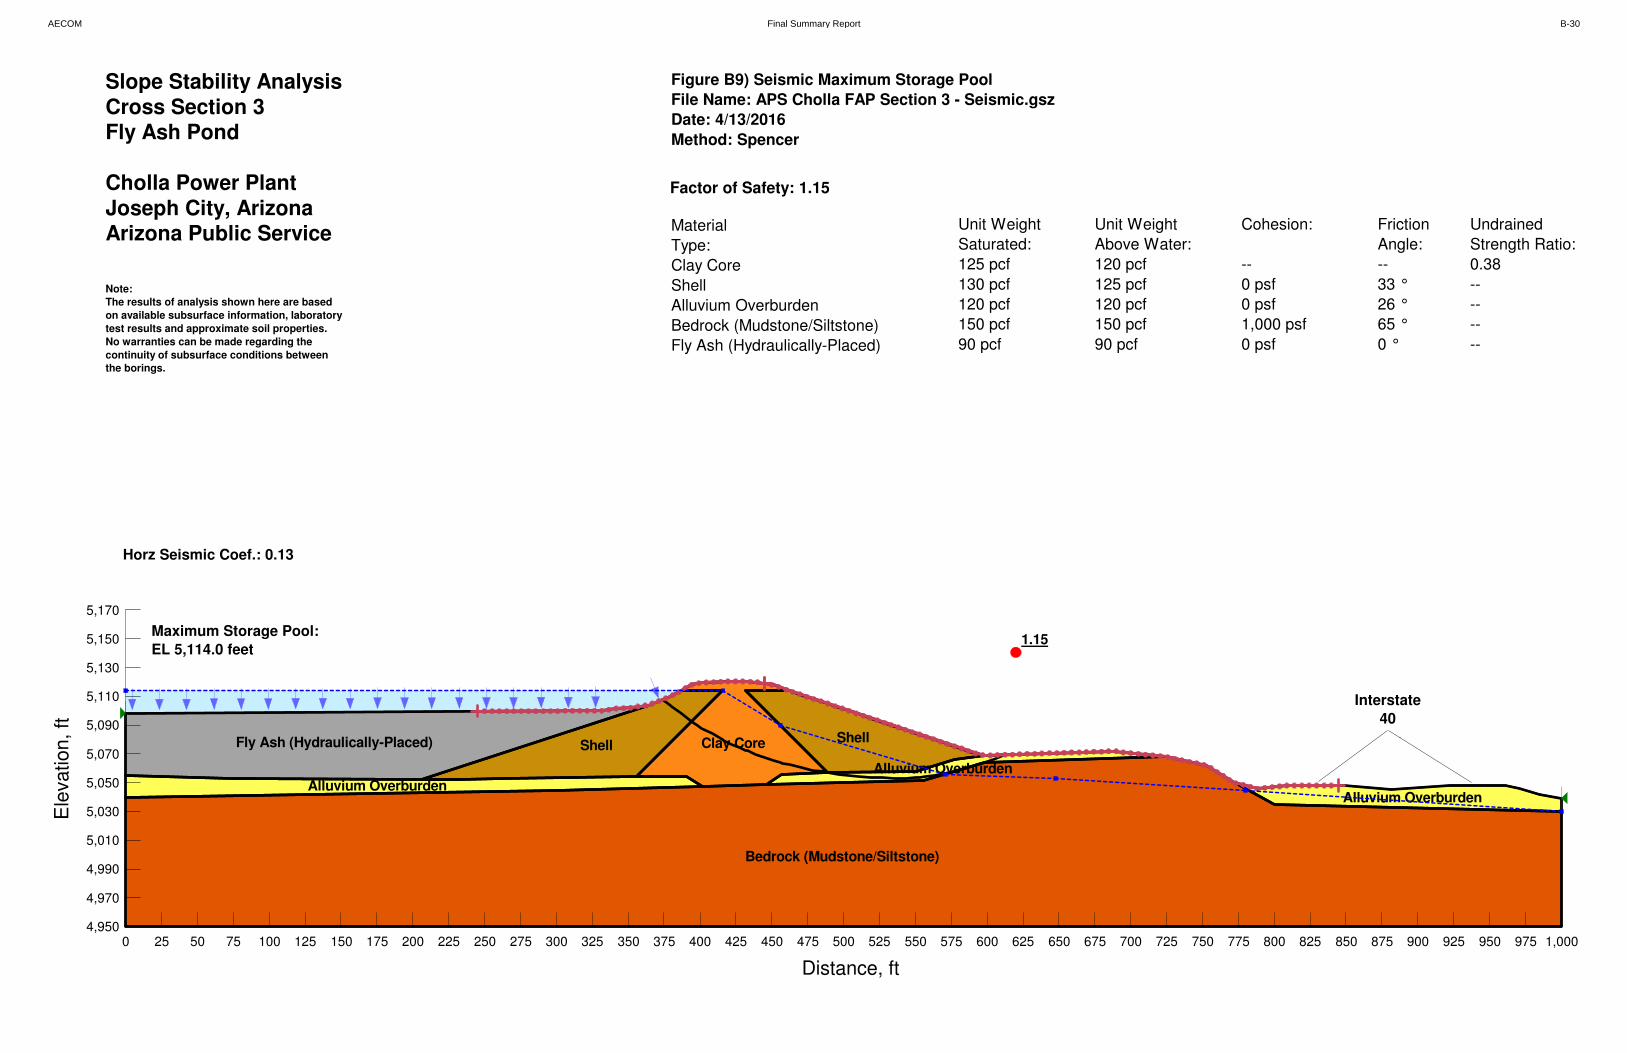
Fly Ash (Hydraulically-Placed) Shell Clay Core Shell
Alluvium OverburdenAlluvium Overburden
Alluvium Overburden
Bedrock (Mudstone/Siltstone)
1.15
Slope Stability Analysis
Cross Section 3Fly Ash Pond
Cholla Power Plant
Joseph City, ArizonaArizona Public Service
Note:
The results of analysis shown here are based
on available subsurface information, laboratory
test results and approximate soil properties.
No warranties can be made regarding the
continuity of subsurface conditions between
the borings.
Figure B9) Seismic Maximum Storage Pool
File Name: APS Cholla FAP Section 3 - Seismic.gsz
Date: 4/13/2016
Method: Spencer
Factor of Safety: 1.15
Material
Type:
Clay Core
Shell
Alluvium Overburden
Bedrock (Mudstone/Siltstone)
Fly Ash (Hydraulically-Placed)
Unit Weight
Saturated:
125 pcf
130 pcf
120 pcf
150 pcf
90 pcf
Unit Weight
Above Water:
120 pcf
125 pcf
120 pcf
150 pcf
90 pcf
Cohesion:
--
0 psf
0 psf
1,000 psf
0 psf
Friction
Angle:
--
33 °
26 °
65 °
0 °
Undrained
Strength Ratio:
0.38
--
--
--
--
Maximum Storage Pool:
EL 5,114.0 feet
Interstate
40
Horz Seismic Coef.: 0.13
Distance, ft
0 25 50 75 100 125 150 175 200 225 250 275 300 325 350 375 400 425 450 475 500 525 550 575 600 625 650 675 700 725 750 775 800 825 850 875 900 925 950 975 1,000
Ele
vation, ft
4,950
4,970
4,990
5,010
5,030
5,050
5,070
5,090
5,110
5,130
5,150
5,170
AECOM Final Summary Report B-30