final sierra-nevada bio-regional assessmenta123.g.akamai.net/7/123/11558/abc123/forestservic... ·...
TRANSCRIPT
United States Department of Agriculture
FINAL SIERRA-NEVADA
BIO-REGIONAL ASSESSMENT
Forest
Service
Pacific Southwest
Region
R5-MB-268 February
2014

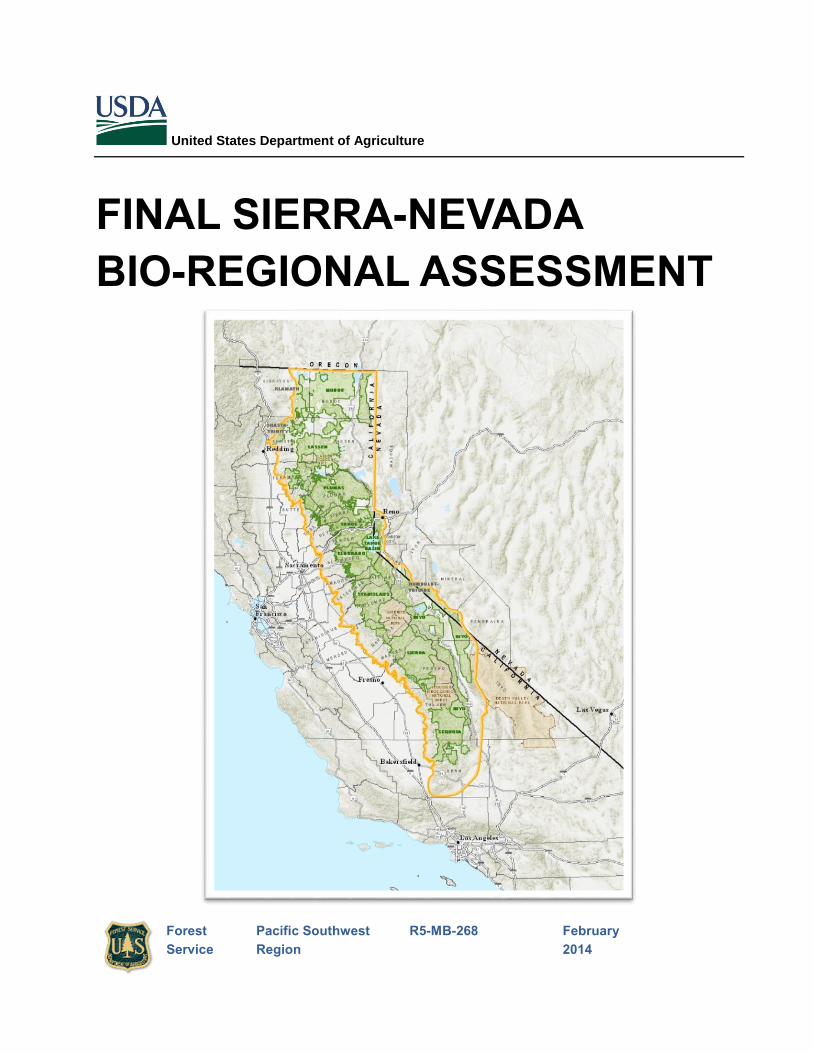
Cover: Map of the Sierra Nevada Bio-Region in California.
In accordance with Federal civil rights law and U.S. Department of Agriculture (USDA) civil rights regulations
and policies, the USDA, its Agencies, offices, and employees, and institutions participating in or administering
USDA programs are prohibited from discriminating based on race, color, national origin, religion, sex, gender
identity (including gender expression), sexual orientation, disability, age, marital status, family/parental status,
income derived from a public assistance program, political beliefs, or reprisal or retaliation for prior civil
rights activity, in any program or activity conducted or funded by USDA (not all bases apply to all programs).
Remedies and complaint filing deadlines vary by program or incident.
Persons with disabilities who require alternative means of communication for program information (e.g.,
Braille, large print, audiotape, American Sign Language, etc.) should contact the responsible Agency or
USDA’s TARGET Center at (202) 720-2600 (voice and TTY) or contact USDA through the Federal Relay
Service at (800) 877-8339. Additionally, program information may be made available in languages other than
English.
To file a program discrimination complaint, complete the USDA Program Discrimination Complaint Form, AD-
3027, found online at http://www.ascr.usda.gov/complaint_filing_cust.html and at any USDA office or write a
letter addressed to USDA and provide in the letter all of the information requested in the form. To request a
copy of the complaint form, call (866) 632-9992. Submit your completed form or letter to USDA by: (1) mail:
U.S. Department of Agriculture, Office of the Assistant Secretary for Civil Rights, 1400 Independence Avenue,
SW, Washington, D.C. 20250-9410; (2) fax: (202) 690-7442; or (3) email: [email protected].
USDA is an equal opportunity provider, employer, and lender.
El USDA es un proveedor, empleador y prestamista que ofrece igualdad de oportunidad
Note: This document is identical to that posted in February 2014, except the cover was edited to include the document publication and year, and this page added.

3
TABLE OF CONTENTS
WHAT IS THE BIO-REGIONAL ASSESSMENT?.................................................................................................. 5
Structure of the Bio-Regional Assessment ......................................................................................................... 5
History and Context ............................................................................................................................................. 6
2012 Planning Rule ............................................................................................................................................... 6
Leadership Intent and Ecological Restoration .................................................................................................. 7
Best Available Scientific Information ................................................................................................................. 7
Science Synthesis ................................................................................................................................................... 8
Drivers and Stressors ............................................................................................................................................ 8
Collaboration ......................................................................................................................................................... 8
Relationship between the Living Assessment and the Bio-Regional Assessment ........................................... 9
Opportunities for Alignment of Agency Conservation Planning ................................................................ 10
Identifying Themes ............................................................................................................................................. 12
Tying Forest Assessments to the Bio-Regional Assessment ......................................................................... 12
2004 Sierra Nevada Framework ........................................................................................................................ 13
Sustainability ....................................................................................................................................................... 13
WHAT IS THE ASSESSMENT AREA? .................................................................................................................. 15
WHAT ARE THE FINDINGS? ............................................................................................................................... 17
WATER QUALITY AND QUANTITY ............................................................................................................. 17
What Are We Trying To Sustain at the Bio-Regional Level? ................................................................ 17
Functioning Watersheds ............................................................................................................................ 17
Good Water Quality and Quantity .......................................................................................................... 22
2004 Sierra Nevada Framework ............................................................................................................... 31
FIRE RESILIENCE .............................................................................................................................................. 33
What Are We Trying To Sustain at the Bio-Regional Level? ................................................................ 33
Fire Management and Landscape Fire Resilience .................................................................................. 33
Fire and the Benefits People Obtain from Ecosystem Services ............................................................ 44
Resilient and Adaptive Communities in the Face of Fire ..................................................................... 47
2004 Sierra Nevada Framework ............................................................................................................... 53
SUSTAINABLE RECREATION ........................................................................................................................ 55
What Are We Trying To Sustain at the Bio-Regional Level? ................................................................ 55
Culture and Lifestyle ................................................................................................................................. 55
Connections to the Land ............................................................................................................................ 60
Economic Opportunities for Communities ............................................................................................. 70
2004 Sierra Nevada Framework ............................................................................................................... 73
ECOLOGICAL INTEGRITY .............................................................................................................................. 75
What are we trying to sustain at the bio-regional level? ....................................................................... 75
Aquatic Ecosystems ................................................................................................................................... 76
Riparian Ecosystems .................................................................................................................................. 85
4
Terrestrial Ecosystems ........................................................................................................................................ 98
Natural Range of Variation ....................................................................................................................... 98
Fire as an Ecosystem Process .................................................................................................................. 111
Old Forest .................................................................................................................................................. 115
Forest Heterogeneity, Early Seral Forest, Non-Forest Habitat ........................................................... 119
Land Use and Connectivity ..................................................................................................................... 123
Benefits to People from Functioning Ecosystems ................................................................................ 128
2004 Sierra Nevada Framework ............................................................................................................. 131
COMMUNITY RESILIENCE ........................................................................................................................... 132
What Are We Trying To Sustain at the Bio-Regional Level? .............................................................. 132
Opportunities that Support the Diversity of Cultures and Values .................................................... 133
Social Interactions ..................................................................................................................................... 142
Local Economic Opportunities from Forest Activities ........................................................................ 144
Health, Safety, Education and Skills ...................................................................................................... 149
2004 Sierra Nevada Framework ............................................................................................................. 152
WHAT ARE THE CONCLUSIONS? .................................................................................................................... 154
What did we learn? ........................................................................................................................................... 154
WATER QUALITY AND QUANTITY .................................................................................................. 154
FIRE RESILIENCE .................................................................................................................................... 156
SUSTAINABLE RECREATION .............................................................................................................. 158
ECOLOGICAL INTEGITY ...................................................................................................................... 160
COMMUNITY RESILIENCE .................................................................................................................. 161
Where Do We Go From Here? ........................................................................................................................ 163
REFERENCES .......................................................................................................................................................... 164
HELPFUL LINKS .................................................................................................................................................... 200
NON-DISCRIMINATION STATEMENT ............................................................................................................ 201
5
WHAT IS THE BIO-REGIONAL ASSESSMENT?
Structure of the Bio-Regional Assessment
The Bio-Regional Assessment is organized as follows:
An opening section that answers the question “WHAT IS THE BIO-REGIONAL ASSESSMENT?” and
provides history and context;
A description and map of the ASSESSMENT AREA;
FINDINGS for the key themes identified:
1. Water Quality and Quantity
2. Fire Resilience
3. Sustainable Recreation
4. Ecological Integrity
5. Community Resilience
CONCLUSIONS about the key themes and integration across them;
REFERENCES cited throughout the document;
HELPFUL LINKS;
NON-DISCRIMINATION STATEMENT.
The goal was an understandable, plainly written document. The writers tried to include an appropriate
level of technical detail without jargon. Acronyms were spelled out or avoided when possible.
6
History and Context There has always been strong interest in the management of the national forests in the Sierra Nevada, but
interest really became focused with the original forest plans developed in the 1980s through early 1990s.
Those original forest plans took between 6 and 8 years to complete and were contentious. They mainly
focused on social interests of the time, and new computer modeling that, in a mechanical way, found
“optimal” solutions. As a result, there was controversy over balancing multiple uses. In the early 1990s,
concerns emerged about trends in old forest habitats needed for species like the California spotted owl.
This led to a major change in the newly adopted forest plans. This was the start of considering a bio-
regional approach to planning around resources in the Sierra Nevada. This approach ultimately
culminated in the Sierra Nevada Forest Plan Amendments to each individual forest plan.
Controversy is not always a bad thing. One positive benefit of continuing controversy surrounding
management of Sierra Nevada forest resources is the emergence of local and larger-scale collaborative
efforts. These span collaboration with local stakeholders on specific projects, to nationally selected 10-
year projects under the Collaborative Forest Landscape Restoration Act, to the Sierra Cascades Dialog
initiated in 2010. Each of these works to strengthen understanding of the social, economic, and
environmental resources to consider, plan and act toward common goals.
The 2012 Planning Rule, with its substantial focus on collaboration and adaptive planning, is the next step
in improving management of the national forests. There is an opportunity to blend and leverage the
different strengths that come from collaboration at multiple scales. Adaptive planning helps find a
balance between planning, doing, and learning that more effectively and efficiently uses taxpayer funds to
manage for sustainability of the resources and opportunities provided by national forests. This process of
developing a Bio-Regional Assessment, followed by forest assessments and plan revisions on the three
“early adopter” national forests represents the evolution of improved management that will benefit not
just the Sierra Nevada, but the nation as a whole.
2012 Planning Rule The 2012 Planning Rule provides the structure for the national forests in California to create local land
management plans. This rule establishes an ongoing, three phase process: 1) assessment; 2) plan
development or revision; and 3) monitoring.
The 2012 Planning Rule is intended to create understanding around landscape scale management. It takes
an integrated and holistic approach that recognizes the interdependence of ecological processes with
social and economic systems. This approach uses best available science to inform decisions along the
way. Collaboration with stakeholders and transparency of process are key ways the 2012 Planning Rule
guides creation of forest plans for the future.
While the Bio-Regional Assessment is not required by the 2012 Planning Rule, it provides context on
themes that cross boundaries over this larger landscape. The forest plans that flow from it will guide
sustainable integrated resource management on National Forest System (NFS) lands. Forest plans will
consider a full range of multiple uses on NFS lands where jobs are generated and economic opportunities
are created. The Bio-Regional Assessment facilitates the dialogue about issues that affect larger areas and

7
more people, and lets the forests use the information for forest-level assessments. The California early
adopter forests under the 2012 Planning Rule that will tier off the Bio-Regional Assessment are the Sierra,
the Sequoia and the Inyo National Forests.
Leadership Intent and Ecological Restoration
In the Pacific Southwest Region of the Forest Service, leadership intent around ecological restoration is to
retain and restore ecological resilience of national forest lands to achieve sustainable ecosystems that
provide a broad range of services to humans and other organisms. Forest Plans guide decisions that will
achieve that sustainability for both the resources and our stakeholders, today and in the future.
The Bio-Regional Assessment is a reflection of conditions on the ground. Wildfires don’t care about
forest or county boundaries. Organisms aren’t concerned with state lines. Pollution drifts over the entire
landscape, not a particular city. The hope is that considering the larger landscape will show the fluidity
and interconnectedness of social, economic and ecological elements, and shine light on issues to work on
in a larger way.
Best Available Scientific Information
The Bio-Regional Assessment is based on the best available scientific information (BASI) as required by
the 2012 Planning Rule. The writers reviewed the available scientific information and determined which
is the most accurate, reliable, and relevant information for topics and themes. The characteristics
generally expected in a valid scientific process are:
PEER REVIEW: The information has been critically reviewed by other qualified scientific
experts in that scientific discipline. The criticism of the peer reviewers has been addressed by the
proponents. Publication in a refereed scientific journal usually indicates that the information has
been appropriately peer-reviewed.
METHODS: Information gathering methods are clearly stated and can be replicated. The
methods are standardized in the pertinent scientific discipline or, if not, the methods have been
appropriately peer-reviewed for reliability and validity.
LOGICAL CONCLUSIONS AND REASONABLE INFERENCES: Conclusions are based
on reasonable assumptions, are supported by other studies, and are consistent with the general
theory underlying the assumptions. Conclusions are logically and reasonably derived from the
assumptions, and are supported by the data. Gaps in information and inconsistencies with other
pertinent scientific information are explained.
QUANTITATIVE ANALYSIS: Data have been analyzed using appropriate statistical or
quantitative methods.
CONTEXT: The information is in proper context. Assumptions, analytical techniques, data, and
conclusions are appropriately framed with respect to the prevailing body of pertinent scientific
knowledge. Information is the most pertinent to the conclusions being drawn and to the
geographic context.
8
REFERENCES: Assumptions, analytical techniques, and conclusions are well referenced with
citations to relevant, credible literature and other pertinent existing information.
Typically BASI is developed using the scientific method, which includes clearly stated questions, well
designed investigations and logically analyzed results, documented clearly and subjected to peer review.
However, BASI may also be information from analyses of data from a local area, or studies to address a
specific question in one area. The BASI could also result from expert opinion, panel consensus, or
observations, as long as the responsible official has a reasonable basis for relying on that scientific
information as the best available .Additionally the Bio-Regional Assessment used local knowledge, such
as tribal knowledge, when appropriate and applicable.
Science Synthesis To support the scientific basis of the Bio-Regional Assessment, the Pacific Southwest Region of the
Forest Service sponsored a Science Synthesis, researched and written by scientists at the Pacific
Southwest Research Station. At the time of the writing of the Bio-Regional Assessment, the Science
Synthesis was still in draft form. The Science Synthesis integrates peer-reviewed scientific information
across disciplines to inform and lead to tangible options for land managers and stakeholders. The
Research Station provided additional review opportunities after the draft was released, and will publish a
final version in the near future. This Science Synthesis will be used during the NEPA phase of forest plan
revision. Much of the information compiled in the draft Science Synthesis was relevant and useful to help
frame the Bio-Regional Assessment.
Drivers and Stressors
Changing climate, human populations, floods, and fires are all potent forces that drive or stress natural
ecosystems, communities of people, and services derived from wildlands. These are called “drivers and
stressors”. Drivers and stressors are used throughout the Bio-Regional Assessment as common threads
among the key themes. Looking at drivers and stressors across boundaries helps describe current
conditions and identify trends.
The 2012 Planning Rule describes drivers as:
Natural disturbance regimes; predominant climatic regimes; broad-scale disturbance regimes such
as wildfire, wind, flooding, insects, and disease and natural vegetation succession including:
human-caused changes in successional pathways that may maintain vegetation in an
uncharacteristic age or size-class condition; scarcity and abundance of successional states relative
to the reference period.
Stressors are defined by the 2012 Planning Rule as: “those that: directly and indirectly degrade or impair
key ecosystem characteristics and ecological integrity.”
Collaboration There has been a major shift in how collaboration is approached in these early stages under the 2012
Planning Rule. The old way of doing business was to create forest plan documents, and then present them

9
to the public for comment. Changes in society, higher expectations for engagement, and new regulations
have all created the need to take a different approach. Success means new, different, creative ways of
operating collaboratively.
There has been engagement with the public at numerous face-to-face workshops and technology has been
used to interact virtually. The Sierra Cascades Dialog continues to be an important vehicle for
engagement on forest planning. The meetings are designed and built with partners, not in a vacuum. The
on-line community called Our Forest Place, a non-Forest Service site, is where members interact on
blogs, and in discussion groups, and where they can find information about forest planning and current
events. The Living Assessment is a wiki tool comprised of chapters aligned to the 15 topics laid out in the
2012 Planning Rule at the bio-regional and forest scales.
Chapter 1 Ecological Integrity of Ecosystems
Chapter 2 Air, Soil, Water
Chapter 3 Drivers and Stressors
Chapter 4 Assessing Carbon
Chapter 5 At-risk Species
Chapter 6 Social, Cultural, Economic
Chapter 7 Benefits to People
Chapter 8 Multiple Uses
Chapter 9 Recreation
Chapter 10 Energy and Minerals
Chapter 11 Infrastructure
Chapter 12 Tribal
Chapter 13 Cultural
Chapter 14 Land
Chapter 15 Designated Areas
Relationship between the Living Assessment and the Bio-Regional Assessment The information found inside each of the chapters on the Living Assessment is intended to describe
current conditions and trends. By outreaching to stakeholders, there has been direct engagement in
contributing to the content, not just reviewing the information. Many interested constituents have added
10
important and valuable input directly, creating a “living” body of work, in partnership with Forest Service
scientists and specialists. This is a remarkable shift in the approach to public involvement.
In January, 2013 the Regional Planning Team began working with agency specialist, researchers, and
interested stakeholders and providing their own initial contributions to the Living Assessment. Over the
course of the next several months, the team monitored entries, gathered information, responded personally
to questions and addressed concerns from contributors. They focused attention on areas where there was
significantly more interest than others and provided additional exposure to those through workshops and
podcasts. On April 8, a snapshot of the bio-regional chapters was taken, and the team began sifting
through the information to synthesize what was most relevant.
When the idea of using a wiki tool was conceived, the hope was to very actively monitor and manage the
content on the bio-regional chapters as they were being edited and to actively work to identify and fill
gaps of knowledge and engage in dialog when there were discrepancies in information. What was learned
in actuality was that it would take more resources (time and personnel) than were available to do this. In
addition, some stakeholders were reluctant to add information while others were very active, resulting in
the potential for unbalanced information. Further complicating continual review is the fact that as a living
and open platform, The Living Assessment is constantly changing. Thus, all the information has to be
evaluated to ensure that all of the information posted there meets the standards of Best Available
Scientific Information as described in the 2012 Planning Rule. Regardless, the wiki environment has
been extremely valuable in capturing and evaluating the information currently available to determine
when there are definitive sources and where there are uncertainties or conflicting information. This has
facilitated a higher level of conversation with stakeholders and we believe has made a stronger Bio-
Regional Assessment.
Based on learning about the use of a wiki tool, the approach was adapted and the team used a very
deliberate process to consider the information in The Living Assessment chapters when preparing the Bio-
Regional Assessment. In the process of writing the Bio-Regional Assessment, the team refined or
developed additional information, and this information has been or will be posted to The Living
Assessment soon. The intention is that The Living Assessment will continue to be updated by Forest
Service specialists and by members of the public after the Bio-Regional Assessment and Forest
Assessments are finalized, and during the forest-level NEPA processes which follow. The vision is that
The Living Assessment continues to improve and serves as a foundation of knowledge to inform the
continual, adaptive planning process.
Opportunities for Alignment of Agency Conservation Planning The California Biodiversity Council is composed of 42 federal, state, and local government agencies and
organizations, and works to improve coordination and cooperation related to natural resource
conservation. In February 2013, the Council approved the resolution “Strengthening Agency Alignment
for Natural Resource Conservation.”
VISION:
Over time, the broad goals and conservation measures for biodiversity adopted by
agencies from all levels of government are aligned and government operations are more
11
efficient. As a result, the plans, programs, policies, and regulations described in agency
documents portray a consistent vision of desired, and regionally-appropriate, conditions
for conservation and management of natural resources across California.
GOALS:
Increased coordination with all levels of governments and agencies (federal, tribal, state, local),
stakeholder groups, private landowners, and others; increased effectiveness through leveraging
of existing networks, relationships, and multiagency venues; improved sharing of data,
information, tools and science among governments and agencies; and better alignment of
planning, policies and regulations across governments and agencies; and coordinated and
streamlined permitting to increase regulatory certainty.
National forest plan revisions present an opportunity for the Forest Service to further the goals of this
resolution. Already, the Forest Service is strengthening relationships with several state agencies and
actively participating in the following major statewide resource planning efforts:
2013 update to the California Water Plan
2015 update to the California State Forest and Rangelands Assessment
2015 update to the California State Wildlife Action Plan
The Forest Service is also an active participant in the system of Landscape Conservation Cooperatives,
tapping into coordinated science partnerships and collaborative landscape planning. In the Sierra Nevada
bio-region, there are three nationally selected Collaborative Forest Landscape Restoration Program
projects that are innovating collaboration:
Dinkey Landscape Restoration Project on the Sierra National Forest
Burney-Hat Creek Basins Project on the Lassen National Forest
Amador-Calaveras Consensus Group Cornerstone Project on the Stanislaus and Eldorado National
Forests
During the plan revision, there will be opportunities to align forest plans with broader conservation
strategies and objectives. It will be important to learn from these and other planning efforts in order to
realize efficiencies in planning. It will also help forest plans better consider the unique contributions of
the national forests to providing ecosystem services at the state, regional, and local scales.
There are many challenges to aligning agency planning efforts, including limited budgets and varied
timelines for completion of plans. By committing to working toward alignment in the adaptive planning
framework of the 2012 Planning Rule, greater efficiencies can be realized to overcome these obstacles.
Success in greater alignment of conservation planning is essential to increase the ecosystem services
benefit for both people and natural resources.

12
Identifying Themes
The Bio-Regional Assessment integrates social, economic and ecological systems. The Regional
Planning Team relied heavily on bio-regional chapters of The Living Assessment described above. The
goal was to weave together the information from The Living Assessment to describe the
interconnectedness of these systems, the condition they are currently in, and how they are trending.
The five themes identified are: Water Quality and Quantity; Fire Resilience; Sustainable Recreation;
Ecological Integrity and Community Resilience.
These key themes were identified by answering the following questions:
Is it related to, and appropriately addressed at the bio-regional scale?
Is there broad interest in it?
Is sustainability in question?
Does it have linkages woven through the topic papers?
Is it something that forest plans influence?
Is it relative to the Leadership Intent for Ecological Restoration and the 2012 Planning Rule?
The answers to these questions led to emerging themes consistent with the Leadership Intent for
Ecological Restoration and the 2012 Planning Rule, both of which focus on sustainability of key
ecosystem services. In both, the integration of social, economic, and ecological sustainability are
emphasized. In the Leadership Intent, specific areas of water and riparian areas, watershed restoration,
fire and carbon resiliency, recreational opportunities and local economies, and ecosystem services in
general are emphasized. The topics set out in the 2012 Planning Rule gave us a way to gather information
on a more detailed set of topics. Within those 15 topics, there are repeating threads that connect water,
fire, air, ecological integrity, recreation, and communities.
The goal was to identify key themes consistent with the Leadership Intent for Ecological Restoration, find
common threads among the fifteen topic areas, and focus on sustainability and integration of social,
economic, and ecological integrity as directed by the 2012 Planning Rule.
Tying Forest Assessments to the Bio-Regional Assessment
The Bio-Regional Assessment INFORMS and GUIDES the forest assessments; it does not direct. The
early adopter Sierra Nevada forests, the Sierra, the Sequoia and the Inyo, will consider the condition and
trend information from the Bio-Regional Assessment as they develop their forest assessments and as they
work toward their forest “need for change”. In the forest assessments, they will address each of the
fifteen topics laid out in the Planning Rule and associated draft directives.
The linkages between the Bio-Regional Assessment and the forest assessments may be different for each
forest; however the forests will use the document in a consistent way as they consider those five themes.
The forests will emphasize topics of particular importance for their forest under the five Bio-Regional
Assessment themes, based on internal expertise and stakeholder input, and weave the themes into their
assessment conclusion statements.
13
The Bio-Regional Assessment does not provide solutions or decisions. Its purpose is to describe
conditions and trends over the larger landscape for the forests as they move through their forest plan
revision process.
2004 Sierra Nevada Framework
Information on the current bio-regional scale management direction is included at the end of each theme
for understanding of the management practices that have resulted in the current conditions and probable
trends. Trends were determined assuming that current management direction would persist into the
future.
The next phases of the plan revision process include determinations of the need for change to existing
management direction. The hope is that these short summaries of the existing management direction are
helpful as they relate to the five themes of the Bio-Regional Assessment. As the forests progress through
the next stages of the planning process, a more detailed look at management direction will take place to
determine what may need to be changed in specific forest plans.
Sustainability
The 2012 Planning Rule directs that forest plans provide for social, economic, and ecological
sustainability within Forest Service authority and consistent with the inherent capability of the plan area.
Sustainability is the capability to meet the needs of the present generation, without compromising the
ability of future generations to meet their needs. Ecological, economic, and social sustainability are
further defined as follows:
Ecological sustainability: Capability of ecosystems to maintain ecosystem integrity.
Economic sustainability: Capability of society to produce and consume or otherwise benefit from
goods and services including contributions to jobs and market and nonmarket benefits.
Social sustainability: Capability of society to support the network of relationships, traditions, culture,
and activities that connect people to the land and to one another, and support vibrant communities.
According to the National Report on Sustainable Forests (USFS 2011a), through sustainable management,
forests can contribute to the resilience of ecosystems, societies, and economies, while safeguarding
biological diversity and providing a broad range of goods and services for present and future generations.
Land management decisions need to account for influences and interactions among the three arenas of
environment, society, and economy in order to achieve sustainability.
Outdated and weak sustainability envisioned the environmental, social and economic realms as
intersecting, yet separate parts of a system. The updated model of strong sustainability, adopted by the
Forest Service (USFS 2011a), reflects a more holistic and scientifically rigorous understanding of the role
and need for a healthy environment to sustain human society and economies, in synch with intact
ecosystems.
The 2012 Planning Rule recognizes that social, economic, and ecological systems are interdependent,
without one being a priority over the other. As such, it requires the consideration of all three in all phases

14
of the planning process. National forest management can influence social and economic conditions
relevant to a planning area, but cannot ensure social and economic sustainability, because many factors
are outside the control and authority of the decision maker. For that reason, the 2012 Planning Rule
requires that forest plans contribute to social and economic sustainability within Forest Service authority,
and the inherent capability of the plan area.
15
WHAT IS THE ASSESSMENT AREA?
The boundary of the Sierra Nevada bio-region is the full study area boundary used in the 1996 Sierra
Nevada Ecosystem Project (SNEP) final report to Congress. Socio-economic data for the counties that
intersect this boundary was examined.
Findings from the Sierra Nevada Conservancy (SNC), a California state agency that recently developed a
report on socio-economic indicators in the Sierra Nevada were also used. The SNC’s boundary for the
Sierra Nevada was established by statute. The report either uses census block data that closely aligns with
the boundary, or county-level data. The SNC boundary is similar to the SNEP boundary of the Sierra
Nevada, except that it excludes the Tahoe Basin, a portion of Nevada, and a portion in the northwest along
the boundary with Oregon.
Using census block data allows for a precise definition of the Sierra Nevada as defined by the SNC
boundary, with the toe of the Sierra foothills forming the western boundary. Alternatively, using counties
that intersect the SNEP boundary, results in the inclusion of certain Central Valley cities, such as Fresno
and Bakersfield. The SNC report is more descriptive of local socio-economic conditions in the Sierra
Nevada. The SNC population base is much smaller than the population base for the aggregate of counties
that intersect the SNEP boundary, and portrays a different picture in terms of population growth, diversity,
employment, and other socio-economic measures.
Providing a broadened definition of the Sierra Nevada is vital to understanding the region and changes on
the horizon. Many of the changes to the communities immediately outside the Sierra Nevada will
influence national management. These are communities the Forest Service is trying to better understand,
reach and engage.
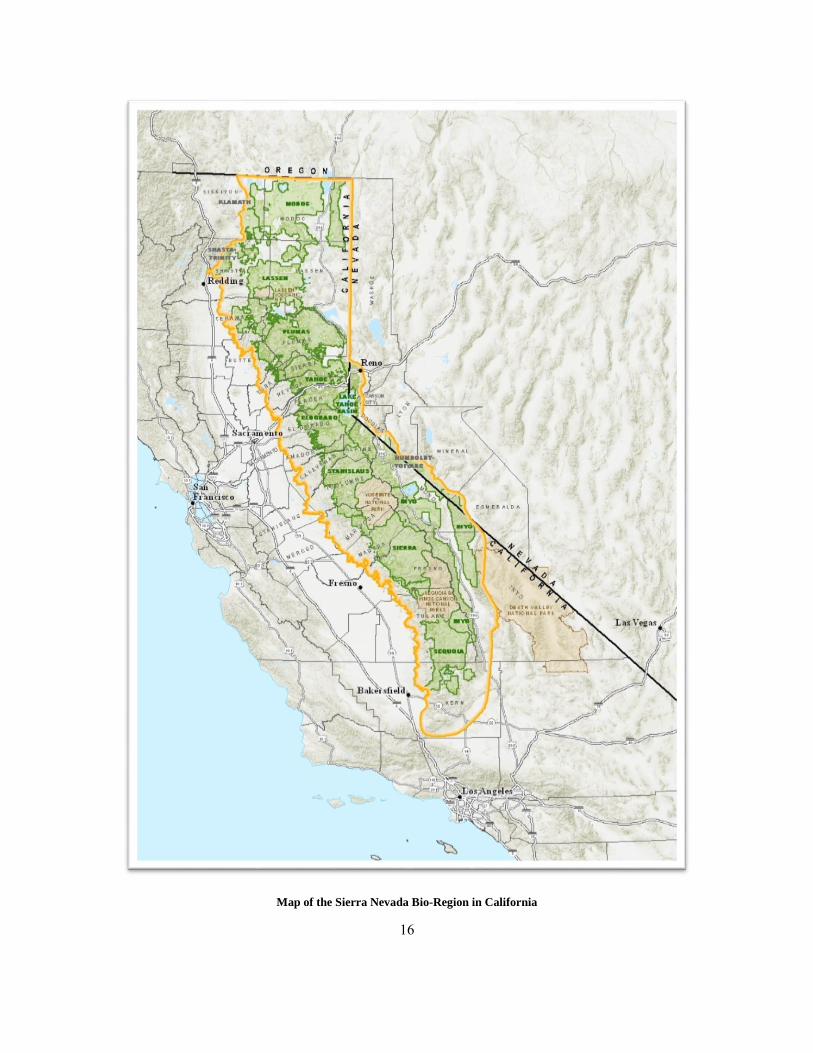
The relief map below shows mountain ranges in light brown, valleys in beige, and water in blue. Also
shown on the base map are county lines, major highways, and key gateway cities such as Redding,
Sacramento, Reno, Fresno, and Bakersfield. Additional major cities shown are San Francisco, Los
Angeles, and Las Vegas. The Bio-Regional Assessment area is the boundary from the Sierra Nevada
Ecosystem Project. It is shown in orange and includes the entire Sierra Nevada mountain range and
California portion of the Cascades Range north to the Oregon border and east generally to the Nevada
border. It includes the Sierra Nevada foothills on the west, the Modoc Plateau in the northeast and the
eastern portion of the Sierra Nevada range that extends into Nevada around Reno and Lake Tahoe and
south and east to the White Mountains. Overlaid on the map within the Bio-Region boundary are the
national forests in green and national parks in medium brown. The national forests from north to south
are: Modoc, Lassen, Plumas, Tahoe, Lake Tahoe Basin Management Unit, Eldorado, Stanislaus, Inyo,
Sierra, and Sequoia. In the northwest small portions of the Klamath and Shasta-Trinity National Forests
are included. The national parks shown from north to south are: Lassen Volcanic, Yosemite, Sequoia and
Kings Canyon, and Death Valley.
16
Map of the Sierra Nevada Bio-Region in California
17
WHAT ARE THE FINDINGS?
WATER QUALITY AND QUANTITY
What Are We Trying To Sustain at the Bio-Regional Level?
1. Functioning watersheds
2. Good water quality and quantity
Functioning Watersheds
A watershed has five main functions (UF IFAS Extension 2007). These functions are
hydrological and ecological in nature.
Hydrological functions: collect rainfall water; store water in various amounts and for different
periods; release water as runoff.
Ecological Functions: provide conditions and sites for various biochemical reactions to take
place; provide habitat to flora and fauna of various kinds.
A total of 774 sub-watersheds were assessed on the ten Sierra Nevada national forests in 2010
using the Forest Service Watershed Condition Framework. The sub-watersheds ranged in size
from 8,058 to 236,289 acres, including National Forest System (NFS) and non-NFS lands, with a
mean of 23,025 acres. Of these sub-watersheds, 490 (63 percent) were classified as “functioning
properly,” 344 (44 percent) were classified as “functioning at risk,” and forty (five percent) were
classified as “impaired function.”
The national forests in California have generally provided a high level of protection for the Sierra
Nevada headwaters. For example, a recent statewide survey found that streams in forested
watersheds were in better condition than streams in watersheds in any other land use (Ode 2007,
Domagalski et al. 2000, Kratzer and Shelton 1998, Ahearn et al. 2005). Seventy-eight percent
were in an un-degraded condition, according to a 2010 rapid watershed condition assessment by
forest hydrologists, soil scientists, and aquatic biologists (USFS 2013). When a forest stream
segment was very impaired, the following stressors were most associated with that poor
condition: total nitrogen (30 percent), chloride (20 percent), total phosphorus (10 percent), lack of
habitat complexity (20 percent), and riparian disturbance and streambed stability (10 percent)
(Hunsaker et al. 2013b).
Sierra Nevada watersheds face significant threats including fire, poorly planned development, and
unauthorized recreation. Past impairment of watersheds has been primarily driven by road-
related impacts, barriers to aquatic connectivity and non-native species (USFS 2011e).
Additionally, hydrologic function has been adversely impacted by forest activities that were
historically more intense such as agriculture, mining, roads, and livestock grazing.
18
Climate Change
The effects of climate change are apparent in rising minimum temperatures, earlier snowpack
melting, changing stream hydrology, and increased frequency of large, severe wildfires (Safford
et al. 2012). Climate changes are also expected to change the pattern, frequency, and intensity of
disturbances (Safford et al. 2012). The result will be increased wildfires, doubling the area burned
annually by the middle of the 21st century. Pulses of soil erosion and flooding caused by higher
rainfall intensity will increase, but the pattern will be highly variable. This will also affect how
forest roads are built and maintained, along with other infrastructure. With warming temperatures,
trees are expected to decrease soil moisture and increase evapotranspiration, thus leaving less
water for movement to streams. Mechanical thinning of trees and low-intensity under burning of
vegetation would reduce evapotranspiration and help maintain soil and stream water amounts
(Hunsaker et al. 2013b). As the Forests in the bio-region increase the pace and scale of
restoration, including mechanical tree thinning and managed fire, the forests should become more
resilient to climate change.
Effects of Fire
The effects of fire can be both negative and positive for water quality and quantity, depending
upon the extent and severity of the fire. The primary effect of large, high severity fires on water
quality is a result of loss of soil cover, exposing roads, trails, and skid trails that are key sources
of sediment. According to Hunsaker et al. (2013b):
Fuels, vegetation management and fire can all contribute to erosion and sediment
transport to aquatic ecosystems. Even when best management practices are used, impacts
to roads, trails, and skid trails are felt immediately following large, high severity fires.
Work to reduce the magnitude and frequency of wildfire is likely important to influence
total sediment yields from forests in the Sierra Nevada drainage basins.
Uncharacteristically large and severe fires may cause erosion and changes to the streambed that
can eliminate vulnerable aquatic population, degrade water quality, reduce capacity of
downstream reservoirs, and increase the risk of flood (Long et al. 2013c). There are beneficial
effects of fire to stream and river ecosystems that are described more under the Ecological
Integrity Theme (e.g. large wood recruitment). More information on fire and its effect on
hydrologic function may be found under the Fire Resilience theme.
Effects of Development
The majority of National Forest System (NFS) lands in the bio-region are not developed,
however, conversion of forest land to developed uses, such as roads or camp grounds, often
disrupts wetlands, and interferes with their ability to store, clean, and cool water, especially in
flood or drought periods (Burns et al. 2005). One of the reasons lands are undeveloped is that
twenty percent (2.3 million acres) of the NFS lands in the Sierra Nevada are in designated
wilderness. Additional lands are in roadless areas. California’s population growth has been
accompanied by increased land development, resulting in a loss of forests and rangelands (USFS

19
Region 5 2013). These changes can alter the stability of the ecosystem by favoring certain
species and marginalizing others (Havlick 2002). Infrastructure development can add pollutants
to local watersheds, altering the localized supply of clean water to humans, and possibly
destabilizing ecological processes that produce other ecological services important to human
wellbeing (Zedler 2003, Zipperer 2002). Based on increasing population projections,
development may increase to address demand, although this will be tempered by flat or declining
budgets. Increased development would continue to put pressure on ecological processes.
Considering the proportion of the landscape that they occupy, roads are a prevalent cause of
hydrologic and land form process alteration on NFS lands (USFS 2011b).When roads and
drainage features contribute flow directly to a natural water body, they become part of the
drainage network and are hydrologically-connected. These drainage systems may further increase
connectivity if they deteriorate because of use, weather, or poor maintenance. In addition, cut
slopes can intercept subsurface storm flow when the height of the cut slope exceeds the depth to
the water table. This runoff is laterally redistributed and often concentrated along inside ditches or
the running surface, where it is discharged to hill slopes below the road or trail prism or routed
directly into streams. These hydrologic processes and pathway alterations largely drive the water-
quality impacts associated with roads (USFS 2011b). Hydrologically disconnecting roads from
the drainage network is an important practice for eliminating chronic water-quality impacts
(USFS 2011b). As budgets tighten, and maintenance and closure efforts are constrained, water
quality issues with roads could increase. There is more discussion of best management practices
and the effect on water quality below. The deferred maintenance for road and trail infrastructure
on Sierra Nevada forests exceeds several hundred million dollars. For example, deferred
maintenance on the Sierra National Forest is approximately $102 million, on the Sequoia
National Forest approximately $94 million and on the Inyo National Forest approximately $29
million (Sierra, Sequoia and Inyo Travel Management Draft Environmental Impact Statements).
Over the past several years, the Forest Service has been funded to maintain approximately 20
percent of its road system to safety and environmental standards.
Connectivity in watersheds and aquatic habitat has been impacted by water development projects
as well as older, unimproved road crossings, as described above and under the Ecological
Integrity theme. These projects are numerous in the watersheds in the bio-region and therefore
many watershed flow cycles and function have been disrupted. Most of this development
occurred more than a decade ago. The trend is toward maintaining existing dams and
infrastructure, rather than expanding the network. Additionally, Federal Energy Regulatory
Commission (FERC) relicensing results in a review of the ecosystem conditions and watershed
function and in operational changes that benefit watershed function, such as more ecosystem-
friendly flow patterns or more cold water being released. The hydropower licensing process
provides an important opportunity to restore wetlands, rivers, and watersheds through intensive
and long term collaboration with project licensees, federal and state agencies and non-
government organizations. Some opportunities for watershed restoration include restoring
essential river flows where projects have diverted water for generations, thus protecting fish and
wildlife habitat and listed species, providing fish passage, and restoring degraded habitats.
20
Unauthorized or Unmanaged Recreation
Water is a major attraction for visitors to the national forests and unmanaged recreation can
adversely impact natural resources. Population growth will increase demand for recreation around
water bodies. Camping, day-use and travel through riparian areas have the potential to degrade
water resources. As popular areas become crowded, new areas will be utilized and may be at
ecological risk. New uses could have more impacts. As the population diversifies and increases
so will the demand for recreation and environmental uses and values.
Livestock Grazing
Much of the research on grazing has had experimental design limitations that limit the application
of results on national forest lands. Many studies of grazing impacts are difficult to translate to
grazing management strategies when they lack details such as stocking rates or utilization levels
(Briske et al. 2008). Quantifying the influence of livestock grazing in stream and meadow
ecosystems has been difficult because experimental designs may not sufficiently address
ecological variation. Sarr (2002) identified common problems in evaluating responses to
livestock grazing and exclusion, including lack of proper controls and the small size of
exclosures. Research experiments are often conducted at too small a scale to properly evaluate
effects (Briske et al. 2008).
It is widely recognized that unmanaged over-grazing results in adverse resource impacts.
However, the grazing that is permitted under the 2004 Framework is managed. The 2004
Framework and the allotment-level management documents, such as allotment management
plans, grazing permits, and annual operating instructions include extensive restrictions on site-
specific grazing to ensure that sites are not overgrazed and that resource impacts are avoided.
Recent science makes clear that grazing can be compatible with the protection of aquatic and
riparian resources, including sensitive wildlife species (see e.g., Briske et al 2011, Roche et al
2012a, Roche et al 2012b, Jackson and Allen-Diaz 2006). Briske et al (2011, p.240) evaluated
multiple rangeland conservation practices and their benefits, and concluded:
Riparian vegetation management that maintains or enhances key riparian vegetation
attributes (i.e. species composition, root mass and root density, cover and biomass) will
enhance stream channel and riparian soil stability, and this in turn will support ecosystem
services, such as flood and pollutant attenuation and quality of riparian habitats.
In addition, while it is true that scientific papers have documented adverse impacts of grazing on
stream health, such studies generally do not account for the success of best management practices
(BMPs) in mitigating adverse effects. Studies that have evaluated the effects of carefully
managed grazing demonstrate that BMPs can be effective in managing livestock distribution to
minimize or avoid adverse environmental impacts (Ward et al 2003, George et al 2008, Bailey
2004). Such BMPs include: livestock herding; strategic placement of mineral supplements; water
developments; fencing; rest-rotational and other grazing systems to adjust the timing, frequency,
intensity and duration of use; and monitoring to assure that grazing permits are being
implemented and that standards are effective (Clary and Lenninger 2000, Tate et al 2004a and
21
2005). BMPs are routinely used in managing grazing under the 2004 Framework to avoid
adverse impacts. Livestock grazing occurs around riparian areas, particularly meadows, and has
for more than one hundred years. The effects of grazing depend on the level of intensity of the
grazing. Future livestock grazing will continue to be managed and monitored to balance this use
with ecological impacts.
Currently, a total of 221 permittees graze livestock under 240 permits on Forest Service
allotments in the Sierra Nevada bio-region. “Grazing on public lands plays an important role in
maintaining viable ranching operations (Gentner and Tanaka 2002, Huntsinger et al. 2010, Sulak
and Huntsinger 2007)” (Charnley et al 2013 p.21). Permittees on three national forests in the
Sierra Nevada were found to use an average of 2.6 leases per year per operation, and the public
lands lease contributed an average of 41 percent of the income they earned from ranching (Sulak
and Huntsinger 2007, Charnley et al. 2013). Because of the number of cattle needed to have a
financially viable ranching enterprise (Sulak and Huntsinger 2007), California ranchers often
maintain livestock herds that are larger than their private lands can support. “This means they
must lease public or other private lands for part of the year” (Charnley et al. 2013, p.21). “The
importance of public land leases led one-third of the permittees interviewed to state that if they
lost the leases, they would probably sell all or part of their private ranch” (Charnley et al. 2013,
pp.21-22). The administration of the grazing program on the Sierra Nevada national forests is
intertwined with the conservation of California rangeland, primarily in the foothills adjacent to
the forest. This is in part because of an eligibility requirement of Forest Service grazing permits
for permittees to own base property ranches for their cattle to graze when they are not using forest
rangelands. Grazing permits not only enable ranchers to maintain ranching as a component of
their livelihood, strategies and culture, but they also contribute to the conservation of private
rangelands and their associated ecological values by helping prevent the sale of private ranches
by ranchers whose operations would fail without the public land connection (Charnley et al.
2013).
Livestock grazing can provide other ecological benefits when used as a management tool.
Targeted grazing uses livestock to manipulate vegetation to meet management objectives. These
strategies have been used on projects such as utility corridor maintenance and fuels treatments.
This creates a mutual benefit for both livestock owners and the Forest Service. Interest in targeted
grazing among private business owners and land managers has experienced a recent surge.
However, although there is support for these practices, their application has been fairly limited
due to competing agency priorities.
Wet Meadows
“Evaluations of wet meadow restoration efforts within the Sierra Nevada have demonstrated
gains at specific sites in certain functions, including water quality, water quantity, and macro-
invertebrate diversity” (Long et al. 2013 p.2).
According to Long et al. (2013 p.3):
22
Wet meadow restoration is expected to have an important role in securing favorable flows of high
quality water (Viers and Rheinheimer 2011), mitigating man-influenced carbon and nitrogen
concentrations (Norton et al. 2011), and supporting biodiversity including pollinators (Colloran et
al. in press).
Also, according to Long et al. (2013 p. 18):
Wet meadows can be vulnerable to transformations that result in diminished socio-ecological
value. The flip side of that coin is that restoration of these systems holds great potential to provide
multiple ecological and social benefits, despite their small share of the landscape. Research to date
suggests that projects can promote important benefits.
Good Water Quality and Quantity
Forested watersheds in the bio-region provide an abundant supply of clean water that supports a
broad range of downstream uses (California Department of Forestry and Fire Protection 2010).
Water supplied from forests provides water for municipal and agricultural supplies (USFS 2011).
This water also provides a variety of recreation, tourism and travel opportunities. It provides
habitat for fish and wildlife. Plants, fish and wildlife also depend on clean water for survival.
Water from most streams on the western slope of the Sierra Nevada is used to produce
hydropower. Water controlled by water development projects, such as dams, also provides flood
protection and tribal needs. These result in economic, recreational and cultural benefits (Postel
and Carpenter 1997). Water is a very valuable commodity in California.
Water is a basic requirement for people’s quality of life, and there is a strong relationship between
forest land and clean water. Water originating from the Sierra Nevada supplies roughly 60 percent
of California’s fresh water (Sierra Business Council 2007). For approximately 23 million
Californians, or about 60 percent of the population, their drinking water begins its journey in the
Sierra Nevada. The value of this resource is immense in terms of the various services it provides
and supports. A discussion of the value of these ecosystem services and the resulting benefits to
people is provided under the Fire Resilience and Ecological Integrity themes.
Water is critical to California’s agricultural industry, which supplies most of the nation’s fruits
and vegetables. Sierra Nevada supplies drive the Central Valley’s extensive agricultural economy
(Sierra Business Council 2007). The Central Valley, which receives most of its water, both
groundwater and surface water, from the bio-region, is one of the world’s most productive
agricultural regions. More than 230 crops are grown there. On less than one percent of the total
farmland in the United States, the Central Valley produces eight percent of the nation’s
agricultural output by value, 17 billion U.S. dollars in 2002 (Reilly 2008). Virtually all non-
tropical crops are grown in the Central Valley, which is the primary source for a number of food
products throughout the United States, including tomatoes, almonds, grapes, cotton, apricots, and
asparagus (Pollan 2011). The top three counties in 2011 gross value of agricultural production in
California are located in the Central Valley and are reliant on the water supplied from the bio-
region. They are Fresno at $6.9 billion, Tulare at $5.6 billion and Kern at $5.4 billion of
23
agricultural production (CDFA 2013). Thirty-four million-acre feet (MAF) of water are used
primarily in the Central Valley for agricultural purposes. Fourteen MAF are from the bio-region.
Water plays a major role in providing a diverse set of recreation opportunities on forests in the
bio-region. The Sierra Nevada landscape is the setting for a large recreation and tourism industry,
and for new homes built for the influx of people who enjoy living there. Each national forest has
a defined set of “recreation settings,” representing geographic areas for particular recreation
opportunities, and to which forest visitors have grown emotionally attached over time. Many
forests in the bio-region have recreation settings related to rivers and lakes. According to 2005-
2009 National Visitor Use Monitoring (NVUM) data, approximately ten percent of visitors to
forests in the bio-region fish, five percent do motorized water activities, and three percent do non-
motorized water activities. Water bodies also support a variety of other recreation activities, like
viewing natural features, hiking, and camping. The economic contributions of this recreation to
local economies are discussed under the Sustainable Recreation theme.
Ecosystems near water (riparian), and in water (aquatic), account for more than 50 percent of the
animals, plants, and other living things of concern. More detail on this may be found under the
Biodiversity of Aquatic and Riparian Ecosystems section under this Water theme.
Hydropower is currently the primary source of renewable energy generation in the bio-region.
The bio-region, including the Sacramento River, the San Joaquin River and the Tulare Lake Basin
hydrologic regions produce approximately 1,800 megawatts annually, although this is dependent
on precipitation (Fromeworth 2004, p 578).
All known living organisms need water to survive, and vegetation needs more water than animals.
Vegetation is made of up to 90 percent water by weight compared to animals, which are about 75
percent water. Vegetation replenishes water needs by pulling moisture up through root systems.
Like all living things, vegetation uses water for cell growth and overall health, but also for several
specific functions. Vegetation plays an active role in regulating water, energy, and carbon dioxide
fluxes, which makes it a key regulatory force in the earth’s hydrological cycle. Through the plant-
soil system, carbon dioxide uptake and water evaporation are inherently connected.
In addition, regulating the timing of water flow provides benefits to people located in floodplains,
inside and outside the bio-region. Manmade infrastructure, like dams, reservoirs and levee
systems, regulate water supply and help lower the risk of extreme floods. They also provide for a
constant supply of water when there is less late season flow. The managed release of snowmelt
throughout the spring and summer helps control winter flooding in the valleys, and provides
irrigation for crops and water to keep recreation and other businesses and industries thriving
through the summer (Sierra Nevada Conservancy 2011a).
Tribes throughout California have rights to access water for adequate supplies for direct
consumption, agricultural purposes, or protecting existing resources. Tribes may have senior
water rights and some water sources may be defined as “sacred sites” (USFS 2012a).
Infrastructure development or improvements to recreational sites needing additional water,
electricity, sewage, and roads, may impact traditional landscapes. “Native American cultural
resources are often concentrated along perennial streams due to availability of water and
24
culturally important plants, travel corridors, and other patterns that facilitated development
(Jackson 1988)” (Hunsaker et al. 2013a, p.3). It is essential to consult with tribes before
permitting, licensing, or taking action that may affect tribal water quality, quantity or cultural site
condition. Although there are regulations in place in the bio-region to prevent infringement on
tribal water rights and to protect cultural properties and sacred sites, complete implementation of
these regulations has not always occurred.
Clean water is highly valuable to the people and ecosystems of the Sierra Nevada and all of
California. In terms of natural resources, water is the most valuable commodity in the bio-region,
followed by timber, livestock and other agricultural products. Based on estimates of direct
resource values as one input (not the total revenue produced by resource dependent activities), the
Sierra Nevada ecosystem produces approximately $2.2 billion in commodities and services
annually. Water accounts for more than 60 percent of that total value. Given population increases
in the state resulting in more people benefiting from these commodities and services, as well as
the conflicting uses for water resulting in rising costs for this resource, the trend in this value is
increasing and will continue to increase into the future. Most of the water value accrues to water
rights holders and beneficiaries outside of the bio-region. About six percent of the total
consumption of this water supply happens within the bio-region (Stewart 1996).
Water is a vital resource and critical to the social, ecological and economic sustainability of the
bio-region. Forests in the bio-region are the primary source of water used throughout California.
Socially and ecologically, water is fundamental because all life depends on it (Hunsaker et al.
2013a). The benefits of water, a key forest ecosystem service, accrue to people throughout many
economic sectors and across a broad landscape.
Growing Need for Water
The population of California is expected to grow 37 percent between 2010 and 2050. This will
require additional water in order to meet the needs of more people (California Department of
Finance California Department of Forestry and Fire Protection 2010). Recent population growth
has led to increased competition for water among various uses throughout the state, and in the
bio-region. For those counties in California partially or entirely within the bio-region, total
population is expected to increase by 69 percent between 2010 and 2050 (California Department
of Finance 2012, Lin and Metcalfe 2013). Growth is expected to be greatest in the South Sierra
counties of Fresno, Kern, and Tulare. Within the Sierra Nevada, these competing interests include
in-stream flows for aquatic species, water recreation, hydropower, domestic uses, and national
forest and special use permit site uses. This expected population growth will only increase the
competition for these various water uses in the state and the bio-region.
As an example of the use of bio-region water supplies and the need for water quantity, water from
the Sierra Nevada supplies San Francisco and Los Angeles. According to the Los Angeles
Department of Water and Power (LADWP) 2010 Urban Water Management Plan, the Los
Angeles Aqueduct, which originates in the Sierra Nevada, is one of the major imported water
sources to the City of Los Angeles, averaging 36 percent of total water supplies in recent years,
and delivering 39 percent of the total runoff in the eastern Sierra Nevada in an average year.
25
Many uses for the water from the bio-region compete. The resulting conflicts mean that there
isn’t enough water for all user groups. Going forward, climate change is expected to reduce the
supply, and may increase the competition for water use. Development and population growth will
put even more demand on the available water.
The competition for the availability of limited water supplies has led to continuing political
activity in the state related to water. As time goes on, this political conversation will continue
with increasing intensity. Pressures from expansion of California’s agricultural and urban areas
are being resisted by groups interested in preserving biodiversity and environmental quality in the
Sierra Nevada, and who view the continuous and rising export of water to other regions as
undesirable in the long run (Mittelbach and Wambem2003).
Water Quantity
Annual water yield from national forests in the bio-region is estimated at 14 million acre feet per
year (Rector and MacDonald 1986, Brown and Froemke 2009). The Forest Service “Forests to
Faucets” project highlights that this water from National Forest System (NFS) lands is critical for
communities and the state economy. Many of the major municipal water systems rely heavily on
surface water supplies that originate on the forest lands of the bio-region. This surface water is
also important to irrigated agriculture and recreational uses. These key economic sectors rely on
dependable and consistent water supplies (USFS 2011d).
When water soaks into the ground and replenishes groundwater, it helps supply Central Valley
aquifers used for irrigation and municipal supplies. Groundwater provides about five percent of
the local water supply in the Sierra Nevada, limited to areas of fractured rock and small alluvial
aquifers along streams. Most of this groundwater is used for domestic purposes.
The amount and distribution of rainfall is the main factor determining the amount of water
supplied by a watershed. Rainfall patterns, in turn, depend mainly on climate and topography, and
not on management of the ecosystems directly (Egoh et.al. 2008, USFS 1976). However, forest
decisions about vegetation, fuel, range, and road management can influence the timing of water
supply from storm flows and snowmelt. In addition, vegetation and fuel management may
influence water quantity through changes in the amount of evapotranspiration from vegetation on
forests lands (FAO 2008, Rector and MacDonald 1986, Ziemer 1986). Forest Service mandates
to manage for a wide range of resource values make it difficult to apply the scale of management
practices needed that would actually increase the flows of a watershed (USFS 2000).
According to Hunsaker et al. (2013a p.14):
Many fuels management treatments or forest restoration efforts remove less than 20
percent of the basal area of trees. Although this may result in a change in flow, it likely
will not be detectable, especially in dry years. With best management practices (BMPs),
which should not cause overland flow from skid trails or soil compaction, there should be
little or no detectable effect on peak discharges (Bosch and Hewlett 1982, Hibbert 1967,
Stednick 1996). Any change will be short-lived because of vegetation regrowth.
26
Prescribed fire by itself is less likely to influence water yield than mechanical treatments
because of the smaller reduction in basal area and lack of ground disturbance by heavy
machinery (Troendle et al. 2010).
Climate predictions for California include increased warming, less snowpack, and earlier spring
snowmelt. These changes would influence the amount of water supply that can originate from
forest lands and from reduced precipitation, as well as the amount and types of vegetation that
would influence the timing of this water supply. Climate change is also expected to increase the
severity and area of fires, which would directly impact the timing of water supply. All of these
factors would change how water is budgeted and the ecological integrity of stream ecosystems
(Viers and Rheinheimer 2011).
Additionally, as described in Jardine and Long (2013):
Watersheds in the northern Sierra Nevada may be most vulnerable to decreased mean annual flow,
south central watersheds to changes in runoff timing, and the central Sierra Nevada to longer
periods of low flow. Although the Kern River may be the most resilient watershed, the anticipated
shifts in the hydrologic cycle will impact spring and summer water-based recreation and tourism
and, more importantly, the California communities that depend heavily on Sierra Nevada water
supplies.
Climate change, development, and population growth are expected to increase the strain on this
supply, and increase competition between the various uses. Future uncertainty in water supply
leads to difficulty in planning and decreases in the profitability of key economic sectors in the
bio-region such as agriculture and recreation. Management of the supply will impact social and
economic sustainability, since communities and local economies rely on this water.
Water Quality
There is a strong relationship between forest land and the provision of clean water. This
ecosystem provides stabilization of soils and filtering services that reduce sedimentation and
pollutants and thus regulates water quality (de Groot et al. 2002). Forests and grasslands often
produce high-quality water. Long term studies have shown this to be generally true in undisturbed
ecosystems and for some classes of land use. Various forms of land use have been found to
degrade water quality to varying degrees, with the most significant forest land water quality
problems being sediment, nutrients, temperature, and hazardous chemicals (Dissmeyer 2000,
USDA FS 2000). Vegetation and fuels management can directly impact the provision of this
filtering ability of forest lands. In addition, many activities occurring on forest lands such as over-
grazing, hydrologically-connected roads, and ground disturbing recreational activities can also
lower water quality. Best management practices to protect, restore, or mitigate water quality
issues have been devised to limit the potential impacts resulting from these management actions.
A number of measures can be used to characterize water quality, including chemical indicators
(nutrients, conductivity, pH, metals, pathogens, pesticides, and organics), physical indicators
(temperature and sediment), biological indicators such as stream invertebrates, and human
27
exposure indicators (swimmable, fishable, drinkable) (Hunsaker et al. 2012a). Sediment and
nutrient loads from forested watersheds in the Sierra Nevada, including large areas within
national forests, were found to be substantially lower than loads from downstream agricultural
areas, and significantly lower than average pollutant loads nationwide (Kratzer and Shelton
1998). “The chemistry of water is usually very good within national forests” (Hunsaker et al.
2013a, p.21).
Threats to forest scale water quality affect the sustainability of these ecosystem services and the
resulting economic benefits. These threats to water quality are climate change, fire, development,
and increasing use of forest land, all of which have the potential to alter existing landscapes
affecting both forest vegetation and soil that protect water quality. The resulting reduced
filtration of precipitation and runoff, and the potential for increased sedimentation can reduce the
benefits associated with recreational and cultural experiences on the forest and can negatively
impact the functioning of the localized ecosystem (Hill 2012).
Wild and Scenic Rivers
Eight rivers designated as Wild and Scenic Rivers, totaling 345 river miles, are within the Sierra
Nevada bio-region. Each river is administered to protect and enhance the specific outstandingly
remarkable values that caused it to be designated. Designation also protects natural, cultural and
recreational river-related values on federal lands, and provides guidance to effect a voluntary
protection strategy for all lands in the river corridor. Wild and scenic rivers accommodate people
and communities by allowing existing uses to continue where they do not conflict with river
protection. Based on current limited studies, indications are that property values remain stable or
increase on designated rivers. This is often tied to the protection and enhancement of scenery,
other aesthetic values and water quality.
From fiscal year 2012 year end reporting, of the eight rivers in the bio-region only three are
“meeting statutory requirements.” These are the Kern, Merced, and Tuolumne Wild and Scenic
Rivers. Five of the rivers in the bio-region, Cottonwood Creek, Owens River Headwaters,
Feather, Kings and North Fork American do not currently meet statutory requirements. A more
detailed assessment of each river will occur in the forest assessments. There are 467 miles of
additional recommended wild and scenic rivers in the bio-region.
Effects of Fire
Fires have varying effects depending on the extent, soil erodability, and rain events after the fire.
Wildfires affect rates of soil erosion and sediment transport by removing protective vegetation
and litter cover from forest soils, destroying roots that bind soil, removing woody debris that
slows runoff and erosion, and reducing infiltration and increasing runoff owing to development of
hydrophobic (water repellant) soils (Neary et al. 2005). Effects vary with fire severity,
topography, geology, and climate. Severe fires that destroy a high proportion of vegetation, soil
cover, and roots have the greatest potential to increase erosion, particularly if the fire is closely
followed by significant precipitation or snowmelt (Benda et al. 2003, Bisson et al. 2003, Spencer
28
et al. 2003). Sediment yields measured from burned areas in the Sierra Nevada have ranged from
30 to 44 tons per acre per year (Pierson et al. 2008, Carroll et al. 2007).
Pierson et al. (2008) monitored post-fire sediment yield for three years following a fire in
northwestern Nevada and compared their results with sediment yield from an unburned control.
The sediment yield for the burned area was 3,400 times higher than the sediment yield for the
unburned area, indicating a very substantial increase caused by the fire. Fire effects decreased, but
were still apparent three years after the fire.
Fuels reduction treatments, including road construction, in conjunction with implementing best
management practices, can reduce long term average annual watershed erosion rates from 0.2
tons per acre per year, to 0.14 tons per acre per year, by reducing the size, severity, and frequency
of fire (Elliott 2010). Elliot (2010) provides scientific evidence that fuel treatments provide a net
benefit for watersheds given the risk of severe erosion and sedimentation from wildfires.
Timber Harvest
Timber harvest can contribute to erosion and sediment transport to streams. Water quality
characteristics most affected by timber harvesting are sediment, dissolved nutrients, and water
temperature. Undisturbed forests are generally low in dissolved or suspended matter and
sediment loads and dissolved nutrients generally increase with the level of disturbance to the
forest. Logging and related activities such as road building, skidding, slash burning, and others
have the potential to produce erosion that can deliver sediment and nutrients to streams (Foster
Wheeler 2000). Although research about fire history in particular strongly suggests a need for
treatments within many riparian areas, limited information about the effects and effectiveness of
mechanical treatments and prescribed fire treatments currently limits guidance for managing
these valuable riparian ecosystems (Hunsaker et al. 2013b).
Roads, Overgrazing and Recreation
Overgrazing, hydrologically connected roads, and ground-disturbing recreational activities can all
lower water quality. Road and trail construction, use, and maintenance can all contribute to
erosion and sediment transport to aquatic ecosystems. Road-related sediment yields vary across
the bio-region from 0.007 to 0.13 tons per acre per year (Weaver et al. 1995, Coe 2006). These
influences are mainly removal or reduction of soil cover or soil disruption, destroying roots that
bind soil, removing woody debris that slows runoff and erosion, and reducing infiltration.
Sedimentation and barriers from road and trail crossings have also contributed to degraded
conditions.
On the national forests in California, best management practices (BMPs) are used to protect water
quality and have been for more than 30 years. BMPs are designed to protect, restore, or mitigate
water quality issues and are used to limit the potential impacts from these management activities.
BMPs for vegetation management on National Forest System (NFS) lands have been effective in
preventing potential or adverse impacts to water quality more than 95 percent of the time (USFS
2013). BMPs for roads have been effective 77 percent of the time, which is a reduction from the
29
2009 monitoring report, and 69 percent of the time for livestock grazing. Information from 2003-
2007 reporting showed that only two percent of the evaluations indicated significant adverse
effects to water quality.
However, the impacts on water quality are caused by roads hydrologically-connected to a stream,
and many roads are in areas where this is not the case. There is no current data on what portion
of roads are not maintained and hydrologically-connected, however, proper implementation of
BMPs will minimize sedimentation from roads under most circumstances. The flat budgets
projected into the future limit the ability to fully maintain roads and implement BMPs, and this
will likely continue. Sedimentation into streams from hydrologically-connected roads where
BMPs are not applied is expected to continue into the future and affect local water quality.
Roads provide important services to society. Their presence can also negatively influence the
hydrology, geomorphology, and ecosystem processes on NFS lands. There are numerous articles
in the peer reviewed literature describing the impacts of roads on the landscape. Fragmented
habitats, polluted waters, failed culverts, and eroded road beds are just a few of many road-related
impacts that undermine the natural capacity of our forests to provide clean water and valuable
wildlife habitat. Excessive road densities directly affect water quality and aquatic values, and
have been tied to reductions in pool frequency within a channel, increased sedimentation, and
warmer water temperatures.
According to Hunsaker et al. (2013b):
The median sediment production rate from roads was 0.2 kg m-2, nearly an order of magnitude
higher than any of the other sources measured (skid trails, off-road vehicle trails, hillslopes burned
by prescribed fire and wildfire, undisturbed). Historically, roads have been considered the primary
source of sediment and a significant problem in many landscapes.
The following is a summary of some points discussed by Gucinski et al. (2001) about road
erosion effects:
Although mass erosion rates from roads typically are one to several orders of magnitude
higher than from other land uses based on unit area, roads usually occupy a relatively small
fraction of the landscape, so their combined effect on erosion may be more comparable to
other activities, such as timber harvest.;
Poorly designed channel crossings of roads and culverts designed to pass only water flow
may also affect the morphology of small tributary streams, as well as limit or eliminate fish
passage;
Indirect effects of roads on channel morphology include the contributions of sediment and
altered stream flow that can change channel width, depth, local gradients, and habitat features
(pools, riffles) for aquatic organisms;
Extensive research has demonstrated that improved design, building, and maintenance of
roads can reduce road-related surface erosion at the scale of individual road segments
(Hunsaker et al. 2013a).
30
Road impacts to water quality and aquatic habitat should be less in the future because very little
new road construction is expected, and because there is knowledge about how to construct and
maintain roads to lessen impacts. Larger sources of soil erosion may include increased wildfires,
as well as lack of road maintenance resulting in progressive degradation of road drainage
structures and functions (Furniss et al. 1991). Road maintenance and decommissioning are
generally effective and beneficial for water quality, but will not mitigate an increase in sediment
yields from increased wildfire frequency (Hunsaker et al. 2013a, Goode et al. 2012).
Water quality issues are often associated with ranching activities. Ranching is also a major part of
the cultural heritage in the Sierra Nevada and helps preserve the open space and rural character of
communities that residents and visitors in the Sierra Nevada value so much (Sierra Nevada
Conservancy 2011a). There is concern that microbial and nutrient pollution by cattle on public
lands degrades water quality, threatening human and ecological health. Given the importance of
clean water on national forests in the region, and concerns raised by recent studies (Derlet 2006
and Central Sierra Environmental Resource Center), the Forest Service initiated a comprehensive
study in 2011 in collaboration with the UC Davis Rangeland Watershed laboratory to examine
water quality and environmental conditions across common resource use activities throughout the
region. The study was conducted using a cross sectional survey of water quality conditions
associated with cattle grazing and recreation on 12 grazing allotments in northern California. The
study measured fecal coliform, E. coli, and nutrients, and compared the results to multiple water
quality regulatory benchmarks. The study also examined relationships between water quality,
environmental conditions, cattle grazing, and recreation (Roche et al. 2013).
Nutrient concentrations observed throughout the grazing-recreation season in the 2011
comprehensive study described above were at least one order of magnitude below levels of
ecological concern, and were similar to U.S. Environmental Protection Agency (EPA) estimates
for background water quality conditions in the region (Roche et al. in press). All but the most
restrictive fecal indicator bacteria water quality benchmarks were broadly met, and the EPA’s
currently recommended E. coli benchmarks were met by over 90 percent of the 743 samples
collected during the study. Elevated fecal indicator concentrations were associated with stagnant
low flow conditions at the time of sample collection, turbidity, and when cattle were observed
nearby at the time of sampling. Recreation was associated with the lowest fecal indicator
concentrations. The results indicate that cattle grazing, recreation, and provisioning of clean
water are broadly compatible goals across these national forest system lands. It also supports
continued use Land and Resource Management Plan (LRMP) standard and guideline BMPs to
ensure livestock management is conducted in a way to minimize adverse impacts (Roche et al.
2013).
Water Contamination
Geologic sources of mercury in the Sierra Nevada are limited to relatively small areas; however,
historic gold mining introduced large quantities of mercury into streams of the northern Sierra
Nevada in the nineteenth century. The American, Feather, North and Middle Yuba, South Yuba
31
and Bear Rivers are all identified as impaired owing to excessive mercury concentrations (Alpers
and Hunerlach 2000).
Approximately 20 water bodies on NFS lands in the Sierra Nevada are listed as impaired on the
State of California State Board’s 2010 303(d) list. Eagle Lake, the Truckee River, and Lake Tahoe
and its tributaries are listed for pollutants related to silviculture and livestock grazing. Most of the
other listings are for mercury and other metals resulting from historic mining or natural or
unknown sources. A conclusion can be drawn that the number of water bodies considered to be
impaired by the state’s water quality regulatory agency is a small fraction of the hundreds of
water bodies on NFS lands. Most water bodies on NFS lands are unimpaired and support
beneficial uses. Since water bodies have supported beneficial uses consistently in the past, it is
expected that water bodies on NFS lands will continue to support beneficial uses.
The most direct benefits to people resulting from good water quality on forest land are to the
recreational and cultural users who enjoy benefits right on the forests, and before any manmade
treatment processes are available. These recreational and cultural services provided by the forests
yield great benefit, both to the individuals enjoying these experiences and the local economies
benefitting from visitor spending in the local economy.
2004 Sierra Nevada Framework
The strategy for aquatic management in the 2004 Sierra Nevada Framework, which amended all
the forest plans in the bio-region, is to maintain and improve water quality and satisfy all federal
and state water quality requirements.
Some highlights of the key direction from the 2004 Framework are:
a description of desired conditions for aquatic, riparian, and meadow habitats;
a set of land allocations, specifically riparian conservation areas and critical aquatic refuges,
that delineate aquatic, riparian, and meadow habitats, which are to be managed consistently
with the applicable riparian conservation objectives and associated standards and guidelines;
and
an adaptive management program that includes monitoring and research specifically aimed at
assessing effects of management activities on the willow flycatcher and Yosemite toad.
The aquatic strategy also includes stream-type dependent flexible width riparian areas, protection
for in-stream flows, controls on sedimentation and loss of soil productivity, direction to restore
and maintain hydrologically functional meadows, conservation assessments of aquatic or
riparian-related threatened and endangered species, and incorporation of established recovery
plans, standards to move the level of coarse large woody debris toward the range of natural
variability, controls on livestock grazing in meadows and riparian areas, and standards for road
construction and stream crossings.

32
All ground disturbing projects must implement state-approved best management practices
(BMPs) specifically designed to protect water quality and comply with Clean Water Act and state
water quality standards.
For waters designated as “Water Quality Limited” (Clean Water Act Section 303(d)), managers
must participate in the development and implementation of total maximum daily loads (TMDLs)
and TMDL implementation plans.
Post-wildfire management activities in riparian conservation areas and critical aquatic refuges
should emphasize enhancing native vegetation cover, stabilizing channels by non-structural
means, minimizing adverse effects from the existing road network, and carrying out activities
identified in landscape analyses. Post-wildfire operations will minimize the exposure of bare soil.
The aquatic strategy recommends restoration practices in areas with compaction in excess of soil
quality standards, areas with lowered water tables, and areas that are either actively down cutting
or that have historic gullies. The 2004 Framework provided flexibility for developing
management strategies for road building, recreational use, grazing, and timber harvests, and other
forest activities that may be contributing to the observed degradation.
Flood Plains and Wetlands, Executive Orders 11988 and 11990, require federal agencies to avoid,
to the extent possible, short and long term effects resulting from the occupancy and modification
of flood plains, and the modification or destruction of wetlands. Standards and guidelines are
provided for soil, water, wetlands, and riparian areas to minimize effects to flood plains and
wetlands. They incorporate the BMPs of the Soil and Water Conservation Handbook. The
standards and guidelines apply to all floodplains and wetlands where less restrictive management
might otherwise occur.
33
FIRE RESILIENCE
What Are We Trying To Sustain at the Bio-Regional Level?
1. Fire management and landscape fire resilience
2. Fire and the benefits people obtain from ecosystem services
3. Resilient and adaptive communities in the face of fire
In our current condition, fire is a double edged sword. It has always been one of the most fundamental
ecosystem processes shaping the landscape in the bio-region. In the past, it was more extensive,
widespread, and less intense. Over 100 years of fire suppression, along with other land uses, changed how
fire burns. Now there are detrimental effects to ecosystem integrity from a lack of fire and to communities
and resources from too much high intensity fire. There are many controversies surrounding how to define
and address these issues. This assessment addresses key areas including fire management history, trends
and conditions in landscape fire resiliency, effects of fire on ecosystem services, and communities in the
face of fire.
Fire Management and Landscape Fire Resilience
Changes in vegetation from management over the last century, population growth, development in the
wildland urban interface (WUI) and climate change have vastly changed the patterns of fire and the
ecological, social, and economic consequences of fire (Husari et al. 2006, Collins and Skinner 2013).
Prior to European settlement, fire was widespread throughout the bio-region (Sugihara et al. 2007). The
frequency, spatial pattern, and severity varied by ecosystem. The variation by ecosystem and the
ecological role of fire is described under the Ecological Integrity theme. Native Americans used fire to
manage for varied beneficial uses for thousands of years. The relative importance of lightning as opposed
to what Native Americans did is in the number of ignitions or area burned and is often debated (van
Wagtendonk and Fites-Kaufman 2007). It is unknown how lightning ignitions may have varied over
thousands of years, but based on current patterns, ignitions are plentiful throughout the bio-region (van
Wagtendonk and Fites-Kaufman 2007). In addition to ignitions by lightning, Native Americans used fire
for thousands of years to manage for food, basketry, hunting, travel ways, and fire hazard (Anderson and
Moratto 1996, Anderson 2007). Some areas were burned every year or every several years, where
particularly important food sources were present (Anderson 2007). This included areas around and in
meadows and riparian areas. Importantly, Native Americans did not suppress fires, or if they did, not on a
widespread basis. The combination of Native American fire management and lightning ignitions resulted
in frequent fire, dominated by low and moderate intensities, across the landscape (Skinner and Chang
1996, van Wagtendonk and Fites-Kaufman 2007, Skinner and Taylor 2007, Reigel et al. 2007).
European settlement in the bio-region greatly intensified with discovery of gold in the Sierra Nevada in
1848 (Beesley 1996). At the same time, there was intensive logging to fuel steam-generated equipment
and to build housing, along with extensive grazing for livestock. These early settlers affected fire directly
and indirectly in numerous ways (Safford 2013). Overall, widespread fire decreased. However, in some

34
locations, it may have increased or changed in nature. Fire history reconstructions, using tree rings, show
decreased fire frequency at this time or in the late 1800s (e.g. Kilgore and Taylor 1979, Caprio and
Swetnam 1995, Taylor 2000). This decline has been attributed to the demise of Native Americans. At the
same time, there were other changes in fire from European settlement activities. There was indiscriminate
use of fire and accidental fire by early settlers. Sheepherders burned extensively at high elevations in the
fall on their way down from the mountains, presumably to improve forage (Sudworth 1900, Leiburg
1902, Vankat 1970, McKelvey and Johnston 1992). Some of the large shrubfields at higher elevations are
attributed to this burning (Sudworth 1900, Leiburg 1902), and still persist (Nagel and Taylor 2005).
Ranchers in the foothills reportedly used fires to increase forage production and enhance livestock access
(Merriam 2013). Miners and other early settlers caused accidental fires. Early logging caused other
changes in forests that would last and affect fire for more than a century. Fire resistant large pines were
favored for logging. Branches and tops of trees were left, adding fuel on the ground. All of these
settlement changes in fire on the landscape muddied evidence on the amount and distribution of high
severity fire prior to European settlement.
Over the last century or longer, with good intent but unforeseen consequences, most fires were rigorously
suppressed. For at least half a century, this suppression was successful (McKelvey et al. 1996, Husari and
McKelvey 1996, Husari et al. 2006). This fire suppression has resulted in increased vegetation density
and uniformity, increase of less fire tolerant trees, and understory fuel loads resulting in increased fire
potential (van Wagtendonk 1985, Stephens and Moghaddas 2005, Stephens 2005, van Wagtendonk and
Fites-Kaufman 2006, North et al. 2009). The effects of fire suppression on increasing fuels in the Sierra
Nevada and elsewhere in the western United States is well documented (Reinhardt et al. 2008) and has
been considered in past forest plans and forest plan revisions (USDA 2001). More recently, changes in
climate have been overlaid on top of increased fuel conditions, contributing to undesirable fire effects to
ecosystems and communities.
Published research has established that wildfires have become larger, and that large fires are more
frequent across the western United States since the 1970s (Calkin et al. 2005, Lenihan et al. 2008,
Westerling et al. 2006). There is a trend of increasing fire severity over the past 20 years or more
(Miller et al. 2009). Miller and Safford (2012) found a statistically significant increasing trend in both
percentage and area of high severity per year in yellow pine/mixed conifer forests. However, the total
acreage burning annually is well below historic levels (Stephens et al. 2007, Miller et al. 2009, North
et al. 2012). Although there is a current trend of increasing severity, the total area of high severity fire
is still less than what likely occurred historically, because fire area overall is so reduced (Stephens
2007, Miller et al. 2012). However, the pattern of high severity is substantially changed, with much
larger, continuous areas burned at high severity, concentrated in watersheds, compared to distributed
small patches, and occasionally larger ones throughout most of the landscape (van Wagtendonk and
Fites-Kaufman 2007, Collins and Stephens 2010). Current patterns are attributed to climate change
occurring across the now densely vegetated landscape.
Climate is a fundamental process that strongly influences other drivers and stressors in the Sierra Nevada,
including fire, invasive species, insects, pathogens, water development and diversion, aerial contaminants,
and land use patterns (Safford et al. 2012). It is characterized by regional temperature and precipitation,
but also involves changes in humidity, atmospheric pressure, wind, cloudiness, and other weather
components that affect fire. It may affect snowpack distribution, drought and extreme climatic events, for

35
example heat waves, that can lengthen and increase the severity of fire season. Increases in fire season
have already been documented (Westerling et al. 2006).
Current patterns of fire, extensive human development among the wildlands, and concern about old forest
associated species (e.g. California spotted owl, fisher) have made current fire management very complex.
Smoke from managed fire or from uncontrolled wildfires is a nuisance and can be a health hazard to some
people (Byterowicz et al. 2013). The effects of fire on wildlife are discussed under the Ecological
Integrity theme. The effects of smoke on people are found in the subsection “Communities in the Face of
Fire” under this theme. Here, the pattern of human developments in wildlands, and the wildland urban
interface (WUI) in relation to fire management is introduced.
In the map below, developed areas are depicted in dark gray overlaid across the bio-region. These are
referred to as wildland developed areas in the title. The data was developed by the Western Wildland Fire
Risk Center, at the Forest Service Pacific Northwest Research Station. The national forests are shown in
light green, and adjacent lands are shown in light tan. Larger water bodies, such as Lake Tahoe and Mono
Lake, are shown in light blue. The map shows that there is development concentrated on the western and
eastern low elevations, running from the north to the south. The greatest concentrations occur on the
lower western slopes, bordering the Sacramento and San Joaquin Valleys. This includes the western
boundaries of the Sierra, Stanislaus, Eldorado, Tahoe, and Plumas National Forests. The densest area is to
the east of Sacramento, along and within the western portion of the Tahoe and Eldorado National Forests.
There are other developed areas that cut across west to east, along major travel corridors, from the central
Sierra Nevada north. This includes along the Highway 80 corridor across the middle of the Tahoe
National Forest, and Highway 299 across the Lassen and Modoc National Forests. In the northern portion
of the bio-region, in Plumas and Lassen Counties, there are scattered small concentrations in the larger
valleys that occur in the mountains in the interior, in addition to the edges. There are also large
concentrations of development around large lakes or reservoirs including Lake Tahoe, and Lake Almanor
in the north, and around Lake Isabella in the south.
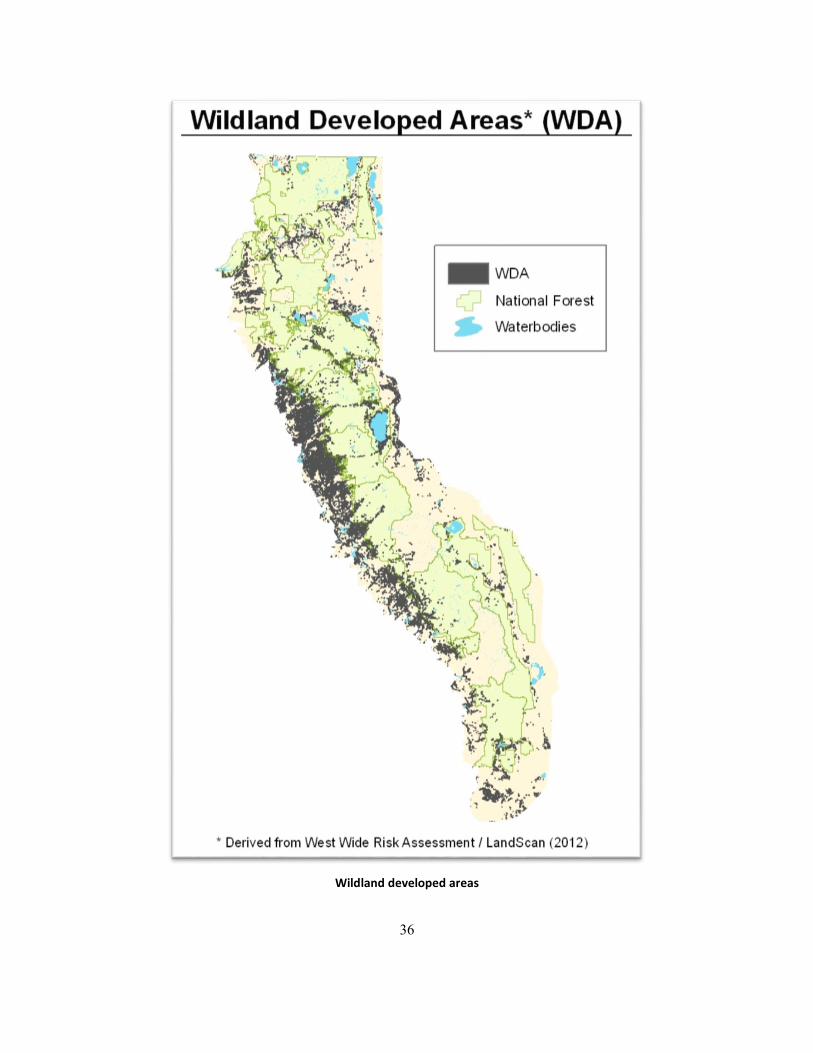
36
Wildland developed areas
37
The combination of accumulated vegetation and fuels in the wildlands and increased population in
communities adjacent and intermixed with them throughout the western United States is recognized by
many to contribute to increasing threats to communities, as well as increased fire management costs
throughout the western United States (California Forest and Range Assessment 2010, Toman et al. 2012,
Wildland Fire Leadership Council Cohesive Strategy 2013, Ecological Restoration Institute 2013). The
extensive WUI in the bio-region has resulted in changes to fire management including choice of strategies
and spending during uncontrolled wildfires (Calkin et al. 2005, Canton-Thomson et al. 2008). Research
since the turn of the century has shown that fuels in the “home ignition zone” and ignitability of building
materials (e.g. fire resistant metal vs. burnable wood shingle roof) are most critical to whether structures
burn in the WUI or not (Cohen 2001, 2003, 2004, Reinhardt et al. 2008). Investigation of recent
catastrophic fires in the WUI, where many structures burned, shows that most of the damage in the WUI
occurs during the most severe fire weather conditions (Menakis et al. 2003). Fires under these conditions
have rapid growth rates and/or high intensities (Reinhardt et al. 2008). An example in the bio-region is
the Angora Fire in South Lake Tahoe in 2007 (USFS 2007, Safford et al. 2009). Despite fuel hazard
reduction treatments in the WUI, 254 homes were destroyed (Safford et al. 2009).
These types of fires also put more firefighters at risk (Stockmann et al. 2010). In 2006, five firefighters
were killed protecting WUI structures (Stockmann et al. 2010). In 2003, 15 people were killed in
association with the Cedar Fire, including one firefighter. As a result of these newer findings, the new
Cohesive Fire Strategy emphasizes fire adapted communities, fire resilient wildlands, and risk-based fire
management. Fire adapted communities are discussed in a later subsection and fire resilient wildlands are
discussed below.
Predicted trends are that climate will continue to change and magnify the fire risk to communities, as well
as increase the likelihood of more intense and faster growing fires in the wildlands (McKenzie et al. 2004,
Westerling 2006, Westerling and Bryant 2008, Westerling et al. 2011). Longer fire seasons, and drier and
hotter fire conditions have already been noted over the last decade (Safford and Meyer 2012).
Current and future fire management is incorporating a risk-based management approach, as outlined in
the Cohesive Fire Strategy (2013). There are regional assessments, and plan development is underway.
One broad-scale approach the Cohesive Fire Strategy provided was a probability assessment of wildfire
risk (Cohesive Strategy 2013). In this national risk assessment, the Sierra Nevada mountain range was
identified as one of the highest risk areas in the country (Cohesive Strategy 2013).
These data are currently being calibrated for use in California at the bio-regional, forest and finer scales
by CalFire and Forest Service fire behavior experts. This requires using local weather stations and
analyzing weather related to fires of different sizes in the surrounding areas. One notable example is a
collaborative effort by government and private industry (Pacific Gas and Electric) in the Mokelumne
Watershed to assess costs of treating fire hazard to reduce potential costs from post-fire sediment into
reservoirs. Another key effort underway is the development of severe fire behavior thresholds (Energy
Release Component) to improve science-based fire management actions on the three southern Sierra
Nevada early adopter forests (Bowden personal communication 2013).
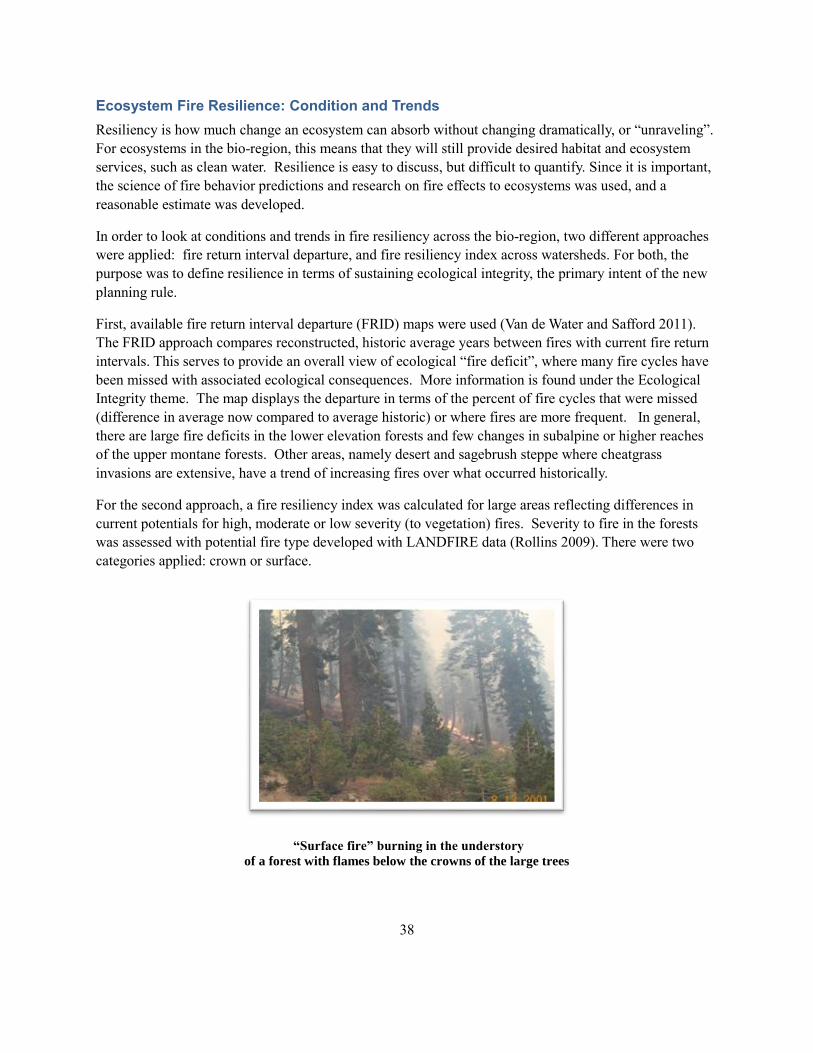
38
Ecosystem Fire Resilience: Condition and Trends
Resiliency is how much change an ecosystem can absorb without changing dramatically, or “unraveling”.
For ecosystems in the bio-region, this means that they will still provide desired habitat and ecosystem
services, such as clean water. Resilience is easy to discuss, but difficult to quantify. Since it is important,
the science of fire behavior predictions and research on fire effects to ecosystems was used, and a
reasonable estimate was developed.
In order to look at conditions and trends in fire resiliency across the bio-region, two different approaches
were applied: fire return interval departure, and fire resiliency index across watersheds. For both, the
purpose was to define resilience in terms of sustaining ecological integrity, the primary intent of the new
planning rule.
First, available fire return interval departure (FRID) maps were used (Van de Water and Safford 2011).
The FRID approach compares reconstructed, historic average years between fires with current fire return
intervals. This serves to provide an overall view of ecological “fire deficit”, where many fire cycles have
been missed with associated ecological consequences. More information is found under the Ecological
Integrity theme. The map displays the departure in terms of the percent of fire cycles that were missed
(difference in average now compared to average historic) or where fires are more frequent. In general,
there are large fire deficits in the lower elevation forests and few changes in subalpine or higher reaches
of the upper montane forests. Other areas, namely desert and sagebrush steppe where cheatgrass
invasions are extensive, have a trend of increasing fires over what occurred historically.
For the second approach, a fire resiliency index was calculated for large areas reflecting differences in
current potentials for high, moderate or low severity (to vegetation) fires. Severity to fire in the forests
was assessed with potential fire type developed with LANDFIRE data (Rollins 2009). There were two
categories applied: crown or surface.
“Surface fire” burning in the understory
of a forest with flames below the crowns of the large trees
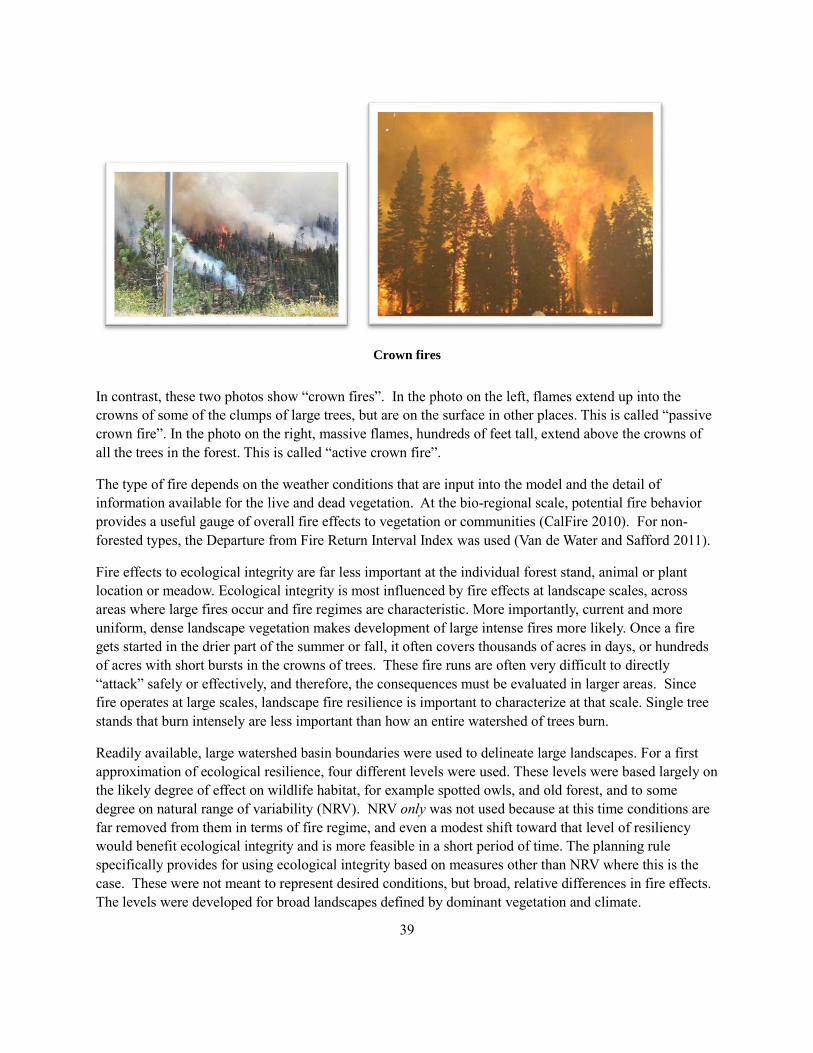
39
Crown fires
In contrast, these two photos show “crown fires”. In the photo on the left, flames extend up into the
crowns of some of the clumps of large trees, but are on the surface in other places. This is called “passive
crown fire”. In the photo on the right, massive flames, hundreds of feet tall, extend above the crowns of
all the trees in the forest. This is called “active crown fire”.
The type of fire depends on the weather conditions that are input into the model and the detail of
information available for the live and dead vegetation. At the bio-regional scale, potential fire behavior
provides a useful gauge of overall fire effects to vegetation or communities (CalFire 2010). For non-
forested types, the Departure from Fire Return Interval Index was used (Van de Water and Safford 2011).
Fire effects to ecological integrity are far less important at the individual forest stand, animal or plant
location or meadow. Ecological integrity is most influenced by fire effects at landscape scales, across
areas where large fires occur and fire regimes are characteristic. More importantly, current and more
uniform, dense landscape vegetation makes development of large intense fires more likely. Once a fire
gets started in the drier part of the summer or fall, it often covers thousands of acres in days, or hundreds
of acres with short bursts in the crowns of trees. These fire runs are often very difficult to directly
“attack” safely or effectively, and therefore, the consequences must be evaluated in larger areas. Since
fire operates at large scales, landscape fire resilience is important to characterize at that scale. Single tree
stands that burn intensely are less important than how an entire watershed of trees burn.
Readily available, large watershed basin boundaries were used to delineate large landscapes. For a first
approximation of ecological resilience, four different levels were used. These levels were based largely on
the likely degree of effect on wildlife habitat, for example spotted owls, and old forest, and to some
degree on natural range of variability (NRV). NRV only was not used because at this time conditions are
far removed from them in terms of fire regime, and even a modest shift toward that level of resiliency
would benefit ecological integrity and is more feasible in a short period of time. The planning rule
specifically provides for using ecological integrity based on measures other than NRV where this is the
case. These were not meant to represent desired conditions, but broad, relative differences in fire effects.
The levels were developed for broad landscapes defined by dominant vegetation and climate.
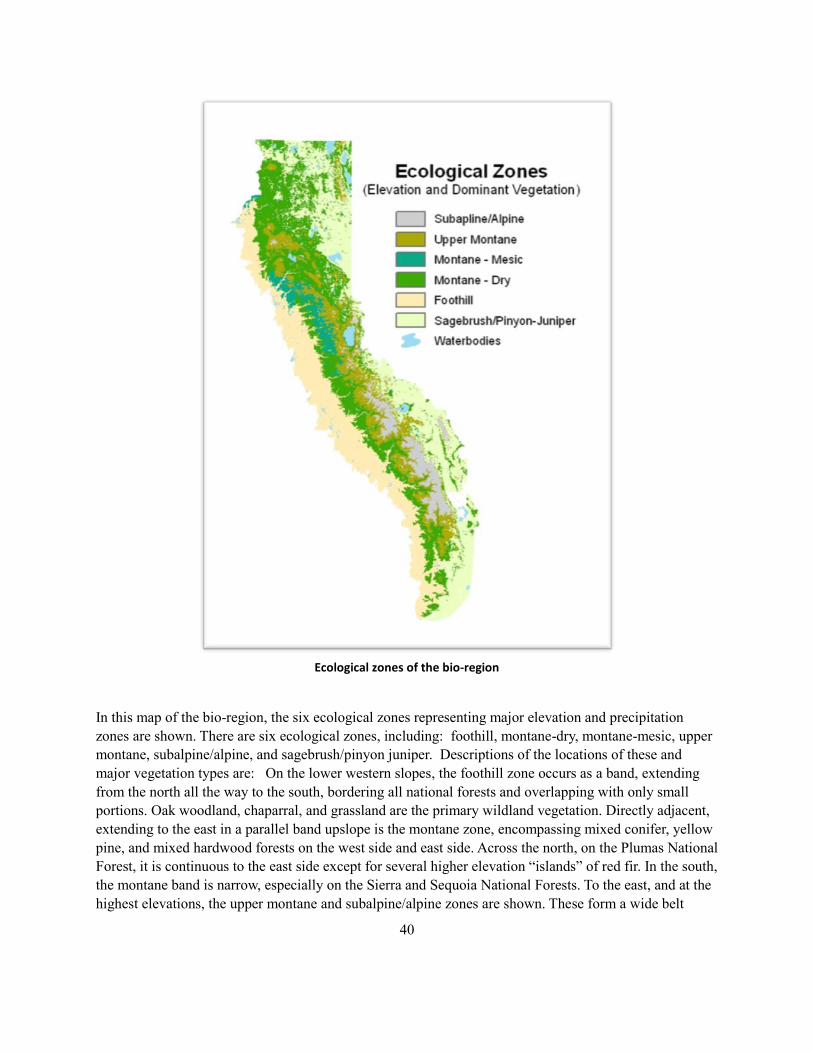
40
Ecological zones of the bio-region
In this map of the bio-region, the six ecological zones representing major elevation and precipitation
zones are shown. There are six ecological zones, including: foothill, montane-dry, montane-mesic, upper
montane, subalpine/alpine, and sagebrush/pinyon juniper. Descriptions of the locations of these and
major vegetation types are: On the lower western slopes, the foothill zone occurs as a band, extending
from the north all the way to the south, bordering all national forests and overlapping with only small
portions. Oak woodland, chaparral, and grassland are the primary wildland vegetation. Directly adjacent,
extending to the east in a parallel band upslope is the montane zone, encompassing mixed conifer, yellow
pine, and mixed hardwood forests on the west side and east side. Across the north, on the Plumas National
Forest, it is continuous to the east side except for several higher elevation “islands” of red fir. In the south,
the montane band is narrow, especially on the Sierra and Sequoia National Forests. To the east, and at the
highest elevations, the upper montane and subalpine/alpine zones are shown. These form a wide belt
41
across the top of the mountain range in the south but narrow progressively north through the Tahoe
National Forest, where it becomes discontinuous islands. Red fir, Jeffrey pine, and lodgepole pine forests,
meadows, and chaparral comprise the upper montane vegetation. Along the eastern portion of the bio-
region, there are large expanses of sagebrush and the pinyon/ juniper zone. Over half of the northern third
of the bio-region, from Lake Tahoe north to the California border, is occupied by the sagebrush,
pinyon/juniper and eastside montane zones. To the east and south of Lake Tahoe, the sagebrush and
pinyon/juniper zones occur mainly to the east in Nevada, and then in a wider band on the Inyo National
Forest to the southern edges of the bio-region. In the southeastern corner, a small area of desert occurs,
and subalpine forests of bristlecone pine.
Within these landscapes, forested areas (pine, mixed-conifer, red fir) were rated by broad levels of fire
types. For other types, where the potential fire models are less useful for ecological effects (chaparral),
the FRID data were used. Resilience was also rated differently in the narrow band around communities
and infrastructure, or the wildland urban interface (WUI), using fire behavior standards for firefighting
based on an interagency fire assessment group including state and federal partners. In general this follows
the Hauling Chart (Pyne et al. 1996). This was in a relatively narrow band and is largely masked in the
wildland fire resiliency ratings at the bio-regional scale. The wildland fire resilience ratings are very
important to fire resilience in the WUI, since the intensity and speed fires that start in wildlands and move
into the WUI depends on the conditions in the wildlands (Reinhardt et al. 2008). In the map below,
wildland fire resilience ratings are shown.
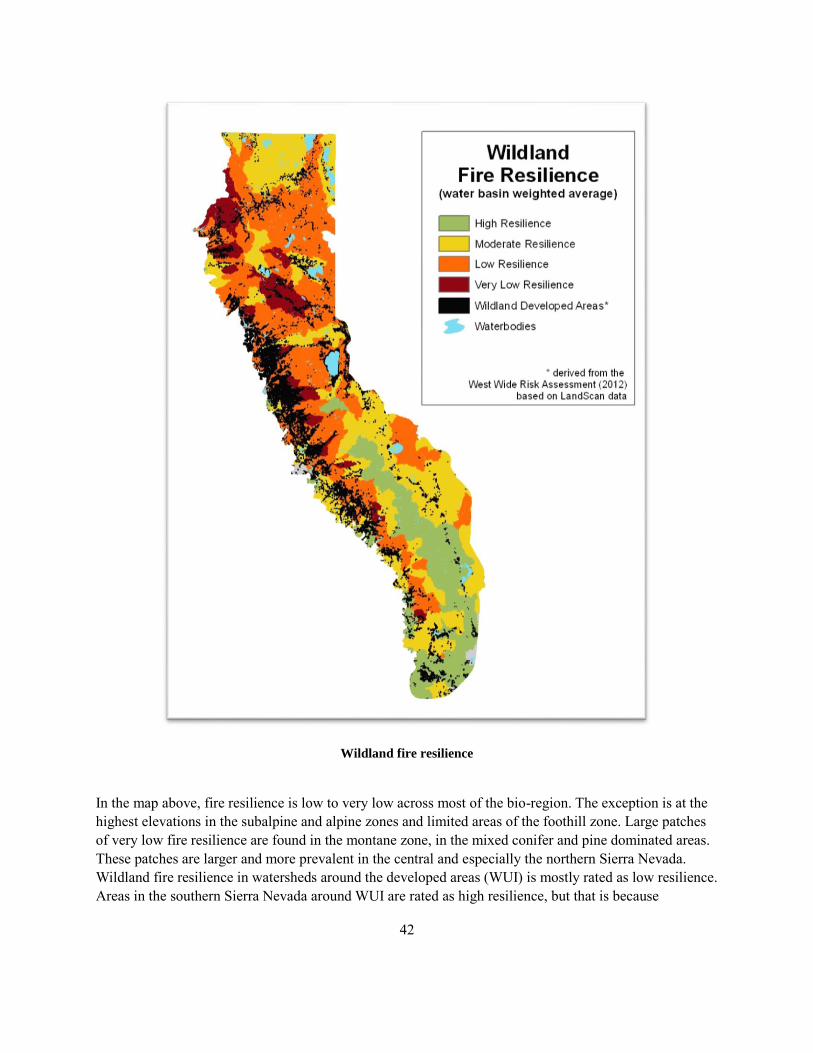
42
Wildland fire resilience
In the map above, fire resilience is low to very low across most of the bio-region. The exception is at the
highest elevations in the subalpine and alpine zones and limited areas of the foothill zone. Large patches
of very low fire resilience are found in the montane zone, in the mixed conifer and pine dominated areas.
These patches are larger and more prevalent in the central and especially the northern Sierra Nevada.
Wildland fire resilience in watersheds around the developed areas (WUI) is mostly rated as low resilience.
Areas in the southern Sierra Nevada around WUI are rated as high resilience, but that is because
43
ecologically, the dominant vegetation type, chaparral is resilient ecologically. The native vegetation is
adapted to high intensity fire. These maps do not mean that the vegetation in the WUI is a low hazard for
fire suppression.
Since 1991, over 340,000 acres have been treated by the Forest Service in the WUI in the bio-region
(Efird and Wheatley 2004, 2005, 2006, Flebbe 2007, 2008, 2009, 2010, 2011). Further, the Forest Service
has contributed millions of dollars toward Fire Safe Council grants, administered by the independent
California Fire Safe Council. A comprehensive assessment of fire hazard and risk within and among
developed areas in the WUI is not possible at this time, because multiple land ownerships occur and there
is not a combined database of WUI treatments (Sapsis personal communication 2013). Extensive fuel
hazard reduction treatments around structures and along evacuation routes have been completed by
CalFire, the Bureau of Land Management, the National Park Service, the Natural Resource Conservation
Service, many Fire Safe Councils and other organizations, communities and private landowners. One of
the most pressing needs identified in the Cohesive Strategy (2013) is to develop a common, spatial
database of WUI treatments to accurately track fire hazard and risk conditions.
Trends in fire resilience depend on changes in vegetation and fuels across large landscape areas because
the scale of fires during severe fire conditions is large. The Forest Service has two monitoring programs
to track changes in vegetation from fire. One is the Fire Severity Monitoring Program (Miller and Safford
2012). The other includes vegetation management treatments entered into the national database Forest
Service Activity Tracking System (FACTS). In progress is a systematic process for taking these results
and translating them into changes in fuels that can then be used to predict changes in fire behavior and
fire resilience (Bowden personal communication 2013). This system will be transparent, and use the
National Fire Plan tool, LANDFIRE. This tool will be prototyped for the three southern Sierra Nevada
early adopter forest assessments (Sierra, Sequoia, and Inyo) and then applied to the bio-region.
Effects of Landscape Fire Resilience on Communities
Current conditions have led to more funding needed to manage fuels and suppress fire. Forest Service
spending from 2006 through 2012 in the bio-region has increased mostly as a result of increases for
wildland fire management (USFS 2012b). Fire suppression costs are also skyrocketing (Calkin et al.
2005). At the national level, these increases are seriously jeopardizing the agency’s ability to fund its
natural resource mission (USFS 2008). A recent fire in the bio-region, the Angora Fire in South Lake
Tahoe, cost $160,000,000 alone and was one of the ten costliest fires in U.S. history (Safford et al. 2009).
According to Winter et al. (2013), institutional, political, and social constraints influence management
decisions and need to be accounted for and examined in models, tools, and applications, especially with
managing wildland fires for resource management objectives. District rangers and forest supervisors have
cited the lack of agency support in their decisions on managed wildfires, as well as air quality regulations,
as reasons to continue full fire suppression. Rangers also referred to public concern, including the impacts
of lingering smoke, risks of damage to habitats, and risk of fire escapes to communities as having
influenced their decisions. However, Yosemite and Sequoia and Kings Canyon National Parks have long
managed wildfires to restore fire to the ecosystem. More recently, the Sequoia, Stanislaus, and Eldorado
National Forests have begun to strategically manage wildfires for resource benefits.
44
Education about the ecological role of fire may result in people being more accepting of fire, and the
smoke and the risks that come with it. Many people's concern for fire and smoke may stem from a belief
that wildfire only has negative outcomes, when, with proper management, fire also has extremely
beneficial outcomes. It may also take time and experience with successful outcomes for people to
become comfortable with managing to increase the amount of fire on the landscape.
Any major reduction in fire suppression and fuel loading, as well as restoring the role fire plays on the
landscape, is heavily dependent on increased local, regional, and national political support (Winter et al.
2013a). In addition, increased prescribed burning will disproportionately affect residents and tourism-
related businesses in order to provide benefits for the greater public good and reduce negative impacts to
future generations (Winter et al. 2013a).
Fire and the Benefits People Obtain from Ecosystem Services
As discussed above, wildfire in the bio-region is increasing in severity and these uncharacteristic fires
have the potential to disrupt the underlying ecological processes that provide ecosystem services.
Ecosystem services are the valuable outputs of healthy ecosystems, and are critical to the wellbeing of
people. The bio-region provides an array of these services that are enjoyed directly by individuals and
communities like water, wood products, energy, and recreational opportunities. There are also many vital
services that provide benefits that are less apparent in our daily life, but are important for the support they
offer the ecosystem, such as water filtration, carbon sequestration and biodiversity.
Important landscapes that provide the resources that produce these key ecosystem services are found
throughout the bio-region (Metcalfe et al. 2013). Uncharacteristic fires threaten these landscapes and any
resulting interruption or loss of these services has a cost to everyone. As a result, the Forest Service’s
restoration based-management direction includes, “commitment to a renewed focus on the sustainable
delivery of ecosystem services” (USFS 2013 p .1). In addition to fire, disturbances from impacts to
ecological integrity also threaten the benefits obtained by people from ecosystem services in the bio-
region. More details on these threats to ecological integrity are included under the Ecological Integrity
theme.
To get a sense of the extent wildfire threatens the many important ecosystem services provided by our
forests in the bio-region, the landscapes that provide these services were examined as to their risk for
uncharacteristic fire that would be detrimental to these services. It is clear that a high percentage of
ecosystem services are under a threat from uncharacteristic fire (Metcalfe et al. 2013). Specifically:
99 percent of the important timber-producing land in the bio-region is at risk for uncharacteristic
fire;
90 percent of the important carbon sequestration land in the bio-region is at risk for
uncharacteristic fire ;
74 percent of the land with the most valuable assets for protecting water quality is at risk for
uncharacteristic fire;
45
87 percent of the land with the most valuable assets for supporting water supply is at risk for
uncharacteristic fire;
89 percent of the Forest Service recreation facilities in the bio-region are at risk for
uncharacteristic fire;
91 percent of the locations in the bio-region that provide habitat for important ethno-botanical
species for cultural heritage uses are at risk for uncharacteristic fire;
62 percent of the land important to providing terrestrial biodiversity in the bio-region is at risk for
uncharacteristic fire;
86 percent of the land important to providing aquatic biodiversity in the bio-region is at risk for
uncharacteristic fire;
83 percent of the land with high potential for providing solar energy, 46 percent of the land with
high potential for wind energy and 97 percent of the land with high potential for geothermal
energy are at risk for uncharacteristic fire; and
45 percent of existing hydroelectric facilities and 23 percent of the acres in existing electricity
transmission corridors are at risk for uncharacteristic fire.
The fact that such a large extent of the bio-region’s important ecosystem service landscape is at risk
suggests that under current conditions, the future trend will be for increased loss and more interruptions in
the benefits that these services provide (Metcalfe et al. 2013). Contributing to this potential trend in
declining benefits is the fact that the cost of fire management (fuel reduction and fire preparedness) and
fire suppression have made up larger and larger portions of forest budgets in the bio-region. With limited
financial resources available for management, this increase in fire spending reduces the ability of forests
to address other management needs that also threaten the ecosystem and therefore the sustainability of
these ecosystem services (Gorte 2013). The management of these other threats to the ecosystem is
discussed in more detail under the Ecological Integrity theme.
Also important to note is the large geographical scale at which this potential interruption or loss of
benefits will affect people. Many services are thought of as benefiting locals or “on forest” users and
therefore it is perceived that any decrease in the benefits from ecosystem services will affect only those
people in close proximity to the forests. Examples of these more local services are recreational
opportunities for visitors and local employment from forest commodities such as timber and grazing and
through supporting forest recreation. However, the scale of the potentially lost benefits from ecosystem
services is much larger and has an effect on people located far from forest boundaries. When services
such as water supply, electricity, carbon sequestration and cultural resources are lost, people across the
state are affected even if they do not live near the forests or never plan to visit the forests. It is important
to communicate about these potentially lost benefits so people understand the important role forest
ecosystem services and forest management play in their daily life.
The cost of losing or interrupting ecosystem services is related to the value that these services provide.
The services that are easiest to characterize in terms of their value are the forest commodities bought and
46
sold in existing markets. Examples of these are water, timber, livestock and energy. However, the term
“value” is used here to represent something more inclusive than just a monetary or dollar value. It is also
used to capture the idea that benefits, even when they are not directly relatable to dollars spent or
received, still contribute to improving the quality of our lives. Examples of such value associated with
non-monetary benefits are ecosystem services such as cultural heritage, sense of place, aesthetics and
biodiversity. Even though there is no direct market where the benefits from these services can be bought
and sold, they all contribute to people’s wellbeing and therefore these benefits need to be considered in
forest management.
To get a sense of the magnitude of the benefits provided by the ecosystem services of the bio-region, the
1996 Sierra Nevada Ecosystem Project (SNEP) examined the value of some forest commodities and
services produced annually (Stewart 1996). This study estimated this annual value as approximately $2.2
billion – around $3.2 billion in today’s dollars – and this value does not include many of the non-
monetary types of benefits described above. In this estimate from SNEP, the value from water supply
alone accounts for more than 60 percent of this total and the benefits of this water are enjoyed across all
of California, thus showing the vast numbers of people from all around the state who rely on these
benefits on a daily basis and who would feel the cost associated with any interruption or loss of this
service. Forests provide us with tremendous value contributing greatly to people’s quality of life. The
threat of wildfire fire interrupting or reducing these services is an important management consideration
across the bio-region.
Other important commodity based ecosystem services in the bio-region at risk of fire are timber, grazing,
and energy. Timber and grazing provide value to people through the production of fiber and food, as well
as through job opportunities and by supporting the culture and way of life of rural forest communities.
The current and potential use of renewable energy generated from hydropower, biomass, geothermal and
solar and wind facilities on forest lands is another valuable commodity on these forest lands. This energy
potential has increasing value as the state looks to diversify its energy portfolio and also reduce carbon
emissions from energy generation (NREL 2005).
Outside of these commodities, the bio-region provides the setting for a large recreation and tourism
industry. The national forests in the bio-region provide immense value through a diversity of forested,
river and lake-based recreation settings, a vast spectrum of public and private recreation opportunities for
the summer and winter, and a variety of popular modes of recreation access (motorized, mechanized, non-
motorized and equestrian). These activities draw people from around the world and provide enjoyment as
well as benefit to local economies.
Major unplanned events like wildfire have the potential to interrupt and reduce the benefits of this
recreation. Scientific findings point to more impact from fire on the recreation visitor experience than
anticipated by managers; sometimes, health and safety issues are of sufficient concern to cause people to
change their travel plans (see citations in Winter et al. 2013a). Studies have found long term negative
effects of large wildfires on wilderness visitation. These studies have also reported variable effects of
forest fires on recreation and tourism associated with fire intensity and recreation use activity. Other
studies suggest a smaller more minimal impact of fires on the overall experience of recreationists and
tourists (Winter et al. 2013). Whatever the magnitude of the effect on visitors that may result from fire, it
is important to recognize that decreasing visitation not only reduces the benefits obtained by these
47
visitors, but also reduces the benefits available to the local economies that cater to these visitors (Lin and
Metcalfe 2013).
Cultural heritage and sense of place are also important ecosystem services that provide value to a wide
selection of people. The Sierra Nevada bio-region has a rich history and culture that has always been
deeply connected to the land and its natural resources. This began with Native American settlement in
10,000 years ago, through the gold rush, which brought tens of thousands of people into the Sierra
Nevada area. Mining activity also led to significant timber harvesting, ranching, and farming and was
followed by a growing number of exurban migrants who wanted a refuge from urban life and were
attracted to the natural beauty and cultural history of the area. All of these uses have value in terms of the
defined cultures in the bio-region, as well as the identity provided to individuals and communities. The
threat of fire places this value at risk (Lin and Metcalfe 2013).
Other key ecosystem services provided by forests in the bio-region are carbon sequestration and
biodiversity, which are also vulnerable to uncharacteristic fire. Sequestering carbon is an important
attribute of forest ecosystems and provides a great benefit globally by reducing atmospheric greenhouse
gases. Biodiversity provides value to people as it allows for protection of the species necessary to provide
the services of recreation, agriculture, fisheries and forest products. It also provides benefits through the
value placed on an ethical obligation to protect other species from extinction, religious and cultural values
associated with cherishing the earth and its inhabitants, and the desire to leave for future generations that
which we are able to enjoy (EPA 1999).
Overall, increased fire resilience of our forests reduces the potential for disruptions and the benefits from
the services above and also benefits local communities directly through reductions in severe wildfire that
can threaten life and property. Therefore, increasing the fire resilience of forest landscapes in the bio-
region is an ecosystem service in and of itself that benefits communities. The role of resilient and fire
adapted communities in forest management are discussed in more detail in the next section.
Resilient and Adaptive Communities in the Face of Fire
Wildfires have a variety of impacts on individuals, families, neighborhoods, social groups, and
communities (McCool 2007, Winter et al. 2013a). These fires can lead to death, increased personal stress,
problems with health from smoke, psychological and emotional impacts, increased community tension
and conflict, destruction of property, interruption to businesses, and decreased opportunities for recreation
in the area (California Department of Forestry and Fire Protection 2010). The costs associated with these
impacts to communities are above and beyond any Forest Service fire suppression costs, and have been
estimated to be far larger in magnitude when including both monetary losses (e.g. destroyed property and
disruption to local businesses) and non-monetary losses (e.g. changes to social conditions and overall
quality of life in the affected communities) (Zybach et al. 2009). Forest Service strategies can directly
influence the magnitude of these impacts by determining how fires can best be managed and how the
agency can work with communities to best prepare for, recover from, and understand wildfires.
Resilient communities are able to cope with, adapt to, persist and develop in the face of change, and
innovate and transform into new, more desirable configurations in response to disturbances and the costs
associated with wildfires (Folke 2006, Long et al. 2013b). Such resiliency requires communities to be
48
fire-adaptive in that they are made up of informed and prepared citizens, collaboratively planning and
taking action to safely co-exist with wildfire (WFLC 2013). However, rural communities across the
United States tend to be less resilient and more vulnerable to these types of disturbances than are urban
communities, and the people residing in the wildland urban interface (WUI) are particularly vulnerable to
fire (Jardine and Long 2013). Given the recent trends for increased development in the WUI of the bio-
region, the impact of fire on communities is an important management concern.
Development in the Wildland Urban Interface
Population growth and more demand for housing are resulting in increased development in the wildland
urban interface (WUI) across the state. In 2000, over 90 percent of homes in the Sierra Nevada and Sierra
Nevada foothills (as defined by Bailey’s ecoregions) were located in the WUI, and the WUI captured
virtually all of the net growth in housing units in this area from 2000-2006 (Hammer et al. 2007). In this
study, WUI housing units in the Sierra Nevada were largely characterized as “intermix”, meaning
structures are scattered throughout and overtopped by wildland vegetation. This recent growth and
settlement in the Sierra Nevada is influenced by amenity migration into the WUI and settlement of
seasonal and year-round residents who are drawn here by its unique features (Loeffler and Steinicke
2007). Amenity migration in the Sierra Nevada has also been characterized by people moving to higher
elevations, further expanding this WUI into previously undeveloped mountain areas (Loeffler and
Steinicke 2006, as cited in Winter et al. 2013b). In addition, California’s senior population, which is the
largest in California’s history, is another social factor influencing growth in the WUI. This population is
expected to continue to grow and settle in the bio-region’s foothill and rural counties (Roberts et al. 2009,
as cited in Winter et al. 2013b). As a result, more population in these areas means a greater risk to
communities and a greater potential for impacts from fire.
The condition of fuels in our forests also contributes to increased potential for community impacts from
fire. The Sierra Nevada has been subject to fire suppression for over a century, resulting in ecological and
human safety problems (Heckmann et al. 2008). Following 100 years of putting out fires in the bio-
region, vegetation and fuels have become denser and more continuous. As a result, fires have become
more difficult to suppress. This combination of increasing forest fuels, along with increased development
in the WU, has resulted in increases in both the frequency and intensity of wildfires with the potential to
impact communities (Rahn 2009). In fact, a concentration of California’s highest priority landscapes –
defined as having a high wildfire threat together with human infrastructure assets – is located within the
Sierra Nevada (California Department of Forestry and Fire Protection 2010).
Smoke and Communities
Smoke from wildfires is particularly contentious for communities. This impact is exacerbated by trends
of more people, more homes, and more recreational uses in the bio-region. Wildfires result in lower air
quality and can impact human health as intense, large, and long-lasting wildfires are likely to result in air
quality that exceeds set standards (Bytnerowicz et.al. 2013). While fire and associated smoke have always
had a consistent presence in the bio-region and are key ecosystem components, the levels and patterns of
smoke, and the resulting effects on people have changed. Prior to the 19th century, when fires were
49
burning extensively across much of the lower and mid-elevation areas annually, smoke emissions were
substantial (Stephens et al. 2007, Bytnerowicz et al. 2013).
A long history of fire suppressions has encouraged residents and visitors to the Sierra Nevada to
expect exceptional visibility and smoke-free conditions during the summer and fall. This may not
be a realistic expectation for the area, especially under a changing climate projected to increase the
likelihood of large, severe wildfires (e.g. Westerling et al 2006) (Bytnerowicz et al. 2013).
Unmanaged wildfires cause the highest levels of smoke. This is a result of the extensive absence of fire
and accumulated fuel levels, as well as burning when temperatures are hottest and combustion is the
greatest.
Managed fires, and prescribed fires, where the smoke is managed, produce emissions, although these
emissions are at generally lower levels than unmanaged wildfires, and these practices may reduce overall
emissions in the long run. A study of the western states found that large-scale prescribed fire could
reduce long term carbon emissions in the western U.S. by about 20 percent (Wiedinmyer and Hurteau
2010). The discussion around this tradeoff can be contentious and difficult for local air quality boards to
grapple with. In the bio-region, this situation occurs in the southern Sierra Nevada in the San Joaquin Air
Basin. The San Joaquin Valley Unified Air Pollution Control Board, Sequoia National Forest, and Sequoia
and Kings Canyon National Parks dealt with it through a great deal of communication with one another.
Joint meetings were held to discuss the benefits of reduced emissions from unmanaged wildfires and
ecosystem health, and the short term impacts. One outcome was that remote, 24-hour live video cameras
were installed to provide real-time condition tracking by the Air Pollution Control Board. This successful
effort has enabled the Sequoia National Forest to restore managed fire to substantial areas on the Kern
Plateau.
Importance of Collaboration
Two key findings in recent major reports emphasize the critical role of collaboration – the importance of
an all lands approach to effectively address fire in the wildland urban interface (WUI) - and the necessity
that communities and agencies at all levels work together in all phases of planning (WFLC 2013, Toman
et al. 2013, ERI 2013). With the migration of more urban and suburban Californians to communities in
the bio-region, more people are exposing themselves and their families to the danger of wildfire. Many
newer residents in fire risk areas are unfamiliar with the safety problems associated with building in these
locations (Sierra Business Council 1997). In particular, people tend to underestimate the risk of living in
high fire risk areas and landowners are not typically liable for failure to take risk reduction actions on
private property (Yoder and Blatner 2004). However, community involvement in wildfire planning is
extensive in California (California Department of Forestry and Fire Protection 2010) and is a critical
component of developing fire adaptive communities (WFLC 2013). Examples of this community
involvement include (Charnley et al. 2013):
Fire Safe Councils (FSCs) where The Forest Service plays an active role supporting and engaging
with the FSCs in their activities, and provides funding. FSCs help Californians mobilize to
protect their homes, communities, and surrounding lands from wildfire;
50
Fire Learning Networks foster collaboration across organizations and administrative boundaries
to develop landscape-scale restoration plans for fire-prone ecosystems;
Conservation learning networks promote education by spreading best practices and identifying
barriers and solutions;
Community Wildfire Protection Plans not only help communities address fire risk locally, but also
help people create social networks, enhance learning, and build community capacity.
As discussed in Charnley et al. (2013), the Forest Service can play a role in all of these types of activities,
providing data and expertise, and helping stakeholders form the necessary networks. They also describe
how collaboration between managers, researchers, and tribal practitioners can be the vehicle for
evaluating cultural resources that support community health and livelihoods. Tribal communities in the
Sierra Nevada present distinctive opportunities for mutually beneficial partnerships to restore ecologically
and culturally significant resources and to promote resilience.
Tribal Concerns and Fire Management
Modern towns and cities now exist in the places where tribal communities once stood. Traditional tribal
practices not only protected those communities, but provided for the communities at large. Traditional
practices such as burning were passed on from generation to generation because tribes knew that small
fires prevented large catastrophic ones. Also managing the timing of these fires was a consideration as
fires that started in the late summer were known to trigger salmon runs. This was an effect of inversion
layers of smoke settling in on river canyons and cooling the water through shading the sun’s rays. The
cooler water would be felt by the salmon downstream and would initiate their move upstream. In some
places, this activity eventually became ceremony and continued for thousands of years. Today’s practice
of suppressing fires has had an impact on these types of ceremonial traditions, and may have ecological
and economic impacts on salmon species and subsistence and commercial fisheries as well.
There are several plants that have cultural significance to tribes, and special ecological value in providing
habitat or playing key ecological roles dependent on fire and smoke. One example in the Sierra Nevada is
California black oak, which is an important food source for Native Americans, and is recognized as a key
species to manage for wildlife habitat (Lake and Long 2013). Fire can be targeted at specific locations to
enhance willows in riparian areas, acorns, and feeding locations for wild game, as well as to reduce insect
infestations that damage traditional food sources or species gathered for traditional purposes (Goodwin
2013). Many ecosystems in the Sierra Nevada are not self-maintaining islands. Resource management
by Native Americans in the bio-region was long term and widespread, producing ecological and
evolutionary consequences in the biota (Anderson and Moratto 1996). The concept of managing areas as
wilderness is controversial with the tribes as well as with the public (Goodwin 2013). The intent of
maintaining these areas in their “pristine” condition can be felt by tribes as not considering traditional
ecological knowledge and associated tribal practices. The increased risk of catastrophic fires in the Sierra
Nevada is thought to be one of symptoms resulting from the departure of Native Americans from
managing these ecosystems (Anderson and Moratto 1996). With the expected increase in
51
uncharacteristically large fires, as well as impacts from climate change, tribes may end up needing to
establish new sacred sites or ceremonial areas in the future (Goodwin 2013).
Forest Restoration and the Role of Rural Communities
Sound restoration work to retain and restore ecological resilience in the face of wildfire is being done
throughout the bio-region. However, important indicators suggest that impacts from disturbances are
currently outpacing the benefits of this work. Specifically, wildfires in the bio-region are becoming
larger, more frequent and of greater severity, and these fires threaten communities and the health of
resources in the forests that support human wellbeing (e.g. wood, fiber and water as well as biodiversity,
scenic landscapes and wildlife habitat). To counter this trend and ensure the sustainability of the benefits
these resources provide, forest management will need to significantly increase the pace and scale of
restoration in order to remove the conditions driving these increases in fire (USFS 2013).
Current policy for national forest management calls for approaches that accomplish ecological restoration
goals, while simultaneously producing forest products that can benefit local communities (USDA 2010,
USFS 2007 as cited in Charnley and Long 2013). Ecological restoration as a policy in the bio-region can
contribute to reducing current trends in fire while simultaneously contributing to the sustainability of local
community wellbeing. Specifically, restoration projects that support the local wood product economy
also provide the opportunity to support local residents in rural areas who rely on the forest for their
livelihoods. For example, a study has estimated 13-29 jobs are created or retained and over $2.1 million in
total economic activity is generated for every $1 million invested on restoration (Moseley and Nielsen-
Pincus 2009). In addition, rural communities in the wildland urban interface (WUI) are economically
connected with key forest sectors as they rely on activity in timber, mining, grazing and recreation. A
reduction in uncharacteristic wildfire as a result of restoration reduces the potential for damage to the
resources on which these forest sectors are dependent. Therefore, restoration reduces the potential for
disruption on the livelihood for many of the residents in these communities (Zybach et al. 2009).
Not only is restoration a potential benefit to these rural communities, but economically healthy local
communities are also a benefit to the success of Forest Service restoration goals. Given the desire to
increase the pace and scale of restoration, maintaining a robust local workforce and local infrastructure is
necessary to support the logistics and economics of restoration (Charnley and Long 2013, Charnley et al.
in press). This is because the revenue that can be generated through stable local markets for timber and
non-timber biomass from restoration activities can help offset the costs of Forest Service restoration
goals. In addition, the further the haul distance from the harvest site to the processing facility, the higher
the transportation costs and less economical the timber sale. Therefore, maintaining local wood
processing infrastructure in the bio-region is an important strategy for maintaining favorable economics to
accomplish ecological restoration goals while sustaining jobs in the local wood products industry
(Charnley and Long 2013, Charnley et al. in press).
However, changes in the timber economy have resulted in drastic reductions in the local timber
infrastructure and the labor force that supports this industry. Timber harvest in the bio-region has
declined since the early 1990s. The declines are a result of protection of old growth forests, protection of
threatened and endangered species, restrictions on harvesting in unroaded areas, and timber sale appeals
and litigation. At the same time, state regulations resulted in similar decreases in timber harvests from
52
state and private lands (Morgan et.al. 2004 and 2012). The volume of timber harvested from Sierra
Nevada national forests was 1.29 billion board feet in 1988, and 183.8 million board feet in 2010, 86
percent lower than it was in 1988 (Charnley and Long 2013). Timber harvest on private land in California
has followed a similar trend, decreasing over this same time period. Some of the downturn in logging on
private lands is related to the downturn in the economy that has resulted in reduced housing starts and an
overall decreased in the demand for lumber. As the economy improves, there is anticipation of a potential
increase in the demand for timber from private lands and also possibly from state and federal sources as
well (Rykoff 2013).
This reduction has contributed to the number of sawmill closures that have occurred in California
between 1988 and 2006 (Morgan et al. 2012). Between the late 1980s and 2000, California milling
capacity dropped by almost 60 percent and facility closures since 2000 have continued this trend. As of
2006, there remained 12 sawmills, two medium-density fiberboard and particleboard mills, and no veneer
mills in counties within the Sierra Nevada synthesis area. Current and expected economic conditions are
difficult for these facilities and a continued decline in the number of mills in the bio-region would not be
surprising (Morgan et al. 2012, Charnley and Long 2013).
A longer term view of the California wood products industry seems to indicate that infrastructure is
capable of providing an effective link between the supply of available logs and societal demands for wood
products. While the number of operating manufacturing facilities has sharply declined in the face of
significant decreases in home construction, improved economic conditions are likely to at least stabilize,
if not increase their number. These future timber harvests throughout the bio-region are dependent on
multiple factors. One factor is the demand for wood products, which fluctuates in response to both
regional and international economic conditions. Others are the pace of new home construction and future
decisions on restoration. These factors make identifying these trends difficult (Sherlock 2013).
Non-timber biomass is also generated during forest restoration. This biomass can be used to generate
electricity for the people of California. Biomass energy is promising as it is renewable. Like timber, the
revenue from biomass can help offset restoration costs and contribute to the economies of local
communities. Currently, California has more biomass power plants than any other state and this capacity
has been growing (Mayhead and Tittmann 2012, Morgan et al. 2004). Even so, biomass currently only
accounts for around two percent of the state’s total electricity generation. There are also economic
challenges facing future development of biomass power plants. Existing contracts make these plants
unprofitable, and there is restricted ability of new plants to attract investment capital given the uncertainty
of biomass supply (Mayhead and Tittmann 2012). As a result, there is uncertainty surrounding the
development of biomass energy and its ultimate growth potential in the bio-region (Charnley and Long
2013).
Without stability in the local wood products industries and without more stable local markets for timber
and biomass, the ability of the Forest Service to achieve an increase in the pace and scale of restoration on
this landscape will be limited. This is because the potential revenues generated from these products are
lost, and fewer acres can be treated as transportation costs increase. As a result, the opportunity to offset
some of the cost of restoration is lost. This is a critical factor in the current federal government budget
environment. Therefore, forest actions to support these industries that can be undertaken in conjunction
53
with other management objectives will aid progress on restoration and will also contribute to development
and jobs in local communities (Charnley and Long 2013, Charnley et al. in press).
2004 Sierra Nevada Framework
Goals for fire and fuels management are intended to reduce threats to communities and wildlife habitat
from large, severe wildfires and to reintroduce fire into fire-adapted ecosystems. They include:
managing hazardous fuels in and around communities;
strategically placing treatment areas across landscapes to interrupt potential fire spread; fuel
treatments such as thinning and brush removal are designed to reduce the amount of burnable material
over 25-30 percent of the land base;
removing sufficient material in treatment areas to cause a fire to burn at lower intensities and slower
rates of spread compared to untreated areas, and
considering cost-efficiency in designing treatments to maximize the number of acres that can be
treated under a limited budget.
Fire and fuels management is integrated with the strategy for conserving old forest ecosystems. Direction
is included to guide managers in placing and designing effective area treatments while incorporating
needs for retaining key habitat elements for sensitive species. The direction was designed to protect old
forest species and to perpetuate old forest ecosystems, while addressing the need to intervene in the forest
to reduce the fuel loads feeding catastrophic fires.
The basic strategy also includes other management objectives such as reducing stand density for forest
health, restoring and maintaining ecosystem structure and composition, and restoring ecosystems after
severe wildfires and other large catastrophic disturbance events.
Site-specific fuels treatment prescriptions are designed to modify fire intensity and spread in treated areas.
Managers consider topographic position, slope steepness, predominant wind direction, and the amount
and arrangement of surface, ladder, and crown fuels in developing fuels treatment prescriptions for each
treatment area. Fuels treatments are intended to reduce surface, ladder, and crown fuels. Crown fuels are
modified to reduce the potential for spread of crown fire. Consideration should be given to the frequency
of entries to the site that will be needed to achieve desired reductions in fuels condition class. Expanded
use of mechanical treatments can be used to set the stage for prescribed fire as a follow-up treatment, or to
deal with those specific situations when there are concerns about smoke or available burn days.
The integrated strategy emphasizes ecosystem restoration following catastrophic disturbance events,
allows for salvage of dead and dying trees for both economic value and fuels reduction purposes, and
incorporates fuels and vegetation management standards and guidelines. Over a period of time, land
managers can gradually restore fire to the ecosystem in its more natural form.
Appropriate tribal governments and tribal communities will be consulted regarding fire protection and
fuels management activities that potentially affect ranches, reservations, and other occupied areas. Fire
protection plans will be developed for such areas in consultation with appropriate tribal or intertribal
organizations. The direction is to coordinate with tribes and appropriate tribal organizations regarding

54
training, outreach, and other items of mutual interest in order to support tribal and national forest fire
programs.
The standards and guidelines call for mitigation of impacts from fuels and vegetation management to
protect spotted owl and Northern goshawk nest sites, and fisher and marten dens.
The Forest Service must meet all regulations put forth by the air districts. Smoke from both wildland and
prescribed fires affect the air quality in in the Sierra Nevada bio-region. These effects are short term,
meaning that smoke from fires can be severe but limited to when fires are burning. Smoke often impacts
more than a single basin when present and can be transported great distances from its source. California’s
Code of Regulations, Title 17 Sub-chapter 2 Smoke Management Guidelines for Agricultural and
Prescribed Burning, sets out smoke management requirements. The requirements set forth by the state are
then implemented by air districts. Coordination between the Forest Service and air districts are required
for prescribed burning permission. Local air districts have established regulations to minimize smoke
impacts from prescribed fires (5CARB).
55
SUSTAINABLE RECREATION
What Are We Trying To Sustain at the Bio-Regional Level?
1. Culture and lifestyle
2. Connections to the land
3. Economic opportunities for communities
The Forest Service is working toward a new model for recreation as laid out in the 2010 strategy
“Connecting People with America’s Great Outdoors: A Framework for Sustainable Recreation.” The
agency’s vision for sustainable recreation is "renewing body and spirit, inspiring passion for the land."
Through this new framework, the Forest Service aims to:
provide a diverse range of quality natural and cultural resource based recreation opportunities in
partnership with people and communities;
protect the natural, cultural, and scenic environment for present and future generations to enjoy;
partner with public and private recreation benefit providers; and
perform and plan by implementing systems and processes to ensure effective decisions and
investments, collaborative approaches, and enhanced professionalism.
The framework includes ten focus areas that the Forest Service Pacific Southwest Region is in the process
of implementing. These focus areas describe actions that will help us achieve sustainable recreation
programs on national forests by 2019.
Sustainable recreation is a relatively recent concept for the Forest Service, and the 2012 Planning Rule
was the first time that the concept was introduced in regulation related to the agency. Forest plans of the
future will more fully embrace the sustainable recreation concepts within this framework. The focus areas
will be used during the forest plan revision process to provide key programmatic questions triggering
need for change. At the bio-regional scale, a broad look is taken at the condition and trend of major
components of sustainable recreation organized under the concepts of sustaining culture and lifestyle,
connections to the land, and economic opportunities for current and future generations.
Culture and Lifestyle
Outdoor recreation has had a long history in the Sierra Nevada and is a distinct part of the culture and
lifestyle in the region (Sierra Nevada Conservancy 2011a). Eighty-four percent of Californians polled in
the most recent Comprehensive Outdoor Recreation Plan (CORP) statewide survey said outdoor
recreation was an “important” or “very important” contributor to their quality of life (Roberts et al. 2009).
Californians: seek relaxation, socialization and natural values from their outdoor recreation pursuits; they
pursue a wide range of outdoor activities; they want more amenities when they engage in outdoor
recreation; they have a variety of outdoor recreation styles and participation patterns; and outdoor
recreation and nature-based tourism are important elements of California’s tourism portfolio (Roberts et
56
al. 2009). The importance of outdoor recreation along with the recognition and promotion of associated
benefits continues to increase in California (California Department of Parks and Recreation 2009) and the
country as a whole (Council on Environmental Quality et al.2011).
National forests are part of an expansive network of local, state, and federal parks, forests, trails, and open
space systems in the state (Roberts et al. 2009). According to National Visitor User Monitoring (NVUM)
data collected between 2005 and 2009, annual visitation to the ten national forests in the bio-region was
estimated at about 19 million people. In terms of visit duration, the Sequoia, Inyo, and Sierra National
Forests account for 45 percent of all recreation visitor days on National Forest System (NFS) lands in the
Sierra Nevada (USFS 2012c). Together with the adjacent national parks, this portion of the Sierra Nevada
probably has one of the highest recreation activity levels in the world (USFS 2012c).
National Visitor Use Monitoring (NVUM) data are used throughout this document and provide the most
relevant, reliable and accurate data available on visitation to the bio-region’s national forests. NVUM data
are collected using a random sampling method that yields statistically valid results at the forest level. As a
rule, NVUM results are unbiased; however, results for any single year or season may under or over-
represent some groups of visitors. Unusual weather patterns, major fire closures, or unanticipated pulses
or lapses in visitation are not incorporated into the sampling framework.
By the year 2050, California’s 2010 population of approximately 37 million people is expected to increase
37 percent to over 51 million people (California Department of Finance 2012). The important role that
recreation continues to play in the lives of Californians, together with a growing population, is expected
to result in an increasing demand for recreation opportunities from national forests in the bio-region into
the future. Nationally, participation in nature-based outdoor recreation is on the rise (Cordell 2012).
The increasing demand for recreation opportunities will be a challenge for the agency in the future. The
Forest Service is committed to supporting a wide range of recreation opportunities, as well as other
services and benefits provided by National Forest System (NFS) lands. However, these ecosystem
services and benefits have limits, impact each other, and require tradeoffs. The Forest Service continues to
manage national forests for multiple uses and benefits, working with communities to find balance
between uses given ecological constraints, external drivers and stressors, policies and laws, and agency
resource limitations. The agency continues to work partners as a way to help address the increasing
demand for recreation opportunities.
The significant role that recreation plays in the Sierra Nevada’s identity needs to be considered along with other
aspects of this identity, particularly the local culture and values of communities within the bio-region that go
beyond outdoor recreation. Maintaining the rural character of the region is important to many local residents,
who take pride in their history and the lasting presence of that history in the region’s small towns (Sierra
Business Council 1997). Recreation and tourism greatly contributed to growth and development in the bio-
region, bringing new economic opportunities to many communities that were formerly timber dependent
(Charnley 2013). As people moved from urban areas to Sierra Nevada forests for their amenities and improved
quality of life, they brought new values and differences in recreation engagement, compared to residents who
have had a longer history in the area (Winter et al. 2013b). While net migration into counties entirely within the
Sierra Nevada, as defined by the Sierra Nevada Conservancy, declined between 2001 and 2009 (Sierra Nevada
Conservancy 2011b), “protecting scenery, outdoor recreation opportunities, and environmental quality will
57
likely continue to encourage amenity migration” (Cordell as cited in Winter et al. 2013b, p.5). Positive
outcomes of amenity migration are reliant on local adaptive capacity to manage change in both social and
physical attributes of community (Winter et al. 2013b).
Potential impacts of recreation to local tribal cultures need to be taken into account as well. Tensions are
growing among American Indians and those using and managing the outdoor recreation resources of the west
(McAvoy 2002). The agency is required by law to administer the National Forest System for outdoor recreation,
among other uses including range, timber, water, wildlife and fish. Untold numbers of Native American sacred
sites and traditional places are located on these same lands, and tribal practices are tied to these resources.
Economic and recreational drivers are important in land management decision-making, but sacred site concerns
are equally important. American Indians are part of the Old and the New West. They have historic,
contemporary and symbolic links with the landscapes of the west, including the landscapes in and near the
major recreation, park and tourism resources of the west. Increasing user visits or directing recreational or user
traffic toward sacred sites or traditional cultural properties may have an adverse effect on the location, as well as
the religious, ceremonial or cultural activity of the tribes (Goodwin 2013). There is still a lack of understanding
by visitors and managers toward Native American values and traditions, as well as a lack of understanding of
treaty rights that give Native Americans unique use rights on NFS lands (McAvoy et al. 2004). The agency
continues to work on developing stronger relationships with tribal communities.
Recreating in Sierra Nevada national forests is highly valued by communities both inside and outside the bio-
region. Based on 2005-2009 NVUM data, about 36.2 percent of visitors to a forest in the bio-region travelled
100 miles or less, 16.4 percent travelled 101-200 miles, 24.3 percent travelled 201-500 miles, and 23 percent
travelled 500 miles or more.
As shown in the map below, the largest percentage of 2005-2009 NVUM survey respondents who visited a
national forest in the bio-region came from Washoe County in Nevada (7.2 percent), which includes the Reno
metropolitan area, as well as the northeast portion of Lake Tahoe. Los Angeles County provided the second
highest percentage (5.6 percent). Together, the nine counties in the San Francisco Bay Area accounted for a
large proportion of respondents (17.3 percent). A relatively large percentage of respondents also came from
Fresno County, Sacramento County, and the central Sierra counties. Eight percent of respondents came from
states other than California or Nevada. Two percent of respondents were foreign visitors, mostly from Europe.
The role that the bio-region’s national forests play in the lives of people living in urban areas and the Central
Valley is likely to increase. Increasing urbanization in California (California Department of Parks and
Recreation 2009) and across the country in general (USFS 2012f) may result in a growing number of visitors
originating from urban areas, trying to escape the stresses of city living and also choosing closer, more
affordable locations for their vacations (California Department of Parks and Recreation 2009). This trend may
also result in an increase in recreation activities associated with urban visitors, including backcountry activities
and snow skiing (USFS 2012f). California’s Central Valley population is expected to see major growth, but
contains only 4 percent of the state’s protected lands (California Department of Parks and Recreation 2009). As
a result, California State Parks has identified this region as an underserved region for parks, recreation facilities,
programs, and services (California Department of Parks and Recreation 2009). Growing populations in the
Central Valley may look to Sierra Nevada national forests to meet their outdoor recreation needs.
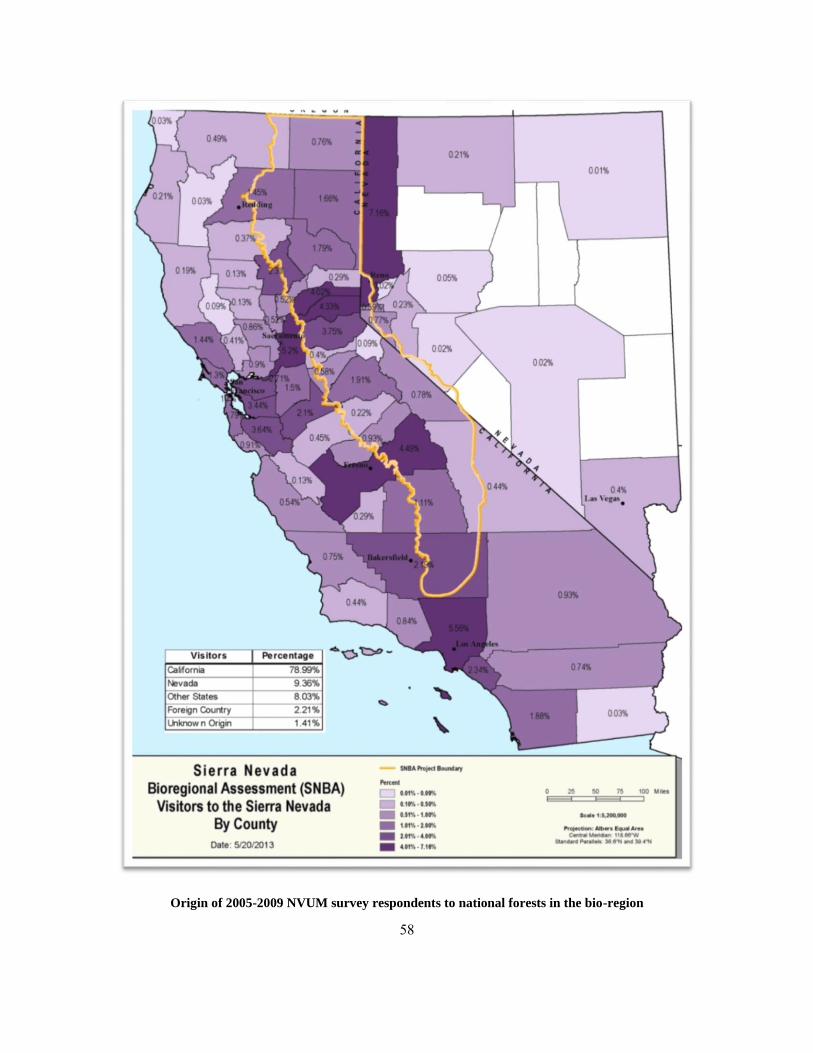
58
Origin of 2005-2009 NVUM survey respondents to national forests in the bio-region
59
According to Roberts et al. (2009):
No demographic trend is of greater importance to national forest managers and leaders than the
immense growth of cultural diversity. California is home to more than one-third of the entire U.S.
Asian American population and about 30 percent of all U.S. Latinos and Native Hawaiians or
Pacific Islanders.
Increases in culturally diverse populations will likely be reflected in recreation in the Sierra Nevada
forests (Winter et al. 2013b). Roberts et al. (2009) provide insight into the outdoor recreation styles and
participation patterns of Latinos and Asian Americans, the two groups whose growth is expected to have
the most influence in the future. They have found that at federal sites, California’s Latino population:
prefer to recreate in large groups at forested sites with amenities that support day-long activities; are
interested in experiences with a strong social component; are looking for stress relief and a good family
experience; and enjoy picnicking, day hiking, camping, and family gatherings. Based on studies of Asian
Americans in the San Francisco Bay area, they found that Asian Americans: enjoy going to the park or
beach, walking/hiking on trails, picnicking, and driving for pleasure; and are looking for beautiful
scenery, to interact closely with nature, and for opportunities to be with family. In general, Roberts et al.
(2009) found that public open spaces offer a place for many immigrants to recreate and relax, help
maintain cultural traditions, and connect with other immigrants for mutual support and information
sharing.
However, as described in Roberts et al. (2009)
More than 45 years of research continues to show that people from culturally diverse backgrounds
are not using the national forests and other public lands in numbers representative of the
populations within the market areas. Not all people feel comfortable and safe, have access,
maintain strong and positive ties, or have knowledge about these natural areas and what to do on
them.
Language may be a barrier for some groups. Forty-three percent of Californians speak a language other
than English, and 20 percent speak English less than “very well” (Headwaters Economics 2012a). The
national 2010 Resources Planning Act Assessment (USFS 2012f) found that people are more likely to
participate in most types of recreation activities if they are male, non-Hispanic White, young to middle-
aged, college educated, and earn a higher level of income. According to 2005-2009 NVUM data, 84
percent of visitors to national forests in the bio-region were White, and eight percent of visitors were
Hispanic or Latino (of any race). While the local Sierra Nevada population is less racially and ethnically
diverse than the rest of the state (Sierra Nevada Conservancy 2011b), many visitors to the bio-region’s
national forests are not local, as shown in the map above. In the counties that contribute to the bio-region,
which include Central Valley cities outside of the bio-region such as Fresno and Bakersfield, just over 70
percent of the population is White and 32 percent is Hispanic or Latino. In California, just over 60 percent
of the population is White and 37 percent is Hispanic or Latino (Headwaters Economics 2012a).
According to Winter et al. (2013b, p.7), “services offered through existing communication and
information approaches and more direct opportunities, such as those represented in recreation and
60
tourism, might be a poor fit to these populations that are increasing in the region and surrounding areas.”
Through programs like the Central California Consortium, the Forest Service continues to look for ways
to engage with youth and underserved communities on natural resource issues, and to encourage them to
use public lands. In addition, the report “Serving Culturally Diverse Visitors to Forests in California: A
Resource Guide” by Roberts et al. (2009) is the first of its kind in the Forest Service and has a multitude
of ideas and materials for use and implementation by managers as well as staff who work in the field. The
Forest Service also continues to work with internal and external scientists to better understand ethnically
diverse groups and their relationship to National Forest System lands.
Connections to the Land
Most Americans have come to know their national forests and grasslands by participating in recreation
activities (USFS 2010a). Outdoor recreation provides the opportunity to unplug from our busy lives,
recharge our souls and live healthier lifestyles (Outdoor Industry Association et al. 2012). Connection to
the natural environment plays an important role in contributing to community attachment and wellbeing,
especially in communities where public lands dominate the landscape (Brehm et al. 2004). Positive and
meaningful outdoor recreation experiences offer an important way for people to develop connections to
natural spaces and a foundation for stewardship that further protects the physical environment and
contributes to community resilience (Winter et al. 2013a). National forests in the bio-region foster these
connections by managing for recreation settings, opportunities, and access, and scenic character.
Recreation Settings
Recreation settings are the social, managerial, and physical attributes of a place that, when combined,
provide a distinct set of recreation opportunities. The Forest Service uses the Recreation Opportunity
Spectrum (ROS) to define recreation settings and categorize them into six distinct classes: primitive,
semi-primitive non-motorized, semi-primitive motorized, roaded natural, rural, and urban (36 CFR
219.19). These six classes are described below. The ROS system was originally developed to support the
planning direction under the 1982 planning rule. Final forest plans will have an accompanying ROS layer
that emerges from the integrated planning process, spatially depicting broad sustainable recreation
outcomes.
15 percent primitive: Opportunity for isolation from human-made sights, sounds, and management
controls in an unmodified natural environment. Only facilities essential for resource protection are
available. A high degree of challenge and risk are present. Visitors use outdoor skills and have
minimal contact with other users or groups. Motorized use is prohibited.
11 percent semi-primitive non-motorized: Some opportunity for isolation from human-made sights,
sounds, and management controls in a predominantly unmodified environment. Opportunity to have a
high degree of interaction with the natural environment, a moderate degree of challenge and risk, and
to use outdoor skills. Concentration of visitors is low, but evidence of users is often present. On-site
managerial controls are subtle. Facilities are provided for resource protection and the safety of users.
Motorized use is prohibited.
7 percent semi-primitive motorized: Some opportunity for isolation from human-made sights,
sounds, and management controls in a predominantly unmodified environment. Opportunity to have a
61
high degree of interaction with the natural environment, a moderate degree of challenge and risk, and
to use outdoor skills. Concentration of visitors is low, but evidence of other area users is present. On-
site managerial controls are subtle. Facilities are provided for resource protection and the safety of
users. Motorized use is permitted.
60 percent roaded natural: Mostly equal opportunities to affiliate with other groups or be isolated
from sights and sounds of humans. The landscape is generally natural with modifications moderately
evident. Concentration of users is low to moderate, but facilities for group activities may be present.
Challenge and risk opportunities are generally not important in this class. Opportunities for both
motorized and non-motorized activities are present. Construction standards and facility design
incorporate conventional motorized uses.
6 percent rural: Characterized by a substantially modified natural environment. Opportunities to
affiliate with others are prevalent. The convenience of recreation sites and opportunities are more
important than a natural landscape or setting. Sights and sounds of humans are readily evident, and
the concentration of users is often moderate to high. Developed sites, roads, and trails are designed
for moderate to high uses.
Less than 1 percent urban: Characterized by a substantially urbanized environment, although the
background may have natural-appealing elements. High levels of human activity and concentrated
development, including recreation opportunities are prevalent. Developed sites, roads and other
recreation opportunities are designed for high use.
Recreation Facility Analysis
Starting in 2007, Recreation Facility Analyses (RFAs) were conducted nation-wide to address growing
concern about the agency’s ability to maintain recreation sites to meet the needs of the public. The goal
was to align management of recreation sites and facilities with the forest’s niche and economic capability.
Since 2007, national forest recreation programs throughout the country have been guided by program
niche statements and complementary niche settings developed through the RFA process. Niche statements
and taglines broadly define the scope of a national forest’s recreation program and highlight those aspects
that are distinctive. The ten national forests in the bio-region have the following recreation niche taglines:
Modoc Open Spaces – Historic Places
Lassen Your Crossroads to Discovery
Plumas It's All about Water and Room to Breathe
Tahoe The Challenge of the Sierras
Eldorado Golden Nugget of the Sierra - Discover and Enjoy
Lake Tahoe Basin Jewel of the Sierra
Stanislaus Destination Central Sierra
Sierra The Heart of the Real Sierra
Sequoia Giant Sequoia and Whitewater
Inyo Inspiring Destinations
Niche settings represent broad geographic areas that provide a contiguous backdrop for particular
opportunities and activities. People recognize and often have personal and emotional connections to these
places on the landscape. There are approximately 66 types of niche settings that have been identified
62
among the ten national forests in the bio-region, which will be further considered in forest level
assessments. Some examples of niche settings include scenic routes, river corridors, wildlands, developed
destinations, lakes recreation, backcountry, and high country. The character of these niche settings ranges
from areas with little human intervention to areas with high concentrations of human activities.
The ROS classes described above are considered a finer-scale subdivision of these broad niche settings,
with each niche setting having a mix of ROS classes. However, niche settings from the RFA process have
not yet been integrated with the ROS classification system.
Recreation Opportunities
A recreation opportunity is an opportunity to participate in a specific recreation activity in a particular
recreation setting to enjoy desired recreation experiences and other benefits that accrue. Recreation
opportunities include non-motorized, motorized, developed, and dispersed recreation on land, water, and
in the air (36 CFR 219.19).
Each national forest aims to provide a set of outdoor recreation activities consistent with the forest niche
and the ROS class in which the activities are located. The opportunities may be provided by the Forest
Service directly, or under a special use permit.
According to 2005-2009 NVUM data, the most popular activity in the bio-region is viewing natural
features. This is followed by downhill skiing, hiking/walking, relaxing, and viewing wildlife. So far,
2010-2014 NVUM data, which do not yet include results for the Sierra, Stanislaus, and Eldorado National
Forests, indicate that these activities are likely going to remain the five most popular activities, though not
necessarily in the same order.
Visitor satisfaction from 2005-2009 NVUM data provides some sense of people’s ability to connect to the
land through the quality of their experiences. The majority of visitors to the bio-region’s national forests
were satisfied with the elements most important to them for undeveloped areas, day-use developed sites
and overnight-use developed sites. Some areas where visitors expressed dissatisfaction were signs in
overnight-use developed sites, crowding in all three categories, lack of parking and condition of parking
in day-use developed sites, and restroom cleanliness in day-use developed sites and undeveloped areas.
With the wide range of recreation styles and interests that continue to change, it is no surprise that
recreation user conflicts sometimes occur. A stable public land base, a declining private natural land base,
and increasing numbers of outdoor recreation enthusiasts may result in increased user conflicts and
declines in the quality and number of available recreation acres per person, especially on public lands
near large and growing population centers (USFS 2012f). In addition, stressors like climate change may
exacerbate competition among uses. For example, climate change will continue to impact water flow and
timing in the Sierra Nevada, affecting the availability of water-based recreation activities and tourism
(Winter et al. 2013a). In California, activities like off-highway vehicle recreation, mountain biking,
boating and adventure recreation have increased dramatically in recent years. At the same time,
population growth, urbanization, and alternative energy production compete for suitable lands (California
Department of Forestry and Fire Protection 2010). The California Department of Parks and Recreation
(2002) emphasizes the importance of good trail design, construction, and maintenance in accommodating
63
higher numbers and multiple uses, while also recognizing that because of the state’s finite resources,
increased sharing of resources will be necessary, inevitably creating some friction among diverse user
groups. National forests in the bio-region continue to struggle to meet public demand for recreation,
carrying an inventory of recreation opportunities beyond the capability to maintain them. At the same
time, reducing or limiting access to recreation on public lands by closing roads, campgrounds, RV
parking, and trails can negatively impact surrounding communities (Hurniston 2010).
The specific mix of outdoor recreation activities and their level of popularity with the public will continue
to change over time, influencing forest lands and management decisions (Cordell 2012). This is especially
true in California, where shifting demographics are expected to change recreation demands on National
Forest System (NFS) lands and may impact visitor satisfaction. The prominence of Latino and Asian
values and vision is expected to increase as these two cultural groups increase in size and influence
(Roberts et al. 2009). For example, research indicates that many ethnically diverse groups prefer more
developed sites that have picnic tables, grills, trash cans, and flush toilets (Roberts et al. 2009).
Wildfire and forest pests threaten large acreages of landscapes in the Sierra Nevada that have recreation
value (California Department of Forestry and Fire Protection 2010). Scientific findings seem to point to
more impact from fire on the recreation visitor experience than anticipated by managers (see Bricker et al.
2008, as cited in Winter et al. 2013c). Winter et al. (2013c) describe how some studies found long term
effects of visitation (Englin et al. 2008), while others found minimal impact on visitor experience (Thapa
et al. 2008, Winter and Knap 2008). Variable effects were also found depending on fire intensity and
recreation activity (Loomis et al. 2001). Safety and health concerns, when great enough, were found to
cause people to change travel plans (Thapa et al. 2008, Winter and Knap 2008).
NVUM visitor satisfaction data provide useful information about people who are already using the forest.
It does not, however, provide insight into those people who do not use national forests and their level of
connectedness with nature. Current forest management may unintentionally create barriers to use and
enjoyment (e.g. language and lack of information) by the growing population of ethnic minorities in
California and the country as a whole (Roberts et al. 2009). Americans, especially those who live in urban
areas, are becoming more disconnected from the outdoors, weakening the commitment to stewardship of
our shared natural legacy (Council on Environmental Quality et al. 2011). Children today spend less than
half as much time outside as their parents did, and are “plugged in” to electronic devices for more than
seven hours a day (Council on Environmental Quality et al. 2011). An emotional affinity toward nature is
linked to the willingness of people to protect the environment, and positive emotional experiences with
nature play an important role in developing that affinity, especially if they share those experiences with
significant others (Müller et al. 2009). In addition, a positive connection to nature develops earlier in life
and remains a stable trait throughout adulthood (Berk 2006). Comparing Round 2 (2005-2009) and Round
3 (2010-2014) NVUM data for the seven bio-regional forests where data collection is complete shows
that visitation by people 19 years of age and under has decreased from 20.3 percent to 17.7 percent.
Special uses are commercial and non-commercial uses of NFS lands that are not already authorized by
current regulations. They are authorized by permit, which are generally not required for non-commercial
recreation uses. Special uses are a critical part of the Forest Service’s recreation program, supporting the
current level of facilities and programs that are currently available to the public on NFS lands. A majority
64
of the commercial recreation special uses represent public and private partnerships. These recreation
opportunities are made possible largely through private investment in facilities and infrastructure.
The Forest Service Pacific Southwest Region administers the largest special uses program of all Forest
Service regions. There are over 15,000 special uses authorized, 8,000 of which are recreation-related.
Over half of all these recreation special uses are located in the Sierra Nevada bio-region. The types of
recreation special uses provided in this bio-region include a diverse range of opportunities both winter
and summer. By far, recreation residences account for the greatest number of special use permits.
Recreation residences are private cabins for non-commercial use. Many of these cabins are historical and
have passed through generations of families for their use and enjoyment. The second most common
permit in the bio-region is outfitting and guiding. Over 300 permits are currently issued for outfitting and
guiding, although the actual number varies year to year. Outfitters and guides provide recreational
opportunities and services to meet the needs of people who lack the skills, knowledge, equipment, or
abilities related to a specific outdoor recreation pursuit. Outfitters assist the agency and the public by
promoting responsible use, conservation, and stewardship of forest lands, including designated
wilderness. Outfitting and guiding activities include, but are not limited to mountain climbing, hunting,
educational courses, river trips, shuttle services, skiing, jeep tours, fishing, and hiking. These services
may be conducted by both for-profit and non-profit entities.
Because recreation experiences are often provided by commercial service providers, their supply and
delivery is subject to the variation and demand of the market and the economy. The Forest Service strives
to help these service providers be successful by requiring sound business plans and determinations of
financial and technical ability during permit issuance and as needed. Although the relative amount and
type of recreation special uses provided is partly based on demand, it is also a function of the agency’s
need for these services and the ability to provide them in the context of administrative capacity, as well as
the social and resource capacity on the ground. The condition of special use facilities varies depending on
the type, location, and capacity of the entity operating and maintaining the site. The number of forest
visitors who participate in recreation special use activities varies considerably by type of use and location.
Population growth and increasing demand for outdoor recreation opportunities, together with declining
federal budgets and agency efforts to partner with recreation providers, are expected to result in
increasing use of special use permits to deliver recreation services to the public.
Recreation Access
National forests in the bio-region provide summer and winter access for outdoor-based recreation
opportunities and popular destinations through a system of roads and trails. Modes of access include non-
motorized, motorized, mechanized, and equestrian.
According to 2011 data, there are over 9,700 miles of NFS trails in the bio-region, about 60 percent of the
total on the national forests in California. About four percent of trails in the bio-region are minimally
developed, 32 percent are moderately developed, 50 percent are developed, 12 percent are highly or fully
developed, and two percent are not specified. Twenty-five percent of trails are in wilderness areas. NFS
trails are managed and maintained to provide a high-quality recreation experience while protecting natural
resources. Trails are one of the most valued resources on national forests and critical to providing a
65
diversity of recreational access and opportunities to our visitors. However, decreasing federal budgets and
increasing recreation demand is expected to challenge trail management and maintenance in the future.
The distribution and availability of the trail system on each forest changes dramatically when snow covers
the landscape. Within the bio-region, many of the trails open in the spring, summer and fall are not
available during the winter months. During the winter, many miles of snow-covered road transition and
are available as groomed or ungroomed snow trails. There are approximately 1,700 miles of snow trails
available for Nordic activities, including cross-country skiing and snowmobiling. All of the national
forests within the bio-region have snow trails. In addition, there are approximately 34 winter trail heads
available for access to non-motorized and motorized winter recreation activities. Of these, 18 serve a dual
role as a “sno-park”. Sno-parks are administered by California State Parks Off-Highway Motor Vehicle
Recreation (OHMVR) Division in conjunction with the Forest Service and the California Department of
Transportation. This collaboration provides sites in the Sierra Nevada where visitors have access to
plowed winter parking and for snow play, cross-country skiing, snowmobiling and other Nordic activities.
Motorized and non-motorized trail recreation opportunities in and near the bio-region are also offered
through the California Department of Parks and Recreation, Bureau of Land Management, Bureau of
Reclamation, and the county parks.
Each forest in the bio-region has made a motorized travel management decision to implement the
provisions of the 2005 Travel Management Rule (36 CFR 212, Subpart B). These decisions prohibit
motor vehicle travel off designated National Forest Transportation System (NFTS) roads and motorized
trails by the public except as allowed by permit or other authorization (excluding snowmobile use). The
forests added unauthorized routes to the NFTS, made changes to existing NFTS roads including season of
use and vehicle class changes, and identified road openings and closures. This effort was needed to help
prohibit cross-country travel by motor vehicles and stem the tide of natural resource degradation to
improve the ecological health of the forests.
However, managing and maintaining the NFTS to agency standard remains a challenge. As a result of
population growth, increasing recreation demand, shifting priorities, declining budgets, and staffing
issues, a large percentage of the NFTS is at risk of falling into disrepair in the future (Juarez et al. 2013).
The agency currently relies heavily on partners to help keep trails maintained, and the role of partners
may expand in the future given these trends. Between 2004 and 2009, the agency received $38.5 million
from the California State Parks Off-Highway Motor Recreation Division’s Grant Program for trail and
facility maintenance, conservation, law enforcement, restoration, planning, and route inventory and
designation activities (OHMVR 2011).
During the next phase of travel management (36 CFR 212, Subpart A), each forest will complete a travel
analysis process for system roads. The resulting recommendations will bring the forest closer to defining
needed versus unneeded roads, with the goal of establishing the recommended minimum road system.
Since Subpart A does not result in a decision, it is not subject to NEPA regulation.
Scenic Character
The places people go to recreate on national forest lands have important social meaning that relate to or
depend on scenery (Mattson and Mosier 2012). People form varied and complex relationships with
66
specific places that often hold emotional, symbolic, and spiritual meanings (Kruger et al. 2008). As
described in Winter et al. (2013b), attachment to place can be deeply connected to a person’s sense of self
or a group identity, which can lead to management actions being viewed as personal attacks or
discrimination against certain groups. Native Americans have a deep sense of place meaning and
attachment to areas in national forests that have been traditionally used by their people, and gathering and
recreation activities continue to tie them to these special places (McAvoy et al. 2004).
Though differences vary across regions and cultures, people who visit national forests tend to have a
mutually shared expectation regarding the scenery (USFS 1995). A combination of physical, biological,
and cultural images gives an area its positive scenic identity and contributes to sense of place (Juarez et
al. 2013). Scenic integrity measures the degree to which a landscape is free from visible disturbances that
detract from the natural or socially valued appearance, including any visible disturbances due to human
activities or extreme natural events outside of the historic range of variability. Based on existing visual
condition surveys from forest plan environmental impact statements dated 1988-1992, 81 percent of
recreation settings were estimated to have a high scenic integrity level, meaning no disturbance or
unnoticed disturbance. Fourteen percent of recreation settings had minor disturbances visible, and five
percent had more severe disturbances. This provides some sense of scenery conditions across forests in
the bio-region and their ability to contribute to the important relationships that individuals and
communities have with places on forests, and to attract newcomers as well. People also make connections
to particular places for reasons unrelated to scenery.
While scenery may appear visibly undisturbed, the sustainability of scenic attributes over the long term is
dependent on ecological integrity (Mattson and Mosier 2012). However, no estimates are available at the
bio-regional scale to gauge the ecological sustainability of valued scenic character attributes, known as
“scenic stability”. Overall, the foothill, montane, and to a lesser degree upper montane landscapes are
outside the natural range of variability in most locations (Safford et al. 2013). Vegetation is more uniform
and dense, there are more young trees than old, and fires occur in larger high severity patches. Dense
stands are less resilient to large, high severity fire and insect and pathogen outbreaks, making these
landscapes more susceptible to dramatic changes in a short period of time with long recovery periods. As
population growth and urbanization continue, particularly along the Sierra Nevada foothills, demand for
energy and communication infrastructure is expected to increase, which could result in a loss of scenery
in the bio-region, and impacts to recreation experiences and sense of place (Juarez et al. 2013).
Conservation Education and Interpretive Services
Forest Service conservation education and interpretive services programs are important vehicles for
connecting people to and educating them about their national forests. Because of the shift that has
occurred in the country from a mostly rural society to a mostly urban society, the conservation education
program has shifted its focus over the years (Juarez et al. 2013). The conservation education program
emphasizes and is expected to continue to emphasize programs for minority youth and families living in
urban communities and connecting them to nature and our national forests. The interpretive services
program objective is to create intellectual and emotional connections between people and their natural and
cultural heritage, thereby instilling respect and appreciation for America’s public lands and fostering their
protection and stewardship (Juarez et al. 2013). The interpretive services program is a key provider of
67
interpretive products, such as media and presentations to aid understanding and appreciation of natural
and cultural resources and land management issues. The interpretive services program enhances the
public’s recreational experience, fosters commitment to wise use and conservation of the resources, and
develops informed participation in public land management. The operating hours and overall number of
visitor centers on the national forests in California have decreased. Both the conservation education and
interpretive service programs are working more with partners to help deliver programs.
Congressionally Designated Areas
One way that Congress has provided long term protection of unique recreational experiences, among a
host of other social, economic, and ecological values, is through the designation of areas that have
specific management requirements. The Pacific Crest National Scenic Trail, designated wild and scenic
rivers, and designated wilderness are three such areas that play a significant role in contributing to
recreation across the Sierra Nevada bio-region. The information below comes from Boston et al. 2013.
The Pacific Crest National Scenic Trail (PCT) is one of 11 national scenic trails and it is considered one
of the most remote long distance trails with over 46 percent of its path in designated wilderness.
Beginning in southern California at the Mexican border, the PCT travels a total distance of 2,650 miles
through California, Oregon, and Washington until reaching the Canadian border. First conceived in the
1930s, the trail traverses the highest elevations of the Sierra and Cascade mountain ranges and was
designed to include portions of the historic John Muir and Skyline Trails. When the PCT was established,
the nature and purpose was to provide high quality scenic, primitive hiking and horseback riding
opportunities and to conserve natural, historic, and cultural resources along the corridor. Since the PCT is
within two hours travel time from the metropolitan centers of San Diego, Sacramento, Portland, and
Seattle, there is a high demand for day and weekend use. Permits for travel more than 500 miles have
increased significantly in the last decade, the highest issued being 1,497 in 2012. Additional management
threats include wildland fire, scenic corridor impacts from renewable energy development, and motorized
trespass.
The National Wild and Scenic Rivers System (NWSRS) was created to preserve certain rivers with
outstanding natural, cultural, and recreational values in a free-flowing condition for the enjoyment of
present and future generations. Eight rivers designated as wild and scenic, totaling 345.4 river miles, are
within the Sierra Nevada bio-region. Each river is administered to protect and enhance the free flow,
water quality, and the specific outstandingly remarkable values that caused it to be designated.
Designation also provides guidance to effect a voluntary protection strategy for all lands in the river
corridor. Wild and scenic rivers allow existing uses of rivers to continue where they do not conflict with
river protection. River values are protected: 1) through the assessment of hydroelectric facilities or water
resource development projects within the designated reach; 2) through the protection and enhancement of
water quality and outstandingly remarkable values; and 3) through the promotion of economic
development, tourism, or recreational use, as appropriate. Based on current limited studies, indications are
that property values remain stable or increase on designated rivers. This is often tied to the protection and
enhancement of scenery, other aesthetic values and water quality. From 2012 reporting, of the eight rivers
in the bio-region only three meet statutory requirements. These are the Kern, Merced, and Tuolumne
Rivers. Five of the rivers in the bio-region, Cottonwood Creek, Owens River Headwaters, Feather, Kings

68
and North Fork American Rivers do not currently meet statutory requirements. For more details, see
Boston et al. 2013. A more detailed assessment of each river will occur in the forest level assessments.
There are 467 additional miles of recommended wild and scenic rivers in the bio-region.
In the Sierra Nevada bio-region there are approximately 4.7 million acres of designated wilderness.
Nearly half of the land base in the Sierra Nevada is designated wilderness. The majority (2,608,606 acres)
is managed by the Forest Service. Management of existing Forest Service wilderness areas is guided by a
combination of legislation, regulation, Forest Service policy (FSM 2320), and forest plan direction. Some
wilderness areas also have specific wilderness management plans or strategies. The Forest Service has
full management responsibility for 27 wilderness areas in the bio-region and shares responsibility for
three others.
There have been 12 bills passed by Congress designating lands in the Sierra Nevada as wilderness,
starting with the original bill in 1964 which initially designated over 600,000 acres. Subsequent bills
added acreage and the additions are shown in the graph below. The wilderness system has increased from
657,748 acres in 1964, to 2,670,234 acres after the most recent wilderness bill passed in 2009. These
lands are mostly in the high elevation ecological zones.
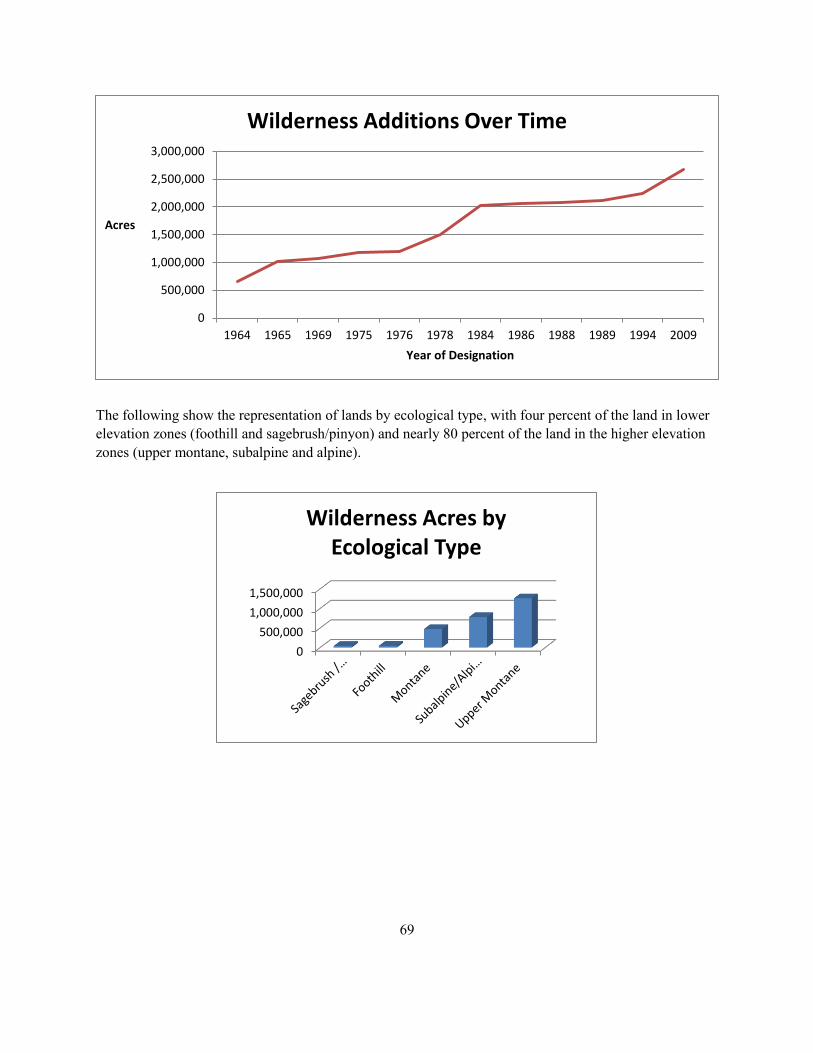
69
0
500,000
1,000,000
1,500,000
2,000,000
2,500,000
3,000,000
1964 1965 1969 1975 1976 1978 1984 1986 1988 1989 1994 2009
Acres
Year of Designation
Wilderness Additions Over Time
The following show the representation of lands by ecological type, with four percent of the land in lower
elevation zones (foothill and sagebrush/pinyon) and nearly 80 percent of the land in the higher elevation
zones (upper montane, subalpine and alpine).
0
500,000
1,000,000
1,500,000
Wilderness Acres by Ecological Type
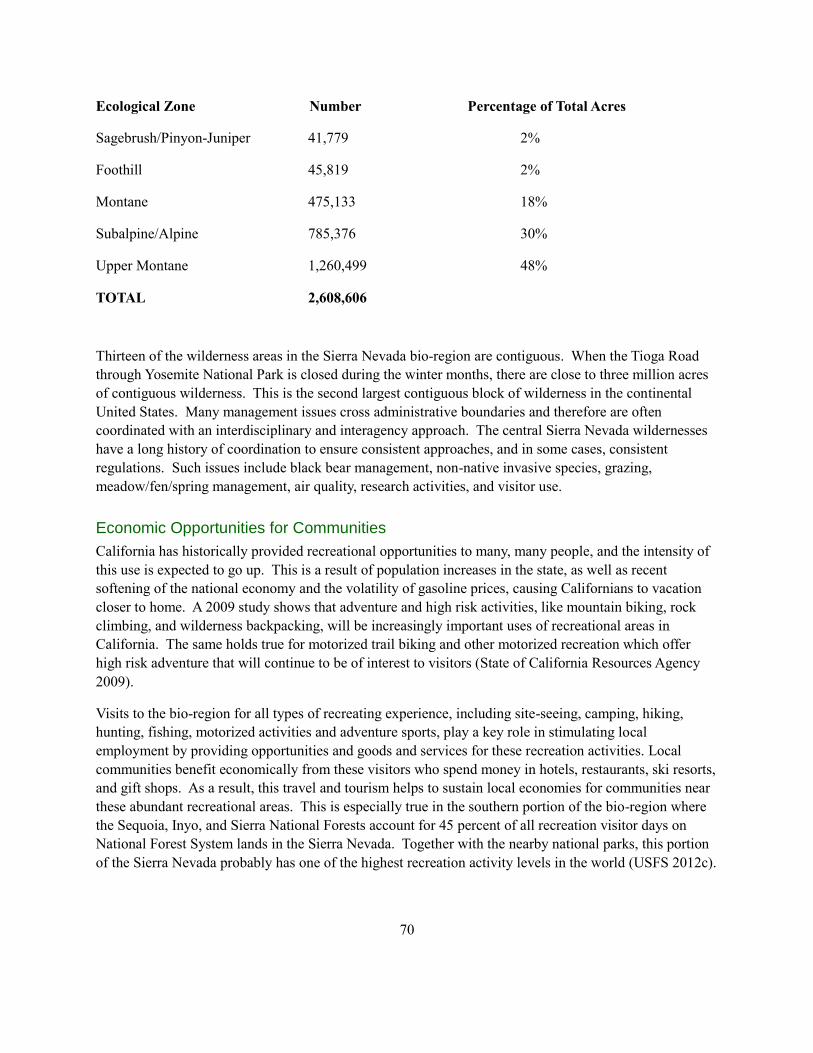
70
Ecological Zone Number Percentage of Total Acres
Sagebrush/Pinyon-Juniper 41,779 2%
Foothill 45,819 2%
Montane 475,133 18%
Subalpine/Alpine 785,376 30%
Upper Montane 1,260,499 48%
TOTAL 2,608,606
Thirteen of the wilderness areas in the Sierra Nevada bio-region are contiguous. When the Tioga Road
through Yosemite National Park is closed during the winter months, there are close to three million acres
of contiguous wilderness. This is the second largest contiguous block of wilderness in the continental
United States. Many management issues cross administrative boundaries and therefore are often
coordinated with an interdisciplinary and interagency approach. The central Sierra Nevada wildernesses
have a long history of coordination to ensure consistent approaches, and in some cases, consistent
regulations. Such issues include black bear management, non-native invasive species, grazing,
meadow/fen/spring management, air quality, research activities, and visitor use.
Economic Opportunities for Communities
California has historically provided recreational opportunities to many, many people, and the intensity of
this use is expected to go up. This is a result of population increases in the state, as well as recent
softening of the national economy and the volatility of gasoline prices, causing Californians to vacation
closer to home. A 2009 study shows that adventure and high risk activities, like mountain biking, rock
climbing, and wilderness backpacking, will be increasingly important uses of recreational areas in
California. The same holds true for motorized trail biking and other motorized recreation which offer
high risk adventure that will continue to be of interest to visitors (State of California Resources Agency
2009).
Visits to the bio-region for all types of recreating experience, including site-seeing, camping, hiking,
hunting, fishing, motorized activities and adventure sports, play a key role in stimulating local
employment by providing opportunities and goods and services for these recreation activities. Local
communities benefit economically from these visitors who spend money in hotels, restaurants, ski resorts,
and gift shops. As a result, this travel and tourism helps to sustain local economies for communities near
these abundant recreational areas. This is especially true in the southern portion of the bio-region where
the Sequoia, Inyo, and Sierra National Forests account for 45 percent of all recreation visitor days on
National Forest System lands in the Sierra Nevada. Together with the nearby national parks, this portion
of the Sierra Nevada probably has one of the highest recreation activity levels in the world (USFS 2012c).
71
Given the amount and variety of recreational opportunities in the bio-region, it is not surprising that jobs
in travel and tourism make up a high percentage of all employment in many communities and particularly
in the central and southern areas (Lin and Metcalfe 2013). A study estimating the percentage of total
county employment and earnings generated by visitor spending found that visitation is especially
important to economies in Mariposa County (where visitor spending accounts for 52 percent of all county
employment and 33.4 percent of all county earnings), Mono County (48.6 percent of employment and
32.2 percent of earnings), Inyo County (23.5 percent of employment and 11.5 percent of earnings), and
Sierra County (22.7 percent of employment and 13.0 percent of earnings) (Dean Runyan and Associates
2012). While recreational jobs provide an important source of earnings in some communities in the bio-
region, they are typically lower paying jobs than other traditional forest-based activities such as timber,
mining and agriculture. The 2011 average annual wage for travel and tourism industries was $17,892,
which is much lower than the bio-regional average wage of $42,776 (U.S. Department of Labor 2012).
Nonetheless, communities are economically dependent on the quantity and quality of national forest
recreational opportunities and opportunities on other public lands in the bio-region. More details on the
importance of all forest activities to the economies of local communities are found under the Community
Resilience theme.
In addition to the economic contribution of visitor spending to supporting jobs in these communities,
counties in the bio-region receive revenue from the sales tax collected on visitor spending, and this money
supports critical county services. This includes the sales tax collected on all of the spending on goods and
services while travelers are visiting an area, and it shows that visitors generate a large percentage of these
important local government revenues in Mariposa County (where visitor spending accounts for 61.4
percent of all sales tax revenue collected in the county), Mono County (57.9 percent), Alpine County
(33.3 percent), Sierra County (29.9 percent), Plumas County (24.9 percent) and Inyo County (20.8
percent) (Dean Runyan and Associates 2012). While national forests do contribute to travel and tourism
in the bio-region and therefore forest visitors can influence this revenue, there are other recreational
opportunities that drive this tourism, such as the national parks, and therefore all this revenue cannot only
be attributed to visitors to the national forests.
Demand is going up for the Forest Service and other land management agencies to provide more and
higher quality recreational opportunities in the bio-region. At the same time, Forest Service budgets are
decreasing and fewer resources are available to maintain and operate existing recreational facilities,
develop new opportunities or provide management of dispersed recreation. Any decrease in the quality of
the recreational experience in the bio-region, or an inability to meet the needs of visitors, could result in
them going elsewhere to recreate (Juarez et al. 2013). As discussed above, many local communities in the
bio-region are dependent on the visitation that results from recreational activities on the forests, and
therefore, a declining Forest Service budget to maintain the quality of existing facilities and to create the
new opportunities that visitors to the bio-region are looking for threatens the economy and therefore the
quality of life in these communities (Lin and Metcalfe 2013).
In 2006, the Forest Service undertook the Recreation Facility Analysis (RFA), to identify national forest
recreation site priorities and establish annual programs of work to reduce a mounting deferred
maintenance backlog that negatively affects the quality of the recreational experience. At the time, that
backlog stood at $49 million for national forests in the bio-region. During this same period, a small
infusion of funding through the American Recovery and Reinvestment Act of 2009 and fees collected
72
from the Land and Water Conservation Fund Act were used to do some recreation site improvement.
These projects largely focused on addressing visitor satisfaction comments from National Visitor Use
Monitoring (NVUM) surveys. Although there were improvements on specific sites, there was not enough
funding to substantially reduce the backlog (Juarez et al. 2013).
It is also important to note that visitor satisfaction and reliable, safe access to recreational opportunities
are dependent on a well maintained and functioning forest transportation infrastructure. Therefore, the
amount of deferred maintenance for the transportation infrastructure in the bio-region is another financial
consideration affecting the quantity and quality of recreational opportunities. For example, deferred
maintenance on roads is considerable on the Tahoe, Sierra and Inyo National Forests where there is an
estimated backlog of $129 million, $102 million and $29 million respectively (USFS-TNF 2009, USFS-
SNF 2009, USFS-INF 2009).
Communities that depend on visitor income to support their economy are also dependent on the Forest
Service maintaining a high quality of recreational experience so that people continue to visit. In the face
of declining federal budgets and the significant deferred maintenance backlog, there are new and different
opportunities for communities to partner with the agency to fund and maintain facilities and create new
recreational experiences. These include community-based stewardship, volunteerism and special uses.
Such partnerships can help to provide the types of recreational opportunities desired where current Forest
Service budgets alone would not be enough to develop the opportunities the public wants (Juarez et al.
2013).
Community-based stewardship and public land volunteerism is on the rise nationally. New organizations
and communication tools are helping to increase involvement from new and different groups. In addition,
amenity migration of retired people into foothill and mountain communities provides an opportunity to
expand the volunteer and partnership workforce. These volunteers are crucial because they get work done
on national forest projects that the agency lacks the resources to accomplish. The 2012 Volunteers and
Partners Accomplishment Report for the Pacific Southwest Region showed around 465,000 accumulated
volunteer hours overall, with approximately 70 percent of the hours within the recreation management
functional area. At $21.79 per hour, the appraised value for recreation management was estimated to be
more than $7 million, a significant contribution to the sustainability of recreation and tourism in the bio-
region. The Forest Service can find high-quality volunteer experiences for visitors to national forests and
achieve recreation management goals that may not be possible given budget limitations (Juarez et al.
2013, Winter 2013).
Special uses are another way that that the Forest Service may be able to meet increased demand for
recreational opportunities. There are about 900 possible types of special uses in the national forests, and
about 100 are related to recreation. Special uses within the bio-region provide recreation opportunities
and access to the National Forests to a variety of people. A majority of the commercial recreation special
uses in the bio-region represent public and private partnerships. These recreation opportunities are made
possible largely through private investment in facilities and infrastructure where agency appropriated
dollars would be insufficient to provide the desired level of service. However, because these opportunities
are provided by commercial service providers, their supply and delivery is subject to the variation and
demand of the market and the economy.
73
Special uses within the bio-region also support local economies, as visitors rely on these communities for
goods and services. This effect can be are significant as federal revenues to the treasury derived from
special uses in the region approach $20 million annually, and some of the uses within the bio-region serve
large numbers of visitors. For example, ski areas see anywhere from 60,000 to 1.1 million visitors each
year. Others, such as organizational camps, provide environmental learning and physical activities for
young people that are critical to establishing healthy lifestyles and habits.
Uncertainty associated with the economy, as well as environmental concerns surrounding the impacts of
special use activities limit the ability to forecast the extent expansion of special uses will alleviate issues
associated with Forest Service budget limitations (Juarez et al. 2013).
2004 Sierra Nevada Framework
Recreation management was not one of the key problem areas addressed in the 2004 Framework.
However, the decision reaffirms that providing recreation opportunities is one of the Forest Service's
major missions in California, along with providing sustainable, healthy ecosystems.
The introduction to the 2004 Framework discussed both wilderness and wild and scenic rivers. The 2004
Framework stated that wilderness is a unique and vital resource. It retains its primeval character and
influence, without permanent improvements or human habitation. Natural conditions are protected and
preserved. Fire is restored as a natural process through managing wildfires for resource management
objectives. The area generally appears to have been affected primarily by the forces of nature, with the
imprint of humanity’s work substantially unnoticeable. The Sierra Nevada offers outstanding
opportunities for solitude, or a primitive and unconfined type of recreation. Human influence does not
impede or interfere with natural succession in the ecosystems.
The outstandingly remarkable values for which wild and scenic rivers have been established, are
candidates for designation, or are under study, are protected and preserved for the benefit and enjoyment
of present and future generations. Free-flowing conditions of wild and scenic rivers, candidate or study
rivers, are preserved. Human influence may be evident, but does not interfere with, or impede the natural
succession of river ecosystems.
The standards and guidelines call for mitigation of impacts from recreation to protect spotted owl and
Northern goshawk nest sites, and fisher and marten dens.
Lands are classified into two types of sensitivity to air quality to protect human health and natural
resources. Class I lands have more stringent requirements for air quality. Class I lands are on wilderness
or national park lands over 5,000 acres in size. The other classification is for areas with air pollution
levels exceeding regulatory guidelines.
Since the 2004 Framework did not address recreation as one of the key problems, the decision had little
direction related to this theme and current direction exists in the forest plans. Original forest plans
include direction for recreation future conditions, management prescriptions and standard and guidelines.
Estimates of recreation levels are included and monitoring and evaluation requirements are spelled out.

74
These plans used the Recreation Opportunity Spectrum (ROS) to characterize recreation management;
and visual quality is measured using visual quality objectives (VQO’s). They addressed a full spectrum of
recreation from wilderness and wild and scenic rivers, to dispersed, non-motorized, dispersed motorized
and developed sites. The management prescriptions included direction on where certain recreational uses
were emphasized, and direction on where other uses are not allowed.
These original forest plans have not always been amended to be consistent with new information and
current policy direction. One example is that the Forest Service now measures visual quality with the
Scenery Management System (SMS) rather than the Visual Quality Objectives (VQO) system.
75
ECOLOGICAL INTEGRITY
What are we trying to sustain at the bio-regional level?
1. Biological diversity
2. Ecosystem resilience
3. Benefits to people
The Sierra Nevada bio-region contains a rich diversity of ecosystems. Fifty percent of California’s plant
species occur here, and 60 percent of California’s animal species live here. While it varies across
ecosystems in the Sierra Nevada, many landscapes, plants, animals, and fire patterns have been drastically
altered by human management over the last 150 years. In this section, the concepts of ecological
integrity, biodiversity, and ecosystem resilience are defined, and conditions and trends for the most
important components described. Throughout, the drivers and stressors, in particular climate change, fire,
and land use, are identified and their impact on ecological integrity described.
Ecosystems, or the living and non-living components of the living world and how they interact are central
to the concepts of ecological integrity, biodiversity, and ecosystem resilience. A pond is an example of an
ecosystem in simplified form, with insects, plants, frogs and fish as the living components, and water and
nutrients as the non-living components. Typically, ecosystems are separated into aquatic, (water-based),
terrestrial (land-based) and riparian ecosystems (which fall in the interface between land and water). The
ecological integrity discussion below is separated by these three main ecosystem types.
Ecological integrity is defined as the degree to which ecosystems are represented and functioning (Safford
et al. 2012). In more technical terms, the draft 2012 Planning Rule directives define it as:
The quality or condition of an ecosystem when its dominant ecological characteristics (for
example composition, structure, function, connectivity, and species composition and diversity)
occur within the natural range of variation and can withstand and recover from most perturbations
imposed by natural environmental dynamics or human influence.
Biodiversity, or the living component, is central to ecological integrity. Most simply, it is the diversity of
life. More formally, according to the US Congressional Biodiversity Act, HR1268 (1990):
Biological diversity means the full range of variety and variability within and among living
organisms and the ecological complexes in which they occur, and encompasses ecosystem or
community diversity, species diversity, and genetic diversity.
Characterizing biodiversity is like painting a landscape. “Broad-brush” or coarse-filter or fine-filter
approaches can be used. The types and distribution of species is fine-filter. Coarse-filter includes broad
landscape patterns of vegetation, habitat, carbon cycling, or fire processes.
Species of conservation concern are identified in the planning rule for individual forest plan revision. For
this assessment, initial evaluation of potential species was conducted but the final list will be selected by
the Regional Forester, during individual forest plan revisions. For this assessment, the California Natural
76
Diversity Database listed over 1,000 species that may occur within the bio-region. To characterize
coarse-filter habitat and connectivity components of ecological integrity, they included old forest
associated species, sagebrush habitat, and riparian and aquatic habitats. Other meadow associated species
are covered very generally.
Coarse-filter characteristics vary with ecosystem type, aquatic, riparian, and terrestrial. Habitat
connectivity is covered across all ecosystems. Natural range of variability in vegetation is characterized
for terrestrial and riparian ecosystems. Ecosystem sustainability is more likely if ecosystems are within
the bounds of natural variation (Wiens et al. 2012). The flow and regulation of water, fire and nutrients
(especially carbon) through ecosystems, are important characteristics called “ecosystem processes or
functions” are key to ecosystem services. The ability of an ecosystem to withstand changes in climate, or
fire or other natural or man-made drivers and stressors, and still maintain the range of biodiversity and
functions, is referred to as “ecosystem resilience”. The key drivers and stressors that affect all aspects of
biodiversity and ecological integrity are fire, climate, water development, land management, and human
population growth. The relative importance and effect of individual drivers and stressors depends on the
ecosystem and are discussed in the context of aquatic, terrestrial or riparian ecosystems.
For each ecosystem, several key ecosystem characteristics were selected based on criteria identified in the
draft directives: 1) they were measurable; 2) the information is readily available; and 3) they are
meaningful. For a complete description of the characteristics, what they indicate and additional
background on available information on them, see Chapter 1 of the Bio-Regional Living Assessment.
Aquatic Ecosystems
Aquatic ecosystems (in the water) and riparian based ecosystems (in the water-land interface) are closely
linked. Water moves between them. Animals move between them such as many insects or frogs. Riparian
plants are influenced by levels and timing of water in the aquatic ecosystems and aquatic ecosystems are
affected by shade from riparian plants and nutrients from the leaves that fall into water. These connections
make it difficult to separate out the ecological integrity of aquatic ecosystems and riparian ecosystems.
There are unique features of both that differentiate them.
There are three types of aquatic/riparian ecosystems: lakes or ponds, streams or rivers and seeps or
springs. Each one of these has water surrounded by vegetation that is dependent on water. With streams or
rivers, there is a further distinction with those surrounded by meadows and those surrounded by narrow
strips of shrubs, trees or non-meadow vegetation. Across the bio-region, there has been focused attention
on the ecological integrity of meadow/aquatic ecosystems. These ecosystems have been especially
impacted by historic management, including road locations and historic intensive grazing during the
1800s and early 1900s, often prior to becoming national forests. They are prized for their scenic value for
recreation, are used for current, more carefully managed grazing, and provide habitat for a large number
of species, including rare, threatened, and endangered animals and plants.
The figure below illustrates the linkages between ecological elements of riparian and aquatic ecosystems
in meadows of the Sierra Nevada bio-region. In the center of the figure, a picture of a wet meadow is
shown. The foreground has a dense carpet of lush, green sedges and scattered white wildflowers. The
background shows a low ridge with forest and a snow-covered mountain peak behind it. Surrounding this
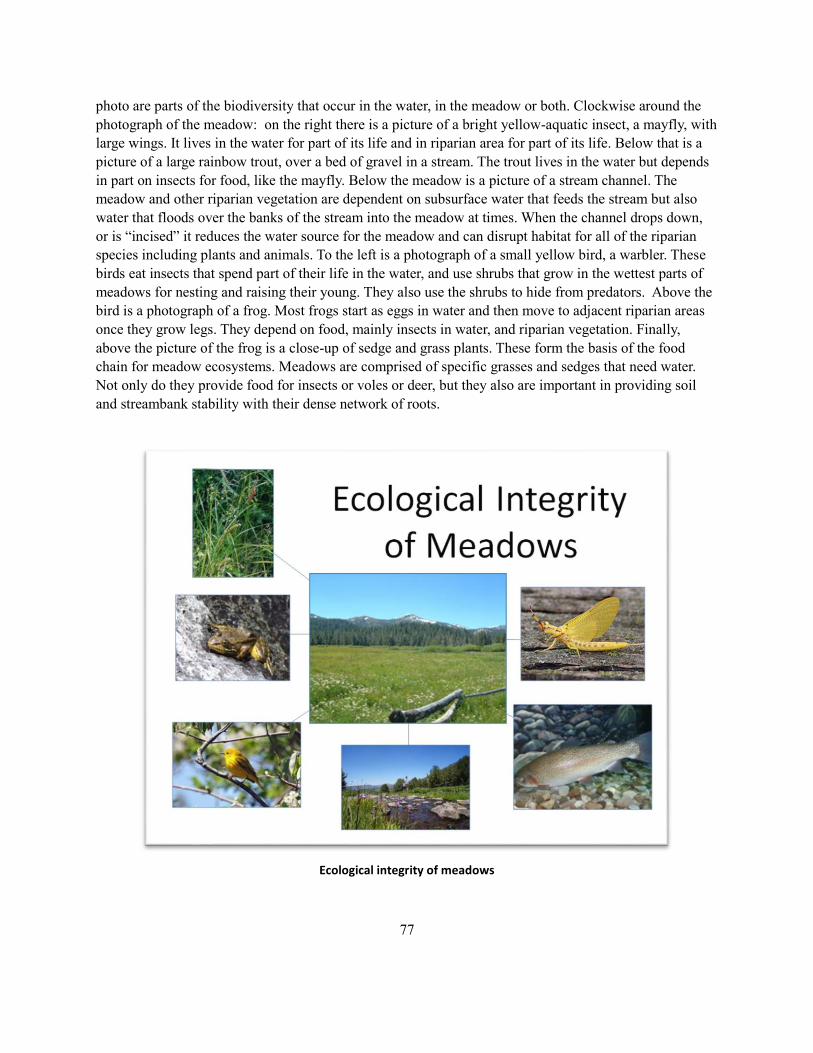
77
photo are parts of the biodiversity that occur in the water, in the meadow or both. Clockwise around the
photograph of the meadow: on the right there is a picture of a bright yellow-aquatic insect, a mayfly, with
large wings. It lives in the water for part of its life and in riparian area for part of its life. Below that is a
picture of a large rainbow trout, over a bed of gravel in a stream. The trout lives in the water but depends
in part on insects for food, like the mayfly. Below the meadow is a picture of a stream channel. The
meadow and other riparian vegetation are dependent on subsurface water that feeds the stream but also
water that floods over the banks of the stream into the meadow at times. When the channel drops down,
or is “incised” it reduces the water source for the meadow and can disrupt habitat for all of the riparian
species including plants and animals. To the left is a photograph of a small yellow bird, a warbler. These
birds eat insects that spend part of their life in the water, and use shrubs that grow in the wettest parts of
meadows for nesting and raising their young. They also use the shrubs to hide from predators. Above the
bird is a photograph of a frog. Most frogs start as eggs in water and then move to adjacent riparian areas
once they grow legs. They depend on food, mainly insects in water, and riparian vegetation. Finally,
above the picture of the frog is a close-up of sedge and grass plants. These form the basis of the food
chain for meadow ecosystems. Meadows are comprised of specific grasses and sedges that need water.
Not only do they provide food for insects or voles or deer, but they also are important in providing soil
and streambank stability with their dense network of roots.
Ecological integrity of meadows
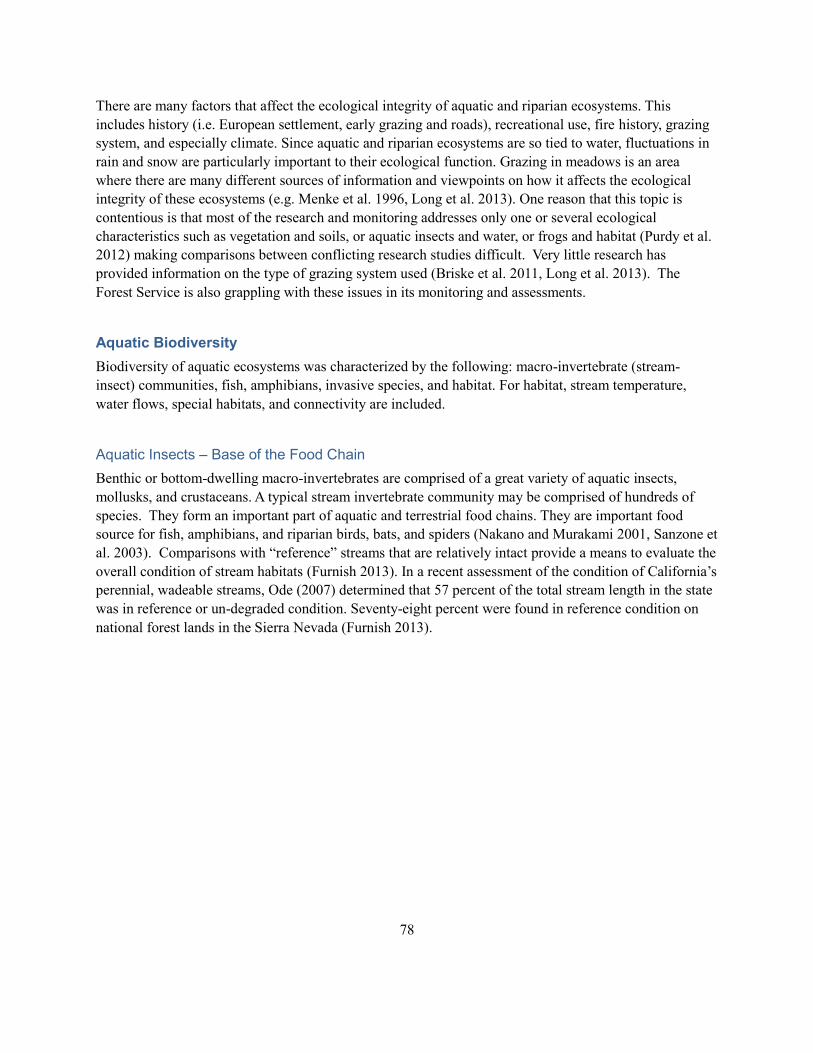
78
There are many factors that affect the ecological integrity of aquatic and riparian ecosystems. This
includes history (i.e. European settlement, early grazing and roads), recreational use, fire history, grazing
system, and especially climate. Since aquatic and riparian ecosystems are so tied to water, fluctuations in
rain and snow are particularly important to their ecological function. Grazing in meadows is an area
where there are many different sources of information and viewpoints on how it affects the ecological
integrity of these ecosystems (e.g. Menke et al. 1996, Long et al. 2013). One reason that this topic is
contentious is that most of the research and monitoring addresses only one or several ecological
characteristics such as vegetation and soils, or aquatic insects and water, or frogs and habitat (Purdy et al.
2012) making comparisons between conflicting research studies difficult. Very little research has
provided information on the type of grazing system used (Briske et al. 2011, Long et al. 2013). The
Forest Service is also grappling with these issues in its monitoring and assessments.
Aquatic Biodiversity
Biodiversity of aquatic ecosystems was characterized by the following: macro-invertebrate (stream-
insect) communities, fish, amphibians, invasive species, and habitat. For habitat, stream temperature,
water flows, special habitats, and connectivity are included.
Aquatic Insects – Base of the Food Chain
Benthic or bottom-dwelling macro-invertebrates are comprised of a great variety of aquatic insects,
mollusks, and crustaceans. A typical stream invertebrate community may be comprised of hundreds of
species. They form an important part of aquatic and terrestrial food chains. They are important food
source for fish, amphibians, and riparian birds, bats, and spiders (Nakano and Murakami 2001, Sanzone et
al. 2003). Comparisons with “reference” streams that are relatively intact provide a means to evaluate the
overall condition of stream habitats (Furnish 2013). In a recent assessment of the condition of California’s
perennial, wadeable streams, Ode (2007) determined that 57 percent of the total stream length in the state
was in reference or un-degraded condition. Seventy-eight percent were found in reference condition on
national forest lands in the Sierra Nevada (Furnish 2013).
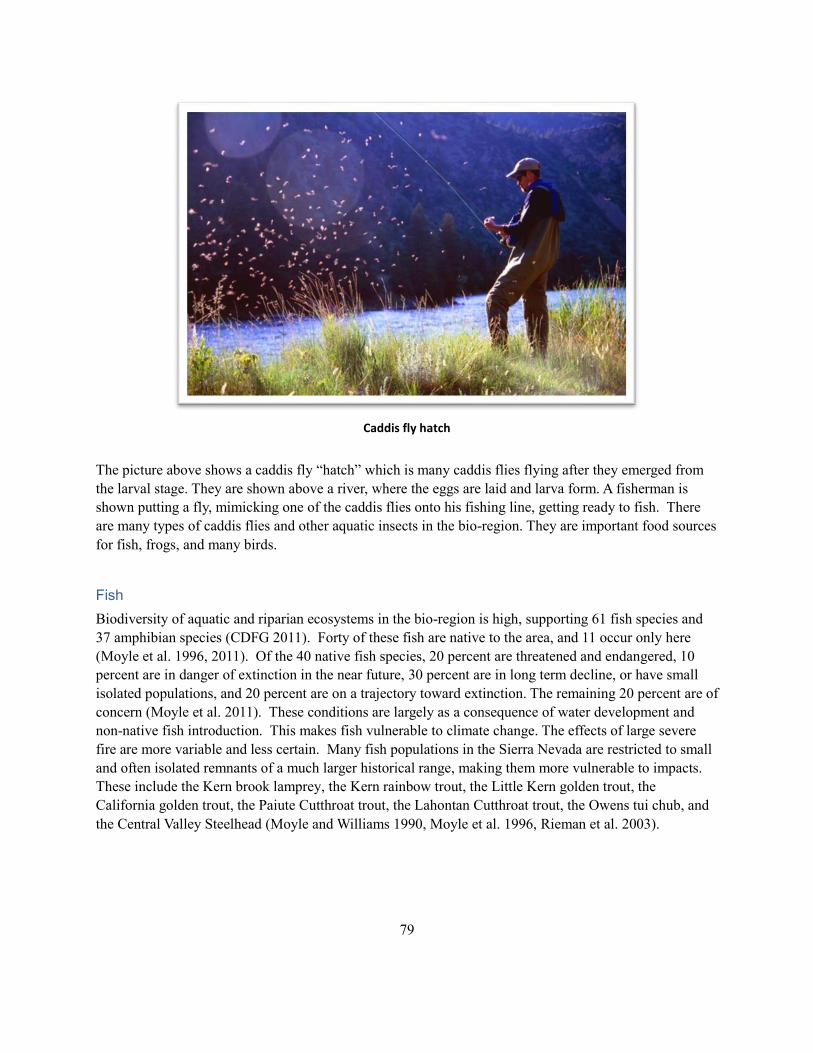
79
Caddis fly hatch
The picture above shows a caddis fly “hatch” which is many caddis flies flying after they emerged from
the larval stage. They are shown above a river, where the eggs are laid and larva form. A fisherman is
shown putting a fly, mimicking one of the caddis flies onto his fishing line, getting ready to fish. There
are many types of caddis flies and other aquatic insects in the bio-region. They are important food sources
for fish, frogs, and many birds.
Fish
Biodiversity of aquatic and riparian ecosystems in the bio-region is high, supporting 61 fish species and
37 amphibian species (CDFG 2011). Forty of these fish are native to the area, and 11 occur only here
(Moyle et al. 1996, 2011). Of the 40 native fish species, 20 percent are threatened and endangered, 10
percent are in danger of extinction in the near future, 30 percent are in long term decline, or have small
isolated populations, and 20 percent are on a trajectory toward extinction. The remaining 20 percent are of
concern (Moyle et al. 2011). These conditions are largely as a consequence of water development and
non-native fish introduction. This makes fish vulnerable to climate change. The effects of large severe
fire are more variable and less certain. Many fish populations in the Sierra Nevada are restricted to small
and often isolated remnants of a much larger historical range, making them more vulnerable to impacts.
These include the Kern brook lamprey, the Kern rainbow trout, the Little Kern golden trout, the
California golden trout, the Paiute Cutthroat trout, the Lahontan Cutthroat trout, the Owens tui chub, and
the Central Valley Steelhead (Moyle and Williams 1990, Moyle et al. 1996, Rieman et al. 2003).
80
Amphibians
Amphibians (frogs, toads, and salamanders) have experienced a global decline, including in the United
States (Lannoo 2005). Across the bio-region, there are several amphibians that are of concern including
the mountain yellow-legged frog, and Sierra Nevada mountain yellow-legged frog, Cascades frog and the
Yosemite toad. The Yosemite toad is discussed below in riparian ecosystems.
Both the Sierran and mountain yellow-legged frogs and the Yosemite toad have disappeared from more
than half the known historic sites, and the yellow-legged frogs have declined more than 90 percent (USFS
2011). The Cascades frog has declined dramatically in the southern Cascades (Fellers and Drost 1993).
The causes of the declines is multiple and is thought to include predation by non-native trout, infection by
chytrid fungus, and threats from water development, climate change, recreation and livestock (USFWS
2011). Pesticides have been implicated as potential contributors to the decline, but no direct association
has been found (Bradford et al. 2011). Because of the multiple factors and lack of integrated research, the
relative importance of the different factors is unknown (Pope and Long 2013).
Special Aquatic Habitats
Cold water springs, hot springs, fens, bogs, vernal pools, marshes, seeps, snowmelt pools, and alkaline or
caldera lakes provide distinct aquatic habitats. They are areas of high biological diversity occupied by rare
aquatic and terrestrial animal and plant species. Examples include the insect “eating” plants, sundew and
California pitcher plant, many mosses and caddis flies. These habitats attract a variety of terrestrial
animals because they provide a concentrated food and water source. Because special habitats are often
small and isolated, they are sensitive to local impacts such as water diversions, mining, roads, grazing,
and recreation. Most special habitats are poorly understood and their condition across the bio-region is not
available.
Aquatic Ecosystem Resilience
Resilience of aquatic ecosystems is the ability to absorb environmental changes or disturbances, and still
support native biodiversity and ecosystem services. The response of aquatic ecosystems depends on
current and historic land uses. Aquatic ecosystems affected by water development are more sensitive to
reductions in water or changes in water from climate change. Water development includes dams,
diversions, and development of springs for human or livestock water sources. All major rivers in the
Sierra Nevada are impounded and regulated to some extent, with the exception of the Consumnes River.
Watersheds where there has been a history of intensive management, from mining or historic, intensive
livestock grazing that contributed to incised channels are less resilient. Where there have been fewer
historic changes, the ecosystem is more resilient. According to the Sierra Nevada Ecosystem Project
(SNEP) report, aquatic ecosystems are the most altered of all ecosystems in the bio-region (Centers of
Water and Wildland Resources 1996).
Habitat Connectivity and Invasive Species
Dams, diversions, road and trail crossings, and other water development have broken up the continuity of
rivers and streams throughout the bio-region. This has affected the habitat and life histories of fish and
other aquatic species through fragmentation, sedimentation and invasive species.
81
In aquatic ecosystems, the continuity of water is essential to habitat for biodiversity. Fish move up and
down water courses. Nutrients and food move from the higher watershed down. The timing of breeding,
growth of young, migration and other life history traits of many species are linked to natural fluctuations
in water flows. Temperature of water is dependent on the amount and source of water, and has a key
influence on all aquatic life (Cassie 2006). The dependence of continuity or connectivity is more obvious
for some plants and animals than others. The life cycle of anadromous fish, which migrate from the
mountains to the oceans and then return, are obviously affected by physical barriers such as dams or
diversions. Ninety percent of historic salmon spawning and rearing habitat has been lost because of the
physical barriers of dams (Moyle et al. 2011). Other fish, such as rainbow trout, are also affected.
Insects, plants, birds, mammals, and amphibians living in or near streams or rivers are impacted by
changes in water flow patterns, water temperature, sediment and other habitat factors changed by water
development, road or trail crossings and developments in riparian and aquatic habitats (Stanford and
Hauer 1992, Hawkins et al. 1997, Thomas 2005, Moyle et al. 2011).
Fish stocking in rivers, streams, reservoirs, and previously fishless lakes have reduced native fish and
amphibians, for example yellow-legged frogs. Other aquatic invasive species, such as quagga mussel and
New Zealand mudsnails, have spread throughout California on boats, fishing equipment, and other water
sports gear (CDFG 2008). A well-publicized example is the invasion and spread of the Asian clam in
Lake Tahoe that is threatening the native aquatic ecosystem (Wittman et al. 2012) and has cost a
substantial amount of money on control efforts. However, there are recreational and economic benefits to
introduced fish and these are discussed in subsequent sections.
Most water development is beyond the scope and control of national forest management, falling under
water rights administered by the State of California, and regulation by the Federal Energy Regulatory
Commission (FERC). The Forest Service does participate in the relicensing process for FERC projects in
providing “4e” conditions. The agency typically provides conditions that relate to water flow regimes and
temperatures to mimic more natural seasonal fluctuations. The many small hydro projects that started in
the 1980s are less closely managed, and have added to fragmentation of the aquatic ecosystems,
particularly on smaller headwater streams, to an unknown extent.
Culverts on road crossings can also disrupt habitat connectivity by restricting upstream movement by
species and causing amphibians to cross the road and likely be killed. While surveys of culverts on Forest
Service roads have been done, implications for biodiversity have not been evaluated.
Climate
Effects of climate change on aquatic ecosystems are already occurring such as earlier snowmelt (Yarnell
et al. 2010, CADWR 2012). This is likely to continue (Null et al 2010) and will impact aquatic
ecosystems through seasonal changes, decreased water flows and increased water temperatures. Earlier
spring runoff can cause changes in spring emergence and populations of aquatic insects, the basis of
aquatic food webs (Harper and Peckarsky 2006). As a result, fish abundance, diversity and distribution
may decline (Moyle et al. 2011). Species restricted to limited areas, such as the Kern golden trout, are
particularly vulnerable to climate change (Moyle et al. 2011, Katz et al. 2012). Similarly, yellow-legged
frogs occur in limited locations and impacts from climate change would be great, especially if sites dry up
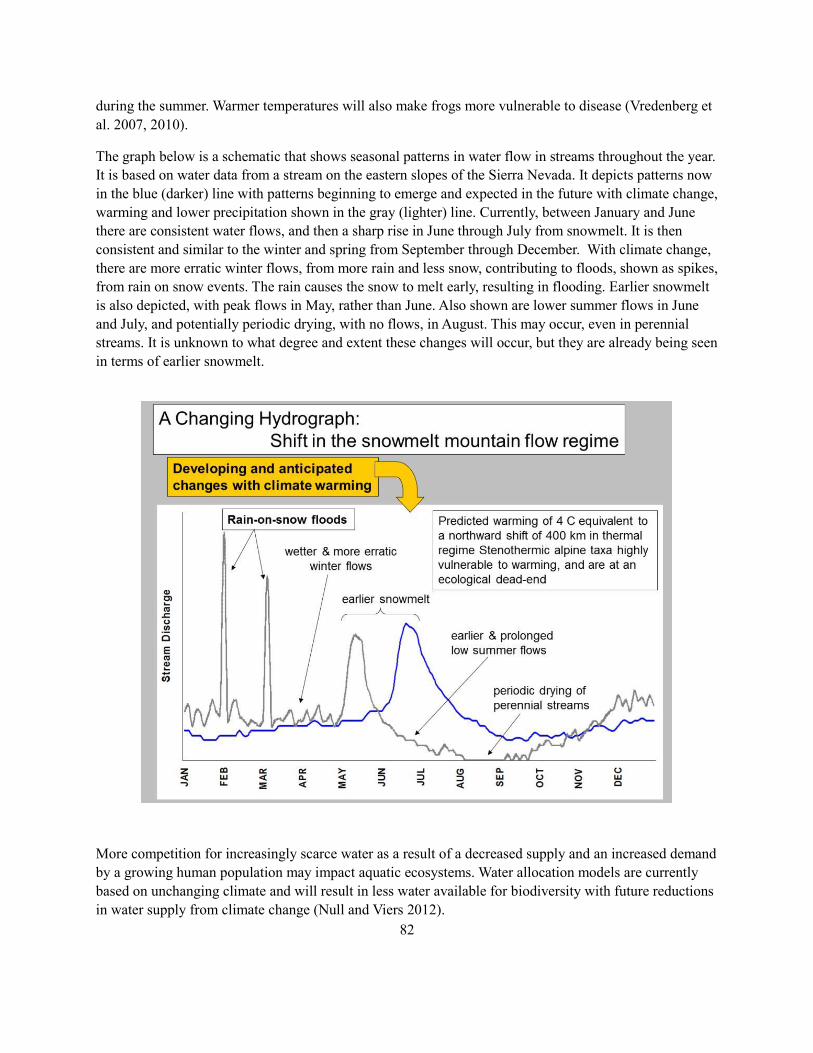
82
during the summer. Warmer temperatures will also make frogs more vulnerable to disease (Vredenberg et
al. 2007, 2010).
The graph below is a schematic that shows seasonal patterns in water flow in streams throughout the year.
It is based on water data from a stream on the eastern slopes of the Sierra Nevada. It depicts patterns now
in the blue (darker) line with patterns beginning to emerge and expected in the future with climate change,
warming and lower precipitation shown in the gray (lighter) line. Currently, between January and June
there are consistent water flows, and then a sharp rise in June through July from snowmelt. It is then
consistent and similar to the winter and spring from September through December. With climate change,
there are more erratic winter flows, from more rain and less snow, contributing to floods, shown as spikes,
from rain on snow events. The rain causes the snow to melt early, resulting in flooding. Earlier snowmelt
is also depicted, with peak flows in May, rather than June. Also shown are lower summer flows in June
and July, and potentially periodic drying, with no flows, in August. This may occur, even in perennial
streams. It is unknown to what degree and extent these changes will occur, but they are already being seen
in terms of earlier snowmelt.
More competition for increasingly scarce water as a result of a decreased supply and an increased demand
by a growing human population may impact aquatic ecosystems. Water allocation models are currently
based on unchanging climate and will result in less water available for biodiversity with future reductions
in water supply from climate change (Null and Viers 2012).
83
Fire and Aquatic Ecosystems
Aquatic ecosystems in the bio-region evolved over thousands of years with widespread, recurrent fire.
With changes in vegetation and management since European settlement, the nature of fire has changed
and the effects are more complicated. “Uncharacteristic” fires are those that are not typical of the historic,
natural fire regime (Hardy 2005). In the bio-region, this generally applies to very large, dominantly high
severity, intense fire patches, encompassing tens of thousands of acres or more.
Fires that burn within the natural range of variation can benefit native fishes (Brown et al. 2001, Burton
2005). The response of aquatic ecosystems to uncharacteristic fires is more complex. Fish in large
populations are likely to benefit after fire, even after high severity fires in the long term despite immediate
mortality in burned areas (Hunsaker et al. 2013). Similarly, fire within the natural range of variation can
benefit amphibian diversity (Hossack and Pilliod 2011). But small, isolated populations are more
vulnerable. A single fire can be devastating by eliminating local populations (Hunsaker et al. 2013).
When fires are followed with intense rainfall, mudslides and debris flows can occur (DeGraff et al. 2011).
These can both rejuvenate in the long term and cause negative impacts in the short term to aquatic
habitats (Burton 2005, Neville et al. 2012). Road crossings and trails are especially vulnerable to damage
during intense fires and can deliver extensive sediment to streams if not properly stabilized and managed.
One beneficial effect of fire is the addition of large logs from trees burned in the fires into rivers and
streams (Pettit and Naiman 2007, Beche et al. 2005, Gregory et al.2003, Minshall et al. 1997, Young
1994). These logs are important in forming pools that provide habitat for trout and other species.
There are many controversies and unanswered questions about the effects of different post-fire restoration
actions on aquatic ecosystems. Research is still needed on what types of interventions and where they are
most appropriate and effective (Long et al. 2013).
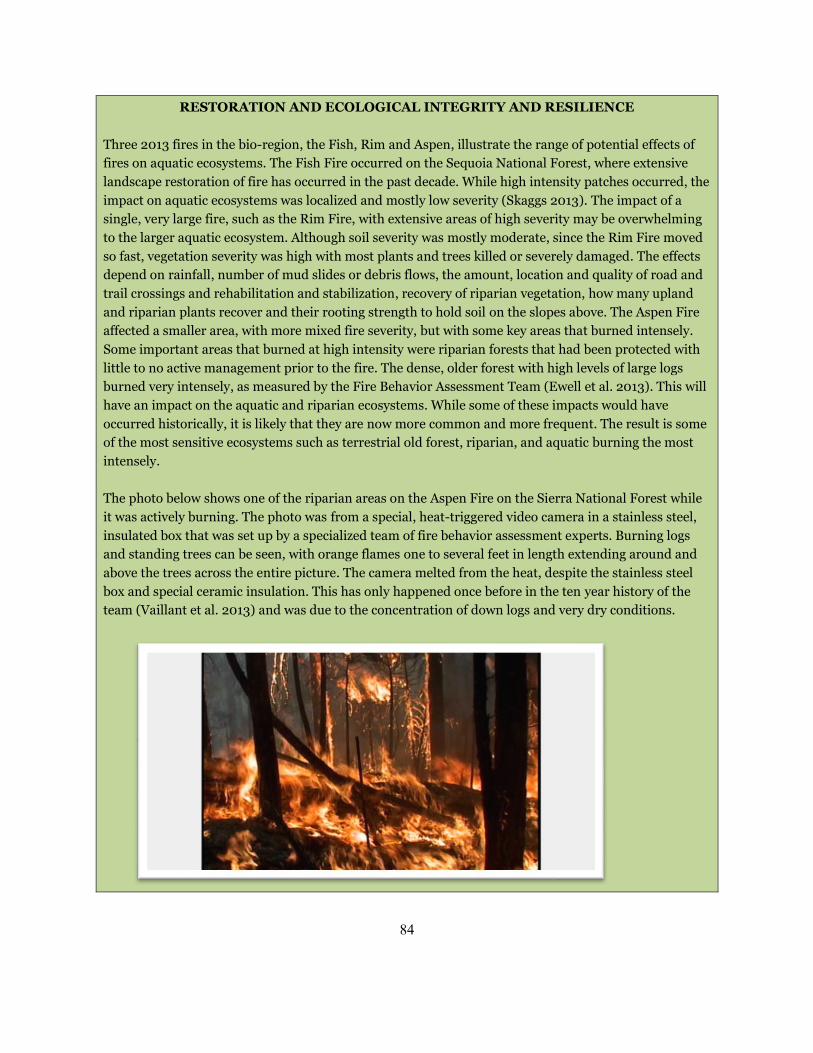
84
RESTORATION AND ECOLOGICAL INTEGRITY AND RESILIENCE
Three 2013 fires in the bio-region, the Fish, Rim and Aspen, illustrate the range of potential effects of
fires on aquatic ecosystems. The Fish Fire occurred on the Sequoia National Forest, where extensive
landscape restoration of fire has occurred in the past decade. While high intensity patches occurred, the
impact on aquatic ecosystems was localized and mostly low severity (Skaggs 2013). The impact of a
single, very large fire, such as the Rim Fire, with extensive areas of high severity may be overwhelming
to the larger aquatic ecosystem. Although soil severity was mostly moderate, since the Rim Fire moved
so fast, vegetation severity was high with most plants and trees killed or severely damaged. The effects
depend on rainfall, number of mud slides or debris flows, the amount, location and quality of road and
trail crossings and rehabilitation and stabilization, recovery of riparian vegetation, how many upland
and riparian plants recover and their rooting strength to hold soil on the slopes above. The Aspen Fire
affected a smaller area, with more mixed fire severity, but with some key areas that burned intensely.
Some important areas that burned at high intensity were riparian forests that had been protected with
little to no active management prior to the fire. The dense, older forest with high levels of large logs
burned very intensely, as measured by the Fire Behavior Assessment Team (Ewell et al. 2013). This will
have an impact on the aquatic and riparian ecosystems. While some of these impacts would have
occurred historically, it is likely that they are now more common and more frequent. The result is some
of the most sensitive ecosystems such as terrestrial old forest, riparian, and aquatic burning the most
intensely.
The photo below shows one of the riparian areas on the Aspen Fire on the Sierra National Forest while
it was actively burning. The photo was from a special, heat-triggered video camera in a stainless steel,
insulated box that was set up by a specialized team of fire behavior assessment experts. Burning logs
and standing trees can be seen, with orange flames one to several feet in length extending around and
above the trees across the entire picture. The camera melted from the heat, despite the stainless steel
box and special ceramic insulation. This has only happened once before in the ten year history of the
team (Vaillant et al. 2013) and was due to the concentration of down logs and very dry conditions.
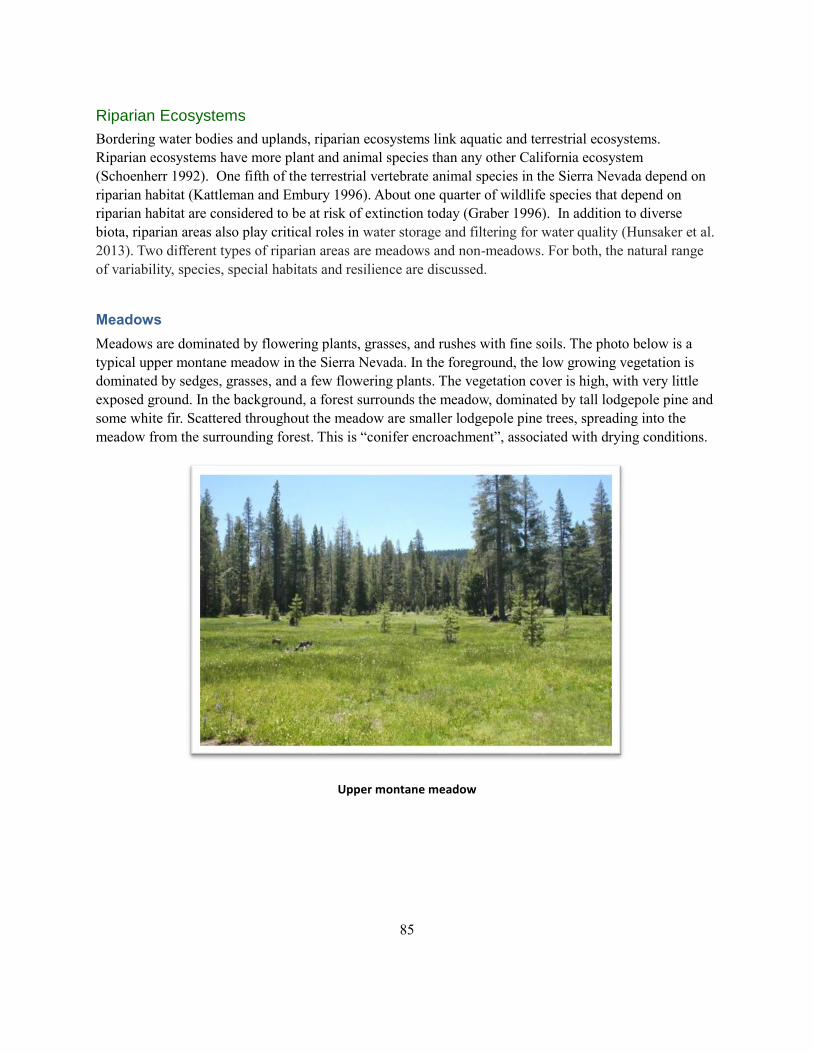
85
Riparian Ecosystems
Bordering water bodies and uplands, riparian ecosystems link aquatic and terrestrial ecosystems.
Riparian ecosystems have more plant and animal species than any other California ecosystem
(Schoenherr 1992). One fifth of the terrestrial vertebrate animal species in the Sierra Nevada depend on
riparian habitat (Kattleman and Embury 1996). About one quarter of wildlife species that depend on
riparian habitat are considered to be at risk of extinction today (Graber 1996). In addition to diverse
biota, riparian areas also play critical roles in water storage and filtering for water quality (Hunsaker et al.
2013). Two different types of riparian areas are meadows and non-meadows. For both, the natural range
of variability, species, special habitats and resilience are discussed.
Meadows
Meadows are dominated by flowering plants, grasses, and rushes with fine soils. The photo below is a
typical upper montane meadow in the Sierra Nevada. In the foreground, the low growing vegetation is
dominated by sedges, grasses, and a few flowering plants. The vegetation cover is high, with very little
exposed ground. In the background, a forest surrounds the meadow, dominated by tall lodgepole pine and
some white fir. Scattered throughout the meadow are smaller lodgepole pine trees, spreading into the
meadow from the surrounding forest. This is “conifer encroachment”, associated with drying conditions.
Upper montane meadow
86
Natural Range of Variability
Meadows vary considerably in their condition relative to the natural range of variability. Most of the
variation is due to historic human use, both removal of Native American management and intensive use
during European settlement.
Meadows have attracted humans for thousands of years. Native Americans gathered plants, pruned,
selectively harvested, weeded, irrigated, and preferentially burned meadows (Anderson and Moratto
1996). Native American cultural interest in meadows remains high (Lake and Long 2013), reflected in
existing or pending stewardship projects such as the Indian Valley on the Plumas National Forest, and
Meek’s Meadow on the Lake Tahoe Basin, or other collaborative management such as with the Fork
Mono Tribe.
In the late 1800s, meadows were dramatically altered by European-American settlers. Intensive livestock
use resulted in extensive overgrazing and soil erosion (Menke et al. 1996, Gross and Coppoletta 2013).
Other meadows were used for hay production (Momsen 1996). Mining, water diversions, introduction of
non-native species, fire suppression, and recreation have also occurred in the past and many of these
practices continue today (Kattleman and Embury 1996). All of these past and current uses have
contributed to incised channels—lowered stream levels—that decrease water levels and vastly alter
meadow ecosystems. There is a lack of meadows that have not experienced this history making
reconstruction of the natural range of ecological conditions, and only indirect inferences are possible
(Gross and Coppoletta 2013).
Current conditions of twenty individual ecosystem composition, structure, and process characteristics
were assessed in relation to the natural range of variability (NRV) including: plant species composition
and richness, fire regime components, hydrology, grazing, distribution and size of meadows, vegetation
height and biomass, and upland plant invasion (Gross and Coppoletta 2013). Out of the 20 indicators, 20
percent are considered within NRV, 65 percent outside of NRV, and the remainder could not be
determined. The total area of meadows has decreased due to past and current land use such as dams,
diversions, and recreation, and upland species encroachment such as conifers and sagebrush from fire
suppression or stream channel incision. Recent research on channel incision in Sierra Nevada meadows
showed 54 percent of meadows to be incised (Fryoff-Hung and Viers 2012). While livestock grazing has
probably contributed to channel incision in Sierra Nevada meadows, the effects of grazing are difficult to
separate from those of other land uses such as construction of roads, railroads, and ditches, and climatic
variability (Ratliff 1985).
The overall biomass in meadows is within NRV, but species diversity of plants and animals are outside of
NRV, mostly due to non-native plant species invasions (Gross and Coppoletta 2013). Both floods and
fires affect meadows. Fire return intervals are longer and may be contributing to encroachment of conifers
into meadows. Frequency and extent of small floods has decreased due to incised channels, dams, and
gully formation in many meadows.
87
Species Diversity
More information is known about meadow wildlife than plant species. Thirty-seven species of birds in the
Sierra Nevada are dependent or strongly associated with montane meadows (Siegel and DeSante 1999).
Collaborative monitoring of common and rare birds in meadows has been conducted by Partners in
Flight. Limited information is available from these data at this time but will be in the near future. In the
interim, several species were selected for evaluation: Yosemite toad, willow flycatcher, and great gray
owl. These species were chosen because they occur across more than one forest, there is existing,
available, information on them, and they are sensitive to two or more key drivers and stressors such as
climate, water development, recreation, or fire. A number of plant species, particularly moonwort ferns,
are of concern but comprehensive information on them is not readily available. More detailed information
on plants will be included in the forest assessments and in special habitats (fens) below.
Yosemite toad, an endemic species, and a proposed species for federal endangered species listing under
the Endangered Species Act, occurs in meadows in the central and southern Sierra Nevada (USDI 2013).
It occupies less than 50 percent of its historic range, and remaining populations appear to be in decline
(Davidson et al. 2002). Multiple factors have been attributed to the decline including: grazing,
recreational trails, non-native fish, disease, increase in ultraviolet radiation, pollutants (USFS 2004),
meadow wetness, and climate (Roche et al. 2012). Particularly contentious is grazing in or near toad
habitat. Recent research reported no detectable differences in toad occupancy or density between grazed
and ungrazed meadows (Roche et al. 2012). Because of its preference for the wetter areas in meadows,
the toad is most vulnerable to changes in meadow hydrology from channel incision and climate change
(Pope and Long 2013).
Willow flycatcher is another meadow-associated species that occurs in the wetter portions of meadows. It
is a neo-tropical migrant that spends the winters in Central America and then breeds and summers in
North American meadows. In the bio-region, it is found where standing water and tall willow shrubs
occur. Once common throughout the western United States, the willow flycatcher is gone from much of
its range. It is no longer found breeding in the central Sierra Nevada (Eldorado south to the Sequoia
National Forest) (Greene et al. 2003). A declining population trend led to the listing of the willow
flycatcher as a California state endangered species. In forest surveys, a stable or slightly increasing
population since 2003 has been found on the Tahoe National Forest and to the north. Water levels,
predator vulnerability, and parasitic cowbirds are the primary threats to the willow flycatcher during the
breeding season (Stefani et al. 2001, Cain et al. 2003, Soroka and Morrison 2005). There may also be
direct effects of grazing on willow flycatchers, although most of the effects are thought to be indirect
through influences on meadow water levels from historic, intensive grazing, decreased willow foliage
volume, and increased parasitic cowbird levels (Green et al. 2003). The interaction of grazing and willow
flycatchers is controversial. A comprehensive grazing study, such as the one for Yosemite toad would help
to ascertain cause and effect. The role of impacts to tropical habitat in the willow flycatchers decline is
unknown.
Great gray owls are large owls that live in the edge between forest and meadows or other grassy openings
and are listed as a California state endangered species. Only about 200 to 300 individuals remain in
California (CDFG 2010). Yosemite is the southernmost range, where most are found in the bio-region.
Some nest locations and other sightings have been made on the Stanislaus, Eldorado, Tahoe, and Plumas
88
National Forests. They nest in moderate dense forest with large snags or old trees, next to meadows or
grassy openings (CDFG 2010). They are found most often in red fir forests, but also in mixed conifer or
conifer-oak woodland. They hunt for rodents mostly in meadows, but also grassy open areas in forests,
recently burned areas, and sometimes clear cuts or plantations (Greene 1995). In the winter, they move
downslope to snow-free areas where they can more easily hunt. Detailed surveys of causes of decline are
not available but automobile collisions, disease, and habitat loss from development or intensive
vegetation management have been noted (Maurer 2005, Jepsen et al. 2011). Large reduction in tree cover
from fire, vegetation management, or recreation sites, may make the forests unsuitable for nesting
(Hayward and Verner 1994). Current trends in fire, climate and pace of restoration of fire resilience make
fire a critical threat. The Rim Fire spread in or near some of the great gray owl habitat but it is unknown
at this time to what extent habitat or birds may have been impacted. As the fire burned in that portion of
the park, it was less severe. But the fire illustrates how one particular fire may impact a species with
limited distributions.
Special Habitats
There are two habitat types associated with meadows that are particular “hotspots” of biodiversity—they
are home to a large number of species, and often specialized, uncommon plants or animals. These are fens
and aspen.
Fens are peat-forming wetlands, with groundwater inflow, and form over thousands of years (Bedford and
Godwin 2003). Most are less than an acre in size. They are hotspots of biodiversity, with many unique
plants and animals (Sikes et al. 2012). Fens have been noted as one of the top sensitive habitat types in
several assessments of the bio-region (SNEP 1996, USFS 2001, CNDDB 2009). Eight species of
threatened, endangered, or sensitive (TES) plants have been noted in fen habitat including several
moonwort ferns, tall alpine aster, and numerous mosses. The insectivorous plants, sundew and California
pitcher plant are found in fens. Five federally listed or candidate threatened or endangered animal species
have been recorded in fen areas including yellow-legged frogs, Cascades frog, Yosemite toad, and Owens
tui chub (Sikes et al. 2012, CNDDB 2009). Two state threatened birds, the greater sandhill crane, and
willow flycatcher, have also been observed.
Recently, systematic surveys of fens on national forests in the bio-region have begun (Sikes et al. 2102).
Preliminary results show that some fens are at risk. Most commonly noted factors include: lowered water
tables from gullies caused by trails (hiking and livestock), direct impact from off-road vehicles and
livestock, and sediment from adjacent areas (Cooper and Wolf 2006, Sikes et al. 2012).
Aspen is a deciduous tree that occurs across the bio-region where wet soils occur. It grows where there is
subsurface water, such as around meadows and streams in red fir and lodgepole pine forests, throughout
eastside landscapes in patches, and in rocky talus or pockets where snow accumulates (Estes 2013). It
supports very diverse understory plant and bird communities and has been described as a biodiversity
oasis (Sheppard et al. 2006, Kuhn et al. 2011, Estes 2013). Riparian or meadow-associated aspen is the
single most species-rich bird habitat in the Sierra Nevada. Several bird species of management interest are
associated with aspen including Northern Goshawk, Red-breasted Sapsucker, Warbling Vireo, and
Mountain Bluebird. Aspen distribution is greatly reduced compared to pre-European settlement, and
many stands are in poor condition due to conifer encroachment and poor regeneration.
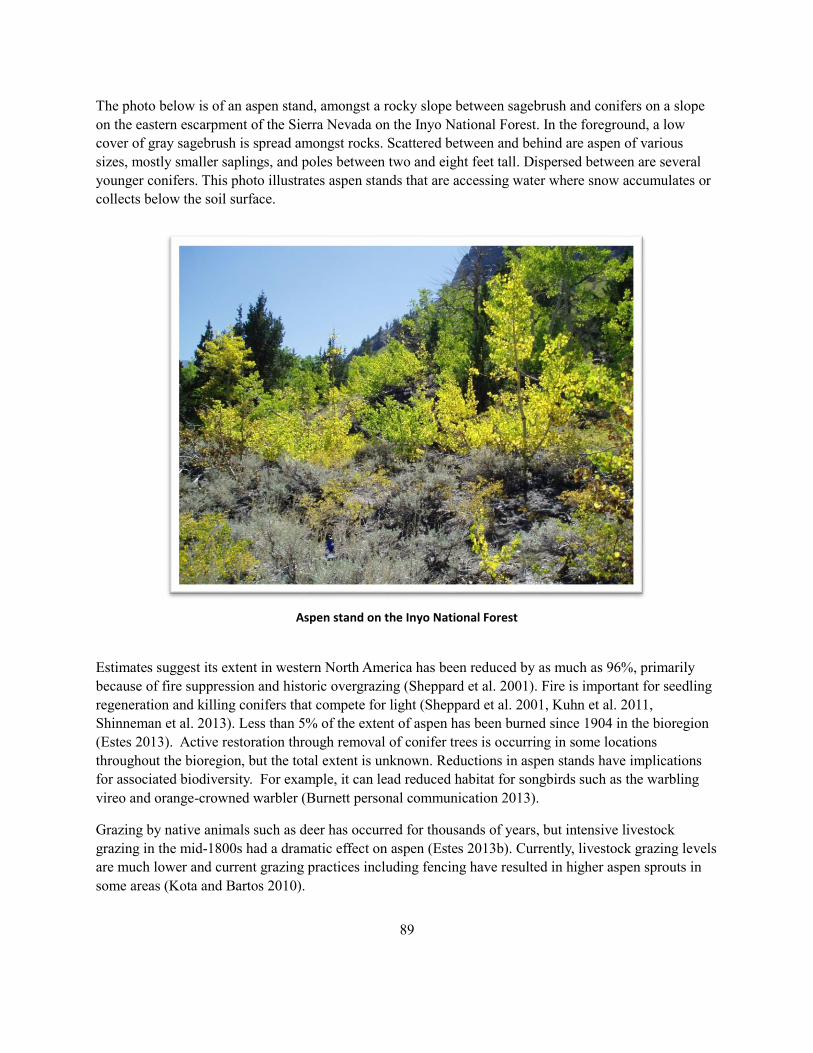
89
The photo below is of an aspen stand, amongst a rocky slope between sagebrush and conifers on a slope
on the eastern escarpment of the Sierra Nevada on the Inyo National Forest. In the foreground, a low
cover of gray sagebrush is spread amongst rocks. Scattered between and behind are aspen of various
sizes, mostly smaller saplings, and poles between two and eight feet tall. Dispersed between are several
younger conifers. This photo illustrates aspen stands that are accessing water where snow accumulates or
collects below the soil surface.
Aspen stand on the Inyo National Forest
Estimates suggest its extent in western North America has been reduced by as much as 96%, primarily
because of fire suppression and historic overgrazing (Sheppard et al. 2001). Fire is important for seedling
regeneration and killing conifers that compete for light (Sheppard et al. 2001, Kuhn et al. 2011,
Shinneman et al. 2013). Less than 5% of the extent of aspen has been burned since 1904 in the bioregion
(Estes 2013). Active restoration through removal of conifer trees is occurring in some locations
throughout the bioregion, but the total extent is unknown. Reductions in aspen stands have implications
for associated biodiversity. For example, it can lead reduced habitat for songbirds such as the warbling
vireo and orange-crowned warbler (Burnett personal communication 2013).
Grazing by native animals such as deer has occurred for thousands of years, but intensive livestock
grazing in the mid-1800s had a dramatic effect on aspen (Estes 2013b). Currently, livestock grazing levels
are much lower and current grazing practices including fencing have resulted in higher aspen sprouts in
some areas (Kota and Bartos 2010).
90
Aspen are particularly vulnerable to reductions in water. Climate change and land use that alters water
levels or availability are key stressors. Climate change has the potential to greatly affect aspen. Some
climate change research has predicted that aspen distribution will decrease and it will become restricted to
higher elevations (Rehfeldt et al. 2009). Aspen stands accumulate more snow than conifer-dominated
stands (LaMalfa and Ryle 2008). There has been a trend in increased restoration of aspen stands, because
of their high biodiversity value and this may also increase water yields despite declines from climate
change (Gifford et al. 1984, Kaufman 1985). It is unknown to what extent aspen restoration is occurring
and how much effect it might have on water yields overall.
Reductions in available water from roads, trails, or other activities that alter hydrology can also affect
aspen. It is unknown to what extent these land uses are impacting aspen.
Resilience of Meadows
Resilience of meadow ecosystems is characterized the same as for aquatic ecosystems. It is the ability to
absorb environmental changes or disturbances, and still support native biodiversity and ecosystem
services. Meadows where there has been a history of intensive management, from mining or historic,
intensive livestock grazing that contributed to incised channels are less resilient. Where there have been
fewer historic changes, the ecosystem is more resilient. The primary drivers and stressors that affect
resilience of meadow ecosystems are legacies of past management, current management intensity, and
climate change. Characterizing the resilience of meadows is complex and no single approach has been
developed. The comparison of current conditions to natural range of variability (NRV) is one approach to
assessing resilience. A second approach is to characterize hydrologic function, such as channel condition,
soil stability, and overall vegetation. A third is to evaluate the susceptibility to climate change. A growing
body of scientific understanding suggests that the most robust assessment of resiliency of meadow
ecosystems includes all aspects of meadow condition from hydrologic to vegetative and biodiversity
(Purdy et al. 2012). Meadows that are determined to be resilient in one aspect of ecological integrity may
be less so in another.
Based on the NRV assessment described above, 65 percent of the characteristics used to assess meadows
were considered outside the natural range of variability. It is unknown exactly how much each of these
different characteristics affect resiliency of meadows. In addition, comprehensive information on each of
these characteristics in meadows throughout the bio-region is unknown.
The intensity of grazing can affect meadow condition and resiliency. Intensity of grazing can affect water
infiltration rates, and root biomass. Studies are lacking in the bio-region that include sufficient
information on grazing intensity, utilization, duration, and timing, and ecological variation to draw
conclusions about current conditions in meadows as related to different levels of grazing (Long et al.
2013). Results from a ten year Forest Service grazed, meadow monitoring program are currently being
evaluated for ecological condition and trend by researchers at the University of California at Davis.
Emphasis is on resiliency characteristics including hydrologic function in the short and long term based
on “functional groups” of plants. For example, plants that have stronger and deeper root systems are rated
as having higher hydrologic function because they stabilize and protect soil better (Frietas 2013). Effects
of grazing may be difficult to separate from effects from the amount of meadow wetness affected by
many factors (Frietas 2013).
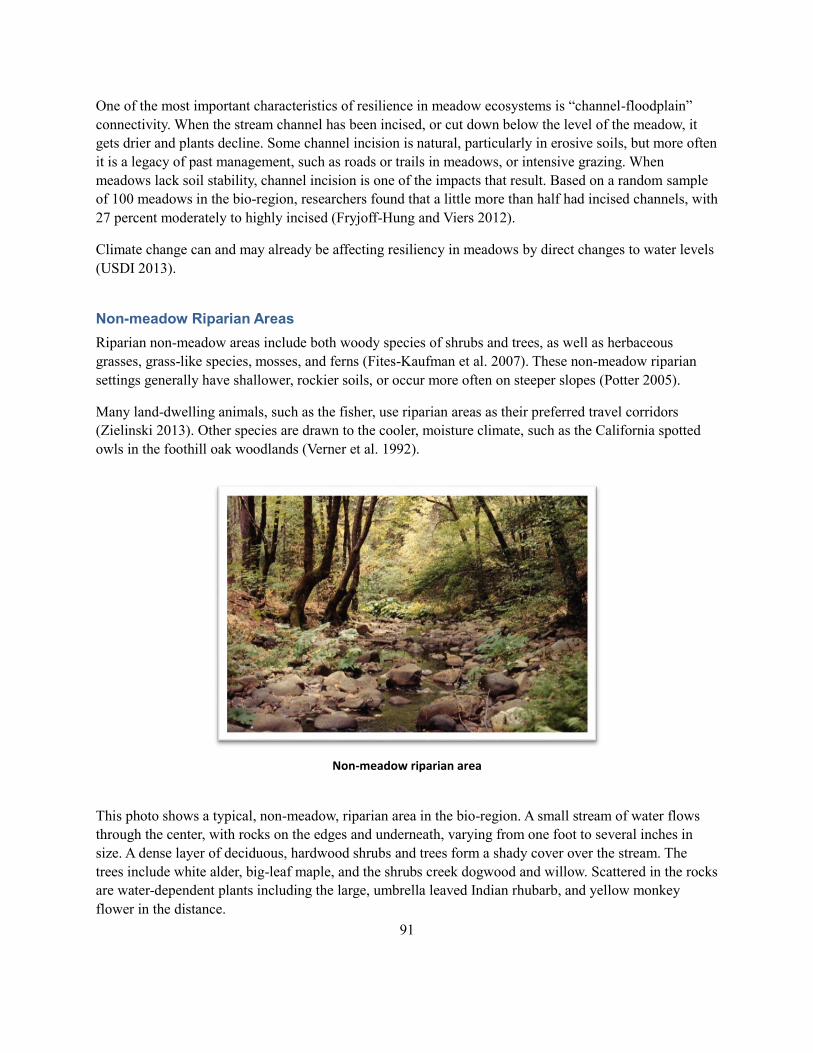
91
One of the most important characteristics of resilience in meadow ecosystems is “channel-floodplain”
connectivity. When the stream channel has been incised, or cut down below the level of the meadow, it
gets drier and plants decline. Some channel incision is natural, particularly in erosive soils, but more often
it is a legacy of past management, such as roads or trails in meadows, or intensive grazing. When
meadows lack soil stability, channel incision is one of the impacts that result. Based on a random sample
of 100 meadows in the bio-region, researchers found that a little more than half had incised channels, with
27 percent moderately to highly incised (Fryjoff-Hung and Viers 2012).
Climate change can and may already be affecting resiliency in meadows by direct changes to water levels
(USDI 2013).
Non-meadow Riparian Areas
Riparian non-meadow areas include both woody species of shrubs and trees, as well as herbaceous
grasses, grass-like species, mosses, and ferns (Fites-Kaufman et al. 2007). These non-meadow riparian
settings generally have shallower, rockier soils, or occur more often on steeper slopes (Potter 2005).
Many land-dwelling animals, such as the fisher, use riparian areas as their preferred travel corridors
(Zielinski 2013). Other species are drawn to the cooler, moisture climate, such as the California spotted
owls in the foothill oak woodlands (Verner et al. 1992).
Non-meadow riparian area
This photo shows a typical, non-meadow, riparian area in the bio-region. A small stream of water flows
through the center, with rocks on the edges and underneath, varying from one foot to several inches in
size. A dense layer of deciduous, hardwood shrubs and trees form a shady cover over the stream. The
trees include white alder, big-leaf maple, and the shrubs creek dogwood and willow. Scattered in the rocks
are water-dependent plants including the large, umbrella leaved Indian rhubarb, and yellow monkey
flower in the distance.
92
Unlike meadows that have been extensively studied in the bio-region, there is less scientific information
available on biodiversity of non-meadow riparian areas. Information is available for individual water
development projects, but there is no single database or compilation useful for this assessment (Lind
2012).
Characteristics of ecological integrity discussed are coarse-filter biodiversity and processes including
natural range of variation in vegetation and fire as an ecological process. Water flow including seasonal
changes, temperatures, and connectivity also affect riparian vegetation and animals. These water
dynamics have been discussed above in aquatic ecosystems and are not repeated. Finally, an overall
aquatic, riparian, and watershed ecological integrity index was developed as a first approximation for the
bio-region. Information was not readily available for fine-filter characteristics and will be included later
in the planning process as appropriate and available.
Natural Range of Variation
Sawyer (2013) conducted a literature review on the natural range of variation of riparian ecosystems in
the bio-region. Little published information was available, and much of it centered on the lower edges
bordering the Sacramento Valley, Truckee River, and lower east side (Owens Valley and Mono Basin).
Riparian areas play important roles in ecological integrity of the bio-region because of their concentration
of biodiversity, connectivity corridors, and location between land and water ecosystems. Overall, riparian
areas are outside of the natural range of variability at low and mid-elevations, where fire suppression, land
uses and water development have concentrated.
Riparian areas cover less than one percent of the land area, but encompass the headwaters for 24 major
watersheds (Kattleman and Embury 1996), and are home to more plant and animal species than any other
ecosystem in California (Schoenherr 1992), They are used by more than one-fifth of the vertebrate species
(Graber 1996). They are considered “keystone” ecosystems, because they play a significant ecological
role, compared to the area in the landscape they occupy (Gregory et al. 1991, Malanson 1993). Riparian
vegetation also plays important ecosystem functions in carbon, nitrogen, water cycling, and aquatic
habitat. Riparian vegetation stabilizes stream banks, traps and stores sediment, improves water quality,
provides nutrients to aquatic ecosystems, and is home to species that live in both water and land such as
amphibians and some aquatic insects (Gregory et al. 1991, Naiman and Decamps 1997, Patten 1998,
Sawyer 2013).
Vegetation varies with channel conditions, soils, valley shape, distance from water and time since fire
(Harris 1998, Merrill et al. 2006, Russell and McBride 2001). Deciduous trees and shrubs are common,
including aspen, cottonwood, white or mountain alder, dogwoods, and willows (Potter 1998, Merrill et al.
2006).
Riparian ecosystems have been changed by non-native invasive species and are among those areas of the
Sierra Nevada most impacted by them (Schwartz et al. 1996). Himalayan blackberry, on the westside, and
Russian olive and salt cedar on the eastside especially impact riparian ecosystems. They take over and
disrupt or eliminate native plant species, and change water patterns. Tall whitetop and purple loosestrife
are found on both sides at low elevations and can rapidly spread and crowd out native plants and animals.
There are often severe effects of invasives on biodiversity. Tamarix dewaters riparian areas, replacing
93
cottonwood and willow where a high proportion of bird diversity is found (Smith et al. 1998, Heath and
Ballard 2003). Altered riparian systems may be especially vulnerable (Parks et al. 2005). The extent and
detailed locations of these riparian invaders is not known.
Riparian vegetation has almost disappeared in riparian areas where water flow has been nearly or
completely eliminated due to water development (Kattelman and Embury 1996). Ninety-three percent of
studied watersheds in the bio-region have clear gaps in the riparian corridor, largely from road and
railroad crossings, timber harvest, private lot clearing, livestock grazing, and dam and diversion de-
watering (Kondolf et al. 1996). The gaps may be short or long, depending on the location and degree of
water development and land-use.
Recurrent flooding and fire that originated in adjacent uplands, promoted hardwood dominance over
conifers (van Wagtendonk and Fites-Kaufman 2006). Most riparian areas have characteristics that are
suited to survive flooding or other disturbances, such as the ability to sprout or seeds that spread and
germinate easily. Disturbance is important to the ecological integrity of riparian ecosystems. Flooding,
scouring and debris flows create diverse and patchy vegetation that in turn support diverse animal
communities (Potter 1998, Kobziar and McBride 2006). In many riparian areas in the bio-region, fire
also played an important role in ecological integrity.
Fire as an Ecological Process
Fire suppression and other management practices that have limited fire in riparian zones have had a direct
effect on the composition and structure of riparian vegetation (Van de Water and North 2011, Russell and
McBride 2001, Sawyer 2013). This effect results in cascading changes to the aquatic environment,
nutrient cycling, and food webs. Fires naturally spread into riparian areas, although sometimes in different
ways and frequency than they burned in adjacent uplands (Collins and Skinner 2013). One of the most
important fire effects is to favor deciduous sprouting shrubs, trees, flowering plants, and grasses that have
difficulty with dense conifers that shade them (van Wagtendonk and Fites-Kaufman 2006, van de Water
and North 2011). Less healthy foliage and more insect-infested stems may occur (Lake 2013). Changes
in leaf litter into streams can occur. The leaves, especially deciduous leaves, which fall into streams, are
important parts of the food web that includes aquatic insects, frogs, salamanders, birds, bats, and fish.
Reductions in deciduous shrubs or trees leads to less litter fall into streams and less food for the aquatic
food web.
The photo below is a close-up of a vigorously growing, recently sprouted willow in a riparian area
following a prescribed fire. In the background, charred older tall stems are seen, with bright green foliage
sprouting at the base.
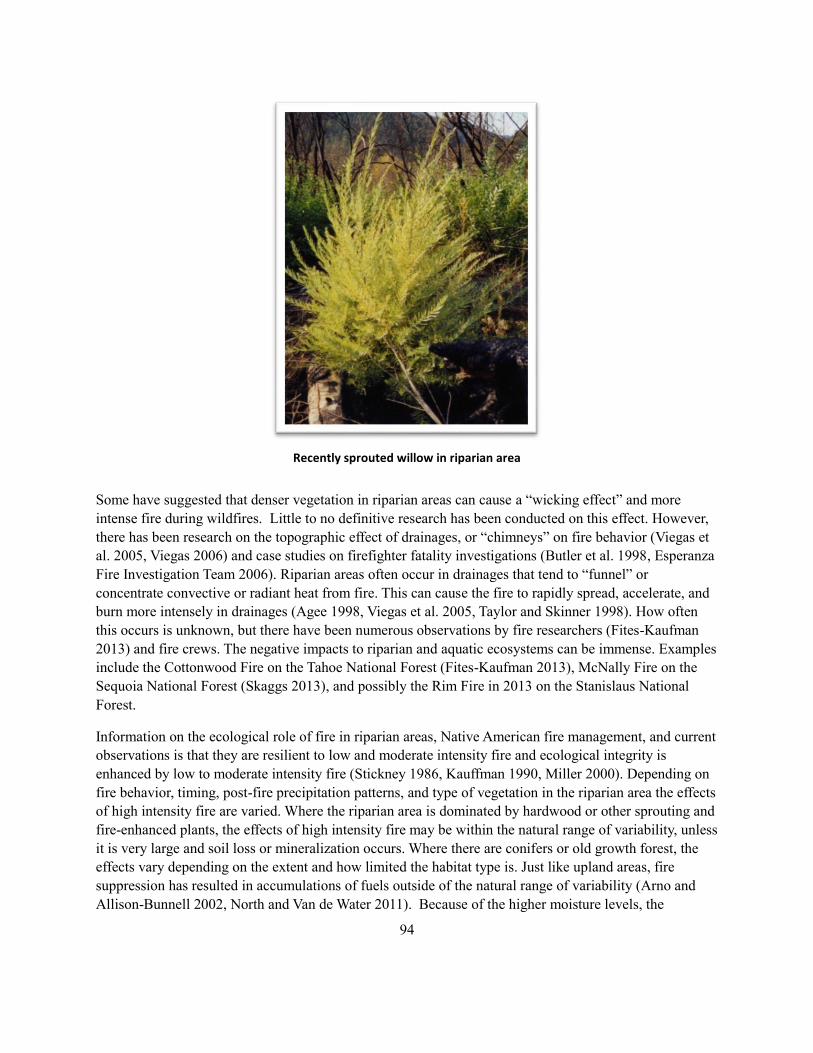
94
Recently sprouted willow in riparian area
Some have suggested that denser vegetation in riparian areas can cause a “wicking effect” and more
intense fire during wildfires. Little to no definitive research has been conducted on this effect. However,
there has been research on the topographic effect of drainages, or “chimneys” on fire behavior (Viegas et
al. 2005, Viegas 2006) and case studies on firefighter fatality investigations (Butler et al. 1998, Esperanza
Fire Investigation Team 2006). Riparian areas often occur in drainages that tend to “funnel” or
concentrate convective or radiant heat from fire. This can cause the fire to rapidly spread, accelerate, and
burn more intensely in drainages (Agee 1998, Viegas et al. 2005, Taylor and Skinner 1998). How often
this occurs is unknown, but there have been numerous observations by fire researchers (Fites-Kaufman
2013) and fire crews. The negative impacts to riparian and aquatic ecosystems can be immense. Examples
include the Cottonwood Fire on the Tahoe National Forest (Fites-Kaufman 2013), McNally Fire on the
Sequoia National Forest (Skaggs 2013), and possibly the Rim Fire in 2013 on the Stanislaus National
Forest.
Information on the ecological role of fire in riparian areas, Native American fire management, and current
observations is that they are resilient to low and moderate intensity fire and ecological integrity is
enhanced by low to moderate intensity fire (Stickney 1986, Kauffman 1990, Miller 2000). Depending on
fire behavior, timing, post-fire precipitation patterns, and type of vegetation in the riparian area the effects
of high intensity fire are varied. Where the riparian area is dominated by hardwood or other sprouting and
fire-enhanced plants, the effects of high intensity fire may be within the natural range of variability, unless
it is very large and soil loss or mineralization occurs. Where there are conifers or old growth forest, the
effects vary depending on the extent and how limited the habitat type is. Just like upland areas, fire
suppression has resulted in accumulations of fuels outside of the natural range of variability (Arno and
Allison-Bunnell 2002, North and Van de Water 2011). Because of the higher moisture levels, the
95
accumulations can be greater and more rapid than in adjacent uplands. The high moisture can lessen the
effects of some fires as well, but not during very dry conditions or when fire is accelerating in a drainage.
Leaving riparian areas alone may enhance the likelihood of very high intensity fire with very high
severity effects (Dwire and Kaufman 2003).
Resilience and Restoration of Riparian Ecosystems
Resilience to recreation and grazing depends on the intensity, timing and their effect on water tables to a
large degree. Since many meadows and riparian areas still have impacts from past European-settlement
activities such as mining, grazing, logging, and roads, restoration is an important priority across the bio-
region. Restoration is a key strategy for promoting ecological resilience to current factors including
climate change, uncharacteristic fires (Hunsaker et al. 2013), and land use including grazing (Long et al.
2013) and recreation. There are many uncertainties about restoration choices and effectiveness.
Restoration of both meadow and non-meadow riparian areas are covered here, since the science and
issues are similar.
Restoration of water flow patterns on regulated streams or rivers can improve biodiversity resilience in
riparian and aquatic ecosystems and has been a focus of recent water development relicensing processes
(Hunsaker et al. 2013). Mimicking natural flow patterns and removing barriers, especially in headwater
areas where feasible can enhance resilience of foothill yellow-legged frogs, California red-legged frogs,
native fish, and riparian habitat (Moyle and Mount 2007, Kondolf et al. 2012, Kupferberg et al. 2012,
Yarnell et al. 2012).
The importance of meadows for biodiversity and ecosystem services (e.g. grazing, water) in the bioregion
was identified in the previous subsections and by numerous scientific syntheses (e.g. Long et al. 2013,
Viers et al. 2013). Meadows play very important roles in many aspects of ecosystem resilience and
ecosystem services such as water storage, filtration, and regulation (Viers et al. 2013). Meadows have
also been the focus of intensive human use for over 150 years. Yet, they are amongst the most at risk
ecosystems to climate change (Viers et al. 2013). Restoration strategies for meadows have focused on
stream channel stability floodplain connectivity and water table levels (Long et al. 2013, Viers et al.
2013).
Long et al. (2013) reviewed the complex interactions of different types of grazing management on
meadow resilience. There are still many unknowns but managing the intensity and timing of grazing can
alter impacts and improve conditions in meadows with legacy problems (Briske et al. 2012). The
interaction between riparian vegetation species composition, structure and function, grazing levels,
seasonal and yearly variability in water availability, stream habitat, and temperature are unknown (Long
et al. 2013).
Approaches for meadow restoration depend on the degree of channel incision (Chambers and Miller
2010). There are many different views and uncertainties regarding which kind of in-stream structures or
other measures, such as bank stabilization are effective (Long et al. 2013). Monitoring and research on the
effectiveness of these restoration methods for biodiversity is needed (Hobbs and Cramer 2008, Bernhardt
and Palmer 2011). Research on how condition assessments of riparian vegetation, channel hydrology,
bird diversity, amphibians, fish, and aquatic insects shows that the condition of one factor may not reflect
96
the status of another aspect (Purdy et al. 2012). For example, vegetation condition may be good but fish
or amphibian status not. Monitoring of riparian restoration success often focuses on one or several factors
and not all. The recent research demonstrates that integrated, multi-factor, ecological integrity monitoring
is needed to evaluate the effectiveness of restoration on riparian function and resilience (Purdy et al.
2012). At this time, multi-factor ecological condition monitoring of meadows and riparian areas is not
conducted on forest lands.
Overall Ecological Integrity of Aquatic and Riparian Ecosystems
An integrated assessment of ecological integrity was developed for the bio-region based on existing,
available, spatial information. This is a broad brush assessment using varied elements that either support
or decrease ecosystem function. This assessment is similar in concept to ones developed for fish across
California (Moyle et al 2011) and watersheds in national forests across the country. In addition, this is
one element of the watershed assessments done across the region and referenced in the assessments for
each forest.
A simple watershed-based index was developed by first assigning positive points for watersheds with
presence of native fish, amphibians, and insects. Negative points were assigned for watersheds with
invasive or non-native species, water development, road density, and contraction of native species (once
present but now absent). The points were totaled for each watershed and a percentage based on the total
for the watershed with the maximum points. For example, if the maximum points were 50, then a score of
25 out of 50 would get a score assigned of 50 percent. The purpose is to assess broad trends in aquatic
ecological integrity across the bio-region. There was limited information on private lands in the foothills,
particularly on the western slopes, and therefore the information is less reliable. Overall, the watersheds
are rare that have full ecological integrity.
In the map of aquatic ecological integrity below, there are several patterns across the bio-region. Higher
elevation, subalpine watersheds in the southern Sierra Nevada are in the best condition, with positive
although low index levels. This is primarily due to the presence of natives but the contraction of their
distributions. Most of the rest of the watersheds fall below zero, with negative index ratings. This is
primarily due to the presence of non-native species and contraction or loss of native species. The lowest
ratings are in the central and northern portion of the bio-region where the most extensive water
development has occurred. This includes most of the Modoc, Lassen, Plumas and Tahoe National Forests.
From the Eldorado National Forest south, through the Stanislaus, Sierra, and Sequoia National Forests,
watersheds have low ratings at mid and lower elevations but high ratings at high elevations. On the east
side, the Inyo National Forest has a mixture of low and high index ratings. These are due to high levels of
water development in some watersheds but low development in others. Much information was lacking for
the Humboldt-Toiyabe National Forest to the north of the Inyo National Forest and south of the Tahoe
National Forest and these indices are not reliable. The Modoc National Forest is similar to the adjacent
Lassen National Forest with mostly moderate and low ratings. Although less data was available for many
of the lands in the foothills, the extensive areas of human development, depicted by the black areas,
combined with extensive water development, indicates that these areas have low integrity overall. The
exception is on some watersheds on the westside of the Lassen National Forest, where many of the native
fish are still present.
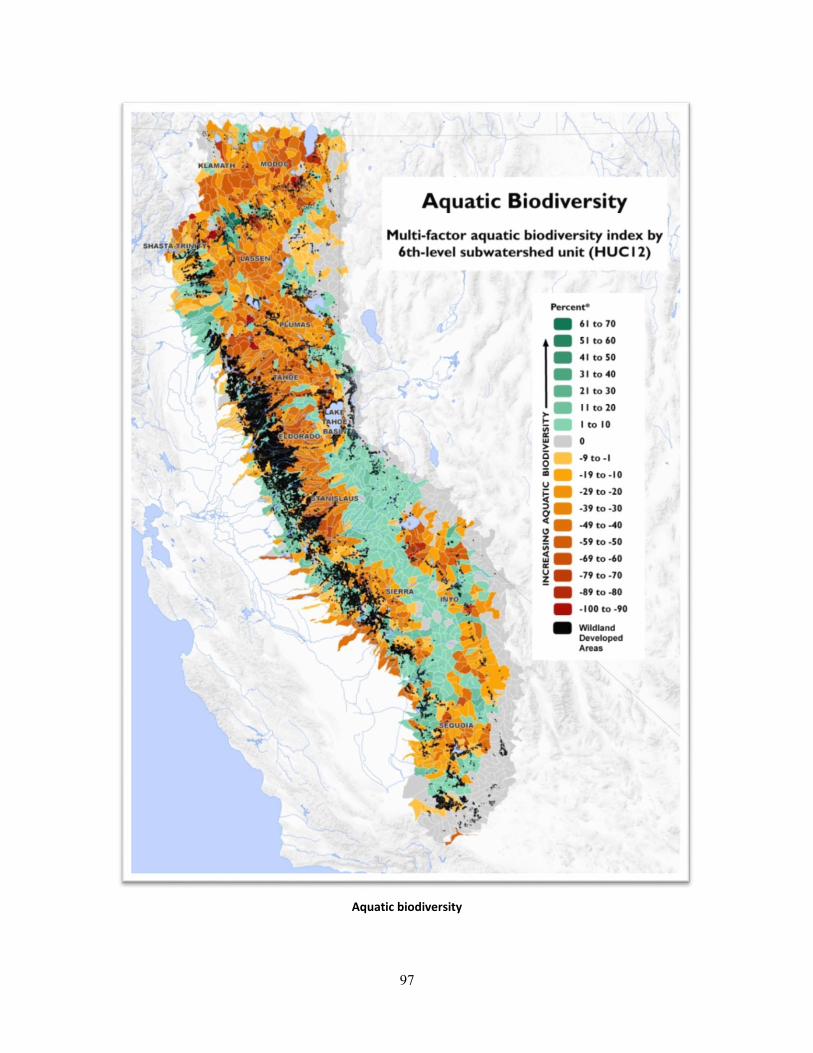
97
Aquatic biodiversity
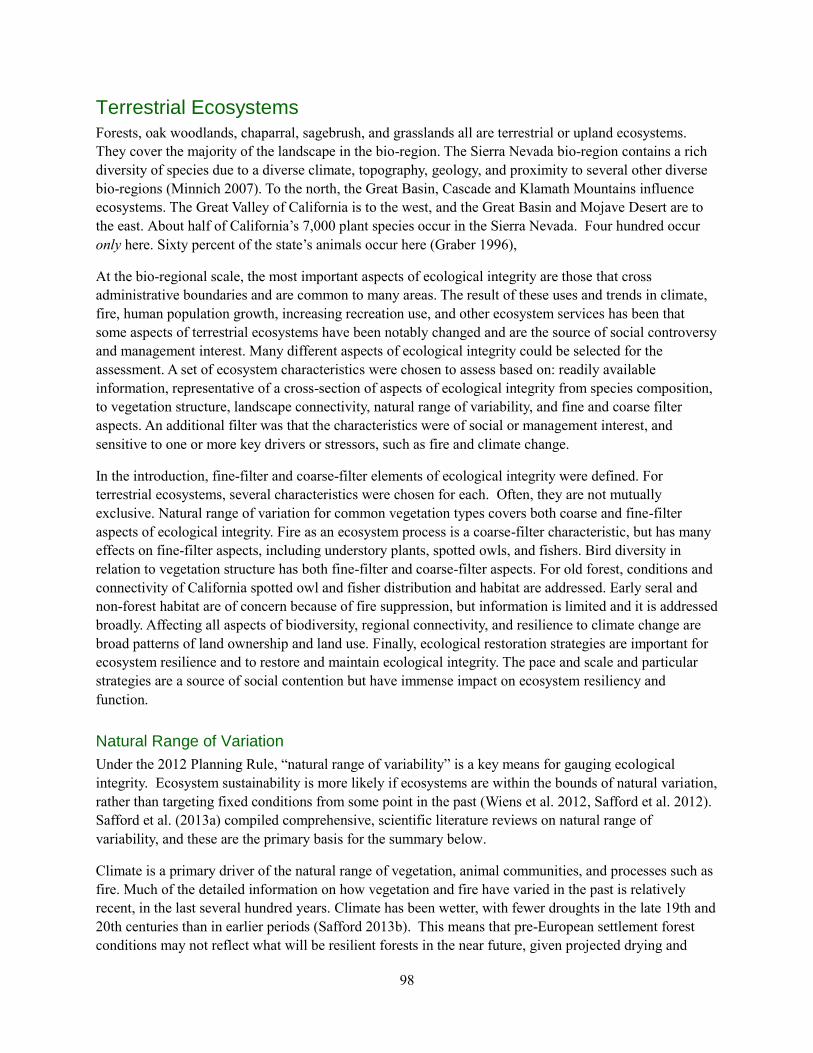
98
Terrestrial Ecosystems
Forests, oak woodlands, chaparral, sagebrush, and grasslands all are terrestrial or upland ecosystems.
They cover the majority of the landscape in the bio-region. The Sierra Nevada bio-region contains a rich
diversity of species due to a diverse climate, topography, geology, and proximity to several other diverse
bio-regions (Minnich 2007). To the north, the Great Basin, Cascade and Klamath Mountains influence
ecosystems. The Great Valley of California is to the west, and the Great Basin and Mojave Desert are to
the east. About half of California’s 7,000 plant species occur in the Sierra Nevada. Four hundred occur
only here. Sixty percent of the state’s animals occur here (Graber 1996),
At the bio-regional scale, the most important aspects of ecological integrity are those that cross
administrative boundaries and are common to many areas. The result of these uses and trends in climate,
fire, human population growth, increasing recreation use, and other ecosystem services has been that
some aspects of terrestrial ecosystems have been notably changed and are the source of social controversy
and management interest. Many different aspects of ecological integrity could be selected for the
assessment. A set of ecosystem characteristics were chosen to assess based on: readily available
information, representative of a cross-section of aspects of ecological integrity from species composition,
to vegetation structure, landscape connectivity, natural range of variability, and fine and coarse filter
aspects. An additional filter was that the characteristics were of social or management interest, and
sensitive to one or more key drivers or stressors, such as fire and climate change.
In the introduction, fine-filter and coarse-filter elements of ecological integrity were defined. For
terrestrial ecosystems, several characteristics were chosen for each. Often, they are not mutually
exclusive. Natural range of variation for common vegetation types covers both coarse and fine-filter
aspects of ecological integrity. Fire as an ecosystem process is a coarse-filter characteristic, but has many
effects on fine-filter aspects, including understory plants, spotted owls, and fishers. Bird diversity in
relation to vegetation structure has both fine-filter and coarse-filter aspects. For old forest, conditions and
connectivity of California spotted owl and fisher distribution and habitat are addressed. Early seral and
non-forest habitat are of concern because of fire suppression, but information is limited and it is addressed
broadly. Affecting all aspects of biodiversity, regional connectivity, and resilience to climate change are
broad patterns of land ownership and land use. Finally, ecological restoration strategies are important for
ecosystem resilience and to restore and maintain ecological integrity. The pace and scale and particular
strategies are a source of social contention but have immense impact on ecosystem resiliency and
function.
Natural Range of Variation
Under the 2012 Planning Rule, “natural range of variability” is a key means for gauging ecological
integrity. Ecosystem sustainability is more likely if ecosystems are within the bounds of natural variation,
rather than targeting fixed conditions from some point in the past (Wiens et al. 2012, Safford et al. 2012).
Safford et al. (2013a) compiled comprehensive, scientific literature reviews on natural range of
variability, and these are the primary basis for the summary below.
Climate is a primary driver of the natural range of vegetation, animal communities, and processes such as
fire. Much of the detailed information on how vegetation and fire have varied in the past is relatively
recent, in the last several hundred years. Climate has been wetter, with fewer droughts in the late 19th and
20th centuries than in earlier periods (Safford 2013b). This means that pre-European settlement forest
conditions may not reflect what will be resilient forests in the near future, given projected drying and
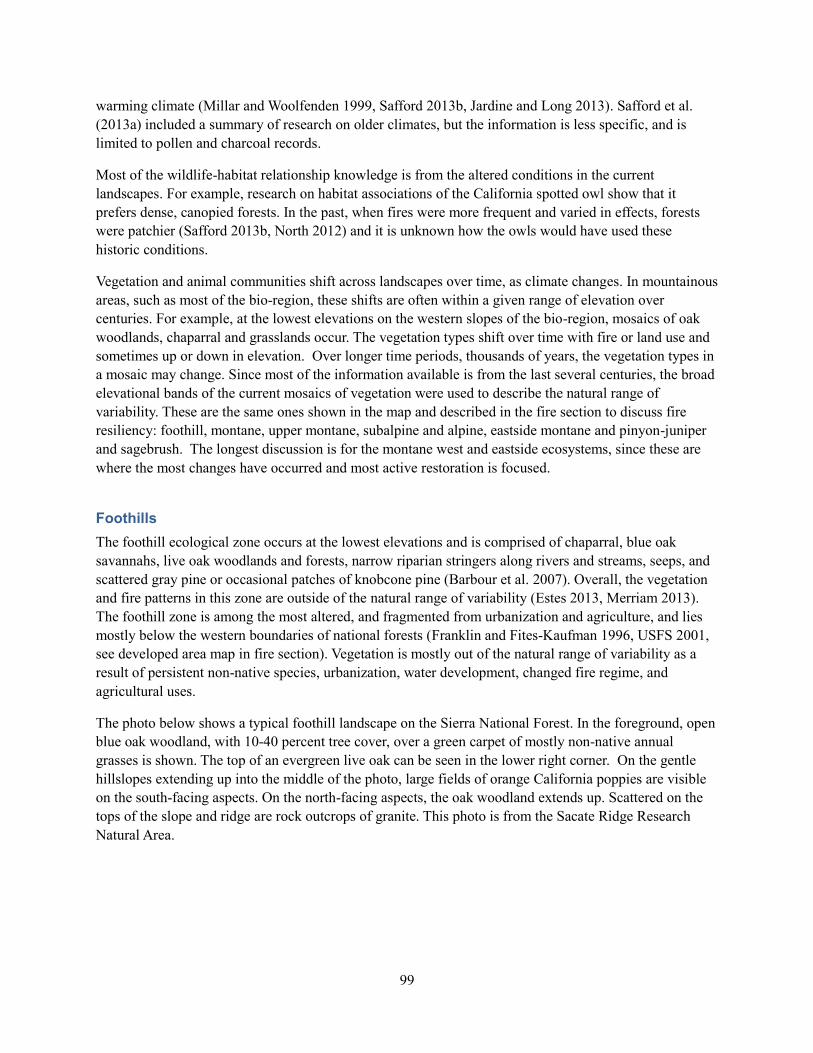
99
warming climate (Millar and Woolfenden 1999, Safford 2013b, Jardine and Long 2013). Safford et al.
(2013a) included a summary of research on older climates, but the information is less specific, and is
limited to pollen and charcoal records.
Most of the wildlife-habitat relationship knowledge is from the altered conditions in the current
landscapes. For example, research on habitat associations of the California spotted owl show that it
prefers dense, canopied forests. In the past, when fires were more frequent and varied in effects, forests
were patchier (Safford 2013b, North 2012) and it is unknown how the owls would have used these
historic conditions.
Vegetation and animal communities shift across landscapes over time, as climate changes. In mountainous
areas, such as most of the bio-region, these shifts are often within a given range of elevation over
centuries. For example, at the lowest elevations on the western slopes of the bio-region, mosaics of oak
woodlands, chaparral and grasslands occur. The vegetation types shift over time with fire or land use and
sometimes up or down in elevation. Over longer time periods, thousands of years, the vegetation types in
a mosaic may change. Since most of the information available is from the last several centuries, the broad
elevational bands of the current mosaics of vegetation were used to describe the natural range of
variability. These are the same ones shown in the map and described in the fire section to discuss fire
resiliency: foothill, montane, upper montane, subalpine and alpine, eastside montane and pinyon-juniper
and sagebrush. The longest discussion is for the montane west and eastside ecosystems, since these are
where the most changes have occurred and most active restoration is focused.
Foothills
The foothill ecological zone occurs at the lowest elevations and is comprised of chaparral, blue oak
savannahs, live oak woodlands and forests, narrow riparian stringers along rivers and streams, seeps, and
scattered gray pine or occasional patches of knobcone pine (Barbour et al. 2007). Overall, the vegetation
and fire patterns in this zone are outside of the natural range of variability (Estes 2013, Merriam 2013).
The foothill zone is among the most altered, and fragmented from urbanization and agriculture, and lies
mostly below the western boundaries of national forests (Franklin and Fites-Kaufman 1996, USFS 2001,
see developed area map in fire section). Vegetation is mostly out of the natural range of variability as a
result of persistent non-native species, urbanization, water development, changed fire regime, and
agricultural uses.
The photo below shows a typical foothill landscape on the Sierra National Forest. In the foreground, open
blue oak woodland, with 10-40 percent tree cover, over a green carpet of mostly non-native annual
grasses is shown. The top of an evergreen live oak can be seen in the lower right corner. On the gentle
hillslopes extending up into the middle of the photo, large fields of orange California poppies are visible
on the south-facing aspects. On the north-facing aspects, the oak woodland extends up. Scattered on the
tops of the slope and ridge are rock outcrops of granite. This photo is from the Sacate Ridge Research
Natural Area.
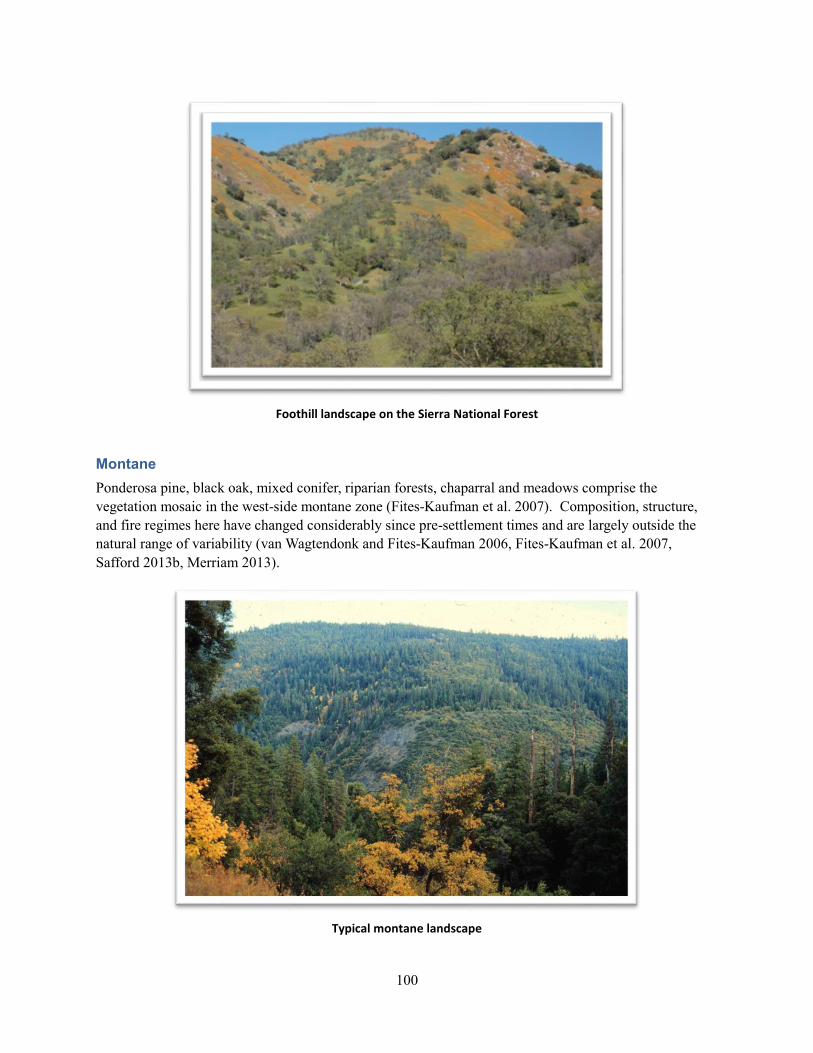
100
Foothill landscape on the Sierra National Forest
Montane
Ponderosa pine, black oak, mixed conifer, riparian forests, chaparral and meadows comprise the
vegetation mosaic in the west-side montane zone (Fites-Kaufman et al. 2007). Composition, structure,
and fire regimes here have changed considerably since pre-settlement times and are largely outside the
natural range of variability (van Wagtendonk and Fites-Kaufman 2006, Fites-Kaufman et al. 2007,
Safford 2013b, Merriam 2013).
Typical montane landscape

101
The photo of the landscape above is typical for the montane zone. In the foreground, oaks with yellow,
fall-colored leaves, are interspersed with canyon live oak, ponderosa pine, and scattered Douglas-fir.
There are several large snags, with their bark still on, on the right of the photo, right where the slope
drops off steeply into the canyon. These were likely killed by bark beetles in a dry year. Across the
canyon, a large rock outcop is partially covered by a patch of white leaf manzanita and other shrubs that
are low growing because of the very shallow, rocky soils. Few if any conifers have become established
here. Above the rock outcrop, which is at least ten acres in size, is a broad slope containing a patchwork
of hardwood, conifer and mixed stands. The cover is dense, more than 60 percent.
The degree of change in tree species depends on rainfall at the site and location in the landscape (Fites-
Kaufman et al. 2007). On many, drier, more exposed ridge tops and south or west-facing slopes, pines and
oaks have decreased substantially and shade tolerant species, such as cedar and fir, have increased
(Safford 2013b). Shade tolerant incense cedar and white fir reproduce more prolifically and can crowd out
pines when not periodically thinned or killed by low or moderate intensity fire (North 2013). In the
northern Sierra Nevada where rainfall is higher, or on lower, north or east-facing slopes, the changes have
been less dramatic, with a high proportion of Douglas-fir present before and now. At higher elevations,
near the red fir forests, a higher proportion of white fir was and is typical. Regardless of the mixture of
dominant species, tree density is higher, canopy cover of trees more uniformly higher, small and medium
tree density is higher and large tree density is lower (Fites-Kaufman et al. 2007, Safford 2013b).
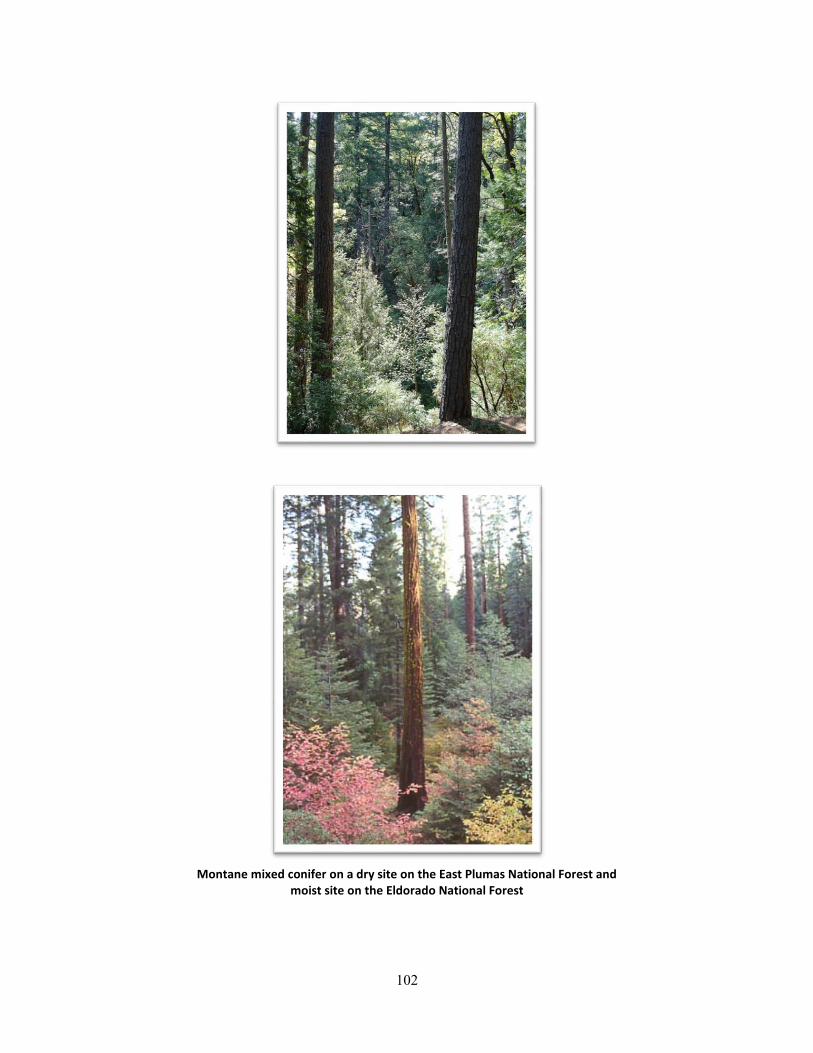
102
Montane mixed conifer on a dry site on the East Plumas National Forest and
moist site on the Eldorado National Forest
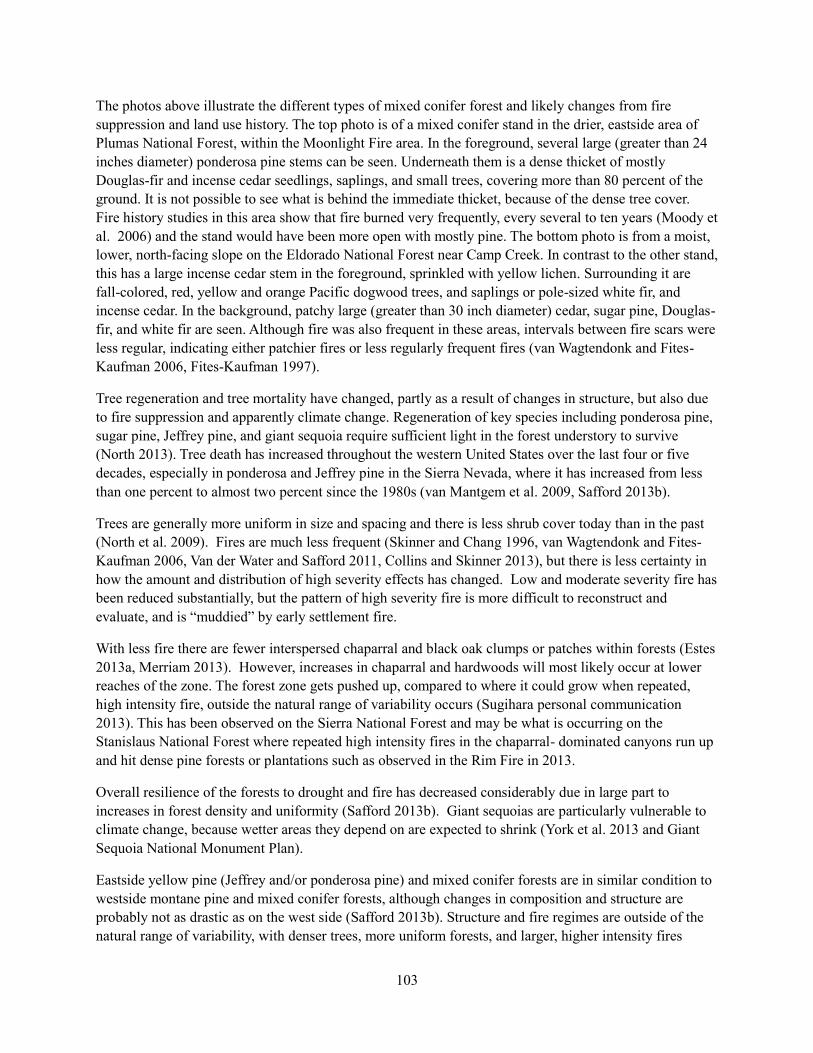
103
The photos above illustrate the different types of mixed conifer forest and likely changes from fire
suppression and land use history. The top photo is of a mixed conifer stand in the drier, eastside area of
Plumas National Forest, within the Moonlight Fire area. In the foreground, several large (greater than 24
inches diameter) ponderosa pine stems can be seen. Underneath them is a dense thicket of mostly
Douglas-fir and incense cedar seedlings, saplings, and small trees, covering more than 80 percent of the
ground. It is not possible to see what is behind the immediate thicket, because of the dense tree cover.
Fire history studies in this area show that fire burned very frequently, every several to ten years (Moody et
al. 2006) and the stand would have been more open with mostly pine. The bottom photo is from a moist,
lower, north-facing slope on the Eldorado National Forest near Camp Creek. In contrast to the other stand,
this has a large incense cedar stem in the foreground, sprinkled with yellow lichen. Surrounding it are
fall-colored, red, yellow and orange Pacific dogwood trees, and saplings or pole-sized white fir, and
incense cedar. In the background, patchy large (greater than 30 inch diameter) cedar, sugar pine, Douglas-
fir, and white fir are seen. Although fire was also frequent in these areas, intervals between fire scars were
less regular, indicating either patchier fires or less regularly frequent fires (van Wagtendonk and Fites-
Kaufman 2006, Fites-Kaufman 1997).
Tree regeneration and tree mortality have changed, partly as a result of changes in structure, but also due
to fire suppression and apparently climate change. Regeneration of key species including ponderosa pine,
sugar pine, Jeffrey pine, and giant sequoia require sufficient light in the forest understory to survive
(North 2013). Tree death has increased throughout the western United States over the last four or five
decades, especially in ponderosa and Jeffrey pine in the Sierra Nevada, where it has increased from less
than one percent to almost two percent since the 1980s (van Mantgem et al. 2009, Safford 2013b).
Trees are generally more uniform in size and spacing and there is less shrub cover today than in the past
(North et al. 2009). Fires are much less frequent (Skinner and Chang 1996, van Wagtendonk and Fites-
Kaufman 2006, Van der Water and Safford 2011, Collins and Skinner 2013), but there is less certainty in
how the amount and distribution of high severity effects has changed. Low and moderate severity fire has
been reduced substantially, but the pattern of high severity fire is more difficult to reconstruct and
evaluate, and is “muddied” by early settlement fire.
With less fire there are fewer interspersed chaparral and black oak clumps or patches within forests (Estes
2013a, Merriam 2013). However, increases in chaparral and hardwoods will most likely occur at lower
reaches of the zone. The forest zone gets pushed up, compared to where it could grow when repeated,
high intensity fire, outside the natural range of variability occurs (Sugihara personal communication
2013). This has been observed on the Sierra National Forest and may be what is occurring on the
Stanislaus National Forest where repeated high intensity fires in the chaparral- dominated canyons run up
and hit dense pine forests or plantations such as observed in the Rim Fire in 2013.
Overall resilience of the forests to drought and fire has decreased considerably due in large part to
increases in forest density and uniformity (Safford 2013b). Giant sequoias are particularly vulnerable to
climate change, because wetter areas they depend on are expected to shrink (York et al. 2013 and Giant
Sequoia National Monument Plan).
Eastside yellow pine (Jeffrey and/or ponderosa pine) and mixed conifer forests are in similar condition to
westside montane pine and mixed conifer forests, although changes in composition and structure are
probably not as drastic as on the west side (Safford 2013b). Structure and fire regimes are outside of the
natural range of variability, with denser trees, more uniform forests, and larger, higher intensity fires
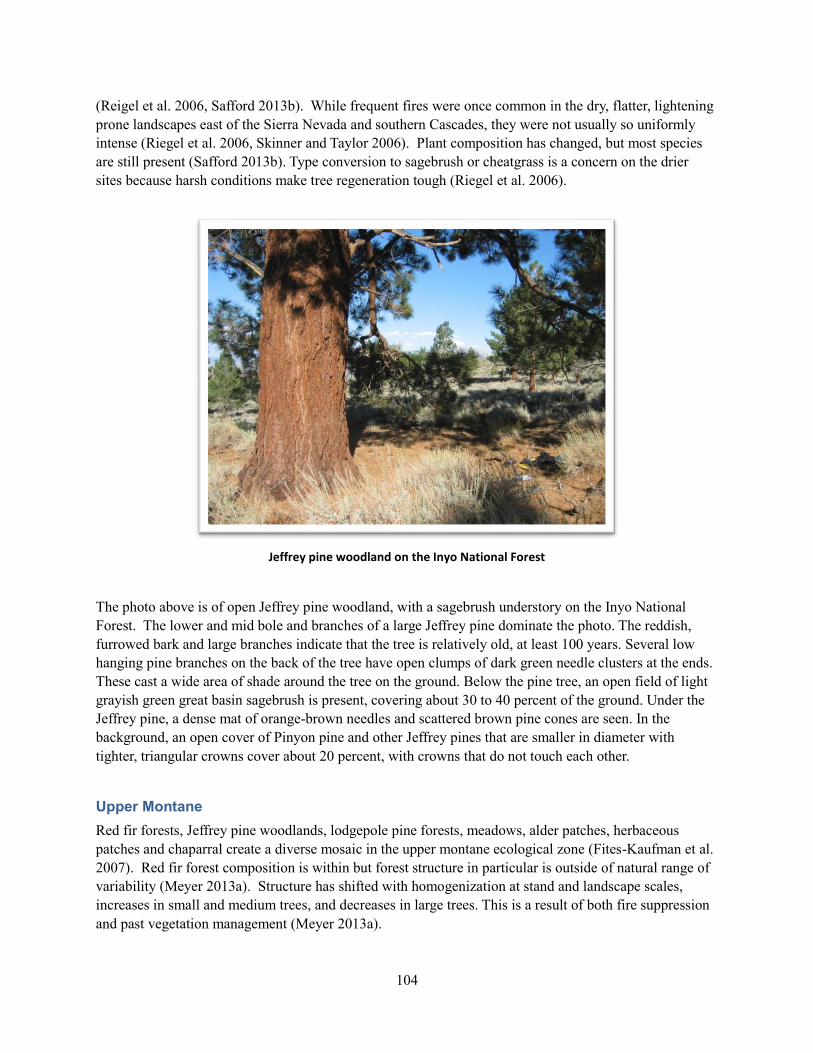
104
(Reigel et al. 2006, Safford 2013b). While frequent fires were once common in the dry, flatter, lightening
prone landscapes east of the Sierra Nevada and southern Cascades, they were not usually so uniformly
intense (Riegel et al. 2006, Skinner and Taylor 2006). Plant composition has changed, but most species
are still present (Safford 2013b). Type conversion to sagebrush or cheatgrass is a concern on the drier
sites because harsh conditions make tree regeneration tough (Riegel et al. 2006).
Jeffrey pine woodland on the Inyo National Forest
The photo above is of open Jeffrey pine woodland, with a sagebrush understory on the Inyo National
Forest. The lower and mid bole and branches of a large Jeffrey pine dominate the photo. The reddish,
furrowed bark and large branches indicate that the tree is relatively old, at least 100 years. Several low
hanging pine branches on the back of the tree have open clumps of dark green needle clusters at the ends.
These cast a wide area of shade around the tree on the ground. Below the pine tree, an open field of light
grayish green great basin sagebrush is present, covering about 30 to 40 percent of the ground. Under the
Jeffrey pine, a dense mat of orange-brown needles and scattered brown pine cones are seen. In the
background, an open cover of Pinyon pine and other Jeffrey pines that are smaller in diameter with
tighter, triangular crowns cover about 20 percent, with crowns that do not touch each other.
Upper Montane
Red fir forests, Jeffrey pine woodlands, lodgepole pine forests, meadows, alder patches, herbaceous
patches and chaparral create a diverse mosaic in the upper montane ecological zone (Fites-Kaufman et al.
2007). Red fir forest composition is within but forest structure in particular is outside of natural range of
variability (Meyer 2013a). Structure has shifted with homogenization at stand and landscape scales,
increases in small and medium trees, and decreases in large trees. This is a result of both fire suppression
and past vegetation management (Meyer 2013a).
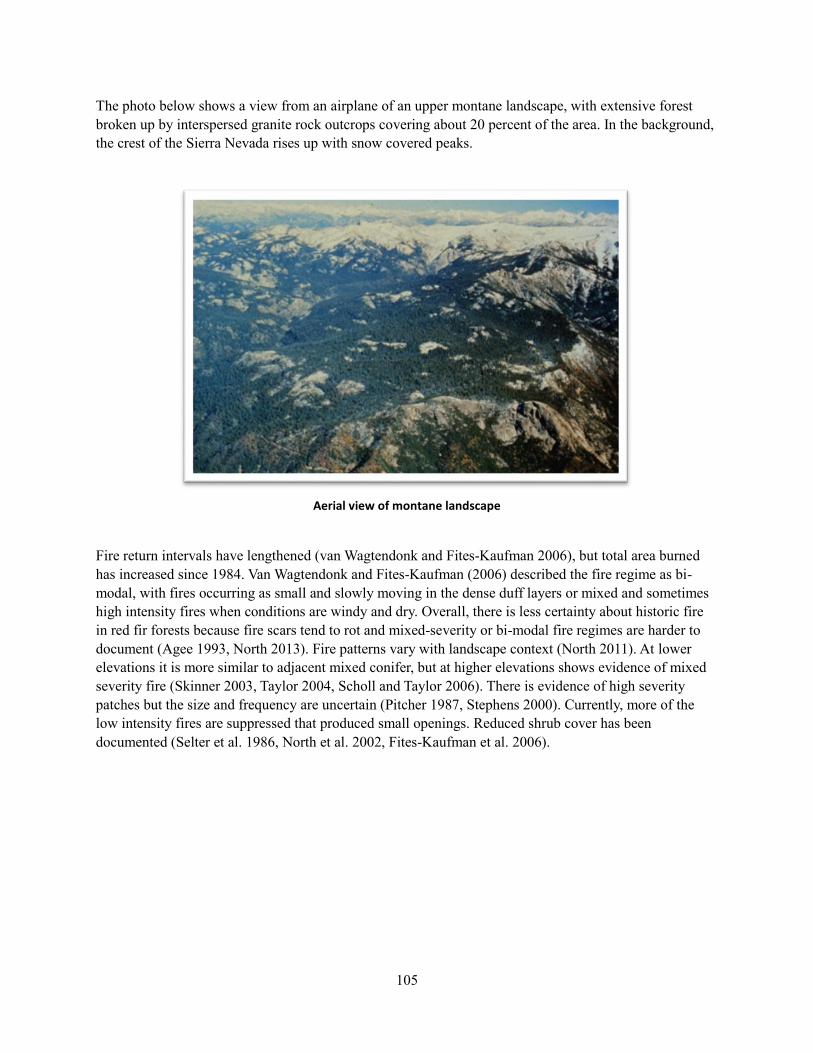
105
The photo below shows a view from an airplane of an upper montane landscape, with extensive forest
broken up by interspersed granite rock outcrops covering about 20 percent of the area. In the background,
the crest of the Sierra Nevada rises up with snow covered peaks.
Aerial view of montane landscape
Fire return intervals have lengthened (van Wagtendonk and Fites-Kaufman 2006), but total area burned
has increased since 1984. Van Wagtendonk and Fites-Kaufman (2006) described the fire regime as bi-
modal, with fires occurring as small and slowly moving in the dense duff layers or mixed and sometimes
high intensity fires when conditions are windy and dry. Overall, there is less certainty about historic fire
in red fir forests because fire scars tend to rot and mixed-severity or bi-modal fire regimes are harder to
document (Agee 1993, North 2013). Fire patterns vary with landscape context (North 2011). At lower
elevations it is more similar to adjacent mixed conifer, but at higher elevations shows evidence of mixed
severity fire (Skinner 2003, Taylor 2004, Scholl and Taylor 2006). There is evidence of high severity
patches but the size and frequency are uncertain (Pitcher 1987, Stephens 2000). Currently, more of the
low intensity fires are suppressed that produced small openings. Reduced shrub cover has been
documented (Selter et al. 1986, North et al. 2002, Fites-Kaufman et al. 2006).
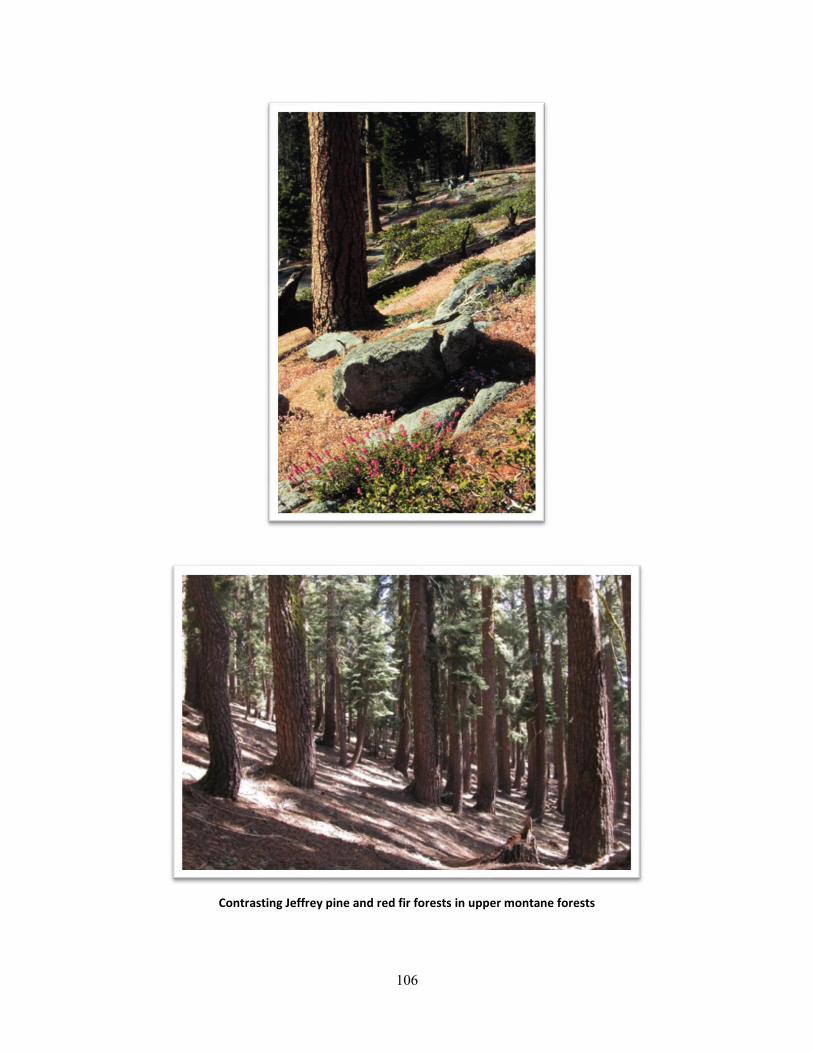
106
Contrasting Jeffrey pine and red fir forests in upper montane forests
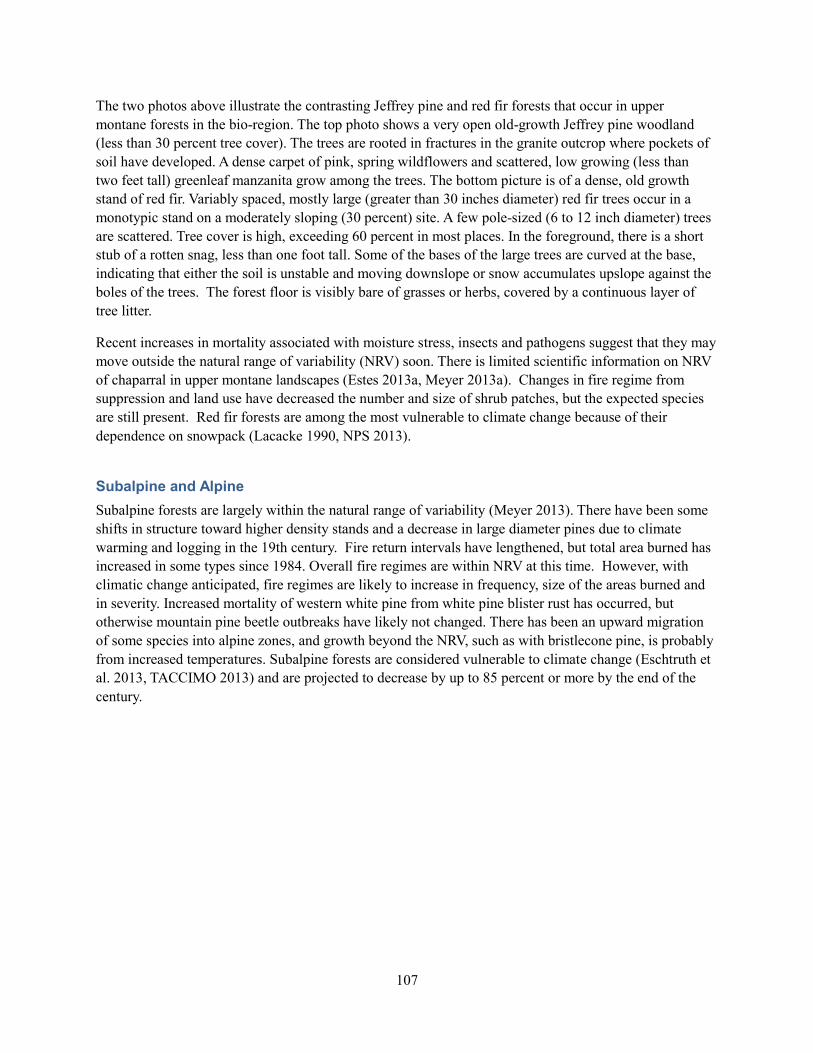
107
The two photos above illustrate the contrasting Jeffrey pine and red fir forests that occur in upper
montane forests in the bio-region. The top photo shows a very open old-growth Jeffrey pine woodland
(less than 30 percent tree cover). The trees are rooted in fractures in the granite outcrop where pockets of
soil have developed. A dense carpet of pink, spring wildflowers and scattered, low growing (less than
two feet tall) greenleaf manzanita grow among the trees. The bottom picture is of a dense, old growth
stand of red fir. Variably spaced, mostly large (greater than 30 inches diameter) red fir trees occur in a
monotypic stand on a moderately sloping (30 percent) site. A few pole-sized (6 to 12 inch diameter) trees
are scattered. Tree cover is high, exceeding 60 percent in most places. In the foreground, there is a short
stub of a rotten snag, less than one foot tall. Some of the bases of the large trees are curved at the base,
indicating that either the soil is unstable and moving downslope or snow accumulates upslope against the
boles of the trees. The forest floor is visibly bare of grasses or herbs, covered by a continuous layer of
tree litter.
Recent increases in mortality associated with moisture stress, insects and pathogens suggest that they may
move outside the natural range of variability (NRV) soon. There is limited scientific information on NRV
of chaparral in upper montane landscapes (Estes 2013a, Meyer 2013a). Changes in fire regime from
suppression and land use have decreased the number and size of shrub patches, but the expected species
are still present. Red fir forests are among the most vulnerable to climate change because of their
dependence on snowpack (Lacacke 1990, NPS 2013).
Subalpine and Alpine
Subalpine forests are largely within the natural range of variability (Meyer 2013). There have been some
shifts in structure toward higher density stands and a decrease in large diameter pines due to climate
warming and logging in the 19th century. Fire return intervals have lengthened, but total area burned has
increased in some types since 1984. Overall fire regimes are within NRV at this time. However, with
climatic change anticipated, fire regimes are likely to increase in frequency, size of the areas burned and
in severity. Increased mortality of western white pine from white pine blister rust has occurred, but
otherwise mountain pine beetle outbreaks have likely not changed. There has been an upward migration
of some species into alpine zones, and growth beyond the NRV, such as with bristlecone pine, is probably
from increased temperatures. Subalpine forests are considered vulnerable to climate change (Eschtruth et
al. 2013, TACCIMO 2013) and are projected to decrease by up to 85 percent or more by the end of the
century.
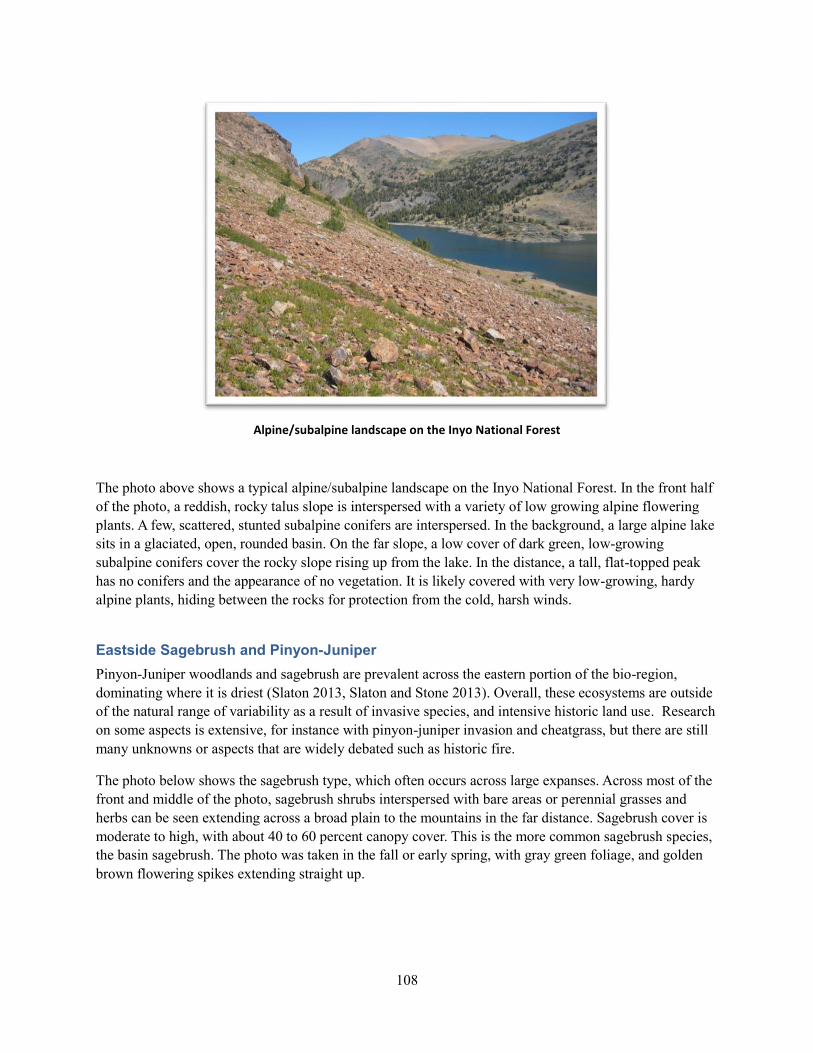
108
Alpine/subalpine landscape on the Inyo National Forest
The photo above shows a typical alpine/subalpine landscape on the Inyo National Forest. In the front half
of the photo, a reddish, rocky talus slope is interspersed with a variety of low growing alpine flowering
plants. A few, scattered, stunted subalpine conifers are interspersed. In the background, a large alpine lake
sits in a glaciated, open, rounded basin. On the far slope, a low cover of dark green, low-growing
subalpine conifers cover the rocky slope rising up from the lake. In the distance, a tall, flat-topped peak
has no conifers and the appearance of no vegetation. It is likely covered with very low-growing, hardy
alpine plants, hiding between the rocks for protection from the cold, harsh winds.
Eastside Sagebrush and Pinyon-Juniper
Pinyon-Juniper woodlands and sagebrush are prevalent across the eastern portion of the bio-region,
dominating where it is driest (Slaton 2013, Slaton and Stone 2013). Overall, these ecosystems are outside
of the natural range of variability as a result of invasive species, and intensive historic land use. Research
on some aspects is extensive, for instance with pinyon-juniper invasion and cheatgrass, but there are still
many unknowns or aspects that are widely debated such as historic fire.
The photo below shows the sagebrush type, which often occurs across large expanses. Across most of the
front and middle of the photo, sagebrush shrubs interspersed with bare areas or perennial grasses and
herbs can be seen extending across a broad plain to the mountains in the far distance. Sagebrush cover is
moderate to high, with about 40 to 60 percent canopy cover. This is the more common sagebrush species,
the basin sagebrush. The photo was taken in the fall or early spring, with gray green foliage, and golden
brown flowering spikes extending straight up.
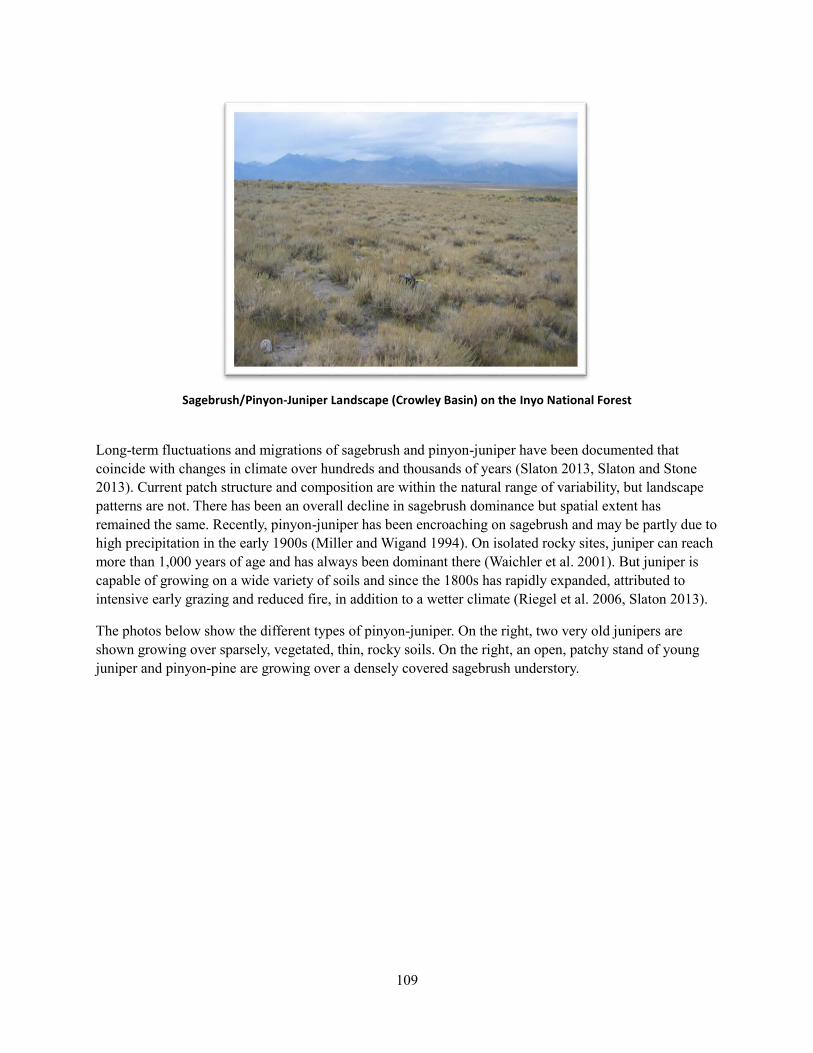
109
Sagebrush/Pinyon-Juniper Landscape (Crowley Basin) on the Inyo National Forest
Long-term fluctuations and migrations of sagebrush and pinyon-juniper have been documented that
coincide with changes in climate over hundreds and thousands of years (Slaton 2013, Slaton and Stone
2013). Current patch structure and composition are within the natural range of variability, but landscape
patterns are not. There has been an overall decline in sagebrush dominance but spatial extent has
remained the same. Recently, pinyon-juniper has been encroaching on sagebrush and may be partly due to
high precipitation in the early 1900s (Miller and Wigand 1994). On isolated rocky sites, juniper can reach
more than 1,000 years of age and has always been dominant there (Waichler et al. 2001). But juniper is
capable of growing on a wide variety of soils and since the 1800s has rapidly expanded, attributed to
intensive early grazing and reduced fire, in addition to a wetter climate (Riegel et al. 2006, Slaton 2013).
The photos below show the different types of pinyon-juniper. On the right, two very old junipers are
shown growing over sparsely, vegetated, thin, rocky soils. On the right, an open, patchy stand of young
juniper and pinyon-pine are growing over a densely covered sagebrush understory.
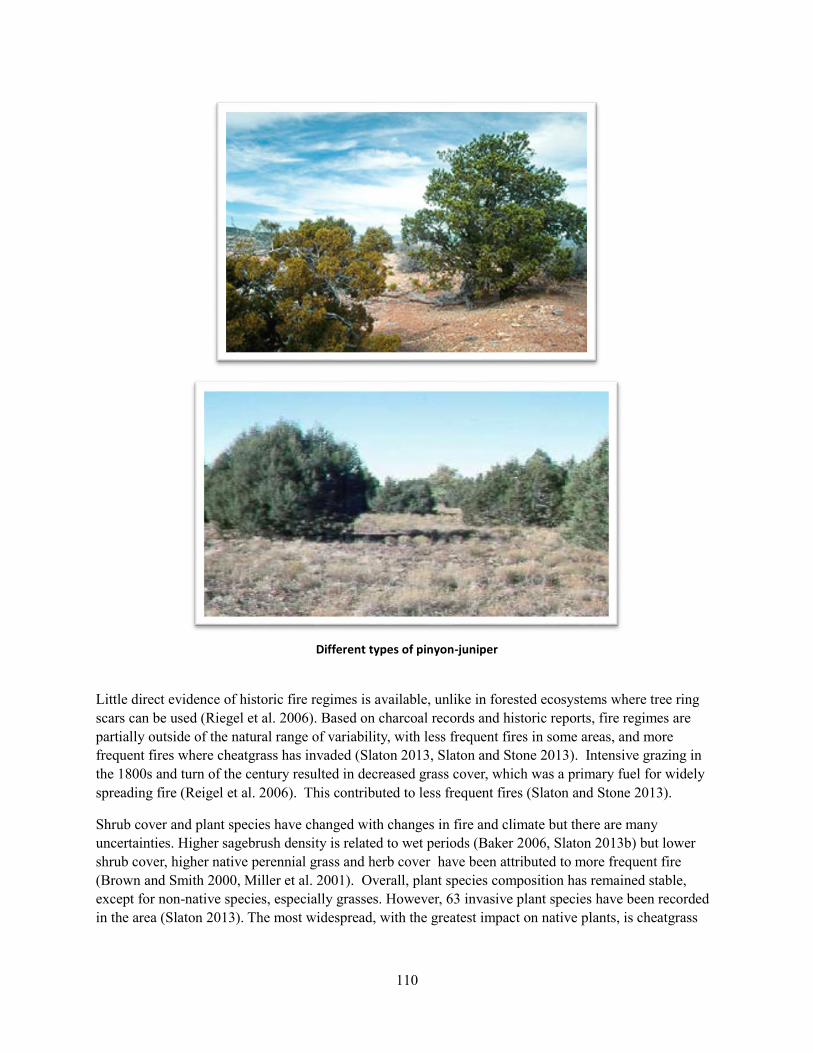
110
Different types of pinyon-juniper
Little direct evidence of historic fire regimes is available, unlike in forested ecosystems where tree ring
scars can be used (Riegel et al. 2006). Based on charcoal records and historic reports, fire regimes are
partially outside of the natural range of variability, with less frequent fires in some areas, and more
frequent fires where cheatgrass has invaded (Slaton 2013, Slaton and Stone 2013). Intensive grazing in
the 1800s and turn of the century resulted in decreased grass cover, which was a primary fuel for widely
spreading fire (Reigel et al. 2006). This contributed to less frequent fires (Slaton and Stone 2013).
Shrub cover and plant species have changed with changes in fire and climate but there are many
uncertainties. Higher sagebrush density is related to wet periods (Baker 2006, Slaton 2013b) but lower
shrub cover, higher native perennial grass and herb cover have been attributed to more frequent fire
(Brown and Smith 2000, Miller et al. 2001). Overall, plant species composition has remained stable,
except for non-native species, especially grasses. However, 63 invasive plant species have been recorded
in the area (Slaton 2013). The most widespread, with the greatest impact on native plants, is cheatgrass
111
(Chambers et al. 2007). The susceptibility of ecosystems to cheatgrass is poorly understood. Lower
elevations and drier sites are the most vulnerable.
Fire as an Ecosystem Process
Fire is the single most dominant ecological process affecting terrestrial biodiversity and ecological
integrity across much of the bio-region. The nature of fire has changed dramatically in most ecosystems
and vegetation types since the late 1800s. As described above, while fire overall has decreased, the
incidence of “uncharacteristic” fires has increased. The dilemma of the ecological deficit of fire and
prevalence of uncharacteristic fires is especially problematic in the mid-elevation yellow pine and mixed
conifer forests. These forest types encompass 7.5 million acres in the bio-region (Safford 2013b), provide
a large proportion of ecosystem services, and are the major habitat for two species of focused interest and
controversy, the California spotted owl and fisher.
Most scientists, land managers, and the public believe that current patterns of uncharacteristic fires are not
desirable, for both social and ecological reasons (e.g. Collins and Skinner 2013, Keane 2013, Winters
2013, Zielinksi 2013). In order to address the issue, it is important to consider the ecological role of fire.
There have been numerous comprehensive compilations of scientific information on the ecological role of
fire, such as the book Fire in California Ecosystems (Sugihara et al. 2006). Here, we summarize this and
more recent information on the ecological role of fire in ecological integrity.
Van Der Water and Safford (2011) conducted a comprehensive review of historic and current fire
frequency data for all major vegetation types on national forests in California. This provides an estimate
of how much has been “missed” with fire suppression across the landscape. The map below is from that
analysis and shows the percent of departure from reconstructed, historic, mean fire return intervals. The
lower and mid-elevations in the central and northern Sierra Nevada, and southern Cascades have
experienced the greatest departures in fire. Yellow pine, mixed conifer, and hardwood forests and
woodlands have generally experienced a two-thirds decrease in mean fire return interval. For example,
research on evidence of fire from tree rings in giant sequoia stumps and logs in the Sequoia National Park
showed that fires burned on an average every five to ten years within a watershed (Caprio and Swetnam
1995). Currently, the frequency is more than 100 years between fires (Van de Water and Safford 2011).
This extends across most of the Modoc National Forest south through the Sequoia National Forest. In the
southeastern area, on the Inyo National Forest, the departure includes both reduced fire in yellow pine
forests and increased fire in sagebrush where cheatgrass has invaded. At higher elevations in subalpine
and alpine areas, there has been relatively little to no change. Upper montane, red fir, Jeffrey pine, and
lodgepole pine forests have experienced moderate declines in fire return intervals, although as described
above in the natural range of variability section, historic fire patterns are more variable.
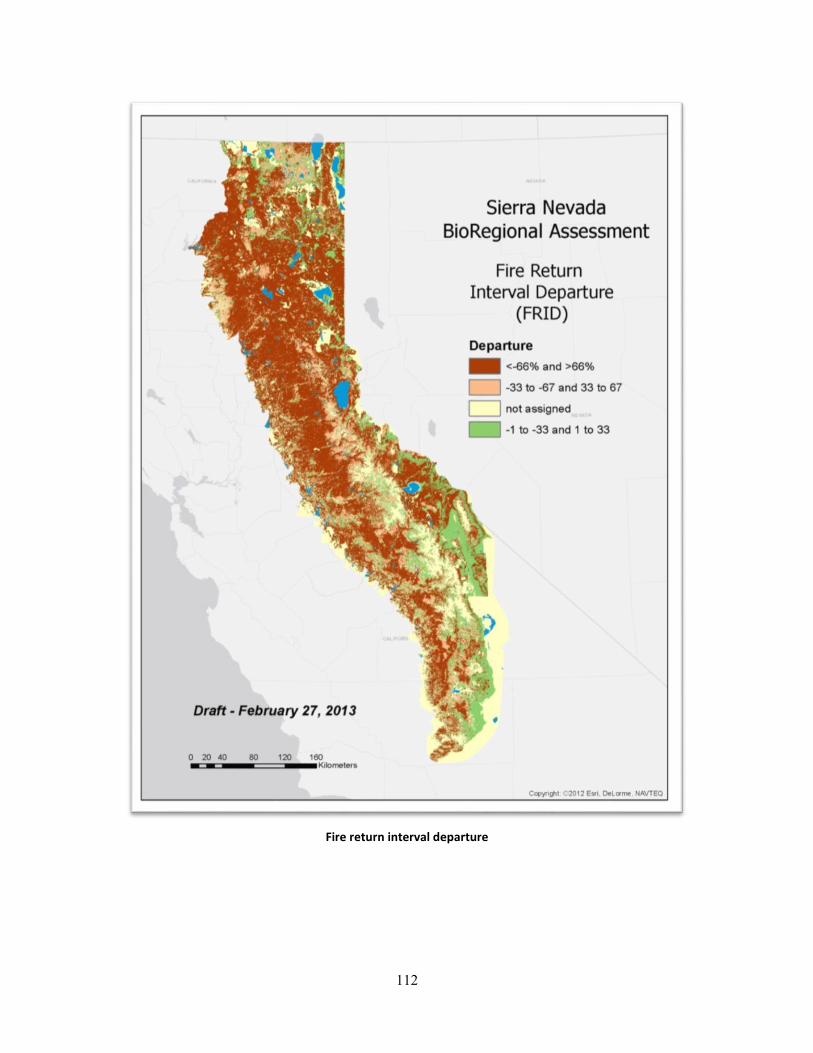
112
Fire return interval departure
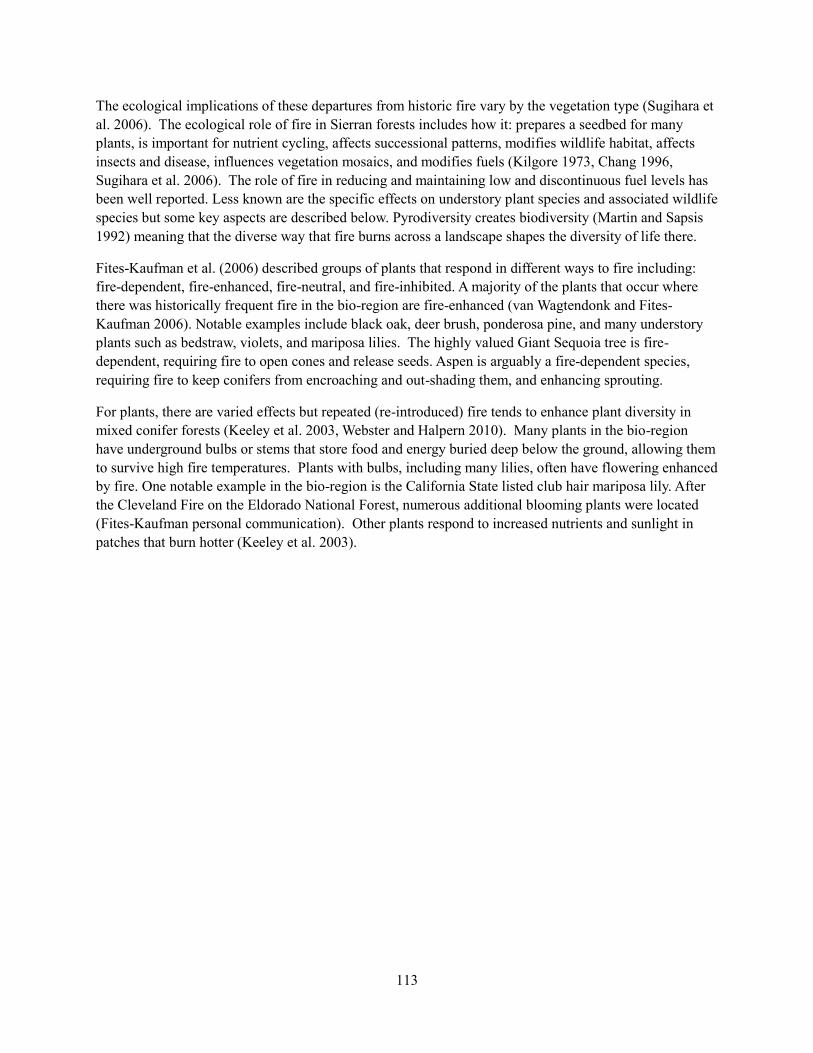
113
The ecological implications of these departures from historic fire vary by the vegetation type (Sugihara et
al. 2006). The ecological role of fire in Sierran forests includes how it: prepares a seedbed for many
plants, is important for nutrient cycling, affects successional patterns, modifies wildlife habitat, affects
insects and disease, influences vegetation mosaics, and modifies fuels (Kilgore 1973, Chang 1996,
Sugihara et al. 2006). The role of fire in reducing and maintaining low and discontinuous fuel levels has
been well reported. Less known are the specific effects on understory plant species and associated wildlife
species but some key aspects are described below. Pyrodiversity creates biodiversity (Martin and Sapsis
1992) meaning that the diverse way that fire burns across a landscape shapes the diversity of life there.
Fites-Kaufman et al. (2006) described groups of plants that respond in different ways to fire including:
fire-dependent, fire-enhanced, fire-neutral, and fire-inhibited. A majority of the plants that occur where
there was historically frequent fire in the bio-region are fire-enhanced (van Wagtendonk and Fites-
Kaufman 2006). Notable examples include black oak, deer brush, ponderosa pine, and many understory
plants such as bedstraw, violets, and mariposa lilies. The highly valued Giant Sequoia tree is fire-
dependent, requiring fire to open cones and release seeds. Aspen is arguably a fire-dependent species,
requiring fire to keep conifers from encroaching and out-shading them, and enhancing sprouting.
For plants, there are varied effects but repeated (re-introduced) fire tends to enhance plant diversity in
mixed conifer forests (Keeley et al. 2003, Webster and Halpern 2010). Many plants in the bio-region
have underground bulbs or stems that store food and energy buried deep below the ground, allowing them
to survive high fire temperatures. Plants with bulbs, including many lilies, often have flowering enhanced
by fire. One notable example in the bio-region is the California State listed club hair mariposa lily. After
the Cleveland Fire on the Eldorado National Forest, numerous additional blooming plants were located
(Fites-Kaufman personal communication). Other plants respond to increased nutrients and sunlight in
patches that burn hotter (Keeley et al. 2003).
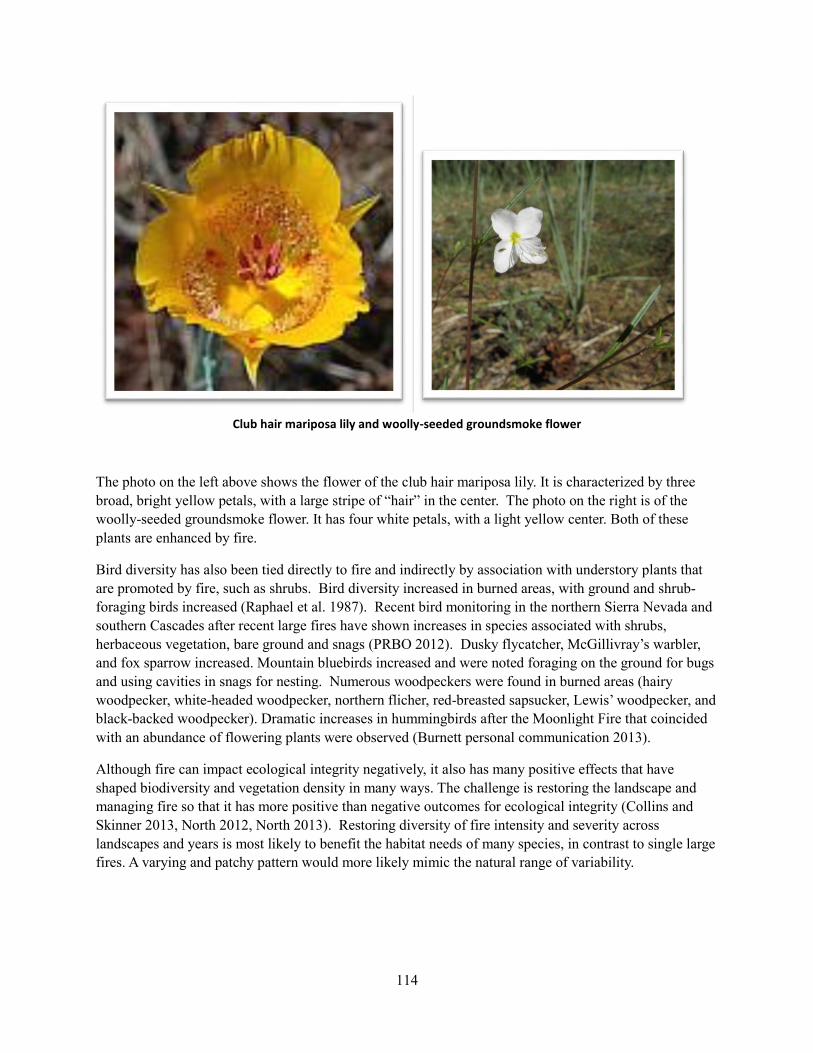
114
Club hair mariposa lily and woolly-seeded groundsmoke flower
The photo on the left above shows the flower of the club hair mariposa lily. It is characterized by three
broad, bright yellow petals, with a large stripe of “hair” in the center. The photo on the right is of the
woolly-seeded groundsmoke flower. It has four white petals, with a light yellow center. Both of these
plants are enhanced by fire.
Bird diversity has also been tied directly to fire and indirectly by association with understory plants that
are promoted by fire, such as shrubs. Bird diversity increased in burned areas, with ground and shrub-
foraging birds increased (Raphael et al. 1987). Recent bird monitoring in the northern Sierra Nevada and
southern Cascades after recent large fires have shown increases in species associated with shrubs,
herbaceous vegetation, bare ground and snags (PRBO 2012). Dusky flycatcher, McGillivray’s warbler,
and fox sparrow increased. Mountain bluebirds increased and were noted foraging on the ground for bugs
and using cavities in snags for nesting. Numerous woodpeckers were found in burned areas (hairy
woodpecker, white-headed woodpecker, northern flicher, red-breasted sapsucker, Lewis’ woodpecker, and
black-backed woodpecker). Dramatic increases in hummingbirds after the Moonlight Fire that coincided
with an abundance of flowering plants were observed (Burnett personal communication 2013).
Although fire can impact ecological integrity negatively, it also has many positive effects that have
shaped biodiversity and vegetation density in many ways. The challenge is restoring the landscape and
managing fire so that it has more positive than negative outcomes for ecological integrity (Collins and
Skinner 2013, North 2012, North 2013). Restoring diversity of fire intensity and severity across
landscapes and years is most likely to benefit the habitat needs of many species, in contrast to single large
fires. A varying and patchy pattern would more likely mimic the natural range of variability.
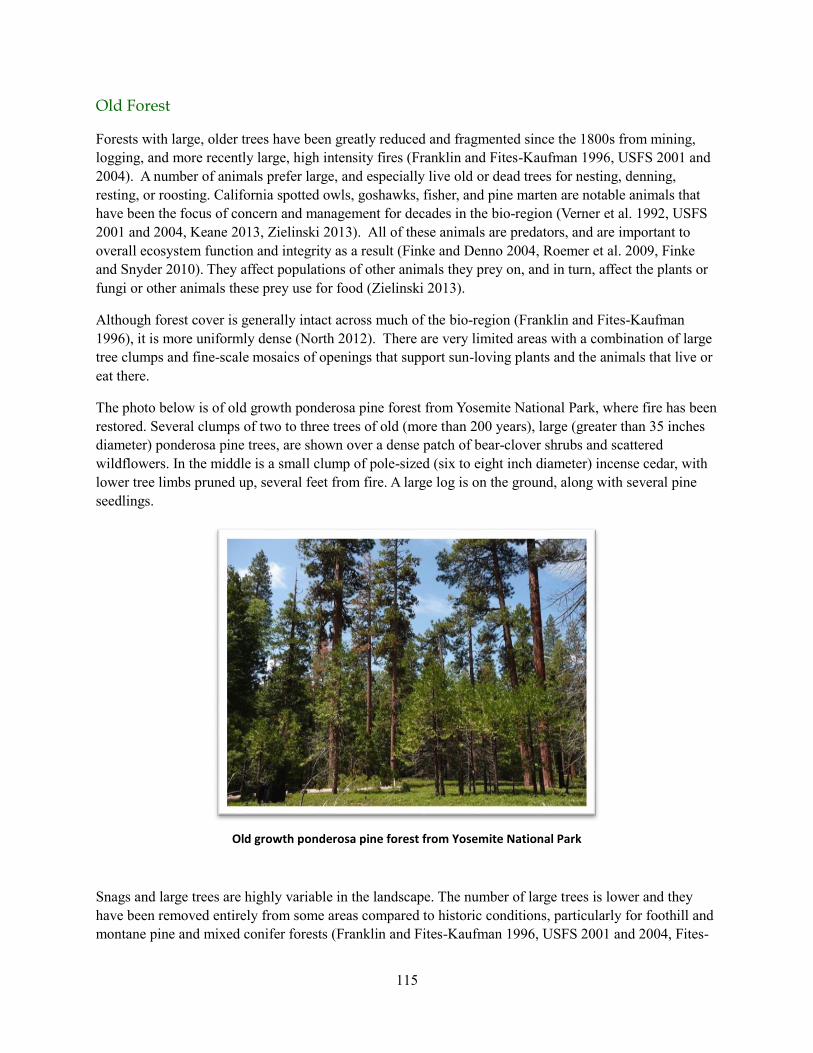
115
Old Forest
Forests with large, older trees have been greatly reduced and fragmented since the 1800s from mining,
logging, and more recently large, high intensity fires (Franklin and Fites-Kaufman 1996, USFS 2001 and
2004). A number of animals prefer large, and especially live old or dead trees for nesting, denning,
resting, or roosting. California spotted owls, goshawks, fisher, and pine marten are notable animals that
have been the focus of concern and management for decades in the bio-region (Verner et al. 1992, USFS
2001 and 2004, Keane 2013, Zielinski 2013). All of these animals are predators, and are important to
overall ecosystem function and integrity as a result (Finke and Denno 2004, Roemer et al. 2009, Finke
and Snyder 2010). They affect populations of other animals they prey on, and in turn, affect the plants or
fungi or other animals these prey use for food (Zielinski 2013).
Although forest cover is generally intact across much of the bio-region (Franklin and Fites-Kaufman
1996), it is more uniformly dense (North 2012). There are very limited areas with a combination of large
tree clumps and fine-scale mosaics of openings that support sun-loving plants and the animals that live or
eat there.
The photo below is of old growth ponderosa pine forest from Yosemite National Park, where fire has been
restored. Several clumps of two to three trees of old (more than 200 years), large (greater than 35 inches
diameter) ponderosa pine trees, are shown over a dense patch of bear-clover shrubs and scattered
wildflowers. In the middle is a small clump of pole-sized (six to eight inch diameter) incense cedar, with
lower tree limbs pruned up, several feet from fire. A large log is on the ground, along with several pine
seedlings.
Old growth ponderosa pine forest from Yosemite National Park
Snags and large trees are highly variable in the landscape. The number of large trees is lower and they
have been removed entirely from some areas compared to historic conditions, particularly for foothill and
montane pine and mixed conifer forests (Franklin and Fites-Kaufman 1996, USFS 2001 and 2004, Fites-
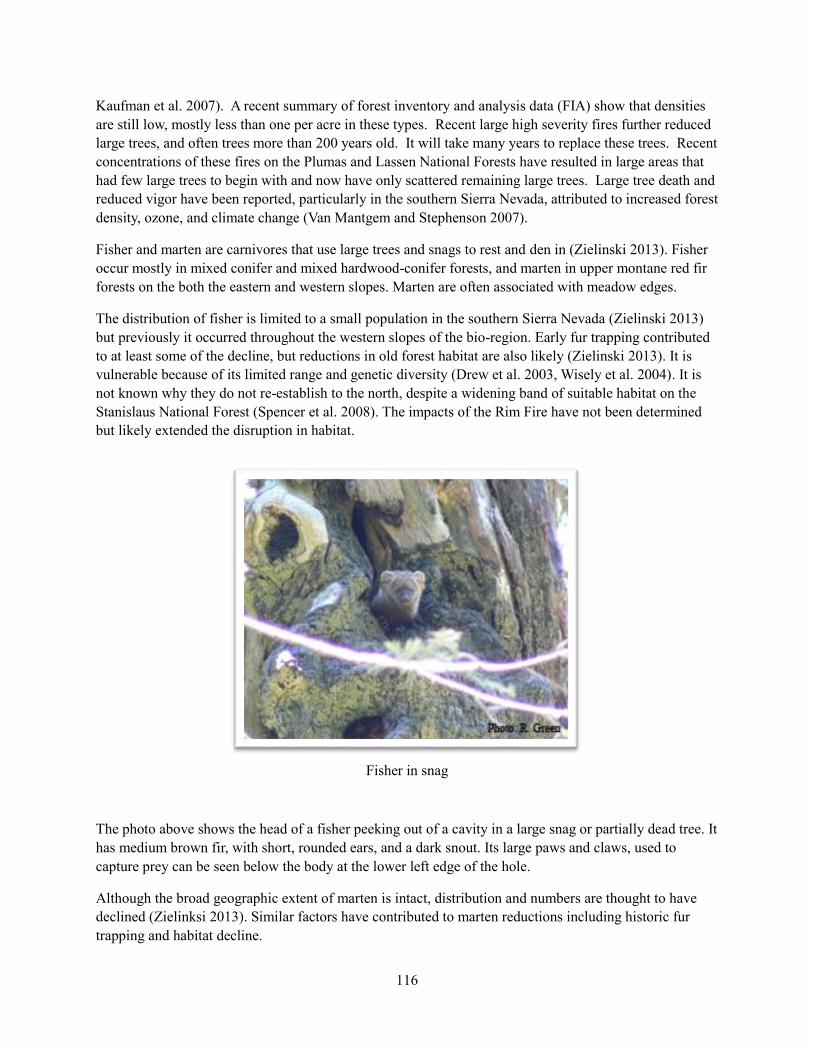
116
Kaufman et al. 2007). A recent summary of forest inventory and analysis data (FIA) show that densities
are still low, mostly less than one per acre in these types. Recent large high severity fires further reduced
large trees, and often trees more than 200 years old. It will take many years to replace these trees. Recent
concentrations of these fires on the Plumas and Lassen National Forests have resulted in large areas that
had few large trees to begin with and now have only scattered remaining large trees. Large tree death and
reduced vigor have been reported, particularly in the southern Sierra Nevada, attributed to increased forest
density, ozone, and climate change (Van Mantgem and Stephenson 2007).
Fisher and marten are carnivores that use large trees and snags to rest and den in (Zielinski 2013). Fisher
occur mostly in mixed conifer and mixed hardwood-conifer forests, and marten in upper montane red fir
forests on the both the eastern and western slopes. Marten are often associated with meadow edges.
The distribution of fisher is limited to a small population in the southern Sierra Nevada (Zielinski 2013)
but previously it occurred throughout the western slopes of the bio-region. Early fur trapping contributed
to at least some of the decline, but reductions in old forest habitat are also likely (Zielinski 2013). It is
vulnerable because of its limited range and genetic diversity (Drew et al. 2003, Wisely et al. 2004). It is
not known why they do not re-establish to the north, despite a widening band of suitable habitat on the
Stanislaus National Forest (Spencer et al. 2008). The impacts of the Rim Fire have not been determined
but likely extended the disruption in habitat.
Fisher in snag
The photo above shows the head of a fisher peeking out of a cavity in a large snag or partially dead tree. It
has medium brown fir, with short, rounded ears, and a dark snout. Its large paws and claws, used to
capture prey can be seen below the body at the lower left edge of the hole.
Although the broad geographic extent of marten is intact, distribution and numbers are thought to have
declined (Zielinksi 2013). Similar factors have contributed to marten reductions including historic fur
trapping and habitat decline.
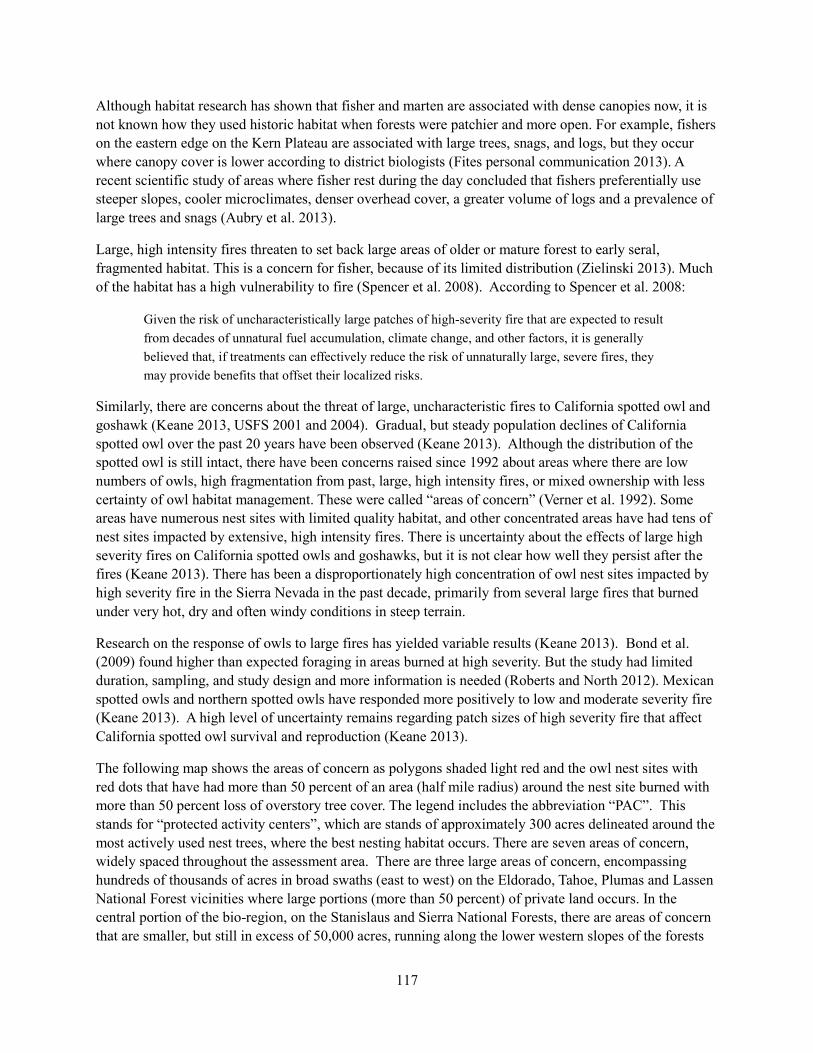
117
Although habitat research has shown that fisher and marten are associated with dense canopies now, it is
not known how they used historic habitat when forests were patchier and more open. For example, fishers
on the eastern edge on the Kern Plateau are associated with large trees, snags, and logs, but they occur
where canopy cover is lower according to district biologists (Fites personal communication 2013). A
recent scientific study of areas where fisher rest during the day concluded that fishers preferentially use
steeper slopes, cooler microclimates, denser overhead cover, a greater volume of logs and a prevalence of
large trees and snags (Aubry et al. 2013).
Large, high intensity fires threaten to set back large areas of older or mature forest to early seral,
fragmented habitat. This is a concern for fisher, because of its limited distribution (Zielinski 2013). Much
of the habitat has a high vulnerability to fire (Spencer et al. 2008). According to Spencer et al. 2008:
Given the risk of uncharacteristically large patches of high-severity fire that are expected to result
from decades of unnatural fuel accumulation, climate change, and other factors, it is generally
believed that, if treatments can effectively reduce the risk of unnaturally large, severe fires, they
may provide benefits that offset their localized risks.
Similarly, there are concerns about the threat of large, uncharacteristic fires to California spotted owl and
goshawk (Keane 2013, USFS 2001 and 2004). Gradual, but steady population declines of California
spotted owl over the past 20 years have been observed (Keane 2013). Although the distribution of the
spotted owl is still intact, there have been concerns raised since 1992 about areas where there are low
numbers of owls, high fragmentation from past, large, high intensity fires, or mixed ownership with less
certainty of owl habitat management. These were called “areas of concern” (Verner et al. 1992). Some
areas have numerous nest sites with limited quality habitat, and other concentrated areas have had tens of
nest sites impacted by extensive, high intensity fires. There is uncertainty about the effects of large high
severity fires on California spotted owls and goshawks, but it is not clear how well they persist after the
fires (Keane 2013). There has been a disproportionately high concentration of owl nest sites impacted by
high severity fire in the Sierra Nevada in the past decade, primarily from several large fires that burned
under very hot, dry and often windy conditions in steep terrain.
Research on the response of owls to large fires has yielded variable results (Keane 2013). Bond et al.
(2009) found higher than expected foraging in areas burned at high severity. But the study had limited
duration, sampling, and study design and more information is needed (Roberts and North 2012). Mexican
spotted owls and northern spotted owls have responded more positively to low and moderate severity fire
(Keane 2013). A high level of uncertainty remains regarding patch sizes of high severity fire that affect
California spotted owl survival and reproduction (Keane 2013).
The following map shows the areas of concern as polygons shaded light red and the owl nest sites with
red dots that have had more than 50 percent of an area (half mile radius) around the nest site burned with
more than 50 percent loss of overstory tree cover. The legend includes the abbreviation “PAC”. This
stands for “protected activity centers”, which are stands of approximately 300 acres delineated around the
most actively used nest trees, where the best nesting habitat occurs. There are seven areas of concern,
widely spaced throughout the assessment area. There are three large areas of concern, encompassing
hundreds of thousands of acres in broad swaths (east to west) on the Eldorado, Tahoe, Plumas and Lassen
National Forest vicinities where large portions (more than 50 percent) of private land occurs. In the
central portion of the bio-region, on the Stanislaus and Sierra National Forests, there are areas of concern
that are smaller, but still in excess of 50,000 acres, running along the lower western slopes of the forests
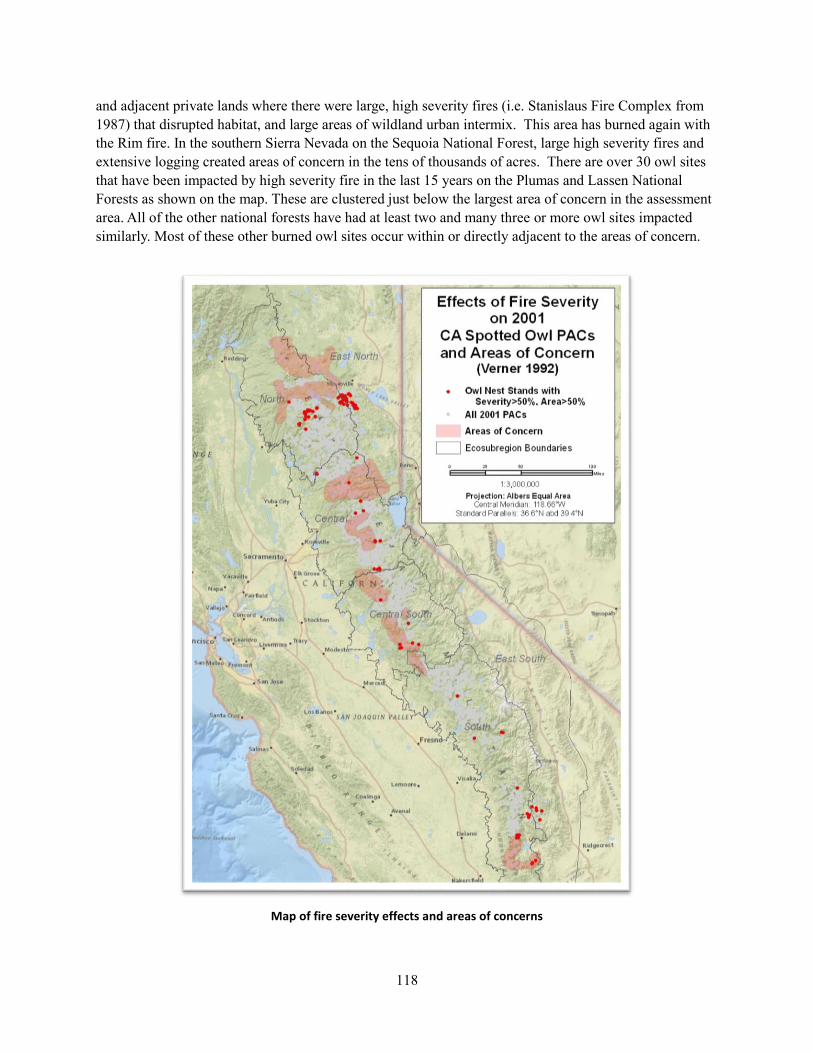
118
and adjacent private lands where there were large, high severity fires (i.e. Stanislaus Fire Complex from
1987) that disrupted habitat, and large areas of wildland urban intermix. This area has burned again with
the Rim fire. In the southern Sierra Nevada on the Sequoia National Forest, large high severity fires and
extensive logging created areas of concern in the tens of thousands of acres. There are over 30 owl sites
that have been impacted by high severity fire in the last 15 years on the Plumas and Lassen National
Forests as shown on the map. These are clustered just below the largest area of concern in the assessment
area. All of the other national forests have had at least two and many three or more owl sites impacted
similarly. Most of these other burned owl sites occur within or directly adjacent to the areas of concern.
Map of fire severity effects and areas of concerns
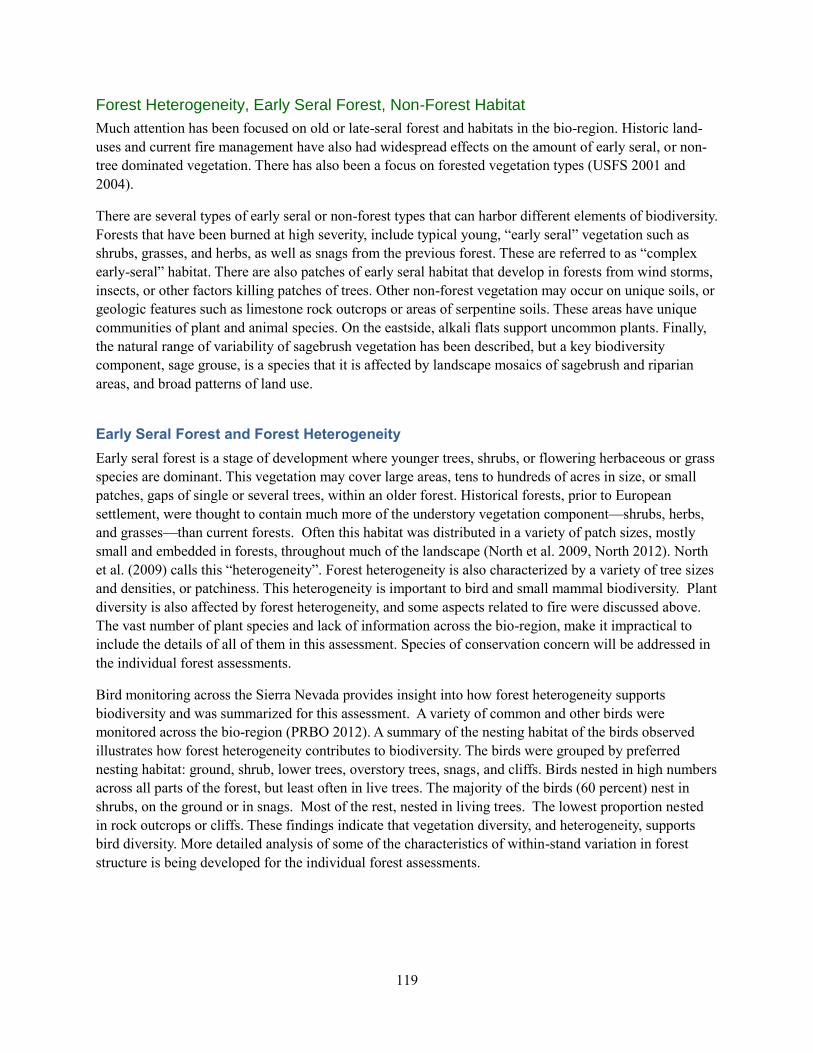
119
Forest Heterogeneity, Early Seral Forest, Non-Forest Habitat
Much attention has been focused on old or late-seral forest and habitats in the bio-region. Historic land-
uses and current fire management have also had widespread effects on the amount of early seral, or non-
tree dominated vegetation. There has also been a focus on forested vegetation types (USFS 2001 and
2004).
There are several types of early seral or non-forest types that can harbor different elements of biodiversity.
Forests that have been burned at high severity, include typical young, “early seral” vegetation such as
shrubs, grasses, and herbs, as well as snags from the previous forest. These are referred to as “complex
early-seral” habitat. There are also patches of early seral habitat that develop in forests from wind storms,
insects, or other factors killing patches of trees. Other non-forest vegetation may occur on unique soils, or
geologic features such as limestone rock outcrops or areas of serpentine soils. These areas have unique
communities of plant and animal species. On the eastside, alkali flats support uncommon plants. Finally,
the natural range of variability of sagebrush vegetation has been described, but a key biodiversity
component, sage grouse, is a species that it is affected by landscape mosaics of sagebrush and riparian
areas, and broad patterns of land use.
Early Seral Forest and Forest Heterogeneity
Early seral forest is a stage of development where younger trees, shrubs, or flowering herbaceous or grass
species are dominant. This vegetation may cover large areas, tens to hundreds of acres in size, or small
patches, gaps of single or several trees, within an older forest. Historical forests, prior to European
settlement, were thought to contain much more of the understory vegetation component—shrubs, herbs,
and grasses—than current forests. Often this habitat was distributed in a variety of patch sizes, mostly
small and embedded in forests, throughout much of the landscape (North et al. 2009, North 2012). North
et al. (2009) calls this “heterogeneity”. Forest heterogeneity is also characterized by a variety of tree sizes
and densities, or patchiness. This heterogeneity is important to bird and small mammal biodiversity. Plant
diversity is also affected by forest heterogeneity, and some aspects related to fire were discussed above.
The vast number of plant species and lack of information across the bio-region, make it impractical to
include the details of all of them in this assessment. Species of conservation concern will be addressed in
the individual forest assessments.
Bird monitoring across the Sierra Nevada provides insight into how forest heterogeneity supports
biodiversity and was summarized for this assessment. A variety of common and other birds were
monitored across the bio-region (PRBO 2012). A summary of the nesting habitat of the birds observed
illustrates how forest heterogeneity contributes to biodiversity. The birds were grouped by preferred
nesting habitat: ground, shrub, lower trees, overstory trees, snags, and cliffs. Birds nested in high numbers
across all parts of the forest, but least often in live trees. The majority of the birds (60 percent) nest in
shrubs, on the ground or in snags. Most of the rest, nested in living trees. The lowest proportion nested
in rock outcrops or cliffs. These findings indicate that vegetation diversity, and heterogeneity, supports
bird diversity. More detailed analysis of some of the characteristics of within-stand variation in forest
structure is being developed for the individual forest assessments.
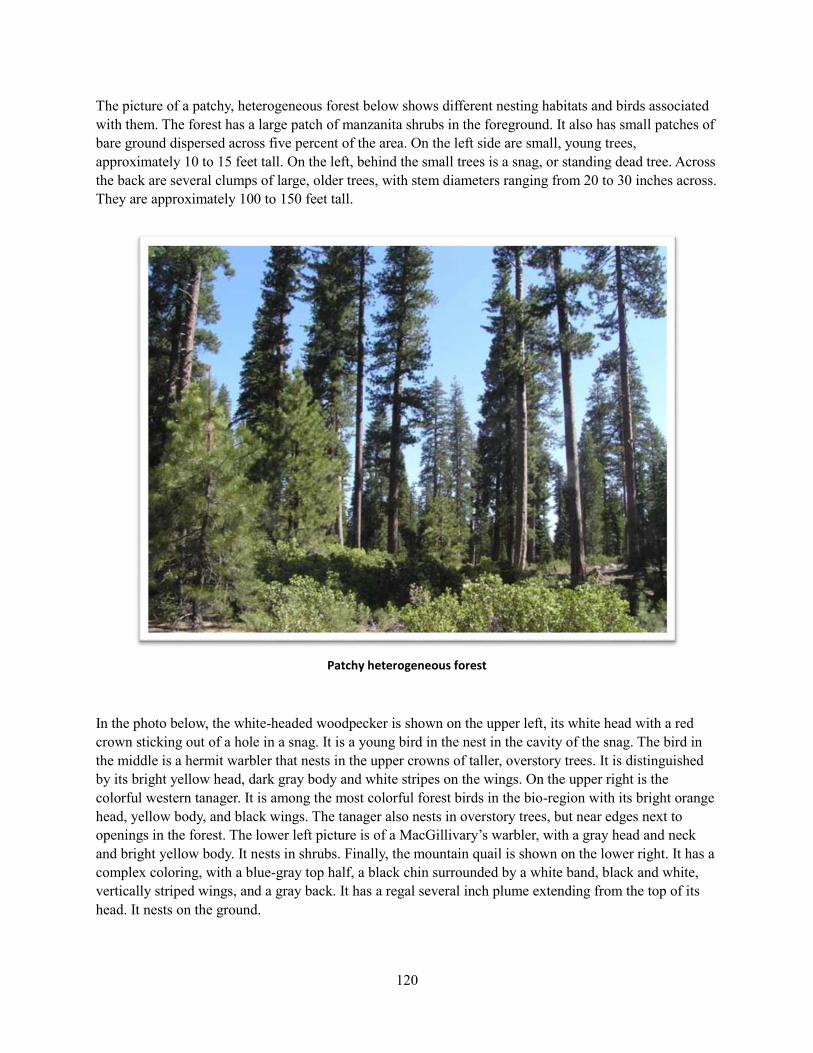
120
The picture of a patchy, heterogeneous forest below shows different nesting habitats and birds associated
with them. The forest has a large patch of manzanita shrubs in the foreground. It also has small patches of
bare ground dispersed across five percent of the area. On the left side are small, young trees,
approximately 10 to 15 feet tall. On the left, behind the small trees is a snag, or standing dead tree. Across
the back are several clumps of large, older trees, with stem diameters ranging from 20 to 30 inches across.
They are approximately 100 to 150 feet tall.
Patchy heterogeneous forest
In the photo below, the white-headed woodpecker is shown on the upper left, its white head with a red
crown sticking out of a hole in a snag. It is a young bird in the nest in the cavity of the snag. The bird in
the middle is a hermit warbler that nests in the upper crowns of taller, overstory trees. It is distinguished
by its bright yellow head, dark gray body and white stripes on the wings. On the upper right is the
colorful western tanager. It is among the most colorful forest birds in the bio-region with its bright orange
head, yellow body, and black wings. The tanager also nests in overstory trees, but near edges next to
openings in the forest. The lower left picture is of a MacGillivary’s warbler, with a gray head and neck
and bright yellow body. It nests in shrubs. Finally, the mountain quail is shown on the lower right. It has a
complex coloring, with a blue-gray top half, a black chin surrounded by a white band, black and white,
vertically striped wings, and a gray back. It has a regal several inch plume extending from the top of its
head. It nests on the ground.
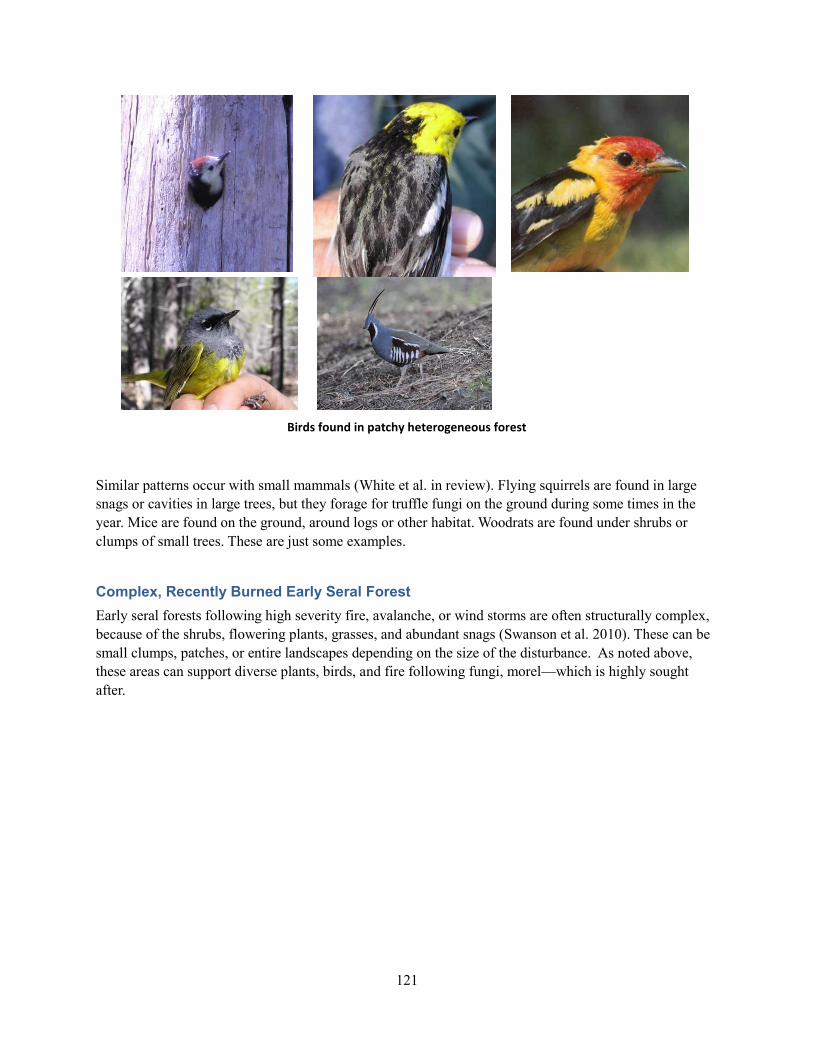
121
Birds found in patchy heterogeneous forest
Similar patterns occur with small mammals (White et al. in review). Flying squirrels are found in large
snags or cavities in large trees, but they forage for truffle fungi on the ground during some times in the
year. Mice are found on the ground, around logs or other habitat. Woodrats are found under shrubs or
clumps of small trees. These are just some examples.
Complex, Recently Burned Early Seral Forest
Early seral forests following high severity fire, avalanche, or wind storms are often structurally complex,
because of the shrubs, flowering plants, grasses, and abundant snags (Swanson et al. 2010). These can be
small clumps, patches, or entire landscapes depending on the size of the disturbance. As noted above,
these areas can support diverse plants, birds, and fire following fungi, morel—which is highly sought
after.
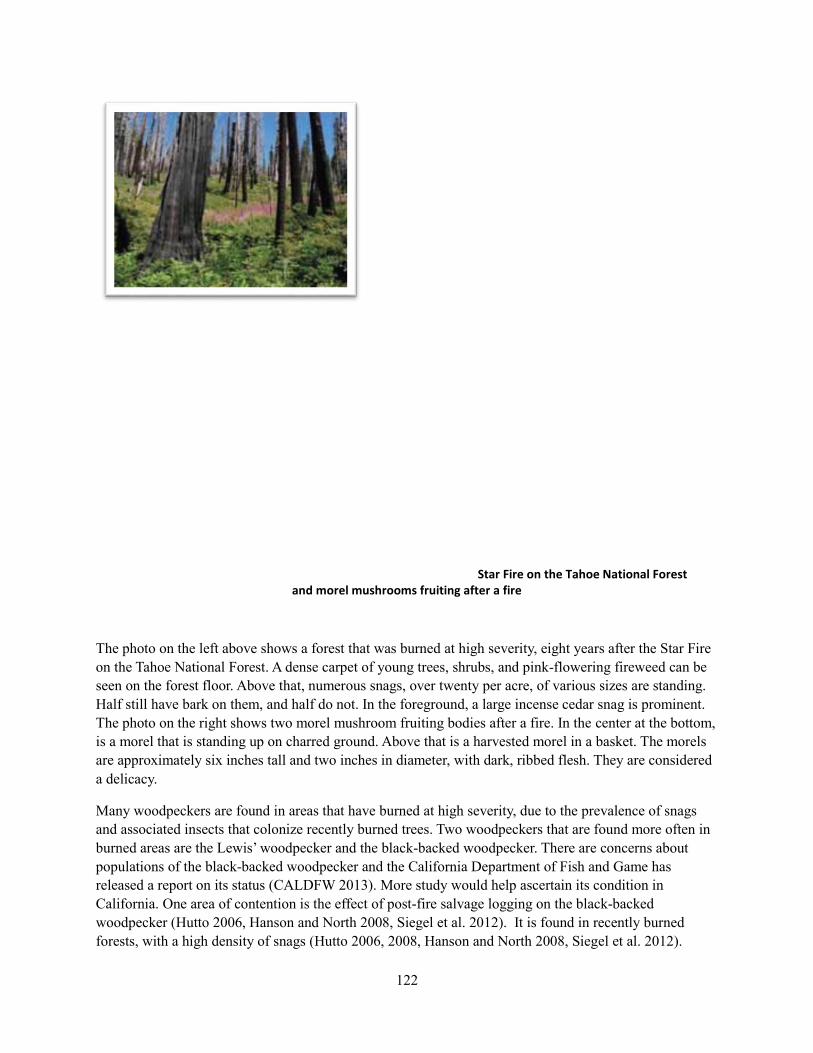
122
Star Fire on the Tahoe National Forest and morel mushrooms fruiting after a fire
The photo on the left above shows a forest that was burned at high severity, eight years after the Star Fire
on the Tahoe National Forest. A dense carpet of young trees, shrubs, and pink-flowering fireweed can be
seen on the forest floor. Above that, numerous snags, over twenty per acre, of various sizes are standing.
Half still have bark on them, and half do not. In the foreground, a large incense cedar snag is prominent.
The photo on the right shows two morel mushroom fruiting bodies after a fire. In the center at the bottom,
is a morel that is standing up on charred ground. Above that is a harvested morel in a basket. The morels
are approximately six inches tall and two inches in diameter, with dark, ribbed flesh. They are considered
a delicacy.
Many woodpeckers are found in areas that have burned at high severity, due to the prevalence of snags
and associated insects that colonize recently burned trees. Two woodpeckers that are found more often in
burned areas are the Lewis’ woodpecker and the black-backed woodpecker. There are concerns about
populations of the black-backed woodpecker and the California Department of Fish and Game has
released a report on its status (CALDFW 2013). More study would help ascertain its condition in
California. One area of contention is the effect of post-fire salvage logging on the black-backed
woodpecker (Hutto 2006, Hanson and North 2008, Siegel et al. 2012). It is found in recently burned
forests, with a high density of snags (Hutto 2006, 2008, Hanson and North 2008, Siegel et al. 2012).
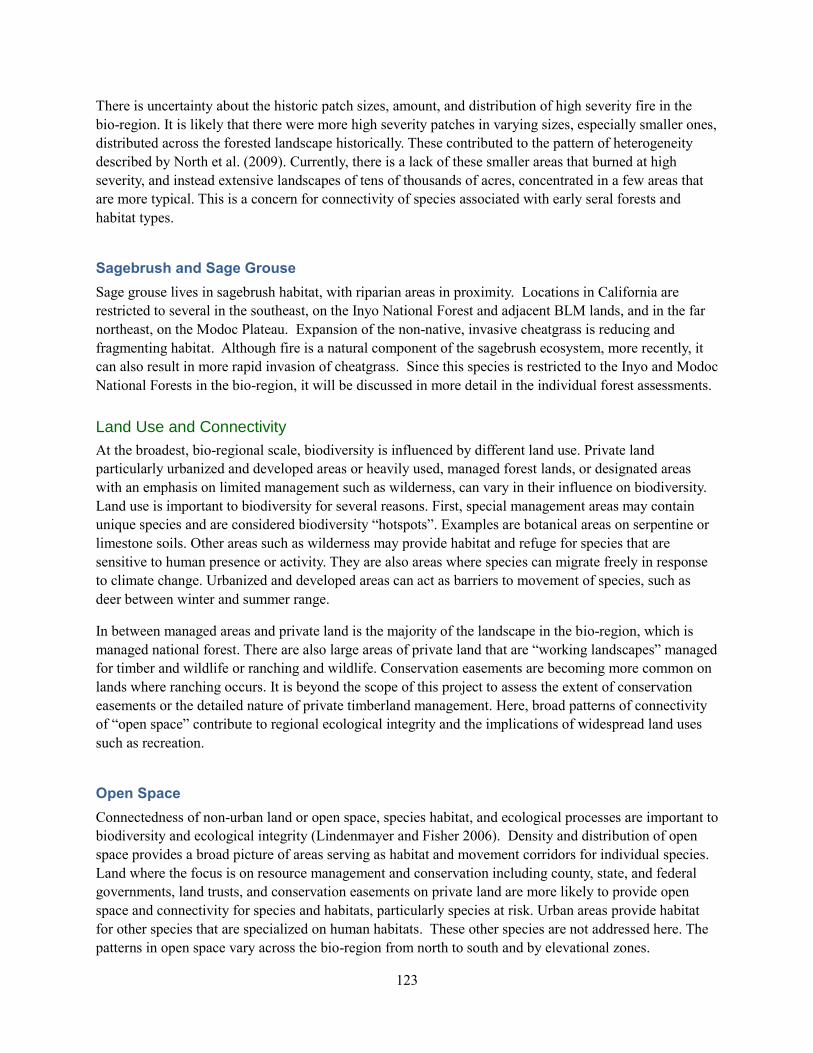
123
There is uncertainty about the historic patch sizes, amount, and distribution of high severity fire in the
bio-region. It is likely that there were more high severity patches in varying sizes, especially smaller ones,
distributed across the forested landscape historically. These contributed to the pattern of heterogeneity
described by North et al. (2009). Currently, there is a lack of these smaller areas that burned at high
severity, and instead extensive landscapes of tens of thousands of acres, concentrated in a few areas that
are more typical. This is a concern for connectivity of species associated with early seral forests and
habitat types.
Sagebrush and Sage Grouse
Sage grouse lives in sagebrush habitat, with riparian areas in proximity. Locations in California are
restricted to several in the southeast, on the Inyo National Forest and adjacent BLM lands, and in the far
northeast, on the Modoc Plateau. Expansion of the non-native, invasive cheatgrass is reducing and
fragmenting habitat. Although fire is a natural component of the sagebrush ecosystem, more recently, it
can also result in more rapid invasion of cheatgrass. Since this species is restricted to the Inyo and Modoc
National Forests in the bio-region, it will be discussed in more detail in the individual forest assessments.
Land Use and Connectivity
At the broadest, bio-regional scale, biodiversity is influenced by different land use. Private land
particularly urbanized and developed areas or heavily used, managed forest lands, or designated areas
with an emphasis on limited management such as wilderness, can vary in their influence on biodiversity.
Land use is important to biodiversity for several reasons. First, special management areas may contain
unique species and are considered biodiversity “hotspots”. Examples are botanical areas on serpentine or
limestone soils. Other areas such as wilderness may provide habitat and refuge for species that are
sensitive to human presence or activity. They are also areas where species can migrate freely in response
to climate change. Urbanized and developed areas can act as barriers to movement of species, such as
deer between winter and summer range.
In between managed areas and private land is the majority of the landscape in the bio-region, which is
managed national forest. There are also large areas of private land that are “working landscapes” managed
for timber and wildlife or ranching and wildlife. Conservation easements are becoming more common on
lands where ranching occurs. It is beyond the scope of this project to assess the extent of conservation
easements or the detailed nature of private timberland management. Here, broad patterns of connectivity
of “open space” contribute to regional ecological integrity and the implications of widespread land uses
such as recreation.
Open Space
Connectedness of non-urban land or open space, species habitat, and ecological processes are important to
biodiversity and ecological integrity (Lindenmayer and Fisher 2006). Density and distribution of open
space provides a broad picture of areas serving as habitat and movement corridors for individual species.
Land where the focus is on resource management and conservation including county, state, and federal
governments, land trusts, and conservation easements on private land are more likely to provide open
space and connectivity for species and habitats, particularly species at risk. Urban areas provide habitat
for other species that are specialized on human habitats. These other species are not addressed here. The
patterns in open space vary across the bio-region from north to south and by elevational zones.

124
On the following map, open space was assessed by creating a picture of the density of urbanized areas
and private land where management was uncertain into the future. On this map, these areas are depicted
as broad zones with different concentrations, or percent of area, of open spaces and other lands. The
assessment area is subdivided into six different geographic areas that depict differences in climate and
dominant vegetation. On the western half, to the west of the mountain crest, are four geographic areas.
The northern geographic area includes the southern Cascade Mountains and areas to the west,
encompassing the western one-third of the Lassen and Plumas National Forests and the Lassen National
Park. The central geographic area includes the western half of the Tahoe National Forest and the entire
Eldorado National Forest and adjacent private lands. The Stanislaus National Forest, Yosemite National
Park and foothill areas to the east make up the central south geographic area. The southern geographic
area is comprised of the Sierra and Sequoia National Forests, Sequoia and Kings Canyon National Parks,
and private foothill lands to the west. To the east of the crest, there are two geographic areas. South of
Lake Tahoe is the southeastern geographic area, encompassing the Inyo National Forest, the westernmost
portion of the Toiyabe National Forest, intervening Bureau of Land Management lands, and private lands.
The entire Modoc Plateau including the Modoc National Forest, and extensive Bureau of Land
Management and private lands, the eastern two-thirds of the Lassen National Forest, and the eastern half
of the Plumas and Tahoe National Forests comprise the northeastern geographic area. The foothills are
the most urbanized and have the least potential for open space, most with more than 75 percent private
land. Beyond the foothills, open space is more continuous in the southern and central portions, with less
than five percent private land than the northern portions of the bio-region. To the west and north of Lake
Tahoe, there are alternating large areas with more than 75 percent private land with other areas of less
than 25 percent private land. Large areas on the Eldorado and Tahoe National Forests have extensive
“checkerboard” lands, with 50 percent private land, a legacy from railroad land grants. These broadly
different patterns in open space were part of the basis for delineating different sub-regions across the
assessment area, in addition to considering climate and biodiversity.
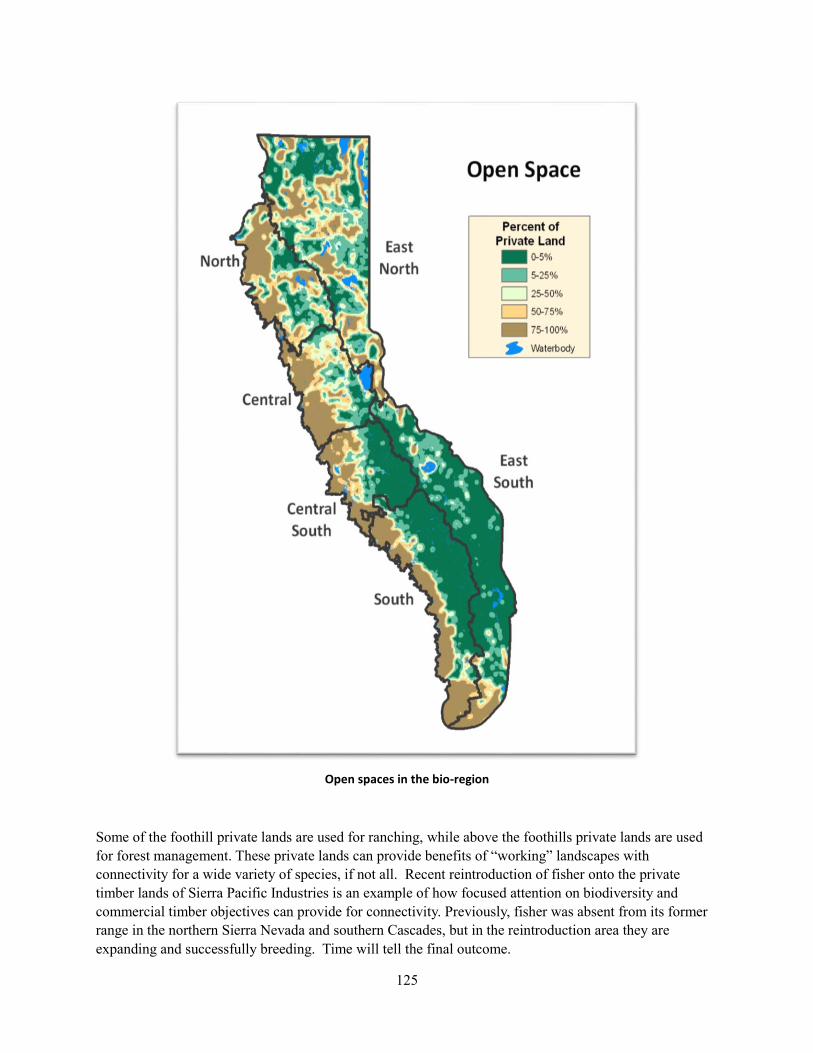
125
Open spaces in the bio-region
Some of the foothill private lands are used for ranching, while above the foothills private lands are used
for forest management. These private lands can provide benefits of “working” landscapes with
connectivity for a wide variety of species, if not all. Recent reintroduction of fisher onto the private
timber lands of Sierra Pacific Industries is an example of how focused attention on biodiversity and
commercial timber objectives can provide for connectivity. Previously, fisher was absent from its former
range in the northern Sierra Nevada and southern Cascades, but in the reintroduction area they are
expanding and successfully breeding. Time will tell the final outcome.
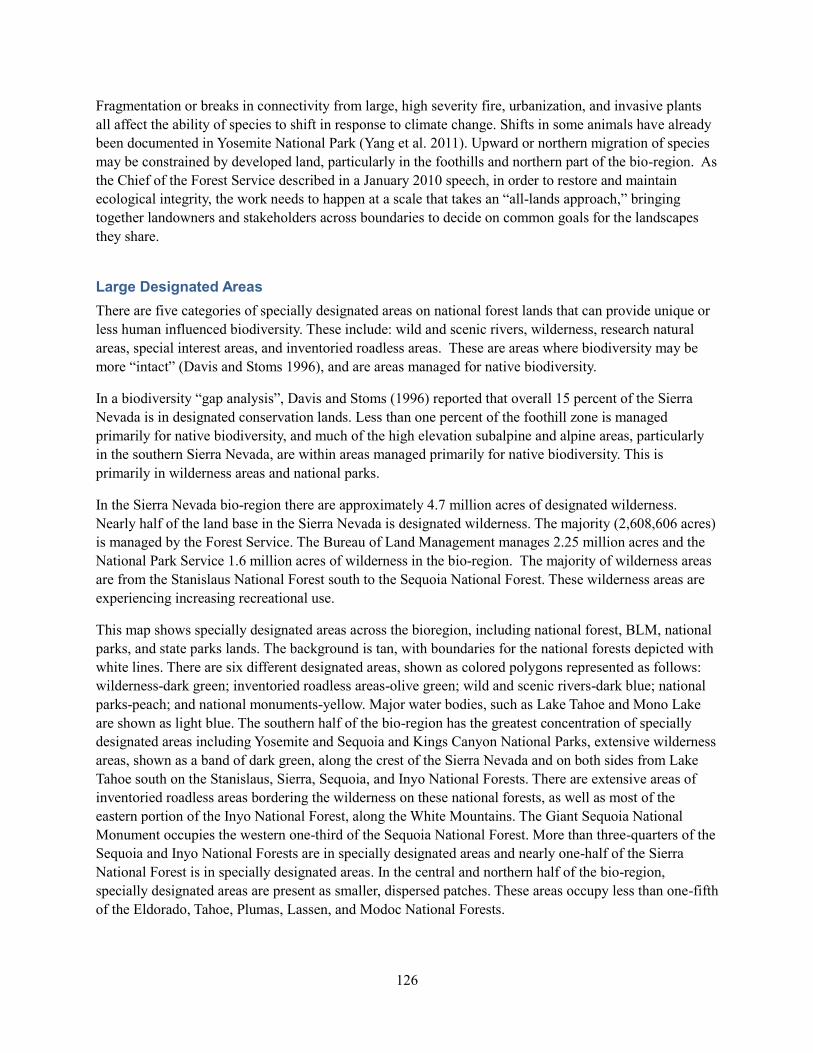
126
Fragmentation or breaks in connectivity from large, high severity fire, urbanization, and invasive plants
all affect the ability of species to shift in response to climate change. Shifts in some animals have already
been documented in Yosemite National Park (Yang et al. 2011). Upward or northern migration of species
may be constrained by developed land, particularly in the foothills and northern part of the bio-region. As
the Chief of the Forest Service described in a January 2010 speech, in order to restore and maintain
ecological integrity, the work needs to happen at a scale that takes an “all-lands approach,” bringing
together landowners and stakeholders across boundaries to decide on common goals for the landscapes
they share.
Large Designated Areas
There are five categories of specially designated areas on national forest lands that can provide unique or
less human influenced biodiversity. These include: wild and scenic rivers, wilderness, research natural
areas, special interest areas, and inventoried roadless areas. These are areas where biodiversity may be
more “intact” (Davis and Stoms 1996), and are areas managed for native biodiversity.
In a biodiversity “gap analysis”, Davis and Stoms (1996) reported that overall 15 percent of the Sierra
Nevada is in designated conservation lands. Less than one percent of the foothill zone is managed
primarily for native biodiversity, and much of the high elevation subalpine and alpine areas, particularly
in the southern Sierra Nevada, are within areas managed primarily for native biodiversity. This is
primarily in wilderness areas and national parks.
In the Sierra Nevada bio-region there are approximately 4.7 million acres of designated wilderness.
Nearly half of the land base in the Sierra Nevada is designated wilderness. The majority (2,608,606 acres)
is managed by the Forest Service. The Bureau of Land Management manages 2.25 million acres and the
National Park Service 1.6 million acres of wilderness in the bio-region. The majority of wilderness areas
are from the Stanislaus National Forest south to the Sequoia National Forest. These wilderness areas are
experiencing increasing recreational use.
This map shows specially designated areas across the bioregion, including national forest, BLM, national
parks, and state parks lands. The background is tan, with boundaries for the national forests depicted with
white lines. There are six different designated areas, shown as colored polygons represented as follows:
wilderness-dark green; inventoried roadless areas-olive green; wild and scenic rivers-dark blue; national
parks-peach; and national monuments-yellow. Major water bodies, such as Lake Tahoe and Mono Lake
are shown as light blue. The southern half of the bio-region has the greatest concentration of specially
designated areas including Yosemite and Sequoia and Kings Canyon National Parks, extensive wilderness
areas, shown as a band of dark green, along the crest of the Sierra Nevada and on both sides from Lake
Tahoe south on the Stanislaus, Sierra, Sequoia, and Inyo National Forests. There are extensive areas of
inventoried roadless areas bordering the wilderness on these national forests, as well as most of the
eastern portion of the Inyo National Forest, along the White Mountains. The Giant Sequoia National
Monument occupies the western one-third of the Sequoia National Forest. More than three-quarters of the
Sequoia and Inyo National Forests are in specially designated areas and nearly one-half of the Sierra
National Forest is in specially designated areas. In the central and northern half of the bio-region,
specially designated areas are present as smaller, dispersed patches. These areas occupy less than one-fifth
of the Eldorado, Tahoe, Plumas, Lassen, and Modoc National Forests.
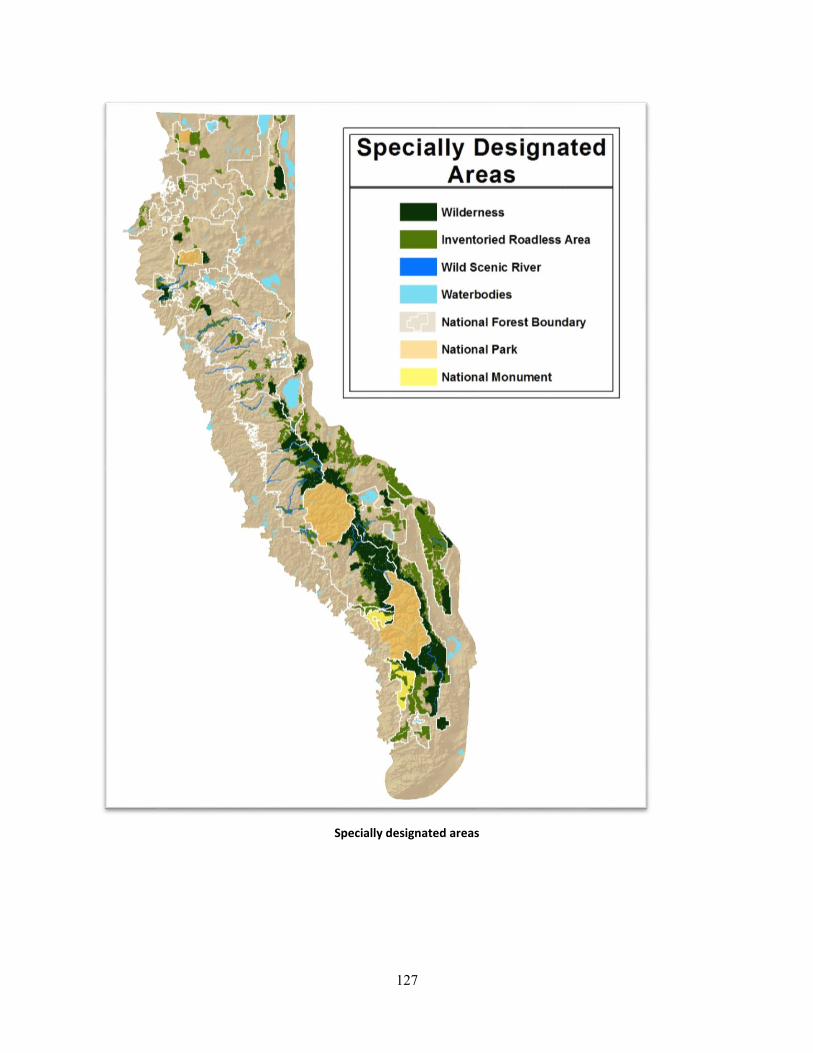
127
Specially designated areas
128
Benefits to People from Functioning Ecosystems
Despite the many benefits they provide, many ecosystems in the bio-region, the species, and their
respective ecological processes are being negatively impacted by development trends, rising population,
habitat fragmentation, intensification of human activity, and the effects of climate change. It has been
estimated that by 2040, almost 20 percent of the Sierra Nevada private forests and rangelands could be
affected by projected development (Duane 1996). These effects are of concern from an ecosystem
services perspective, as they have resulted in diminished, interrupted, suspended, or redirected flows of
ecosystem services and the benefits that they provide to people.
Ecosystem services are the valuable outputs of healthy ecosystems and are critical to the wellbeing of
people. The bio-region provides an array of these services that are enjoyed directly by individuals and
communities, such as water, wood products, energy, and recreational opportunities. There are also many
vital services that provide benefits that are less apparent in our daily life but are important for the support
they offer the ecosystem, such as water filtration, carbon sequestration and biodiversity. Discussion of the
importance of the benefits provided by ecosystem services is also provided under the Fire Resiliency
theme.
Successfully addressing emerging deficits in ecosystem services requires stemming decline in ecosystem
service production, as well as ensuring ecosystem service use is not wasteful or needlessly impactful to
the ecological systems that provide them. As a result, the Forest Service’s commitment to restoration
management includes “commitment to a renewed focus on the sustainable delivery of ecosystem
services” (USFS 2013b, p.1).
When ecosystem services are interrupted or lost, the benefits to people are reduced and this affects the
quality of our lives. The 1996 Sierra Nevada Ecosystem Project estimated the value of some of the
ecosystem services that are provided in the bio-region (Stewart 1996). This estimate focused on
commodity services directly tied to existing economic markets, and determined that the bio-region
produces approximately $2.2 billion worth of commodities and services annually. This amount would be
around $3.2 billion in today’s dollars. Water accounts for most of this estimate and provides tremendous
value to people around the state who depend on it daily. Most of the water value accrues to water rights
holders and beneficiaries outside of the region. Although the infrastructure to hold, divert, and channel the
water is very valuable, relatively little direct employment is needed locally to operate and maintain these
facilities. Other forest-based commodities account for a smaller portion, and the benefits accrued can be
more local in nature. Timber, grazing and recreation involve many more employees locally and have
greater visibility in the local economies.
The estimated ecosystem services dollar value presented above is significant, and yet comprises only a
portion of the value of the ecosystem services that are provided by resources in the bio-region.
Ecosystem services such as cultural heritage, sense of place, aesthetics and biodiversity contribute to
improving the quality of people’s lives but do not have an easily identifiable monetary or dollar value.
This does not make them any less valuable or important (Metcalfe et al. 2013). Any loss of ecological
integrity that results in a loss or interruption of these valuable services is an important consideration in
maintaining the benefits people obtain from the national forests in the plan area.
Many ecosystem services are provided simultaneously by landscapes across the bio-region and as a result,
these landscapes provide an immense value to people. For example, an area that provides wildlife habitat,
rangeland for grazing and prime conditions for carbon sequestration may also be home to important sites

129
that support cultural heritage, protect water quality and provide recreational opportunities. These
landscapes that provide all of the benefits of these multiple services are where complementary and
conflicting relationships between these services and their value will be an important consideration in the
management of ecological integrity. In addition, the importance of ecological integrity across broad
landscapes in providing value to people highlights the fact that conservation of these services does not
stop at administrative and political boundaries. The coordinated management of ecosystem health across
different agencies, as well as between public and private stakeholders, and the inclusion of this
collaboration up front is a critical component of forest plan revision in the bio-region.
Also important to note is the scale at which any potential interruption or loss of the benefits from
ecosystem services will affect people. Many services are thought of as benefiting only locals or “on
forest” users and therefore any decreases in these benefits are believed to affect only those people in close
proximity to the forests. Examples of these services are recreational opportunities for visitors and local
employment resulting from forest commodities and supporting forest recreation. However, the scale of
these benefits is much larger and affects people across a much larger area. When services such as water
supply, electricity, carbon sequestration and cultural resources are lost, people across the state are affected
even if they do not live near forests or never plan to visit the forests. This value of these potentially lost
benefits needs to be communicated to society so there is an understanding of the important role of forests
in people’s daily life. This value also needs to be considered in restoration as improved ecological
conditions for supporting the sustainability these benefits should be considered in restoration planning.
One threat to ecological integrity that can lead to a loss of these benefits is air pollution. Air pollution can
have a dramatic effect on the ability of these landscapes to provide ecosystem services. The major
pollutants causing ecological harm in the bio-region are ozone, which can be toxic to plants, and nitrogen
deposition, which can induce undesirable effects on terrestrial and aquatic ecosystems (Byterowicz 2013).
The risk of insect and disease mortality is another factor that can affect ecosystem services as the
resources that provide these services are lost. To better understand the extent of this potential effect,
timber and carbon sequestration in the bio-region was examined using a forest health index that measures
future risk of vegetation mortality from insect and disease. This examination found that 56 percent of the
important timber-producing land in the bio-region and 66 percent of the important carbon sequestration
land in the bio-region is at medium or high risk for insect or disease mortality (Metcalfe et al. 2013). As a
result of factors such as air pollution and insect and disease mortality, the benefits to people who are
dependent on functioning ecosystems are reduced through the loss of these forest resources. In addition,
reductions in forest health can result in more dead wood, which then adds to fuels in the forests, making
areas more susceptible to fire. More details on the threat to the value of ecosystem services from fire are
provided under the Fire Resilience theme.
Losing benefits from ecosystem services has an effect locally on quality of life, and also has impacts to
economies that are dependent on forest activities, such as timber, grazing and recreation. For example,
impacts of air quality currently pose threats to recreation along the western slopes of the southwestern
Sierra Nevada, which experience frequent episodes of unhealthy air and haze that obstructs visibility
(Cisneros et al. 2010, Bytnerowicz et al. 2013). Any potential declines in visits has an impact on the local
economies that rely on that visitation to support that local economy, and reduces the recreational and
aesthetic opportunities available to people. More details on this important relationship can be found
under the Sustainable Recreation theme.
130
Forest-based commodities and recreational opportunities are not the only ecosystem services potentially
affected by a loss of ecological integrity. Ecological integrity also influences the ability of ecosystems to
provide many social benefits that support the diversity of values that people and communities hold. The
Sierra Nevada’s history and culture have always been deeply connected to the land and its natural
resources. For thousands of years, Native Americans have lived off the land, with a land ethic that
included spiritual, philosophical and cultural dimensions (Anderson and Moratto 1996). They viewed
humans as part of the natural system, helping to ensure abundance and diversity of plant and animal life.
European settlers brought extensive changes to the landscape through mining, timber harvesting,
ranching, farming, and water use, leading to long-lasting cultural views of the Sierra Nevada as a place
valued for resource production (Walker and Fortmann 2003). A shift in focus toward nature-based
recreation and tourism brought new visitors to the area, including many urbanites looking for a new place
to settle, away from city life. New residents brought new values to the bio-region, tied more with scenic
and environmental values than with resource production (Walker and Fortmann 2003). Healthy
ecosystems help people and communities sustain these diverse values and cultures.
Maintaining ecological composition, structures, and functions allows for continued use of the land over
the long term for tribal uses, resource extraction, and recreation, as well as scenic beauty and existence
values. However, the diversity of values also influences ecological integrity by putting more demands on
forests in the bio-region. Increasing diversity occurring within and especially right outside the Sierra
Nevada bio-region will add to the diversity of values and interests that already characterize visitors and
residents in the Sierra Nevada and surrounding areas (Winter et al. 2013a). Increasing population growth
across different parts of the bio-region and California as a whole, as well as increasing demand for
outdoor recreation and raw materials, is expected to put more pressure on public lands and lead to
increased conflict and competition for access (Cordell et al. 2004, as cited in Winter et al. 2013b). People
who live far away from the Sierra Nevada can also be affected by management decisions. Research
shows that people living far from the Sierra Nevada hold substantial values for the region’s ecosystems,
and especially for their charismatic fish and wildlife (Long et al. 2013).
The sustainability of the scenic attributes of the forests is also dependent on ecological integrity (Mattson
and Mosier 2012). Visually, scenery in the bio-region appears largely intact; however, no estimates are
available at this time to gauge scenic stability at the bio-regional scale. As population growth and
urbanization continues, particularly along the Sierra foothills, so too will the demand for associated
infrastructure, such as utility line, cellular towers, and alternative energy exploration and development. In
addition, major unplanned events like wildfire will continue to occur. These factors, along with the
current pace of ecological restoration efforts are expected to result in the loss of scenic character for a
substantial portion of national forest landscapes in the bio-region, affecting recreation experiences, as
well as the sense of place of individuals and communities.
National forests can also provide benefits for educational and skill building opportunities through their
conservation education and volunteer programs, along with training and work programs like the Youth
Conservation Corps and California Conservation Corps. Efforts that help restore ecological integrity to
degraded systems not only help to sustain healthy forests, but also healthy people and communities.
“Ecological restoration offers an opportunity to communicate positive messages, values, and activities,
while addressing ecosystem threats” (Charnley 2013, p.7). Volunteerism is growing in importance in
recreation in California, which enhances both people’s lives and landscapes (Roberts 2009). Themed days
and special events like Coastal Cleanup, Public Lands Day, and National Trails Day increase the visibility
of volunteering on public lands. New organizations and communication tools are helping to support
131
increased involvement from new and different groups. Decreasing federal budgets will continue to affect
the ability to sustain and grow volunteer, training and work programs.
The removal of Native American management from the landscape has influenced and continues to
influence Sierra Nevada forests. Resource management by Native Americans in the Sierra Nevada bio-
region was long term and widespread, producing ecological and evolutionary consequences in the biota
(Blackburn and Anderson 1993, as cited in Anderson and Moratto 1996). Therefore, many ecosystems in
the Sierra Nevada are not self-maintaining islands that require only protection to remain in a “pristine”
state. There is currently an ecological “vacuum,” or disequilibrium, in the Sierra Nevada resulting from
the departure of Native Americans from managing these ecosystems. The decline in biotic diversity,
species extirpation and endangerment, human encroachment into fire-type plant communities like
chaparral, and greatly increased risk of catastrophic fires are symptoms of this disequilibrium. Tribal
communities within the Sierra Nevada present distinctive opportunities for mutually beneficial
partnerships to restore ecologically and culturally significant resources, and to promote resilience.
Forest management restoration activities to improve the integrity and functioning of ecosystems not only
provide benefits to people in terms of sustaining the ecosystem services discussed above, but also by
contributing to the wellbeing of communities. Maintaining the local resources of capable infrastructure
and workforce is necessary to the success of restoration, and also provides economic opportunities in
these communities. Current policy for national forest management calls for such approaches that
accomplish ecological restoration goals, while simultaneously producing forest products that can benefit
local communities (USDA 2010, USFS 2007). More details on the important role of communities in
forest restoration are provided under the Fire Resilience and Resilient Communities themes.
2004 Sierra Nevada Framework
Ecological integrity is not directly addressed in the current plan direction by that title. However, the 2004
Framework has many references to the preservation and restoration of ecosystems. In the Implementation
section the Regional Forester states:
My intention is to provide for ecological restoration of processes and enhance long-term
ecological integrity, assure the most efficient and appropriate use of government resources,
minimize costs to holders of existing government contracts and permits, avoid disruptions to local
communities, and reduce the likelihood of confusion.
132
COMMUNITY RESILIENCE
What Are We Trying To Sustain at the Bio-Regional Level?
1. Opportunities that support the diversity of cultures and values
2. Social interactions
3. Local economic opportunities from forest activities
4. Health, safety, education and skills
As described in Charnley (2013, p.4):
community wellbeing studies recognize that (1) wellbeing in forest communities was
based on more than jobs and income, and included other quality of life attributes, such as
health, safety, political participation, social equity, and access to social services; and (2)
national forests can contribute to community wellbeing in multiple ways that include both
commodities (e.g., timber, grazing, minerals, non-timber forest products) and amenities
(e.g., outdoor recreation, scenic beauty, clean air and water, open space, forests and
mountains) values associated with them.
Wellbeing in local forest communities depends on community capacity, or the ability to respond to
internal and external stresses, create and take advantage of opportunities, and meet the needs of residents
(Kusel 2001, as cited in Charnley 2013). Community capacity influences the ability of communities to
prepare for and adapt to change and stressors such as wildland fire and climate change. Communities that
are resilient are able to cope with, adapt to, and shape change (Charnley 2013). “It is however,
challenging to identify critical thresholds beyond which social systems will lose their resilience and break
down” (Charnley 2013, p.6).
Human wellbeing and ecosystem health are interconnected and interdependent. According to the 2010
National Report on Sustainable Forests (USFS 2011a), through sustainable management, forests can
contribute to the resilience of ecosystems, societies, and economies, while safeguarding biological
diversity and providing a broad range of goods and services for present and future generations. Because
the benefits of nature are irreplaceable, healthy ecosystems form the foundation for strong sustainability
on which society and the economy depend. To achieve sustainability of national forest lands, management
decisions need to account for influences and interactions of the environment, society, and the economy.
According to Winter et al. (2013a, p.2), understanding linkages between humans and forests can greatly
benefit restoration and conservation efforts and contribute to community wellbeing and resilience.
“Dialogue with stakeholders, including forest community residents, can help managers in the
identification of valued ecosystem services. In addition, discussions of valued services can facilitate
stakeholder recognition of benefits they may not be aware of or value.”
In this section, there is discussion of aspects of national forest management in the bio-region that
contribute to community wellbeing and resilience, as well as issues and trends influencing these aspects.
Different types of communities are considered, including local communities within the Sierra Nevada,
133
communities outside the Sierra Nevada that use national forests, and communities outside the Sierra
Nevada bio-region that do not use national forests but benefit from them.
Opportunities that Support the Diversity of Cultures and Values
As described in Flora and Flora (2004), cultural capital includes the values and approaches to life that are
passed on through generations. It is the filter through which people live their lives and how they view the
world around them. It gives people their sense of identity and influences how they view the range of
alternatives available to them in life. Supporting diversity in values and cultures helps people act
positively toward themselves and their communities. In the Sierra Nevada, there are various ways that the
Forest Service contributes to sustaining this diversity, which in turn benefits communities both inside and
outside the bio-region.
Diverse Community Values
National forests across the bio-region support and influence a wide range of values and interests that
communities have. This includes local residents, as well as communities outside the bio-region that
directly and indirectly benefit from the forests. Additionally, forests in the bio-region are an integral part
of Native American culture; traditions and values have been passed down through generations for
thousands of years (McAvoy et al. 2004).
Many long-time residents in the Sierra Nevada maintain cultural ties to the traditional, resource-based
economy of the region, and continue to view the local landscape as a source of production and livelihoods
(Walker and Fortmann 2003). Ranchers who move their livestock seasonally have a long history in the
Sierra Nevada, depend on Forest Service range, and have a strong commitment to and affection for the
lifestyle (Huntsinger et al. 2010, as cited in Charnley and Long 2013). Management of these lands
directly influences ranchers, affecting range vegetation and forage production and availability of land for
range versus other uses (Huntsinger et al. 2010, as cited in Charnley and Long 2013). Permitted livestock
grazing on National Forest System land in California has been decreasing since the early 1900s.
Timber harvest has long been an important part of the bio-region’s cultural heritage and legacy. Since the
late 1980s, timber harvest from national forests has steadily declined because of policy and legal
constraints, restrictions on harvesting in unroaded areas, and appeals and litigation (Charnley and Long
2013). While the majority of timber production in the Sierra Nevada now comes from private harvest,
there has been increasing interest in developing new sustainable natural resource economies through
restoration and biomass for energy production from public lands (Sierra Business Council 2007).
Recreation and tourism have a long history in the Sierra Nevada. Outdoor recreation is part of the identity
of many local communities, and demand for outdoor recreation opportunities continues to grow. Being
outdoors is an important part of the California lifestyle, and national forests are part of an expansive
network of local, state, and federal parks, forests, trails, and open space systems (Roberts et al. 2009).
Beyond those who directly use national forests in the bio-region, “research has shown that people living
far from the Sierra Nevada hold substantial values for the region’s ecosystems and especially for their
charismatic fish and wildlife” (Long et al. 2013, p.12).
Management of National Forest System lands can influence community values by the opportunities
provided on the land, and by contributions to environmental and aesthetic qualities of the region. The
134
Forest Service is required to sustainably manage national forests for multiple uses and benefits. This
means managing for the best combination of uses that benefit the public, while ensuring productivity of
the land and protecting the quality of the environment. This mandate supports a wide range of values that
people and communities hold, but these uses and benefits have limits and also interact with each other.
Tradeoffs are necessary in collaboration with stakeholders to support this mandate. Balancing across
values and interests can be contentious and emotional for those involved.
While many local residents in the Sierra Nevada share values around maintaining the rural and
environmental qualities of the region to which National Forest System lands contribute (Sierra Business
Council 1997), how people prioritize those values and how they fit in relation to other values can vary,
affecting decisions and activities they choose to engage in (Jones et al. 2003). Tensions have long existed
among various stakeholders who compete for their interests regarding national forests in the Sierra
Nevada. Population and settlement growth in the Sierra Nevada has largely been driven by a phenomenon
known as amenity migration, referring to the movement of people from urban areas to Sierra Nevada
forests for their amenity values, such as low crime, good schools, outdoor recreation opportunities, scenic
beauty, and an overall improved quality of life (Loeffler and Steinicke 2007). Since the 1950s, a
continuous influx of migrants from urban areas has influenced the culture of many rural and traditionally
resource-based communities in the Sierra Nevada (Walker and Fortmann 2003). Newcomers are often less
tied to natural resource production and more tied to scenic and rural qualities of the landscape, which can
conflict with the views of long-time residents. As a result, long-time residents can feel a loss of social
power and cultural identity (Walker and Fortmann 2003).
Between 2000 and 2010, the population for the group of counties that intersect the bio-region boundary
increased by about 16 percent from 5.6 million to 6.5 million people, while the state population increased
eight percent (Lin and Metcalfe 2013). Many of the counties that intersect the bio-region include the fast-
growing cities of the Central Valley that lie outside the actual bio-region boundary. As shown in the map
below, population change from 2000-2010 in and around the bio-region has been highly variable, with
more population loss occurring in the northern and eastern portions and more growth in the central and
southern portions.
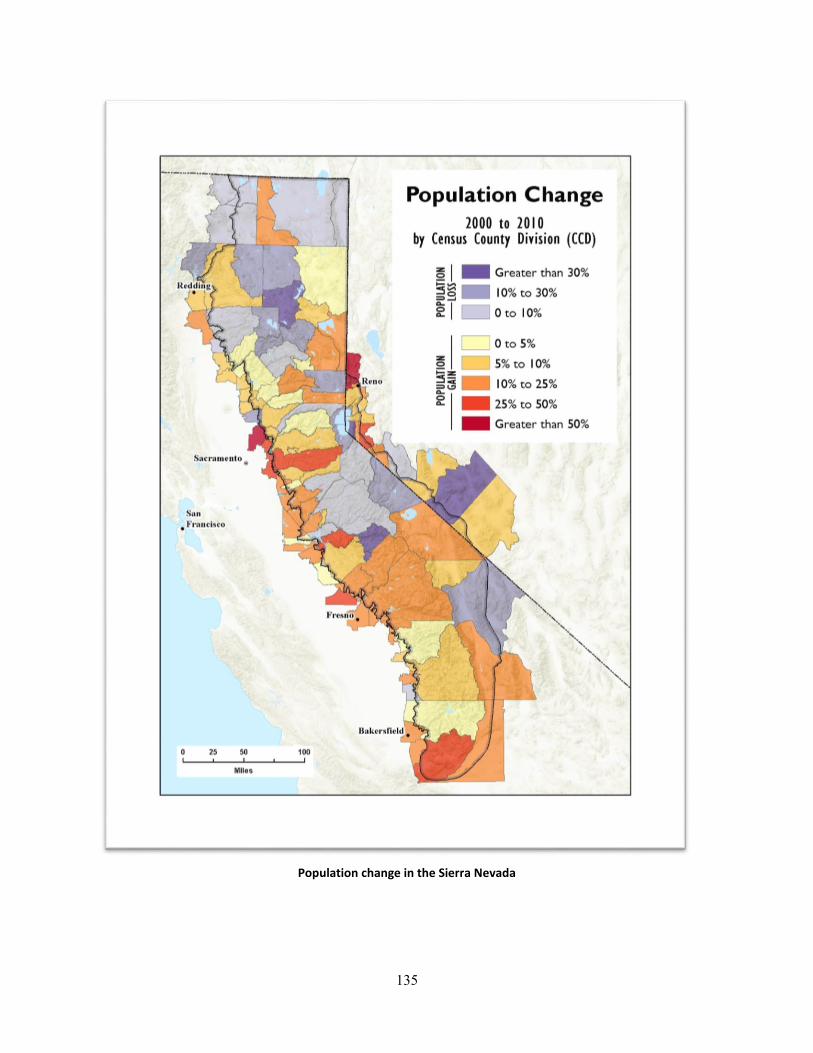
135
Population change in the Sierra Nevada
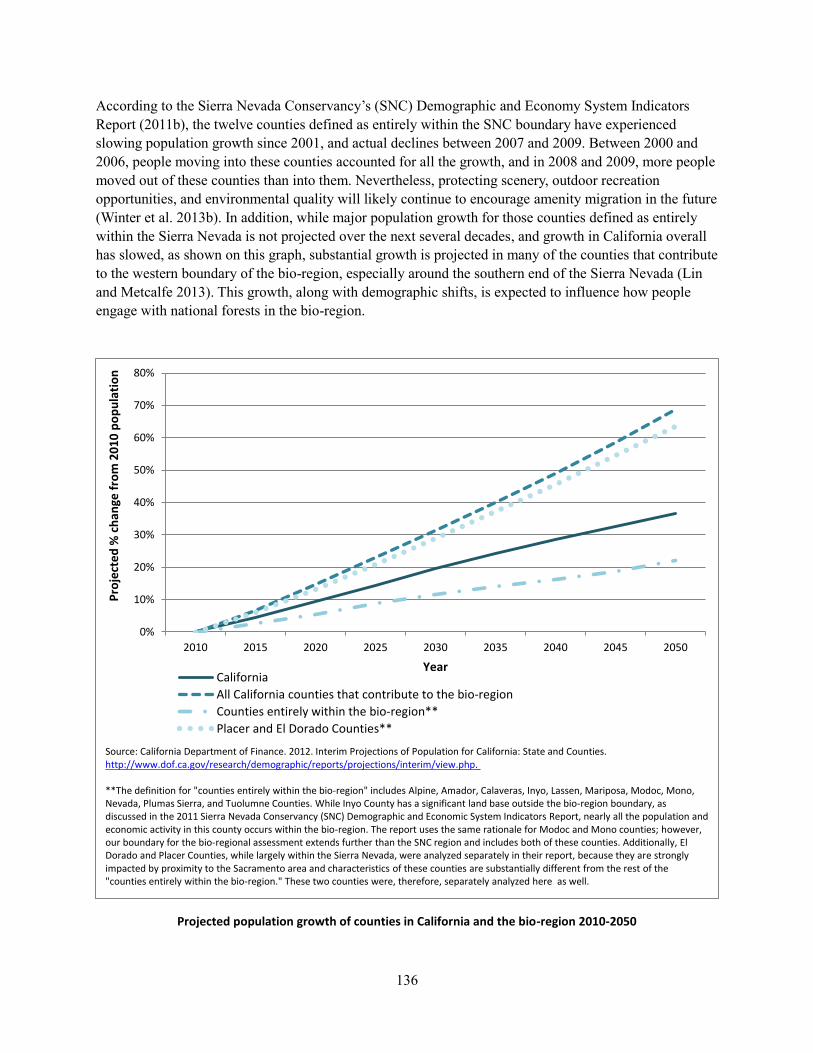
136
According to the Sierra Nevada Conservancy’s (SNC) Demographic and Economy System Indicators
Report (2011b), the twelve counties defined as entirely within the SNC boundary have experienced
slowing population growth since 2001, and actual declines between 2007 and 2009. Between 2000 and
2006, people moving into these counties accounted for all the growth, and in 2008 and 2009, more people
moved out of these counties than into them. Nevertheless, protecting scenery, outdoor recreation
opportunities, and environmental quality will likely continue to encourage amenity migration in the future
(Winter et al. 2013b). In addition, while major population growth for those counties defined as entirely
within the Sierra Nevada is not projected over the next several decades, and growth in California overall
has slowed, as shown on this graph, substantial growth is projected in many of the counties that contribute
to the western boundary of the bio-region, especially around the southern end of the Sierra Nevada (Lin
and Metcalfe 2013). This growth, along with demographic shifts, is expected to influence how people
engage with national forests in the bio-region.
Projected population growth of counties in California and the bio-region 2010-2050
0%
10%
20%
30%
40%
50%
60%
70%
80%
2010 2015 2020 2025 2030 2035 2040 2045 2050
Pro
ject
ed
% c
han
ge f
rom
20
10
po
pu
lati
on
YearCalifornia
All California counties that contribute to the bio-region
Counties entirely within the bio-region**
Placer and El Dorado Counties**
Source: California Department of Finance. 2012. Interim Projections of Population for California: State and Counties. http://www.dof.ca.gov/research/demographic/reports/projections/interim/view.php.
**The definition for "counties entirely within the bio-region" includes Alpine, Amador, Calaveras, Inyo, Lassen, Mariposa, Modoc, Mono, Nevada, Plumas Sierra, and Tuolumne Counties. While Inyo County has a significant land base outside the bio-region boundary, as discussed in the 2011 Sierra Nevada Conservancy (SNC) Demographic and Economic System Indicators Report, nearly all the population and economic activity in this county occurs within the bio-region. The report uses the same rationale for Modoc and Mono counties; however, our boundary for the bio-regional assessment extends further than the SNC region and includes both of these counties. Additionally, El Dorado and Placer Counties, while largely within the Sierra Nevada, were analyzed separately in their report, because they are strongly impacted by proximity to the Sacramento area and characteristics of these counties are substantially different from the rest of the "counties entirely within the bio-region." These two counties were, therefore, separately analyzed here as well.
137
Increasing diversity, both in and outside the bio-region, will continue to influence community values.
Though the Sierra Nevada is generally less diverse than the state as a whole, it is becoming more diverse.
According to Roberts et al. (2009), “No demographic trend is of greater importance to national forest
managers and leaders than the immense growth of cultural diversity. California is home to more than one-
third of the entire U.S. Asian American population and about 30 percent of all U.S. Latinos and Native
Hawaiians or Pacific Islanders.” As Winter et al. (2013a, p.8) point out:
These dimensions of diversity add to the already diverse demographic, economic, and ethnic
profile of Sierra Nevada communities. Both new and existing populations will challenge modes of
outreach, engagement, and approaches to management. Particular attention will need to be paid to
groups who may be underserved or underrepresented in opportunities to have their opinions heard,
needs or interests represented in decisions about how places will be managed, and opportunities to
use their public lands.
Movement into the Sierra Nevada by new residents and increasing cultural diversity will continue to
challenge the agency’s ability to manage for diverse interests. Additionally, balancing across multiple uses
and benefits will continue to be influenced by ecological constraints, external drivers and stressors,
policies and laws, and agency resource limitations.
National Forests as a Place to Learn about and Contribute to Cultural Legacy
Forests support cultural legacy through the various cultural connections that they provide. National forests
provide residents and visitors in the Sierra Nevada various opportunities to connect with and learn about
the region’s history and culture. National Visitor Use Monitoring (NVUM) data provides some sense of
the role that visiting historic sites currently plays in visits to national forests in the bio-region. According
to 2005-2009 data, 6.4 percent of visitors to forests in the bio-region visited historic sites, although only
0.1 percent cited this activity as the main reason for visiting a forest. National outdoor recreation trends
indicate that visiting historic sites has had moderate growth in recent years (Cordell 2012). Maintaining
cultural connections depends on protecting and knowing the condition of cultural and historic resources.
However, many resources throughout the bio-region have not been identified or have not been evaluated.
In addition, the agency is in the middle of a dramatic shift in philosophy regarding cultural resources to
not only include material objects and features, but also broader, Native American definitions and uses.
There is little information on conditions and trends for these new types of cultural resources.

138
Some general trends are expected to impact cultural and historic resources over the next several decades:
climate change
population growth
increasing demand for recreation infrastructure
decreasing federal budgets
increasing looting and vandalism
unauthorized marijuana cultivation
increasing demand by Native American tribes for access to and
use of traditional and sacred cultural resources and places
increasing demand for heritage tourism
increasing frequency and severity of wildfire in the Sierra Nevada
Sierra Nevada landscapes have long inspired artistic production and continue to inspire artists to
contribute to the region’s future legacy. John Muir is perhaps the most well-known for capturing the spirit
and grandeur of the region in his writings, and Mark Twain, Jack London, Bret Harte, Mary Austin, and
John Burroughs contributed significantly to describing the Sierra Nevada in prose and poetry (Duane
1999). The lives, stories, and poems of Beat Generation writers, including Allen Ginsberg, Jack Kerouac,
and Gary Snyder were also greatly influenced by the Sierra Nevada. In his world famous photographs,
Ansel Adams captured the beauty and spirit of Sierra Nevada landscapes. Hundreds of art galleries and
studios, music venues, and theaters are found throughout the Sierra Nevada, many of which are closely
tied to the bio-region's natural and cultural history (National Geographic Society 2009). With population
growth expected in various parts of the Sierra Nevada, demand for utility lines, cell towers, and
infrastructure for alternative energy development is expected to increase as well. This could result in
scenery becoming less visually appealing for some, affecting artistic inspiration and sense of place. The
level of support for the arts can also influence how well the arts thrive, which can contribute to the
wellbeing of communities (Kay 2000, McHenry 2009).
Native American Culture and Rights
Forests in the bio-region play an important role in supporting and protecting the rights and privileges of
tribes that help them maintain their culture. Every national forest is carved out of ancestral Native
American land, and Native American historical and spiritual connection to the land has not been
extinguished or diminished despite these changes in title. As described in the Sierra Nevada Ecosystem
Project report (Anderson and Moratto 1996), Native Americans have influenced Sierra Nevada landscapes
over many generations. For thousands of years, their land use ethic included spiritual, philosophical, and
economic dimensions. In Native American culture, humans are viewed as part of the natural system,
helping to ensure abundance and diversity of plant and animal life. Native Americans practiced land
management though burning, irrigating, pruning, selective harvesting, sowing, and weeding. Today, while
most of their ancestral lands are occupied by others, tribes throughout the Sierra Nevada have maintained
distinct ethnic identities. Many Native Americans participate in traditional activities, such as hunting,
fishing, trapping, and gathering berries, and do not differentiate these activities into distinct categories,
such as work, leisure, family, culture, and tradition (McAvoy et al. 2004). These activities carry on family
and tribal traditions, provide sustenance for families, and continue a spiritual connection to the land and to
139
animal and plant resources (McAvoy et al. 2004). These activities, and the places connected to them, have
cultural, symbolic, and spiritual as well as functional meanings (McAvoy et al. 2004).
As described in Goodwin (2013), the Forest Service shares in the federal government's overall trust
responsibility for federally recognized American Indian tribes and Alaska Natives. Tribes throughout
California have the right to hunt, fish, and gather on tribal lands, as well as have access to water that
supplies consumption, agricultural purposes, or resource protection. Some tribes have rights associated
with treaties, and some tribes have other reserved rights. Tribal consultation is a formal, legally mandated
process used for implementing a nation-to-nation relationship established by treaties and executive orders
of the United States. It is very important for the national forests to maintain a sense of history and
relationship with the tribes. Information shared in consultation is part of the larger conversation and
relationship, and it is not an isolated one-time contact. The ability to sustain their culture and way of life
is dependent on access to cultural resources and sacred sites. Native American sacred sites are locations
considered sacred by: Indigenous Americans, the citizens of the 110 California federally recognized
tribes, the more than 50 non-federally recognized tribes petitioning for recognition, and a multitude of
other Native Americans who may or may not be associated with a specific federally recognized tribe.
Sacred sites are not identified or defined by the agency. Only the tribes and traditional practitioners can
describe and tell us what is sacred on the landscape.
While California’s indigenous people trace their ancestry back 9,000 to 14,000 years or more, and are
sovereign governments, California Native Americans and their cultures are almost non-existent in the
eyes of the American people and in terms of history and recognition by the federal government (Goodwin
2013). Currently, there is a lack of understanding by visitors and managers toward Native American
values and traditions, as well as a lack of understanding of treaty rights that give Native Americans unique
use rights on National Forest System lands (McAvoy et al. 2004).
The Forest Service recognizes that National Forest System lands are also ancestral lands to many tribes,
and that there is a need for effective relationships with these tribes, to engage in formal consultation, and
to provide avenues for more communication and collaboration. The Forest Service may conduct activities
that have a substantial impact on tribes. These include land management planning, grant programs, timber
sales, mining, road building, recreational development and use, archaeological excavations, and energy
development. Agency cultural training is currently being developed by the Washington Office of Tribal
Relations specifically for the purposes of carrying out the recommendations within the Sacred Sites
Report to the Secretary of Agriculture. Staff in the Washington Office is also working with Regional
Tribal Relations Program Managers to develop broader training on tribal issues and needs. The Pacific
Southwest Regional Office Tribal Relations staff is also developing a guide on formal tribal consultation.
There is growing recognition that tribal communities within the Sierra Nevada present distinctive
opportunities for partnerships to restore ecologically and culturally significant resources, and to promote
resilience, as well as the importance of incorporating traditional ecological knowledge into management
and monitoring (Charnley et al. 2013). The variability of resources across different tribes also impacts
their ability to engage in various planning and management efforts.
Non-tribal Harvesting of Special Forest Products
According to Richards (1996), harvesting non-timber forest products (NTFP) has been an important
cultural activity for non-tribal communities as well. A wide range of non-timber forest products are
gathered from National Forest System (NFS) lands in the Sierra Nevada, including wild food plants,
140
medicinal plants, floral greens, seeds and cones, posts, poles, firewood, transplants, and Christmas trees.
New uses for and values toward special forest products have developed. The most frequently collected
and most economically valuable products are in decline, while many “minor” products are either
emerging or increasing. Some of these products may be intensely valued by particular socio-cultural user
groups, even disproportionately in relation to the amount harvested, the economic value received, and the
ecological impacts on the landscape. Conversely, the collection of other special forest products may have
unanticipated ecological or socio-economic consequences depending on past, present, and future
conditions of removal, including harvesting pressure. Ethnicity and different community traditions have
played an important role in what special forest products are gathered in Sierra Nevada forests. National
Visitor Use Monitoring (NVUM) data provides some sense of the role that NTFP harvesting currently
plays in visits to national forests in the bio-region. According to 2005-2009 data for the bio-region, 2.1
percent of visitors participated in gathering forest products, though only 0.2 percent of visitors reported it
as the main reason for visiting a forest. Tribal versus non-tribal gathering, however, is not differentiated.
As mentioned in Charnley and Long 2013, little information about non-tribal, non-traditional forest
product harvesting in California, and in the Sierra Nevada specifically, exists in the published literature.
No monitoring or studies have been conducted or published by the Forest Service in California on ethno-
botany.
Inclusive Politics, Government, and Management
The Sierra Nevada is an area that is extremely important to different people for various reasons. A host of
groups and governments have a vested interest in what happens on NFS lands, which make up about 41
percent of the land base in the bio-region. By working together toward common goals across jurisdictions,
we can be more efficient and effective with available resources. The Forest Service can help ensure broad
participation in public processes, and that the voices of underrepresented or excluded groups are heard.
The ability to work across agencies and governments to address resources issues can influence the
effectiveness of management across all jurisdictions, particularly in light of future uncertainties and
change. A good example of this is invasive species management. Areas with high land use diversity and
subdivision of lands between management agencies make it difficult to effectively control invasive
species without collective action (Winter et al. 2013a). Another example includes restoring the role of fire
on the landscape, which requires major political support and coordination across various levels and
agencies of government.
According to Charnley et al (2013, p.3):
An all-lands approach to forest management calls for cooperation and collaboration with other
landowners, creating an opportunity for the Forest Service to build relationships with its neighbors
and to promote broad-scale restoration. Yet managing across ownership boundaries remains
challenging.
The Forest Service Pacific Southwest Region has drafted partnership strategies that recommit the region
to broader and more successful collaborations with external partners. The plan is to expand the number,
quality, and scope of partnerships throughout the state, especially in areas related to water and watershed
management, healthy forests, engaging youth, recreation, and volunteerism (USFS 2013).
141
Tribes throughout California have expressed their interest in working with the Forest Service to develop
management strategies consistent with traditional management techniques. The path toward diversity and
inclusiveness includes the original inhabitants of these lands, as well as the variety of peoples who
currently live and work around the national forests. For tribal economies to be successful, it is necessary
to be diverse in reaching out, building infrastructure and developing a governmental structure. Tribes that
participate actively in forest planning and are involved in Forest Service projects can create jobs and
improve their own economies. The current consultation process may need to be improved so that all
parties feel a true sense of engagement from the beginning, and the tribes want to be active participants.
Effective consultation on forest management begins before lines are drawn on a map. Forest managers
can most effectively begin this process by engaging tribal partners to discuss historical land treatment and
how those lessons learned over thousands of years can help us develop long term strategies to restore the
nation’s forests. Traditional ecological knowledge and western science can be blended for successful
outcomes on the landscape. Tribes should be consulted as early as possible in the development of policies,
plans and actions that may have tribal implications. Tribes can be supportive partners for management
decisions. Tribes can communicate their knowledge and belief in the benefits of thinning diverse stands
and balancing within the ecosystem. Tribal partners can facilitate larger collaborative efforts between
federal agencies. Tribes work with nearly all state and federal agencies, and have access to private
funding and their own programs. Recognition of their strength as partners will help accomplish the
landscape scale restoration that is needed. Tribes are willing to partner with the agency to reach important
restoration goals, and walking together as partners will be critical to success.
Promoting broad participation and involvement may continue to be a challenge. The socio-political
environment in California, where there is high regional diversity, racial and ethnic diversity, political
distrust, and a trend toward civic disengagement, signifies more rather than less difficulty in reaching
public consensus on policy issues (Winter et al. 2013c). These trends are not constrained to California,
and in some cases, reflect a detachment, disconnection, and mistrust of anything “governmental” by a
frustrated segment of the public (Winter et al. 2013c).
As described in the 2012 Planning Rule, public participation early on in the planning process is expected
to lead to stronger, more effective and relevant plans. Early engagement is expected to increase trust in
the agency and potentially reduce the cost of litigation as a result of receiving public input before
developing and finalizing decisions. There are various direct costs associated with litigation, such as
attorney fees and employee salaries. There are also indirect costs, such as those related to delays and
modifications of projects on the ground and resources spent on litigation rather than developing new
projects or other activities. By engaging with the public early on and throughout the planning process, the
agency will be better able to address issues and concerns by increasing transparency, developing
awareness of the values and expected behavior of others, and seeking greater understanding about values,
needs, tradeoffs, and outcomes.
Increasing cultural diversity and increasing efforts to include underrepresented communities and youth in
management discussion will require new ways of engaging stakeholders.
According to Winter et al. (2013a, p.2):
142
Given the projections of diversity of cultures and accompanying diversity of values that will
continue to characterize visitors and residents in the Sierra Nevada and surrounding areas,
engaging stakeholders in an ongoing and adaptive process for forest management practices and
decision making is important.
The Forest Service, as required by the 1994 Executive Order 12898, continues to make achieving
environmental justice part of its mission by identifying and addressing, as appropriate, disproportionately
high and adverse human health or environmental effects of its programs, policies, and activities on
minority populations and low-income populations (Council on Environmental Quality 1997). In addition,
environmental justice at the U.S. Department of Agriculture means that, to the greatest extent practicable
and permitted by law, all populations are provided the opportunity to comment before decisions are
rendered on, are allowed to share in the benefits of, are not excluded from, and are not affected in a
disproportionately high and adverse manner by government programs and activities affecting the
environment and its impact on human health (U.S. Department of Agriculture 2012). For each forest
going through forest plan revision in California, environmental justice concerns will be identified and
addressed. New Forest Service guidance on environmental justice analyses is forthcoming.
Social Interactions
Social interactions that build trust and get people working together benefit communities by contributing
to a sense of common identity and shared future, which is critical for community prosperity and
sustainability (Flora and Flora 2004). Social interactions with friends and family also help to pass on
values and world views. The Forest Service plays a role in fostering and maintaining social interactions.
Opportunities for Spending Time with Friends and Family
According to a report by Roberts et al. (2009), being with friends and family is one of the main reasons
Californians enjoy outdoor recreation. Social interaction with friends and family and experiences with
features of a place define people's sense of place, attachment to place, and the feeling that a community
attributes to a specific landscape (Eisenhauer et al. 2000, Kruger and Jakes 2003). In particular,
socializing and spending time with family plays a major role in how and why California’s Latino
population recreate on federal lands. Studies have shown that they: enjoy all day, extended family social
outings; are interested in an outdoor experience with a strong social recreation component; and identify
having a good family experience as one of the most important features of a satisfying outdoor recreation
excursion. The report notes also notes that immigrants often look to recreation and leisure time to help
maintain cultural traditions and to connect with other immigrants for mutual support and information
sharing. While recent immigrants tend to recreate with family groups, second and later generations often
pursue recreation with friends. The Latino emphasis on family and family values is maintained across
generations and does not seem to diminish with increased time in this country.
National forests in the bio-region provide a wide range of opportunities for family, friends, organizations,
and clubs to get together. However, the growing population of ethnic minorities in California is still
underrepresented among visitors. The social benefits from recreating on National Forest System lands in
the bio-region may not be as wide reaching as they could be. Differences in how people want to interact
with the land and the role that socializing plays in theses interactions can affect and can be affected by
management. These factors can have an influence on people’s ability to connect to the land and to each
143
other. The Forest Service continues to work on ways for engaging underrepresented communities, as
previously described in the section “National Forests as a Playground for All” under the “Sustainable
Recreation” theme.
Opportunities for People to Work Together and Build Community Capacity
Forests help establish community identity and promote civic involvement by bringing people together
through collaboration. Natural areas can help establish community identity, social activity, and social
participation (Karjalainen et al. 2010). Places help shape the identity of social groups who share common
experiences and develop positive interpersonal relationships relative to a place, and they can inspire
people to take collective action (Cheng et al. 2003). Natural resource management can also bring together
diverse individuals and groups who may be able to discover common, place-based group identities, which
can transform and sustain communities that have direct effects on natural resources (Cheng et al. 2003).
The Forest Service plays a key role in bringing people together to participate in forest planning and
management. As laid out in Charnley et al. (2013, p.8), there are many social benefits of collaborative
natural resources management. Collaboration on national forest management issues often takes place
through community-based collaborative groups.
They describe the following benefits from relevant literature:
creating a sense of shared ownership over large and complex environmental problems;
combining different forms of ecological knowledge and promoting better and shared understanding of
natural resource management issues;
integrating economic and social concerns with ecological concerns so that they can be addressed
together;
enhancing opportunities to pool resources and assets in addressing resource management issues;
improving working relationships between agencies, members of the public, and other stakeholders;
and
increasing community understanding of and support for land management.
However, Charnley et al. ((2013) also point to barriers to collaboration that have been shown to exist in
eastern Oregon based on a study by Bergmann and Bliss (2004). These may also be applicable to
communities in the Sierra Nevada, and many may be beyond the ability of the agency to control. These
include:
short tenures and high turnover of federal staff;
concerns about accountability of managers when rural people believe that their livelihoods are at risk;
strong ideological differences among stakeholders;
concern about administrative burdens and regulatory limitations imposed by NEPA and other federal
environmental laws;
skepticism among environmental groups about local collaboratives; and
differential risks to landowners and managers due to scale.
144
High levels of regional diversity, increasing racial and ethnic diversity, political distrust, and a trend
toward civic disengagement in California add to the challenge of bringing together diverse individuals
and reaching consensus on any given issue (Winter et al. 2013b). Despite challenges, the agency’s
emphasis on working together and taking an “all-lands approach” to management (USFS 2013) is
expected to result in an increase in collaborative efforts throughout the bio-region in the future.
An important trend is the increase in online interaction. There is an increasing trend toward internet tools
and norms for collaborative natural resource management, and open government more generally. The use
of the Living Assessment for forest plan revision is a good example. The trend toward “open government”
and use of the internet to create a more inclusive, accessible environment is marked by transparency,
participation, and two-way exchange of information, knowledge, and values. The U.S. Department of
Agriculture has an open government plan and a website dedicated to the open government initiative.
Local Economic Opportunities from Forest Activities
The overall economic contribution of the bio-region is estimated to be small when compared to the state
as a whole. The Sierra Nevada Conservancy (SNC) estimated that the SNC Region – which aligns with
the SNC boundary and therefore excludes portions of counties that fall outside this boundary – comprises
around 0.7 percent of the total value of California’s 2009 economic production as measured by gross
domestic product (Sierra Nevada Conservancy 2011b). As discussed above, there is more value in the
bio-region than can be captured in such measures of economic output alone and these factors also
contribute to the quality of life for residents and visitors to the bio-region.
The physical proximity of these communities to the forests of the bio-region creates a natural connection
and opportunity for forest activities to influence both the economic contribution and the overall wellbeing
of communities in this area. Forest-related economic activities in these communities include production
and processing of forest commodities, as well as providing support and services for recreational
opportunities. Note that these local economies may be based primarily in forest commodities or
recreation services, or may be comprised of some mixture of these sectors. Traditionally, commodity-
based economic sectors have played a big role in employment in these communities because sectors such
as timber and grazing have a long history in the bio-region. Recreational opportunities on the forests and
the visitors these opportunities draw have grown, and play an important role in shaping employment as
communities develop their economies around providing visitor services (Steward 1996).
Forest-based activities also influence community wellbeing in the bio-region by generating local
government revenues that are needed to fund critical public services such as fire protection, education and
transportation (Lin and Metcalfe 2013). Examples of these key forest activities are in commodity sectors
like timber and grazing, as well as in the non-commodity based recreation sector, which supports many
job opportunities in the travel and tourism industry across the bio-region. In some places in the bio-
region, these activities make up a significant portion of the local economy and therefore forest
management plays an important role in influencing the economic conditions in these communities.
Another contribution of forest activities to job creation is through Forest Service spending, which is
potentially a direct investment into the local economy. This investment can support local jobs for forest
activities and also provide local services, such as grocery stores, banks and restaurants, needed by these
workers and their families.
145
The role of forest activities in providing job opportunities, contributing to local government revenues and
the effects of local Forest Service spending are discussed below.
Job Opportunities
The bio-region is more vulnerable economically than is the state as a whole. As a result, communities in
the bio-region are less able to dampen and adapt to changes that may negatively affect local economies.
This vulnerability varies from community to community. In general, there are fewer job opportunities in
the counties of the bio-region, the job opportunities that exist are typically lower paying than are jobs
across the state, the residents have lower incomes and receive less of this income from current
employment, thus relying more on their retirement savings, Social Security and public assistance
programs (Lin and Metcalfe 2013). In addition, some local economies in the bio-region lack diversity
across economic sectors. As a result, they are dependent on only a few specific sectors to support a large
percentage of local employment. Such a concentration of employment in just a few sectors creates
volatility and the potential for boom and bust cycles in these communities when businesses in the same
major industry group are all expanding or contracting at the same time (Lin and Metcalfe 2013).
Historically, federal forest management was important in contributing to community stability in the bio-
region by providing stable employment and income in the local timber industry. However, federal forest
management alone cannot ensure this community stability as jobs in the forest products industry are
influenced by market conditions and changes in technology that are outside the control of forest
management. As a result, national forests cannot expect to ensure community economic wellbeing
through their management actions alone (Charnley 2013). Strategies can be developed that allow forests
to achieve management objectives while simultaneously considering the effects on local wellbeing (USFS
2013).
Developments in the bio-region during the 1990s saw a dramatic decline in timber production on national
forest lands as a result of concerns about old growth forest ecosystems, watershed health, and threatened
species (Berck et al. 2003, Charnley et al. 2006, Charnley 2013). In addition, California has also been
affected by the national trend of decreasing sawmill capacity resulting from decreasing market demand
(Spelter, McKeever and Toth 2009). This declining timber production had an adverse effect on the
economies of local communities through reductions in workforce and declines in the forest product
infrastructure available to process timber.
Across the bio-region, forest commodity sectors make up a much smaller percentage of total employment.
As of 2010, timber and mining in the counties of the bio-region made up only 0.7 percent and 0.5 percent
of employment respectively. Trends in the timber industry have seen reductions in the local workforce
and the infrastructure available to process timber and biomass. As a result, the timber that is harvested in
the bio-region and then transported out of the bio-region for processing takes these potential jobs and
economic benefits away from local communities. In addition, this reduction in capacity also increases the
economic and logistic difficulties associated with increasing the pace and scale of forest restoration
(Charnley and Long 2013, Charnley et al. in press). This effect highlights the important interdependence
of resilient communities and forest management objectives, which are further detailed under the Fire
Resilience theme. Future timber harvests throughout the bio-region are dependent on the demand for
wood products, which fluctuates in response to both regional and international economic conditions, the
pace of new home construction and future decisions on restoration activities (Sherlock 2013).
146
Grazing on forest lands has also been a traditional forest activity in local economies that has declined in
recent years due to market conditions, environmental concerns that limit the herd size authorized in Forest
Service grazing permits, and limited resources available to evaluate requests for new permits. Public
rangelands on the forests are used for seasonal cattle and sheep grazing as ranchers often have a greater
demand for year-round forage than can be supported on their privately-owned base property lands. The
seasonal nature of the valley and foothill rangelands led to the tradition of moving animals from the
private base ranches to the higher elevation summer public land ranges to round out the annual forage
needs for their livestock. Therefore, access to these public lands is critical in determining the viability of
ranching operations. The number of permitted head grazed on National Forests System lands has
decreased by more than 50 percent since 1980. This means fewer economic opportunities are available in
this sector. Agricultural jobs, which include grazing, make up around three percent of employment in the
counties of the bio-region.
Even though contributions of forest commodities to employment are small across the bio-region,
production on national forest lands continues to make an important contribution to local economies in
some parts of the Sierra Nevada. Across the bio-region, a concentration of timber production is prevalent
in the northern Sierra Nevada counties, and grazing is found mainly in the northern and eastern Sierra
Nevada, as well as in the oak woodland ecosystems of the western edge of the bio-region (Duane 1996,
Charnley 2013).
The central and southern portions of the bio-region are where recreation and tourism dominate some local
economies (Duane 1996, Charnley 2013). Recreation, tourism and travel make up a much larger portion
of the workforce than do timber and grazing, accounting for 18 percent of all employment in the counties
of the bio-region. In terms of the number of jobs created, recreation is the most influential of forest-based
activities. These service jobs have a lower average wage, so while more jobs are created by recreation,
they pay less. More details on the importance of recreation in supporting communities are provided under
the Sustainable Recreation theme. Trends show that employment across forest activity sectors has been
fairly stable over the last decade, except for the expected fluctuations during the recent recession (Lin and
Metcalfe 2013).
The recent recession had a large impact in the state and in the bio-region, with unemployment doubling in
both areas from 2007 to 2010 (Sierra Nevada Conservancy 2011b). The counties of the bio-region have a
higher average annual unemployment rate, lower average earnings per job, and lower per capita income
than does the state as a whole. Households in the bio-region also receive a smaller percentage of their
income from their jobs and more from payments such as Social Security and public assistance (Lin and
Metcalfe 2013). These social transfer payments were the fastest growing income component throughout
the entire bio-region from 2001 to 2010. This is a similar growth rate as the state as a whole. The
percentage of income from labor increased faster in the bio-region over this time period than it did across
the state. However, median household income in the bio-region increased by just two percent last
decade, compared to the state as a whole, which increased by four percent, thus resulting in a widening of
the income gap between those living in the bio-region and the rest of the state (Sierra Nevada
Conservancy 2011b).
The bio-region is more economically vulnerable, but there are differences in this vulnerability across the
various bio-regional sub-areas. The counties in the northern portion of the bio-region have lower than
average earnings and a larger percentage of income resulting from retirement savings and Social Security.
This is because the area has a higher percentage of retirement-age people over the last decade. The
147
counties of the southern portion of the bio-region have a lower than average per capita income and a
higher percentage of this income is from public assistance programs such as Supplemental Security
Income (SSI), public cash assistance and food stamps. This follows from the finding that poverty in this
area is the highest in the bio-region and is much higher than the state as a whole. The counties of the
central portion of the bio-region have a lower than average unemployment, higher than average earnings
and higher than average per capita income. Comparing these measures reveals that the economy in the
central portion of the bio-region is healthier overall than the economy of the bio-region as a whole (Lin
and Metcalfe 2013).
Forest management plays a role in influencing conditions in forest-related economic sectors and
contributes to community wellbeing. Such consideration is critical in forest planning as current Forest
Service direction from the U.S. Department of Agriculture (2010) is to generate jobs through recreation
and natural resource conservation, restoration, and management in rural areas. In addition, the 2012
Planning Rule directs forests to examine how management can contribute to social and economic
sustainability, thereby supporting communities and rural job opportunities. Also, the Forest Service
Pacific Southwest Region Ecological Restoration Implementation Plan calls for consideration of the
socio-economic dimensions of restoration to support vibrant and prosperous rural communities (Charnley
2013, USFS 2013).
Creating restoration-based job opportunities in these areas would help to reduce unemployment, increase
earnings and develop a more diverse employment base, thus lessening the economic vulnerability in the
bio-region, and improving the capacity of these communities to adapt to change (Kusel 2001, Nadeau et
al. 2003, Sturtevant and Donoghue 2008, Charnley 2013, Walker and Salt 2006, Charnley and Long
2013). For example, a study has estimated that 13-29 jobs would be created or retained and over $2.1
million in total economic activity would be generated for every $1 million that is invested on restoration
(Moseley and Nielsen-Pincus 2009). This approach to restoration helps to maintain a local workforce and
infrastructure in these communities with the capacity to carry out the forest management work that is
needed to improve and restore ecological integrity and resilience in forest ecosystems (Kelly and Bliss
2009). More details on the important role of communities and the local workforce in forest restoration are
provided under the Fire Resilience theme.
Contributions to Local Government Revenues
Key sources of local government revenue from forest activities are the sales tax collected on commodities
and services, as well as the direct revenue received from the Payments In-Lieu of Taxes (PILT) and
Secure Rural Schools and Community Self-Determination Act (SRS) programs. Current conditions and
expected future trends in constrained government budgets suggest that these revenues are important as
they allow local governments to provide public services such as fire protection, education and
transportation that is important in maintaining wellbeing in communities.
Under federal law, county governments are compensated through Payments in Lieu of Taxes (PILT) for
reductions to their property tax bases from National Forest System (NFS) land. These lands cannot be
taxed, but may create demand for services such as fire protection, police cooperation, or simply longer
roads to skirt the federal property. For NFS lands, counties receive federal payments for timber and other
resources through either the traditional 25 percent revenue sharing agreement, or through the Secure
Rural Schools and Community Self-Determination Act (SRS). The 25 percent fund has provided revenue
sharing between the forest service and rural counties for nearly a century (Gebert et al. 2004). Because of
148
decreases in timber production and timber prices, counties have typically favored the higher payments
from SRS since its introduction in 2000. Originally scheduled to sunset in 2006, SRS was renewed by
Congress in 2007, 2008 and 2012. Each time, payments were reduced. The future of SRS is uncertain
given that it has not yet been renewed for FY 2013 and all payments may revert to the original 25 percent
revenue sharing framework if not renewed. This potential variability in payments from year to year makes
planning difficult, as the amount of revenue available to local governments is uncertain. In addition, there
is uncertainty given the current federal government budget sequester as PILT payments are scheduled to
be reduced below the levels counties were expecting to receive this year (Salazar 2013).
All of the counties in the bio-region received some level of payment in lieu of taxes (PILT) in FY 2009.
Looking at these PILT revenues as a percentage of total county revenues shows a small contribution for
the bio-region as a whole (around 0.5 percent of all county revenue) but a more important contribution for
specific counties, particularly Modoc where PILT accounted for 5.7 percent of all county revenue, and
Plumas County (5.7 percent), Siskiyou County (4.3 percent), Sierra County (4.2 percent), Lassen County
(4.1 percent), Inyo County (3.3 percent), Alpine County (3.0 percent), and Tuolumne County (2.5
percent)(Lin and Metcalfe 2013). Given limited and strained local government budgets, any loss of
revenue can have a noticeable effect on the quantity and quality of services that can be provided.
Data on timber tax revenues show that they contribute a very small percentage of the total county
revenues for the bio-region as a whole (0.01 percent). A study which estimated the percentage of the
county sales tax revenue dependent on visitor-related spending found that this is a very important source
of revenues for counties, particularly in Mariposa County where the sales tax from visitor spending
accounts for 61.4 percent of all sales tax revenue collected. The other counties where visitor spending is
important to local government revenues are Mono County (57.9 percent), Alpine County (33.3 percent),
Sierra County (29.9 percent), Plumas County (24.9 percent) and Inyo County (20.8 percent)(Dean
Runyan and Associates 2012). While national forests do contribute to travel and tourism in the bio-region,
and therefore, can influence this transient tax revenue, there are other recreational opportunities that drive
this tourism, such as the national parks, and therefore all of this revenue cannot be attributed to visitors to
national forests alone.
Not only are forest activities important in supporting local government revenues through PILT and sales
taxes, but these revenues are also important in supporting local forest activities. These government
revenues pay for the education necessary to develop a local work force and also for the transportation
infrastructure that the residents of the area and the businesses engaged in forest-based activities rely on to
support daily activities. In addition, the financial incentives that are provided by local governments help
support forest activities. An example is Williamson Act funding – a state program reducing property tax
rates to encourage the conservation of agricultural lands– and its importance in sustaining ranching in the
bio-region. Budget cuts have already resulted in dramatic reductions to the funding of this program, and
continued decreases bring into question the ability of ranchers to maintain the profitability of their
businesses. Not only would the potential business closures result in economic consequences from lost job
opportunities, but would also result in social consequences as a result of impacts to the culture of the bio-
region as ranching as a lifestyle is lost. Such a transformation could also result in commercial
development of large areas of current rangeland throughout the state, thus increasing the development
pressures in the wildland urban interface area of the bio-region and the ecological problems that brings
(Wertzel et al. 2012). This example shows the complex integration of economic, social and ecological
factors that influence forest management in the bio-region.
149
Forest Service Spending in Local Economies
Forest Service spending from 2006 through 2012 by the national forests in the bio-region has increased,
mostly as a result of increases in the budgets for wildland fire management – spending for fuel reduction
and fire preparedness (USFS 2012c). An important consideration of this spending in contributing to local
community wellbeing is how much is actually spent locally to support businesses and to create job
opportunities in these communities. Forest managers have the opportunity to think strategically about this
local spending and the mechanisms available to ensure local economic benefit (Charnley 2013, Charnley
and Long 2013).
Health, Safety, Education and Skills
Individual skills, abilities, and knowledge, or human capital, contribute to a person’s ability to support
themselves, contribute to their families, and strengthen their communities (Flora and Flora 2004). Formal
and informal education, training, and experience contribute to human capital, as well as health. The Forest
Service has a role in helping to maintain human capital in the bio-region and beyond.
Human Health
Forests in the bio-region provide basic necessities for life, like clean air and water, and many physical and
mental health benefits. Forested watersheds in California provide an abundant supply of clean water that
supports a broad range of downstream uses (CalFire 2010). The controlled release of snowmelt
throughout the spring and summer helps to control winter flooding in the valleys, and provides irrigation
for food crops and water to keep recreation and other businesses and industries thriving through the
summer. This water also provides hydropower to light homes, and quality drinking water to meet the
needs of residents throughout California (Sierra Nevada Conservancy 2011a).
Climate change is impacting water flow and timing in the Sierra Nevada (Jardine and Long 2013). As
population grows throughout the state, demand for water in California grows, while the supply remains
the same (CalFire 2010). Pressures from California’s agricultural and urban areas are being resisted by
groups interested in preserving biodiversity and environmental quality in the Sierra Nevada, and who
view the continuous and rising export of water to other regions as undesirable in the long run (Mittelbach
and Wambem 2003). Population growth has led to increased competition for water among various uses
within the Sierra Nevada, including in-stream flows for aquatic species, water recreation, hydropower,
domestic uses, and national forest and special use permit site uses. According to a 2010 assessment of
Sierra Nevada watersheds using the Forest Service Watershed Condition Framework, 63 percent were
classified as “functioning properly” and 36 percent were classified as “functioning at risk.” National
forests have generally provided a high level of water quality protection for Sierra Nevada headwaters. Of
the water bodies on NFS lands within the Sierra Nevada, only Lake Tahoe was listed as one of the “top
threatened watersheds” by the CalFire 2010 Forest and Range Assessment Program Report.
Participation in recreation activities is the way most people have come to know their national forests, and
contributes greatly to the physical, mental, and spiritual health of people (USFS 2010a). “The connections
between human health and forests hold great potential for improvement of wellbeing (Karjalainen et al.
2010)” (Winter et al. 2013c, p.2). People who feel connected to nature are not only more likely to protect
nature, but also more likely to feel satisfied with their lives (Mayer and Frantz 2004).
According to the America’s Great Outdoors report (Council on Environmental Quality et al. 2011):

150
Studies show that access to the outdoors can help turn the tide on the obesity health epidemic.
They show that play and relaxation in nature can reduce stress and anxiety, promote learning and
personal growth, and provide overall mental and physical restoration.
Eighty-four percent of the Californians polled in the most recent Comprehensive Outdoor Recreation Plan
(CORP) statewide survey said outdoor recreation was an “important” or “very important” contributor to
their quality of life (Roberts et al. 2009). Nature-based outdoor recreation has been increasing nationally
(Cordell 2012). A stable public land base, a declining private natural land base, and increasing numbers of
outdoor recreation enthusiasts are expected to result in increased conflicts and declines in the quality and
number of per person recreation opportunities, especially on public lands near large and growing
population centers (USFS 2012f). In California, activities such as off-highway vehicle recreation,
mountain biking, boating and adventure recreation, have increased dramatically in recent years. At the
same time, population growth, urbanization and alternative energy production compete for suitable lands
(CalFire 2010). Cordell et al. (2004) expect that socio-economic trends across the country will put
disproportionate pressure on public lands for recreation and raw materials, and lead to increased conflict
and competition for access (as cited in Winter et al. 2013b).
Forests have a positive impact on air quality through deposition of pollutants to the vegetation canopy,
reduction of summertime air temperatures, and decrease of ultraviolet radiation (Karjalainen et al. 2010).
In the foothills and the southern Sierra Nevada, increased industrial and automobile pollution is of
particular concern. Pollution from the Central Valley goes up the western slopes of the Sierra Nevada,
creating hazy, unhealthy conditions for people in foothill communities up to elevations of over 6,000 feet
(Cahill et al. 1996). In multiple locations in the Sierra Nevada, especially the western slopes adjacent to
the highly polluted California Central Valley, studies have pointed to elevated ozone levels that exceed
public health standards (Winter et al. 2013a). People in these areas are exposed to higher ozone
concentration. The elderly, young, and people with respiratory conditions are at greater risk from
degraded air quality. Air pollution in many high Sierra Nevada communities is also attributed to local
sources, namely wood fires in towns like Truckee and Mammoth Lakes during winter months, which push
particulate levels into an unhealthy range (Sierra Business Council 1997). Air pollution in the Sierra
Nevada is largely outside the control of the Forest Service, aside from our influence on smoke through
fire management.
The Forest Service priority to increase the pace and scale of ecological restoration intends to improve the
integrity and functioning of ecosystems and sustainability of ecosystem services that benefit human health
and wellbeing (USFS 2013). Currently a small fraction, less than five percent, of the landscape has had
some form of treatment for restoration. Future trends in terms of improved ecosystem health and
associated human health benefits depend on the success of this regional priority.
Community Safety and Resilience to Wildfire
Wildfires can impact humans and their families, neighborhoods, and communities in a variety of ways
(McCool et al. 2007). They can lead to: death, increased stress, health problems related to smoke,
psychological impacts, emotional impacts, increased community tension and conflict, and decreased
opportunities for recreation. As described in Long et al. (2013), intense, large, and long-lasting wildfires
are likely to result in air quality that exceeds levels put in place to protect human health.
Uncharacteristically large and severe fires may also cause erosion and reorganization that can eliminate
151
vulnerable aquatic population, degrade water quality, reduce capacity of downstream reservoirs, and
increase the risk of flood. Large wildfires can increase the release of heavy metals in soils(Long et al.
2013c) , which have likely built up over time through atmospheric deposition (Bytnerowicz et al. 2013),
as well as mining activity that may have introduced heavy metals into the ecosystem (Hunsaker et al.
2013a) (as cited in Winter 2013a).
The Forest Service helps communities in the bio-region stay safe through wildfire prevention and
suppression activities. However, fires are increasingly outside the range of variation of historic fire
regimes for most ecosystems after nearly a century of fire exclusion and other forest management choices.
Shifted fire regimes compounded by climate change, species invasions, population growth, and increased
development in the wildland urban interface (WUI) can have serious negative consequences on human
wellbeing (Winter et al. 2013a). The Forest Service Pacific Southwest Region’s priority to increase the
pace and scale of ecological restoration intends to improve forest and community resilience to wildfire
(USFS 2013).
A concentration of California’s high priority landscapes in terms of community safety, defined as high
wildfire threat together with human infrastructure assets, is located in the Sierra Nevada bio-region
(CalFire 2010). With the migration of more people into Sierra Nevada communities, more people are
exposing themselves and their families to unnecessary personal risk, particularly to the danger of wildfire.
Many newer residents are unfamiliar with the safety problems associated with building in certain
locations (Sierra Business Council 1997). People living in high fire risk areas tend to be unduly optimistic
about the degree of risk involved (Winter et al. 2013a). Landowners are not typically liable for failure to
take risk reduction actions on private property (Yoder and Blatner 2004). Still, community involvement in
wildfire planning is extensive in California, as evidenced by community wildfire protection plans, local
and regional Fire Safe Councils, Resource Conservation Districts and community participation in
Firewise Communities/USA program (CalFire 2010). Agency strategies can directly impact how fires are
managed and how communities prepare for, recover from, and understand wildland fires. Collaborative
approaches to fire management and risk reduction has helped with effective risk management (Winter et
al. 2013a). Education about the ecological role of fire, including high-severity fire, is also important in
helping people be more accepting of fire and smoke. It may be that many people's distaste for fire and
smoke stems from a belief that wildfire only has negative outcomes. The reality is that fire can also have
extremely beneficial outcomes.
National Forests as a Place to Learn and Build Skills
Forests provide opportunities for people, especially young people, to learn about nature and management
and to build valuable skills. There is increased attention on poverty in rural communities in the Sierra
Nevada, and connections between wellbeing and ecological quality (Winter et al. 2013a). There is an
income gap between those local communities within the Sierra Nevada and the rest of the state (Sierra
Nevada Conservancy 2011b). The poverty rate of the counties that contribute to the bio-region is higher
than the state as a whole (Lin and Metcalfe 2013). The impacts of poverty can be longstanding and affect
cognitive and socio-emotional processes influencing life-long development and outcomes in adulthood
(Evans and Rosenbaum 2008, as cited in Winter et al. 2013a). While a greater percentage of people in
local Sierra Nevada communities have a high school degree compared to the state, the percentage of
people with a college degree is lower than state levels (Sierra Nevada Conservancy 2011b). National
forests can provide educational and skill-building opportunities. For example, since 1970, the Youth
152
Conservation Corps (YCC) has operated as a summer employment program for a diverse group of young
people aged 15 through 18 who work, learn, and earn together by doing projects on public land. The
program is administered by the Forest Service, the U.S. Fish and Wildlife Service, and the National Park
Service. Another example is the California Conservation Corps, which has crews that work with the
Forest Service to receive training and work experience in forestry and firefighting. Finally, the Forest
Service Central California Consortium is a program focused on environmental education, minority
outreach and recruitment. It serves the greater San Joaquin Valley, and its purpose is to educate
underserved rural communities on natural resources and to encourage them to use public lands. The
program has established Hispanic and Asian components with African American and Native American
programs being established in the near future.
The Forest Service Pacific Southwest Region’s priority to increase the pace and scale of ecological
restoration of National Forest System lands is expected to increase the work that we do with youth (USFS
2013). In addition, the President’s America’s Great Outdoors initiative aims to develop quality
conservation jobs and service opportunities on public lands, especially for young people (Council on
Environmental Quality et al. 2011). This goal has led to an effort to develop a 21st Century Conservation
Service Corps (21CSC) to provide job training and to maintain and preserve public lands. The 21CSC
brings together many of the existing conservation corps programs and focuses on helping young people,
including low-income and disadvantaged youth, earn valuable training and work experience and to
accomplish conservation work on public lands in the great outdoors.
2004 Sierra Nevada Framework
Community resilience is not directly addressed in the current plan direction. However, there is guidance
on working to be responsive to the needs of those communities most directly affected by Forest Service
management.
One of the reasons the 2001 Framework was amended by the 2004 Framework was to reduce the risk of
wildfire to communities in the wildland urban interface. The decision includes managing hazardous fuels
in and around communities, combined with strategic placement of fuels treatments across broad
landscapes to modify wildland fire behavior.
This decision also addresses the need to retain industry infrastructure by allowing more wood by-products
to be generated from fuels treatments and dead and dying trees to be harvested during salvage operations.
It acknowledges that the Forest Service has a role to play in providing a wood supply for local
manufacturers and sustaining a part of the employment base in rural communities. In some cases, these
wood by-products will also help to offset the cost of fuels treatments.
The decision affirms that authorized recreation businesses contribute significantly to the economic base of
communities and counties that rely on national forest recreation for employment, wages, and taxes.
The 2004 Framework recognized the value of recreational pack stock use and commercial livestock
grazing and provides for flexibility to develop local management strategies that protect resources while
allowing reasonable uses.
The 2004 Framework adopts an integrated vegetation management strategy with the primary objective of
protecting communities and modifying landscape-scale fire behavior to reduce the size and severity of
wildfires. This would provide for the removal of some medium-sized trees to increase the likelihood of
153
accomplishing program goals with limited funding. The 2004 Framework acknowledges the role the
Forest Service plays in providing a wood supply for local manufacturers and sustaining a part of the
employment base in rural communities. This strategy addresses the need to retain industry infrastructure
by allowing wood by-products to be generated from fuels treatments and for dead and dying trees to be
salvaged after wildfires. This active approach to vegetation and fuels management accepts the risks of
temporarily changing some habitat for California spotted owls and other species to reduce the future risk
of wildfire to habitat and human communities.
The 2004 Framework calls for line officers to increase their collaborative efforts within the communities
of the Sierra Nevada. Much of this effort focuses around implementing the Healthy Forest Restoration Act
and the National Fire Plan.
The 2004 Framework directs the Forest Service to work with tribal governments and tribal communities
to develop mutually acceptable protocols for government-to-government and tribal community
consultations. These protocols will emphasize line officer and tribal official roles and responsibilities.
154
WHAT ARE THE CONCLUSIONS?
This assessment synthesizes existing information related to social, economic, and ecological conditions
and trends across the Sierra Nevada. While forest-level assessments are required by the 2012 Planning
Rule, there is no requirement for a bio-regional assessment. Based on input from stakeholders,
information was gathered and conclusions formed at this large scale to help guide forest plan revisions,
and help identify overarching themes. It was conducted rapidly, using readily available information and
existing data. It highlights both our current knowledge as well as information gaps.
This assessment looked at systems and sustainability for water quality and quantity, fire resilience,
sustainable recreation, ecological integrity and community resilience. There are pieces of the
sustainability puzzle throughout each theme. For each theme, there are conditions and trends where
drivers and stressors have influence and cause stability, deterioration or improvement. The intent was to
highlight these trends. Gaps in information were identified. This information will be used in the next
phase of the planning process.
What did we learn?
WATER QUALITY AND QUANTITY
Increasing population, with accompanying increasing demand for water use, will put increasing pressure
on water quantity and lead to more conflict over water uses.
Water emanating from the forests is of high quality.
On forests, there is the potential for water quality problems. Implementation of best management
practices appears to be effective in decreasing adverse water quality problems.
People love to recreate around water. More people will result in demand for more water-based recreation,
in turn putting more strain on already compromised riparian ecosystems.
Climate change will likely change the pattern and flow of water, adding stress to aquatic and terrestrial
ecosystems.
Lack of fire in the riparian zone creates less patchiness, less diversity of plants and structure, and fewer
animals. If minimal management in riparian zones continues, the trend will be away from natural riparian
ecosystem function.
Increased conifer, overall vegetation density and uniformity in riparian areas result in higher intensity
fires across large areas. With climate change come more frequent uncharacteristic fires, and this is likely
to continue.
Water storage and flood control infrastructure have caused many negative effects in aquatic ecosystems.
However, increased management and oversight, where possible, reduces adverse impacts.
Population growth increases the spread of aquatic invasive species. Additionally non-native fish species
are planted, impacting the food cycle and health of native aquatic species.
155
The National Forests in California provide a high level of protection for the Sierra Nevada headwaters.
When a forest stream segment was very impaired, the following stressors were most often associated with
that poor condition: total nitrogen (30 percent), chloride (20 percent), total phosphorus (10 percent), lack
of habitat complexity (20 percent), and riparian disturbance and streambed stability (10 percent).
Work to reduce the magnitude and frequency of wildfire is likely important to influence total sediment
yields from forests in the Sierra Nevada drainage basins.
Uncharacteristically large and severe fires cause erosion that can eliminate vulnerable aquatic population,
degrade water quality, reduce capacity of downstream reservoirs, and increase the risk of flood.
Conversion of forest land to developed uses, such as roads or campgrounds, often disrupts wetlands, and
interferes with their ability to store, clean, and cool water, especially in flood or drought periods. Whether
more development will occur on forests in the bio-region, and whether there will be more impacts to
wetlands and local water quantity and quality is an information gap.
Hydrologically disconnecting roads is an important practice for eliminating chronic water-quality impacts
(USFS 2011b). As budgets tighten, and maintenance and closures are constrained, water quality issues
with roads could increase.
The deferred maintenance for road and trail infrastructure on Sierra Nevada forests exceeds several
hundred million dollars. Over the past several years, the Forest Service has had funding to maintain
approximately 20 percent of its road system to safety and environmental standards. It is unlikely that this
trend will reverse. Watershed function is likely to continue to be impacted by road and trails that are not
maintained to standard.
Unmanaged overgrazing results in adverse resource impacts. However, grazing permitted under the 2004
Framework is managed. Allotment management document extensive restrictions on site-specific grazing.
This ensures that sites are not overgrazed, and that resource impacts are avoided.
The administration of the grazing program on Sierra Nevada national forests is intertwined with the
conservation of California rangeland (e.g. open space), primarily in the foothills adjacent to forests.
Grazing on national forests helps conserve private rangelands and their associated ecological values.
Evaluations of wet meadow restoration efforts within the Sierra Nevada have demonstrated gains at
specific sites in certain functions. These include: water quality, water quantity, and macro-invertebrate
diversity. Wet meadow restoration is expected to serve an important role in securing favorable flows of
high quality water.
Groundwater provides about five percent of the local water supply in the Sierra Nevada. Groundwater
replenishment may decrease as climate change affects precipitation volume and timing.
Many fuels management treatments or forest restoration efforts remove less than 20 percent of the basal
area of trees. Although this may result in a change in flow, it likely will not be detectable, especially in
dry years. Any change will be short term because of vegetation regrowth.
Prescribed fire by itself is less likely to influence water yield than mechanical treatments. With
prescribed fire there is less reduction in basal area and less ground disturbance by heavy machinery.
156
Severe fires destroy a high proportion of vegetation, soil cover, and roots and have great potential to
increase erosion. The sediment yield for burned areas is more than for unburned areas. Fire effects
decreased, but were still apparent three years after the fire. With high intensity fire increasing, erosion and
sedimentation are expected to increase as well.
Fuel treatments provide a net benefit for watersheds given the risk of severe erosion and sedimentation
from wildfires.
Although research about fire history strongly suggests a need for treatment within many riparian areas,
limited information about the effects and effectiveness of mechanical treatments and prescribed fire
treatments limits guidance for managing these valuable riparian ecosystems.
Over 80 percent of the roads on the national forests are not maintained as needed due to inadequate
funding. Consequently the majority of roads are not being maintained to the standards necessary to
reduce adverse impacts to water quality. This is likely to continue into the future.
Road impacts to water quality and aquatic habitat should be less in the future because very little new road
construction is expected, and knowledge exists about how to construct and maintain roads to lessen
impacts.
Nutrient concentrations in grazed meadows observed throughout the grazing and recreation season were
at least one order of magnitude below levels of ecological concern, and were similar to U.S.
Environmental Protection Agency (USEPA) estimates for background water quality conditions in the
Sierra Nevada.
Cattle grazing, recreation, and provisioning of clean water are broadly compatible goals across these
National Forest System (NFS) lands.
NFS lands are unimpaired and support beneficial uses. Since water bodies have supported beneficial uses
consistently in the past, it is expected that water bodies on NFS lands will continue to do so.
FIRE RESILIENCE
Predicted trends are for longer fire seasons, drier and hotter conditions, and persistent trends of over-
dense and uniform vegetation. These all lead to trends in extensive high severity fires during the peak fire
season. Fires are increasingly outside the range of variation of historic fire regimes for most ecosystems.
Fires can lead to death, increased personal stress, problems with health from smoke, psychological and
emotional impacts, increased community tension and conflict, destruction of property, interruption to
businesses, and decreased opportunities for recreation. Uncharacteristic wildfire is increasing in the bio-
region, which leads to the potential for increased adverse impacts on people and communities.
Uncharacteristic fire disrupts ecosystems and threatens the sustainability of forest benefits through
interruptions and lowering the quality of ecosystem services provided by the forests. Wildfires are
becoming larger, more frequent and of greater severity, which increases the potential for interruption and
loss of these ecosystem benefits.
Nearly half of the critical aquatic refuges (CARS), two thirds of the goshawk and fisher locations, and
more than 80 percent of the spotted owl and pine marten sites are in landscapes with low to very low fire
157
resilience. It is clear that a high percentage of important landscapes are under a threat from
uncharacteristic fire.
There is a significant absence of low and moderate severity fire in these strongly fire adapted forests of
the Sierra Nevada, resulting in denser, more continuous vegetation.
Restoration to lessen fire threats to wildland urban interfaces, reduce large, high severity fires, or
reintroduce low to moderate severity fire means addressing far more acres than are currently managed. It
is estimated that current treatment rates, including wildfires of all severities, is at a rate less than 20
percent of what burned historically.
Sequestering carbon is an important job of forest ecosystems and provides increased benefit globally by
reducing atmospheric greenhouse gases. Increases in extensive high severity fires during the peak fire
season threaten these benefits as the potential increases for more carbon losses to the atmosphere.
The cost of fire management and suppression make up a larger and larger portion of forest budgets in the
bio-region. This is likely to continue. With limited financial resources available for management, this
increase in fire spending reduces the ability of forests in the bio-region to take care of other management
needs that also threaten the sustainability of ecosystem services.
Population growth and more demand for housing results in increased development in the wildland urban
interface across California. More people relocating into in these areas mean an increased risk to
communities and more potential impact from fire.
As a result of the combination of heavy forest fuels and increased development in the wildland urban
interface, California has experienced significantly more frequency and intensity of wildfires, and the
associated impacts on communities.
Wildfires result in lower air quality and can impact human health. Unmanaged wildfires cause the highest
levels of smoke. Extensive absence of fire has resulted in even greater smoke emissions when
uncontrolled wildfires burn because of high, accumulated fuel levels, burning when temperatures are
hottest, and combustion is greatest.
Managed fires, and prescribed fires where smoke is managed, produce emissions, although these
emissions are at generally lower levels than wildfires, and may reduce overall emissions in the long run.
The increased risk of catastrophic fires in the Sierra Nevada is thought to be a result of the absence of
Native Americans in the management of these ecosystems.
The practice of suppressing fires has negatively impacted ceremonial traditions, and may negatively
impact salmon species and subsistence and commercial fisheries as well.
Fire can be targeted at specific locations to enhance willows, acorns, and feeding locations for wild game,
as well as to reduce insect infestations that damage traditional food sources or species gathered for
traditional purposes.
Sound restoration work to retain and restore ecological resilience in the face of wildfire is being
conducted; however, as wildland fires are becoming larger, more frequent and of greater severity, impacts
from disturbances seem to be outpacing the benefits of this work.
158
Given the desire to increase the pace and scale of restoration, building or maintaining a robust local
workforce and wood products infrastructure is necessary to support the logistics and economics of
restoration. Maintaining this local wood processing infrastructure in the bio-region is an important
strategy for maintaining favorable economics for accomplishing ecological restoration goals, while
sustaining jobs in the local wood products industry. Current trends have been for declining capacity in
these local resources, which will place strain on restoration efforts going forward.
The revenue generated through stable local markets for timber and non-timber biomass from restoration
activities can help offset the costs of achieving Forest Service restoration goals. The amount of this
potential future revenue will be a function of economic conditions affecting the price of timber and
biomass in the market, as well as the existence of infrastructure to process this material.
Maintaining local wood processing infrastructure in the bio-region is an important strategy for
maintaining favorable economics for accomplishing ecological restoration goals, while sustaining jobs in
the local wood products industry.
Any major reduction in fire suppression and fuel loading, as well as restoring the role that fire plays on
the landscape, is heavily dependent on increased local, regional, and national political support.
Increased development in the wildland urban interface has added complexity to fire management, with
firefighting resources redirected toward defending homes instead of making progress on the fire line.
SUSTAINABLE RECREATION
Outdoor recreation is a major part of the Sierra Nevada’s identity. The role that it plays both inside and
outside the Sierra Nevada is expected to grow with increasing population, urbanization, demand, and
recognition of the physical, mental, and spiritual health benefits. This may be particularly true for
California’s urban areas and the Central Valley.
A wide range of recreation activities draws people from around the world to forests. These activities
provide enjoyment to visitors and benefit the local economies that provide goods and services to these
visitors. The intensity of this use is expected to go up with population growth.
The diversity of visitors that recreate on national forest lands in the bio-region is not currently
representative of populations within market areas. However, this is expected to change in the future as
cultural diversity continues to increase in California, and communication and management approaches
become better suited to diverse populations.
Jobs in travel and tourism make up a high percentage of all employment in many communities throughout
the bio-region, particularly the central and southern areas. However, these are generally lower paying
jobs. With the potential for recreation to increase in this region, the importance of this sector in local
economies can be expected to continue.
In addition to the economic contribution of spending to support jobs in communities, the counties in the
bio-region receive revenue from sales tax from visitor spending, and this money supports critical county
services. Given expected trends in local government budgets and the potential for recreation to increase
in this region, visitor spending can be expected to continue to be an important source of revenue.

159
Demand is going up for the Forest Service and other land management agencies to provide more and
higher quality recreational opportunities in the bio-region. At the same time, Forest Service budgets are
decreasing and fewer resources are available to maintain existing recreational facilities or to develop new
opportunities.
Communities who depend on visitor income to support their economies are dependent on high quality
recreational experience so that people continue to visit.
While demand is going up for the Forest Service and other land management agencies to provide more
and higher quality recreational opportunities in the bio-region, federal budgets are decreasing and fewer
resources are available to operate and maintain existing recreational facilities or to develop new ones.
Recreation on national forest system lands in the bio-region is currently not financially sustainable.
Future sustainability will be impacted by federal budgets, partnership opportunities, and the
implementation of the Sustainable Recreation Framework.
Declining federal budgets could lead to a decline in condition or number of existing facilities, roads, and
trails open to the public, resulting in lower visitor satisfaction and decreased opportunities for connecting
with the land.
National forests in the bio-region currently provide a wide range of recreation opportunities and settings.
They are expected to continue to support a range of recreation activities, but within the framework of
sustainable recreation.
Scenic character, which provides the backdrop for various recreation opportunities and contributes to
people’s emotional connection to the land, is currently fairly high in terms of visual quality. However, the
stability of that scenery is based on ecological integrity and stability, which is currently low for many
ecosystems in the bio-region that are outside the natural range of variability. The agency priority to
increase the pace and scale of restoration is expected to improve scenic stability.
Trails are critical to providing a diversity of recreational access to our visitors and one of the most valued
resources on national forests. As a result of population growth and a resulting increase in public use,
shifting priorities, declining budgets, and staffing issues, the bio-region has a large percentage of trails not
currently maintained and managed to agency standard, which is likely to continue into the future.
Conservation education and interpretive services programs play an increasingly important role in
connecting people with nature. Due to decreasing federal budgets, programs are expected to increase
reliance on partners to help deliver programs in the future.
Congressionally designated areas such as the Pacific Crest Trail, wild and scenic rivers, and wilderness
will continue to provide unique recreation opportunities in the bio-region.
Community-based stewardship and public land volunteerism is on the rise nationally. Volunteers are
crucial to maintaining recreation opportunities on national forest system lands in the bio-region and will
likely play an even greater role in the future.
Special uses are a critical part of the agency’s recreation program, supporting the level of facilities and
programs currently available to the public on national forests in the bio-region. The number of recreation

160
special use permits issued annually is stable. Special uses are expected to play an increasing role in
helping to meet the demand for existing and new recreational opportunities.
ECOLOGICAL INTEGITY
Overall resilience of forests to drought and fire has changed considerably. The Giant Sequoia National
Monument, and the Tahoe, Stanislaus, Sierra and Sequoia National Forests are particularly vulnerable to
climate change because the wetter areas are expected to shrink.
Red fir forests are both in and outside the natural range of variability and are among the most vulnerable
to climate change. Structure has shifted with homogenization, increases in small and medium trees, and
decreases in large trees.
Eastside yellow pine and mixed conifer forests, westside montane pine and mixed conifer forest structure
and fire regimes are outside the natural range of variability, with denser trees, more uniform forests, and
larger, higher intensity fires.
Pinyon-juniper woodlands and sagebrush are prevalent across the eastern portion of the bio-region,
dominating where it is driest. Some aspects of these are in the natural range of variability and others are
far outside of it.
A large portion of the bio-region, the montane pine and mixed conifer forests, are relatively productive in
terms of vegetation growth, but because they are dry, decomposition is slow. This results in increasing
fuels for fire and the likelihood of high intensity crown fires and widespread insect outbreak beyond
natural range of variability levels.
Rate of vegetation change and carbon dynamics are important considerations with restoration. Offsetting
reduced future wildfire carbon emissions from mechanical and fire treatment is debated for the relative
tradeoffs.
The ability for species to move throughout a landscape is important for overall population viability and
integrity. Expansion of non-native, invasive cheatgrass reduces and fragments habitat. Overall forest
cover is generally intact across much of the bio-region, but is typically more uniform in density and size.
There are far fewer blocks of old forest and very limited and shrinking forests with fine-scale mosaics of
openings that support sun-loving plants and the animals that live or eat there. Fragmentation or breaks in
connectivity from large, high severity fire, urbanization, and invasive plants all affect the ability of
species to shift in response to climate change.
Uniformity in forest composition, along with the absence of low to moderate intensity fire, has resulted in
a vast reduction in fine-scale forest complexity and decreased biodiversity.
The major pollutants causing ecological harm in the Sierra Nevada are ozone, which can be toxic to
plants, and nitrogen deposition, which can induce undesirable effects on terrestrial and aquatic
ecosystems. Ozone and nitrogen deposition interact with other environmental stressors, especially drought
and climate change, to predispose forests to the impacts of pests and diseases.
Large, high intensity fires threaten to set back large areas of older or mature forest to early seral,
fragmented habitat.

161
Despite the benefits they provide, many ecosystems in the bio-region, the species, their respective
ecological processes and ecosystem services have negative impacts now and in the future by development
trends, rising population, habitat fragmentation, intensification of human activity, and the effects of
climate change.
One threat to ecological integrity is air pollution. This can have a dramatic effect on the ability of these
landscapes to provide ecosystem services.
Ecological integrity also influences the ability of ecosystems to provide many social benefits that support
the diversity of values that people and communities hold. Healthy ecosystems help people and
communities sustain diverse values and cultures.
National forests can also provide educational and skill building opportunities through their conservation
education and volunteer programs, along with training and work programs.
The removal of Native American management from the landscape has influenced and continues to
influence Sierra Nevada forests.
Forest management restoration activities to improve the integrity and functioning of ecosystems not only
provide benefits to people in terms of sustaining ecosystem services, they also increase the wellbeing of
communities. Future decisions on forest restoration activities will determine the trend in this factor.
Increasing the pace and scale of management that restores forest, shrub, grass, and water ecosystems will
heighten the ability of these systems to withstand changes, and still provide for native plants and animals
and other ecosystem services.
Less than five percent of the landscape is under any sort of restoration treatment. Treating a small
fraction of the landscape does not substantially improve the ecological integrity of forests or increase
habitat resilience to high intensity fires during the hottest and driest or windiest weather.
Although it is not always easy to collaborate, given declines in agency staffing and resources, and
recognizing that there can be challenges in the process, the Forest Service will continue to collaborate
with stakeholders and find new ways to engage the public in our work and with each other.
COMMUNITY RESILIENCE
The Sierra Nevada bio-region has a rich history and culture that has always been and continues to be
deeply connected to the land and its natural resources, beginning when Native Americans settled here
thousands of years ago.
National forests in the bio-region continue to support a diversity of values by managing for multiple uses.
However, this will become increasingly challenging as demands from public lands increase and federal
budgets continue to decline.
National forests are expected to continue to provide opportunities for people to connect with culture and
history, though the future sustainability of historic and cultural resources is uncertain because many have
not been identified or evaluated for condition.
Sierra Nevada landscapes continue to inspire the arts, which contributes to community wellbeing.

162
There is a lack of understanding about Native American values and traditions and their unique rights on
National Forest System lands, which help sustain their culture. However, these conditions should improve
with increasing agency efforts to develop effective relationships with tribes.
Harvesting special forest products is an important cultural activity in the bio-region. Increases in
population and cultural diversity may increase gathering or shift which types of products are harvested
from national forests. Data are generally unavailable regarding impacts of harvesting.
Forest service management and planning processes continue to become more inclusive and collaborative.
Expansion of partnerships is also expected in the future. Working together with communities helps build
community capacity and resilience.
Communities in and around the Sierra Nevada are continuously changing. They are becoming more
culturally and ethnically diverse, which is expected to influence national forest outreach, engagement, and
approaches to management.
National forests in the bio-region continue to provide opportunities for socializing and spending time with
friends and family, which helps pass on values and traditions. Forest service outreach efforts are expected
to help underrepresented visitor groups better take advantage of these social benefits.
National forests in the bio-region are expected to continue to provide health benefits to local and non-
local communities, although this will be dependent on efforts to restore the health and resilience of
forests.
The Sierra Nevada contains a concentration of high priority landscapes in terms of community safety to
wildfire. Given the agency’s priority to increase the pace and scale of forest restoration, together with
increasing wildfire planning efforts and collaborative approaches to fire management, community
resilience to wildfire may improve.
Forests currently provide training, skill-building, and educational opportunities, which contribute to
building human capital and strengthening communities. Given agency goals to increase the work that we
do with youth, as well as major efforts like the 21st Century Conservation Service Corps, expanded
opportunities are expected in the future, particularly for underrepresented groups.
Forest-based activities influence community wellbeing in the bio-region through sales tax, and the
Payment in Lieu of Taxes (PIL) and Secure Rural Schools (SRS) programs by generating local
government revenues needed to fund critical public services such as fire protection, education and
transportation. Given trends in local government budgets, these sources of revenue can be expected to
remain important in maintaining these services. However, Forest Service budgetary challenges to
maintaining recreation opportunities that draw visitors and uncertainty surrounding the future of federal
payments brings into question the ability of these revenue sources to maintain wellbeing in communities.
Another contribution of forest activities to job creation is through Forest Service spending, which is
potentially a direct investment into the local economy. Forest spending in the bio-region has increased in
recent years mainly due to spending on fire suppression efforts. The importance of this forest spending to
local economies in the future is dependent on the amount of spending that occurs locally, as opposed to
spending that occurs outside of the local forest area.
163
Commodity production on national forest lands continues to contribute to local economies in some parts
of the Sierra Nevada. However, across the bio-region, the trend is a reduction in the local workforce and
the infrastructure available to process timber and biomass. In addition, grazing on forest lands is a
traditional forest activity in local economies that has declined in recent years due to market conditions and
environmental concerns that limit the herd size authorized under grazing permits. Renewable energy use
generated from hydropower, biomass, geothermal, solar and wind facilities on forest lands is another
important commodity. This potential has increasing value as California looks to diversify its energy
portfolio and reduce carbon emissions from energy generation.
Where Do We Go From Here? Identifying the major bio-regional conditions and trends creates a foundation for a conversation with
stakeholders. It helps develop the more local and focused forest assessments. It serves as an information
resource that informs the need for changing existing forest plans. . This assessment, along with the forest
assessments, the continuously updated Living Assessment and new science will be used to develop desired
conditions, objectives, standards and guidelines and land suitability for the Sierra Nevada forests under
forest plan revision,
There is a shared understanding of the various viewpoints and science relating to these complex issues.
This assessment reflects information shared by both the public and the Forest Service and serves as a
concise foundation to help bring focus to topics appropriate to plan revision.
164
REFERENCES
Agee, J. K. 1996. Fire ecology of Pacific Northwest Forests. Island Press.
Ahearn, D.S.; Sheibley, R.W.; Dahlgren, R.A. and others. 2005. Land use and land cover influence on
water quality in the last free-flowing river draining the western Sierra Nevada, California. Journal
of Hydrology. 313: 234-247.
Alpers, C.N., and Hunerlach, M.P., 2000, Mercury contamination from historic gold mining in California:
U.S. Geological Survey Fact Sheet FS-061-00.
Anderson, M.K. 2006. The use of fire by Native Americans in California. In: Fire in California’s
Ecosystems. Berkeley, CA: University of California Press: 417-430.
Anderson, M.K.; Moratto, M.J. 1996. Native American land-use practices and ecological impacts. In:
Sierra Nevada Ecosystem Project (SNEP): Final Report to Congress. Davis, CA: University of
California, Centers for Water and Wildland Resources: 557-609. Vol. II, Assessments and
Scientific Basis for Management Options.
Aplet, G.; Gallo, J. 2013. Applying Climate Adaptation Concepts to the Landscape Scale: Examples
from the Sierra and Stanislaus National Forests. The Wilderness Society Report.
Arno, S. F., and Allison-Bunnell, S. 2002. Flames in our forest: disaster or renewal?. Island Press.
Backiel, A.; Gorte, R.W. 1992. Congressional Research Service Report for Congress: Clearcutting
in the National Forests.
Baker, W. L. 2006. Fire and restoration of sagebrush ecosystems. Wildlife Society Bulletin 34:177-185.
Bailey, D. W. 2004. Management strategies for optimal grazing distribution and use of arid rangelands.
Journal of Animal Science 83:E147– E153.
Barbour, M.G. 2007. Closed-Cone Pine and Cypress. In: eds Barbour, M. G., Keeler-Wolf, T., and
Schoenherr, A. A. Terrestrial vegetation of California. Berkeley, CA: Univ of California Press.
Barbour, M.G.; Keeler-Wolf, T.; Schoenherr, A. A. 2007. Terrestrial vegetation of California. Berkeley,
CA: Univ. of California Press.
Barbour, M.G.; Pavlik, B.; Drysdale, F.; Lindstrom, S. 1993. California's changing landscapes: diversity
and conservation of California vegetation. Sacramento: California Native Plant Society
Barrett, S.; Havlina, D.; Jones, J. and others. 2010. Interagency Fire Regime Condition Class Guidebook.
Version 3.0 Interagency Landfire Group: USDA Forest Service, US Department of the Interior,
and The Nature Conservancy.
Beche LA, Stephens SL, Resh VH. 2005. Effects of prescribed fire on a Sierra Nevada (California, USA)
stream and its riparian zone. For Ecol Manage 218:37–59.
165
Bedford, B. L., and Godwin, K. S. 2003. Fens of the United States: distribution, characteristics, and
scientific connection versus legal isolation. Wetlands, 23(3), 608-629.
Beesley, D. (1996). Reconstructing the landscape: an environmental history, 1820-1960. In: Sierra
Nevada Ecosystem Project (SNEP): Final Report to Congress. Davis, CA: University of
California, Centers for Water and Wildland Resources. Vol. II, Assessments and Scientific Basis
for Management Options.
Benda, L., Miller, D., Bigelow, P., and Andras, K., 2003, Effects of post-fire wildfire erosion on channel
environments, Boise River, Idaho: Forest Ecology and Management 178: 105-119.
Berck, P.; Costello, C.; Fortmann, L. and others. 2003. Poverty and employment in forest-dependent
counties. Forest Science. 49 (5): 763-777.
Berk, L. 2006. Development through the lifespan. Boston, MA: Allyn and Bacon.
Bernhardt, E. S., and Palmer, M. A. 2011. River restoration: the fuzzy logic of repairing reaches to reverse
catchment scale degradation. Ecological Applications, 21(6), 1926-1931.
Bisson, P.A., Rieman, B.E., Luce, C., Hessburg, P.F., Lee, D.C., Kershner, J.L., Reeves, G.H., and
Gresswell, R.E., 2003, Fire and ecosystems of the western USA: current knowledge and key
questions: Forest Ecology and Management 178: 213-219.
Blackburn, T.C.; Anderson, M.K., eds. 1993. Before the wilderness: native Californians as environmental
managers. Menlo Park, CA: Ballena Press.
Boerner, R.E.; Huang, J.; Hart, S.C. 2008. Fire, thinning, and the carbon economy: Effects of fire and fire
surrogate treatments on estimated carbon storage and sequestration rate. Forest Ecology and
Management, 255(8): 3081-3097.
Bowden, P. 2012. Regional Fuels Analyst, US Forest Service Pacific Southwest Region, McClellan, CA.
Personal communication November.
Bosch, J.M.; Hewlett, J.D. 1982. A review of catchment experiments to determine the effect of vegetation
changes on water yield and evapotranspiration. J. of Hydrology. 55: 2-23.
Boston, C; Boyst, B.; Juarez, T. and others. 2013. DRAFT Designated Areas in the Bio-region – A
Summary of Condition and Trend for Forest Plan Revision. Unpublished report on file. Vallejo,
CA: U.S. Department of Agriculture, Forest Service, Pacific Southwest Region. June.
Bradford, D.F.; Knapp, R.A.; Sparling, D.W. and others. 2011. Pesticide distributions and population
declines of California, USA, alpine frogs, Rana muscosa and Rana sierra. Environmental
Toxicology and Chemistry. 30: 682-691.
Brehm, J.M.; Eisenhauer, B.W.; Krannich, R.S. 2004. Dimensions of community attachment and their
relationship to well-being in the amenity-rich rural West. Rural Sociology. 69(3): 405-429.
Briske, D.D.; Derner, J.D.; Brown, J.R.; Fuhlendorf, S.D.; Teague, W.R.; Havstad, K.M.; Gillen, R.L.;
Ash, A.J.; Willms, W.D. 2008. Rotational grazing on rangelands: Reconciliation of perception and
experimental evidence. Rangeland Ecology & Management. 61(1): 3-17.
166
Briske, D.D.; Derner, J.D.; Milchunas, D.G.; Tate, K. 2011b. An evidence-based assessment of prescribed
grazing practices. In Briske, D.D. (ed.), In: Conservation Benefits of Rangeland Practices:
Assessment, Recommendations, and Knowledge Gaps. Lawrence, KS. : Allen Press: 21-74.
Briske, D.D.; Sayre, N.F.; Huntsinger, L.; Fernandez-Gimenez, M.; Budd, B.; Derner, J.D. 2011a. Origin,
Persistence, and Resolution of the Rotational Grazing Debate: Integrating Human Dimensions
Into Rangeland Research. Rangeland Ecology & Management. 64(4): 325-334.
Briske, D.D. (editor). 2011. Conservation Benefits of Rangeland Practices: Assessment,
Recommendations, and Knowledge Gaps. United States Department of Agriculture, Natural
Resources Conservation Service.
Brooks, M.L.; Minnich, R. 2006. Southeastern desert bio-region. In: Fire in California Ecosystems, NG
Sugihara, JW van Wagtendonk, J. Fites-Kaufman, KE Shaffer, and AE Thode (eds.). Berkeley,
CA: University of California Press.
Brown, T.C.; Froemke, P. 2009, Estimated mean annual contribution to water supply from units of the
National Forest System (NFS) of the U.S. Forest Service: USDA Forest Service Rocky Mountain
Research Station.
Brown, T.J.; Hall, B.L.; Westerling, A.L. 2004. The impact of twenty-first century climate change on
wildland fire danger in the western United States: an applications perspective. Climatic
Change, 62(1-3), 365-388.
Brown, D.K.; A.A. Echelle, D.L. Propst, J.E. Brooks, W.L. Fisher. 2001. Catastrophic wildfire and
number of populations as factors influencing risk of extinction for Gila trout (Oncorhynchus
gilae). Western North Am. Naturalist, 61: 139–148.
Brown, J. K. and J. K. Smith. 2000. Wildland fire in ecosystems: effects of fire on flora. Page 257. U.S.
Department of Agriculture, Forest Service, Rocky Mountain Research Station, Ogden, UT.
Burns, D.; Vitvar, T.; McDonnell, J. and others. 2005. Effects of suburban development on runoff
generation in the Croton River basin, New York, USA. Journal of Hydrology. 311(1–4): 266–281.
Burton, T. A. 2005. Fish and stream habitat risks from uncharacteristic wildfire: observations from 17
years of fire-related disturbances on the Boise National Forest, Idaho. Forest Ecology and
Management, 211(1), 140-149.
Bytnerowicz, A.; Fenn, M.E.; Long, J.W. 2013. Air Quality Chapter 8 in Long, Jonathan W.; Quinn-
Davidson, Lenya, and Skinner, Carl N., tech. editors. Science Synthesis to support Forest Plan
Revision in the Sierra Nevada and Southern Cascades. Draft Final Report. Albany, CA: U.S.
Department of Agriculture, Forest Service, Pacific Southwest Research Station. 504 p.
Cain III, J. W., M. L. Morrison, and H. L. Bombay. 2003. Predator activity and nest success of Willow
Flycatchers and yellow warblers. Journal of Wildlife Management 67:600-610.
Cahill, T.S; Carroll, J.J.; Campbell, D; Gill, T.E. 1996. Air Quality. In: Sierra Nevada Ecosystem Project
(SNEP): Final Report to Congress. Davis, CA: University of California, Centers for Water and
167
Wildland Resources: 1227-1261. Vol. II, Assessments and Scientific Basis for Management
Options.
California Department of Finance. 2012. Interim Projections of Population for California: State and
Counties.
California Department of Fish and Game [CDFG]. 2008. California Aquatic Invasive Species
Management Plan. Sacramento, California.
California Department of Fish and Game [CDFG]. 2010. California's Wildlife (1988-1990 + updates) --
Life History Accounts and Range Maps.
California Department of Fish and Game [CDFG]. 2011. California Natural Diversity Database
(CNDDB), List of Special Animals. Biogeographic Data. January 2011. California.
California Department of Food and Agriculture [CDFA]. 2013. County Statistical Data. County
Agricultural Statistics Review 2012-2013. Sacramento, California.
California Department of Forestry and Fire Protection [CALFIRE]. 2010. California's Forests and
Rangelands: 2010 Assessment. Sacramento, CA: Fire and Resource Assessment Program.
California Department of Parks and Recreation. 2002. Recreational Trails Plan, Phase 1. Sacramento,
California.
California Department of Parks and Recreation. 2009. California Outdoor Recreation Plan 2008: An
Element of the California Outdoor Recreation Planning Program. Sacramento, California.
California Department of Parks and Recreation Off-Highway Motor Vehicle Recreation Division
(OHMVR). 2011. Off-Highway Motor Vehicle Recreation Commission Program Report.
Sacramento, California.
California Department of Water Resources [CADWR] 2012. Snow survey results. Unpublished report,
Sacramento, CA.
Calkin, D. E., Gebert, K. M., Jones, J. G., and Neilson, R. P. 2005. Forest Service large fire area burned.
Canton-Thomas et al. 2008 WUI costs.
Caprio, A. C., and Swetnam, T. W. 1995. Historic fire regimes along an elevational gradient on the west
slope of the Sierra Nevada, California.
Carroll, E.M., Miller, W.W., Johnson, D.W., Saito, L., Qualls, R.G., and Walker, R.F., 2007, Spatial
analysis of a large magnitude erosion event following a Sierran wildfire: Journal of
Environmental Quality 36(4):1105-1111.
Cassie, D. 2006. Thermal regime of rivers: a review. Freshwater Biology 51 :1389–1406.
Centers for Water and Wildland Resources. 1996. Status of the Sierra Nevada. Sierra Nevada Ecosystem
Project : Final Report to Congress . Davis, CA: University of California, Center for Water and
Wildland Resources.
168
Chambers, J. C., and Miller, J. R. 2011. Meadow Management and Treatment Options. Geomorphology,
Hydrology and Ecology of Great Basin Meadow Complexes: Implications for Management and
Restoration. Gen. Tech. Rep. RMRS-GTR-258 Fort Collins, CO: US Department of Agriculture,
Forest Service, Rocky Mountain Research Station, 113-124.
Chambers, J. C., B. A. Roundy, R. R. Blank, S. E. Meyer, and A. Whittaker. 2007. What makes Great
Basin sagebrush ecosystems invasible by Bromus tectorum? Ecological Monographs 77:117-145.
Charnley, S. 2013. Strategies for Job Creation through Forest Management. Chapter 9.4 in Long, Jonathan
W.; Quinn-Davidson, Lenya, and Skinner, Carl N., tech. editors. Science Synthesis to support
Forest Plan Revision in the Sierra Nevada and Southern Cascades. Draft Final Report. Albany,
CA: U.S. Department of Agriculture, Forest Service, Pacific Southwest Research Station. 504 p.
Charnley, S.; Donoghue, E.M.; Stuart, C. [and others] 2006. Northwest Forest Plan, the first 10 years
(1994-2003): Socio-economic monitoring results. Gen. Tech. Rep. PNW-GTR-649. Portland, OR:
U.S. Department of Agriculture, Forest Service, Pacific Northwest Research Station.
Charnley, S.; Long, J.W. 2013. Managing Forest Products for Community Benefit. Chapter 9.5 in Long,
Jonathan W.; Quinn-Davidson, Lenya, and Skinner, Carl N., tech. editors. Science Synthesis to
support Forest Plan Revision in the Sierra Nevada and Southern Cascades. Draft Final Report.
Albany, CA: U.S. Department of Agriculture, Forest Service, Pacific Southwest Research Station.
504 p.
Charnley, S.; Long, J.W.; Lake, F.K. 2013. Collaboration. Chapter 9.6 in Long, Jonathan W.; Quinn-
Davidson, Lenya, and Skinner, Carl N., tech. editors. Science Synthesis to support Forest Plan
Revision in the Sierra Nevada and Southern Cascades. Draft Final Report. Albany, CA: U.S.
Department of Agriculture, Forest Service, Pacific Southwest Research Station. 504 p.
Charnley, S.; Sheridan, T.E.; Nabhan, G.P. In press. Stitching the West Back Together: Conserving
Working Landscapes and Biodiversity in the American West. Chicago: University of Chicago
Press.
Chavez, D.J.; Olson, D. 2011. Visitor survey results: Giant Sequoia National Monument day use study
2009-2010. Albany, CA: U.S. Department of Agriculture, Forest Service, Pacific Southwest
Research Station.
Cheng, A.S.; Kruger, L.E.; Daniels, S.E. 2003. "Place" as an Integrating Concept in Natural Resource
Politics: Propositions for a Social Science Research Agenda. Society & Natural Resources. 16(2):
87-104.
Cisneros, R.; Bytnerowicz, A.; Schweizer, D. and others. 2010. Ozone, nitric acid, and ammonia air
pollution is unhealthy for people and ecosystems in southern Sierra Nevada, California.
Environmental Pollution. 158(10): 3261-3271.
Clary, W. P., and W. C. Leininger. 2000. Stubble height as a tool for management of riparian areas.
Journal of Range Management 53:562–573.
Coe, D.B.R., 2006, Sediment production and delivery from forest roads in the Sierra Nevada, California:
MS thesis, Colorado State University, Fort Collins, CO 117 p.
169
Cohen, J.D. 2000. Preventing disaster: home ignitability in the wildland–urban interface. Journal of
Forestry, 98 (3) (2000), pp. 15–21.
Cohen, J.D. 2001. Wildland–urban fire—a different approach Proceedings of the Firefigther Safety
Summit, International Association of Wildland Fire, Missoula, MT, November 6-8 (2001)
Cohen, J.D., 2003. An examination of the Summerhaven, Arizona home destruction related to the local
wildland fire behavior during the June 2003 Aspen Fire. Unpublished report, Assistant Secretary
of Agriculture. p.82.
Cohen, J.D. 2004. Relating flame radiation to home ignition using modeling and experimental crown
fires. Canadian Journal of Forest Research, 34 (2004), pp. 1616–1626.
Collins, B.; Skinner, C. 2013. Fire and Fuels. Chapter 4.1 in Long, J.W.; Quinn-Davidson, L., and
Skinner, C.N., tech. editors. Science Synthesis to support Forest Plan Revision in the Sierra
Nevada and Southern Cascades. Draft Final Report. Albany, CA: U.S. Department of Agriculture,
Forest Service, Pacific Southwest Research Station. 504 p.
Collins, B. M., and Stephens, S. L. (2010). Stand-replacing patches within a ‘mixed severity ’fire regime:
quantitative characterization using recent fires in a long-established natural fire area. Landscape
Ecology, 25(6), 927-939.
Colloran, B.; LeBuhn, G.; Reynolds, M. in press. The Benefits of Meadow Restoration for Pollinators. In
Root, T.L.; Hall, K.R.; Herzog, M.; Howell, C.A. (eds.), In: Biological Impacts of Climate
Change in California: Case Studies Linking Science and Management. Sacramento, CA:
California Energy Commission Public Interest Energy Research.
Cordell, H.K. 2012. Outdoor recreation trends and futures: a technical document supporting the Forest
Service 2010 RPA Assessment. Gen. Tech. Rep. SRS-150. Asheville, NC: U.S. Department of
Agriculture Forest Service, Southern Research Station. 167 p.
Cordell, H.K.; Bergstrom, J.C.; Betz, C.J.; Green, G.T. 2004. Dominant socio-economic forces shaping
the future of the United States. In: Manfredo, M.J.; Vaske, J.J.; Bruyere, B.L.; Field, D.R.;
Brown, P.J., eds. Society and Natural Resources: A Summary of Knowledge. Jefferson, MO:
Modern Litho: 349-361.
Corey, L.; Fjeld, P.; Serat, W. 1970. Distributional patterns of ddt residues in the Sierra Nevada
mountains. Pesticides Monitoring Journal. 3: 204-211.
Council on Environmental Quality. 1997. Environmental Justice: Guidance Under the National
Environmental Policy Act. Washington, D.C.
Council on Environmental Quality; Department of Agriculture; Department of the Interior; Environmental
Protection Agency. 2011. America’s Great Outdoors: A Promise to Future Generations.
Coutant, C. C. 1977. Compilation of temperature preference data. Journal of the Fisheries Board of
Canada, 34(5), 739-745.
170
Davidson, C. 2004. Declining downwind: amphibian declines in California and historic pesticide use.
Ecological Applications. 17:587-597.
Davidson, C.; Bernard, M.D.; Shaffer, H.B. [and others] 2007. Effects of chytrid and carbaryl exposure on
survival, growth, and skin peptide defenses in foothill yellow-legged frogs. Environmental
Science and Technology. 41:1771-1776.
Davidson, C., Shaffer, H. B., and Jennings, M. R. 2002. Spatial Tests of the Pesticide Drift, Habitat
Destruction, UV‐B, and Climate‐Change Hypotheses for California Amphibian Declines.
Conservation Biology, 16(6), 1588-1601.
Davis, O. K. and D. S. Shafer. 2006. Sporormiella fungal spores, a palynological means of detecting
herbivore density. Palaeogeography, Palaeoclimatology, Palaeoecology 237:40-50.
DeGraff, J. V., Wagner, D. L., Gallegos, A. J., DeRose, M., Shannon, C., & Ellsworth, T. 2011. The
remarkable occurrence of large rainfall-induced debris flows at two different locations on July 12,
2008, Southern Sierra Nevada, CA, USA. Landslides, 8(3), 343-353.
de Groot, R.; Wilson, M.A.; Boumans, R.M. 2002. A typology for the classification, description and
valuation of ecosystem functions, goods and services. Ecol. Econ. 41, pp.393–408.
Dean Runyan and Associates. 2012. California Travel Impacts by County, 1992-2010 2011 Preliminary
State & Regional Estimates April 2012 p.149.
Derlet R.W., Richards J.R., Tanaka L.L., Hayden C., Ger K.A., et al. (2012) Impact of summer cattle
grazing on the Sierra Nevada watershed: aquatic algae and bacteria. J. Env. Pub. Health 2012: 1-
7.
Derlet, R.W., Carlson, J.R., 2006. Coliform bacteria in Sierra Nevada wilderness lakes and streams: What
is the impact of backpackers, pack animals, and cattle? Journal of Wilderness Medicine 17, 15-20.
Dissmeyer, G., ed. 2000. Drinking water from forests and grasslands: a synthesis of the scientific
literature. Gen. Tech. Rep. SRS–39. Asheville, NC: U.S. Department of Agriculture, Forest
Service, Southern Research Station. 246 p.
Dolanc, C. R., J. H. Thorne, and H. D. Safford. 2012. Widespread shifts in the demographic structure of
Sierra Nevada subalpine forests over the last 80 years. Global Ecology and
Biogeography.Domagalski, J.L.; Knifong, D.L.; Dileanis, P.D. and others. 2000. Water Quality in
the Sacramento River Basin, California, 1994-98: U.S. Geological Survey Circular 1215,
Sacramento, CA, 36 pp.
Duane, T.P. 1996 Human Settlement, 1850-2040. In Sierra Nevada Ecosystem Project: Final report to
Congress, vol. II, chap 11. Davis: University of California, Centers for Water and Wildland
Resources.
Duane, T.P. 1999. Shaping the Sierra: Nature, Culture, and Conflict in the Changing West. Berkeley, CA:
University of California Press.
Dwire, K. A., and Kauffman, J. B. 2003. Fire and riparian ecosystems in landscapes of the western
USA. Forest Ecology and Management, 178(1), 61-74.
171
Ecological Restoration Institute [ERI]. 2013. The Efficacy of Hazardous Fuel Treatments: A Rapid
Assessment of the Economic and Ecological Consequences of Alternative Hazardous Fuel
Treatments. Northern Arizona University. 29 p.
Effird, T and S. Wheatley. 2004. Monitoring accomplishment report 2003: Sierra Forest Plan
Implementation. Unpublished report, US Forest Service Pacific Southwest Region, Vallejo, CA.
Effird, T and S. Wheatley. 2005. Monitoring accomplishment report 2003: Sierra Forest Plan
Implementation. Unpublished report, US Forest Service Pacific Southwest Region, Vallejo, CA.
Effird, T and S. Wheatley. 2006. Monitoring accomplishment report 2003: Sierra Forest Plan
Implementation. Unpublished report, US Forest Service Pacific Southwest Region, Vallejo, CA.
Egoh, B.; Reyers B.; Rouget M. and others. 2008. Mapping ecosystem services for planning and
management. Agriculture, Ecosystems and Environment. Elsevier B.V., 6 p.
Eisenhauer, B.; Krannich, R.; Blahna, D. 2000. Attachments to Special Places on Public Lands: An
Analysis of Activities, Reason for Attachments, and Community Connections. Society & Natural
Resources. 13(5): 421-441.
Elliott, W. J., 2010, Effects of forest biomass use on watershed processes in the Western United States:
Western Journal of Applied Forestry 25(1): 12 – 17.
Elmore, A.J.; Mustard J.F.; Manning S.J. 2003. Regional patterns of plant community response to changes
in water: Owens Valley, California. Ecological Applications 13: 443 – 460.
Environmental Protection Agency [EPA]. 1999. Biodiversity Recovery Plan Chapter 2: The Values of
Biodiversity. Chicago Wilderness Biodiversity Plan. Great Lakes Ecosystem Program. 5 p.
Epanchin, P. N., Knapp, R. A., and Lawler, S. P. 2010. Nonnative trout impact an alpine-nesting bird by
altering aquatic-insect subsidies.Ecology, 91(8), 2406-2415.
Erman, N. A., & Erman, D. C. 1995. Spring permanence, Trichoptera species richness, and the role of
drought. Journal of the Kansas Entomological Society, 50-64.
Eschtruth, A.K.; Battles, J.J.; Saah, D.S. 2013. Five Needle Pines. Appendix 9 in: A natural resource
condition assessment for Sequoia and Kings Canyon National Parks. Natural Resource Report
NPS/SEKI/NRR—2013/XXX. Eds. Sydoriak, C.A., J.A. Panek, J.J. Battles, and K.R.
Nydick. Visalia, CA.
Estes, B. 2013a. Historic Range of Variability for Chaparral in the Sierra Nevada and South Cascades.
Unpublished document on file. USDA Forest Service, Pacific Southwest Region. Vallejo, CA.
Estes, B. 2013b. Historic Range of Variability for Aspen in the Sierra Nevada and South Cascades.
Unpublished document on file. USDA Forest Service, Pacific Southwest Region. Vallejo, CA.
Evans, G.W.; Rosenbaum, J. 2008. Self-regulation and the income-achievement gap. Early Childhood
Research Quarterly. 23(4): 504-514.
172
Ewell, C, N. Vaillant, and A. Reiner. 2013. Fire behavior and effects on the Aspen Fire. Unpublished
document on file, Sierra National Forest, Clovis, CA.
Fellers, G. M., and Drost, C. A. 1993. Disappearance of the cascades frog (Rana cascadae) at the southern
end of its range, California, USA.Biological Conservation, 65(2), 177-181.
Fellers, G.M.; McConnell, L.L.; Pratt, D.; Datta, S. 2004. Pesticides in mountain yellow-legged frogs
(Rana muscosa) from the Sierra Nevada mountains of California, USA. Environmental
Toxicology and Chemistry. 23:2170-2177.
Fenn, M. E.; Poth, M.A.; Bytnerowicz, A.; Sickman, J.O.; Takemoto, B. 2003. Effects of ozone, nitrogen
deposition, and other stressors on montane ecosystems in the Sierra Nevada. In: Bytnerowicz, A.,
M. Arbaugh, R. Alonso (eds). Ozone Air Pollution in the Sierra Nevada: Distribution and Effects
on Forests. Developments in Environmental Science 2, Elsevier, Amsterdam: 111-115.
Fenn, M.E.; Allen, E.B.; Weiss, S.B.; and others. 2010. Nitrogen critical loads and management
alternatives for N-impacted ecosystems in California. Journal of Environmental Management. 91:
2404-2423.
Fenn, M.E.; Haeuber, R.; Tonnesen, G.S.; Baron, J.S, and others. 2003. Nitrogen Emissions, Deposition,
and Monitoring in the Western United States. Bioscience. April. vol. 53 (4). P 391.
Ferranto, S.; Huntsinger, L.; Getz, C. and others. 2011. Forest and rangeland owners value land for natural
amenities and as financial investment. California Agriculture. 65(4): 184-191.
Fites-Kaufman. J. 1997. Historic Landscape Pattern and Process: Fire, Vegetation, and Environment
Interactions in the Northern Sierra Nevada.
Fites-Kaufman, J.A.; Bradley, A.F.; Merrill, A.G. 2006. Fire and plant interactions. In: Fire in California’s
ecosystems. Berkeley, CA: University of California Press. 94-117.
Fites-Kaufman, J.A.; Rundel, P.; Stephenson, N.; Weixelman, D.A. 2007. Montane and subalpine
vegetation of the Sierra Nevada and Cascade ranges. In: Terrestrial Vegetation of California.
Berkeley, CA: University of California Press . 456-501.
Flannigan, M.D.; Stocks, B.J.; Wotton, B.M. 2000. Climate change and forest fires. Science of the Total
Environment. 261: 221-229.
Flebbe, P. 2007. Monitoring accomplishment report 2008: Sierra Forest Plan Implementation.
Unpublished report, US Forest Service Pacific Southwest Region, Vallejo, CA.
Flebbe, P. 2008. Monitoring accomplishment report 2008: Sierra Forest Plan Implementation.
Unpublished report, US Forest Service Pacific Southwest Region, Vallejo, CA.
Flebbe, P. 2009. Monitoring accomplishment report 2008: Sierra Forest Plan Implementation.
Unpublished report, US Forest Service Pacific Southwest Region, Vallejo, CA.
Flebbe, P. 2010. Monitoring accomplishment report 2008: Sierra Forest Plan Implementation.
Unpublished report, US Forest Service Pacific Southwest Region, Vallejo, CA.
173
Flebbe, P. 2011. Monitoring accomplishment report 2008: Sierra Forest Plan Implementation.
Unpublished report, US Forest Service Pacific Southwest Region, Vallejo, CA.
Flora, C.B.; Flora, J.L. 2004. Rural Communities, Legacy and Change. Boulder, CO: Westview Press.
Folke, C. 2006. Resilience: The emergence of a perspective for social-ecological systems analysis.
Global Environmental Change. 16. pp.253-267.
Food and Agricultural Organization of the United Nations [FAO]. 2008. Forests and water quantity. in
Forests and Water. FAO Forestry Paper 155. 92 p.
Foster Wheeler Environmental Corporation. 2000. Watershed Assessment Upper Mokelumne River,
Volume I-Watershed Assessment; Prepared for Sierra Pacific Industries.
Franklin, J.F.; Fites-Kaufman, J.A. 1996. Assessment of late-successional forests of the
Sierra Nevada. In: Sierra Nevada Ecosystem Project. Final report to Congress.
Davis, CA: University of California, Centers for Water and Wildland Resources. Vol. 2pp. 627–
662.
Fried, J. 2013. Forest Researcher, Pacific Northwest Station, Portland, OR. Personal communication,
April.
Frietas, M.R. 2013. The influences of changing precipitation and grazing management on Sierra Nevada
mountain meadow plant community attributes and function. M.S. Thesis. University of
California. Davis, CA. 29 p.
Fryjoff-Hung; Viers. 2012. Sierra Nevada Multi-Source Meadow Polygons Compilation (v 1.0), Center
for Watershed Sciences, UC Davis. December 2012.
Furnish, J. 2012. Management Indicator Species: Aquatic Invertebrate Monitoring Report. US Forest
Service. Unpublished document on file, Vallejo, California.
Furniss, M.J.; Roelofs, T.D.; Yee, C.S. 1991. Road construction and maintenance. In: Meehan, W.R., ed.
Influences of forest and rangeland management on salmonid fishes and their habitats. Spec. Publ.
19. Bethesda, MD: American Fisheries Society: 297-323.
Gebert, K. M., Calkin, D. E., & Schuster, E. G. 2004. The Secure Rural Schools Act of 2000: Does It
Make Rural Schools Secure? Journal of Education Finance, 30(2), 176-186.
George, M.R.; Jackson, R.D.; Boyd, C.S.; Tate, K.W. 2011 A Scientific Assessment of the Effectiveness
of Riparian Management Practices. In: Briske, D.D., ed. Conservation Benefits of Rangeland
Practices: Assessment, Recommendations, and Knowledge Gaps. Lawrence, KS: Allen Press.
Gifford, G.F., Humphries, W. and Jaynes, R.A., 1984. A preliminary quantification of the impacts of
aspen to conifer succession on water yield. II. Modeling results. Water Resour. Bull., 20: 181--
186.
Goode, J.R.; Luce, C.H.; Buffington, J.M. 2012. Enhanced sediment delivery in a changing climate in
semi-arid mountain basins: Implications for water resource management and aquatic habitat in the
northern Rocky Mountains. Geomorphology. 139: 1-15.
174
Goodwin, R. 2013. DRAFT Areas of Tribal Importance for the Bio-region – A Summary of Condition
and Trend for Forest Plan Revision. Unpublished report on file. Vallejo, CA: U.S. Department of
Agriculture, Forest Service, Pacific Southwest Region. June.
Gorte, R. 2013. The Rising Cost of Wildfire Protection. Headwaters Economics. Bozeman, MT. June.
Graber, D.M. 1996. Status of terrestrial vertebrates. In: Sierra Nevada Ecosystem Project: Final report to
Congress. Davis, CA: University of California, Centers for Water and Wildland Resources. Vol. 2.
Pages 709 – 734.
Greene, C. 1995. Habitat Requirements of Great Gray Owls in the Central Sierra Nevada. M.S. Thesis.
University of Michigan, MI.
Green, G. A., Bombay, H. L., and Morrison, M. L. 2003. Conservation assessment of the Willow
Flycatcher in the Sierra Nevada. Foster Wheeler Environmental Corporation.
Gregory, S. V., Swanson, F. J., McKee, W. A., and Cummins, K. W. 1991. An ecosystem perspective of
riparian zones. BioScience, 41(8), 540-551.
Gregory SV, Boyer K, Gurnell A (Eds). 2003. The ecology and management of wood in world rivers.
Bethesda (MD): American Fisheries Society.
Gross, S.; Coppoletta, M. 2013. Historic Range of Variability for Meadows in the Sierra Nevada and
Southern Cascades. Unpublished document. USDA Forest Service, Pacific Southwest Region.
Vallejo, CA.
Gucinski, H.; Furniss, M.J.; Ziemer, R.R., Brookes, M.H. 2001. Forest roads: a synthesis of scientific
information. Gen. Tech. Rep. PNW-GTR-509. Portland, OR. U.S. Department of Agriculture,
Forest Service, Pacific Northwest Research Station. 103 p.
Hageman, K.J.; Simonich, S.L.; Campbell, D.H. and others. 2006. Atmospheric deposition of current-use
and historic-use pesticides in snow at national parks in the western United States. Environmental
Science and Toxicology. 40:3174-3180.
Hammer, R.B.; Radeloff, V.C.; Fried, J.S.; Stewart, S.I. 2007. Wildland-urban interface housing growth
during the 1990s in California, Oregon, and Washington. International Journal of Wildland Fire.
16(3): 255-265.
Hanson, C.T.; North, M.P. 2008. Postfire woodpecker foraging in salvage-logged and unlogged forests of
the Sierra Nevada. The condor,110 (4), 777-782.
Hardy, C. C. 2005. Wildland fire hazard and risk: Problems, definitions, and context. Forest ecology and
management, 211(1), 73-82.
Harper, M. P., and Peckarsky, B. L. 2006. Emergence cues of a mayfly in a high-altitude stream
ecosystem: potential response to climate change. Ecological Applications, 16(2), 612-621.
Harris, R. R. 1988. Associations between stream valley geomorphology and riparian vegetation as a basis
for landscape analysis in the eastern Sierra Nevada, California, USA. Environmental
Management 12:219-228.
175
Havlick, D. 2002. No place distant: roads and motorized recreation on America’s public lands.
Washington, DC: Island Press. 253 p.
Hawkins, C. P., Hogue, J. N., Decker, L. M., and Feminella, J. W. 1997. Channel morphology, water
temperature, and assemblage structure of stream insects. Journal of the North American
Benthological Society, 728-749.
Hayward, G.D. ed., and Verner, J., eds. 1994. Flammulated, Boreal, and Great Gray Owls in the United
States: A Technical Conservation Assessment. General Technical Report RM-253. Fort Collins,
CO: U.S. Department of Agriculture, Forest Service, Rocky Mountain Forest and Range
Experiment Station. 214 p.
Headwaters Economics. 2012a. Economic Profile System - Human Dimensions Toolkit (EPS-HDT).
Reports were run in 2012, which used 2006-2010 American Community Survey data from the
U.S. Census Bureau.
Headwaters Economics. 2012b. A Profile of Federal Land Payments. Percentage calculations made using
Headwaters’ PILT values and the total revenues from the FY 2009 California State Controllers
County Report.
Heath and Ballard. 2003. Tamarix and cottonwood bird diversity. Patterns of breeding songbird diversity
and occurrence in riparian habitats of the eastern Sierra Nevada.
Heckmann, K.E.; Manley, P.N.; Schlesinger, M.D. 2008. Ecological integrity of remnant montane forests
along an urban gradient in the Sierra Nevada. Forest Ecology and Management. 255(7): 2453-
2466.
Hibbert, A.R. 1967. Forest treatment effects on water yield. In: Sopper, W.E.; Lull, H.W. [Eds.]. Forest
hydrology. Pergamon, New York, N.Y.: 527-543.
Hill, B. 2012. Personal conversation on the factors influencing water quality in the bio-region. U.S.
Department of Agriculture Forest Service Region 5 Regional Hydrologist. November 19.
Hobbs, R. J., and Cramer, V. A. 2008. Restoration ecology: interventionist approaches for restoring and
maintaining ecosystem function in the face of rapid environmental change. Annual Review of
Environment and Resources, 33, 39-61.
Hopkinson , P.; Hammond, M; Bartolome, J. and others. 2013 . Meadows. Appendix 13 in: National Park
Service. 2013. A natural resource condition assessment for Sequoia and Kings Canyon National
Parks. Natural Resource Report NPS/SEKI/NRR—2013/XXX. Eds. Sydoriak, C.A., J.A. Panek,
J.J. Battles, and K.R. Nydick. Visalia, CA.
Hossack, B. R., and Pilliod, D. S. 2011. Amphibian responses to wildfire in the western United States:
emerging patterns from short-term studies. Fire Ecology, 7(2), 129-144.
Hull, J. M., Keane, J. J., Savage, W. K., Godwin, S. A.,and others. 2010. Range-wide genetic
differentiation among North American great gray owls (Strix nebulosa) reveals a distinct lineage
restricted to the Sierra Nevada, California. Molecular Phylogenetics and Evolution, 56(1), 212-
221.
176
Hunsaker, C.; Long, J.W.; Herbst, D. 2013a. Watershed and Stream Ecosystems. Chapter 6.1 in Long,
J.W.; Quinn-Davidson, L., and Skinner, C.N., tech. editors. Science Synthesis to Promote
Resilience of Social-Ecological Systems in the Sierra Nevada and Southern Cascades. Draft Final
Report. Albany, CA: U.S. Department of Agriculture, Forest Service, Pacific Southwest Research
Station.
Hunsaker, C.; Long, J.W.; North, M. 2013b. Forested Riparian Areas. Chapter 6.2. in Long, J.W.; Quinn-
Davidson, L., and Skinner, C.N., tech. editors. Science Synthesis to Promote Resilience of Social-
Ecological Systems in the Sierra Nevada and Southern Cascades. Draft Final Report. Albany, CA:
U.S. Department of Agriculture, Forest Service, Pacific Southwest Research Station.
Huntsinger, L.; Forero, L.C.; Sulak, A. 2010. Transhumance and pastoral resilience in the Western United
States. Pastoralism. 1(1): 9-36.
Hurniston, G. 2010. Jobs, Economic Development, and Sustainable Communities: Strategizing Policy
Needs and Program Delivery for Rural California. Davis, CA: U.S. Department of Agriculture.
Hurteau, M.D.; North, M. 2010. Carbon recovery rates following different wildfire risk mitigation
treatments. Forest Ecology and Management. 260(5), 930-937.
Hurteau, M.D.; Stoddard, M.T.; Fule, P.Z. 2011. The carbon costs of mitigating high‐severity wildfire in
southwestern ponderosa pine. Global Change Biology, 17(4), 1516-1521.
Husari, S. J.; McKelvey, K. S. 1996. Fire management policies and programs. In : Sierra Nevada
ecosystem project: Final report to Congress. Davis, CA: University of California, Centers for
Water and Wildland Resources. Vol. 2, pp. 1101-1118.
Husari, S.J.; Nichols, T.; Sugihara, N.G.; Stephens, S.L. 2006. Fire and Fuel Management. In: Fire in
California Ecosystems. Berkeley, CA: University of California Press. Jackson, R. D., and B.
Allen-Diaz. 2006. Spring-fed wetland and riparian plant communities respond differently to
altered grazing intensity. Journal of Applied Ecology 43:485–498.
Jardine, A.; Long, J.W. 2013. Synopsis of Climate Change. Chapter 1.3 in Long, Jonathan W.; Quinn-
Davidson, Lenya, and Skinner, Carl N., tech. editors. Science Synthesis to support Forest Plan
Revision in the Sierra Nevada and Southern Cascades. Draft Final Report. Albany, CA: U.S.
Department of Agriculture, Forest Service, Pacific Southwest Research Station. 504 p.
Jennings, M. R. 1996. Status of amphibians. In Sierra Nevada ecosystem project: final report to
Congress. Vol. 2, pp. 921-944.
Jepsen, E.P.B.., Keane, J.J. and Ernest, H.B. 2011. Winter distribution and conservation status of the
Sierra Nevada great gray owl. The Journal of Wildlife Management, 75: 1678–1687.Johnson, H.
2011. Just the Facts: California’s Population. San Francisco, CA: Public Policy Institute of
California.
Jones, A. 2000. Effects of cattle grazing on North American arid ecosystems: a quantitative review:
Western North American Naturalist 60(2): 155-164.
177
Jones, R.E.; Fly, J.M.; Talley, J.; Cordell, H.K. 2003. Green Migration into Rural America: The New
Frontier of Environmentalism? Society & Natural Resources. 16(3).
Juarez, T.; Mick, K; Wetterberg, S.; Williams, T. 2013. DRAFT Recreation in the Bio-region – A
Summary of Condition and Trend for Forest Plan Revision. Unpublished report on file. Vallejo,
CA: U.S. Department of Agriculture, Forest Service, Pacific Southwest Region. June.
Karjalainen, E.; Sarjala, T.; Raitio, H. 2010. Promoting human health through forests: overview and major
challenges. Environmental Health and Preventive Medicine. 15(1): 1-8.
Kattelmann, R.; Embury, M. 1996. Riparian areas and wetlands. In: Sierra Nevada Ecosystem Project:
Final report to Congress. Davis, CA: University of California, Centers for Water and Wildland
Resources. Vol. 3.
Kauffman, J.B.; Krueger, W.C. 1984. Livestock impacts on riparian ecosystems and streamside
management implications…a review: Journal of Range Management 37(5):430-437.
Kaufmann, M. R. 1985. Annual transpiration in subalpine forests: Large differences among four species.
Forest Ecology and Management 13:235-246.
Kay, A. 2000. Art and community development: the role the arts have in regenerating communities.
Community Development Journal. 35(4): 414-424.
Keane, J. 2013. California Spotted Owl: Scientific Considerations for Forest Planning. Chapter 7.2 in
Long, Jonathan W.; Quinn-Davidson, Lenya, and Skinner, Carl N., tech. editors. Science
Synthesis to Promote Resilience of Social-Ecological Systems in the Sierra Nevada and Southern
Cascades. Draft Final Report. Albany, CA: U.S. Department of Agriculture, Forest Service,
Pacific Southwest Research Station.
Kelly, E.C.; Bliss, J. 2009. Healthy forests, healthy communities: an emerging paradigm for natural
resource-dependent communities? Society and Natural Resources. 22 (6): 519-537.
Kilgore, B. M. (1973). The ecological role of fire in Sierran conifer forests: its application to national
park management. Quaternary Research, 3(3), 496-513.
Kilgore, B. M., and Taylor, D. (1979). Fire history of a sequoia-mixed conifer forest. Ecology, 129-142.
Klinger, R.C.; Brooks, M.L.; Randall, J.M. 2006. Fire and invasive plant species. In: Fire in California’s
ecosystems, 499-519.
Knapp, R. A., Boiano, D. M., and Vredenburg, V. T. 2007. Removal of nonnative fish results in population
expansion of a declining amphibian (mountain yellow-legged frog, Rana muscosa). Biological
Conservation, 135(1), 11-20.
Knapp, R. A., and Morgan, J. A. 2006. Tadpole mouthpart depigmentation as an accurate indicator of
chytridiomycosis, an emerging disease of amphibians. Journal Information, 2006(2).
Kobziar and McBride. 2006. Flooding, scouring, diverse communities.
178
Kondolf, G.; Mathias, R.; Kattelmann, R.; Embury, M.; Erman, D. 1996. Status of Riparian Habitat. In:
Sierra Nevada Ecosystem Project: Final report to Congress, vol. III. Davis, CA: University of
California, Centers for Water and Wildland Resources.
Kota, A. M., and Bartos, D. L. 2010. Evaluation of techniques to protect aspen suckers from ungulate
browsing in the Black Hills. Western Journal of Applied Forestry, 25(4), 161-168.
Kratzer, C.R.; Shelton, J. 1998. Water Quality Assessment of the San Joaquin-Tulare Basins, California:
Analysis of Available Data on Nutrients and Suspended Sediment in Surface Water, 1972-1990:
U.S. Geological Survey Professional Paper 1587, 93 pp.
Kruger, L.E.; Hall, T.E.; Stiefel, M.C., eds. 2008. Understanding concepts of place in recreation research
and management. Portland, OR: U.S. Department of Agriculture, Forest Service, Pacific
Northwest Research Station.
Kruger, L.E.; Jakes, P.J. 2003. Special Section - Sense of Place - The Importance of Place: Advances in
Science and Application. Forest Science. 49(6): 819.
Kuhn, T. J., Safford, H. D., Jones, B. E., and Tate, K. W. 2011. Aspen (Populus tremuloides) stands and
their contribution to plant diversity in a semiarid coniferous landscape. Plant Ecology, 212(9),
1451-1463.
Kupferberg, S. J., Palen, W. J., Lind, A. J., Bobzien, S., Catenazzi, A., Drennan, J. O. E., and Power, M.
E. (2012). Effects of Flow Regimes Altered by Dams on Survival, Population Declines, and
Range‐Wide Losses of California River‐Breeding Frogs. Conservation Biology, 26(3), 513-
524.Kusel, J. 2001. Assessing Well-Being in Forest Dependent Communities. Journal of
Sustainable Forestry. 13(1-2): 359-384.
Laacke, R. J. 1990. Abies magnifica A. Murr., California red fir. Silvics of North America, 1(654),
71.Lake, F.K.; Long, J.W. 2013. Fire and Tribal Cultural Resources. Chapter 4.2 in Long, J.W.;
Quinn-Davidson, L., and Skinner, C.N., tech. editors. Science Synthesis to Promote Resilience of
Social-Ecological Systems in the Sierra Nevada and Southern Cascades. Draft Final Report.
Albany, CA: U.S. Department of Agriculture, Forest Service, Pacific Southwest Research Station.
LaMalfa, E. M. and R. Ryle. 2008. Differential Snowpack Accumulation and Water Dynamics in Aspen
and Conifer Communities: Implications for Water Yield and Ecosystem Function. Ecosystems
11:569-581.
Lannoo, M. J. (Ed.). 2005. Amphibian declines: the conservation status of United States species. Univ of
California Press.
Lieberg, J.B. 1902. Forest conditions in the northern Sierra Nevada, California. U.S. Geological Survey
Professional Paper No. 8, U.S. Government Printing Office, Washington, D.C.
Lenihan, J.M.; Bachelet, D.; Neilson, R.P.; Drapek, R. 2008. Response of vegetation distribution,
ecosystem productivity, and fire to climate change scenarios for California. Climatic
Change, 87(1), 215-230.
179
Lenihan, J.M.; Drapek, R.; Bachelet, D.; Neilson, R.P. 2003. Climate change effects on vegetation
distribution, carbon, and fire in California.Ecological Applications, 13(6), 1667-1681.
Lenihan, J. M., Bachelet, D., Neilson, R. P., & Drapek, R. (2008). Response of vegetation distribution,
ecosystem productivity, and fire to climate change scenarios for California. Climatic
Change, 87(1), 215-230.
Lin, S.; Metcalfe, M. 2013. DRAFT Socio-economics for the Bio-region – A Summary of Condition and
Trend for Forest Plan Revision. Unpublished report on file. Vallejo, CA: U.S. Department of
Agriculture, Forest Service, Pacific Southwest Region. June.
Lin, Amy. 2012. Federal Energy Relicensing Coordinator, Plumas and Tahoe National Forests. Personal
communication, November 2012.
Lindenmayer, D.B.; Fischer, J. 2006. Habitat fragmentation and landscape change: an ecological and
conservation synthesis. Island Press.
Loeffler, R.; Steinicke, E. 2006. Counterurbanization and Its Socio-economic Effects in High Mountain
Areas of the Sierra Nevada (California/Nevada). Mountain Research and Development. 26(1):
64-71.
Loeffler, R.; Steinicke, E. 2007. Amenity migration in the U.S. Sierra Nevada. Geographical Review.
97(1).
Loft, E. R., J. W. Menke, and J. G. Kie. 1991. Habitat shifts by mule deer - the influence of cattle grazing.
Journal of Wildlife Management 55:16-26.
Loheide, S.P.; Lundquist, J.D. 2009. Snowmelt‐induced diel fluxes through the hyporheic zone. Water
Resources Research, 45(7).
Long, J.; Quinn-Davidson, L.; Skinner, C. and others. 2013c. Post-wildfire Management. Chapter 4.3 in
Long, J.W.; Quinn-Davidson, L., and Skinner, C.N., tech. editors. Science Synthesis to Promote
Resilience of Social-Ecological Systems in the Sierra Nevada and Southern Cascades. Draft Final
Report. Albany, CA: U.S. Department of Agriculture, Forest Service, Pacific Southwest Research
Station.
Long, J.W.; Pope, K.; Mathews, K. 2013a. Wet Meadows. Chapter 6.3 in Long, J.W.; Quinn-Davidson, L.,
and Skinner, C.N., tech. editors. Science Synthesis to Promote Resilience of Social-Ecological
Systems in the Sierra Nevada and Southern Cascades. Draft Final Report. Albany, CA: U.S.
Department of Agriculture, Forest Service, Pacific Southwest Research Station.
Long, J.W.; Skinner, C.N.; North, M.P. and others. 2013b. Integrative Approaches. Chapter 1.1 in Long,
Jonathan W.; Quinn-Davidson, Lenya, and Skinner, Carl N., tech. editors. Science Synthesis to
support Forest Plan Revision in the Sierra Nevada and Southern Cascades. Draft Final Report.
Albany, CA: U.S. Department of Agriculture, Forest Service, Pacific Southwest Research Station.
504 p.
Los Angeles Department of Water and Power [LADWP]. 2010. Urban Water Management Plan.
180
Malanson, G. P. 1993. Riparian landscapes. Cambridge University Press.Martin and Sapsis. 1992. Fire-
diversity.
Mattson, D.; Mosier, J. 2012. USFS Scenery Management. Slides from presentation on 5/22/2012.
Maurer, J. 2005. Yosemite National Park Wildlife Biologist. Vehicle Collisions Report and
Recommendations.Stanislaus National Forest. 1991. Land and Resource Management Plan.
Sonora, CA.
Mayer, F.S.; Frantz, C.M. 2004. The connectedness to nature scale: a measure of individuals’ feeling in
community with nature. Journal of Environmental Psychology. 24: 503–515.
Mayhead, G.; Tittman, P. 2012. Uncertain future for California's biomass power plants. California
Agriculture. 66 (1): 6-7.
McAvoy, L. 2002. American Indians, Place Meanings, and the Old/New West. Journal of Leisure
Research. 34(4).
McAvoy, L.; Shirilla, P.; Flood, J. 2004. American Indian gathering and recreation uses of national
forests. Proceedings of the 2004 Northeastern Recreation Research Symposium. 81-87 p.
McConnell, L.L.; LeNoir, J.S.; Datta, S.; Sieber, J.N. 1998. West deposition of current-use pesticides in
the Sierra Nevada mountain range, California, USA. Environmental Toxicology and Chemistry.
10:1908-1916.
McCool, S.F.; Burchfield, J.; Williams, D.R. and others. 2007. Social science to improve fuels
management: a synthesis of research on the impacts of wildland fires on communities. Gen. Tech.
Rep. NC-269. Newtown Square, PA: U.S. Department of Agriculture, Forest Service, Northern
Research Station. 36 p.
McHenry, J.A. 2009. A place for the arts in rural revitalization and the social wellbeing of Australian rural
communities. Rural Society. 19(1): 60-70.
McIlroy SK, Lind AJ, Allen-Diaz BH, Roche LM, Frost WE, et al. (2013) Determining the Effects of
Cattle Grazing Treatments on Yosemite Toads (Anaxyrus [=Bufo] canorus) in Montane Meadows.
PLoS ONE 8(11): e79263. doi:10.1371/journal.pone.0079263.
McKelvey, K. S., and Johnston, J. D. 1992. Historical perspectives on forests of the Sierra Nevada and the
Transverse Ranges of southern California: forest conditions at the turn of the century. J. Verner,
K.S. McKelvey, B.R. Noon, R.J. Gutiérrez, G.I. Gould, Jr., and T,W. Beck, technical
coordinators. The California Spotted Owl: A Technical Assessment of its Current Status. USDA
Forest Service, Pacific Southwest Research Station. General Technical Report PSW-GTR-133,
225-246.
McKelvey, K.S.; Skinner, C.N.; Chang, C.R. and others. 1996. An overview of fire in the Sierra Nevada.
In Sierra Nevada ecosystem project: Final report to Congress. Davis, CA: University of
California, Centers for Water and Wildland Resources. Vol. 2, pp. 1033-1040.
McKenzie, D.Z.; Gedalof, Z.; Peterson, D.L.; Mote, P.M. 2004. Climate change, wildfire, and
conservation. Conservation Biology 18:890-902.
181
Menakis, J.P.; Cohen, J.D.; Bradshaw, L. 2003. Mapping wildland fire risk to flammable structures for the
conterminous United States, in: Proceedings Fire Conference 2000: The First national Congress
on Fire Ecology, Prevention and management, Misc. Pub. No. 13, Tall Timbers Research Station,
Tallahassee, FL. Pp. 41-49.
Menke, J.W., C. Davis, and P. Beesley. 1996. Public rangeland / livestock grazing assessment. In Sierra
Nevada ecosystem project: Final report to Congress. Davis, CA: University of California, Centers
for Water and Wildland Resources. Vol. 3, pp. 901-972.
Merriam, K. 2013. Natural Range of Variation in Hardwood Vegetation in the Sierra Nevada, California
over the Holocene Epoch. Unpublished document. USDA Forest Service, Pacific Southwest
Region, Vallejo, CA.
Merrill, A. G., Benning, T. L., and Fites, J. A. 2006. Factors controlling structural and floristic variation of
riparian zones in a mountainous landscape of the western United States. Western North American
Naturalist, 66(2), 137-154.
Metcalfe, M.: Kohler, T: Brough, A: and Emly, V. 2013. DRAFT Ecosystem Services for the Bio-region –
A Summary for Forest Plan Revision. Unpublished report on file with U.S. Department of
Agriculture Forest Service Region 5 Vallejo, CA. June.
Meyer, M. 2013a. Natural Range of Variation in Red Fir Vegetation in the Sierra Nevada and South
Cascades, California. Unpublished document. USDA Forest Service, Pacific Southwest Region,
Vallejo, CA.
Meyer, M. 2013b. Natural Range of Variation in Subalpine Vegetation in the Sierra Nevada and South
Cascades, California. Unpublished document. USDA Forest Service, Pacific Southwest Region,
Vallejo, CA.
Millar, C. I., and Woolfenden, W. B. 1999. The role of climate change in interpreting historical
variability. Ecological Applications, 9(4), 1207-1216.
Miller, M., 2000. Fire autecology. In: Brown, J.K., Smith, J.K. (Eds.), Wildland Fire and Ecosystems:
Effects of Fire on Flora. Gen. Tech. Rep. RMRS-GTR-412-vol 2, USDA Forest Service, Ogden,
UT, pp. 9–34.
Miller, R. F. and J. A. Rose. 1999. Fire history and western juniper encroachment in sagebrush steppe.
Journal of Range Management 52:550-559.
Miller, R., C. Baisan, J. Rose, and D. Pacioretty. 2001. Pre- and post-settlement fire regimes in mountain
big sagebrush steppe and aspen: the northwestern Great Basin. Final Report to the National
Interagency Fire Center, Oregon State University, Eastern Oregon Agricultural Research Center.
Miller, R. F. and P. E. Wigand. 1994. Holocene changes in semiarid pinyon-juniper woodlands.
Bioscience 44:465-474.
Miller, J.D.; Safford, H.D. 2012. Trends in wildfire severity 1984-2010 in the Sierra Nevada, Modoc
Plateau and southern Cascades, California, USA. Fire Ecology, 8(3), 41-57.
182
Miller, J.D.; Safford, H.D.; Crimmins, M.; Thode, A.E. 2009. Quantitative evidence for increasing forest
fire severity in the Sierra Nevada and southern Cascade Mountains, California and Nevada,
USA. Ecosystems, 12(1), 16-32.
Minnich, R.A. 2007. Climate, paleoclimate, and paleovegetation. In: Terrestrial Vegetation of
California, 3, 43-70.
Minshall, G.W., Robinson, C.T., Lawrence, D.E., 1997. Postfire responses of lotic ecosystems in
Yellowstone National Park, USA. Can. J. Fish. Aquat. Sci. 54, 2509–2525.
Mittelbach, F.G.; Wambem, D. 2003. Competition for natural resources in California's Sierra Nevada.
California Policy Options: 89-109.
Moody, T.J.; Fites-Kaufman, J.; Stephens, S.L. 2006. Fire history and climate influences from forests in
the northern Sierra Nevada, USA. Fire Ecology 2.1: 115-141.
Morgan, T.A.; Brandt, J.P.; Songster, K.E. and others. 2012. California's forest products industry and
timber harvest, 2006. Portland, OR: U.S. Department of Agriculture, Forest Service, Pacific
Northwest Research Station. 48 p.
Morgan, T.A.; Keegan III, C.E.; Dillon, T. and others 2004. California's forest products industry: a
descriptive analysis. Gen. Tech. Rep. PNW-GTR-615. Portland, OR: U.S. Department of
Agriculture, Forest Service, Pacific Northwest Research Station.
Moseley, C.: Nielsen-Pincus, M. 2009. Economic Impact and Job Creation from Forest and Watershed
Restoration: A Preliminary Assessment. Briefing Paper #14. Ecosystem Workforce Program.
Institute for a Sustainable Environment. University of Oregon. Winter.
Moyle, P.B. 1996. Status of aquatic habitat types. In: Sierra Nevada Ecosystem Project, Final Report to
Congress. Davis, CA: University of California, Centers for Water and Wildland Resources. Vol.
2. Pages 945-952.
Moyle, P.B.; Katz, J.V.E.; Quiñones, R.M. 2011. Rapid decline of California’s native inland fishes: A
status assessment. Biological Conservation 144:2414–2423.
Moyle, P. B., and Mount, J. F. 2007. Homogenous rivers, homogenous faunas. Proceedings of the
National Academy of Sciences, 104(14), 5711-5712.
Moyle, P.B., Williams, J.E. 1990. Biodiversity loss in the temperate zone: Decline of the native fish fauna
of California. Cons. Biol. 4: 475–84.
Moyle, P. B., Yoshiyama, R. M., and Knapp, R. A. 1996. Status of fish and fisheries. In Sierra Nevada
Ecosystem Project: Final Report to Congress. Davis, CA: University of California, Centers for
Water and Wildland Resources. Vol. 2, pp. 953-973.
Müller, M.M.; Kals, E.; Pansa, R. 2009. Adolescents’ Emotional Affinity toward Nature: A Cross-Societal
Study. The Journal of Developmental Processes. 4(1): 59-69.
Nadeau, S.; Shindler, B.A.; Kakoyannis, C. 2003. Beyond the economic model: assessing sustainability in
forest communities. In: Shindler, B.A., Beckley, T.M. and Finley, M.C., eds. Two paths toward
183
sustainable forests: public values in Canada and the United States. Corvallis: Oregon State
University Press: 60-74. Chapter 4.
Nagel, T.A.; Taylor, A.H. 2005. Fire and persistence of montane chaparral in mixed conifer forest
landscapes in the northern Sierra Nevada, Lake Tahoe Basin, California, USA 1. The Journal of
the Torrey Botanical Society, 132(3), 442-457.
Naiman, R. J., and Décamps, H. 1997. The ecology of interfaces: riparian zones. Annual review of
Ecology and Systematics, 621-658.
Nakano, S., and Murakami, M. 2001. Reciprocal subsidies: dynamic interdependence between terrestrial
and aquatic food webs.Proceedings of the National Academy of Sciences, 98(1), 166-170.
National Geographic Society. 2009. Sierra Nevada Geotourism MapGuide.
National Renewable Energy Laboratory [NREL]. 2005. Assessing the Potential for Renewable Energy on
National Forest System Lands. January. 123p.
National Research Council. 2000. Watershed management for potable water supply: assessing the New
York City strategy. Washington, DC: National Academy Press. 530 p.
Neary, D. G.; Ryan, K.C.; DeBano, L.F. (eds.), 2005 (revised 2008), Wildland fire in ecosystems: effects
of fire on soils and water. General Technical Report RMRS-GTR-42, Vol.4., Ogden, UT: USDA
Forest Service, Rocky Mountain Research Station, 250 pp.
Neary, D.G.; Ryan, K.C.; DeBano, L.F., eds. 2005 (revised 2008), Wildland fire in ecosystems: effects of
fire on soils and water. General Technical Report RMRS-GTR-42, Vol.4., Ogden, UT: USDA
Forest Service, Rocky Mountain Research Station, 250 pp.
Neville, H. M., Gresswell, R. E., and Dunham, J. B. 2012. Genetic variation reveals influence of
landscape connectivity on population dynamics and resiliency of western trout in disturbance-
prone habitats. In: Luce, C.; Morgan, P.; Dwire, K.; Isaak, D.; Holden, Z.; Rieman, B. Climate
change, forests, fire, water, and fish: Building resilient landscapes, streams, and managers. Gen.
Tech. Rep. RMRS-GTR-290. Fort Collins, CO: US Department of Agriculture, Forest Service,
Rocky Mountain Research Station.
Noon, B. R. 2003. Conceptual issues in monitoring ecological resources. Monitoring ecosystems:
interdisciplinary approaches for evaluating ecoregional initiatives. Island Press, Washington, DC,
USA, 27-71.
Noon, B.R., McKelvey, K.S.; Dickson, B.G. 2009. Multispecies conservation planning on U.S. federal
lands. Pages 51–84 inJ. J. Millspaugh and F. R. Thompson, III, editors. Models for planning
wildlife conservation in large landscapes. Academic Press, New York, New York.
North, M. 2012. Managing Sierra Nevada Forests. Gen. Tech. Rep. PSW-GTR-237. Albany, CA: U.S.
Department of Agriculture, Forest Service, Pacific Southwest Research Station.
North, M. 2013. Forest Ecology. Chapter 2.0 in Long, J.W.; Quinn-Davidson, L., and Skinner, C.N., tech.
editors. Science Synthesis to Promote Resilience of Social-Ecological Systems in the Sierra
184
Nevada and Southern Cascades. Draft Final Report. Albany, CA: U.S. Department of Agriculture,
Forest Service, Pacific Southwest Research Station.
North, M.; Collins, B.M.; Stephens, S. 2012. Using fire to increase the scale, benefits, and future
maintenance of fuels treatments. Journal of Forestry, 110(7), 392-401.
North, M.; Hurteau, M.; Innes, J. 2009. Fire suppression and fuels treatment effects on mixed-conifer
carbon stocks and emissions.Ecological Applications, 19(6), 1385-1396.
North, M., Hurteau, M., Innes, J. 2009. Fire suppression and fuels treatment effects on mixed-conifer
carbon stocks and emissions. Ecological Applications 19, 1385-1396.Norton, J.B.; Jungst, L.J.;
Norton, U.; Olsen, H.R.; Tate, K.W.; Horwath, W.R. 2011. Soil Carbon and Nitrogen Storage in
Upper Montane Riparian Meadows. Ecosystems. 14(8): 1217-1231.
Null, S.E.; Viers, J.H. 2012. Water and Energy Sector Vulnerability to Climate Warming in the Sierra
Nevada: Water Year Classification in Non-Stationary Climates. Prepared for: California Energy
Commission by University of California, Davis. White paper from the California Energy
Commission’s California Climate Change Center. CEC-500-2012-015.
Null, S. E., Viers, J. H., and Mount, J. F. 2010. Hydrologic response and watershed sensitivity to climate
warming in California's Sierra Nevada.PLoS One, 5(4), e9932.
Ode, P.R. 2007, Ecological condition assessment of California’s perennial wadeable streams: Report to
the State Water Resources Control Board’s Non-Point Source Program: California Department of
Fish and Game Aquatic, Bioassessment Laboratory, Rancho Cordova, CA.
Ode, P.R.; Kincaid, T.M.; Fleming, T.; Rehn, A.C.. 2011. Ecological Condition Assessments of
California’s Perennial Wadeable Streams: Highlights from the Surface Water Ambient Monitoring
Program, Perennial Streams Assessment (PSA) (2000-2007). Sacramento, CA: State Water
Resources Control Board’s Non-Point Source Pollution Control Program, Surface Water Ambient
Monitoring Program , California Department of Fish and Game Aquatic Bioassessment
Laboratory, and the U.S. Environmental Protection Agency.
Outdoor Industry Association; Western Governors' Association; Motorcycle Industry Council and others.
2012. Outdoor Recreation Economy: A Snapshot of the Economic Impact of Outdoor Recreation
in the West.
Pardo, L.H.; Fenn, M.E.; Goodale, C.L. and others. 2011. Effects of nitrogen deposition and empirical
nitrogen critical loads for ecoregions of the United States. Ecological Applications, 21(8), 3049-
3082.
Parks, C.G.; Radosevich, S.R.; Endress, B.A. and others 2005. Natural and land-use history of the
Northwest mountain ecoregions (USA) in relation to patterns of plant invasions. Perspectives in
Plant Ecology, Evolution and Systematics, 7(3): 137-158.
Patten, D. T. 1998. Riparian ecosystems of semi-arid North America: Diversity and human impacts.
Wetlands 18:498-512.
185
Patterson, T.M. 2013. Ecosystem Services. Chapter 9.2 in Long, Jonathan W.; Quinn-Davidson, Lenya,
and Skinner, Carl N., tech. editors. Science Synthesis to support Forest Plan Revision in the
Sierra Nevada and Southern Cascades. Draft Final Report. Albany, CA: U.S. Department of
Agriculture, Forest Service, Pacific Southwest Research Station. 504 p.
Pettit, N.E. and R.J. Naiman. 2007. Fire in the Riparian Zone: Characteristics and Ecological
Consequences. Ecosystems 10: 673–687.
Pierson, F.B., Robichaud, P.R., Moffet, C.A., Spaeth, K.E., Hardegree, S.P., Clark, P.E., and Williams,
C.J., 2008, Fire effects on rangeland hydrology and erosion in a steep sagebrush-dominated
landscape: Hydrological Processes 22: 2916-2929.
Pitcher, D.C. 1987. Fire history and age structure in red fir forests of Sequoia National Park, California.
Canadian Journal of Forest Research 17: 582-587.
Poff, N. L., and Zimmerman, J. K. 2010. Ecological responses to altered flow regimes: a literature review
to inform the science and management of environmental flows. Freshwater Biology, 55(1), 194-
205.
Pollan, M. 2007. Our Decrepit Food Factories. New York Times Magazine. Retrieved 2011-11-13.
Pope, K.; Long, J.W. 2013. Lakes: Recent Research and Restoration Strategies. Chapter 6.4 in Long,
Jonathan W.; Quinn-Davidson, Lenya, and Skinner, Carl N., tech. editors. Science Synthesis to
Promote Resilience of Social-Ecological Systems in the Sierra Nevada and Southern Cascades.
Draft Final Report. Albany, CA: U.S. Department of Agriculture, Forest Service, Pacific
Southwest Research Station.
Postel, S.; Carpenter, S. 1997. Freshwater ecosystem services. In: Daily, G., ed. Nature’s services: societal
dependence on natural ecosystems. Washington, DC: Island Press: 195–214.
Potter, D. A. 1998. Forested communities of the upper montane in the Central and Southern Sierra
Nevada. General Technical Report PSW-GTR-169. Pacific Southwest Research Station, Forest
Service, US Department of Agriculture, Albany, CA. 319 p.
Potter, D. A. 2005. Riparian community classification: west slope, central and southern Sierra Nevada.
California. Technical Report R5-TP-022. USDA Forest Service, Pacific Southwest Research
Station, Berkeley, CA.
Pyne, S. J., Andrews, P. L., and Laven, R. D. 1996. Introduction to wildland fire (No. Ed. 2). John Wiley
and Sons.
Purdy, S. E., Moyle, P. B., and Tate, K. W. 2012. Montane meadows in the Sierra Nevada: comparing
terrestrial and aquatic assessment methods. Environmental monitoring and assessment, 184(11),
6967-6986.
Rachowicz, L. J., Knapp, R. A., Morgan, J. A., Stice, M. J., Vredenburg, V. T., Parker, J. M., & Briggs, C.
J. 2006. Emerging infectious disease as a proximate cause of amphibian mass
mortality. Ecology, 87(7), 1671-1683.
186
Rahn, M. 2009. Wildfire Impact Analysis, Fire Impact Analysis, Spring 2009. San Diego, CA: San Diego
University.
Ratliff, R.D. 1985. Meadows in the Sierra Nevada of California: state of knowledge. Gen. Tech. Rep.
PSW-84. Pacific Southwest Forest and Range Experiment Station, USDA Forest Service, Albany,
CA.
Rector, J.R.; MacDonald, L.H. 1986. Water yield opportunities on National Forest lands in the Pacific
Southwest Region: Proceedings of the California Watershed Management Conference, November
18-20, 1986, West Sacramento, CA, p. 68-73.
Rehfeldt, G. E., D. E. Ferguson, and N. L. Crookston. 2009. Aspen, climate, and sudden decline in
western USA. Forest Ecology and Management 10. 258:2353-2364.
Reilly, T.E. 2008. Ground-Water Availability in the United States: U.S. Geological Survey Circular 1323.
Denver, CO: U.S. Geological Survey. p. 84.
Rieman, B., Lee, D., Burns, D., Gresswell, R., Young, M., Stowell, R. and Howell, P. 2003. Status of
native fishes in the western United States and issues for fire and fuels management. Forest
Ecology and Management, 178(1), 197-211.
Reinhardt, E. D., Keane, R. E., Calkin, D. E., and Cohen, J. D. 2008. Objectives and considerations for
wildland fuel treatment in forested ecosystems of the interior western United States. Forest
Ecology and Management, 256(12), 1997-2006.
Richards, R.T. 1996. Special forest products harvesting in the Sierra Nevada. In: Sierra Nevada ecosystem
project: final report to Congress, vol. III. Davis, CA: University of California: 787-884.
Richardson, T. W. and S. K. Heath. 2004. Effects of conifers on aspen-breeding bird communities in the
Sierra Nevada. Transactions of the Western Section of the Wildlife Society 40:68-81.
Riegel, G.M.; Miller, R.F.; Skinner, C.N.; Smith, S.E. 2006. Northeastern plateaus bio-region. In: Fire in
California’s ecosystems. Berkeley, CA: University of California Press.
Roberts, N.S.; Chavez, D.J.; Lara, B.M.; Sheffield, E.A. 2009. Serving culturally diverse visitors to
forests in California: a resource guide. Gen. Tech. Rep. PSW-GTR-222. Albany, CA: U.S.
Department of Agriculture, Forest Service, Pacific Southwest Research Station. 76 p.
Roche LM, Latimer AM, Eastburn DJ, Tate KW. 2012. Cattle Grazing and Conservation of a Meadow-
Dependent Amphibian Species in the Sierra Nevada. PLoS ONE 7(4): e35734.
doi:10.1371/journal.pone.0035734.
Roche, L.M., B. Allen-Diaz, D.J. Eastburn, and K.W. Tate. 2012a. Cattle Grazing and Yosemite Toad
(Bufo canorus Camp) Breeding Habitat in Sierra Nevada Meadows. Rangeland Ecology and
Management. 65:56-65.
Roche, L.M., L. Kromschroeder, E.R. Atwill, R.A. Dahlgren, and K.W. Tate. 2013. Water quality
conditions associated with cattle grazing and recreation on national forest lands. PLoS ONE. 8(6):
e68127.
187
Roche, L.M., L. Kromschroeder, E.R. Atwill, R.A. Dahlgren, and K.W. Tate. In press. Water quality
conditions associated with cattle grazing and recreation on national forest lands. PLoS ONE.
Roche, L.M.; Allen-Diaz, B.; Eastburn, D.J.; Tate, K.W. 2012a. Cattle Grazing and Yosemite Toad (Bufo
canorus Camp) Breeding Habitat in Sierra Nevada Meadows. Rangeland Ecology &
Management. 65(1): 56-65.
Roche, L.M.; Latimer, A.M.; Eastburn, D.J.; Tate, K.W. 2012b. Cattle Grazing and Conservation of a
Meadow-Dependent Amphibian Species in the Sierra Nevada. Plos One. 7(4): e35734.
Rollins, M.G. 2009. LANDFIRE: a nationally consistent vegetation, wildland fire, and fuel
assessment. International Journal of Wildland Fire, 18(3), 235-249.
Romin, L.A.; Bissonette, J.A. 1996. Deer: vehicle collisions: status of state monitoring activities and
mitigation efforts. Wildlife Society Bulletin, 276-283.
Russell, W.H.; McBride, J.R. 2001. The relative importance of fire and watercourse proximity in
determining stand composition in mixed conifer riparian forests. Forest Ecology and Management
150: 259-265.
Russell, W. H. and J. R. McBride. 2001. The relative importance of fire and watercourse proximity in
determining stand composition in mixed conifer riparian forests. Forest Ecology and Management
150:259-265.
Rykoff, A. 2013. Personal conversation on the factors influencing private timber harvests in California.
U.S. Department of Agriculture Forest Service Region 5 Timber Sale Preparation and
Stewardship Contracting Section Head. June 25.
Safford, H.D. 2013a. Natural Range of Variability Assessments for the Sierra Nevada Bio-regional
Assessment. Unpublished document. USDA Forest Service, Pacific Southwest Region, Vallejo,
CA.
Safford, H.D. 2013b. Natural Range of Variation for Yellow Pine and Mixed Conifer Forests in the
Assessment Area. Unpublished document. USDA Forest Service, Pacific Southwest Region,
Vallejo, CA.
Safford, H.D.; North, M.; Meyer, M.D. 2012a. Chapter 3: Climate change and the relevance of historical
forest conditions. In North, M. (ed.), In: Managing Sierra Nevada forests. General Technical
Report PSW-GTR-237. Albany, CA: U. S. Department of Agriculture, Forest Service, Pacific
Southwest Research Station: 23-46.
Safford, H.D.; Hayward, G.D.; Heller, N.E.; Wiens, J.A. 2012. Historical ecology, climate change, and
resource management: can the past still inform the future? In: (eds) Wiens, J.A.; Hayward, G.D.;
Hugh, D.; Giffen, C. 2012. Historical environmental variation in conservation and natural
resource management. Wiley-Blackwell. pp. 46-62.
Safford, H. D., Schmidt, D. A., and Carlson, C.H. 2009. Effects of fuel treatments on fire severity in an
area of wildland–urban interface, Angora Fire, Lake Tahoe Basin, California. Forest Ecology and
Management, 258(5), 773-787.
188
Safford, H.D.; Stevens, J.T.; Merriam, K.; Meyer, M.D.; Latimer, A.M. 2012b. Fuel treatment
effectiveness in California yellow pine and mixed conifer forests. Forest Ecology and
Management. 274: 17-28.
Salazar, K. 2013. A Letter to County Commissioners on the Sequester Impacts to PILT. Department of the
Interior. March 6.
Sampson, A. W. 1919. Effect of Grazing on Aspen Reproduction. U.S. Department of Agriculture,
Washington, D.C. Bulletin 741.
Sanzone, D. M., Meyer, J. L., Martí, E., Gardiner, E. P., Tank, J. L., and Grimm, N. B. 2003. Carbon and
nitrogen transfer from a desert stream to riparian predators. Oecologia, 134(2), 238-250.
Sapsis. 2012. State senior fire scientist. CALFire, Fire and Forest Range Assessment Program,
Sacramento, CA. February.
Sarr, D.A. 2002. Riparian livestock exclosure research in the western United States: A critique and some
recommendations. Environmental management. 30(4): 516-526.
Sawyer, S. 2013. Natural Range of Variation in Non-meadow Riparian Zones. Unpublished document.
Safford, H.D. 2013. Natural Range of Variation for Yellow Pine and Mixed Conifer Forests in the
Assessment Area. Unpublished document. USDA Forest Service, Pacific Southwest Region,
Vallejo, CA.
Schoenherr, A.A. 1992. A natural history of California. Berkeley and Los Angeles: University of
California Press.
Scholl, A.E.; Taylor, A.H. 2010. Fire regimes, forest change, and self-organization in an old-growth
mixed-conifer forest, Yosemite National Park, USA. Ecological Applications 20: 362-380.
Schultz, C.A.; Sisk, T.D.; Noon, B.R.; Nie, M.A. 2013. Wildlife conservation planning under the United
States Forest Service's 2012 planning rule. The Journal of Wildlife Management. Vol.77 (3): 428–
444.
Schultz, P.W. 2011. Conservation Means Behavior. Conservation Biology 25(6): 1080-1083.
Schwartz, M.W.; Porter, D.J.; Randall, M.; Lyons, K.E. 1996. Impacts of Nonindigenous plants. In Sierra
Nevada Ecosystem Project: Final report to Congress. Davis, CA: University of California,
Centers for Water and Wildland Resources. Vol. II Pages 1203 –1226.
Selter, C.M., W.D. Pitts, and M.G. Barbour. 1986. Site microenvironment and seedling survival of Shasta
red fir. American Midland Naturalist 115: 288-300.
Shaffer, K.E.; Laudenslayer Jr., W.F. 2006. Fire and animal interactions. In: Fire in California’s
ecosystems. Berkeley, CA: University of California Press. P. 118-144.
Shepperd, W. D., D. L. Bartos, and S. A. Mata. 2001. Above- and below-ground effects of aspen clonal
regeneration and succession to conifers. Canadian Journal of Forest Research 31:739–745.
189
Shepperd, Wayne D.; Rogers, Paul C.; Burton, David; Bartos, Dale L. 2006. Ecology, Biodiversity,
management, and restoration of aspen in the Sierra Nevada. Gen. Tech. Rep. RMRS-GTR-
178.Fort Collins, CO: U.S. Department of Agriculture, Forest Service, Rocky Mountain Research
Station 122 p.
Sherlock, J. 2013. Personal conversation on the factors influencing future timber harvests in the bio-
region. U.S. Department of Agriculture Forest Service Region 5 Regional Silviculturist. May 15.
Shinneman, D. J., Baker, W. L., Rogers, P. C., and Kulakowski, D. 2013. Fire regimes of quaking aspen in
the Mountain West. Forest Ecology and Management, 299(1), 22-34.
Sickman, J.O.; Leydecker, A.L.; Chang, C.C.; Kendall, C., and others. 2003. Mechanisms underlying
export of N from high-elevation catchments during seasonal transitions. Biogeochemistry, 64(1),
1-24.
Siegel, R.B.; DeSante, D.F. 1999. The draft avian conservation plan for the Sierra Nevada Bio-region:
conservation priorities and strategies for safeguarding Sierra bird populations. Version 1.0. Point-
Reyes, CA. Institute for Bird Populations report to California Partners in Flight.
Sierra Business Council. 1997. Planning for prosperity: building successful communities in the Sierra
Nevada. Truckee, CA: Sierra Business Council.
Sierra Business Council. 2007. The State of the Sierra. Truckee, CA: Sierra Business Council.
Sierra Nevada Conservancy. 2011a. Strategic Plan. In: N. R. A. State of California, Sierra Nevada Legacy,
editor, Auburn, CA.
Sierra Nevada Conservancy. 2011b. System Indicators - Demographics and Economy.
Sierra Nevada Conservancy. 2011c. System Indicator Report - Land Conservation and Wildlife Habitat.
Sierra Nevada Conservancy. 2012a. System Indicator Report - Forest Health and Carbon Storage.
Sierra Nevada Conservancy. 2012b. System Indicator Report - Water and Air Quality and Climate.
Sikes, K., Cooper, D., Weis, S., Keeler-Wolf, T., Barbour, M., Ikeda, D. and Evens, J. 2013. Fen
conservation and vegetation assessment in the National Forests of the Sierra Nevada and adjacent
mountains, California. Unpublished report to the United States Forest Service, Region 5.
Skinner, C.M. 2003. Fire regimes of upper montane and subalpine glacial basins in the Klamath
Mountains of northern California. Tall Timbers Research Station Miscellaneous Publication
13:145-151.
Skinner, C.N.; Chang, C.R. 1996. Fire regimes, past and present. In: Sierra Nevada ecosystem project:
final report to congress. Davis, CA: University of California, Centers for Water and
Wildlands. Vol. 2, pp. 1041-1069.
Skinner, C.N.; Taylor, A.H. 2006. Southern Cascades bio-region. In: Fire in California Ecosystems.
Berkeley, CA: University of California Press.
190
Slaton, M. 2013. Sagebrush Natural Range of Variation (NRV). Unpublished document on file. USDA
Forest Service, Pacific Southwest Region, Vallejo, CA.
Slaton, M., and H. Stone. 2013. Pinyon-Juniper Natural Range of Variation (NRV). Unpublished
document on file at USDA Forest Service, Pacific Southwest Region, Vallejo, CA.
Soroka, D. E., and Morrison, M. L. 2005. Behavioral activities and breeding success of Willow
Flycatchers in the Sierra Nevada. Western North American Naturalist, 65(4), 441-450.
Smith, N.; Deal, R.; Kline, J.D. and others. 2011. Using ecosystem services as a framework for forest
stewardship: executive summary. Gen. Tech. Rep PNW GTR-852. Portland, OR: U.S.
Department of Agriculture, Forest Service, Pacific Northwest Research Station. 46 p.
Spelter, H., McKeever, D., and Toth, D. 2009. Profile 2009: softwood sawmills in the United States and
Canada. Madison, WI: Forest Service.
Spencer, C.N., Gabel, K.O., and Hauer, F.R., 2003, Wildfire effects on stream food webs and nutrient
dynamics in Glacier National Park, USA: Forest Ecology and Management 178: 141-153.
Spencer, W.; Rustigian-Romsos, H. 2012. Decision support maps and recommendations for conserving
rare carnivores in the interior mountains of California. Unpublished report. Corvallis, OR: Center
for Conservation Biology.
Springsteen, B.; Christofk, T.; Eubanks, S. and others. 2011. Emission reductions from woody biomass
waste for energy as an alternative to open burning. J. Air and Waste Mgt. Assoc. 61:63-68.
Stanford, J. A.; Hauer, F.R. 1992. Mitigating the impacts of stream and lake regulation in the Flathead
River catchment, Montana, USA: An ecosystem perspective. Aquatic Conservation: Marine and
Freshwater Ecosystems 2:35– 63.
State of California Resources Agency. 2009. California Outdoor Recreation Plan 2008. California State
Parks.
Stednick, J.D. 1996. Monitoring the effects of timber harvest on annual water yield. Journal of Hydrology
176.
Stephens, S.L. 2000. Mixed conifer and red fir forest structure and uses in 1899 from the central and
northern Sierra Nevada, California. Madroño 47:43-52.
Stephens, S. L. 2005. Forest fire causes and extent on United States Forest Service lands. International
Journal of Wildland Fire, 14(3), 213-222.
Stephens, S.L.; Martin, R.E.; Clinton, N.E. 2007. Prehistoric fire area and emissions from California's
forests, woodlands, shrublands, and grasslands.Forest Ecology and Management, 251(3), 205-
216.
Stephens, S.L.; McIver, J.D.; Boerner, R.E. and others. 2012. The effects of forest fuel-reduction
treatments in the United States. BioScience, 62(6), 549-560.
191
Stephens, S. L., and Moghaddas, J. J. 2005. Experimental fuel treatment impacts on forest structure,
potential fire behavior, and predicted tree mortality in a California mixed conifer forest. Forest
Ecology and Management, 215(1), 21-36.
Stewart, W. 1996. Chapter 23 Economic Assessment of the Ecosystem from Status of the Sierra Nevada
Volume III Assessments, Comissioned Reports, and Background Information. Wildland
Resources Center Report No. 38. University of California Davis. June.
Stickney, P.F., 1986. First Decade Plant Succession Following the Sundance Forest Fire, Northern Idaho.
Gen. Tech. Rep. GTR-INT-197, USDA Forest Service, Ogden, UT, 26 pp.
Stockmann, K., Burchfield, J., Calkin, D., and Venn, T. 2010. Guiding preventative wildland fire
mitigation policy and decisions with an economic modeling system. Forest policy and
economics, 12(2), 147-154.
Sturtevant, V.E.; Donoghue, E.M. 2008. Community and forest connections: continuity and change. In:
Sturtevant, V.E.; Donoghue, E.M., eds. Forest community connections: implications for research,
management, and governance. Washington, DC: Resources for the Future: 3-44.
Sugihara, N. 2013. USDA Pacific Southwest Region, Regional Fire Ecologist. Personal communication.
April 2013.
Sugihara, N.; Van Wagtendonk, J.; Fites-Kaufman, J.A.; 2006a. Fire as an Ecological Process. In: Fire in
California Ecosystems. Berkeley, CA: University of California Press.
Sugihara, N.; Van Wagtendonk, J.; Shaffer, K.E.; Fites-Kaufman, J.A.; Thode, A.E., eds. 2006b. Fire in
California Ecosystems. Berkeley, CA: University of California Press.
Sudworth, G. B. 1900. Stanislaus and Lake Tahoe Forest Reserves, California, and adjacent territories.
Pages 505-561 Twenty-first annual report of the US Geological Survey, Part 5, Forest Resources.
Government Printing Office, Washington, DC.
TACCIMO (Template for Assessing Climate Change Impacts and Management Options)-Sierra Nevada
Vulnerability Assessment Working Group. 2013. A Vulnerability Assessment Workshop for Focal
Resources of the Sierra Nevada: Workshop Proceedings, March 5-7, 2013. Climate Adaptation
Project for the Sierra Nevada. Prepared by EcoAdapt.
Taleb, N.N. 2010. The black swan: The impact of the highly improbable. New York, NY: Random House.
366 p.
Tate, K. W., D. F. Lile, D. L. Lancaster, M. L. Porath, J. A. Morrison, and Y. Sado. 2005. Statistical
analysis of monitoring data to evaluate stream temperature—a watershed scale case study.
California Agriculture 59:161–167.
Tate, K. W., M. Das Gracas, C. Pereira, and E. R. Atwill. 2004a. Efficacy of vegetated buffer strips for
retaining Cryptosporidium parvum. Journal of Environmental Quality 33:2243–2251.
Taylor, A.H. 2000. Fire regimes and forest changes along a montane forest gradient, Lassen Volcanic
National Park, southern Cascade Mountains, USA. Journal of Biogeography 27:87-104.
192
Taylor, A.H. 2004. Identifying forest reference conditions on early cut-over lands, Lake Tahoe Basin,
USA. Ecological Applications 14: 1903-1920.
Taylor, A. H. 2008. The successional status of aspen (Populus tremuloides) in Lassen National Forest. The
Pennsylvania State University, University Park, PA.
Taylor, A. H., and Skinner, C. N. (1998). Fire history and landscape dynamics in a late-successional
reserve, Klamath Mountains, California, USA. Forest Ecology and Management, 111(2), 285-
301.
Thompson, J. 2005. Keeping it cool: unraveling the influences on stream temperature. PNW Research
Station Science Findings, Issue 73.
Toman, E.: Stidham, M.: McCaffrey, S.: Shindler, B. 2013. Social Science at the Wildland-Urban
Interface: a Compendium of Research Results to Create Fire-Adapted Communities. US
Department of Agriculture. Forest Service. Northern Research Station. GTR NRS-111.
Trimble, S.W.; Mendel, A.C. 1995. The cow as a geomorphic agent: Geomorphology 13: 233-253.
Troendle, C.A.; MacDonald, L.H.; Luce, C.H.; Larsen, I.J. 2010. Fuel management and water yield.
Pages 126-148 in W.J. Elliot, I.S. Miller, and L. Audin (eds.), Cumulative watershed effects of
fuel management in the western United States. Gen. Tech. Rep. RMRS-GTR231. Fort Collins,
CO. U.S. Department of Agriculture, Forest Service, Rocky Mountain Research Station. 299 p.
University of California, Davis [UC Davis]. 2013. Plant functional group analysis on the Inyo National
Forest Range allotments in meadows. Preliminary results available on the University website.
U.S. Department of Agriculture. 2010. Strategic Plan: FY 2010-2015. Washington, DC: U.S. Department
of Agriculture.
U.S. Department of Agriculture. 2012. Environmental Justice Strategic Plan 2012-2014. Washington,
D.C.: 15 p.
U.S. Department of Agriculture Forest Service [USFS] 2007. USFS Forest Service Strategic Plan FY
2007-2012. Washington DC: U.S. Department of Agriculture Forest Service 2011.
U.S. Department of Agriculture Forest Service [USFS] 2010b. Dinkey Creek Restoration Project. Clovis,
CA: Sierra National Forest.
U.S. Department of Agriculture Forest Service [USFS] 2011c. Last Chance Restoration Project.
Foresthill, CA: Tahoe National Forest.
U.S. Department of Agriculture Forest Service [USFS] 2012d. Forest Service Western Core Data Tables.
McClellan, CA: Forest Inventory Program.
U.S. Department of Agriculture Forest Service [USFS] 2013.
U.S. Department of Agriculture Forest Service [USFS]. [n.d.]. Travel Management. (21 June 2013).
193
U.S. Department of Agriculture Forest Service [USFS]. 1976. Forests and Water: effects of forest
management on floods, sedimentation and water supply. General Technical Report PSW-18/1976.
121 p.
U.S. Department of Agriculture Forest Service [USFS]. 1995. Landscape Aesthetics, A Handbook for
Scenery Management. Washington, DC: U.S. Department of Agriculture, Forest Service.
U.S. Department of Agriculture Forest Service [USFS]. 2000. Water and the Forest Service, United States
Department of Agriculture, Washington Office, FS-660. January.
U.S. Department of Agriculture Forest Service [USFS]. 2001. Draft Environmental Impact Report for
Forest Plan Revision, Sierra Nevada. Vallejo, CA: Pacific Southwest Region.
U.S. Department of Agriculture Forest Service [USFS]. 2008. “The U.S. Forest Service An Overview”
Washington D.C.
U.S. Department of Agriculture Forest Service [USFS]. 2009. Best Management Practices Monitoring
Report. Vallejo, CA: Pacific Southwest Region.
U.S. Department of Agriculture Forest Service [USFS]. 2009. Motorized Travel Management Final
Environmental Impact Statement, R5-MB-198; Inyo National Forest. United States Department
of Agriculture, August.
U.S. Department of Agriculture Forest Service [USFS]. 2009. Motorized Travel Management Final
Environmental Impact Statement, Sequoia National Forest. United States Department of
Agriculture, October.
U.S. Department of Agriculture Forest Service [USFS]. 2010. Motorized Travel Management Final
Environmental Impact Statement, R5-MB-211; Sierra National Forest. United States Department
of Agriculture, March.
U.S. Department of Agriculture Forest Service [USFS]. 2010a. Connecting People with America’s Great
Outdoors, A Framework for Sustainable Recreation. Washington, DC: U.S. Department of
Agriculture, Forest Service.
U.S. Department of Agriculture Forest Service [USFS]. 2011a. National Report on Sustainable Forests-
2010.
U.S. Department of Agriculture Forest Service [USFS]. 2011d. From the Forest to the Faucet: Drinking
Water and Forests in the US – Methods Paper, Washington DC. United States Department of
Agriculture, October.
U.S. Department of Agriculture Forest Service [USFS]. 2011e. Watershed Condition Framework, FS-977
A Framework for Assessing and Tracking Changes to Watershed Condition; Washington DC.
United States Department of Agriculture, May.
U.S. Department of Agriculture Forest Service [USFS]. 2012a. USDA Policy and Procedures Review and
Recommendations: Indian Sacred Sites. Washington, DC: U.S. Department of Agriculture, Forest
Service.
194
U.S. Department of Agriculture Forest Service [USFS]. 2012b. National Forest Statement of Receipts
(ASR-13-2) for Fiscal Year 2011.
U.S. Department of Agriculture Forest Service [USFS]. 2012c. Giant Sequoia National Monument: Final
Environmental Impact Statement. Vallejo, CA: U.S. Dept. of Agriculture, Forest Service, Pacific
Southwest Region.
U.S. Department of Agriculture Forest Service [USFS]. 2013. Best Management Practices Monitoring
Report. Vallejo, CA: Pacific Southwest Region.
U.S. Department of Agriculture Forest Service [USFS]. 2013. Ecological Restoration Implementation
Plan. Vallejo, CA: U.S. Dept. of Agriculture, Forest Service, Pacific Southwest Region.
U.S. Department of Agriculture, Forest Service [USFS]. 2011b. Water Quality Management Handbook.
R5 FSH 2509.22 – Chapter 10, Vallejo, CA. December. 241 p.
U.S. Department of Agriculture Office of the Chief Economist [USDA OCE]. 2012. Frequently Asked
Questions – Effects of Climate Variability and Change on Forest Ecosystems.
U.S. Department of Labor. 2012. Bureau of Labor Statistics, Quarterly Census of Employment and
Wages. Washington, D.C.
University of Florida Institute of Food Agricultural Sciences Extension [UF IFAS Extension]. 2007.
Watershed Management Frequently Asked Questions. (13 May 2013).
US Department of Agriculture Forest Service Inyo National Forest [USFS-INF]. 2009. 3.2 Transportation
and Facilities. Draft Environmental Impact Statement. Volume I. Motorized Travel Management.
January.
US Department of Agriculture Forest Service Sierra National Forest [USFS-SNF]. 2009. 3.2
Transportation and Facilities. Draft Environmental Impact Statement. Volume I. Motorized Travel
Management R5-MB-211. March.
US Department of Agriculture Forest Service Tahoe National Forest [USFS-TNF]. 2010. 3.8
Transportation and Facilities. Supplemental Draft Environmental Impact Statement. Volume I.
Motorized Travel Management. February.
US Department of Agriculture Forest Service 2004. Sierra Nevada forest plan amendment: final
supplemental environmental impact statement. Vallejo, California. US Forest Service, Pacific
Southwest Region.
US Department of Agriculture Forest Service Forest Service [USFS]. 2012e. FY 06-12 planning and
budget spreadsheet. Region 5 Program Development, Budget and Accountability 2012.
US Department of Agriculture Forest Service Forest Service [USFS]. 2012f. Future of America's Forests
and Rangelands. U.S. Department of Agriculture, Forest Service, Washington, DC.
US Department of Agriculture Forest Service [USFS] 2013 Water Quality Protection on National Forests
in the Pacific Southwest Region: Best Management Practices Evaluation Program, 2008-2010
February 22, 2013.
195
US Department of Interior, Fish and Wildlife Service [USFWS] 2011. A Status Review of the Mountain
Yellow-legged Frog. Report to the Fish and Game Commission, State of California Natural
Resources Agency, Department of Fish and Game. November 18, 2011.
US Department of Interior, Fish and Wildlife Service [USFWS] 2013. “Endangered and Threatened
Wildlife and Plants: Endangered Status for the Sierra Nevada Yellow-Legged Frog and the
Northern Distinct Population Segment of the Mountain Yellow-Legged Frog, and Threatened
Status for the Yosemite Toad” (Proposed Rule). Federal Register 78:80 (April 25, 2013) pp.
24471-24514. Available from: the Government Printing Office [www.gpo.gov]; Accessed:
9/24/13.
US Department of Interior National Park Service [NPS]. 2013. A natural resource condition assessment
for Sequoia and Kings Canyon National Parks. Natural Resource Report NPS/SEKI/NRR—
2013/XXX. Eds. Sydoriak, C.A., J.A. Panek, J.J. Battles, and K.R. Nydick. National Park
Service, Visalia, CA.
Vaillant, N.; Noonan-Wright, E.; Dailey, S. and others. 2013. Effectiveness and longevity of fuel
treatments in coniferous forests across California. Final Report, Project ID: 09-1-01-1 to Joint
Fire Science Program.
Van de Water, K.M.; North, M. 2011. Stand structure, fuel loads, and fire behavior in riparian and upland
forests, Sierra Nevada Mountains, USA; a comparison of current and reconstructed conditions.
Forest Ecology and Management 262: 215-228.
Van de Water, K.M.; Safford, H.D. 2011. A summary of fire frequency estimates for California vegetation
before Euro-American settlement. Fire Ecology, 7(3), 26-58
Van Mantgem, P.J.; Stephenson, N.L. 2007. Apparent climatically induced increase of tree mortality rates
in a temperate forest. Ecology Letters, 10(10), 909-916.
Van Mantgem, P.J.; Stephenson, N.L.; Byrne, J.C. and others. 2009. Widespread increase of tree mortality
rates in the western United States. Science, 323(5913), 521-524.
Van Wagtendonk, J. W. (1985). Fire suppression effects on fuels and succession in short-fire-interval
wilderness ecosystems. USDA Forest Service general technical report INT-Intermountain Forest
and Range Experiment Station.
Van Wagtendonk, J.W.; Fites-Kaufman, J.A. 2006. Sierra Nevada bio-region. In: Fire in California’s
ecosystems. Berkeley, CA: University of California Press. P. 264-294.
Vankat, J.L. 1977. Fire and man in Sequoia National Park. Annals of the Association of American
Geographers 67: 17-27.
Verner, J.; McKelvey, K.S.; Noon, B.R. and others, technical coordinators. 1992. The California spotted
owl: a technical assessment of its current status. Gen. Tech. Rep. PSW-GTR-133. Albany, CA:
Pacific Southwest Research Station, Forest Service, US Department of Agriculture, 285.
Viegas, D. X. 2006. Parametric study of an eruptive fire behavior model. International Journal of
Wildland Fire, 15(2), 169-177.
196
Viegas DX, Pita LP .2004. Fire spread in canyons. International Journal of Wildland Fire 13, 253–
274.Viers, J.H.; Rheinheimer, D.E. 2011. Freshwater conservation options for a changing climate
in California’s Sierra Nevada. Marine and Freshwater Research. 62: 266–278.
Viers, J.H.; Rheinheimer, D.H. 2011. Freshwater conservation options for a changing climate California’s
Sierra Nevada. Marine and Freshwater Research 62:266-278.
Viers, J. H., Purdy, S. E., Peek, R. A., Fryjoff-Hung, A., Santos, N. R., Katz, J. V. and Yarnell, S. M. 2013.
Montane Meadows in the Sierra Nevada: changing hydroclimatic conditions and concepts for
vulnerability assessment. UC Davis, Center for Watershed Sciences. Watershed Sciences
Technical Report, prepared for National Fish and Wildlife Foundation.
Vredenburg, V.T., R. Bingham, R. Knapp, J. A. T. Morgan, C. Moritz, and D. Wake. 2007. Concordant
molecular and phenotypic data delineate new taxonomy and conservation priorities for the
endangered mountain yellow-legged frog. Journal of Zoology 271 (2007) 361–374.
Vredenburg V.T., Knapp R.A., Tunstall T.S., Briggs C.J. 2010. Dynamics of an emerging disease drive
large-scale amphibian population extinctions. Proc Natl Acad Sci U S A 107:9689–9694.
Waichler, W. S., Miller, R. F., and Doescher, P. S. (2001). Community characteristics of old-growth
western juniper woodlands. Journal of Range Management, 518-527.
Walker, B.; Salt, D. 2006. Resilience thinking: Sustaining ecosystems and people in a changing world.
Washington: Island Press.
Walker, B.; Salt, D. 2006. Resilience thinking: Sustaining ecosystems and people in a changing world.
Washington: Island Press. 174 p.
Walker, P.; Fortmann, L. 2003. Whose landscape? A political ecology of the ‘exurban’ Sierra. Cultural
Geographies. 10(4): 469-491.
Ward, T. A., K. W. Tate, and E. R. Atwill. 2003. A cross-sectional survey of California’s grazed rangeland
riparian areas. Proceedings of the Riparian Habitat and Floodplain Conference; 12–14 March
2001; Sacramento, CA, USA. Sacramento, CA, USA: California Riparian Habitat Joint Venture.
p. 479–583.
Weaver, W. E. D. K. H. a. J. H. P. 1995. Magnitude and causes of gully erosion in the lower Redwood
Creek basin, northwestern California. Pages I1-I21, in: Nolan, K.M., H.M. Kelsey, and D.C.
Marron, eds., Geomorphic processes and aquatic habitat in the Redwood Creek basin,
northwestern California . U.S. Geological Survey Professional Paper 1454. Washington, DC. 26
pp. [1.89Mb].
Webb, B. W., and Walling, D. E. 1996. Long-term variability in the thermal impact of river impoundment
and regulation. Applied Geography, 16(3), 211-223.
Webster, K.M.; Halpern, C.B. 2010. Long-term vegetation responses to reintroduction and repeated use of
fire in mixed-conifer forests of the Sierra Nevada. Ecosphere, 1(5), art9.
Wiens, J.A.; Hayward, G.D.; Hugh, D.; Giffen, C. 2012. Historical environmental variation in
conservation and natural resource management. Wiley-Blackwell.
197
Weiss, S.B. 2006. Impacts of Nitrogen Deposition on California Ecosystems and Biodiversity. California
Energy Commission, PIER Energy-Related Environmental Research. CEC-500-2005-165.
Weiss Penzias, P.; Jaffe, D.A.; Swartzendruber, P. and others. 2006. Observations of Asian air pollution in
the free troposphere at Mount Bachelor Observatory during the spring of 2004. Journal of
Geophysical Research: Atmospheres (1984–2012), 111(D10).
Weixelman, D. A., and D. J. Cooper. 2009. Assessing Proper Functioning Condition for Fen Areas in the
Sierra Nevada and Southern Cascade Ranges in California, A User Guide. General Technical
Report R5-TP-028. USDA, Forest Service, Pacific Southwest Region, Vallejo, CA.
Weixelman, D. A. and S. E. Gross. 2013. (in review) Plant functional types in relation to disturbance and
hydrology in mountain meadows, Sierra Nevada and Southern Cascade ranges, CA.
Weixelman, D. A., B. Hill, D.J. Cooper, E.L. Berlow, and others. 2011. A Field Key to Meadow
Hydrogeomorphic Types for the Sierra Nevada and Southern Cascade Ranges in California. Gen.
Tech. Rep. R5-TP-034. Vallejo, CA. U.S. Department of Agriculture, Forest Service, Pacific
Southwest Region, 34 pp.
Wertzel W.I.; Lacher, D.; Swezey, S. and others. 2012. Analysis reveals potential rangeland impacts if
Williamson Act eliminated. California Agriculture. 66(4) pp. 131-136. October-December.
West, N. E. (1984). Successional patterns and productivity potentials of pinyon-juniper ecosystems. p.
1301-1332 In: Developing Strategies for Rangeland Management. National Research
Counci1/National Academy of Sciences. Westview Press, Boulder, CO.
Westerling, A.L.; Bryant, B.P. 2008. Climate change and wildfire in California. Climatic Change, 87(1),
231-249.
Westerling, A.L.; Bryant, B.P.; Preisler, H.K. and others. 2011. Climate change and growth scenarios for
California wildfire. Climatic change, 109(1), 445-463.
Westerling, A.L.; Hidalgo, H.G.; Cayan, D.R.; Swetnam, T.W.. 2006. Warming and earlier spring
increases. Science, 313(5789), 940-943.
Western Governors Association Biomass Taskforce. 2006. Clean and Diversified Energy Initiative.
Wiedinmyer, C.; Hurteau, M.D. 2010. Prescribed fire as a means of reducing forest carbon emissions in
the western United States. Environmental science & technology, 44(6), 1926-1932.
Wiens, J.A.; Hayward, G.D.; Hugh, D.; Giffen, C. 2012. Historical environmental variation in
conservation and natural resource management. Wiley-Blackwell.
Wildland Fire Leadership Council [WFLC]. 2013. National Cohesive Wildland Fire Management
Strategy. in response to requirements of the Federal Land Assistance, Management, and
Enhancement (FLAME) Act of 2009. 44p.
Winter, P. 2013. Personal conversation on volunteers in the bio-region. U.S. Department of Agriculture
Forest Service Pacific Southwest Research Station Research Social Scientist. April 23.
198
Winter, P.L.; Long, J.W.; Charnley, S. 2013c. Social/Economic/Cultural Components (Preface). Chapter
9.0 in Long, Jonathan W.; Quinn-Davidson, Lenya, and Skinner, Carl N., tech. editors. Science
Synthesis to support Forest Plan Revision in the Sierra Nevada and Southern Cascades. Draft
Final Report. Albany, CA: U.S. Department of Agriculture, Forest Service, Pacific Southwest
Research Station. 504 p.
Winter, P.L.; Long, J.W.; Lake, F.K. 2013a. Sociocultural Perspectives on Threats, Risks, and Health.
Chapter 9.3 in Long, Jonathan W.; Quinn-Davidson, Lenya, and Skinner, Carl N., tech. editors.
Science Synthesis to support Forest Plan Revision in the Sierra Nevada and Southern Cascades.
Draft Final Report. Albany, CA: U.S. Department of Agriculture, Forest Service, Pacific
Southwest Research Station. 504 p.
Winter, P.L.; Long, J.W.; Lake, F.K. 2013b. Broader Context for Social, Economic, and Cultural. Chapter
9.1 in Long, Jonathan W.; Quinn-Davidson, Lenya, and Skinner, Carl N., tech. editors. Science
Synthesis to support Forest Plan Revision in the Sierra Nevada and Southern Cascades. Draft
Final Report. Albany, CA: U.S. Department of Agriculture, Forest Service, Pacific Southwest
Research Station. 504 p.
Wittmann, M. E., Chandra, S., Reuter, J. E., Caires, A., Schladow, S. G., and Denton, M. 2012.
Harvesting an invasive bivalve in a large natural lake: species recovery and impacts on native
benthic macroinvertebrate community structure in Lake Tahoe, USA. Aquatic Conservation:
Marine and Freshwater Ecosystems, 22(5), 588-597.
Woolfenden, W. B. 1996. Quarternary Vegetation History. Pages 47-70 Sierra Nevada Ecosystem Project:
final report to congress. Volume II: Assessment of scientific basis for management options.
University of California, Davis, Centers for Water and Wildlands Resources, Davis, CA.
Yang, D.S.; Conroy, C.J.; Moritz, C. 2011. Contrasting responses of Peromyscus mice of Yosemite
National Park to recent climate change. Global Change Biology, 17(8), 2559-2566.
Yarnell, S.M., J.H. Viers, and J.F. Mount. 2010. Ecology and management of the spring snowmelt
recession. BioScience 60:114-127.
Yoder, J.; Blatner, K. 2004. Incentives and timing of prescribed fire for wildfire risk management. Journal
of Forestry. 102(6): 38-41.
York, R.A.; Stephenson, N.L.; Meyer, M. and others. 2013. Giant Sequoia. Appendix 11 in: National Park
Service. 2013. A natural resource condition assessment for Sequoia and Kings Canyon National
Parks. Natural Resource Report NPS/SEKI/NRR—2013. Eds. Sydoriak, C.A., J.A. Panek, J.J.
Battles, and K.R. Nydick. Visalia, CA: National Park Service, Sequoia and Kings Canyon
National Park.
Young, M.K., 1994. Movement and characteristics of streamborne coarse woody debris in adjacent
burned and undisturbed watersheds in Wyoming. Can. J. For. Res. 24, 1933–1938.
Zedler, J. 2003. Wetlands at your service: reducing impacts of agriculture at the watershed scale. Frontiers
in Ecology and Environment. 1(2): 65–72.
199
Zielinski, B. 2013. The Forest Carnivores: Fisher and Marten. Chapter 7.1 in Long, Jonathan W.; Quinn-
Davidson, Lenya, and Skinner, Carl N., tech. editors. Science Synthesis to Promote Resilience of
Social-Ecological Systems in the Sierra Nevada and Southern Cascades. Draft Final Report.
Albany, CA: U.S. Department of Agriculture, Forest Service, Pacific Southwest Research Station.
Ziemer, R. 1986. Water Yields from Forests: An Agnostic View presented at the California Watershed
Management Conference, November 18-20 1986 West Sacramento, CA. 5 p.
Zipperer, W. 2002. Urban influences on forests. In: Macie, E.A.; Hermansen, L.A., eds. Human influences
on forest ecosystems: the southern wildland urban interface assessment. Gen. Tech. Rep. GTR-
SRS-55. Asheville, NC: U.S. Department of Agriculture, Forest Service, Southern Research
Station: 73–91.
Zybach, B.; Dubrasich, M.; Brenner, G. and others. 2009 U.S. Wildfire Cost-Plus-Loss Economics
Project: The "One-Pager" Checklist. Wildland Fire Lessons Learned Center. Fall.
200
HELPFUL LINKS
US Forest Service Pacific Southwest Region Plan Revision website
http://www.fs.usda.gov/main/r5/landmanagement/planning
USFS Plan Revision website
http://www.fs.usda.gov/planningrule
Sierra Cascades Dialog
www.fs.usda.gov/goto/r5/SierraCascadesDialog
Our Forest Place
http://ourforestplace.ning.com/
The Living Assessment
http://livingassessment.wikispaces.com/
PSW Science Synthesis
http://www.fs.fed.us/psw/publications/reports/psw_sciencesynthesis2013/index.shtml
History page for Sierra Nevada Forest Planning
http://livingassessment.wikispaces.com/Brief+History+of+Sierra+Nevada+Forest+Planning
USFS Pacific Southwest Region Ecological Restoration
http://www.fs.usda.gov/detail/r5/landmanagement/?cid=STELPRDB5308848
Forest Service Road Accomplishment Reports
http://www.wildlandscpr.org/2006-and-2007-road-accomplishment-reports-rars
Forest Service Travel Management
http://www.fs.usda.gov/main/r5/recreation/travelmanagement

201
NON-DISCRIMINATION STATEMENT
Non-Discrimination Policy
The U.S. Department of Agriculture (USDA) prohibits discrimination against its customers, employees,
and applicants for employment on the bases of race, color, national origin, age, disability, sex, gender
identity, religion, reprisal, and where applicable, political beliefs, marital status, familial or parental
status, sexual orientation, or all or part of an individual's income is derived from any public assistance
program, or protected genetic information in employment or in any program or activity conducted or
funded by the Department. (Not all prohibited bases will apply to all programs and/or employment
activities.)
To File an Employment Complaint
If you wish to file an employment complaint, you must contact your agency's EEO Counselor (PDF)
within 45 days of the date of the alleged discriminatory act, event, or in the case of a personnel action.
Additional information can be found online at http://www.ascr.usda.gov/complaint_filing_file.html.
To File a Program Complaint
If you wish to file a Civil Rights program complaint of discrimination, complete the USDA Program
Discrimination Complaint Form (PDF), found online at
http://www.ascr.usda.gov/complaint_filing_cust.html, or at any USDA office, or call (866) 632-9992 to
request the form. You may also write a letter containing all of the information requested in the form. Send
your completed complaint form or letter to us by mail at U.S. Department of Agriculture, Director, Office
of Adjudication, 1400 Independence Avenue, S.W., Washington, D.C. 20250-9410, by fax (202) 690-7442
or email at [email protected].
Persons with Disabilities
Individuals who are deaf, hard of hearing or have speech disabilities and you wish to file either an EEO or
program complaint please contact USDA through the Federal Relay Service at (800) 877-8339 or (800)
845-6136 (in Spanish).
Persons with disabilities, who wish to file a program complaint, please see information above on how to
contact us by mail directly or by email. If you require alternative means of communication for program
information (e.g., Braille, large print, audiotape, etc.) please contact USDA's TARGET Center at (202)
720-2600 (voice and TDD).
All Other Inquiries
For any other information not pertaining to civil rights, please refer to the listing of the USDA Agencies
and Offices for specific agency information.
Document Number: R5-MB-268