final revised supplementary info-msm paper for srep …/na2 is not released 25.7 – 38.7 19.4 –...
TRANSCRIPT

1
AMarkovState-basedQuantitativeKineticModelofSodiumRelease
fromtheDopamineTransporter
AsgharM.Razavi1,GeorgeKhelashvili1,HarelWeinstein1,2*
1Department of Physiology and Biophysics, Weill Cornell Medical College of Cornell University, New York, NY, 10065, USA. 2Institute for Computational Biomedicine, Weill Medical College of Cornell University, New York, NY 10065, USA. *Corresponding author: (email: [email protected])
SupplementaryInformation
Figure S1. Intracellular gate opening during the equilibration phase. As the PIP2
mediated interactionof theN-terminus (R51here) and IL4 (R443) is established,
the network of interactions at the intracellular gate (R60–D436, Y335–E428, and
R445–E428)isdestabilized.
2
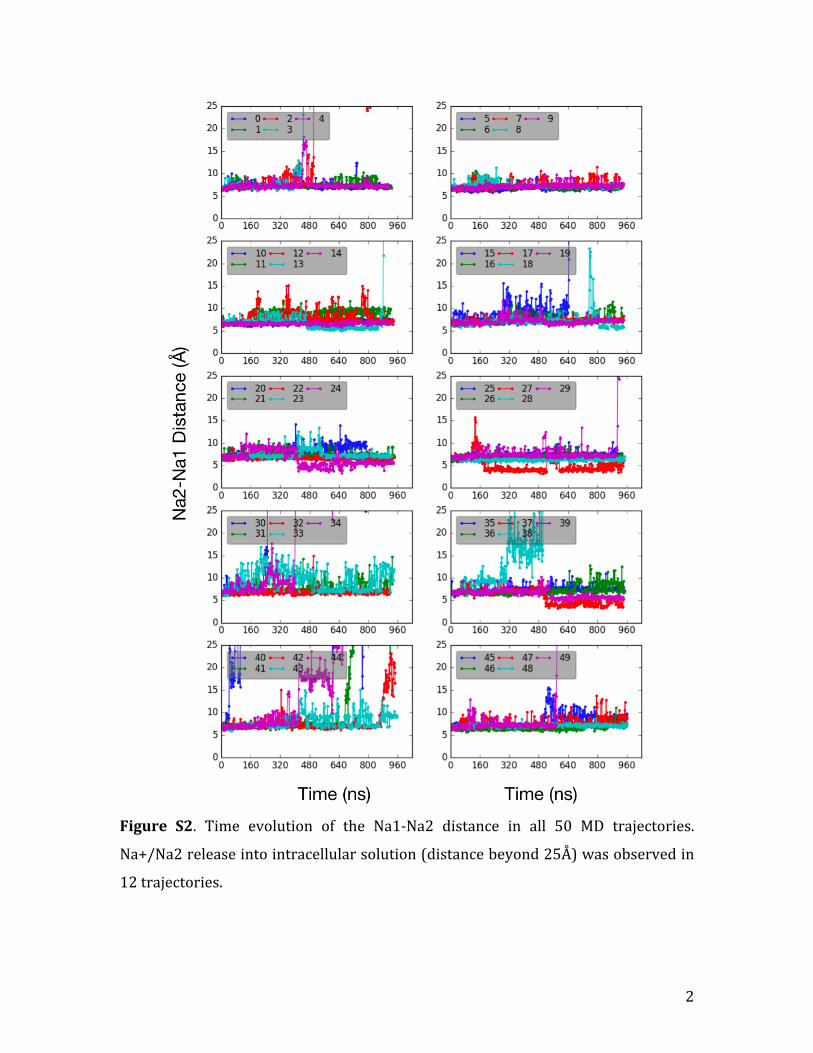
Figure S2. Time evolution of the Na1-Na2 distance in all 50 MD trajectories.
Na+/Na2releaseintointracellularsolution(distancebeyond25Å)wasobservedin
12trajectories.
3
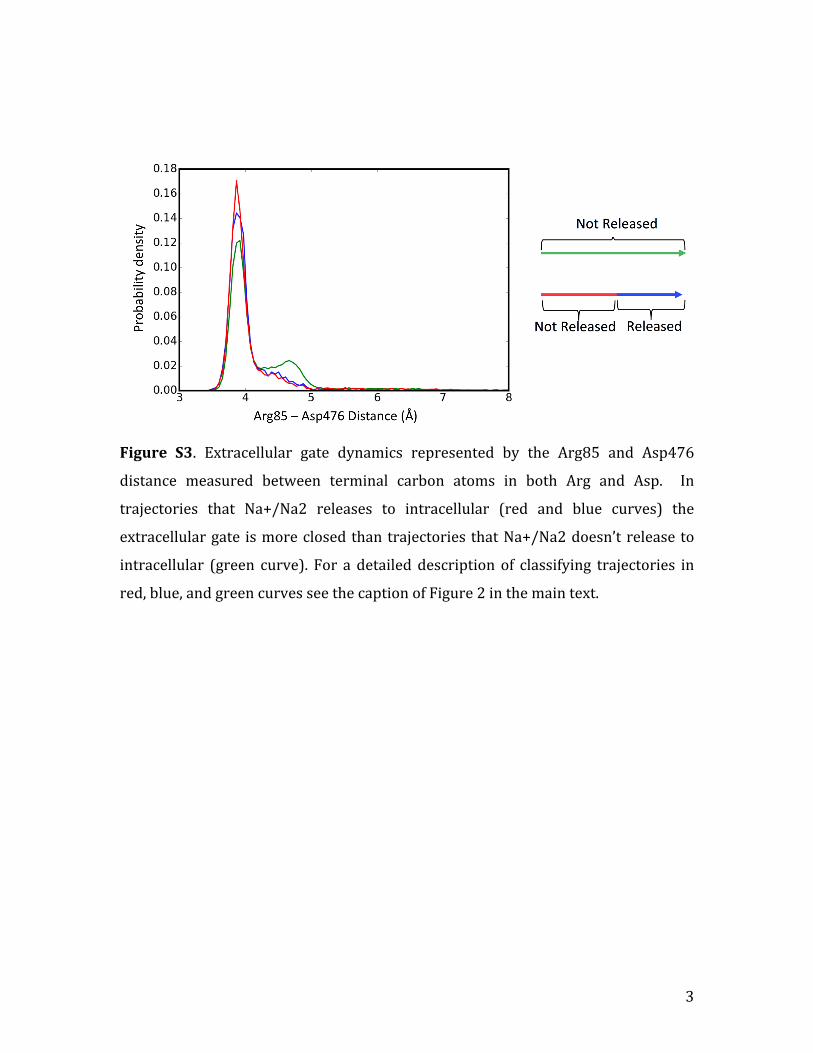
Figure S3. Extracellular gate dynamics represented by the Arg85 and Asp476
distance measured between terminal carbon atoms in both Arg and Asp. In
trajectories that Na+/Na2 releases to intracellular (red and blue curves) the
extracellulargate ismoreclosedthantrajectories thatNa+/Na2doesn’treleaseto
intracellular (green curve). For a detailed description of classifying trajectories in
red,blue,andgreencurvesseethecaptionofFigure2inthemaintext.
4
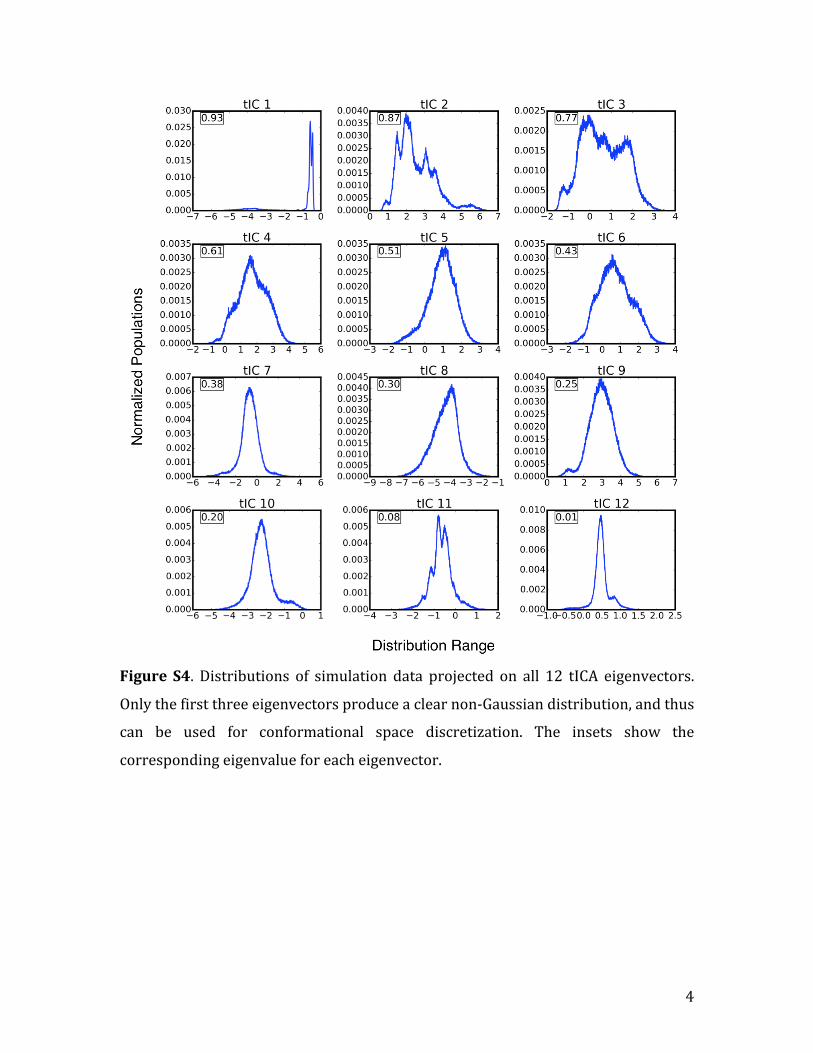
FigureS4. Distributions of simulation data projected on all 12 tICA eigenvectors.
Onlythefirstthreeeigenvectorsproduceaclearnon-Gaussiandistribution,andthus
can be used for conformational space discretization. The insets show the
correspondingeigenvalueforeacheigenvector.

5
Figure S5. Contribution of tICA parameters to the first two eigenvectors.
Parameters reflectingNa+motion contributemore to tIC 1; parameters reflecting
waterpenetrationhavehighercontributionsintIC2.
6
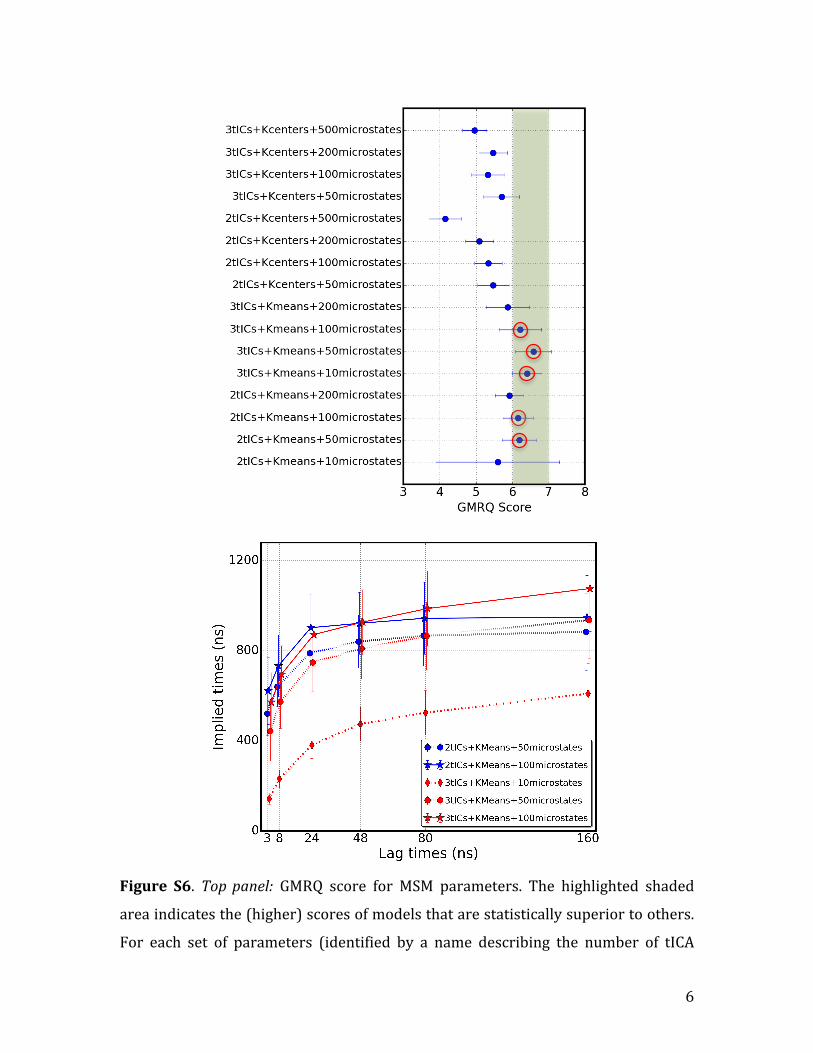
Figure S6. Toppanel: GMRQ score for MSM parameters. The highlighted shaded
areaindicatesthe(higher)scoresofmodelsthatarestatisticallysuperiortoothers.
For each set of parameters (identified by a name describing the number of tICA
7
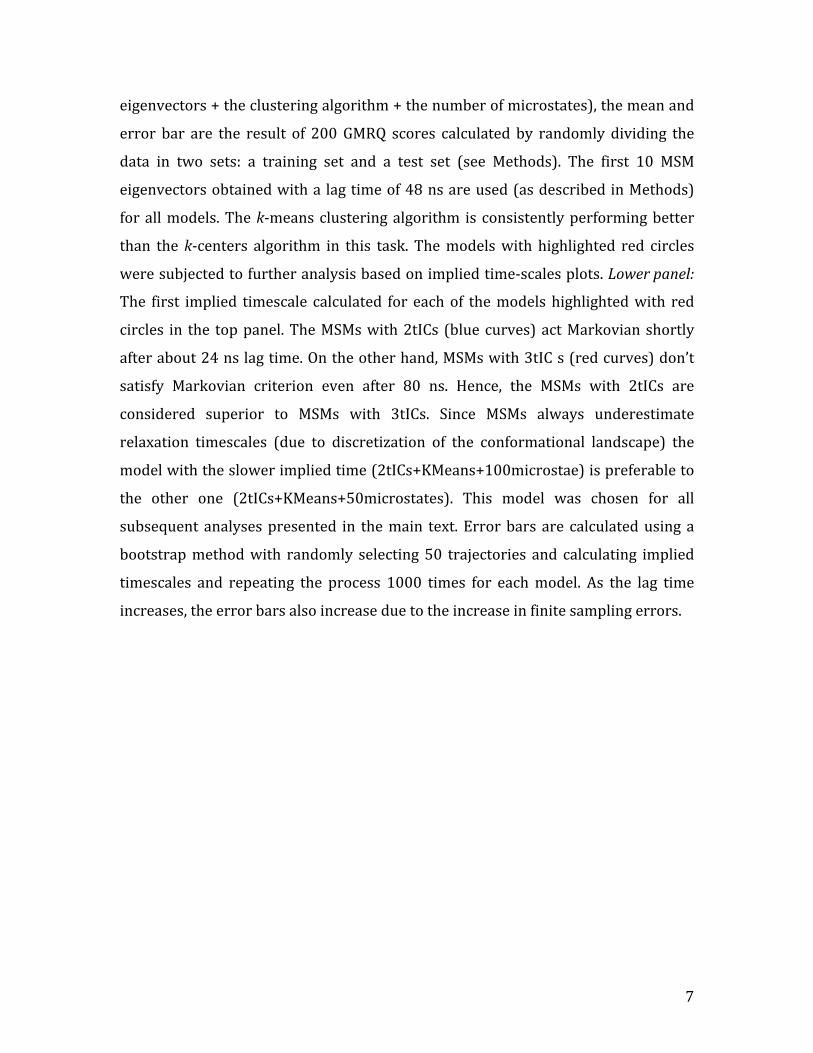
eigenvectors+theclusteringalgorithm+thenumberofmicrostates),themeanand
error bar are the result of 200GMRQ scores calculated by randomly dividing the
data in two sets: a training set and a test set (see Methods). The first 10 MSM
eigenvectorsobtainedwitha lagtimeof48nsareused(asdescribedinMethods)
forallmodels.Thek-meansclusteringalgorithm is consistentlyperformingbetter
than thek-centers algorithm in this task. Themodelswith highlighted red circles
weresubjectedtofurtheranalysisbasedonimpliedtime-scalesplots.Lowerpanel:
The first implied timescale calculated for eachof themodelshighlightedwith red
circles in the toppanel.TheMSMswith2tICs (bluecurves)actMarkovianshortly
afterabout24nslagtime.Ontheotherhand,MSMswith3tICs(redcurves)don’t
satisfy Markovian criterion even after 80 ns. Hence, the MSMs with 2tICs are
considered superior to MSMs with 3tICs. Since MSMs always underestimate
relaxation timescales (due to discretization of the conformational landscape) the
modelwiththeslowerimpliedtime(2tICs+KMeans+100microstae)ispreferableto
the other one (2tICs+KMeans+50microstates). This model was chosen for all
subsequent analysespresented in themain text.Errorbars are calculatedusinga
bootstrapmethodwith randomly selecting50 trajectories and calculating implied
timescales and repeating the process 1000 times for eachmodel. As the lag time
increases,theerrorbarsalsoincreaseduetotheincreaseinfinitesamplingerrors.

8
FigureS7.TimeevolutionofthetrajectorieswhereNa+/Na2isreleasedatdifferent
times (trajectory lengths).For each release time to the intracellular environment,
(shownasinsert),thecoloreddotsindicatethetimeevolution(frombluetored)for
thetrajectoriesthatreleasedatthattime,mappedonthefirsttwotICAcoordinates
(cf.Fig8inmaintext).

9
FigureS8.IdentificationoftheMSMrelaxationmodefortheintermediatestate.Thetotal contribution of each eigenvector to the intermediate state is shown as both
absolute ( ) and normalized ( ) values; vi are the eigenvectors
correspondingtointermediatestatemicrostates.
abs(vi )i∑ abs(vi )
vall∑i
∑

10
FigureS9.Markov StateModel eigenvectors and corresponding relaxationmodesontICAlandscapes(cf.Figure6inmaintext).Coloredcirclesidentifythecenterofthe microstate into which the trajectory snapshots are clustered. Red and bluecolorsrepresentnegativeandpositiveeigenvectors,respectively,andthesizeofthe

11
circles isproportional toeigenvectorsvalue.The relaxation timesarealso shown.TheMSM8theigenvectorcontributesmosttotheintermediatestate.
FigureS10.Thepopulationweighted2DhistogramofR445–E428distanceagainst
tIC1.TheovalhighlightstheintermediatestateandlinesshowR445–E428distance
rangeinÅ.

12
Figure S11. PIP2 mediated N-terminus interactions with IL2. R60 from the N-
terminusisinteractingwithK264fromIL2(orangecartoon)throughaPIP2lipid(in
magenta).OtherLysresiduesfromIL2(K257andK260)areinteractingwithPIP2as
well. These interactions result in partial unfolding of IL2. Na+/Na2 is interacting
withE428.ColorcodeisthesameasinFigure1A.
13
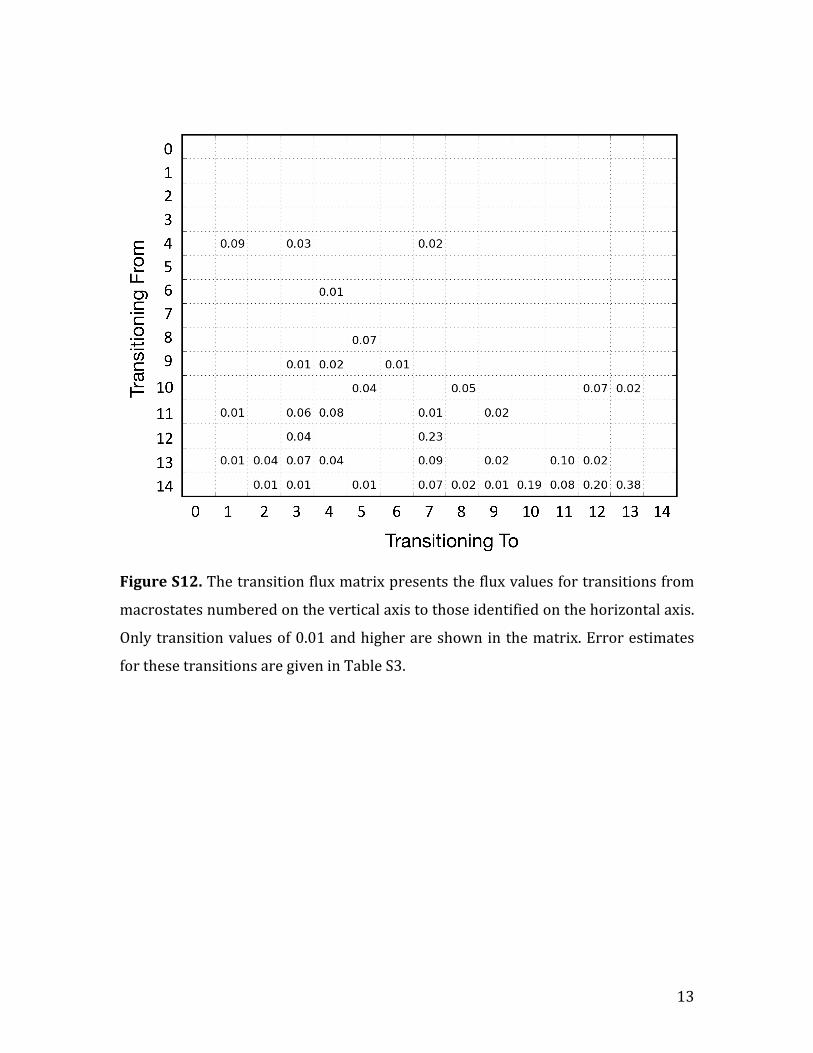
FigureS12.Thetransitionfluxmatrixpresentsthefluxvaluesfortransitionsfrom
macrostatesnumberedontheverticalaxistothoseidentifiedonthehorizontalaxis.
Onlytransitionvaluesof0.01andhigherareshowninthematrix.Errorestimates
forthesetransitionsaregiveninTableS3.

14
Table S1. Correlation values for water coordination number of Na+/Na2 and
distance betweenNa+/Na2 and sodium at Na1 site. The correlation numbers are
calculatedbyconsideringallframesuptothetimewhenNa+/Na2isreleasedtothe
intracellularenvironment.
Trajectory number
Absolute Na+/Na2 release time (ns)
Correlation between Na2–Na1 distance and water coordination number of Na+/Na2
2 504 0.76 3 448 0.70 13 886 0.56 15 646 0.38 29 913 0.41 30 252 0.74 34 406 0.60 38 504 0.75 40 80 0.78 41 721 0.50 44 633 0.62 49 580 0.44
Average correlation for the 12 trajectories: 0.60
Table S2. Confidence levels (at 68% and 95%) for water distribution in the
extracellularcavity,obtainedbyassumingnormaldistributions.
Trajectories 68 percent confidence interval
95 percent confidence interval
Na+/Na2isNot Released 25.7 – 38.7 19.4 – 45.0
Na+/Na2isReleased
before the release 22.9 – 35.2 17.0 – 41.2 after the release 23.5 – 35.0 17.9 – 40.6
15
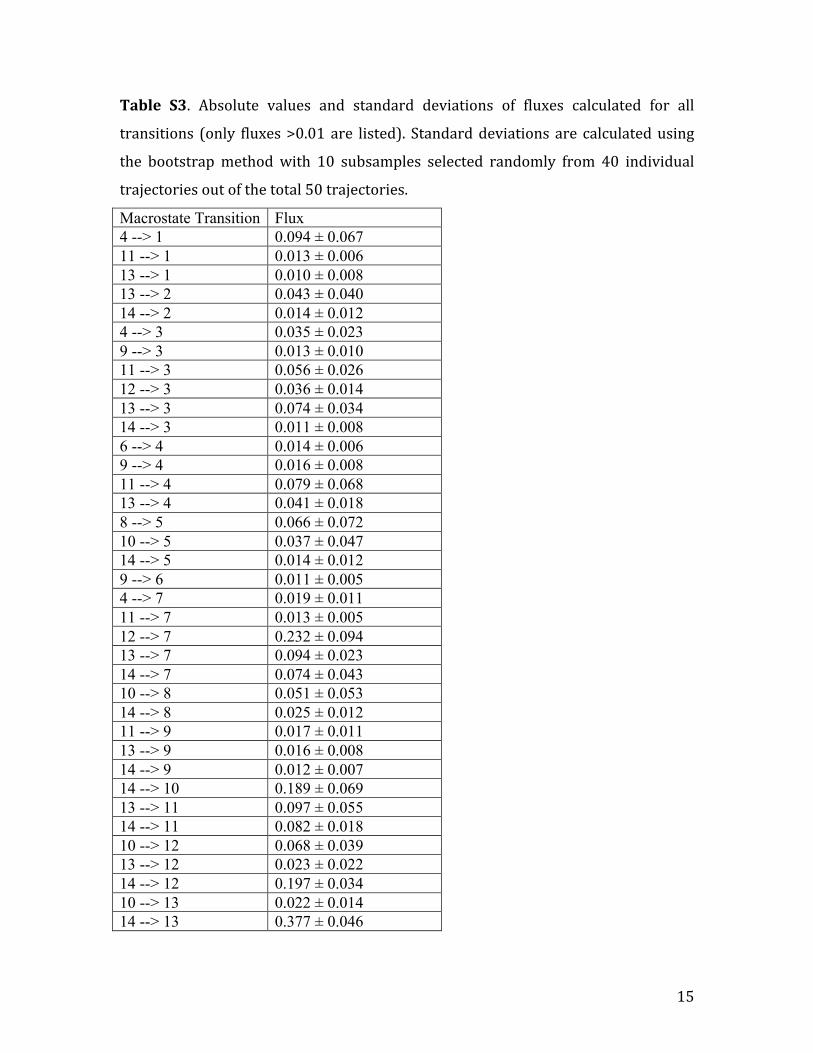
Table S3. Absolute values and standard deviations of fluxes calculated for all
transitions (only fluxes>0.01are listed). Standarddeviations are calculatedusing
the bootstrapmethodwith 10 subsamples selected randomly from 40 individual
trajectoriesoutofthetotal50trajectories.
Macrostate Transition Flux 4 --> 1 0.094 ± 0.067 11 --> 1 0.013 ± 0.006 13 --> 1 0.010 ± 0.008 13 --> 2 0.043 ± 0.040 14 --> 2 0.014 ± 0.012 4 --> 3 0.035 ± 0.023 9 --> 3 0.013 ± 0.010 11 --> 3 0.056 ± 0.026 12 --> 3 0.036 ± 0.014 13 --> 3 0.074 ± 0.034 14 --> 3 0.011 ± 0.008 6 --> 4 0.014 ± 0.006 9 --> 4 0.016 ± 0.008 11 --> 4 0.079 ± 0.068 13 --> 4 0.041 ± 0.018 8 --> 5 0.066 ± 0.072 10 --> 5 0.037 ± 0.047 14 --> 5 0.014 ± 0.012 9 --> 6 0.011 ± 0.005 4 --> 7 0.019 ± 0.011 11 --> 7 0.013 ± 0.005 12 --> 7 0.232 ± 0.094 13 --> 7 0.094 ± 0.023 14 --> 7 0.074 ± 0.043 10 --> 8 0.051 ± 0.053 14 --> 8 0.025 ± 0.012 11 --> 9 0.017 ± 0.011 13 --> 9 0.016 ± 0.008 14 --> 9 0.012 ± 0.007 14 --> 10 0.189 ± 0.069 13 --> 11 0.097 ± 0.055 14 --> 11 0.082 ± 0.018 10 --> 12 0.068 ± 0.039 13 --> 12 0.023 ± 0.022 14 --> 12 0.197 ± 0.034 10 --> 13 0.022 ± 0.014 14 --> 13 0.377 ± 0.046

16
TableS4.MSM-predictedsodiumreleasepathwaysandfluxes.
Pathway NormalizedFlux AccumulatedFlux
[14127] 0.20 0.20
[14137] 0.10 0.30
[14131141] 0.08 0.38
[147] 0.07 0.45
[14133] 0.07 0.52
[14113] 0.06 0.58
[141085] 0.05 0.63