final report / vol.2 future gsmp developmentopen_jicareport.jica.go.jp/pdf/11868668_03.pdf · 4...
TRANSCRIPT

APPENDICES

The Study for Development of the Greater Surabaya Metropolitan Ports in the Republic of Indonesia Appendix
A1-1
Appendix 1. Tables and Supportive Information regarding IEE
Appendix 1.1 Baseline Information on Tg. Bulupandan
1) Environmental and Social Baseline Data
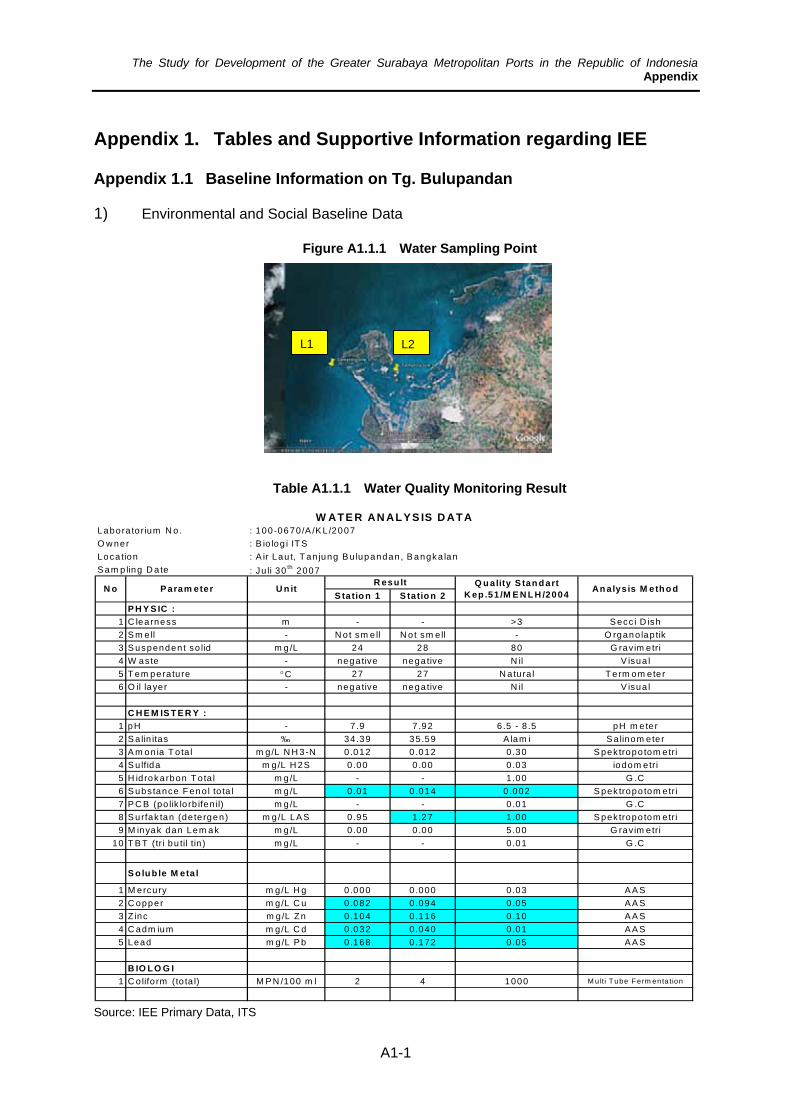
Figure A1.1.1 Water Sampling Point
Table A1.1.1 Water Quality Monitoring Result
Source: IEE Primary Data, ITS
Labora to rium N o. : 100 -0670/A /K L/2007O w ner : B io log i IT SLoca tion : A ir Lau t, T an jung B u lupandan, B angka lanS am p ling D a te : Ju li 30 th 2007
S ta tio n 1 S tatio n 2P H Y S IC :
1 C learness m - - >3 S ecc i D ish2 S m e ll - N o t sm e ll N o t sm e ll - O rgano lap tik3 S uspendent so lid m g /L 24 28 80 G ravim etri4 W aste - negative negative N il V isua l5 T em pera tu re °C 27 27 N atura l T e rm om eter6 O il layer - negative negative N il V isua l
C H E M IS T E R Y :1 pH - 7 .9 7 .92 6 .5 - 8 .5 pH m e ter2 S a lin itas ‰ 34 .39 35.59 A lam i S a linom eter3 A m on ia T o ta l m g/L N H 3-N 0.012 0 .012 0.30 S pek tropo tom etri4 S u lfida m g/L H 2S 0.00 0 .00 0 .03 iodom etri5 H id rokarbon T o ta l m g /L - - 1 .00 G .C6 S ubs tance F eno l to ta l m g /L 0 .01 0 .014 0 .002 S pek tropo tom etri7 P C B (po lik lo rb ifen il) m g /L - - 0 .01 G .C8 S urfak tan (de te rgen) m g/L LA S 0.95 1 .27 1 .00 S pek tropo tom etri9 M inyak dan Lem ak m g/L 0 .00 0 .00 5 .00 G ravim etri
10 T B T (tri bu til tin ) m g /L - - 0 .01 G .C
S o lu b le M eta l
1 M ercury m g/L H g 0.000 0 .000 0.03 A A S2 C opper m g/L C u 0.082 0 .094 0.05 A A S3 Z inc m g/L Z n 0.104 0 .116 0.10 A A S4 C adm ium m g/L C d 0.032 0 .040 0.01 A A S5 Lead m g/L P b 0.168 0 .172 0.05 A A S
B IO L O G I1 C olifo rm (to ta l) M P N /100 m l 2 4 1000 M ulti T ube F erm en ta tion
Q u ality S tan d art K ep .51 /M E N L H /2004 An alys is M eth o d
W AT E R AN ALY S IS D ATA
R esu ltN o P aram eter U n it
L1 L2

The Study for Development of the Greater Surabaya Metropolitan Ports in the Republic of Indonesia Appendix
A1-2
Table A1.1.2 Original and Associated Species of Mangroves Identified in Tg. Bulupandan
No. Species Indonesian Name Family Note Amount 1 Rhizopora mucronata Bakau, tanjang lanang Rhizoporaceae Original Mangrove **** 2 Rhizopora apiculata Bakau Rhizoporaceae Original Mangrove *** 3 Rhizopora stylosa Bakau Rhizoporaceae Original Mangrove * 4 Avicennia marina Api-api Avicenniaceae Original Mangrove ** 5 Sonneratia caseolaris Bogem Sonneratiaceae Original Mangrove **** 6 Sonneratia alba Bogem Sonneratiaceae Original Mangrove * 7 Aegiceras corniculatum Teruntun, kacangan Myrsinaceae Original Mangrove ** 8 Xylocarpus moluccensis Nyirih, banang-banang Meliaceae Original Mangrove *** 9 Exoecaria agallocha Madengan, buta-buta Euphorbiaceae Original Mangrove *** 10 Lumnitzera racemosa Truntun, kedukduk Combretaceae Original Mangrove *** 11 Ceriops tagal Tengah, mentigi Rhizoporaceae Original Mangrove *** 12 Ceriops decandra Tingi, tengar Rhizoporaceae Original Mangrove * 13 Nypa fruticans Nipah Palmae Original Mangrove * 14 Pemphis acidula Setigi Lythraceae Original Mangrove *** 15 Thespesia populnea Waru laut, waru-lot Malvaceae Associated Mangrove ** 16 Sesuvium portulacastrum Alur Alzoaceae Associated Mangrove **** 17 Spinifex littoreus Rumput tikusan Poaceae Associated Mangrove **** 18 Clerodendrum inerme Nyamplung Guttiferae Associated Mangrove **
Note: ****: With abundance, ***: above average, **: average, * below average Source: IEE Primary Data, ITS
Table A1.1.3 Mangrove Species for Land Plantation Identified in Tg. Bulupandan
No. Species Indonesian Name Family Note 1 Sesbania grandiflora Turi Fabaceae **** 2 Morinda citrifolia Mengkudu Rubiaceae * 3 Lantana camara Kembang telekan Verbenaceae ** 4 Leucaena glauca Lamtoro Fabaceae *** 5 Pluchea indica Beluntas Asteraceae **** 6 Cynodon dactylon Rumput grinting Poaceae **** 7 Pogonatherum paniceum Rumput merak Poaceae **** 8 Themeda gigantea Rumput gajah Poaceae *** 9 Paspalum commersonii Rumput tuton Poaceae ****
Note: ****: With extreme abundance, ***: above average, **: average, * below average Source: IEE Primary Data, ITS
Table A1.1.4 Birds Identified in Tg. Bulupandan
No. Species Indonesian Name Family Note
1 Tringa hypoleucos Trinil pantai Scolopacidae 2 Charadrius javanicus Cerek jawa Charadriidae ** NT / *** 3 Egretta garzetta Kuntul kecil Ardeidae * / ** LC 4 Acrocephalus stentoreus Kerakbasi ramai Acrocephalidae ** LC 5 Zosterops palpebrosus Kacamata biasa Zosteropidae 6 Gerygone sulphurea Remetuk laut Pardalotidae ** LC 7 Collocalia esculenta Walet sapi Apodidae ** LC

The Study for Development of the Greater Surabaya Metropolitan Ports in the Republic of Indonesia Appendix
A1-3
No. Species Indonesian Name Family Note
8 Nectarinia jugularis Burung madu sriganti Nectarinidae * 9 Streptopelia chinensis Tekukur biasa Columbidae
10 Pycnonotus goiavier Merbah cerukcuk Pycnonotidae 11 Pycnonotus aurigaster Cucak kutilang Pycnonotidae 12 Butorides striatus Kokokan laut Ardeidae ** LC 13 Todirhampus chloris Cekakak sungai Alcedinidae * 14 Alcedo coerulescens Raja udang biru Alcedinidae * / ** LC / *** 15 Corvus macrorhynchos Gagak kampung Corvidae ** LC 16 Merops sp Kirik-kirik Meropidae 17 Geopelia striata Perkutut Columbidae ** LC 18 Rhipidura javanica Kipasan belang Rhipiduridae * 19 Lonchura punctulata Bondol peking Passeridae 20 Artamus leucorhynchus Kekep babi Corvidae ** LC 21 Dicaeum trochileum Cabai jawa Nectarinidae * / ** LC / *** 22 Lalage sp Kapasan Campephagidae 23 Ardea purpurea Cangak merak Ardeidae ** LC 24 Sterna albifrons Dara laut kecil Sternidae * 25 Chlidomas hybridus Dara laut kumis Sternidae * 26 Hirundo tahitica Layang-layang batu Hirundinidae 27 Bubulcus ibis Kuntul kerbau Ardeidae * / ** LC 28 Prinia sp Prenjak Cisticolidae 29 Orthotomus sp Cinenen Cisticolidae
Note: * Protected based on PP RI No. 7 Year 1999 ** Status Based on IUCN Red List
LC: (Least Concern) if there are plenty of it and are well distributed on natural world NT :(Near Threatened) if it is feared to become threatened on the future
*** Bird species with limited distribution and on the brink of extinction (Birdlife International – Indonesia Programme data)
Source: IEE Primary Data, ITS
Table A1.1.5 Water quality criteria based on Diversities Index of Phytoplankton (Carter and Hill, 1981)
Location No. Species Family
L1 L2 1 Fragillariopsis sp.1 Bacillariaceae 3 9 2 Fragillariopsis sp.2 Bacillariaceae 9 6 3 Ceratium fusus Ceratiaceae 12 4 Ceratium furca Ceratiaceae 3 6 5 Ceratium trichoceros Ceratiaceae 33 6 6 Ceratium tripos Ceratiaceae 3 7 Bacteriastrum comosum Chaetocerotaceae 18 8 Chaetoceros mitra Chaetocerotaceae 6 3 9 Chaetoceros curvisetus Chaetocerotaceae 57 12 10 Chaetoceros pseudocurvisetus Chaetocerotaceae 36 45 11 Chaetoceros sp Chaetocerotaceae 9 36 12 Coscinodiscus centralis Coscinodiscaceae 24 13 Coscinodiscus radiatus Coscinodiscaceae 45 33 14 Coscinodiscus sp Coscinodiscaceae 57 36 15 Cyclotella sp Coscinodiscaceae 33 3 16 Dinophysis sp Dinophysiaceae 6

The Study for Development of the Greater Surabaya Metropolitan Ports in the Republic of Indonesia Appendix
A1-4
Location No. Species Family
L1 L2 17 Denticula sp Epithemiaceae 24 24 18 Odontella sp Eupodiscaceae 9 99 19 Melosira sp Melosiraceae 30 20 Pseudo-nitzschia sp.1 Naviculaceae 6 21 Pseudo-nitzschia sp.2 Naviculaceae 48 22 Navicula sp.1 Naviculaceae 18 23 Navicula sp.2 Naviculaceae 60 24 Navicula sp.3 Naviculaceae 21 25 Pleurosigma sp.1 Naviculaceae 6 3 26 Pleurosigma sp.2 Naviculaceae 6 27 Pleurosigma sp.3 Naviculaceae 18 28 Navicula directa Naviculaceae 6 3 29 Noctiluca sp Noctilucaceae 12 6 30 Peridinium sp Peridiniaceae 9 12 31 Dithylium sp Raphidiniaceae 15 32 Rhizosolenia pungens Rhizosoleniaceae 9 33 Rhizosolenia sp.1 Rhizosoleniaceae 18 34 Rhizosolenia imbricata Rhizosoleniaceae 24 35 Rhizosolenia sp.2 Rhizosoleniaceae 33 72 36 Guinardia sp Rhizosoleniaceae 15 6 37 Rhizosolenia sp.3 Rhizosoleniaceae 9 38 Stellarima sp Stellarimaceae 6 39 Thalassionema bacillare Thalassionemataceae 15 6 40 Thalassionema nitzschioides Thalassionemataceae 21 6 41 Lioloma sp Thalassionemataceae 9 42 Thalassiosira sp Thalassiosiraceae 3 43 Skeletonema sp.1 Thalassiosiraceae 30 6 44 Skeletonema sp.2 Thalassiosiraceae 3 45 Ulothrix sp Ulothricasceae 12 3 46 Ulothrix zonata Ulothricasceae 6 12 47 Binucleira tatrana Ulothricasceae 24
Total 801 546 Diversities Index 3.42 2.91
Source: IEE Primary Data, ITS
Table A1.1.6 Diversities Index of Phytoplankton (Carter and Hill, 1981)
Diversities Index Water Qualities Phytoplankton Zooplankton
Very good > 2.0 > 2.0 Good 1.6 - 2.0 1.6 - 2.0 Normal 1.0 - 1.6 1.4 - 1.6 Bad 0.7 - 1.0 1.0 - 1.4 Very Bad < 0.7 < 1.0

The Study for Development of the Greater Surabaya Metropolitan Ports in the Republic of Indonesia Appendix
A1-5
Table A1.1.7 Water quality criteria based on Diversities Index of Zooplankton (Carter and Hill, 1981)
Location No. Species Family
L1 L2 1 Acartia sp Calanidae 18 102 2 Echinocamptus sp Centrocamptidae 18 3 Tintinnopsis sp Codonellidae 3 6 4 Diaptomus sp Diaptomidae 69 75 5 Globigerina sp Foraminifera 15 6 Peneropolis sp Foraminifera 3 9 7 Oithona sp Oithonidae 36 8 Ethmolaimus sp Rhabditidae 9 9 Diaphanosoma sp Sididae 6
10 Larva Nauplii Copepoda 15 3 11 Larva Zoea Copepoda 6 12 Larva Polychaeta 1 9 13 Larva Polychaeta 2 3
Total 150 255 Diversities Index 1.76 1.55
Source: IEE Primary Data, ITS
Table A1.1.8 Diversities Index of Zooplankton (Carter and Hill, 1981)
Diversities Index Water Qualities Phytoplankton Zooplankton
Very good > 2.0 > 2.0 Good 1.6 - 2.0 1.6 - 2.0 Normal 1.0 - 1.6 1.4 - 1.6 Bad 0.7 - 1.0 1.0 - 1.4 Very Bad < 0.7 < 1.0
Table A1.1.9 Water quality criteria based on Diversities Index of makrozoo benthos (Carter and Hill, 1981)
Location No. Species Family
L1 L2 1 Acrosterigma subrugosa Cardiidae 2 2 Cerithium sp Cerithiidae 130 3 Clibanarius sp Coenobitidae 2 4 Donax sp Donacidae 2 5 Drupella sp Muricidae 4 6 Nassarius albescens Nassariidae 2 7 Natica onca Naticidae 2 8 Nereis sp Nereididae 3 9 Oliva sp Olividae 2
10 Nerita undata Ostreidae 2 11 Eteone sp Phyllodocidae 18 12 Telescopium telescopium Potamididae 6 13 Cerithidea cingulata Potamididae 27 14 Terebralia sulcata Potamididae 114

The Study for Development of the Greater Surabaya Metropolitan Ports in the Republic of Indonesia Appendix
A1-6
Location No. Species Family
L1 L2 15 Pyramidella sp Pyramidellidae 2 16 Strombus urceus Strombidae 2 17 Holthuisana sp Sundathelphusidae 3 18 Tellina sp Tellinidae 2 19 Uca vocans Trochidae 3 12 20 Uca pugilator Trochidae 6 21 Crassostrea sp Trochidae 6 22 Turitella terebra Turitellidae 3 2 23 Paphia undulata Veneriidae 2 24 Gafrarium divaricatum Veneriidae 2
Total 63 310 Diversities Index 1.52 1.63
Source: IEE Primary Data, ITS
Table A1.1.10 Diversities Level Criteria (Canter & Hill, 1981)
Diversities Index Variation level
> 2.0 Very high 2.0 - 1.6 High 1.5 - 1.0 Average 0,7 - 1.0 Low
< 0,7 Very Low
Table A1.1.11 Water pollution level criteria based on benthos diversities index (Lee, Wang, and Kuo, 1978)
Water Qualities Diversities Index Unpolluted > 2.0 Lightly polluted 1.6 - 2.0 Polluted 1.0 - 6.0 Very polluted < 1.0
Table A1.1.12 Population and Population Density
Area (km2) Population Households Density per ha Klampis sub-distrcit 67.1 50,416 16,467 7.51
Ko’ol village 1.65 1,877 683 4.1 Tolbuk village 1.33 1,383 461 3.5 Klampis Barat 0.13 3,240 1,016 78
Source: Bangkalan/Klampis in figure (2006)
Table A1.1.13 Population by Age Group of Klampis Sub-District
Age Group Population Percentage < 5 years old 3,684 7
5 - 14 years old 9,613 19 15 - 44 years old 2,1649 43 45 - 64 years old 11,947 24 > 65 years old 3,523 7
Total 50, 416 100 Source: Klampis in figure (2006)

The Study for Development of the Greater Surabaya Metropolitan Ports in the Republic of Indonesia Appendix
A1-7
Table A1.1.14 Age Distribution of the Survey Respondents
Group of Age Number of People Precentage (%)
15 - 20 7 11 21 - 30 10 16 31 - 40 14 23 41 - 50 15 24 51 - 70 16 26 Total 62 100
Source: IEE Primary data, Field Survey, July, 2007
Table A1.1.15 Land Use Pattern (Ha)
Agriculture
Fish Pond Residential land
Others Total
Ko’ol village 74.8 (45%) 50.8 (30%) 38.4 (23%) 1.6(2%) 165.3(100%) Tolbuk village 75.8(57%) 24.9(19%) 12.5(10%) 19.7(13%) 132.9(100%)
Tobadung village 95.2(63%) 13.1(9%) 41.7(27%) 0.3(1%) 149.8(100%) Klampis village 1(8%) - 11 (84%) 1(8%) 13.0 (100%)
Source: Klampis in figure (2006)
Table A1.1.16 Income Sources of Respondents
Types of employment Number Percentages ( % ) Farming 27 43 Fishery 21 33 Trading 5 8 Transportation 1 1.5 Secretary Work 1 1.5
Unemployed 7 11 Total 62 100
Source: IEE Primary Data, Field survey, July 2007
Table A1.1.17 Major Cultivated Crops in Socah Sub-District
Type of crops Harvested
Area ( Ha )
Production ( ton )
Productivity (100 kg/Ha)
Paddy 1,239 5, 551 45 Corn 7176 12, 845 18 Cassava 415 4, 571 110 Sweet potato 24 280 117 Green bean 401 241 600
Source: Bangkalan in Figures, 2006

The Study for Development of the Greater Surabaya Metropolitan Ports in the Republic of Indonesia Appendix
A1-8
Table A1.1.18 Income Level
Income (Rp.) Number of People
Precentage (%)
<0.5million 36 58 0.5million-1million 10 16 1million-2million 7 11
2million-2.5million 0 0 >2.5million 5 8
(Refuse to respond) 4 6 Total 62 100
Source: Primary data, Field Survey, July, 2007
Poverty Indicator:
Table A1.1.19 Poverty Level in Klampis sub-district
Category Number of HH
Percentage (%)
Non- privileged (Very Poor) 2,868 20 Privileged stage I (Poor) 6,097 43 Privileged stage II 4,644 33 Privileged stage III 489 3 Privileged stage III Plus 81 1
Total 14,179 100
Source: Bangkalan in figure, 2006
Poverty level can be categorized into 5 different levels based on using both economic and non-economic indicators. Non-privileged is categorized as “very poor” and Privileged stage I as “poor”. Each privileged category is defined by BKKBN (Coordinative Agency of National Family Planning) as follows;
i) Non-privileged (if failed to fulfill any one of them, he/she stays in this category): (Economic) Able to purchase minimum 2,100kcal (or two meals a day) plus other basic needs (ex. basic clothing, home with a floor); (Non-economic) regular religion practice, provision of public health to children.
ii) Privileged stage I (if failed to fulfill any one of them, he/she stays in this category): (Economic) consumption of meat/fish/eggs at least once a week, supply of new clothing every year, minimum room space of 8m2 person; (Non-economic) free from sickness for the last three months, regular income, literacy (10 –60 years old), education for children (6-15 years old).
iii) Privileged stage II (Those who can fulfill Privileged stage I, but if fail to fulfill any one of them, he/she stays in this category): (Economic and non-economic) regular income and savings; family socialization, recreation/every 6months, frequent religious practice, access to media information, use of transportation.
iv) Privileged stage III: Those who can fulfill all Privileged stage II indicators. v) Privileged stage III+: Those who can fulfill all Privileged stage II indicators plus
who can give donation and be able to participate in community socialization activities.

The Study for Development of the Greater Surabaya Metropolitan Ports in the Republic of Indonesia Appendix
A1-9
Table A1.1.20 Educational Institutes in Klampis Sub-District
Type of Schools Number of Schools
Number of Teachers
Number of Students
Elementary schools 33 139 5,944 Government middle schools 1 25 365 Private middle schools 3 34 91 High Schools - - - Madrasah Diniyah 73 373 8,450 Madrasah Ibtidaiyah (Islamic elementary schools) 2 18 244 Madrasah Tsanawiyah (MTs, Islamic middle schools) 3 18 426 Madrasah Aliyah (Islamic High schools) 1 17 157 Source: Bangkalan in Figures, 2006
Table A1.1.21 Education Level of the Survey Respondents
Educational Level Number Percentage (%) Elementary Graduate 37 60 Middle School 9 14 Islamic High School 1 2 No Educational Back ground 9 14
Source: Field survey, July, 2007
Table A1.1.22 Availability of Clean Water in the Surveyed Villages
Village Tapped Water Well Total
Tolbuk - 461 461 Ko'ol - 683 683 Klampis Barat 235 781 1,016
Source: Klampis in Figure, 2006
Table A.1.1.23 Household Energy Resources in the Sample Villages
Village Wood/Coal
Kerosene
Electricity/Gas
Tolbuk 352 70 39 Ko'ol 561 72 50 Klampis Barat 759 192 65
Source: Klampis in Figure, 2006
Table A.1.1.23 Sanitation Environment in Kalmpis Sub-district
Sewage System Number of Population Septic Tank 1,925 Goose neck 6,790
Pit 16,595 Source: Klampis in Figure, 2006

The Study for Development of the Greater Surabaya Metropolitan Ports in the Republic of Indonesia Appendix
A1-10
2) Hydrodynamic Simulation
The hydrodynamic simulation on a qualitative level was carried out based on the “with” and “without” the project scenario to analyze the current, sediment concentration, seabed etc. Current Flow: With regards to the current conditions, under “without the project” scenario, the current conditions will remain as it is, while if we take a look at the “with the project” scenario, the current interaction with the harbor structure will change the original hydraulic and sediment transportation regimes of the area. It can also be observed that the current velocity is reduced on the east side of the harbor structure when the current is moving towards the west and vice versa, when the current is moving towards the east.
Figure A1.1.2 Comparative Analysis on Current Flow (East-West Current Flow)
“Without” the Project Scenario “With” the Project Scenario
Figure A1.1.3 Comparative Analysis on Current Flow (West-East Current Flow)
“Without” the Project Scenario “With” the Project Scenario
Sedimentation: With regards to the sediment concentration, under “without the project” scenario, the current conditions will remain as it is, while if we take a look at the “with the project” scenario, the construction of harbor structure will block the transportation of the sediment towards the breakwater zone. Under East-West waver-current environment, the transportation velocity of bed sediment movements on the east side of the structure is reduced or on halt, therefore, sedimentation will occur before the structure. On the other hand, the sediment transportation to the west side of the structure will be reduced, and cause erosion. The situation is vise-versa under West- East waver-current environment; the only difference is that because

The Study for Development of the Greater Surabaya Metropolitan Ports in the Republic of Indonesia Appendix
A1-11
the current amount is larger under East-west waver-current environment, the sedimentation amount may be larger on the eastern side.
Figure A1.1.4 Comparative Analysis on Sediment Concentration (West-East Current Flow)
“Without” the Project Scenario “With” the Project Scenario Change in Sea Bed Conditions: With regards to change in sea bed, under “without the project” scenario, the current conditions will remain as it is, while if we take a look at the “with the project” scenario, the change in seabed condition may occur due to increase in sediment deposits on both side of the harbor structure as explained above.
Figure A.1.1.5 Comparative Analysis on Change in Sea Bed Condition
“Without” the Project Scenario “With” the Project Scenario
It is recommended to numerically model wave and tie induced currents and associated sediment distribution in the harbor basin and in the entrance channels. Such study would enable to quantify harbor siltation and to identify critical areas of the design, which requires further investigation.

The Study for Development of the Greater Surabaya Metropolitan Ports in the Republic of Indonesia Appendix
A1-12
3) Summary of Mitigation Measures
Environmental Items and Potential Impacts Proposed Mitigation Location Time Frame
Permits Required environmental assessment
Full- scale EIA is required at feasibility study stage.
Physical Environmental Impacts on Hydrodynamic environment (Dredging and Reclamation) Change in current flow/
sediment transportation/ sea bed
• Dredging shall be controlled and limited to area required.
• Adopting good dredging practices by selecting the right equipment (ex. TSDH) and right dredging, loading and placement methods.
• Reclaimed land area should be carefully examined based on the result of the hydrodynamic modeling study to minimize the impacts on hydrology.
• Comprehensive monitoring required in relation to hydrodynamic affects
Dredging and reclamation sites
During Construction/ Post Construction
Impacts from deep-sea disposal
• Disposal of dredged materials should be put in place to prevent distribution of suspended solids in the waters outside of disposal sites.
• Contents of spoiled materials should be analyzed regularly before dumping to make sure they do contain toxic components.
• Conduct sampling and seawater quality analysis in the dumping area.
Off-shore disposal site
During construction/operation
Impacts on reclamation Reclamation material to be obtained should be analyzed to verify its conformity. In Tg. Bulupandan, the dredged materials are planned to use for reclamation purposes. In such case, sediment quality of the seabed should be analyzed.
Construction site
During construction
Deterioration of air quality • Using vehicles that have passed emission tests, spraying water on construction sites etc.
• Regular air quality monitoring to meet the required standards.
Construction site
Harbor area access road
During construction During operation
Increased noise and vibration
• Ensuring the noise emission is within the allowable level. Use of well maintained machines and plants and silencers/ mufflers for construction equipments, if required.
• Implementation of proper traffic management practices and road maintenance during transport.
Construction site Access road area
During construction During Operation
Impacts on water flow/quality Surface water runoff Accommodation of proper drainage
system on a reclaimed land Port terminal areas
During Operation
Deterioration of water quality due to increased
Adopting good dredging practices by selecting the right equipment (ex. TSDH)
Construction site in the
During construction

The Study for Development of the Greater Surabaya Metropolitan Ports in the Republic of Indonesia Appendix
A1-13
Environmental Items and Potential Impacts Proposed Mitigation Location Time Frame
SS and turbidity and right dredging, loading and placement methods.
bay area
Deterioration of water quality due to increased pollutants spreading into the sea.
• Ensure the adoption of loading/unloading, handling and storage practices.
• Each terminal will be required to have a proper waste management plan. Storage and disposal have to follow existing regulations.
Port terminal areas
During operation
Biological Environment Impacts on Terrestrial/Marine ecology Permanent loss of
mangroves Re-plantation/ remedial action is to be taken to minimize the impacts.
Surrounding the bay area
Before/post construction
Loss of other habitats Adopt best dredging practice and disposal of dredged materials by following appropriate engineering design and monitoring and feedback system to limit any possible disruption of ecological processes.
Surrounding the bay area/ offshore sea area
Before/post construction
Impacts on land use Change in land use, visual
effects The change in the land use is likely to be significant. It should be in keeping with the nature of a site to as a port activity zone to a possible extent.
Port terminal and the surrounding areas
All phases
Archaeological and Historical sites
Identification of remains and cultural assets including graves should be confirmed before construction.
Access road construction area
All phases
Impact on Resettlement
• Resettlement impact is to be minimized for port construction area. Further efforts are required to minimize the resettlement impacts for access road construction sites.
• In case resettlement takes place, proper compensation and assistance should be provided to the PAPs based on resettlement action plan prepared by the project authority.
Port construction and access road sites
Before construction
Economic activities /Labor • Loss of livelihood / income
generating activities • Local intentions including PAPs should
be incorporated into project planning. • PAPs facing economic displacement
are also entitled for compensation for their losses.
• Priorities should be given to locals for port construction related activities
• Provision of training programs for locals.
Affected land area in Klampis and fishing grounds used for fisheries
All phases
Women /Vulnerable Groups • Increased risk of chronic
diseases / loss of livelihood activities of the poor
• Provision of livelihood support programs for women/ vulnerable.
• Infectious disease prevention program for contractors.
• Provision of social awareness program for women.
Administrative area of affected villages in Klampis sub-district
All phases

The Study for Development of the Greater Surabaya Metropolitan Ports in the Republic of Indonesia Appendix
A1-14
Environmental Items and Potential Impacts Proposed Mitigation Location Time Frame
Culture and interaction/Conflict of interests • Conflicts of interests
stemming from land dispute, socio-economic reasons
• A Good co-ordination with project authorities and local community leaders.
• Utilization of local knowledge into project planning.
• Provision of land registration promotion programs
Administrative area of affected villages in Klampis sub-district
During / post construction
Equity of Benefits and losses • Increased socio-economic
disparities and regional divide
Monitoring of local socio-economic conditions
Administrative area of Klampis
During / post construction
Safety • Increased risk of maritime
insecurity due to off shore pipelines / increase traffic accident risks due to increased traffic volume
• Improved provision of maritime security and safety measures.
• Improved navigation aids to ensure safe transit inside the port including the potential risks that existing /to be constructed pipelines posses.
• Traffic safety enhancement for increased traffic.
Port and access road area / vessels navigation route
During / post construction

The Study for Development of the Greater Surabaya Metropolitan Ports in the Republic of Indonesia Appendix
A1-15
Appendix 1.2 Baseline Information on Socah
1) Environmental and Social Baseline Data on Socah area
Figure A1.2.1 Water Sampling Point
Table A1.2.1 Water Quality Monitoring Result
PARAMETER Unit 1 2
Standard
Physic Clearness m - - >3 Smell No smell No smell Suspended Solid mg/l 376 312 80 Waste positive positive nil Temperature c 26 26 Oil layer negative negative nil
Chemistry PH - 8.14 7.82 6.5-8.5 Salinity %o 21.03 20.33 Alami Ammonia mg/l 0.07 0.08 0.3 Sulfida mg/l 0 0 0.03 COD mg/l - - 1.00 Substance Phenol mg/l 0.001 0.001 0.002 PCB mg/l - - 0.01 Detergent mg/l 1.71 1.65 1.00 Mineral Oil mg/l 0.00 0.00 5.00 TBT - - 0.01
Heavy Metal mg/l Mercury mg/l 0.000 0.000 0.03 Copper mg/l 0.041 0.032 0.05 Zn mg/l 0.096 0.092 0.10 Cadmium mg/l 0.046 0.032 0.01 Lead mg/l 0.032 0.028 0.05
Biology Colifrom MPN 16 8 1000
Source: IEE Primary data, ITS, 2007
Da’irin
Junganyar

The Study for Development of the Greater Surabaya Metropolitan Ports in the Republic of Indonesia Appendix
A1-16
Table A1.2.2 Air Condition
Source: Survey and Analysis Channel, ITS (2000)
Table A1.2.3 Original and Associated Species of Mangroves Identified in Socah
No Species Indonesia Name Family note Amount 1 Avicennia alba api-api Avicenniaceae Original mangrove **** 2 Avicennia marina api-api Avicenniaceae Original mangrove *** 3 Avicennia officinalis api-api Avicenniaceae Original mangrove * 4 Ceriops decandra tingi, tengar Rhizoporaceae Original mangrove * 5 Ceriops tagal tengah, mentigi Rhizoporaceae Original mangrove *** 6 Exoecaria agallocha madengan, buta-buta Euphorbiaceae Original mangrove **** 7 Lumnitzera racemosa truntun, kedukduk Combretaceae Original mangrove *** 8 Rhizopora apiculata bakau Rhizoporaceae Original mangrove ** 9 Rhizopora mucronata bakau, tanjang lanang Rhizoporaceae Original mangrove ****
10 Sonneratia alba bogem Sonneratiaceae Original mangrove * 11 Sonneratia caseolaris bogem Sonneratiaceae Original mangrove **** 12 Acanthus ilicifolius jeruju Acanthaceae Associated mangrove **** 13 Calotropis gigantea biduri Asclepiadaceae Associated mangrove ** 14 Ipomoea pes-caprae teracak kambing Convolvulaceae Associated mangrove *** 15 Sesuvium portulacastrum alur Alzoaceae Associated mangrove *** 16 Spinifex littoreus rumput tikusan Poaceae Associated mangrove ****
Note: ****: With extreme abundance, ***: with abundance, **: average, * below average Source: IEE Primary Data, ITS
Table A1.2.4 Mangrove Species for Land Plantation Identified in Socah
No. Species Indonesian Name Family Note 1 Sesbania grandiflora Turi Fabaceae **** 2 Leucaena glauca Lamtoro Fabaceae *** 3 Pluchea indica Beluntas Asteraceae **** 4 Cynodon dactylon Rumput grinting Poaceae **** 5 Pogonatherum paniceum Rumput merak Poaceae **** 6 Themeda gigantea Rumput gajah Poaceae *** 7 Paspalum commersonii Rumput tuton Poaceae **** Note: ****: With abundance, ***: with abundance, **: average, * below average Source: IEE Primary Data, ITS

The Study for Development of the Greater Surabaya Metropolitan Ports in the Republic of Indonesia Appendix
A1-17
Table A1.2.5 Birds Identified in Tg. Bulupandan
No. Species Indonesian Name Family Note 1 Alcedo coerulescens raja udang biru Alcedinidae * / ** LC / *** 2 Butorides striatus kokokan laut Ardeidae ** LC 3 Collocalia esculenta walet sapi Apodidae ** LC 4 Dicaeum trochileum cabai jawa Nectarinidae * / ** LC / *** 5 Egretta garzetta kuntul kecil Ardeidae * / ** LC 6 Gerygone sulphurea remetuk laut Pardalotidae 7 Lalage sp kapasan Campephagidae 8 Lonchura punctulata bondol peking Passeridae 9 Passer montanus burung gereja erasia Passeridae 10 Prinia sp prenjak Cisticolidae 11 Pycnonotus aurigaster cucak kutilang Pycnonotidae 11 Pycnonotus goiavier merbah cerukcuk Pycnonotidae 12 Rhipidura javanica kipasan belang Rhipiduridae * 13 Streptopelia chinensis tekukur biasa Columbidae 14 Todirhampus chloris cekakak sungai Alcedinidae * 15 Tringa totanus trinil kaki merah Scolopacidae migran
Note: * Protected based on PP RI No. 7 Year 1999 ** Status Based on IUCN Red List
LC: (Least Concern) if there are plenty of it and are well distributed on natural world NT :(Near Threatened) if it is feared to become threatened on the future
*** Bird species with limited distribution and on the brink of extinction (Birdlife International – Indonesia Programme data)
Source: IEE Primary data, ITS
Table A1.2.6 Water quality criteria based on Diversities Index of Phytoplankton (Carter and Hill, 1981)
Location No. Species Family
Junganyar Da'iring 1 Fragillariopsis sp Bacillariaceae 7 - 2 Ceratium furca Ceratiaceae 4 3 3 Microcystis sp Chroococcaceae - 5 4 Coscinodiscus sp.1 Coscinodiscaceae 42 - 5 Coscinodiscus sp.2 Coscinodiscaceae 23 12 6 Cyclotella sp Coscinodiscaceae 10 6 7 Denticula sp Epithemiaceae - 2 8 Odontella sp Eupodiscaceae 3 9 9 Navicula sp.1 Naviculaceae 6 - 10 Navicula sp.2 Naviculaceae 3 - 11 Pleurosigma sp.1 Naviculaceae 6 5 12 Pleurosigma sp.2 Naviculaceae 2 4 13 Noctiluca sp.1 Noctilucaceae 2 - 14 Noctiluca sp.2 Noctilucaceae 1 - 15 Peridinium sp Peridiniaceae 1 2 16 Dithylium sp Raphidiniaceae 2 - 17 Rhizosolenia pungens Rhizosoleniaceae 14 - 18 Rhizosolenia sp.1 Rhizosoleniaceae 2 44 19 Rhizosolenia sp.2 Rhizosoleniaceae 1 - 20 Sphaeroplea sp Sphaeropleaceae 2 6 21 Stellarima sp Stellarimaceae - 1

The Study for Development of the Greater Surabaya Metropolitan Ports in the Republic of Indonesia Appendix
A1-18
22 Thalassionema nitzschioides Thalassionemataceae 6 2 23 Triceratium sp Triceratiaceae - 1 24 Binucleira tatrana Ulothrichaceae 4 2 25 Ulothrix sp Ulothrichaceae 4 7
Total 145 111 Diversities Index 2.46 2.17
Source: IEE Primary Data, ITS
Table A1.2.7 Diversities Index of Phytoplankton (Carter and Hill, 1981)
Diversities Index Water Qualities Phytoplankton Zooplankton
Very good > 2.0 > 2.0 Good 1.6 - 2.0 1.6 - 2.0 Normal 1.0 - 1.6 1.4 - 1.6 Bad 0.7 - 1.0 1.0 - 1.4 Very Bad < 0.7 < 1.0
Table A1.2.8 Water quality criteria based on Diversities Index of Zooplankton (Carter and Hill, 1981)
Location No. Species Family Junganyar Da'iring 1 Acartia sp Calanidae 10 - 2 Diaptomus sp Diaptomidae 4 12 3 Globigerina Foraminifera 2 8 4 Peneropolis sp Foraminifera 2 - 5 Oithona sp Oithonidae 8 2 6 Ethmolaimus sp Rhabditidae 13 7 7 Larva Nauplii Copepoda 1 -
Total 40 29 Diversities Index 1.66 1.25
Source: Primary Data, IEE by ITS
Table A1.2.9 Diversities Index of Zooplankton (Carter and Hill, 1981)
Diversities Index Water Qualities Phytoplankton Zooplankton
Very good > 2.0 > 2.0 Good 1.6 - 2.0 1.6 - 2.0 Normal 1.0 - 1.6 1.4 - 1.6 Bad 0.7 - 1.0 1.0 - 1.4 Very Bad < 0.7 < 1.0

The Study for Development of the Greater Surabaya Metropolitan Ports in the Republic of Indonesia Appendix
A1-19
Table A1.2.10 Water quality criteria based on Diversities Index of makrozoo benthos (Carter and Hill, 1981)
Location No. Species Family
Da'iring Junganyar 1 Anadara granosa Arcidae - 1 2 Cerithidea cingulata Potamididae - 35 3 Cerithidea djadjariensis Potamididae 16 32 4 Clibanarius sp Coenobitidae 3 2 5 Cymatium sp Ranellidae 1 - 6 Drupa sp Muricidae 1 - 7 Libitina rostrata Trapeziidae 1 - 8 Nassarius sp.1 Nassaridae 4 3
Source: IEE Primary Data, ITS
Table A1.2.11 Diversities Level Criteria (Canter & Hill, 1981)
Diversities Index Variation level > 2.0 Very high
2.0 - 1.6 High 1.5 - 1.0 Average 0,7 - 1.0 Low
< 0,7 Very Low
Table A1.2.12 Water pollution level criteria based on benthos diversities index (Lee, Wang, and Kuo, 1978)
Water Qualities Diversities Index Unpolluted > 2.0 Lightly polluted 1.6 - 2.0 Polluted 1.0 - 6.0 Very polluted < 1.0
Table A1.2.13 Population and Population Density
Area (km2) Population No. household Density per ha
Socah sub-distrcit 53.8 55,493 12,196 10.3
Da’iring village 3.31 2,168 406 6.5
Junganyan village 0.86 2,830 592 15.3
Socah 1.15 5,208 1,266 4.6
Source: Bangkalan in figure (2006)
Table A1.2.14 Population by Age Group of Socah Sub-District
Age Group Population Percentage < 5 years old 4 249 7.65
5 - 14 years old 11 561 20.83 15 - 44 years old 25 273 45.55 45 - 64 years old 10 251 18.47 > 65 years old 4 159 7.5
Total 55, 493 100 Source: Socah in figure (2006)

The Study for Development of the Greater Surabaya Metropolitan Ports in the Republic of Indonesia Appendix
A1-20
Table A1.2.15 Age Distribution of the Survey Respondents
Group of Age Number of People Precentage (%)
< 30 4 6.45 31 - 40 15 24.19 41 - 50 15 24.19 51 - 60 20 32.25
> 61 8 12.92 Total 62 100
Source: Primary data, Field Survey, July,2007
Table A.2.16 Land Use Pattern (Ha)
Agriculture
Fish Pond Residential land
Others Total
Da’iring village 207 (53%)
57 (14 %)
41 (11%)
83 (21%)
388 (100%)
Junganyan village 14 (17%)
- (0%)
19 (22%)
53 (62%)
86 (100%)
Socah 31 (26%)
13 (12%)
68 (60%)
3 (2%)
115 (100%)
Source: Klampis in figure (2006)
Table A1.2.17 Income Sources of Respondents
Types of employment Number Percentages ( % ) Farming & Fisheries 35 56 Private Sector 12 20
Unemployed / secondary job
11 18
Refuse to respond 4 6 Total 62 100
Source: IEE Primary Data, ITS
Table A1.2.18 Major Cultivated Crops in Socah Sub-District
Type of crops Harvested
Area ( Ha )
Production ( ton )
Productivity (100 kg/Ha)
Paddy 2,918 12,652 43 Corn 1,630 3, 056 19 Cassava 159 1, 895 120
Source: Bangkalan in Figures, 2006
Table A1.2.19 Income Level
Income (Rp.) Number of
People Percentage (%)
1million-2million 29 47 2million-2.5million 0 0 2.5million-5million 28 45 5million-10million 5 8
Total 62 100 Source: IEE Primary data, Field Survey, July,2007

The Study for Development of the Greater Surabaya Metropolitan Ports in the Republic of Indonesia Appendix
A1-21
Table A1.2.20 Poverty Level in Socah sub-district
Category Number of HH Percentage (%) Non- privileged (Very Poor) 1, 959 15 Privileged stage I (Poor) 5, 285 40 Privileged stage II 2, 050 15 Privileged stage III 3, 676 28 Privileged stage III Plus 3 2
Total 12,973 100 Source: Bangkalan in figure, 2006
Table A1.2.21 Educational Institutes in Klampis Sub-District
Types of Schools Number of Schools
Number of Teachers
Number of Students
Elementary schools 42 301 6754 Government middle schools 1 30 308 Private middle schools 1 12 68 High Schools - - - Madrasah Diniyah 45 399 6979 Madrasah Ibtidaiyah (Islamic elementary schools)
2 26 221
Madrasah Tsanawiyah (MTs, Islamic middle schools)
5 80 486
Madrasah Aliyah (Islamic High schools)
1 19 70
Source: Bangkalan in Figures, 2006
Table A1.2.22 Education Level of the Survey Respondents
Educational Level Number Percentage (%) Elementary Graduate 31 50 Middle School 15 24 High School 10 16 University Graduate 6 10 Total 62 100 Source: IEE Field survey, July, 2007

The Study for Development of the Greater Surabaya Metropolitan Ports in the Republic of Indonesia Appendix
A1-22
2) Hydrodynamic Simulation
The hydrodynamic simulation on a qualitative level was carried out based on the “with” and “without” the project scenario to analyze the current, sediment concentration, seabed etc.
In the project planning, at first three alternative designs were considered to assess their impacts.
• Existing Condition (without the project) • Option 1: Pier (length: 3km) with trestles; • Option 2: Reclamation up to 0 m seawater level area plus pier construction (length:
3km); • Option 3: Dredging (water depth: 14m) plus land reclamation using the existing land
area.
Figure A1.2.2 Three Design Alternatives at Socah area
Since no specific construction methods or activities or sites are specified, input conditions for the simulation was confined to parameters such as sediment contents, limits on high tide/low tide, river stream and its estuary etc., to carry out qualitative analysis on change of flow of current, sediment concentration, seabed etc.
Current /Sedimentation/Sea bed: The table is the result of the comparative analyses on the change in current condition for the four (including with out the project option) alternative layouts. • “Without” the project option: No action alternative is the situation where no development
activity is implemented, therefore, the current will continue to flow both from the north and the south.
• Option 1: The current flows into the planned port location will be reduced in amount compared to the existing condition because the trestles to be constructed will interrupt the current flow. On the other hand, current that flow around the sailing route will increase because the port will reduce the width of the bay, enabling the current velocity on the sailing route to increase. However, because the trestles do not completely block current movement and allows the current to move from gaps in between the trestles.
Pier + Trestel Type Pier plus Land reclamation Type
Excavation and reclamation Type
Option 1 Option 2 Option 3

The Study for Development of the Greater Surabaya Metropolitan Ports in the Republic of Indonesia Appendix
A1-23
• Option 2: the simulation result is somehow similar with the option 1 result, but in option 2, the current speed on the sailing route experience greater increase than option 1. This condition brings advantage on the sailing route, however, it slows down the sedimentation, because the reclamation creates a distraction on the shore, and as a result, there will be sedimentation on the on one side of the structure and erosion on the other side (depending on the direction of current movement). In addition, river end in the south of the port encounters may carry sediment into the sea basin.
• Option 3: An excavation decreases the base elevation around the future port. Such decreased elevation causes a gradient change on the river end along the harbor basin and increases the current speed from the river end towards the harbor basin. This increase in current also creates an increase in sediment transportation from the river end towards the harbor basin. Reclamation work will also bring changes to the current flow and increase sediment on one side of the structure and decrease on the other.
Figure A1.2.3 Comparative Analysis on Change in Current Flow
Without the project Snenario Option 1
Option 2 Option 3
(South Current created by simulation on t = 649 hours)

The Study for Development of the Greater Surabaya Metropolitan Ports in the Republic of Indonesia Appendix
A1-24
Figure A1.2.4 Comparative Analysis on Change in Current Flow
Existing Option 1
Option 2 Option 3
(North Current created by simulation on t = 649 hours)
Figure A1.2.5 Comparative Analysis on Change in Sedimentation Concentration
Existing Option 1

The Study for Development of the Greater Surabaya Metropolitan Ports in the Republic of Indonesia Appendix
A1-25
Option 2 Option 3
Figure 1.2.6 Comparative Analysis on Change in Sea Bed Condition
Existing Option 1
Option 2 Option 3

The Study for Development of the Greater Surabaya Metropolitan Ports in the Republic of Indonesia Appendix
A1-26
3) Summary of Mitigation Measures
Environmental Items and Potential Impacts Proposed Mitigation Location Time Frame
Permits Required environmental assessment
Full- scale EIA is required at feasibility study stage.
Physical Environmental Impacts on Hydrodynamic environment (Dredging and Reclamation) • Change in water flow due
to reclamation • Reclaimed land area should be carefully
examined based on the result of the hydrodynamic modeling study to minimize the impacts on hydrology.
• Comprehensive monitoring required in relation to hydrodynamic affects
Reclamation sites
During construction /Post construction
• Impacts from deep-sea disposal
• Disposal of dredged materials should be put in place to prevent distribution of suspended solids in the waters outside of disposal sites.
• Contents of spoiled materials should be analyzed regularly before dumping to make sure they do contain toxic components.
• Conduct sampling and seawater quality analysis in the dumping area.
Off-shore disposal site
During construction/operation
Deterioration of air quality • Using vehicles that have passed emission tests, spraying water on construction sites etc.
• Regular air quality monitoring to meet the required standards.
Construction site
Harbor area/ access road
During construction During operation
Increased noise and vibration
• Ensuring the noise emission is within the allowable level. Use of well maintained machines and plants and silencers/ mufflers for construction equipments, if required.
• Implementation of proper traffic management practices and road maintenance during transport.
Construction site Access road area
During construction During operation
Impact on water • Deterioration of water
quality due to increased SS and turbidity
Adopting good dredging practices by selecting the right equipment (ex. TSDH) and right dredging, loading and placement methods.
Construction site
During construction
• Deterioration of water quality due to increased pollutants spreading into the sea.
• Ensure the adoption of loading/unloading, handling and storage practices.
• Each terminal will be required to have a proper waste management plan. Storage and disposal have to follow existing regulations.
Port terminal areas
During operation
Biological Environment Impacts on Terrestrial/Marine ecology • Permanent loss of
mangroves Re-plantation/ remedial action is to be taken to minimize the impacts.
Along the coastline
Before/post construction
• Loss of other habitats Adopt best dredging practice and disposal Surrounding Before/post

The Study for Development of the Greater Surabaya Metropolitan Ports in the Republic of Indonesia Appendix
A1-27
Environmental Items and Potential Impacts Proposed Mitigation Location Time Frame
of dredged materials by following appropriate engineering design and monitoring and feedback system to limit any possible disruption of ecological processes.
the bay area/ offshore sea area
construction
Impacts on land use • Change in land use, visual
effects The change in the land use is likely to be significant. It should be in keeping with the nature of a site to as a port activity zone to a possible extent.
Port terminal and the surrounding areas
All phases
• Archaeological and Historical sites
Identification of remains and cultural assets including graves should be confirmed before construction.
Access road construction area
All phases
Impact on Resettlement
• Resettlement impact is to be minimized for port construction area. Further efforts are required to minimize the resettlement impacts for access road construction sites.
• In case resettlement takes place, proper compensation and assistance should be provided to the PAPs based on resettlement action plan prepared by the project authority.
Port construction and access road sites
Before construction
Economic activities /Labor • Loss of livelihood / income
generating activities • Local intentions including PAPs should
be incorporated into project planning. • PAPs facing economic displacement
are also entitled for compensation for their losses.
• Priorities should be given to locals for port construction related activities
• Provision of training programs for locals.
Affected land area at Socah and fishing grounds used for fisheries
All phases
Women /Vulnerable Groups • Increased risk of chronic
diseases / loss of livelihood activities of the poor
• Provision of livelihood support programs for women/ vulnerable.
• Infectious disease prevention program for contractors.
• Provision of social awareness program for women.
Administrative area of affected villages at Socah sub-district
All phases
Culture and interaction/Conflict of interests • Conflicts of interests
stemming from land dispute, socio-economic reasons
• A strong anti-development feeling was expressed by part of the residents due to absence of information dissemination and consultation process in the planning. Open consultations with the stakeholders are required at the early planning stage.
• A Good co-ordination with project authorities and local community leaders.
• Utilization of local knowledge into project planning.
Administrative area of affected villages at Socah sub-district
During / post construction

The Study for Development of the Greater Surabaya Metropolitan Ports in the Republic of Indonesia Appendix
A1-28
Environmental Items and Potential Impacts Proposed Mitigation Location Time Frame
• Provision of land registration promotion programs
Equity of Benefits and losses Increased socio-economic
disparities and regional divide
Monitoring of local socio-economic conditions
Administrative area of Socah
During / post construction
Safety Increased risk of maritime
insecurity due to off shore pipelines / increase traffic accident risks due to increased traffic volume
• Improved provision of maritime security and safety measures.
• Improved navigation aids to ensure safe transit inside the port including the potential risks that existing /to be constructed pipelines posses.
• Traffic safety enhancement for increased traffic.
Port and access road area / vessels navigation route
During / post construction

The Study for Development of the Greater Surabaya Metropolitan Ports in the Republic of Indonesia Appendix
A1-29
Appendix 1.3 Related Information on Social Consultation
Minutes of Meeting from the Consultation Meeting
Date) July12th, 2007 Location) Klampis sub district, Ko’ol village Meeting Place) Ko’ol village head’s residence Number of Attendants) 40 from Ko’ol and Tolbok village Outline of the meeting:
• Opening remarks was made by the official from Klampis sub district (Pak Ilyas). IEE Study team leader explained about objective and the outline of the project and the scope of IEE social survey.
• Social survey was carried out using a questionnaire form in a separate room for men and women.
Main point discussed: • (The meeting was held in a calm and tranquil atmosphere) • Most villagers expressed their support for the port construction. • Some participants expressed concern about the negative impacts on the fisheries activities and
compensation to be offered. • Respondents anticipated that the project might disturb the social solidarity in the community
Date) July12th, 2007 Location) Klampis sub district, Klampis Barat village Meeting Place) Klampis Barat village head’s residence Number of attendants) 22 from Klampis Barat village Outline of the meeting:
• Opening remarks was made by the official from Klampis sub district (Pak Ilyas). IEE Study team leader explained about objective and the outline of the project and the scope of IEE social survey.
• Social survey was carried out using a questionnaire form (all attendants were male). Main points discussed:
• Respondents asked about the project plan and its mitigation measures to be taken especially for the social impacts.
• Specific minitagory measures to be taken by the project were addressed by one of the local NGO (who is also a secretary of the village head).
• A concern was expressed was by fishermen that the project plan may disturb their net-fishing activities in /out side the bay, the construction methodology should be considered not to disturb
• It was also pointed that fishing route for the crafts may be affected due to construction activities.

The Study for Development of the Greater Surabaya Metropolitan Ports in the Republic of Indonesia Appendix
A1-30
Date) August 24th, 2007 Location) Socah sub district, Socah village Meeting Plave) Socah sub-district office Number of attendants 62) from Da’iring, Junganyar and Socah village (The original consultation meeting planned in July 2007 was suspended for over a month because of the anti-development feelings surged by some of the villagers (such as in Junganyar villagers) and for social security reasons, the meeting was putt off until the situation had settled down) Outline of the meeting:
• Opening remarks made by the official from Socah sub district (Pak Chandra) following by a speech from Bappeda Bangkalan (Pak Yoyok). IEE Study team leader explained about objective and the outline of the project and the scope of IEE social survey.
• Social survey was carried out using a questionnaire form (all attendants were male). Main points discussed:
• There was a anti-development feelings prevailing among some of the attendants, as village leader (Junganyar) and other followers (including local NGO) critically mentioned about the negative social impacts on the local people to be imposed, and that tried to persuade other attendants to reject any development planning in the area including this study.
• Most of the villagers from Junganyar village opposed to the project planning and asked a voting to be carried out.
• (After a tough session with some of the participants, the team was allowed to go on to a survey session, where individuals were given more freedom to give whatever their views are opinions were).

The Study for Development of the Greater Surabaya Metropolitan Ports in the Republic of Indonesia Appendix
A1-31
Questionnaire Form
For Socio-economic Survey I. RESPONDENT IDENTITY Name
…………………
Sex
Male / Female
Address ………………… Religion …………………
- RT / RW - Kelurahan - Kecamatan - Kabupaten Age : Last Education Level :
………………… ………………… ………………… ………………… ………………… …………………
Respondent Status: 1. Prominent Figure 2. Religion Figure 3. Lead of RT/RW 4. Member of DPRD 5. Member of BPD/LPM 6. Member of PKK 7. NGO 8. Locals 9. Others ……….
Working eminent: 1. Government
officer 2. Farmer 3. Local vendor 4. Fisherman 5. Teacher 6. Army Forced /
Policeman 7. Private 8. Others…………
I. HOUSE, YARD AND LAND OWNER STATUS
1.1. House condition: 1. Permanent 2. Non permanent 3. Semi permanent
House Broad : .................................................. Commodious of yard : ..........................................
1.2. House and land owner status:
1. Certificate of Right Own Possession / petok: yes/ no (not yet) 2. Own of relative 3. Right Property Use : Certificate yes/ no.
4. Rent house 5. Others......................
1.3. Yard owner status :
1. Certificate of Right Own Possession / petok: yes/ no (not yet) 2. Own of relative 3. Right Property Use : Certificate yes/ no. 4. Rent house 5. Others......................
II. OCCUPATION AND SALARY 2.1. Respondent occupation type: 1. Farmer, ……… 7. Government officer ............... 2. Farmer Laborer 8. Army ................ 3. Local vendor, ………. 9. Private/Labour ............... 4. Fisherman 10. Retired ............... 5. Breeder ….......... 11. Transportation Service ........... 6. Tukang, buruh bangunan ........... 12. Others ..............

The Study for Development of the Greater Surabaya Metropolitan Ports in the Republic of Indonesia Appendix
A1-32
2.2. Respondent salary per month: 1. < Rp. 500.000,- 2. between Rp. 500.000 – Rp. 1.000.000,- 3. between Rp. 1.000.000 – Rp. 2.000.000,- 4. > Rp. 2.500.000,- 2.3. Do you have other activity ? 1. yes 2. no 2.4. If “Yes”, howmuct salary per month?. 1. < Rp. 500.000,- 2. between Rp. 500.000 – Rp. 1.000.000,- 3. between Rp. 1.000.000 – Rp. 2.000.000,- 4. > Rp. 2.500.000,- 2.5. How many animal husbandry do you have? 1. Chiken .................... 2. Goat ............... 3. Cow ...................... 4. .............................. 2.6. How many vehicle do you have? 1. Bicycle ............................. 2. Motor cycle ................... 3. Car ............................... 4. ............... III. SOCIAL LIVING AND TRANQUILLITY 3.1. Social living condition
1. Peacefull 2. Sometime intruding 3. No peaceful, always intruding.
3.2. What kind of social problem does society have? ........................................................................................................................ ......................................................................................................................... 3.3. What is your action if outside labour join in the project?
1. Full accepting 2. Suspicious 3. Do not care 4. Reject with negotiation 5. Full reject.
3.4. What kind of means will you take if there is a social conflict: ……
1. Meeting and discussion with the prominent figure (RT/RW or others) 2. Jurisdiction 3. Negotiation 4. With brutal action 5. Others..........
3.5. In your opinion, who is the prominent figure? 1. Village chief 2. Village official 3. Clergyman 4.RT/RW 5. others..............
3.6. What is your perception on the social relationship in the community

The Study for Development of the Greater Surabaya Metropolitan Ports in the Republic of Indonesia Appendix
A1-33
1. good 2. harmonious 3. do not care with other 4. not harmonious
3.7. When do you socialize with the locals? :
1. Arisan 4. pengajian 2. People wish 5. regular social gathering 3. Others ........ 6. after pray
IV. PERSEPTION AND ATTITUDE OF DEVELOPMENT PLAN “Initial Environmental Evaluation (IEE) Study”
4.1. How did you obatin the information of the development plan? No. Source Yes No A Radio B Television C Magazine D Government formal information E Project information F Others citizen
4.2. After hearing the information about the project development, how is the social live condition?
a. Nothing happen b. Change with: 1. Negative reaction of society 2. Become fidgety
3. Emergence of society group 4. Create dispute
5. Others .......... 4.3. Do you agree with the development plan?
1. Agree, because……………………………………………………......... 2. Agree, but ………………………………………………………............ 3. Do not agree, because........................................................................................
4.4. What is your opinion about the benefits of the development? If any.
1. For oneself and family ................................................................................. 2. For the society ................................................................................... 3. For the government ...............................................................................
4.5. What is your hopes about the development plan? ( you can answer more then one)
1. Want to be engaged in port labour 2. Want to be engaged in labor work during construction phase 3. Development plan shall improve the socio-environmental condition 4. Development plan may develop human resource quality
5. Other, ……………………
The Study for Development of the Greater Surabaya Metropolitan Ports in the Republic of Indonesia Appendix
A1-34
4.6. Suggestion for tackling of negative perception of port development. .............................................................................
V. HEALTH of ENVIRONMENT 5.1. Type of disease which often happened in this place
1. Disease of respiration of tabletop 2. Disease of respiration of underside 3. Disease of intestine infection 4. Disease of digestive channel 5. Disease of eye 6. Disease of tuberculosis 7. Disease of skin 8. The Others . . . . . . ?
5.2. Do around location have a facility to medicinize . . . . . ?
1. Yes, there is 2. No, there isn’t
If there is, What kind of facility . . . ? 1. Posyandu 2. Public Hospital 3. Puskesmas 4. Doctor practice 5. Medication of Alternative
5.3. Where does the respondent usually go to medicine . . . . ?
1. Cured by themselves 2. In Puskesmas closest 3. Go to the doctor 4. In hospital closest 5. Medication of Alternative 6. The Others . . . ?
VI. UTILITY SERVICE AND INFRASTRUCTURE A. CLEAN WATER
6.1. What about the condition of used water here . . . . ?
1. Clear and transparent, with no smell and taste 2. Clear and transparent with smell and taste 3. Turbid with no smell 4. Turbid with smell
6.2. Source of water around respondent location for cooking and drinking
1. Water work 2. Well water 3. Hydrant / Water Pump 4. Water cistern of rain 5. Water buying
6.3. Source of Water around respondent location for bathing and washing
1. Water work 2. Well water 3. Hydrant / Water Pump 4. Water cistern of rain 5. Water buying

The Study for Development of the Greater Surabaya Metropolitan Ports in the Republic of Indonesia Appendix
A1-35
B. GARBAGE SERVICE 6.4. The way of dismissal of house garbage in this time
1. Thrown to available garbage box 2. Thrown to the available river or drain 3. Thrown and piled up 4. Burned and piled up 5. The Others . . . . ?
6.5. If the area has been served by garbage wagon, how many times garbage transported . . . ? 1. Everyday 2. Once of two days 3. Once of three days 4. Not certainly
C. DRAINAGE SERVICE
6.6. Network drainage around the houses 1. The house have never been flooded
2. There’s a network of drainage but it’s not function well because it’s closed by garbage or land
3. There’s no network of drainage but not flooded 4. Flooded, if there’s a big rain 5. The Others . . . .
D. SANITATION and DISMISSAL of WASTE
6.7. Where you defecate . . . ?
1. Water closet 2. not in water closet . . .
6.8. The way of dismissal of sanitation at home . . . 1. Using basin of septic tank 2. Thrown to public toilet 3. Thrown to the river 4. Toilet in wasteland or fishpond 5. The others . . . .
E. INFRASTRUCTURE
6.9 What kind of road network around your house ? 1. Land Road 2. Rock Road 3. Street of Paving 4. Asphalt Pavement
6.10 What kind of road to go to your house ?
1. Land Road 2. Rock Road 3. Street of Paving 4. Asphalt Pavement
6.11 Is there any electrics network at your house ?
1. Yes, there is 2. No, there is not

The Study for Development of the Greater Surabaya Metropolitan Ports in the Republic of Indonesia Appendix
A1-36
Table List of Attendants for the Consulation Meeting (Tg. Bulupandan)
1 Wasiah Ko'ol Klampis Bangkalan 20 Islam2 Mochtar Ko'ol Klampis Bangkalan 34 Islam4 Sarifah Ko'ol Barat Ko'ol Klampis Bangkalan 35 Islam5 Muria Ko'ol Tengah Ko'ol Klampis Bangkalan 45 Islam6 Suhani Ko'ol Tengah Ko'ol Klampis Bangkalan 30 Islam7 Muhammad Ko'ol Tengah Ko'ol Klampis Bangkalan 20 Islam8 Sukainah Ko'ol Tengah Ko'ol Klampis Bangkalan 19 Islam9 Wardha Ko'ol Barat Ko'ol Klampis Bangkalan 22 Islam
10 Sulaimah Ko'ol Tengah Ko'ol Klampis Bangkalan 22 Islam11 Jumriyah Ko'ol Tengah Ko'ol Klampis Bangkalan 25 Islam12 Khasinah Ko'ol Klampis Bangkalan 45 Islam13 Saoede Ko'ol Klampis Bangkalan 48 Islam14 Munise Ko'ol Tengah Ko'ol Klampis Bangkalan 45 Islam15 Khosiah Ko'ol Tengah Ko'ol Klampis Bangkalan 20 Islam16 Saleh Ko'ol Timur Ko'ol Klampis Bangkalan 55 Islam17 Syamsul Arifin Tolbu Tolbu Klampis Bangkalan 41 Islam18 H. M Naqib Ko'ol Barat Ko'ol Klampis Bangkalan 42 Islam19 Hamdan Tolbu Tolbu Klampis Bangkalan 62 Islam20 M. Rafiq Ko'ol Tengah Ko'ol Klampis Bangkalan 36 Islam21 Assam Ko'ol Barat Ko'ol Klampis Bangkalan 45 Islam22 M. Sama'in HS Ko'ol Tengah Ko'ol Klampis Bangkalan 58 Islam23 Abdul Manaf Ko'ol Tengah Ko'ol Klampis Bangkalan 57 Islam24 Supa'i Ko'ol Tengah Ko'ol Klampis Bangkalan 39 Islam25 Busri Ko'ol Timur Ko'ol Klampis Bangkalan 32 Islam26 Maadin Tolbu Tolbu Klampis Bangkalan 53 Islam27 Azis Tolbu Tolbu Klampis Bangkalan 25 Islam28 Muji Tolbu Tolbu Klampis Bangkalan 40 Islam29 Na'im Ko'ol Tengah Ko'ol Klampis Bangkalan 40 Istram30 Marzuki Ko'ol Tengah Ko'ol Klampis Bangkalan 45 Islam31 Sohib Tolbu Tolbu Klampis Bangkalan 17 Islam32 Zaini Ko'ol Tengah Ko'ol Klampis Bangkalan 45 Islam33 Alwi Tolbu Ko'ol Klampis Bangkalan 42 Islam34 Kabi Ko'ol Barat Ko'ol Klampis Bangkalan 52 Islam35 Salama Ko'ol Barat Ko'ol Klampis Bangkalan 57 Islam36 Ahman Tolbu Ko'ol Klampis Bangkalan 20 Islam37 Nedi Ko'ol Ko'ol Klampis Bangkalan 70 Islam38 Moneri Ko'ol Ko'ol Klampis Bangkalan 70 Islam39 Matnahi Tolbu Tolbu Klampis Bangkalan 60 Islam40 Sidi Ko'ol Barat Ko'ol Klampis Bangkalan 60 Islam41 Saimin Kampung karang anyar Klampis Barat Klampis Bangkalan 29 Islam42 M. Subhi Kampung karang anyar Klampis Barat Klampis Bangkalan 35 Islam43 Bpk. Zaini Kampung makam Klampis Barat Klampis Bangkalan 30 Islam44 Mustajib Parteker Klampis Barat Klampis Bangkalan 26 Islam45 H. Abdul Rasyid Kampung karang anyar Klampis Barat Klampis Bangkalan 46 Islam46 Muhammad Ali Kampung Klampis Barat Klampis Barat Klampis Bangkalan 40 Islam47 Ansori Klampis Barat Klampis Bangkalan 36 Islam48 H. Abdul Halil KM Parteker Klampis Bangkalan 50 Islam49 Sohib KM Parteker Klampis Bangkalan 45 Islam50 Ahmat Kampung karang anyar Klampis Barat Klampis Bangkalan 65 Islam51 Sadali Klampis Barat Klampis Barat Klampis Bangkalan 60 Islam52 H. Mar'um Klampis Barat Klampis Barat Klampis Bangkalan 55 Islam53 Jamil Klampis Barat Klampis Barat Klampis Bangkalan 40 Islam54 Dul Rosyid Loh makam Klampis Barat Klampis Bangkalan 35 Islam55 H. Imam Klampis Barat Klampis Barat Klampis Bangkalan 55 Islam56 Muji Klampis Barat Klampis Barat Klampis Bangkalan 30 Islam57 H. Munir Klampis Barat Klampis Barat Klampis Bangkalan 50 Islam58 H. Hasan Klampis Barat Klampis Barat Klampis Bangkalan 52 Islam59 Syamsul Klampis Barat Klampis Barat Klampis Bangkalan 32 Islam60 Haji Hasan Kampung makam Klampis Barat Klampis Bangkalan 49 Islam61 Hadi Irianto Kampung makam Klampis Barat Klampis Bangkalan 37 Islam62 H. Azis Kampung makam Klampis Barat Klampis Bangkalan 30 Islam63 Abdul Latif Ko'ol Tengah Ko'ol Klampis Bangkalan 20 Islam
NoRESPONDENT IDENTITY
Nama Alamat Kelurahan Kecamatan Kabupaten Umur Agama

The Study for Development of the Greater Surabaya Metropolitan Ports in the Republic of Indonesia Appendix
A1-37
Table List of Attendants for the Consulation Meeting (Socah)
1 Masyhur Bargan Socah Socah Bangkalan 47 Elementary M Islam2 Muslimin Ps. Gunonijan Dakiring Socah Bangkalan 40 Elementary M Islam
6 Subandi Dakiring Dakiring Socah Bangkalan 50 - M Islam
8 Bunali Pasar Socah Socah Socah Bangkalan 60 Elementary M Islam9 Nasir Bargan Socah - Socah Bangkalan 48 - M Islam10 Moh Naji Pasar Socah - Socah Bangkalan 51 Elementary M -11 Musyaffar Bargan Socah Socah Socah Bangkalan 57 Junior M Islam12 Latip Socah Socah Socah Bangkalan 51 Elementary M -13 Bungkel Junganyar Socah Socah Bangkalan 53 Elementary M -14 Halilih Junganyar Junganyar Socah Bangkalan 52 Elementary M -15 Suharto Junganyar Junganyar Socah Bangkalan 31 Junior M -16 Suharni Junganyar Junganyar Socah Bangkalan 62 Elementary M -
18 Munawwir Socah Socah Socah Bangkalan 60 - -19 Muc. Rofi Junganyar Junganyar Socah Bangkalan - - M -20 Dainankocri Junganyar Junganyar Socah Bangkalan 49 Senior M -21 Ach. Djufri Kauman Socah Socah Bangkalan 65 Elementary M Islam22 Holifin Bargan Socah Socah Bangkalan 50 Elementary M Islam
25 Rupian. S Junganyar Junganyar Socah Bangkalan 57 Elementary M Islam26 Ansori Dakiring Dakiring Socah Bangkalan 43 Senior M Islam27 Hasnain Dakiring Dakiring Socah Bangkalan 70 Elementary M Islam28 Selamet Dakiring Dakiring Socah Bangkalan 56 Elementary M Islam29 Solihan Kejawan Socah Socah Bangkalan 56 Senior M -30 Abd Rahman Kejawan Socah Socah Bangkalan 54 Elementary M -
32 Pendere Sumri Junganyar Socah Bangkalan M -
34 Adb Wahid Kauman Socah Socah Bangkalan 65 Elementary M Islam
36 Mat Saini Junganyar Junganyar Socah Bangkalan Elementary M Islam37 Isyanto Junganyar RT06/RW02 Junganyar Socah Bangkalan M Islam38 Bukhori Junganyar RT06/RW02 Junganyar Socah Bangkalan 36 Junior M Islam39 Zainul Junganyar RT06/RW02 Junganyar Socah Bangkalan Elementary M Islam40 Mahfudz Junganyar RT06/RW02 Junganyar Socah Bangkalan Elementary M Islam41 Asmari Kauman RT05/RW01 Socah Socah Bangkalan Junior M Islam
43 M. Nasir Jungayar Junganyar Socah Bangkalan 32 Junior M Islam
45 Ali Rosidin Kejawan RT02/RW06 Socah Socah Bangkalan 34 Senior M Islam46 Zainal Arifin Kejawan RT02/RW06 Socah Socah Bangkalan 43 Senior M Islam47 Modjo JunganyarRT04/RW02 Junganyar Socah Bangkalan 48 Bachelor M Islam48 Fathoni Junganyar RT02 /RW01 Junganyar Socah Bangkalan 41 Junior M Islam49 Bungkel Gunungan RT04/RW04 Junganyar Socah Bangkalan 52 Elementary M Islam
51 H. Ashari Dairing RT07/RW03 Dairing Socah Bangkalan 61 - M Islam
53 Syamsuri Buluh Dairing RTII/RW I Dairing Socah Bangkalan 67 Senior M Islam54 Abdul Azis Junganyar RT02/03 Junganyar Socah Bangkalan 40 Junior M Islam
56 Suhri Dairing RT 02/RW 02 Dairing Socah Bangkalan 40 Elementary M Islam57 M. samsul Junganyar RT01/03 Junganyar Socah Bangkalan 50 Elementary M Islam58 Musrian Dairing RT 05/ RW02 Dairing Socah Bangkalan 61 Elementary M Islam59 Abdul Mukti Dairing RT 01/RW01 Dairing Socah Bangkalan 36 Junior M Islam60 Subiryanto T. Pasar RT03/RW05 Socah Socah Bangkalan 44 Elementary M Islam61 Abdul Rohim T. Pasar RT03/RW05 Socah Socah Bangkalan 52 Junior M Islam62 Manito T. Pasar RT03/RW05 Socah Socah Bangkalan 48 Junior M
Rofii55 BangkalanSocahDairingDairing RT02/RW02 IslamMSenior32
Moh Makruf52 BangkalanSocahSocahKauman RT 01/RW 01 IslamMJunior63
Marhasan42 BangkalanSocahSocahTimur Pasar RT02/RW05 IslamM52
Maritim SocahNurhomsin33 42BangkalanSocahSocah IslamMSenior
Dakiring Senior M Islam
Islam
Bachelo M
Abdul Samar5 34BangkalanSocahDakiring
Bangkalan4 SocahDakiringDakiringAli Mulyono Islam
M -Socah Bangkalan 34 Elementary
M-37
3 Hosen, SH Raya Pedeng Socah
35 SocahSocahSocahSolihain MJunior47Bangkalan Islam
Kauman BangkalanSocahSocah IslamM
Socah MElementary
Drs.H.Abdul Muhit24 58 Bachelor
Islam7 Urip Supriyadi Kauman Socah
31 JunganyarJunganyarM Ghazali
Socah
60Bangkalan
Socah Bangkalan 40
50
23 IslamKaumanEka Rusmiati, SH WBachelor35BangkalanSocah
ElementaryDairingDusun Pesisir RT07/RW03Akhsin Islam
SocahJunganyar Islam
IslamM
M49BangkalanSocah
KaumanNitin WSenior23Bangkalan17
ReligionSex
RESPONDENT IDENTITY
Name Address Village District Sub ofProvince Age Education
No
44 M. Haris Junganyar RT03/RW01 Junior34BangkalanSocahJunganyar
r


The Study for Development of the Greater Surabaya Metropolitan Ports in the Republic of Indonesia Appendix
A2-1
Appendix 2. Origin and Destination Port of Domestic Shipping Cargoes to/from Surabaya Port
(1) Container:Loading (1000 TEU)
2005 2010 2020 2030 2005 2010 2020 2030 2005 2010 2020 20306 Belawan 33 44 67 96 33 47 79 118 33 47 86 149
30 Palembang 0 0 - - 0 0 - - 0 0 - - 34 Panjang 7 8 11 16 7 9 14 19 7 9 15 24 36 Tanjung Priok 8 12 21 32 8 13 25 39 8 13 27 49 55 Benoa 20 26 41 59 20 28 48 73 20 28 52 92 61 Kupang / Tenau 5 8 13 19 5 9 15 23 5 9 17 29 63 Ende 0 0 - - 0 0 - - 0 0 - - 65 Kalabahi 1 0 - - 1 0 - - 1 0 - - 78 Banjarmasin 51 19 - - 51 21 - - 51 21 - - 80 Balikpapan 40 53 83 123 40 56 99 152 40 57 107 192 81 Samarinda 58 78 125 187 58 83 148 230 58 83 161 290 82 Tarakan 7 16 30 46 7 17 36 57 7 17 39 72 84 Bitung 65 82 118 166 65 87 140 204 65 88 152 258 86 Gorontalo 0 0 - - 0 0 - - 0 0 - - 87 Pantoloan 1 2 4 5 1 2 4 7 1 2 5 9 89 Ujung Pandang 136 172 251 354 136 183 297 435 136 184 322 550 92 Ambon 4 8 13 17 4 8 15 21 4 8 16 26 94 Ternate 0 0 - - 0 0 - - 0 0 - - 95 Sorong 7 14 29 46 7 15 34 56 7 15 37 71 96 Jayapura 9 12 20 31 9 12 23 38 9 13 25 48
452 555 826 1,198 452 591 979 1,471 452 594 1,060 1,859
Destination Port
Total
Case 1 Case 2 Case 3
(2) Container:Unloading (1000 TEU)
2005 2010 2020 2030 2005 2010 2020 2030 2005 2010 2020 20306 Belawan 64 85 132 191 64 91 157 235 64 92 170 297
34 Panjang 26 39 59 83 26 41 70 101 26 41 76 128 36 Tanjung Priok 10 16 27 41 10 17 32 50 10 17 35 63 44 Banten 17 24 40 60 17 26 48 74 17 26 52 93 55 Benoa 1 2 4 6 1 2 4 7 1 2 5 9 59 Bima 1 0 - - 1 0 - - 1 0 - - 61 Kupang / Tenau 4 6 11 17 4 7 13 21 4 7 15 27 78 Banjarmasin 88 37 - - 88 39 - - 88 40 - - 80 Balikpapan 2 2 4 5 2 3 4 6 2 3 5 8 81 Samarinda 34 49 77 111 34 52 92 136 34 53 100 172 84 Bitung 12 17 30 46 12 19 35 56 12 19 38 71 87 Pantoloan 1 2 4 5 1 2 4 6 1 2 5 8 89 Ujung Pandang 207 292 461 667 207 311 547 819 207 312 592 1,036 92 Ambon 0 0 0 0 0 0 0 0 0 0 0 1 95 Sorong 0 0 0 0 0 0 0 0 0 0 0 0 96 Jayapura 2 4 8 13 2 4 9 15 2 4 10 19
470 577 858 1,246 470 615 1,018 1,529 470 618 1,102 1,933 Total
Case 1 Case 2 Case 3Origin Port

The Study for Development of the Greater Surabaya Metropolitan Ports in the Republic of Indonesia Appendix
A2-2
(3) Break Bulk:Loading (1000 MT)
2005 2010 2020 2030 2005 2010 2020 2030 2005 2010 2020 20306 Belawan 70 39 25 29 70 41 30 35 70 41 33 44
12 Dumai 0 0 - - 0 0 - - 0 0 - - 14 Pekanbaru 22 17 24 40 22 18 28 49 22 18 31 62 17 Bagan Siapi-api 1 0 - - 1 0 - - 1 0 - - 20 Tembilahan 0 0 - - 0 0 - - 0 0 - - 21 Rengat 4 1 3 8 4 1 4 10 4 1 4 13 25 Teluk Bayur 107 74 62 72 107 79 74 88 107 79 80 112 26 Kuala Tangkal 4 4 5 7 4 4 6 9 4 4 6 11 29 Pulau Baai 24 17 18 27 24 18 21 33 24 18 23 42 30 Palembang 7 7 9 14 7 7 11 17 7 7 12 21 31 Pangkal Balam 1 0 - - 1 0 - - 1 0 - - 32 Tanjung Pandang 0 0 0 0 0 0 0 1 0 0 0 1 33 Muntok 7 7 9 13 7 7 11 16 7 7 12 20 34 Panjang 30 22 21 29 30 23 25 35 30 23 27 44 36 Tanjung Priok 86 55 53 77 86 58 63 95 86 59 68 120 44 Banten 11 15 16 15 11 16 19 19 11 16 20 24 45 Semarang 3 1 - - 3 1 - - 3 1 - - 46 Cilacap 15 15 21 32 15 16 25 40 15 16 27 50 48 Surabaya 0 0 - - 0 0 - - 0 0 - - 49 Gresik 31 28 36 55 31 30 43 68 31 30 47 86 50 Probolinggo 333 329 422 618 333 350 501 759 333 352 542 959 51 Meneg / Tanjung Wangi 1 0 - - 1 0 - - 1 0 - - 54 Kalianget 3 1 - - 3 1 - - 3 1 - - 55 Benoa 2 1 - - 2 1 - - 2 1 - - 58 Lembar 10 8 8 10 10 8 10 13 10 9 10 16 59 Bima 1 0 - - 1 0 - - 1 0 - - 60 Badas 1 0 3 7 1 0 3 9 1 0 4 11 61 Kupang / Tenau 57 35 27 32 57 37 32 40 57 38 35 50 62 Waingapu 22 19 21 29 22 20 25 35 22 20 27 45 63 Ende 76 70 101 163 76 75 119 201 76 75 129 254 64 Maumere 8 8 11 17 8 9 13 21 8 9 14 26 65 Kalabahi 8 11 17 25 8 12 20 30 8 12 21 38 66 Pontianak 5 2 4 10 5 2 5 13 5 2 5 16 70 Sampit 7 7 9 15 7 7 11 18 7 7 12 23 74 Pangkalan Bun 1 0 - - 1 0 - - 1 0 - - 76 Kumai 57 53 67 100 57 56 80 122 57 57 86 154 78 Banjarmasin 253 422 609 858 253 450 723 1,053 253 452 783 1,331 79 Kotabaru 19 19 22 31 19 20 26 38 19 20 28 48 81 Samarinda 75 55 52 67 75 59 62 82 75 59 67 104 82 Tarakan 52 15 - - 52 16 - - 52 16 - - 84 Bitung 0 0 - - 0 0 - - 0 0 - - 86 Gorontalo 4 6 8 12 4 6 10 15 4 6 11 19 87 Pantoloan 22 20 11 0 22 21 13 0 22 21 14 0 88 Toli-toli 0 0 - - 0 0 - - 0 0 - - 89 Ujung Pandang 124 84 65 69 124 89 77 85 124 90 83 108 91 Kendari 18 19 28 45 18 20 34 55 18 21 36 70 92 Ambon 67 35 19 18 67 37 22 22 67 37 24 27 94 Ternate 36 28 28 34 36 30 33 42 36 30 35 53 95 Sorong 36 11 - - 36 11 - - 36 11 - - 96 Jayapura 23 12 13 23 23 13 16 28 23 13 17 36 97 Biak 0 0 - - 0 0 - - 0 0 - - 99 Manokwari 5 5 8 12 5 5 9 15 5 5 10 19
115 Jawa Timur 1 0 - - 1 0 - - 1 0 - - 119 Kalimantan Selatan 35 34 41 59 35 36 49 72 35 36 53 91 120 Kalimantan Timur 19 16 18 27 19 17 22 33 19 17 24 41 123 Sulawesi Tengah 27 28 39 60 27 30 46 74 27 30 50 93 125 Sulawesi Tenggara 1 0 - - 1 0 - - 1 0 - - 126 Nusa Tenggara Barat 60 55 76 122 60 59 91 149 60 59 98 189 128 Maluku 48 40 40 50 48 42 47 61 48 42 51 78 129 Maluku Utara 2 1 3 8 2 1 4 10 2 1 4 12 130 Irian Jaya/Papua 5 4 9 19 5 4 11 24 5 4 12 30
1,949 1,755 2,085 2,959 1,949 1,870 2,472 3,633 1,949 1,880 2,677 4,591 Total
Case 1 Case 3Case 2Destination Port

The Study for Development of the Greater Surabaya Metropolitan Ports in the Republic of Indonesia Appendix
A2-3
(4) Break Bulk:Unloading (1000 MT)
2005 2010 2020 2030 2005 2010 2020 2030 2005 2010 2020 20302 Lhokseumawe 7 7 9 13 7 7 11 16 7 7 11 21 6 Belawan 2 1 - - 2 1 - - 2 1 - - 9 Kuala Tanjung 1 0 3 9 1 0 4 11 1 0 4 14
14 Pekanbaru 31 33 42 59 31 35 50 73 31 35 54 92 26 Kuala Tangkal 8 9 12 18 8 9 14 22 8 9 16 28 27 Talang Dukuh / Jambi 5 6 8 12 5 6 10 15 5 6 10 19 29 Pulau Baai 0 0 0 1 0 0 0 1 0 0 0 2 30 Palembang 1 0 - - 1 0 - - 1 0 - - 32 Tanjung Pandang 5 8 12 19 5 8 15 23 5 9 16 29 33 Muntok 2 2 2 4 2 2 3 4 2 2 3 6 34 Panjang 28 24 28 40 28 25 33 50 28 25 36 63 36 Tanjung Priok 8 7 10 16 8 7 12 20 8 7 13 25 43 Cirebon 1 0 4 10 1 1 4 13 1 1 5 16 45 Semarang 1 0 - - 1 0 - - 1 0 - - 48 Surabaya 25 25 38 63 25 27 45 78 25 27 49 98 55 Benoa 1 0 - - 1 0 - - 1 0 - - 57 Celukan Bawang 5 6 10 17 5 6 12 21 5 6 13 27 60 Badas 1 0 - - 1 0 - - 1 0 - - 61 Kupang / Tenau 6 3 2 1 6 3 2 2 6 3 2 2 62 Waingapu 6 3 3 3 6 4 3 4 6 4 3 5 63 Ende 0 0 0 1 0 0 0 1 0 0 0 1 64 Maumere 2 2 4 6 2 2 4 8 2 2 5 10 65 Kalabahi 0 0 0 0 0 0 0 0 0 0 0 0 70 Sampit 78 51 38 39 78 54 45 48 78 55 48 61 74 Pangkalan Bun 23 15 10 11 23 15 12 13 23 16 13 17 76 Kumai 148 102 87 104 148 109 103 128 148 109 112 162 78 Banjarmasin 253 454 744 1,127 253 484 883 1,384 253 487 956 1,749 79 Kotabaru 11 8 7 8 11 8 8 10 11 8 9 13 81 Samarinda 76 47 31 31 76 50 37 38 76 50 40 48 82 Tarakan 53 34 24 24 53 36 29 30 53 36 31 38 83 Nunukan 86 95 144 232 86 102 171 285 86 102 185 360 86 Gorontalo 2 2 3 6 2 2 4 7 2 2 4 9 87 Pantoloan 6 6 3 - 6 7 3 - 6 7 3 - 89 Ujung Pandang 354 386 573 914 354 411 680 1,122 354 414 736 1,419 91 Kendari 2 1 0 0 2 1 0 0 2 1 0 1 92 Ambon 0 0 - - 0 0 - - 0 0 - - 94 Ternate 3 3 4 6 3 3 5 8 3 3 5 10 96 Jayapura 3 1 - - 3 1 - - 3 1 - -
101 Nanggore Aceh Darussalam 0 0 0 0 - - - - 0 0 0 0 107 Kepulauan Bangka Belitung - - - - 1 0 - - - - - - 111 Jawa Barat 1 0 - - - - - - 1 0 - - 118 Kalimantan Tengah 5 2 - - 5 2 - - 5 2 - - 119 Kalimantan Selatan 8 10 16 26 8 11 19 32 8 11 20 40 120 Kalimantan Timur 1,284 904 781 932 1,284 963 927 1,144 1,284 968 1,003 1,446 121 Sulawesi Utara 19 39 63 91 19 41 74 112 19 42 80 142 125 Sulawesi Tenggara 10 11 18 30 10 12 21 37 10 12 23 46 126 Nusa Tenggara Barat 5 7 11 17 5 8 13 20 5 8 14 26 128 Maluku 5 9 14 20 5 9 16 25 5 9 18 31 129 Maluku Utara 0 0 1 1 0 0 1 2 0 0 1 2 130 Irian Jaya/Papua 16 15 20 30 16 17 24 36 16 17 26 46
2,599 2,341 2,780 3,946 2,599 2,494 3,297 4,845 2,599 2,508 3,571 6,123 Total
Case 1 Case 2 Case 3Origin Port

The Study for Development of the Greater Surabaya Metropolitan Ports in the Republic of Indonesia Appendix
A2-4
(5) Liquid Bulk:Loading (1000 MT)
2005 2010 2020 2030 2005 2010 2020 2030 2005 2010 2020 20306 Belawan 1 1 0 0 1 1 1 0 1 1 1 0
12 Dumai 0 0 0 0 0 0 0 0 0 0 0 0 20 Tembilahan 0 0 0 0 0 0 0 0 0 0 0 0 25 Teluk Bayur 1 1 1 1 1 1 1 1 1 1 1 1 28 Muara Sabak 0 0 0 0 0 0 0 0 0 0 0 0 30 Palembang 0 0 0 0 0 0 0 0 0 0 0 0 36 Tanjung Priok 0 0 0 0 0 0 0 0 0 0 0 0 44 Banten 89 54 67 108 89 58 76 121 89 58 80 135 48 Surabaya 0 0 0 - 0 0 0 - 0 0 0 - 51 Meneg / Tanjung Wangi 2 1 1 2 2 1 1 2 2 1 1 2 61 Kupang / Tenau 20 28 30 20 20 30 34 22 20 30 35 25 78 Banjarmasin 676 943 1,315 1,664 676 1,008 1,485 1,862 676 1,013 1,564 2,086 81 Samarinda 41 57 89 132 41 61 101 147 41 61 106 165 84 Bitung 2 3 3 2 2 3 4 2 2 3 4 2
115 Jawa Timur 0 0 0 - 0 0 0 - 0 0 0 - 126 Nusa Tenggara Barat 1 1 1 1 1 1 1 1 1 1 1 1
834 1,090 1,509 1,929 834 1,165 1,705 2,159 834 1,171 1,795 2,418 Total
Case 1 Case 2 Case 3Destination Port
(6) Liquid Bulk:Unloading (1000 MT)
2005 2010 2020 2030 2005 2010 2020 2030 2005 2010 2020 20306 Belawan 43 68 85 83 43 72 95 91 43 72 99 101
12 Dumai 1,838 2,806 3,576 3,936 1,838 2,962 3,969 4,348 1,838 2,975 4,151 4,814 14 Pekanbaru 0 0 0 1 0 0 0 1 0 0 0 1 20 Tembilahan 349 495 654 895 349 522 726 988 349 525 759 1,094 21 Rengat 18 21 31 64 18 22 34 70 18 22 36 78 26 Kuala Tangkal 0 1 2 6 0 1 2 6 0 1 2 7 27 Talang Dukuh / Jambi 31 48 128 400 31 50 142 442 31 51 149 490 30 Palembang 1,329 1,712 1,942 1,912 1,329 1,807 2,156 2,113 1,329 1,815 2,255 2,339 31 Pangkal Balam 3 4 9 23 3 4 9 26 3 4 10 28 34 Panjang 55 68 71 52 55 72 79 57 55 72 82 63 36 Tanjung Priok 51 72 86 82 51 76 95 91 51 77 100 100 44 Banten 257 317 564 1,411 257 335 626 1,559 257 336 654 1,726 46 Cilacap 4 5 10 28 4 5 11 31 4 5 12 34 51 Meneg / Tanjung Wangi 38 75 84 10 38 79 93 11 38 79 98 12 66 Pontianak 5 8 17 49 5 8 19 54 5 8 20 60 76 Kumai 57 94 270 870 57 99 300 962 57 99 314 1,065 78 Banjarmasin 0 0 0 1 0 0 0 1 0 0 0 1 80 Balikpapan 2,158 3,540 4,525 4,481 2,158 3,737 5,024 4,950 2,158 3,754 5,254 5,481 81 Samarinda 47 79 228 736 47 83 253 813 47 83 265 900 84 Bitung 25 34 72 198 25 36 80 219 25 36 84 243 89 Ujung Pandang 5 6 11 28 5 7 12 31 5 7 13 34 99 Manokwari - - - - 1 1 3 8 - - - -
101 Nanggore Aceh Darussalam 1 1 2 7 - - - - 1 1 3 9 107 Kepulauan Bangka Belitung - - - - 0 0 0 - - - - - 111 Jawa Barat 0 0 0 - 3 8 9 2 0 0 0 - 115 Jawa Timur 3 7 8 2 - - - - 3 8 10 2 119 Kalimantan Selatan 3 4 4 7 3 4 5 8 3 4 5 9 120 Kalimantan Timur 816 1,245 1,649 2,057 816 1,314 1,830 2,273 816 1,320 1,914 2,516 126 Nusa Tenggara Barat 0 0 1 2 0 1 1 2 0 1 1 3 130 Irian Jaya/Papua 2 3 7 21 2 3 8 24 2 3 8 26
7,138 10,712 14,037 17,362 7,138 11,308 15,582 19,180 7,138 11,358 16,297 21,237 Total
Case 1 Case 2 Case 3Origin Port

The Study for Development of the Greater Surabaya Metropolitan Ports in the Republic of Indonesia Appendix
A2-5
(7) Dry Bulk:Loading (1000 MT)
2005 2010 2020 2030 2005 2010 2020 2030 2005 2010 2020 20306 Belawan 431 596 883 1,146 431 619 957 1,241 431 621 991 1,349
12 Dumai 388 369 270 170 388 384 293 184 388 385 303 200 14 Pekanbaru 7 21 41 53 7 22 44 57 7 22 46 62 26 Kuala Tangkal 2 2 3 5 2 3 4 5 2 3 4 5 30 Palembang 52 67 95 123 52 69 103 133 52 70 106 145 44 Banten 60 30 - - 60 31 - - 60 31 - - 63 Ende 6 3 - - 6 3 - - 6 3 - - 80 Balikpapan 1 0 - - 1 0 - - 1 0 - - 81 Samarinda 1 1 - - 1 1 - - 1 1 - - 84 Bitung 0 1 2 3 0 1 3 3 0 1 3 4
107 Kepulauan Bangka Belitung 127 163 232 301 127 170 251 326 127 170 260 354 126 Nusa Tenggara Barat 1 0 - - 1 0 - - 1 0 - -
1,076 1,254 1,527 1,801 1,076 1,303 1,654 1,950 1,076 1,307 1,713 2,119
Case 1 Case 2 Case 3
Total
Destination Port
(8) Dry Bulk:Unloading (1000 MT)
2005 2010 2020 2030 2005 2010 2020 2030 2005 2010 2020 20306 Belawan 8 33 92 115 8 34 100 125 8 34 103 135
12 Dumai 2 5 13 16 2 5 14 18 2 5 15 19 14 Pekanbaru 8 11 18 23 8 12 20 25 8 12 20 27 30 Palembang 14 60 199 289 14 62 215 314 14 62 223 341 31 Pangkal Balam 2 4 7 9 2 4 8 10 2 4 8 11 32 Tanjung Pandang 155 226 386 482 155 235 418 523 155 236 433 568 34 Panjang 144 103 - - 144 107 - - 144 108 - - 36 Tanjung Priok 44 31 - - 44 32 - - 44 32 - - 54 Kalianget 72 134 275 344 72 139 298 373 72 140 308 405 62 Waingapu 16 11 - - 16 12 - - 16 12 - - 63 Ende 9 6 - - 9 6 - - 9 6 - - 64 Maumere 0 0 - - 0 0 - - 0 0 - - 78 Banjarmasin 224 446 771 737 224 463 835 798 224 465 865 867 79 Kotabaru 19 41 74 70 19 43 80 76 19 43 83 82 80 Balikpapan 0 0 0 0 0 0 0 0 0 0 0 0 81 Samarinda 35 62 102 104 35 64 111 112 35 65 115 122 87 Pantoloan 6 5 - - 6 5 - - 6 5 - - 88 Toli-toli 1 1 - - 1 1 - - 1 1 - - 89 Ujung Pandang 16 70 194 243 16 72 210 263 16 73 217 286 91 Kendari 5 4 - - 5 4 - - 5 4 - - 94 Ternate 16 12 - - 16 12 - - 16 12 - - 96 Jayapura 1 5 14 18 1 5 16 20 1 5 16 21
101 Nanggore Aceh Darussalam - - - - 9 19 42 52 - - - - 107 Kepulauan Bangka Belitung 9 18 39 48 - - - - 9 19 43 57 118 Kalimantan Tengah 5 4 - - 5 4 - - 5 4 - - 119 Kalimantan Selatan 261 415 753 929 261 432 815 1,006 261 433 844 1,093 121 Sulawesi Utara 831 594 - - 831 618 - - 831 620 - - 126 Nusa Tenggara Barat 115 82 - - 115 86 - - 115 86 - - 128 Maluku 184 132 - - 184 137 - - 184 137 - - 129 Maluku Utara 0 0 - - 0 0 - - 0 0 - - 130 Irian Jaya/Papua 205 291 481 602 205 302 522 652 205 303 540 709
2,409 2,806 3,418 4,030 2,409 2,916 3,703 4,365 2,409 2,925 3,834 4,743 Total
Case 1 Case 2 Case 3Origin Port


The Study for Development of the Greater Surabaya Metropolitan Ports in the Republic of Indonesia Appendix
A3-1
Appendix 3. Simulation Works for Siltation
1) Model for Channel Siltation Simulations
Siltation volume accompanied by widening and deepening of the Surabaya West Channel is assessed by channel siltation simulations. It was carried out by utilizing “PHRI-JPC” model.
The methodology of the simulation is illustrated in Figure A.3.1.
Figure A3.1 Flow of Siltation Simulation Work
Calculation of Current Field
• Tidal Current
• Near shore Current
Calculation of Wave Field
• Wave Direction
• Wave Height
Calculation of SS Density
• Erosion / Floating
• Dispersion
• Settlement
Calculation of Siltation Volume
(Change in Depth)
Assessment of Required Maintenance
Dredging Volume
Source: JICA Study Team

The Study for Development of the Greater Surabaya Metropolitan Ports in the Republic of Indonesia Appendix
2
2) Conditions and Parameters employed in the Simulations
Table A3.1 Conditions and Parameters Employed for the Simulation Work
Item Condition
Channel Planned depth: CDL-12m, CDL-14m, CDL-16m Width: 200m, 300m, 350m Side slope: 1/5 1/5 1/5
Wave
Seasonal average in terms of wave energy Dry season: H=0.87m, T=4.0s, Wave direction: 82.4° Rainy season: H=0.54m, T=4.3s, Wave direction: 302.0°
Unusual wave conditions Dry season: H=2.00m, T=5.0s, Wave direction: 90.0° Rainy season: H=2.00m, T=5.0s, Wave direction: 270.0°
Tide Offshore border M2+S2+0.5 x (K1+O1)
Sea water level Mean sea water level: CDL+1.4m
Bottom materials (Figure A.3.3)
Density: 2.65t/m3 Clay and Silt: Water content = 200%
Settlement speed = 0.26 cm/s Sand: Void ratio: 0.4
Medium particle size: 0.2mm Settlement speed = 2.5 cm/s
Composition ratio: Zone 1: Clay and Silt: 70%, Sand: 30%
Zone 2 and 3: Clay and Silt: 60%, Sand: 40% Zone 4 and 5: Clay and Silt: 70%, Sand: 30% Zone 6 and 8: Clay and Silt: 90%, Sand: 10%
SS density of the Solo River
Dry season: 20 ppm Rainy season: 1,750 ppm
Evaluation area Outer Channel : Buoy 5 – Buoy 6 (16km) Inner Channel : Buoy 6 – Karang Pisang (21km)
Grid interval (Figure A.3.2)
Overall Zone: 200m by 200m Zone 1, 2, 3, 4, 5, 6, 7, and 8 : 50m by 50m
Layers Upper layer: Sea water surface to -2.5m Middle layer: -2.5 m to - 4.0m Lower layer: -4.0 m to sea bottom
Horizontal eddy viscosity coefficient
100,000cm2/s
Vertical diffusion coefficient
1.0cm2/s
Friction coefficient Middle layer: 0.001, Lower layer: gn2/h1/3
Manning’s roughness coefficient: n=0.025
Note: Wave direction is indicated clockwise in degree from North

The Study for Development of the Greater Surabaya Metropolitan Ports in the Republic of Indonesia Appendix
A3-3
Figure A3.2 Calculation Areas with Grid Interval of 200m and 50m
Source: JICA Study Team

The Study for Development of the Greater Surabaya Metropolitan Ports in the Republic of Indonesia Appendix
4
Figure A3.3 Soil Classification and Median Particle Diameter
Source: JICA Study Team
3) Re-production of Current Field
Comparison of the harmonic analysis of tidal currents between the observed tide ellipses and simulated ones at Buoy No. 6 and Buoy No. 8 is shown in Figure A.3.4. The re-production accuracy is considered very well.
Current vector distribution diagrams are drawn for all the cases of the simulations. The results for the strongest ebb and flood currents are summarized and presented in Figure A.3.5 to 8.

The Study for Development of the Greater Surabaya Metropolitan Ports in the Republic of Indonesia Appendix
A3-5
Figure A3.4 Comparison of Tidal Ellipses by Harmonic Analysis
(M2+S2 Components)
Source: JICA Study Team
-80
-60
-40
-20
0
20
40
60
80
-80 -60 -40 -20 0 20 40 60 80
obs.
cal.
cm/s
cm/s
-80
-60
-40
-20
0
20
40
60
80
-80 -60 -40 -20 0 20 40 60 80
obs.
cal.
cm/s
cm/s
-80
-60
-40
-20
0
20
40
60
80
Upper Layer
Lower Layer
Buoy No. 6
Buoy No.8 Upper Layer
obs.
cal.
-80 -60 -40 -20 0 20 40 60 80
cm/s
cm/s
-80
-60
-40
-20
0
20
40
60
80
-60 -40 -20 0 20 40 60 80
obs.
cal.
-80
cm/s
cm/s
Lower Layer

The Study for Development of the Greater Surabaya Metropolitan Ports in the Republic of Indonesia Appendix
6
Figure A3.5 Currents of Upper Layer for the Maximum Flood Current in Rainy Season
Source: JICA Study Team

The Study for Development of the Greater Surabaya Metropolitan Ports in the Republic of Indonesia Appendix
A3-7
Figure A3.6 Currents of Bottom Layer for the Maximum Flood Current in Rainy Season
Source: JICA Study Team

The Study for Development of the Greater Surabaya Metropolitan Ports in the Republic of Indonesia Appendix
8
Figure A3.7 Currents of Upper Layer for the Maximum Ebb Current in Rainy Season
Source: JICA Study Team

The Study for Development of the Greater Surabaya Metropolitan Ports in the Republic of Indonesia Appendix
A3-9
Figure A3.8 Currents of Bottom Layer for the Maximum Ebb Current in Rainy Season
Source: JICA Study Team

The Study for Development of the Greater Surabaya Metropolitan Ports in the Republic of Indonesia Appendix
10
4) Re-production of Wave Fields
Wave conditions are simulated by applying the Global Wave Hindcast Method to the Java Sea. The calculations are carried out for a period of five years form January 2002 to December 2006, the result of which is summarized in Table A.3.2 and Table A.3.3.
Then, the average wave height of 0.87m and 0.54m are applied in the simulations for the dry season and the rainy season, respectively, as the case of the average maritime conditions.
Table A3.2 Average Energy Usual Waves at Offshore of Middle Java
Season Month Wave Height
H0 (m) Wave Period
T0 (sec) Direction (degrees)
Remarks
Dry May - Oct. 0.87 4.0 82.4
Rainy Nov. - Apr. 0.54 4.3 302.0
Note: Simulated period: Jan. 2002 to Dec. 2006. Wave direction is measured clockwise from the north. Source: JICA Study Team
Table A3.3 Unusual Waves at Offshore of Middle Java
Season Days Wave Height
H0 (m) Wave Period
T0 (sec) Direction (degrees)
Remarks
Dry 5 2.00 5.0 90.0
Rainy 5 2.00 5.0 270.0
5) Result of Siltation Simulations in the Surabaya West Channel
The results of siltation simulations under the average wave conditions and the unusual wave conditions are shown in Figure A.3.9 to 12 at Zone 1 to 6.
The estimated soil volumes to be deposited in the channel are shown in Table A.3.4. Accumulation of soil is expected to occur form the entrance of the Surabaya West Channel (Zone 1 to Zone 6). Major reasons why large scale siltation can occur from Zone 1 to 6 are:
1. Due to sudden expansion of the flow after the water mass flows into the outer channel from the inner channel through the narrow outlet of the inner channel, the current slows down and loses the power to keep the suspended particles, resulting in sedimentation,
2. The composition of the bed materials at this area is mostly clay, and floating/movement of the particles is easy to occur, and
3. The current crosses the channel perpendicularly in this zone from relatively shallow water area to deeper channel with a depth of 12m, 14m and 16m, which is also accompanied by decrease in current speed, or loss of particle carrying capacity of water mass, resulting in settlement of suspended particles in the channel.

The Study for Development of the Greater Surabaya Metropolitan Ports in the Republic of Indonesia Appendix
A3-11
Table A3.4 Estimate of Soil Volume Deposited in the Surabaya West Channel
Estimated Total Siltation Volume (million m3 p.a.)
Required Maintenance Dredging Volume (million m3 p.a.)
W: 200m W: 300m W: 350m W: 200m W: 300m W: 350m Zone
D: -12m D: -14m D: -16m D: -12m D: -14m D: -16m
Remarks
1 0.3 0.5 0.7 0.3 0.5 0.7 Buoy No.5, No.2
2 0.4 0.8 1.2 0.4 0.9 1.2 Buoy No.7
3 0.6 1.0 1.4 0.6 1.0 1.4 Karang Jamuang
4 0.6 0.9 1.5 0.6 0.9 1.5 Buoy No.9, No.11
5 0.5 0.8 1.1 0.5 0.8 1.1 Buoy No.6
6 0.5 0.6 0.7 0.01 0.1 0.3 Buoy No.13
Total 2.9 4.6 6.6 2.4 4.2 6.2
Source: JICA Study Team

The Study for Development of the Greater Surabaya Metropolitan Ports in the Republic of Indonesia Appendix
12
Figure A3.9 Distribution Chart of Water Depth Change
(Channel Depth: -10m, Channel Width: 100m)
Source: JICA Study Team

The Study for Development of the Greater Surabaya Metropolitan Ports in the Republic of Indonesia Appendix
A3-13
Figure A.3.10 Distribution Chart of Water Depth Change
(Channel Depth: -12m, Channel Width: 200m)
Source: JICA Study Team

The Study for Development of the Greater Surabaya Metropolitan Ports in the Republic of Indonesia Appendix
14
Figure A.3.11 Distribution Chart of Water Depth Change
(Channel Depth: -14m, Channel Width: 300m)
Source: JICA Study Team

The Study for Development of the Greater Surabaya Metropolitan Ports in the Republic of Indonesia Appendix
A3-15
Figure A.3.12 Distribution Chart of Water Depth Change
(Channel Depth: -16m, Channel Width: 350m)
Source: JICA Study Team
