final report - vetovi student name: chris cruise
TRANSCRIPT

Final Report - Vetovi
Student Name: Chris Cruise
University of Florida
Department of Electrical and Computer Engineering
EEL 4665/5666 Intelligent Machines Design Laboratory
Date: 4/21/2015

1
Contents Abstract .................................................................................................................................................. 2
Introduction ............................................................................................................................................ 3
Integrated System ................................................................................................................................... 4
Hardware Layout Diagram ................................................................................................................... 4
Software Layout Diagram .................................................................................................................... 5
Mobile Platform ...................................................................................................................................... 6
Actuation ................................................................................................................................................ 6
Sensors.................................................................................................................................................... 7
Behaviors ................................................................................................................................................ 7
Experimentation ...................................................................................................................................... 9
Special Sensor ..................................................................................................................................... 9
Conclusions ........................................................................................................................................... 11
Documentation ..................................................................................................................................... 11
Appendix A. ODROID C1 Wiring Chart .................................................................................................... 12
Appendix B. Arduino Wiring Chart ......................................................................................................... 13

2
Abstract Vetovi is a cooperating set of two near-identical robots that will be racing each other. I will give
each robot a series of waypoints for them to reach as quickly as possible and repeat some set number of times to the race completion. Each robot must also exhibit high level collision avoidance to evade both static and dynamic obstacles. One robot will be outfitted with a scanning LIDAR and slowly generate a 2D map of the area over time. This map will be shared over a network with the other robot. The robots’ path planning algorithms will then use this map to better improve their route and increase the speed at which they navigate the waypoints.

3
Introduction Vetovi is inspired by the recent developments of autonomous vehicle technology. Current
research that is looking into creating the next generation of cars is focused in two areas: autonomous cars and the connected car.
The “autonomous car” refers to a large set of automations that replace the requirements of the driver when controlling the vehicle. Intelligent vehicle behaviors were demonstrated as early as the 1980s at Carnegie Mellon1 but only recently gained significant traction due to the DARPA Grand Challenge and DARPA Urban Challenge. In these events, vehicles were required to navigate a series of waypoints while avoiding obstacles2. The Grand Challenge featured a 130 mile course through a desert that robots had to follow while avoiding obstacles and staying on the road. The Urban Challenge moved to an urban environment that featured stop signs and traffic as dynamic obstacles to be avoided. Early commercial implementations of this technology include intelligent cruise control which keeps spacing between vehicles and lane-keep assist which tracks lane markers on the highway and provides slight corrections if the driver is drifting out of his lane. The eventual goal in the field of autonomous is to have a self-driving car and potentially even a driverless car (a car in which a human may not even be present).
The “Connected Car” is an idea that has its roots in the “Internet of Things.” The Internet of Things (IoT) is a rapidly developing concept where more and more devices are being connected to the internet. Things such as washers and dryers, public cameras, environmental sensor and more are being connected to the internet. The purpose of this ranges from improving customer experience by allowing them to interact and control their devices from internet applications to leveraging the ability of the internet to store data from vast sensor networks which can then be mined for trends and results. By connecting cars to the internet, we can make use of the large amounts of sensor data and calibration information that cars produce each second to determine large scale trends in vehicle performance. More important to my project is the concept that by having cars connected to the internet, they can talk to each other (vehicle to vehicle communication) and the transportation network (vehicle to infrastructure communication) to improve the efficiency of transportation. I intend to apply this concept of vehicle communication to find how it can be used to improve the effectiveness of autonomous vehicles to avoid obstacles and plan paths.
In this paper, I will consider the technical requirements of each robot as well as the transportation network in order to complete this project. I will then consider the more detailed specifications for subsystems of the robots with special consideration given to sensors and actuators.

4
Integrated System In this project, I will consider only two vehicles, both of which will be autonomous. The vehicles
will be given a series of waypoints and be required to navigate those waypoints to a final destination. A goal of the project is to have high level collision avoidance as the robots must not only avoid static obstacles like walls, but also work around each other and other dynamic obstacles that may be entered into the system. The extra dynamic obstacles can be any moving obstacle that was previously unclassified by the robots and will most likely be as simple as rolling balls in the path of the robots or having people walk in front of the robots. The most important aspect is for the robots to generate a map of the road network and use it to plan paths through the network to increase the speed at which they are able to navigate between waypoints.
Hardware Layout Diagram A diagram of the hardware layout in shown below. Note that blue nodes represent processing nodes, purple nodes represent sensors (the LIDAR gets a green node to designate it at the special sensor) and all actuators are highlighted in red for high power nodes.
Laptop
O-DROID C1 (Primary Robot)
O-DROID C1 (Secondary Robot)
Wi-Fi Connections
Router
Arduino
IMU
Bump Sensor Array
Sonar Array
Arduino
IMU
Bump Sensor Array Sonar Array
LIDAR LITE
Dual Motor Driver
Dual Motor Driver
Stepper Driver
Stepper
Steering Motor
Drive Motor
Steering Motor
Drive Motor

5
Software Layout Diagram The software on the robot was done almost entirely in C++ using the ROS framework. An Arduino was also programmed using Arduino’s native C-like programming language to handle pose estimation by filtering the IMU sensor components. The main ODROID C1 computer served as the primary handler of major processing tasks including obstacle avoidance, generating occupancy grids, and communication. A diagram similar the hardware layout is shown below for software. Note: blue nodes represent hardware, purple nodes represent sensors (the LIDAR gets a special green node), red nodes represent power outputs, yellow nodes represent high level behaviors that I developed myself, and orange nodes represent existing ROS software components that I have implemented in my project. Pose update, sonar, LIDAR, and step nodes are all routine data input nodes. These are used to generate obstacle avoidance information and an occupancy grid. If obstacle avoidance detects an imminent threat (obstacle), it will ignore the path plan to take the best course of action in avoiding that obstacle. Otherwise, a path is planned to optimize time to next waypoint. Every LIDAR scan is converted to a Laser Scan message and passed to the AMCL library for localization. If far off of pose update or if the Arduino has detected a sensor drift fault, the robot will stop and several more scans will be taken to update the map and localization. The occupancy grid is passed over the network once a second to Rviz for visualization by the user. I generate my occupancy grid myself instead of using gmapping to minimize computations and to be able to integrate the sonars into the map. Dashed lines indicate nodes that do not exist on the secondary robot.
Laptop
O-DROID C1
Wi-Fi Connections Router
Arduino
IMU Filtering
Pose Update LIDAR
Drive
RVIZ – Occupancy Grid
Visualization Node
Reports change in position
Occupancy Grid
Obstacle Avoidance
Path Planning
AMCL (Localization)
Laser Scan
Step Sonar Array

6
Mobile Platform The mobile platform has few requirements as the sensor package, specifically the scanning LIDAR, is the dominating aspect of this project. In order to provide best results from the sensors, the mobile platform must be stable and not vibrate when traversing a flat terrain profile. Also, the mobile platform must be capable of a speed of 10 feet/second. This speed is approximately equivalent to quick walk. The speed requirement is necessary to demonstrate the effectiveness of the mapping and control algorithms by reducing the amount of time the robot has to sense its environment and make decisions. The final mobile platforms of the robots are modified RC cars. By using RC cars, I saved myself a lot of time as I did not have to design my own platforms, but also a lot of money as each came fully built with motors and batteries for less than $30 each. I especially like the RC cars because they have Ackermann steering and suspension systems so they have very similar vehicle dynamics to their full scale counterparts.
Actuation There will be very few actuations in my robots. Each robot has a single motor for the rear wheel drive and a second motor on the front for steering. The only other actuations will be the control of a stepper motor used to implement the scanning LIDAR system. A stepper motor can be set to position control which I will use to step through the motor’s predetermined angles for each LIDAR measurement. By doing this, I will know to a high degree of accuracy what angle the LIDAR is pointing compared to the robots orientation. Using this angle and geometry, I can determine what area of the world map needs to be updated with the new LIDAR measurement.

7
Sensors Both robots will possess the following sensors:
o Bump sensors – for last resort obstacle avoidance Digital output
o Sonar rangefinders (HC-SR04) x3 – for obstacle avoidance and short distance mapping 4~500cm distance Sourced from Amazon Operate at 5V. 20Hz Digital Output
o IMU – for localizing the robots position which is necessary to determine what parts of the world map that new sensor data will need to update. Implemented as a combination of accelerometers, gyros, and a magnetometer.
2x GY-521 gyro/accelerometer combo 1x Pololu LSM303 Magnetometer Combined gyro and accelerometer measurements for improved accuracy and
reduced effects of drift 120Hz I2C output – all position calculations done through arduino
o A single robot will possess a LIDAR rangefinder. The LIDAR will be the sensor that makes the vast majority of the contributions to the world map which will be shared over a network.
0 – 40m distance. 0.25cm accurracy 30Hz I2C Output (limited by stepper motor speed) Sourced from PulsedLight3d
Behaviors The behaviors of my robots will parallel common behaviors that one would expect from a self-
driving car. They should reflect low level implementations of mapping, path planning, and collision avoidance.
Passive obstacle avoidance to avoid walls and others robots (all robots) o This will be accomplished using three SONAR sensors facing to the left/middle/right
respectively. These are used to avoid nearby obstacles and a sonar to detect the distance of obstacles directly in front of the robot. The bump sensors will be used as kill switches – if you “bump” into something while driving a car, you have effectively failed your mission so triggering a bump sensor will be considered failure and stop the robots to prevent potential damage.
“Mapping” of environment (G-Bot) o I will use the IMU to localize the G-Bot and gather distance information on a 2D plane
using a LIDAR rangefinder. For mapping, I will create a 2D array that can hold a 10m x 10m detection grid with a resolution of 1cm which corresponds to a 1000 x 1000 byte array. This array will be stored as a ROS occupancy grid data structure where each element will have a score of 1-100 reflecting the certainty of an object in that location. Note that I do not expect the sensors to provide a resolution of 1cm but will provide the memory for it in software and will increase or decrease this value based on the experimental capabilities of the sensors. The array will be maintained using a blackboard system and implement a gap filler and sensory filter to improve its accuracy. Quality will be assessed based on time
8
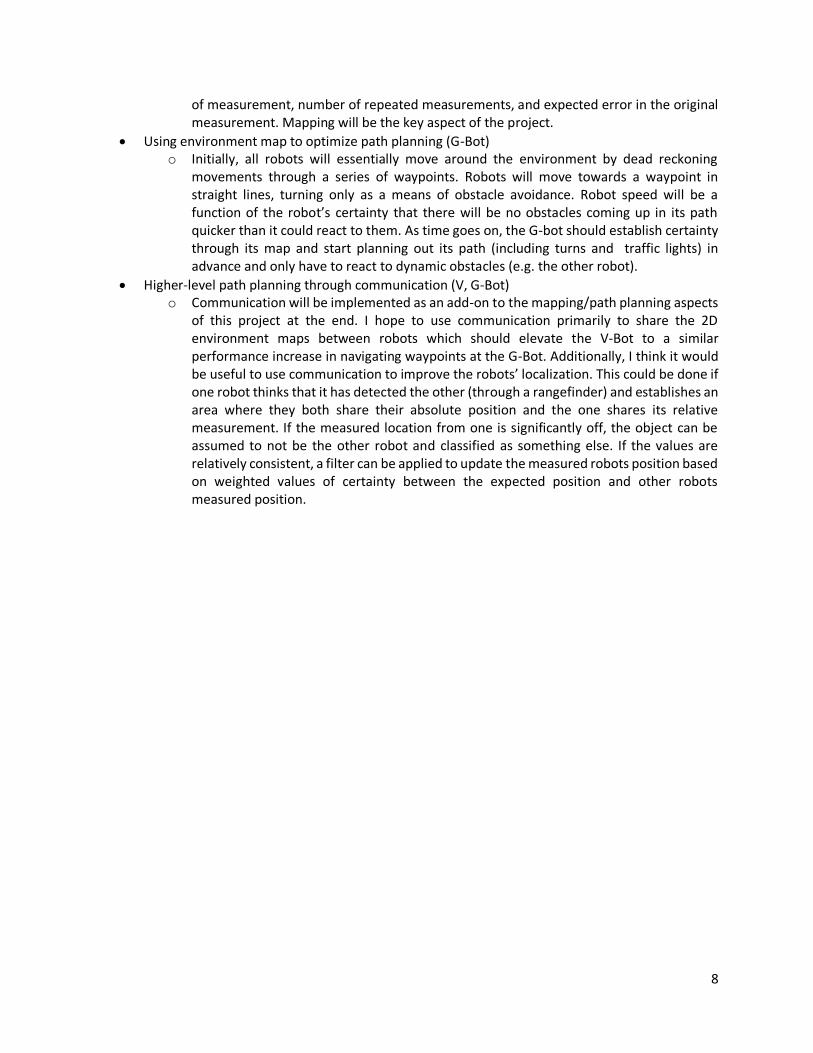
of measurement, number of repeated measurements, and expected error in the original measurement. Mapping will be the key aspect of the project.
Using environment map to optimize path planning (G-Bot) o Initially, all robots will essentially move around the environment by dead reckoning
movements through a series of waypoints. Robots will move towards a waypoint in straight lines, turning only as a means of obstacle avoidance. Robot speed will be a function of the robot’s certainty that there will be no obstacles coming up in its path quicker than it could react to them. As time goes on, the G-bot should establish certainty through its map and start planning out its path (including turns and traffic lights) in advance and only have to react to dynamic obstacles (e.g. the other robot).
Higher-level path planning through communication (V, G-Bot) o Communication will be implemented as an add-on to the mapping/path planning aspects
of this project at the end. I hope to use communication primarily to share the 2D environment maps between robots which should elevate the V-Bot to a similar performance increase in navigating waypoints at the G-Bot. Additionally, I think it would be useful to use communication to improve the robots’ localization. This could be done if one robot thinks that it has detected the other (through a rangefinder) and establishes an area where they both share their absolute position and the one shares its relative measurement. If the measured location from one is significantly off, the object can be assumed to not be the other robot and classified as something else. If the values are relatively consistent, a filter can be applied to update the measured robots position based on weighted values of certainty between the expected position and other robots measured position.

9
Experimentation
Special Sensor My special sensor is a LidarLite laser rangefinder that will be mounted onto a stepper motor to convert it into a full scanning LIDAR. While many high-performance (and high cost) scanning LIDARs use a fixed sensor with a rotating mirror, I decided that it would be easier to rotate the entire sensor in the scope of this experiment.
To achieve this, a bipolar stepper motor and stepper motor driver along with the PulsedLight LidarLite are required. Personally, I chose to use the EasyStepper driver from Sparkfun due to its easy of use as it only requires a direction and step input (steps on rising clock edge). The EasyStepper also has a microstepping feature enabled by default. The LidarLite is equally simple to use as data can be read either via PWM or the I2C bus. I chose to use the I2C bus due to the difficulty in reading PWM using a GPIO pin and the ODROID C1’s do not have built in hardware for measuring PWM signals.
O-Droid C1 Pin Peripheral Pin
2 (5V) LidarLite Pin 1 (Vcc)
3 (SCL) LidarLite Pin 5
5 (SDA) LidarLite Pin 4
6 (GND) LidarLite Pin 6 (GND)
4 (5V) EasyStepper Logic High
20 (GND) EasyStepper Logic Low
16 (GPIO, WiringPi #4) EasyStepper Direction
18 (GPIO, WiringPi #5) EasyStepper Step
I bought a stepper motor with 200 steps/revolution. By commanding the stepper motor to go a single step, the angle of rotation is also known as demonstrated by the following calculations.
200𝑠𝑡𝑒𝑝𝑠
𝑟𝑒𝑣𝑜𝑙𝑢𝑡𝑖𝑜𝑛× 8
𝑚𝑖𝑐𝑟𝑜𝑠𝑡𝑒𝑝𝑠
𝑠𝑡𝑒𝑝= 1600
𝑚𝑖𝑐𝑟𝑜𝑠𝑡𝑒𝑝𝑠
𝑟𝑒𝑣𝑜𝑙𝑢𝑡𝑖𝑜𝑛
360𝑑𝑒𝑔𝑟𝑒𝑒𝑠
𝑟𝑒𝑣𝑜𝑙𝑢𝑡𝑖𝑜𝑛 ÷ 1600
𝑚𝑖𝑐𝑟𝑜𝑠𝑡𝑒𝑝𝑠
𝑟𝑒𝑣𝑜𝑙𝑢𝑡𝑖𝑜𝑛 =
360
1600= 0.225
𝑑𝑒𝑔𝑟𝑒𝑒𝑠
𝑚𝑖𝑐𝑟𝑜𝑠𝑡𝑒𝑝
Thus, this stepper motor provides us with 1600 unique measurements in a revolution and only rotates 0.225 degrees per step. This far exceeds the requirements of this project and many of these steps

10
may be skipped in order to provide a fast enough rate of scanning. Even at 100 Hz, we could only get one 360 degree scan every 16 seconds if we measured at every microstep. This is especially critical when the scan is behind the robot as a minimum of 8 second LIDAR blindness would occur in the robots direction of motion. Obviously, there is a tradeoff here between precision and speed of sampling.
Ultimately, I decided to disable microstepping and take two full steps, which corresponds to 3.6˚
per measurement and 100 measurements per rotation. I also found that the maximum rate that the LIDAR could reliably provide I2C output was at about 35 Hz. To allow a buffer for slow measurements, I am running the LIDAR node at 30 Hz. This gives me a full measurement sweep once every 3.3 seconds. While much slower than many commercial scanning LIDARs, the cost was also an order of magnitude lower. Regardless, initial testing of the scanning LIDAR has been promising as very accurate measurements have been recorded with minimal noise and garbage data. The following pictures will show the experimental setup. This is my room where the test scans have been taking place. This image is produced solely for reference when considering the data plot shown later.
Finally, the following image is a post-processed plot generated in Matlab from the Lidar Lite scan of my room. There were approximately 10 outliers that showed up in 3200 data points that were collected (two complete revolutions are shown in this scan), which are visible at 5˚, 27˚, and 70˚. Some issues may have
arisen due to the fact that the wires have not yet been routed properly and some can obstruct the view of the LIDAR. At 70˚, there was an open door to a bathroom with a mirror. In my tests, I have found that
the LIDAR performs poorly with mirrors as well as with bright computer screens. I have disregarded these instances within the scope of my experiment as they will not occur in my test conditions.
Degrees
Distance (cm)
Chair (Me)
Wall
Monitor
11
Conclusions This was an extraordinarily ambitious project and I definitely got caught up in trying to do too
much at the beginning of the semester. Also, I had a lot of issues with prioritization of tasks to be completed on the robot as I tended to focus on what I thought was most interesting, which were the high level behaviors (mapping, path planning, etc). This caused me to be behind in the more basic features such as integrating the behaviors into the driving node and adding the visualization node which are the more critical aspects in that if they do not work, the robot cannot perform. Instead of finishing something and improving incrementally, I went for it all right away and ended up behind for much of the semester. Definitely a major lesson learned.
That being said, I am very happy with my robots at this point. While I did have to cut away a lot of functionality (traffic light recognition, stop sign recognition), those were mainly “show-off” tasks that I had trivialized into CdS cell light sensor/line following behaviors anyways. The mapping and localization of the robots as well as the communication all turned out really well and I am especially proud that I wrote my own Occupancy Grid generation node which gave me a lot of background in SLAM. ROS has been taking me a while to pick up, but finally (and only recently) the framework clicked for me and now I feel like I am able to use the full power of what is an extremely rich development environment for robots. While Demo Day performance fell short due to networking issues, I am looking forward to presenting at Media Day and showing off the full potential of Vetovi.
Documentation Kanade, Takeo (February 1986). "Autonomous land vehicle project at CMU". CSC '86 Proceedings of the 1986 ACM fourteenth annual conference on Computer science. Overview. (2008, July 1). Retrieved January 28, 2015, from http://archive.darpa.mil/grandchallenge/ Pololu Magnetometer: https://www.pololu.com/product/1273 GY-521: http://playground.arduino.cc/Main/MPU-6050 Sonar: http://www.micropik.com/PDF/HCSR04.pdf -https://docs.google.com/document/d/1Y-yZnNhMYy7rwhAgyL_pfa39RsB-x2qR4vP8saG73rE/edit All source code is current hosted on my website: www.ccruiserobot.wordpress.com and will be moved over to a github account shortly (link to be posted on my website when migration occurs)

12
Appendix A. ODROID C1 Wiring Chart ODROID
Pin Raspi Pin Function Device Device Pin Wire Color
1 3.3V
2 5.0V
3 I2CA_SDA LIDAR Pin 5 Yellow-Brown-Blue
4 5.0V
5 I2CA_SCL LIDAR Pin 4 Black-Green
6 GND
7 7
8 TX
9 GND
10 RX
11 0 Stepper Driver Step Green
12 1 Stepper Driver Dir Blue
13 2
14 GND
15 3
16 4
17 3.3V
18 5
19 12
20 GND
21 13 H-Bridge, Back Motor B-1A Green/Purple
22 6 H-Bridge, Back Motor B_1B Blue/Orange
23 14 SPI H-Bridge, Front
Motor A-1A Green
24 10 H-Bridge, Front
Motor A-1B Blue
25 GND
26 11
27 I2CB_SDA
28 I2CB_SDL
29 21 Right Sonar Echo Echo Blue
30 GND
31 22 Mid Sonar Trig Trig Green
32 26 Mid Sonar Echo Echo Blue
33 23 Right Sonar Trig Trig Green
34 GND
35 24 Left Sonar Trig Trig Green
36 27 Left Sonar Echo Echo Blue
37 AIN1
38 1.8V
39 GND
40 AIN0

13
Appendix B. Arduino Wiring Chart Arduino
Pin Function Device Device Pin Wire Color
(empty)
IOREF
RESET
3.3V 3.3V Accel Right ADO
5V 5V Accel Mid Vcc Red
GND GND Accel Mid GND Black
GND GND Mag GND Black
Vin (5V) 5V Mag Vin Red
A0 A0
A1 A1
A2 A2
A3 A3
A4 SDA IMU, SDA SDA Blue
A5 SCL IMU, SCL SCL Green
0
1 HIGH (5V) Sonar Left 5V Orange
2 LOW (GND) Sonar Left GND Purple
3
4
5
6
7 HIGH (5V) Sonar Mid 5V Orange
8 LOW (GND) Sonar Mid GND Purple
9
10
11 HIGH (5V) Sonar Right 5V Orange
12 LOW (GND) Sonar Right GND Purple
13 HIGH (5V) Accel Right 5V Red
GND GND Accel Right GND Black
AREF
(empty)
(empty)