final report the true cost of food waste within ... true cost of food waste within... · the true...
TRANSCRIPT
Final Report
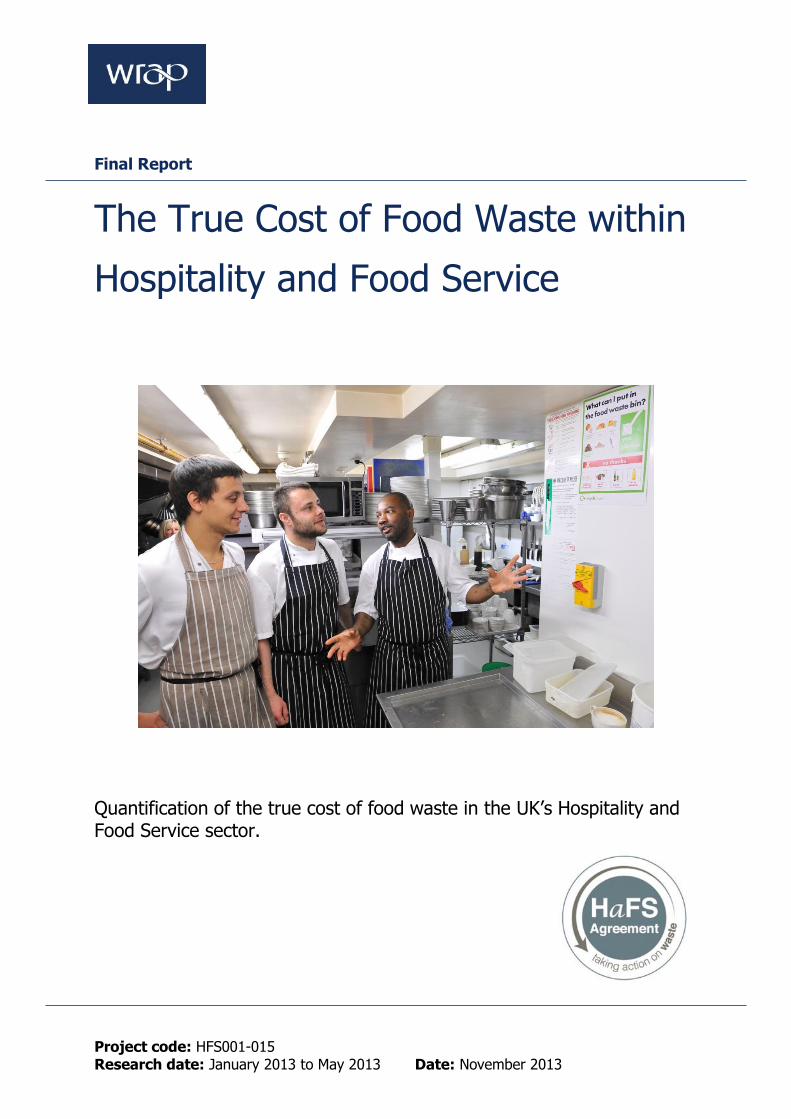
The True Cost of Food Waste within
Hospitality and Food Service
Quantification of the true cost of food waste in the UK’s Hospitality and Food Service sector.
Project code: HFS001-015 Research date: January 2013 to May 2013 Date: November 2013
2
WRAP’s vision is a world where resources are used sustainably. We work with businesses, individuals and communities to help them reap the benefits of reducing waste, developing sustainable products and using resources in an efficient way. Find out more at www.wrap.org.uk Document reference: [e.g. WRAP, 2006, Report Name (WRAP Project TYR009-19. Report prepared by…..Banbury, WRAP]
Written by: Dr Peter Lee, Dr Julian Parfitt and Anna Fryer
Front cover photography: WRAP
While we have tried to make sure this report is accurate, we cannot accept responsibility or be held legally responsible for any loss or damage arising out of or in
connection with this information being inaccurate, incomplete or misleading. This material is copyrighted. You can copy it free of charge as long as the material is
accurate and not used in a misleading context. You must identify the source of the material and acknowledge our copyright. You must not use material to endorse or
suggest we have endorsed a commercial product or service. For more details please see our terms and conditions on our website at www.wrap.org.uk
The True Cost of Food Waste within Hospitality and Food Service 3
Executive summary
Each year the Hospitality and Food Service (HaFS) sector in the UK serves over 8 billion meals, and produces over 2.87 million tonnes of food and associated packaging waste. Nearly 1 million tonnes of this waste produced is food waste. Three quarters of this food waste could have been eaten and is equivalent to throwing away one in six meals served. Throwing this much food waste away has a considerable impact that goes beyond the commonly reported costs associated with waste collection. This report provides an estimate of the ‘true cost’ of a tonne of food waste generated by HaFS businesses in the UK. This in turn provides part of the evidence base to generate the business case which will encourage businesses to reduce the amount of waste they produce, and deliver cost savings. The yield losses were determined by dividing the weight of food waste by the weight of purchased food. The analysis shows that 17.8% of total food purchased by the HaFS industry by weight is wasted, of which 13.2% is avoidable and the remaining 4.6% is unavoidable. The objectives of this research are to:
identify the ‘true cost’ of food waste within different subsectors and operational
environments of the UK HaFS industry from a financial perspective. These estimates
take into consideration the following costs associated with food waste: food purchase1;
waste management; energy; water; labour2; administration3, and; transport.
understand the impact of how this ‘true cost’ changes over time; and
translate the true cost into an appropriate metric to engage senior staff and front line
staff within the HaFS industry.
Every effort has been made to ensure that the estimates in this report are as robust as possible, but the findings should still be treated with caution due to the small sample size used in some parts of the methodology. While the results displayed here provide a good indication of the true cost of waste, any business should consider its own situation and likely cost savings through reducing its own waste.
The true cost estimates
Table 1 shows the estimated total cost of food waste derived within this study. This shows that in 2011 the total cost of food waste generated within the UK HaFS sector is estimated at £2.5 billion per annum.
1 The Horizons definition of ‘food purchases’ is used, namely, at caterers’ buying prices (i.e. including any distributors’ margin) and exclude VAT. It does not refer to the cost of food purchases by the end consumer. 2 Labour refers to the back of house labour costs associated with the preparation and cooking of food destined to be wasted. 3 Administration refers to the invoicing costs associated with the purchasing of food destined to be wasted.
The True Cost of Food Waste within Hospitality and Food Service 4
Table 1 The estimated total cost of food waste in nine HaFS subsectors in 2011 (£Millions)
Subsector England Scotland Wales N. Ireland United Kingdom
Restaurants 642.4 24.2 8.7 7.2 682.4
QSR 259.6 9.8 4.1 3.4 276.8
Pubs 321.1 18.2 11.2 6.5 357.1
Hotels 258.4 42.7 14.4 2.2 317.8
Leisure 208.2 21.0 6.8 4.6 240.7
Staff catering 36.9 4.0 1.3 1.8 44.0
Healthcare 204.5 12.0 10.8 3.0 230.4
Education 205.9 23.4 12.6 7.7 249.5
Services 89.9 11.2 5.9 5.0 112.0
Total 2,226.9 166.4 75.8 41.5 2,510.6
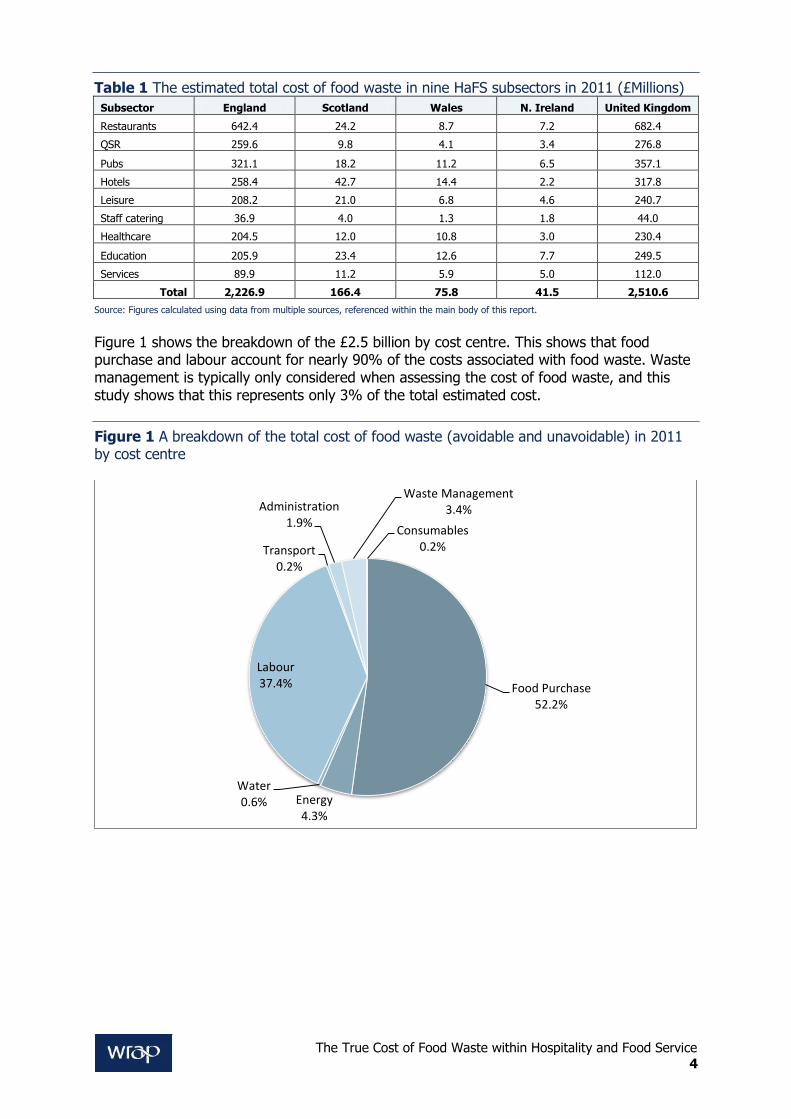
Source: Figures calculated using data from multiple sources, referenced within the main body of this report. Figure 1 shows the breakdown of the £2.5 billion by cost centre. This shows that food purchase and labour account for nearly 90% of the costs associated with food waste. Waste management is typically only considered when assessing the cost of food waste, and this study shows that this represents only 3% of the total estimated cost.
Figure 1 A breakdown of the total cost of food waste (avoidable and unavoidable) in 2011 by cost centre
Food Purchase 52.2%
Energy 4.3%
Water 0.6%
Labour 37.4%
Transport 0.2%
Administration 1.9%
Waste Management 3.4%
Consumables 0.2%
The True Cost of Food Waste within Hospitality and Food Service 5
The true cost estimates over time
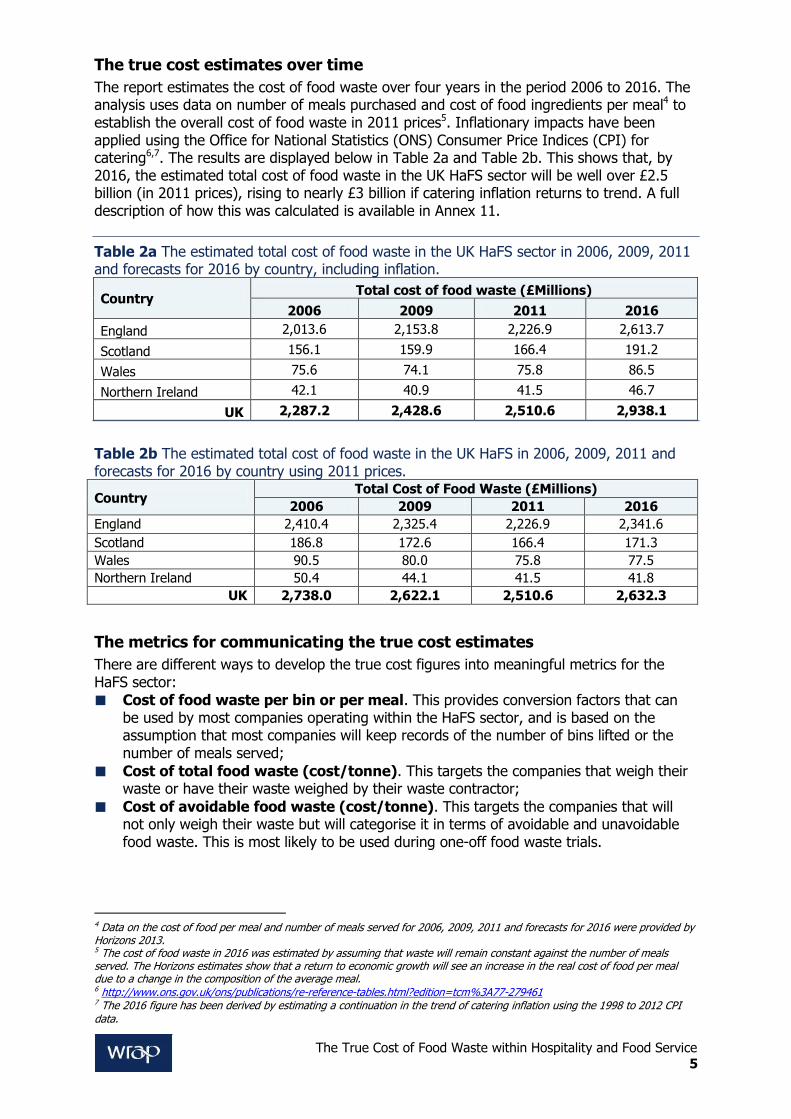
The report estimates the cost of food waste over four years in the period 2006 to 2016. The analysis uses data on number of meals purchased and cost of food ingredients per meal4 to establish the overall cost of food waste in 2011 prices5. Inflationary impacts have been applied using the Office for National Statistics (ONS) Consumer Price Indices (CPI) for catering6,7. The results are displayed below in Table 2a and Table 2b. This shows that, by 2016, the estimated total cost of food waste in the UK HaFS sector will be well over £2.5 billion (in 2011 prices), rising to nearly £3 billion if catering inflation returns to trend. A full description of how this was calculated is available in Annex 11.
Table 2a The estimated total cost of food waste in the UK HaFS sector in 2006, 2009, 2011 and forecasts for 2016 by country, including inflation.
Country Total cost of food waste (£Millions)
2006 2009 2011 2016
England 2,013.6 2,153.8 2,226.9 2,613.7
Scotland 156.1 159.9 166.4 191.2
Wales 75.6 74.1 75.8 86.5
Northern Ireland 42.1 40.9 41.5 46.7
UK 2,287.2 2,428.6 2,510.6 2,938.1
Table 2b The estimated total cost of food waste in the UK HaFS in 2006, 2009, 2011 and forecasts for 2016 by country using 2011 prices.
Country Total Cost of Food Waste (£Millions)
2006 2009 2011 2016
England 2,410.4 2,325.4 2,226.9 2,341.6
Scotland 186.8 172.6 166.4 171.3
Wales 90.5 80.0 75.8 77.5
Northern Ireland 50.4 44.1 41.5 41.8
UK 2,738.0 2,622.1 2,510.6 2,632.3
The metrics for communicating the true cost estimates
There are different ways to develop the true cost figures into meaningful metrics for the HaFS sector:
Cost of food waste per bin or per meal. This provides conversion factors that can be used by most companies operating within the HaFS sector, and is based on the assumption that most companies will keep records of the number of bins lifted or the number of meals served;
Cost of total food waste (cost/tonne). This targets the companies that weigh their waste or have their waste weighed by their waste contractor;
Cost of avoidable food waste (cost/tonne). This targets the companies that will not only weigh their waste but will categorise it in terms of avoidable and unavoidable food waste. This is most likely to be used during one-off food waste trials.
4 Data on the cost of food per meal and number of meals served for 2006, 2009, 2011 and forecasts for 2016 were provided by Horizons 2013. 5 The cost of food waste in 2016 was estimated by assuming that waste will remain constant against the number of meals served. The Horizons estimates show that a return to economic growth will see an increase in the real cost of food per meal due to a change in the composition of the average meal. 6 http://www.ons.gov.uk/ons/publications/re-reference-tables.html?edition=tcm%3A77-279461 7 The 2016 figure has been derived by estimating a continuation in the trend of catering inflation using the 1998 to 2012 CPI data.
The True Cost of Food Waste within Hospitality and Food Service 6
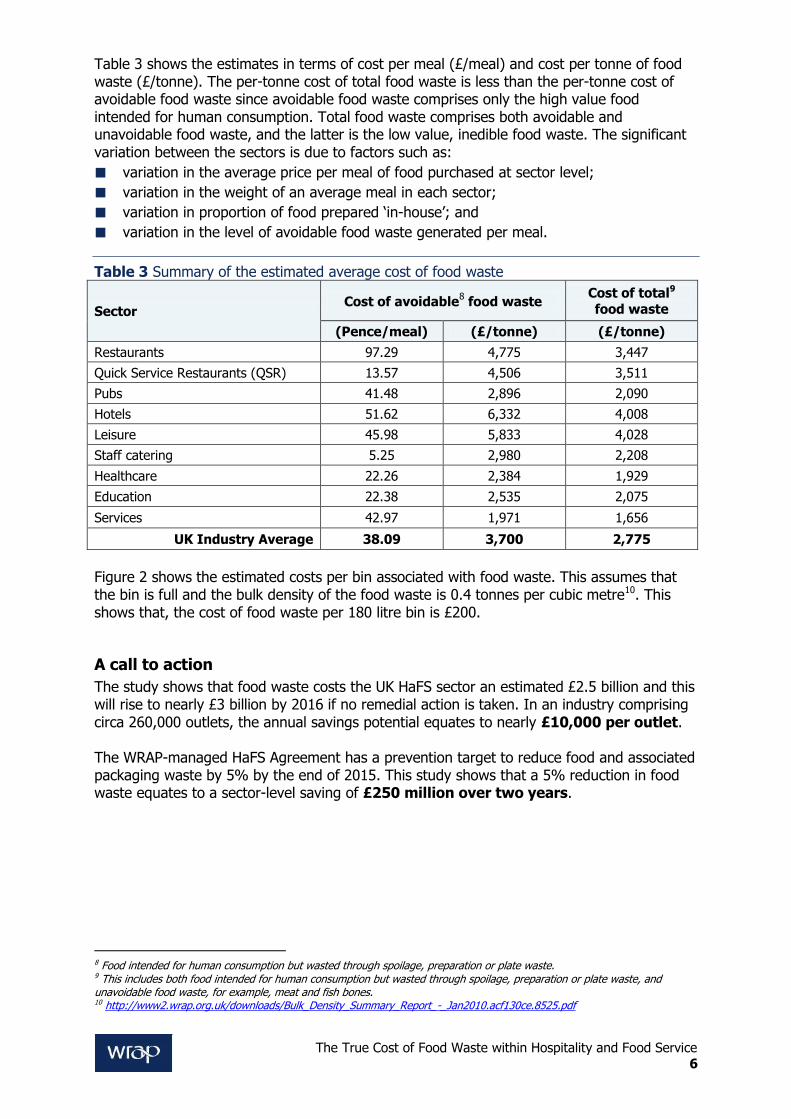
Table 3 shows the estimates in terms of cost per meal (£/meal) and cost per tonne of food waste (£/tonne). The per-tonne cost of total food waste is less than the per-tonne cost of avoidable food waste since avoidable food waste comprises only the high value food intended for human consumption. Total food waste comprises both avoidable and unavoidable food waste, and the latter is the low value, inedible food waste. The significant variation between the sectors is due to factors such as:
variation in the average price per meal of food purchased at sector level;
variation in the weight of an average meal in each sector;
variation in proportion of food prepared ‘in-house’; and
variation in the level of avoidable food waste generated per meal.
Table 3 Summary of the estimated average cost of food waste
Sector Cost of avoidable
8 food waste
Cost of total9
food waste
(Pence/meal) (£/tonne) (£/tonne)
Restaurants 97.29 4,775 3,447
Quick Service Restaurants (QSR) 13.57 4,506 3,511
Pubs 41.48 2,896 2,090
Hotels 51.62 6,332 4,008
Leisure 45.98 5,833 4,028
Staff catering 5.25 2,980 2,208
Healthcare 22.26 2,384 1,929
Education 22.38 2,535 2,075
Services 42.97 1,971 1,656
UK Industry Average 38.09 3,700 2,775
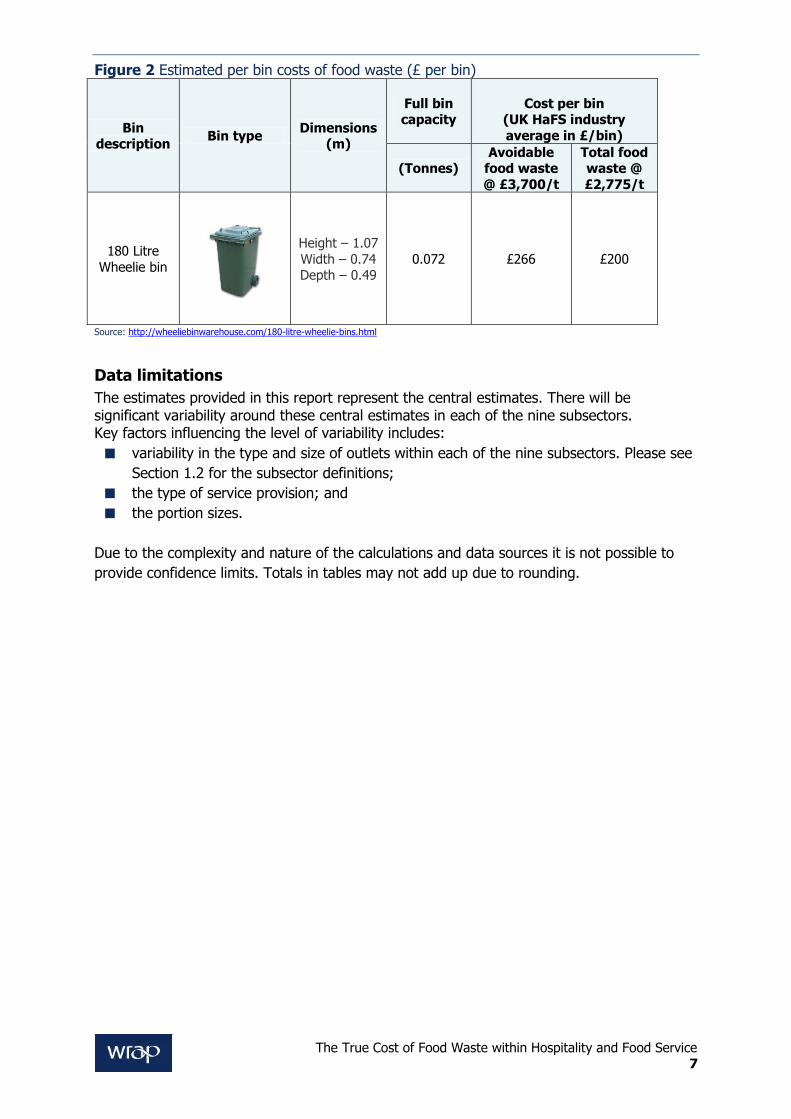
Figure 2 shows the estimated costs per bin associated with food waste. This assumes that the bin is full and the bulk density of the food waste is 0.4 tonnes per cubic metre10. This shows that, the cost of food waste per 180 litre bin is £200.
A call to action
The study shows that food waste costs the UK HaFS sector an estimated £2.5 billion and this will rise to nearly £3 billion by 2016 if no remedial action is taken. In an industry comprising circa 260,000 outlets, the annual savings potential equates to nearly £10,000 per outlet. The WRAP-managed HaFS Agreement has a prevention target to reduce food and associated packaging waste by 5% by the end of 2015. This study shows that a 5% reduction in food waste equates to a sector-level saving of £250 million over two years.
8 Food intended for human consumption but wasted through spoilage, preparation or plate waste. 9 This includes both food intended for human consumption but wasted through spoilage, preparation or plate waste, and unavoidable food waste, for example, meat and fish bones. 10 http://www2.wrap.org.uk/downloads/Bulk_Density_Summary_Report_-_Jan2010.acf130ce.8525.pdf
The True Cost of Food Waste within Hospitality and Food Service 7
Figure 2 Estimated per bin costs of food waste (£ per bin)
Bin description
Bin type Dimensions
(m)
Full bin capacity
Cost per bin (UK HaFS industry
average in £/bin)
(Tonnes) Avoidable
food waste
@ £3,700/t
Total food waste @
£2,775/t
180 Litre
Wheelie bin
Height – 1.07
Width – 0.74 Depth – 0.49
0.072 £266 £200
Source: http://wheeliebinwarehouse.com/180-litre-wheelie-bins.html
Data limitations
The estimates provided in this report represent the central estimates. There will be significant variability around these central estimates in each of the nine subsectors. Key factors influencing the level of variability includes:
variability in the type and size of outlets within each of the nine subsectors. Please see
Section 1.2 for the subsector definitions;
the type of service provision; and
the portion sizes.
Due to the complexity and nature of the calculations and data sources it is not possible to
provide confidence limits. Totals in tables may not add up due to rounding.
The True Cost of Food Waste within Hospitality and Food Service 8
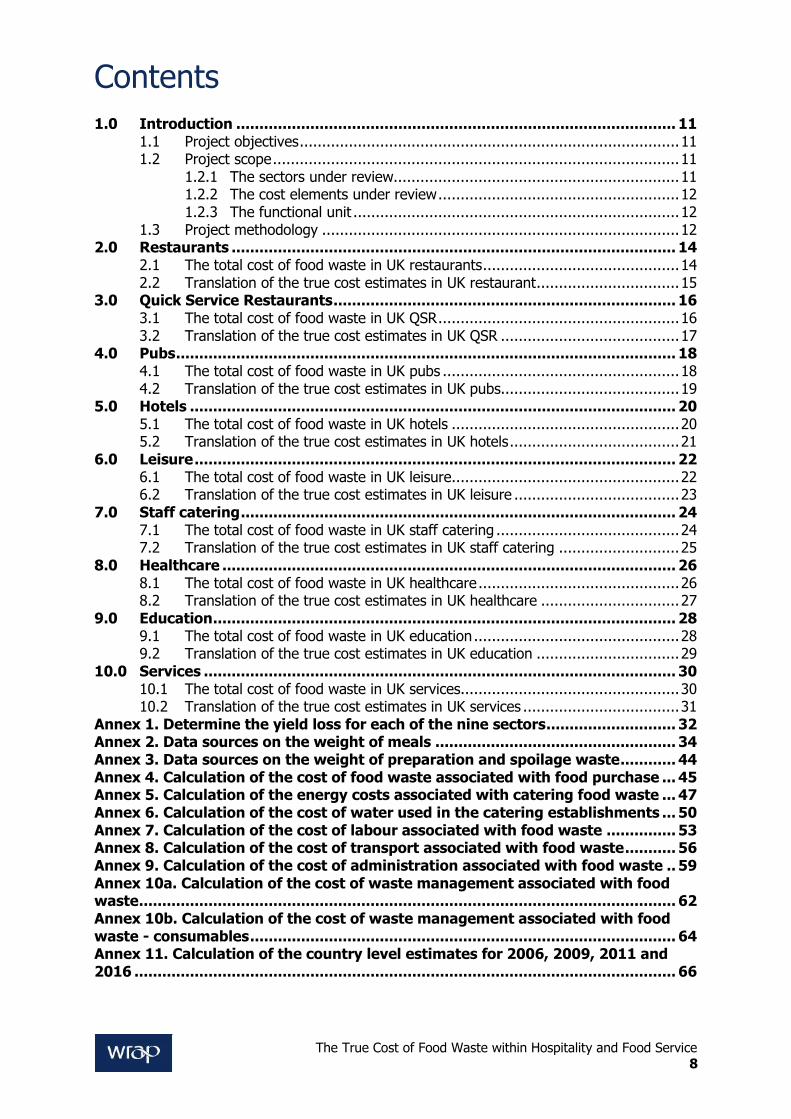
Contents
1.0 Introduction ............................................................................................... 11 1.1 Project objectives ..................................................................................... 11 1.2 Project scope ........................................................................................... 11
1.2.1 The sectors under review................................................................ 11 1.2.2 The cost elements under review ...................................................... 12 1.2.3 The functional unit ......................................................................... 12
1.3 Project methodology ................................................................................ 12 2.0 Restaurants ................................................................................................ 14
2.1 The total cost of food waste in UK restaurants ............................................ 14 2.2 Translation of the true cost estimates in UK restaurant ................................ 15
3.0 Quick Service Restaurants .......................................................................... 16 3.1 The total cost of food waste in UK QSR ...................................................... 16 3.2 Translation of the true cost estimates in UK QSR ........................................ 17
4.0 Pubs ............................................................................................................ 18 4.1 The total cost of food waste in UK pubs ..................................................... 18 4.2 Translation of the true cost estimates in UK pubs........................................ 19
5.0 Hotels ......................................................................................................... 20 5.1 The total cost of food waste in UK hotels ................................................... 20 5.2 Translation of the true cost estimates in UK hotels ...................................... 21
6.0 Leisure ........................................................................................................ 22 6.1 The total cost of food waste in UK leisure ................................................... 22 6.2 Translation of the true cost estimates in UK leisure ..................................... 23
7.0 Staff catering .............................................................................................. 24 7.1 The total cost of food waste in UK staff catering ......................................... 24 7.2 Translation of the true cost estimates in UK staff catering ........................... 25
8.0 Healthcare .................................................................................................. 26 8.1 The total cost of food waste in UK healthcare ............................................. 26 8.2 Translation of the true cost estimates in UK healthcare ............................... 27
9.0 Education .................................................................................................... 28 9.1 The total cost of food waste in UK education .............................................. 28 9.2 Translation of the true cost estimates in UK education ................................ 29
10.0 Services ...................................................................................................... 30 10.1 The total cost of food waste in UK services................................................. 30 10.2 Translation of the true cost estimates in UK services ................................... 31
Annex 1. Determine the yield loss for each of the nine sectors ............................ 32 Annex 2. Data sources on the weight of meals .................................................... 34 Annex 3. Data sources on the weight of preparation and spoilage waste ............ 44 Annex 4. Calculation of the cost of food waste associated with food purchase ... 45 Annex 5. Calculation of the energy costs associated with catering food waste ... 47 Annex 6. Calculation of the cost of water used in the catering establishments ... 50 Annex 7. Calculation of the cost of labour associated with food waste ............... 53 Annex 8. Calculation of the cost of transport associated with food waste ........... 56 Annex 9. Calculation of the cost of administration associated with food waste .. 59 Annex 10a. Calculation of the cost of waste management associated with food waste .................................................................................................................... 62 Annex 10b. Calculation of the cost of waste management associated with food waste - consumables ............................................................................................ 64 Annex 11. Calculation of the country level estimates for 2006, 2009, 2011 and 2016 ..................................................................................................................... 66
The True Cost of Food Waste within Hospitality and Food Service 9
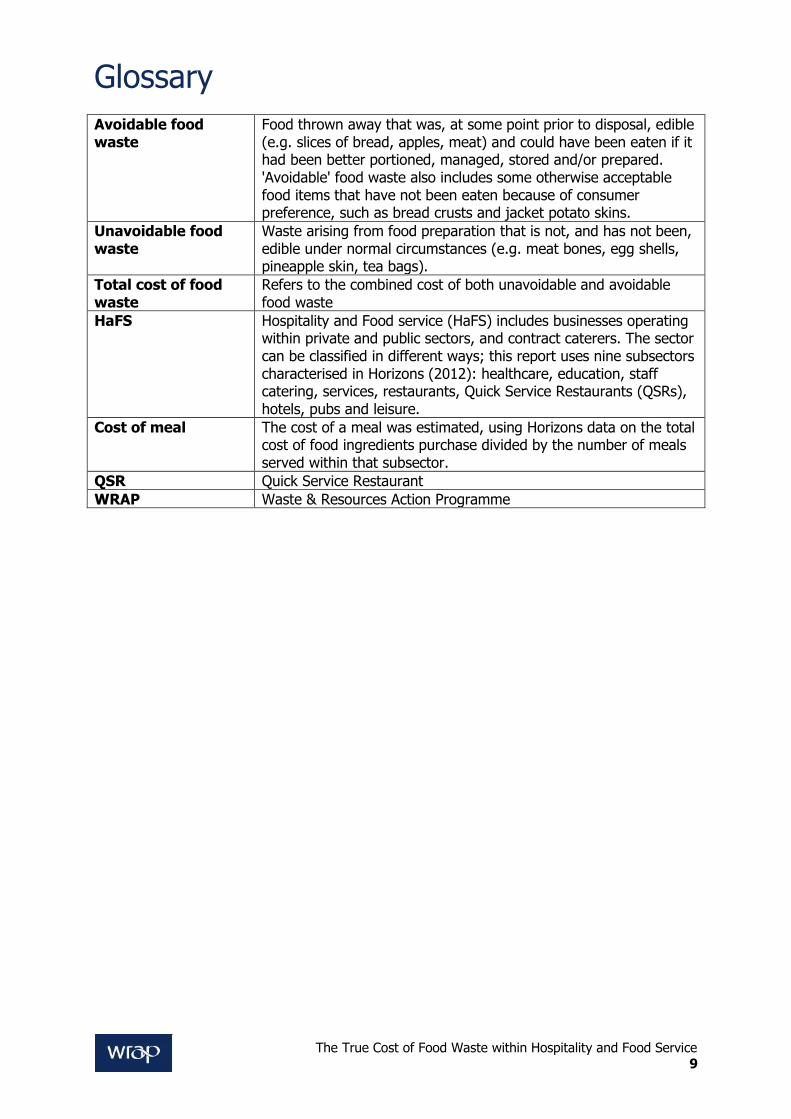
Glossary
Avoidable food waste
Food thrown away that was, at some point prior to disposal, edible (e.g. slices of bread, apples, meat) and could have been eaten if it had been better portioned, managed, stored and/or prepared. 'Avoidable' food waste also includes some otherwise acceptable food items that have not been eaten because of consumer preference, such as bread crusts and jacket potato skins.
Unavoidable food waste
Waste arising from food preparation that is not, and has not been, edible under normal circumstances (e.g. meat bones, egg shells, pineapple skin, tea bags).
Total cost of food waste
Refers to the combined cost of both unavoidable and avoidable food waste
HaFS Hospitality and Food service (HaFS) includes businesses operating within private and public sectors, and contract caterers. The sector can be classified in different ways; this report uses nine subsectors characterised in Horizons (2012): healthcare, education, staff catering, services, restaurants, Quick Service Restaurants (QSRs), hotels, pubs and leisure.
Cost of meal The cost of a meal was estimated, using Horizons data on the total cost of food ingredients purchase divided by the number of meals served within that subsector.
QSR Quick Service Restaurant
WRAP Waste & Resources Action Programme
The True Cost of Food Waste within Hospitality and Food Service 10
Acknowledgements We would like to thank the following organisations for their assistance in compiling this study:
DECC
Horizons
Hyder Consulting
People 1st
Sodexo
Unilever Food Solutions
William Murray
WRAP
The True Cost of Food Waste within Hospitality and Food Service 11
Introduction 1.1 Project objectives The objectives of this work are to:
identify the ‘true cost’ of food waste within different subsectors and operational
environments of the UK HaFS industry from a financial perspective. These estimates
take into consideration the following costs associated with food waste: food purchase;
waste management; energy; water; labour11; administration12, and; transport.
understand the impact of how this ‘true cost’ changes over time; and
translate this true cost into an appropriate metric to engage senior staff and front line
staff within and HaFS organisation.
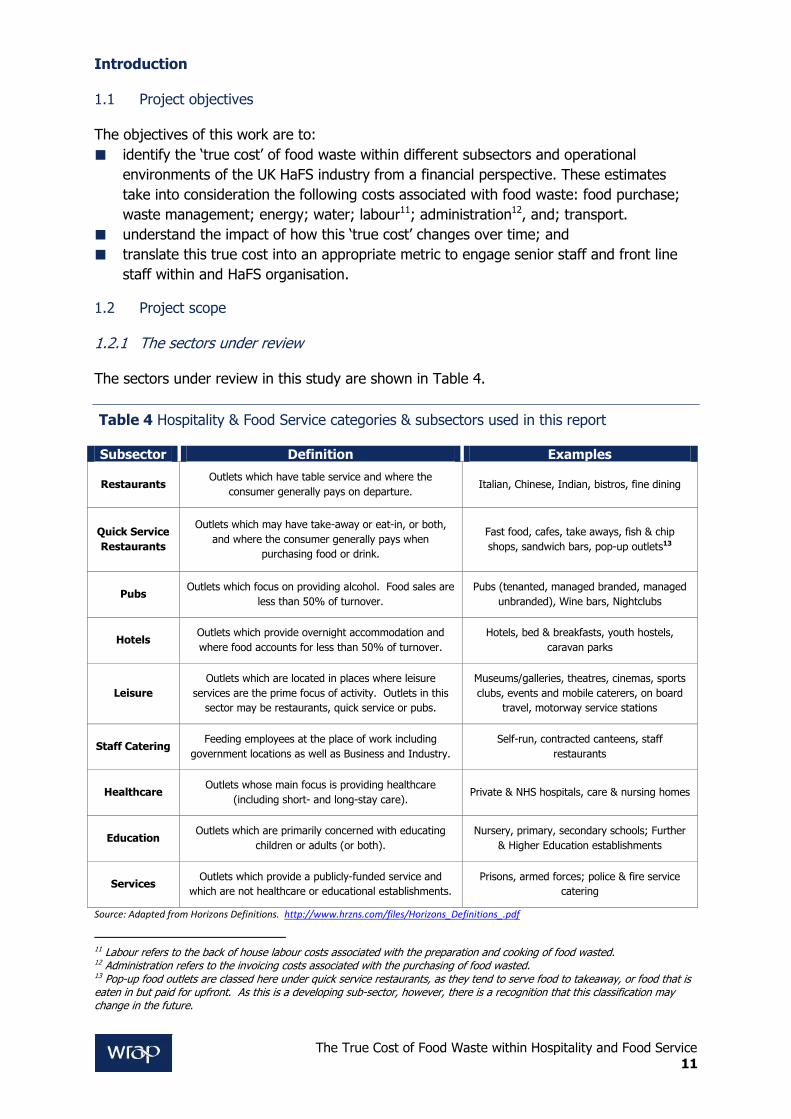
1.2 Project scope 1.2.1 The sectors under review The sectors under review in this study are shown in Table 4.
Table 4 Hospitality & Food Service categories & subsectors used in this report Subsector Definition Examples
Restaurants Outlets which have table service and where the
consumer generally pays on departure. Italian, Chinese, Indian, bistros, fine dining
Quick Service
Restaurants
Outlets which may have take-away or eat-in, or both,
and where the consumer generally pays when
purchasing food or drink.
Fast food, cafes, take aways, fish & chip
shops, sandwich bars, pop-up outlets13
Pubs Outlets which focus on providing alcohol. Food sales are
less than 50% of turnover.
Pubs (tenanted, managed branded, managed
unbranded), Wine bars, Nightclubs
Hotels Outlets which provide overnight accommodation and
where food accounts for less than 50% of turnover.
Hotels, bed & breakfasts, youth hostels,
caravan parks
Leisure
Outlets which are located in places where leisure
services are the prime focus of activity. Outlets in this
sector may be restaurants, quick service or pubs.
Museums/galleries, theatres, cinemas, sports
clubs, events and mobile caterers, on board
travel, motorway service stations
Staff Catering Feeding employees at the place of work including
government locations as well as Business and Industry.
Self-run, contracted canteens, staff
restaurants
Healthcare Outlets whose main focus is providing healthcare
(including short- and long-stay care). Private & NHS hospitals, care & nursing homes
Education Outlets which are primarily concerned with educating
children or adults (or both).
Nursery, primary, secondary schools; Further
& Higher Education establishments
Services Outlets which provide a publicly-funded service and
which are not healthcare or educational establishments.
Prisons, armed forces; police & fire service
catering
Source: Adapted from Horizons Definitions. http://www.hrzns.com/files/Horizons_Definitions_.pdf
11 Labour refers to the back of house labour costs associated with the preparation and cooking of food wasted. 12 Administration refers to the invoicing costs associated with the purchasing of food wasted. 13 Pop-up food outlets are classed here under quick service restaurants, as they tend to serve food to takeaway, or food that is eaten in but paid for upfront. As this is a developing sub-sector, however, there is a recognition that this classification may change in the future.
The True Cost of Food Waste within Hospitality and Food Service 12
1.2.2 The cost elements under review
The cost elements under review in this study were:
food purchase: the total cost of food purchases by the HaFS;
energy used within the catering establishment: the variable costs or operational energy
costs associated with the preparation and cooking of meals (fixed energy costs
associated with lighting, etc. are excluded from the calculations);
water used within the catering establishment: the water costs associated with the back
of house preparation and cooking the meals, excluding water used for domestic-type
activities and other water consumption from the front of house;
labour: the costs of kitchen staff associated with the preparation and cooking of food,
i.e. kitchen and catering assistants, cooks and chefs;
transport: the transport costs associated with the collection of food supplies by HaFS
outlets;
administration: the costs associated with the invoicing of food supplies;
waste management: the costs associated with the management of all food waste,
e.g. waste contractor costs and running costs of sink disposal units etc., including the
costs of consumables used for the management of food waste (e.g. bin bags).
The focus of the study is on the costs of food waste incurred by the UK HaFS industry. The supply chain costs, such as water and energy used in growing the food, are embedded in the food purchase costs. 1.2.3 The functional unit The following functional units were used in this study:
cost of total food waste in pence per meal;
cost of avoidable food waste in £ per tonne;
cost of total food waste, i.e. avoidable and unavoidable food waste, in £ per tonne; and
cost of total food waste in £ per bin.
1.3 Project methodology The study comprised six steps (Figure 3):
Step 1: Determine the yield loss by subsector, using:
o Total weight of food waste (tonnes) / Total weight of purchased food (tonnes)
Step 2: Determine the total expenditure on each of the focus cost centres by subsector;
Step 3: Determine the total cost of food waste associated with each cost centre by
multiplying the calculations made in Step 1 by those in Step 2;
Step 4: Determine the cost per functional unit by dividing the total cost of waste,
derived in Step 3, by:
o Total meals served: to estimate the total cost of food waste per meal.
o Total avoidable food waste: to estimate the cost of avoidable food waste in
terms of cost per tonne.
o Total food waste: to estimate the cost of total food waste in terms of cost per
tonne.
o Average bin weight: to estimate the cost of food waste per bin.

The True Cost of Food Waste within Hospitality and Food Service 13
Step 5: Determine the estimates for 2006, 2009, 2011 and forecasts for 2016 using
Horizons data for the four years on number of meals served and cost of food purchased
by country and by subsector, and;
Step 6: Determine estimates by nation: England, Scotland, Wales and Northern Ireland. Sections 2 to 10 show the results for each of the nine subsectors, and the associated calculations can be seen in the Annexes.
Figure 3 The six-step methodology used in the project
Determine the yield loss by weight (%
of food wasted) in
each of the 9 subsectors
Determine the total
subsector costs
associated with each
cost element
Determine the total cost of food waste in each of the 9 subsectors
Determine the cost per functional
unit for each of the 9
subsectors
Determine the estimates
for 2006, 2009 and
forecasts for 2016
Determine the country
level estimates for each of the 9
subsectors
The True Cost of Food Waste within Hospitality and Food Service 14
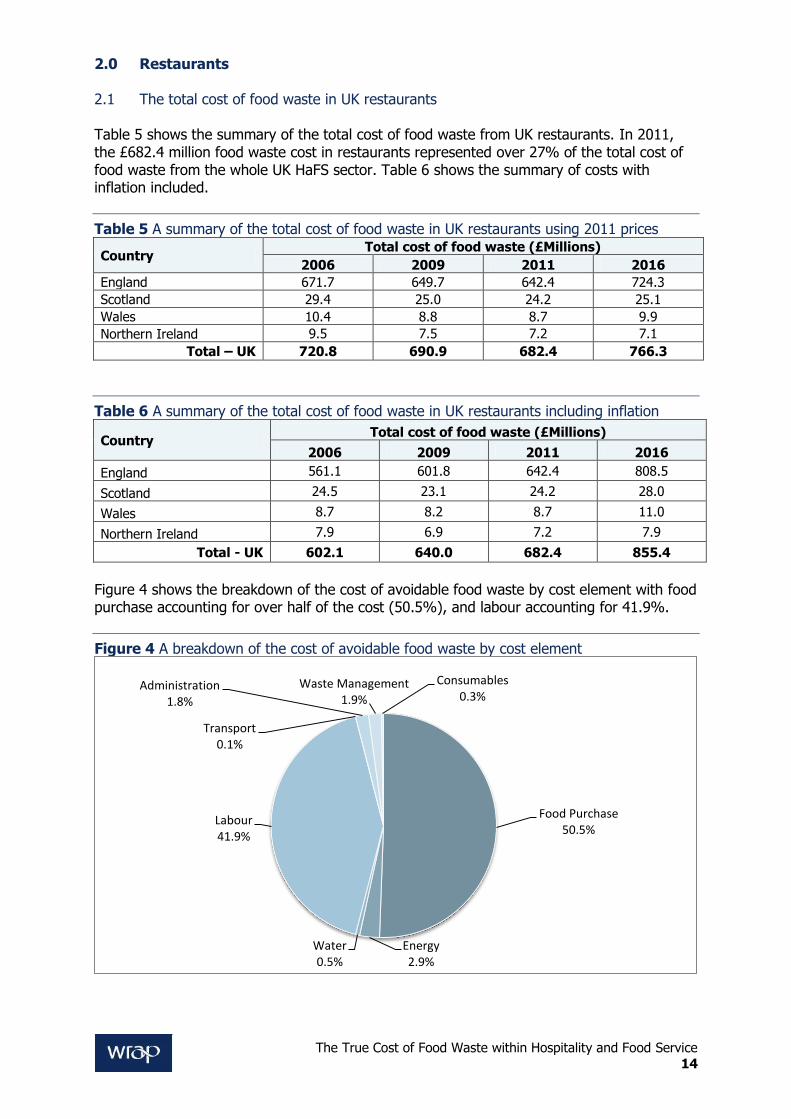
2.0 Restaurants 2.1 The total cost of food waste in UK restaurants Table 5 shows the summary of the total cost of food waste from UK restaurants. In 2011, the £682.4 million food waste cost in restaurants represented over 27% of the total cost of food waste from the whole UK HaFS sector. Table 6 shows the summary of costs with inflation included.
Table 5 A summary of the total cost of food waste in UK restaurants using 2011 prices
Country Total cost of food waste (£Millions)
2006 2009 2011 2016
England 671.7 649.7 642.4 724.3
Scotland 29.4 25.0 24.2 25.1
Wales 10.4 8.8 8.7 9.9
Northern Ireland 9.5 7.5 7.2 7.1
Total – UK 720.8 690.9 682.4 766.3
Table 6 A summary of the total cost of food waste in UK restaurants including inflation
Country Total cost of food waste (£Millions)
2006 2009 2011 2016
England 561.1 601.8 642.4 808.5
Scotland 24.5 23.1 24.2 28.0
Wales 8.7 8.2 8.7 11.0
Northern Ireland 7.9 6.9 7.2 7.9
Total - UK 602.1 640.0 682.4 855.4
Figure 4 shows the breakdown of the cost of avoidable food waste by cost element with food purchase accounting for over half of the cost (50.5%), and labour accounting for 41.9%.
Figure 4 A breakdown of the cost of avoidable food waste by cost element
Food Purchase 50.5%
Energy 2.9%
Water 0.5%
Labour 41.9%
Transport 0.1%
Administration 1.8%
Waste Management 1.9%
Consumables 0.3%
The True Cost of Food Waste within Hospitality and Food Service 15
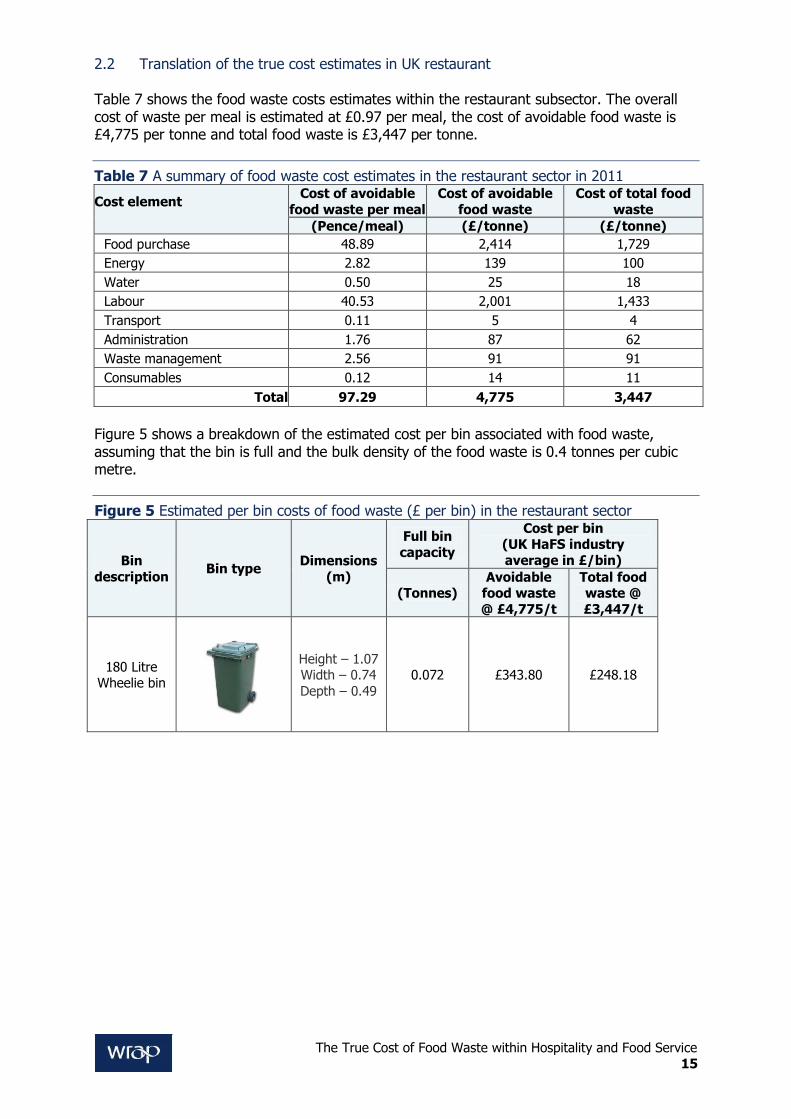
2.2 Translation of the true cost estimates in UK restaurant Table 7 shows the food waste costs estimates within the restaurant subsector. The overall cost of waste per meal is estimated at £0.97 per meal, the cost of avoidable food waste is £4,775 per tonne and total food waste is £3,447 per tonne.
Table 7 A summary of food waste cost estimates in the restaurant sector in 2011
Cost element
Cost of avoidable
food waste per meal
Cost of avoidable
food waste
Cost of total food
waste
(Pence/meal) (£/tonne) (£/tonne)
Food purchase 48.89 2,414 1,729
Energy 2.82 139 100
Water 0.50 25 18
Labour 40.53 2,001 1,433
Transport 0.11 5 4
Administration 1.76 87 62
Waste management 2.56 91 91
Consumables 0.12 14 11
Total 97.29 4,775 3,447
Figure 5 shows a breakdown of the estimated cost per bin associated with food waste, assuming that the bin is full and the bulk density of the food waste is 0.4 tonnes per cubic metre.
Figure 5 Estimated per bin costs of food waste (£ per bin) in the restaurant sector
Bin
description Bin type
Dimensions
(m)
Full bin
capacity
Cost per bin (UK HaFS industry
average in £/bin)
(Tonnes) Avoidable
food waste
@ £4,775/t
Total food waste @
£3,447/t
180 Litre Wheelie bin
Height – 1.07 Width – 0.74
Depth – 0.49
0.072 £343.80 £248.18
The True Cost of Food Waste within Hospitality and Food Service 16
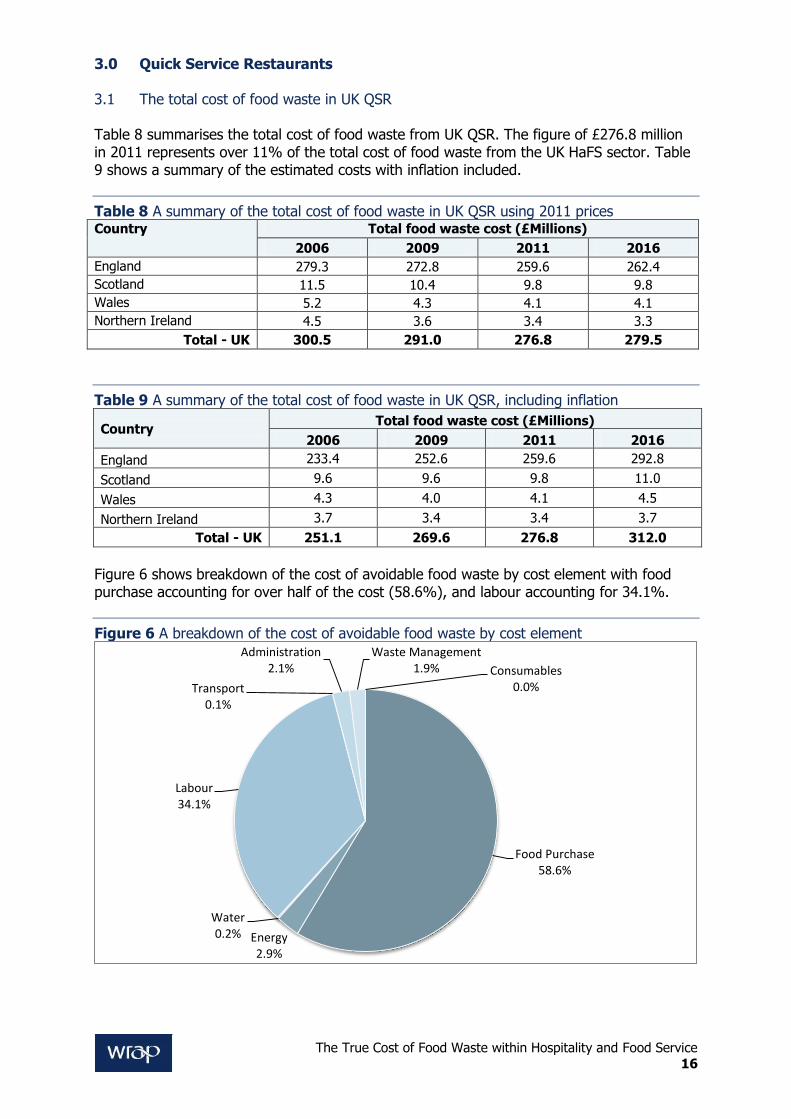
3.0 Quick Service Restaurants 3.1 The total cost of food waste in UK QSR Table 8 summarises the total cost of food waste from UK QSR. The figure of £276.8 million in 2011 represents over 11% of the total cost of food waste from the UK HaFS sector. Table 9 shows a summary of the estimated costs with inflation included.
Table 8 A summary of the total cost of food waste in UK QSR using 2011 prices Country Total food waste cost (£Millions)
2006 2009 2011 2016
England 279.3 272.8 259.6 262.4
Scotland 11.5 10.4 9.8 9.8
Wales 5.2 4.3 4.1 4.1
Northern Ireland 4.5 3.6 3.4 3.3
Total - UK 300.5 291.0 276.8 279.5
Table 9 A summary of the total cost of food waste in UK QSR, including inflation
Country Total food waste cost (£Millions)
2006 2009 2011 2016
England 233.4 252.6 259.6 292.8
Scotland 9.6 9.6 9.8 11.0
Wales 4.3 4.0 4.1 4.5
Northern Ireland 3.7 3.4 3.4 3.7
Total - UK 251.1 269.6 276.8 312.0
Figure 6 shows breakdown of the cost of avoidable food waste by cost element with food purchase accounting for over half of the cost (58.6%), and labour accounting for 34.1%.
Figure 6 A breakdown of the cost of avoidable food waste by cost element
Food Purchase 58.6%
Energy 2.9%
Water 0.2%
Labour 34.1%
Transport 0.1%
Administration 2.1%
Waste Management 1.9% Consumables
0.0%
The True Cost of Food Waste within Hospitality and Food Service 17
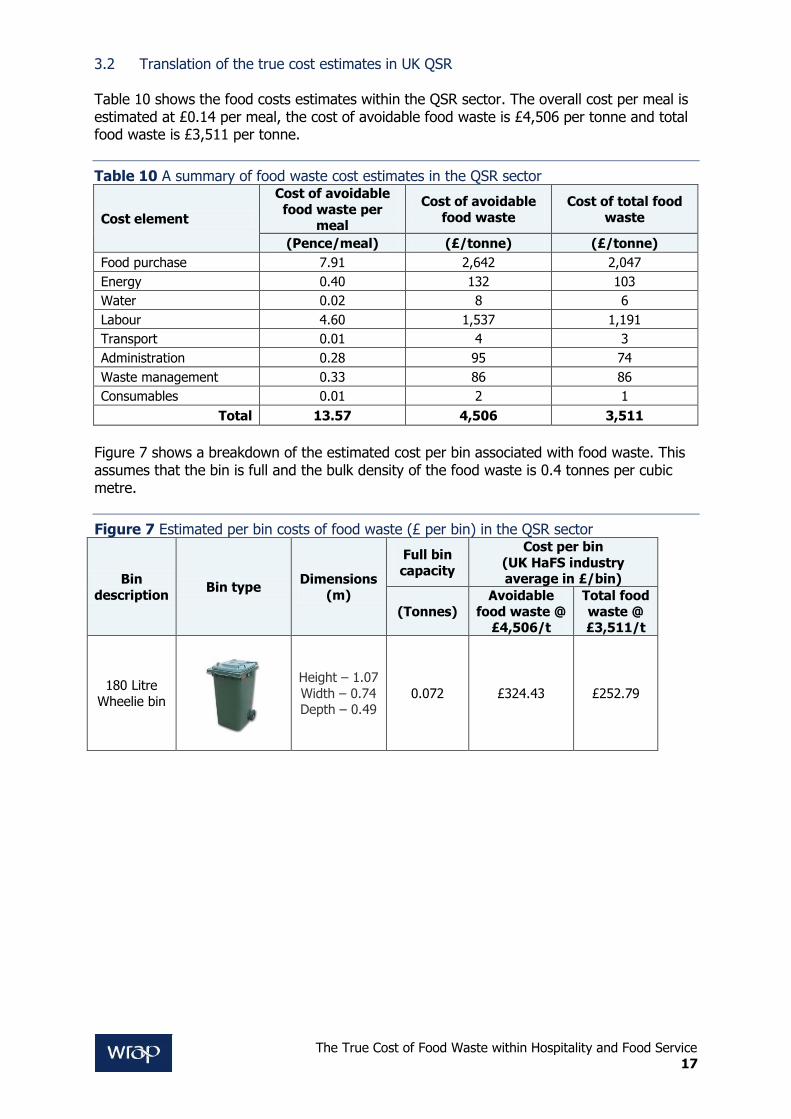
3.2 Translation of the true cost estimates in UK QSR Table 10 shows the food costs estimates within the QSR sector. The overall cost per meal is estimated at £0.14 per meal, the cost of avoidable food waste is £4,506 per tonne and total food waste is £3,511 per tonne.
Table 10 A summary of food waste cost estimates in the QSR sector
Cost element
Cost of avoidable
food waste per meal
Cost of avoidable
food waste
Cost of total food
waste
(Pence/meal) (£/tonne) (£/tonne)
Food purchase 7.91 2,642 2,047
Energy 0.40 132 103
Water 0.02 8 6
Labour 4.60 1,537 1,191
Transport 0.01 4 3
Administration 0.28 95 74
Waste management 0.33 86 86
Consumables 0.01 2 1
Total 13.57 4,506 3,511
Figure 7 shows a breakdown of the estimated cost per bin associated with food waste. This assumes that the bin is full and the bulk density of the food waste is 0.4 tonnes per cubic metre.
Figure 7 Estimated per bin costs of food waste (£ per bin) in the QSR sector
Bin
description Bin type
Dimensions
(m)
Full bin
capacity
Cost per bin
(UK HaFS industry average in £/bin)
(Tonnes)
Avoidable
food waste @ £4,506/t
Total food
waste @ £3,511/t
180 Litre
Wheelie bin
Height – 1.07
Width – 0.74 Depth – 0.49
0.072 £324.43 £252.79
The True Cost of Food Waste within Hospitality and Food Service 18
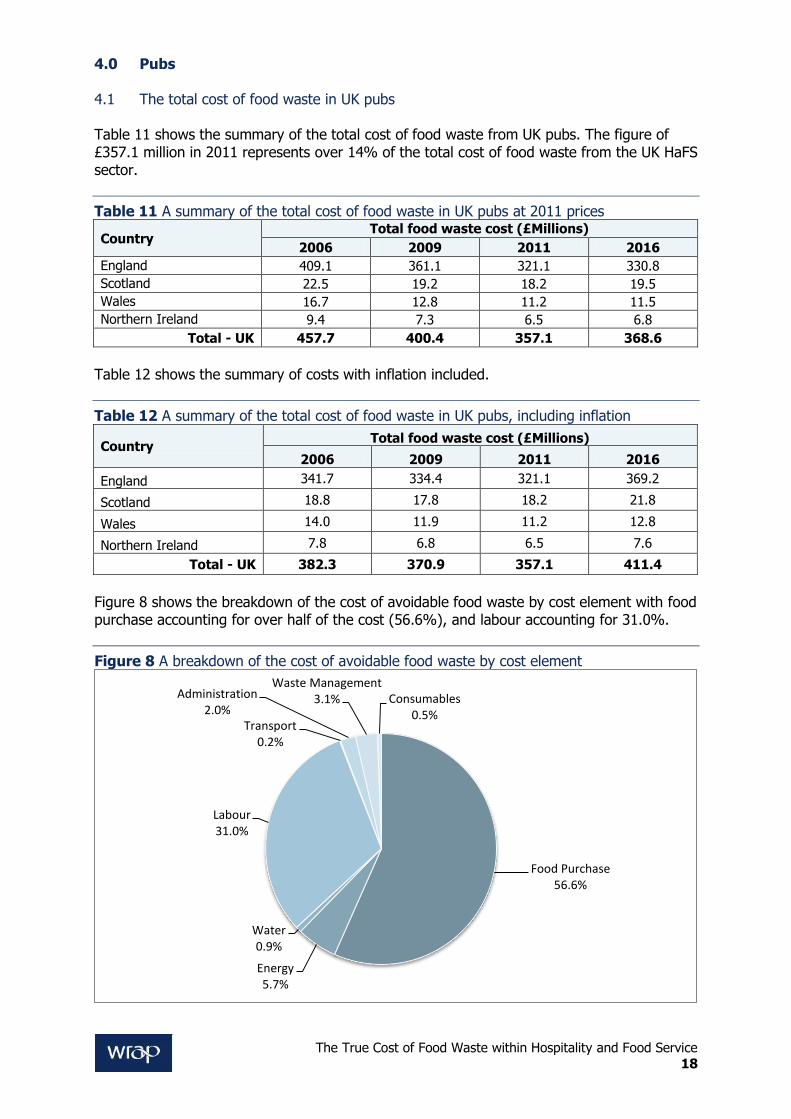
4.0 Pubs 4.1 The total cost of food waste in UK pubs Table 11 shows the summary of the total cost of food waste from UK pubs. The figure of £357.1 million in 2011 represents over 14% of the total cost of food waste from the UK HaFS sector.
Table 11 A summary of the total cost of food waste in UK pubs at 2011 prices
Country Total food waste cost (£Millions)
2006 2009 2011 2016
England 409.1 361.1 321.1 330.8
Scotland 22.5 19.2 18.2 19.5
Wales 16.7 12.8 11.2 11.5
Northern Ireland 9.4 7.3 6.5 6.8
Total - UK 457.7 400.4 357.1 368.6
Table 12 shows the summary of costs with inflation included.
Table 12 A summary of the total cost of food waste in UK pubs, including inflation
Country Total food waste cost (£Millions)
2006 2009 2011 2016
England 341.7 334.4 321.1 369.2
Scotland 18.8 17.8 18.2 21.8
Wales 14.0 11.9 11.2 12.8
Northern Ireland 7.8 6.8 6.5 7.6
Total - UK 382.3 370.9 357.1 411.4
Figure 8 shows the breakdown of the cost of avoidable food waste by cost element with food purchase accounting for over half of the cost (56.6%), and labour accounting for 31.0%.
Figure 8 A breakdown of the cost of avoidable food waste by cost element
Food Purchase 56.6%
Energy 5.7%
Water 0.9%
Labour 31.0%
Transport 0.2%
Administration 2.0%
Waste Management 3.1% Consumables
0.5%
The True Cost of Food Waste within Hospitality and Food Service 19
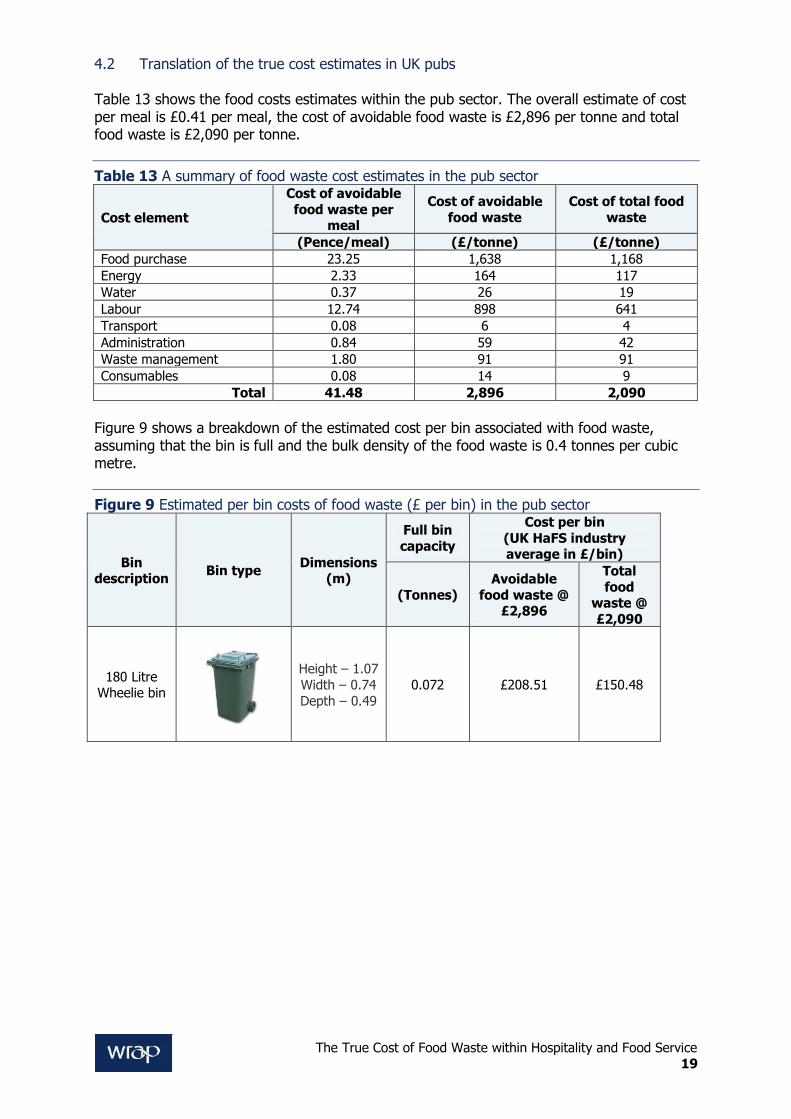
4.2 Translation of the true cost estimates in UK pubs Table 13 shows the food costs estimates within the pub sector. The overall estimate of cost per meal is £0.41 per meal, the cost of avoidable food waste is £2,896 per tonne and total food waste is £2,090 per tonne.
Table 13 A summary of food waste cost estimates in the pub sector
Cost element
Cost of avoidable
food waste per meal
Cost of avoidable
food waste
Cost of total food
waste
(Pence/meal) (£/tonne) (£/tonne)
Food purchase 23.25 1,638 1,168
Energy 2.33 164 117
Water 0.37 26 19
Labour 12.74 898 641
Transport 0.08 6 4
Administration 0.84 59 42
Waste management 1.80 91 91
Consumables 0.08 14 9
Total 41.48 2,896 2,090
Figure 9 shows a breakdown of the estimated cost per bin associated with food waste, assuming that the bin is full and the bulk density of the food waste is 0.4 tonnes per cubic metre.
Figure 9 Estimated per bin costs of food waste (£ per bin) in the pub sector
Bin description
Bin type Dimensions
(m)
Full bin
capacity
Cost per bin
(UK HaFS industry average in £/bin)
(Tonnes)
Avoidable
food waste @ £2,896
Total
food waste @
£2,090
180 Litre Wheelie bin
Height – 1.07
Width – 0.74
Depth – 0.49
0.072 £208.51 £150.48
The True Cost of Food Waste within Hospitality and Food Service 20
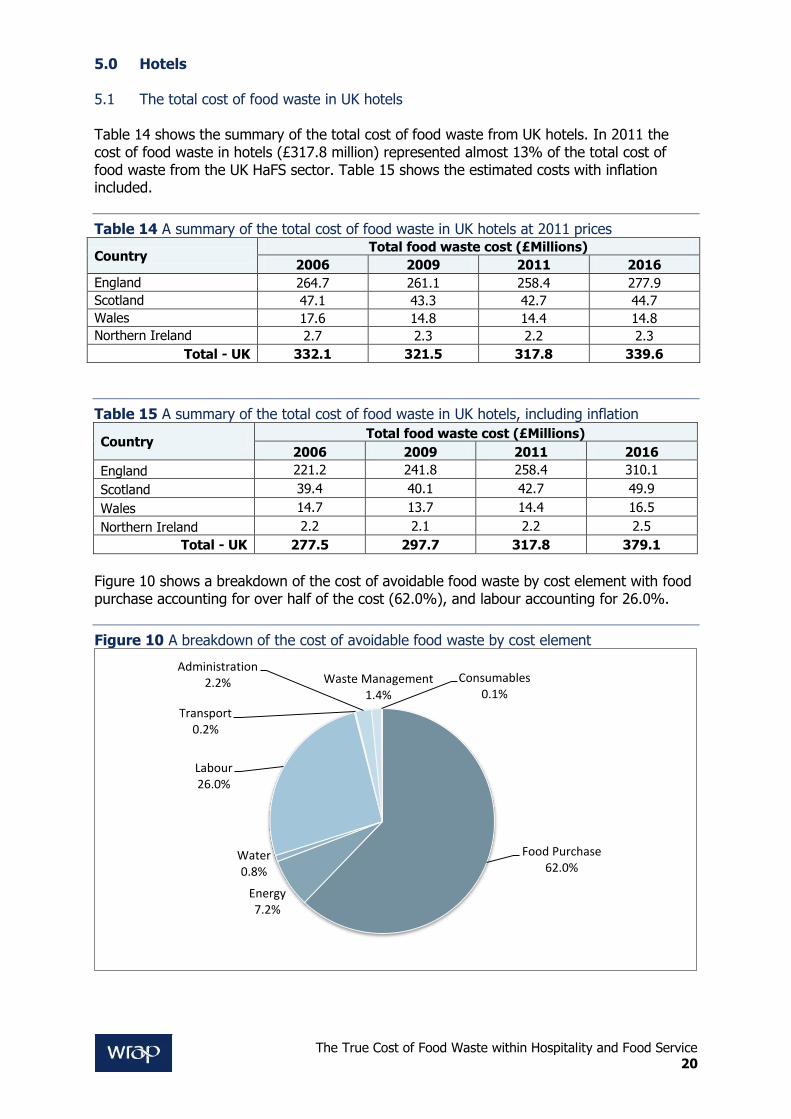
5.0 Hotels 5.1 The total cost of food waste in UK hotels Table 14 shows the summary of the total cost of food waste from UK hotels. In 2011 the cost of food waste in hotels (£317.8 million) represented almost 13% of the total cost of food waste from the UK HaFS sector. Table 15 shows the estimated costs with inflation included.
Table 14 A summary of the total cost of food waste in UK hotels at 2011 prices
Country Total food waste cost (£Millions)
2006 2009 2011 2016
England 264.7 261.1 258.4 277.9
Scotland 47.1 43.3 42.7 44.7
Wales 17.6 14.8 14.4 14.8
Northern Ireland 2.7 2.3 2.2 2.3
Total - UK 332.1 321.5 317.8 339.6
Table 15 A summary of the total cost of food waste in UK hotels, including inflation
Country Total food waste cost (£Millions)
2006 2009 2011 2016
England 221.2 241.8 258.4 310.1
Scotland 39.4 40.1 42.7 49.9
Wales 14.7 13.7 14.4 16.5
Northern Ireland 2.2 2.1 2.2 2.5
Total - UK 277.5 297.7 317.8 379.1
Figure 10 shows a breakdown of the cost of avoidable food waste by cost element with food purchase accounting for over half of the cost (62.0%), and labour accounting for 26.0%.
Figure 10 A breakdown of the cost of avoidable food waste by cost element
Food Purchase 62.0%
Energy 7.2%
Water 0.8%
Labour 26.0%
Transport 0.2%
Administration 2.2% Waste Management
1.4%
Consumables 0.1%
The True Cost of Food Waste within Hospitality and Food Service 21
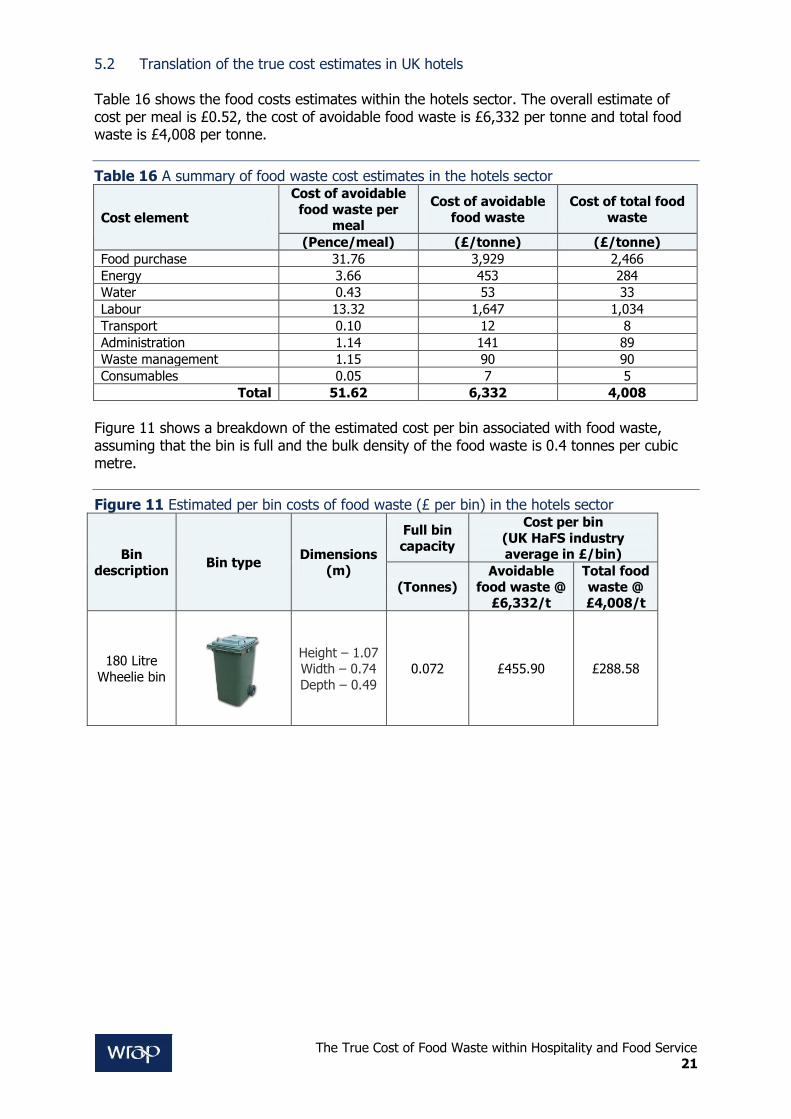
5.2 Translation of the true cost estimates in UK hotels Table 16 shows the food costs estimates within the hotels sector. The overall estimate of cost per meal is £0.52, the cost of avoidable food waste is £6,332 per tonne and total food waste is £4,008 per tonne.
Table 16 A summary of food waste cost estimates in the hotels sector
Cost element
Cost of avoidable
food waste per meal
Cost of avoidable
food waste
Cost of total food
waste
(Pence/meal) (£/tonne) (£/tonne)
Food purchase 31.76 3,929 2,466
Energy 3.66 453 284
Water 0.43 53 33
Labour 13.32 1,647 1,034
Transport 0.10 12 8
Administration 1.14 141 89
Waste management 1.15 90 90
Consumables 0.05 7 5
Total 51.62 6,332 4,008
Figure 11 shows a breakdown of the estimated cost per bin associated with food waste, assuming that the bin is full and the bulk density of the food waste is 0.4 tonnes per cubic metre.
Figure 11 Estimated per bin costs of food waste (£ per bin) in the hotels sector
Bin
description Bin type
Dimensions
(m)
Full bin
capacity
Cost per bin
(UK HaFS industry average in £/bin)
(Tonnes)
Avoidable
food waste @ £6,332/t
Total food
waste @ £4,008/t
180 Litre
Wheelie bin
Height – 1.07 Width – 0.74
Depth – 0.49
0.072 £455.90 £288.58
The True Cost of Food Waste within Hospitality and Food Service 22
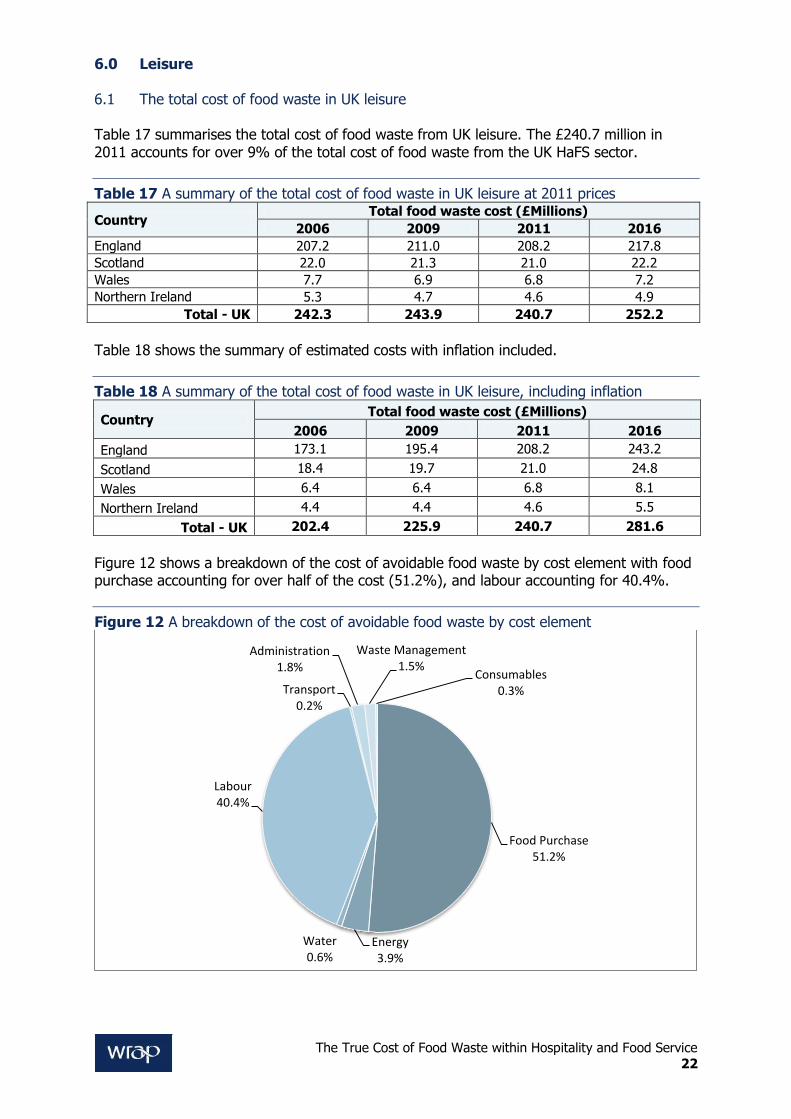
6.0 Leisure 6.1 The total cost of food waste in UK leisure Table 17 summarises the total cost of food waste from UK leisure. The £240.7 million in 2011 accounts for over 9% of the total cost of food waste from the UK HaFS sector.
Table 17 A summary of the total cost of food waste in UK leisure at 2011 prices
Country Total food waste cost (£Millions)
2006 2009 2011 2016
England 207.2 211.0 208.2 217.8
Scotland 22.0 21.3 21.0 22.2
Wales 7.7 6.9 6.8 7.2
Northern Ireland 5.3 4.7 4.6 4.9
Total - UK 242.3 243.9 240.7 252.2
Table 18 shows the summary of estimated costs with inflation included.
Table 18 A summary of the total cost of food waste in UK leisure, including inflation
Country Total food waste cost (£Millions)
2006 2009 2011 2016
England 173.1 195.4 208.2 243.2
Scotland 18.4 19.7 21.0 24.8
Wales 6.4 6.4 6.8 8.1
Northern Ireland 4.4 4.4 4.6 5.5
Total - UK 202.4 225.9 240.7 281.6
Figure 12 shows a breakdown of the cost of avoidable food waste by cost element with food purchase accounting for over half of the cost (51.2%), and labour accounting for 40.4%.
Figure 12 A breakdown of the cost of avoidable food waste by cost element
Food Purchase 51.2%
Energy 3.9%
Water 0.6%
Labour 40.4%
Transport 0.2%
Administration 1.8%
Waste Management 1.5%
Consumables 0.3%

The True Cost of Food Waste within Hospitality and Food Service 23
6.2 Translation of the true cost estimates in UK leisure Table 19 shows the food costs estimates within the leisure sector. The overall cost per meal is estimated at £0.46 per meal, the cost of avoidable food waste is £5,833 per tonne and total food waste is £4,028 per tonne.
Table 19 A summary of food waste cost estimates in the leisure sector
Cost element
Cost of avoidable
food waste per meal
Cost of avoidable
food waste
Cost of total food
waste
(Pence/meal) (£/tonne) (£/tonne)
Food purchase 23.43 2,989 2,049
Energy 1.76 225 154
Water 0.28 35 24
Labour 18.48 2,357 1,616
Transport 0.11 14 10
Administration 0.84 108 74
Waste management 1.03 90 90
Consumables 0.04 15 11
Total 45.98 5,833 4,028
Figure 13 shows a breakdown of the estimated cost per bin associated with food waste. This assumes that the bin is full and the bulk density of the food waste is 0.4 tonnes per cubic metre.
Figure 13 Estimated per bin costs of food waste (£ per bin) in the leisure sector
Bin
description Bin type
Dimensions
(m)
Full bin
capacity
Cost per bin
(UK HaFS industry average in £/bin)
(Tonnes)
Avoidable
food waste @ £5,833/t
Total food
waste @ £4,028/t
180 Litre
Wheelie bin
Height – 1.07 Width – 0.74
Depth – 0.49
0.072 £419.98 £290.02
The True Cost of Food Waste within Hospitality and Food Service 24
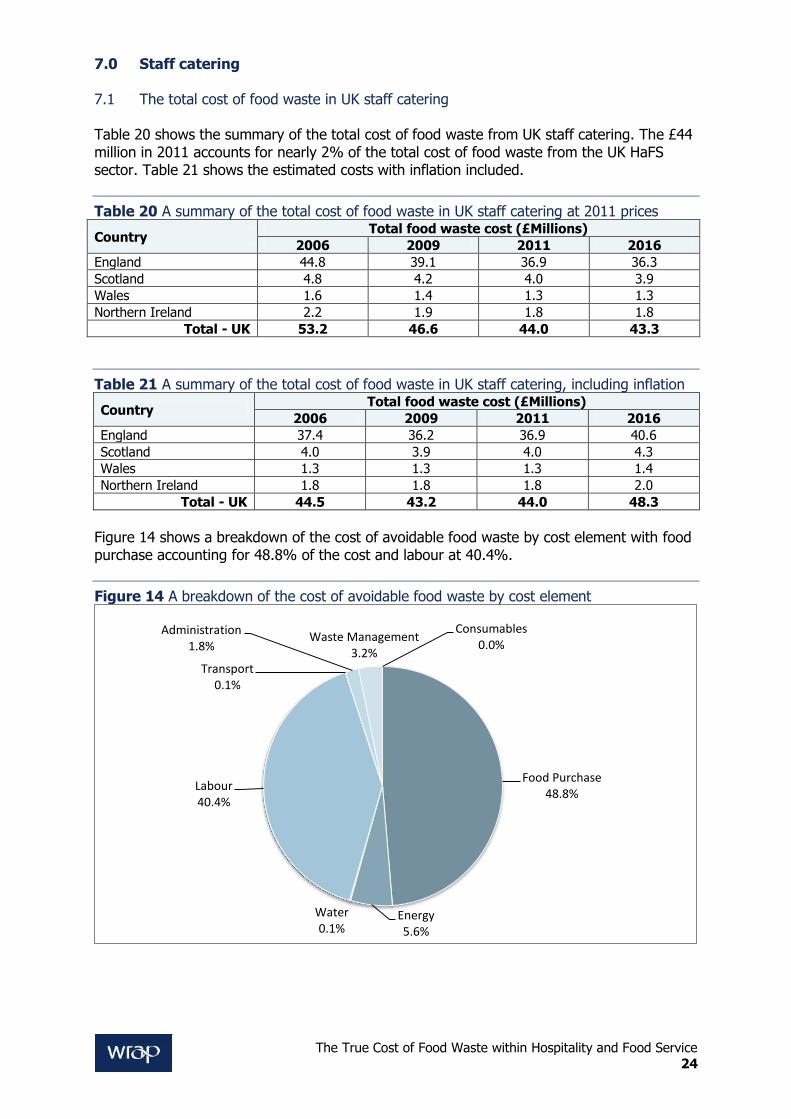
7.0 Staff catering 7.1 The total cost of food waste in UK staff catering Table 20 shows the summary of the total cost of food waste from UK staff catering. The £44 million in 2011 accounts for nearly 2% of the total cost of food waste from the UK HaFS sector. Table 21 shows the estimated costs with inflation included.
Table 20 A summary of the total cost of food waste in UK staff catering at 2011 prices
Country Total food waste cost (£Millions)
2006 2009 2011 2016
England 44.8 39.1 36.9 36.3
Scotland 4.8 4.2 4.0 3.9
Wales 1.6 1.4 1.3 1.3
Northern Ireland 2.2 1.9 1.8 1.8
Total - UK 53.2 46.6 44.0 43.3
Table 21 A summary of the total cost of food waste in UK staff catering, including inflation
Country Total food waste cost (£Millions)
2006 2009 2011 2016
England 37.4 36.2 36.9 40.6
Scotland 4.0 3.9 4.0 4.3
Wales 1.3 1.3 1.3 1.4
Northern Ireland 1.8 1.8 1.8 2.0
Total - UK 44.5 43.2 44.0 48.3
Figure 14 shows a breakdown of the cost of avoidable food waste by cost element with food purchase accounting for 48.8% of the cost and labour at 40.4%.
Figure 14 A breakdown of the cost of avoidable food waste by cost element
Food Purchase 48.8%
Energy 5.6%
Water 0.1%
Labour 40.4%
Transport 0.1%
Administration 1.8%
Waste Management 3.2%
Consumables 0.0%

The True Cost of Food Waste within Hospitality and Food Service 25
7.2 Translation of the true cost estimates in UK staff catering Table 22 shows the food costs estimates within the staff catering sector. The overall cost per meal is estimated at £0.05, the cost of avoidable food waste is £2,980 per tonne and total food waste is £2,208 per tonne.
Table 22 A summary of food waste cost estimates in the staff catering sector
Cost element
Cost of avoidable
food waste per meal
Cost of avoidable
food waste
Cost of total food
waste
(Pence/meal) (£/tonne) (£/tonne)
Food purchase 2.53 1,453 1,064
Energy 0.29 168 123
Water 0.01 4 3
Labour 2.09 1,204 881
Transport 0.01 3 2
Administration 0.09 52 38
Waste management 0.23 97 97
Consumables 0.01 1 <1
Total 5.25 2,980 2,208
Figure 15 shows a breakdown of the estimated cost per bin associated with food waste. This assumes that the bin is full and the bulk density of the food waste is 0.4 tonnes per cubic metre.
Figure 15 Estimated per bin costs of food waste (£ per bin) in the staff catering sector
Bin
description Bin type
Dimensions
(m)
Full bin
capacity
Cost per bin
(UK HaFS industry average in £/bin)
(Tonnes)
Avoidable
food waste @ £2,980/t
Total food
waste @ £2,208/t
180 Litre
Wheelie bin
Height – 1.07 Width – 0.74
Depth – 0.49
0.072 £214.56 £158.98
The True Cost of Food Waste within Hospitality and Food Service 26
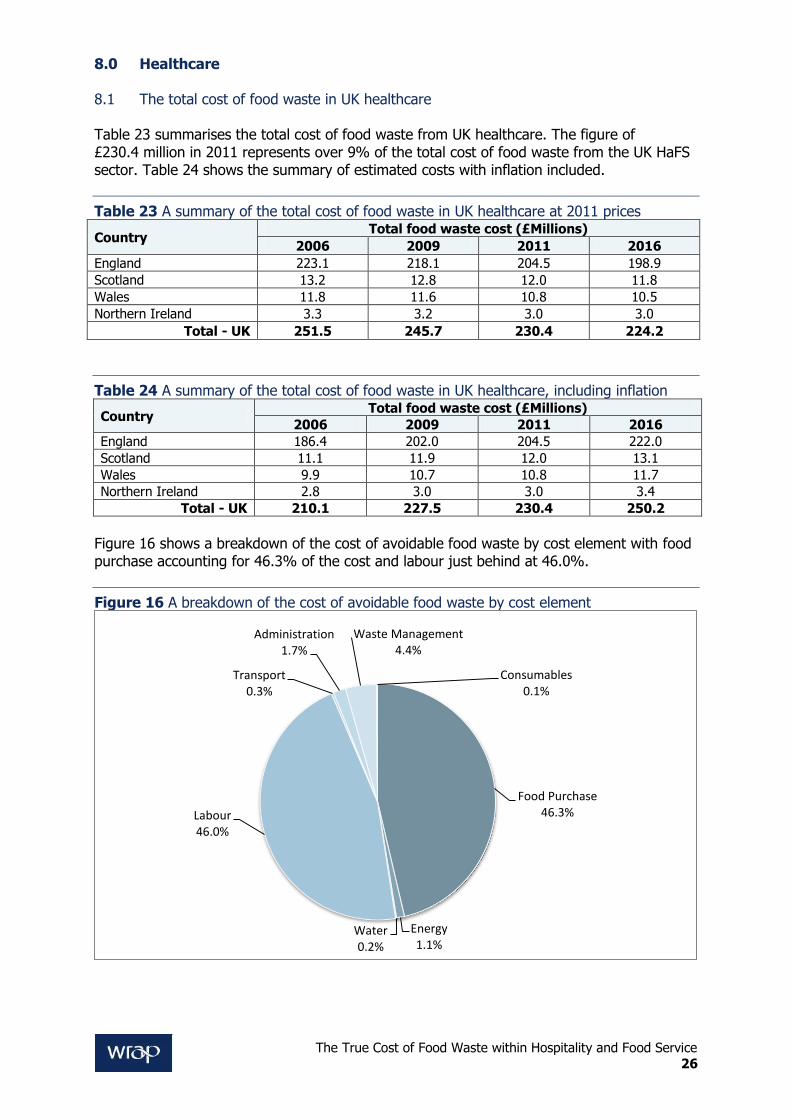
8.0 Healthcare 8.1 The total cost of food waste in UK healthcare Table 23 summarises the total cost of food waste from UK healthcare. The figure of £230.4 million in 2011 represents over 9% of the total cost of food waste from the UK HaFS sector. Table 24 shows the summary of estimated costs with inflation included.
Table 23 A summary of the total cost of food waste in UK healthcare at 2011 prices
Country Total food waste cost (£Millions)
2006 2009 2011 2016
England 223.1 218.1 204.5 198.9
Scotland 13.2 12.8 12.0 11.8
Wales 11.8 11.6 10.8 10.5
Northern Ireland 3.3 3.2 3.0 3.0
Total - UK 251.5 245.7 230.4 224.2
Table 24 A summary of the total cost of food waste in UK healthcare, including inflation
Country Total food waste cost (£Millions)
2006 2009 2011 2016
England 186.4 202.0 204.5 222.0
Scotland 11.1 11.9 12.0 13.1
Wales 9.9 10.7 10.8 11.7
Northern Ireland 2.8 3.0 3.0 3.4
Total - UK 210.1 227.5 230.4 250.2
Figure 16 shows a breakdown of the cost of avoidable food waste by cost element with food purchase accounting for 46.3% of the cost and labour just behind at 46.0%.
Figure 16 A breakdown of the cost of avoidable food waste by cost element
Food Purchase 46.3%
Energy 1.1%
Water 0.2%
Labour 46.0%
Transport 0.3%
Administration 1.7%
Waste Management 4.4%
Consumables 0.1%
The True Cost of Food Waste within Hospitality and Food Service 27
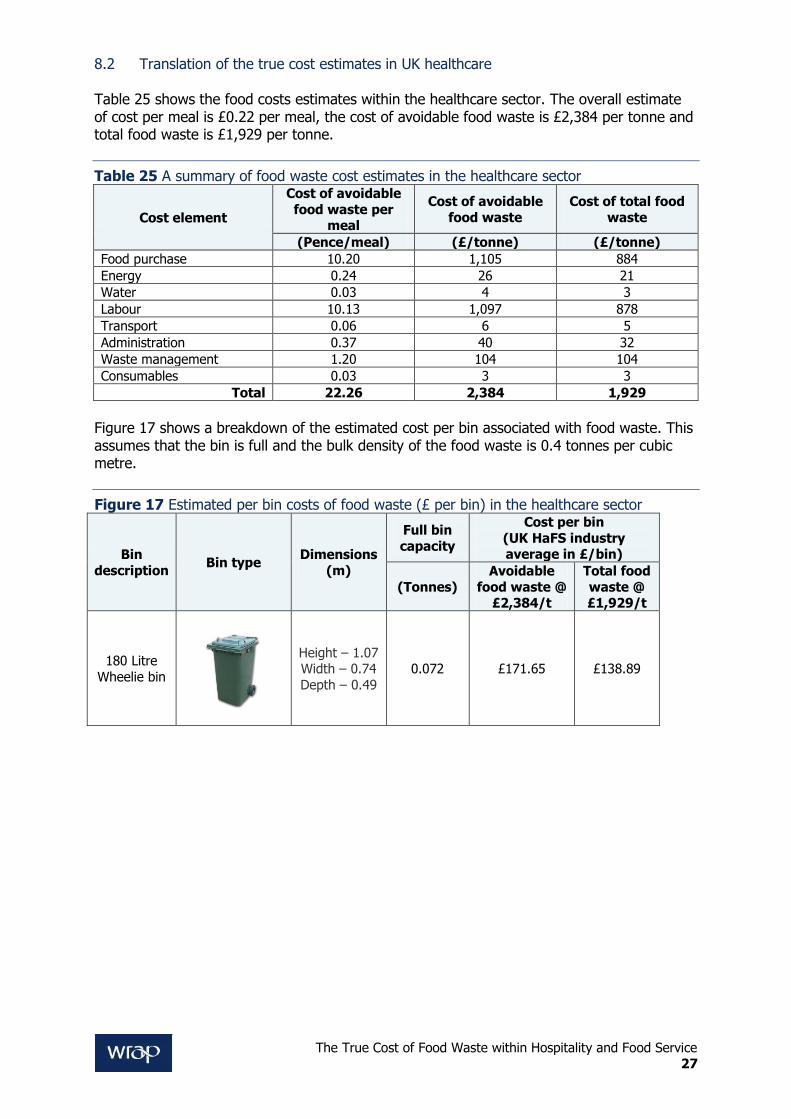
8.2 Translation of the true cost estimates in UK healthcare Table 25 shows the food costs estimates within the healthcare sector. The overall estimate of cost per meal is £0.22 per meal, the cost of avoidable food waste is £2,384 per tonne and total food waste is £1,929 per tonne.
Table 25 A summary of food waste cost estimates in the healthcare sector
Cost element
Cost of avoidable
food waste per meal
Cost of avoidable
food waste
Cost of total food
waste
(Pence/meal) (£/tonne) (£/tonne)
Food purchase 10.20 1,105 884
Energy 0.24 26 21
Water 0.03 4 3
Labour 10.13 1,097 878
Transport 0.06 6 5
Administration 0.37 40 32
Waste management 1.20 104 104
Consumables 0.03 3 3
Total 22.26 2,384 1,929
Figure 17 shows a breakdown of the estimated cost per bin associated with food waste. This assumes that the bin is full and the bulk density of the food waste is 0.4 tonnes per cubic metre.
Figure 17 Estimated per bin costs of food waste (£ per bin) in the healthcare sector
Bin
description Bin type
Dimensions
(m)
Full bin
capacity
Cost per bin
(UK HaFS industry average in £/bin)
(Tonnes)
Avoidable
food waste @ £2,384/t
Total food
waste @ £1,929/t
180 Litre
Wheelie bin
Height – 1.07 Width – 0.74
Depth – 0.49
0.072 £171.65 £138.89
The True Cost of Food Waste within Hospitality and Food Service 28
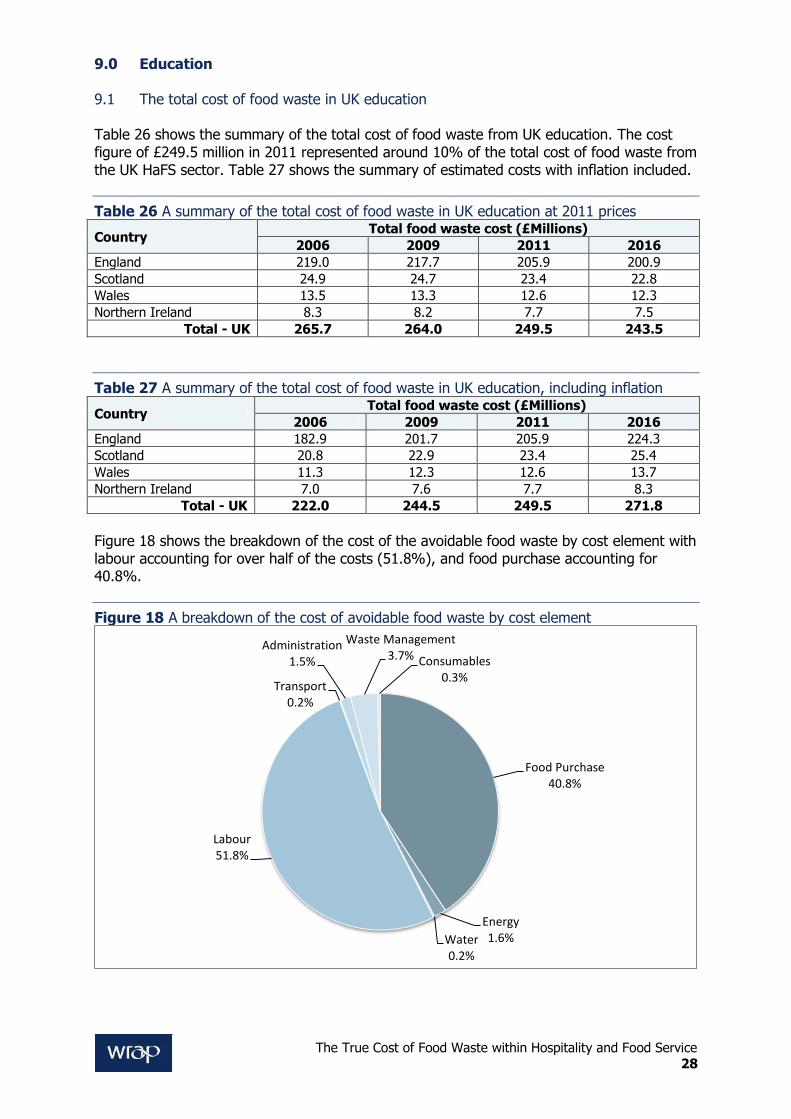
9.0 Education 9.1 The total cost of food waste in UK education Table 26 shows the summary of the total cost of food waste from UK education. The cost figure of £249.5 million in 2011 represented around 10% of the total cost of food waste from the UK HaFS sector. Table 27 shows the summary of estimated costs with inflation included.
Table 26 A summary of the total cost of food waste in UK education at 2011 prices
Country Total food waste cost (£Millions)
2006 2009 2011 2016
England 219.0 217.7 205.9 200.9
Scotland 24.9 24.7 23.4 22.8
Wales 13.5 13.3 12.6 12.3
Northern Ireland 8.3 8.2 7.7 7.5
Total - UK 265.7 264.0 249.5 243.5
Table 27 A summary of the total cost of food waste in UK education, including inflation
Country Total food waste cost (£Millions)
2006 2009 2011 2016
England 182.9 201.7 205.9 224.3
Scotland 20.8 22.9 23.4 25.4
Wales 11.3 12.3 12.6 13.7
Northern Ireland 7.0 7.6 7.7 8.3
Total - UK 222.0 244.5 249.5 271.8
Figure 18 shows the breakdown of the cost of the avoidable food waste by cost element with labour accounting for over half of the costs (51.8%), and food purchase accounting for 40.8%.
Figure 18 A breakdown of the cost of avoidable food waste by cost element
Food Purchase 40.8%
Energy 1.6% Water
0.2%
Labour 51.8%
Transport 0.2%
Administration 1.5%
Waste Management 3.7% Consumables
0.3%

The True Cost of Food Waste within Hospitality and Food Service 29
9.2 Translation of the true cost estimates in UK education Table 28 shows the food costs estimates within the education sector. The overall estimate of cost per meal is £0.22 per meal, the cost of avoidable food waste is £2,535 per tonne and total food waste is £2,075 per tonne.
Table 28 A summary of food waste cost estimates in the education sector
Cost element
Cost of avoidable
food waste per meal
Cost of avoidable
food waste
Cost of total food
waste
(Pence/meal) (£/tonne) (£/tonne)
Food purchase 9.06 1,034 839
Energy 0.36 41 33
Water 0.05 6 4
Labour 11.51 1,313 1,065
Transport 0.03 4 3
Administration 0.33 37 30
Waste management 1.00 93 93
Consumables 0.04 9 7
Total 22.38 2,535 2,075
Figure 19 shows a breakdown of the estimated cost per bin associated with food waste. This assumes that the bin is full and the bulk density of the food waste is 0.4 tonnes per cubic metre.
Figure 19 Estimated per bin costs of food waste (£ per bin) in the education sector
Bin
description Bin type
Dimensions
(m)
Full bin
capacity
Cost per bin
(UK HaFS industry average in £/bin)
(Tonnes)
Avoidable
food waste @ £2,535/t
Total food
waste @ £2,075/t
180 Litre
Wheelie bin
Height – 1.07 Width – 0.74
Depth – 0.49
0.072 £182.52 £149.40
The True Cost of Food Waste within Hospitality and Food Service 30
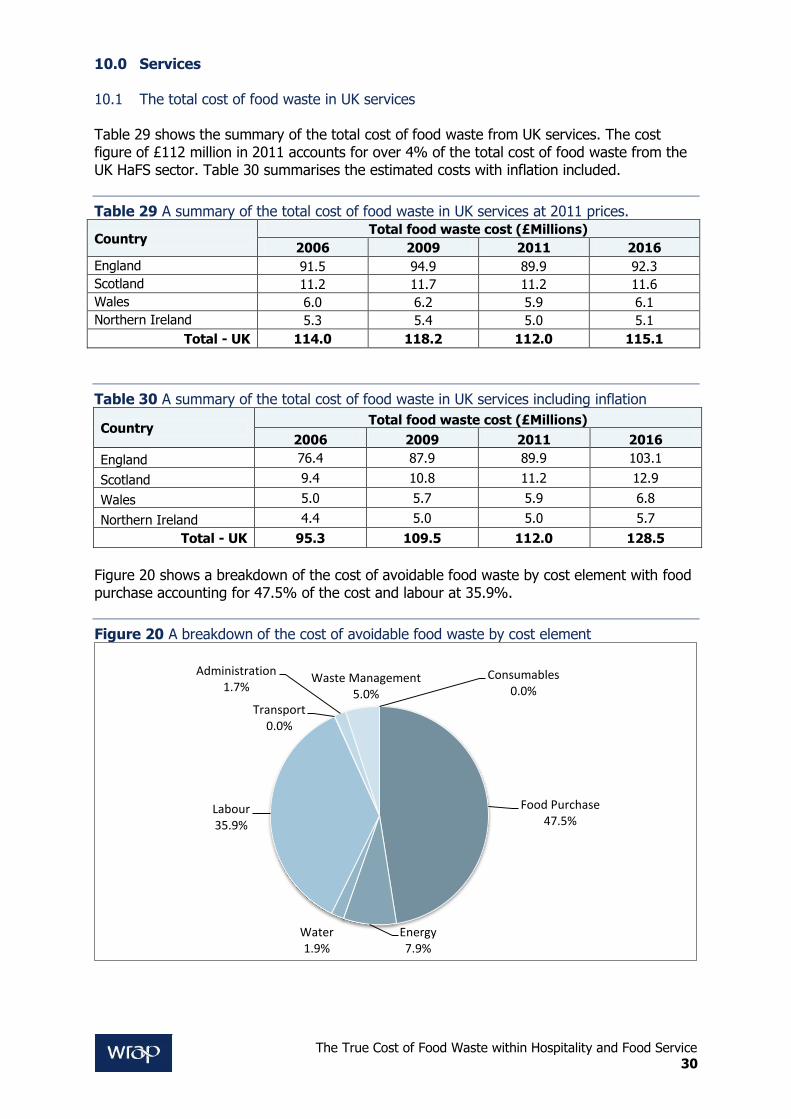
10.0 Services 10.1 The total cost of food waste in UK services Table 29 shows the summary of the total cost of food waste from UK services. The cost figure of £112 million in 2011 accounts for over 4% of the total cost of food waste from the UK HaFS sector. Table 30 summarises the estimated costs with inflation included.
Table 29 A summary of the total cost of food waste in UK services at 2011 prices.
Country Total food waste cost (£Millions)
2006 2009 2011 2016
England 91.5 94.9 89.9 92.3
Scotland 11.2 11.7 11.2 11.6
Wales 6.0 6.2 5.9 6.1
Northern Ireland 5.3 5.4 5.0 5.1
Total - UK 114.0 118.2 112.0 115.1
Table 30 A summary of the total cost of food waste in UK services including inflation
Country Total food waste cost (£Millions)
2006 2009 2011 2016
England 76.4 87.9 89.9 103.1
Scotland 9.4 10.8 11.2 12.9
Wales 5.0 5.7 5.9 6.8
Northern Ireland 4.4 5.0 5.0 5.7
Total - UK 95.3 109.5 112.0 128.5
Figure 20 shows a breakdown of the cost of avoidable food waste by cost element with food purchase accounting for 47.5% of the cost and labour at 35.9%.
Figure 20 A breakdown of the cost of avoidable food waste by cost element
Food Purchase 47.5%
Energy 7.9%
Water 1.9%
Labour 35.9%
Transport 0.0%
Administration 1.7%
Waste Management 5.0%
Consumables 0.0%
The True Cost of Food Waste within Hospitality and Food Service 31
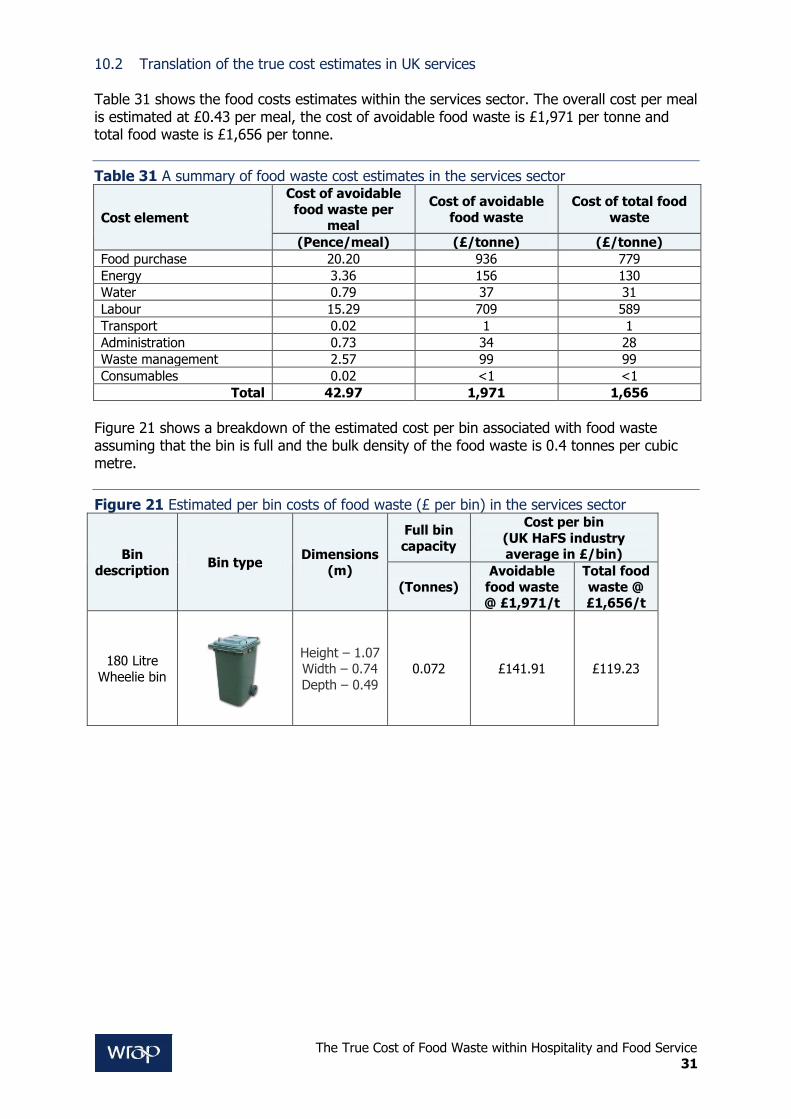
10.2 Translation of the true cost estimates in UK services Table 31 shows the food costs estimates within the services sector. The overall cost per meal is estimated at £0.43 per meal, the cost of avoidable food waste is £1,971 per tonne and total food waste is £1,656 per tonne.
Table 31 A summary of food waste cost estimates in the services sector
Cost element
Cost of avoidable
food waste per meal
Cost of avoidable
food waste
Cost of total food
waste
(Pence/meal) (£/tonne) (£/tonne)
Food purchase 20.20 936 779
Energy 3.36 156 130
Water 0.79 37 31
Labour 15.29 709 589
Transport 0.02 1 1
Administration 0.73 34 28
Waste management 2.57 99 99
Consumables 0.02 <1 <1
Total 42.97 1,971 1,656
Figure 21 shows a breakdown of the estimated cost per bin associated with food waste assuming that the bin is full and the bulk density of the food waste is 0.4 tonnes per cubic metre.
Figure 21 Estimated per bin costs of food waste (£ per bin) in the services sector
Bin
description Bin type
Dimensions
(m)
Full bin
capacity
Cost per bin
(UK HaFS industry average in £/bin)
(Tonnes)
Avoidable
food waste @ £1,971/t
Total food
waste @ £1,656/t
180 Litre
Wheelie bin
Height – 1.07 Width – 0.74
Depth – 0.49
0.072 £141.91 £119.23
The True Cost of Food Waste within Hospitality and Food Service 32
Annex 1. Determine the yield loss for each
of the nine sectors
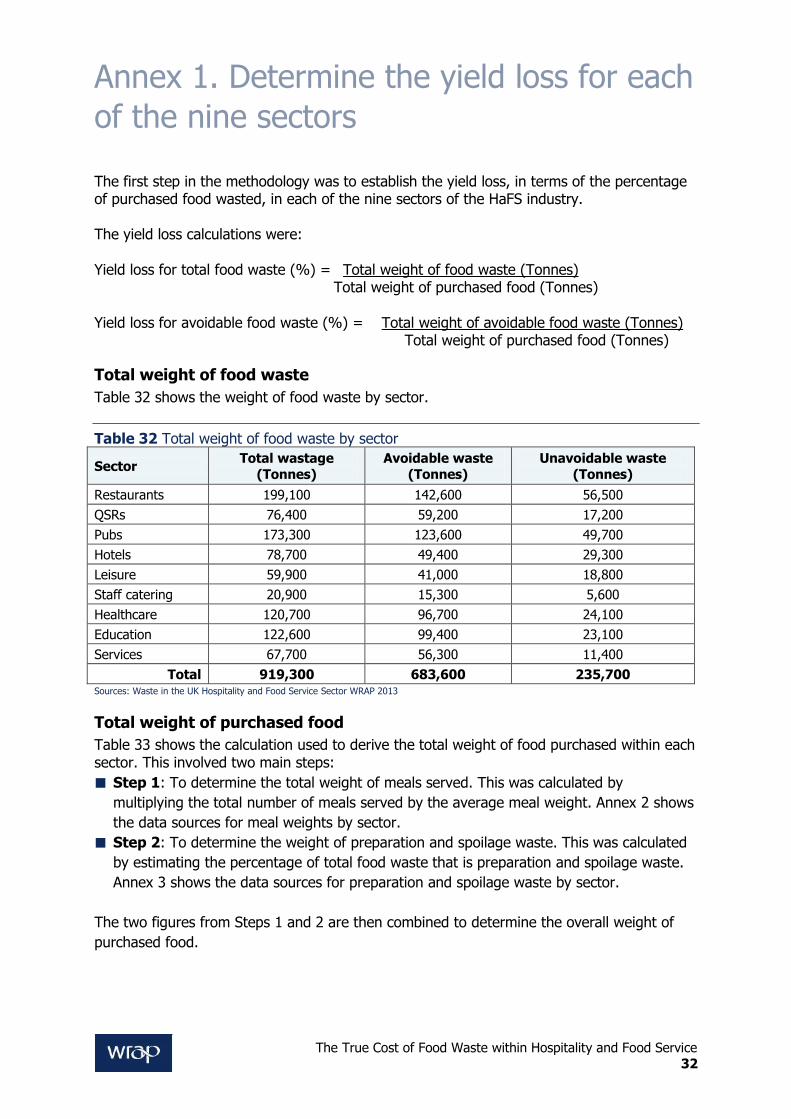
The first step in the methodology was to establish the yield loss, in terms of the percentage of purchased food wasted, in each of the nine sectors of the HaFS industry. The yield loss calculations were: Yield loss for total food waste (%) = Total weight of food waste (Tonnes) Total weight of purchased food (Tonnes) Yield loss for avoidable food waste (%) = Total weight of avoidable food waste (Tonnes) Total weight of purchased food (Tonnes)
Total weight of food waste
Table 32 shows the weight of food waste by sector.
Table 32 Total weight of food waste by sector
Sector Total wastage
(Tonnes)
Avoidable waste
(Tonnes)
Unavoidable waste
(Tonnes)
Restaurants 199,100 142,600 56,500
QSRs 76,400 59,200 17,200
Pubs 173,300 123,600 49,700
Hotels 78,700 49,400 29,300
Leisure 59,900 41,000 18,800
Staff catering 20,900 15,300 5,600
Healthcare 120,700 96,700 24,100
Education 122,600 99,400 23,100
Services 67,700 56,300 11,400
Total 919,300 683,600 235,700 Sources: Waste in the UK Hospitality and Food Service Sector WRAP 2013
Total weight of purchased food
Table 33 shows the calculation used to derive the total weight of food purchased within each sector. This involved two main steps:
Step 1: To determine the total weight of meals served. This was calculated by
multiplying the total number of meals served by the average meal weight. Annex 2 shows
the data sources for meal weights by sector.
Step 2: To determine the weight of preparation and spoilage waste. This was calculated
by estimating the percentage of total food waste that is preparation and spoilage waste.
Annex 3 shows the data sources for preparation and spoilage waste by sector.
The two figures from Steps 1 and 2 are then combined to determine the overall weight of
purchased food.
The True Cost of Food Waste within Hospitality and Food Service 33
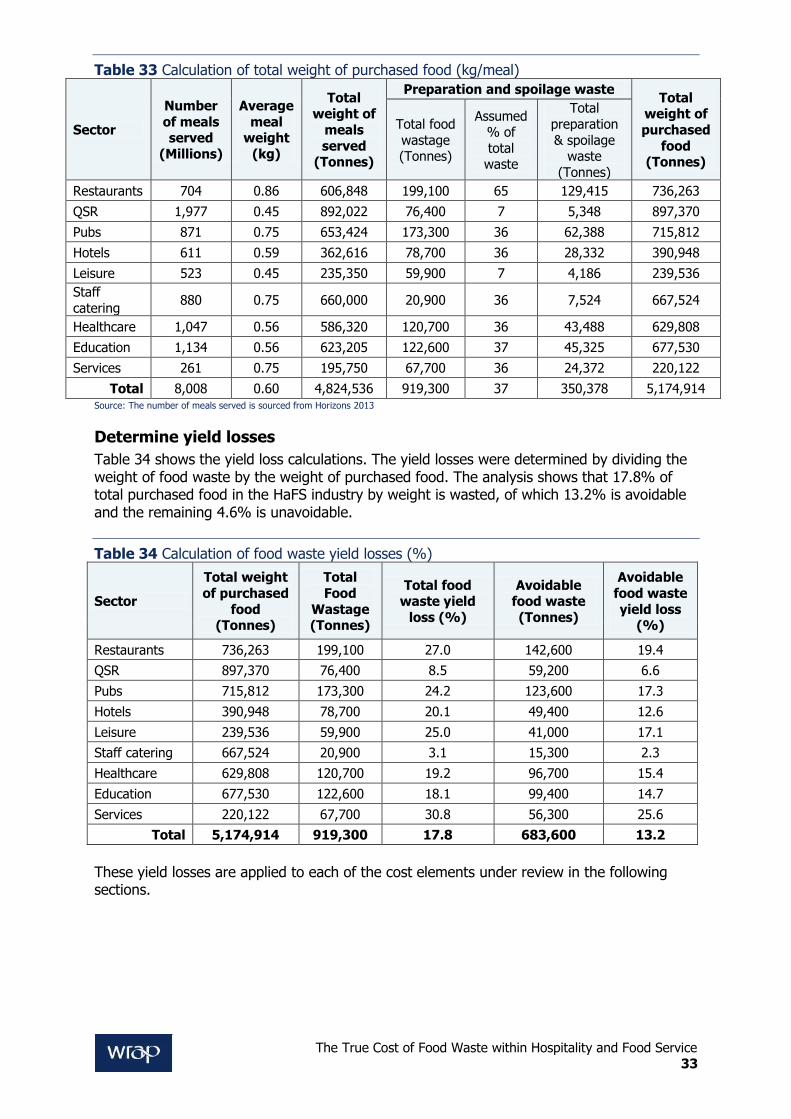
Table 33 Calculation of total weight of purchased food (kg/meal)
Sector
Number
of meals served
(Millions)
Average
meal weight
(kg)
Total weight of
meals
served (Tonnes)
Preparation and spoilage waste Total
weight of
purchased
food (Tonnes)
Total food
wastage (Tonnes)
Assumed % of
total waste
Total
preparation
& spoilage waste
(Tonnes)
Restaurants 704 0.86 606,848 199,100 65 129,415 736,263
QSR 1,977 0.45 892,022 76,400 7 5,348 897,370
Pubs 871 0.75 653,424 173,300 36 62,388 715,812
Hotels 611 0.59 362,616 78,700 36 28,332 390,948
Leisure 523 0.45 235,350 59,900 7 4,186 239,536
Staff
catering 880 0.75 660,000 20,900 36 7,524 667,524
Healthcare 1,047 0.56 586,320 120,700 36 43,488 629,808
Education 1,134 0.56 623,205 122,600 37 45,325 677,530
Services 261 0.75 195,750 67,700 36 24,372 220,122
Total 8,008 0.60 4,824,536 919,300 37 350,378 5,174,914 Source: The number of meals served is sourced from Horizons 2013
Determine yield losses
Table 34 shows the yield loss calculations. The yield losses were determined by dividing the weight of food waste by the weight of purchased food. The analysis shows that 17.8% of total purchased food in the HaFS industry by weight is wasted, of which 13.2% is avoidable and the remaining 4.6% is unavoidable.
Table 34 Calculation of food waste yield losses (%)
Sector
Total weight
of purchased
food (Tonnes)
Total
Food
Wastage (Tonnes)
Total food waste yield
loss (%)
Avoidable food waste
(Tonnes)
Avoidable
food waste
yield loss (%)
Restaurants 736,263 199,100 27.0 142,600 19.4
QSR 897,370 76,400 8.5 59,200 6.6
Pubs 715,812 173,300 24.2 123,600 17.3
Hotels 390,948 78,700 20.1 49,400 12.6
Leisure 239,536 59,900 25.0 41,000 17.1
Staff catering 667,524 20,900 3.1 15,300 2.3
Healthcare 629,808 120,700 19.2 96,700 15.4
Education 677,530 122,600 18.1 99,400 14.7
Services 220,122 67,700 30.8 56,300 25.6
Total 5,174,914 919,300 17.8 683,600 13.2
These yield losses are applied to each of the cost elements under review in the following sections.
The True Cost of Food Waste within Hospitality and Food Service 34
Annex 2. Data sources on the weight of
meals
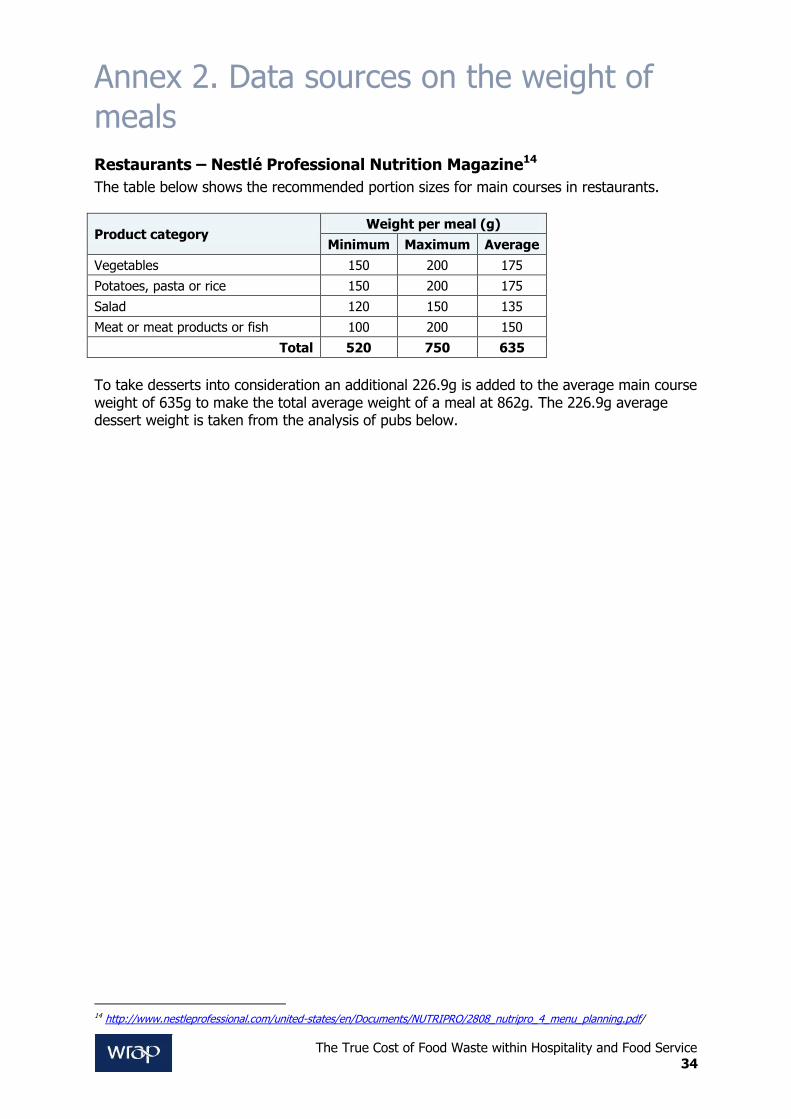
Restaurants – Nestlé Professional Nutrition Magazine14
The table below shows the recommended portion sizes for main courses in restaurants.
Product category Weight per meal (g)
Minimum Maximum Average
Vegetables 150 200 175
Potatoes, pasta or rice 150 200 175
Salad 120 150 135
Meat or meat products or fish 100 200 150
Total 520 750 635
To take desserts into consideration an additional 226.9g is added to the average main course weight of 635g to make the total average weight of a meal at 862g. The 226.9g average dessert weight is taken from the analysis of pubs below.
14 http://www.nestleprofessional.com/united-states/en/Documents/NUTRIPRO/2808_nutripro_4_menu_planning.pdf/
The True Cost of Food Waste within Hospitality and Food Service 35
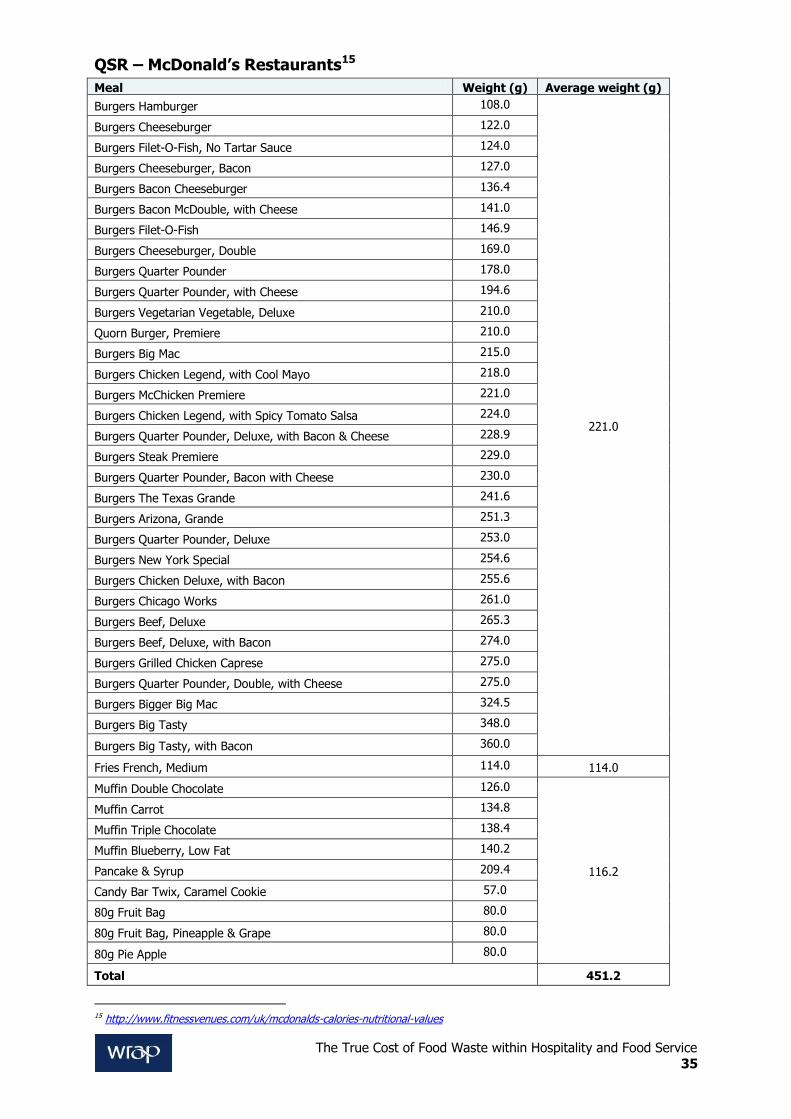
QSR – McDonald’s Restaurants15
Meal Weight (g) Average weight (g)
Burgers Hamburger 108.0
221.0
Burgers Cheeseburger 122.0
Burgers Filet-O-Fish, No Tartar Sauce 124.0
Burgers Cheeseburger, Bacon 127.0
Burgers Bacon Cheeseburger 136.4
Burgers Bacon McDouble, with Cheese 141.0
Burgers Filet-O-Fish 146.9
Burgers Cheeseburger, Double 169.0
Burgers Quarter Pounder 178.0
Burgers Quarter Pounder, with Cheese 194.6
Burgers Vegetarian Vegetable, Deluxe 210.0
Quorn Burger, Premiere 210.0
Burgers Big Mac 215.0
Burgers Chicken Legend, with Cool Mayo 218.0
Burgers McChicken Premiere 221.0
Burgers Chicken Legend, with Spicy Tomato Salsa 224.0
Burgers Quarter Pounder, Deluxe, with Bacon & Cheese 228.9
Burgers Steak Premiere 229.0
Burgers Quarter Pounder, Bacon with Cheese 230.0
Burgers The Texas Grande 241.6
Burgers Arizona, Grande 251.3
Burgers Quarter Pounder, Deluxe 253.0
Burgers New York Special 254.6
Burgers Chicken Deluxe, with Bacon 255.6
Burgers Chicago Works 261.0
Burgers Beef, Deluxe 265.3
Burgers Beef, Deluxe, with Bacon 274.0
Burgers Grilled Chicken Caprese 275.0
Burgers Quarter Pounder, Double, with Cheese 275.0
Burgers Bigger Big Mac 324.5
Burgers Big Tasty 348.0
Burgers Big Tasty, with Bacon 360.0
Fries French, Medium 114.0 114.0
Muffin Double Chocolate 126.0
116.2
Muffin Carrot 134.8
Muffin Triple Chocolate 138.4
Muffin Blueberry, Low Fat 140.2
Pancake & Syrup 209.4
Candy Bar Twix, Caramel Cookie 57.0
80g Fruit Bag 80.0
80g Fruit Bag, Pineapple & Grape 80.0
80g Pie Apple 80.0
Total 451.2
15 http://www.fitnessvenues.com/uk/mcdonalds-calories-nutritional-values
The True Cost of Food Waste within Hospitality and Food Service 36
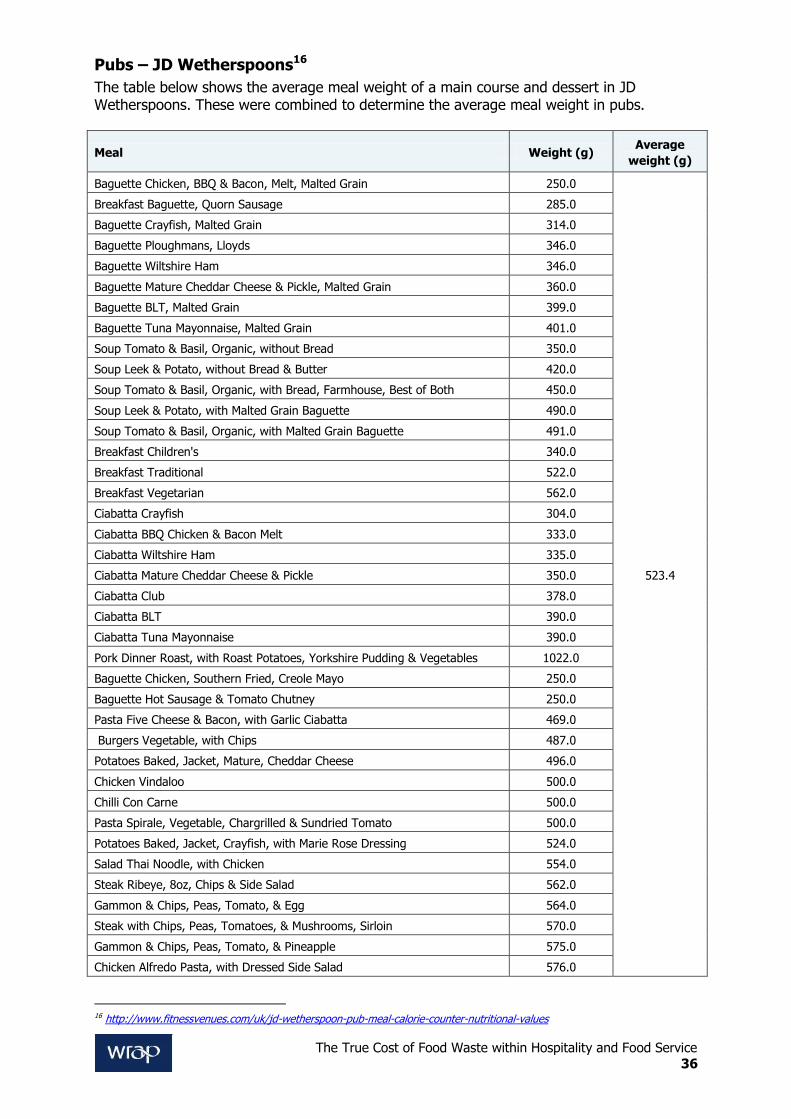
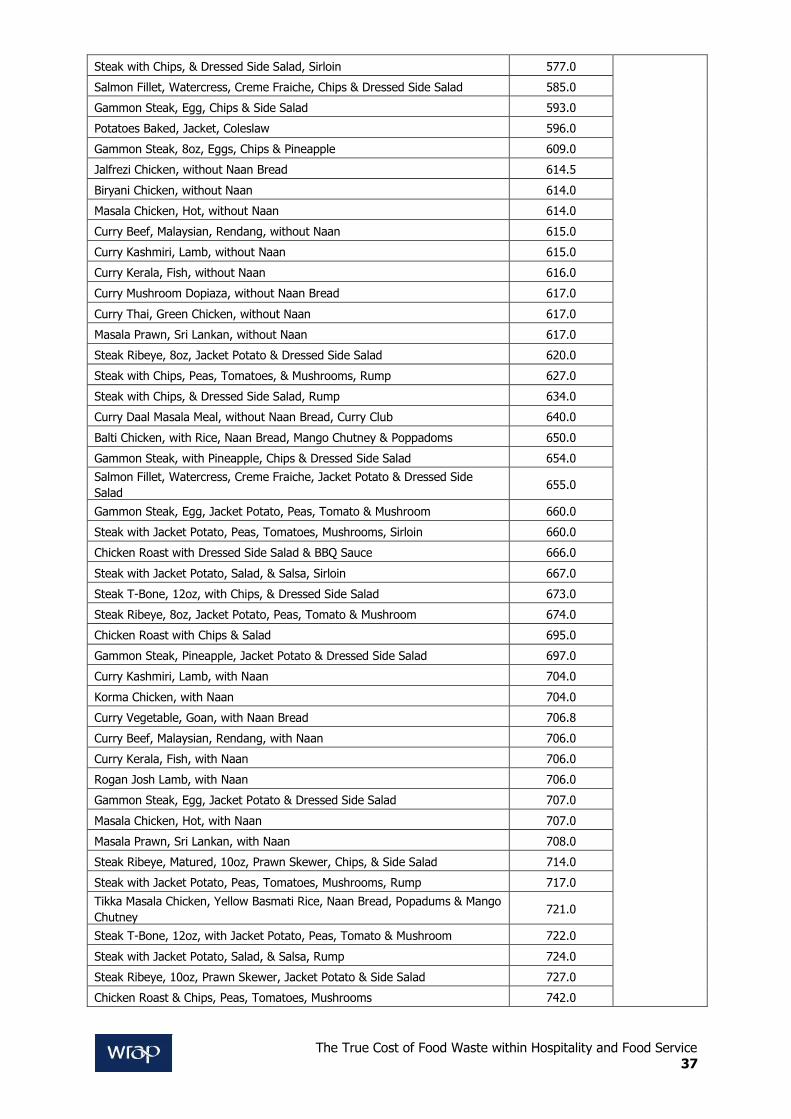
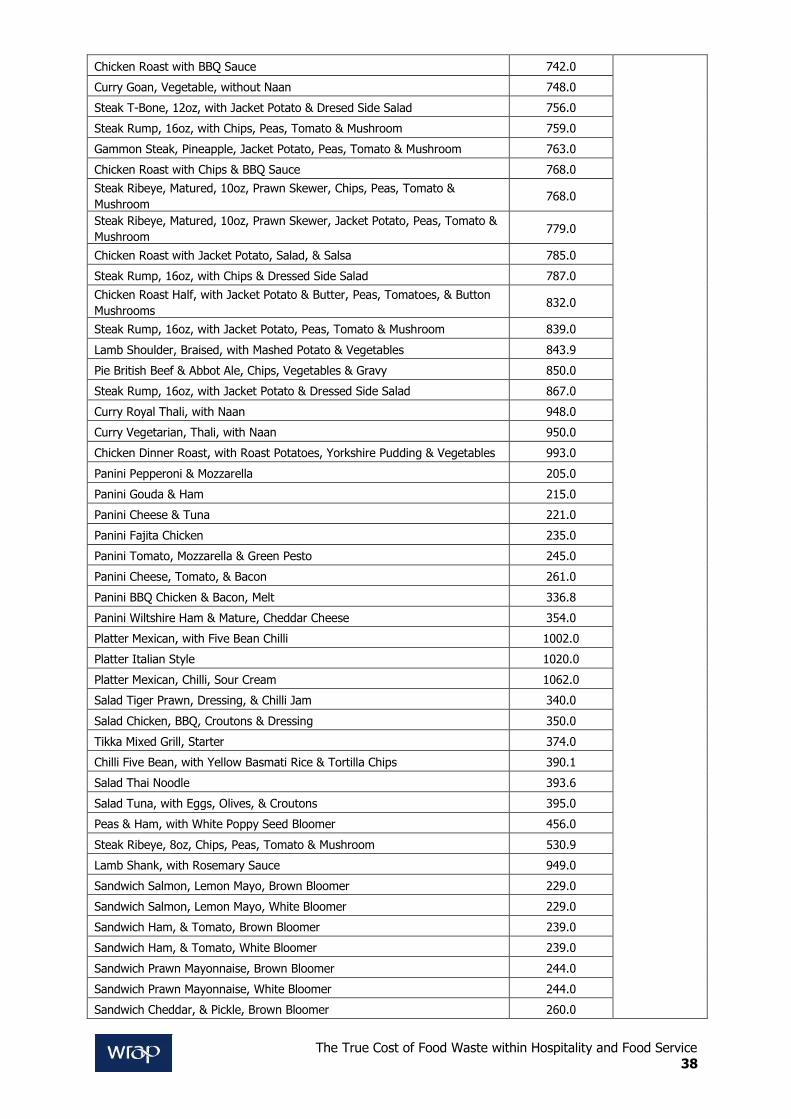
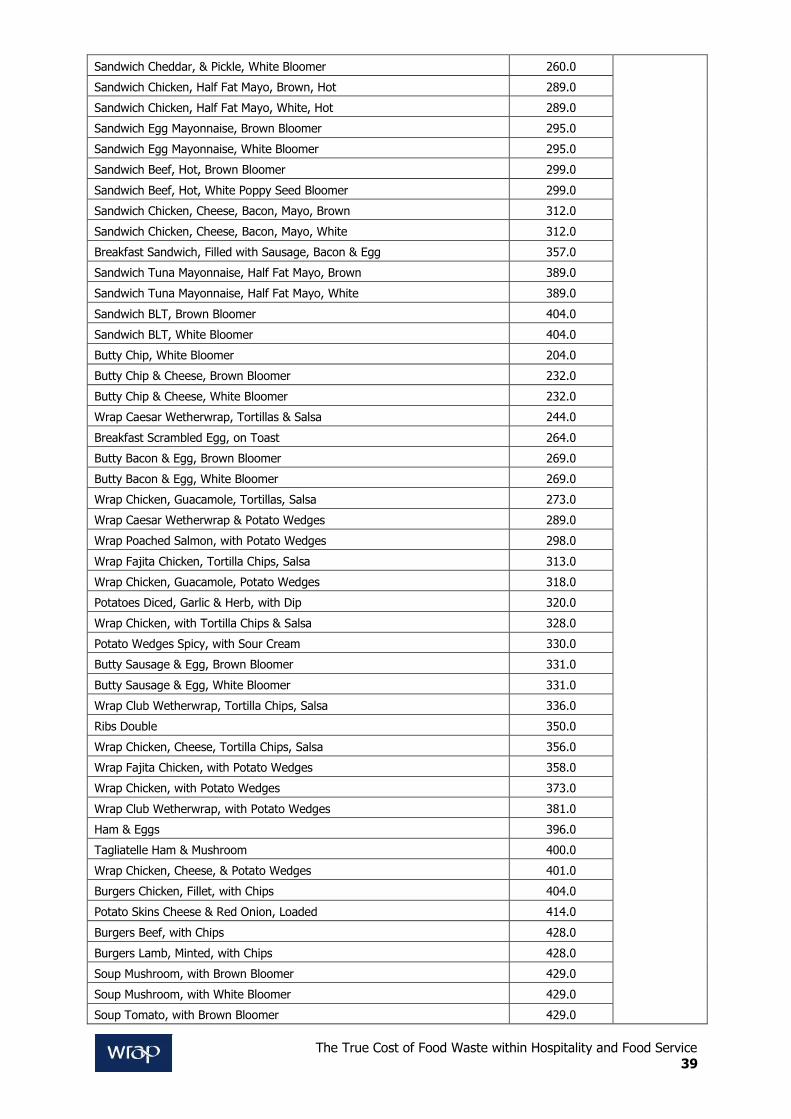
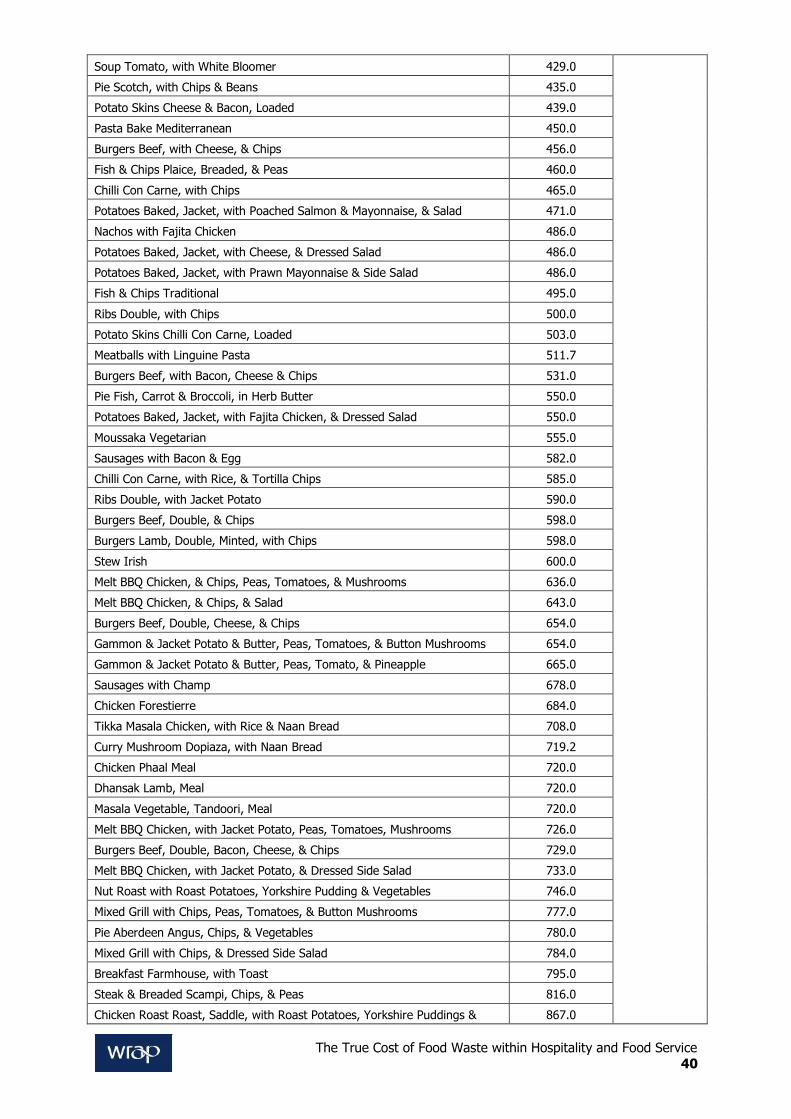
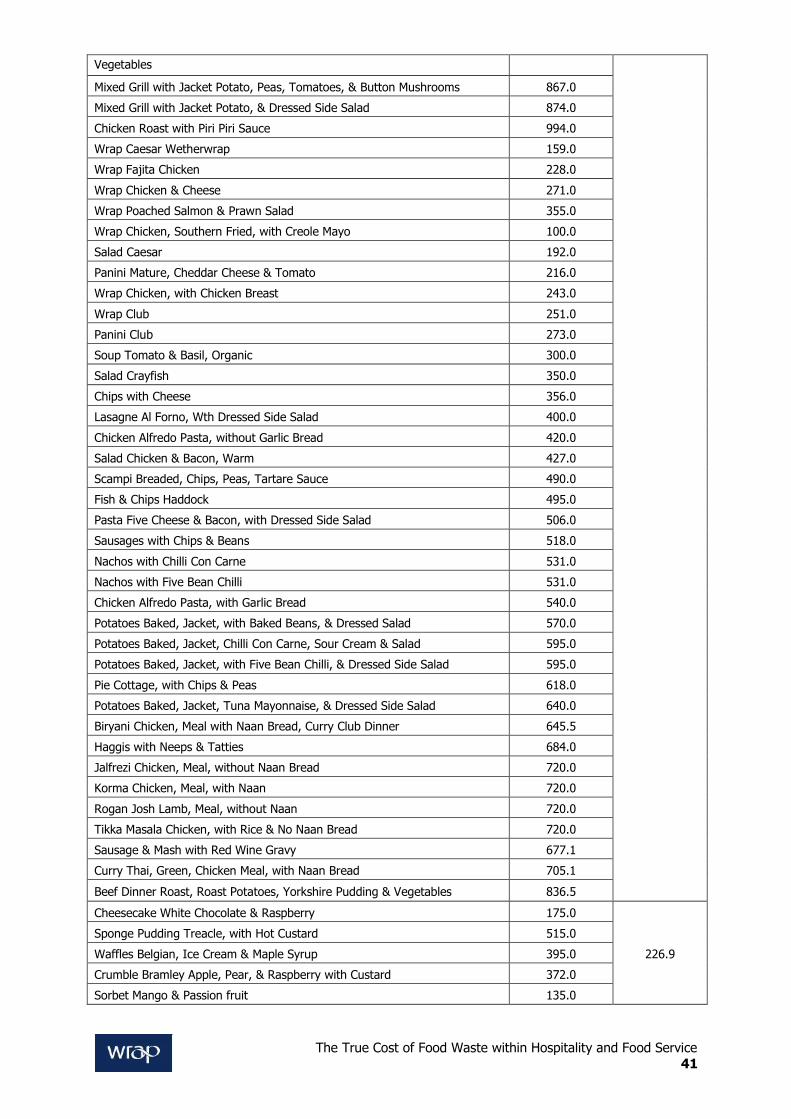
Pubs – JD Wetherspoons16
The table below shows the average meal weight of a main course and dessert in JD Wetherspoons. These were combined to determine the average meal weight in pubs.
Meal Weight (g) Average
weight (g)
Baguette Chicken, BBQ & Bacon, Melt, Malted Grain 250.0
523.4
Breakfast Baguette, Quorn Sausage 285.0
Baguette Crayfish, Malted Grain 314.0
Baguette Ploughmans, Lloyds 346.0
Baguette Wiltshire Ham 346.0
Baguette Mature Cheddar Cheese & Pickle, Malted Grain 360.0
Baguette BLT, Malted Grain 399.0
Baguette Tuna Mayonnaise, Malted Grain 401.0
Soup Tomato & Basil, Organic, without Bread 350.0
Soup Leek & Potato, without Bread & Butter 420.0
Soup Tomato & Basil, Organic, with Bread, Farmhouse, Best of Both 450.0
Soup Leek & Potato, with Malted Grain Baguette 490.0
Soup Tomato & Basil, Organic, with Malted Grain Baguette 491.0
Breakfast Children's 340.0
Breakfast Traditional 522.0
Breakfast Vegetarian 562.0
Ciabatta Crayfish 304.0
Ciabatta BBQ Chicken & Bacon Melt 333.0
Ciabatta Wiltshire Ham 335.0
Ciabatta Mature Cheddar Cheese & Pickle 350.0
Ciabatta Club 378.0
Ciabatta BLT 390.0
Ciabatta Tuna Mayonnaise 390.0
Pork Dinner Roast, with Roast Potatoes, Yorkshire Pudding & Vegetables 1022.0
Baguette Chicken, Southern Fried, Creole Mayo 250.0
Baguette Hot Sausage & Tomato Chutney 250.0
Pasta Five Cheese & Bacon, with Garlic Ciabatta 469.0
Burgers Vegetable, with Chips 487.0
Potatoes Baked, Jacket, Mature, Cheddar Cheese 496.0
Chicken Vindaloo 500.0
Chilli Con Carne 500.0
Pasta Spirale, Vegetable, Chargrilled & Sundried Tomato 500.0
Potatoes Baked, Jacket, Crayfish, with Marie Rose Dressing 524.0
Salad Thai Noodle, with Chicken 554.0
Steak Ribeye, 8oz, Chips & Side Salad 562.0
Gammon & Chips, Peas, Tomato, & Egg 564.0
Steak with Chips, Peas, Tomatoes, & Mushrooms, Sirloin 570.0
Gammon & Chips, Peas, Tomato, & Pineapple 575.0
Chicken Alfredo Pasta, with Dressed Side Salad 576.0
16 http://www.fitnessvenues.com/uk/jd-wetherspoon-pub-meal-calorie-counter-nutritional-values
The True Cost of Food Waste within Hospitality and Food Service 37
Steak with Chips, & Dressed Side Salad, Sirloin 577.0
Salmon Fillet, Watercress, Creme Fraiche, Chips & Dressed Side Salad 585.0
Gammon Steak, Egg, Chips & Side Salad 593.0
Potatoes Baked, Jacket, Coleslaw 596.0
Gammon Steak, 8oz, Eggs, Chips & Pineapple 609.0
Jalfrezi Chicken, without Naan Bread 614.5
Biryani Chicken, without Naan 614.0
Masala Chicken, Hot, without Naan 614.0
Curry Beef, Malaysian, Rendang, without Naan 615.0
Curry Kashmiri, Lamb, without Naan 615.0
Curry Kerala, Fish, without Naan 616.0
Curry Mushroom Dopiaza, without Naan Bread 617.0
Curry Thai, Green Chicken, without Naan 617.0
Masala Prawn, Sri Lankan, without Naan 617.0
Steak Ribeye, 8oz, Jacket Potato & Dressed Side Salad 620.0
Steak with Chips, Peas, Tomatoes, & Mushrooms, Rump 627.0
Steak with Chips, & Dressed Side Salad, Rump 634.0
Curry Daal Masala Meal, without Naan Bread, Curry Club 640.0
Balti Chicken, with Rice, Naan Bread, Mango Chutney & Poppadoms 650.0
Gammon Steak, with Pineapple, Chips & Dressed Side Salad 654.0
Salmon Fillet, Watercress, Creme Fraiche, Jacket Potato & Dressed Side
Salad 655.0
Gammon Steak, Egg, Jacket Potato, Peas, Tomato & Mushroom 660.0
Steak with Jacket Potato, Peas, Tomatoes, Mushrooms, Sirloin 660.0
Chicken Roast with Dressed Side Salad & BBQ Sauce 666.0
Steak with Jacket Potato, Salad, & Salsa, Sirloin 667.0
Steak T-Bone, 12oz, with Chips, & Dressed Side Salad 673.0
Steak Ribeye, 8oz, Jacket Potato, Peas, Tomato & Mushroom 674.0
Chicken Roast with Chips & Salad 695.0
Gammon Steak, Pineapple, Jacket Potato & Dressed Side Salad 697.0
Curry Kashmiri, Lamb, with Naan 704.0
Korma Chicken, with Naan 704.0
Curry Vegetable, Goan, with Naan Bread 706.8
Curry Beef, Malaysian, Rendang, with Naan 706.0
Curry Kerala, Fish, with Naan 706.0
Rogan Josh Lamb, with Naan 706.0
Gammon Steak, Egg, Jacket Potato & Dressed Side Salad 707.0
Masala Chicken, Hot, with Naan 707.0
Masala Prawn, Sri Lankan, with Naan 708.0
Steak Ribeye, Matured, 10oz, Prawn Skewer, Chips, & Side Salad 714.0
Steak with Jacket Potato, Peas, Tomatoes, Mushrooms, Rump 717.0
Tikka Masala Chicken, Yellow Basmati Rice, Naan Bread, Popadums & Mango
Chutney 721.0
Steak T-Bone, 12oz, with Jacket Potato, Peas, Tomato & Mushroom 722.0
Steak with Jacket Potato, Salad, & Salsa, Rump 724.0
Steak Ribeye, 10oz, Prawn Skewer, Jacket Potato & Side Salad 727.0
Chicken Roast & Chips, Peas, Tomatoes, Mushrooms 742.0
The True Cost of Food Waste within Hospitality and Food Service 38
Chicken Roast with BBQ Sauce 742.0
Curry Goan, Vegetable, without Naan 748.0
Steak T-Bone, 12oz, with Jacket Potato & Dresed Side Salad 756.0
Steak Rump, 16oz, with Chips, Peas, Tomato & Mushroom 759.0
Gammon Steak, Pineapple, Jacket Potato, Peas, Tomato & Mushroom 763.0
Chicken Roast with Chips & BBQ Sauce 768.0
Steak Ribeye, Matured, 10oz, Prawn Skewer, Chips, Peas, Tomato &
Mushroom 768.0
Steak Ribeye, Matured, 10oz, Prawn Skewer, Jacket Potato, Peas, Tomato &
Mushroom 779.0
Chicken Roast with Jacket Potato, Salad, & Salsa 785.0
Steak Rump, 16oz, with Chips & Dressed Side Salad 787.0
Chicken Roast Half, with Jacket Potato & Butter, Peas, Tomatoes, & Button
Mushrooms 832.0
Steak Rump, 16oz, with Jacket Potato, Peas, Tomato & Mushroom 839.0
Lamb Shoulder, Braised, with Mashed Potato & Vegetables 843.9
Pie British Beef & Abbot Ale, Chips, Vegetables & Gravy 850.0
Steak Rump, 16oz, with Jacket Potato & Dressed Side Salad 867.0
Curry Royal Thali, with Naan 948.0
Curry Vegetarian, Thali, with Naan 950.0
Chicken Dinner Roast, with Roast Potatoes, Yorkshire Pudding & Vegetables 993.0
Panini Pepperoni & Mozzarella 205.0
Panini Gouda & Ham 215.0
Panini Cheese & Tuna 221.0
Panini Fajita Chicken 235.0
Panini Tomato, Mozzarella & Green Pesto 245.0
Panini Cheese, Tomato, & Bacon 261.0
Panini BBQ Chicken & Bacon, Melt 336.8
Panini Wiltshire Ham & Mature, Cheddar Cheese 354.0
Platter Mexican, with Five Bean Chilli 1002.0
Platter Italian Style 1020.0
Platter Mexican, Chilli, Sour Cream 1062.0
Salad Tiger Prawn, Dressing, & Chilli Jam 340.0
Salad Chicken, BBQ, Croutons & Dressing 350.0
Tikka Mixed Grill, Starter 374.0
Chilli Five Bean, with Yellow Basmati Rice & Tortilla Chips 390.1
Salad Thai Noodle 393.6
Salad Tuna, with Eggs, Olives, & Croutons 395.0
Peas & Ham, with White Poppy Seed Bloomer 456.0
Steak Ribeye, 8oz, Chips, Peas, Tomato & Mushroom 530.9
Lamb Shank, with Rosemary Sauce 949.0
Sandwich Salmon, Lemon Mayo, Brown Bloomer 229.0
Sandwich Salmon, Lemon Mayo, White Bloomer 229.0
Sandwich Ham, & Tomato, Brown Bloomer 239.0
Sandwich Ham, & Tomato, White Bloomer 239.0
Sandwich Prawn Mayonnaise, Brown Bloomer 244.0
Sandwich Prawn Mayonnaise, White Bloomer 244.0
Sandwich Cheddar, & Pickle, Brown Bloomer 260.0
The True Cost of Food Waste within Hospitality and Food Service 39
Sandwich Cheddar, & Pickle, White Bloomer 260.0
Sandwich Chicken, Half Fat Mayo, Brown, Hot 289.0
Sandwich Chicken, Half Fat Mayo, White, Hot 289.0
Sandwich Egg Mayonnaise, Brown Bloomer 295.0
Sandwich Egg Mayonnaise, White Bloomer 295.0
Sandwich Beef, Hot, Brown Bloomer 299.0
Sandwich Beef, Hot, White Poppy Seed Bloomer 299.0
Sandwich Chicken, Cheese, Bacon, Mayo, Brown 312.0
Sandwich Chicken, Cheese, Bacon, Mayo, White 312.0
Breakfast Sandwich, Filled with Sausage, Bacon & Egg 357.0
Sandwich Tuna Mayonnaise, Half Fat Mayo, Brown 389.0
Sandwich Tuna Mayonnaise, Half Fat Mayo, White 389.0
Sandwich BLT, Brown Bloomer 404.0
Sandwich BLT, White Bloomer 404.0
Butty Chip, White Bloomer 204.0
Butty Chip & Cheese, Brown Bloomer 232.0
Butty Chip & Cheese, White Bloomer 232.0
Wrap Caesar Wetherwrap, Tortillas & Salsa 244.0
Breakfast Scrambled Egg, on Toast 264.0
Butty Bacon & Egg, Brown Bloomer 269.0
Butty Bacon & Egg, White Bloomer 269.0
Wrap Chicken, Guacamole, Tortillas, Salsa 273.0
Wrap Caesar Wetherwrap & Potato Wedges 289.0
Wrap Poached Salmon, with Potato Wedges 298.0
Wrap Fajita Chicken, Tortilla Chips, Salsa 313.0
Wrap Chicken, Guacamole, Potato Wedges 318.0
Potatoes Diced, Garlic & Herb, with Dip 320.0
Wrap Chicken, with Tortilla Chips & Salsa 328.0
Potato Wedges Spicy, with Sour Cream 330.0
Butty Sausage & Egg, Brown Bloomer 331.0
Butty Sausage & Egg, White Bloomer 331.0
Wrap Club Wetherwrap, Tortilla Chips, Salsa 336.0
Ribs Double 350.0
Wrap Chicken, Cheese, Tortilla Chips, Salsa 356.0
Wrap Fajita Chicken, with Potato Wedges 358.0
Wrap Chicken, with Potato Wedges 373.0
Wrap Club Wetherwrap, with Potato Wedges 381.0
Ham & Eggs 396.0
Tagliatelle Ham & Mushroom 400.0
Wrap Chicken, Cheese, & Potato Wedges 401.0
Burgers Chicken, Fillet, with Chips 404.0
Potato Skins Cheese & Red Onion, Loaded 414.0
Burgers Beef, with Chips 428.0
Burgers Lamb, Minted, with Chips 428.0
Soup Mushroom, with Brown Bloomer 429.0
Soup Mushroom, with White Bloomer 429.0
Soup Tomato, with Brown Bloomer 429.0
The True Cost of Food Waste within Hospitality and Food Service 40
Soup Tomato, with White Bloomer 429.0
Pie Scotch, with Chips & Beans 435.0
Potato Skins Cheese & Bacon, Loaded 439.0
Pasta Bake Mediterranean 450.0
Burgers Beef, with Cheese, & Chips 456.0
Fish & Chips Plaice, Breaded, & Peas 460.0
Chilli Con Carne, with Chips 465.0
Potatoes Baked, Jacket, with Poached Salmon & Mayonnaise, & Salad 471.0
Nachos with Fajita Chicken 486.0
Potatoes Baked, Jacket, with Cheese, & Dressed Salad 486.0
Potatoes Baked, Jacket, with Prawn Mayonnaise & Side Salad 486.0
Fish & Chips Traditional 495.0
Ribs Double, with Chips 500.0
Potato Skins Chilli Con Carne, Loaded 503.0
Meatballs with Linguine Pasta 511.7
Burgers Beef, with Bacon, Cheese & Chips 531.0
Pie Fish, Carrot & Broccoli, in Herb Butter 550.0
Potatoes Baked, Jacket, with Fajita Chicken, & Dressed Salad 550.0
Moussaka Vegetarian 555.0
Sausages with Bacon & Egg 582.0
Chilli Con Carne, with Rice, & Tortilla Chips 585.0
Ribs Double, with Jacket Potato 590.0
Burgers Beef, Double, & Chips 598.0
Burgers Lamb, Double, Minted, with Chips 598.0
Stew Irish 600.0
Melt BBQ Chicken, & Chips, Peas, Tomatoes, & Mushrooms 636.0
Melt BBQ Chicken, & Chips, & Salad 643.0
Burgers Beef, Double, Cheese, & Chips 654.0
Gammon & Jacket Potato & Butter, Peas, Tomatoes, & Button Mushrooms 654.0
Gammon & Jacket Potato & Butter, Peas, Tomato, & Pineapple 665.0
Sausages with Champ 678.0
Chicken Forestierre 684.0
Tikka Masala Chicken, with Rice & Naan Bread 708.0
Curry Mushroom Dopiaza, with Naan Bread 719.2
Chicken Phaal Meal 720.0
Dhansak Lamb, Meal 720.0
Masala Vegetable, Tandoori, Meal 720.0
Melt BBQ Chicken, with Jacket Potato, Peas, Tomatoes, Mushrooms 726.0
Burgers Beef, Double, Bacon, Cheese, & Chips 729.0
Melt BBQ Chicken, with Jacket Potato, & Dressed Side Salad 733.0
Nut Roast with Roast Potatoes, Yorkshire Pudding & Vegetables 746.0
Mixed Grill with Chips, Peas, Tomatoes, & Button Mushrooms 777.0
Pie Aberdeen Angus, Chips, & Vegetables 780.0
Mixed Grill with Chips, & Dressed Side Salad 784.0
Breakfast Farmhouse, with Toast 795.0
Steak & Breaded Scampi, Chips, & Peas 816.0
Chicken Roast Roast, Saddle, with Roast Potatoes, Yorkshire Puddings & 867.0
The True Cost of Food Waste within Hospitality and Food Service 41
Vegetables
Mixed Grill with Jacket Potato, Peas, Tomatoes, & Button Mushrooms 867.0
Mixed Grill with Jacket Potato, & Dressed Side Salad 874.0
Chicken Roast with Piri Piri Sauce 994.0
Wrap Caesar Wetherwrap 159.0
Wrap Fajita Chicken 228.0
Wrap Chicken & Cheese 271.0
Wrap Poached Salmon & Prawn Salad 355.0
Wrap Chicken, Southern Fried, with Creole Mayo 100.0
Salad Caesar 192.0
Panini Mature, Cheddar Cheese & Tomato 216.0
Wrap Chicken, with Chicken Breast 243.0
Wrap Club 251.0
Panini Club 273.0
Soup Tomato & Basil, Organic 300.0
Salad Crayfish 350.0
Chips with Cheese 356.0
Lasagne Al Forno, Wth Dressed Side Salad 400.0
Chicken Alfredo Pasta, without Garlic Bread 420.0
Salad Chicken & Bacon, Warm 427.0
Scampi Breaded, Chips, Peas, Tartare Sauce 490.0
Fish & Chips Haddock 495.0
Pasta Five Cheese & Bacon, with Dressed Side Salad 506.0
Sausages with Chips & Beans 518.0
Nachos with Chilli Con Carne 531.0
Nachos with Five Bean Chilli 531.0
Chicken Alfredo Pasta, with Garlic Bread 540.0
Potatoes Baked, Jacket, with Baked Beans, & Dressed Salad 570.0
Potatoes Baked, Jacket, Chilli Con Carne, Sour Cream & Salad 595.0
Potatoes Baked, Jacket, with Five Bean Chilli, & Dressed Side Salad 595.0
Pie Cottage, with Chips & Peas 618.0
Potatoes Baked, Jacket, Tuna Mayonnaise, & Dressed Side Salad 640.0
Biryani Chicken, Meal with Naan Bread, Curry Club Dinner 645.5
Haggis with Neeps & Tatties 684.0
Jalfrezi Chicken, Meal, without Naan Bread 720.0
Korma Chicken, Meal, with Naan 720.0
Rogan Josh Lamb, Meal, without Naan 720.0
Tikka Masala Chicken, with Rice & No Naan Bread 720.0
Sausage & Mash with Red Wine Gravy 677.1
Curry Thai, Green, Chicken Meal, with Naan Bread 705.1
Beef Dinner Roast, Roast Potatoes, Yorkshire Pudding & Vegetables 836.5
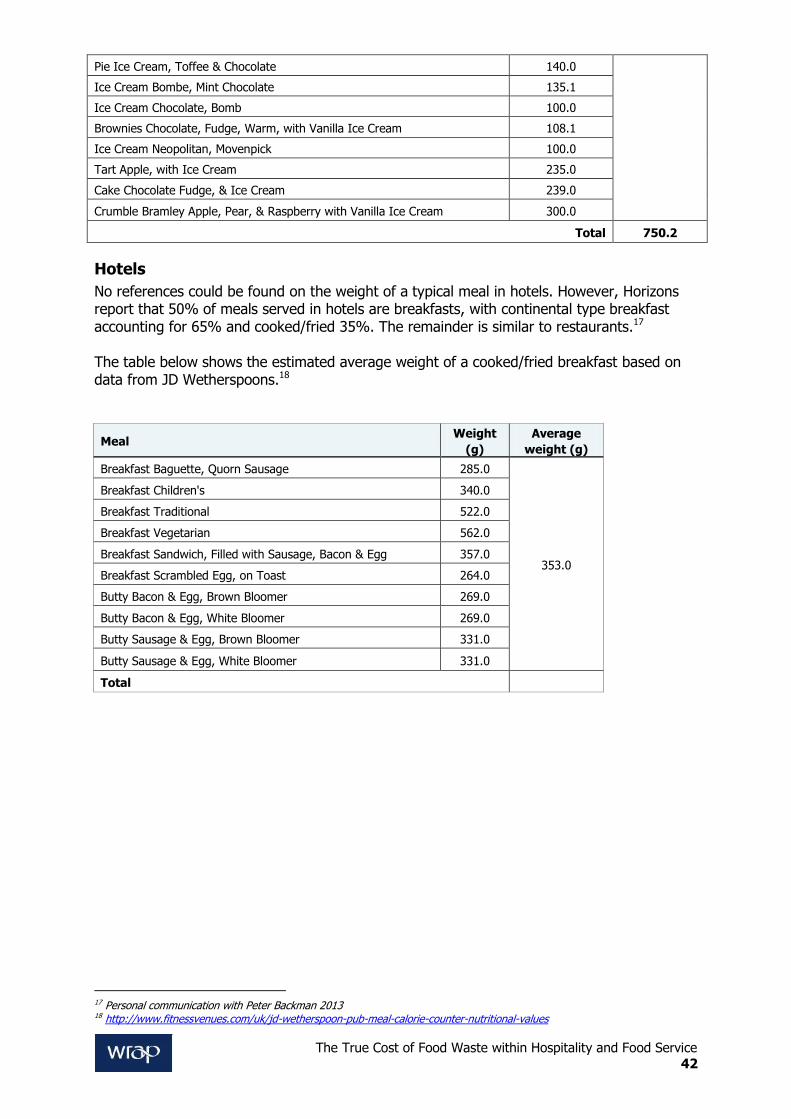
Cheesecake White Chocolate & Raspberry 175.0
226.9
Sponge Pudding Treacle, with Hot Custard 515.0
Waffles Belgian, Ice Cream & Maple Syrup 395.0
Crumble Bramley Apple, Pear, & Raspberry with Custard 372.0
Sorbet Mango & Passion fruit 135.0
The True Cost of Food Waste within Hospitality and Food Service 42
Pie Ice Cream, Toffee & Chocolate 140.0
Ice Cream Bombe, Mint Chocolate 135.1
Ice Cream Chocolate, Bomb 100.0
Brownies Chocolate, Fudge, Warm, with Vanilla Ice Cream 108.1
Ice Cream Neopolitan, Movenpick 100.0
Tart Apple, with Ice Cream 235.0
Cake Chocolate Fudge, & Ice Cream 239.0
Crumble Bramley Apple, Pear, & Raspberry with Vanilla Ice Cream 300.0
Total 750.2
Hotels
No references could be found on the weight of a typical meal in hotels. However, Horizons report that 50% of meals served in hotels are breakfasts, with continental type breakfast accounting for 65% and cooked/fried 35%. The remainder is similar to restaurants.17 The table below shows the estimated average weight of a cooked/fried breakfast based on data from JD Wetherspoons.18
Meal Weight
(g)
Average
weight (g)
Breakfast Baguette, Quorn Sausage 285.0
353.0
Breakfast Children's 340.0
Breakfast Traditional 522.0
Breakfast Vegetarian 562.0
Breakfast Sandwich, Filled with Sausage, Bacon & Egg 357.0
Breakfast Scrambled Egg, on Toast 264.0
Butty Bacon & Egg, Brown Bloomer 269.0
Butty Bacon & Egg, White Bloomer 269.0
Butty Sausage & Egg, Brown Bloomer 331.0
Butty Sausage & Egg, White Bloomer 331.0
Total
17 Personal communication with Peter Backman 2013 18 http://www.fitnessvenues.com/uk/jd-wetherspoon-pub-meal-calorie-counter-nutritional-values
The True Cost of Food Waste within Hospitality and Food Service 43
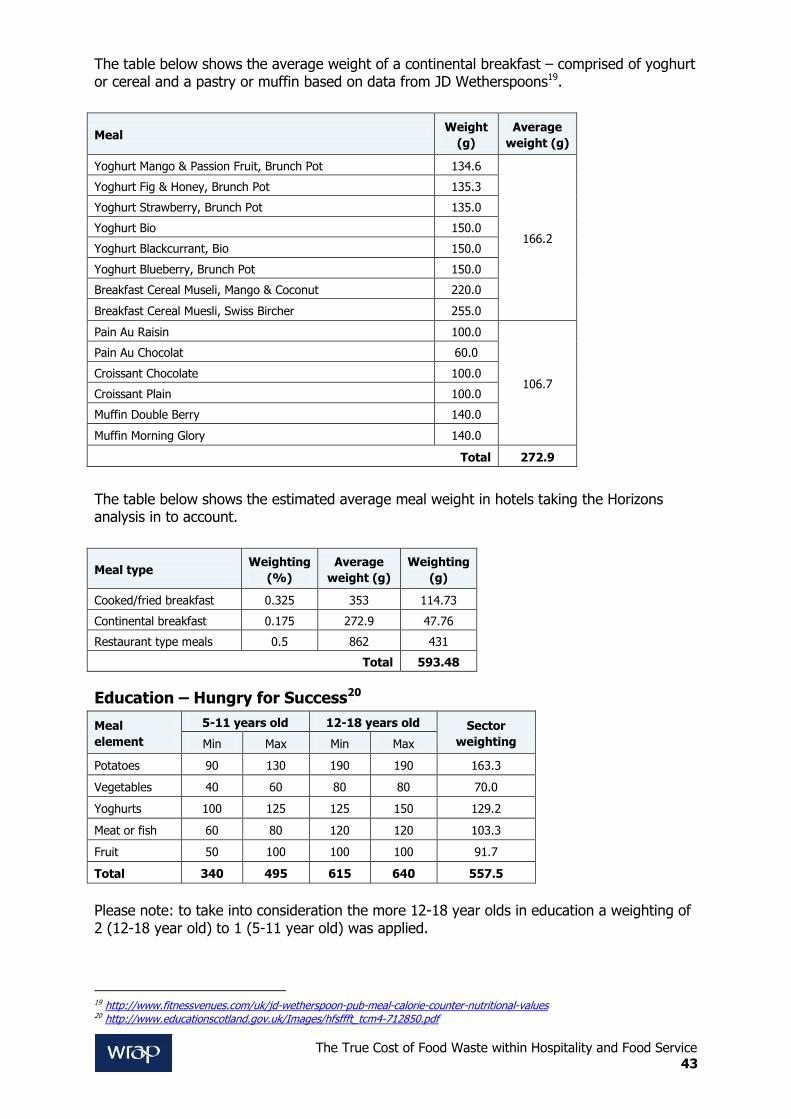
The table below shows the average weight of a continental breakfast – comprised of yoghurt or cereal and a pastry or muffin based on data from JD Wetherspoons19.
Meal Weight
(g)
Average
weight (g)
Yoghurt Mango & Passion Fruit, Brunch Pot 134.6
166.2
Yoghurt Fig & Honey, Brunch Pot 135.3
Yoghurt Strawberry, Brunch Pot 135.0
Yoghurt Bio 150.0
Yoghurt Blackcurrant, Bio 150.0
Yoghurt Blueberry, Brunch Pot 150.0
Breakfast Cereal Museli, Mango & Coconut 220.0
Breakfast Cereal Muesli, Swiss Bircher 255.0
Pain Au Raisin 100.0
106.7
Pain Au Chocolat 60.0
Croissant Chocolate 100.0
Croissant Plain 100.0
Muffin Double Berry 140.0
Muffin Morning Glory 140.0
Total 272.9
The table below shows the estimated average meal weight in hotels taking the Horizons analysis in to account.
Meal type Weighting
(%)
Average
weight (g)
Weighting
(g)
Cooked/fried breakfast 0.325 353 114.73
Continental breakfast 0.175 272.9 47.76
Restaurant type meals 0.5 862 431
Total 593.48
Education – Hungry for Success20
Meal
element
5-11 years old 12-18 years old Sector
weighting Min Max Min Max
Potatoes 90 130 190 190 163.3
Vegetables 40 60 80 80 70.0
Yoghurts 100 125 125 150 129.2
Meat or fish 60 80 120 120 103.3
Fruit 50 100 100 100 91.7
Total 340 495 615 640 557.5
Please note: to take into consideration the more 12-18 year olds in education a weighting of 2 (12-18 year old) to 1 (5-11 year old) was applied.
19 http://www.fitnessvenues.com/uk/jd-wetherspoon-pub-meal-calorie-counter-nutritional-values 20 http://www.educationscotland.gov.uk/Images/hfsffft_tcm4-712850.pdf

The True Cost of Food Waste within Hospitality and Food Service 44
Annex 3. Data sources on the weight of
preparation and spoilage waste
Restaurants – Sustainable Restaurants Association (SRA)21
The SRA ‘Too Good to Waste’ survey found that preparation and spoilage waste accounted for 65% of total food waste in restaurants.
QSR – The United States Department of Agriculture22
The United States Department of Agriculture reported that in 2008 the US food service sector wasted 86 billion pounds of food, of which, 4-10% of the food is lost in preparation.
Hotels
The food losses incurred in preparing breakfast will be quite modest since the dominant meat products, namely, sausages and bacon are processed and the pastries, etc, would
typically be bought in. It is therefore assumed that 50% of meals (the breakfast) would generate preparation and spoilage waste similar to QSR, i.e. 7% and the remainder (the restaurant type meals) would generate much more i.e. 65%. Therefore it is estimated the overall preparation waste and spoilage will be 36%.
Education - WRAP23
WRAP’s ‘Food Waste in Schools’ survey found that 36% of food waste in primary schools is preparation and plate waste and 38% in secondary schools.
21 http://www.thesra.org/wp-content/uploads/2012/02/SRA002-SRA-Food-Waste-Survey-Full-Report.pdf 22 http://flashfoodrecovery.com/2013/01/ 23 http://www.wrap.org.uk/sites/files/wrap/Food%20waste%20in%20schools%20full%20report%20.pdf
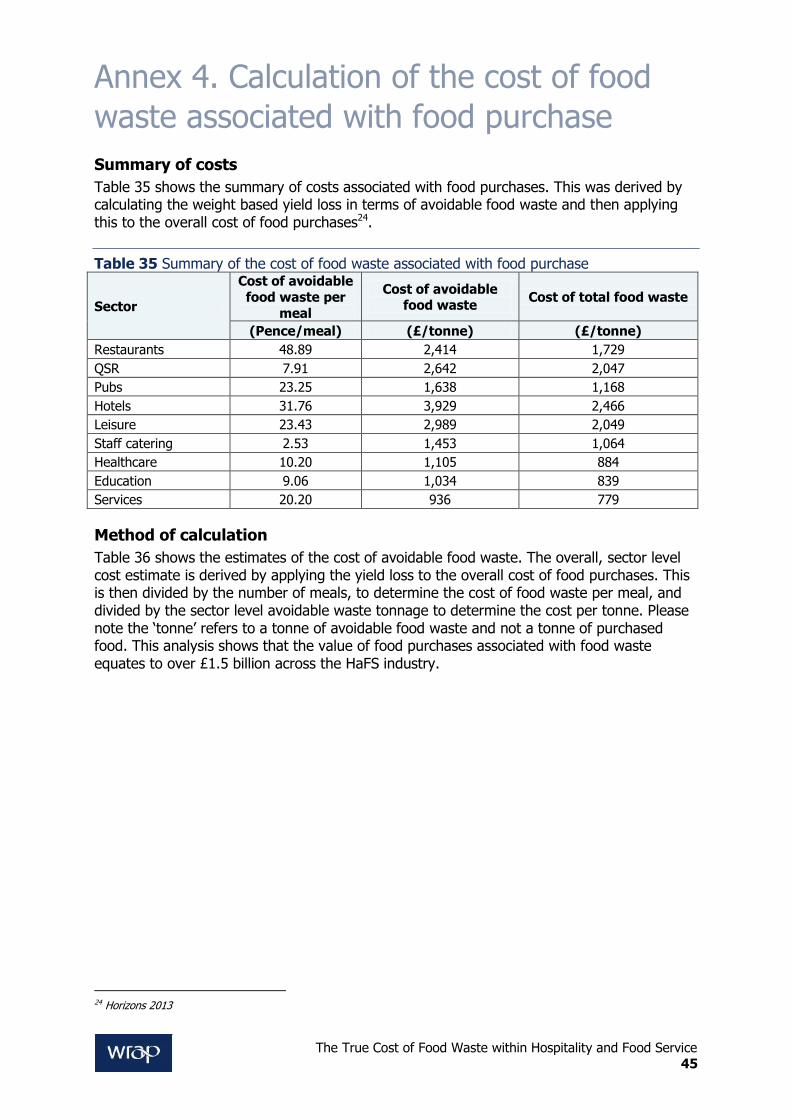
The True Cost of Food Waste within Hospitality and Food Service 45
Annex 4. Calculation of the cost of food
waste associated with food purchase
Summary of costs
Table 35 shows the summary of costs associated with food purchases. This was derived by calculating the weight based yield loss in terms of avoidable food waste and then applying this to the overall cost of food purchases24.
Table 35 Summary of the cost of food waste associated with food purchase
Sector
Cost of avoidable
food waste per
meal
Cost of avoidable food waste
Cost of total food waste
(Pence/meal) (£/tonne) (£/tonne)
Restaurants 48.89 2,414 1,729
QSR 7.91 2,642 2,047
Pubs 23.25 1,638 1,168
Hotels 31.76 3,929 2,466
Leisure 23.43 2,989 2,049
Staff catering 2.53 1,453 1,064
Healthcare 10.20 1,105 884
Education 9.06 1,034 839
Services 20.20 936 779
Method of calculation
Table 36 shows the estimates of the cost of avoidable food waste. The overall, sector level cost estimate is derived by applying the yield loss to the overall cost of food purchases. This is then divided by the number of meals, to determine the cost of food waste per meal, and divided by the sector level avoidable waste tonnage to determine the cost per tonne. Please note the ‘tonne’ refers to a tonne of avoidable food waste and not a tonne of purchased food. This analysis shows that the value of food purchases associated with food waste equates to over £1.5 billion across the HaFS industry.
24 Horizons 2013
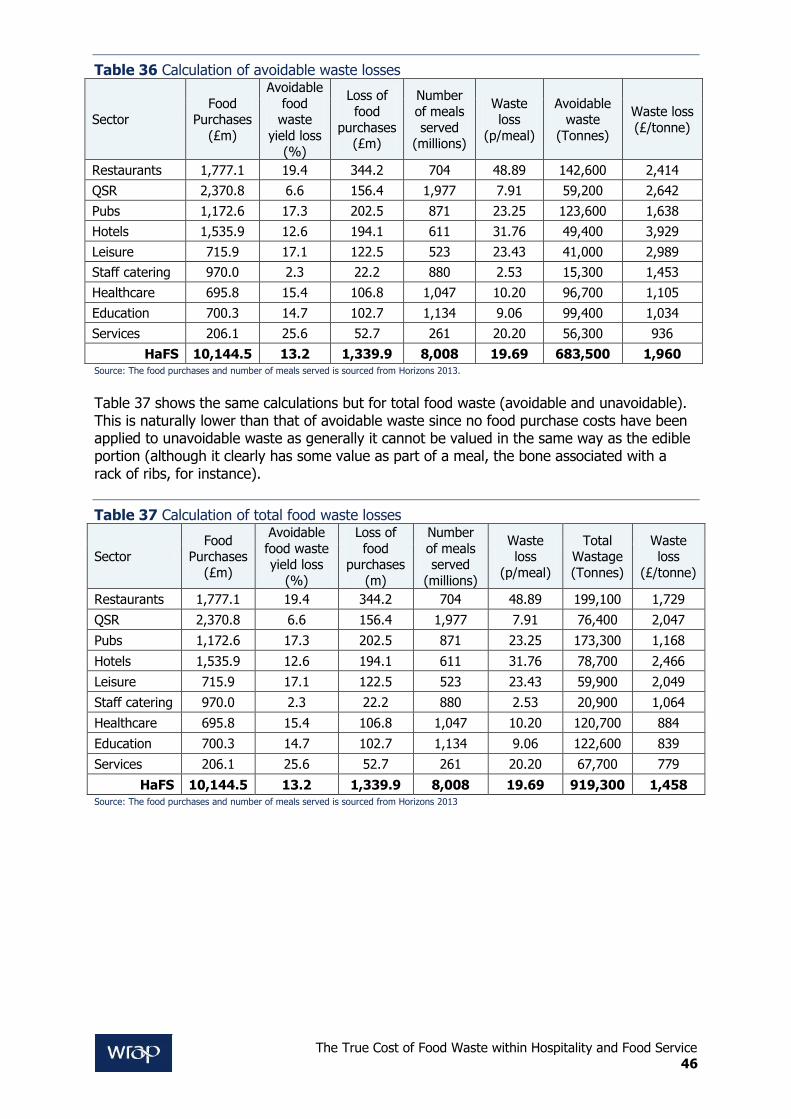
The True Cost of Food Waste within Hospitality and Food Service 46
Table 36 Calculation of avoidable waste losses
Sector Food
Purchases
(£m)
Avoidable
food waste
yield loss
(%)
Loss of
food
purchases (£m)
Number
of meals
served (millions)
Waste loss
(p/meal)
Avoidable waste
(Tonnes)
Waste loss
(£/tonne)
Restaurants 1,777.1 19.4 344.2 704 48.89 142,600 2,414
QSR 2,370.8 6.6 156.4 1,977 7.91 59,200 2,642
Pubs 1,172.6 17.3 202.5 871 23.25 123,600 1,638
Hotels 1,535.9 12.6 194.1 611 31.76 49,400 3,929
Leisure 715.9 17.1 122.5 523 23.43 41,000 2,989
Staff catering 970.0 2.3 22.2 880 2.53 15,300 1,453
Healthcare 695.8 15.4 106.8 1,047 10.20 96,700 1,105
Education 700.3 14.7 102.7 1,134 9.06 99,400 1,034
Services 206.1 25.6 52.7 261 20.20 56,300 936
HaFS 10,144.5 13.2 1,339.9 8,008 19.69 683,500 1,960 Source: The food purchases and number of meals served is sourced from Horizons 2013.
Table 37 shows the same calculations but for total food waste (avoidable and unavoidable). This is naturally lower than that of avoidable waste since no food purchase costs have been applied to unavoidable waste as generally it cannot be valued in the same way as the edible portion (although it clearly has some value as part of a meal, the bone associated with a rack of ribs, for instance).
Table 37 Calculation of total food waste losses
Sector Food
Purchases
(£m)
Avoidable
food waste yield loss
(%)
Loss of
food purchases
(m)
Number
of meals served
(millions)
Waste loss
(p/meal)
Total Wastage
(Tonnes)
Waste loss
(£/tonne)
Restaurants 1,777.1 19.4 344.2 704 48.89 199,100 1,729
QSR 2,370.8 6.6 156.4 1,977 7.91 76,400 2,047
Pubs 1,172.6 17.3 202.5 871 23.25 173,300 1,168
Hotels 1,535.9 12.6 194.1 611 31.76 78,700 2,466
Leisure 715.9 17.1 122.5 523 23.43 59,900 2,049
Staff catering 970.0 2.3 22.2 880 2.53 20,900 1,064
Healthcare 695.8 15.4 106.8 1,047 10.20 120,700 884
Education 700.3 14.7 102.7 1,134 9.06 122,600 839
Services 206.1 25.6 52.7 261 20.20 67,700 779
HaFS 10,144.5 13.2 1,339.9 8,008 19.69 919,300 1,458 Source: The food purchases and number of meals served is sourced from Horizons 2013
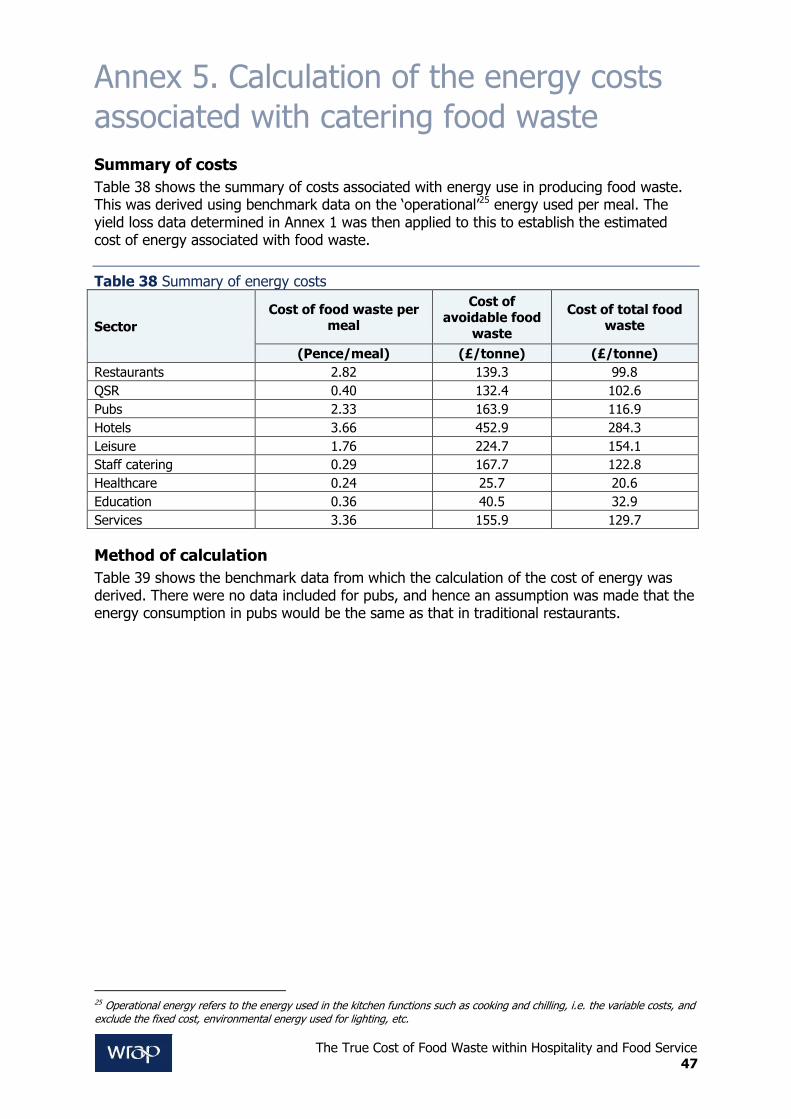
The True Cost of Food Waste within Hospitality and Food Service 47
Annex 5. Calculation of the energy costs
associated with catering food waste
Summary of costs
Table 38 shows the summary of costs associated with energy use in producing food waste. This was derived using benchmark data on the ‘operational’25 energy used per meal. The yield loss data determined in Annex 1 was then applied to this to establish the estimated cost of energy associated with food waste.
Table 38 Summary of energy costs
Sector
Cost of food waste per meal
Cost of avoidable food
waste
Cost of total food waste
(Pence/meal) (£/tonne) (£/tonne)
Restaurants 2.82 139.3 99.8
QSR 0.40 132.4 102.6
Pubs 2.33 163.9 116.9
Hotels 3.66 452.9 284.3
Leisure 1.76 224.7 154.1
Staff catering 0.29 167.7 122.8
Healthcare 0.24 25.7 20.6
Education 0.36 40.5 32.9
Services 3.36 155.9 129.7
Method of calculation
Table 39 shows the benchmark data from which the calculation of the cost of energy was derived. There were no data included for pubs, and hence an assumption was made that the energy consumption in pubs would be the same as that in traditional restaurants.
25 Operational energy refers to the energy used in the kitchen functions such as cooking and chilling, i.e. the variable costs, and exclude the fixed cost, environmental energy used for lighting, etc.
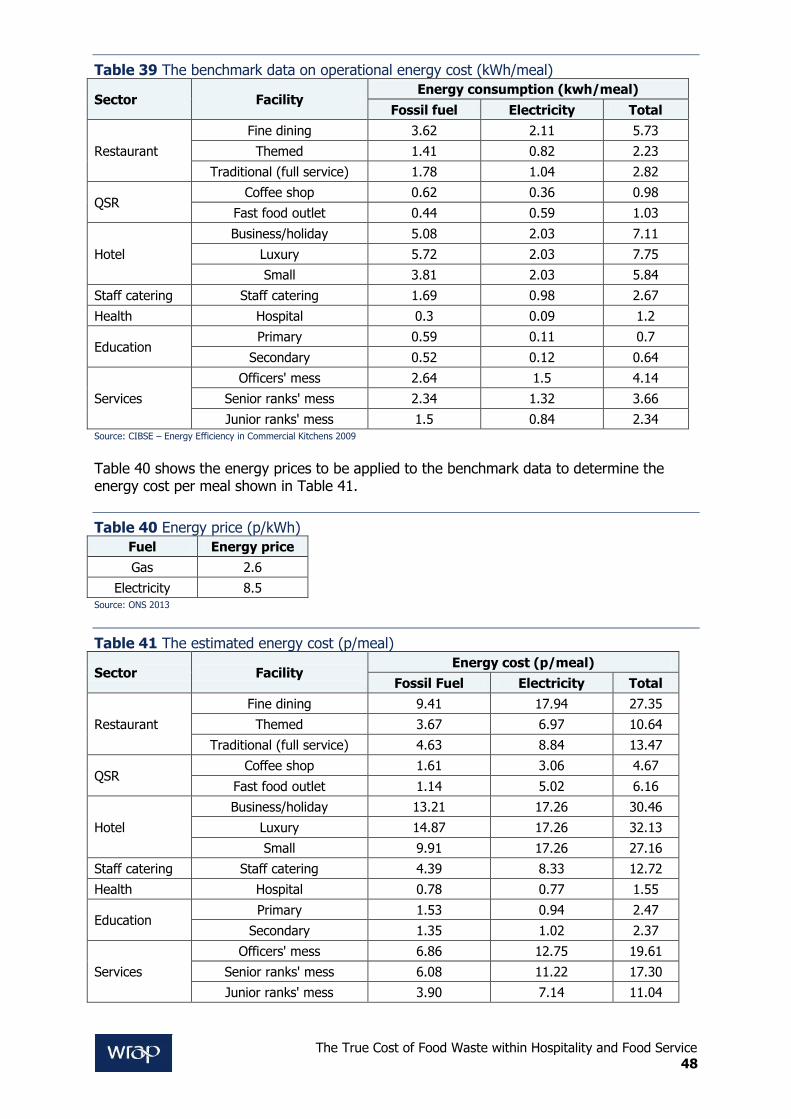
The True Cost of Food Waste within Hospitality and Food Service 48
Table 39 The benchmark data on operational energy cost (kWh/meal)
Sector Facility Energy consumption (kwh/meal)
Fossil fuel Electricity Total
Restaurant
Fine dining 3.62 2.11 5.73
Themed 1.41 0.82 2.23
Traditional (full service) 1.78 1.04 2.82
QSR Coffee shop 0.62 0.36 0.98
Fast food outlet 0.44 0.59 1.03
Hotel
Business/holiday 5.08 2.03 7.11
Luxury 5.72 2.03 7.75
Small 3.81 2.03 5.84
Staff catering Staff catering 1.69 0.98 2.67
Health Hospital 0.3 0.09 1.2
Education Primary 0.59 0.11 0.7
Secondary 0.52 0.12 0.64
Services
Officers' mess 2.64 1.5 4.14
Senior ranks' mess 2.34 1.32 3.66
Junior ranks' mess 1.5 0.84 2.34 Source: CIBSE – Energy Efficiency in Commercial Kitchens 2009
Table 40 shows the energy prices to be applied to the benchmark data to determine the energy cost per meal shown in Table 41.
Table 40 Energy price (p/kWh)
Fuel Energy price
Gas 2.6
Electricity 8.5 Source: ONS 2013
Table 41 The estimated energy cost (p/meal)
Sector Facility Energy cost (p/meal)
Fossil Fuel Electricity Total
Restaurant
Fine dining 9.41 17.94 27.35
Themed 3.67 6.97 10.64
Traditional (full service) 4.63 8.84 13.47
QSR Coffee shop 1.61 3.06 4.67
Fast food outlet 1.14 5.02 6.16
Hotel
Business/holiday 13.21 17.26 30.46
Luxury 14.87 17.26 32.13
Small 9.91 17.26 27.16
Staff catering Staff catering 4.39 8.33 12.72
Health Hospital 0.78 0.77 1.55
Education Primary 1.53 0.94 2.47
Secondary 1.35 1.02 2.37
Services
Officers' mess 6.86 12.75 19.61
Senior ranks' mess 6.08 11.22 17.30
Junior ranks' mess 3.90 7.14 11.04
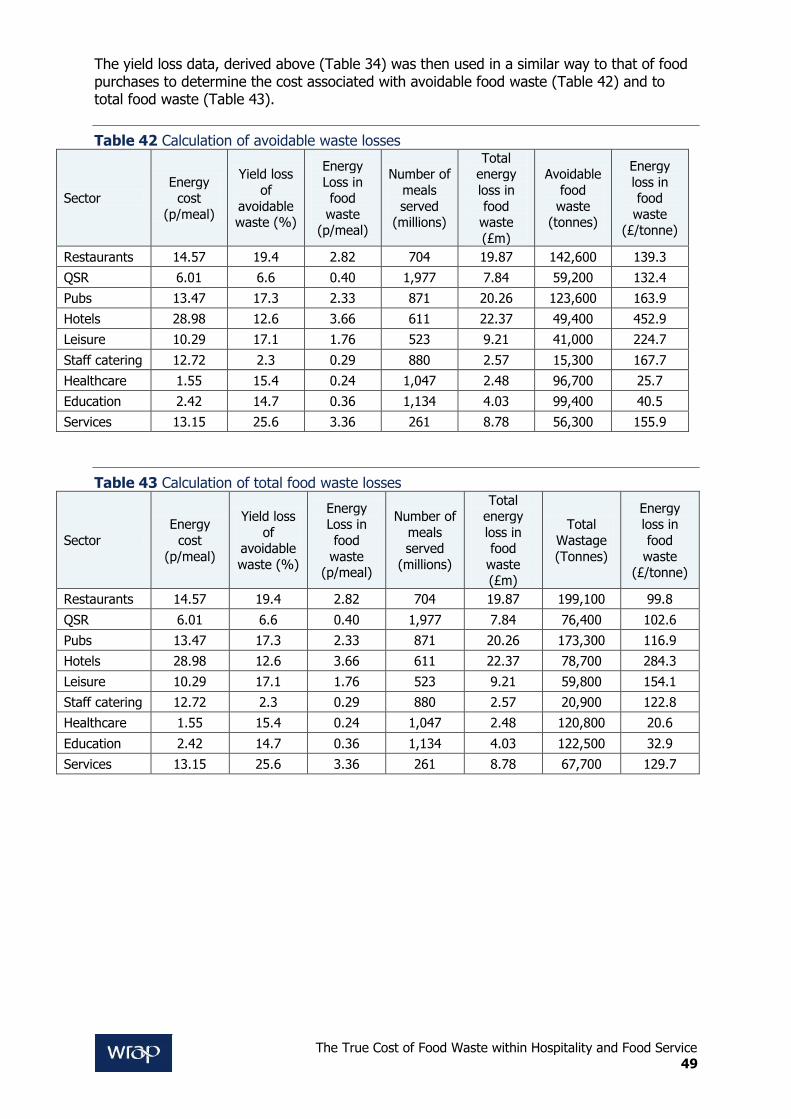
The True Cost of Food Waste within Hospitality and Food Service 49
The yield loss data, derived above (Table 34) was then used in a similar way to that of food purchases to determine the cost associated with avoidable food waste (Table 42) and to total food waste (Table 43).
Table 42 Calculation of avoidable waste losses
Sector Energy
cost
(p/meal)
Yield loss
of
avoidable waste (%)
Energy
Loss in food
waste (p/meal)
Number of
meals
served (millions)
Total energy
loss in
food waste
(£m)
Avoidable
food
waste (tonnes)
Energy
loss in food
waste (£/tonne)
Restaurants 14.57 19.4 2.82 704 19.87 142,600 139.3
QSR 6.01 6.6 0.40 1,977 7.84 59,200 132.4
Pubs 13.47 17.3 2.33 871 20.26 123,600 163.9
Hotels 28.98 12.6 3.66 611 22.37 49,400 452.9
Leisure 10.29 17.1 1.76 523 9.21 41,000 224.7
Staff catering 12.72 2.3 0.29 880 2.57 15,300 167.7
Healthcare 1.55 15.4 0.24 1,047 2.48 96,700 25.7
Education 2.42 14.7 0.36 1,134 4.03 99,400 40.5
Services 13.15 25.6 3.36 261 8.78 56,300 155.9
Table 43 Calculation of total food waste losses
Sector
Energy
cost
(p/meal)
Yield loss
of avoidable
waste (%)
Energy Loss in
food
waste (p/meal)
Number of
meals served
(millions)
Total energy
loss in food
waste (£m)
Total
Wastage
(Tonnes)
Energy loss in
food
waste (£/tonne)
Restaurants 14.57 19.4 2.82 704 19.87 199,100 99.8
QSR 6.01 6.6 0.40 1,977 7.84 76,400 102.6
Pubs 13.47 17.3 2.33 871 20.26 173,300 116.9
Hotels 28.98 12.6 3.66 611 22.37 78,700 284.3
Leisure 10.29 17.1 1.76 523 9.21 59,800 154.1
Staff catering 12.72 2.3 0.29 880 2.57 20,900 122.8
Healthcare 1.55 15.4 0.24 1,047 2.48 120,800 20.6
Education 2.42 14.7 0.36 1,134 4.03 122,500 32.9
Services 13.15 25.6 3.36 261 8.78 67,700 129.7
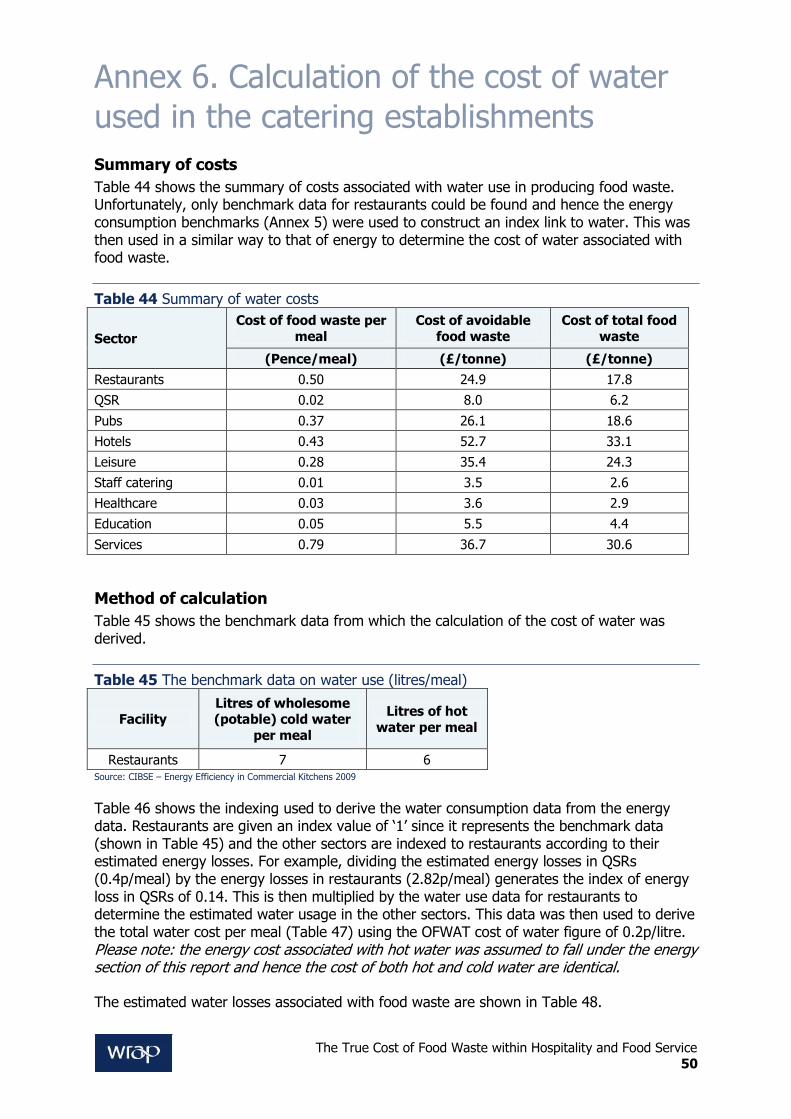
The True Cost of Food Waste within Hospitality and Food Service 50
Annex 6. Calculation of the cost of water
used in the catering establishments
Summary of costs
Table 44 shows the summary of costs associated with water use in producing food waste. Unfortunately, only benchmark data for restaurants could be found and hence the energy consumption benchmarks (Annex 5) were used to construct an index link to water. This was then used in a similar way to that of energy to determine the cost of water associated with food waste.
Table 44 Summary of water costs
Sector
Cost of food waste per
meal
Cost of avoidable
food waste
Cost of total food
waste
(Pence/meal) (£/tonne) (£/tonne)
Restaurants 0.50 24.9 17.8
QSR 0.02 8.0 6.2
Pubs 0.37 26.1 18.6
Hotels 0.43 52.7 33.1
Leisure 0.28 35.4 24.3
Staff catering 0.01 3.5 2.6
Healthcare 0.03 3.6 2.9
Education 0.05 5.5 4.4
Services 0.79 36.7 30.6
Method of calculation
Table 45 shows the benchmark data from which the calculation of the cost of water was derived.
Table 45 The benchmark data on water use (litres/meal)
Facility Litres of wholesome (potable) cold water
per meal
Litres of hot
water per meal
Restaurants 7 6 Source: CIBSE – Energy Efficiency in Commercial Kitchens 2009
Table 46 shows the indexing used to derive the water consumption data from the energy data. Restaurants are given an index value of ‘1’ since it represents the benchmark data (shown in Table 45) and the other sectors are indexed to restaurants according to their estimated energy losses. For example, dividing the estimated energy losses in QSRs (0.4p/meal) by the energy losses in restaurants (2.82p/meal) generates the index of energy loss in QSRs of 0.14. This is then multiplied by the water use data for restaurants to determine the estimated water usage in the other sectors. This data was then used to derive the total water cost per meal (Table 47) using the OFWAT cost of water figure of 0.2p/litre. Please note: the energy cost associated with hot water was assumed to fall under the energy section of this report and hence the cost of both hot and cold water are identical.
The estimated water losses associated with food waste are shown in Table 48.
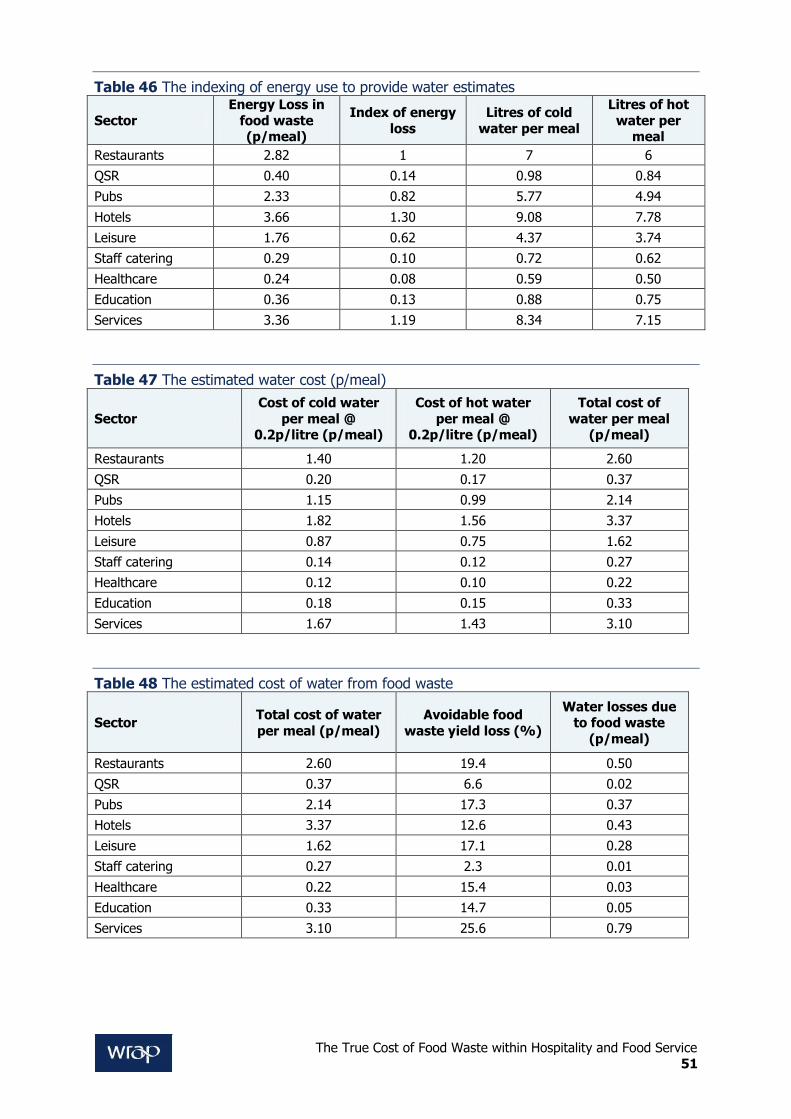
The True Cost of Food Waste within Hospitality and Food Service 51
Table 46 The indexing of energy use to provide water estimates
Sector
Energy Loss in
food waste (p/meal)
Index of energy
loss
Litres of cold
water per meal
Litres of hot
water per meal
Restaurants 2.82 1 7 6
QSR 0.40 0.14 0.98 0.84
Pubs 2.33 0.82 5.77 4.94
Hotels 3.66 1.30 9.08 7.78
Leisure 1.76 0.62 4.37 3.74
Staff catering 0.29 0.10 0.72 0.62
Healthcare 0.24 0.08 0.59 0.50
Education 0.36 0.13 0.88 0.75
Services 3.36 1.19 8.34 7.15
Table 47 The estimated water cost (p/meal)
Sector
Cost of cold water
per meal @ 0.2p/litre (p/meal)
Cost of hot water
per meal @ 0.2p/litre (p/meal)
Total cost of
water per meal (p/meal)
Restaurants 1.40 1.20 2.60
QSR 0.20 0.17 0.37
Pubs 1.15 0.99 2.14
Hotels 1.82 1.56 3.37
Leisure 0.87 0.75 1.62
Staff catering 0.14 0.12 0.27
Healthcare 0.12 0.10 0.22
Education 0.18 0.15 0.33
Services 1.67 1.43 3.10
Table 48 The estimated cost of water from food waste
Sector Total cost of water
per meal (p/meal)
Avoidable food
waste yield loss (%)
Water losses due to food waste
(p/meal)
Restaurants 2.60 19.4 0.50
QSR 0.37 6.6 0.02
Pubs 2.14 17.3 0.37
Hotels 3.37 12.6 0.43
Leisure 1.62 17.1 0.28
Staff catering 0.27 2.3 0.01
Healthcare 0.22 15.4 0.03
Education 0.33 14.7 0.05
Services 3.10 25.6 0.79
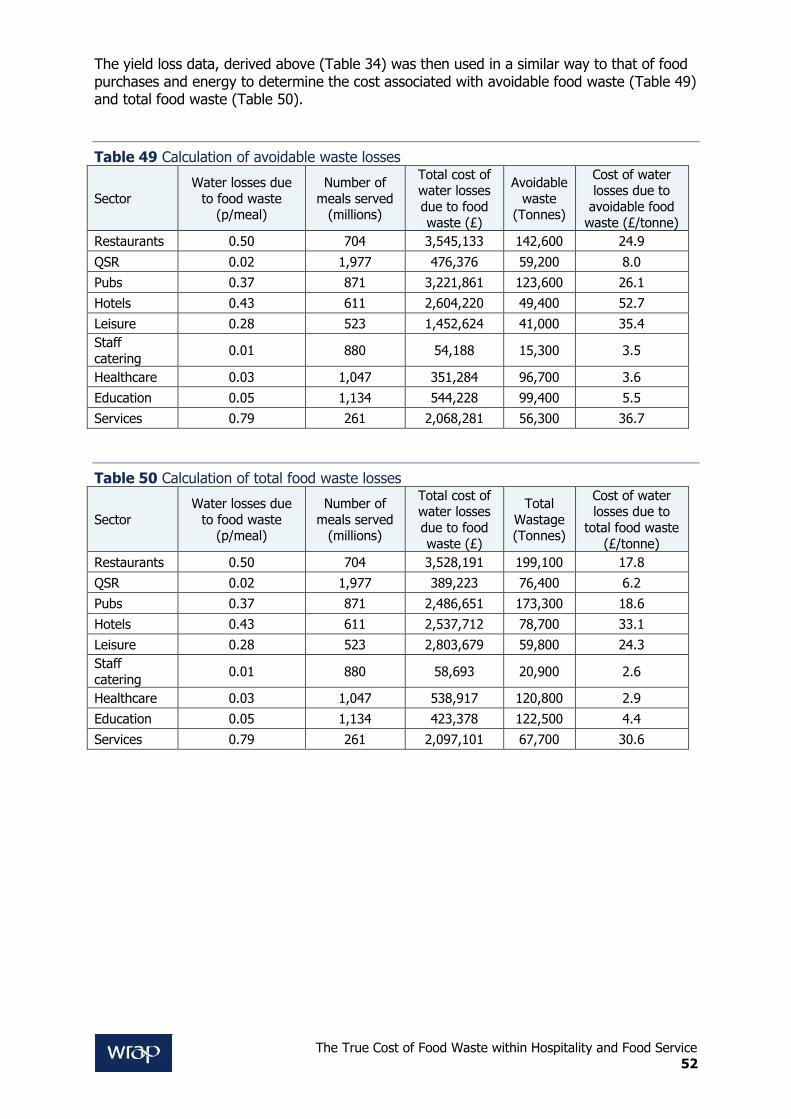
The True Cost of Food Waste within Hospitality and Food Service 52
The yield loss data, derived above (Table 34) was then used in a similar way to that of food purchases and energy to determine the cost associated with avoidable food waste (Table 49) and total food waste (Table 50).
Table 49 Calculation of avoidable waste losses
Sector
Water losses due
to food waste (p/meal)
Number of
meals served (millions)
Total cost of water losses
due to food
waste (£)
Avoidable
waste (Tonnes)
Cost of water losses due to
avoidable food
waste (£/tonne)
Restaurants 0.50 704 3,545,133 142,600 24.9
QSR 0.02 1,977 476,376 59,200 8.0
Pubs 0.37 871 3,221,861 123,600 26.1
Hotels 0.43 611 2,604,220 49,400 52.7
Leisure 0.28 523 1,452,624 41,000 35.4
Staff
catering 0.01 880 54,188 15,300 3.5
Healthcare 0.03 1,047 351,284 96,700 3.6
Education 0.05 1,134 544,228 99,400 5.5
Services 0.79 261 2,068,281 56,300 36.7
Table 50 Calculation of total food waste losses
Sector
Water losses due
to food waste (p/meal)
Number of
meals served (millions)
Total cost of water losses
due to food
waste (£)
Total
Wastage (Tonnes)
Cost of water losses due to
total food waste
(£/tonne)
Restaurants 0.50 704 3,528,191 199,100 17.8
QSR 0.02 1,977 389,223 76,400 6.2
Pubs 0.37 871 2,486,651 173,300 18.6
Hotels 0.43 611 2,537,712 78,700 33.1
Leisure 0.28 523 2,803,679 59,800 24.3
Staff
catering 0.01 880 58,693 20,900 2.6
Healthcare 0.03 1,047 538,917 120,800 2.9
Education 0.05 1,134 423,378 122,500 4.4
Services 0.79 261 2,097,101 67,700 30.6
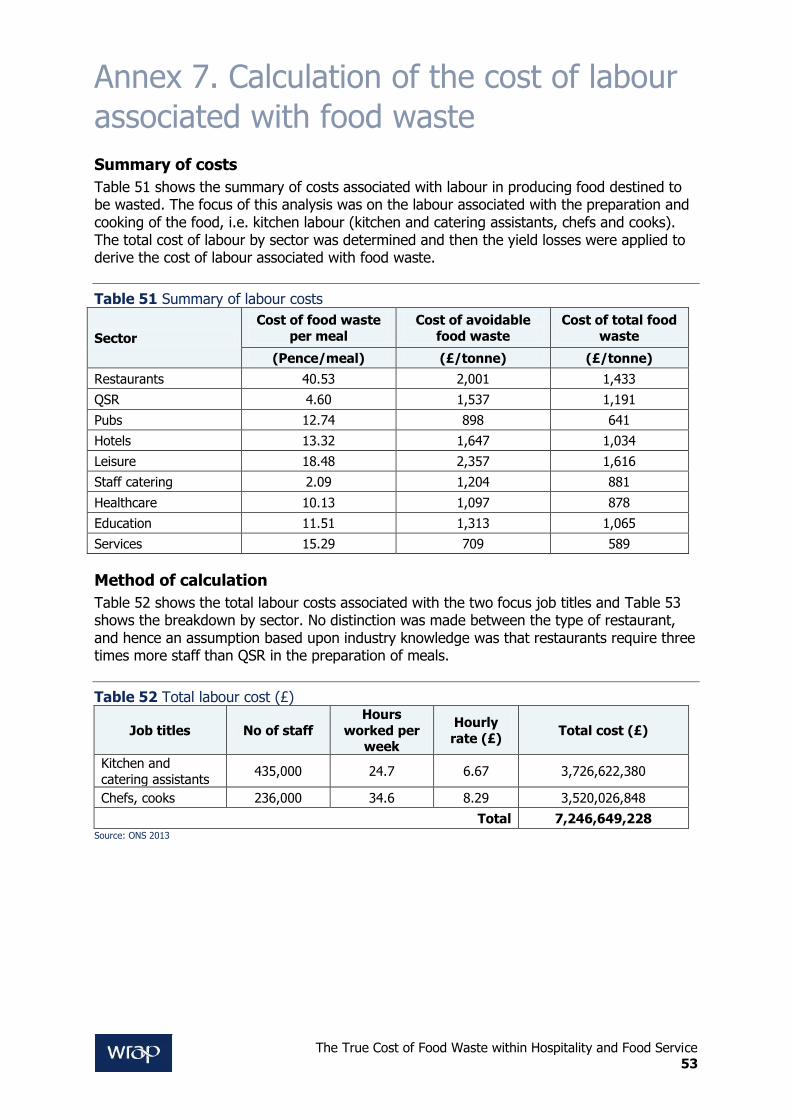
The True Cost of Food Waste within Hospitality and Food Service 53
Annex 7. Calculation of the cost of labour
associated with food waste
Summary of costs
Table 51 shows the summary of costs associated with labour in producing food destined to be wasted. The focus of this analysis was on the labour associated with the preparation and cooking of the food, i.e. kitchen labour (kitchen and catering assistants, chefs and cooks). The total cost of labour by sector was determined and then the yield losses were applied to derive the cost of labour associated with food waste.
Table 51 Summary of labour costs
Sector
Cost of food waste
per meal
Cost of avoidable
food waste
Cost of total food
waste
(Pence/meal) (£/tonne) (£/tonne)
Restaurants 40.53 2,001 1,433
QSR 4.60 1,537 1,191
Pubs 12.74 898 641
Hotels 13.32 1,647 1,034
Leisure 18.48 2,357 1,616
Staff catering 2.09 1,204 881
Healthcare 10.13 1,097 878
Education 11.51 1,313 1,065
Services 15.29 709 589
Method of calculation
Table 52 shows the total labour costs associated with the two focus job titles and Table 53 shows the breakdown by sector. No distinction was made between the type of restaurant, and hence an assumption based upon industry knowledge was that restaurants require three times more staff than QSR in the preparation of meals.
Table 52 Total labour cost (£)
Job titles No of staff
Hours
worked per week
Hourly
rate (£) Total cost (£)
Kitchen and
catering assistants 435,000 24.7 6.67 3,726,622,380
Chefs, cooks 236,000 34.6 8.29 3,520,026,848
Total 7,246,649,228 Source: ONS 2013
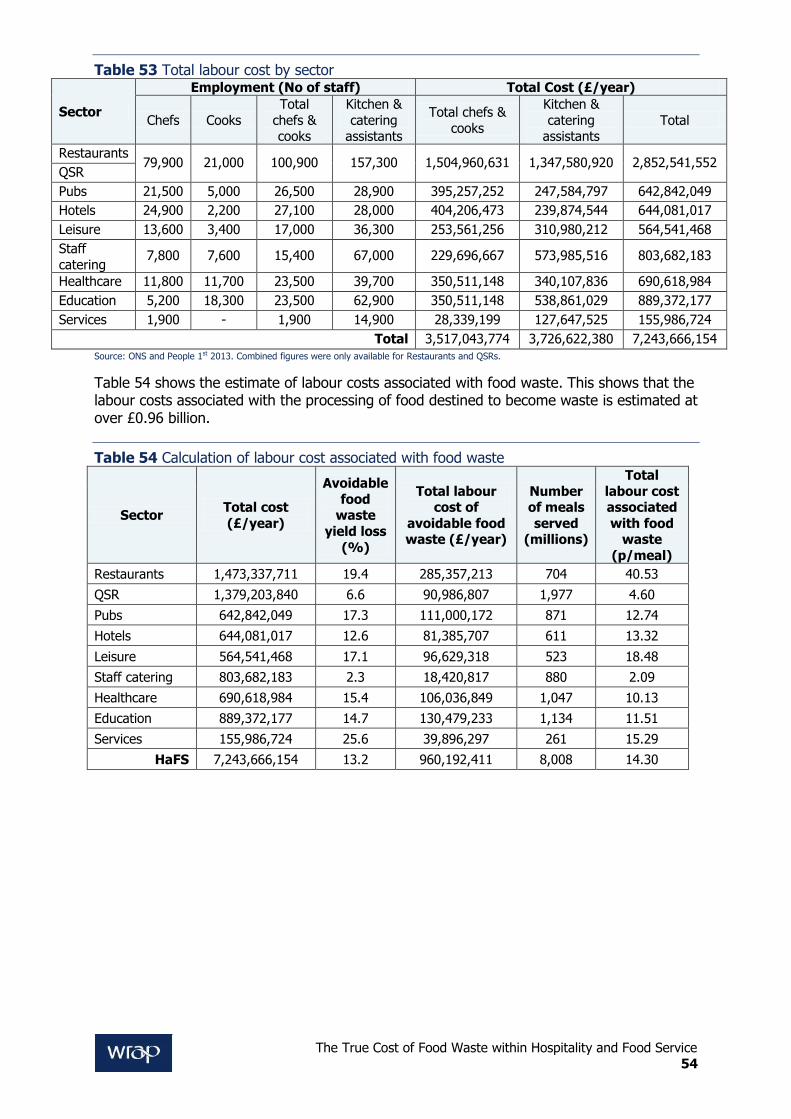
The True Cost of Food Waste within Hospitality and Food Service 54
Table 53 Total labour cost by sector
Sector
Employment (No of staff) Total Cost (£/year)
Chefs Cooks
Total
chefs & cooks
Kitchen &
catering assistants
Total chefs &
cooks
Kitchen &
catering assistants
Total
Restaurants 79,900 21,000 100,900 157,300 1,504,960,631 1,347,580,920 2,852,541,552
QSR
Pubs 21,500 5,000 26,500 28,900 395,257,252 247,584,797 642,842,049
Hotels 24,900 2,200 27,100 28,000 404,206,473 239,874,544 644,081,017
Leisure 13,600 3,400 17,000 36,300 253,561,256 310,980,212 564,541,468
Staff
catering 7,800 7,600 15,400 67,000 229,696,667 573,985,516 803,682,183
Healthcare 11,800 11,700 23,500 39,700 350,511,148 340,107,836 690,618,984
Education 5,200 18,300 23,500 62,900 350,511,148 538,861,029 889,372,177
Services 1,900 - 1,900 14,900 28,339,199 127,647,525 155,986,724
Total 3,517,043,774 3,726,622,380 7,243,666,154 Source: ONS and People 1st 2013. Combined figures were only available for Restaurants and QSRs.
Table 54 shows the estimate of labour costs associated with food waste. This shows that the labour costs associated with the processing of food destined to become waste is estimated at over £0.96 billion.
Table 54 Calculation of labour cost associated with food waste
Sector Total cost
(£/year)
Avoidable
food waste
yield loss
(%)
Total labour cost of
avoidable food waste (£/year)
Number of meals
served (millions)
Total
labour cost associated
with food waste
(p/meal)
Restaurants 1,473,337,711 19.4 285,357,213 704 40.53
QSR 1,379,203,840 6.6 90,986,807 1,977 4.60
Pubs 642,842,049 17.3 111,000,172 871 12.74
Hotels 644,081,017 12.6 81,385,707 611 13.32
Leisure 564,541,468 17.1 96,629,318 523 18.48
Staff catering 803,682,183 2.3 18,420,817 880 2.09
Healthcare 690,618,984 15.4 106,036,849 1,047 10.13
Education 889,372,177 14.7 130,479,233 1,134 11.51
Services 155,986,724 25.6 39,896,297 261 15.29
HaFS 7,243,666,154 13.2 960,192,411 8,008 14.30
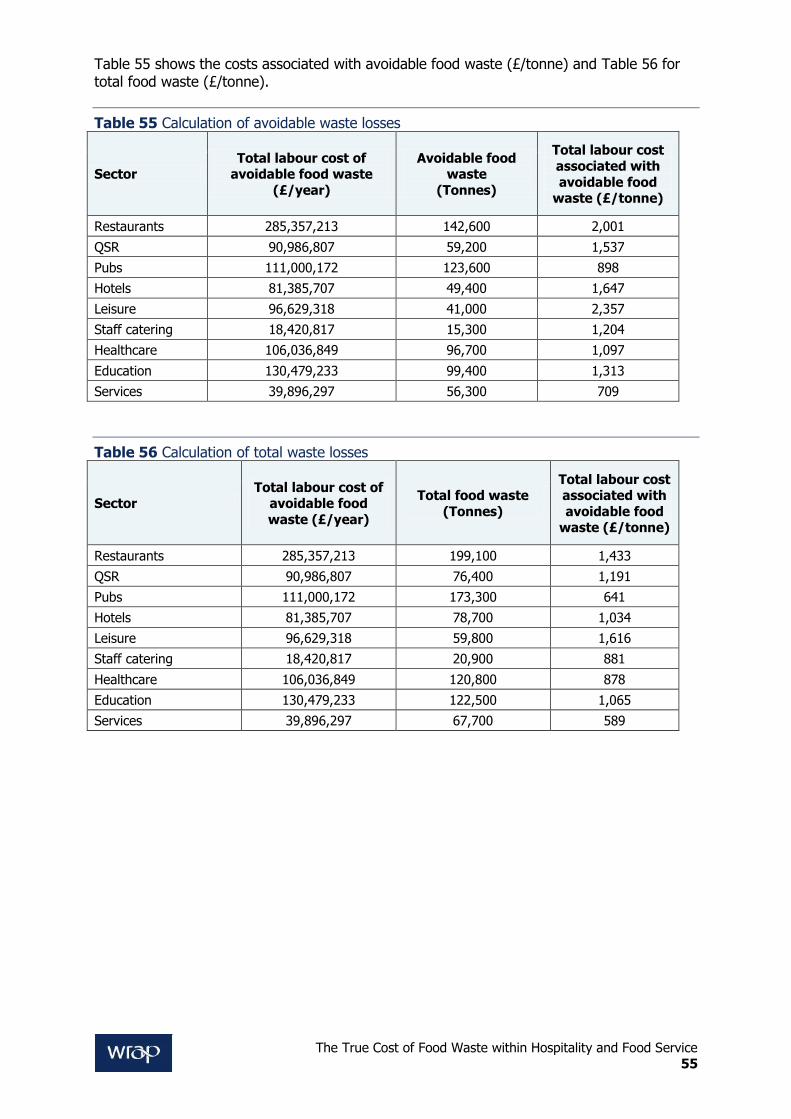
The True Cost of Food Waste within Hospitality and Food Service 55
Table 55 shows the costs associated with avoidable food waste (£/tonne) and Table 56 for total food waste (£/tonne).
Table 55 Calculation of avoidable waste losses
Sector Total labour cost of
avoidable food waste
(£/year)
Avoidable food waste
(Tonnes)
Total labour cost
associated with
avoidable food waste (£/tonne)
Restaurants 285,357,213 142,600 2,001
QSR 90,986,807 59,200 1,537
Pubs 111,000,172 123,600 898
Hotels 81,385,707 49,400 1,647
Leisure 96,629,318 41,000 2,357
Staff catering 18,420,817 15,300 1,204
Healthcare 106,036,849 96,700 1,097
Education 130,479,233 99,400 1,313
Services 39,896,297 56,300 709
Table 56 Calculation of total waste losses
Sector Total labour cost of
avoidable food
waste (£/year)
Total food waste
(Tonnes)
Total labour cost associated with
avoidable food waste (£/tonne)
Restaurants 285,357,213 199,100 1,433
QSR 90,986,807 76,400 1,191
Pubs 111,000,172 173,300 641
Hotels 81,385,707 78,700 1,034
Leisure 96,629,318 59,800 1,616
Staff catering 18,420,817 20,900 881
Healthcare 106,036,849 120,800 878
Education 130,479,233 122,500 1,065
Services 39,896,297 67,700 589
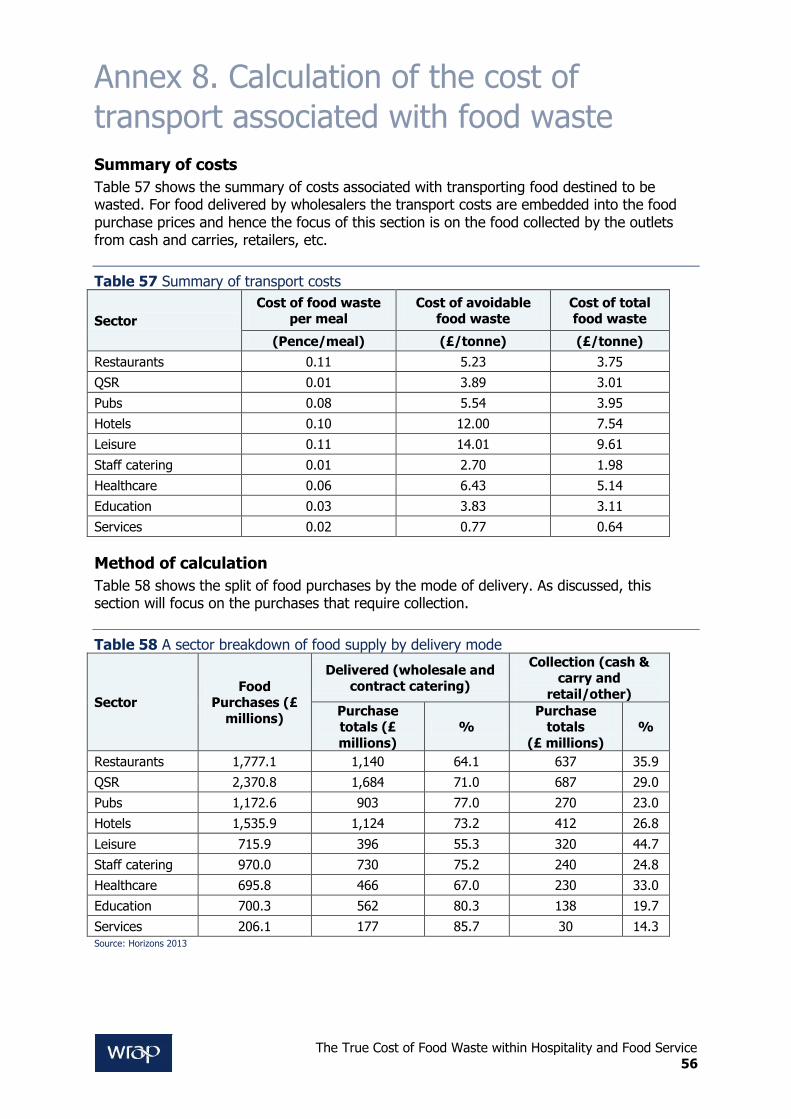
The True Cost of Food Waste within Hospitality and Food Service 56
Annex 8. Calculation of the cost of
transport associated with food waste
Summary of costs
Table 57 shows the summary of costs associated with transporting food destined to be wasted. For food delivered by wholesalers the transport costs are embedded into the food purchase prices and hence the focus of this section is on the food collected by the outlets from cash and carries, retailers, etc.
Table 57 Summary of transport costs
Sector
Cost of food waste per meal
Cost of avoidable food waste
Cost of total food waste
(Pence/meal) (£/tonne) (£/tonne)
Restaurants 0.11 5.23 3.75
QSR 0.01 3.89 3.01
Pubs 0.08 5.54 3.95
Hotels 0.10 12.00 7.54
Leisure 0.11 14.01 9.61
Staff catering 0.01 2.70 1.98
Healthcare 0.06 6.43 5.14
Education 0.03 3.83 3.11
Services 0.02 0.77 0.64
Method of calculation
Table 58 shows the split of food purchases by the mode of delivery. As discussed, this section will focus on the purchases that require collection.
Table 58 A sector breakdown of food supply by delivery mode
Sector Food
Purchases (£
millions)
Delivered (wholesale and
contract catering)
Collection (cash & carry and
retail/other)
Purchase totals (£
millions)
% Purchase
totals
(£ millions)
%
Restaurants 1,777.1 1,140 64.1 637 35.9
QSR 2,370.8 1,684 71.0 687 29.0
Pubs 1,172.6 903 77.0 270 23.0
Hotels 1,535.9 1,124 73.2 412 26.8
Leisure 715.9 396 55.3 320 44.7
Staff catering 970.0 730 75.2 240 24.8
Healthcare 695.8 466 67.0 230 33.0
Education 700.3 562 80.3 138 19.7
Services 206.1 177 85.7 30 14.3 Source: Horizons 2013
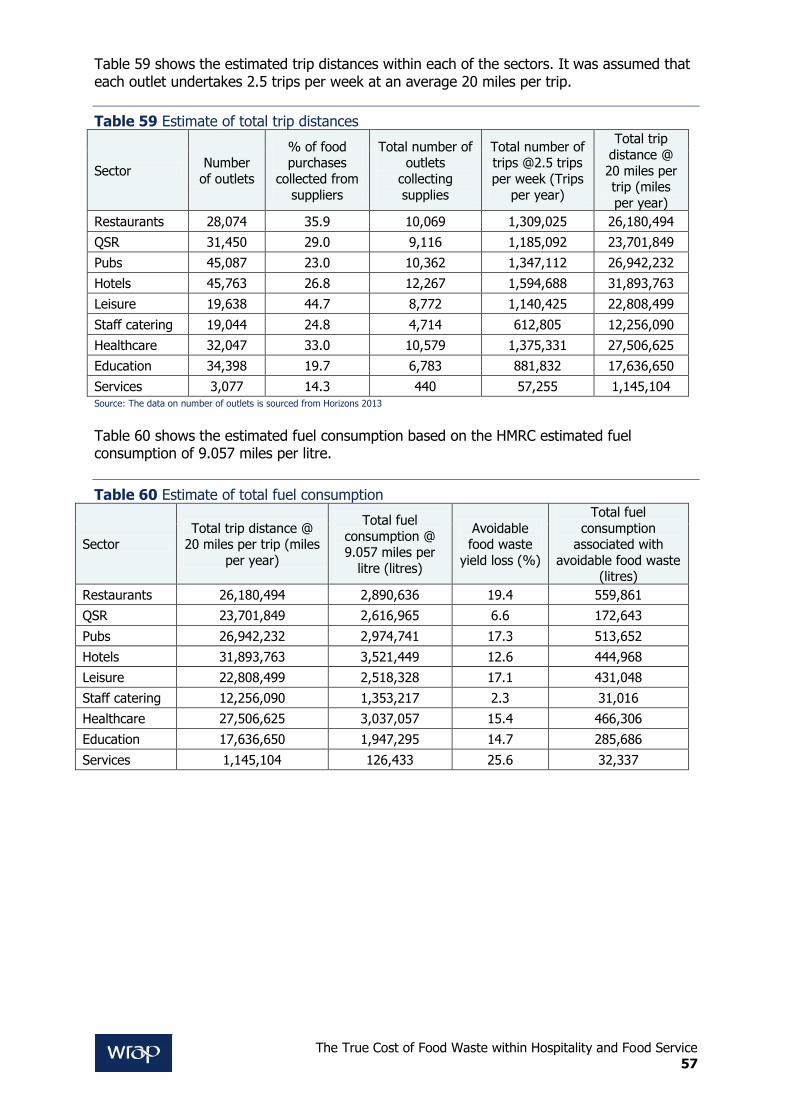
The True Cost of Food Waste within Hospitality and Food Service 57
Table 59 shows the estimated trip distances within each of the sectors. It was assumed that each outlet undertakes 2.5 trips per week at an average 20 miles per trip.
Table 59 Estimate of total trip distances
Sector Number
of outlets
% of food purchases
collected from
suppliers
Total number of outlets
collecting
supplies
Total number of trips @2.5 trips
per week (Trips
per year)
Total trip
distance @
20 miles per trip (miles
per year)
Restaurants 28,074 35.9 10,069 1,309,025 26,180,494
QSR 31,450 29.0 9,116 1,185,092 23,701,849
Pubs 45,087 23.0 10,362 1,347,112 26,942,232
Hotels 45,763 26.8 12,267 1,594,688 31,893,763
Leisure 19,638 44.7 8,772 1,140,425 22,808,499
Staff catering 19,044 24.8 4,714 612,805 12,256,090
Healthcare 32,047 33.0 10,579 1,375,331 27,506,625
Education 34,398 19.7 6,783 881,832 17,636,650
Services 3,077 14.3 440 57,255 1,145,104 Source: The data on number of outlets is sourced from Horizons 2013
Table 60 shows the estimated fuel consumption based on the HMRC estimated fuel consumption of 9.057 miles per litre.
Table 60 Estimate of total fuel consumption
Sector Total trip distance @
20 miles per trip (miles
per year)
Total fuel
consumption @ 9.057 miles per
litre (litres)
Avoidable food waste
yield loss (%)
Total fuel
consumption associated with
avoidable food waste (litres)
Restaurants 26,180,494 2,890,636 19.4 559,861
QSR 23,701,849 2,616,965 6.6 172,643
Pubs 26,942,232 2,974,741 17.3 513,652
Hotels 31,893,763 3,521,449 12.6 444,968
Leisure 22,808,499 2,518,328 17.1 431,048
Staff catering 12,256,090 1,353,217 2.3 31,016
Healthcare 27,506,625 3,037,057 15.4 466,306
Education 17,636,650 1,947,295 14.7 285,686
Services 1,145,104 126,433 25.6 32,337
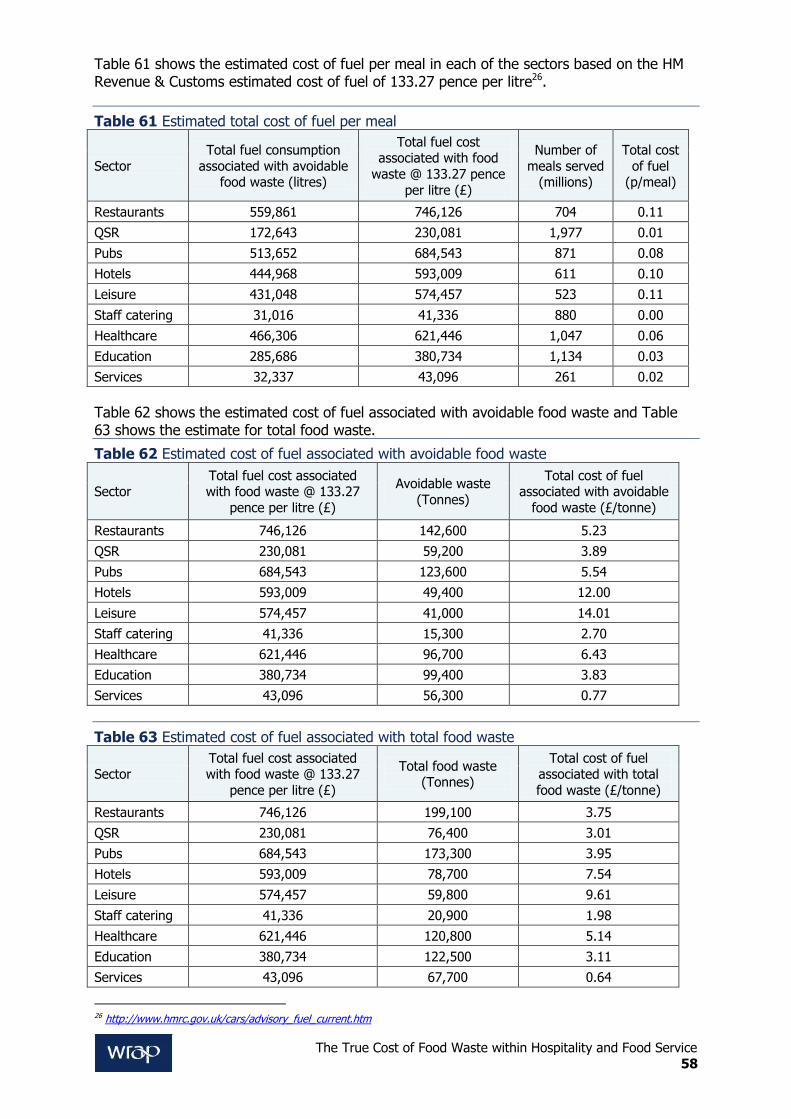
The True Cost of Food Waste within Hospitality and Food Service 58
Table 61 shows the estimated cost of fuel per meal in each of the sectors based on the HM Revenue & Customs estimated cost of fuel of 133.27 pence per litre26.
Table 61 Estimated total cost of fuel per meal
Sector
Total fuel consumption
associated with avoidable food waste (litres)
Total fuel cost associated with food
waste @ 133.27 pence
per litre (£)
Number of
meals served (millions)
Total cost
of fuel (p/meal)
Restaurants 559,861 746,126 704 0.11
QSR 172,643 230,081 1,977 0.01
Pubs 513,652 684,543 871 0.08
Hotels 444,968 593,009 611 0.10
Leisure 431,048 574,457 523 0.11
Staff catering 31,016 41,336 880 0.00
Healthcare 466,306 621,446 1,047 0.06
Education 285,686 380,734 1,134 0.03
Services 32,337 43,096 261 0.02
Table 62 shows the estimated cost of fuel associated with avoidable food waste and Table 63 shows the estimate for total food waste.
Table 62 Estimated cost of fuel associated with avoidable food waste
Sector Total fuel cost associated with food waste @ 133.27
pence per litre (£)
Avoidable waste
(Tonnes)
Total cost of fuel associated with avoidable
food waste (£/tonne)
Restaurants 746,126 142,600 5.23
QSR 230,081 59,200 3.89
Pubs 684,543 123,600 5.54
Hotels 593,009 49,400 12.00
Leisure 574,457 41,000 14.01
Staff catering 41,336 15,300 2.70
Healthcare 621,446 96,700 6.43
Education 380,734 99,400 3.83
Services 43,096 56,300 0.77
Table 63 Estimated cost of fuel associated with total food waste
Sector Total fuel cost associated with food waste @ 133.27
pence per litre (£)
Total food waste (Tonnes)
Total cost of fuel associated with total
food waste (£/tonne)
Restaurants 746,126 199,100 3.75
QSR 230,081 76,400 3.01
Pubs 684,543 173,300 3.95
Hotels 593,009 78,700 7.54
Leisure 574,457 59,800 9.61
Staff catering 41,336 20,900 1.98
Healthcare 621,446 120,800 5.14
Education 380,734 122,500 3.11
Services 43,096 67,700 0.64
26 http://www.hmrc.gov.uk/cars/advisory_fuel_current.htm
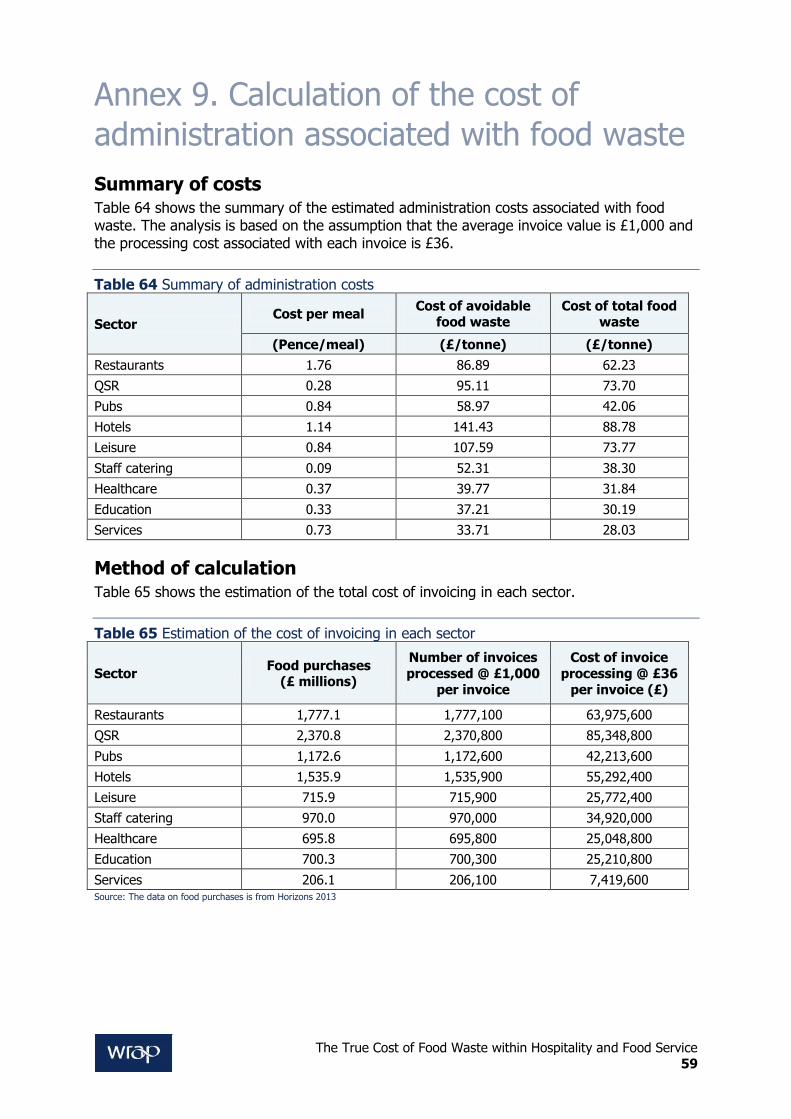
The True Cost of Food Waste within Hospitality and Food Service 59
Annex 9. Calculation of the cost of
administration associated with food waste
Summary of costs Table 64 shows the summary of the estimated administration costs associated with food waste. The analysis is based on the assumption that the average invoice value is £1,000 and the processing cost associated with each invoice is £36.
Table 64 Summary of administration costs
Sector Cost per meal
Cost of avoidable food waste
Cost of total food waste
(Pence/meal) (£/tonne) (£/tonne)
Restaurants 1.76 86.89 62.23
QSR 0.28 95.11 73.70
Pubs 0.84 58.97 42.06
Hotels 1.14 141.43 88.78
Leisure 0.84 107.59 73.77
Staff catering 0.09 52.31 38.30
Healthcare 0.37 39.77 31.84
Education 0.33 37.21 30.19
Services 0.73 33.71 28.03
Method of calculation Table 65 shows the estimation of the total cost of invoicing in each sector.
Table 65 Estimation of the cost of invoicing in each sector
Sector Food purchases
(£ millions)
Number of invoices
processed @ £1,000
per invoice
Cost of invoice
processing @ £36
per invoice (£)
Restaurants 1,777.1 1,777,100 63,975,600
QSR 2,370.8 2,370,800 85,348,800
Pubs 1,172.6 1,172,600 42,213,600
Hotels 1,535.9 1,535,900 55,292,400
Leisure 715.9 715,900 25,772,400
Staff catering 970.0 970,000 34,920,000
Healthcare 695.8 695,800 25,048,800
Education 700.3 700,300 25,210,800
Services 206.1 206,100 7,419,600 Source: The data on food purchases is from Horizons 2013
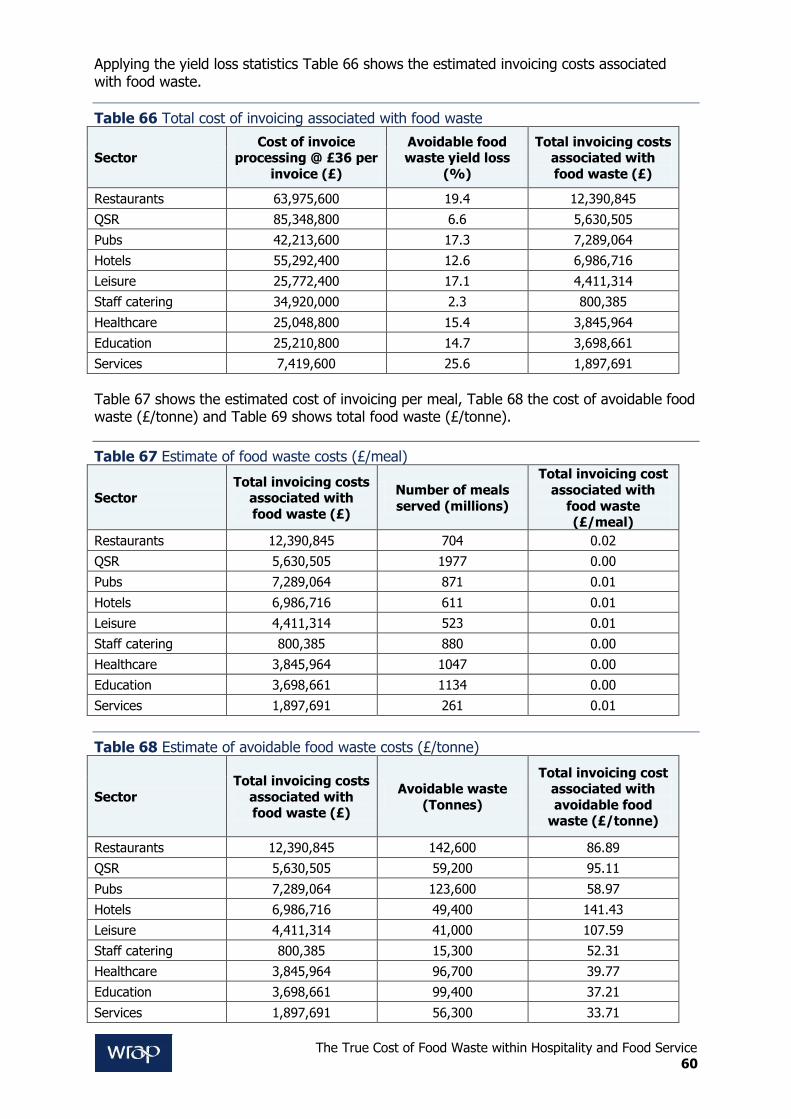
The True Cost of Food Waste within Hospitality and Food Service 60
Applying the yield loss statistics Table 66 shows the estimated invoicing costs associated with food waste.
Table 66 Total cost of invoicing associated with food waste
Sector Cost of invoice
processing @ £36 per
invoice (£)
Avoidable food waste yield loss
(%)
Total invoicing costs associated with
food waste (£)
Restaurants 63,975,600 19.4 12,390,845
QSR 85,348,800 6.6 5,630,505
Pubs 42,213,600 17.3 7,289,064
Hotels 55,292,400 12.6 6,986,716
Leisure 25,772,400 17.1 4,411,314
Staff catering 34,920,000 2.3 800,385
Healthcare 25,048,800 15.4 3,845,964
Education 25,210,800 14.7 3,698,661
Services 7,419,600 25.6 1,897,691
Table 67 shows the estimated cost of invoicing per meal, Table 68 the cost of avoidable food waste (£/tonne) and Table 69 shows total food waste (£/tonne).
Table 67 Estimate of food waste costs (£/meal)
Sector Total invoicing costs
associated with
food waste (£)
Number of meals
served (millions)
Total invoicing cost
associated with
food waste (£/meal)
Restaurants 12,390,845 704 0.02
QSR 5,630,505 1977 0.00
Pubs 7,289,064 871 0.01
Hotels 6,986,716 611 0.01
Leisure 4,411,314 523 0.01
Staff catering 800,385 880 0.00
Healthcare 3,845,964 1047 0.00
Education 3,698,661 1134 0.00
Services 1,897,691 261 0.01
Table 68 Estimate of avoidable food waste costs (£/tonne)
Sector
Total invoicing costs
associated with food waste (£)
Avoidable waste
(Tonnes)
Total invoicing cost associated with
avoidable food waste (£/tonne)
Restaurants 12,390,845 142,600 86.89
QSR 5,630,505 59,200 95.11
Pubs 7,289,064 123,600 58.97
Hotels 6,986,716 49,400 141.43
Leisure 4,411,314 41,000 107.59
Staff catering 800,385 15,300 52.31
Healthcare 3,845,964 96,700 39.77
Education 3,698,661 99,400 37.21
Services 1,897,691 56,300 33.71
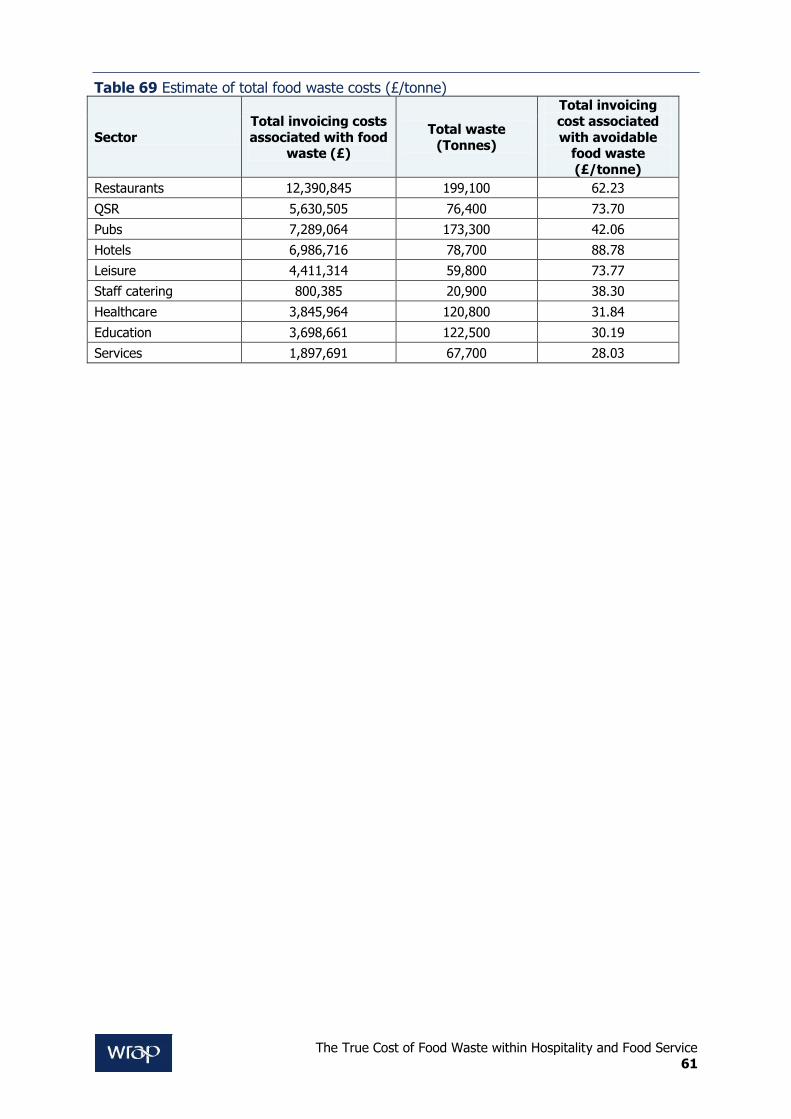
The True Cost of Food Waste within Hospitality and Food Service 61
Table 69 Estimate of total food waste costs (£/tonne)
Sector
Total invoicing costs
associated with food waste (£)
Total waste
(Tonnes)
Total invoicing
cost associated
with avoidable food waste
(£/tonne)
Restaurants 12,390,845 199,100 62.23
QSR 5,630,505 76,400 73.70
Pubs 7,289,064 173,300 42.06
Hotels 6,986,716 78,700 88.78
Leisure 4,411,314 59,800 73.77
Staff catering 800,385 20,900 38.30
Healthcare 3,845,964 120,800 31.84
Education 3,698,661 122,500 30.19
Services 1,897,691 67,700 28.03
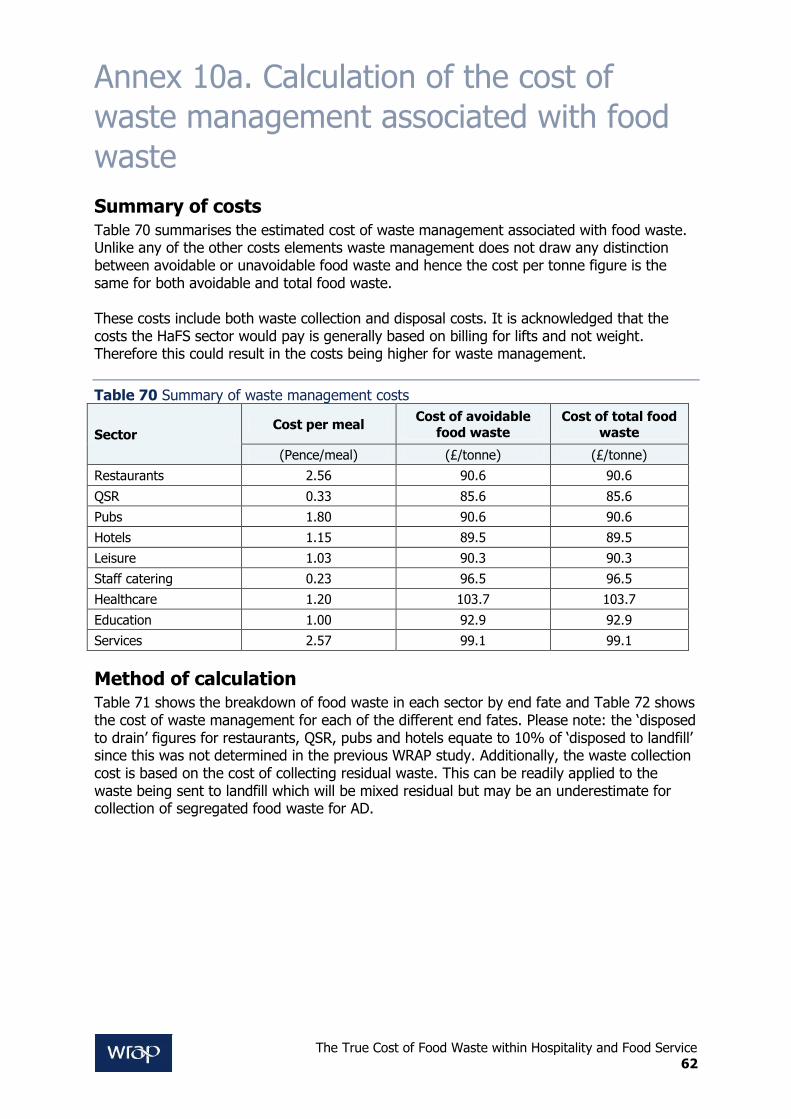
The True Cost of Food Waste within Hospitality and Food Service 62
Annex 10a. Calculation of the cost of
waste management associated with food
waste
Summary of costs Table 70 summarises the estimated cost of waste management associated with food waste. Unlike any of the other costs elements waste management does not draw any distinction between avoidable or unavoidable food waste and hence the cost per tonne figure is the same for both avoidable and total food waste. These costs include both waste collection and disposal costs. It is acknowledged that the costs the HaFS sector would pay is generally based on billing for lifts and not weight. Therefore this could result in the costs being higher for waste management.
Table 70 Summary of waste management costs
Sector Cost per meal
Cost of avoidable
food waste
Cost of total food
waste
(Pence/meal) (£/tonne) (£/tonne)
Restaurants 2.56 90.6 90.6
QSR 0.33 85.6 85.6
Pubs 1.80 90.6 90.6
Hotels 1.15 89.5 89.5
Leisure 1.03 90.3 90.3
Staff catering 0.23 96.5 96.5
Healthcare 1.20 103.7 103.7
Education 1.00 92.9 92.9
Services 2.57 99.1 99.1
Method of calculation Table 71 shows the breakdown of food waste in each sector by end fate and Table 72 shows the cost of waste management for each of the different end fates. Please note: the ‘disposed to drain’ figures for restaurants, QSR, pubs and hotels equate to 10% of ‘disposed to landfill’ since this was not determined in the previous WRAP study. Additionally, the waste collection cost is based on the cost of collecting residual waste. This can be readily applied to the waste being sent to landfill which will be mixed residual but may be an underestimate for collection of segregated food waste for AD.
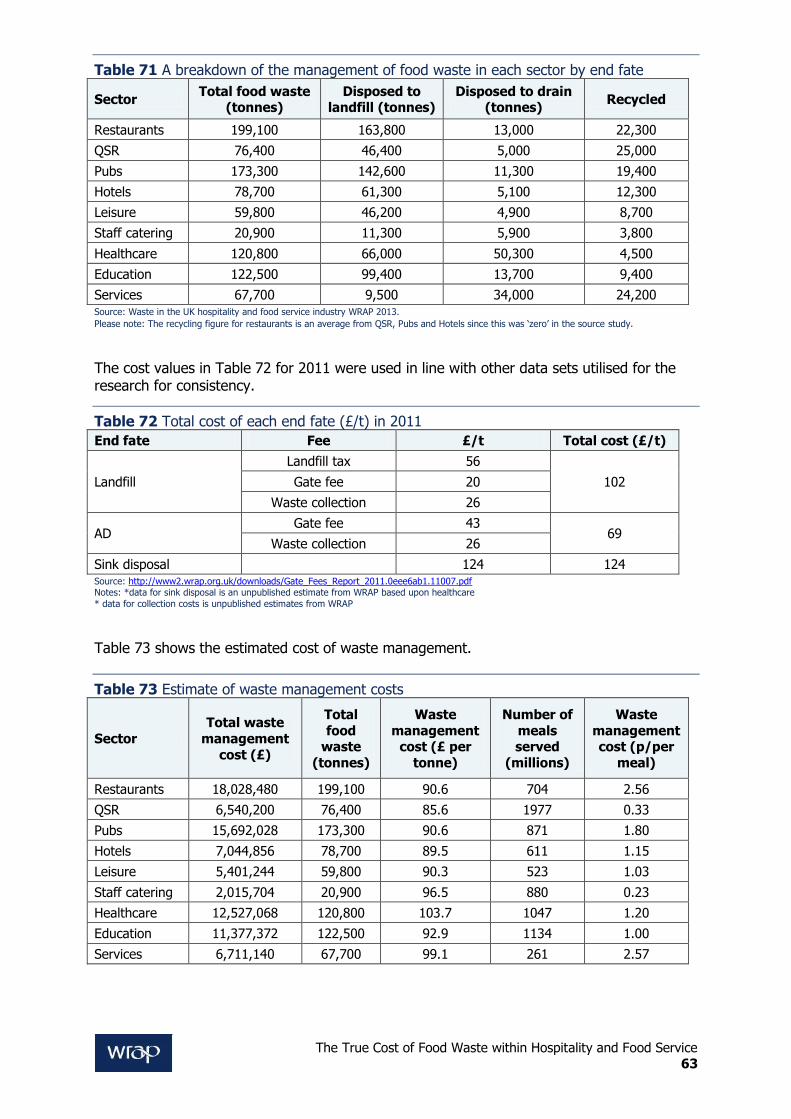
The True Cost of Food Waste within Hospitality and Food Service 63
Table 71 A breakdown of the management of food waste in each sector by end fate
Sector Total food waste
(tonnes) Disposed to
landfill (tonnes) Disposed to drain
(tonnes) Recycled
Restaurants 199,100 163,800 13,000 22,300
QSR 76,400 46,400 5,000 25,000
Pubs 173,300 142,600 11,300 19,400
Hotels 78,700 61,300 5,100 12,300
Leisure 59,800 46,200 4,900 8,700
Staff catering 20,900 11,300 5,900 3,800
Healthcare 120,800 66,000 50,300 4,500
Education 122,500 99,400 13,700 9,400
Services 67,700 9,500 34,000 24,200 Source: Waste in the UK hospitality and food service industry WRAP 2013.
Please note: The recycling figure for restaurants is an average from QSR, Pubs and Hotels since this was ‘zero’ in the source study.
The cost values in Table 72 for 2011 were used in line with other data sets utilised for the research for consistency.
Table 72 Total cost of each end fate (£/t) in 2011
End fate Fee £/t Total cost (£/t)
Landfill
Landfill tax 56
102 Gate fee 20
Waste collection 26
AD Gate fee 43
69 Waste collection 26
Sink disposal
124 124 Source: http://www2.wrap.org.uk/downloads/Gate_Fees_Report_2011.0eee6ab1.11007.pdf Notes: *data for sink disposal is an unpublished estimate from WRAP based upon healthcare
* data for collection costs is unpublished estimates from WRAP
Table 73 shows the estimated cost of waste management.
Table 73 Estimate of waste management costs
Sector
Total waste
management
cost (£)
Total
food waste
(tonnes)
Waste
management cost (£ per
tonne)
Number of
meals served
(millions)
Waste
management cost (p/per
meal)
Restaurants 18,028,480 199,100 90.6 704 2.56
QSR 6,540,200 76,400 85.6 1977 0.33
Pubs 15,692,028 173,300 90.6 871 1.80
Hotels 7,044,856 78,700 89.5 611 1.15
Leisure 5,401,244 59,800 90.3 523 1.03
Staff catering 2,015,704 20,900 96.5 880 0.23
Healthcare 12,527,068 120,800 103.7 1047 1.20
Education 11,377,372 122,500 92.9 1134 1.00
Services 6,711,140 67,700 99.1 261 2.57
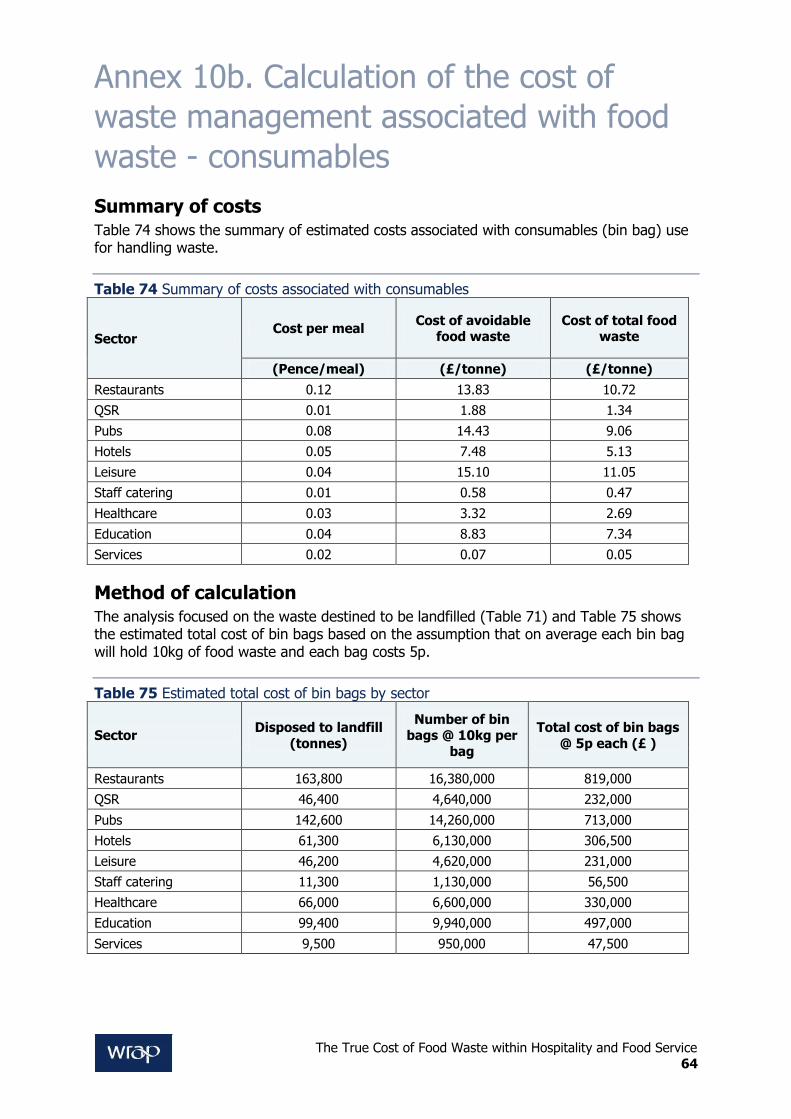
The True Cost of Food Waste within Hospitality and Food Service 64
Annex 10b. Calculation of the cost of
waste management associated with food
waste - consumables
Summary of costs Table 74 shows the summary of estimated costs associated with consumables (bin bag) use for handling waste.
Table 74 Summary of costs associated with consumables
Sector Cost per meal
Cost of avoidable food waste
Cost of total food waste
(Pence/meal) (£/tonne) (£/tonne)
Restaurants 0.12 13.83 10.72
QSR 0.01 1.88 1.34
Pubs 0.08 14.43 9.06
Hotels 0.05 7.48 5.13
Leisure 0.04 15.10 11.05
Staff catering 0.01 0.58 0.47
Healthcare 0.03 3.32 2.69
Education 0.04 8.83 7.34
Services 0.02 0.07 0.05
Method of calculation The analysis focused on the waste destined to be landfilled (Table 71) and Table 75 shows the estimated total cost of bin bags based on the assumption that on average each bin bag will hold 10kg of food waste and each bag costs 5p.
Table 75 Estimated total cost of bin bags by sector
Sector Disposed to landfill
(tonnes)
Number of bin bags @ 10kg per
bag
Total cost of bin bags
@ 5p each (£ )
Restaurants 163,800 16,380,000 819,000
QSR 46,400 4,640,000 232,000
Pubs 142,600 14,260,000 713,000
Hotels 61,300 6,130,000 306,500
Leisure 46,200 4,620,000 231,000
Staff catering 11,300 1,130,000 56,500
Healthcare 66,000 6,600,000 330,000
Education 99,400 9,940,000 497,000
Services 9,500 950,000 47,500
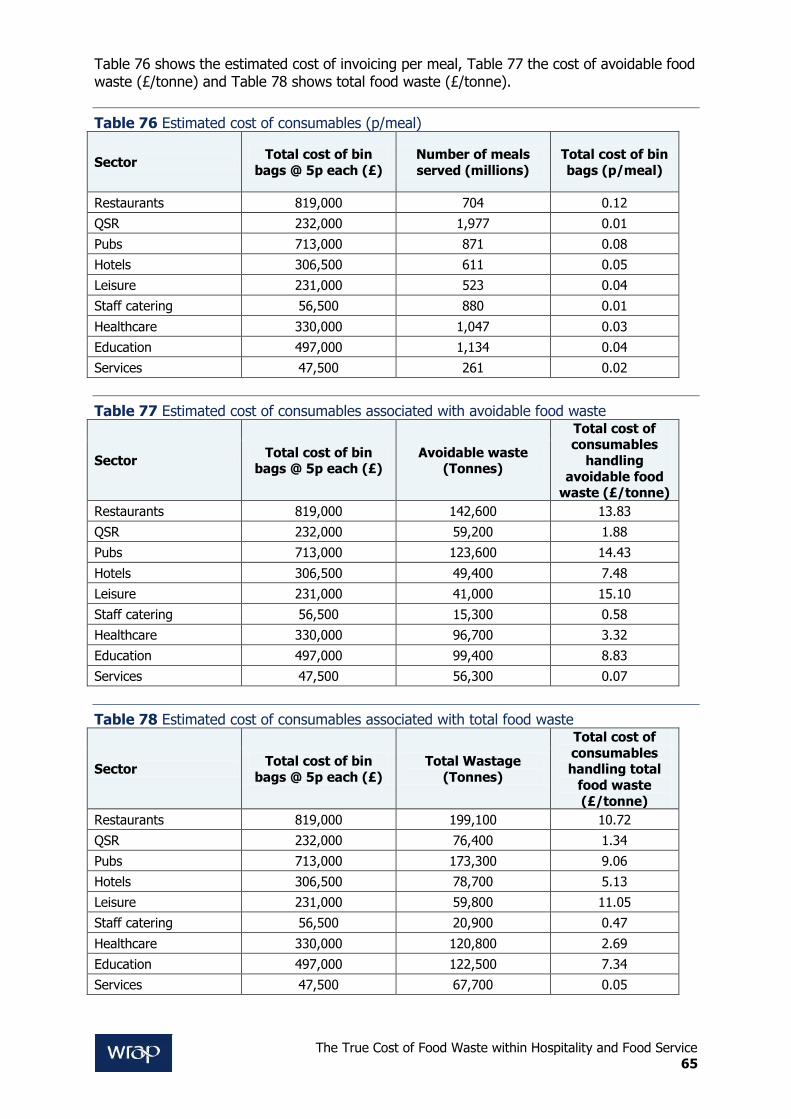
The True Cost of Food Waste within Hospitality and Food Service 65
Table 76 shows the estimated cost of invoicing per meal, Table 77 the cost of avoidable food waste (£/tonne) and Table 78 shows total food waste (£/tonne).
Table 76 Estimated cost of consumables (p/meal)
Sector Total cost of bin
bags @ 5p each (£)
Number of meals
served (millions)
Total cost of bin
bags (p/meal)
Restaurants 819,000 704 0.12
QSR 232,000 1,977 0.01
Pubs 713,000 871 0.08
Hotels 306,500 611 0.05
Leisure 231,000 523 0.04
Staff catering 56,500 880 0.01
Healthcare 330,000 1,047 0.03
Education 497,000 1,134 0.04
Services 47,500 261 0.02
Table 77 Estimated cost of consumables associated with avoidable food waste
Sector Total cost of bin
bags @ 5p each (£) Avoidable waste
(Tonnes)
Total cost of consumables
handling
avoidable food waste (£/tonne)
Restaurants 819,000 142,600 13.83
QSR 232,000 59,200 1.88
Pubs 713,000 123,600 14.43
Hotels 306,500 49,400 7.48
Leisure 231,000 41,000 15.10
Staff catering 56,500 15,300 0.58
Healthcare 330,000 96,700 3.32
Education 497,000 99,400 8.83
Services 47,500 56,300 0.07
Table 78 Estimated cost of consumables associated with total food waste
Sector Total cost of bin
bags @ 5p each (£)
Total Wastage
(Tonnes)
Total cost of
consumables handling total
food waste
(£/tonne)
Restaurants 819,000 199,100 10.72
QSR 232,000 76,400 1.34
Pubs 713,000 173,300 9.06
Hotels 306,500 78,700 5.13
Leisure 231,000 59,800 11.05
Staff catering 56,500 20,900 0.47
Healthcare 330,000 120,800 2.69
Education 497,000 122,500 7.34
Services 47,500 67,700 0.05
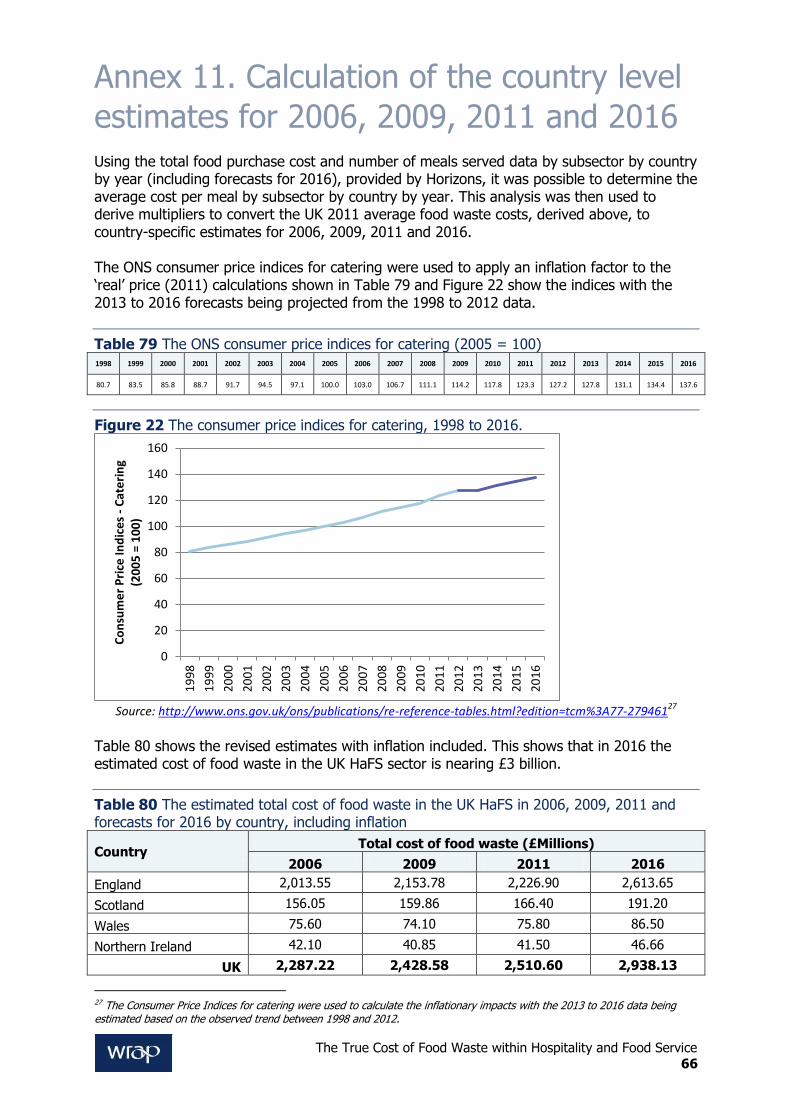
The True Cost of Food Waste within Hospitality and Food Service 66
Annex 11. Calculation of the country level
estimates for 2006, 2009, 2011 and 2016 Using the total food purchase cost and number of meals served data by subsector by country by year (including forecasts for 2016), provided by Horizons, it was possible to determine the average cost per meal by subsector by country by year. This analysis was then used to derive multipliers to convert the UK 2011 average food waste costs, derived above, to country-specific estimates for 2006, 2009, 2011 and 2016. The ONS consumer price indices for catering were used to apply an inflation factor to the ‘real’ price (2011) calculations shown in Table 79 and Figure 22 show the indices with the 2013 to 2016 forecasts being projected from the 1998 to 2012 data.
Table 79 The ONS consumer price indices for catering (2005 = 100) 1998 1999 2000 2001 2002 2003 2004 2005 2006 2007 2008 2009 2010 2011 2012 2013 2014 2015 2016
80.7 83.5 85.8 88.7 91.7 94.5 97.1 100.0 103.0 106.7 111.1 114.2 117.8 123.3 127.2 127.8 131.1 134.4 137.6
Figure 22 The consumer price indices for catering, 1998 to 2016.
Source: http://www.ons.gov.uk/ons/publications/re-reference-tables.html?edition=tcm%3A77-279461
27
Table 80 shows the revised estimates with inflation included. This shows that in 2016 the estimated cost of food waste in the UK HaFS sector is nearing £3 billion.
Table 80 The estimated total cost of food waste in the UK HaFS in 2006, 2009, 2011 and forecasts for 2016 by country, including inflation
Country Total cost of food waste (£Millions)
2006 2009 2011 2016
England 2,013.55 2,153.78 2,226.90 2,613.65
Scotland 156.05 159.86 166.40 191.20
Wales 75.60 74.10 75.80 86.50
Northern Ireland 42.10 40.85 41.50 46.66
UK 2,287.22 2,428.58 2,510.60 2,938.13
27 The Consumer Price Indices for catering were used to calculate the inflationary impacts with the 2013 to 2016 data being estimated based on the observed trend between 1998 and 2012.
0
20
40
60
80
100
120
140
160
19
98
19
99
20
00
20
01
20
02
20
03
20
04
20
05
20
06
20
07
20
08
20
09
20
10
20
11
20
12
20
13
20
14
20
15
20
16
Co
nsu
me
r P
rice
Ind
ice
s -
Cat
eri
ng
(20
05
= 1
00
)