final report: the evaluation of the wings after-school ...€¦ · the wings program and its...
TRANSCRIPT

Final Report: The Evaluation of the WINGS After-School Social-Emotional
Program for At-Risk Urban Children1
May, 2019
David Grissmer, Laura Brock, Chelsea Duran, Andrew Mashburn, Elizabeth Cottone, Helyn Kim, William Murrah, Claire Cameron,
Nancy Deutsch, Julie Blodgett, Amy Cordier, Justin Dormal, Karen Walker
Project Staff
Cara Adams
Alexis Brewer
Pam Jiranek
Shelley Lieberman
Brittany Lorick
Julie Thomas
Rachel Warne Hall West
1This report presents the final results of a research project directed to evaluating and
improving the WINGS after-school social-emotional program. The research was supported
by the Institute of Education Sciences, U.S. Department of Education, through Grant
R305A110703; the National Science Foundation under Grant REAL-1252463; and by the
Edna McConnell Clark Foundation (EMCF) and Social Innovation Fund (SIF) through a grant
to the WINGS program. The SIF is an important federal initiative that is designed to
promote the scaling and replication of promising programs to improve the economic
opportunities and development of individuals and communities. The Corporation for National
Community Service (CNCS) administers the fund and EMCF is one of the intermediaries
responsible for identifying and selecting promising interventions and providing matching
funds to help the programs scale and replicate their models. WINGS was one of 12
evidence-based programs selected by EMCF to be part of the SIF and receive funding and
technical assistance to scale and replicate its model in various locations across the United
States. As part of the SIF, the University of Virginia was asked to extend and expand an
ongoing evaluation study of the WINGS programs. This report describes the overall results
from that study. The opinions expressed are those of the authors and do not represent
views of the U.S. Department of Education, the National Science Foundation, EMCF, or
CNCS. Please direct all correspondence to David Grissmer ([email protected]).

WINGS Evaluation-Final Report to SIF
ii
CONTENTS
Acknowledgments......................................................................................... iii
The Evaluation of the WINGS After-School Social-Emotional Program for At-Risk Urban Children .............................................................................................. 1
Conclusions ................................................................................................................................ 1
Background ................................................................................................................................. 4
The WINGS Program and its Evaluation ............................................................... 4
Research Literature .......................................................................................... 6
Characteristics of Successful SEL Programs .......................................................... 8
Evaluation of WINGS ................................................................................................................ 11
Theory of Action ............................................................................................ 11
Research Questions ........................................................................................ 12
Exploratory and Confirmatory Outcome Measures ................................................ 12
Research Design ............................................................................................ 13
Overall and Differential Attrition ....................................................................... 19
Non-Compliance and its Significance ................................................................. 26
Estimation Methodology ........................................................................................................... 29
Imputation of Missing Data .............................................................................. 31
Results ...................................................................................................................................... 33
Teacher- and Child-Administered Outcome Measures ........................................... 33
Results for Parent Outcome Measures................................................................ 39
Discussion ................................................................................................................................. 39
Interpretation of Main Results .......................................................................... 39
Interpretation of Parent Results........................................................................ 40
Interpretation of Differences in Results for One Year and Two Years of Participation .. 41
Comparison of Results to Previous Research ....................................................... 42
Limitations ................................................................................................... 45
Selectivity and Reliability in Reported Measures .................................................. 45
Unlucky Randomization ................................................................................... 46
Sample Attrition and Missing Data .................................................................... 47
Non-Compliance ............................................................................................ 47
Adjustments for Multiple Outcome Measures ....................................................... 48
Fidelity of Implementation ............................................................................... 48
Flawed Analysis ............................................................................................. 49
Lessons Learned ............................................................................................ 49
Future Research ............................................................................................ 51
References ................................................................................................. 54

WINGS Evaluation-Final Report to SIF
iii
Acknowledgments
This evaluation of the WINGS after-school social-emotional learning program was made
possible by the efforts and contributions of many people over the course of seven years.
Ginny Deerin, the founder and director of the WINGS program through its first 15 years,
not only built a program using the best research available, but she also actively sought
this evaluation of the program and agreed to the evaluation conditions of randomization
into the program. Bridget Laird, who succeeded Ginny, played a key role in developing a
clinician-researcher partnership that proved essential to guiding the project through
difficult times, protecting the interests of the program and guiding the research
objectives to enhance the utility of the research for both researchers and the WINGS
program.
Bridget was supported by the WINGS Evaluation Advisory Committee (WEAC), a group
that monitored the project with annual reviews over its entire span. Our research
benefited greatly from the annual feedback and interactions with the WINGS staff and
management and the WEAC. WEAC members included Michael Balin, David Hunter,
Kristen Moore, and Karen Walker. Their experience with evaluation research and the
WINGS program provided guidance that proved critical to shaping the direction and
methodology in this evaluation.
Finally, research advisors linked to the Edna McDonnell Clark Foundation provided
continuing feedback during the analysis, interpretation, and documentation phase of the
project. This evaluation collected perhaps the most extensive data on outcomes ever
collected from teachers, parents, and child testing, and used a complex methodology to
estimate ITT and TOT impacts, including missing data. Robert Granger and Lynn Karoly
used their extensive research experience to help guide the direction, interpretation, and
documentation of this project through this challenging final analytical phase.

WINGS Evaluation-Final Report to SIF
1
The Evaluation of the WINGS After-School Social-Emotional
Program for At-Risk Urban Children
Executive Summary
This report summarizes the impacts of the WINGS program after one and two years of
participation using outcome measures provided by parents, teachers, and individual
child testing. The report summarizes the final impacts for all three cohorts of children as
well as separate estimates for cohorts 1 and 2 and for cohort 3. This is the final report
for the project submitted to the Edna McConnell Clark Foundation (EMCF) and to the
Social Innovation Fund.
The WINGS program and its evaluation occupy a unique niche in the extensive literature
that evaluates interventions to improve social-emotional skills. WINGS is a unique after-
school social emotional learning (SEL) program for urban, at-risk K-5 children that was
developed by a nonprofit whose research-based design evolved over 10 years prior to
evaluation. The evaluation design incorporated randomized controlled trial methods with
a three-cohort design that followed kindergarten children for two years through first
grade, and had sufficient statistical power (N = 354) to measure results. The evaluation
also included perhaps the most extensive data collection for an SEL program evaluation
ever undertaken from parents, teachers, and child testing that measured more than 35
developmental, behavioral, and academic outcome measures longitudinally before and
after one and two years of participation.
Intention-to-treat (ITT) results for cohorts 1 and 2 showed a pattern of strong (p < .05) or
marginally strong (p < .10) effects (effect size from 0.23 to 0.40) from two years of
participation for cohorts 1 and 2 on 12 of 16 measures of teacher-rated classroom
behaviors and skills: decision-making (p < .10), relationship skills (p < .10), self-
awareness (p < .05), self-management (p < .10), social skills composite (p < .10), less
bullying (p < .05), less externalizing (p < .05), less hyperactivity (p < .05), less problem
behaviors (p < .05), self-regulation (p < .05), closeness to teacher (p < .10) , less conflict
with teacher (p < .10), and a measure of executive function (p < .05), and two measures
of reading (naming vocabulary [p < .05] and letter-word ID [p < .05]).
Treatment-on-the-treated (TOT) estimates in cohorts 1 and 2 that are effects for children
actually attending WINGS have similar levels of statistical significance to ITT results, but
effect sizes are approximately 2.5 times larger (0.6 to 1.0) compared with ITT effects
(0.23 to 0.40). The TOT results for cohorts 1 and 2 suggest that children attending two
years of WINGS would raise their social-emotional, executive function, and reading and
vocabulary skills by 24 to 34 percentile points. These effects would significantly narrow
deficits in these skills for at-risk children.

WINGS Evaluation-Final Report to SIF
2
In contrast to cohorts 1 and 2, cohort 3 registered null results for teacher and child
testing measures that were predictable. The divergent results for cohort 3 would be
predicted by three factors that differ between cohorts 1 and 2 and cohort 3. Cohort 3 had
substantially lower compliance rates, higher overall and differential attrition rates, and
impaired program quality compared with cohorts 1 and 2. Cohorts 1 and 2 had
compliance rates of 39 percent compared with 15 percent for cohort 3. This lower
compliance rate in cohort 3 was caused by the WINGS program being closed for one
cohort 3 school and by a district-mandated additional after-school program implemented
at two schools that led to transfers and lower compliance for WINGS. In addition, the
new district-mandated program caused substantial disruptions in access to facilities at
one school, which substantially impaired the quality of the program. In addition, the
higher overall and differential attrition rates for cohort 3 measures did not meet the What
Works Clearinghouse (WWC) 3 liberal standards for teacher and parent data (see Table
9). The failure to meet WWC liberal standards suggest substantial risk for bias.
These factors would predict results for cohort 3 that would approach null results and
have a much higher threat for bias than for cohorts 1 and 2 measures. In some ways,
cohort 3 simulated a natural experiment that tested whether the evaluation design and
methodology would change in response to substantial changes in compliance, program
quality, and attrition. The results suggest that the evaluation design and methodology
registered these impacts, and that the results from cohorts 1 and 2 represent the effects
of WINGS when compliance and program quality is much higher and attrition is much
lower. If cohort 3 results had remained at cohorts 1 and 2 levels rather than falling to null
results, overall results would have been problematic. The large number of outcome
measures combined with the pattern of their effects across these measures, and the
pattern of effects across cohorts, suggest an evaluation with strong internal validity.
The results also show that gains in cohorts 1 and 2 occurred after only two years of
participation, and results after only one year of participation showed a pattern of null
results. The size and significance of the two-year effects over a large set of outcome
measures suggest that previous research may be underestimating the potential impact
of social-emotional interventions due to their limited dosage of a year or less. The
results also suggest that research-based after-school programs that focus on social-
emotional skills may be equally or more effective than in-school programs for at-risk
children.
Parent-rated measures of home behavior and social-emotional skills showed no impacts
from WINGS after one or two years of participation. The lack of home effects might
reflect that changed skills and behavior might be easier to transfer to the classroom than
the home. A measure of overall parental stress included on the parent survey shows
statistically significant higher (p < .05) levels of stress for treatment group parents. This
increased stress may result from the challenges of having a child attending WINGS and

WINGS Evaluation-Final Report to SIF
3
the associated challenges of late home arrival of a tired child. Parents of WINGS
children, other things being equal, are more stressed, and our results also suggest that
stressed parents—other things being equal—rate children’s behavior lower.
Parent ratings may also be less objective than teacher ratings due to the lack of a peer
control group for comparisons. Classroom behavior during the day for an entire school
year provides an environment where a child’s behavior can be more objectively
compared with peers. Finally, teachers have much higher education levels (typically a
college degree) than the parents in our sample (typically a high school degree or less).
The survey outcome measures could be cognitively challenging in terms of the length of
the survey and understanding the developmental language and measures, and teachers
may be able to provide more reliable assessments.
The current evaluation using K-1 children may underestimate the impact of the K-5
WINGS program since it suggests that effects may increase for older children and
children receiving more dosage. Higher dosage would occur if the WINGS program
were implemented in all schools within an urban school district, so that children whose
families frequently move between schools could receive more continuous years of
participation. Such children receiving 3 to 6 years of participation could be expected to
have much larger effects than K-1 children in this study.
Prior to the evaluation, the level of evidence for the effectiveness of WINGS was preliminary and came from two sources. The first source was a series of master’s theses
and unpublished studies that suggest that WINGS participants have better grades, state
test scores, school attendance, classroom behavior, self-esteem, and higher high school
graduation rates compared with students not in WINGS. The second source was based
on the WINGS design that relies on extensive research about the characteristics of high-
impact (SEL) programs (e.g., Durlak, Weissberg, et al., 2010) and after-school programs
(Durlak, Mahoney, et al., 2010; McComb & Scott-Little, 2003; Kane, 2004).
This evaluation of WINGS was designed to provide a moderate level of evidence on the impact of the WINGS program with funding from the Institute for Education Science and
the Social Innovation Fund. This moderate level was projected based on the design of
the evaluation with randomization at entry, large sample size, and the extensive
longitudinal data collection through two years of participation. This rigorous experimental
study design could provide strong evidence about the causal impacts of providing
access to WINGS on children’s outcomes. The study participants are at high risk for
poor academic and behavioral outcomes, and study results can be generalized to
populations with similar characteristics.
Our judgment is that the results of the evaluation provide a moderate-to-strong level of
evidence on the effectiveness of WINGS. The pattern of impacts across cohorts, with
strong effects for cohorts 1 and 2 together with predictable null effects for cohort 3,

WINGS Evaluation-Final Report to SIF
4
suggest strong internal validity of the results. The contrasting results for one and two
years of evaluation also suggest strong internal validity. These patterns suggest that
WINGS produces a pattern of strong, significant gains in teacher-rated classroom
behavior, social-emotional skills, and child tests of executive function and reading and
vocabulary skills after two years of participation. The large number of measures that
show significant (p < .05) or marginally significant (p < .10) effects is unique to this study.
The general threat to internal validity for randomized controlled trials comes from overall
and differential attrition and non-compliance that introduces a potential for bias.
However, our overall and differential attrition levels for cohorts 1 and 2 for our teacher
and child testing nearly all met WWC conservative standards. Non-compliance levels
were higher due to unexpected high levels of family relocation to schools not having the
WINGS program, but our analysis suggests that characteristics of families relocating
were similar for treatment and control groups. We have also used imputation techniques
for missing data and estimated both ITT and TOT effects that help to clarify, interpret,
and take account of attrition and non-compliance. These results suggest that the levels
of attrition and non-compliance were not major factors in biasing effects and their
statistical significance. However, our recommendations include expanding WINGS to all
schools in a district that would lower both attrition and non-compliance and could
support an even more rigorous evaluation leading to an unambiguous strong evidence
rating.
Background
The WINGS Program and its Evaluation
WINGS for Kids is a structured after-school SEL program for children attending low-
performing schools in high-risk neighborhoods in Charleston County School District,
South Carolina. The schools and communities in North Charleston that are served by
WINGS have high levels of social, economic, and academic risk. More than 90 percent
of students are black and more than 90 percent are eligible for free or reduced-price
lunch. The median family income in 2008 was $39,653, compared to $63,211 for the
nation, placing the majority of North Charleston’s residents below 200 percent of the
poverty level (U.S. Census Bureau, 2008). Fifty-two percent of North Charleston births
in 2008 were to single mothers. Given the incidence of crime relative to the population,
North Charleston has been ranked the seventh-most dangerous city in the United States
(Paras, 2007). Across the schools served by WINGS, the majority of students (42
percent for reading, 52 percent for writing, 50 percent for math, 65 percent for science)
do not meet statewide proficiency standards. The graduation rate for the high school
attended by students in WINGS schools was 34.3 percent in 2007—2008, compared to
73.2 percent for the nation as a whole (Cataldi, Laird, & Kewal Ramani, 2009; McGinley,
Rose, & Donnelly, 2009).

WINGS Evaluation-Final Report to SIF
5
WINGS was designed based on research suggesting that effective SEL programs
incorporated components that included (1) high participation rates, (2) a multi-year
program, (3) a focus on both academic and social-emotional skills, (4) four “SAFE”
characteristics (sequenced, active, focused, and explicit), and (5) a focus on five key
SEL competencies: self-awareness, self-management, responsible decision-making, social awareness, and relationship skills (Zins et al., 2004; Payton et al., 2008; Lauer et
al., 2006; Greenberg et al., 2003).
The multi-year program allows participation from kindergarten to fifth grade. During our
study, the WINGS program served approximately 24 children in each grade at each
participating school. The study randomly assigned children in three consecutive cohorts
into WINGS at kindergarten entrance or a control group, and followed the children
through kindergarten and first grade for up to two years. Control group children spent
after-school time usually with parents or caregivers or in other after-school programs.
WINGS afforded opportunities for children to develop SEL skills using a curriculum that
was implemented throughout the program’s daily activities that included choice time,
free play, academic center time, and meals or snacks. WINGS was implemented for
three hours per day, five days per week during the school year. At each school, the
programs are organized in groups or “nests” of 12 students, with two nests per grade.
Each nest is assigned a WINGS Leader who serves as their mentor and teacher for the
entire year. The five competencies are addressed across 30 learning objectives. Each
week a new learning objective is emphasized and previously taught objectives are
reinforced. Teaching is initially direct, with follow-up modeling, opportunity to practice
skills, and coaching applied to real life lessons, also known as “teachable moments.”
Learning objectives are intentionally embedded into every program activity. Through
these activities, the WINGS staff model each learning objective and reinforce SEL
competencies. The WINGS program framework states that at least two years of
participation would be required to see significant shifts in SEL competency.
The evaluation theory of action predicts that changes in SEL skills will transfer to more
positive and less negative relationships and behaviors particularly in the school
classroom, but also at home, and will have positive long-term impacts on children’s
academic outcomes. Three major data collection efforts included a parent survey, a
teacher survey, and direct child assessments, which provided confirmatory and
exploratory outcome measures. Direct child measures and parent surveys were
collected in the summer/fall at kindergarten entry (pre-test), one year later in summer/fall
of first grade and two years later at summer/fall of second grade. Teacher surveys were
collected in the fall and spring of kindergarten and first grade. The study also collected
an exploratory set of “building block” measures of early cognitive and emotional skills to
better understand the underlying developmental mechanisms leading to the outcomes
and to help interpret the pattern of outcomes.

WINGS Evaluation-Final Report to SIF
6
Research Literature
The evolution of the WINGS program from its inception in the early 2000s and the
design and implementation of its evaluation through 2016 was guided by a rich body of
literature spanning more than two decades of research on social-emotional skills and
programs to improve these skills. SEL broadly refers to the process by which cognitive,
affective, and behavioral skills are acquired that help children effectively establish and
maintain positive, healthy relationships, successfully carry out various social tasks, and
meet daily challenges (CASEL, 2016; Denham et al., 2012; Nickerson & Fishman,
2009). In young children, being socially and emotionally competent means they are able
to inhibit impulsive behavioral responses, take into account others’ perspectives, make
good decisions, express healthy emotions, recognize problems and provide feasible
solutions, and adjust and integrate emotions, behaviors, and actions, in order to work
well socially with others, act responsibly and respectfully, and display developmentally
appropriate prosocial behaviors (Denham et al., 2012; Durlak et al., 2011; Weissberg,
Caplan, & Sivo, 1989; Zins, Elias, Greenberg, & Weissberg, 2000).
Children from low-income families, in particular, face many challenges and risks related
to their social-emotional development that can have negative consequences later on in
life (Duncan & Magnuson, 2005). Gaps in social-emotional development between low-
income children and their more affluent peers are observed before entering formal
schooling, and these gaps persist and increase during the elementary school years and
beyond (Alexander, Entwisle, & Kabbani, 2001; Brooks-Gunn, Duncan, & Aber, 1997;
Hamre & Pianta, 2001). Without early intervention in social-emotional and behavioral
skills, young children are at greater risk for future academic problems, dropping out of
school, peer rejection, and antisocial behaviors (Durlak, Weissberg, Dymnicki, Taylor, &
Schellinger, 2011; Durlak & Weissberg, 2011; Greenberg et al., 2003).
Strengthening young children’s social-emotional competence may serve as an important
protective factor for school and life success, especially if they are exposed to multiple
life stressors (Jones, Greenberg, & Crowley, 2015; Webster-Stratton, Reid, &
Hammond, 2004). As such, researchers have begun investigating promising
approaches and intervention programs, ranging from in-school curricula to teacher and
parent training programs that target the promotion of social-emotional competence in
children (e.g., Jones & Bouffard, 2012; Morris et al., 2013; Morris et al., 2014; Webster-
Stratton,Reid, & Hammond, 2004). There is less work, though, on the impact of social-
emotional competence interventions in after-school settings, despite the fact that these
competencies can be taught in various ways across many different settings and
contexts (CASEL, 2016).
Unfortunately, it is more difficult to conduct research on the effects of social-emotional
and other non-cognitive skills than it is to study the direct improvement of academic
outcomes during schooling. The complexity associated with measuring social-emotional

WINGS Evaluation-Final Report to SIF
7
skills and measuring the effects of social-emotional programs arises from several
sources: the lower reliability of measures, the lack of routine data collection on social-
emotional skills, the limited number of programs developing these skills, the challenges
of collecting data within school, after-school and family settings, the methodological
challenges associated with non-experimental, quasi-experimental, and experimental
data, including accounting for non-compliance and non-response, and the lack of
studies that provide dosage for more than a single year. These limitations have resulted
in a complex body of research literature (Durlak, Weissberg, & Pachan, 2010; Lauer et
al., 2006).
Research that spans both experimental and non-experimental results suggests that SEL
programming promotes positive youth development across a wide developmental span;
in school-based, after-school, and community settings; with students who do and do not
have presenting problems; in urban, suburban, and rural areas; among racially and
ethnically diverse student bodies; and as implemented by professionals as well as
school staff (Payton et al., 2008). Studies have suggested students benefit from SEL
across a wide range of outcomes, including having higher-quality relationships with
peers and adults, having fewer problem behaviors at school, using drugs and alcohol
less, engaging in risky sexual behavior less, and behaving violently less (Greenberg et
al., 2003). Students also have better attitudes about themselves, others, and school,
and earn higher grades and test scores (Durlak, Weissberg, et al., 2011; Payton et al.,
2008).
In a meta-analysis of 317 studies of SEL programs, Payton et al. (2008) suggested that
SEL programming was associated with students’ gaining an average of 11 to 17
percentile points on achievement tests. Among the 180 studies of programs considered
“universal” (not targeted), the authors found a mean effect on academic performance of
0.28. Effects on other outcomes such as attitudes toward self and others, positive social
behavior, conduct problems, and emotional distress were similarly in the 0.20 range
(Payton et al., 2008). Similarly, in another meta-analysis of 213 studies involving more
than 270,000 students, Durlak and colleagues (2011) found that, overall, SEL programs
both in and out of school were significantly effective (grand study-level mean = 0.30).
Specifically, students who participated in evidence-based SEL programs demonstrated
enhanced SEL skills, better attitudes about themselves, others, and school, and
increased prosocial behaviors, compared with students who did not participate in these
programs. Students participating in the SEL programs also had fewer conduct and
internalizing problems, lower levels of emotional distress, increased ability to manage
stress and depression, as well as significant gains of 11 percentile points in academic
achievement compared with students in the control group. Follow-up data (at least six
months later) showed sustained effects in all areas listed above, with effect sizes
ranging from 0.11 to 0.32.

WINGS Evaluation-Final Report to SIF
8
Characteristics of Successful SEL Programs
Few SEL programs have been evaluated using experimental methods with long-term
follow-up. However, enough empirical evidence exists to suggest that certain types of
programs are more effective in improving student outcomes than others. Greenberg et
al. (2003) described the most effective programs as those that use structured manuals
and curricula to create consistency in program delivery; address a range of SEL
constructs; are long-term, with multi-year programs being best; and provide a
developmentally appropriate progression of opportunities for skill-building, spanning
ideally from pre-kindergarten to adolescence. Zins et al. (2004) noted effective programs
tend to be theory- and research-based, with the most rigorous programs undertaking
continuous self-improvement through outcome evaluation.
The Collaborative for Academic, Social, and Emotional Learning (CASEL), a group at
the forefront of SEL research and theory development, asserts that a combination of
social competency instruction and positive learning environments (e.g., a safe and
supportive school climate, active partnership between family and school) contributes to
children’s short- and long-term success (https://casel.org/impact/); Zins et al., 2004). A
number of SEL programs based on this theory, including WINGS, use a model of
instruction built around a framework of five key person-centered SEL competencies:
self-awareness, social awareness, responsible decision-making, self-management, and
relationship management (Payton et al., 2008; Zins et al., 2004). Improvements in these
skill areas, in conjunction with positive environments, are hypothesized to lead to less
risky behavior, greater attachment to school, better academic performance, and more
success in life (https://casel.org/impact/).
Results from a recent series of meta-analyses of SEL program effects further suggest
that theory-based programs that go on to employ evidence-based skill-training
approaches in social competency instruction are the most effective (Durlak &
Weissberg, 2007; Durlak, Weissberg, et al., 2010; Payton et al., 2008). More specifically, SEL programs that provide training that is sequenced, active, focused, and explicit (given the acronym SAFE) have greater effects on student outcomes across a number of domains. Notably, in these meta-analyses, when effect sizes were calculated
separately for programs that met SAFE criteria and programs that did not, in many
domains where there had previously been a significant overall effect, the effects of non-
SAFE programs fell to non-significance while the effects of SAFE programs remained
(Durlak & Weissberg, 2007; Durlak, Weissberg, et al., 2011; Payton et al., 2008). For
example, in their review of 180 studies of universal SEL programs, Payton et al. (2008)
found an overall effect size on students’ positive social behavior of 0.24. However, when
differentiated, the mean effect size of SAFE programs was 0.28, while the mean effect
size of non-SAFE programs was 0.02.

WINGS Evaluation-Final Report to SIF
9
Durlak and Weissberg (2007) and a follow-on meta-analysis by Durlak, Weissberg et al.
(2011) found SAFE SEL programs had significant positive effects on a range of student
outcomes, including child self-perceptions (self-confidence and self-esteem), school
bonding, positive social behaviors, problem behaviors, drug use, achievement test
scores, school grades, and attendance. Average effect sizes across these outcomes
ranged from 0.14 (school attendance) to 0.37 (child self-perceptions) (Durlak &
Weissberg, 2007; Durlak, Weissberg et al., 2010). Taken together, these results suggest
that SEL programs that meet SAFE criteria have particular promise as an intervention
promoting positive youth development.
Five core components of SEL have been identified (CASEL, 2016) and are specifically
highlighted within this report: self-awareness, self-management, responsible decision-
making, social awareness, and relationships skills.
Self-awareness captures the ability to accurately recognize one’s feelings, attributes,
and values, and understand how those feelings influence behavior (Denham & Brown,
2010). For young children, learning new words to label how they feel and describe what
led to those feelings, and developing a sense of self, including knowing what they like
and dislike and identifying strengths and weaknesses, are important for developing self-
awareness (CASEL, 2016).
Self-management describes the ability to successfully regulate one’s emotions,
thoughts, and behaviors, and appropriately express them in multiple contexts, as well as
the ability to manage stress, control impulses, and set goals and persist in meeting
those goals (CASEL, 2016). Although some children may be able to describe how they
are feeling, most children transitioning to formal school are still learning how to express
and react to their feelings and match them to the expectations of the different situations
and contexts they encounter.
Responsible decision-making entails learning how to make constructive and respectful
choices about personal behavior and social interactions, analyzing and solving
problems, being ethically responsible, and considering the well-being of oneself and
others (CASEL, 2016; Denham et al., 2010). With the help of adults, children are
learning how to make choices based on personal opinions, social norms, and rules, and
contemplating the consequences of their actions.
Social awareness is the ability to understand what behaviors are socially and ethically
acceptable in different situations and contexts, as well as the ability to take another’s
perspective, and show empathy toward others, including those from diverse
backgrounds (CASEL, 2016; Denham et al., 2010). Through interacting with peers and
adults, children from a young age are learning how to interpret others’ emotions and
understanding that how they feel may not necessarily be how others are feeling.

WINGS Evaluation-Final Report to SIF
10
Relationship skills refer to the ability to establish and maintain healthy relationships
across a diverse range of individuals, as well as to use skills, such as cooperation,
listening, negotiating, seeking and offering help when needed, and turn taking, to build
and sustain these relationships (CASEL, 2016; Denham & Brown, 2010). Young
children are beginning to learn what it means to be a good friend, ask for and offer help,
communicate effectively, cooperate, negotiate conflicts, and share.
Each of these components, though distinct, is highly interrelated. Both individually and
together, they predict a range of positive outcomes (CASEL, 2016; Denham et al.,
2012). For instance, children’s social-emotional competence has been linked to positive
relationship skills and behaviors, both in the classroom and at home, and increases in
children’s long-term academic skills.
Many interventions and programs targeting the promotion of social-emotional
competence also aim to promote the building blocks that set a strong foundation for
social-emotional development in young children (e.g., Morris et al., 2014). Executive
function, in particular, has received much attention given its critical role in the
development of social-emotional competence (e.g., Bierman, Nix, Greenberg, Blair, &
Domitrovich, 2008; Blair & Raver, 2015; Riggs, Jahromi, Razza, Dillworth-Bart, &
Mueller, 2006).
Executive function is a multi-faceted construct that can broadly be defined as the
processes of cognitive flexibility, working memory, and inhibitory control that are
necessary for purposeful, goal-directed behavior. Studies show that there are persistent
and growing poverty-related gaps, not only in achievement (Reardon, 2011), but also in
the regulation of attention, emotion, stress response, and executive function (Cicchetti,
2002; Evans, 2003). Evidence from neuroscientific studies suggest that focusing on
executive function can enhance children’s learning and development and can establish
positive academic trajectories, particularly for children from low-income families (Blair &
Raver, 2015; Evans & Schamberg, 2009; Raver, Blair, & Willoughby, 2013).
Specific to children’s social-emotional competence, executive function has been directly
implicated in the concurrent and longitudinal development of social-emotional skills
(e.g., Riggs, Blair, & Greenberg, 2003). This is not surprising given the many overlaps
between the subskills that underlie both executive function and social-emotional
development. Studies shows that difficulties in executive function lead to difficulties in
multiple components of social-emotional functioning, including impulsivity, delay of
gratification, emotion regulation, problems with attention, behavioral issues, and
problem solving (e.g., Cole, Usher, & Cargo, 1993; Hughes, 2002; Jahromi & Stifter,
2008; Kim et al., 2016; Pennington, 2002; Séguin, Boulerice, Harden, Tremblay, & Pihl,
1999). Moreover, the executive function components related to planning, inhibiting
response, and controlling one’s attention may be particularly useful for resisting

WINGS Evaluation-Final Report to SIF
11
temptation, regulating frustration and stress (Mischel et al., 1989), and behaving
according to social norms (Peake, Hebl, & Mischel, 2002).
Evaluation of WINGS
Theory of Action
Figure 1 depicts the WINGS program’s theory of change. The WINGS program had
been in existence for about 10 years prior to the start of the evaluation. During that time,
the program used the research cited in the previous section and structured a program
that met the SAFE criteria and focused on the five competencies described earlier. The
stated objectives of the program are to enhance children’s person-centered
competencies (self-awareness, social awareness, responsible decision-making, self-
management, and relationship management), and the theory of change follows that (a)
children assigned to WINGS will develop greater person-centered competencies than
children who are not assigned to WINGS.
Figure 1. Theory of Change
The theory of change also proposes that the positive impacts of assignment to WINGS
will transfer to the classroom and home setting. Specifically, we hypothesize that
compared with children not assigned to WINGS, children assigned to WINGS will
develop and display more positive and less negative behavior and relationships with
their teachers and classmates in school and at home. The (b) increased positive and
InterventionRelationships and Behaviors School Outcomes
Person-Centered Competencies
WINGS Program
•Self Awareness
•Social Awareness
•Responsible Decision Making
•Self Management
•Relationship Management
In Classrooms•Positive •Negative
At Home•Positive•Negative
•Socio-emotional
•Academic
(a)
(b)
(c)
(d)
(e)
(e)

WINGS Evaluation-Final Report to SIF
12
decreased negative relationships and behaviors are hypothesized to be (c) mediated
through the improvements in children’s enhanced person-centered competencies.
Finally, assignment to WINGS is proposed to have (d) longer-term positive impacts on
children’s academic school outcomes and social-emotional behavior. We also collected
a broader set of measures for exploratory analysis that focused on measures of early
emotional and cognitive skills including executive function that can contribute to
identifying possible causative mechanisms that underlie the impacts as well as interpret
the pattern of results across outcome measures.
Research Questions
The following research questions are addressed in this study:
Question 1. Does assignment to WINGS have a positive impact on children’s person-
centered competencies after one year (kindergarten) and two years of WINGS
(kindergarten and first grade) participation?
Question 2. Does assignment to WINGS have a positive impact on children’s
relationships and behaviors in the classroom and at home after one year and two years
of WINGS participation?
Question 3. Does assignment to WINGS have a positive impact on measures of
children’s short-term academic skills after one year and two years of WINGS
participation?
Question 4. Does the impact of WINGS on children’s person-centered competencies,
and relationships and behaviors at school and home after one year and two years vary
for children with different characteristics?
Question 5. Does the impact of WINGS on children’s person-centered competencies,
and relationships and behaviors at school and home change across cohorts?
Question 6. Does the impact of WINGS on children’s person-centered competencies,
relationships and behaviors, and school outcomes vary by the level of initial skills?
Exploratory and Confirmatory Outcome Measures
Assessment tools used in this study included direct child assessments, and measures
from teacher and parent surveys on classroom and home behavior and relationships.
Person-Centered Competencies. Direct assessments were completed in areas that align
closely with the constructs of self-awareness, social awareness, responsible decision-
making, self-management, and relationship management identified in the theory of
change. Parents and teachers reported on the five SEL skills (self-awareness, social
awareness, responsible decision-making, self-management, and relationship

WINGS Evaluation-Final Report to SIF
13
management) via the Devereux Student Strengths Assessment (DESSA; Lebuffe,
Shapiro, & Naglieri, 2009).
Teacher-reported measures of children’s relationships and classroom behaviors
included the Student-Teacher Relationship Scale (STRS; Pianta, 2001), which measures the quality of the teacher’s relationship with individual children, and the Social Skills Improvement System (SSIS; Gresham & Elliott, 2008), which is a measure of an
individual child’s relationships and social behaviors in the classroom.
Parent-reported measures of children’s relationships and behaviors at home were
assessed during parent/caregiver interviews using parent versions of the Social Skills Improvement System (SSIS; Gresham & Elliott, 2008) and the Child-Parent Relationship Scale (Pianta, 1992). We also used the Holmes-Rahe Life Stress Inventory for
occurrence of stressful life events. Our measure is a weighted score based on weights
developed by the measure’s authors in order to adjust for severity of each event (e.g., a
death of the caregiver’s spouse is weighted 100 points, whereas a major change in
eating habits is weighted only 15 points).
School outcomes. Direct assessments of academic outcomes were completed using the Woodcock-Johnson-III Tests of Achievement (WJ-III; Woodcock, McGrew, & Mather,
2001), which evaluates reading skills (Sound Awareness and Letter-Word Identification
subtests) and mathematics skills (Applied Problems and Quantitative Concepts
subtests).
Building block skills included measures of executive function: Head-Toes-Knees-Shoulders Task (HTKS; Ponitz, McClelland, et al., 2008), Emotion Matching Task (EMT;
Morgan, Izard, & King, 2010), Assessment of Children’s Knowledge Task (ACES; Mavroveli et al., 2009), and Theory of Mind (NEPSY II; Korkman, Kirk & Kemp, 2007).
Research Design
Three cohorts of children entering kindergarten whose parents applied for the WINGS
program and consented to be in the study were randomly assigned to a treatment group
eligible for WINGS participation or a control group not eligible for participation. Cohort 1
included four WINGS schools and cohort 2 and 3 had only three schools due to the
discontinuation of the program at one school (James Simons Elementary). James
Simons transitioned to a Montessori magnet school that changed its demographic
characteristics, and the WINGS program was discontinued. Specifically, child-level
random assignment to WINGS or control was determined within four schools in cohort 1
and three schools in cohorts 2 and 3. Because the program serves 12 girls and 12 boys
who enter kindergarten each year and conducts SEL activities separately within each
gender “nest,” gender will also serve as a randomization block to ensure equal numbers
of girls and boys are enrolled in the program. Thus, there will be 20 randomization
blocks for the three-cohort study.

WINGS Evaluation-Final Report to SIF
14
Pre-test data was collected in the summer/fall of kindergarten and post-test data for one
year of potential WINGS participation was collected in the spring of kindergarten and the
summer/fall following kindergarten. Post-test data for two potential years of WINGS
participation was collected in the spring of first grade and in the summer/fall following
first grade.
Table 1 shows that children in the three-cohort study were randomized within 20
randomization blocks. Overall, 209 children were assigned to treatment and 145 to the
control group. Table 1 also provides the sample sizes for each randomization block, as
well as the probabilities for being assigned to treatment or control within each block.
Overall, about 59 percent of participants were assigned to treatment and 41 percent to
the control group. We assigned more to treatment to compensate for expected non-
compliance.
Table 2 provides descriptive statistics for sample demographic characteristics and life
circumstances collected from a parent survey at the beginning of the study. These
factors are important because such background characteristics can affect whether and
how much children will benefit from a particular intervention. As expected, children in
this sample would be characterized as living in high-risk circumstances, with a majority
(96 percent) qualifying for free or reduced-price lunch and a majority having racial
minority status (91 percent black). Furthermore, 80 percent of families received some
form of public assistance, unemployment was 35 percent for caregivers, and the overall
education level of mothers was low, with more than a quarter (29 percent of respondent
caregivers) having less than a high school degree. The average number of children in
the home (2.8) together with the average age of the mothers (29.4) suggest that a
significant proportion were teen mothers.
The Holmes-Rahe Life Stress Index (249.5) was quite high as measured over the
previous two years. Caregivers reported major changes, with more than 49 percent
reporting moving; more than one in six (17 percent) moved more than once during that
time. About one-half of caregivers reported a major change in employment or work-
related responsibilities, hours, or conditions; and more than a third (36 percent) reported
someone in the home starting or stopping either work or education. These
characteristics suggest that these low-income families frequently encountered a major
change in life circumstances that could affect their level of stress, the behavior and
development of their children, and participation and attendance at WINGS.

WINGS Evaluation-Final Report to SIF
15
Table 1. Randomization Blocks: Frequencies and Probabilities
Random Assignment:
Frequencies (n) Random Assignment:
Probabilities (%)
Cohort School Gender Control Treatment Control Treatment
1
Chicora
Female 11 16 40.7 59.3
Male 5 9 35.7 64.3
Memminger
Female 6 9 40.0 60.0
Male 9 13 40.9 59.1
North Charleston Elementary School
Female 9 13 40.9 59.1
Male 8 11 42.1 57.9
James Simons
Female 6 7 46.2 53.8
Male 4 4 50.0 50.0
2
Chicora
Female 8 12 40.0 60.0
Male 6 8 42.9 57.1
Memminger
Female 7 10 41.2 58.8
Male 6 7 46.2 53.8
North Charleston Elementary School
Female 7 11 38.9 61.1
Male 9 11 45.0 55.0
3
Chicora
Female 8 13 38.1 61.9
Male 10 17 37.0 63.0
North Charleston Elementary School
Female 8 12 40.0 60.0
Male 5 7 41.7 58.3
NCES
Female 6 9 40.0 60.0
Male 7 10 41.2 58.8
TOTAL 145 209 41.0 59.0

WINGS Evaluation-Final Report to SIF
16
Table 2. Characteristics of the Sample
Baseline Characteristic or Experience Mean (SD) %
Child Gender (% Male) 46.9
Adult Race (% Black) 91.0
Child Race (% Black) 87.9
Receiving Free/Reduced Lunch 96.0
Receiving Other Forms of Public Assistance 80.4
Parent Employed (or Student) 65.1
Attended Preschool 90.0
Mother's Education
Less than High School 29.2
High School/Equivalent 36.1
More than High School 34.8
Age (years, on first day of school) 5.5 (0.3)
Mother’s Age (years, at time of first survey) 29.4 (5.2)
Number of Children in Home 2.8 (1.4)
Holmes-Rahe Life Stress Inventory Weighted Score 249.5 (167.2)
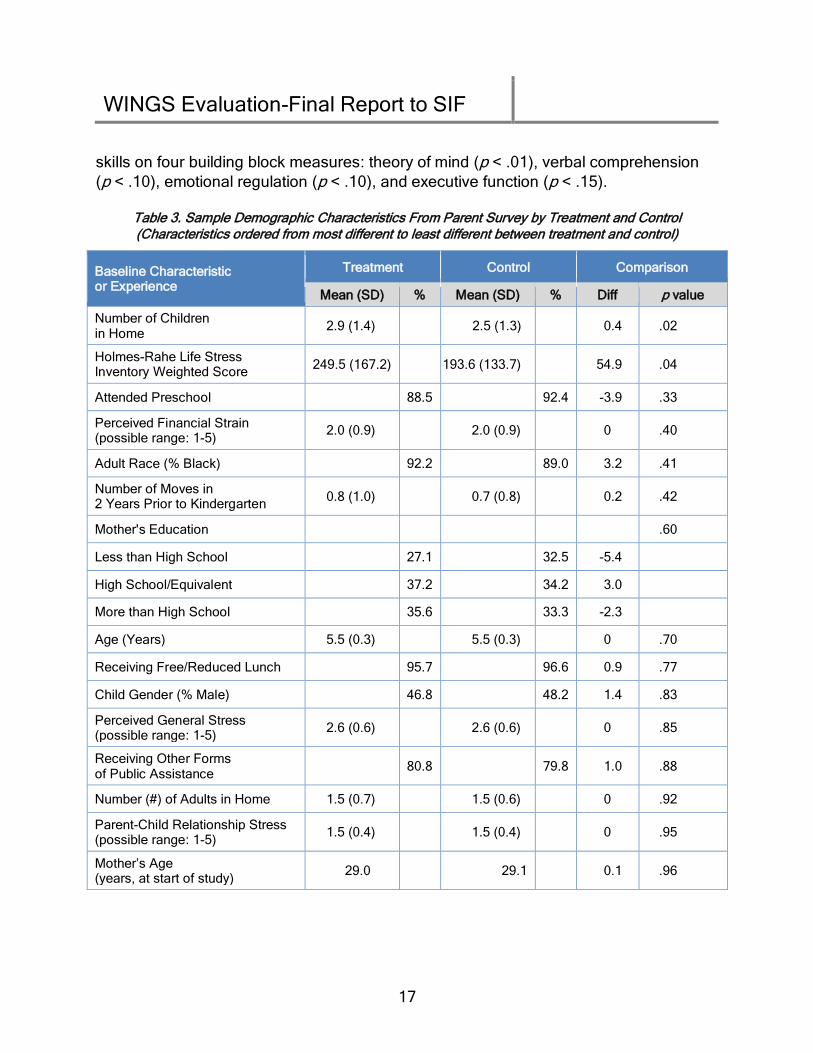
Table 3 shows the demographic characteristics of parents who responded to the
baseline survey, and the differences between the treatment and control groups. Overall
2 of 15 family characteristics showed significant differences at baseline: number of
children in the home and Holmes-Rahe Life Stress weighted scores. Parents in the
treatment group reported higher numbers of children in the home and higher initial
stress levels than control group parents. The remaining 13 family characteristics showed
no significant differences at baseline, suggesting that random assignment was
reasonably balanced on demographic characteristics.
Table 4 shows the differences in baseline outcome measures reported by parents,
teachers, and individual testing of children, and the significance of the differences. The
parent- and teacher-reported pre-test measures showed only one significant difference
(internalizing) among the 18 outcome measures. However, the direct child measures
showed a distinct pattern of control children having somewhat higher developmental
WINGS Evaluation-Final Report to SIF
17
skills on four building block measures: theory of mind (p < .01), verbal comprehension
(p < .10), emotional regulation (p < .10), and executive function (p < .15).
Table 3. Sample Demographic Characteristics From Parent Survey by Treatment and Control (Characteristics ordered from most different to least different between treatment and control)
Baseline Characteristic or Experience
Treatment Control Comparison
Mean (SD) % Mean (SD) % Diff p value
Number of Children in Home
2.9 (1.4) 2.5 (1.3) 0.4 .02
Holmes-Rahe Life Stress Inventory Weighted Score
249.5 (167.2) 193.6 (133.7) 54.9 .04
Attended Preschool 88.5 92.4 -3.9 .33
Perceived Financial Strain (possible range: 1-5)
2.0 (0.9) 2.0 (0.9) 0 .40
Adult Race (% Black) 92.2 89.0 3.2 .41
Number of Moves in 2 Years Prior to Kindergarten
0.8 (1.0) 0.7 (0.8) 0.2 .42
Mother's Education .60
Less than High School 27.1 32.5 -5.4
High School/Equivalent 37.2 34.2 3.0
More than High School 35.6 33.3 -2.3
Age (Years) 5.5 (0.3) 5.5 (0.3) 0 .70
Receiving Free/Reduced Lunch 95.7 96.6 0.9 .77
Child Gender (% Male) 46.8 48.2 1.4 .83
Perceived General Stress (possible range: 1-5)
2.6 (0.6) 2.6 (0.6) 0 .85
Receiving Other Forms of Public Assistance
80.8 79.8 1.0 .88
Number (#) of Adults in Home 1.5 (0.7) 1.5 (0.6) 0 .92
Parent-Child Relationship Stress (possible range: 1-5)
1.5 (0.4) 1.5 (0.4) 0 .95
Mother’s Age (years, at start of study)
29.0 29.1 0.1 .96

WINGS Evaluation-Final Report to SIF
18
Table 4. Sample Baseline Outcome Measures by Treatment and Control (Outcomes ordered by Source, Measure, then from most different to least different between treatment and
control)
Baseline Treatment Control Difference
Source Measure Outcome Mean (SD) % Mean (SD) % Diff p value
Child Testing
# respondents 201 96% 137 94% 2% .62
NEPSY Theory of Mind 10.2 (3.9) 11.5 (4.2) -1.3 .003
DAS Verbal Comprehension 118.0 (15.0) 120.9 (13.0) -2.9 .08
EMT-ACES Emotion Recognition 40.4 (8.9) 41.8 (9.2) -1.5 .08
HTKS Executive Function 14.5 (16.8) 17.7 (17.5) -3.1 .14
DAS Naming Vocabulary 118.3 (16.0) 118.4 (17.1) -0.1 .99
Teacher Reports
# respondents 182 87% 131 90% -3% .44
DESSA
Self-Management 3.6 (0.8) 3.6 (0.8) 0 .40
Self-Awareness 3.4 (0.9) 3.4 (0.8) 0 .46
Social Awareness 3.7 (0.8) 3.7 (0.8) 0 .60
Relationship Skills 3.8 (0.8) 3.7 (0.7) 0.1 .68
Decision-Making 3.6 (0.8) 3.6 (0.7) 0 .78
STRS Closeness 4.1 (0.7) 4.2 (0.7) -0.1 .65
Conflict 1.8 (0.9) 1.7 (0.8) 0.1 .68
Parent Reports
# respondents 193 92% 119 82% 10% .004
SSIS
Internalizing 1.5 (0.4) 1.4 (0.4) 0.1 .04
Bullying 1.2 (0.4) 1.2 (0.4) 0 .59
Externalizing 1.7 (0.5) 1.7 (0.5) 0 .76
Hyperactivity 2 (0.6) 2 (0.6) 0 .99
DESSA
Self-Management 3.8 (0.6) 3.8 (0.7) 0 .42
Social Awareness 4.1 (0.6) 4.1 (0.6) 0 .63
Decision-Making 4.2 (0.7) 4.2 (0.6) 0 .66
Relationship Skills 4.5 (0.6) 4.5 (0.5) 0 .70
Self-Awareness 4.3 (0.6) 4.3 (0.6) 0 .85
STRS Closeness 4.8 (0.3) 4.8 (0.2) 0 .40
Conflict 1.9 (0.8) 1.9 (0.8) 0 .94

WINGS Evaluation-Final Report to SIF
19
Overall, the pre-test family characteristics and the parent and teacher outcome
measures suggests an overall balance due to randomization. However, the direction of
the pre-test measures that showed significant or nearly significant differences were in
the same direction. These measures suggested that control children were in smaller
families that had lower levels of Holmes-Rahe life stress and higher levels of child-
tested developmental measures than treatment children. To correct for these differences
in estimations, we included covariates for number of children in the home, theory of
mind, verbal comprehension, emotional regulation, and executive function. We did not
collect Holmes-Rahe measures for all three cohorts, and could not include this measure
as a covariate.
Overall and Differential Attrition
Some levels of non-response or attrition is an inevitable part of evaluations, particularly
for research that involves programs like WINGS outside the regular school day and
where pre-test and outcome data are collected longitudinally from teachers, parents,
and children. While the level of overall non-response can pose selectivity issues that
can bias effects, a particular issue in experimental studies is the presence of differential
attrition between treatment and control groups. The What Works Clearinghouse (WWC)
has attempted to quantify the risk associated with various levels of overall and
differential attrition (WWC, 2017). We will assess our levels of non-response and use
the WWC guidelines to assess bias risk.
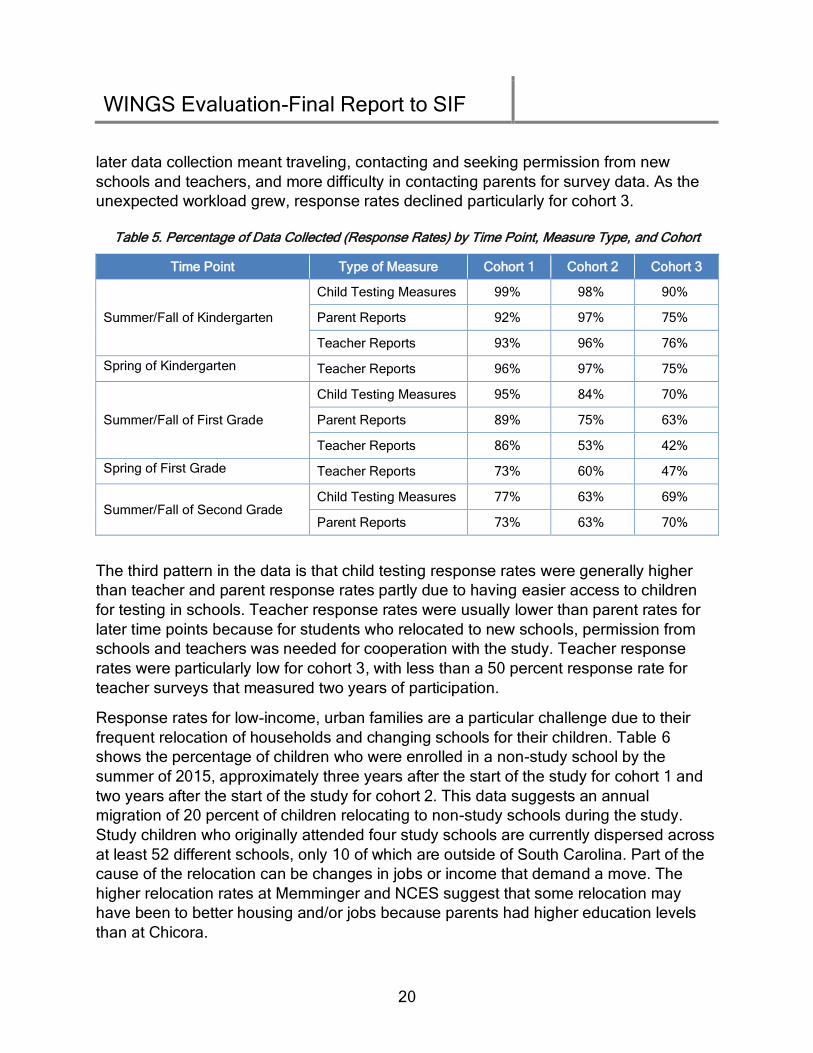
Table 5 shows the response rates for each type of assessment at each time point by
cohort. There are several patterns in the response data that are important. The
response rates in each cohort tended to be the highest at the first data collection in
summer/fall of kindergarten, but response rates predictably declined at the summer/fall
of first grade and in the summer/fall of second grade. This pattern is typical for
longitudinal data collection and a major determinant of declining response was due to
the higher than expected mobility of study families relocating—usually to schools in the
same school district, but some moved out of the city and state. We followed and
collected data from many of these residents who relocated to more than 50 schools
within the school district, but response rates for those who moved was lower.
The second pattern in the response data was a decline in response rates from cohort 1
to cohort 3. This pattern is likely due to two factors. The first factor was the increasing
workload on study personnel as the number of data collection points peaked in later
time periods when later data collection in cohort 1 overlapped with initial data collection
in cohort 3. That is, the data collection for each cohort could span more than two years,
so initial data collection for cohort 3 could overlap with final data collection for cohort 1
and intermediate data collection for cohort 2. The second factor was the much higher
than anticipated migration of families to more distant schools, so that in each cohort,
WINGS Evaluation-Final Report to SIF
20
later data collection meant traveling, contacting and seeking permission from new
schools and teachers, and more difficulty in contacting parents for survey data. As the
unexpected workload grew, response rates declined particularly for cohort 3.
Table 5. Percentage of Data Collected (Response Rates) by Time Point, Measure Type, and Cohort
Time Point Type of Measure Cohort 1 Cohort 2 Cohort 3
Summer/Fall of Kindergarten
Child Testing Measures 99% 98% 90%
Parent Reports 92% 97% 75%
Teacher Reports 93% 96% 76%
Spring of Kindergarten Teacher Reports 96% 97% 75%
Summer/Fall of First Grade
Child Testing Measures 95% 84% 70%
Parent Reports 89% 75% 63%
Teacher Reports 86% 53% 42%
Spring of First Grade Teacher Reports 73% 60% 47%
Summer/Fall of Second Grade Child Testing Measures 77% 63% 69%
Parent Reports 73% 63% 70%
The third pattern in the data is that child testing response rates were generally higher
than teacher and parent response rates partly due to having easier access to children
for testing in schools. Teacher response rates were usually lower than parent rates for
later time points because for students who relocated to new schools, permission from
schools and teachers was needed for cooperation with the study. Teacher response
rates were particularly low for cohort 3, with less than a 50 percent response rate for
teacher surveys that measured two years of participation.
Response rates for low-income, urban families are a particular challenge due to their
frequent relocation of households and changing schools for their children. Table 6
shows the percentage of children who were enrolled in a non-study school by the
summer of 2015, approximately three years after the start of the study for cohort 1 and
two years after the start of the study for cohort 2. This data suggests an annual
migration of 20 percent of children relocating to non-study schools during the study.
Study children who originally attended four study schools are currently dispersed across
at least 52 different schools, only 10 of which are outside of South Carolina. Part of the
cause of the relocation can be changes in jobs or income that demand a move. The
higher relocation rates at Memminger and NCES suggest that some relocation may
have been to better housing and/or jobs because parents had higher education levels
than at Chicora.

WINGS Evaluation-Final Report to SIF
21
Table 6. Percentage of Children Relocated by Cohort and School
School attended at start of study Percentage relocated to
non-study schools as of summer 2015
Cohort 1 Cohort 2
Chicora 39% 29%
Memminger 68% 43%
NCES 68% 34%
JSE 43% N/A
Total 56% 35%
Table 7a provides response rates for all three cohorts by type of measure (parent,
teacher, and child testing) and by treatment and control group for the one-year
participation sample and the two-year participation sample. The table also shows the
differential attrition level and the tests for the statistical significance of the differences
between treatment and control groups. Only 1 of 10 comparisons between treatment
and control groups show a significant difference. The initial response rate in the first
parent survey was 82 percent compared to 92 percent for the treatment group.
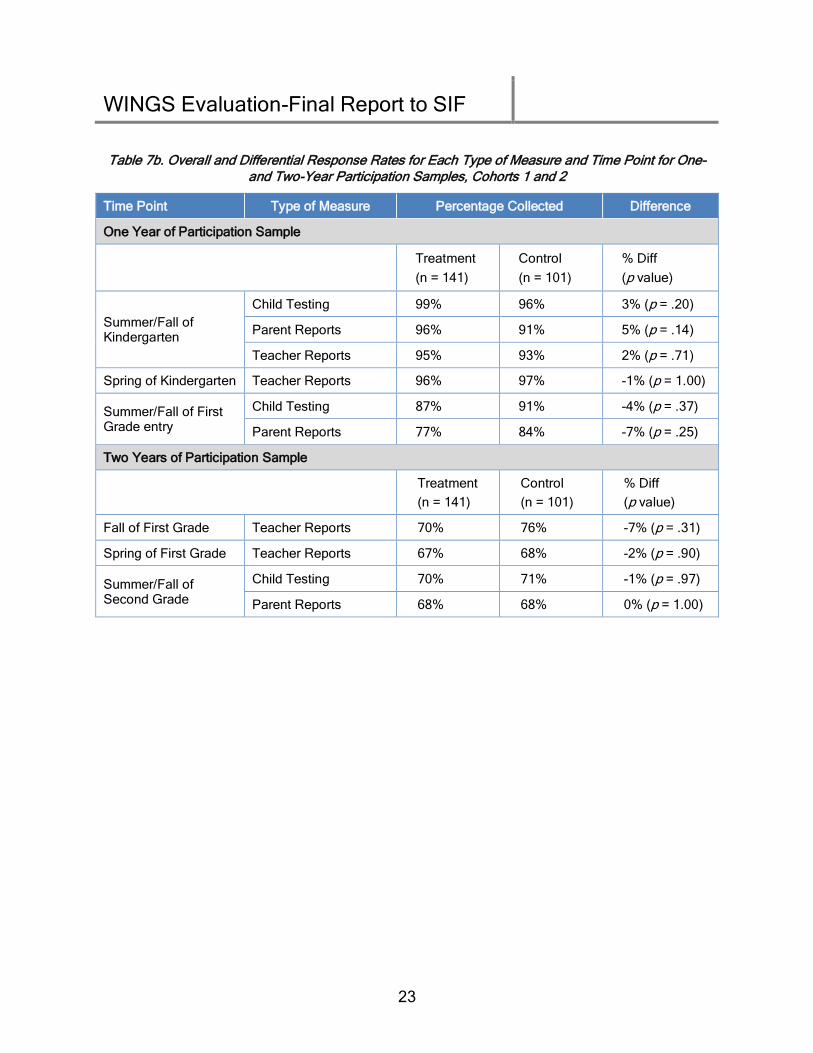
Table 7b is similar to Table 7a, but it shows data for cohorts 1 and 2 only. This data
shows no significant differences for the 10 comparisons between treatment and control
groups. However, Table 7c provides similar data for cohort 3 only and it shows
significant differences for 2 of the 10 comparisons and much greater differential attrition
levels than in cohorts 1 and 2.
Tables 8 and 9 show the WWC status of each data collection point in the one-year
evaluation and two-year evaluation, respectively. For the one-year evaluation including
data from all three cohorts, Table 8 shows that 5 of the 6 data collection points used at
pre-test and post-test met conservative WWC criteria, while the parent data at pre-test
met liberal WWC standards. Similarly, Table 8 shows for cohorts 1 and 2 combined that
5 of 6 data collection points met conservative WWC standards, and the post-test parent
surveys met liberal WWC standards. In contrast, the data for cohort 3 shows that 4 of 6
data collection points (all for parents and teachers) failed to meet liberal WWC
standards, while two direct child measures data collection points met WWC
conservative standards. This data suggests that the direct child measures from all three
cohorts can be used for evaluation of one-year effects, but data from cohorts 1 and 2 will
provide more reliable estimates for teacher and parent measures.

WINGS Evaluation-Final Report to SIF
22
Table 7a. Overall and Differential Response Rates for Each Type of Measure and Time Point for One- and Two-Year Participation Samples, All Three Cohorts
Time Point Type of Measure Percentage Collected Difference
One Year of Participation Sample
Treatment (n = 209)
Control (n = 145)
% Diff (p value)
Summer/Fall of Kindergarten
Child Testing 96% 94% 2% (p = .62)
Parent Reports 92% 82% 10% (p < .01 )
Teacher Reports 87% 90% -3% (p = .44)
Spring of Kindergarten
Teacher Reports 88% 94% -6% (p = .28)
Summer/Fall of First Grade Entry
Child Testing 81% 85% -4% (p = .35)
Parent Reports 79% 74% 5% (p = .32)
Two Years of Participation Sample
Treatment (n=209)
Control (n=145)
% Diff (p value)
Fall of First Grade Teacher Reports 60% 66% -6% (p = .31)
Spring of First Grade Teacher Reports 62% 59% 3% (p = .66)
Summer/Fall of Second Grade
Child Testing 71% 70% 1% (p = .83)
Parent Reports 71% 66% 5% (p = .42)
Table 9 shows the data using WWC criteria to measure two-year impacts. When all
cohorts are included, 4 of the 6 data collection points (all direct child measures and
teacher data) met WWC conservative standards, with only the two parent reports
meeting liberal standards. When only cohorts 1 and 2 are included, all 6 data collection
points met WWC standards. However, the data for cohort 3 only shows that 4 of 6 data
collection points (all teacher and parent data) did not meet even liberal standards, while
the direct child measures met conservative standards at pre-test and liberal standards at
post-test. This suggests that data for cohorts 1 and 2 have little risk for bias when
evaluating two-year effects, but cohort 3 carries considerable risk if used to evaluate
two-year effects.
WINGS Evaluation-Final Report to SIF
23
Table 7b. Overall and Differential Response Rates for Each Type of Measure and Time Point for One- and Two-Year Participation Samples, Cohorts 1 and 2
Time Point Type of Measure Percentage Collected Difference
One Year of Participation Sample
Treatment
(n = 141)
Control
(n = 101)
% Diff
(p value)
Summer/Fall of Kindergarten
Child Testing 99% 96% 3% (p = .20)
Parent Reports 96% 91% 5% (p = .14)
Teacher Reports 95% 93% 2% (p = .71)
Spring of Kindergarten Teacher Reports 96% 97% -1% (p = 1.00)
Summer/Fall of First Grade entry
Child Testing 87% 91% -4% (p = .37)
Parent Reports 77% 84% -7% (p = .25)
Two Years of Participation Sample
Treatment
(n = 141)
Control
(n = 101)
% Diff
(p value)
Fall of First Grade Teacher Reports 70% 76% -7% (p = .31)
Spring of First Grade Teacher Reports 67% 68% -2% (p = .90)
Summer/Fall of Second Grade
Child Testing 70% 71% -1% (p = .97)
Parent Reports 68% 68% 0% (p = 1.00)

WINGS Evaluation-Final Report to SIF
24
Table 7c. Overall and Differential Response Rates for Each Type of Measure and Time Point for One- and Two-Year Participation Sample, Cohort 3
Time Point Type of Measure Percentage Collected Difference
One Year of Participation Sample
Treatment
(n = 68)
Control
(n = 44)
% Diff
(p value)
Summer/Fall of Kindergarten
Child Testing 91% 89% 3% (p = .20)
Parent Reports 84% 61% 22% (p = .01)
Teacher Reports 71% 84% 14% (p = .16)
Spring of Kindergarten Teacher Reports 71% 82% -11% (p = .26)
Summer/Fall of First Grade Entry
Child Testing 66% 68% -2% (p = .99)
Parent Reports 74% 48% 25% (p = .01)
Two Years of Participation Sample
Treatment
(n = 68)
Control
(n = 44)
% Diff
(p value)
Fall of First Grade Teacher Reports 41% 43% -2% (p = .99)
Spring of First Grade Teacher Reports 53% 39% 14% (p = .20)
Summer/Fall of Second Grade
Child Testing 74% 66% 8% (p = .51)
Parent Reports 76% 59% 17% (p = .08)

WINGS Evaluation-Final Report to SIF
25
Table 8. What Works Clearinghouse Status of Data Used in One-Year Participation Evaluation
Data Used for One-Year Participation Evaluation
Time Point Type of Measure Cohorts WWC Status
Summer/Fall of Kindergarten
Pre-tests
Child Testing Measures
1 and 2 Conservative
3 Conservative
1-3 Conservative
Parent Reports
1 and 2 Conservative
3 Neither
1-3 Liberal
Teacher Reports
1 and 2 Conservative
3 Neither
1-3 Conservative
Spring of Kindergarten Teacher reports
1 and 2 Conservative
3 Neither
1-3 Conservative
Summer/Fall of First Grade Entry
Child Testing Measures
1 and 2 Conservative
3 Conservative
1-3 Conservative
Parent Reports
1 and 2 Liberal
3 Neither
1-3 Conservative

WINGS Evaluation-Final Report to SIF
26
Table 9. What Works Clearinghouse Status of Data Used in Two-Year Participation Evaluation
Data Used for Two-Year Participation Evaluation
Time Point Type of Measure Cohort WWC Status
Summer/Fall of Kindergarten Entry
(Pre-tests)
Child Testing Measures
1 and 2 Conservative
3 Conservative
1-3 Conservative
Parent Reports
1 and 2 Conservative
3 Neither
1-3 Liberal
Teacher Reports
1 and 2 Conservative
3 Neither
1-3 Conservative
Spring of First Grade Teacher reports
1 and 2 Conservative
3 Neither
1-3 Conservative
Summer/Fall of Second Grade Entry
Child Testing Measures
1 and 2 Conservative
3 Liberal
1-3 Conservative
Parent Reports
1 and 2 Conservative
3 Neither
1-3 Liberal
Non-Compliance and its Significance
Sample Non-Compliance In contrast to the term “study attrition,” which refers to
individual children or families not being available to provide data for the study, the term
non-compliance refers to whether the participants complied with their treatment and
control assignment. Participants who won the lottery were non-compliers if they did not
meet the standards for completing either one or two years of WINGS (no-shows).
Participants who lost the lottery were non-compliers if they actually attended the WINGS
program and met the standards for one and two years of attendance. These participants
are termed “crossovers.” Non-compliance can introduce bias if the non-compliers’
characteristics are not similar to compliers for both treatment and control groups. Non-

WINGS Evaluation-Final Report to SIF
27
compliance does not directly affect the estimation of ITT effects, but it can make their
interpretation more complex through markedly affecting TOT results.
When non-compliance is present, decisions and rules are needed to determine which
children received “treatment.” A common assumption in many interventions is to
designate children receiving any dosage as “receiving treatment.” However, according
to the WINGS logic model, attending WINGS for two years is thought to be necessary
before seeing positive impacts. In conjunction with WINGS personnel, we also
established minimum attendance criteria for each year based on actual attendance data.
We set the criteria of at least 100 days of attendance in kindergarten and first grade to
qualify as having “received treatment.” Based on these criteria, Tables 10, 11, and 12
provide the consort data for the levels of compliance and non-compliance by cohort.
Table 10 shows that 30 of 82 (37 percent) participants assigned to treatment in cohort 1
met the attendance criteria in both kindergarten and first grade, while the compliance
rate for treatment in cohort 2 (see Table 11) was 42 percent and the compliance rate in
cohort 3 (see Table 12) was 15 percent. The compliance rates for one year of
attendance were much higher, with 68 percent (cohort 1), 61 percent (cohort 2), and 46
percent (cohort 3) receiving treatment. The compliance rates for control children were
very high, with 98 percent (cohort 1), 98 percent (cohort 2), and 100 percent (cohort 3)
for one-year participation, and 86 percent (cohort 1), 91 percent (cohort 2), and 100
percent for children not receiving treatment.
Table 10. Cohort 1 Two-Year Consort Data
Randomized Children: 140
Treatment Condition: Treatment (n = 82) Control (n = 58)
Attended at least 100 days in kindergarten?
Yes No Yes No
56 26 1 57
% of condition group 68% 32% 2% 98%
Attended at least 100 days in first grade?
Yes No Yes No Yes No Yes No
30 26 8 18 0 1 7 50
% of condition group 37% 32% 10% 22% 0% 2% 12% 86%
The low compliance rate for treatment children in cohort 3—less than one-half of the
cohorts 1 and 2 rates—can be attributed to two factors: (1) The WINGS program was
closed at one of the three WINGS schools in cohort 3 so that treatment children could
not attend WINGS in their second year of participation. (2) The school district mandated
that each school initiate a district-sponsored after-school program, which had two

WINGS Evaluation-Final Report to SIF
28
impacts. At one school the WINGS program had restricted access to facilities, which
significantly compromised the effectiveness of the program. Also at both schools with a
WINGS program, children could transfer to the alternate program that provided less
restrictive attendance and earlier transportation. The net impact of these changes was
that cohort 3 children had much lower compliance rates and exposure to a less effective
program. Our earlier attrition data also suggested that cohort 3 teacher response data
often failed to meet WWC liberal standards, increasing the risk for bias. The net effect of
lower compliance and failure to meet WWC standards suggests that cohort 3 results
might be different than cohorts 1 and 2 results, and estimation methodology should test
whether these differences are present.
Table 11. Cohort 2 Two-Year Consort Data
Randomized Children: 102
Treatment Condition: Treatment (n = 59) Control (n = 43)
Attended at least 100 days in kindergarten?
Yes No Yes No
36 23 1 42
% of condition group 61% 39% 2% 98%
Attended at least 100 days in first grade?
Yes No Yes No Yes No Yes No
25 11 5 18 1 0 3 39
% of condition group 42% 19% 8% 31% 2% 0% 7% 91%
Table 12. Cohort 3 Two-Year Consort Data
Randomized Children: 112
Treatment Condition: Treatment (n = 68) Control (n = 44)
Attended at least 100 days in kindergarten?
Yes No Yes No
31 37 0 44
% of condition group 46% 54% 0% 100%
Attended at least 100 days in first grade?
Yes No Yes No Yes No Yes No
10 21 0 37 0 0 0 44
% of condition group 15% 31% 0% 54% 0% 0% 0% 100%
The study maintained records for each child that drew from parent conversations and
WINGS personnel and recorded the reasons for treatment children withdrawing from the
program. This data shows the reasons for non-compliance. About 60 percent of non-

WINGS Evaluation-Final Report to SIF
29
compliance for treatment children was due to a relocation and attendance at another
school without the WINGS program. The WINGS program was available only in the four
study schools, so almost all relocation was to district schools without WINGS. The
second most important reason for non-compliance (23 percent) was removal by the
parent without relocation. Removal by the parent could occur for a wide number of
reasons and might reflect the increased stress on the child and parent from the longer
day at school, and the parent preference to have the child return home after school.
Parents responded very positively when asked about the WINGS program, and there is
little evidence that dissatisfaction with WINGS was a significant cause of removal.
Estimation Methodology
We estimate the intent-to-treat (ITT) and treatment-on-the-treated (TOT) impacts of
WINGS on each of the more than 35 parent, teacher, and child testing measures after
both one year and two years of potential participation. The ITT analysis provides
estimates of the impact on all children assigned to WINGS, regardless of whether they
attended. If all students winning the lottery accepted the offer to attend, and no lottery
losers gained access to WINGS (i.e., perfect compliance), then ITT effects would reflect
the impact of actually attending WINGS. Since less than one-half of treatment children
attended two years of WINGS, ITT estimates do not reflect impacts for students who
actually attended WINGS. TOT provides estimates for those who actually attended
WINGS. The TOT effects show much larger effects than ITT effects.
We report three levels of “statistical significance” at the p < .05, p < .10, and p < .20
levels because lower levels of significance are important for providing guidance on
improving the program, for interpreting patterns of results across measures, and
possibly foreshadowing future effects with larger samples. We evaluated the magnitude
of effect sizes by the conventional scale of small effect (~0.25 standard deviation [SD]),
moderate effect (~0.50 SD), and large effect (~0.75 SD).
Intention-to-Treat (ITT) Analysis. The ITT estimates are calculated from a multiple
regression model:
1
1
N
i i q qi i
q
Y T X =
= + +
where Yi represents an achievement outcome Y for student i, Ti is a dichotomous
variable indicating the lottery outcome for student i (0 = lottery loser-control; 1 = lottery
winner-treatment), and the coefficient β1 is the WINGS treatment effect of interest. Xqi is
a vector of N covariates and εi is the random error term. The covariates include several
sets of variables. The pre-test variable is included. Lottery-specific fixed effects are
dummy variables that account for the 20 lotteries (by school, cohort, and gender) and

WINGS Evaluation-Final Report to SIF
30
account for lottery-level heterogeneity of the types of students and other factors that
differ across lotteries and also correct the standard errors for the loss of degree of
freedom due to blocking. Covariates to adjust for differences caused by randomization
between test and control groups are also included. These covariates include those
characteristics shown in Tables 3 and 4 that showed significant differences between
test and control groups (number of children in the home, theory of mind, verbal
comprehension, emotion recognition, and executive function). In addition, we included
demographic characteristics that include mother’s education, age of mother at child’s
birth, and child’s age. Finally, for child-administered and parent measures we included
only the variables that reflected the difference in timing and setting for child testing and
parent survey administration. These included a dummy for testing done during the
summer or school year and a variable for the days between pre-test and post-test.
These adjustments were not necessary with teacher reports, as all teacher reports were
collected on roughly the same date; in contrast, the parent reports and direct
assessments had wide windows for administration (from summer through fall).
Treatment-on-Treated (TOT) Analysis. The ITT estimates present an internally valid
estimate of the effect of being offered a position in WINGS. However, not all students
who were assigned to the treatment group chose to enroll in WINGS to receive the
required dosage of 100 days in kindergarten for the one-year impact analysis, or 100
days in both kindergarten and first grade for the two-year impact analysis. In addition, a
few children who lost the lottery (crossovers) attended WINGS and received the
required dosage. Therefore, the ITT estimates do not accurately measure the impact of
actually attending WINGS and receiving the required dosage.
We estimated the effect of attending WINGS using an instrumental variables (IV)
approach to account for no-shows or those who chose not to attend after being offered
admission, and crossovers or those who attend WINGS after not being offered
admission (Bloom, H. S.,1984). The first-stage equation, relating treatment assignment
to treatment receipt, was as follows:
�̂�𝑖 = 𝛾0 + 𝛾1𝑍𝑖 + Σ 𝛾𝑞𝑋𝑞𝑖 (2)
where �̂�i represents the expected treatment receipt status for child i (0 = did not receive
WINGS treatment; 1 = received WINGS treatment), based on the child’s treatment
assignment and consideration of covariates, 𝛾1 is the effect of treatment assignment (𝑍𝑖;
0 = control; 1 = treatment) on treatment receipt (Ti), and Xqi is a vector of covariates with
their accompanying regression coefficients, 𝛾𝑞, representing each covariate’s “effect” on
the child’s likelihood to receive treatment.

WINGS Evaluation-Final Report to SIF
31
The second-stage equation, which models the association between predicted treatment
receipt and child outcomes, is:
iqiqiii eXTY +++= ˆ10 , (3)
where 1 represents the association between predicted treatment receipt (�̂�i, as in
equation 2) and child outcome Yi, and Xqi is our vector of covariates with their
accompanying regression coefficients, qi , representing each covariate’s “effect” on the
outcome. Because �̂�i is the predicted treatment receipt based on random assignment
and covariates, the magnitude of 1 can be interpreted as the difference in child
outcomes between children who do and do not receive WINGS treatment due to
treatment and assignment and covariates. A reduced single-equation form of these
analyses can be devised by substituting the right side of formula 2 in for �̂�i in formula 3.
After some simplification, this reduced form can be written as:
iqiqiii XZY +++= 10 , (4)
where 1 1 represents the estimate for our treatment effect.
We also estimated ITT and TOT interaction effects by cohort (cohorts 1 and 2 versus
cohort 3), gender, and level of initial skills. For instance, the three cohort results were
estimated using the ITT estimation described earlier with full imputation, while the
results for cohorts 1 and 2 and cohort 3 were estimated using an interaction term for
either cohorts 1 and 2 or cohort 3 with full imputation. Similar interaction estimates were
done using gender or initial skill level as the interaction term.
Imputation of Missing Data
Missing data can be problematic for randomized controlled trials in two ways. The first
concern is selectivity bias if the characteristics of participants with data differ from those
without data. A particular concern is when there are different levels of missing data and
potential differential selectivity between test and control groups. In our sample, there is
little evidence of selectivity bias from differences in overall attrition or differential attrition
between treatment and control groups in cohorts 1 and 2, but cohort 3 is more
problematic (see Tables 5, 7a, 7b, 7c, 8, and 9). The second concern is that missing
data can reduce the statistical power of the sample to detect effects if only observations
with complete data are used in estimation.

WINGS Evaluation-Final Report to SIF
32
Imputation of missing data does not always result in increasing the power of the sample
(and significance of results) because imputation also introduces additional uncertainty
into standard errors. The magnitude of this uncertainty depends on the amount and
quality of non-missing data and whether imputations using this non-missing data can
reliably predict missing data. Imputation can therefore change effect coefficients in
either direction (indicating selectivity effects between missing and non-missing data) as
well as their statistical significance in either direction. If attrition is random, then effect
estimates should not change and the net effect on standard errors of added sample size
and uncertainty from imputation would be to reduce standard errors and increase the
statistical significance of effects.
The inclusion of missing data into both the ITT and TOT estimates posed a challenge
because the most frequently used procedure for incorporating missing data is full
information maximum likelihood (FIML) estimates. However, while FIML can be used for
ITT estimates, we could not find any literature or software that allowed TOT estimates to
incorporate FIML. TOT estimates are two-stage estimates, and FIML is currently only
used for one-stage estimates.
Our use of multiple imputation (MI), rather than FIML, was based on the fact that TOT
estimates are a critical component in interpreting the impacts of WINGS and were
attainable by using an MI approach. The MI approach begins by filling in, that is
imputing, probable values in place of missing data points. This process makes use of
information from predictor variables as well as auxiliary variables, and also explicitly
preserves uncertainty of imputed estimates by creating multiple, separate imputed data
sets. Thus, each missing observation to be imputed is replaced with not just one
imputed value, but several, and can therefore be thought of as having its own
distribution of plausible values. Analyses are then run and pooled across imputed data
sets to provide reliable parameter estimates, with standard error calculation accounting
for the uncertainty retained by the multiple estimates for each observation.
MI is a general technique that can be carried out using any one of a variety of
algorithms, procedures, and software tools. We used the MICE (multivariate imputation
by chained equations-R version 3.2.5) (Van Buuren & Groothuis-Oudshoorn, 2011),
alternatively called fully conditional specification. In a chained equations approach, the
imputation model is defined variable by variable to allow for customization by analysts
according to the unique features of each variable (e.g., the reasons why a particular
variable has missing data). Then, each equation is run successively in an order defined
by the analyst (in our case, predictors were imputed before outcomes) and the process
is repeated over several iterations (in our case, 40 iterations) to improve precision.

WINGS Evaluation-Final Report to SIF
33
We imputed data separately by construct (or “bucket”) represented in the WINGS logic
model. Thus, a set of imputed data was generated for teacher Devereux Student
Strengths Assessment (DESSA) outcomes, along with all predictors in the teacher
DESSA models, for example. We chose to impute 40 data sets for each “bucket,” and all
subsequent analyses was performed on each of the 40 data sets before being pooled to
produce final estimates. Auxiliary variables included child outcomes from “middle” time
points, which were not included in the models (e.g., for “building blocks” outcomes in our
two-year analyses, the kindergarten assessments were used as predictors, the second-
grade assessments as outcomes, and the first-grade assessments as auxiliary
variables).
Results
The results differed markedly by source of the outcome data. Teacher- and child-
administered outcome measures show a different pattern of results than parent-reported
measures. We discuss these sets of results separately.
Teacher- and Child-Administered Outcome Measures
The pattern of effects sizes and level of significance of the evaluation results for WINGS
suggest five distinct patterns of results across our teacher and child outcome measures.
These five distinctive patterns of results are:
• Table 13 shows distinctly different results for cohort 3 versus cohorts 1 and 2. Cohort 3
has a predictable pattern of null ITT effects for two years of participation with about
equal numbers of coefficients that are positive or negative, with no statistically
significant coefficients at p < .05 or p < .10. In contrast, cohorts 1 and 2 results show a
pattern of all but one coefficient being positive and 15 of 23 statistically significant
coefficients at p < .05 or p < .10.
• Table 13 shows a pattern of significant (p < .05) or marginally significant (p < .10) ITT
effects (effect sizes from 0.23 to 0.40) for cohorts 1 and 2 for two years of participation
for 15 of 23 teacher-reported or child-administered measures: decision-making (p <
.10), relationship skills (p < .10), self-awareness (p < .05), self-management (p < .10),
a social skills composite (p < .10), less bullying (p < .05), less externalizing (p < .05),
less hyperactivity (p < .05), less problem behaviors (p < .05), self-regulation (p < .05),
closeness to teacher (p < .10) , less conflict with teacher (p < .10) , executive function
(p < .05), naming vocabulary (p < .05) and letter-word ID (p < .05).
• Table 14 compares ITT and TOT results for two years of participation for cohorts 1 and
2 that show TOT estimates for children actually attending WINGS that have similar
levels of statistical significance to ITT results, but TOT effect sizes were approximately
2.5 times larger (0.6 to 1.0) than ITT effects (0.23 to 0.40).

WINGS Evaluation-Final Report to SIF
34
• Table 15 shows that the pattern of strong effects for two years of participation
contrasts with very weak to null effects after one year of participation. The results for
the sample at the end of the first year show null effects for teacher-rated measures,
and small statistically significant or marginally significant for two child testing outcome
measures: verbal comprehension and executive function. These results suggest the
program may have been less effective for kindergarten students and/or that the large
effects of WINGS require two years of participation and/or that effects are delayed. In
the latter case, the early effects of executive function and verbal comprehension for
one year of participation may have contributed to the large-scale effects after two
years of participation.
• Finally, Table 16 shows ITT impacts after one year for three samples: all three cohorts,
cohorts 1 and 2 only, and cohort 3. These effects are estimated similarly to the effects
in Table 13. However, unlike in Table 13, the effects after one year do not show the
distinctive pattern across cohorts that the effects after two years show. Effects after
one year show consistent and predominantly null effects across all three cohorts.
These results suggest that the distinctive and different pattern of effects shown for
cohorts 1 and 2 versus cohort 3 for two-year effects are not likely caused by
differences in characteristics of children across cohorts or in differences in program
effects at kindergarten. Rather, these results suggest that differences at two years
between cohorts 1 and 2 and cohort 3 might be due to: (1) changes in program
effectiveness during the second year for cohort 3, (2) changes in the quality of
measurements during the second year for cohort 3, or (3) changes in participation or
compliance in the second year for cohort 3.

WINGS Evaluation-Final Report to SIF
35
Table 13. Comparing ITT Effects for Two Years of Participation for Different Cohorts
All Three Cohorts Cohorts 1 and 2 Cohort 3
Source Measure Outcome Effect Stat-Sig Effect Stat-Sig Effect Stat-Sig
Teacher DESSA Decision-Making 0.17 + 0.24 * 0.010
Teacher DESSA Relationship Skills 0.20 + 0.23 * 0.123
Teacher DESSA Self-Awareness 0.21 * 0.30 ** 0.029
Teacher DESSA Self-Management 0.17 + 0.26 * -0.018
Teacher DESSA Social Awareness 0.04 0.15 -0.205
Teacher DESSA Social Skills Comp. 0.17 + 0.25 * -0.017
Teacher SSIS Less Bullying 0.12 0.31 ** -0.305
Teacher SSIS Less Externalizing 0.13 0.30 ** -0.266
Teacher SSIS Less Hyperactivity 0.24 * 0.40 ** -0.124
Teacher SSIS Less Internalizing 0.09 0.22 -0.230
Teacher SSIS Less Problem Bhav 0.17 + 0.36 ** -0.259
Teacher SSIS Self-Control 0.10 0.16 -0.043
Teacher SSIS Engagement 0.16 0.15 0.180
Teacher SSIS-CBRS
Self-Regulation 0.26 * 0.33 ** 0.087
Teacher STRS Closeness 0.15 0.27 * -0.120
Teacher STRS Less Conflict 0.16 + 0.24 * 0.019
Child DAS Naming Vocab 0.12 0.27 ** -0.249
Child DAS Verbal Comp 0.15 0.04 0.412
Child EMT-ACES
Emotion Reg 0.02 0.02 0.036
Child HTKS Executive Function 0.25 ** 0.32 ** 0.070
Child NEPSY Theory of Mind -0.10 0.03 -0.404 *
Child WJ Applied Problems 0.08 -0.12 0.027
Child WJ Letter-Word ID 0.25 ** 0.26 ** 0.247
** p < .05 Wrong Sign
* p < .10
+ p < .20

WINGS Evaluation-Final Report to SIF
36
Table 14. Comparing ITT and TOT for Two Years of Participation, Cohorts 1 and 2
TOT Results ITT Results
Source Measure Outcome Coefficient Significance Coefficient Significance
Teacher DESSA Decision-Making 0.62 * 0.24 *
Teacher DESSA Relationship Skills 0.59 + 0.23 *
Teacher DESSA Self-Awareness 0.76 ** 0.30 **
Teacher DESSA Self-Management 0.65 * 0.26 *
Teacher DESSA Social Awareness 0.36
0.15
Teacher DESSA Social Skills Composite 0.64 * 0.25 *
Teacher SSIS Less Bullying 0.78 * 0.31 **
Teacher SSIS Less Externalizing 0.76 * 0.30 **
Teacher SSIS Less Hyperactivity 1.02 ** 0.40 **
Teacher SSIS Less Internalizing 0.57 + 0.22 +
Teacher SSIS Less Problem Behaviors 0.92 ** 0.36 **
Teacher SSIS Self-Control 0.42
0.16
Teacher SSIS Engagement 0.40
0.15
Teacher SSIS-CBRS
Self-Regulation 0.85 ** 0.33 **
Teacher STRS Closeness 0.69 + 0.27 *
Teacher STRS Less Conflict 0.639 * 0.24 *
Child DAS Naming Vocabulary 0.58 * 0.27 **
Child DAS Verbal Comprehension 0.10
0.04
Child EMT-ACES
Emotion Recognition 0.04
0.02
Child HTKS Executive Function 0.73 ** 0.32 **
Child NEPSY Theory of Mind 0.06
0.03
Child WJ Applied Problems -0.28
-0.12
Child WJ Letter-Word ID 0.62 * 0.26 **
** p < .05
Wrong Sign
* p < .10
+ p < .20

WINGS Evaluation-Final Report to SIF
37
Table 15. Comparing ITT Results for One and Two Years of Participation
One Year Two Years
Source Measure Outcome Coefficient Significance Coefficient Significance
Teacher DESSA Decision-Making -0.01
.07
.01
.09
.04
.04
0.24 *
Teacher DESSA Relationship Skills 0.07
0.23 *
Teacher DESSA Self-Awareness 0.01
0.30 **
Teacher DESSA Self-Management 0.09
0.26 *
Teacher DESSA Social Awareness 0.04
0.15
Teacher DESSA Social Skills Composite 0.04
0.25 *
Teacher SSIS Less Bullying 0.01
0.31 **
Teacher SSIS Less Externalizing 0.02
0.30 **
Teacher SSIS Less Hyperactivity 0.03
0.40 **
Teacher SSIS Less Internalizing 0.06
0.22 +
Teacher SSIS Less Problem Behaviors 0.03
0.36 **
Teacher SSIS Self-Control -0.05
0.16
Teacher SSIS Engagement 0.05
0.15
Teacher SSIS-CBRS Self-Regulation 0.09
0.33 **
Teacher STRS Closeness -0.15 + 0.27 *
Teacher STRS Less Conflict -0.03
0.24 *
Child DAS Naming Vocabulary 0.04
0.27 **
Child DAS Verbal Comprehension 0.27 ** 0.04
Child EMT-ACES Emotion Recognition 0.06
0.02
Child HTKS Executive Function 0.18 * 0.32 **
Child NEPSY Theory of Mind -0.11
0.03
Child WJ Applied Problems -0.11
-0.12
Child WJ Letter-Word ID 0.12 + 0.26 **
** p < .05
Wrong Sign
* p < .10
+ p < .20

WINGS Evaluation-Final Report to SIF
38
Table 16. Comparing ITT Effects for One Year of Participation for Different Cohorts
All Three Cohorts Cohorts 1 and 2 Cohort 3
Source Measure Outcome Effect Stat-Sig Effect Stat-Sig Effect Stat-Sig
Teacher DESSA Decision-Making -0.01 -0.05 0.09
Teacher DESSA Relationship Skills 0.07 -0.04 0.32 *
Teacher DESSA Self-Awareness 0.01 -0.01 0.07
Teacher DESSA Self-Management 0.09 0.07 0.14
Teacher DESSA Social Awareness 0.04 -0.05 0.23 +
Teacher DESSA Social Skills Comp. 0.04 -0.02 0.18
Teacher SSIS Less Bullying 0.01 0.00 0.03
Teacher SSIS Less Externalizing 0.02 0.02 0.02
Teacher SSIS Less Hyperactivity 0.03 0.06 -0.02
Teacher SSIS Less Internalizing 0.06 0.01 0.18
Teacher SSIS Less Problem Bhav 0.03 0.02 0.05
Teacher SSIS Self-Control -0.05 -0.08 0.02
Teacher SSIS Engagement 0.05 -0.01 0.17
Teacher SSIS-CBRS Self-Regulation 0.09 0.17 + -0.07
Teacher STRS Closeness -0.15 + -0.12 -0.21
Teacher STRS Less Conflict -0.03 0.02 -0.14
Child DAS Naming Vocab 0.04 0.06 -0.02
Child DAS Verbal Comp 0.27 ** 0.28 * 0.24 +
Child EMT-ACES Emotion Recog 0.06 0.05 0.10
Child HTKS Executive Function 0.18 * 0.16 + 0.21
Child NEPSY Theory of Mind -0.11 -0.18 + 0.07
Child WJ Applied Problems -0.11 -0.13 + -0.06
Child WJ Letter-Word ID 0.12 + 0.14 + 0.08
** p < .05 Wrong Sign
* p < .10
+ p < .20

WINGS Evaluation-Final Report to SIF
Results for Parent Outcome Measures
39
The parent measures included similar scales assessing children’s behavior and social-
emotional skills that were reported by teachers. These parent measures for both one-
and two-year impacts showed a pattern of null ITT effects across all measures. That is,
parents with children who were offered admission to WINGS did not report a changing
pattern of behavioral or social-emotional skills compared with parents whose children
did not receive offers of admission to WINGS. Therefore, the reports of classroom
behavior and social-emotional skills by teachers show a pattern across measures of
significant WINGS impacts, while similar parent reports show no WINGS impacts.
However, parents were also asked to provide measures of overall stress, financial
stress, and child-parent stress. These measures showed that overall stress levels were
higher for treatment parents than control parents. The overall stress level showed
statistically significance differences (p < .05). The levels of financial stress and child-
parent stress showed higher stress for WINGS eligible parents, but no statistically
significant differences.
Discussion
Interpretation of Main Results
The divergent results for cohort 3 would be predicted by three factors that differ between
cohorts 1 and 2 and cohort 3. Cohort 3 had substantially lower compliance rates, higher
attrition and differential rates, and impaired program quality compared with cohorts 1
and 2. Cohorts 1 and 2 had compliance rates of 39 percent compared to 15 percent for
cohort 3. This lower compliance rate in cohort 3 was caused by the WINGS program
being closed for one cohort 3 school and to a district-mandated additional after-school
program implemented at two schools that led to transfers and lower compliance for
WINGS. In addition, the new district-mandated program caused significant disruptions in
access to facilities at one school that significantly impaired the quality of the program,
and the higher overall and differential attrition rates for cohort 3 measures did not meet
WWC 3 liberal standards for teacher and parent data (see Table 9). The failure to meet
WWC liberal standards suggest substantial risk for bias.
These factors would predict results for cohort 3 that would approach null results and have
a much higher threat for bias than for cohorts 1 and 2 measures. In some ways, cohort 3
simulated a natural experiment that tested whether the evaluation design and
methodology would change in response to significant changes in compliance, program
quality, and attrition. The results suggest that the evaluation design and methodology
registered these impacts, and that the results from cohorts 1 and 2 represent the effects of
WINGS when compliance and program quality is much higher and attrition is much lower.

WINGS Evaluation-Final Report to SIF
40
TOT estimates for children actually attending WINGS show effects for two years of
participation between 0.6 to 1.0, indicating that typical gains in classroom behavior,
social-emotional skills, executive function, and reading measures would be 25 to 35
percentile points. This size of effects is sufficient to substantially narrow gaps in
executive function, social-emotional skills, and reading skills for disadvantaged children.
The dramatic gains that occurred after two years of dosage versus one year of dosage
suggests that building social-emotional skills may require higher levels of dosage than is
commonly used in research to measure their effects. That is, previous research may
underestimate the potential effectiveness of programs and the power of social-emotional
skills to affect later outcomes because of limitations in dosage. Future research should
focus on interventions that have at least 2 years of intervention.
Our evidence would suggest that WINGS effects may grow with more dosage, for older
children, and may have delayed effects. Thus, the current WINGS evaluation that
includes only K-1 children with up to two years of dosage may underestimate the full
impact of the WINGS K-5 program. For children who remain in schools that have the
WINGS program, it is possible to attend up to six years and effects might be expected to
grow much larger.
Our data suggests two factors that make it difficult for children to receive higher levels of
dosage. These factors are the high rate of migration of low-income families within school
districts to schools not having a WINGS program, and the turbulence and stress present
in these families from frequent changes in jobs, income, health, and relationships that
prevent regular WINGS attendance. A district-wide WINGS program could achieve
much higher dosage and effects for at-risk children.
The transformative impacts for those attending the after-school program would also
likely increase achievement in classrooms for all students—even those not attending
WINGS—due to the improved classroom behavior of WINGS children.
Such notable impacts arising from an after-school program alone, while surprising at
one level, may simply replicate some of the expanded and more diverse opportunities
and learning environments that are present in advantaged families and their schools that
create the social-emotional skill differences for at-risk children (McCombs, et al, 2017).
Interpretation of Parent Results
The absence of similar effects from ratings of behavior and social-emotional skills from
parents and teachers suggests four hypotheses. The first hypothesis is that the child’s
behavior and social-emotional skills have improved in the classroom but not at home.
Our data shows that more than 65 percent of control children who arrived home after
school were supervised by a caregiver and others attended alternative after-school care
programs. Home behavior may be different for children attending WINGS who arrive

WINGS Evaluation-Final Report to SIF
41
home much later and are tired after a long day at school compared with children who
arrive home after school and spend time with caregivers. A measure of overall stress
included on the parent survey shows statistically significant higher levels of stress for
treatment group parents. This increased stress may result from the challenges of having
a child attending WINGS and the associated challenges of late home arrival of a tired
child. Parents of WINGS children, other things being equal, are more stressed, and our
results suggest that stressed parents—other things being equal—rate children’s behavior
lower.
The second hypothesis about parent results is that parent ratings are less objective than
teacher ratings and can be biased by the lack of a peer control group for comparisons
that teachers have, but parents do not. Classroom behavior during the day for an entire
school year provides an environment where a child’s behavior can be more objectively
compared with peers.
The third hypothesis is that the classroom environment is also much more similar to and
places similar demands on children as the WINGS environment, so new learned
behavior during WINGS may be easier to transfer to the classroom than to the home
environment. Finally, teachers have much higher education levels (typically a college
degree) than the parents in our sample (typically a high school degree or less). The
survey outcome measures could be cognitively challenging in terms of length of the
survey as well as an understanding of the developmental language and measures, and
teachers may be able to provide more reliable assessments.
Interpretation of Differences in Results for One Year and Two Years of Participation
The results also suggest that attending WINGS only in kindergarten does not produce
these positive impacts found after two years. This pattern of impacts has three possible
interpretations. One interpretation is that WINGS effects occur only if children attend for
two years; a single year of attendance provides insufficient dosage for significant
impacts. A second interpretation is that the WINGS program is not effective for
kindergarten students, but the program is more effective for first grade students. A third
interpretation is that the current two-year results partly reflect both longer-term, delayed
effects from kindergarten and short-term impacts from first grade. If effects are delayed,
then effects will increase in the longer term and current estimates will underestimate
long-term effects.
Each of these interpretations would suggest that WINGS impacts would increase with
more dosage, and/or with older children and/or if long-term impacts are measured. The
WINGS program serves children through fifth grade, and the current evaluation does not
include older children or children who receive more than two years of dosage or
measure long-term results. Thus, the current evaluation that includes only younger

WINGS Evaluation-Final Report to SIF
42
children with limited dosage and measures short-term impacts may underestimate the
full impact of the WINGS K-5 program.
WINGS is currently configured with only a few schools in a school district offering
WINGS. For children who remain in schools that have WINGS, it is possible to attend up
to six years since the program serves children through fifth grade. However, our data
suggests two factors that make it difficult for children to receive higher levels of dosage.
These factors are the high rate of migration of low-income families within school districts
to schools not having a WINGS program, and the turbulence and stress present in these
families from more frequent changes in jobs, income, health, and relationships that
prevent regular attendance at WINGS. For instance, only four in ten children who were
given the opportunity to start WINGS in kindergarten attained two years of treatment.
Parents of WINGS children express strong approval and support for the program, but
regular attendance requires remaining near schools offering WINGS and a level of
family stability and commitment that some families find difficult to attain.
One direction for increasing the number of children who can have the opportunity to
receive two or more years of WINGS from K-5 is to undertake a district-level
demonstration project that makes WINGS available in all schools in an urban school
district. Doing so might substantially increase the opportunity for children to receive
more than two years of dosage, and increase dosage for older students. Such a project
would allow students who move within a school district to maintain WINGS attendance,
and allow students who drop out of WINGS for a year or more to return and receive
additional dosage.
There are school districts throughout the nation who are experimenting with extended-
day programs, but they often use the extended time for more direct instruction.
However, there is strong experimental evidence that more direct instruction in reading
and math in extended-day programs does not lift achievement (Black, et al, 2009;
McCombs et al, 2017). However, the current evaluation results for WINGS appear
strong enough to support a larger demonstration project in a school district that would
allow experimental measurements of the long-term impacts for older children and for
children who receive more than two years of dosage.
Comparison of Results to Previous Research
This evaluation occupies a fairly unique niche in the literature on social-emotional
programs. The WINGS social-emotional program was an after-school program for low-
income, urban children that developed and evolved with research input over more than
10 years, and it was implemented, managed, and well-funded by a nonprofit
organization. WINGS incorporated components that included (1) high participation rates,
(2) a multi-year program, (3) a focus on social/emotional skills, (4) four “SAFE”
characteristics (sequenced, active, focused, and explicit), and (5) a focus on five key
WINGS Evaluation-Final Report to SIF
43
SEL competencies: self-awareness, self-management, responsible decision-making, social awareness, and relationship skills. The WINGS program developed an excellent
reputation in the Charleston, SC community and was awarded a $4 million, highly
competitive Social Innovation Fund grant (4 programs for children were awarded grants
out of 83 applying) to expand to other locations.
Most social-emotional programs that are evaluated are developed by researchers and
implemented for up to a year, but they do not have the opportunity to evolve and
improve over longer time periods. Evaluating existing programs presents unique
challenges and opportunities in contrast to researcher-designed programs. Perhaps the
main limitation of researcher-designed programs is that the evaluation is done in a
protective environment. Even if such evaluations show impacts, the issue of scaling up
and becoming viable in real-world environments is often problematic. Existing programs
are fully implemented and evolved and become viable in response to the needs of their
clients. Such programs are often more easily scalable.
Comparing our results to results from previous research is not straightforward for
several reasons. Almost all previous research on social-emotional programs either
during the school day or in after-school programs were for programs with dosage less
than a year, for older children, for researcher-designed programs, or for a
demographically more diverse population. Our comprehensive evaluation also
incorporated substantially more outcomes measures than previous studies and
incorporated measures from three sources: teachers, child testing, and parents.
Another complicating factor for comparing results is that previous evaluations of social-
emotional programs implemented either during the school day or in after-school
programs generally report only ITT results. ITT results can be compared across
programs only when compliance rates and attrition rates are equivalent across studies.
However, school-based programs completed in a single school year will generally have
much lower levels of attrition and non-compliance compared with out-of-school
programs. When compliance and attrition rates differ across evaluations, comparing
TOT estimates provides a better comparison since TOT estimates attempt to estimate
effects on children who actually receive treatment.
Meta-analysis of ITT effects for social-emotional programs, whether in school or out of
school including primarily older children for programs of less than a year, tend to fall in
the small-to-moderate range. For our sample of kindergarten children, a single year of
dosage showed only null to weak effects perhaps reflecting that one year of dosage is
insufficient or that after-school programs that extend the school day by three hours does
not work well for very young kindergarten children. Our results suggest that effects were
much stronger for first grade students who received two years of dosage, and our
comparable TOT effects were in the moderate to large range (0.6 to 1.0 SD) compared

WINGS Evaluation-Final Report to SIF
44
with small-to-moderate ITT effects for previous studies. These results might suggest that
previous evaluations would have gotten stronger results if continued for two years.
A study by Blair and Raver (2014) provides an interesting comparison because of its
focus on kindergarten children that included a low-income sample and was focused on
improving executive function, self-regulation, and academic skills. It differed from
WINGS in being for a single year and an in-school intervention, but included some
similar child testing measures. The two interventions also shared a somewhat common
approach to boosting children’s skills.
Blair and Raver (2014) designed an intervention that was a curriculum and pedagogical-
based intervention called Tools of the Mind. The intervention has a “coherent focus on
executive function as a primary mechanism through which children make progress and
develops teachers to learn how to organize and manage instruction so that children
build self-regulation skills through purposeful interactions with classmates.” Teachers
also “engage in dynamic assessment of children’s development in core areas and
provide individualized, differentiated scaffolding depending on how a child performs a
specific skill.”
In many ways the underlying approach used in Tools of the Mind and WINGS is similar
in the extended focus throughout either the school day or the three-hour after-school
period on the child’s activities and providing individualized feedback and learning
opportunities in interaction with other children to improve executive function and social-
emotional skills. In Tools of the Mind, the focus incorporates academic learning activities
rather than typical after-school activities. But both interventions attempt to use many
activities that encourage social peer interactions and use play activities as opportunities
for learning. Both interventions rely on a strategy of using teachers or WINGS leaders to
infuse an activity-planned play or academic environment with opportunities for learning
and social interactions that can be used to provide individualized feedback to children
on behavior directed toward improving their executive functions and social-emotional
skills. WINGS might be seen as a “Tools of the Mind” type of program for an after-school
intervention.
Blair and Raver (2014) found after one year of intervention significant (p < .05) or
marginally significant (p < .10) ITT effects from three of six measures of executive
function and self-regulation in the low-income sample ranging from 0.3 to 0.6, and for
math and two of three reading measures with effects between 0.13 and 0.5. Although
the intervention did not continue for a second year, follow-up measures at two years for
the academic measures generally showed continued or somewhat smaller impacts.
In contrast, WINGS effects at the end of one year showed TOT estimated comparable
effects of 0.25 (p < .10) for a measure of executive function and 0.37 (p < .05) for verbal
comprehension, but no effects on reading or math academic measures or teacher-

WINGS Evaluation-Final Report to SIF
45
reported classroom behavior measures. However, after two years of WINGS, executive
function showed TOT effects of 0.73 (p < .05) and two measures of reading showed
TOT effects of 0.58 to 0.73 (p < .10), and 16 of 23 teacher-reported classroom
measures related to executive function, self-regulation, and social-emotional skills
showed significant or marginally significant comparable TOT effects between 0.6 to 1.0.
WINGS did not show any math results.
The positive effects measured in both studies suggest that the common elements and
approach—the theory of action—that underlie these interactions might be working in both
an in-school and an after-school program. Our results suggest that Blair and Raver
(2014) might have obtained much stronger results had the intervention lasted for two
years.
Limitations
It is important for researchers and policy-makers to recognize the limitations of this
research as well as its strengths. Limitations are factors that could affect the internal or
external validity of the reported results. The factors that can limit the internal validity of
our study include: (1) selectivity and low reliability in reported measures, (2) unlucky
randomization, (3) sample attrition and missing data, (4) non-compliance, (5)
adjustments for multiple outcome measures, (6) poor fidelity of implementation, and (7)
flawed analysis. The external validity of the study is limited by the homogeneity of the
sample to low-income, urban, at-risk children and to the uncertainty of scaling the
program to other schools, school districts, and urban areas.
Selectivity and Reliability in Reported Measures
The design of our study accounted for the high level of funding and tried to design a
randomized controlled trial with mixed methods that incorporated a wider variety of
measures from parents, teachers, and child administration than needed for evaluation,
but could also be used to provide information on causative factors that might explain
results (Grissmer, 2016). Also implicit in this evaluation was the realization that an
unusual opportunity was present to better understand the factors that shaped the
development and outcomes of at-risk urban children from kindergarten entry to end of
first grade. This strategy led us to incorporate extensive data collection from parents,
teachers, and child-administered tests and include a number of developmental
measures that might explain changes in social-emotional skills (building block) skills.
We also incorporated “experimental” measures that were in earlier stages of
development. Finally, the skill levels of these children significantly lagged behind the
skills of the nationally representative children that formed the basis of the appropriate
age ranges for many measures. A few of the measures chosen simply did not work well
as administered or displayed significant floor effects that resulted in their elimination
from the analysis.

WINGS Evaluation-Final Report to SIF
46
We included 38 measures from teachers, child testing, or parents in our final analysis.
We eliminated the following measures from the analysis for the listed reasons:
Differential Ability Scales-II (DAS) working memory (very high level of floor effects),
WALLY (difficulty administering and failed to show significant correlations between time
1 and 2), an experimental executive function measure (measure in development with
some issues in administration that we included only in final two cohorts, positive
insignificant results), Woodcock-Johnson general knowledge (not part of original theory
of action, showed positive, insignificant results), and delay of gratification (complex
question with six choices that has negative correlation with other behavioral and building
block measures and negative, but insignificant outcome results).
Finally, measures can be unreliable if they are not collected at similar points in time and
in similar administrative conditions. Our child testing data and parent data at each data
collection point could have been collected at different times either in the summer
preceding kindergarten, first- or second-grade entry, or during the first two to three
months of the school year. We incorporate covariates to control for the days between
tests as well as whether the tests were administered in summertime or during the school
year. A sensitivity analysis shows little systematic impact on results from including or
eliminating these variables for outcomes associated with child testing or parent
measures. It is only our child testing and parent variables that include the timing
covariates. Teacher-reported outcomes that show similarly strong impacts as child
testing outcomes are collected at the beginning and end of each school year and do not
have this source of variance.
Unlucky Randomization
The possibility of unlucky randomization impacting results is generally tested through
statistical tests of pre-test variables collected close to randomization. Such tests are
stronger as the number of pre-test variables increases. This study has an unusually
large number of pre-test variables from child testing, parents, and teachers to test
whether the overall sample had significant differences in test and control groups on
each of these variables. The statistical tests for differences between treatment and
control children show only a very small proportion that show significant differences. The
primary exception is four developmental variables (theory of mind, verbal
comprehension, executive function, and emotional recognition), a demographic variable
(number of children in the home) that all show differences in the same direction that are
significant at between the p < .01 to p < .20 level. That is, all are in the direction of either
increased parental stress or lower developmental characteristics for treatment children.
We have also incorporated these variables as covariates (along with parent education,
child age, and mother’s age at child’s birth) to adjust for randomization differences.
Inclusion of these variables as covariates predictably strengthens somewhat the effect
size and significance of the results.

WINGS Evaluation-Final Report to SIF
47
Sample Attrition and Missing Data
Study attrition can threaten the internal validity of results if those who stop providing
data have different characteristics than those who supply data, and these characteristics
are correlated with outcome measures. Particularly problematic is attrition levels that are
different between test and control groups (differential attrition). Our data does not show
significant levels of overall and differential attrition for cohorts 1 and 2, but does show
unacceptable levels for cohort 3. The What Works Clearinghouse (WWC), which serves
to assess the internal validity of studies, publishes guidelines for assessing the levels of
overall attrition and differential attrition. Our levels of attrition across almost all measures
in cohorts 1 and 2 show overall and differential attrition that meets the conservative
WWC guidelines. However, cohort 3 attrition characteristics for teacher and parent data
do not meet even liberal WWC criteria for overall and differential attrition.
We also did not find statistically significant differences in early pre-test characteristics of
those who stay in the study and leave the study. A primary reason for leaving the study
was that participants moved out of the WINGS schools to other schools in the school
district. Although we tracked many of these people and continued collecting data, many
who moved stopped supplying data to the study. However, there were no significant
differences in relocation between test and control group characteristics. Overall results
suggest that attrition due to relocation was not correlated with winning or losing the lottery.
The quality of missing data imputation for each individual depends on the amount and
quality of data available for that individual and for all individuals in the sample. We
collected initial pre-test data from about 88 percent of parents, 89 percent of teachers,
and 95 percent of children were given initial batteries of tests. Only 2 to 3 percent of
children were missing data entirely. The remaining missing data came mainly from
missing a parent or teacher survey or child testing at the end of year 1 or year 2. But in
general, there is a fairly rich set of data for the individual and/or for similar students that
can be used to impute missing data. A comparison of results using observations with
complete data to results using imputed data showed the expected patterns with similar or
slightly weaker effect coefficients, but stronger statistical significance for imputed results.
Non-Compliance
Non-compliance occurs when children randomized into treatment groups do not attend
WINGS at all or do not meet participation criteria for WINGS (no-shows) and/or children
randomized into control groups actually do attend WINGS and meet participation criteria
(crossovers). In our study, non-compliance from no-shows was about 32 percent of the
one-year treatment sample and 61 percent of the two-year sample. The primary reason
for the high level of no-shows was parents relocating out of the schools with the WINGS
program to other schools in the same district. Our data suggests that the level of
relocation was not different among treatment and control children, nor would one expect

WINGS Evaluation-Final Report to SIF
48
a relocation decision—a common occurrence for low-income parents in urban areas—to
be linked to winning or losing the WINGS lottery.
Incorporating the effects of non-compliance into randomized controlled trial estimation is
done by changing the interpretation of ITT results and making additional estimates of
TOT results. The ITT results are estimated in the same way regardless of the level of
non-compliance, and these estimates measure effect differences between all children in
treatment versus control groups, regardless of whether children complied. However, the
impacts carry a caveat that the results measure effects across both children who
attended as well as those not attending, and, if effects are positive, presumably the
effects would have been larger if all treatment children had attended the program. The
TOT estimates account for non-compliance (of both types) and make estimates for
impacts for those actually attending the program. However, these estimates cannot
eliminate the potential for bias that would occur if the characteristics of those who
attended are different from those not attending, and these differences are correlated to
outcome variables. In our case, we found no differences in characteristics between
attenders and non-attenders.
Adjustments for Multiple Outcome Measures
No consensus exists about statistical adjustments for multiple comparisons when
virtually all outcome measures are correlated and for large sets of outcome measures.
Any consideration of adjustments should recognize that while such adjustments
decrease the chances of a false positive (an ineffective program will be labeled as
effective), they increase the chances of a false negative (an effective program will be
labeled ineffective). In the evolutionary research stages of developing improved social-
emotional measures and programs, searching for patterns linked to effective programs
may be more important than guarding against misallocating future resources to an
ineffective program. In our case, we do not recommend widespread expansion of
WINGS that would require significant resources and consideration of adjusting for
multiple outcome measures. However, the current WINGS results, in our view, are
strong enough to suggest it should be expanded to all schools at a school district level.
This recommendation would allow measurements for older children and children
receiving more than two years of dosage that our results would suggest would have
stronger effects. It would also allow for a replication of the current results. Thus, the
current results are certainly strong enough to implement the program in an environment
that reaches more children, especially older children, who will receive more dosage and
likely produce stronger effects.
Fidelity of Implementation
Fidelity of implementation measures can be useful when there are a large number of
separate locations with sufficient sample at each location that allow results to be

WINGS Evaluation-Final Report to SIF
49
statistically compared across locations. In our study, we did not have the sample size of
number of locations that allow such an analysis. In this situation, fidelity data can be
useful in interpreting results and identifying factors that might explain differences across
locations. In our study, there were dramatic differences in fidelity between cohorts 1 and
2 and cohort 3 due to the closure of the program at one cohort 3 school and the limited
access to facilities at another school due to a second after-school program that
effectively impaired the normal activities of the WINGS program and lowered
compliance. The dramatic differences between strong results in cohorts 1 and 2 and null
results for cohort 3 suggest that the normally operating WINGS programs in cohort 1 in
four schools and cohort 2 in three schools produced strong effects that declined to null
effects when 2 of 3 schools in cohort 3 were not able to operate.
We collected several different measures of implementation fidelity primarily for cohorts 1
and 2, in order to assess whether programs were implemented with fidelity across
schools and in cohorts 1 and 2. While the programs at different schools in cohorts 1 and
2 encountered some difficult and challenging circumstances, we did not find marked
differences in measures across schools or between cohorts 1 and 2. We did run
interaction terms by school and cohort and found no consistent differences in effects
across schools or between cohorts 1 and 2. The results would suggest that fidelity of
implementation was strong enough across schools and cohorts 1 and 2 to produce the
strong pattern of impacts found for cohorts 1 and 2, but they were not useful in better
understanding differences for one- and two-year participants partly due to the limited
sample sizes and small number of schools and cohorts involved.
Flawed Analysis
Flawed analysis often is involved if results cannot be replicated and can occur either
due to programming errors or from studies that selectively choose publishing results not
directly linked to confirmatory hypotheses or changing and searching among model
specifications for positive results. There is no substitute for replication. But studies are
arguably more vulnerable to these flaws if the number of outcomes measures is few and
data comes from a single set of participants with data collection at a single time period
and with smaller samples that lack adequate power to detect larger effects. Our complex
data set from parents, teachers, and child testing with 38 outcome measures shows
distinctive patterns of results that would be hard to “game.” While programming errors
are possible, these errors tend to be identified during the analysis process when results
dramatically shift (or do not run at all). Subtle programming errors are rare.
Lessons Learned
One of the major problems when evaluating existing programs for children that raise
public and private funding to support their program is the tension that exists between
researchers’ “objectivity” and the threat that poor results from the evaluation pose to

WINGS Evaluation-Final Report to SIF
50
program funding and existence. Failure to recognize and incorporate this tension into
the evaluation process can easily result in premature termination of any evaluation.
Evaluations involving nonprofit programs dependent on nongovernmental funding
require development of a strong researcher–clinician partnership. Directors of nonprofit
programs for children are in a challenging position because their outside funding from
foundations and philanthropists often depends on successful evaluations. These
sources of funding often do not have the sophistication required to understand the
complexity of evaluating these programs and seek simple “black-white” answers (e.g.,
Did the evaluation show your program was effective at a p < .05 level?). Directors also
often do not develop the requisite understanding of research to communicate effectively
more nuanced results. But researchers also often have a “black-white” approach to
evaluation and often use imprecise language in communicating results.
It is essential in these projects to develop the researcher-clinician partnership that
allows both researchers to better understand the programs being evaluated and the
concerns of program managers and clinicians to better understand research and
interpretation of results. Researchers have a lot to learn from clinicians, and vice-versa.
We came into the project with the traditional “hands-off” approach (i.e., let’s do an
“objective” evaluation and not get involved in the program) to evaluation.
We have determined partly through an adversarial process with WINGS and their able
set of research advisors, that this “hands-off” approach was counter-productive and
would not have allowed the project to proceed, nor would a fair evaluation have been
possible. We recognized that evaluations must broaden their scope to include better
understanding the complexity of the lives of program participants, the complexity of
managing and improving out-of-school programs to improve children’s outcomes, the
difficulty of measuring these early developing skills, and the complexity of the analysis
required to obtain and interpret results.
We learned that results can be communicated in a more accurate way that better reflects the probabilistic outcomes of randomized controlled trials that program managers can also understand. We learned that evaluations even under ideal conditions can seldom label programs as ineffective unless negative effects are statistically significant. Even null effects have an even chance of program effects being positive. At best, evaluations can measure positive effects, if present, but such effects usually come with important caveats. We also learned that program managers are very interested in results that reflect p < .20 and p < .10 because these results can point to ways of improving the programs, and may also be harbingers of future effects as measures strengthen and the power of samples increase. We learned that the mixed methods data collected can be used in many ways to suggest improvements in the program.

WINGS Evaluation-Final Report to SIF
51
We also learned that, in our case, program managers can develop a pretty sophisticated
understanding of research methods and offer suggestions and interpretations that
strengthen the research. In particular, annual meetings of presentation of results
allowed WINGS program managers and staff to suggest new, different, and sometimes
better interpretations of the results than supplied by researchers. This ongoing sharing
and interpretation of results at annual meetings was critical to building the partnership.
Future Research
Research on children’s short- and long-term outcomes and the experimental evaluation
of school-based programs and out-of-school programs to improve outcomes are
undergoing rapid evolution and development. Historically, most of this research and
evaluation was focused on the impact of schools and school-based interventions that
have reading and/or math achievement as primary outcomes. School-based
interventions using achievement as outcomes provide an advantage in evaluation
because the measures are highly reliable and replicable, non-compliance and missing
data are usually not problems, statistical power is high from large samples, and
outcomes measures are few. In this evaluation environment, the standard ITT and TOT
methods of evaluation using statistical significance levels of p < .05 are warranted. The
best studies also incorporate multiple methods so that causative mechanisms can
potentially be identified, and assessments can be done to determine whether some
children benefit more than others and whether there are ways of improving the
intervention through improved fidelity.
However, research is increasingly suggesting that children’s long-term outcomes are
predicted as much or more by developmental skills learned outside of direct school
instruction than by skills learned in direct school instruction (McCombs et al., 2017).
These skills include self-regulation, executive function, social-emotional, visuo-spatial,
and early comprehension (Grissmer et al., 2010). These early developmental skills have
less reliable measures, require a larger set of outcome measures to capture their
effects, and need more complex interventions for their improvement because they are
learned largely outside schools. These interventions focused on activities outside of
schools make large samples less accessible and have much higher levels of non-
compliance and missing data that make adequate statistical power more difficult.
The measurement of these early developmental skills is a work in progress, and the
quality and reliability of these measurements have not approached those of the most
commonly used measures associated with achievement. Part of the problem is that any
measure, achievement or otherwise, made with younger children have less quality and
reproducibility. We should not expect at this stage of development to have the same
kinds of results that would be produced using achievement measures because
achievement measures are narrower and better developed—whereas these skills are
displayed in a much wider set of behaviors that are more difficult to measure and less

WINGS Evaluation-Final Report to SIF
52
reproducible. These measures will improve over time allowing better measures, but at
this stage of development, the criteria should not be the most stringent levels of
statistical significance, that is, p < .05. In the long run when measures and interventions
improve and samples have more power, imposing a statistical significance standard
seems reasonable, but the purpose of an evaluation during the evolutionary period of
improving measures and programs with weaker samples should incorporate a different
set of objectives.
Evaluation methodology during the evolving period when measures and interventions
are improving should incorporate the following elements:
• The standard randomized controlled trial ITT and TOT analysis should be used, which
includes methods of incorporating missing data with particular emphasis on the TOT
effect sizes.
• Lower levels of statistical significance should be reported on measures.
• Assessing ways of improving measures should be an important objective by including
a wider range of exploratory outcome measures than is typical in randomized
controlled trials.
• Assessing ways of improving the effectiveness of the intervention is also an important
objective to undertake in addition to standard evaluation analysis.
• Interpretations should focus on the internal consistency and predictability from the
theory of action of the broad patterns of results across measures rather than entirely
on consideration of statistics across individual measures.
Perhaps most importantly, the collection of mixed methods data seems critical for
research involving the building of these early developmental skills in the out-of-school
context. Randomized controlled trials involving the building of early developing skills
learned largely outside school involving low-income children are particularly challenging
during the early stages of research and program development. Investment in the
collection of mixed methods data may be critical for accomplishing the broader set of
objectives outlined above.
Much of the long-term value of this project may still be ahead of us and lie not only with
the “evaluation results,” but in this future research with the data collected. Most of our
mixed methods data has yet to be fully incorporated into the analysis and interpretation
of results, and stronger recommendations for improving future research and the
effectiveness of the WINGS program will emerge from continuing research with this
data. The unique data collected in this project on the lives of low-income urban families,
the development of their children in the K-1 period, and the impact of schools and
programs on their lives can support years of research that can: (1) assess the sensitivity
of current results to alternate assumptions, (2) assess the relationships among

WINGS Evaluation-Final Report to SIF
53
measures of early developing cognitive skills and academic outcomes, (3) improve
current measures of early developing skills, (4) improve the WINGS program, and (5)
identify social and educational policies that can improve outcomes for low-income
children.

WINGS Evaluation-Final Report to SIF
54
References
Alexander, K. L., Entwisle, D. R., & Kabbani, N. (2001). The dropout process in life course perspective: Early risk factors at home and school. Teachers College Record, 103(5), 760-822.
Bierman, K. L., Nix, R. L., Greenberg, M. T., Blair, C., & Domitrovich, C. E. (2008). Executive functions and school readiness intervention: Impact, moderation, and mediation in the Head Start REDI program.
Development and Psychopathology, 20(03), 821-843. doi: 10.1017/S0954579408000394
Black, A. R., Somers, M.-A., Doolittle, F., Unterman, R., Grossman, J. B.
(2009). The evaluation of enhanced academic instruction in after-school programs: Final report. Jessup, MD: National Center for Education
Evaluation and Regional Assistance. Retrieved from https://eric.ed.gov/?id=ED506725
Blair, C., & Raver, C. C. (2014). Closing the achievement gap through
modification of neurocognitive and neuroendocrine function: Results from a cluster randomized controlled trial of an innovative approach to the education of children in kindergarten. PLOS ONE, 9-11. doi:
10.1371/journal.pone.0112393
Blair, C., & Raver, C. C. (2015). School readiness and self-regulation: A developmental psychobiological approach. Annual Review of Psychology,
66, 711-731. doi: 10.1146/annurev-psych-010814-015221
Bloom, H. S. (1984). Accounting for No-Shows in Experimental Evaluation Designs. Evaluation Review, 8(2), 225-246.
Brooks-Gunn, J., Duncan, G., & Aber, J. L. (Eds.). (1997). Neighborhood poverty, Volume 2: Policy implications in studying neighborhoods. New York, NY: Russell Sage Foundation.
Collaborative for Academic, Social, and Emotional Learning (CASEL) (2016). What is SEL? Retrieved from http://www.casel.org/what-is-sel
Cataldi, E. F., Laird, J., & Kewal Ramani, A. (2009). High school dropout and completion rates: 2007. (NCES 2009064). Washington, DC: National Center for Educational Statistics. Retrieved from http://nces.ed.gov/pubsearch/pubsinfo.asp?pubid=2009064
Cicchetti, D. (2002). The impact of social experience on neurobiological systems: Illustration from a constructivist view of child maltreatment. Cognitive development, 17(3), 1407-1428. doi:
10.1016/S0885-2014(02)00121-1

WINGS Evaluation-Final Report to SIF
55
Cole, P. M., Usher, B. A., & Cargo, A. P. (1993). Cognitive risk and its association with risk for disruptive behavior disorder in preschoolers. Journal of Clinical Child Psychology, 22(2), 154-164. doi: 10.1207/s15374424jccp2202_3
Denham, S. A., & Brown, C. (2010). “Plays nice with others”: Social–
emotional learning and academic success. Early Education and Development, 21(5), 652-680. doi: 10.1080/10409289.2010.497450
Denham, S. A., Ji, P., & Hamre, B. (2010). Compendium of preschool through elementary school social-emotional learning and associated assessment measures. Chicago, IL: Collaborative for Academic, Social, and Emotional Learning and Social (CASEL) and Emotional Learning
Research Group, University of Illinois at Chicago. Retrieved from https://casel.org/compendium-of-preschool-through-elementary-school-social%E2%80%90emotional-learning-and-associated-assessment-measures
Denham, S. A., Bassett, H. H., & Zinsser, K. (2012). Early childhood teachers as socializers of young children’s emotional competence. Early Childhood Education Journal, 40(3), 137-143. doi: 10.1007/s10643-
012-0504-2
Duncan, G. J., & Magnuson, K. A. (2005). Can family socialeconomic resources account for racial and ethnic test score gaps? The Future of Children, 35-54.
Durlak, J. A., Mahoney, J. L., Bohnert, A. M., & Parente, M. E. (2010). Developing and improving after-school programs to enhance youth’s
personal growth and adjustment: A special issue of AJCP. American Journal of Community Psychology, 45, 285-293. doi: 0.1007/s10464-010-9298-9
Durlak, J. A., & Weissberg, R. P. (2007). The impact of after-school programs that promote personal and social skills. Chicago, IL: Collaborative for Academic, Social, and Emotional Learning. Retrieved
from https://casel.org/the-impact-of-after-school-programs-that-promote-personal-and-social-skills-2007/
Durlak, J. A., Weissberg, R. P., & Pachan, M. (2010). A meta-analysis of
after-school programs that seek to promote personal and social skills in children and adolescents. American Journal of Community Psychology, 45, 294-309. doi: 0.1007/s10464-010-9300-6
Durlak, J. A., & Weissberg, R. P. (2011). Promoting social and emotional development is an essential part of students’ education. Human Development, 54(1), 1-3. doi: 10.1159/000324337

WINGS Evaluation-Final Report to SIF
56
Durlak, J. A., Weissberg, R. P., Dymnicki, A. B., Taylor, R. D., & Schellinger, K. B. (2011). The impact of enhancing students’ social and emotional
learning: A meta‐analysis of school‐based universal interventions. Child
Development, 82(1), 405-432. doi: 10.1111/j.1467-8624.2010.01564.x
Evans, G. W. (2003). A multimethodological analysis of cumulative risk and allostatic load among rural children. Developmental Psychology, 39(5), 924–933. doi: 10.1073/pnas.0811910106
Evans, G. W., & Schamberg, M. A. (2009). Childhood poverty, chronic stress, and adult working memory. Proceedings of the National Academy of Sciences, 106(16), 6545-6549. doi: 10.1073/pnas.0811910106
Greenberg, M. T., Weissberg, R. P., O’Brien, M. U., Zins, J. E., Fredericks, L., Resnick, H., Elias, M. J. (2003). Enhancing school-based prevention and youth development through coordinated social, emotional, and academic
learning. American Psychologist, 58, 466-474.
Gresham, F. M., & Elliott, S. N. (2008). Social skills improvement system. Minneapolis, MN: Pearson.
Grissmer, D.W. (2016). A guide to incorporating multiple methods in randomized control trials to assess intervention effects (2nd ed.). Retrieved from http://www.apa.org/ed/schools/cpse/activities/mixed-
methods.aspx
Grissmer, D.W., Grimm, K. J., Aiyer, S. M., Murrah, W. M., & Steele, J. S. (2010). Fine motor skills and early comprehension of the world: Two
new school readiness indicators. Developmental Psychology, 46, 1008-1017. doi: 10.1037/a0020104.
Hamre, B. K., & Pianta, R. C. (2001). Early teacher–child relationships and
the trajectory of children's school outcomes through eighth grade. Child Development, 72(2), 625-638.
Hughes, C. (2002). Executive functions and development: Emerging themes.
Infant and Child Development, 11, 201–209. doi: 10.1002/icd.297
Jahromi, L.B., Stifter, C.A. (2008). Individual differences in preschoolers' self-regulation and theory of mind. Merrill-Palmer Quarterly, 54, 125-
150.
Jones, S. M., & Bouffard, S. M. (2012). Social and emotional learning in schools: From programs to strategies. Social Policy Report, 26(4). Ann
Arbor, MI: Society for Research in Child Development. Retrieved from https://eric.ed.gov/?id=ED540203

WINGS Evaluation-Final Report to SIF
57
Jones, D. E., Greenberg, M., & Crowley, M. (2015). Early social-emotional functioning and public health: The relationship between kindergarten
social competence and future wellness. American Journal of Public Health, 105(11), 2283-2290. doi: 0.2105/AJPH.2015.302630
Kane, T. J. (2004). The impact of after-school programs: Interpreting the results of four recent evaluations. Working paper. New York, NY: William T. Grant Foundation. Retrieved from https://www.issuelab.org/resource/the-impact-of-after-school-programs-interpreting-the-results-of-four-recent-evaluations.html
Kim, H., Byers, A. I., Cameron, C. E., Brock, L. L., Cottone, E. A., & Grissmer, D. W. (2016). Unique contributions of attentional control and
visuomotor integration on concurrent teacher-reported classroom functioning in early elementary students. Early Childhood Research Quarterly, 36, 379-390. doi: 10.1016/j.ecresq.2016.01.018
Korkman, M., Kirk, U., & Kemp, S. (2007). NEPSY Second edition (NEPSY II). San Antonio, TX: The Psychological Corporation.
Lauer, P. A., Akiba, M., Wilkerson, S. B., Apthorp, H. S., Snow, D., & Martin-
Glenn, M. L., (2006). Out-of-school-time programs: A meta-analysis of effects for at-risk students. Review of Educational Research, 76, 275-313. doi: 10.3102/00346543076002275
Lebuffe, P. A., Shapiro, V. B., & Naglieri, J. A. (2009). The Devereux student strengths assessment (DESSA) assessment: Technical manual, and user’s guide. Cerritos, CA: Apperson Inc.
Mavroveli, S., Petrides, K. V., Sangareau, Y., & Furnham, A. (2009). Exploring the relationships between trait emotional intelligence and
objective social‐emotional outcomes in childhood. British Journal of
Educational Psychology, 79(2), 259-272. doi: 10.1348/000709908X36884
McComb, E. M., & Scott-Little, C. (2003). After-school programs: Evaluations and outcomes. Greensboro, NC: SERVE.
McCombs, J., Whitaker, A., and Youngmin, Y., (2017), The value of out-of-school time programs. Document no. PE-267-WF. Santa Monica, CA: RAND. doi: 10.7249/PE267
McGinley, N. J., Rose, J. S., & Donnelly, L. F., (2009). Graduation and drop-out rates, 2007-08 (Report No. 09-352). Charleston, SC: Charleston County School District Department of Assessment and Accountability.
WINGS Evaluation-Final Report to SIF
58
Mischel, W., Shoda, Y. & Rodriguez, M.L. (1989). Delay of gratification in children. Science, 244(4907), 933-938.
Morgan, J. K., Izard, C. E., & King, K. A. (2010). Construct validity of the Emotion Matching Task: Preliminary evidence for convergent and criterion validity of a new emotion knowledge measure for young
children. Social Development, 19(1), 52-70. doi: 10.1111/j.1467-9507.2008.00529.x
Morris, P., Lloyd, C. M., Millenky, M., Leacock, N., Raver, C. C., & Bangser,
M. (2013). Using classroom management to improve preschoolers’ social and emotional skills: Final impact and implementation findings from the Foundations of Learning Demonstration in Newark and Chicago. New York, NY: MDRC. Retrieved from https://www.mdrc.org/publication/using-classroom-management-improve-preschoolers-social-and-emotional-skills
Morris, P., Mattera, S. K., Castells, N., Bangser, M., Bierman, K., & Raver,
C. (2014). Impact findings from the Head Start CARES demonstration: National evaluation of three approaches to improving preschoolers' social and emotional competence. New York, NY: MDRC. Retrieved from https://www.mdrc.org/publication/impact-findings-head-start-cares-demonstration
Nickerson, A. B., & Fishman, C. (2009). Convergent and divergent validity of
the Devereux Student Strengths Assessment. School Psychology Quarterly, 24(1), 48-59. doi: 10.1037/a0015147
Paras, A. (2007, November 19). North Charleston crime 7th in U.S. The Post
and Courier, Charleston, SC.
Payton, J., Weissberg, R. P., Durlak, J. A., Dymnicki, A. B., Taylor, R. D., Schellinger, K. B., & Pachan, M. (2008). The positive impact of social and emotional learning for kindergarten to eighth-grade students: Findings from three scientific reviews. Chicago, IL: Collaborative for Academic, Social, and Emotional Learning.
Peake, P. K., Hebl, M., & Mischel, W. (2002). Strategic attention deployment for delay of gratification in working and waiting situations. Developmental Psychology, 38, 313-326.
Pennington, B. F. (2002). Development of psychopathology: Nature and nurture. New York, NY: The Guilford Press.
Pianta, R. (1992). Child-parent relationship scale. Unpublished measure,
University of Virginia.

WINGS Evaluation-Final Report to SIF
59
Pianta, R. (2001). Student-Teacher Relationship Scale: Professional Manual. Odessa, FL.: Psychological Assessment Resources.
Ponitz, C. E. C., McClelland, M. M., Jewkes, A. M., Connor, C. M., Farris, C. L., & Morrison, F. J. (2008). Touch your toes! Developing a direct measure of behavioral regulation in early childhood. Early Childhood Research Quarterly, 23(2), 141-158.
Raver, C. C., Blair, C., & Willoughby, M. (2013). Poverty as a predictor of 4-year-olds' executive function: New perspectives on models of
differential susceptibility. Developmental Psychology, 49(2), 292-304. doi: 10.1037/a0028343
Reardon, S. F. (2011). The widening academic achievement gap between
the rich and the poor: New evidence and possible explanations. In R. Murnane & G. Duncan (Eds.),Whither Opportunity? The widening academic achievement gap between the rich and the poor: New evidence and possible explanations (91-116). New York, NY: Russell Sage Foundation Press.
Riggs, N. R., Blair, C. B., & Greenberg, M. T. (2003). Concurrent and 2-year
longitudinal relations between executive function and the behavior of 1st and 2nd grade children. Child Neuropsychology, 9, 267-276.
Riggs, N. R., Jahromi, L. B., Razza, R. P., Dillworth-Bart, J. E., & Mueller, U.
(2006). Executive function and the promotion of social-emotional competence. Journal of Applied Developmental Psychology, 27, 300-309. doi: 10.1016/j.appdev.2006.04.002
Séguin, J. R., Boulerice, B., Harden, P. W., Tremblay, R. E., & Pihl, R. O. (1999). Executive functions and physical aggression after controlling for attention deficit hyperactivity disorder, general memory, and IQ. Journal of Child Psychology and Psychiatry, 40(8), 1197-1208. doi: 10.1111/1469-7610.00536
Social and Emotional Learning Research Group (SEL Research Group) &
Collaborative for Academic, Social, and Emotional Learning (CASEL) (2010). The benefits of school-based social and emotional learning programs: Highlights from a major new report. Chicago, IL: SEL
Research Group. Retrieved from http://www.innerresilience-tidescenter.org/documents/Meta-analysis3-pagesummary7-5-10%282%29.pdf
U.S. Census Bureau (2008). American Community Survey 2006-2008. Washington, DC: U.S. Census Bureau. Retrieved from http://factfinder.census.gov/servlet/ACSSAFFFacts?_event=Search&geo_id=&_ge

WINGS Evaluation-Final Report to SIF
60
oContext=&_street=&_county=north+charleston&_cityTown=north+charleston&_state=04000US45&_zip=&_lang=en&_sse=on&pctxt=fph&pgsl=010
Van Buuren, S., & Groothuis-Oudshoorn, K. (2011). MICE: Multivariate imputation by chained equations in R. Journal of Statistical Software, 45(3). doi: 10.18637/jss.v045.i03
Webster-Stratton, C., Reid, M. J., & Hammond, M. (2004). Treating children with early-onset conduct problems: Intervention outcomes for parent, child, and teacher training. Journal of Clinical Child and Adolescent Psychology, 33(1), 105-124. doi: 10.1207/S15374424JCCP3301_11
Weissberg, R. P., Caplan, M. Z., & Sivo, P. J. (1989). A new conceptual framework for establishing school-based social competence promotion
programs. In L. A. Bond, & B. E. Compas (Eds.), Primary prevention and promotion in the schools. Primary prevention of psychopathology (Vol. 12, pp. 255–296). Newbury Park, CA: Sage Publications, Inc.
What Works Clearinghouse (WWC) (2017). Attrition Standard. WWC Standards Brief. Retrieved from: https://eric.ed.gov/?id=ED579501
Woodcock, R. W., McGrew, K. S., & Mather, N. (2001). Woodcock-Johnson III Tests of Achievement. Itasca, IL: Riverside.
Zins, J. E., Elias, M. J., Greenberg, M. T., & Weissberg, R. P. (2000). Promoting social and emotional competence in children. In K. M. Minke,
& G. G. Bear (Eds.), Preventing school problems promoting school success: Strategies and programs that work (pp. 71–99). Bethesda, MD: National Association of School Psychologists.
Zins, J. E., Bloodworth, M. R., Weissberg, R. P., & Walberg, H. J. (2004). The scientific base linking social and emotional learning to school success. In J. E. Zins, R. P. Weissberg, M. C., Wang, & H. J. Walberg (Eds.),
Building academic success on social and emotional learning: What does the research say? (pp. 3-22). New York, NY: Teacher’s College Press.