final report study of storm time fluxes 24 april kdsa 1979. final report study of storm time fluxes...
TRANSCRIPT

LMSCD673774 24 April 1979
KDsA
FINAL REPORT
STUDY OF STORM TIME FLUXES
OF HEAVY IONS
CONTRACT NAS-W 3112
prepared by
Lockheed Palo Alto Research Laboratory Lockheed Missiles amp Space Company Inc
3251 Hanover Street Palo Alto California 94304
(NASA-CR-162826) STUDY OF THE STORM TIME N80-18605 FLUXES OF HEAVY IONS Final Report (lockheed Missiles and Space Co) 42 p HC A03MF A01
CSCL 04A Unclas G346 15421
httpsntrsnasagovsearchjspR=19800010329 2018-07-03T081219+0000Z
LMSCD673774
TABLE OF CONTENTS
SECTION TITLE PAGE
Introduction 1
2 29 July 1977 Magnetic Storm 4
3 15 February 1978 Magnetic Storm 23
4 Geomagnetic Storms for IMS 28
5 Discussion and Conclusions 37
6 References 40
LMSCD673774
SECTION 1
INTRODUCTION
The central focus of this program has been the investigation of the
characteristics of the stormtime ring current ions in the energy rangeof
05 to 16 keV Data were processed and analyzed from the Lockheed energetic
ion mass spectrometer aboard the S3-3 satellite which was launched intb a
polar orbit in July 1976 and is still operating Results from this program
have also served as a valuable guide for planning and operating the ion mass
spectrometer experiment on the ISEE spacecraft for selecting and processing
the ISEEion data (Johnson et al 1978) and for planning and conducting
coordinated satellite experiments in support of the International Magnetospheric
Study (IMS)
It is now well established from the S3-3 ion data that relatively large
fluxes of energetic (keV) 0+ and H+ ions are frequently flowing upward from
the ionosphere along magnetic field lines in the polar auroral regionsshy
[Shelley et al 1976 Sharp et al 1976 and Ghielmetti et al 1978]
Also from investigations withthe same instrument during the main phase of
three moderate (DST - 100) magnetic storms it was found that the number
density of 0+ ions in the ring current was comparable to H+ ion density in
the range 05 to 16 keV [Johnson et al 1977]
-Ishy
LMSCD673774
In addition to an improved understanding of the general morphology
of the ring current ions the present study has-also identified two new
features that appear to be important in understanding the ring current
development
1) Solar wind ions have been observed during two magnetic storms
at low L-shells during the main phase of ring current development
and
2) Upstreaming conical ions distributions are observed at low
L-shells (L=4-5) may be an important source of the ionospheric
ions observed in the inner ring current
To investigate the general characteristics of the ring current ions
during moderate (DST - 100) magnetic storms the 29 July 1977 storm has
been studied in considerable detail The 15 February 1978 storm has been
investigated to provide additional data on the new features discussed above
and several storms have been investigated in a preliminary fashion to look for
storm-to-storm variability and to support some of the IMS activities
particularly the time period in December 1978 which was selected by the IMS
Steering Committee for detailed coordinated investigations
For this report the data for the individual storms are presented and
discussed separately The general discussion and conclusions are then
presented in the final section of this report
The ion composition measurements used in this study were made with
an energetic ion mass spectrometer aboard the polar-orbiting S3-3 spacecraft
which has perigee near 350 km and apogee near 8000 km The spacecraft is
spinning at 3 rpm with the spin axis normal to the orbital plane and with
-2shy
LMSCD673774
the instrument view directions in the orbital plane The instrument
contains 3 ion mass spectrometers and 4 electroh spectrometers whose
designs have been described previously [Shelley et al 1972 Reed et al
1969] Each ion spectrometer acquires a 30-channel mass-per-unit-charge
spectrum every second Every 16 seconds the energy-per-unit-charge
setting for each spectrometer is stepped to one of the four vaTues allowing
a 12-point energy spectrum to be acquired every 64 seconds Each spectrometer
on Step 1 is in the lowest energy step etc The energy-per-unit-charge
values are 05 068 094 and 128 keV for spectrometer 1 176 24
33 and 45 keV for spectrometer 2 and 62 85 116 and 160 keV for
spectrometer 3 The four broadband electron channels span the energy
ranges 007 to 024 keV 035 to 11 keV 16 to 50 keV and 73 to 24 keV
-3shy
LMSCD673774
SECTION 2
29 JULY 1977 MAGNETIC STORM
Excellent data coverage near apogee of the S3-3 satellite was
obtained throughout the magnetic storm on 29 July 1977 Satellite apogee
was in the local time-sector near 0500 hours and the ring current data
presented here were-obtained at altitudes in the range 7000-8000 km A
plot of Dst for this storm is shown in Figure 1 along with three other
storms of comparable magnetude which had been investigated earlier for
the ring current ion composition [JOhnson et al 1977] The peak of
main phase in each storm is seen to be about -100 y The very low and
nearly constant Dst for 3 days pr4or to the 29 July storm and the relatively
smooth transition to the peak of the main phase of the storm may make this
event a good one for more detailed study by the IMS community The S3-3
coverage for the main phase portion and for the early decay phase of the
29 July storm is shown in Figure 2 From this plot it can be seen that the
main phase was followed by a relatively rapid decay phase until about 1000
hours UT when a second enhancement of the ring current occurred A
large substorm which was widespread in local time was observed near 1200
hours in the ground-based magnetograms
Examples of the ion mass spectra in three different-energy ranges for two
different L-shell regions during REV 3120 near the peak of Dst (see Figure 2)
are shown in Figure 3 This shows thegood signal-to-background ratio
throughout the region L=258 to 40 The background counting rates were even
lower at the higher latitudes The region L=258-302 was near the inner
edge of the ring current fluxes and the relatively large 0+fluxes in all
-4shy
30 1 DEC 1976 JAN 1977
I--APRIL 1977 lt-100
0
APRIL 1977
-10O0 V
25 JULY 1977 3 0
Figure 1 DST for Four Magnetic Storms of Comparable Peak Intensities
-5shy
40
20
REV REV REV REV REV REV 0 - 3119 3120 3121 3122 3123 3124
-20
-40
-60
-80
S3-3 COVERAGE -100- LPARL ION COMPOSITIO DATA
29 JULY 1977
-120 J 2 4 6 8 10 12 14 16 18 20 22 24
UT HOURS 29 JULY 1977
Figure 2 The Location of S3-3 Satellite Co-verage During the 29 July 1977 Magnetic Storm
+ 29 JULY 1977 H+1000 29 JULY 1977 + 29 JULY 1977
L 258-30228 L -- 258-302 L 258-62-6302 800 E 05-128 E 176-45 E 62-160
0 H+ +in 600
H-kH +HH 0o400
20Het + He+F He+ H+
10 20 30 10 20 30 10 20 30 CHANNEL NUMBER CHANNEL NUMBER CHANNEL NUMBER
1000 29 JULY 1977 29 JULY 1977 H+ 29 JULY 1977 L - 30- 40 L - 30-40 H+800 30-40
E=05-128 E - 176 -45 E - 62-160 H7 600 H
00 o O+ 400 0
0 +200
10 20 30 10 20 30 10 20 30
CHANNEL NUMBER CHANNEL NUMBER CHANNEL NUMBER
Figure 3 Mass Spectra Near the Pbak DST During the 29 July 1977 Magnetic Storm
LMSCD673774
three energy regions can be seen In the region L=30-40 significantly
lower 0+ fluxes are observed particularly at the higher energies
The L-shell distribution of the 0+ andH + ion number densities in
- the instrument energy range 05-16 keV are shown for REV 3120 in Figure 4
Also shown are the dehsities observed with the same instrument in the local
morning sector (022 hours) during the 29 December 1976 magnetic storm
For the 29 July storm particularly large 0+H+ ratios are seen near the inner
edge of the ring current fluxes with variable but generally reduced values
in the ratio at the higher latitudes This general characteristic has also
been reported for ion fluxes precipitating from the 17-18 December 1971
magneticistorm [Sharp et al 1976)
Comparisons of the H+ and 0+ energy distributions in the region from
L=3 to 4 are seen in Figure 5 for the 29 July 1977 and 29 December 1976
storms Although differing in detail the spectral features for the two
storms are similar with the 0+ spectrums being significantly softer than
the H+ spectrums
To further investigate the average energy characteristics at different
times in the storm the average energy of the fluxes integrated over pitch
angles as a function of latitude was determined for each of the spacecraft
passes shown in Figure 2 These results are seen in Figure 6 through 11
One particular feature of the average energy data stands out in the first
thtee passes during the earlier portion of the storm This feature is the
pronounced dip in the average energy of$the fluxes in the region of L=4-45
For the three passes later in the storm shown in Figures 9 10 and 11 the
average energy characteristics were quite variable with no systematic trends
-8shy
SW4Oq oL4au6w 9L[ Jaeqwezoe 6Z pue LL6L RtO 63 aq 6utpno +
H puo A01 SL4SUao AxaqwnN tan6Lj +0
0Z
-or
Mt U
ootI 011
(a) REV 1397 (b) REV 3120 29 DECEMBER 1976 29 JULY 1977 075054 - 075454 063319 - 063943 L =305 -396 L=3 04 -3 95
L44
161 5010
510 00
10 EEG10 10 10 CO
ENRY(key) ENERGY (keV)
Figure 5 Energy Distributions for 0 and H+ Near the Peak of DST During the 29 July 1977 andST29 December 1976 Magnetic Storms
A = H
=
S3-3 REV 3119 29 JULY 197T
80
40 -
20shy
30 40 50 60 70
Figure 6 Average Energies of the 0 and H+ Ions During the Injection Phase of the 29 July 1977 Magnetic Storm
LO
-
10
8
6
4
9Wshy
2 $3-3 REV 3120 2 -29 JULY 1977
010
26 30 40 50 60 70
Figure 7 Average Energies of the 0+ and H ions Near the Peak of the Main Phase of the 29 July1977 Magnetic Storm
10
8
6gt
4
S3-3 REV 3121 29 JULY 1977
-0- 0+H6-
40 50 60 70 80 L
Figure 8 Average Energies of the 0+ and H+ Ions Three Hours After the Peak of the Main Phase oflthe29 July 197- Magnetic Storm
14
12
10
IL
6
4
29 JULY 19772
I10 60 7026 30 40 50
+ + s0eraScndr eki Figure 9 Average Energies of the 0 and H Ions Near aSecondary Peak in
0St During the Early Recovery Phase of the 29 duly 1977 Magnetic Storm
he ErlyST Duing
10
8
6N
4
S3-3 REV 3123 29 JULY 1977
2 -0- 0 + ~H
30 40 50 60 70 L
Figure 10 Average Energies of the 0+ and H+ Ions During the Early Recovery Phase of the 29 July 1977 Magnetic Storm
12
10
8
S3-3 REV 3124 S 29 JULY 1977
-0- 0 +
0 30 40 50 60 70 80
Figure 11 + +
Average Energiesof 0 and H 29 July 1977 Magnetic Storm
Ions During the Early Recovery Phase of the
LMSCD673774
in the average energy data being evident
Evidence for conical pitch angle distributions of 0+ ions was found in
the survey data for Revolution 3119 which was acquired(see Figure 2) during
the ring current build up Spin by spin plots of the-pitch angle distributions
at energies of 05 068 094 and 128 key for 9 successive spins between
L=405 and L=445 are shown in Figure 12 along with one spin at L=466
The loss cone regions between + 150 pitch angles is indicated by the cross
hatching The absence of upward streaming ions with fluxes peaked along
the field direction in this Northern hemisphere pass is evident -However
significant fluxes of upward flowing conical distributions are easily
identified along with weaker andless frequent fluxes of downward flowing
-conical distributions Locally mirroring (90) and predipitating (1650
1800) fluxes of 0+ ions are seen to be very low or absent at these lower
energies At energies above 2 keV-trapped and precipitating 0+ and H+
fluxes are observed in this same L-shell region No significant fluxes
of H+ ions with conical pitch angle distributions were observed in this
region Large spatial andor temperal variations in the upward flowing
conical fluxes can also be seen in a single scan through the pitch angle
range of the conical fluxes This is seen in Figure 12 at 13857 13872
13889 and 13905 seconds During the 54 seconds required for the pitch
angle scans from 600 to 00 to 600 the spacecraft traveled about 25 km Thus
spatial structures less than 25 km andor temporal changes in less than 6
seconds are associated with the conical pitch angle distributions
During REV 3119 significant fluxes of He++ were also observed at
L-shells greater than L=4 Examples of the mass spectrum for three energy
intervals in the range L=40-45 is shown in Figure 13 The He++ mass
-17shy
LMSCD673774
T = 13808 sec 20 LI
10 -29 JULY 1977 L=405
=UT 13825 sec 20 - 0 + IONS E=094 keV
10
100 E= 128 keV
= 0 xO LIT 13857 sec20
SUT = 13872 sec
20 E= 050 keV
1020 E=0613889esacSUT = = 0 9 4
10- iE keV0
LIT = 13905 sec
010 E- 128 keV
20 20 UT = 13921 sec-20 E = 068 keV
10
6 9 T= = 13937 sc20 - 1 E 050 keV
I08shy
30 - LIT = 1400 sec = 0 50 k e V (E b
20 - L = 466
10shy
180 150 120 90 60 30 0 30 60 90 120 150 180
PITCH ANGLE
Figure 12 Conical Pitch Angle Distributions observed During the Injection Phase of the 29 July 1977 Magnetic Storm
deg + REV 3119 REV 3119 REV 3119 L -40-45 L = 40- 45 L - 40-45
200 E - 05-128keV E 176-45keV E - 62-16OkeV
150 - 5 0+ + 1500 +
i15 150 5 0
z z 0 0 0 2500
0 +100 000 100 1000 I00 2000
He~+ He He + 150050 He 500 50 + 500 50 4 +1
eHe1000
5 10 5 20 25 0 1 5 10 15 20 25 30
0 5 10 15 20 25 30 5 10 15 20 25 30
CHANNEL NUMBER CHANNEL NUMBER CHANNEL NUMBER
Figure 13 Mass Spectra Showing the Relatively Large He++ Fluxes in the L=40-45 Region During Injection Phase of the 29 July 1977 Magnetic Storm
-19shy
LMSCD673774
peaks are easily identified and are comparable with or larger than the He+
intensities The energy distributions for H+ 0+ and He averaged over
the region L=4-6 are shown in Figure 14 The 0+ spectrum is significantly
softer than the H+ and He++ spectrums which may indicate a different source
region for the 0+ fluxes than for most of the H+ fluxes
The percentage of the H+ fluxes found for the 0+ and He++ fluxes
over the energy range of the instrument is shown in Figure 15 In the
range L=4-7 the He++ is seen to be about 1-2 percent of the H+ The
relatively high He++H+ and He++He + ratios are incompatible with the
ionosphere being the origin of He++ [Young et al 1977] and thus it is
concluded that the He++ ions are of solar wind origin (see Section 5 for
discussion)
-20shy
S3-3 REV 3119 29 JULY 1977
o7 _ + L 40-60
10
100 In
105_
U X
z ib4 _H
10
10O4 10 ENERGY (keVQ) v
++ Figure 14 Energy Distributions of H He and 0+ Fluxes During the
Injection Phase of the 29 July 1977 Magnetic Storm
15
14 S3-3 REV 3119 29 JULY 1977
0+
12 0
X -1-03 + -9
U-
+ -2 He++
08
C4
LU S6shy
4 +
He
30 40 50 60 L
Figure 15 0+ and He++ Fluxes Relativeto the Ht Fluxes During the Injection Phase of the 29 July 1977 Manetic Storm
70
LMSCD673774
SECTION 3
15 FEBRUARY 1978 MAGNETIC STORM
In the process of surveying data from magnetic stroms that might
be suitable for more concentrated investigations as part of the IMS
relatively large fluxes of He++ ions were also observed on REV 4773
during the injection phase of the 15 February 1978 magnetic storm
DST for this storm peaked at -188 at 1266 hour and the data for REV 4773
were acquired about 2 hours prior to the peak when DST was -83y
A survey plot of the data from REV 4773 in the L-shell range 4 to 7
is shown in Figure 16 The abscissa shows universal time (SYST) geoshy
graphic longitude (LON) geographic latitude (LAT) spacecraft altitude
(ALT) invariant geomagnetic latutude (ILA)and magnetic local time Theshy
four lowest panels show the logarithm of the counts per half-second
counting interval for the electron spectrometers with the lowest energy
being CMEA etc The panel labelled PITCH shows the pitch angle of the
look direction of the spectrometers The next four panels show the
logarithm of the counts from ions with MQ=124 and 16 summed once per
second from selected output channels from all three of the ion mass
spectrometers giving an approximate measure of the relative flux of the
relevant species The next three panels (CXA-l CXA-2 and CXA-3 show
the 32 point mass spectrums for each mass spectrometer at one of the
four energy steps (for each spectrometer) indicated by the short bars in
the discretes panel The energy step code is no bar for step 1 a
double bar for step 2 a single bar above the baseline for step 3 and a
single bar on the baseline for energy step 4 These steps correspond
-23shy
S3-3 REV 4T73
15FE8RUARYIg9E
con -2 -h A
CMEC
51 6 1 0 6 I$1 r60
Figue 16 Survey Plot of Ion and Electron Data from the S3-3 Satellite Durinq the Injection Phase of
the 15 February 1978 Magnetic Storm
S 4 8 9 61 4 4 0 S0~43 114-~1
V ON646611
LMSCD673774
sequentially to the four energies for each spectrometer as discussed
in the Introduction
Two characteristics of the data particularly relevant to this report
are evident in Figure 16 Large upward streaming conical distributions
of 0+ ions (and some H+ ions) are seen in the time interval between
101749 and 102149 Also by comparing the MQ=2 (He++ ) response with
the MQ=l (He+ ) response in the time interval 101749 to 102549 and by
looking at the mass spectrums in this interval evidence for significant
He++ ions is found Most of the MQ=l and MQ=2 response in the-time
interval between 101349 and 101749 is due to background counts which
has been determined by detailed analysis of the responses between the peaks
in the mass spectrums Examples of the mass spectrums when summed over
the energy steps for each spectrometer in the range L=4-7 are shown in
Figure 17 The relatively large He He flux ratios should be noted
Figure 18 shows the He++ percentage of the H+ flux in the energy range of
the instrument and the He++iH+ ratio of the average phase space density
over the same measured velocity ranges (05-8 keVQ for H+ and 10 to 16 keV
Q for He+) These relatively high values are compatible with solar wind
origin for the He+ + ions and are incompatible with ionospheric origin for
the He++ ions Also it is seen that significant He+ + fluxes are measurable
as low as L=39 Large background counts limit the sensitivity to He++
ions below L=39
-25shy
S3-3 REV 4473 15 FEBRUARY 1978
1000shy+
0 E = 05- 128 keV E 176-45keV E = 62- 160 keV H
X 025 800 0+ -0
0 +
Z 600 He4
H+0 e 02
4- X025
X 025r a 400- 4-4 H ++ + -+
H He HeHe U He He
200 1 1
5 10 15 20 25 30 5 10 15 20 25 30 5 10 15 20 25 30 CHANNEL NUMBER
Figure 17 Mass Spectrums Showing the Relatively Large He++ Ion Fluxes in the L=4-7 Region During
the Injection Phase of the 15 February 1978 Magnetic Storm
14 S3-3 REV 4773 15 FEBRUARY 1978
12
10 0
-UL Ut
z U-U
-0
LO U
0
i~ LU
2 2 0 0
30 40 50
L
-60 70
Figure 18 The He++ Percentage of the H+ Flux and the He H+ Ratio of Average Phase Space Density During the Injection Phase of the 15 February 1978-Magnetic Storm
LMSCD673774
SECTION 4
GEOMAGNETIC STORMS FOR IMS
In support of the International Magnetospheric Workshops at Innsbruck
Austria in June 1978 preliminary ion composition data from four magnetic
storms were prepared and presented These storms were on 29 July 1977
23 September 1977 2 December 1977 and 11 December 1977 Except for the
29 July storm further analysis of these events has not been pursued
under this program The Workshops were held to present preliminary IMS
data and then to select some time periods for more detailed study The
time periods selected for the mdre detailed IMS studies were associated
with the 2 December storm as the primary event and the 1I December storm
as the secondary event
Moderately good data coverage for the 2 and 11 December storms was
obtained with the S3-3 spacecraft in the ring current regions in the
midnight sector DST and the general location of S3-3 data acquisitions
for these storms are shown in Figures 19 and 20 TFor each storm data
are acquired during the injection phase within 3 hours of-the peak of the
main phase and during the recovery phase
Three examples of the data during orbit revolutions (REV) 4151 4153
and 4156 from the 2 December storm are shown in Figures 21 22 and 23 for
the inner (Llt4) ring current regions The data are in the same format as
for Figure 16 The data from REV 4151 seen in Figure 21 were acquired during
the injection phase when DST was approximately half of its peak value
-28shy
S3-3 COVERAGE
04
20 gt gt gt gt gt gt gt -20- t Lid LU LIILi
-40t
-60
-80shy
-100shy
-120shy
0bull 6 12 18 24 6 12 18 24
2 DEC 1977 UT (HOURS) 3 DEC 1977
Fiiure 19 Distribution of the S3-3 Satellite Data Acquisitions During the 2 December 1977 Magnetic Storm -29shy
S3-3 COVERAGE
-0 7 0 O 0
(N C1 M
C- CN (vO CN CNI
Mf COi C11
-20 114gtILU gtLLU
ICt gtLU
1-t gtLUt gt
LLI
CtT gt LU
t gt LU
c4 gt LL4
-40o -v v
-60shy
I I I I 1 -100 -
-120 -shy
06 6 12 18 24 6 2 is 24
71DEC 1977 UT (HOURS) 12 DEC 1977
Fig-ure 20 Distribution of the S33 Satellite Data Acquisitions During the 11 December 1977 Magnetic Storm
-30shy
L L LILI 1711
CXR-2
CXF4-3 8 2
P-
HH CMEB i
CMEDC-
SYST 0337i3
LON 30305 LA -54q2 ALT 733273 ILA 5970 ALT 2372
Figure 21
-
0538 13 033913 03 3-0 0341 113 042plusmn33 033 3shy30238 30173 30 10 300118 2998 29928 29870 29813-5334 -5226 -5117 -9007 -4896 -4783 98 70 -955
728572 7M3608 718383 712890 707135 7701117 694 36 688292 5909 588 5786 5725 5663 5601 5539 4 78 2371 2369 2388 2367 2366 2365 5236 2363
SurveyPlot of S3-3 Ion and Election Data During the Injection Phase of the 2 December 1977 Magnetic Storm
$ - shy
CXA-2
CX-3
-IMO=
PI~ICrA A A VV v -V v o bullV o bull V bullVVV bullV o V bull V bull bull V v
CHEB
CMEC
StST 093833 093933 091033 09q1133 0941233 09333 091133 094533 094633 LON 20848 20795 20742 20691 206 39 20588 20538 20488 - 201139 LAT -098 -3976 -3853 -3728 -3602 -3473 -333 -3211 -3077ALT 65865W 650768 612621 634219 625555 616632 607q51 59801q 588321 ILA 5723 5555 5586 5517 5446 5373 5300 5225 51S50 HLT 65 61 57 53 t9 45 1 37 33
00
Figure 22 Survey Plot of S3-3 Ion and Electron Data Near the Main Phase Peak of the 2 December 1977 Magnetic Storm
S3-3 REV 4156 N 2 DECEMBER 1977
CXA-2
IA -
PITCH shy
tHEA2r )rA A
CHER
sLsr 70330 163118 18321 8318 183418 6318 1836 to 183710 1838 18LON 7330 7281 7231 7182 7133 7085 7036 6988 69Z9LT -329 -2993 -2854 -Z713 -2569 -2I3 -271 -2122 -196 RS $8261 579339 56916s 5587qO I|SO 37151 519 92 51598 50961
5028 h79 61714 ILR 5678 583 S 86 5387 5287 s)86
HIT~~2 31231 31 31 310 2310 310 2310 2309
Figure 23 Survey Plot of S3-3 Ion and Electron Data During the Second Ring Current Injection Event of 2 December 1977 Magnetic Storm
LMSCD673774
Relatively large H+ fluxes compared to the 0+ are found at this phase
of the storm in the midnight sector The moderately large H+ fluxes
extend down to an invariant magnetic latitude (ILA) of about 557 (L=31)
During the next S3-3 data acquisition period (REV 4153) data are acquired
within 3 hours of the peak of DST These data for Llt35 are seen in
Figure 22 The 0+ fluxes are now found to be comparable to the H+ fluxes
and extend down to an invariant latitude of 53 (L=28) Data shown in
Figure 23 from REV 4156 were acquired during a second ring current injection
and the ion composition can be seen by pomparison with Figure 21 to be
quite different from the first injection event The 0+ flux is comparable
+to the H+ flux and evidence for He ions can be seen in the CXA-3 mass
plot and in the MQ=4 response plot
An example of data during the main phase of the 11 December storm is
shown in Figure 24 primarily toindicate evidence for a pitch angle scattering
process that is ion mass selective This can be seen in Figure 24 by
comparing the MQ=l response the MQ=16 response and the pitch angle
(PITCH) of the instrument look direction in the time period from 120022 to
120530 Loss cones for the H+ ions in this region are generally well
developed in both directions along the magnetic field whereas for the
0+ ions the loss cone region near 00 pitch angle (instrument pointed upward)
contains high fluxes and in some regions nearly isotropic fluxes At
this stage of analysis of these types of events it appears likely that
strong pitch angle scattering is occurring above the satellite for the
0+ ions but not for the H+ ions The precipitation of these large fluxes
of 0+ ions down to 560 magnetic latitude is expected to produce strong
heating at F-region altitudes Coordinated IMS investigations of this event
11 - ii DECEM BER 1977
CXP-2
CXa=2 A A A A AoA TTvw
IlE
P4EI
CHEC r-v-An--v---n
CMED 8I 7shy$5T 1200 I 0l 0ION 16660 166052 20222 1 0322 -120q16550 16495 2 j 5t22 1206221644 16389 16336 1 0722 I108216283 16231 Lnr -3919 -38l -3670 -3527 -338 -3232 -308 -2926 -2A~r 579507 5C9337 558915 5118245 537328 526168 514768 503132 (J26ILA 6015HLr 10 592105 582G 57 28 LG 7 55242o0 394 2390 2385 51118 5310 51922380 375 2371 tf
L O N 1 6 6 0 0 6 2
Figure 24 Surve Plot of 3-3 Ion and Electron Data Duringthe Main Phase ifthe 11 December 1977-CC
Magnetic Storm Large Fluxes of Precipitating 0 Ions Are Observed from 120022 toshy
120430 UT
LMSCD673774
could contribute to a better understanding of this energy disipation
in the upper atmosphere and ionosphere
The data from REV 4228 shown in Figure 24 were acquired at the peak
of the main phase of the storm The large 0+ fluxes observed throughout
the L=shell region from 27 to 40 (ILA=53-600 ) indicate that the
ionosphere is a significant contributor to the ring current fluxes in the
energy range from 05 to 16 keV
For the 2 and 11 December storms preliminary information was also
presented at the IMS Workshop at Innsbruch Austria on the location of
the dayside cusp the inner edge of the ring current and the polar cap
boundary as determined from the ion composition experiment on the S3-3
spacecraft
-36shy
LMSCD673774
SECTION 5
DISCUSSION AND CONCLUSIONS
Although the dynamic nature and local time assymetries of the ring
current during- the main phase of a magnetic storm make storm-to-storm
comparisons difficult some similarities between data taken near the
peaks of the main phases of the storms on 29 July 1977 and on 29 December
1976 are noteworthy The magnetic local time for the 29 July 1977 data
is near 0500 hours and for the 29 December 1976 data is near 0200 hours
As seen in Figure 5 the average energy distributions for the 0+ ions in
both storms are significantly softer than for the H+ ions in the L=3-4
range This was true at this time at all L-values below 60 for the
29 July storm as seen in Figure 6 This perhaps is indicative of different
source regions for the 0+ and H+ ions at this local time and phase of the
storm In addition as seen in Figure 4 the O number density significantly
exceeds the H+ number density within the instrument energy range near the
inner edge of the ring current in both of the storms A similar trend for
the precipitating fluxes also observed in the local morning sector during
the 17-18 December 1971 magnetic storms has been reported by Sharp et al
1976 Thus it appears that this is at least a commonly occurring feature
during the main phase of storms in the local morning sector
As noted in Section 2 the data on the average ion energies presented
in Figures 6 7 and 8 for the 29 July 1977 storm show a rather dramatic
drop in the average 0+ ion energies in the region of L=4-5 This is
just the region of upstreaming low energy 0+ ions seen in Figure 12 during
the injection phase of the storm These ions are at sufficiently high
pitch angles to be trapped and in a few cases in Figure 12 downward moving
LMSCD673774
trapped 0+ ions are also seen Trapped energetic elections are observed
at higher L-values on this same pass strongly indicating that the
upward flowing 0 ions are on closed field lines and thus are becoming a
part of the ring current at these low L-shells This mechanism of direct
injection of low energy ionospheric ions into the ring current at low
L-shells can then account for the low average 0+ energies in the L=4-5
regions observed in the data presented in Figures 6 7 and 8 The fact
that upstreaming ions are not observed in the L=4-5 regions for REV 3120
and 3121 could result from temporal or local time variations
This mechanism of direct injection of ionospheric ions into the ring
current at low L-shells is also supported by the S3-3 observations prior
to the main phase peak of the 15 February 1978 storm As noted earlier and
as seen in Figure 16 upward flowing conical distributions of 0+ and H+
ions are observed The most prominent upward flowing ions are in the L=45
to 51 region and are at trapped pitch angles Again trapped energetic
elections -are observed at higher L-shells strongly indicating that the
upward flowing 0 + ions are on closed field lines
The large fluxes of 0 + ions observed in the ring current during
the magnetic storms discussed in this report and during storms previously
reported on [Johnson etal 1979 and Geiss et al 1979] show that
the ionosphere is a major contributor to the ring current ions in the
energy range of the S3-3 satellite measurements (05-16 keV) The
contribution of solar wind ions to the ring current during magnetic storms
can be assessed from observations of the ratios of the He++H+ and He++
He+ intensities since the He++H+ flux ratio in the solar wind is
+relatively large (typically about 5 x 10⁻²) whereas the He++H and He++
LMSCID673774
He+ flux ratios for the ionospheric components found inthe outer
-magnetosphere by Young et al (1977) are relatively small (-10 3 and
-10-2 respectively)
For the 15 February 1978 magnetic storm it can be seen from Figure 18
that the He++H+ flux and phase space density ratios in the L=4-6 region
are typically greater than 10-2 and from Figure 17 that the He++He+ flux
ratio will be greater than 10 in a comparable L-shell region These
ratios are consistent with solar wind origin and inconsistent with ionoshy
spheric origin for the He ions
For the 29 July 1977 storm the He H+flux ratios as seen in Figure 15 are typically 1-2 x 10⁻² in the L=4-7 region The He++ fluxes
inthe L=40 to 45 region can be seen from Figure 13 to be comparable to
or larger than the He+ fluxes These data are also consistent with solar
wind origin but not with ionospheric origin for the He ions
The preliminary investigations of the 2 and 11 December 1977 magnetic
storms support the conclusions of the IMS Steering Committee that these
storms are good candidates for detailed and coordinated investigations by
the IMS community From the point of view of ring current composition they
appear to exhibit some interesting and perhaps unique composition features
for which adequate data exist to merit detailed analysis
-39shy
LMSCD673774
SECTION 6
REFERENCES
Geiss J H Balsiger P Eberhardt HP Walker L Weber D T Young and H Rosenbauer Dynamics of Magnetospheric ions as observed by the GEOS Mass Spectrometer Proceedings of the 13th ESLAB Symposium Innsbruch Austria June 5-7 1978 Space Science Reviews in press
Ghielmetti A G R G Johnson R D Sharp and E G Shelley The Latitude Diurnal and Altitudinal Distributions of Upward Flowing Energetic Ions of Ionospheric Origin Geophys Res Lett 5 59 1978
Johnson R G R D Sharp and E G Shelley Observation of Ions of Ionoshyspheric Origin in the Storm-Time Ring Current Geophys Res Lett 4 403 1977
Johnson R G W Lennartson R D Sharp E G Shelley and H Balsiger The Composition of the Near Equatorial Ring Current During the December 11 1977 Magnetic Storm EDS 59 1163 1978
Reed R D E G Shelley J C Bakke T C Sanders and J D McDaniel A Low-Energy Channel-Multiplier Spectrometer for ATS-E IEEE Trans Nucl Sci NS-16 259 1969
Sharp R D R G Johnson and E G Shelley The Morphology of Energetic 0+ Ions During Two Magnetic Storms Latitudinal Variations J GeophysRes 81 3292 1976
Shelley E G R G Johnson and R D Sharp Satellite Observations of Energetic Heavy Ions During a Geomagnetic Storm J Geophys Res 77 6104 1972
Shelley E G R D Sharp and R G Johnson Satellite Observations of an Ionospheric Acceleration Mechanism Geophys Res Lett 3 654 1976
Young D T J Geiss H Balsiger P Eberhardt A Ghielmetti and H Rosenbauer Discovery of He2+ and 02+ ions of Terrestrial Origin in the Outer Magnetosphere Geophys Res Lett 4 561 1977

LMSCD673774
SECTION 2
29 JULY 1977 MAGNETIC STORM
Excellent data coverage near apogee of the S3-3 satellite was
obtained throughout the magnetic storm on 29 July 1977 Satellite apogee
was in the local time-sector near 0500 hours and the ring current data
presented here were-obtained at altitudes in the range 7000-8000 km A
plot of Dst for this storm is shown in Figure 1 along with three other
storms of comparable magnetude which had been investigated earlier for
the ring current ion composition [JOhnson et al 1977] The peak of
main phase in each storm is seen to be about -100 y The very low and
nearly constant Dst for 3 days pr4or to the 29 July storm and the relatively
smooth transition to the peak of the main phase of the storm may make this
event a good one for more detailed study by the IMS community The S3-3
coverage for the main phase portion and for the early decay phase of the
29 July storm is shown in Figure 2 From this plot it can be seen that the
main phase was followed by a relatively rapid decay phase until about 1000
hours UT when a second enhancement of the ring current occurred A
large substorm which was widespread in local time was observed near 1200
hours in the ground-based magnetograms
Examples of the ion mass spectra in three different-energy ranges for two
different L-shell regions during REV 3120 near the peak of Dst (see Figure 2)
are shown in Figure 3 This shows thegood signal-to-background ratio
throughout the region L=258 to 40 The background counting rates were even
lower at the higher latitudes The region L=258-302 was near the inner
edge of the ring current fluxes and the relatively large 0+fluxes in all
-4shy
30 1 DEC 1976 JAN 1977
I--APRIL 1977 lt-100
0
APRIL 1977
-10O0 V
25 JULY 1977 3 0
Figure 1 DST for Four Magnetic Storms of Comparable Peak Intensities
-5shy
40
20
REV REV REV REV REV REV 0 - 3119 3120 3121 3122 3123 3124
-20
-40
-60
-80
S3-3 COVERAGE -100- LPARL ION COMPOSITIO DATA
29 JULY 1977
-120 J 2 4 6 8 10 12 14 16 18 20 22 24
UT HOURS 29 JULY 1977
Figure 2 The Location of S3-3 Satellite Co-verage During the 29 July 1977 Magnetic Storm
+ 29 JULY 1977 H+1000 29 JULY 1977 + 29 JULY 1977
L 258-30228 L -- 258-302 L 258-62-6302 800 E 05-128 E 176-45 E 62-160
0 H+ +in 600
H-kH +HH 0o400
20Het + He+F He+ H+
10 20 30 10 20 30 10 20 30 CHANNEL NUMBER CHANNEL NUMBER CHANNEL NUMBER
1000 29 JULY 1977 29 JULY 1977 H+ 29 JULY 1977 L - 30- 40 L - 30-40 H+800 30-40
E=05-128 E - 176 -45 E - 62-160 H7 600 H
00 o O+ 400 0
0 +200
10 20 30 10 20 30 10 20 30
CHANNEL NUMBER CHANNEL NUMBER CHANNEL NUMBER
Figure 3 Mass Spectra Near the Pbak DST During the 29 July 1977 Magnetic Storm
LMSCD673774
three energy regions can be seen In the region L=30-40 significantly
lower 0+ fluxes are observed particularly at the higher energies
The L-shell distribution of the 0+ andH + ion number densities in
- the instrument energy range 05-16 keV are shown for REV 3120 in Figure 4
Also shown are the dehsities observed with the same instrument in the local
morning sector (022 hours) during the 29 December 1976 magnetic storm
For the 29 July storm particularly large 0+H+ ratios are seen near the inner
edge of the ring current fluxes with variable but generally reduced values
in the ratio at the higher latitudes This general characteristic has also
been reported for ion fluxes precipitating from the 17-18 December 1971
magneticistorm [Sharp et al 1976)
Comparisons of the H+ and 0+ energy distributions in the region from
L=3 to 4 are seen in Figure 5 for the 29 July 1977 and 29 December 1976
storms Although differing in detail the spectral features for the two
storms are similar with the 0+ spectrums being significantly softer than
the H+ spectrums
To further investigate the average energy characteristics at different
times in the storm the average energy of the fluxes integrated over pitch
angles as a function of latitude was determined for each of the spacecraft
passes shown in Figure 2 These results are seen in Figure 6 through 11
One particular feature of the average energy data stands out in the first
thtee passes during the earlier portion of the storm This feature is the
pronounced dip in the average energy of$the fluxes in the region of L=4-45
For the three passes later in the storm shown in Figures 9 10 and 11 the
average energy characteristics were quite variable with no systematic trends
-8shy
SW4Oq oL4au6w 9L[ Jaeqwezoe 6Z pue LL6L RtO 63 aq 6utpno +
H puo A01 SL4SUao AxaqwnN tan6Lj +0
0Z
-or
Mt U
ootI 011
(a) REV 1397 (b) REV 3120 29 DECEMBER 1976 29 JULY 1977 075054 - 075454 063319 - 063943 L =305 -396 L=3 04 -3 95
L44
161 5010
510 00
10 EEG10 10 10 CO
ENRY(key) ENERGY (keV)
Figure 5 Energy Distributions for 0 and H+ Near the Peak of DST During the 29 July 1977 andST29 December 1976 Magnetic Storms
A = H
=
S3-3 REV 3119 29 JULY 197T
80
40 -
20shy
30 40 50 60 70
Figure 6 Average Energies of the 0 and H+ Ions During the Injection Phase of the 29 July 1977 Magnetic Storm
LO
-
10
8
6
4
9Wshy
2 $3-3 REV 3120 2 -29 JULY 1977
010
26 30 40 50 60 70
Figure 7 Average Energies of the 0+ and H ions Near the Peak of the Main Phase of the 29 July1977 Magnetic Storm
10
8
6gt
4
S3-3 REV 3121 29 JULY 1977
-0- 0+H6-
40 50 60 70 80 L
Figure 8 Average Energies of the 0+ and H+ Ions Three Hours After the Peak of the Main Phase oflthe29 July 197- Magnetic Storm
14
12
10
IL
6
4
29 JULY 19772
I10 60 7026 30 40 50
+ + s0eraScndr eki Figure 9 Average Energies of the 0 and H Ions Near aSecondary Peak in
0St During the Early Recovery Phase of the 29 duly 1977 Magnetic Storm
he ErlyST Duing
10
8
6N
4
S3-3 REV 3123 29 JULY 1977
2 -0- 0 + ~H
30 40 50 60 70 L
Figure 10 Average Energies of the 0+ and H+ Ions During the Early Recovery Phase of the 29 July 1977 Magnetic Storm
12
10
8
S3-3 REV 3124 S 29 JULY 1977
-0- 0 +
0 30 40 50 60 70 80
Figure 11 + +
Average Energiesof 0 and H 29 July 1977 Magnetic Storm
Ions During the Early Recovery Phase of the
LMSCD673774
in the average energy data being evident
Evidence for conical pitch angle distributions of 0+ ions was found in
the survey data for Revolution 3119 which was acquired(see Figure 2) during
the ring current build up Spin by spin plots of the-pitch angle distributions
at energies of 05 068 094 and 128 key for 9 successive spins between
L=405 and L=445 are shown in Figure 12 along with one spin at L=466
The loss cone regions between + 150 pitch angles is indicated by the cross
hatching The absence of upward streaming ions with fluxes peaked along
the field direction in this Northern hemisphere pass is evident -However
significant fluxes of upward flowing conical distributions are easily
identified along with weaker andless frequent fluxes of downward flowing
-conical distributions Locally mirroring (90) and predipitating (1650
1800) fluxes of 0+ ions are seen to be very low or absent at these lower
energies At energies above 2 keV-trapped and precipitating 0+ and H+
fluxes are observed in this same L-shell region No significant fluxes
of H+ ions with conical pitch angle distributions were observed in this
region Large spatial andor temperal variations in the upward flowing
conical fluxes can also be seen in a single scan through the pitch angle
range of the conical fluxes This is seen in Figure 12 at 13857 13872
13889 and 13905 seconds During the 54 seconds required for the pitch
angle scans from 600 to 00 to 600 the spacecraft traveled about 25 km Thus
spatial structures less than 25 km andor temporal changes in less than 6
seconds are associated with the conical pitch angle distributions
During REV 3119 significant fluxes of He++ were also observed at
L-shells greater than L=4 Examples of the mass spectrum for three energy
intervals in the range L=40-45 is shown in Figure 13 The He++ mass
-17shy
LMSCD673774
T = 13808 sec 20 LI
10 -29 JULY 1977 L=405
=UT 13825 sec 20 - 0 + IONS E=094 keV
10
100 E= 128 keV
= 0 xO LIT 13857 sec20
SUT = 13872 sec
20 E= 050 keV
1020 E=0613889esacSUT = = 0 9 4
10- iE keV0
LIT = 13905 sec
010 E- 128 keV
20 20 UT = 13921 sec-20 E = 068 keV
10
6 9 T= = 13937 sc20 - 1 E 050 keV
I08shy
30 - LIT = 1400 sec = 0 50 k e V (E b
20 - L = 466
10shy
180 150 120 90 60 30 0 30 60 90 120 150 180
PITCH ANGLE
Figure 12 Conical Pitch Angle Distributions observed During the Injection Phase of the 29 July 1977 Magnetic Storm
deg + REV 3119 REV 3119 REV 3119 L -40-45 L = 40- 45 L - 40-45
200 E - 05-128keV E 176-45keV E - 62-16OkeV
150 - 5 0+ + 1500 +
i15 150 5 0
z z 0 0 0 2500
0 +100 000 100 1000 I00 2000
He~+ He He + 150050 He 500 50 + 500 50 4 +1
eHe1000
5 10 5 20 25 0 1 5 10 15 20 25 30
0 5 10 15 20 25 30 5 10 15 20 25 30
CHANNEL NUMBER CHANNEL NUMBER CHANNEL NUMBER
Figure 13 Mass Spectra Showing the Relatively Large He++ Fluxes in the L=40-45 Region During Injection Phase of the 29 July 1977 Magnetic Storm
-19shy
LMSCD673774
peaks are easily identified and are comparable with or larger than the He+
intensities The energy distributions for H+ 0+ and He averaged over
the region L=4-6 are shown in Figure 14 The 0+ spectrum is significantly
softer than the H+ and He++ spectrums which may indicate a different source
region for the 0+ fluxes than for most of the H+ fluxes
The percentage of the H+ fluxes found for the 0+ and He++ fluxes
over the energy range of the instrument is shown in Figure 15 In the
range L=4-7 the He++ is seen to be about 1-2 percent of the H+ The
relatively high He++H+ and He++He + ratios are incompatible with the
ionosphere being the origin of He++ [Young et al 1977] and thus it is
concluded that the He++ ions are of solar wind origin (see Section 5 for
discussion)
-20shy
S3-3 REV 3119 29 JULY 1977
o7 _ + L 40-60
10
100 In
105_
U X
z ib4 _H
10
10O4 10 ENERGY (keVQ) v
++ Figure 14 Energy Distributions of H He and 0+ Fluxes During the
Injection Phase of the 29 July 1977 Magnetic Storm
15
14 S3-3 REV 3119 29 JULY 1977
0+
12 0
X -1-03 + -9
U-
+ -2 He++
08
C4
LU S6shy
4 +
He
30 40 50 60 L
Figure 15 0+ and He++ Fluxes Relativeto the Ht Fluxes During the Injection Phase of the 29 July 1977 Manetic Storm
70
LMSCD673774
SECTION 3
15 FEBRUARY 1978 MAGNETIC STORM
In the process of surveying data from magnetic stroms that might
be suitable for more concentrated investigations as part of the IMS
relatively large fluxes of He++ ions were also observed on REV 4773
during the injection phase of the 15 February 1978 magnetic storm
DST for this storm peaked at -188 at 1266 hour and the data for REV 4773
were acquired about 2 hours prior to the peak when DST was -83y
A survey plot of the data from REV 4773 in the L-shell range 4 to 7
is shown in Figure 16 The abscissa shows universal time (SYST) geoshy
graphic longitude (LON) geographic latitude (LAT) spacecraft altitude
(ALT) invariant geomagnetic latutude (ILA)and magnetic local time Theshy
four lowest panels show the logarithm of the counts per half-second
counting interval for the electron spectrometers with the lowest energy
being CMEA etc The panel labelled PITCH shows the pitch angle of the
look direction of the spectrometers The next four panels show the
logarithm of the counts from ions with MQ=124 and 16 summed once per
second from selected output channels from all three of the ion mass
spectrometers giving an approximate measure of the relative flux of the
relevant species The next three panels (CXA-l CXA-2 and CXA-3 show
the 32 point mass spectrums for each mass spectrometer at one of the
four energy steps (for each spectrometer) indicated by the short bars in
the discretes panel The energy step code is no bar for step 1 a
double bar for step 2 a single bar above the baseline for step 3 and a
single bar on the baseline for energy step 4 These steps correspond
-23shy
S3-3 REV 4T73
15FE8RUARYIg9E
con -2 -h A
CMEC
51 6 1 0 6 I$1 r60
Figue 16 Survey Plot of Ion and Electron Data from the S3-3 Satellite Durinq the Injection Phase of
the 15 February 1978 Magnetic Storm
S 4 8 9 61 4 4 0 S0~43 114-~1
V ON646611
LMSCD673774
sequentially to the four energies for each spectrometer as discussed
in the Introduction
Two characteristics of the data particularly relevant to this report
are evident in Figure 16 Large upward streaming conical distributions
of 0+ ions (and some H+ ions) are seen in the time interval between
101749 and 102149 Also by comparing the MQ=2 (He++ ) response with
the MQ=l (He+ ) response in the time interval 101749 to 102549 and by
looking at the mass spectrums in this interval evidence for significant
He++ ions is found Most of the MQ=l and MQ=2 response in the-time
interval between 101349 and 101749 is due to background counts which
has been determined by detailed analysis of the responses between the peaks
in the mass spectrums Examples of the mass spectrums when summed over
the energy steps for each spectrometer in the range L=4-7 are shown in
Figure 17 The relatively large He He flux ratios should be noted
Figure 18 shows the He++ percentage of the H+ flux in the energy range of
the instrument and the He++iH+ ratio of the average phase space density
over the same measured velocity ranges (05-8 keVQ for H+ and 10 to 16 keV
Q for He+) These relatively high values are compatible with solar wind
origin for the He+ + ions and are incompatible with ionospheric origin for
the He++ ions Also it is seen that significant He+ + fluxes are measurable
as low as L=39 Large background counts limit the sensitivity to He++
ions below L=39
-25shy
S3-3 REV 4473 15 FEBRUARY 1978
1000shy+
0 E = 05- 128 keV E 176-45keV E = 62- 160 keV H
X 025 800 0+ -0
0 +
Z 600 He4
H+0 e 02
4- X025
X 025r a 400- 4-4 H ++ + -+
H He HeHe U He He
200 1 1
5 10 15 20 25 30 5 10 15 20 25 30 5 10 15 20 25 30 CHANNEL NUMBER
Figure 17 Mass Spectrums Showing the Relatively Large He++ Ion Fluxes in the L=4-7 Region During
the Injection Phase of the 15 February 1978 Magnetic Storm
14 S3-3 REV 4773 15 FEBRUARY 1978
12
10 0
-UL Ut
z U-U
-0
LO U
0
i~ LU
2 2 0 0
30 40 50
L
-60 70
Figure 18 The He++ Percentage of the H+ Flux and the He H+ Ratio of Average Phase Space Density During the Injection Phase of the 15 February 1978-Magnetic Storm
LMSCD673774
SECTION 4
GEOMAGNETIC STORMS FOR IMS
In support of the International Magnetospheric Workshops at Innsbruck
Austria in June 1978 preliminary ion composition data from four magnetic
storms were prepared and presented These storms were on 29 July 1977
23 September 1977 2 December 1977 and 11 December 1977 Except for the
29 July storm further analysis of these events has not been pursued
under this program The Workshops were held to present preliminary IMS
data and then to select some time periods for more detailed study The
time periods selected for the mdre detailed IMS studies were associated
with the 2 December storm as the primary event and the 1I December storm
as the secondary event
Moderately good data coverage for the 2 and 11 December storms was
obtained with the S3-3 spacecraft in the ring current regions in the
midnight sector DST and the general location of S3-3 data acquisitions
for these storms are shown in Figures 19 and 20 TFor each storm data
are acquired during the injection phase within 3 hours of-the peak of the
main phase and during the recovery phase
Three examples of the data during orbit revolutions (REV) 4151 4153
and 4156 from the 2 December storm are shown in Figures 21 22 and 23 for
the inner (Llt4) ring current regions The data are in the same format as
for Figure 16 The data from REV 4151 seen in Figure 21 were acquired during
the injection phase when DST was approximately half of its peak value
-28shy
S3-3 COVERAGE
04
20 gt gt gt gt gt gt gt -20- t Lid LU LIILi
-40t
-60
-80shy
-100shy
-120shy
0bull 6 12 18 24 6 12 18 24
2 DEC 1977 UT (HOURS) 3 DEC 1977
Fiiure 19 Distribution of the S3-3 Satellite Data Acquisitions During the 2 December 1977 Magnetic Storm -29shy
S3-3 COVERAGE
-0 7 0 O 0
(N C1 M
C- CN (vO CN CNI
Mf COi C11
-20 114gtILU gtLLU
ICt gtLU
1-t gtLUt gt
LLI
CtT gt LU
t gt LU
c4 gt LL4
-40o -v v
-60shy
I I I I 1 -100 -
-120 -shy
06 6 12 18 24 6 2 is 24
71DEC 1977 UT (HOURS) 12 DEC 1977
Fig-ure 20 Distribution of the S33 Satellite Data Acquisitions During the 11 December 1977 Magnetic Storm
-30shy
L L LILI 1711
CXR-2
CXF4-3 8 2
P-
HH CMEB i
CMEDC-
SYST 0337i3
LON 30305 LA -54q2 ALT 733273 ILA 5970 ALT 2372
Figure 21
-
0538 13 033913 03 3-0 0341 113 042plusmn33 033 3shy30238 30173 30 10 300118 2998 29928 29870 29813-5334 -5226 -5117 -9007 -4896 -4783 98 70 -955
728572 7M3608 718383 712890 707135 7701117 694 36 688292 5909 588 5786 5725 5663 5601 5539 4 78 2371 2369 2388 2367 2366 2365 5236 2363
SurveyPlot of S3-3 Ion and Election Data During the Injection Phase of the 2 December 1977 Magnetic Storm
$ - shy
CXA-2
CX-3
-IMO=
PI~ICrA A A VV v -V v o bullV o bull V bullVVV bullV o V bull V bull bull V v
CHEB
CMEC
StST 093833 093933 091033 09q1133 0941233 09333 091133 094533 094633 LON 20848 20795 20742 20691 206 39 20588 20538 20488 - 201139 LAT -098 -3976 -3853 -3728 -3602 -3473 -333 -3211 -3077ALT 65865W 650768 612621 634219 625555 616632 607q51 59801q 588321 ILA 5723 5555 5586 5517 5446 5373 5300 5225 51S50 HLT 65 61 57 53 t9 45 1 37 33
00
Figure 22 Survey Plot of S3-3 Ion and Electron Data Near the Main Phase Peak of the 2 December 1977 Magnetic Storm
S3-3 REV 4156 N 2 DECEMBER 1977
CXA-2
IA -
PITCH shy
tHEA2r )rA A
CHER
sLsr 70330 163118 18321 8318 183418 6318 1836 to 183710 1838 18LON 7330 7281 7231 7182 7133 7085 7036 6988 69Z9LT -329 -2993 -2854 -Z713 -2569 -2I3 -271 -2122 -196 RS $8261 579339 56916s 5587qO I|SO 37151 519 92 51598 50961
5028 h79 61714 ILR 5678 583 S 86 5387 5287 s)86
HIT~~2 31231 31 31 310 2310 310 2310 2309
Figure 23 Survey Plot of S3-3 Ion and Electron Data During the Second Ring Current Injection Event of 2 December 1977 Magnetic Storm
LMSCD673774
Relatively large H+ fluxes compared to the 0+ are found at this phase
of the storm in the midnight sector The moderately large H+ fluxes
extend down to an invariant magnetic latitude (ILA) of about 557 (L=31)
During the next S3-3 data acquisition period (REV 4153) data are acquired
within 3 hours of the peak of DST These data for Llt35 are seen in
Figure 22 The 0+ fluxes are now found to be comparable to the H+ fluxes
and extend down to an invariant latitude of 53 (L=28) Data shown in
Figure 23 from REV 4156 were acquired during a second ring current injection
and the ion composition can be seen by pomparison with Figure 21 to be
quite different from the first injection event The 0+ flux is comparable
+to the H+ flux and evidence for He ions can be seen in the CXA-3 mass
plot and in the MQ=4 response plot
An example of data during the main phase of the 11 December storm is
shown in Figure 24 primarily toindicate evidence for a pitch angle scattering
process that is ion mass selective This can be seen in Figure 24 by
comparing the MQ=l response the MQ=16 response and the pitch angle
(PITCH) of the instrument look direction in the time period from 120022 to
120530 Loss cones for the H+ ions in this region are generally well
developed in both directions along the magnetic field whereas for the
0+ ions the loss cone region near 00 pitch angle (instrument pointed upward)
contains high fluxes and in some regions nearly isotropic fluxes At
this stage of analysis of these types of events it appears likely that
strong pitch angle scattering is occurring above the satellite for the
0+ ions but not for the H+ ions The precipitation of these large fluxes
of 0+ ions down to 560 magnetic latitude is expected to produce strong
heating at F-region altitudes Coordinated IMS investigations of this event
11 - ii DECEM BER 1977
CXP-2
CXa=2 A A A A AoA TTvw
IlE
P4EI
CHEC r-v-An--v---n
CMED 8I 7shy$5T 1200 I 0l 0ION 16660 166052 20222 1 0322 -120q16550 16495 2 j 5t22 1206221644 16389 16336 1 0722 I108216283 16231 Lnr -3919 -38l -3670 -3527 -338 -3232 -308 -2926 -2A~r 579507 5C9337 558915 5118245 537328 526168 514768 503132 (J26ILA 6015HLr 10 592105 582G 57 28 LG 7 55242o0 394 2390 2385 51118 5310 51922380 375 2371 tf
L O N 1 6 6 0 0 6 2
Figure 24 Surve Plot of 3-3 Ion and Electron Data Duringthe Main Phase ifthe 11 December 1977-CC
Magnetic Storm Large Fluxes of Precipitating 0 Ions Are Observed from 120022 toshy
120430 UT
LMSCD673774
could contribute to a better understanding of this energy disipation
in the upper atmosphere and ionosphere
The data from REV 4228 shown in Figure 24 were acquired at the peak
of the main phase of the storm The large 0+ fluxes observed throughout
the L=shell region from 27 to 40 (ILA=53-600 ) indicate that the
ionosphere is a significant contributor to the ring current fluxes in the
energy range from 05 to 16 keV
For the 2 and 11 December storms preliminary information was also
presented at the IMS Workshop at Innsbruch Austria on the location of
the dayside cusp the inner edge of the ring current and the polar cap
boundary as determined from the ion composition experiment on the S3-3
spacecraft
-36shy
LMSCD673774
SECTION 5
DISCUSSION AND CONCLUSIONS
Although the dynamic nature and local time assymetries of the ring
current during- the main phase of a magnetic storm make storm-to-storm
comparisons difficult some similarities between data taken near the
peaks of the main phases of the storms on 29 July 1977 and on 29 December
1976 are noteworthy The magnetic local time for the 29 July 1977 data
is near 0500 hours and for the 29 December 1976 data is near 0200 hours
As seen in Figure 5 the average energy distributions for the 0+ ions in
both storms are significantly softer than for the H+ ions in the L=3-4
range This was true at this time at all L-values below 60 for the
29 July storm as seen in Figure 6 This perhaps is indicative of different
source regions for the 0+ and H+ ions at this local time and phase of the
storm In addition as seen in Figure 4 the O number density significantly
exceeds the H+ number density within the instrument energy range near the
inner edge of the ring current in both of the storms A similar trend for
the precipitating fluxes also observed in the local morning sector during
the 17-18 December 1971 magnetic storms has been reported by Sharp et al
1976 Thus it appears that this is at least a commonly occurring feature
during the main phase of storms in the local morning sector
As noted in Section 2 the data on the average ion energies presented
in Figures 6 7 and 8 for the 29 July 1977 storm show a rather dramatic
drop in the average 0+ ion energies in the region of L=4-5 This is
just the region of upstreaming low energy 0+ ions seen in Figure 12 during
the injection phase of the storm These ions are at sufficiently high
pitch angles to be trapped and in a few cases in Figure 12 downward moving
LMSCD673774
trapped 0+ ions are also seen Trapped energetic elections are observed
at higher L-values on this same pass strongly indicating that the
upward flowing 0 ions are on closed field lines and thus are becoming a
part of the ring current at these low L-shells This mechanism of direct
injection of low energy ionospheric ions into the ring current at low
L-shells can then account for the low average 0+ energies in the L=4-5
regions observed in the data presented in Figures 6 7 and 8 The fact
that upstreaming ions are not observed in the L=4-5 regions for REV 3120
and 3121 could result from temporal or local time variations
This mechanism of direct injection of ionospheric ions into the ring
current at low L-shells is also supported by the S3-3 observations prior
to the main phase peak of the 15 February 1978 storm As noted earlier and
as seen in Figure 16 upward flowing conical distributions of 0+ and H+
ions are observed The most prominent upward flowing ions are in the L=45
to 51 region and are at trapped pitch angles Again trapped energetic
elections -are observed at higher L-shells strongly indicating that the
upward flowing 0 + ions are on closed field lines
The large fluxes of 0 + ions observed in the ring current during
the magnetic storms discussed in this report and during storms previously
reported on [Johnson etal 1979 and Geiss et al 1979] show that
the ionosphere is a major contributor to the ring current ions in the
energy range of the S3-3 satellite measurements (05-16 keV) The
contribution of solar wind ions to the ring current during magnetic storms
can be assessed from observations of the ratios of the He++H+ and He++
He+ intensities since the He++H+ flux ratio in the solar wind is
+relatively large (typically about 5 x 10⁻²) whereas the He++H and He++
LMSCID673774
He+ flux ratios for the ionospheric components found inthe outer
-magnetosphere by Young et al (1977) are relatively small (-10 3 and
-10-2 respectively)
For the 15 February 1978 magnetic storm it can be seen from Figure 18
that the He++H+ flux and phase space density ratios in the L=4-6 region
are typically greater than 10-2 and from Figure 17 that the He++He+ flux
ratio will be greater than 10 in a comparable L-shell region These
ratios are consistent with solar wind origin and inconsistent with ionoshy
spheric origin for the He ions
For the 29 July 1977 storm the He H+flux ratios as seen in Figure 15 are typically 1-2 x 10⁻² in the L=4-7 region The He++ fluxes
inthe L=40 to 45 region can be seen from Figure 13 to be comparable to
or larger than the He+ fluxes These data are also consistent with solar
wind origin but not with ionospheric origin for the He ions
The preliminary investigations of the 2 and 11 December 1977 magnetic
storms support the conclusions of the IMS Steering Committee that these
storms are good candidates for detailed and coordinated investigations by
the IMS community From the point of view of ring current composition they
appear to exhibit some interesting and perhaps unique composition features
for which adequate data exist to merit detailed analysis
-39shy
LMSCD673774
SECTION 6
REFERENCES
Geiss J H Balsiger P Eberhardt HP Walker L Weber D T Young and H Rosenbauer Dynamics of Magnetospheric ions as observed by the GEOS Mass Spectrometer Proceedings of the 13th ESLAB Symposium Innsbruch Austria June 5-7 1978 Space Science Reviews in press
Ghielmetti A G R G Johnson R D Sharp and E G Shelley The Latitude Diurnal and Altitudinal Distributions of Upward Flowing Energetic Ions of Ionospheric Origin Geophys Res Lett 5 59 1978
Johnson R G R D Sharp and E G Shelley Observation of Ions of Ionoshyspheric Origin in the Storm-Time Ring Current Geophys Res Lett 4 403 1977
Johnson R G W Lennartson R D Sharp E G Shelley and H Balsiger The Composition of the Near Equatorial Ring Current During the December 11 1977 Magnetic Storm EDS 59 1163 1978
Reed R D E G Shelley J C Bakke T C Sanders and J D McDaniel A Low-Energy Channel-Multiplier Spectrometer for ATS-E IEEE Trans Nucl Sci NS-16 259 1969
Sharp R D R G Johnson and E G Shelley The Morphology of Energetic 0+ Ions During Two Magnetic Storms Latitudinal Variations J GeophysRes 81 3292 1976
Shelley E G R G Johnson and R D Sharp Satellite Observations of Energetic Heavy Ions During a Geomagnetic Storm J Geophys Res 77 6104 1972
Shelley E G R D Sharp and R G Johnson Satellite Observations of an Ionospheric Acceleration Mechanism Geophys Res Lett 3 654 1976
Young D T J Geiss H Balsiger P Eberhardt A Ghielmetti and H Rosenbauer Discovery of He2+ and 02+ ions of Terrestrial Origin in the Outer Magnetosphere Geophys Res Lett 4 561 1977

LMSCD673774
three energy regions can be seen In the region L=30-40 significantly
lower 0+ fluxes are observed particularly at the higher energies
The L-shell distribution of the 0+ andH + ion number densities in
- the instrument energy range 05-16 keV are shown for REV 3120 in Figure 4
Also shown are the dehsities observed with the same instrument in the local
morning sector (022 hours) during the 29 December 1976 magnetic storm
For the 29 July storm particularly large 0+H+ ratios are seen near the inner
edge of the ring current fluxes with variable but generally reduced values
in the ratio at the higher latitudes This general characteristic has also
been reported for ion fluxes precipitating from the 17-18 December 1971
magneticistorm [Sharp et al 1976)
Comparisons of the H+ and 0+ energy distributions in the region from
L=3 to 4 are seen in Figure 5 for the 29 July 1977 and 29 December 1976
storms Although differing in detail the spectral features for the two
storms are similar with the 0+ spectrums being significantly softer than
the H+ spectrums
To further investigate the average energy characteristics at different
times in the storm the average energy of the fluxes integrated over pitch
angles as a function of latitude was determined for each of the spacecraft
passes shown in Figure 2 These results are seen in Figure 6 through 11
One particular feature of the average energy data stands out in the first
thtee passes during the earlier portion of the storm This feature is the
pronounced dip in the average energy of$the fluxes in the region of L=4-45
For the three passes later in the storm shown in Figures 9 10 and 11 the
average energy characteristics were quite variable with no systematic trends
-8shy
SW4Oq oL4au6w 9L[ Jaeqwezoe 6Z pue LL6L RtO 63 aq 6utpno +
H puo A01 SL4SUao AxaqwnN tan6Lj +0
0Z
-or
Mt U
ootI 011
(a) REV 1397 (b) REV 3120 29 DECEMBER 1976 29 JULY 1977 075054 - 075454 063319 - 063943 L =305 -396 L=3 04 -3 95
L44
161 5010
510 00
10 EEG10 10 10 CO
ENRY(key) ENERGY (keV)
Figure 5 Energy Distributions for 0 and H+ Near the Peak of DST During the 29 July 1977 andST29 December 1976 Magnetic Storms
A = H
=
S3-3 REV 3119 29 JULY 197T
80
40 -
20shy
30 40 50 60 70
Figure 6 Average Energies of the 0 and H+ Ions During the Injection Phase of the 29 July 1977 Magnetic Storm
LO
-
10
8
6
4
9Wshy
2 $3-3 REV 3120 2 -29 JULY 1977
010
26 30 40 50 60 70
Figure 7 Average Energies of the 0+ and H ions Near the Peak of the Main Phase of the 29 July1977 Magnetic Storm
10
8
6gt
4
S3-3 REV 3121 29 JULY 1977
-0- 0+H6-
40 50 60 70 80 L
Figure 8 Average Energies of the 0+ and H+ Ions Three Hours After the Peak of the Main Phase oflthe29 July 197- Magnetic Storm
14
12
10
IL
6
4
29 JULY 19772
I10 60 7026 30 40 50
+ + s0eraScndr eki Figure 9 Average Energies of the 0 and H Ions Near aSecondary Peak in
0St During the Early Recovery Phase of the 29 duly 1977 Magnetic Storm
he ErlyST Duing
10
8
6N
4
S3-3 REV 3123 29 JULY 1977
2 -0- 0 + ~H
30 40 50 60 70 L
Figure 10 Average Energies of the 0+ and H+ Ions During the Early Recovery Phase of the 29 July 1977 Magnetic Storm
12
10
8
S3-3 REV 3124 S 29 JULY 1977
-0- 0 +
0 30 40 50 60 70 80
Figure 11 + +
Average Energiesof 0 and H 29 July 1977 Magnetic Storm
Ions During the Early Recovery Phase of the
LMSCD673774
in the average energy data being evident
Evidence for conical pitch angle distributions of 0+ ions was found in
the survey data for Revolution 3119 which was acquired(see Figure 2) during
the ring current build up Spin by spin plots of the-pitch angle distributions
at energies of 05 068 094 and 128 key for 9 successive spins between
L=405 and L=445 are shown in Figure 12 along with one spin at L=466
The loss cone regions between + 150 pitch angles is indicated by the cross
hatching The absence of upward streaming ions with fluxes peaked along
the field direction in this Northern hemisphere pass is evident -However
significant fluxes of upward flowing conical distributions are easily
identified along with weaker andless frequent fluxes of downward flowing
-conical distributions Locally mirroring (90) and predipitating (1650
1800) fluxes of 0+ ions are seen to be very low or absent at these lower
energies At energies above 2 keV-trapped and precipitating 0+ and H+
fluxes are observed in this same L-shell region No significant fluxes
of H+ ions with conical pitch angle distributions were observed in this
region Large spatial andor temperal variations in the upward flowing
conical fluxes can also be seen in a single scan through the pitch angle
range of the conical fluxes This is seen in Figure 12 at 13857 13872
13889 and 13905 seconds During the 54 seconds required for the pitch
angle scans from 600 to 00 to 600 the spacecraft traveled about 25 km Thus
spatial structures less than 25 km andor temporal changes in less than 6
seconds are associated with the conical pitch angle distributions
During REV 3119 significant fluxes of He++ were also observed at
L-shells greater than L=4 Examples of the mass spectrum for three energy
intervals in the range L=40-45 is shown in Figure 13 The He++ mass
-17shy
LMSCD673774
T = 13808 sec 20 LI
10 -29 JULY 1977 L=405
=UT 13825 sec 20 - 0 + IONS E=094 keV
10
100 E= 128 keV
= 0 xO LIT 13857 sec20
SUT = 13872 sec
20 E= 050 keV
1020 E=0613889esacSUT = = 0 9 4
10- iE keV0
LIT = 13905 sec
010 E- 128 keV
20 20 UT = 13921 sec-20 E = 068 keV
10
6 9 T= = 13937 sc20 - 1 E 050 keV
I08shy
30 - LIT = 1400 sec = 0 50 k e V (E b
20 - L = 466
10shy
180 150 120 90 60 30 0 30 60 90 120 150 180
PITCH ANGLE
Figure 12 Conical Pitch Angle Distributions observed During the Injection Phase of the 29 July 1977 Magnetic Storm
deg + REV 3119 REV 3119 REV 3119 L -40-45 L = 40- 45 L - 40-45
200 E - 05-128keV E 176-45keV E - 62-16OkeV
150 - 5 0+ + 1500 +
i15 150 5 0
z z 0 0 0 2500
0 +100 000 100 1000 I00 2000
He~+ He He + 150050 He 500 50 + 500 50 4 +1
eHe1000
5 10 5 20 25 0 1 5 10 15 20 25 30
0 5 10 15 20 25 30 5 10 15 20 25 30
CHANNEL NUMBER CHANNEL NUMBER CHANNEL NUMBER
Figure 13 Mass Spectra Showing the Relatively Large He++ Fluxes in the L=40-45 Region During Injection Phase of the 29 July 1977 Magnetic Storm
-19shy
LMSCD673774
peaks are easily identified and are comparable with or larger than the He+
intensities The energy distributions for H+ 0+ and He averaged over
the region L=4-6 are shown in Figure 14 The 0+ spectrum is significantly
softer than the H+ and He++ spectrums which may indicate a different source
region for the 0+ fluxes than for most of the H+ fluxes
The percentage of the H+ fluxes found for the 0+ and He++ fluxes
over the energy range of the instrument is shown in Figure 15 In the
range L=4-7 the He++ is seen to be about 1-2 percent of the H+ The
relatively high He++H+ and He++He + ratios are incompatible with the
ionosphere being the origin of He++ [Young et al 1977] and thus it is
concluded that the He++ ions are of solar wind origin (see Section 5 for
discussion)
-20shy
S3-3 REV 3119 29 JULY 1977
o7 _ + L 40-60
10
100 In
105_
U X
z ib4 _H
10
10O4 10 ENERGY (keVQ) v
++ Figure 14 Energy Distributions of H He and 0+ Fluxes During the
Injection Phase of the 29 July 1977 Magnetic Storm
15
14 S3-3 REV 3119 29 JULY 1977
0+
12 0
X -1-03 + -9
U-
+ -2 He++
08
C4
LU S6shy
4 +
He
30 40 50 60 L
Figure 15 0+ and He++ Fluxes Relativeto the Ht Fluxes During the Injection Phase of the 29 July 1977 Manetic Storm
70
LMSCD673774
SECTION 3
15 FEBRUARY 1978 MAGNETIC STORM
In the process of surveying data from magnetic stroms that might
be suitable for more concentrated investigations as part of the IMS
relatively large fluxes of He++ ions were also observed on REV 4773
during the injection phase of the 15 February 1978 magnetic storm
DST for this storm peaked at -188 at 1266 hour and the data for REV 4773
were acquired about 2 hours prior to the peak when DST was -83y
A survey plot of the data from REV 4773 in the L-shell range 4 to 7
is shown in Figure 16 The abscissa shows universal time (SYST) geoshy
graphic longitude (LON) geographic latitude (LAT) spacecraft altitude
(ALT) invariant geomagnetic latutude (ILA)and magnetic local time Theshy
four lowest panels show the logarithm of the counts per half-second
counting interval for the electron spectrometers with the lowest energy
being CMEA etc The panel labelled PITCH shows the pitch angle of the
look direction of the spectrometers The next four panels show the
logarithm of the counts from ions with MQ=124 and 16 summed once per
second from selected output channels from all three of the ion mass
spectrometers giving an approximate measure of the relative flux of the
relevant species The next three panels (CXA-l CXA-2 and CXA-3 show
the 32 point mass spectrums for each mass spectrometer at one of the
four energy steps (for each spectrometer) indicated by the short bars in
the discretes panel The energy step code is no bar for step 1 a
double bar for step 2 a single bar above the baseline for step 3 and a
single bar on the baseline for energy step 4 These steps correspond
-23shy
S3-3 REV 4T73
15FE8RUARYIg9E
con -2 -h A
CMEC
51 6 1 0 6 I$1 r60
Figue 16 Survey Plot of Ion and Electron Data from the S3-3 Satellite Durinq the Injection Phase of
the 15 February 1978 Magnetic Storm
S 4 8 9 61 4 4 0 S0~43 114-~1
V ON646611
LMSCD673774
sequentially to the four energies for each spectrometer as discussed
in the Introduction
Two characteristics of the data particularly relevant to this report
are evident in Figure 16 Large upward streaming conical distributions
of 0+ ions (and some H+ ions) are seen in the time interval between
101749 and 102149 Also by comparing the MQ=2 (He++ ) response with
the MQ=l (He+ ) response in the time interval 101749 to 102549 and by
looking at the mass spectrums in this interval evidence for significant
He++ ions is found Most of the MQ=l and MQ=2 response in the-time
interval between 101349 and 101749 is due to background counts which
has been determined by detailed analysis of the responses between the peaks
in the mass spectrums Examples of the mass spectrums when summed over
the energy steps for each spectrometer in the range L=4-7 are shown in
Figure 17 The relatively large He He flux ratios should be noted
Figure 18 shows the He++ percentage of the H+ flux in the energy range of
the instrument and the He++iH+ ratio of the average phase space density
over the same measured velocity ranges (05-8 keVQ for H+ and 10 to 16 keV
Q for He+) These relatively high values are compatible with solar wind
origin for the He+ + ions and are incompatible with ionospheric origin for
the He++ ions Also it is seen that significant He+ + fluxes are measurable
as low as L=39 Large background counts limit the sensitivity to He++
ions below L=39
-25shy
S3-3 REV 4473 15 FEBRUARY 1978
1000shy+
0 E = 05- 128 keV E 176-45keV E = 62- 160 keV H
X 025 800 0+ -0
0 +
Z 600 He4
H+0 e 02
4- X025
X 025r a 400- 4-4 H ++ + -+
H He HeHe U He He
200 1 1
5 10 15 20 25 30 5 10 15 20 25 30 5 10 15 20 25 30 CHANNEL NUMBER
Figure 17 Mass Spectrums Showing the Relatively Large He++ Ion Fluxes in the L=4-7 Region During
the Injection Phase of the 15 February 1978 Magnetic Storm
14 S3-3 REV 4773 15 FEBRUARY 1978
12
10 0
-UL Ut
z U-U
-0
LO U
0
i~ LU
2 2 0 0
30 40 50
L
-60 70
Figure 18 The He++ Percentage of the H+ Flux and the He H+ Ratio of Average Phase Space Density During the Injection Phase of the 15 February 1978-Magnetic Storm
LMSCD673774
SECTION 4
GEOMAGNETIC STORMS FOR IMS
In support of the International Magnetospheric Workshops at Innsbruck
Austria in June 1978 preliminary ion composition data from four magnetic
storms were prepared and presented These storms were on 29 July 1977
23 September 1977 2 December 1977 and 11 December 1977 Except for the
29 July storm further analysis of these events has not been pursued
under this program The Workshops were held to present preliminary IMS
data and then to select some time periods for more detailed study The
time periods selected for the mdre detailed IMS studies were associated
with the 2 December storm as the primary event and the 1I December storm
as the secondary event
Moderately good data coverage for the 2 and 11 December storms was
obtained with the S3-3 spacecraft in the ring current regions in the
midnight sector DST and the general location of S3-3 data acquisitions
for these storms are shown in Figures 19 and 20 TFor each storm data
are acquired during the injection phase within 3 hours of-the peak of the
main phase and during the recovery phase
Three examples of the data during orbit revolutions (REV) 4151 4153
and 4156 from the 2 December storm are shown in Figures 21 22 and 23 for
the inner (Llt4) ring current regions The data are in the same format as
for Figure 16 The data from REV 4151 seen in Figure 21 were acquired during
the injection phase when DST was approximately half of its peak value
-28shy
S3-3 COVERAGE
04
20 gt gt gt gt gt gt gt -20- t Lid LU LIILi
-40t
-60
-80shy
-100shy
-120shy
0bull 6 12 18 24 6 12 18 24
2 DEC 1977 UT (HOURS) 3 DEC 1977
Fiiure 19 Distribution of the S3-3 Satellite Data Acquisitions During the 2 December 1977 Magnetic Storm -29shy
S3-3 COVERAGE
-0 7 0 O 0
(N C1 M
C- CN (vO CN CNI
Mf COi C11
-20 114gtILU gtLLU
ICt gtLU
1-t gtLUt gt
LLI
CtT gt LU
t gt LU
c4 gt LL4
-40o -v v
-60shy
I I I I 1 -100 -
-120 -shy
06 6 12 18 24 6 2 is 24
71DEC 1977 UT (HOURS) 12 DEC 1977
Fig-ure 20 Distribution of the S33 Satellite Data Acquisitions During the 11 December 1977 Magnetic Storm
-30shy
L L LILI 1711
CXR-2
CXF4-3 8 2
P-
HH CMEB i
CMEDC-
SYST 0337i3
LON 30305 LA -54q2 ALT 733273 ILA 5970 ALT 2372
Figure 21
-
0538 13 033913 03 3-0 0341 113 042plusmn33 033 3shy30238 30173 30 10 300118 2998 29928 29870 29813-5334 -5226 -5117 -9007 -4896 -4783 98 70 -955
728572 7M3608 718383 712890 707135 7701117 694 36 688292 5909 588 5786 5725 5663 5601 5539 4 78 2371 2369 2388 2367 2366 2365 5236 2363
SurveyPlot of S3-3 Ion and Election Data During the Injection Phase of the 2 December 1977 Magnetic Storm
$ - shy
CXA-2
CX-3
-IMO=
PI~ICrA A A VV v -V v o bullV o bull V bullVVV bullV o V bull V bull bull V v
CHEB
CMEC
StST 093833 093933 091033 09q1133 0941233 09333 091133 094533 094633 LON 20848 20795 20742 20691 206 39 20588 20538 20488 - 201139 LAT -098 -3976 -3853 -3728 -3602 -3473 -333 -3211 -3077ALT 65865W 650768 612621 634219 625555 616632 607q51 59801q 588321 ILA 5723 5555 5586 5517 5446 5373 5300 5225 51S50 HLT 65 61 57 53 t9 45 1 37 33
00
Figure 22 Survey Plot of S3-3 Ion and Electron Data Near the Main Phase Peak of the 2 December 1977 Magnetic Storm
S3-3 REV 4156 N 2 DECEMBER 1977
CXA-2
IA -
PITCH shy
tHEA2r )rA A
CHER
sLsr 70330 163118 18321 8318 183418 6318 1836 to 183710 1838 18LON 7330 7281 7231 7182 7133 7085 7036 6988 69Z9LT -329 -2993 -2854 -Z713 -2569 -2I3 -271 -2122 -196 RS $8261 579339 56916s 5587qO I|SO 37151 519 92 51598 50961
5028 h79 61714 ILR 5678 583 S 86 5387 5287 s)86
HIT~~2 31231 31 31 310 2310 310 2310 2309
Figure 23 Survey Plot of S3-3 Ion and Electron Data During the Second Ring Current Injection Event of 2 December 1977 Magnetic Storm
LMSCD673774
Relatively large H+ fluxes compared to the 0+ are found at this phase
of the storm in the midnight sector The moderately large H+ fluxes
extend down to an invariant magnetic latitude (ILA) of about 557 (L=31)
During the next S3-3 data acquisition period (REV 4153) data are acquired
within 3 hours of the peak of DST These data for Llt35 are seen in
Figure 22 The 0+ fluxes are now found to be comparable to the H+ fluxes
and extend down to an invariant latitude of 53 (L=28) Data shown in
Figure 23 from REV 4156 were acquired during a second ring current injection
and the ion composition can be seen by pomparison with Figure 21 to be
quite different from the first injection event The 0+ flux is comparable
+to the H+ flux and evidence for He ions can be seen in the CXA-3 mass
plot and in the MQ=4 response plot
An example of data during the main phase of the 11 December storm is
shown in Figure 24 primarily toindicate evidence for a pitch angle scattering
process that is ion mass selective This can be seen in Figure 24 by
comparing the MQ=l response the MQ=16 response and the pitch angle
(PITCH) of the instrument look direction in the time period from 120022 to
120530 Loss cones for the H+ ions in this region are generally well
developed in both directions along the magnetic field whereas for the
0+ ions the loss cone region near 00 pitch angle (instrument pointed upward)
contains high fluxes and in some regions nearly isotropic fluxes At
this stage of analysis of these types of events it appears likely that
strong pitch angle scattering is occurring above the satellite for the
0+ ions but not for the H+ ions The precipitation of these large fluxes
of 0+ ions down to 560 magnetic latitude is expected to produce strong
heating at F-region altitudes Coordinated IMS investigations of this event
11 - ii DECEM BER 1977
CXP-2
CXa=2 A A A A AoA TTvw
IlE
P4EI
CHEC r-v-An--v---n
CMED 8I 7shy$5T 1200 I 0l 0ION 16660 166052 20222 1 0322 -120q16550 16495 2 j 5t22 1206221644 16389 16336 1 0722 I108216283 16231 Lnr -3919 -38l -3670 -3527 -338 -3232 -308 -2926 -2A~r 579507 5C9337 558915 5118245 537328 526168 514768 503132 (J26ILA 6015HLr 10 592105 582G 57 28 LG 7 55242o0 394 2390 2385 51118 5310 51922380 375 2371 tf
L O N 1 6 6 0 0 6 2
Figure 24 Surve Plot of 3-3 Ion and Electron Data Duringthe Main Phase ifthe 11 December 1977-CC
Magnetic Storm Large Fluxes of Precipitating 0 Ions Are Observed from 120022 toshy
120430 UT
LMSCD673774
could contribute to a better understanding of this energy disipation
in the upper atmosphere and ionosphere
The data from REV 4228 shown in Figure 24 were acquired at the peak
of the main phase of the storm The large 0+ fluxes observed throughout
the L=shell region from 27 to 40 (ILA=53-600 ) indicate that the
ionosphere is a significant contributor to the ring current fluxes in the
energy range from 05 to 16 keV
For the 2 and 11 December storms preliminary information was also
presented at the IMS Workshop at Innsbruch Austria on the location of
the dayside cusp the inner edge of the ring current and the polar cap
boundary as determined from the ion composition experiment on the S3-3
spacecraft
-36shy
LMSCD673774
SECTION 5
DISCUSSION AND CONCLUSIONS
Although the dynamic nature and local time assymetries of the ring
current during- the main phase of a magnetic storm make storm-to-storm
comparisons difficult some similarities between data taken near the
peaks of the main phases of the storms on 29 July 1977 and on 29 December
1976 are noteworthy The magnetic local time for the 29 July 1977 data
is near 0500 hours and for the 29 December 1976 data is near 0200 hours
As seen in Figure 5 the average energy distributions for the 0+ ions in
both storms are significantly softer than for the H+ ions in the L=3-4
range This was true at this time at all L-values below 60 for the
29 July storm as seen in Figure 6 This perhaps is indicative of different
source regions for the 0+ and H+ ions at this local time and phase of the
storm In addition as seen in Figure 4 the O number density significantly
exceeds the H+ number density within the instrument energy range near the
inner edge of the ring current in both of the storms A similar trend for
the precipitating fluxes also observed in the local morning sector during
the 17-18 December 1971 magnetic storms has been reported by Sharp et al
1976 Thus it appears that this is at least a commonly occurring feature
during the main phase of storms in the local morning sector
As noted in Section 2 the data on the average ion energies presented
in Figures 6 7 and 8 for the 29 July 1977 storm show a rather dramatic
drop in the average 0+ ion energies in the region of L=4-5 This is
just the region of upstreaming low energy 0+ ions seen in Figure 12 during
the injection phase of the storm These ions are at sufficiently high
pitch angles to be trapped and in a few cases in Figure 12 downward moving
LMSCD673774
trapped 0+ ions are also seen Trapped energetic elections are observed
at higher L-values on this same pass strongly indicating that the
upward flowing 0 ions are on closed field lines and thus are becoming a
part of the ring current at these low L-shells This mechanism of direct
injection of low energy ionospheric ions into the ring current at low
L-shells can then account for the low average 0+ energies in the L=4-5
regions observed in the data presented in Figures 6 7 and 8 The fact
that upstreaming ions are not observed in the L=4-5 regions for REV 3120
and 3121 could result from temporal or local time variations
This mechanism of direct injection of ionospheric ions into the ring
current at low L-shells is also supported by the S3-3 observations prior
to the main phase peak of the 15 February 1978 storm As noted earlier and
as seen in Figure 16 upward flowing conical distributions of 0+ and H+
ions are observed The most prominent upward flowing ions are in the L=45
to 51 region and are at trapped pitch angles Again trapped energetic
elections -are observed at higher L-shells strongly indicating that the
upward flowing 0 + ions are on closed field lines
The large fluxes of 0 + ions observed in the ring current during
the magnetic storms discussed in this report and during storms previously
reported on [Johnson etal 1979 and Geiss et al 1979] show that
the ionosphere is a major contributor to the ring current ions in the
energy range of the S3-3 satellite measurements (05-16 keV) The
contribution of solar wind ions to the ring current during magnetic storms
can be assessed from observations of the ratios of the He++H+ and He++
He+ intensities since the He++H+ flux ratio in the solar wind is
+relatively large (typically about 5 x 10⁻²) whereas the He++H and He++
LMSCID673774
He+ flux ratios for the ionospheric components found inthe outer
-magnetosphere by Young et al (1977) are relatively small (-10 3 and
-10-2 respectively)
For the 15 February 1978 magnetic storm it can be seen from Figure 18
that the He++H+ flux and phase space density ratios in the L=4-6 region
are typically greater than 10-2 and from Figure 17 that the He++He+ flux
ratio will be greater than 10 in a comparable L-shell region These
ratios are consistent with solar wind origin and inconsistent with ionoshy
spheric origin for the He ions
For the 29 July 1977 storm the He H+flux ratios as seen in Figure 15 are typically 1-2 x 10⁻² in the L=4-7 region The He++ fluxes
inthe L=40 to 45 region can be seen from Figure 13 to be comparable to
or larger than the He+ fluxes These data are also consistent with solar
wind origin but not with ionospheric origin for the He ions
The preliminary investigations of the 2 and 11 December 1977 magnetic
storms support the conclusions of the IMS Steering Committee that these
storms are good candidates for detailed and coordinated investigations by
the IMS community From the point of view of ring current composition they
appear to exhibit some interesting and perhaps unique composition features
for which adequate data exist to merit detailed analysis
-39shy
LMSCD673774
SECTION 6
REFERENCES
Geiss J H Balsiger P Eberhardt HP Walker L Weber D T Young and H Rosenbauer Dynamics of Magnetospheric ions as observed by the GEOS Mass Spectrometer Proceedings of the 13th ESLAB Symposium Innsbruch Austria June 5-7 1978 Space Science Reviews in press
Ghielmetti A G R G Johnson R D Sharp and E G Shelley The Latitude Diurnal and Altitudinal Distributions of Upward Flowing Energetic Ions of Ionospheric Origin Geophys Res Lett 5 59 1978
Johnson R G R D Sharp and E G Shelley Observation of Ions of Ionoshyspheric Origin in the Storm-Time Ring Current Geophys Res Lett 4 403 1977
Johnson R G W Lennartson R D Sharp E G Shelley and H Balsiger The Composition of the Near Equatorial Ring Current During the December 11 1977 Magnetic Storm EDS 59 1163 1978
Reed R D E G Shelley J C Bakke T C Sanders and J D McDaniel A Low-Energy Channel-Multiplier Spectrometer for ATS-E IEEE Trans Nucl Sci NS-16 259 1969
Sharp R D R G Johnson and E G Shelley The Morphology of Energetic 0+ Ions During Two Magnetic Storms Latitudinal Variations J GeophysRes 81 3292 1976
Shelley E G R G Johnson and R D Sharp Satellite Observations of Energetic Heavy Ions During a Geomagnetic Storm J Geophys Res 77 6104 1972
Shelley E G R D Sharp and R G Johnson Satellite Observations of an Ionospheric Acceleration Mechanism Geophys Res Lett 3 654 1976
Young D T J Geiss H Balsiger P Eberhardt A Ghielmetti and H Rosenbauer Discovery of He2+ and 02+ ions of Terrestrial Origin in the Outer Magnetosphere Geophys Res Lett 4 561 1977

10
8
6
4
9Wshy
2 $3-3 REV 3120 2 -29 JULY 1977
010
26 30 40 50 60 70
Figure 7 Average Energies of the 0+ and H ions Near the Peak of the Main Phase of the 29 July1977 Magnetic Storm
10
8
6gt
4
S3-3 REV 3121 29 JULY 1977
-0- 0+H6-
40 50 60 70 80 L
Figure 8 Average Energies of the 0+ and H+ Ions Three Hours After the Peak of the Main Phase oflthe29 July 197- Magnetic Storm
14
12
10
IL
6
4
29 JULY 19772
I10 60 7026 30 40 50
+ + s0eraScndr eki Figure 9 Average Energies of the 0 and H Ions Near aSecondary Peak in
0St During the Early Recovery Phase of the 29 duly 1977 Magnetic Storm
he ErlyST Duing
10
8
6N
4
S3-3 REV 3123 29 JULY 1977
2 -0- 0 + ~H
30 40 50 60 70 L
Figure 10 Average Energies of the 0+ and H+ Ions During the Early Recovery Phase of the 29 July 1977 Magnetic Storm
12
10
8
S3-3 REV 3124 S 29 JULY 1977
-0- 0 +
0 30 40 50 60 70 80
Figure 11 + +
Average Energiesof 0 and H 29 July 1977 Magnetic Storm
Ions During the Early Recovery Phase of the
LMSCD673774
in the average energy data being evident
Evidence for conical pitch angle distributions of 0+ ions was found in
the survey data for Revolution 3119 which was acquired(see Figure 2) during
the ring current build up Spin by spin plots of the-pitch angle distributions
at energies of 05 068 094 and 128 key for 9 successive spins between
L=405 and L=445 are shown in Figure 12 along with one spin at L=466
The loss cone regions between + 150 pitch angles is indicated by the cross
hatching The absence of upward streaming ions with fluxes peaked along
the field direction in this Northern hemisphere pass is evident -However
significant fluxes of upward flowing conical distributions are easily
identified along with weaker andless frequent fluxes of downward flowing
-conical distributions Locally mirroring (90) and predipitating (1650
1800) fluxes of 0+ ions are seen to be very low or absent at these lower
energies At energies above 2 keV-trapped and precipitating 0+ and H+
fluxes are observed in this same L-shell region No significant fluxes
of H+ ions with conical pitch angle distributions were observed in this
region Large spatial andor temperal variations in the upward flowing
conical fluxes can also be seen in a single scan through the pitch angle
range of the conical fluxes This is seen in Figure 12 at 13857 13872
13889 and 13905 seconds During the 54 seconds required for the pitch
angle scans from 600 to 00 to 600 the spacecraft traveled about 25 km Thus
spatial structures less than 25 km andor temporal changes in less than 6
seconds are associated with the conical pitch angle distributions
During REV 3119 significant fluxes of He++ were also observed at
L-shells greater than L=4 Examples of the mass spectrum for three energy
intervals in the range L=40-45 is shown in Figure 13 The He++ mass
-17shy
LMSCD673774
T = 13808 sec 20 LI
10 -29 JULY 1977 L=405
=UT 13825 sec 20 - 0 + IONS E=094 keV
10
100 E= 128 keV
= 0 xO LIT 13857 sec20
SUT = 13872 sec
20 E= 050 keV
1020 E=0613889esacSUT = = 0 9 4
10- iE keV0
LIT = 13905 sec
010 E- 128 keV
20 20 UT = 13921 sec-20 E = 068 keV
10
6 9 T= = 13937 sc20 - 1 E 050 keV
I08shy
30 - LIT = 1400 sec = 0 50 k e V (E b
20 - L = 466
10shy
180 150 120 90 60 30 0 30 60 90 120 150 180
PITCH ANGLE
Figure 12 Conical Pitch Angle Distributions observed During the Injection Phase of the 29 July 1977 Magnetic Storm
deg + REV 3119 REV 3119 REV 3119 L -40-45 L = 40- 45 L - 40-45
200 E - 05-128keV E 176-45keV E - 62-16OkeV
150 - 5 0+ + 1500 +
i15 150 5 0
z z 0 0 0 2500
0 +100 000 100 1000 I00 2000
He~+ He He + 150050 He 500 50 + 500 50 4 +1
eHe1000
5 10 5 20 25 0 1 5 10 15 20 25 30
0 5 10 15 20 25 30 5 10 15 20 25 30
CHANNEL NUMBER CHANNEL NUMBER CHANNEL NUMBER
Figure 13 Mass Spectra Showing the Relatively Large He++ Fluxes in the L=40-45 Region During Injection Phase of the 29 July 1977 Magnetic Storm
-19shy
LMSCD673774
peaks are easily identified and are comparable with or larger than the He+
intensities The energy distributions for H+ 0+ and He averaged over
the region L=4-6 are shown in Figure 14 The 0+ spectrum is significantly
softer than the H+ and He++ spectrums which may indicate a different source
region for the 0+ fluxes than for most of the H+ fluxes
The percentage of the H+ fluxes found for the 0+ and He++ fluxes
over the energy range of the instrument is shown in Figure 15 In the
range L=4-7 the He++ is seen to be about 1-2 percent of the H+ The
relatively high He++H+ and He++He + ratios are incompatible with the
ionosphere being the origin of He++ [Young et al 1977] and thus it is
concluded that the He++ ions are of solar wind origin (see Section 5 for
discussion)
-20shy
S3-3 REV 3119 29 JULY 1977
o7 _ + L 40-60
10
100 In
105_
U X
z ib4 _H
10
10O4 10 ENERGY (keVQ) v
++ Figure 14 Energy Distributions of H He and 0+ Fluxes During the
Injection Phase of the 29 July 1977 Magnetic Storm
15
14 S3-3 REV 3119 29 JULY 1977
0+
12 0
X -1-03 + -9
U-
+ -2 He++
08
C4
LU S6shy
4 +
He
30 40 50 60 L
Figure 15 0+ and He++ Fluxes Relativeto the Ht Fluxes During the Injection Phase of the 29 July 1977 Manetic Storm
70
LMSCD673774
SECTION 3
15 FEBRUARY 1978 MAGNETIC STORM
In the process of surveying data from magnetic stroms that might
be suitable for more concentrated investigations as part of the IMS
relatively large fluxes of He++ ions were also observed on REV 4773
during the injection phase of the 15 February 1978 magnetic storm
DST for this storm peaked at -188 at 1266 hour and the data for REV 4773
were acquired about 2 hours prior to the peak when DST was -83y
A survey plot of the data from REV 4773 in the L-shell range 4 to 7
is shown in Figure 16 The abscissa shows universal time (SYST) geoshy
graphic longitude (LON) geographic latitude (LAT) spacecraft altitude
(ALT) invariant geomagnetic latutude (ILA)and magnetic local time Theshy
four lowest panels show the logarithm of the counts per half-second
counting interval for the electron spectrometers with the lowest energy
being CMEA etc The panel labelled PITCH shows the pitch angle of the
look direction of the spectrometers The next four panels show the
logarithm of the counts from ions with MQ=124 and 16 summed once per
second from selected output channels from all three of the ion mass
spectrometers giving an approximate measure of the relative flux of the
relevant species The next three panels (CXA-l CXA-2 and CXA-3 show
the 32 point mass spectrums for each mass spectrometer at one of the
four energy steps (for each spectrometer) indicated by the short bars in
the discretes panel The energy step code is no bar for step 1 a
double bar for step 2 a single bar above the baseline for step 3 and a
single bar on the baseline for energy step 4 These steps correspond
-23shy
S3-3 REV 4T73
15FE8RUARYIg9E
con -2 -h A
CMEC
51 6 1 0 6 I$1 r60
Figue 16 Survey Plot of Ion and Electron Data from the S3-3 Satellite Durinq the Injection Phase of
the 15 February 1978 Magnetic Storm
S 4 8 9 61 4 4 0 S0~43 114-~1
V ON646611
LMSCD673774
sequentially to the four energies for each spectrometer as discussed
in the Introduction
Two characteristics of the data particularly relevant to this report
are evident in Figure 16 Large upward streaming conical distributions
of 0+ ions (and some H+ ions) are seen in the time interval between
101749 and 102149 Also by comparing the MQ=2 (He++ ) response with
the MQ=l (He+ ) response in the time interval 101749 to 102549 and by
looking at the mass spectrums in this interval evidence for significant
He++ ions is found Most of the MQ=l and MQ=2 response in the-time
interval between 101349 and 101749 is due to background counts which
has been determined by detailed analysis of the responses between the peaks
in the mass spectrums Examples of the mass spectrums when summed over
the energy steps for each spectrometer in the range L=4-7 are shown in
Figure 17 The relatively large He He flux ratios should be noted
Figure 18 shows the He++ percentage of the H+ flux in the energy range of
the instrument and the He++iH+ ratio of the average phase space density
over the same measured velocity ranges (05-8 keVQ for H+ and 10 to 16 keV
Q for He+) These relatively high values are compatible with solar wind
origin for the He+ + ions and are incompatible with ionospheric origin for
the He++ ions Also it is seen that significant He+ + fluxes are measurable
as low as L=39 Large background counts limit the sensitivity to He++
ions below L=39
-25shy
S3-3 REV 4473 15 FEBRUARY 1978
1000shy+
0 E = 05- 128 keV E 176-45keV E = 62- 160 keV H
X 025 800 0+ -0
0 +
Z 600 He4
H+0 e 02
4- X025
X 025r a 400- 4-4 H ++ + -+
H He HeHe U He He
200 1 1
5 10 15 20 25 30 5 10 15 20 25 30 5 10 15 20 25 30 CHANNEL NUMBER
Figure 17 Mass Spectrums Showing the Relatively Large He++ Ion Fluxes in the L=4-7 Region During
the Injection Phase of the 15 February 1978 Magnetic Storm
14 S3-3 REV 4773 15 FEBRUARY 1978
12
10 0
-UL Ut
z U-U
-0
LO U
0
i~ LU
2 2 0 0
30 40 50
L
-60 70
Figure 18 The He++ Percentage of the H+ Flux and the He H+ Ratio of Average Phase Space Density During the Injection Phase of the 15 February 1978-Magnetic Storm
LMSCD673774
SECTION 4
GEOMAGNETIC STORMS FOR IMS
In support of the International Magnetospheric Workshops at Innsbruck
Austria in June 1978 preliminary ion composition data from four magnetic
storms were prepared and presented These storms were on 29 July 1977
23 September 1977 2 December 1977 and 11 December 1977 Except for the
29 July storm further analysis of these events has not been pursued
under this program The Workshops were held to present preliminary IMS
data and then to select some time periods for more detailed study The
time periods selected for the mdre detailed IMS studies were associated
with the 2 December storm as the primary event and the 1I December storm
as the secondary event
Moderately good data coverage for the 2 and 11 December storms was
obtained with the S3-3 spacecraft in the ring current regions in the
midnight sector DST and the general location of S3-3 data acquisitions
for these storms are shown in Figures 19 and 20 TFor each storm data
are acquired during the injection phase within 3 hours of-the peak of the
main phase and during the recovery phase
Three examples of the data during orbit revolutions (REV) 4151 4153
and 4156 from the 2 December storm are shown in Figures 21 22 and 23 for
the inner (Llt4) ring current regions The data are in the same format as
for Figure 16 The data from REV 4151 seen in Figure 21 were acquired during
the injection phase when DST was approximately half of its peak value
-28shy
S3-3 COVERAGE
04
20 gt gt gt gt gt gt gt -20- t Lid LU LIILi
-40t
-60
-80shy
-100shy
-120shy
0bull 6 12 18 24 6 12 18 24
2 DEC 1977 UT (HOURS) 3 DEC 1977
Fiiure 19 Distribution of the S3-3 Satellite Data Acquisitions During the 2 December 1977 Magnetic Storm -29shy
S3-3 COVERAGE
-0 7 0 O 0
(N C1 M
C- CN (vO CN CNI
Mf COi C11
-20 114gtILU gtLLU
ICt gtLU
1-t gtLUt gt
LLI
CtT gt LU
t gt LU
c4 gt LL4
-40o -v v
-60shy
I I I I 1 -100 -
-120 -shy
06 6 12 18 24 6 2 is 24
71DEC 1977 UT (HOURS) 12 DEC 1977
Fig-ure 20 Distribution of the S33 Satellite Data Acquisitions During the 11 December 1977 Magnetic Storm
-30shy
L L LILI 1711
CXR-2
CXF4-3 8 2
P-
HH CMEB i
CMEDC-
SYST 0337i3
LON 30305 LA -54q2 ALT 733273 ILA 5970 ALT 2372
Figure 21
-
0538 13 033913 03 3-0 0341 113 042plusmn33 033 3shy30238 30173 30 10 300118 2998 29928 29870 29813-5334 -5226 -5117 -9007 -4896 -4783 98 70 -955
728572 7M3608 718383 712890 707135 7701117 694 36 688292 5909 588 5786 5725 5663 5601 5539 4 78 2371 2369 2388 2367 2366 2365 5236 2363
SurveyPlot of S3-3 Ion and Election Data During the Injection Phase of the 2 December 1977 Magnetic Storm
$ - shy
CXA-2
CX-3
-IMO=
PI~ICrA A A VV v -V v o bullV o bull V bullVVV bullV o V bull V bull bull V v
CHEB
CMEC
StST 093833 093933 091033 09q1133 0941233 09333 091133 094533 094633 LON 20848 20795 20742 20691 206 39 20588 20538 20488 - 201139 LAT -098 -3976 -3853 -3728 -3602 -3473 -333 -3211 -3077ALT 65865W 650768 612621 634219 625555 616632 607q51 59801q 588321 ILA 5723 5555 5586 5517 5446 5373 5300 5225 51S50 HLT 65 61 57 53 t9 45 1 37 33
00
Figure 22 Survey Plot of S3-3 Ion and Electron Data Near the Main Phase Peak of the 2 December 1977 Magnetic Storm
S3-3 REV 4156 N 2 DECEMBER 1977
CXA-2
IA -
PITCH shy
tHEA2r )rA A
CHER
sLsr 70330 163118 18321 8318 183418 6318 1836 to 183710 1838 18LON 7330 7281 7231 7182 7133 7085 7036 6988 69Z9LT -329 -2993 -2854 -Z713 -2569 -2I3 -271 -2122 -196 RS $8261 579339 56916s 5587qO I|SO 37151 519 92 51598 50961
5028 h79 61714 ILR 5678 583 S 86 5387 5287 s)86
HIT~~2 31231 31 31 310 2310 310 2310 2309
Figure 23 Survey Plot of S3-3 Ion and Electron Data During the Second Ring Current Injection Event of 2 December 1977 Magnetic Storm
LMSCD673774
Relatively large H+ fluxes compared to the 0+ are found at this phase
of the storm in the midnight sector The moderately large H+ fluxes
extend down to an invariant magnetic latitude (ILA) of about 557 (L=31)
During the next S3-3 data acquisition period (REV 4153) data are acquired
within 3 hours of the peak of DST These data for Llt35 are seen in
Figure 22 The 0+ fluxes are now found to be comparable to the H+ fluxes
and extend down to an invariant latitude of 53 (L=28) Data shown in
Figure 23 from REV 4156 were acquired during a second ring current injection
and the ion composition can be seen by pomparison with Figure 21 to be
quite different from the first injection event The 0+ flux is comparable
+to the H+ flux and evidence for He ions can be seen in the CXA-3 mass
plot and in the MQ=4 response plot
An example of data during the main phase of the 11 December storm is
shown in Figure 24 primarily toindicate evidence for a pitch angle scattering
process that is ion mass selective This can be seen in Figure 24 by
comparing the MQ=l response the MQ=16 response and the pitch angle
(PITCH) of the instrument look direction in the time period from 120022 to
120530 Loss cones for the H+ ions in this region are generally well
developed in both directions along the magnetic field whereas for the
0+ ions the loss cone region near 00 pitch angle (instrument pointed upward)
contains high fluxes and in some regions nearly isotropic fluxes At
this stage of analysis of these types of events it appears likely that
strong pitch angle scattering is occurring above the satellite for the
0+ ions but not for the H+ ions The precipitation of these large fluxes
of 0+ ions down to 560 magnetic latitude is expected to produce strong
heating at F-region altitudes Coordinated IMS investigations of this event
11 - ii DECEM BER 1977
CXP-2
CXa=2 A A A A AoA TTvw
IlE
P4EI
CHEC r-v-An--v---n
CMED 8I 7shy$5T 1200 I 0l 0ION 16660 166052 20222 1 0322 -120q16550 16495 2 j 5t22 1206221644 16389 16336 1 0722 I108216283 16231 Lnr -3919 -38l -3670 -3527 -338 -3232 -308 -2926 -2A~r 579507 5C9337 558915 5118245 537328 526168 514768 503132 (J26ILA 6015HLr 10 592105 582G 57 28 LG 7 55242o0 394 2390 2385 51118 5310 51922380 375 2371 tf
L O N 1 6 6 0 0 6 2
Figure 24 Surve Plot of 3-3 Ion and Electron Data Duringthe Main Phase ifthe 11 December 1977-CC
Magnetic Storm Large Fluxes of Precipitating 0 Ions Are Observed from 120022 toshy
120430 UT
LMSCD673774
could contribute to a better understanding of this energy disipation
in the upper atmosphere and ionosphere
The data from REV 4228 shown in Figure 24 were acquired at the peak
of the main phase of the storm The large 0+ fluxes observed throughout
the L=shell region from 27 to 40 (ILA=53-600 ) indicate that the
ionosphere is a significant contributor to the ring current fluxes in the
energy range from 05 to 16 keV
For the 2 and 11 December storms preliminary information was also
presented at the IMS Workshop at Innsbruch Austria on the location of
the dayside cusp the inner edge of the ring current and the polar cap
boundary as determined from the ion composition experiment on the S3-3
spacecraft
-36shy
LMSCD673774
SECTION 5
DISCUSSION AND CONCLUSIONS
Although the dynamic nature and local time assymetries of the ring
current during- the main phase of a magnetic storm make storm-to-storm
comparisons difficult some similarities between data taken near the
peaks of the main phases of the storms on 29 July 1977 and on 29 December
1976 are noteworthy The magnetic local time for the 29 July 1977 data
is near 0500 hours and for the 29 December 1976 data is near 0200 hours
As seen in Figure 5 the average energy distributions for the 0+ ions in
both storms are significantly softer than for the H+ ions in the L=3-4
range This was true at this time at all L-values below 60 for the
29 July storm as seen in Figure 6 This perhaps is indicative of different
source regions for the 0+ and H+ ions at this local time and phase of the
storm In addition as seen in Figure 4 the O number density significantly
exceeds the H+ number density within the instrument energy range near the
inner edge of the ring current in both of the storms A similar trend for
the precipitating fluxes also observed in the local morning sector during
the 17-18 December 1971 magnetic storms has been reported by Sharp et al
1976 Thus it appears that this is at least a commonly occurring feature
during the main phase of storms in the local morning sector
As noted in Section 2 the data on the average ion energies presented
in Figures 6 7 and 8 for the 29 July 1977 storm show a rather dramatic
drop in the average 0+ ion energies in the region of L=4-5 This is
just the region of upstreaming low energy 0+ ions seen in Figure 12 during
the injection phase of the storm These ions are at sufficiently high
pitch angles to be trapped and in a few cases in Figure 12 downward moving
LMSCD673774
trapped 0+ ions are also seen Trapped energetic elections are observed
at higher L-values on this same pass strongly indicating that the
upward flowing 0 ions are on closed field lines and thus are becoming a
part of the ring current at these low L-shells This mechanism of direct
injection of low energy ionospheric ions into the ring current at low
L-shells can then account for the low average 0+ energies in the L=4-5
regions observed in the data presented in Figures 6 7 and 8 The fact
that upstreaming ions are not observed in the L=4-5 regions for REV 3120
and 3121 could result from temporal or local time variations
This mechanism of direct injection of ionospheric ions into the ring
current at low L-shells is also supported by the S3-3 observations prior
to the main phase peak of the 15 February 1978 storm As noted earlier and
as seen in Figure 16 upward flowing conical distributions of 0+ and H+
ions are observed The most prominent upward flowing ions are in the L=45
to 51 region and are at trapped pitch angles Again trapped energetic
elections -are observed at higher L-shells strongly indicating that the
upward flowing 0 + ions are on closed field lines
The large fluxes of 0 + ions observed in the ring current during
the magnetic storms discussed in this report and during storms previously
reported on [Johnson etal 1979 and Geiss et al 1979] show that
the ionosphere is a major contributor to the ring current ions in the
energy range of the S3-3 satellite measurements (05-16 keV) The
contribution of solar wind ions to the ring current during magnetic storms
can be assessed from observations of the ratios of the He++H+ and He++
He+ intensities since the He++H+ flux ratio in the solar wind is
+relatively large (typically about 5 x 10⁻²) whereas the He++H and He++
LMSCID673774
He+ flux ratios for the ionospheric components found inthe outer
-magnetosphere by Young et al (1977) are relatively small (-10 3 and
-10-2 respectively)
For the 15 February 1978 magnetic storm it can be seen from Figure 18
that the He++H+ flux and phase space density ratios in the L=4-6 region
are typically greater than 10-2 and from Figure 17 that the He++He+ flux
ratio will be greater than 10 in a comparable L-shell region These
ratios are consistent with solar wind origin and inconsistent with ionoshy
spheric origin for the He ions
For the 29 July 1977 storm the He H+flux ratios as seen in Figure 15 are typically 1-2 x 10⁻² in the L=4-7 region The He++ fluxes
inthe L=40 to 45 region can be seen from Figure 13 to be comparable to
or larger than the He+ fluxes These data are also consistent with solar
wind origin but not with ionospheric origin for the He ions
The preliminary investigations of the 2 and 11 December 1977 magnetic
storms support the conclusions of the IMS Steering Committee that these
storms are good candidates for detailed and coordinated investigations by
the IMS community From the point of view of ring current composition they
appear to exhibit some interesting and perhaps unique composition features
for which adequate data exist to merit detailed analysis
-39shy
LMSCD673774
SECTION 6
REFERENCES
Geiss J H Balsiger P Eberhardt HP Walker L Weber D T Young and H Rosenbauer Dynamics of Magnetospheric ions as observed by the GEOS Mass Spectrometer Proceedings of the 13th ESLAB Symposium Innsbruch Austria June 5-7 1978 Space Science Reviews in press
Ghielmetti A G R G Johnson R D Sharp and E G Shelley The Latitude Diurnal and Altitudinal Distributions of Upward Flowing Energetic Ions of Ionospheric Origin Geophys Res Lett 5 59 1978
Johnson R G R D Sharp and E G Shelley Observation of Ions of Ionoshyspheric Origin in the Storm-Time Ring Current Geophys Res Lett 4 403 1977
Johnson R G W Lennartson R D Sharp E G Shelley and H Balsiger The Composition of the Near Equatorial Ring Current During the December 11 1977 Magnetic Storm EDS 59 1163 1978
Reed R D E G Shelley J C Bakke T C Sanders and J D McDaniel A Low-Energy Channel-Multiplier Spectrometer for ATS-E IEEE Trans Nucl Sci NS-16 259 1969
Sharp R D R G Johnson and E G Shelley The Morphology of Energetic 0+ Ions During Two Magnetic Storms Latitudinal Variations J GeophysRes 81 3292 1976
Shelley E G R G Johnson and R D Sharp Satellite Observations of Energetic Heavy Ions During a Geomagnetic Storm J Geophys Res 77 6104 1972
Shelley E G R D Sharp and R G Johnson Satellite Observations of an Ionospheric Acceleration Mechanism Geophys Res Lett 3 654 1976
Young D T J Geiss H Balsiger P Eberhardt A Ghielmetti and H Rosenbauer Discovery of He2+ and 02+ ions of Terrestrial Origin in the Outer Magnetosphere Geophys Res Lett 4 561 1977

10
8
6gt
4
S3-3 REV 3121 29 JULY 1977
-0- 0+H6-
40 50 60 70 80 L
Figure 8 Average Energies of the 0+ and H+ Ions Three Hours After the Peak of the Main Phase oflthe29 July 197- Magnetic Storm
14
12
10
IL
6
4
29 JULY 19772
I10 60 7026 30 40 50
+ + s0eraScndr eki Figure 9 Average Energies of the 0 and H Ions Near aSecondary Peak in
0St During the Early Recovery Phase of the 29 duly 1977 Magnetic Storm
he ErlyST Duing
10
8
6N
4
S3-3 REV 3123 29 JULY 1977
2 -0- 0 + ~H
30 40 50 60 70 L
Figure 10 Average Energies of the 0+ and H+ Ions During the Early Recovery Phase of the 29 July 1977 Magnetic Storm
12
10
8
S3-3 REV 3124 S 29 JULY 1977
-0- 0 +
0 30 40 50 60 70 80
Figure 11 + +
Average Energiesof 0 and H 29 July 1977 Magnetic Storm
Ions During the Early Recovery Phase of the
LMSCD673774
in the average energy data being evident
Evidence for conical pitch angle distributions of 0+ ions was found in
the survey data for Revolution 3119 which was acquired(see Figure 2) during
the ring current build up Spin by spin plots of the-pitch angle distributions
at energies of 05 068 094 and 128 key for 9 successive spins between
L=405 and L=445 are shown in Figure 12 along with one spin at L=466
The loss cone regions between + 150 pitch angles is indicated by the cross
hatching The absence of upward streaming ions with fluxes peaked along
the field direction in this Northern hemisphere pass is evident -However
significant fluxes of upward flowing conical distributions are easily
identified along with weaker andless frequent fluxes of downward flowing
-conical distributions Locally mirroring (90) and predipitating (1650
1800) fluxes of 0+ ions are seen to be very low or absent at these lower
energies At energies above 2 keV-trapped and precipitating 0+ and H+
fluxes are observed in this same L-shell region No significant fluxes
of H+ ions with conical pitch angle distributions were observed in this
region Large spatial andor temperal variations in the upward flowing
conical fluxes can also be seen in a single scan through the pitch angle
range of the conical fluxes This is seen in Figure 12 at 13857 13872
13889 and 13905 seconds During the 54 seconds required for the pitch
angle scans from 600 to 00 to 600 the spacecraft traveled about 25 km Thus
spatial structures less than 25 km andor temporal changes in less than 6
seconds are associated with the conical pitch angle distributions
During REV 3119 significant fluxes of He++ were also observed at
L-shells greater than L=4 Examples of the mass spectrum for three energy
intervals in the range L=40-45 is shown in Figure 13 The He++ mass
-17shy
LMSCD673774
T = 13808 sec 20 LI
10 -29 JULY 1977 L=405
=UT 13825 sec 20 - 0 + IONS E=094 keV
10
100 E= 128 keV
= 0 xO LIT 13857 sec20
SUT = 13872 sec
20 E= 050 keV
1020 E=0613889esacSUT = = 0 9 4
10- iE keV0
LIT = 13905 sec
010 E- 128 keV
20 20 UT = 13921 sec-20 E = 068 keV
10
6 9 T= = 13937 sc20 - 1 E 050 keV
I08shy
30 - LIT = 1400 sec = 0 50 k e V (E b
20 - L = 466
10shy
180 150 120 90 60 30 0 30 60 90 120 150 180
PITCH ANGLE
Figure 12 Conical Pitch Angle Distributions observed During the Injection Phase of the 29 July 1977 Magnetic Storm
deg + REV 3119 REV 3119 REV 3119 L -40-45 L = 40- 45 L - 40-45
200 E - 05-128keV E 176-45keV E - 62-16OkeV
150 - 5 0+ + 1500 +
i15 150 5 0
z z 0 0 0 2500
0 +100 000 100 1000 I00 2000
He~+ He He + 150050 He 500 50 + 500 50 4 +1
eHe1000
5 10 5 20 25 0 1 5 10 15 20 25 30
0 5 10 15 20 25 30 5 10 15 20 25 30
CHANNEL NUMBER CHANNEL NUMBER CHANNEL NUMBER
Figure 13 Mass Spectra Showing the Relatively Large He++ Fluxes in the L=40-45 Region During Injection Phase of the 29 July 1977 Magnetic Storm
-19shy
LMSCD673774
peaks are easily identified and are comparable with or larger than the He+
intensities The energy distributions for H+ 0+ and He averaged over
the region L=4-6 are shown in Figure 14 The 0+ spectrum is significantly
softer than the H+ and He++ spectrums which may indicate a different source
region for the 0+ fluxes than for most of the H+ fluxes
The percentage of the H+ fluxes found for the 0+ and He++ fluxes
over the energy range of the instrument is shown in Figure 15 In the
range L=4-7 the He++ is seen to be about 1-2 percent of the H+ The
relatively high He++H+ and He++He + ratios are incompatible with the
ionosphere being the origin of He++ [Young et al 1977] and thus it is
concluded that the He++ ions are of solar wind origin (see Section 5 for
discussion)
-20shy
S3-3 REV 3119 29 JULY 1977
o7 _ + L 40-60
10
100 In
105_
U X
z ib4 _H
10
10O4 10 ENERGY (keVQ) v
++ Figure 14 Energy Distributions of H He and 0+ Fluxes During the
Injection Phase of the 29 July 1977 Magnetic Storm
15
14 S3-3 REV 3119 29 JULY 1977
0+
12 0
X -1-03 + -9
U-
+ -2 He++
08
C4
LU S6shy
4 +
He
30 40 50 60 L
Figure 15 0+ and He++ Fluxes Relativeto the Ht Fluxes During the Injection Phase of the 29 July 1977 Manetic Storm
70
LMSCD673774
SECTION 3
15 FEBRUARY 1978 MAGNETIC STORM
In the process of surveying data from magnetic stroms that might
be suitable for more concentrated investigations as part of the IMS
relatively large fluxes of He++ ions were also observed on REV 4773
during the injection phase of the 15 February 1978 magnetic storm
DST for this storm peaked at -188 at 1266 hour and the data for REV 4773
were acquired about 2 hours prior to the peak when DST was -83y
A survey plot of the data from REV 4773 in the L-shell range 4 to 7
is shown in Figure 16 The abscissa shows universal time (SYST) geoshy
graphic longitude (LON) geographic latitude (LAT) spacecraft altitude
(ALT) invariant geomagnetic latutude (ILA)and magnetic local time Theshy
four lowest panels show the logarithm of the counts per half-second
counting interval for the electron spectrometers with the lowest energy
being CMEA etc The panel labelled PITCH shows the pitch angle of the
look direction of the spectrometers The next four panels show the
logarithm of the counts from ions with MQ=124 and 16 summed once per
second from selected output channels from all three of the ion mass
spectrometers giving an approximate measure of the relative flux of the
relevant species The next three panels (CXA-l CXA-2 and CXA-3 show
the 32 point mass spectrums for each mass spectrometer at one of the
four energy steps (for each spectrometer) indicated by the short bars in
the discretes panel The energy step code is no bar for step 1 a
double bar for step 2 a single bar above the baseline for step 3 and a
single bar on the baseline for energy step 4 These steps correspond
-23shy
S3-3 REV 4T73
15FE8RUARYIg9E
con -2 -h A
CMEC
51 6 1 0 6 I$1 r60
Figue 16 Survey Plot of Ion and Electron Data from the S3-3 Satellite Durinq the Injection Phase of
the 15 February 1978 Magnetic Storm
S 4 8 9 61 4 4 0 S0~43 114-~1
V ON646611
LMSCD673774
sequentially to the four energies for each spectrometer as discussed
in the Introduction
Two characteristics of the data particularly relevant to this report
are evident in Figure 16 Large upward streaming conical distributions
of 0+ ions (and some H+ ions) are seen in the time interval between
101749 and 102149 Also by comparing the MQ=2 (He++ ) response with
the MQ=l (He+ ) response in the time interval 101749 to 102549 and by
looking at the mass spectrums in this interval evidence for significant
He++ ions is found Most of the MQ=l and MQ=2 response in the-time
interval between 101349 and 101749 is due to background counts which
has been determined by detailed analysis of the responses between the peaks
in the mass spectrums Examples of the mass spectrums when summed over
the energy steps for each spectrometer in the range L=4-7 are shown in
Figure 17 The relatively large He He flux ratios should be noted
Figure 18 shows the He++ percentage of the H+ flux in the energy range of
the instrument and the He++iH+ ratio of the average phase space density
over the same measured velocity ranges (05-8 keVQ for H+ and 10 to 16 keV
Q for He+) These relatively high values are compatible with solar wind
origin for the He+ + ions and are incompatible with ionospheric origin for
the He++ ions Also it is seen that significant He+ + fluxes are measurable
as low as L=39 Large background counts limit the sensitivity to He++
ions below L=39
-25shy
S3-3 REV 4473 15 FEBRUARY 1978
1000shy+
0 E = 05- 128 keV E 176-45keV E = 62- 160 keV H
X 025 800 0+ -0
0 +
Z 600 He4
H+0 e 02
4- X025
X 025r a 400- 4-4 H ++ + -+
H He HeHe U He He
200 1 1
5 10 15 20 25 30 5 10 15 20 25 30 5 10 15 20 25 30 CHANNEL NUMBER
Figure 17 Mass Spectrums Showing the Relatively Large He++ Ion Fluxes in the L=4-7 Region During
the Injection Phase of the 15 February 1978 Magnetic Storm
14 S3-3 REV 4773 15 FEBRUARY 1978
12
10 0
-UL Ut
z U-U
-0
LO U
0
i~ LU
2 2 0 0
30 40 50
L
-60 70
Figure 18 The He++ Percentage of the H+ Flux and the He H+ Ratio of Average Phase Space Density During the Injection Phase of the 15 February 1978-Magnetic Storm
LMSCD673774
SECTION 4
GEOMAGNETIC STORMS FOR IMS
In support of the International Magnetospheric Workshops at Innsbruck
Austria in June 1978 preliminary ion composition data from four magnetic
storms were prepared and presented These storms were on 29 July 1977
23 September 1977 2 December 1977 and 11 December 1977 Except for the
29 July storm further analysis of these events has not been pursued
under this program The Workshops were held to present preliminary IMS
data and then to select some time periods for more detailed study The
time periods selected for the mdre detailed IMS studies were associated
with the 2 December storm as the primary event and the 1I December storm
as the secondary event
Moderately good data coverage for the 2 and 11 December storms was
obtained with the S3-3 spacecraft in the ring current regions in the
midnight sector DST and the general location of S3-3 data acquisitions
for these storms are shown in Figures 19 and 20 TFor each storm data
are acquired during the injection phase within 3 hours of-the peak of the
main phase and during the recovery phase
Three examples of the data during orbit revolutions (REV) 4151 4153
and 4156 from the 2 December storm are shown in Figures 21 22 and 23 for
the inner (Llt4) ring current regions The data are in the same format as
for Figure 16 The data from REV 4151 seen in Figure 21 were acquired during
the injection phase when DST was approximately half of its peak value
-28shy
S3-3 COVERAGE
04
20 gt gt gt gt gt gt gt -20- t Lid LU LIILi
-40t
-60
-80shy
-100shy
-120shy
0bull 6 12 18 24 6 12 18 24
2 DEC 1977 UT (HOURS) 3 DEC 1977
Fiiure 19 Distribution of the S3-3 Satellite Data Acquisitions During the 2 December 1977 Magnetic Storm -29shy
S3-3 COVERAGE
-0 7 0 O 0
(N C1 M
C- CN (vO CN CNI
Mf COi C11
-20 114gtILU gtLLU
ICt gtLU
1-t gtLUt gt
LLI
CtT gt LU
t gt LU
c4 gt LL4
-40o -v v
-60shy
I I I I 1 -100 -
-120 -shy
06 6 12 18 24 6 2 is 24
71DEC 1977 UT (HOURS) 12 DEC 1977
Fig-ure 20 Distribution of the S33 Satellite Data Acquisitions During the 11 December 1977 Magnetic Storm
-30shy
L L LILI 1711
CXR-2
CXF4-3 8 2
P-
HH CMEB i
CMEDC-
SYST 0337i3
LON 30305 LA -54q2 ALT 733273 ILA 5970 ALT 2372
Figure 21
-
0538 13 033913 03 3-0 0341 113 042plusmn33 033 3shy30238 30173 30 10 300118 2998 29928 29870 29813-5334 -5226 -5117 -9007 -4896 -4783 98 70 -955
728572 7M3608 718383 712890 707135 7701117 694 36 688292 5909 588 5786 5725 5663 5601 5539 4 78 2371 2369 2388 2367 2366 2365 5236 2363
SurveyPlot of S3-3 Ion and Election Data During the Injection Phase of the 2 December 1977 Magnetic Storm
$ - shy
CXA-2
CX-3
-IMO=
PI~ICrA A A VV v -V v o bullV o bull V bullVVV bullV o V bull V bull bull V v
CHEB
CMEC
StST 093833 093933 091033 09q1133 0941233 09333 091133 094533 094633 LON 20848 20795 20742 20691 206 39 20588 20538 20488 - 201139 LAT -098 -3976 -3853 -3728 -3602 -3473 -333 -3211 -3077ALT 65865W 650768 612621 634219 625555 616632 607q51 59801q 588321 ILA 5723 5555 5586 5517 5446 5373 5300 5225 51S50 HLT 65 61 57 53 t9 45 1 37 33
00
Figure 22 Survey Plot of S3-3 Ion and Electron Data Near the Main Phase Peak of the 2 December 1977 Magnetic Storm
S3-3 REV 4156 N 2 DECEMBER 1977
CXA-2
IA -
PITCH shy
tHEA2r )rA A
CHER
sLsr 70330 163118 18321 8318 183418 6318 1836 to 183710 1838 18LON 7330 7281 7231 7182 7133 7085 7036 6988 69Z9LT -329 -2993 -2854 -Z713 -2569 -2I3 -271 -2122 -196 RS $8261 579339 56916s 5587qO I|SO 37151 519 92 51598 50961
5028 h79 61714 ILR 5678 583 S 86 5387 5287 s)86
HIT~~2 31231 31 31 310 2310 310 2310 2309
Figure 23 Survey Plot of S3-3 Ion and Electron Data During the Second Ring Current Injection Event of 2 December 1977 Magnetic Storm
LMSCD673774
Relatively large H+ fluxes compared to the 0+ are found at this phase
of the storm in the midnight sector The moderately large H+ fluxes
extend down to an invariant magnetic latitude (ILA) of about 557 (L=31)
During the next S3-3 data acquisition period (REV 4153) data are acquired
within 3 hours of the peak of DST These data for Llt35 are seen in
Figure 22 The 0+ fluxes are now found to be comparable to the H+ fluxes
and extend down to an invariant latitude of 53 (L=28) Data shown in
Figure 23 from REV 4156 were acquired during a second ring current injection
and the ion composition can be seen by pomparison with Figure 21 to be
quite different from the first injection event The 0+ flux is comparable
+to the H+ flux and evidence for He ions can be seen in the CXA-3 mass
plot and in the MQ=4 response plot
An example of data during the main phase of the 11 December storm is
shown in Figure 24 primarily toindicate evidence for a pitch angle scattering
process that is ion mass selective This can be seen in Figure 24 by
comparing the MQ=l response the MQ=16 response and the pitch angle
(PITCH) of the instrument look direction in the time period from 120022 to
120530 Loss cones for the H+ ions in this region are generally well
developed in both directions along the magnetic field whereas for the
0+ ions the loss cone region near 00 pitch angle (instrument pointed upward)
contains high fluxes and in some regions nearly isotropic fluxes At
this stage of analysis of these types of events it appears likely that
strong pitch angle scattering is occurring above the satellite for the
0+ ions but not for the H+ ions The precipitation of these large fluxes
of 0+ ions down to 560 magnetic latitude is expected to produce strong
heating at F-region altitudes Coordinated IMS investigations of this event
11 - ii DECEM BER 1977
CXP-2
CXa=2 A A A A AoA TTvw
IlE
P4EI
CHEC r-v-An--v---n
CMED 8I 7shy$5T 1200 I 0l 0ION 16660 166052 20222 1 0322 -120q16550 16495 2 j 5t22 1206221644 16389 16336 1 0722 I108216283 16231 Lnr -3919 -38l -3670 -3527 -338 -3232 -308 -2926 -2A~r 579507 5C9337 558915 5118245 537328 526168 514768 503132 (J26ILA 6015HLr 10 592105 582G 57 28 LG 7 55242o0 394 2390 2385 51118 5310 51922380 375 2371 tf
L O N 1 6 6 0 0 6 2
Figure 24 Surve Plot of 3-3 Ion and Electron Data Duringthe Main Phase ifthe 11 December 1977-CC
Magnetic Storm Large Fluxes of Precipitating 0 Ions Are Observed from 120022 toshy
120430 UT
LMSCD673774
could contribute to a better understanding of this energy disipation
in the upper atmosphere and ionosphere
The data from REV 4228 shown in Figure 24 were acquired at the peak
of the main phase of the storm The large 0+ fluxes observed throughout
the L=shell region from 27 to 40 (ILA=53-600 ) indicate that the
ionosphere is a significant contributor to the ring current fluxes in the
energy range from 05 to 16 keV
For the 2 and 11 December storms preliminary information was also
presented at the IMS Workshop at Innsbruch Austria on the location of
the dayside cusp the inner edge of the ring current and the polar cap
boundary as determined from the ion composition experiment on the S3-3
spacecraft
-36shy
LMSCD673774
SECTION 5
DISCUSSION AND CONCLUSIONS
Although the dynamic nature and local time assymetries of the ring
current during- the main phase of a magnetic storm make storm-to-storm
comparisons difficult some similarities between data taken near the
peaks of the main phases of the storms on 29 July 1977 and on 29 December
1976 are noteworthy The magnetic local time for the 29 July 1977 data
is near 0500 hours and for the 29 December 1976 data is near 0200 hours
As seen in Figure 5 the average energy distributions for the 0+ ions in
both storms are significantly softer than for the H+ ions in the L=3-4
range This was true at this time at all L-values below 60 for the
29 July storm as seen in Figure 6 This perhaps is indicative of different
source regions for the 0+ and H+ ions at this local time and phase of the
storm In addition as seen in Figure 4 the O number density significantly
exceeds the H+ number density within the instrument energy range near the
inner edge of the ring current in both of the storms A similar trend for
the precipitating fluxes also observed in the local morning sector during
the 17-18 December 1971 magnetic storms has been reported by Sharp et al
1976 Thus it appears that this is at least a commonly occurring feature
during the main phase of storms in the local morning sector
As noted in Section 2 the data on the average ion energies presented
in Figures 6 7 and 8 for the 29 July 1977 storm show a rather dramatic
drop in the average 0+ ion energies in the region of L=4-5 This is
just the region of upstreaming low energy 0+ ions seen in Figure 12 during
the injection phase of the storm These ions are at sufficiently high
pitch angles to be trapped and in a few cases in Figure 12 downward moving
LMSCD673774
trapped 0+ ions are also seen Trapped energetic elections are observed
at higher L-values on this same pass strongly indicating that the
upward flowing 0 ions are on closed field lines and thus are becoming a
part of the ring current at these low L-shells This mechanism of direct
injection of low energy ionospheric ions into the ring current at low
L-shells can then account for the low average 0+ energies in the L=4-5
regions observed in the data presented in Figures 6 7 and 8 The fact
that upstreaming ions are not observed in the L=4-5 regions for REV 3120
and 3121 could result from temporal or local time variations
This mechanism of direct injection of ionospheric ions into the ring
current at low L-shells is also supported by the S3-3 observations prior
to the main phase peak of the 15 February 1978 storm As noted earlier and
as seen in Figure 16 upward flowing conical distributions of 0+ and H+
ions are observed The most prominent upward flowing ions are in the L=45
to 51 region and are at trapped pitch angles Again trapped energetic
elections -are observed at higher L-shells strongly indicating that the
upward flowing 0 + ions are on closed field lines
The large fluxes of 0 + ions observed in the ring current during
the magnetic storms discussed in this report and during storms previously
reported on [Johnson etal 1979 and Geiss et al 1979] show that
the ionosphere is a major contributor to the ring current ions in the
energy range of the S3-3 satellite measurements (05-16 keV) The
contribution of solar wind ions to the ring current during magnetic storms
can be assessed from observations of the ratios of the He++H+ and He++
He+ intensities since the He++H+ flux ratio in the solar wind is
+relatively large (typically about 5 x 10⁻²) whereas the He++H and He++
LMSCID673774
He+ flux ratios for the ionospheric components found inthe outer
-magnetosphere by Young et al (1977) are relatively small (-10 3 and
-10-2 respectively)
For the 15 February 1978 magnetic storm it can be seen from Figure 18
that the He++H+ flux and phase space density ratios in the L=4-6 region
are typically greater than 10-2 and from Figure 17 that the He++He+ flux
ratio will be greater than 10 in a comparable L-shell region These
ratios are consistent with solar wind origin and inconsistent with ionoshy
spheric origin for the He ions
For the 29 July 1977 storm the He H+flux ratios as seen in Figure 15 are typically 1-2 x 10⁻² in the L=4-7 region The He++ fluxes
inthe L=40 to 45 region can be seen from Figure 13 to be comparable to
or larger than the He+ fluxes These data are also consistent with solar
wind origin but not with ionospheric origin for the He ions
The preliminary investigations of the 2 and 11 December 1977 magnetic
storms support the conclusions of the IMS Steering Committee that these
storms are good candidates for detailed and coordinated investigations by
the IMS community From the point of view of ring current composition they
appear to exhibit some interesting and perhaps unique composition features
for which adequate data exist to merit detailed analysis
-39shy
LMSCD673774
SECTION 6
REFERENCES
Geiss J H Balsiger P Eberhardt HP Walker L Weber D T Young and H Rosenbauer Dynamics of Magnetospheric ions as observed by the GEOS Mass Spectrometer Proceedings of the 13th ESLAB Symposium Innsbruch Austria June 5-7 1978 Space Science Reviews in press
Ghielmetti A G R G Johnson R D Sharp and E G Shelley The Latitude Diurnal and Altitudinal Distributions of Upward Flowing Energetic Ions of Ionospheric Origin Geophys Res Lett 5 59 1978
Johnson R G R D Sharp and E G Shelley Observation of Ions of Ionoshyspheric Origin in the Storm-Time Ring Current Geophys Res Lett 4 403 1977
Johnson R G W Lennartson R D Sharp E G Shelley and H Balsiger The Composition of the Near Equatorial Ring Current During the December 11 1977 Magnetic Storm EDS 59 1163 1978
Reed R D E G Shelley J C Bakke T C Sanders and J D McDaniel A Low-Energy Channel-Multiplier Spectrometer for ATS-E IEEE Trans Nucl Sci NS-16 259 1969
Sharp R D R G Johnson and E G Shelley The Morphology of Energetic 0+ Ions During Two Magnetic Storms Latitudinal Variations J GeophysRes 81 3292 1976
Shelley E G R G Johnson and R D Sharp Satellite Observations of Energetic Heavy Ions During a Geomagnetic Storm J Geophys Res 77 6104 1972
Shelley E G R D Sharp and R G Johnson Satellite Observations of an Ionospheric Acceleration Mechanism Geophys Res Lett 3 654 1976
Young D T J Geiss H Balsiger P Eberhardt A Ghielmetti and H Rosenbauer Discovery of He2+ and 02+ ions of Terrestrial Origin in the Outer Magnetosphere Geophys Res Lett 4 561 1977

10
8
6N
4
S3-3 REV 3123 29 JULY 1977
2 -0- 0 + ~H
30 40 50 60 70 L
Figure 10 Average Energies of the 0+ and H+ Ions During the Early Recovery Phase of the 29 July 1977 Magnetic Storm
12
10
8
S3-3 REV 3124 S 29 JULY 1977
-0- 0 +
0 30 40 50 60 70 80
Figure 11 + +
Average Energiesof 0 and H 29 July 1977 Magnetic Storm
Ions During the Early Recovery Phase of the
LMSCD673774
in the average energy data being evident
Evidence for conical pitch angle distributions of 0+ ions was found in
the survey data for Revolution 3119 which was acquired(see Figure 2) during
the ring current build up Spin by spin plots of the-pitch angle distributions
at energies of 05 068 094 and 128 key for 9 successive spins between
L=405 and L=445 are shown in Figure 12 along with one spin at L=466
The loss cone regions between + 150 pitch angles is indicated by the cross
hatching The absence of upward streaming ions with fluxes peaked along
the field direction in this Northern hemisphere pass is evident -However
significant fluxes of upward flowing conical distributions are easily
identified along with weaker andless frequent fluxes of downward flowing
-conical distributions Locally mirroring (90) and predipitating (1650
1800) fluxes of 0+ ions are seen to be very low or absent at these lower
energies At energies above 2 keV-trapped and precipitating 0+ and H+
fluxes are observed in this same L-shell region No significant fluxes
of H+ ions with conical pitch angle distributions were observed in this
region Large spatial andor temperal variations in the upward flowing
conical fluxes can also be seen in a single scan through the pitch angle
range of the conical fluxes This is seen in Figure 12 at 13857 13872
13889 and 13905 seconds During the 54 seconds required for the pitch
angle scans from 600 to 00 to 600 the spacecraft traveled about 25 km Thus
spatial structures less than 25 km andor temporal changes in less than 6
seconds are associated with the conical pitch angle distributions
During REV 3119 significant fluxes of He++ were also observed at
L-shells greater than L=4 Examples of the mass spectrum for three energy
intervals in the range L=40-45 is shown in Figure 13 The He++ mass
-17shy
LMSCD673774
T = 13808 sec 20 LI
10 -29 JULY 1977 L=405
=UT 13825 sec 20 - 0 + IONS E=094 keV
10
100 E= 128 keV
= 0 xO LIT 13857 sec20
SUT = 13872 sec
20 E= 050 keV
1020 E=0613889esacSUT = = 0 9 4
10- iE keV0
LIT = 13905 sec
010 E- 128 keV
20 20 UT = 13921 sec-20 E = 068 keV
10
6 9 T= = 13937 sc20 - 1 E 050 keV
I08shy
30 - LIT = 1400 sec = 0 50 k e V (E b
20 - L = 466
10shy
180 150 120 90 60 30 0 30 60 90 120 150 180
PITCH ANGLE
Figure 12 Conical Pitch Angle Distributions observed During the Injection Phase of the 29 July 1977 Magnetic Storm
deg + REV 3119 REV 3119 REV 3119 L -40-45 L = 40- 45 L - 40-45
200 E - 05-128keV E 176-45keV E - 62-16OkeV
150 - 5 0+ + 1500 +
i15 150 5 0
z z 0 0 0 2500
0 +100 000 100 1000 I00 2000
He~+ He He + 150050 He 500 50 + 500 50 4 +1
eHe1000
5 10 5 20 25 0 1 5 10 15 20 25 30
0 5 10 15 20 25 30 5 10 15 20 25 30
CHANNEL NUMBER CHANNEL NUMBER CHANNEL NUMBER
Figure 13 Mass Spectra Showing the Relatively Large He++ Fluxes in the L=40-45 Region During Injection Phase of the 29 July 1977 Magnetic Storm
-19shy
LMSCD673774
peaks are easily identified and are comparable with or larger than the He+
intensities The energy distributions for H+ 0+ and He averaged over
the region L=4-6 are shown in Figure 14 The 0+ spectrum is significantly
softer than the H+ and He++ spectrums which may indicate a different source
region for the 0+ fluxes than for most of the H+ fluxes
The percentage of the H+ fluxes found for the 0+ and He++ fluxes
over the energy range of the instrument is shown in Figure 15 In the
range L=4-7 the He++ is seen to be about 1-2 percent of the H+ The
relatively high He++H+ and He++He + ratios are incompatible with the
ionosphere being the origin of He++ [Young et al 1977] and thus it is
concluded that the He++ ions are of solar wind origin (see Section 5 for
discussion)
-20shy
S3-3 REV 3119 29 JULY 1977
o7 _ + L 40-60
10
100 In
105_
U X
z ib4 _H
10
10O4 10 ENERGY (keVQ) v
++ Figure 14 Energy Distributions of H He and 0+ Fluxes During the
Injection Phase of the 29 July 1977 Magnetic Storm
15
14 S3-3 REV 3119 29 JULY 1977
0+
12 0
X -1-03 + -9
U-
+ -2 He++
08
C4
LU S6shy
4 +
He
30 40 50 60 L
Figure 15 0+ and He++ Fluxes Relativeto the Ht Fluxes During the Injection Phase of the 29 July 1977 Manetic Storm
70
LMSCD673774
SECTION 3
15 FEBRUARY 1978 MAGNETIC STORM
In the process of surveying data from magnetic stroms that might
be suitable for more concentrated investigations as part of the IMS
relatively large fluxes of He++ ions were also observed on REV 4773
during the injection phase of the 15 February 1978 magnetic storm
DST for this storm peaked at -188 at 1266 hour and the data for REV 4773
were acquired about 2 hours prior to the peak when DST was -83y
A survey plot of the data from REV 4773 in the L-shell range 4 to 7
is shown in Figure 16 The abscissa shows universal time (SYST) geoshy
graphic longitude (LON) geographic latitude (LAT) spacecraft altitude
(ALT) invariant geomagnetic latutude (ILA)and magnetic local time Theshy
four lowest panels show the logarithm of the counts per half-second
counting interval for the electron spectrometers with the lowest energy
being CMEA etc The panel labelled PITCH shows the pitch angle of the
look direction of the spectrometers The next four panels show the
logarithm of the counts from ions with MQ=124 and 16 summed once per
second from selected output channels from all three of the ion mass
spectrometers giving an approximate measure of the relative flux of the
relevant species The next three panels (CXA-l CXA-2 and CXA-3 show
the 32 point mass spectrums for each mass spectrometer at one of the
four energy steps (for each spectrometer) indicated by the short bars in
the discretes panel The energy step code is no bar for step 1 a
double bar for step 2 a single bar above the baseline for step 3 and a
single bar on the baseline for energy step 4 These steps correspond
-23shy
S3-3 REV 4T73
15FE8RUARYIg9E
con -2 -h A
CMEC
51 6 1 0 6 I$1 r60
Figue 16 Survey Plot of Ion and Electron Data from the S3-3 Satellite Durinq the Injection Phase of
the 15 February 1978 Magnetic Storm
S 4 8 9 61 4 4 0 S0~43 114-~1
V ON646611
LMSCD673774
sequentially to the four energies for each spectrometer as discussed
in the Introduction
Two characteristics of the data particularly relevant to this report
are evident in Figure 16 Large upward streaming conical distributions
of 0+ ions (and some H+ ions) are seen in the time interval between
101749 and 102149 Also by comparing the MQ=2 (He++ ) response with
the MQ=l (He+ ) response in the time interval 101749 to 102549 and by
looking at the mass spectrums in this interval evidence for significant
He++ ions is found Most of the MQ=l and MQ=2 response in the-time
interval between 101349 and 101749 is due to background counts which
has been determined by detailed analysis of the responses between the peaks
in the mass spectrums Examples of the mass spectrums when summed over
the energy steps for each spectrometer in the range L=4-7 are shown in
Figure 17 The relatively large He He flux ratios should be noted
Figure 18 shows the He++ percentage of the H+ flux in the energy range of
the instrument and the He++iH+ ratio of the average phase space density
over the same measured velocity ranges (05-8 keVQ for H+ and 10 to 16 keV
Q for He+) These relatively high values are compatible with solar wind
origin for the He+ + ions and are incompatible with ionospheric origin for
the He++ ions Also it is seen that significant He+ + fluxes are measurable
as low as L=39 Large background counts limit the sensitivity to He++
ions below L=39
-25shy
S3-3 REV 4473 15 FEBRUARY 1978
1000shy+
0 E = 05- 128 keV E 176-45keV E = 62- 160 keV H
X 025 800 0+ -0
0 +
Z 600 He4
H+0 e 02
4- X025
X 025r a 400- 4-4 H ++ + -+
H He HeHe U He He
200 1 1
5 10 15 20 25 30 5 10 15 20 25 30 5 10 15 20 25 30 CHANNEL NUMBER
Figure 17 Mass Spectrums Showing the Relatively Large He++ Ion Fluxes in the L=4-7 Region During
the Injection Phase of the 15 February 1978 Magnetic Storm
14 S3-3 REV 4773 15 FEBRUARY 1978
12
10 0
-UL Ut
z U-U
-0
LO U
0
i~ LU
2 2 0 0
30 40 50
L
-60 70
Figure 18 The He++ Percentage of the H+ Flux and the He H+ Ratio of Average Phase Space Density During the Injection Phase of the 15 February 1978-Magnetic Storm
LMSCD673774
SECTION 4
GEOMAGNETIC STORMS FOR IMS
In support of the International Magnetospheric Workshops at Innsbruck
Austria in June 1978 preliminary ion composition data from four magnetic
storms were prepared and presented These storms were on 29 July 1977
23 September 1977 2 December 1977 and 11 December 1977 Except for the
29 July storm further analysis of these events has not been pursued
under this program The Workshops were held to present preliminary IMS
data and then to select some time periods for more detailed study The
time periods selected for the mdre detailed IMS studies were associated
with the 2 December storm as the primary event and the 1I December storm
as the secondary event
Moderately good data coverage for the 2 and 11 December storms was
obtained with the S3-3 spacecraft in the ring current regions in the
midnight sector DST and the general location of S3-3 data acquisitions
for these storms are shown in Figures 19 and 20 TFor each storm data
are acquired during the injection phase within 3 hours of-the peak of the
main phase and during the recovery phase
Three examples of the data during orbit revolutions (REV) 4151 4153
and 4156 from the 2 December storm are shown in Figures 21 22 and 23 for
the inner (Llt4) ring current regions The data are in the same format as
for Figure 16 The data from REV 4151 seen in Figure 21 were acquired during
the injection phase when DST was approximately half of its peak value
-28shy
S3-3 COVERAGE
04
20 gt gt gt gt gt gt gt -20- t Lid LU LIILi
-40t
-60
-80shy
-100shy
-120shy
0bull 6 12 18 24 6 12 18 24
2 DEC 1977 UT (HOURS) 3 DEC 1977
Fiiure 19 Distribution of the S3-3 Satellite Data Acquisitions During the 2 December 1977 Magnetic Storm -29shy
S3-3 COVERAGE
-0 7 0 O 0
(N C1 M
C- CN (vO CN CNI
Mf COi C11
-20 114gtILU gtLLU
ICt gtLU
1-t gtLUt gt
LLI
CtT gt LU
t gt LU
c4 gt LL4
-40o -v v
-60shy
I I I I 1 -100 -
-120 -shy
06 6 12 18 24 6 2 is 24
71DEC 1977 UT (HOURS) 12 DEC 1977
Fig-ure 20 Distribution of the S33 Satellite Data Acquisitions During the 11 December 1977 Magnetic Storm
-30shy
L L LILI 1711
CXR-2
CXF4-3 8 2
P-
HH CMEB i
CMEDC-
SYST 0337i3
LON 30305 LA -54q2 ALT 733273 ILA 5970 ALT 2372
Figure 21
-
0538 13 033913 03 3-0 0341 113 042plusmn33 033 3shy30238 30173 30 10 300118 2998 29928 29870 29813-5334 -5226 -5117 -9007 -4896 -4783 98 70 -955
728572 7M3608 718383 712890 707135 7701117 694 36 688292 5909 588 5786 5725 5663 5601 5539 4 78 2371 2369 2388 2367 2366 2365 5236 2363
SurveyPlot of S3-3 Ion and Election Data During the Injection Phase of the 2 December 1977 Magnetic Storm
$ - shy
CXA-2
CX-3
-IMO=
PI~ICrA A A VV v -V v o bullV o bull V bullVVV bullV o V bull V bull bull V v
CHEB
CMEC
StST 093833 093933 091033 09q1133 0941233 09333 091133 094533 094633 LON 20848 20795 20742 20691 206 39 20588 20538 20488 - 201139 LAT -098 -3976 -3853 -3728 -3602 -3473 -333 -3211 -3077ALT 65865W 650768 612621 634219 625555 616632 607q51 59801q 588321 ILA 5723 5555 5586 5517 5446 5373 5300 5225 51S50 HLT 65 61 57 53 t9 45 1 37 33
00
Figure 22 Survey Plot of S3-3 Ion and Electron Data Near the Main Phase Peak of the 2 December 1977 Magnetic Storm
S3-3 REV 4156 N 2 DECEMBER 1977
CXA-2
IA -
PITCH shy
tHEA2r )rA A
CHER
sLsr 70330 163118 18321 8318 183418 6318 1836 to 183710 1838 18LON 7330 7281 7231 7182 7133 7085 7036 6988 69Z9LT -329 -2993 -2854 -Z713 -2569 -2I3 -271 -2122 -196 RS $8261 579339 56916s 5587qO I|SO 37151 519 92 51598 50961
5028 h79 61714 ILR 5678 583 S 86 5387 5287 s)86
HIT~~2 31231 31 31 310 2310 310 2310 2309
Figure 23 Survey Plot of S3-3 Ion and Electron Data During the Second Ring Current Injection Event of 2 December 1977 Magnetic Storm
LMSCD673774
Relatively large H+ fluxes compared to the 0+ are found at this phase
of the storm in the midnight sector The moderately large H+ fluxes
extend down to an invariant magnetic latitude (ILA) of about 557 (L=31)
During the next S3-3 data acquisition period (REV 4153) data are acquired
within 3 hours of the peak of DST These data for Llt35 are seen in
Figure 22 The 0+ fluxes are now found to be comparable to the H+ fluxes
and extend down to an invariant latitude of 53 (L=28) Data shown in
Figure 23 from REV 4156 were acquired during a second ring current injection
and the ion composition can be seen by pomparison with Figure 21 to be
quite different from the first injection event The 0+ flux is comparable
+to the H+ flux and evidence for He ions can be seen in the CXA-3 mass
plot and in the MQ=4 response plot
An example of data during the main phase of the 11 December storm is
shown in Figure 24 primarily toindicate evidence for a pitch angle scattering
process that is ion mass selective This can be seen in Figure 24 by
comparing the MQ=l response the MQ=16 response and the pitch angle
(PITCH) of the instrument look direction in the time period from 120022 to
120530 Loss cones for the H+ ions in this region are generally well
developed in both directions along the magnetic field whereas for the
0+ ions the loss cone region near 00 pitch angle (instrument pointed upward)
contains high fluxes and in some regions nearly isotropic fluxes At
this stage of analysis of these types of events it appears likely that
strong pitch angle scattering is occurring above the satellite for the
0+ ions but not for the H+ ions The precipitation of these large fluxes
of 0+ ions down to 560 magnetic latitude is expected to produce strong
heating at F-region altitudes Coordinated IMS investigations of this event
11 - ii DECEM BER 1977
CXP-2
CXa=2 A A A A AoA TTvw
IlE
P4EI
CHEC r-v-An--v---n
CMED 8I 7shy$5T 1200 I 0l 0ION 16660 166052 20222 1 0322 -120q16550 16495 2 j 5t22 1206221644 16389 16336 1 0722 I108216283 16231 Lnr -3919 -38l -3670 -3527 -338 -3232 -308 -2926 -2A~r 579507 5C9337 558915 5118245 537328 526168 514768 503132 (J26ILA 6015HLr 10 592105 582G 57 28 LG 7 55242o0 394 2390 2385 51118 5310 51922380 375 2371 tf
L O N 1 6 6 0 0 6 2
Figure 24 Surve Plot of 3-3 Ion and Electron Data Duringthe Main Phase ifthe 11 December 1977-CC
Magnetic Storm Large Fluxes of Precipitating 0 Ions Are Observed from 120022 toshy
120430 UT
LMSCD673774
could contribute to a better understanding of this energy disipation
in the upper atmosphere and ionosphere
The data from REV 4228 shown in Figure 24 were acquired at the peak
of the main phase of the storm The large 0+ fluxes observed throughout
the L=shell region from 27 to 40 (ILA=53-600 ) indicate that the
ionosphere is a significant contributor to the ring current fluxes in the
energy range from 05 to 16 keV
For the 2 and 11 December storms preliminary information was also
presented at the IMS Workshop at Innsbruch Austria on the location of
the dayside cusp the inner edge of the ring current and the polar cap
boundary as determined from the ion composition experiment on the S3-3
spacecraft
-36shy
LMSCD673774
SECTION 5
DISCUSSION AND CONCLUSIONS
Although the dynamic nature and local time assymetries of the ring
current during- the main phase of a magnetic storm make storm-to-storm
comparisons difficult some similarities between data taken near the
peaks of the main phases of the storms on 29 July 1977 and on 29 December
1976 are noteworthy The magnetic local time for the 29 July 1977 data
is near 0500 hours and for the 29 December 1976 data is near 0200 hours
As seen in Figure 5 the average energy distributions for the 0+ ions in
both storms are significantly softer than for the H+ ions in the L=3-4
range This was true at this time at all L-values below 60 for the
29 July storm as seen in Figure 6 This perhaps is indicative of different
source regions for the 0+ and H+ ions at this local time and phase of the
storm In addition as seen in Figure 4 the O number density significantly
exceeds the H+ number density within the instrument energy range near the
inner edge of the ring current in both of the storms A similar trend for
the precipitating fluxes also observed in the local morning sector during
the 17-18 December 1971 magnetic storms has been reported by Sharp et al
1976 Thus it appears that this is at least a commonly occurring feature
during the main phase of storms in the local morning sector
As noted in Section 2 the data on the average ion energies presented
in Figures 6 7 and 8 for the 29 July 1977 storm show a rather dramatic
drop in the average 0+ ion energies in the region of L=4-5 This is
just the region of upstreaming low energy 0+ ions seen in Figure 12 during
the injection phase of the storm These ions are at sufficiently high
pitch angles to be trapped and in a few cases in Figure 12 downward moving
LMSCD673774
trapped 0+ ions are also seen Trapped energetic elections are observed
at higher L-values on this same pass strongly indicating that the
upward flowing 0 ions are on closed field lines and thus are becoming a
part of the ring current at these low L-shells This mechanism of direct
injection of low energy ionospheric ions into the ring current at low
L-shells can then account for the low average 0+ energies in the L=4-5
regions observed in the data presented in Figures 6 7 and 8 The fact
that upstreaming ions are not observed in the L=4-5 regions for REV 3120
and 3121 could result from temporal or local time variations
This mechanism of direct injection of ionospheric ions into the ring
current at low L-shells is also supported by the S3-3 observations prior
to the main phase peak of the 15 February 1978 storm As noted earlier and
as seen in Figure 16 upward flowing conical distributions of 0+ and H+
ions are observed The most prominent upward flowing ions are in the L=45
to 51 region and are at trapped pitch angles Again trapped energetic
elections -are observed at higher L-shells strongly indicating that the
upward flowing 0 + ions are on closed field lines
The large fluxes of 0 + ions observed in the ring current during
the magnetic storms discussed in this report and during storms previously
reported on [Johnson etal 1979 and Geiss et al 1979] show that
the ionosphere is a major contributor to the ring current ions in the
energy range of the S3-3 satellite measurements (05-16 keV) The
contribution of solar wind ions to the ring current during magnetic storms
can be assessed from observations of the ratios of the He++H+ and He++
He+ intensities since the He++H+ flux ratio in the solar wind is
+relatively large (typically about 5 x 10⁻²) whereas the He++H and He++
LMSCID673774
He+ flux ratios for the ionospheric components found inthe outer
-magnetosphere by Young et al (1977) are relatively small (-10 3 and
-10-2 respectively)
For the 15 February 1978 magnetic storm it can be seen from Figure 18
that the He++H+ flux and phase space density ratios in the L=4-6 region
are typically greater than 10-2 and from Figure 17 that the He++He+ flux
ratio will be greater than 10 in a comparable L-shell region These
ratios are consistent with solar wind origin and inconsistent with ionoshy
spheric origin for the He ions
For the 29 July 1977 storm the He H+flux ratios as seen in Figure 15 are typically 1-2 x 10⁻² in the L=4-7 region The He++ fluxes
inthe L=40 to 45 region can be seen from Figure 13 to be comparable to
or larger than the He+ fluxes These data are also consistent with solar
wind origin but not with ionospheric origin for the He ions
The preliminary investigations of the 2 and 11 December 1977 magnetic
storms support the conclusions of the IMS Steering Committee that these
storms are good candidates for detailed and coordinated investigations by
the IMS community From the point of view of ring current composition they
appear to exhibit some interesting and perhaps unique composition features
for which adequate data exist to merit detailed analysis
-39shy
LMSCD673774
SECTION 6
REFERENCES
Geiss J H Balsiger P Eberhardt HP Walker L Weber D T Young and H Rosenbauer Dynamics of Magnetospheric ions as observed by the GEOS Mass Spectrometer Proceedings of the 13th ESLAB Symposium Innsbruch Austria June 5-7 1978 Space Science Reviews in press
Ghielmetti A G R G Johnson R D Sharp and E G Shelley The Latitude Diurnal and Altitudinal Distributions of Upward Flowing Energetic Ions of Ionospheric Origin Geophys Res Lett 5 59 1978
Johnson R G R D Sharp and E G Shelley Observation of Ions of Ionoshyspheric Origin in the Storm-Time Ring Current Geophys Res Lett 4 403 1977
Johnson R G W Lennartson R D Sharp E G Shelley and H Balsiger The Composition of the Near Equatorial Ring Current During the December 11 1977 Magnetic Storm EDS 59 1163 1978
Reed R D E G Shelley J C Bakke T C Sanders and J D McDaniel A Low-Energy Channel-Multiplier Spectrometer for ATS-E IEEE Trans Nucl Sci NS-16 259 1969
Sharp R D R G Johnson and E G Shelley The Morphology of Energetic 0+ Ions During Two Magnetic Storms Latitudinal Variations J GeophysRes 81 3292 1976
Shelley E G R G Johnson and R D Sharp Satellite Observations of Energetic Heavy Ions During a Geomagnetic Storm J Geophys Res 77 6104 1972
Shelley E G R D Sharp and R G Johnson Satellite Observations of an Ionospheric Acceleration Mechanism Geophys Res Lett 3 654 1976
Young D T J Geiss H Balsiger P Eberhardt A Ghielmetti and H Rosenbauer Discovery of He2+ and 02+ ions of Terrestrial Origin in the Outer Magnetosphere Geophys Res Lett 4 561 1977

12
10
8
S3-3 REV 3124 S 29 JULY 1977
-0- 0 +
0 30 40 50 60 70 80
Figure 11 + +
Average Energiesof 0 and H 29 July 1977 Magnetic Storm
Ions During the Early Recovery Phase of the
LMSCD673774
in the average energy data being evident
Evidence for conical pitch angle distributions of 0+ ions was found in
the survey data for Revolution 3119 which was acquired(see Figure 2) during
the ring current build up Spin by spin plots of the-pitch angle distributions
at energies of 05 068 094 and 128 key for 9 successive spins between
L=405 and L=445 are shown in Figure 12 along with one spin at L=466
The loss cone regions between + 150 pitch angles is indicated by the cross
hatching The absence of upward streaming ions with fluxes peaked along
the field direction in this Northern hemisphere pass is evident -However
significant fluxes of upward flowing conical distributions are easily
identified along with weaker andless frequent fluxes of downward flowing
-conical distributions Locally mirroring (90) and predipitating (1650
1800) fluxes of 0+ ions are seen to be very low or absent at these lower
energies At energies above 2 keV-trapped and precipitating 0+ and H+
fluxes are observed in this same L-shell region No significant fluxes
of H+ ions with conical pitch angle distributions were observed in this
region Large spatial andor temperal variations in the upward flowing
conical fluxes can also be seen in a single scan through the pitch angle
range of the conical fluxes This is seen in Figure 12 at 13857 13872
13889 and 13905 seconds During the 54 seconds required for the pitch
angle scans from 600 to 00 to 600 the spacecraft traveled about 25 km Thus
spatial structures less than 25 km andor temporal changes in less than 6
seconds are associated with the conical pitch angle distributions
During REV 3119 significant fluxes of He++ were also observed at
L-shells greater than L=4 Examples of the mass spectrum for three energy
intervals in the range L=40-45 is shown in Figure 13 The He++ mass
-17shy
LMSCD673774
T = 13808 sec 20 LI
10 -29 JULY 1977 L=405
=UT 13825 sec 20 - 0 + IONS E=094 keV
10
100 E= 128 keV
= 0 xO LIT 13857 sec20
SUT = 13872 sec
20 E= 050 keV
1020 E=0613889esacSUT = = 0 9 4
10- iE keV0
LIT = 13905 sec
010 E- 128 keV
20 20 UT = 13921 sec-20 E = 068 keV
10
6 9 T= = 13937 sc20 - 1 E 050 keV
I08shy
30 - LIT = 1400 sec = 0 50 k e V (E b
20 - L = 466
10shy
180 150 120 90 60 30 0 30 60 90 120 150 180
PITCH ANGLE
Figure 12 Conical Pitch Angle Distributions observed During the Injection Phase of the 29 July 1977 Magnetic Storm
deg + REV 3119 REV 3119 REV 3119 L -40-45 L = 40- 45 L - 40-45
200 E - 05-128keV E 176-45keV E - 62-16OkeV
150 - 5 0+ + 1500 +
i15 150 5 0
z z 0 0 0 2500
0 +100 000 100 1000 I00 2000
He~+ He He + 150050 He 500 50 + 500 50 4 +1
eHe1000
5 10 5 20 25 0 1 5 10 15 20 25 30
0 5 10 15 20 25 30 5 10 15 20 25 30
CHANNEL NUMBER CHANNEL NUMBER CHANNEL NUMBER
Figure 13 Mass Spectra Showing the Relatively Large He++ Fluxes in the L=40-45 Region During Injection Phase of the 29 July 1977 Magnetic Storm
-19shy
LMSCD673774
peaks are easily identified and are comparable with or larger than the He+
intensities The energy distributions for H+ 0+ and He averaged over
the region L=4-6 are shown in Figure 14 The 0+ spectrum is significantly
softer than the H+ and He++ spectrums which may indicate a different source
region for the 0+ fluxes than for most of the H+ fluxes
The percentage of the H+ fluxes found for the 0+ and He++ fluxes
over the energy range of the instrument is shown in Figure 15 In the
range L=4-7 the He++ is seen to be about 1-2 percent of the H+ The
relatively high He++H+ and He++He + ratios are incompatible with the
ionosphere being the origin of He++ [Young et al 1977] and thus it is
concluded that the He++ ions are of solar wind origin (see Section 5 for
discussion)
-20shy
S3-3 REV 3119 29 JULY 1977
o7 _ + L 40-60
10
100 In
105_
U X
z ib4 _H
10
10O4 10 ENERGY (keVQ) v
++ Figure 14 Energy Distributions of H He and 0+ Fluxes During the
Injection Phase of the 29 July 1977 Magnetic Storm
15
14 S3-3 REV 3119 29 JULY 1977
0+
12 0
X -1-03 + -9
U-
+ -2 He++
08
C4
LU S6shy
4 +
He
30 40 50 60 L
Figure 15 0+ and He++ Fluxes Relativeto the Ht Fluxes During the Injection Phase of the 29 July 1977 Manetic Storm
70
LMSCD673774
SECTION 3
15 FEBRUARY 1978 MAGNETIC STORM
In the process of surveying data from magnetic stroms that might
be suitable for more concentrated investigations as part of the IMS
relatively large fluxes of He++ ions were also observed on REV 4773
during the injection phase of the 15 February 1978 magnetic storm
DST for this storm peaked at -188 at 1266 hour and the data for REV 4773
were acquired about 2 hours prior to the peak when DST was -83y
A survey plot of the data from REV 4773 in the L-shell range 4 to 7
is shown in Figure 16 The abscissa shows universal time (SYST) geoshy
graphic longitude (LON) geographic latitude (LAT) spacecraft altitude
(ALT) invariant geomagnetic latutude (ILA)and magnetic local time Theshy
four lowest panels show the logarithm of the counts per half-second
counting interval for the electron spectrometers with the lowest energy
being CMEA etc The panel labelled PITCH shows the pitch angle of the
look direction of the spectrometers The next four panels show the
logarithm of the counts from ions with MQ=124 and 16 summed once per
second from selected output channels from all three of the ion mass
spectrometers giving an approximate measure of the relative flux of the
relevant species The next three panels (CXA-l CXA-2 and CXA-3 show
the 32 point mass spectrums for each mass spectrometer at one of the
four energy steps (for each spectrometer) indicated by the short bars in
the discretes panel The energy step code is no bar for step 1 a
double bar for step 2 a single bar above the baseline for step 3 and a
single bar on the baseline for energy step 4 These steps correspond
-23shy
S3-3 REV 4T73
15FE8RUARYIg9E
con -2 -h A
CMEC
51 6 1 0 6 I$1 r60
Figue 16 Survey Plot of Ion and Electron Data from the S3-3 Satellite Durinq the Injection Phase of
the 15 February 1978 Magnetic Storm
S 4 8 9 61 4 4 0 S0~43 114-~1
V ON646611
LMSCD673774
sequentially to the four energies for each spectrometer as discussed
in the Introduction
Two characteristics of the data particularly relevant to this report
are evident in Figure 16 Large upward streaming conical distributions
of 0+ ions (and some H+ ions) are seen in the time interval between
101749 and 102149 Also by comparing the MQ=2 (He++ ) response with
the MQ=l (He+ ) response in the time interval 101749 to 102549 and by
looking at the mass spectrums in this interval evidence for significant
He++ ions is found Most of the MQ=l and MQ=2 response in the-time
interval between 101349 and 101749 is due to background counts which
has been determined by detailed analysis of the responses between the peaks
in the mass spectrums Examples of the mass spectrums when summed over
the energy steps for each spectrometer in the range L=4-7 are shown in
Figure 17 The relatively large He He flux ratios should be noted
Figure 18 shows the He++ percentage of the H+ flux in the energy range of
the instrument and the He++iH+ ratio of the average phase space density
over the same measured velocity ranges (05-8 keVQ for H+ and 10 to 16 keV
Q for He+) These relatively high values are compatible with solar wind
origin for the He+ + ions and are incompatible with ionospheric origin for
the He++ ions Also it is seen that significant He+ + fluxes are measurable
as low as L=39 Large background counts limit the sensitivity to He++
ions below L=39
-25shy
S3-3 REV 4473 15 FEBRUARY 1978
1000shy+
0 E = 05- 128 keV E 176-45keV E = 62- 160 keV H
X 025 800 0+ -0
0 +
Z 600 He4
H+0 e 02
4- X025
X 025r a 400- 4-4 H ++ + -+
H He HeHe U He He
200 1 1
5 10 15 20 25 30 5 10 15 20 25 30 5 10 15 20 25 30 CHANNEL NUMBER
Figure 17 Mass Spectrums Showing the Relatively Large He++ Ion Fluxes in the L=4-7 Region During
the Injection Phase of the 15 February 1978 Magnetic Storm
14 S3-3 REV 4773 15 FEBRUARY 1978
12
10 0
-UL Ut
z U-U
-0
LO U
0
i~ LU
2 2 0 0
30 40 50
L
-60 70
Figure 18 The He++ Percentage of the H+ Flux and the He H+ Ratio of Average Phase Space Density During the Injection Phase of the 15 February 1978-Magnetic Storm
LMSCD673774
SECTION 4
GEOMAGNETIC STORMS FOR IMS
In support of the International Magnetospheric Workshops at Innsbruck
Austria in June 1978 preliminary ion composition data from four magnetic
storms were prepared and presented These storms were on 29 July 1977
23 September 1977 2 December 1977 and 11 December 1977 Except for the
29 July storm further analysis of these events has not been pursued
under this program The Workshops were held to present preliminary IMS
data and then to select some time periods for more detailed study The
time periods selected for the mdre detailed IMS studies were associated
with the 2 December storm as the primary event and the 1I December storm
as the secondary event
Moderately good data coverage for the 2 and 11 December storms was
obtained with the S3-3 spacecraft in the ring current regions in the
midnight sector DST and the general location of S3-3 data acquisitions
for these storms are shown in Figures 19 and 20 TFor each storm data
are acquired during the injection phase within 3 hours of-the peak of the
main phase and during the recovery phase
Three examples of the data during orbit revolutions (REV) 4151 4153
and 4156 from the 2 December storm are shown in Figures 21 22 and 23 for
the inner (Llt4) ring current regions The data are in the same format as
for Figure 16 The data from REV 4151 seen in Figure 21 were acquired during
the injection phase when DST was approximately half of its peak value
-28shy
S3-3 COVERAGE
04
20 gt gt gt gt gt gt gt -20- t Lid LU LIILi
-40t
-60
-80shy
-100shy
-120shy
0bull 6 12 18 24 6 12 18 24
2 DEC 1977 UT (HOURS) 3 DEC 1977
Fiiure 19 Distribution of the S3-3 Satellite Data Acquisitions During the 2 December 1977 Magnetic Storm -29shy
S3-3 COVERAGE
-0 7 0 O 0
(N C1 M
C- CN (vO CN CNI
Mf COi C11
-20 114gtILU gtLLU
ICt gtLU
1-t gtLUt gt
LLI
CtT gt LU
t gt LU
c4 gt LL4
-40o -v v
-60shy
I I I I 1 -100 -
-120 -shy
06 6 12 18 24 6 2 is 24
71DEC 1977 UT (HOURS) 12 DEC 1977
Fig-ure 20 Distribution of the S33 Satellite Data Acquisitions During the 11 December 1977 Magnetic Storm
-30shy
L L LILI 1711
CXR-2
CXF4-3 8 2
P-
HH CMEB i
CMEDC-
SYST 0337i3
LON 30305 LA -54q2 ALT 733273 ILA 5970 ALT 2372
Figure 21
-
0538 13 033913 03 3-0 0341 113 042plusmn33 033 3shy30238 30173 30 10 300118 2998 29928 29870 29813-5334 -5226 -5117 -9007 -4896 -4783 98 70 -955
728572 7M3608 718383 712890 707135 7701117 694 36 688292 5909 588 5786 5725 5663 5601 5539 4 78 2371 2369 2388 2367 2366 2365 5236 2363
SurveyPlot of S3-3 Ion and Election Data During the Injection Phase of the 2 December 1977 Magnetic Storm
$ - shy
CXA-2
CX-3
-IMO=
PI~ICrA A A VV v -V v o bullV o bull V bullVVV bullV o V bull V bull bull V v
CHEB
CMEC
StST 093833 093933 091033 09q1133 0941233 09333 091133 094533 094633 LON 20848 20795 20742 20691 206 39 20588 20538 20488 - 201139 LAT -098 -3976 -3853 -3728 -3602 -3473 -333 -3211 -3077ALT 65865W 650768 612621 634219 625555 616632 607q51 59801q 588321 ILA 5723 5555 5586 5517 5446 5373 5300 5225 51S50 HLT 65 61 57 53 t9 45 1 37 33
00
Figure 22 Survey Plot of S3-3 Ion and Electron Data Near the Main Phase Peak of the 2 December 1977 Magnetic Storm
S3-3 REV 4156 N 2 DECEMBER 1977
CXA-2
IA -
PITCH shy
tHEA2r )rA A
CHER
sLsr 70330 163118 18321 8318 183418 6318 1836 to 183710 1838 18LON 7330 7281 7231 7182 7133 7085 7036 6988 69Z9LT -329 -2993 -2854 -Z713 -2569 -2I3 -271 -2122 -196 RS $8261 579339 56916s 5587qO I|SO 37151 519 92 51598 50961
5028 h79 61714 ILR 5678 583 S 86 5387 5287 s)86
HIT~~2 31231 31 31 310 2310 310 2310 2309
Figure 23 Survey Plot of S3-3 Ion and Electron Data During the Second Ring Current Injection Event of 2 December 1977 Magnetic Storm
LMSCD673774
Relatively large H+ fluxes compared to the 0+ are found at this phase
of the storm in the midnight sector The moderately large H+ fluxes
extend down to an invariant magnetic latitude (ILA) of about 557 (L=31)
During the next S3-3 data acquisition period (REV 4153) data are acquired
within 3 hours of the peak of DST These data for Llt35 are seen in
Figure 22 The 0+ fluxes are now found to be comparable to the H+ fluxes
and extend down to an invariant latitude of 53 (L=28) Data shown in
Figure 23 from REV 4156 were acquired during a second ring current injection
and the ion composition can be seen by pomparison with Figure 21 to be
quite different from the first injection event The 0+ flux is comparable
+to the H+ flux and evidence for He ions can be seen in the CXA-3 mass
plot and in the MQ=4 response plot
An example of data during the main phase of the 11 December storm is
shown in Figure 24 primarily toindicate evidence for a pitch angle scattering
process that is ion mass selective This can be seen in Figure 24 by
comparing the MQ=l response the MQ=16 response and the pitch angle
(PITCH) of the instrument look direction in the time period from 120022 to
120530 Loss cones for the H+ ions in this region are generally well
developed in both directions along the magnetic field whereas for the
0+ ions the loss cone region near 00 pitch angle (instrument pointed upward)
contains high fluxes and in some regions nearly isotropic fluxes At
this stage of analysis of these types of events it appears likely that
strong pitch angle scattering is occurring above the satellite for the
0+ ions but not for the H+ ions The precipitation of these large fluxes
of 0+ ions down to 560 magnetic latitude is expected to produce strong
heating at F-region altitudes Coordinated IMS investigations of this event
11 - ii DECEM BER 1977
CXP-2
CXa=2 A A A A AoA TTvw
IlE
P4EI
CHEC r-v-An--v---n
CMED 8I 7shy$5T 1200 I 0l 0ION 16660 166052 20222 1 0322 -120q16550 16495 2 j 5t22 1206221644 16389 16336 1 0722 I108216283 16231 Lnr -3919 -38l -3670 -3527 -338 -3232 -308 -2926 -2A~r 579507 5C9337 558915 5118245 537328 526168 514768 503132 (J26ILA 6015HLr 10 592105 582G 57 28 LG 7 55242o0 394 2390 2385 51118 5310 51922380 375 2371 tf
L O N 1 6 6 0 0 6 2
Figure 24 Surve Plot of 3-3 Ion and Electron Data Duringthe Main Phase ifthe 11 December 1977-CC
Magnetic Storm Large Fluxes of Precipitating 0 Ions Are Observed from 120022 toshy
120430 UT
LMSCD673774
could contribute to a better understanding of this energy disipation
in the upper atmosphere and ionosphere
The data from REV 4228 shown in Figure 24 were acquired at the peak
of the main phase of the storm The large 0+ fluxes observed throughout
the L=shell region from 27 to 40 (ILA=53-600 ) indicate that the
ionosphere is a significant contributor to the ring current fluxes in the
energy range from 05 to 16 keV
For the 2 and 11 December storms preliminary information was also
presented at the IMS Workshop at Innsbruch Austria on the location of
the dayside cusp the inner edge of the ring current and the polar cap
boundary as determined from the ion composition experiment on the S3-3
spacecraft
-36shy
LMSCD673774
SECTION 5
DISCUSSION AND CONCLUSIONS
Although the dynamic nature and local time assymetries of the ring
current during- the main phase of a magnetic storm make storm-to-storm
comparisons difficult some similarities between data taken near the
peaks of the main phases of the storms on 29 July 1977 and on 29 December
1976 are noteworthy The magnetic local time for the 29 July 1977 data
is near 0500 hours and for the 29 December 1976 data is near 0200 hours
As seen in Figure 5 the average energy distributions for the 0+ ions in
both storms are significantly softer than for the H+ ions in the L=3-4
range This was true at this time at all L-values below 60 for the
29 July storm as seen in Figure 6 This perhaps is indicative of different
source regions for the 0+ and H+ ions at this local time and phase of the
storm In addition as seen in Figure 4 the O number density significantly
exceeds the H+ number density within the instrument energy range near the
inner edge of the ring current in both of the storms A similar trend for
the precipitating fluxes also observed in the local morning sector during
the 17-18 December 1971 magnetic storms has been reported by Sharp et al
1976 Thus it appears that this is at least a commonly occurring feature
during the main phase of storms in the local morning sector
As noted in Section 2 the data on the average ion energies presented
in Figures 6 7 and 8 for the 29 July 1977 storm show a rather dramatic
drop in the average 0+ ion energies in the region of L=4-5 This is
just the region of upstreaming low energy 0+ ions seen in Figure 12 during
the injection phase of the storm These ions are at sufficiently high
pitch angles to be trapped and in a few cases in Figure 12 downward moving
LMSCD673774
trapped 0+ ions are also seen Trapped energetic elections are observed
at higher L-values on this same pass strongly indicating that the
upward flowing 0 ions are on closed field lines and thus are becoming a
part of the ring current at these low L-shells This mechanism of direct
injection of low energy ionospheric ions into the ring current at low
L-shells can then account for the low average 0+ energies in the L=4-5
regions observed in the data presented in Figures 6 7 and 8 The fact
that upstreaming ions are not observed in the L=4-5 regions for REV 3120
and 3121 could result from temporal or local time variations
This mechanism of direct injection of ionospheric ions into the ring
current at low L-shells is also supported by the S3-3 observations prior
to the main phase peak of the 15 February 1978 storm As noted earlier and
as seen in Figure 16 upward flowing conical distributions of 0+ and H+
ions are observed The most prominent upward flowing ions are in the L=45
to 51 region and are at trapped pitch angles Again trapped energetic
elections -are observed at higher L-shells strongly indicating that the
upward flowing 0 + ions are on closed field lines
The large fluxes of 0 + ions observed in the ring current during
the magnetic storms discussed in this report and during storms previously
reported on [Johnson etal 1979 and Geiss et al 1979] show that
the ionosphere is a major contributor to the ring current ions in the
energy range of the S3-3 satellite measurements (05-16 keV) The
contribution of solar wind ions to the ring current during magnetic storms
can be assessed from observations of the ratios of the He++H+ and He++
He+ intensities since the He++H+ flux ratio in the solar wind is
+relatively large (typically about 5 x 10⁻²) whereas the He++H and He++
LMSCID673774
He+ flux ratios for the ionospheric components found inthe outer
-magnetosphere by Young et al (1977) are relatively small (-10 3 and
-10-2 respectively)
For the 15 February 1978 magnetic storm it can be seen from Figure 18
that the He++H+ flux and phase space density ratios in the L=4-6 region
are typically greater than 10-2 and from Figure 17 that the He++He+ flux
ratio will be greater than 10 in a comparable L-shell region These
ratios are consistent with solar wind origin and inconsistent with ionoshy
spheric origin for the He ions
For the 29 July 1977 storm the He H+flux ratios as seen in Figure 15 are typically 1-2 x 10⁻² in the L=4-7 region The He++ fluxes
inthe L=40 to 45 region can be seen from Figure 13 to be comparable to
or larger than the He+ fluxes These data are also consistent with solar
wind origin but not with ionospheric origin for the He ions
The preliminary investigations of the 2 and 11 December 1977 magnetic
storms support the conclusions of the IMS Steering Committee that these
storms are good candidates for detailed and coordinated investigations by
the IMS community From the point of view of ring current composition they
appear to exhibit some interesting and perhaps unique composition features
for which adequate data exist to merit detailed analysis
-39shy
LMSCD673774
SECTION 6
REFERENCES
Geiss J H Balsiger P Eberhardt HP Walker L Weber D T Young and H Rosenbauer Dynamics of Magnetospheric ions as observed by the GEOS Mass Spectrometer Proceedings of the 13th ESLAB Symposium Innsbruch Austria June 5-7 1978 Space Science Reviews in press
Ghielmetti A G R G Johnson R D Sharp and E G Shelley The Latitude Diurnal and Altitudinal Distributions of Upward Flowing Energetic Ions of Ionospheric Origin Geophys Res Lett 5 59 1978
Johnson R G R D Sharp and E G Shelley Observation of Ions of Ionoshyspheric Origin in the Storm-Time Ring Current Geophys Res Lett 4 403 1977
Johnson R G W Lennartson R D Sharp E G Shelley and H Balsiger The Composition of the Near Equatorial Ring Current During the December 11 1977 Magnetic Storm EDS 59 1163 1978
Reed R D E G Shelley J C Bakke T C Sanders and J D McDaniel A Low-Energy Channel-Multiplier Spectrometer for ATS-E IEEE Trans Nucl Sci NS-16 259 1969
Sharp R D R G Johnson and E G Shelley The Morphology of Energetic 0+ Ions During Two Magnetic Storms Latitudinal Variations J GeophysRes 81 3292 1976
Shelley E G R G Johnson and R D Sharp Satellite Observations of Energetic Heavy Ions During a Geomagnetic Storm J Geophys Res 77 6104 1972
Shelley E G R D Sharp and R G Johnson Satellite Observations of an Ionospheric Acceleration Mechanism Geophys Res Lett 3 654 1976
Young D T J Geiss H Balsiger P Eberhardt A Ghielmetti and H Rosenbauer Discovery of He2+ and 02+ ions of Terrestrial Origin in the Outer Magnetosphere Geophys Res Lett 4 561 1977

LMSCD673774
T = 13808 sec 20 LI
10 -29 JULY 1977 L=405
=UT 13825 sec 20 - 0 + IONS E=094 keV
10
100 E= 128 keV
= 0 xO LIT 13857 sec20
SUT = 13872 sec
20 E= 050 keV
1020 E=0613889esacSUT = = 0 9 4
10- iE keV0
LIT = 13905 sec
010 E- 128 keV
20 20 UT = 13921 sec-20 E = 068 keV
10
6 9 T= = 13937 sc20 - 1 E 050 keV
I08shy
30 - LIT = 1400 sec = 0 50 k e V (E b
20 - L = 466
10shy
180 150 120 90 60 30 0 30 60 90 120 150 180
PITCH ANGLE
Figure 12 Conical Pitch Angle Distributions observed During the Injection Phase of the 29 July 1977 Magnetic Storm
deg + REV 3119 REV 3119 REV 3119 L -40-45 L = 40- 45 L - 40-45
200 E - 05-128keV E 176-45keV E - 62-16OkeV
150 - 5 0+ + 1500 +
i15 150 5 0
z z 0 0 0 2500
0 +100 000 100 1000 I00 2000
He~+ He He + 150050 He 500 50 + 500 50 4 +1
eHe1000
5 10 5 20 25 0 1 5 10 15 20 25 30
0 5 10 15 20 25 30 5 10 15 20 25 30
CHANNEL NUMBER CHANNEL NUMBER CHANNEL NUMBER
Figure 13 Mass Spectra Showing the Relatively Large He++ Fluxes in the L=40-45 Region During Injection Phase of the 29 July 1977 Magnetic Storm
-19shy
LMSCD673774
peaks are easily identified and are comparable with or larger than the He+
intensities The energy distributions for H+ 0+ and He averaged over
the region L=4-6 are shown in Figure 14 The 0+ spectrum is significantly
softer than the H+ and He++ spectrums which may indicate a different source
region for the 0+ fluxes than for most of the H+ fluxes
The percentage of the H+ fluxes found for the 0+ and He++ fluxes
over the energy range of the instrument is shown in Figure 15 In the
range L=4-7 the He++ is seen to be about 1-2 percent of the H+ The
relatively high He++H+ and He++He + ratios are incompatible with the
ionosphere being the origin of He++ [Young et al 1977] and thus it is
concluded that the He++ ions are of solar wind origin (see Section 5 for
discussion)
-20shy
S3-3 REV 3119 29 JULY 1977
o7 _ + L 40-60
10
100 In
105_
U X
z ib4 _H
10
10O4 10 ENERGY (keVQ) v
++ Figure 14 Energy Distributions of H He and 0+ Fluxes During the
Injection Phase of the 29 July 1977 Magnetic Storm
15
14 S3-3 REV 3119 29 JULY 1977
0+
12 0
X -1-03 + -9
U-
+ -2 He++
08
C4
LU S6shy
4 +
He
30 40 50 60 L
Figure 15 0+ and He++ Fluxes Relativeto the Ht Fluxes During the Injection Phase of the 29 July 1977 Manetic Storm
70
LMSCD673774
SECTION 3
15 FEBRUARY 1978 MAGNETIC STORM
In the process of surveying data from magnetic stroms that might
be suitable for more concentrated investigations as part of the IMS
relatively large fluxes of He++ ions were also observed on REV 4773
during the injection phase of the 15 February 1978 magnetic storm
DST for this storm peaked at -188 at 1266 hour and the data for REV 4773
were acquired about 2 hours prior to the peak when DST was -83y
A survey plot of the data from REV 4773 in the L-shell range 4 to 7
is shown in Figure 16 The abscissa shows universal time (SYST) geoshy
graphic longitude (LON) geographic latitude (LAT) spacecraft altitude
(ALT) invariant geomagnetic latutude (ILA)and magnetic local time Theshy
four lowest panels show the logarithm of the counts per half-second
counting interval for the electron spectrometers with the lowest energy
being CMEA etc The panel labelled PITCH shows the pitch angle of the
look direction of the spectrometers The next four panels show the
logarithm of the counts from ions with MQ=124 and 16 summed once per
second from selected output channels from all three of the ion mass
spectrometers giving an approximate measure of the relative flux of the
relevant species The next three panels (CXA-l CXA-2 and CXA-3 show
the 32 point mass spectrums for each mass spectrometer at one of the
four energy steps (for each spectrometer) indicated by the short bars in
the discretes panel The energy step code is no bar for step 1 a
double bar for step 2 a single bar above the baseline for step 3 and a
single bar on the baseline for energy step 4 These steps correspond
-23shy
S3-3 REV 4T73
15FE8RUARYIg9E
con -2 -h A
CMEC
51 6 1 0 6 I$1 r60
Figue 16 Survey Plot of Ion and Electron Data from the S3-3 Satellite Durinq the Injection Phase of
the 15 February 1978 Magnetic Storm
S 4 8 9 61 4 4 0 S0~43 114-~1
V ON646611
LMSCD673774
sequentially to the four energies for each spectrometer as discussed
in the Introduction
Two characteristics of the data particularly relevant to this report
are evident in Figure 16 Large upward streaming conical distributions
of 0+ ions (and some H+ ions) are seen in the time interval between
101749 and 102149 Also by comparing the MQ=2 (He++ ) response with
the MQ=l (He+ ) response in the time interval 101749 to 102549 and by
looking at the mass spectrums in this interval evidence for significant
He++ ions is found Most of the MQ=l and MQ=2 response in the-time
interval between 101349 and 101749 is due to background counts which
has been determined by detailed analysis of the responses between the peaks
in the mass spectrums Examples of the mass spectrums when summed over
the energy steps for each spectrometer in the range L=4-7 are shown in
Figure 17 The relatively large He He flux ratios should be noted
Figure 18 shows the He++ percentage of the H+ flux in the energy range of
the instrument and the He++iH+ ratio of the average phase space density
over the same measured velocity ranges (05-8 keVQ for H+ and 10 to 16 keV
Q for He+) These relatively high values are compatible with solar wind
origin for the He+ + ions and are incompatible with ionospheric origin for
the He++ ions Also it is seen that significant He+ + fluxes are measurable
as low as L=39 Large background counts limit the sensitivity to He++
ions below L=39
-25shy
S3-3 REV 4473 15 FEBRUARY 1978
1000shy+
0 E = 05- 128 keV E 176-45keV E = 62- 160 keV H
X 025 800 0+ -0
0 +
Z 600 He4
H+0 e 02
4- X025
X 025r a 400- 4-4 H ++ + -+
H He HeHe U He He
200 1 1
5 10 15 20 25 30 5 10 15 20 25 30 5 10 15 20 25 30 CHANNEL NUMBER
Figure 17 Mass Spectrums Showing the Relatively Large He++ Ion Fluxes in the L=4-7 Region During
the Injection Phase of the 15 February 1978 Magnetic Storm
14 S3-3 REV 4773 15 FEBRUARY 1978
12
10 0
-UL Ut
z U-U
-0
LO U
0
i~ LU
2 2 0 0
30 40 50
L
-60 70
Figure 18 The He++ Percentage of the H+ Flux and the He H+ Ratio of Average Phase Space Density During the Injection Phase of the 15 February 1978-Magnetic Storm
LMSCD673774
SECTION 4
GEOMAGNETIC STORMS FOR IMS
In support of the International Magnetospheric Workshops at Innsbruck
Austria in June 1978 preliminary ion composition data from four magnetic
storms were prepared and presented These storms were on 29 July 1977
23 September 1977 2 December 1977 and 11 December 1977 Except for the
29 July storm further analysis of these events has not been pursued
under this program The Workshops were held to present preliminary IMS
data and then to select some time periods for more detailed study The
time periods selected for the mdre detailed IMS studies were associated
with the 2 December storm as the primary event and the 1I December storm
as the secondary event
Moderately good data coverage for the 2 and 11 December storms was
obtained with the S3-3 spacecraft in the ring current regions in the
midnight sector DST and the general location of S3-3 data acquisitions
for these storms are shown in Figures 19 and 20 TFor each storm data
are acquired during the injection phase within 3 hours of-the peak of the
main phase and during the recovery phase
Three examples of the data during orbit revolutions (REV) 4151 4153
and 4156 from the 2 December storm are shown in Figures 21 22 and 23 for
the inner (Llt4) ring current regions The data are in the same format as
for Figure 16 The data from REV 4151 seen in Figure 21 were acquired during
the injection phase when DST was approximately half of its peak value
-28shy
S3-3 COVERAGE
04
20 gt gt gt gt gt gt gt -20- t Lid LU LIILi
-40t
-60
-80shy
-100shy
-120shy
0bull 6 12 18 24 6 12 18 24
2 DEC 1977 UT (HOURS) 3 DEC 1977
Fiiure 19 Distribution of the S3-3 Satellite Data Acquisitions During the 2 December 1977 Magnetic Storm -29shy
S3-3 COVERAGE
-0 7 0 O 0
(N C1 M
C- CN (vO CN CNI
Mf COi C11
-20 114gtILU gtLLU
ICt gtLU
1-t gtLUt gt
LLI
CtT gt LU
t gt LU
c4 gt LL4
-40o -v v
-60shy
I I I I 1 -100 -
-120 -shy
06 6 12 18 24 6 2 is 24
71DEC 1977 UT (HOURS) 12 DEC 1977
Fig-ure 20 Distribution of the S33 Satellite Data Acquisitions During the 11 December 1977 Magnetic Storm
-30shy
L L LILI 1711
CXR-2
CXF4-3 8 2
P-
HH CMEB i
CMEDC-
SYST 0337i3
LON 30305 LA -54q2 ALT 733273 ILA 5970 ALT 2372
Figure 21
-
0538 13 033913 03 3-0 0341 113 042plusmn33 033 3shy30238 30173 30 10 300118 2998 29928 29870 29813-5334 -5226 -5117 -9007 -4896 -4783 98 70 -955
728572 7M3608 718383 712890 707135 7701117 694 36 688292 5909 588 5786 5725 5663 5601 5539 4 78 2371 2369 2388 2367 2366 2365 5236 2363
SurveyPlot of S3-3 Ion and Election Data During the Injection Phase of the 2 December 1977 Magnetic Storm
$ - shy
CXA-2
CX-3
-IMO=
PI~ICrA A A VV v -V v o bullV o bull V bullVVV bullV o V bull V bull bull V v
CHEB
CMEC
StST 093833 093933 091033 09q1133 0941233 09333 091133 094533 094633 LON 20848 20795 20742 20691 206 39 20588 20538 20488 - 201139 LAT -098 -3976 -3853 -3728 -3602 -3473 -333 -3211 -3077ALT 65865W 650768 612621 634219 625555 616632 607q51 59801q 588321 ILA 5723 5555 5586 5517 5446 5373 5300 5225 51S50 HLT 65 61 57 53 t9 45 1 37 33
00
Figure 22 Survey Plot of S3-3 Ion and Electron Data Near the Main Phase Peak of the 2 December 1977 Magnetic Storm
S3-3 REV 4156 N 2 DECEMBER 1977
CXA-2
IA -
PITCH shy
tHEA2r )rA A
CHER
sLsr 70330 163118 18321 8318 183418 6318 1836 to 183710 1838 18LON 7330 7281 7231 7182 7133 7085 7036 6988 69Z9LT -329 -2993 -2854 -Z713 -2569 -2I3 -271 -2122 -196 RS $8261 579339 56916s 5587qO I|SO 37151 519 92 51598 50961
5028 h79 61714 ILR 5678 583 S 86 5387 5287 s)86
HIT~~2 31231 31 31 310 2310 310 2310 2309
Figure 23 Survey Plot of S3-3 Ion and Electron Data During the Second Ring Current Injection Event of 2 December 1977 Magnetic Storm
LMSCD673774
Relatively large H+ fluxes compared to the 0+ are found at this phase
of the storm in the midnight sector The moderately large H+ fluxes
extend down to an invariant magnetic latitude (ILA) of about 557 (L=31)
During the next S3-3 data acquisition period (REV 4153) data are acquired
within 3 hours of the peak of DST These data for Llt35 are seen in
Figure 22 The 0+ fluxes are now found to be comparable to the H+ fluxes
and extend down to an invariant latitude of 53 (L=28) Data shown in
Figure 23 from REV 4156 were acquired during a second ring current injection
and the ion composition can be seen by pomparison with Figure 21 to be
quite different from the first injection event The 0+ flux is comparable
+to the H+ flux and evidence for He ions can be seen in the CXA-3 mass
plot and in the MQ=4 response plot
An example of data during the main phase of the 11 December storm is
shown in Figure 24 primarily toindicate evidence for a pitch angle scattering
process that is ion mass selective This can be seen in Figure 24 by
comparing the MQ=l response the MQ=16 response and the pitch angle
(PITCH) of the instrument look direction in the time period from 120022 to
120530 Loss cones for the H+ ions in this region are generally well
developed in both directions along the magnetic field whereas for the
0+ ions the loss cone region near 00 pitch angle (instrument pointed upward)
contains high fluxes and in some regions nearly isotropic fluxes At
this stage of analysis of these types of events it appears likely that
strong pitch angle scattering is occurring above the satellite for the
0+ ions but not for the H+ ions The precipitation of these large fluxes
of 0+ ions down to 560 magnetic latitude is expected to produce strong
heating at F-region altitudes Coordinated IMS investigations of this event
11 - ii DECEM BER 1977
CXP-2
CXa=2 A A A A AoA TTvw
IlE
P4EI
CHEC r-v-An--v---n
CMED 8I 7shy$5T 1200 I 0l 0ION 16660 166052 20222 1 0322 -120q16550 16495 2 j 5t22 1206221644 16389 16336 1 0722 I108216283 16231 Lnr -3919 -38l -3670 -3527 -338 -3232 -308 -2926 -2A~r 579507 5C9337 558915 5118245 537328 526168 514768 503132 (J26ILA 6015HLr 10 592105 582G 57 28 LG 7 55242o0 394 2390 2385 51118 5310 51922380 375 2371 tf
L O N 1 6 6 0 0 6 2
Figure 24 Surve Plot of 3-3 Ion and Electron Data Duringthe Main Phase ifthe 11 December 1977-CC
Magnetic Storm Large Fluxes of Precipitating 0 Ions Are Observed from 120022 toshy
120430 UT
LMSCD673774
could contribute to a better understanding of this energy disipation
in the upper atmosphere and ionosphere
The data from REV 4228 shown in Figure 24 were acquired at the peak
of the main phase of the storm The large 0+ fluxes observed throughout
the L=shell region from 27 to 40 (ILA=53-600 ) indicate that the
ionosphere is a significant contributor to the ring current fluxes in the
energy range from 05 to 16 keV
For the 2 and 11 December storms preliminary information was also
presented at the IMS Workshop at Innsbruch Austria on the location of
the dayside cusp the inner edge of the ring current and the polar cap
boundary as determined from the ion composition experiment on the S3-3
spacecraft
-36shy
LMSCD673774
SECTION 5
DISCUSSION AND CONCLUSIONS
Although the dynamic nature and local time assymetries of the ring
current during- the main phase of a magnetic storm make storm-to-storm
comparisons difficult some similarities between data taken near the
peaks of the main phases of the storms on 29 July 1977 and on 29 December
1976 are noteworthy The magnetic local time for the 29 July 1977 data
is near 0500 hours and for the 29 December 1976 data is near 0200 hours
As seen in Figure 5 the average energy distributions for the 0+ ions in
both storms are significantly softer than for the H+ ions in the L=3-4
range This was true at this time at all L-values below 60 for the
29 July storm as seen in Figure 6 This perhaps is indicative of different
source regions for the 0+ and H+ ions at this local time and phase of the
storm In addition as seen in Figure 4 the O number density significantly
exceeds the H+ number density within the instrument energy range near the
inner edge of the ring current in both of the storms A similar trend for
the precipitating fluxes also observed in the local morning sector during
the 17-18 December 1971 magnetic storms has been reported by Sharp et al
1976 Thus it appears that this is at least a commonly occurring feature
during the main phase of storms in the local morning sector
As noted in Section 2 the data on the average ion energies presented
in Figures 6 7 and 8 for the 29 July 1977 storm show a rather dramatic
drop in the average 0+ ion energies in the region of L=4-5 This is
just the region of upstreaming low energy 0+ ions seen in Figure 12 during
the injection phase of the storm These ions are at sufficiently high
pitch angles to be trapped and in a few cases in Figure 12 downward moving
LMSCD673774
trapped 0+ ions are also seen Trapped energetic elections are observed
at higher L-values on this same pass strongly indicating that the
upward flowing 0 ions are on closed field lines and thus are becoming a
part of the ring current at these low L-shells This mechanism of direct
injection of low energy ionospheric ions into the ring current at low
L-shells can then account for the low average 0+ energies in the L=4-5
regions observed in the data presented in Figures 6 7 and 8 The fact
that upstreaming ions are not observed in the L=4-5 regions for REV 3120
and 3121 could result from temporal or local time variations
This mechanism of direct injection of ionospheric ions into the ring
current at low L-shells is also supported by the S3-3 observations prior
to the main phase peak of the 15 February 1978 storm As noted earlier and
as seen in Figure 16 upward flowing conical distributions of 0+ and H+
ions are observed The most prominent upward flowing ions are in the L=45
to 51 region and are at trapped pitch angles Again trapped energetic
elections -are observed at higher L-shells strongly indicating that the
upward flowing 0 + ions are on closed field lines
The large fluxes of 0 + ions observed in the ring current during
the magnetic storms discussed in this report and during storms previously
reported on [Johnson etal 1979 and Geiss et al 1979] show that
the ionosphere is a major contributor to the ring current ions in the
energy range of the S3-3 satellite measurements (05-16 keV) The
contribution of solar wind ions to the ring current during magnetic storms
can be assessed from observations of the ratios of the He++H+ and He++
He+ intensities since the He++H+ flux ratio in the solar wind is
+relatively large (typically about 5 x 10⁻²) whereas the He++H and He++
LMSCID673774
He+ flux ratios for the ionospheric components found inthe outer
-magnetosphere by Young et al (1977) are relatively small (-10 3 and
-10-2 respectively)
For the 15 February 1978 magnetic storm it can be seen from Figure 18
that the He++H+ flux and phase space density ratios in the L=4-6 region
are typically greater than 10-2 and from Figure 17 that the He++He+ flux
ratio will be greater than 10 in a comparable L-shell region These
ratios are consistent with solar wind origin and inconsistent with ionoshy
spheric origin for the He ions
For the 29 July 1977 storm the He H+flux ratios as seen in Figure 15 are typically 1-2 x 10⁻² in the L=4-7 region The He++ fluxes
inthe L=40 to 45 region can be seen from Figure 13 to be comparable to
or larger than the He+ fluxes These data are also consistent with solar
wind origin but not with ionospheric origin for the He ions
The preliminary investigations of the 2 and 11 December 1977 magnetic
storms support the conclusions of the IMS Steering Committee that these
storms are good candidates for detailed and coordinated investigations by
the IMS community From the point of view of ring current composition they
appear to exhibit some interesting and perhaps unique composition features
for which adequate data exist to merit detailed analysis
-39shy
LMSCD673774
SECTION 6
REFERENCES
Geiss J H Balsiger P Eberhardt HP Walker L Weber D T Young and H Rosenbauer Dynamics of Magnetospheric ions as observed by the GEOS Mass Spectrometer Proceedings of the 13th ESLAB Symposium Innsbruch Austria June 5-7 1978 Space Science Reviews in press
Ghielmetti A G R G Johnson R D Sharp and E G Shelley The Latitude Diurnal and Altitudinal Distributions of Upward Flowing Energetic Ions of Ionospheric Origin Geophys Res Lett 5 59 1978
Johnson R G R D Sharp and E G Shelley Observation of Ions of Ionoshyspheric Origin in the Storm-Time Ring Current Geophys Res Lett 4 403 1977
Johnson R G W Lennartson R D Sharp E G Shelley and H Balsiger The Composition of the Near Equatorial Ring Current During the December 11 1977 Magnetic Storm EDS 59 1163 1978
Reed R D E G Shelley J C Bakke T C Sanders and J D McDaniel A Low-Energy Channel-Multiplier Spectrometer for ATS-E IEEE Trans Nucl Sci NS-16 259 1969
Sharp R D R G Johnson and E G Shelley The Morphology of Energetic 0+ Ions During Two Magnetic Storms Latitudinal Variations J GeophysRes 81 3292 1976
Shelley E G R G Johnson and R D Sharp Satellite Observations of Energetic Heavy Ions During a Geomagnetic Storm J Geophys Res 77 6104 1972
Shelley E G R D Sharp and R G Johnson Satellite Observations of an Ionospheric Acceleration Mechanism Geophys Res Lett 3 654 1976
Young D T J Geiss H Balsiger P Eberhardt A Ghielmetti and H Rosenbauer Discovery of He2+ and 02+ ions of Terrestrial Origin in the Outer Magnetosphere Geophys Res Lett 4 561 1977

LMSCD673774
peaks are easily identified and are comparable with or larger than the He+
intensities The energy distributions for H+ 0+ and He averaged over
the region L=4-6 are shown in Figure 14 The 0+ spectrum is significantly
softer than the H+ and He++ spectrums which may indicate a different source
region for the 0+ fluxes than for most of the H+ fluxes
The percentage of the H+ fluxes found for the 0+ and He++ fluxes
over the energy range of the instrument is shown in Figure 15 In the
range L=4-7 the He++ is seen to be about 1-2 percent of the H+ The
relatively high He++H+ and He++He + ratios are incompatible with the
ionosphere being the origin of He++ [Young et al 1977] and thus it is
concluded that the He++ ions are of solar wind origin (see Section 5 for
discussion)
-20shy
S3-3 REV 3119 29 JULY 1977
o7 _ + L 40-60
10
100 In
105_
U X
z ib4 _H
10
10O4 10 ENERGY (keVQ) v
++ Figure 14 Energy Distributions of H He and 0+ Fluxes During the
Injection Phase of the 29 July 1977 Magnetic Storm
15
14 S3-3 REV 3119 29 JULY 1977
0+
12 0
X -1-03 + -9
U-
+ -2 He++
08
C4
LU S6shy
4 +
He
30 40 50 60 L
Figure 15 0+ and He++ Fluxes Relativeto the Ht Fluxes During the Injection Phase of the 29 July 1977 Manetic Storm
70
LMSCD673774
SECTION 3
15 FEBRUARY 1978 MAGNETIC STORM
In the process of surveying data from magnetic stroms that might
be suitable for more concentrated investigations as part of the IMS
relatively large fluxes of He++ ions were also observed on REV 4773
during the injection phase of the 15 February 1978 magnetic storm
DST for this storm peaked at -188 at 1266 hour and the data for REV 4773
were acquired about 2 hours prior to the peak when DST was -83y
A survey plot of the data from REV 4773 in the L-shell range 4 to 7
is shown in Figure 16 The abscissa shows universal time (SYST) geoshy
graphic longitude (LON) geographic latitude (LAT) spacecraft altitude
(ALT) invariant geomagnetic latutude (ILA)and magnetic local time Theshy
four lowest panels show the logarithm of the counts per half-second
counting interval for the electron spectrometers with the lowest energy
being CMEA etc The panel labelled PITCH shows the pitch angle of the
look direction of the spectrometers The next four panels show the
logarithm of the counts from ions with MQ=124 and 16 summed once per
second from selected output channels from all three of the ion mass
spectrometers giving an approximate measure of the relative flux of the
relevant species The next three panels (CXA-l CXA-2 and CXA-3 show
the 32 point mass spectrums for each mass spectrometer at one of the
four energy steps (for each spectrometer) indicated by the short bars in
the discretes panel The energy step code is no bar for step 1 a
double bar for step 2 a single bar above the baseline for step 3 and a
single bar on the baseline for energy step 4 These steps correspond
-23shy
S3-3 REV 4T73
15FE8RUARYIg9E
con -2 -h A
CMEC
51 6 1 0 6 I$1 r60
Figue 16 Survey Plot of Ion and Electron Data from the S3-3 Satellite Durinq the Injection Phase of
the 15 February 1978 Magnetic Storm
S 4 8 9 61 4 4 0 S0~43 114-~1
V ON646611
LMSCD673774
sequentially to the four energies for each spectrometer as discussed
in the Introduction
Two characteristics of the data particularly relevant to this report
are evident in Figure 16 Large upward streaming conical distributions
of 0+ ions (and some H+ ions) are seen in the time interval between
101749 and 102149 Also by comparing the MQ=2 (He++ ) response with
the MQ=l (He+ ) response in the time interval 101749 to 102549 and by
looking at the mass spectrums in this interval evidence for significant
He++ ions is found Most of the MQ=l and MQ=2 response in the-time
interval between 101349 and 101749 is due to background counts which
has been determined by detailed analysis of the responses between the peaks
in the mass spectrums Examples of the mass spectrums when summed over
the energy steps for each spectrometer in the range L=4-7 are shown in
Figure 17 The relatively large He He flux ratios should be noted
Figure 18 shows the He++ percentage of the H+ flux in the energy range of
the instrument and the He++iH+ ratio of the average phase space density
over the same measured velocity ranges (05-8 keVQ for H+ and 10 to 16 keV
Q for He+) These relatively high values are compatible with solar wind
origin for the He+ + ions and are incompatible with ionospheric origin for
the He++ ions Also it is seen that significant He+ + fluxes are measurable
as low as L=39 Large background counts limit the sensitivity to He++
ions below L=39
-25shy
S3-3 REV 4473 15 FEBRUARY 1978
1000shy+
0 E = 05- 128 keV E 176-45keV E = 62- 160 keV H
X 025 800 0+ -0
0 +
Z 600 He4
H+0 e 02
4- X025
X 025r a 400- 4-4 H ++ + -+
H He HeHe U He He
200 1 1
5 10 15 20 25 30 5 10 15 20 25 30 5 10 15 20 25 30 CHANNEL NUMBER
Figure 17 Mass Spectrums Showing the Relatively Large He++ Ion Fluxes in the L=4-7 Region During
the Injection Phase of the 15 February 1978 Magnetic Storm
14 S3-3 REV 4773 15 FEBRUARY 1978
12
10 0
-UL Ut
z U-U
-0
LO U
0
i~ LU
2 2 0 0
30 40 50
L
-60 70
Figure 18 The He++ Percentage of the H+ Flux and the He H+ Ratio of Average Phase Space Density During the Injection Phase of the 15 February 1978-Magnetic Storm
LMSCD673774
SECTION 4
GEOMAGNETIC STORMS FOR IMS
In support of the International Magnetospheric Workshops at Innsbruck
Austria in June 1978 preliminary ion composition data from four magnetic
storms were prepared and presented These storms were on 29 July 1977
23 September 1977 2 December 1977 and 11 December 1977 Except for the
29 July storm further analysis of these events has not been pursued
under this program The Workshops were held to present preliminary IMS
data and then to select some time periods for more detailed study The
time periods selected for the mdre detailed IMS studies were associated
with the 2 December storm as the primary event and the 1I December storm
as the secondary event
Moderately good data coverage for the 2 and 11 December storms was
obtained with the S3-3 spacecraft in the ring current regions in the
midnight sector DST and the general location of S3-3 data acquisitions
for these storms are shown in Figures 19 and 20 TFor each storm data
are acquired during the injection phase within 3 hours of-the peak of the
main phase and during the recovery phase
Three examples of the data during orbit revolutions (REV) 4151 4153
and 4156 from the 2 December storm are shown in Figures 21 22 and 23 for
the inner (Llt4) ring current regions The data are in the same format as
for Figure 16 The data from REV 4151 seen in Figure 21 were acquired during
the injection phase when DST was approximately half of its peak value
-28shy
S3-3 COVERAGE
04
20 gt gt gt gt gt gt gt -20- t Lid LU LIILi
-40t
-60
-80shy
-100shy
-120shy
0bull 6 12 18 24 6 12 18 24
2 DEC 1977 UT (HOURS) 3 DEC 1977
Fiiure 19 Distribution of the S3-3 Satellite Data Acquisitions During the 2 December 1977 Magnetic Storm -29shy
S3-3 COVERAGE
-0 7 0 O 0
(N C1 M
C- CN (vO CN CNI
Mf COi C11
-20 114gtILU gtLLU
ICt gtLU
1-t gtLUt gt
LLI
CtT gt LU
t gt LU
c4 gt LL4
-40o -v v
-60shy
I I I I 1 -100 -
-120 -shy
06 6 12 18 24 6 2 is 24
71DEC 1977 UT (HOURS) 12 DEC 1977
Fig-ure 20 Distribution of the S33 Satellite Data Acquisitions During the 11 December 1977 Magnetic Storm
-30shy
L L LILI 1711
CXR-2
CXF4-3 8 2
P-
HH CMEB i
CMEDC-
SYST 0337i3
LON 30305 LA -54q2 ALT 733273 ILA 5970 ALT 2372
Figure 21
-
0538 13 033913 03 3-0 0341 113 042plusmn33 033 3shy30238 30173 30 10 300118 2998 29928 29870 29813-5334 -5226 -5117 -9007 -4896 -4783 98 70 -955
728572 7M3608 718383 712890 707135 7701117 694 36 688292 5909 588 5786 5725 5663 5601 5539 4 78 2371 2369 2388 2367 2366 2365 5236 2363
SurveyPlot of S3-3 Ion and Election Data During the Injection Phase of the 2 December 1977 Magnetic Storm
$ - shy
CXA-2
CX-3
-IMO=
PI~ICrA A A VV v -V v o bullV o bull V bullVVV bullV o V bull V bull bull V v
CHEB
CMEC
StST 093833 093933 091033 09q1133 0941233 09333 091133 094533 094633 LON 20848 20795 20742 20691 206 39 20588 20538 20488 - 201139 LAT -098 -3976 -3853 -3728 -3602 -3473 -333 -3211 -3077ALT 65865W 650768 612621 634219 625555 616632 607q51 59801q 588321 ILA 5723 5555 5586 5517 5446 5373 5300 5225 51S50 HLT 65 61 57 53 t9 45 1 37 33
00
Figure 22 Survey Plot of S3-3 Ion and Electron Data Near the Main Phase Peak of the 2 December 1977 Magnetic Storm
S3-3 REV 4156 N 2 DECEMBER 1977
CXA-2
IA -
PITCH shy
tHEA2r )rA A
CHER
sLsr 70330 163118 18321 8318 183418 6318 1836 to 183710 1838 18LON 7330 7281 7231 7182 7133 7085 7036 6988 69Z9LT -329 -2993 -2854 -Z713 -2569 -2I3 -271 -2122 -196 RS $8261 579339 56916s 5587qO I|SO 37151 519 92 51598 50961
5028 h79 61714 ILR 5678 583 S 86 5387 5287 s)86
HIT~~2 31231 31 31 310 2310 310 2310 2309
Figure 23 Survey Plot of S3-3 Ion and Electron Data During the Second Ring Current Injection Event of 2 December 1977 Magnetic Storm
LMSCD673774
Relatively large H+ fluxes compared to the 0+ are found at this phase
of the storm in the midnight sector The moderately large H+ fluxes
extend down to an invariant magnetic latitude (ILA) of about 557 (L=31)
During the next S3-3 data acquisition period (REV 4153) data are acquired
within 3 hours of the peak of DST These data for Llt35 are seen in
Figure 22 The 0+ fluxes are now found to be comparable to the H+ fluxes
and extend down to an invariant latitude of 53 (L=28) Data shown in
Figure 23 from REV 4156 were acquired during a second ring current injection
and the ion composition can be seen by pomparison with Figure 21 to be
quite different from the first injection event The 0+ flux is comparable
+to the H+ flux and evidence for He ions can be seen in the CXA-3 mass
plot and in the MQ=4 response plot
An example of data during the main phase of the 11 December storm is
shown in Figure 24 primarily toindicate evidence for a pitch angle scattering
process that is ion mass selective This can be seen in Figure 24 by
comparing the MQ=l response the MQ=16 response and the pitch angle
(PITCH) of the instrument look direction in the time period from 120022 to
120530 Loss cones for the H+ ions in this region are generally well
developed in both directions along the magnetic field whereas for the
0+ ions the loss cone region near 00 pitch angle (instrument pointed upward)
contains high fluxes and in some regions nearly isotropic fluxes At
this stage of analysis of these types of events it appears likely that
strong pitch angle scattering is occurring above the satellite for the
0+ ions but not for the H+ ions The precipitation of these large fluxes
of 0+ ions down to 560 magnetic latitude is expected to produce strong
heating at F-region altitudes Coordinated IMS investigations of this event
11 - ii DECEM BER 1977
CXP-2
CXa=2 A A A A AoA TTvw
IlE
P4EI
CHEC r-v-An--v---n
CMED 8I 7shy$5T 1200 I 0l 0ION 16660 166052 20222 1 0322 -120q16550 16495 2 j 5t22 1206221644 16389 16336 1 0722 I108216283 16231 Lnr -3919 -38l -3670 -3527 -338 -3232 -308 -2926 -2A~r 579507 5C9337 558915 5118245 537328 526168 514768 503132 (J26ILA 6015HLr 10 592105 582G 57 28 LG 7 55242o0 394 2390 2385 51118 5310 51922380 375 2371 tf
L O N 1 6 6 0 0 6 2
Figure 24 Surve Plot of 3-3 Ion and Electron Data Duringthe Main Phase ifthe 11 December 1977-CC
Magnetic Storm Large Fluxes of Precipitating 0 Ions Are Observed from 120022 toshy
120430 UT
LMSCD673774
could contribute to a better understanding of this energy disipation
in the upper atmosphere and ionosphere
The data from REV 4228 shown in Figure 24 were acquired at the peak
of the main phase of the storm The large 0+ fluxes observed throughout
the L=shell region from 27 to 40 (ILA=53-600 ) indicate that the
ionosphere is a significant contributor to the ring current fluxes in the
energy range from 05 to 16 keV
For the 2 and 11 December storms preliminary information was also
presented at the IMS Workshop at Innsbruch Austria on the location of
the dayside cusp the inner edge of the ring current and the polar cap
boundary as determined from the ion composition experiment on the S3-3
spacecraft
-36shy
LMSCD673774
SECTION 5
DISCUSSION AND CONCLUSIONS
Although the dynamic nature and local time assymetries of the ring
current during- the main phase of a magnetic storm make storm-to-storm
comparisons difficult some similarities between data taken near the
peaks of the main phases of the storms on 29 July 1977 and on 29 December
1976 are noteworthy The magnetic local time for the 29 July 1977 data
is near 0500 hours and for the 29 December 1976 data is near 0200 hours
As seen in Figure 5 the average energy distributions for the 0+ ions in
both storms are significantly softer than for the H+ ions in the L=3-4
range This was true at this time at all L-values below 60 for the
29 July storm as seen in Figure 6 This perhaps is indicative of different
source regions for the 0+ and H+ ions at this local time and phase of the
storm In addition as seen in Figure 4 the O number density significantly
exceeds the H+ number density within the instrument energy range near the
inner edge of the ring current in both of the storms A similar trend for
the precipitating fluxes also observed in the local morning sector during
the 17-18 December 1971 magnetic storms has been reported by Sharp et al
1976 Thus it appears that this is at least a commonly occurring feature
during the main phase of storms in the local morning sector
As noted in Section 2 the data on the average ion energies presented
in Figures 6 7 and 8 for the 29 July 1977 storm show a rather dramatic
drop in the average 0+ ion energies in the region of L=4-5 This is
just the region of upstreaming low energy 0+ ions seen in Figure 12 during
the injection phase of the storm These ions are at sufficiently high
pitch angles to be trapped and in a few cases in Figure 12 downward moving
LMSCD673774
trapped 0+ ions are also seen Trapped energetic elections are observed
at higher L-values on this same pass strongly indicating that the
upward flowing 0 ions are on closed field lines and thus are becoming a
part of the ring current at these low L-shells This mechanism of direct
injection of low energy ionospheric ions into the ring current at low
L-shells can then account for the low average 0+ energies in the L=4-5
regions observed in the data presented in Figures 6 7 and 8 The fact
that upstreaming ions are not observed in the L=4-5 regions for REV 3120
and 3121 could result from temporal or local time variations
This mechanism of direct injection of ionospheric ions into the ring
current at low L-shells is also supported by the S3-3 observations prior
to the main phase peak of the 15 February 1978 storm As noted earlier and
as seen in Figure 16 upward flowing conical distributions of 0+ and H+
ions are observed The most prominent upward flowing ions are in the L=45
to 51 region and are at trapped pitch angles Again trapped energetic
elections -are observed at higher L-shells strongly indicating that the
upward flowing 0 + ions are on closed field lines
The large fluxes of 0 + ions observed in the ring current during
the magnetic storms discussed in this report and during storms previously
reported on [Johnson etal 1979 and Geiss et al 1979] show that
the ionosphere is a major contributor to the ring current ions in the
energy range of the S3-3 satellite measurements (05-16 keV) The
contribution of solar wind ions to the ring current during magnetic storms
can be assessed from observations of the ratios of the He++H+ and He++
He+ intensities since the He++H+ flux ratio in the solar wind is
+relatively large (typically about 5 x 10⁻²) whereas the He++H and He++
LMSCID673774
He+ flux ratios for the ionospheric components found inthe outer
-magnetosphere by Young et al (1977) are relatively small (-10 3 and
-10-2 respectively)
For the 15 February 1978 magnetic storm it can be seen from Figure 18
that the He++H+ flux and phase space density ratios in the L=4-6 region
are typically greater than 10-2 and from Figure 17 that the He++He+ flux
ratio will be greater than 10 in a comparable L-shell region These
ratios are consistent with solar wind origin and inconsistent with ionoshy
spheric origin for the He ions
For the 29 July 1977 storm the He H+flux ratios as seen in Figure 15 are typically 1-2 x 10⁻² in the L=4-7 region The He++ fluxes
inthe L=40 to 45 region can be seen from Figure 13 to be comparable to
or larger than the He+ fluxes These data are also consistent with solar
wind origin but not with ionospheric origin for the He ions
The preliminary investigations of the 2 and 11 December 1977 magnetic
storms support the conclusions of the IMS Steering Committee that these
storms are good candidates for detailed and coordinated investigations by
the IMS community From the point of view of ring current composition they
appear to exhibit some interesting and perhaps unique composition features
for which adequate data exist to merit detailed analysis
-39shy
LMSCD673774
SECTION 6
REFERENCES
Geiss J H Balsiger P Eberhardt HP Walker L Weber D T Young and H Rosenbauer Dynamics of Magnetospheric ions as observed by the GEOS Mass Spectrometer Proceedings of the 13th ESLAB Symposium Innsbruch Austria June 5-7 1978 Space Science Reviews in press
Ghielmetti A G R G Johnson R D Sharp and E G Shelley The Latitude Diurnal and Altitudinal Distributions of Upward Flowing Energetic Ions of Ionospheric Origin Geophys Res Lett 5 59 1978
Johnson R G R D Sharp and E G Shelley Observation of Ions of Ionoshyspheric Origin in the Storm-Time Ring Current Geophys Res Lett 4 403 1977
Johnson R G W Lennartson R D Sharp E G Shelley and H Balsiger The Composition of the Near Equatorial Ring Current During the December 11 1977 Magnetic Storm EDS 59 1163 1978
Reed R D E G Shelley J C Bakke T C Sanders and J D McDaniel A Low-Energy Channel-Multiplier Spectrometer for ATS-E IEEE Trans Nucl Sci NS-16 259 1969
Sharp R D R G Johnson and E G Shelley The Morphology of Energetic 0+ Ions During Two Magnetic Storms Latitudinal Variations J GeophysRes 81 3292 1976
Shelley E G R G Johnson and R D Sharp Satellite Observations of Energetic Heavy Ions During a Geomagnetic Storm J Geophys Res 77 6104 1972
Shelley E G R D Sharp and R G Johnson Satellite Observations of an Ionospheric Acceleration Mechanism Geophys Res Lett 3 654 1976
Young D T J Geiss H Balsiger P Eberhardt A Ghielmetti and H Rosenbauer Discovery of He2+ and 02+ ions of Terrestrial Origin in the Outer Magnetosphere Geophys Res Lett 4 561 1977

LMSCD673774
SECTION 3
15 FEBRUARY 1978 MAGNETIC STORM
In the process of surveying data from magnetic stroms that might
be suitable for more concentrated investigations as part of the IMS
relatively large fluxes of He++ ions were also observed on REV 4773
during the injection phase of the 15 February 1978 magnetic storm
DST for this storm peaked at -188 at 1266 hour and the data for REV 4773
were acquired about 2 hours prior to the peak when DST was -83y
A survey plot of the data from REV 4773 in the L-shell range 4 to 7
is shown in Figure 16 The abscissa shows universal time (SYST) geoshy
graphic longitude (LON) geographic latitude (LAT) spacecraft altitude
(ALT) invariant geomagnetic latutude (ILA)and magnetic local time Theshy
four lowest panels show the logarithm of the counts per half-second
counting interval for the electron spectrometers with the lowest energy
being CMEA etc The panel labelled PITCH shows the pitch angle of the
look direction of the spectrometers The next four panels show the
logarithm of the counts from ions with MQ=124 and 16 summed once per
second from selected output channels from all three of the ion mass
spectrometers giving an approximate measure of the relative flux of the
relevant species The next three panels (CXA-l CXA-2 and CXA-3 show
the 32 point mass spectrums for each mass spectrometer at one of the
four energy steps (for each spectrometer) indicated by the short bars in
the discretes panel The energy step code is no bar for step 1 a
double bar for step 2 a single bar above the baseline for step 3 and a
single bar on the baseline for energy step 4 These steps correspond
-23shy
S3-3 REV 4T73
15FE8RUARYIg9E
con -2 -h A
CMEC
51 6 1 0 6 I$1 r60
Figue 16 Survey Plot of Ion and Electron Data from the S3-3 Satellite Durinq the Injection Phase of
the 15 February 1978 Magnetic Storm
S 4 8 9 61 4 4 0 S0~43 114-~1
V ON646611
LMSCD673774
sequentially to the four energies for each spectrometer as discussed
in the Introduction
Two characteristics of the data particularly relevant to this report
are evident in Figure 16 Large upward streaming conical distributions
of 0+ ions (and some H+ ions) are seen in the time interval between
101749 and 102149 Also by comparing the MQ=2 (He++ ) response with
the MQ=l (He+ ) response in the time interval 101749 to 102549 and by
looking at the mass spectrums in this interval evidence for significant
He++ ions is found Most of the MQ=l and MQ=2 response in the-time
interval between 101349 and 101749 is due to background counts which
has been determined by detailed analysis of the responses between the peaks
in the mass spectrums Examples of the mass spectrums when summed over
the energy steps for each spectrometer in the range L=4-7 are shown in
Figure 17 The relatively large He He flux ratios should be noted
Figure 18 shows the He++ percentage of the H+ flux in the energy range of
the instrument and the He++iH+ ratio of the average phase space density
over the same measured velocity ranges (05-8 keVQ for H+ and 10 to 16 keV
Q for He+) These relatively high values are compatible with solar wind
origin for the He+ + ions and are incompatible with ionospheric origin for
the He++ ions Also it is seen that significant He+ + fluxes are measurable
as low as L=39 Large background counts limit the sensitivity to He++
ions below L=39
-25shy
S3-3 REV 4473 15 FEBRUARY 1978
1000shy+
0 E = 05- 128 keV E 176-45keV E = 62- 160 keV H
X 025 800 0+ -0
0 +
Z 600 He4
H+0 e 02
4- X025
X 025r a 400- 4-4 H ++ + -+
H He HeHe U He He
200 1 1
5 10 15 20 25 30 5 10 15 20 25 30 5 10 15 20 25 30 CHANNEL NUMBER
Figure 17 Mass Spectrums Showing the Relatively Large He++ Ion Fluxes in the L=4-7 Region During
the Injection Phase of the 15 February 1978 Magnetic Storm
14 S3-3 REV 4773 15 FEBRUARY 1978
12
10 0
-UL Ut
z U-U
-0
LO U
0
i~ LU
2 2 0 0
30 40 50
L
-60 70
Figure 18 The He++ Percentage of the H+ Flux and the He H+ Ratio of Average Phase Space Density During the Injection Phase of the 15 February 1978-Magnetic Storm
LMSCD673774
SECTION 4
GEOMAGNETIC STORMS FOR IMS
In support of the International Magnetospheric Workshops at Innsbruck
Austria in June 1978 preliminary ion composition data from four magnetic
storms were prepared and presented These storms were on 29 July 1977
23 September 1977 2 December 1977 and 11 December 1977 Except for the
29 July storm further analysis of these events has not been pursued
under this program The Workshops were held to present preliminary IMS
data and then to select some time periods for more detailed study The
time periods selected for the mdre detailed IMS studies were associated
with the 2 December storm as the primary event and the 1I December storm
as the secondary event
Moderately good data coverage for the 2 and 11 December storms was
obtained with the S3-3 spacecraft in the ring current regions in the
midnight sector DST and the general location of S3-3 data acquisitions
for these storms are shown in Figures 19 and 20 TFor each storm data
are acquired during the injection phase within 3 hours of-the peak of the
main phase and during the recovery phase
Three examples of the data during orbit revolutions (REV) 4151 4153
and 4156 from the 2 December storm are shown in Figures 21 22 and 23 for
the inner (Llt4) ring current regions The data are in the same format as
for Figure 16 The data from REV 4151 seen in Figure 21 were acquired during
the injection phase when DST was approximately half of its peak value
-28shy
S3-3 COVERAGE
04
20 gt gt gt gt gt gt gt -20- t Lid LU LIILi
-40t
-60
-80shy
-100shy
-120shy
0bull 6 12 18 24 6 12 18 24
2 DEC 1977 UT (HOURS) 3 DEC 1977
Fiiure 19 Distribution of the S3-3 Satellite Data Acquisitions During the 2 December 1977 Magnetic Storm -29shy
S3-3 COVERAGE
-0 7 0 O 0
(N C1 M
C- CN (vO CN CNI
Mf COi C11
-20 114gtILU gtLLU
ICt gtLU
1-t gtLUt gt
LLI
CtT gt LU
t gt LU
c4 gt LL4
-40o -v v
-60shy
I I I I 1 -100 -
-120 -shy
06 6 12 18 24 6 2 is 24
71DEC 1977 UT (HOURS) 12 DEC 1977
Fig-ure 20 Distribution of the S33 Satellite Data Acquisitions During the 11 December 1977 Magnetic Storm
-30shy
L L LILI 1711
CXR-2
CXF4-3 8 2
P-
HH CMEB i
CMEDC-
SYST 0337i3
LON 30305 LA -54q2 ALT 733273 ILA 5970 ALT 2372
Figure 21
-
0538 13 033913 03 3-0 0341 113 042plusmn33 033 3shy30238 30173 30 10 300118 2998 29928 29870 29813-5334 -5226 -5117 -9007 -4896 -4783 98 70 -955
728572 7M3608 718383 712890 707135 7701117 694 36 688292 5909 588 5786 5725 5663 5601 5539 4 78 2371 2369 2388 2367 2366 2365 5236 2363
SurveyPlot of S3-3 Ion and Election Data During the Injection Phase of the 2 December 1977 Magnetic Storm
$ - shy
CXA-2
CX-3
-IMO=
PI~ICrA A A VV v -V v o bullV o bull V bullVVV bullV o V bull V bull bull V v
CHEB
CMEC
StST 093833 093933 091033 09q1133 0941233 09333 091133 094533 094633 LON 20848 20795 20742 20691 206 39 20588 20538 20488 - 201139 LAT -098 -3976 -3853 -3728 -3602 -3473 -333 -3211 -3077ALT 65865W 650768 612621 634219 625555 616632 607q51 59801q 588321 ILA 5723 5555 5586 5517 5446 5373 5300 5225 51S50 HLT 65 61 57 53 t9 45 1 37 33
00
Figure 22 Survey Plot of S3-3 Ion and Electron Data Near the Main Phase Peak of the 2 December 1977 Magnetic Storm
S3-3 REV 4156 N 2 DECEMBER 1977
CXA-2
IA -
PITCH shy
tHEA2r )rA A
CHER
sLsr 70330 163118 18321 8318 183418 6318 1836 to 183710 1838 18LON 7330 7281 7231 7182 7133 7085 7036 6988 69Z9LT -329 -2993 -2854 -Z713 -2569 -2I3 -271 -2122 -196 RS $8261 579339 56916s 5587qO I|SO 37151 519 92 51598 50961
5028 h79 61714 ILR 5678 583 S 86 5387 5287 s)86
HIT~~2 31231 31 31 310 2310 310 2310 2309
Figure 23 Survey Plot of S3-3 Ion and Electron Data During the Second Ring Current Injection Event of 2 December 1977 Magnetic Storm
LMSCD673774
Relatively large H+ fluxes compared to the 0+ are found at this phase
of the storm in the midnight sector The moderately large H+ fluxes
extend down to an invariant magnetic latitude (ILA) of about 557 (L=31)
During the next S3-3 data acquisition period (REV 4153) data are acquired
within 3 hours of the peak of DST These data for Llt35 are seen in
Figure 22 The 0+ fluxes are now found to be comparable to the H+ fluxes
and extend down to an invariant latitude of 53 (L=28) Data shown in
Figure 23 from REV 4156 were acquired during a second ring current injection
and the ion composition can be seen by pomparison with Figure 21 to be
quite different from the first injection event The 0+ flux is comparable
+to the H+ flux and evidence for He ions can be seen in the CXA-3 mass
plot and in the MQ=4 response plot
An example of data during the main phase of the 11 December storm is
shown in Figure 24 primarily toindicate evidence for a pitch angle scattering
process that is ion mass selective This can be seen in Figure 24 by
comparing the MQ=l response the MQ=16 response and the pitch angle
(PITCH) of the instrument look direction in the time period from 120022 to
120530 Loss cones for the H+ ions in this region are generally well
developed in both directions along the magnetic field whereas for the
0+ ions the loss cone region near 00 pitch angle (instrument pointed upward)
contains high fluxes and in some regions nearly isotropic fluxes At
this stage of analysis of these types of events it appears likely that
strong pitch angle scattering is occurring above the satellite for the
0+ ions but not for the H+ ions The precipitation of these large fluxes
of 0+ ions down to 560 magnetic latitude is expected to produce strong
heating at F-region altitudes Coordinated IMS investigations of this event
11 - ii DECEM BER 1977
CXP-2
CXa=2 A A A A AoA TTvw
IlE
P4EI
CHEC r-v-An--v---n
CMED 8I 7shy$5T 1200 I 0l 0ION 16660 166052 20222 1 0322 -120q16550 16495 2 j 5t22 1206221644 16389 16336 1 0722 I108216283 16231 Lnr -3919 -38l -3670 -3527 -338 -3232 -308 -2926 -2A~r 579507 5C9337 558915 5118245 537328 526168 514768 503132 (J26ILA 6015HLr 10 592105 582G 57 28 LG 7 55242o0 394 2390 2385 51118 5310 51922380 375 2371 tf
L O N 1 6 6 0 0 6 2
Figure 24 Surve Plot of 3-3 Ion and Electron Data Duringthe Main Phase ifthe 11 December 1977-CC
Magnetic Storm Large Fluxes of Precipitating 0 Ions Are Observed from 120022 toshy
120430 UT
LMSCD673774
could contribute to a better understanding of this energy disipation
in the upper atmosphere and ionosphere
The data from REV 4228 shown in Figure 24 were acquired at the peak
of the main phase of the storm The large 0+ fluxes observed throughout
the L=shell region from 27 to 40 (ILA=53-600 ) indicate that the
ionosphere is a significant contributor to the ring current fluxes in the
energy range from 05 to 16 keV
For the 2 and 11 December storms preliminary information was also
presented at the IMS Workshop at Innsbruch Austria on the location of
the dayside cusp the inner edge of the ring current and the polar cap
boundary as determined from the ion composition experiment on the S3-3
spacecraft
-36shy
LMSCD673774
SECTION 5
DISCUSSION AND CONCLUSIONS
Although the dynamic nature and local time assymetries of the ring
current during- the main phase of a magnetic storm make storm-to-storm
comparisons difficult some similarities between data taken near the
peaks of the main phases of the storms on 29 July 1977 and on 29 December
1976 are noteworthy The magnetic local time for the 29 July 1977 data
is near 0500 hours and for the 29 December 1976 data is near 0200 hours
As seen in Figure 5 the average energy distributions for the 0+ ions in
both storms are significantly softer than for the H+ ions in the L=3-4
range This was true at this time at all L-values below 60 for the
29 July storm as seen in Figure 6 This perhaps is indicative of different
source regions for the 0+ and H+ ions at this local time and phase of the
storm In addition as seen in Figure 4 the O number density significantly
exceeds the H+ number density within the instrument energy range near the
inner edge of the ring current in both of the storms A similar trend for
the precipitating fluxes also observed in the local morning sector during
the 17-18 December 1971 magnetic storms has been reported by Sharp et al
1976 Thus it appears that this is at least a commonly occurring feature
during the main phase of storms in the local morning sector
As noted in Section 2 the data on the average ion energies presented
in Figures 6 7 and 8 for the 29 July 1977 storm show a rather dramatic
drop in the average 0+ ion energies in the region of L=4-5 This is
just the region of upstreaming low energy 0+ ions seen in Figure 12 during
the injection phase of the storm These ions are at sufficiently high
pitch angles to be trapped and in a few cases in Figure 12 downward moving
LMSCD673774
trapped 0+ ions are also seen Trapped energetic elections are observed
at higher L-values on this same pass strongly indicating that the
upward flowing 0 ions are on closed field lines and thus are becoming a
part of the ring current at these low L-shells This mechanism of direct
injection of low energy ionospheric ions into the ring current at low
L-shells can then account for the low average 0+ energies in the L=4-5
regions observed in the data presented in Figures 6 7 and 8 The fact
that upstreaming ions are not observed in the L=4-5 regions for REV 3120
and 3121 could result from temporal or local time variations
This mechanism of direct injection of ionospheric ions into the ring
current at low L-shells is also supported by the S3-3 observations prior
to the main phase peak of the 15 February 1978 storm As noted earlier and
as seen in Figure 16 upward flowing conical distributions of 0+ and H+
ions are observed The most prominent upward flowing ions are in the L=45
to 51 region and are at trapped pitch angles Again trapped energetic
elections -are observed at higher L-shells strongly indicating that the
upward flowing 0 + ions are on closed field lines
The large fluxes of 0 + ions observed in the ring current during
the magnetic storms discussed in this report and during storms previously
reported on [Johnson etal 1979 and Geiss et al 1979] show that
the ionosphere is a major contributor to the ring current ions in the
energy range of the S3-3 satellite measurements (05-16 keV) The
contribution of solar wind ions to the ring current during magnetic storms
can be assessed from observations of the ratios of the He++H+ and He++
He+ intensities since the He++H+ flux ratio in the solar wind is
+relatively large (typically about 5 x 10⁻²) whereas the He++H and He++
LMSCID673774
He+ flux ratios for the ionospheric components found inthe outer
-magnetosphere by Young et al (1977) are relatively small (-10 3 and
-10-2 respectively)
For the 15 February 1978 magnetic storm it can be seen from Figure 18
that the He++H+ flux and phase space density ratios in the L=4-6 region
are typically greater than 10-2 and from Figure 17 that the He++He+ flux
ratio will be greater than 10 in a comparable L-shell region These
ratios are consistent with solar wind origin and inconsistent with ionoshy
spheric origin for the He ions
For the 29 July 1977 storm the He H+flux ratios as seen in Figure 15 are typically 1-2 x 10⁻² in the L=4-7 region The He++ fluxes
inthe L=40 to 45 region can be seen from Figure 13 to be comparable to
or larger than the He+ fluxes These data are also consistent with solar
wind origin but not with ionospheric origin for the He ions
The preliminary investigations of the 2 and 11 December 1977 magnetic
storms support the conclusions of the IMS Steering Committee that these
storms are good candidates for detailed and coordinated investigations by
the IMS community From the point of view of ring current composition they
appear to exhibit some interesting and perhaps unique composition features
for which adequate data exist to merit detailed analysis
-39shy
LMSCD673774
SECTION 6
REFERENCES
Geiss J H Balsiger P Eberhardt HP Walker L Weber D T Young and H Rosenbauer Dynamics of Magnetospheric ions as observed by the GEOS Mass Spectrometer Proceedings of the 13th ESLAB Symposium Innsbruch Austria June 5-7 1978 Space Science Reviews in press
Ghielmetti A G R G Johnson R D Sharp and E G Shelley The Latitude Diurnal and Altitudinal Distributions of Upward Flowing Energetic Ions of Ionospheric Origin Geophys Res Lett 5 59 1978
Johnson R G R D Sharp and E G Shelley Observation of Ions of Ionoshyspheric Origin in the Storm-Time Ring Current Geophys Res Lett 4 403 1977
Johnson R G W Lennartson R D Sharp E G Shelley and H Balsiger The Composition of the Near Equatorial Ring Current During the December 11 1977 Magnetic Storm EDS 59 1163 1978
Reed R D E G Shelley J C Bakke T C Sanders and J D McDaniel A Low-Energy Channel-Multiplier Spectrometer for ATS-E IEEE Trans Nucl Sci NS-16 259 1969
Sharp R D R G Johnson and E G Shelley The Morphology of Energetic 0+ Ions During Two Magnetic Storms Latitudinal Variations J GeophysRes 81 3292 1976
Shelley E G R G Johnson and R D Sharp Satellite Observations of Energetic Heavy Ions During a Geomagnetic Storm J Geophys Res 77 6104 1972
Shelley E G R D Sharp and R G Johnson Satellite Observations of an Ionospheric Acceleration Mechanism Geophys Res Lett 3 654 1976
Young D T J Geiss H Balsiger P Eberhardt A Ghielmetti and H Rosenbauer Discovery of He2+ and 02+ ions of Terrestrial Origin in the Outer Magnetosphere Geophys Res Lett 4 561 1977

LMSCD673774
sequentially to the four energies for each spectrometer as discussed
in the Introduction
Two characteristics of the data particularly relevant to this report
are evident in Figure 16 Large upward streaming conical distributions
of 0+ ions (and some H+ ions) are seen in the time interval between
101749 and 102149 Also by comparing the MQ=2 (He++ ) response with
the MQ=l (He+ ) response in the time interval 101749 to 102549 and by
looking at the mass spectrums in this interval evidence for significant
He++ ions is found Most of the MQ=l and MQ=2 response in the-time
interval between 101349 and 101749 is due to background counts which
has been determined by detailed analysis of the responses between the peaks
in the mass spectrums Examples of the mass spectrums when summed over
the energy steps for each spectrometer in the range L=4-7 are shown in
Figure 17 The relatively large He He flux ratios should be noted
Figure 18 shows the He++ percentage of the H+ flux in the energy range of
the instrument and the He++iH+ ratio of the average phase space density
over the same measured velocity ranges (05-8 keVQ for H+ and 10 to 16 keV
Q for He+) These relatively high values are compatible with solar wind
origin for the He+ + ions and are incompatible with ionospheric origin for
the He++ ions Also it is seen that significant He+ + fluxes are measurable
as low as L=39 Large background counts limit the sensitivity to He++
ions below L=39
-25shy
S3-3 REV 4473 15 FEBRUARY 1978
1000shy+
0 E = 05- 128 keV E 176-45keV E = 62- 160 keV H
X 025 800 0+ -0
0 +
Z 600 He4
H+0 e 02
4- X025
X 025r a 400- 4-4 H ++ + -+
H He HeHe U He He
200 1 1
5 10 15 20 25 30 5 10 15 20 25 30 5 10 15 20 25 30 CHANNEL NUMBER
Figure 17 Mass Spectrums Showing the Relatively Large He++ Ion Fluxes in the L=4-7 Region During
the Injection Phase of the 15 February 1978 Magnetic Storm
14 S3-3 REV 4773 15 FEBRUARY 1978
12
10 0
-UL Ut
z U-U
-0
LO U
0
i~ LU
2 2 0 0
30 40 50
L
-60 70
Figure 18 The He++ Percentage of the H+ Flux and the He H+ Ratio of Average Phase Space Density During the Injection Phase of the 15 February 1978-Magnetic Storm
LMSCD673774
SECTION 4
GEOMAGNETIC STORMS FOR IMS
In support of the International Magnetospheric Workshops at Innsbruck
Austria in June 1978 preliminary ion composition data from four magnetic
storms were prepared and presented These storms were on 29 July 1977
23 September 1977 2 December 1977 and 11 December 1977 Except for the
29 July storm further analysis of these events has not been pursued
under this program The Workshops were held to present preliminary IMS
data and then to select some time periods for more detailed study The
time periods selected for the mdre detailed IMS studies were associated
with the 2 December storm as the primary event and the 1I December storm
as the secondary event
Moderately good data coverage for the 2 and 11 December storms was
obtained with the S3-3 spacecraft in the ring current regions in the
midnight sector DST and the general location of S3-3 data acquisitions
for these storms are shown in Figures 19 and 20 TFor each storm data
are acquired during the injection phase within 3 hours of-the peak of the
main phase and during the recovery phase
Three examples of the data during orbit revolutions (REV) 4151 4153
and 4156 from the 2 December storm are shown in Figures 21 22 and 23 for
the inner (Llt4) ring current regions The data are in the same format as
for Figure 16 The data from REV 4151 seen in Figure 21 were acquired during
the injection phase when DST was approximately half of its peak value
-28shy
S3-3 COVERAGE
04
20 gt gt gt gt gt gt gt -20- t Lid LU LIILi
-40t
-60
-80shy
-100shy
-120shy
0bull 6 12 18 24 6 12 18 24
2 DEC 1977 UT (HOURS) 3 DEC 1977
Fiiure 19 Distribution of the S3-3 Satellite Data Acquisitions During the 2 December 1977 Magnetic Storm -29shy
S3-3 COVERAGE
-0 7 0 O 0
(N C1 M
C- CN (vO CN CNI
Mf COi C11
-20 114gtILU gtLLU
ICt gtLU
1-t gtLUt gt
LLI
CtT gt LU
t gt LU
c4 gt LL4
-40o -v v
-60shy
I I I I 1 -100 -
-120 -shy
06 6 12 18 24 6 2 is 24
71DEC 1977 UT (HOURS) 12 DEC 1977
Fig-ure 20 Distribution of the S33 Satellite Data Acquisitions During the 11 December 1977 Magnetic Storm
-30shy
L L LILI 1711
CXR-2
CXF4-3 8 2
P-
HH CMEB i
CMEDC-
SYST 0337i3
LON 30305 LA -54q2 ALT 733273 ILA 5970 ALT 2372
Figure 21
-
0538 13 033913 03 3-0 0341 113 042plusmn33 033 3shy30238 30173 30 10 300118 2998 29928 29870 29813-5334 -5226 -5117 -9007 -4896 -4783 98 70 -955
728572 7M3608 718383 712890 707135 7701117 694 36 688292 5909 588 5786 5725 5663 5601 5539 4 78 2371 2369 2388 2367 2366 2365 5236 2363
SurveyPlot of S3-3 Ion and Election Data During the Injection Phase of the 2 December 1977 Magnetic Storm
$ - shy
CXA-2
CX-3
-IMO=
PI~ICrA A A VV v -V v o bullV o bull V bullVVV bullV o V bull V bull bull V v
CHEB
CMEC
StST 093833 093933 091033 09q1133 0941233 09333 091133 094533 094633 LON 20848 20795 20742 20691 206 39 20588 20538 20488 - 201139 LAT -098 -3976 -3853 -3728 -3602 -3473 -333 -3211 -3077ALT 65865W 650768 612621 634219 625555 616632 607q51 59801q 588321 ILA 5723 5555 5586 5517 5446 5373 5300 5225 51S50 HLT 65 61 57 53 t9 45 1 37 33
00
Figure 22 Survey Plot of S3-3 Ion and Electron Data Near the Main Phase Peak of the 2 December 1977 Magnetic Storm
S3-3 REV 4156 N 2 DECEMBER 1977
CXA-2
IA -
PITCH shy
tHEA2r )rA A
CHER
sLsr 70330 163118 18321 8318 183418 6318 1836 to 183710 1838 18LON 7330 7281 7231 7182 7133 7085 7036 6988 69Z9LT -329 -2993 -2854 -Z713 -2569 -2I3 -271 -2122 -196 RS $8261 579339 56916s 5587qO I|SO 37151 519 92 51598 50961
5028 h79 61714 ILR 5678 583 S 86 5387 5287 s)86
HIT~~2 31231 31 31 310 2310 310 2310 2309
Figure 23 Survey Plot of S3-3 Ion and Electron Data During the Second Ring Current Injection Event of 2 December 1977 Magnetic Storm
LMSCD673774
Relatively large H+ fluxes compared to the 0+ are found at this phase
of the storm in the midnight sector The moderately large H+ fluxes
extend down to an invariant magnetic latitude (ILA) of about 557 (L=31)
During the next S3-3 data acquisition period (REV 4153) data are acquired
within 3 hours of the peak of DST These data for Llt35 are seen in
Figure 22 The 0+ fluxes are now found to be comparable to the H+ fluxes
and extend down to an invariant latitude of 53 (L=28) Data shown in
Figure 23 from REV 4156 were acquired during a second ring current injection
and the ion composition can be seen by pomparison with Figure 21 to be
quite different from the first injection event The 0+ flux is comparable
+to the H+ flux and evidence for He ions can be seen in the CXA-3 mass
plot and in the MQ=4 response plot
An example of data during the main phase of the 11 December storm is
shown in Figure 24 primarily toindicate evidence for a pitch angle scattering
process that is ion mass selective This can be seen in Figure 24 by
comparing the MQ=l response the MQ=16 response and the pitch angle
(PITCH) of the instrument look direction in the time period from 120022 to
120530 Loss cones for the H+ ions in this region are generally well
developed in both directions along the magnetic field whereas for the
0+ ions the loss cone region near 00 pitch angle (instrument pointed upward)
contains high fluxes and in some regions nearly isotropic fluxes At
this stage of analysis of these types of events it appears likely that
strong pitch angle scattering is occurring above the satellite for the
0+ ions but not for the H+ ions The precipitation of these large fluxes
of 0+ ions down to 560 magnetic latitude is expected to produce strong
heating at F-region altitudes Coordinated IMS investigations of this event
11 - ii DECEM BER 1977
CXP-2
CXa=2 A A A A AoA TTvw
IlE
P4EI
CHEC r-v-An--v---n
CMED 8I 7shy$5T 1200 I 0l 0ION 16660 166052 20222 1 0322 -120q16550 16495 2 j 5t22 1206221644 16389 16336 1 0722 I108216283 16231 Lnr -3919 -38l -3670 -3527 -338 -3232 -308 -2926 -2A~r 579507 5C9337 558915 5118245 537328 526168 514768 503132 (J26ILA 6015HLr 10 592105 582G 57 28 LG 7 55242o0 394 2390 2385 51118 5310 51922380 375 2371 tf
L O N 1 6 6 0 0 6 2
Figure 24 Surve Plot of 3-3 Ion and Electron Data Duringthe Main Phase ifthe 11 December 1977-CC
Magnetic Storm Large Fluxes of Precipitating 0 Ions Are Observed from 120022 toshy
120430 UT
LMSCD673774
could contribute to a better understanding of this energy disipation
in the upper atmosphere and ionosphere
The data from REV 4228 shown in Figure 24 were acquired at the peak
of the main phase of the storm The large 0+ fluxes observed throughout
the L=shell region from 27 to 40 (ILA=53-600 ) indicate that the
ionosphere is a significant contributor to the ring current fluxes in the
energy range from 05 to 16 keV
For the 2 and 11 December storms preliminary information was also
presented at the IMS Workshop at Innsbruch Austria on the location of
the dayside cusp the inner edge of the ring current and the polar cap
boundary as determined from the ion composition experiment on the S3-3
spacecraft
-36shy
LMSCD673774
SECTION 5
DISCUSSION AND CONCLUSIONS
Although the dynamic nature and local time assymetries of the ring
current during- the main phase of a magnetic storm make storm-to-storm
comparisons difficult some similarities between data taken near the
peaks of the main phases of the storms on 29 July 1977 and on 29 December
1976 are noteworthy The magnetic local time for the 29 July 1977 data
is near 0500 hours and for the 29 December 1976 data is near 0200 hours
As seen in Figure 5 the average energy distributions for the 0+ ions in
both storms are significantly softer than for the H+ ions in the L=3-4
range This was true at this time at all L-values below 60 for the
29 July storm as seen in Figure 6 This perhaps is indicative of different
source regions for the 0+ and H+ ions at this local time and phase of the
storm In addition as seen in Figure 4 the O number density significantly
exceeds the H+ number density within the instrument energy range near the
inner edge of the ring current in both of the storms A similar trend for
the precipitating fluxes also observed in the local morning sector during
the 17-18 December 1971 magnetic storms has been reported by Sharp et al
1976 Thus it appears that this is at least a commonly occurring feature
during the main phase of storms in the local morning sector
As noted in Section 2 the data on the average ion energies presented
in Figures 6 7 and 8 for the 29 July 1977 storm show a rather dramatic
drop in the average 0+ ion energies in the region of L=4-5 This is
just the region of upstreaming low energy 0+ ions seen in Figure 12 during
the injection phase of the storm These ions are at sufficiently high
pitch angles to be trapped and in a few cases in Figure 12 downward moving
LMSCD673774
trapped 0+ ions are also seen Trapped energetic elections are observed
at higher L-values on this same pass strongly indicating that the
upward flowing 0 ions are on closed field lines and thus are becoming a
part of the ring current at these low L-shells This mechanism of direct
injection of low energy ionospheric ions into the ring current at low
L-shells can then account for the low average 0+ energies in the L=4-5
regions observed in the data presented in Figures 6 7 and 8 The fact
that upstreaming ions are not observed in the L=4-5 regions for REV 3120
and 3121 could result from temporal or local time variations
This mechanism of direct injection of ionospheric ions into the ring
current at low L-shells is also supported by the S3-3 observations prior
to the main phase peak of the 15 February 1978 storm As noted earlier and
as seen in Figure 16 upward flowing conical distributions of 0+ and H+
ions are observed The most prominent upward flowing ions are in the L=45
to 51 region and are at trapped pitch angles Again trapped energetic
elections -are observed at higher L-shells strongly indicating that the
upward flowing 0 + ions are on closed field lines
The large fluxes of 0 + ions observed in the ring current during
the magnetic storms discussed in this report and during storms previously
reported on [Johnson etal 1979 and Geiss et al 1979] show that
the ionosphere is a major contributor to the ring current ions in the
energy range of the S3-3 satellite measurements (05-16 keV) The
contribution of solar wind ions to the ring current during magnetic storms
can be assessed from observations of the ratios of the He++H+ and He++
He+ intensities since the He++H+ flux ratio in the solar wind is
+relatively large (typically about 5 x 10⁻²) whereas the He++H and He++
LMSCID673774
He+ flux ratios for the ionospheric components found inthe outer
-magnetosphere by Young et al (1977) are relatively small (-10 3 and
-10-2 respectively)
For the 15 February 1978 magnetic storm it can be seen from Figure 18
that the He++H+ flux and phase space density ratios in the L=4-6 region
are typically greater than 10-2 and from Figure 17 that the He++He+ flux
ratio will be greater than 10 in a comparable L-shell region These
ratios are consistent with solar wind origin and inconsistent with ionoshy
spheric origin for the He ions
For the 29 July 1977 storm the He H+flux ratios as seen in Figure 15 are typically 1-2 x 10⁻² in the L=4-7 region The He++ fluxes
inthe L=40 to 45 region can be seen from Figure 13 to be comparable to
or larger than the He+ fluxes These data are also consistent with solar
wind origin but not with ionospheric origin for the He ions
The preliminary investigations of the 2 and 11 December 1977 magnetic
storms support the conclusions of the IMS Steering Committee that these
storms are good candidates for detailed and coordinated investigations by
the IMS community From the point of view of ring current composition they
appear to exhibit some interesting and perhaps unique composition features
for which adequate data exist to merit detailed analysis
-39shy
LMSCD673774
SECTION 6
REFERENCES
Geiss J H Balsiger P Eberhardt HP Walker L Weber D T Young and H Rosenbauer Dynamics of Magnetospheric ions as observed by the GEOS Mass Spectrometer Proceedings of the 13th ESLAB Symposium Innsbruch Austria June 5-7 1978 Space Science Reviews in press
Ghielmetti A G R G Johnson R D Sharp and E G Shelley The Latitude Diurnal and Altitudinal Distributions of Upward Flowing Energetic Ions of Ionospheric Origin Geophys Res Lett 5 59 1978
Johnson R G R D Sharp and E G Shelley Observation of Ions of Ionoshyspheric Origin in the Storm-Time Ring Current Geophys Res Lett 4 403 1977
Johnson R G W Lennartson R D Sharp E G Shelley and H Balsiger The Composition of the Near Equatorial Ring Current During the December 11 1977 Magnetic Storm EDS 59 1163 1978
Reed R D E G Shelley J C Bakke T C Sanders and J D McDaniel A Low-Energy Channel-Multiplier Spectrometer for ATS-E IEEE Trans Nucl Sci NS-16 259 1969
Sharp R D R G Johnson and E G Shelley The Morphology of Energetic 0+ Ions During Two Magnetic Storms Latitudinal Variations J GeophysRes 81 3292 1976
Shelley E G R G Johnson and R D Sharp Satellite Observations of Energetic Heavy Ions During a Geomagnetic Storm J Geophys Res 77 6104 1972
Shelley E G R D Sharp and R G Johnson Satellite Observations of an Ionospheric Acceleration Mechanism Geophys Res Lett 3 654 1976
Young D T J Geiss H Balsiger P Eberhardt A Ghielmetti and H Rosenbauer Discovery of He2+ and 02+ ions of Terrestrial Origin in the Outer Magnetosphere Geophys Res Lett 4 561 1977
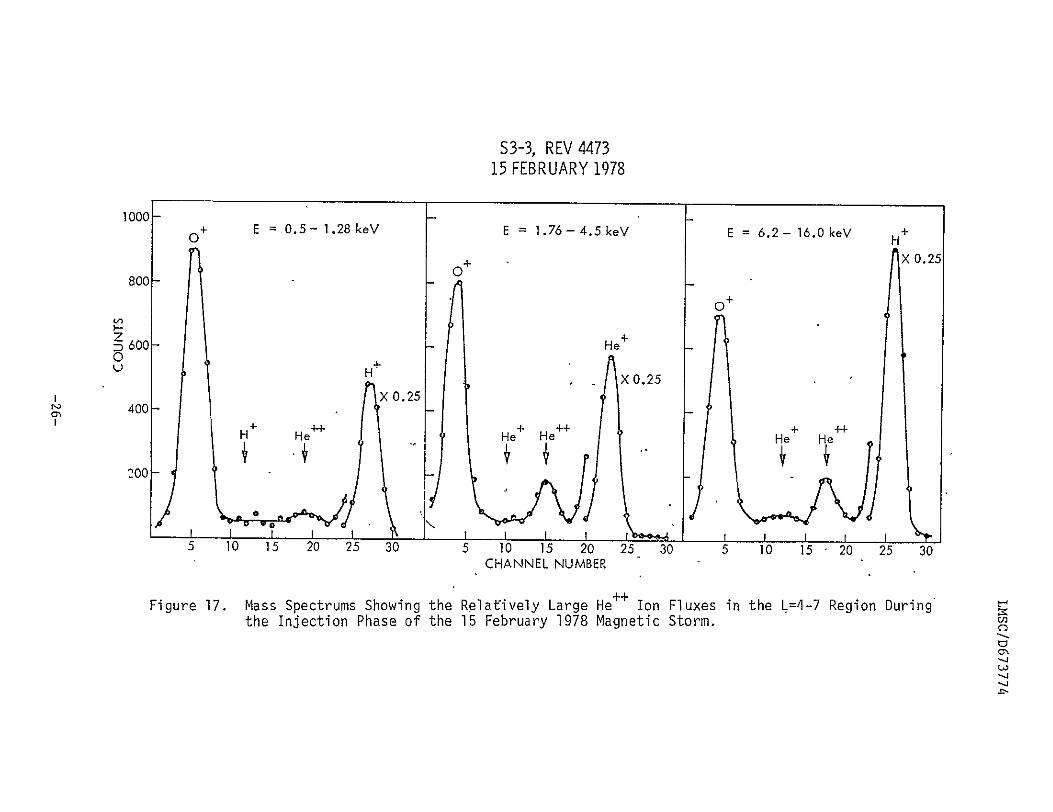

LMSCD673774
SECTION 4
GEOMAGNETIC STORMS FOR IMS
In support of the International Magnetospheric Workshops at Innsbruck
Austria in June 1978 preliminary ion composition data from four magnetic
storms were prepared and presented These storms were on 29 July 1977
23 September 1977 2 December 1977 and 11 December 1977 Except for the
29 July storm further analysis of these events has not been pursued
under this program The Workshops were held to present preliminary IMS
data and then to select some time periods for more detailed study The
time periods selected for the mdre detailed IMS studies were associated
with the 2 December storm as the primary event and the 1I December storm
as the secondary event
Moderately good data coverage for the 2 and 11 December storms was
obtained with the S3-3 spacecraft in the ring current regions in the
midnight sector DST and the general location of S3-3 data acquisitions
for these storms are shown in Figures 19 and 20 TFor each storm data
are acquired during the injection phase within 3 hours of-the peak of the
main phase and during the recovery phase
Three examples of the data during orbit revolutions (REV) 4151 4153
and 4156 from the 2 December storm are shown in Figures 21 22 and 23 for
the inner (Llt4) ring current regions The data are in the same format as
for Figure 16 The data from REV 4151 seen in Figure 21 were acquired during
the injection phase when DST was approximately half of its peak value
-28shy
S3-3 COVERAGE
04
20 gt gt gt gt gt gt gt -20- t Lid LU LIILi
-40t
-60
-80shy
-100shy
-120shy
0bull 6 12 18 24 6 12 18 24
2 DEC 1977 UT (HOURS) 3 DEC 1977
Fiiure 19 Distribution of the S3-3 Satellite Data Acquisitions During the 2 December 1977 Magnetic Storm -29shy
S3-3 COVERAGE
-0 7 0 O 0
(N C1 M
C- CN (vO CN CNI
Mf COi C11
-20 114gtILU gtLLU
ICt gtLU
1-t gtLUt gt
LLI
CtT gt LU
t gt LU
c4 gt LL4
-40o -v v
-60shy
I I I I 1 -100 -
-120 -shy
06 6 12 18 24 6 2 is 24
71DEC 1977 UT (HOURS) 12 DEC 1977
Fig-ure 20 Distribution of the S33 Satellite Data Acquisitions During the 11 December 1977 Magnetic Storm
-30shy
L L LILI 1711
CXR-2
CXF4-3 8 2
P-
HH CMEB i
CMEDC-
SYST 0337i3
LON 30305 LA -54q2 ALT 733273 ILA 5970 ALT 2372
Figure 21
-
0538 13 033913 03 3-0 0341 113 042plusmn33 033 3shy30238 30173 30 10 300118 2998 29928 29870 29813-5334 -5226 -5117 -9007 -4896 -4783 98 70 -955
728572 7M3608 718383 712890 707135 7701117 694 36 688292 5909 588 5786 5725 5663 5601 5539 4 78 2371 2369 2388 2367 2366 2365 5236 2363
SurveyPlot of S3-3 Ion and Election Data During the Injection Phase of the 2 December 1977 Magnetic Storm
$ - shy
CXA-2
CX-3
-IMO=
PI~ICrA A A VV v -V v o bullV o bull V bullVVV bullV o V bull V bull bull V v
CHEB
CMEC
StST 093833 093933 091033 09q1133 0941233 09333 091133 094533 094633 LON 20848 20795 20742 20691 206 39 20588 20538 20488 - 201139 LAT -098 -3976 -3853 -3728 -3602 -3473 -333 -3211 -3077ALT 65865W 650768 612621 634219 625555 616632 607q51 59801q 588321 ILA 5723 5555 5586 5517 5446 5373 5300 5225 51S50 HLT 65 61 57 53 t9 45 1 37 33
00
Figure 22 Survey Plot of S3-3 Ion and Electron Data Near the Main Phase Peak of the 2 December 1977 Magnetic Storm
S3-3 REV 4156 N 2 DECEMBER 1977
CXA-2
IA -
PITCH shy
tHEA2r )rA A
CHER
sLsr 70330 163118 18321 8318 183418 6318 1836 to 183710 1838 18LON 7330 7281 7231 7182 7133 7085 7036 6988 69Z9LT -329 -2993 -2854 -Z713 -2569 -2I3 -271 -2122 -196 RS $8261 579339 56916s 5587qO I|SO 37151 519 92 51598 50961
5028 h79 61714 ILR 5678 583 S 86 5387 5287 s)86
HIT~~2 31231 31 31 310 2310 310 2310 2309
Figure 23 Survey Plot of S3-3 Ion and Electron Data During the Second Ring Current Injection Event of 2 December 1977 Magnetic Storm
LMSCD673774
Relatively large H+ fluxes compared to the 0+ are found at this phase
of the storm in the midnight sector The moderately large H+ fluxes
extend down to an invariant magnetic latitude (ILA) of about 557 (L=31)
During the next S3-3 data acquisition period (REV 4153) data are acquired
within 3 hours of the peak of DST These data for Llt35 are seen in
Figure 22 The 0+ fluxes are now found to be comparable to the H+ fluxes
and extend down to an invariant latitude of 53 (L=28) Data shown in
Figure 23 from REV 4156 were acquired during a second ring current injection
and the ion composition can be seen by pomparison with Figure 21 to be
quite different from the first injection event The 0+ flux is comparable
+to the H+ flux and evidence for He ions can be seen in the CXA-3 mass
plot and in the MQ=4 response plot
An example of data during the main phase of the 11 December storm is
shown in Figure 24 primarily toindicate evidence for a pitch angle scattering
process that is ion mass selective This can be seen in Figure 24 by
comparing the MQ=l response the MQ=16 response and the pitch angle
(PITCH) of the instrument look direction in the time period from 120022 to
120530 Loss cones for the H+ ions in this region are generally well
developed in both directions along the magnetic field whereas for the
0+ ions the loss cone region near 00 pitch angle (instrument pointed upward)
contains high fluxes and in some regions nearly isotropic fluxes At
this stage of analysis of these types of events it appears likely that
strong pitch angle scattering is occurring above the satellite for the
0+ ions but not for the H+ ions The precipitation of these large fluxes
of 0+ ions down to 560 magnetic latitude is expected to produce strong
heating at F-region altitudes Coordinated IMS investigations of this event
11 - ii DECEM BER 1977
CXP-2
CXa=2 A A A A AoA TTvw
IlE
P4EI
CHEC r-v-An--v---n
CMED 8I 7shy$5T 1200 I 0l 0ION 16660 166052 20222 1 0322 -120q16550 16495 2 j 5t22 1206221644 16389 16336 1 0722 I108216283 16231 Lnr -3919 -38l -3670 -3527 -338 -3232 -308 -2926 -2A~r 579507 5C9337 558915 5118245 537328 526168 514768 503132 (J26ILA 6015HLr 10 592105 582G 57 28 LG 7 55242o0 394 2390 2385 51118 5310 51922380 375 2371 tf
L O N 1 6 6 0 0 6 2
Figure 24 Surve Plot of 3-3 Ion and Electron Data Duringthe Main Phase ifthe 11 December 1977-CC
Magnetic Storm Large Fluxes of Precipitating 0 Ions Are Observed from 120022 toshy
120430 UT
LMSCD673774
could contribute to a better understanding of this energy disipation
in the upper atmosphere and ionosphere
The data from REV 4228 shown in Figure 24 were acquired at the peak
of the main phase of the storm The large 0+ fluxes observed throughout
the L=shell region from 27 to 40 (ILA=53-600 ) indicate that the
ionosphere is a significant contributor to the ring current fluxes in the
energy range from 05 to 16 keV
For the 2 and 11 December storms preliminary information was also
presented at the IMS Workshop at Innsbruch Austria on the location of
the dayside cusp the inner edge of the ring current and the polar cap
boundary as determined from the ion composition experiment on the S3-3
spacecraft
-36shy
LMSCD673774
SECTION 5
DISCUSSION AND CONCLUSIONS
Although the dynamic nature and local time assymetries of the ring
current during- the main phase of a magnetic storm make storm-to-storm
comparisons difficult some similarities between data taken near the
peaks of the main phases of the storms on 29 July 1977 and on 29 December
1976 are noteworthy The magnetic local time for the 29 July 1977 data
is near 0500 hours and for the 29 December 1976 data is near 0200 hours
As seen in Figure 5 the average energy distributions for the 0+ ions in
both storms are significantly softer than for the H+ ions in the L=3-4
range This was true at this time at all L-values below 60 for the
29 July storm as seen in Figure 6 This perhaps is indicative of different
source regions for the 0+ and H+ ions at this local time and phase of the
storm In addition as seen in Figure 4 the O number density significantly
exceeds the H+ number density within the instrument energy range near the
inner edge of the ring current in both of the storms A similar trend for
the precipitating fluxes also observed in the local morning sector during
the 17-18 December 1971 magnetic storms has been reported by Sharp et al
1976 Thus it appears that this is at least a commonly occurring feature
during the main phase of storms in the local morning sector
As noted in Section 2 the data on the average ion energies presented
in Figures 6 7 and 8 for the 29 July 1977 storm show a rather dramatic
drop in the average 0+ ion energies in the region of L=4-5 This is
just the region of upstreaming low energy 0+ ions seen in Figure 12 during
the injection phase of the storm These ions are at sufficiently high
pitch angles to be trapped and in a few cases in Figure 12 downward moving
LMSCD673774
trapped 0+ ions are also seen Trapped energetic elections are observed
at higher L-values on this same pass strongly indicating that the
upward flowing 0 ions are on closed field lines and thus are becoming a
part of the ring current at these low L-shells This mechanism of direct
injection of low energy ionospheric ions into the ring current at low
L-shells can then account for the low average 0+ energies in the L=4-5
regions observed in the data presented in Figures 6 7 and 8 The fact
that upstreaming ions are not observed in the L=4-5 regions for REV 3120
and 3121 could result from temporal or local time variations
This mechanism of direct injection of ionospheric ions into the ring
current at low L-shells is also supported by the S3-3 observations prior
to the main phase peak of the 15 February 1978 storm As noted earlier and
as seen in Figure 16 upward flowing conical distributions of 0+ and H+
ions are observed The most prominent upward flowing ions are in the L=45
to 51 region and are at trapped pitch angles Again trapped energetic
elections -are observed at higher L-shells strongly indicating that the
upward flowing 0 + ions are on closed field lines
The large fluxes of 0 + ions observed in the ring current during
the magnetic storms discussed in this report and during storms previously
reported on [Johnson etal 1979 and Geiss et al 1979] show that
the ionosphere is a major contributor to the ring current ions in the
energy range of the S3-3 satellite measurements (05-16 keV) The
contribution of solar wind ions to the ring current during magnetic storms
can be assessed from observations of the ratios of the He++H+ and He++
He+ intensities since the He++H+ flux ratio in the solar wind is
+relatively large (typically about 5 x 10⁻²) whereas the He++H and He++
LMSCID673774
He+ flux ratios for the ionospheric components found inthe outer
-magnetosphere by Young et al (1977) are relatively small (-10 3 and
-10-2 respectively)
For the 15 February 1978 magnetic storm it can be seen from Figure 18
that the He++H+ flux and phase space density ratios in the L=4-6 region
are typically greater than 10-2 and from Figure 17 that the He++He+ flux
ratio will be greater than 10 in a comparable L-shell region These
ratios are consistent with solar wind origin and inconsistent with ionoshy
spheric origin for the He ions
For the 29 July 1977 storm the He H+flux ratios as seen in Figure 15 are typically 1-2 x 10⁻² in the L=4-7 region The He++ fluxes
inthe L=40 to 45 region can be seen from Figure 13 to be comparable to
or larger than the He+ fluxes These data are also consistent with solar
wind origin but not with ionospheric origin for the He ions
The preliminary investigations of the 2 and 11 December 1977 magnetic
storms support the conclusions of the IMS Steering Committee that these
storms are good candidates for detailed and coordinated investigations by
the IMS community From the point of view of ring current composition they
appear to exhibit some interesting and perhaps unique composition features
for which adequate data exist to merit detailed analysis
-39shy
LMSCD673774
SECTION 6
REFERENCES
Geiss J H Balsiger P Eberhardt HP Walker L Weber D T Young and H Rosenbauer Dynamics of Magnetospheric ions as observed by the GEOS Mass Spectrometer Proceedings of the 13th ESLAB Symposium Innsbruch Austria June 5-7 1978 Space Science Reviews in press
Ghielmetti A G R G Johnson R D Sharp and E G Shelley The Latitude Diurnal and Altitudinal Distributions of Upward Flowing Energetic Ions of Ionospheric Origin Geophys Res Lett 5 59 1978
Johnson R G R D Sharp and E G Shelley Observation of Ions of Ionoshyspheric Origin in the Storm-Time Ring Current Geophys Res Lett 4 403 1977
Johnson R G W Lennartson R D Sharp E G Shelley and H Balsiger The Composition of the Near Equatorial Ring Current During the December 11 1977 Magnetic Storm EDS 59 1163 1978
Reed R D E G Shelley J C Bakke T C Sanders and J D McDaniel A Low-Energy Channel-Multiplier Spectrometer for ATS-E IEEE Trans Nucl Sci NS-16 259 1969
Sharp R D R G Johnson and E G Shelley The Morphology of Energetic 0+ Ions During Two Magnetic Storms Latitudinal Variations J GeophysRes 81 3292 1976
Shelley E G R G Johnson and R D Sharp Satellite Observations of Energetic Heavy Ions During a Geomagnetic Storm J Geophys Res 77 6104 1972
Shelley E G R D Sharp and R G Johnson Satellite Observations of an Ionospheric Acceleration Mechanism Geophys Res Lett 3 654 1976
Young D T J Geiss H Balsiger P Eberhardt A Ghielmetti and H Rosenbauer Discovery of He2+ and 02+ ions of Terrestrial Origin in the Outer Magnetosphere Geophys Res Lett 4 561 1977

S3-3 COVERAGE
-0 7 0 O 0
(N C1 M
C- CN (vO CN CNI
Mf COi C11
-20 114gtILU gtLLU
ICt gtLU
1-t gtLUt gt
LLI
CtT gt LU
t gt LU
c4 gt LL4
-40o -v v
-60shy
I I I I 1 -100 -
-120 -shy
06 6 12 18 24 6 2 is 24
71DEC 1977 UT (HOURS) 12 DEC 1977
Fig-ure 20 Distribution of the S33 Satellite Data Acquisitions During the 11 December 1977 Magnetic Storm
-30shy
L L LILI 1711
CXR-2
CXF4-3 8 2
P-
HH CMEB i
CMEDC-
SYST 0337i3
LON 30305 LA -54q2 ALT 733273 ILA 5970 ALT 2372
Figure 21
-
0538 13 033913 03 3-0 0341 113 042plusmn33 033 3shy30238 30173 30 10 300118 2998 29928 29870 29813-5334 -5226 -5117 -9007 -4896 -4783 98 70 -955
728572 7M3608 718383 712890 707135 7701117 694 36 688292 5909 588 5786 5725 5663 5601 5539 4 78 2371 2369 2388 2367 2366 2365 5236 2363
SurveyPlot of S3-3 Ion and Election Data During the Injection Phase of the 2 December 1977 Magnetic Storm
$ - shy
CXA-2
CX-3
-IMO=
PI~ICrA A A VV v -V v o bullV o bull V bullVVV bullV o V bull V bull bull V v
CHEB
CMEC
StST 093833 093933 091033 09q1133 0941233 09333 091133 094533 094633 LON 20848 20795 20742 20691 206 39 20588 20538 20488 - 201139 LAT -098 -3976 -3853 -3728 -3602 -3473 -333 -3211 -3077ALT 65865W 650768 612621 634219 625555 616632 607q51 59801q 588321 ILA 5723 5555 5586 5517 5446 5373 5300 5225 51S50 HLT 65 61 57 53 t9 45 1 37 33
00
Figure 22 Survey Plot of S3-3 Ion and Electron Data Near the Main Phase Peak of the 2 December 1977 Magnetic Storm
S3-3 REV 4156 N 2 DECEMBER 1977
CXA-2
IA -
PITCH shy
tHEA2r )rA A
CHER
sLsr 70330 163118 18321 8318 183418 6318 1836 to 183710 1838 18LON 7330 7281 7231 7182 7133 7085 7036 6988 69Z9LT -329 -2993 -2854 -Z713 -2569 -2I3 -271 -2122 -196 RS $8261 579339 56916s 5587qO I|SO 37151 519 92 51598 50961
5028 h79 61714 ILR 5678 583 S 86 5387 5287 s)86
HIT~~2 31231 31 31 310 2310 310 2310 2309
Figure 23 Survey Plot of S3-3 Ion and Electron Data During the Second Ring Current Injection Event of 2 December 1977 Magnetic Storm
LMSCD673774
Relatively large H+ fluxes compared to the 0+ are found at this phase
of the storm in the midnight sector The moderately large H+ fluxes
extend down to an invariant magnetic latitude (ILA) of about 557 (L=31)
During the next S3-3 data acquisition period (REV 4153) data are acquired
within 3 hours of the peak of DST These data for Llt35 are seen in
Figure 22 The 0+ fluxes are now found to be comparable to the H+ fluxes
and extend down to an invariant latitude of 53 (L=28) Data shown in
Figure 23 from REV 4156 were acquired during a second ring current injection
and the ion composition can be seen by pomparison with Figure 21 to be
quite different from the first injection event The 0+ flux is comparable
+to the H+ flux and evidence for He ions can be seen in the CXA-3 mass
plot and in the MQ=4 response plot
An example of data during the main phase of the 11 December storm is
shown in Figure 24 primarily toindicate evidence for a pitch angle scattering
process that is ion mass selective This can be seen in Figure 24 by
comparing the MQ=l response the MQ=16 response and the pitch angle
(PITCH) of the instrument look direction in the time period from 120022 to
120530 Loss cones for the H+ ions in this region are generally well
developed in both directions along the magnetic field whereas for the
0+ ions the loss cone region near 00 pitch angle (instrument pointed upward)
contains high fluxes and in some regions nearly isotropic fluxes At
this stage of analysis of these types of events it appears likely that
strong pitch angle scattering is occurring above the satellite for the
0+ ions but not for the H+ ions The precipitation of these large fluxes
of 0+ ions down to 560 magnetic latitude is expected to produce strong
heating at F-region altitudes Coordinated IMS investigations of this event
11 - ii DECEM BER 1977
CXP-2
CXa=2 A A A A AoA TTvw
IlE
P4EI
CHEC r-v-An--v---n
CMED 8I 7shy$5T 1200 I 0l 0ION 16660 166052 20222 1 0322 -120q16550 16495 2 j 5t22 1206221644 16389 16336 1 0722 I108216283 16231 Lnr -3919 -38l -3670 -3527 -338 -3232 -308 -2926 -2A~r 579507 5C9337 558915 5118245 537328 526168 514768 503132 (J26ILA 6015HLr 10 592105 582G 57 28 LG 7 55242o0 394 2390 2385 51118 5310 51922380 375 2371 tf
L O N 1 6 6 0 0 6 2
Figure 24 Surve Plot of 3-3 Ion and Electron Data Duringthe Main Phase ifthe 11 December 1977-CC
Magnetic Storm Large Fluxes of Precipitating 0 Ions Are Observed from 120022 toshy
120430 UT
LMSCD673774
could contribute to a better understanding of this energy disipation
in the upper atmosphere and ionosphere
The data from REV 4228 shown in Figure 24 were acquired at the peak
of the main phase of the storm The large 0+ fluxes observed throughout
the L=shell region from 27 to 40 (ILA=53-600 ) indicate that the
ionosphere is a significant contributor to the ring current fluxes in the
energy range from 05 to 16 keV
For the 2 and 11 December storms preliminary information was also
presented at the IMS Workshop at Innsbruch Austria on the location of
the dayside cusp the inner edge of the ring current and the polar cap
boundary as determined from the ion composition experiment on the S3-3
spacecraft
-36shy
LMSCD673774
SECTION 5
DISCUSSION AND CONCLUSIONS
Although the dynamic nature and local time assymetries of the ring
current during- the main phase of a magnetic storm make storm-to-storm
comparisons difficult some similarities between data taken near the
peaks of the main phases of the storms on 29 July 1977 and on 29 December
1976 are noteworthy The magnetic local time for the 29 July 1977 data
is near 0500 hours and for the 29 December 1976 data is near 0200 hours
As seen in Figure 5 the average energy distributions for the 0+ ions in
both storms are significantly softer than for the H+ ions in the L=3-4
range This was true at this time at all L-values below 60 for the
29 July storm as seen in Figure 6 This perhaps is indicative of different
source regions for the 0+ and H+ ions at this local time and phase of the
storm In addition as seen in Figure 4 the O number density significantly
exceeds the H+ number density within the instrument energy range near the
inner edge of the ring current in both of the storms A similar trend for
the precipitating fluxes also observed in the local morning sector during
the 17-18 December 1971 magnetic storms has been reported by Sharp et al
1976 Thus it appears that this is at least a commonly occurring feature
during the main phase of storms in the local morning sector
As noted in Section 2 the data on the average ion energies presented
in Figures 6 7 and 8 for the 29 July 1977 storm show a rather dramatic
drop in the average 0+ ion energies in the region of L=4-5 This is
just the region of upstreaming low energy 0+ ions seen in Figure 12 during
the injection phase of the storm These ions are at sufficiently high
pitch angles to be trapped and in a few cases in Figure 12 downward moving
LMSCD673774
trapped 0+ ions are also seen Trapped energetic elections are observed
at higher L-values on this same pass strongly indicating that the
upward flowing 0 ions are on closed field lines and thus are becoming a
part of the ring current at these low L-shells This mechanism of direct
injection of low energy ionospheric ions into the ring current at low
L-shells can then account for the low average 0+ energies in the L=4-5
regions observed in the data presented in Figures 6 7 and 8 The fact
that upstreaming ions are not observed in the L=4-5 regions for REV 3120
and 3121 could result from temporal or local time variations
This mechanism of direct injection of ionospheric ions into the ring
current at low L-shells is also supported by the S3-3 observations prior
to the main phase peak of the 15 February 1978 storm As noted earlier and
as seen in Figure 16 upward flowing conical distributions of 0+ and H+
ions are observed The most prominent upward flowing ions are in the L=45
to 51 region and are at trapped pitch angles Again trapped energetic
elections -are observed at higher L-shells strongly indicating that the
upward flowing 0 + ions are on closed field lines
The large fluxes of 0 + ions observed in the ring current during
the magnetic storms discussed in this report and during storms previously
reported on [Johnson etal 1979 and Geiss et al 1979] show that
the ionosphere is a major contributor to the ring current ions in the
energy range of the S3-3 satellite measurements (05-16 keV) The
contribution of solar wind ions to the ring current during magnetic storms
can be assessed from observations of the ratios of the He++H+ and He++
He+ intensities since the He++H+ flux ratio in the solar wind is
+relatively large (typically about 5 x 10⁻²) whereas the He++H and He++
LMSCID673774
He+ flux ratios for the ionospheric components found inthe outer
-magnetosphere by Young et al (1977) are relatively small (-10 3 and
-10-2 respectively)
For the 15 February 1978 magnetic storm it can be seen from Figure 18
that the He++H+ flux and phase space density ratios in the L=4-6 region
are typically greater than 10-2 and from Figure 17 that the He++He+ flux
ratio will be greater than 10 in a comparable L-shell region These
ratios are consistent with solar wind origin and inconsistent with ionoshy
spheric origin for the He ions
For the 29 July 1977 storm the He H+flux ratios as seen in Figure 15 are typically 1-2 x 10⁻² in the L=4-7 region The He++ fluxes
inthe L=40 to 45 region can be seen from Figure 13 to be comparable to
or larger than the He+ fluxes These data are also consistent with solar
wind origin but not with ionospheric origin for the He ions
The preliminary investigations of the 2 and 11 December 1977 magnetic
storms support the conclusions of the IMS Steering Committee that these
storms are good candidates for detailed and coordinated investigations by
the IMS community From the point of view of ring current composition they
appear to exhibit some interesting and perhaps unique composition features
for which adequate data exist to merit detailed analysis
-39shy
LMSCD673774
SECTION 6
REFERENCES
Geiss J H Balsiger P Eberhardt HP Walker L Weber D T Young and H Rosenbauer Dynamics of Magnetospheric ions as observed by the GEOS Mass Spectrometer Proceedings of the 13th ESLAB Symposium Innsbruch Austria June 5-7 1978 Space Science Reviews in press
Ghielmetti A G R G Johnson R D Sharp and E G Shelley The Latitude Diurnal and Altitudinal Distributions of Upward Flowing Energetic Ions of Ionospheric Origin Geophys Res Lett 5 59 1978
Johnson R G R D Sharp and E G Shelley Observation of Ions of Ionoshyspheric Origin in the Storm-Time Ring Current Geophys Res Lett 4 403 1977
Johnson R G W Lennartson R D Sharp E G Shelley and H Balsiger The Composition of the Near Equatorial Ring Current During the December 11 1977 Magnetic Storm EDS 59 1163 1978
Reed R D E G Shelley J C Bakke T C Sanders and J D McDaniel A Low-Energy Channel-Multiplier Spectrometer for ATS-E IEEE Trans Nucl Sci NS-16 259 1969
Sharp R D R G Johnson and E G Shelley The Morphology of Energetic 0+ Ions During Two Magnetic Storms Latitudinal Variations J GeophysRes 81 3292 1976
Shelley E G R G Johnson and R D Sharp Satellite Observations of Energetic Heavy Ions During a Geomagnetic Storm J Geophys Res 77 6104 1972
Shelley E G R D Sharp and R G Johnson Satellite Observations of an Ionospheric Acceleration Mechanism Geophys Res Lett 3 654 1976
Young D T J Geiss H Balsiger P Eberhardt A Ghielmetti and H Rosenbauer Discovery of He2+ and 02+ ions of Terrestrial Origin in the Outer Magnetosphere Geophys Res Lett 4 561 1977

LMSCD673774
Relatively large H+ fluxes compared to the 0+ are found at this phase
of the storm in the midnight sector The moderately large H+ fluxes
extend down to an invariant magnetic latitude (ILA) of about 557 (L=31)
During the next S3-3 data acquisition period (REV 4153) data are acquired
within 3 hours of the peak of DST These data for Llt35 are seen in
Figure 22 The 0+ fluxes are now found to be comparable to the H+ fluxes
and extend down to an invariant latitude of 53 (L=28) Data shown in
Figure 23 from REV 4156 were acquired during a second ring current injection
and the ion composition can be seen by pomparison with Figure 21 to be
quite different from the first injection event The 0+ flux is comparable
+to the H+ flux and evidence for He ions can be seen in the CXA-3 mass
plot and in the MQ=4 response plot
An example of data during the main phase of the 11 December storm is
shown in Figure 24 primarily toindicate evidence for a pitch angle scattering
process that is ion mass selective This can be seen in Figure 24 by
comparing the MQ=l response the MQ=16 response and the pitch angle
(PITCH) of the instrument look direction in the time period from 120022 to
120530 Loss cones for the H+ ions in this region are generally well
developed in both directions along the magnetic field whereas for the
0+ ions the loss cone region near 00 pitch angle (instrument pointed upward)
contains high fluxes and in some regions nearly isotropic fluxes At
this stage of analysis of these types of events it appears likely that
strong pitch angle scattering is occurring above the satellite for the
0+ ions but not for the H+ ions The precipitation of these large fluxes
of 0+ ions down to 560 magnetic latitude is expected to produce strong
heating at F-region altitudes Coordinated IMS investigations of this event
11 - ii DECEM BER 1977
CXP-2
CXa=2 A A A A AoA TTvw
IlE
P4EI
CHEC r-v-An--v---n
CMED 8I 7shy$5T 1200 I 0l 0ION 16660 166052 20222 1 0322 -120q16550 16495 2 j 5t22 1206221644 16389 16336 1 0722 I108216283 16231 Lnr -3919 -38l -3670 -3527 -338 -3232 -308 -2926 -2A~r 579507 5C9337 558915 5118245 537328 526168 514768 503132 (J26ILA 6015HLr 10 592105 582G 57 28 LG 7 55242o0 394 2390 2385 51118 5310 51922380 375 2371 tf
L O N 1 6 6 0 0 6 2
Figure 24 Surve Plot of 3-3 Ion and Electron Data Duringthe Main Phase ifthe 11 December 1977-CC
Magnetic Storm Large Fluxes of Precipitating 0 Ions Are Observed from 120022 toshy
120430 UT
LMSCD673774
could contribute to a better understanding of this energy disipation
in the upper atmosphere and ionosphere
The data from REV 4228 shown in Figure 24 were acquired at the peak
of the main phase of the storm The large 0+ fluxes observed throughout
the L=shell region from 27 to 40 (ILA=53-600 ) indicate that the
ionosphere is a significant contributor to the ring current fluxes in the
energy range from 05 to 16 keV
For the 2 and 11 December storms preliminary information was also
presented at the IMS Workshop at Innsbruch Austria on the location of
the dayside cusp the inner edge of the ring current and the polar cap
boundary as determined from the ion composition experiment on the S3-3
spacecraft
-36shy
LMSCD673774
SECTION 5
DISCUSSION AND CONCLUSIONS
Although the dynamic nature and local time assymetries of the ring
current during- the main phase of a magnetic storm make storm-to-storm
comparisons difficult some similarities between data taken near the
peaks of the main phases of the storms on 29 July 1977 and on 29 December
1976 are noteworthy The magnetic local time for the 29 July 1977 data
is near 0500 hours and for the 29 December 1976 data is near 0200 hours
As seen in Figure 5 the average energy distributions for the 0+ ions in
both storms are significantly softer than for the H+ ions in the L=3-4
range This was true at this time at all L-values below 60 for the
29 July storm as seen in Figure 6 This perhaps is indicative of different
source regions for the 0+ and H+ ions at this local time and phase of the
storm In addition as seen in Figure 4 the O number density significantly
exceeds the H+ number density within the instrument energy range near the
inner edge of the ring current in both of the storms A similar trend for
the precipitating fluxes also observed in the local morning sector during
the 17-18 December 1971 magnetic storms has been reported by Sharp et al
1976 Thus it appears that this is at least a commonly occurring feature
during the main phase of storms in the local morning sector
As noted in Section 2 the data on the average ion energies presented
in Figures 6 7 and 8 for the 29 July 1977 storm show a rather dramatic
drop in the average 0+ ion energies in the region of L=4-5 This is
just the region of upstreaming low energy 0+ ions seen in Figure 12 during
the injection phase of the storm These ions are at sufficiently high
pitch angles to be trapped and in a few cases in Figure 12 downward moving
LMSCD673774
trapped 0+ ions are also seen Trapped energetic elections are observed
at higher L-values on this same pass strongly indicating that the
upward flowing 0 ions are on closed field lines and thus are becoming a
part of the ring current at these low L-shells This mechanism of direct
injection of low energy ionospheric ions into the ring current at low
L-shells can then account for the low average 0+ energies in the L=4-5
regions observed in the data presented in Figures 6 7 and 8 The fact
that upstreaming ions are not observed in the L=4-5 regions for REV 3120
and 3121 could result from temporal or local time variations
This mechanism of direct injection of ionospheric ions into the ring
current at low L-shells is also supported by the S3-3 observations prior
to the main phase peak of the 15 February 1978 storm As noted earlier and
as seen in Figure 16 upward flowing conical distributions of 0+ and H+
ions are observed The most prominent upward flowing ions are in the L=45
to 51 region and are at trapped pitch angles Again trapped energetic
elections -are observed at higher L-shells strongly indicating that the
upward flowing 0 + ions are on closed field lines
The large fluxes of 0 + ions observed in the ring current during
the magnetic storms discussed in this report and during storms previously
reported on [Johnson etal 1979 and Geiss et al 1979] show that
the ionosphere is a major contributor to the ring current ions in the
energy range of the S3-3 satellite measurements (05-16 keV) The
contribution of solar wind ions to the ring current during magnetic storms
can be assessed from observations of the ratios of the He++H+ and He++
He+ intensities since the He++H+ flux ratio in the solar wind is
+relatively large (typically about 5 x 10⁻²) whereas the He++H and He++
LMSCID673774
He+ flux ratios for the ionospheric components found inthe outer
-magnetosphere by Young et al (1977) are relatively small (-10 3 and
-10-2 respectively)
For the 15 February 1978 magnetic storm it can be seen from Figure 18
that the He++H+ flux and phase space density ratios in the L=4-6 region
are typically greater than 10-2 and from Figure 17 that the He++He+ flux
ratio will be greater than 10 in a comparable L-shell region These
ratios are consistent with solar wind origin and inconsistent with ionoshy
spheric origin for the He ions
For the 29 July 1977 storm the He H+flux ratios as seen in Figure 15 are typically 1-2 x 10⁻² in the L=4-7 region The He++ fluxes
inthe L=40 to 45 region can be seen from Figure 13 to be comparable to
or larger than the He+ fluxes These data are also consistent with solar
wind origin but not with ionospheric origin for the He ions
The preliminary investigations of the 2 and 11 December 1977 magnetic
storms support the conclusions of the IMS Steering Committee that these
storms are good candidates for detailed and coordinated investigations by
the IMS community From the point of view of ring current composition they
appear to exhibit some interesting and perhaps unique composition features
for which adequate data exist to merit detailed analysis
-39shy
LMSCD673774
SECTION 6
REFERENCES
Geiss J H Balsiger P Eberhardt HP Walker L Weber D T Young and H Rosenbauer Dynamics of Magnetospheric ions as observed by the GEOS Mass Spectrometer Proceedings of the 13th ESLAB Symposium Innsbruch Austria June 5-7 1978 Space Science Reviews in press
Ghielmetti A G R G Johnson R D Sharp and E G Shelley The Latitude Diurnal and Altitudinal Distributions of Upward Flowing Energetic Ions of Ionospheric Origin Geophys Res Lett 5 59 1978
Johnson R G R D Sharp and E G Shelley Observation of Ions of Ionoshyspheric Origin in the Storm-Time Ring Current Geophys Res Lett 4 403 1977
Johnson R G W Lennartson R D Sharp E G Shelley and H Balsiger The Composition of the Near Equatorial Ring Current During the December 11 1977 Magnetic Storm EDS 59 1163 1978
Reed R D E G Shelley J C Bakke T C Sanders and J D McDaniel A Low-Energy Channel-Multiplier Spectrometer for ATS-E IEEE Trans Nucl Sci NS-16 259 1969
Sharp R D R G Johnson and E G Shelley The Morphology of Energetic 0+ Ions During Two Magnetic Storms Latitudinal Variations J GeophysRes 81 3292 1976
Shelley E G R G Johnson and R D Sharp Satellite Observations of Energetic Heavy Ions During a Geomagnetic Storm J Geophys Res 77 6104 1972
Shelley E G R D Sharp and R G Johnson Satellite Observations of an Ionospheric Acceleration Mechanism Geophys Res Lett 3 654 1976
Young D T J Geiss H Balsiger P Eberhardt A Ghielmetti and H Rosenbauer Discovery of He2+ and 02+ ions of Terrestrial Origin in the Outer Magnetosphere Geophys Res Lett 4 561 1977

LMSCD673774
trapped 0+ ions are also seen Trapped energetic elections are observed
at higher L-values on this same pass strongly indicating that the
upward flowing 0 ions are on closed field lines and thus are becoming a
part of the ring current at these low L-shells This mechanism of direct
injection of low energy ionospheric ions into the ring current at low
L-shells can then account for the low average 0+ energies in the L=4-5
regions observed in the data presented in Figures 6 7 and 8 The fact
that upstreaming ions are not observed in the L=4-5 regions for REV 3120
and 3121 could result from temporal or local time variations
This mechanism of direct injection of ionospheric ions into the ring
current at low L-shells is also supported by the S3-3 observations prior
to the main phase peak of the 15 February 1978 storm As noted earlier and
as seen in Figure 16 upward flowing conical distributions of 0+ and H+
ions are observed The most prominent upward flowing ions are in the L=45
to 51 region and are at trapped pitch angles Again trapped energetic
elections -are observed at higher L-shells strongly indicating that the
upward flowing 0 + ions are on closed field lines
The large fluxes of 0 + ions observed in the ring current during
the magnetic storms discussed in this report and during storms previously
reported on [Johnson etal 1979 and Geiss et al 1979] show that
the ionosphere is a major contributor to the ring current ions in the
energy range of the S3-3 satellite measurements (05-16 keV) The
contribution of solar wind ions to the ring current during magnetic storms
can be assessed from observations of the ratios of the He++H+ and He++
He+ intensities since the He++H+ flux ratio in the solar wind is
+relatively large (typically about 5 x 10⁻²) whereas the He++H and He++
LMSCID673774
He+ flux ratios for the ionospheric components found inthe outer
-magnetosphere by Young et al (1977) are relatively small (-10 3 and
-10-2 respectively)
For the 15 February 1978 magnetic storm it can be seen from Figure 18
that the He++H+ flux and phase space density ratios in the L=4-6 region
are typically greater than 10-2 and from Figure 17 that the He++He+ flux
ratio will be greater than 10 in a comparable L-shell region These
ratios are consistent with solar wind origin and inconsistent with ionoshy
spheric origin for the He ions
For the 29 July 1977 storm the He H+flux ratios as seen in Figure 15 are typically 1-2 x 10⁻² in the L=4-7 region The He++ fluxes
inthe L=40 to 45 region can be seen from Figure 13 to be comparable to
or larger than the He+ fluxes These data are also consistent with solar
wind origin but not with ionospheric origin for the He ions
The preliminary investigations of the 2 and 11 December 1977 magnetic
storms support the conclusions of the IMS Steering Committee that these
storms are good candidates for detailed and coordinated investigations by
the IMS community From the point of view of ring current composition they
appear to exhibit some interesting and perhaps unique composition features
for which adequate data exist to merit detailed analysis
-39shy
LMSCD673774
SECTION 6
REFERENCES
Geiss J H Balsiger P Eberhardt HP Walker L Weber D T Young and H Rosenbauer Dynamics of Magnetospheric ions as observed by the GEOS Mass Spectrometer Proceedings of the 13th ESLAB Symposium Innsbruch Austria June 5-7 1978 Space Science Reviews in press
Ghielmetti A G R G Johnson R D Sharp and E G Shelley The Latitude Diurnal and Altitudinal Distributions of Upward Flowing Energetic Ions of Ionospheric Origin Geophys Res Lett 5 59 1978
Johnson R G R D Sharp and E G Shelley Observation of Ions of Ionoshyspheric Origin in the Storm-Time Ring Current Geophys Res Lett 4 403 1977
Johnson R G W Lennartson R D Sharp E G Shelley and H Balsiger The Composition of the Near Equatorial Ring Current During the December 11 1977 Magnetic Storm EDS 59 1163 1978
Reed R D E G Shelley J C Bakke T C Sanders and J D McDaniel A Low-Energy Channel-Multiplier Spectrometer for ATS-E IEEE Trans Nucl Sci NS-16 259 1969
Sharp R D R G Johnson and E G Shelley The Morphology of Energetic 0+ Ions During Two Magnetic Storms Latitudinal Variations J GeophysRes 81 3292 1976
Shelley E G R G Johnson and R D Sharp Satellite Observations of Energetic Heavy Ions During a Geomagnetic Storm J Geophys Res 77 6104 1972
Shelley E G R D Sharp and R G Johnson Satellite Observations of an Ionospheric Acceleration Mechanism Geophys Res Lett 3 654 1976
Young D T J Geiss H Balsiger P Eberhardt A Ghielmetti and H Rosenbauer Discovery of He2+ and 02+ ions of Terrestrial Origin in the Outer Magnetosphere Geophys Res Lett 4 561 1977