final report rp2012-03 - center for urban and regional studies
TRANSCRIPT

Land Use Forecasting Models for Small Areas in North
Carolina
NCDOT Research Project RP 2012-03
Final Report
Prepared for:
North Carolina Department of Transportation
Prepared by:
Joseph Huegy, AICP
Institute for Transportation Research and Education
North Carolina State University
Brian J. Morton, Ph.D.
Center for Urban and Regional Studies
University of North Carolina at Chapel Hill

DISCLAIMER The contents of this report reflect the views of the author(s) and not necessarily the views
of the University. The author(s) are responsible for the facts and the accuracy of the data
presented herein. The contents do not necessarily reflect the official views or policies of
either the North Carolina Department of Transportation or the Federal Highway
Administration at the time of publication. This report does not constitute a standard,
specification, or regulation.

ACKNOWLEDGEMENTS
The authors gratefully acknowledge the contributions to this research effort of Michael Miller with the ORED lab at ITRE for the description of methods to forecast school enrollment in North Carolina, and of Matthew Day with Triangle J Council of Governments for conducting the survey of Rural Planning Organizations and for reporting the results.

Technical Report Documentation Page
1. Report No. FHWA/NC/
2. Government Accession No.
3. Recipient’s Catalog No.
4. Title and Subtitle Land Use Forecasting Models for Small Areas in North Carolina
5. Report Date May 24, 2013
6. Performing Organization Code
7. Author(s) Joseph Huegy, AICP Brian J. Morton, Ph.D.
8. Performing Organization Report No.
9. Performing Organization Name and Address Institute for Transportation Research and Education North Carolina State University
10. Work Unit No. (TRAIS)
Centennial Campus, Box 8601 Raleigh, NC 27695‐8601
11. Contract or Grant No.
12. Sponsoring Agency Name and Address North Carolina Department of Transportation Research and Analysis Group
13. Type of Report and Period Covered
1 South Wilmington Street Raleigh, North Carolina 27601
14. Sponsoring Agency Code 2012‐03
Supplementary Notes:
16. Abstract
This report documents research undertaken as part of research project RP 2012‐03 “Land Use Forecasting Models for Small Areas in North Carolina.” The project reviewed the literature on land use models used with transportation models and focusing on land use models used in small areas. Two land use models were acquired for testing as possible candidates for conducting a pilot study. The Transportation Economics and Land Use Model (TELUM) was selected for the pilot performed for Statesville, North Carolina. The pilot study is reported along with an assessment of the usability of the TELUM model for preparing land use forecasts in North Carolina. Recommendations are provided for implementing land use models as part of transportation planning procedures for small areas in North Carolina.
17. Key Words Planning, Land use models, Forecasting
18. Distribution Statement
19. Security Classif. (of this report)
20. Security Classif. (of this page)
21. No. of Pages 122
22. Price
Form DOT F 1700.7 (8‐72) Reproduction of completed page authorized


Land Use Forecasting Models for Small Areas in North Carolina
Center for Urban and Regional Studies at UNC Chapel Hill i Institute for Transportation Research and Education (ITRE) at NC State University
Executive Summary
This report documents research undertaken as part of research project RP 2012‐03 “Land Use Forecasting Models for Small Areas in North Carolina.” The project reviewed the literature on land use models used with transportation models and focused on land use models used in small areas. Two land use models were acquired for testing as possible candidates for conducting a pilot study. The Transportation Economics and Land Use Model (TELUM) was selected for the pilot study performed for Statesville, North Carolina. The pilot study is reported along with an assessment of the usability of the TELUM model for preparing land use forecasts in North Carolina. Recommendations are provided for implementing land use models as part of transportation planning procedures for small areas in North Carolina.
The project also undertook to determine the state of land use forecasting practice in Rural Planning Organizations across North Carolina. Survey results show that while a majority of RPOs have experience preparing base year socio economic data, less than half of RPOs have experience preparing land use forecasts. This suggests that a land use forecasting model could be useful for informing land use forecasts prepared as part of the transportation planning process.
The literature review determined that while there are many land use models that have been developed, most were developed and applied in large metropolitan areas. Land use models have been developed that could be applied in small areas, but only a few have been applied in more than one area. Two of these were acquired for a more detailed review.
Two land use model platforms, Transportation Economics and Land Use Model (TELUM) and Gravity Land Use Model (G‐LUM) were installed and tested to become familiar with their user interfaces and procedures. The user documentation was consulted to determine the capabilities of the two model platforms, and a summary of findings was prepared. The NCDOT Steering and Implementation committee reviewed the findings and recommended using the TELUM platform to perform a pilot study, and Statesville, North Carolina was selected for the pilot study.
The pilot study paired the TELUM land use model with the Statesville, North Carolina transportation model. TELUM inputs for population and employment were prepared from readily available data sources including census data and the OnTheMap product for both a base year (2009) and a lag year (2004) in order to calibrate the TELUM model. Transportation accessibility for morning work trips was provided by the travel demand model. The calibrated model was applied to prepare forecasts for Statesville in five year increments from 2014 to 2040 feeding back revised impedances from the transportation model at each increment. A set of spreadsheets in a workbook were set up to facilitate the translation of data from one model to the other. After the forecasts were prepared, the 2040 results of the TELUM forecast were compared to the locally prepared forecast for 2040 and thematic maps were prepared to show and compare the results. The TELUM model performed well in application in terms of ease of use and generated what appear to be plausible results. The results of applying the TELUM model are quite different from the locally prepared forecast.
A set of recommendations for implementation are included at the end of the report. It is suggested that TELUM models could be prepared by two person teams using data similar to that used by the research team. The spreadsheet tools used by the research team could be used to translate the data from the TELUM output for input to the transportation model. The

Land Use Forecasting Models for Small Areas in North Carolina
ii Center for Urban and Regional Studies at UNC Chapel Hill Institute for Transportation Research and Education (ITRE) at NC State University
spreadsheets could be modified as needed for the specific study area application. It is recommended that the TELUM model be used to supplement and inform locally generated forecasts.
Land Use Forecasting Models for Small Areas in North Carolina
Center for Urban and Regional Studies at UNC Chapel Hill iii Institute for Transportation Research and Education (ITRE) at NC State University
Table of Contents
1 Introduction ...................................................................................................................................... 1‐1
2 Result of Literature Review .............................................................................................................. 2‐2
2.1 Model Catalogue .......................................................................................................... 2‐2
2.2 A Short List of Candidate Models ................................................................................. 2‐6
2.2.1 Transportation Economic and Land Use Model (TELUM) ..................................... 2‐6
2.2.2 Gravity Land Use Model (G‐LUM) ......................................................................... 2‐9
2.2.3 Recommendation of Model Platform for Case Study ......................................... 2‐10
2.3 Methods Used by Others – Forecasting School Enrollment for School Districts in North
Carolina ................................................................................................................................. 2‐19
2.3.1 Introduction ........................................................................................................ 2‐19
2.3.2 Background ......................................................................................................... 2‐19
2.3.3 The Dynamic Allocation of Gain Model .............................................................. 2‐22
2.3.4 Challenges and Opportunities ............................................................................. 2‐24
3 Description of Research Conducted ................................................................................................. 3‐1
3.1 State of Practice in North Carolina ............................................................................... 3‐1
3.1.1 Summary ............................................................................................................... 3‐1
3.2 Pilot Study – Statesville, North Carolina ....................................................................... 3‐1
3.2.1 Introduction .......................................................................................................... 3‐2
3.2.2 Model Structure and Key Behavioral Assumptions .............................................. 3‐3
3.2.2.1 Employment Location (TELUM‐Emp) ............................................................................ 3‐3
3.2.2.2 Residential Location (TELUM‐Res) ................................................................................ 3‐4
3.2.2.3 Residential Land Consumption ...................................................................................... 3‐6
3.2.2.4 Industrial (Basic) Land Consumption ............................................................................. 3‐6
3.2.2.5 Commercial Land Consumption .................................................................................... 3‐6
3.2.3 Input Data for Calibration ..................................................................................... 3‐7
3.2.3.1 Household and Employment Sectors and Regional Data: Initial Data Entry Unit ......... 3‐7
3.2.3.2 Zonal Data on Households, Employment, and Land Use; Regional Data on Labor Force; and Regional Growth: Data Organization and Preparation Unit ................................................ 3‐10
3.2.3.3 Zonal Travel Impedance: Travel Impedance Preparation Unit ................................... 3‐13
3.2.4 Input Data for Forecasting .................................................................................. 3‐14
Land Use Forecasting Models for Small Areas in North Carolina
iv Center for Urban and Regional Studies at UNC Chapel Hill Institute for Transportation Research and Education (ITRE) at NC State University
3.2.5 Post‐Processing TELUM’s Output, Household Population, and Vehicle Counts . 3‐18
4 Findings and Conclusions ................................................................................................................. 4‐1
4.1 Projections Using the Final Statesville TELUM Model .................................................. 4‐1
5 Recommendations ............................................................................................................................ 5‐9
6 Implementation and Technology Transfer Plan ............................................................................... 6‐9
6.1 Recommendations for Implementation ....................................................................... 6‐9
7 Works Cited ...................................................................................................................................... 7‐1
Appendix A Data Required for Calibrating the Statesville TELUM Model: Additional Details ............ A‐1
Appendix B Data Required for Forecasting with the Statesville TELUM Model: Additional Details .... B‐1
Appendix C Calibration Results ............................................................................................................. C‐1
Appendix D Survey Responses ............................................................................................................. D‐1
Appendix E Survey Instrument ............................................................................................................. E‐1
Land Use Forecasting Models for Small Areas in North Carolina
Center for Urban and Regional Studies at UNC Chapel Hill 1‐1 Institute for Transportation Research and Education (ITRE) at NC State University
1 Introduction
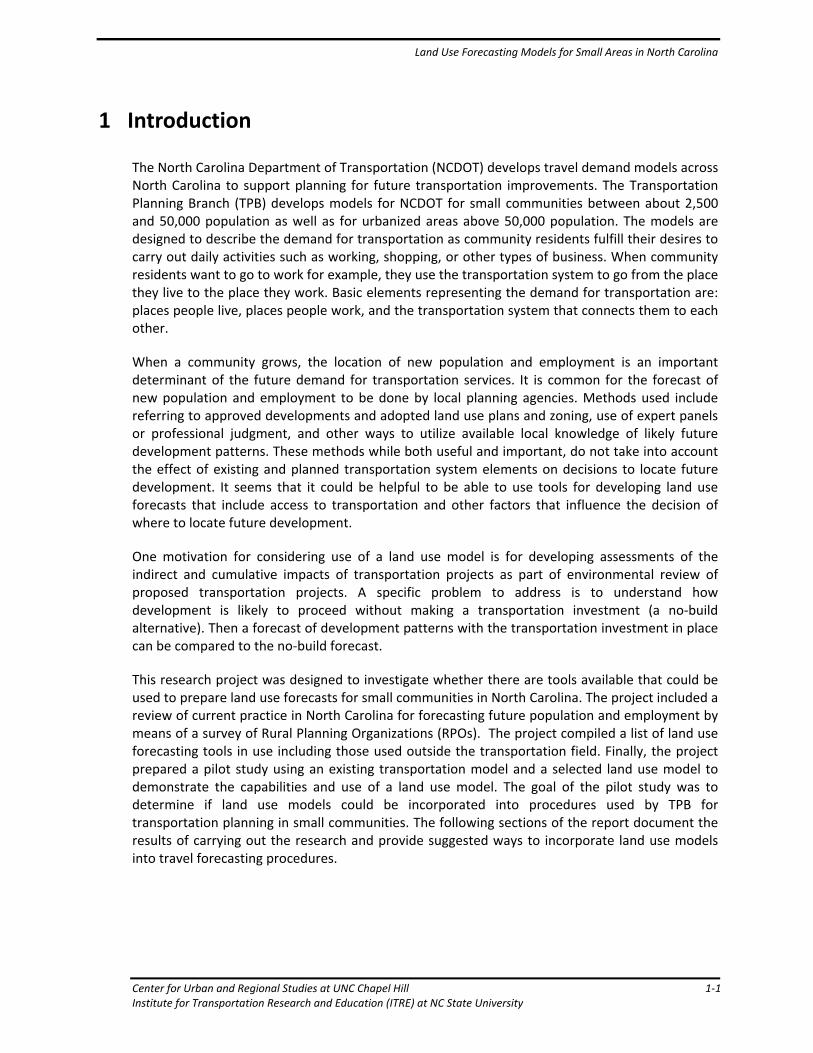
The North Carolina Department of Transportation (NCDOT) develops travel demand models across North Carolina to support planning for future transportation improvements. The Transportation Planning Branch (TPB) develops models for NCDOT for small communities between about 2,500 and 50,000 population as well as for urbanized areas above 50,000 population. The models are designed to describe the demand for transportation as community residents fulfill their desires to carry out daily activities such as working, shopping, or other types of business. When community residents want to go to work for example, they use the transportation system to go from the place they live to the place they work. Basic elements representing the demand for transportation are: places people live, places people work, and the transportation system that connects them to each other.
When a community grows, the location of new population and employment is an important determinant of the future demand for transportation services. It is common for the forecast of new population and employment to be done by local planning agencies. Methods used include referring to approved developments and adopted land use plans and zoning, use of expert panels or professional judgment, and other ways to utilize available local knowledge of likely future development patterns. These methods while both useful and important, do not take into account the effect of existing and planned transportation system elements on decisions to locate future development. It seems that it could be helpful to be able to use tools for developing land use forecasts that include access to transportation and other factors that influence the decision of where to locate future development.
One motivation for considering use of a land use model is for developing assessments of the indirect and cumulative impacts of transportation projects as part of environmental review of proposed transportation projects. A specific problem to address is to understand how development is likely to proceed without making a transportation investment (a no‐build alternative). Then a forecast of development patterns with the transportation investment in place can be compared to the no‐build forecast.
This research project was designed to investigate whether there are tools available that could be used to prepare land use forecasts for small communities in North Carolina. The project included a review of current practice in North Carolina for forecasting future population and employment by means of a survey of Rural Planning Organizations (RPOs). The project compiled a list of land use forecasting tools in use including those used outside the transportation field. Finally, the project prepared a pilot study using an existing transportation model and a selected land use model to demonstrate the capabilities and use of a land use model. The goal of the pilot study was to determine if land use models could be incorporated into procedures used by TPB for transportation planning in small communities. The following sections of the report document the results of carrying out the research and provide suggested ways to incorporate land use models into travel forecasting procedures.
Land Use Forecasting Models for Small Areas in North Carolina
2‐2 Center for Urban and Regional Studies at UNC Chapel Hill Institute for Transportation Research and Education (ITRE) at NC State University
2 Result of Literature Review
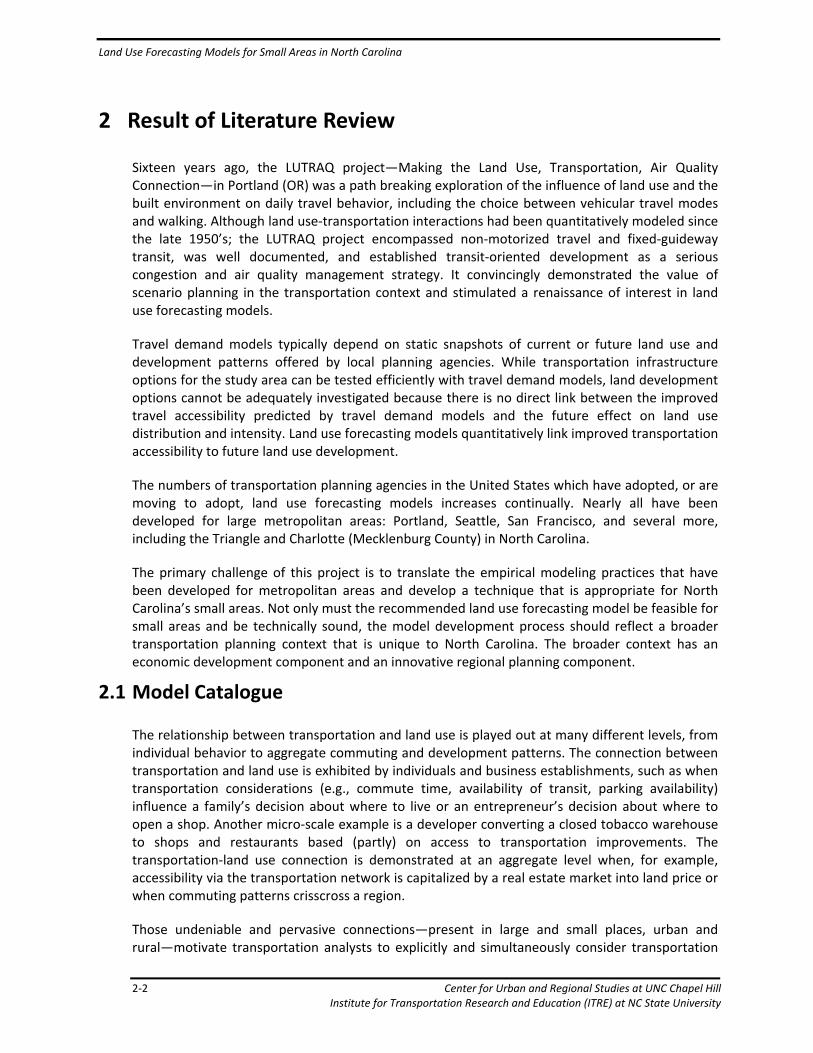
Sixteen years ago, the LUTRAQ project—Making the Land Use, Transportation, Air Quality Connection—in Portland (OR) was a path breaking exploration of the influence of land use and the built environment on daily travel behavior, including the choice between vehicular travel modes and walking. Although land use‐transportation interactions had been quantitatively modeled since the late 1950’s; the LUTRAQ project encompassed non‐motorized travel and fixed‐guideway transit, was well documented, and established transit‐oriented development as a serious congestion and air quality management strategy. It convincingly demonstrated the value of scenario planning in the transportation context and stimulated a renaissance of interest in land use forecasting models.
Travel demand models typically depend on static snapshots of current or future land use and development patterns offered by local planning agencies. While transportation infrastructure options for the study area can be tested efficiently with travel demand models, land development options cannot be adequately investigated because there is no direct link between the improved travel accessibility predicted by travel demand models and the future effect on land use distribution and intensity. Land use forecasting models quantitatively link improved transportation accessibility to future land use development.
The numbers of transportation planning agencies in the United States which have adopted, or are moving to adopt, land use forecasting models increases continually. Nearly all have been developed for large metropolitan areas: Portland, Seattle, San Francisco, and several more, including the Triangle and Charlotte (Mecklenburg County) in North Carolina.
The primary challenge of this project is to translate the empirical modeling practices that have been developed for metropolitan areas and develop a technique that is appropriate for North Carolina’s small areas. Not only must the recommended land use forecasting model be feasible for small areas and be technically sound, the model development process should reflect a broader transportation planning context that is unique to North Carolina. The broader context has an economic development component and an innovative regional planning component.
2.1 Model Catalogue
The relationship between transportation and land use is played out at many different levels, from individual behavior to aggregate commuting and development patterns. The connection between transportation and land use is exhibited by individuals and business establishments, such as when transportation considerations (e.g., commute time, availability of transit, parking availability) influence a family’s decision about where to live or an entrepreneur’s decision about where to open a shop. Another micro‐scale example is a developer converting a closed tobacco warehouse to shops and restaurants based (partly) on access to transportation improvements. The transportation‐land use connection is demonstrated at an aggregate level when, for example, accessibility via the transportation network is capitalized by a real estate market into land price or when commuting patterns crisscross a region.
Those undeniable and pervasive connections—present in large and small places, urban and rural—motivate transportation analysts to explicitly and simultaneously consider transportation
Land Use Forecasting Models for Small Areas in North Carolina
Center for Urban and Regional Studies at UNC Chapel Hill 2‐3 Institute for Transportation Research and Education (ITRE) at NC State University
and land use. Model builders have used a number of techniques to empirically capture transportation‐land use connections. Such models are characterized by explicit measures of accessibility that reflect the state of a study area’s transportation network and algorithms that portray the influence of accessibility on locational choice.
The most sophisticated and complex models have these additional characteristics: 1) they are linked in some way to a travel demand model, which may be built‐in or stand‐alone and 2) the land use algorithms and travel demand algorithms (which may reside in an external model) are interfaced, the former automatically receiving updated accessibility from the travel demand module and the latter automatically receiving updated land use from the land use module. Such models can be more realistic than transportation models in which the land use inputs are exogenous, and land use models in which accessibility is exogenous or not explicitly represented. Accumulating evidence suggests that the most sophisticated models best portray causal relationships (internal validity) and have the best generalizability (external validity) and policy usefulness.
Nonetheless, simpler models certainly have their place. With careful choice and implementation, a simpler model can represent a substantial advance in an agency’s modeling practice.
Table 2‐1 lists land use forecasting modeling platforms that have been used in North America and includes development scenario design tools with which the former may be contrasted. A development scenario design tool assists analysts and stakeholders with articulating their development vision (trend, compact development, etc.) for a particular locale and depicting the land uses that would emerge with implementation. A modeling platform comprises a theory about how land use evolves in a market economy, a database shell, and data input‐output processes; those components are incorporated into software designed to facilitate construction of any number of models. For example, just as TransCAD is a modeling platform for travel demand models, TRANUS is a modeling platform for integrated land use‐transportation models.
With a development scenario design tool, a user would operate in a GIS environment, select the magic wand tool, and paint the landscape with the different place types that express the community’s development vision or scenario. The most sophisticated tools come with a palette or library of place types, such as large‐lot single family dwelling, two‐story mixed use, and many more. The tool calculates the new levels of employment and population for each parcel or zone and the entire study area. The future locations of activity are entirely exogenous and must be specified by the user. Development scenario design tools typically generate the spatially‐referenced socioeconomic data needed by external travel demand models for trip generation, but they do not possess algorithms that would spatially allocate study‐area control totals of future employment and population. Nonetheless, development scenario design tools are very widely used, they are excellent for design charrettes involving the general public, and they have facilitated development of regional land use plans, including the award‐winning Sacramento (CA) Blueprint. Because their forecasting capability is the most limited of the tools that we include in this review, the project team concludes that development scenario design tools will not best serve the Transportation Planning Branch’s needs.

Land Use Forecasting Models for Small Areas in North Carolina
2‐4 Center for Urban and Regional Studies at UNC Chapel Hill Institute for Transportation Research and Education (ITRE) at NC State University
Table 2‐1 Development Scenario Design Tools and Empirical Land Use Forecasting Modeling Platforms Used in North America
Development Scenario Design Tools
Community Build‐Out Analysis† CommunityViz INDEX
I‐PLACE3S
Legacy Models
Kain Lowry Projective Land Use Model (PLUM)
Cellular Automata Models
Land Use Evolution and Impact Assessment Model (LEAM)
Slope, Land Use, Exclusion, Urban, Transportation, Hill Shading (SLEUTH)
Rule‐Based Spatial Allocation Models and Spatial Interaction Models
California Urban Futures 2 ITLUP, DRAM, EMPAL, METROPILUS
Gravity Land Use Model (G‐LUM)
HLFM II+ (part of QRS II) Land Use Scenario DevelopeR (LUSDR)
Simplified Land Allocation Model (SLAM)
Transportation Economic and Land Use Model (TELUM)
UPLAN What if?
Integrated or Linked Land Use‐Transportation Models Using Discrete Choice Sub models
Integrated Land Use, Transportation, Environment (ILUTE)
MEPLAN MetroSim
PECAS TRANUS UrbanSim
Other Models
Cube Land School‐enrollment forecasting models
Subarea Allocation Model and Information Manager
Urban Dynamic Model Urban Land Use Allocation Model (ULAM)
† Underlining connotes open source and/or free of charge.
Land use forecasting models are intrinsically behavioral: there is some underlying theory about the influences on the spatial allocation of employment and population. Despite that commonality, the models differ markedly in the degree to which market processes, market equilibrium (or disequilibrium), and prices are explicitly represented. They also differ with respect to whether and how land use‐transportation interactions are represented, i.e., the feedback among land use, network loadings, accessibility, and land use change.
The Transportation Planning Branch’s needs will be served by one or more land use forecasting models. We distinguish among five types of modeling platform.
Land Use Forecasting Models for Small Areas in North Carolina
Center for Urban and Regional Studies at UNC Chapel Hill 2‐5 Institute for Transportation Research and Education (ITRE) at NC State University
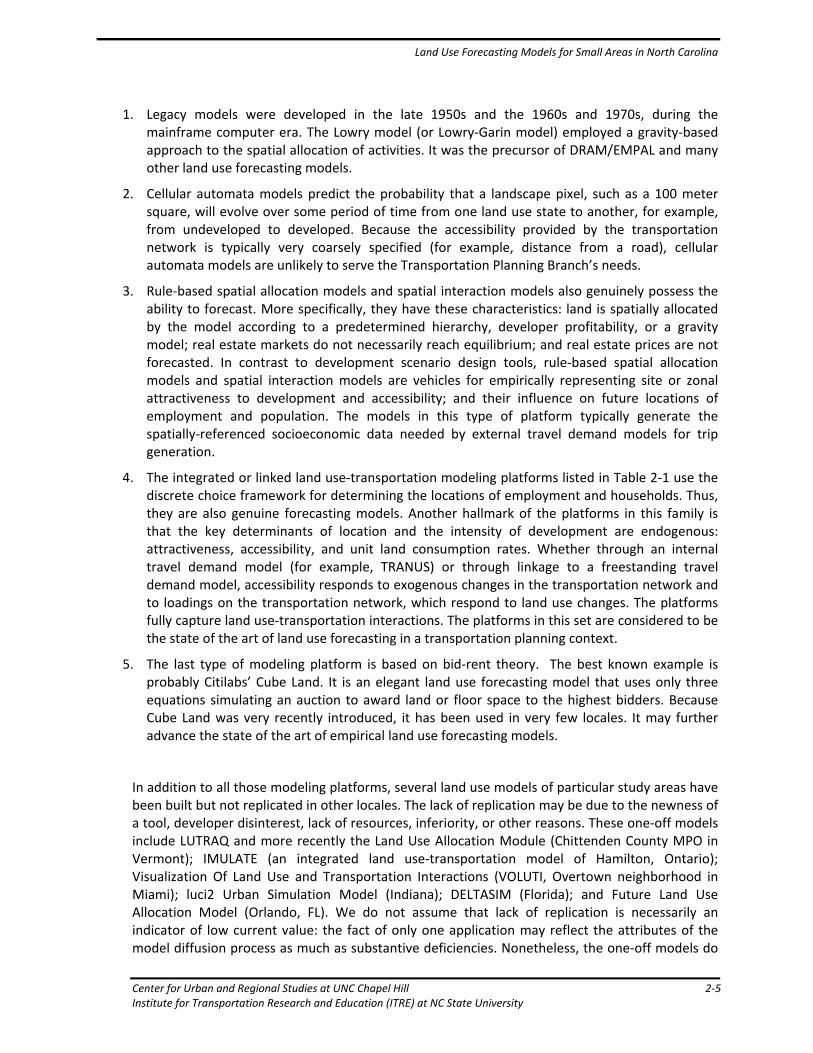
1. Legacy models were developed in the late 1950s and the 1960s and 1970s, during the mainframe computer era. The Lowry model (or Lowry‐Garin model) employed a gravity‐based approach to the spatial allocation of activities. It was the precursor of DRAM/EMPAL and many other land use forecasting models.
2. Cellular automata models predict the probability that a landscape pixel, such as a 100 meter square, will evolve over some period of time from one land use state to another, for example, from undeveloped to developed. Because the accessibility provided by the transportation network is typically very coarsely specified (for example, distance from a road), cellular automata models are unlikely to serve the Transportation Planning Branch’s needs.
3. Rule‐based spatial allocation models and spatial interaction models also genuinely possess the ability to forecast. More specifically, they have these characteristics: land is spatially allocated by the model according to a predetermined hierarchy, developer profitability, or a gravity model; real estate markets do not necessarily reach equilibrium; and real estate prices are not forecasted. In contrast to development scenario design tools, rule‐based spatial allocation models and spatial interaction models are vehicles for empirically representing site or zonal attractiveness to development and accessibility; and their influence on future locations of employment and population. The models in this type of platform typically generate the spatially‐referenced socioeconomic data needed by external travel demand models for trip generation.
4. The integrated or linked land use‐transportation modeling platforms listed in Table 2‐1 use the discrete choice framework for determining the locations of employment and households. Thus, they are also genuine forecasting models. Another hallmark of the platforms in this family is that the key determinants of location and the intensity of development are endogenous: attractiveness, accessibility, and unit land consumption rates. Whether through an internal travel demand model (for example, TRANUS) or through linkage to a freestanding travel demand model, accessibility responds to exogenous changes in the transportation network and to loadings on the transportation network, which respond to land use changes. The platforms fully capture land use‐transportation interactions. The platforms in this set are considered to be the state of the art of land use forecasting in a transportation planning context.
5. The last type of modeling platform is based on bid‐rent theory. The best known example is probably Citilabs’ Cube Land. It is an elegant land use forecasting model that uses only three equations simulating an auction to award land or floor space to the highest bidders. Because Cube Land was very recently introduced, it has been used in very few locales. It may further advance the state of the art of empirical land use forecasting models.
In addition to all those modeling platforms, several land use models of particular study areas have been built but not replicated in other locales. The lack of replication may be due to the newness of a tool, developer disinterest, lack of resources, inferiority, or other reasons. These one‐off models include LUTRAQ and more recently the Land Use Allocation Module (Chittenden County MPO in Vermont); IMULATE (an integrated land use‐transportation model of Hamilton, Ontario); Visualization Of Land Use and Transportation Interactions (VOLUTI, Overtown neighborhood in Miami); luci2 Urban Simulation Model (Indiana); DELTASIM (Florida); and Future Land Use Allocation Model (Orlando, FL). We do not assume that lack of replication is necessarily an indicator of low current value: the fact of only one application may reflect the attributes of the model diffusion process as much as substantive deficiencies. Nonetheless, the one‐off models do
Land Use Forecasting Models for Small Areas in North Carolina
2‐6 Center for Urban and Regional Studies at UNC Chapel Hill Institute for Transportation Research and Education (ITRE) at NC State University
not need to be further investigated because there are several candidates among the contemporary models that have been used repeatedly. The latter are preferable if for no other reason than that multiple applications imply an active user base, which may be consulted for technical assistance.
Another context in which land use forecasting regularly occurs is public facility planning, specifically the location and size of public schools. The models used to forecast residential growth in connection with school enrollment may provide insight into forecasting the land‐use inputs needed by travel demand models. The Operations Research and Education Laboratory (OREd) at ITRE has developed a school‐enrollment forecasting model, which is used by dozens of North Carolina school districts with a wide range of size and technical sophistication. Starting from data on subdivision development and an external forecast of population growth, the model spatially allocates population growth over a 10‐year planning horizon. For a description of this tool, see section 2.3 later in this report.
2.2 A Short List of Candidate Models
The primary goal of our model evaluation process is to identify the modeling platforms that would minimize the total cost to the Transportation Planning Branch of acquiring a sustainable—in the sense of having continuing value—land use forecasting capability that is technically sound and provides the socioeconomic inputs (population and employment) required by an external four‐step travel demand model. Our search criteria take into account monetary and nonmonetary costs, the latter including acquisition of the data required by a land use forecasting model, time required implementing a model, and staff resources required for effective use of a model.
An important secondary goal of model evaluation is to determine whether and how easily a modeling platform could be linked to additional planning tools that local governments commonly use to manage utilities (water supply and sewerage) and comprehensively assess the impacts of development. Thus, for example, the potential linkage of a land use forecasting model and CommunityViz would be an important consideration. The secondary goal was articulated during the meeting convened in October, 2012 by the research team and the Transportation Planning Branch to obtain various internal and external stakeholders’ insights into how the project could be made most useful to the staff participating in community studies and community planning.
Our evaluation criteria lead us to favor the modeling platforms that have been developed in the last decade and applied in multiple locations; have a graphical user interface and built‐in calibration procedures; require only commonly‐available data; and are open‐source or free of charge, and well‐documented while still capturing land use‐transportation interactions. We have identified two candidate models: the Transportation Economic and Land Use Model (TELUM) and Gravity Land Use Model (G‐LUM).
2.2.1 Transportation Economic and Land Use Model (TELUM)
TELUM was developed by Professor Stephen H. Putman and staff at the New Jersey Institute of Technology with funding from the Federal Highway Administration. TELUM builds on the DRAM (forecasts residential locations) and EMPAL (forecasts business locations) components of METROPILUS, which Putman also developed. The current version (5.0) was released in March
Land Use Forecasting Models for Small Areas in North Carolina
Center for Urban and Regional Studies at UNC Chapel Hill 2‐7 Institute for Transportation Research and Education (ITRE) at NC State University
2005. (New Jersey Institute of Technology, 2005) The Transportation Economic and Land Use System (TELUS) Project at the New Jersey Institute of Technology maintains TELUM and provides the software and technical assistance without cost to the user (http://www.telus‐national.org/products/telum.htm). The software is Windows‐based, and the user’s computer must also have Microsoft Access and Microsoft Excel; ESRI’s ArcGIS is helpful but not essential. TELUM has been used by the Pikes Peak Area Council of Governments (CO) and the MPOs in Des Moines (IA) and Little Rock (AR). (Spasovic, 2008, p. 22)
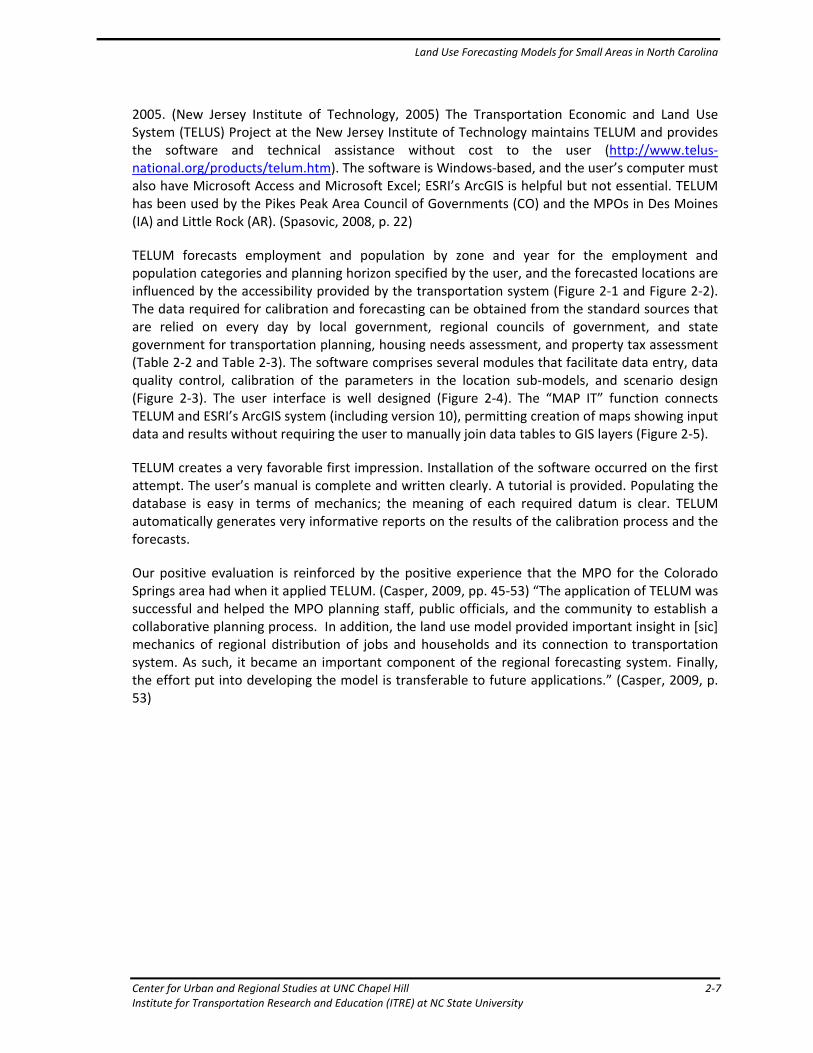
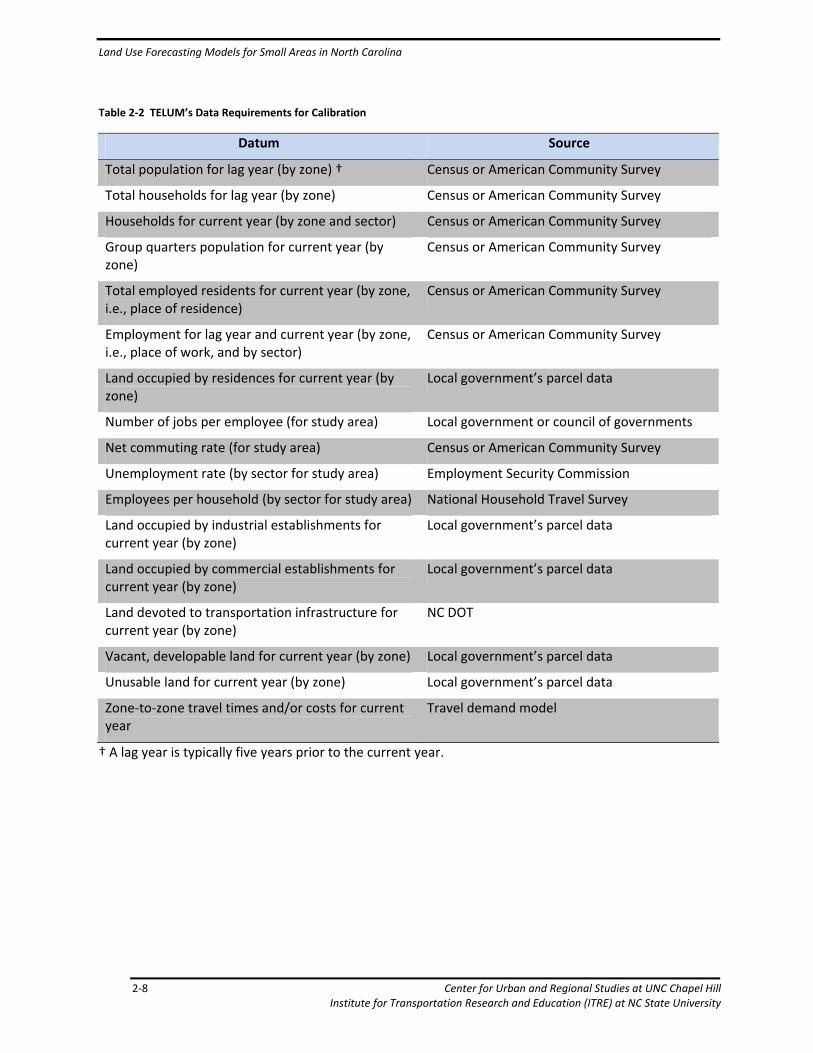
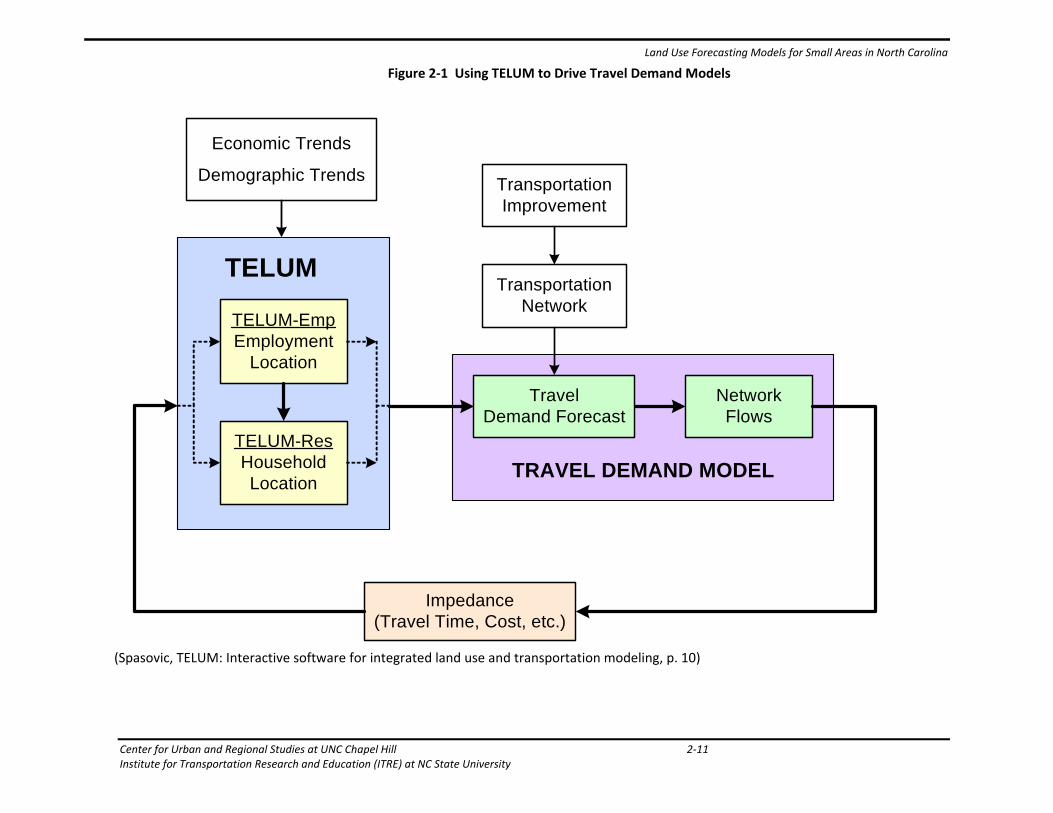
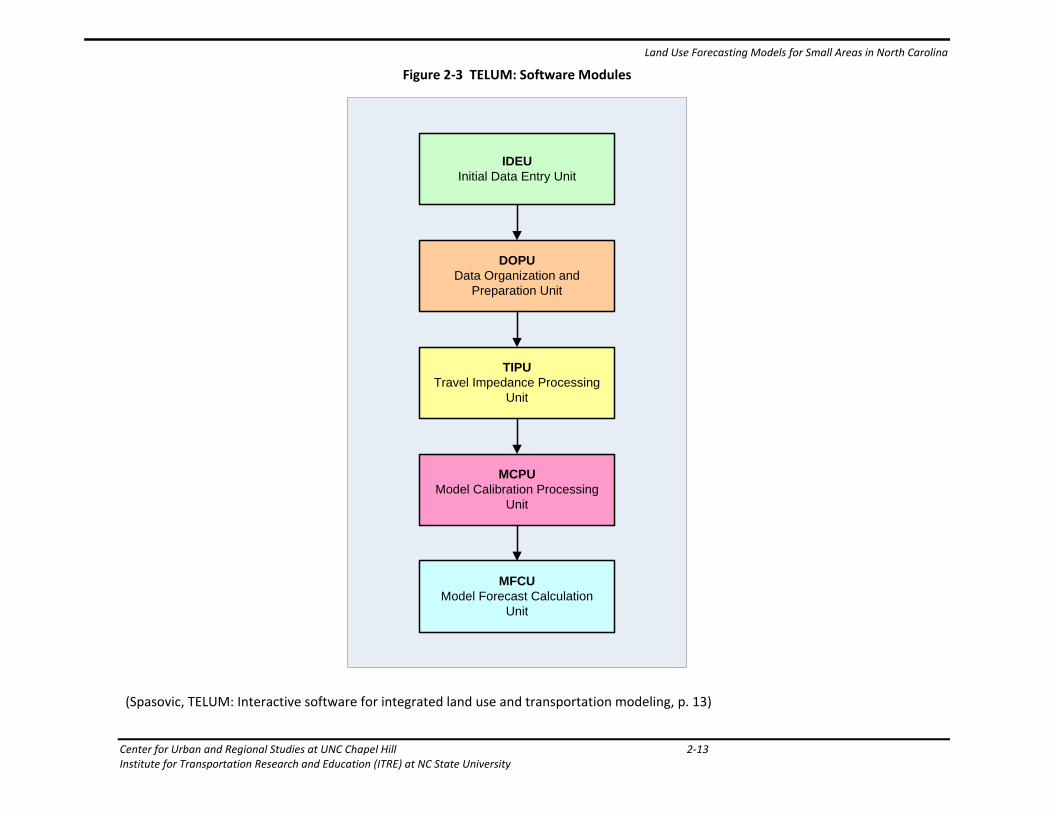
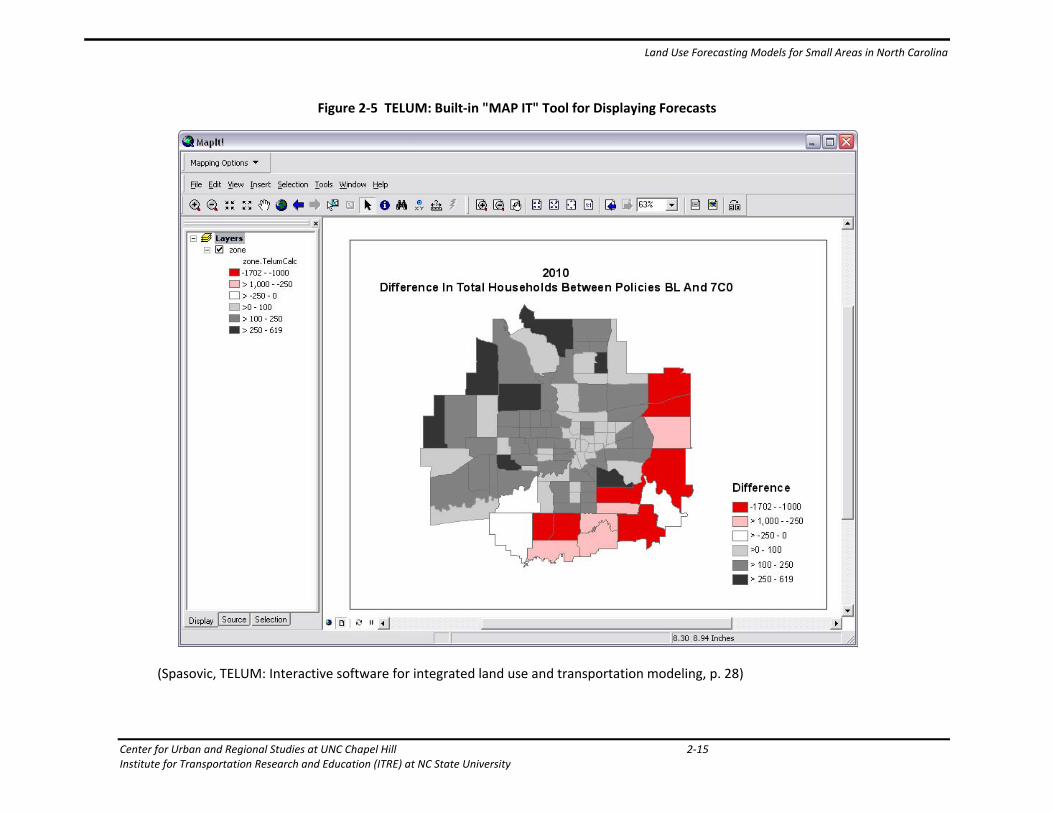
TELUM forecasts employment and population by zone and year for the employment and population categories and planning horizon specified by the user, and the forecasted locations are influenced by the accessibility provided by the transportation system (Figure 2‐1 and Figure 2‐2). The data required for calibration and forecasting can be obtained from the standard sources that are relied on every day by local government, regional councils of government, and state government for transportation planning, housing needs assessment, and property tax assessment (Table 2‐2 and Table 2‐3). The software comprises several modules that facilitate data entry, data quality control, calibration of the parameters in the location sub‐models, and scenario design (Figure 2‐3). The user interface is well designed (Figure 2‐4). The “MAP IT” function connects TELUM and ESRI’s ArcGIS system (including version 10), permitting creation of maps showing input data and results without requiring the user to manually join data tables to GIS layers (Figure 2‐5).
TELUM creates a very favorable first impression. Installation of the software occurred on the first attempt. The user’s manual is complete and written clearly. A tutorial is provided. Populating the database is easy in terms of mechanics; the meaning of each required datum is clear. TELUM automatically generates very informative reports on the results of the calibration process and the forecasts.
Our positive evaluation is reinforced by the positive experience that the MPO for the Colorado Springs area had when it applied TELUM. (Casper, 2009, pp. 45‐53) “The application of TELUM was successful and helped the MPO planning staff, public officials, and the community to establish a collaborative planning process. In addition, the land use model provided important insight in [sic] mechanics of regional distribution of jobs and households and its connection to transportation system. As such, it became an important component of the regional forecasting system. Finally, the effort put into developing the model is transferable to future applications.” (Casper, 2009, p. 53)
Land Use Forecasting Models for Small Areas in North Carolina
2‐8 Center for Urban and Regional Studies at UNC Chapel Hill Institute for Transportation Research and Education (ITRE) at NC State University
Table 2‐2 TELUM’s Data Requirements for Calibration
Datum Source
Total population for lag year (by zone) † Census or American Community Survey
Total households for lag year (by zone) Census or American Community Survey
Households for current year (by zone and sector) Census or American Community Survey
Group quarters population for current year (by zone)
Census or American Community Survey
Total employed residents for current year (by zone, i.e., place of residence)
Census or American Community Survey
Employment for lag year and current year (by zone, i.e., place of work, and by sector)
Census or American Community Survey
Land occupied by residences for current year (by zone)
Local government’s parcel data
Number of jobs per employee (for study area) Local government or council of governments
Net commuting rate (for study area) Census or American Community Survey
Unemployment rate (by sector for study area) Employment Security Commission
Employees per household (by sector for study area) National Household Travel Survey
Land occupied by industrial establishments for current year (by zone)
Local government’s parcel data
Land occupied by commercial establishments for current year (by zone)
Local government’s parcel data
Land devoted to transportation infrastructure for current year (by zone)
NC DOT
Vacant, developable land for current year (by zone) Local government’s parcel data
Unusable land for current year (by zone) Local government’s parcel data
Zone‐to‐zone travel times and/or costs for current year
Travel demand model
† A lag year is typically five years prior to the current year.
Land Use Forecasting Models for Small Areas in North Carolina
Center for Urban and Regional Studies at UNC Chapel Hill 2‐9 Institute for Transportation Research and Education (ITRE) at NC State University
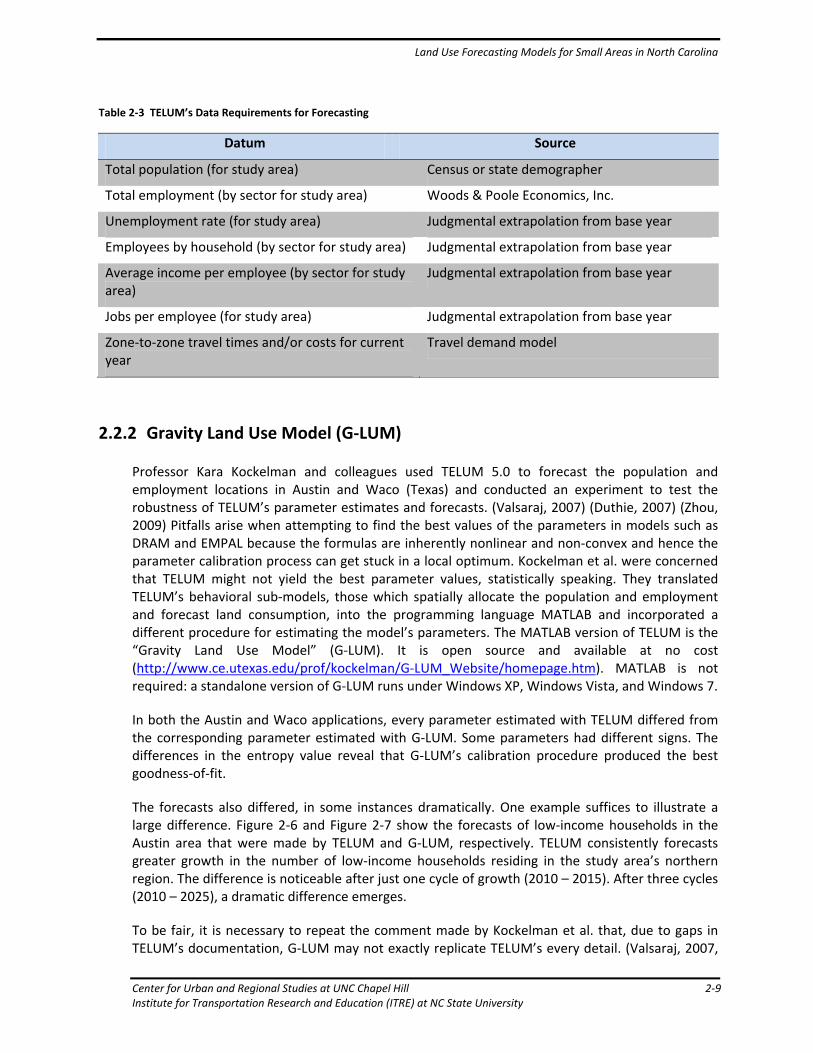
Table 2‐3 TELUM’s Data Requirements for Forecasting
Datum Source
Total population (for study area) Census or state demographer
Total employment (by sector for study area) Woods & Poole Economics, Inc.
Unemployment rate (for study area) Judgmental extrapolation from base year
Employees by household (by sector for study area) Judgmental extrapolation from base year
Average income per employee (by sector for study area)
Judgmental extrapolation from base year
Jobs per employee (for study area) Judgmental extrapolation from base year
Zone‐to‐zone travel times and/or costs for current year
Travel demand model
2.2.2 Gravity Land Use Model (G‐LUM)
Professor Kara Kockelman and colleagues used TELUM 5.0 to forecast the population and employment locations in Austin and Waco (Texas) and conducted an experiment to test the robustness of TELUM’s parameter estimates and forecasts. (Valsaraj, 2007) (Duthie, 2007) (Zhou, 2009) Pitfalls arise when attempting to find the best values of the parameters in models such as DRAM and EMPAL because the formulas are inherently nonlinear and non‐convex and hence the parameter calibration process can get stuck in a local optimum. Kockelman et al. were concerned that TELUM might not yield the best parameter values, statistically speaking. They translated TELUM’s behavioral sub‐models, those which spatially allocate the population and employment and forecast land consumption, into the programming language MATLAB and incorporated a different procedure for estimating the model’s parameters. The MATLAB version of TELUM is the “Gravity Land Use Model” (G‐LUM). It is open source and available at no cost (http://www.ce.utexas.edu/prof/kockelman/G‐LUM_Website/homepage.htm). MATLAB is not required: a standalone version of G‐LUM runs under Windows XP, Windows Vista, and Windows 7.
In both the Austin and Waco applications, every parameter estimated with TELUM differed from the corresponding parameter estimated with G‐LUM. Some parameters had different signs. The differences in the entropy value reveal that G‐LUM’s calibration procedure produced the best goodness‐of‐fit.
The forecasts also differed, in some instances dramatically. One example suffices to illustrate a large difference. Figure 2‐6 and Figure 2‐7 show the forecasts of low‐income households in the Austin area that were made by TELUM and G‐LUM, respectively. TELUM consistently forecasts greater growth in the number of low‐income households residing in the study area’s northern region. The difference is noticeable after just one cycle of growth (2010 – 2015). After three cycles (2010 – 2025), a dramatic difference emerges.
To be fair, it is necessary to repeat the comment made by Kockelman et al. that, due to gaps in TELUM’s documentation, G‐LUM may not exactly replicate TELUM’s every detail. (Valsaraj, 2007,

Land Use Forecasting Models for Small Areas in North Carolina
2‐10 Center for Urban and Regional Studies at UNC Chapel Hill Institute for Transportation Research and Education (ITRE) at NC State University
p. 98) Consequently, the experiment’s comparisons of forecasts may reflect not only differences in calibration procedure but also differences in the formulas used to forecast land consumption. It is still true that the differences in parameter values that Kockelman et al. found for the population and employment location formulas are solely due to differences in the calibration procedure and that G‐LUM yields better‐fitting parameters.
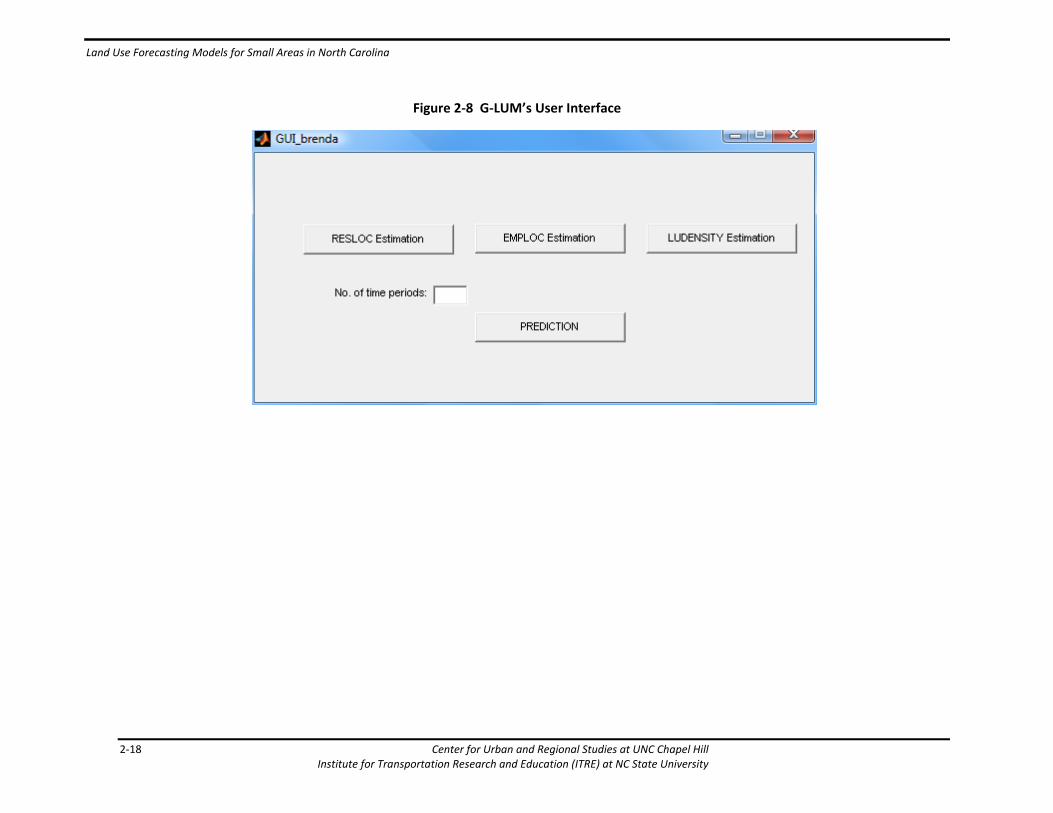
G‐LUM’s user interface can only be described as minimal but adequate (Figure 2‐8). The same can be said of its user’s manual (http://www.ce.utexas.edu/prof/kockelman/G‐LUM_Website/G‐LUM_Code_Documentation.pdf). G‐LUM provides users with access to all of TELUM’s mathematical structure and an arguably superior facility for calibration. On its own merits, G‐LUM is entirely successful.
2.2.3 Recommendation of Model Platform for Case Study
TELUM and G‐LUM have complementary strengths. TELUM’s strong point is a user‐friendly facility for preparing and verifying the lag year, current year, and future year databases. The calibration procedure is especially strong in G‐LUM. They may be used in tandem with minimal redundancy. A hybrid TELUM/G‐LUM modeling system would be an excellent way for the Transportation Planning Branch to acquire a quantitative land‐use forecasting process that is technically sound and has modest requirements for data and staff expertise. The TELUM product was recommended for testing based on TELUM providing a reasonable blend of modest input requirements, acceptable model capabilities, and a user interface (see Section 3.2 below for more information on the choice of platform to test in the pilot study).
Land Use Forecasting Models for Small Areas in North Carolina
Center for Urban and Regional Studies at UNC Chapel Hill 2‐11 Institute for Transportation Research and Education (ITRE) at NC State University
(Spasovic, TELUM: Interactive software for integrated land use and transportation modeling, p. 10)
Figure 2‐1 Using TELUM to Drive Travel Demand Models
TELUM-EmpEmployment
Location
Transportation Network
TravelDemand Forecast
NetworkFlows
Transportation Improvement
TELUM-ResHousehold Location
TELUM
TRAVEL DEMAND MODEL
Impedance(Travel Time, Cost, etc.)
Economic Trends
Demographic Trends

Land Use Forecasting Models for Small Areas in North Carolina
2‐12 Center for Urban and Regional Studies at UNC Chapel Hill Institute for Transportation Research and Education (ITRE) at NC State University
Figure 2‐2 TELUM: Overview of Modeling Process
(Spasovic, TELUM: Interactive software for integrated land use and transportation modeling, p. 12)
Land Use Forecasting Models for Small Areas in North Carolina
Center for Urban and Regional Studies at UNC Chapel Hill 2‐13 Institute for Transportation Research and Education (ITRE) at NC State University
Figure 2‐3 TELUM: Software Modules
(Spasovic, TELUM: Interactive software for integrated land use and transportation modeling, p. 13)
IDEUInitial Data Entry Unit
DOPUData Organization and
Preparation Unit
TIPUTravel Impedance Processing
Unit
MCPUModel Calibration Processing
Unit
MFCUModel Forecast Calculation
Unit

Land Use Forecasting Models for Small Areas in North Carolina
2‐14 Center for Urban and Regional Studies at UNC Chapel Hill Institute for Transportation Research and Education (ITRE) at NC State University
Figure 2‐4 TELUM: Example Screenshot of User Interface
(Spasovic, TELUM: Interactive software for integrated land use and transportation modeling, p. 15)
Land Use Forecasting Models for Small Areas in North Carolina
Center for Urban and Regional Studies at UNC Chapel Hill 2‐15 Institute for Transportation Research and Education (ITRE) at NC State University
Figure 2‐5 TELUM: Built‐in "MAP IT" Tool for Displaying Forecasts
(Spasovic, TELUM: Interactive software for integrated land use and transportation modeling, p. 28)

Lan
(F
nd Use Forecasting M
2‐16
Forecasting emplo
Models for Small Area
oyment and popu
as in North Carolina
Institute for Tra
Figure 2‐6 Low‐i
ulation in Texas: Asize effe
Center for Urnsportation Research
income househo
An investigation ects, for the Austi
rban and Regional Sth and Education (ITR
olds in the Austin
on TELUM requirn and Waco regio
tudies at UNC ChapelE) at NC State Univer
area forecast by
rements, assumpons, 2007, p. 33)
l Hill rsity
y TELUM
ptions, and results
s, including a studdy of zone

(F
Center for UrbanInstitute for Tran
Forecasting emplo
n and Regional Studiensportation Research
oyment and popu
es at UNC Chapel Hilh and Education (ITRE
Figure 2‐7 Low‐i
ulation in Texas: Asize effe
llE) at NC State Univer
income househo
An investigation ects, for the Austi
rsity
olds in the Austin
on TELUM requirn and Waco regio
Land Use
2
area forecast by
rements, assumpons, 2007, p. 34)
e Forecasting Models
2‐17
y G‐LUM
ptions, and results
for Small Areas in No
s, including a stud
orth Carolina
dy of zone
Land Use Forecasting Models for Small Areas in North Carolina
2‐18 Center for Urban and Regional Studies at UNC Chapel Hill Institute for Transportation Research and Education (ITRE) at NC State University
Figure 2‐8 G‐LUM’s User Interface

Land Use Forecasting Models for Small Areas in North Carolina
Center for Urban and Regional Studies at UNC Chapel Hill 2‐19 Institute for Transportation Research and Education (ITRE) at NC State University
2.3 Methods Used by Others – Forecasting School Enrollment for School Districts in North Carolina
2.3.1 Introduction
Techniques for forecasting land use and population used by other agencies in North Carolina have also been investigated. This was done to insure that if techniques are already being used that could be extended or be applied to transportation; they would be considered for application. A set of techniques known to the research team are used by school districts in North Carolina to predict the number and location of school children for the purpose of planning for new school construction.
Reliably predicting the future land use for an area as large and diverse as Wake County in North Carolina may be a daunting task, but the results can be immensely beneficial for those charged with the planning of schools that will house future generations of children. A research unit in the Pupil Transportation Group at the Institute for Transportation Research and Education (ITRE) called the Operations Research and Education Laboratory (OREd) is dedicated to assisting those planners using forecasted land use data to provide optimal planning solutions for school districts and the communities they serve.
2.3.2 Background
The OREd was founded in 1990 to provide data‐driven planning tools for school districts. These tools utilize Operations Research techniques to provide school planners with scientifically sound and defensible strategies for the location of future school sites and drawing attendance boundaries.
School membership forecasts are essential inputs for the processes used by OREd. However, the standard district‐level forecast provided by state education agencies do not provide the necessary building‐level resolution. OREd solves this problem by conducting an extensive land use study for the district, collecting data from interviews with municipal and county planners, utility providers, NCDOT, surveyors, and others. In addition, GIS analysis of district data layers provides key information on residential growth rates, student generation ratios, and subdivision or multi‐family development.
The end product of the analysis of land use data is a time‐dependent distribution of residential growth potential over the district called the Allocation of Gain (AOG). This central feature of the forecast process has evolved significantly over the existence of OREd and especially over the last decade as GIS technologies have advanced. OREd currently offers three levels of AOG models, depending on district size and needs.
1. Static Allocation of Gain. The simplest model is best suited for those smaller and rural districts with fairly clear residential growth patterns. The model assumes the spatial pattern of growth will remain stable over the course of the ten‐year forecast, differing only in magnitude of growth.
Land Use Fo
2‐20
2. S
s
s
j
Figure 2‐9 W
For genparresiden(SG
orecasting Mode
0
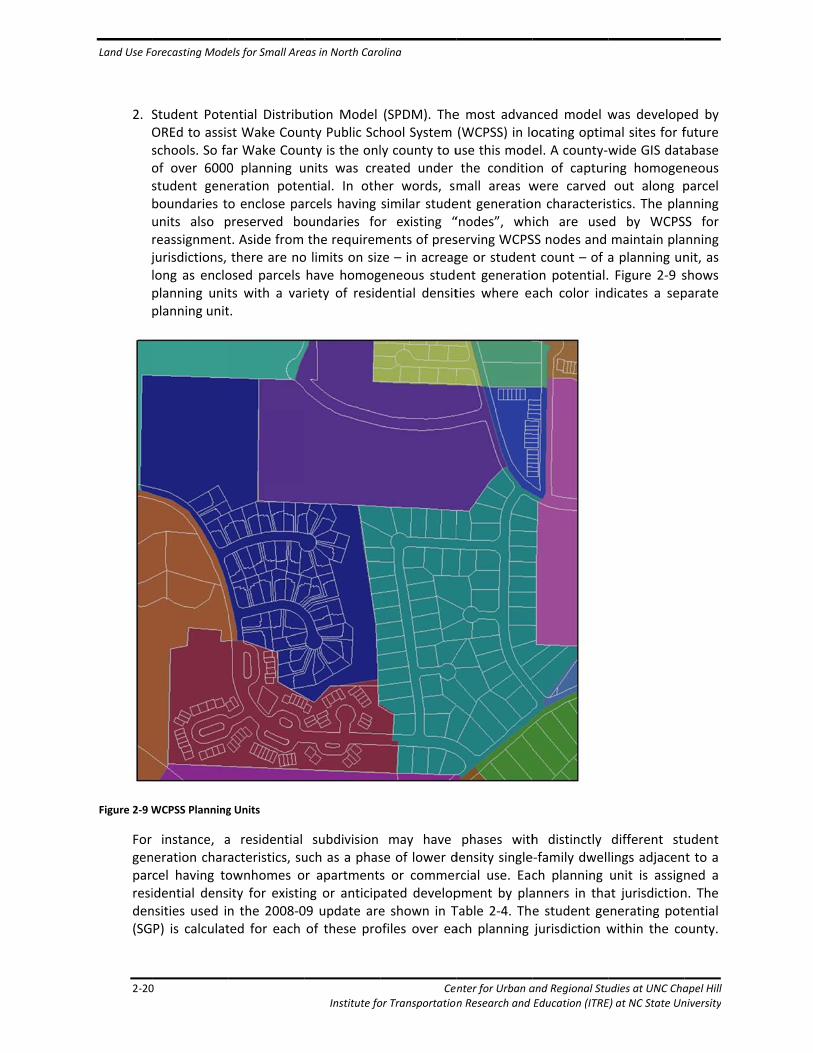
Student PoteOREd to assisschools. So faof over 6000student geneboundaries tunits also preassignmentjurisdictions, long as encloplanning unitplanning unit
WCPSS Planning
instance, aneration charcel having toidential densnsities used inP) is calculat
els for Small Are
ential Distribust Wake Counar Wake Coun0 planning ueration poteo enclose papreserved bot. Aside from there are noosed parcels ts with a vart.
g Units
a residential acteristics, suownhomes oity for existinn the 2008‐0ted for each
eas in North Caro
Institute fo
ution Model nty Public Schnty is the onlunits was crential. In othrcels having oundaries fothe requirem
o limits on sizhave homogriety of resid
subdivision uch as a phasor apartmentsng or anticip09 update areof these pro
olina
Ceor Transportation
(SPDM). Thehool System ly county to ueated under her words, smsimilar studeor existing “ments of presze – in acreaggeneous studedential densit
may have se of lower ds or commerated develope shown in Tofiles over ea
nter for Urban an Research and
e most advan(WCPSS) in louse this modethe conditiomall areas went generatio“nodes”, whserving WCPSge or studentent generatioties where e
phases withdensity singlercial use. Eacpment by plaTable 2‐4. Thach planning
and Regional StuEducation (ITRE
nced model wocating optimel. A county‐won of capturwere carved on characterisich are useSS nodes and t count – of aon potential.ach color ind
h distinctly e‐family dwellch planning anners in thae student gejurisdiction w
udies at UNC ChaE) at NC State Un
was developmal sites for fwide GIS datring homogenout along p
stics. The plad by WCPSmaintain plaa planning un Figure 2‐9 sdicates a sep
different stlings adjacenunit is assignat jurisdictionenerating potwithin the co
apel Hill niversity
ed by future abase neous parcel nning SS for nning nit, as shows parate
udent t to a ned a n. The tential ounty.

Land Use Forecasting Models for Small Areas in North Carolina
Center for Urban and Regional Studies at UNC Chapel Hill 2‐21 Institute for Transportation Research and Education (ITRE) at NC State University
Together, the planner‐assigned density and the OREd‐assigned SGP make up the profile for that planning unit.
Table 2‐4 Residential Density Planning Region Profiles
Profile Residential Class Residential Density
NONRES Planning Region is non‐residential
N/A
RR Rural residential Under 0.50 du/ac
VL Very low residential 0.51 – 1.00 du/ac
L Low residential 1.01 – 3.00 du/ac
ML Low‐medium residential 3.01 – 5.00 du/ac
M Medium residential 5.01 – 8.00 du/ac
MH Medium‐high residential 8.01 – 12.00 du/ac
H High residential 12.01 – 16.00 du/ac
VH Very high residential 16.01 – 20.00 du/ac
UH Urban high residential Over 20.00 du/ac
UH_RAL Urban high – Raleigh 20.01 – 40.00 du/ac
EXH_RAL Extremely high – Raleigh Over 40 du/ac
The GIS database was divided by Urban Service Area among the 13 planning agencies within Wake County. The planners were asked to use a common residential density table developed by OREd to populate present and future residential profiles and expected build‐out timelines for each of the planning units within their jurisdiction. This was a time‐intensive procedure: smaller jurisdictions may have only a few hundred planning units, but had to complete the task with a smaller staff. Raleigh had around one‐third of the planning units, but could divide their jurisdiction into planning sub‐regions that were already defined.
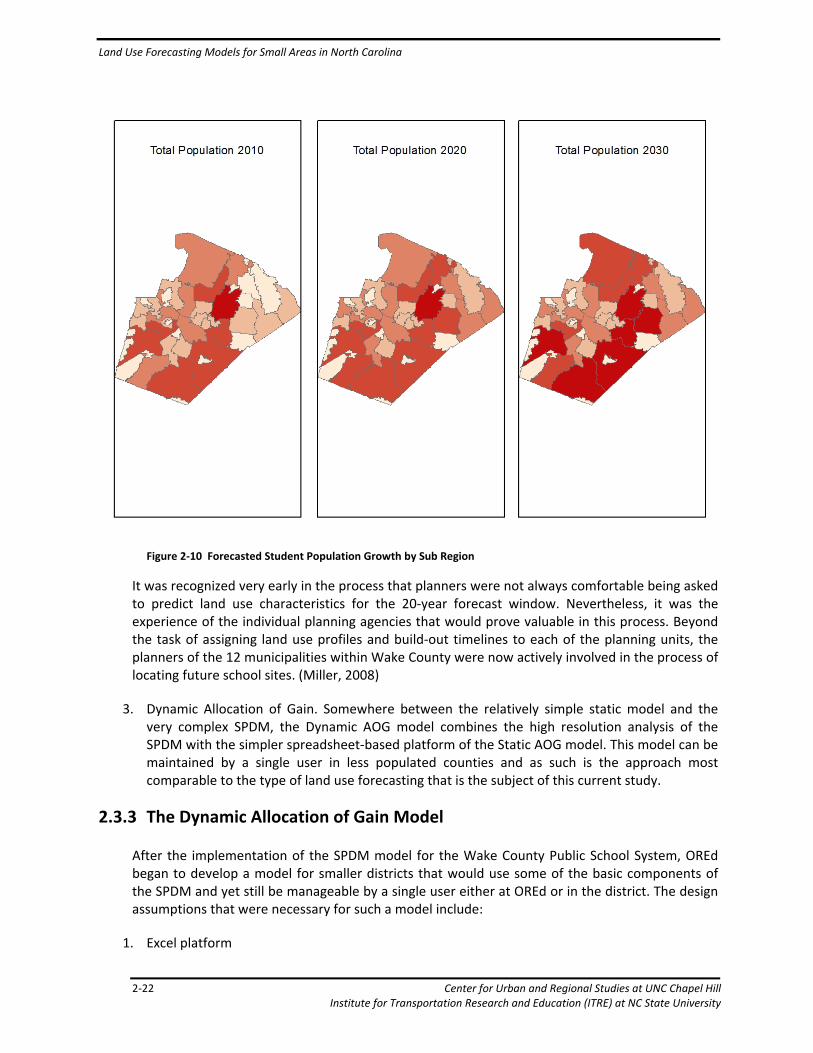
When complete, the planning unit database was used as input for the Student Potential Distribution Model, which uses cohort survival techniques to advance students through the system and assign new growth to areas based on residential profile and build‐out data provided by the planners. Cohort survival techniques apply survival rates and birth rates by sex to estimate future population by age over the forecast period. The existing population is divided into age groups which are the cohorts. The cohorts containing the existing population of students will move to older cohorts over the forecast period subject to the survival rate, and children will be born depending on the birth rate for females in cohorts of child bearing age and move into student age cohorts over the forecast period. The end result is a high‐resolution 20‐year K‐12 student population forecast based on residential growth potential as seen by county and municipal planners (see Figure 2‐10). Planning units have been aggregated to districts in the figures for clarity.
Land Use Forecasting Models for Small Areas in North Carolina
2‐22 Center for Urban and Regional Studies at UNC Chapel Hill Institute for Transportation Research and Education (ITRE) at NC State University
Figure 2‐10 Forecasted Student Population Growth by Sub Region
It was recognized very early in the process that planners were not always comfortable being asked to predict land use characteristics for the 20‐year forecast window. Nevertheless, it was the experience of the individual planning agencies that would prove valuable in this process. Beyond the task of assigning land use profiles and build‐out timelines to each of the planning units, the planners of the 12 municipalities within Wake County were now actively involved in the process of locating future school sites. (Miller, 2008)
3. Dynamic Allocation of Gain. Somewhere between the relatively simple static model and the very complex SPDM, the Dynamic AOG model combines the high resolution analysis of the SPDM with the simpler spreadsheet‐based platform of the Static AOG model. This model can be maintained by a single user in less populated counties and as such is the approach most comparable to the type of land use forecasting that is the subject of this current study.
2.3.3 The Dynamic Allocation of Gain Model
After the implementation of the SPDM model for the Wake County Public School System, OREd began to develop a model for smaller districts that would use some of the basic components of the SPDM and yet still be manageable by a single user either at OREd or in the district. The design assumptions that were necessary for such a model include:
1. Excel platform

Land Use Forecasting Models for Small Areas in North Carolina
Center for Urban and Regional Studies at UNC Chapel Hill 2‐23 Institute for Transportation Research and Education (ITRE) at NC State University
2. High resolution
3. Compatible with existing OREd forecasting methods
4. “Real‐time” modification of:
o Build‐out timeline
o Student generation ratios
For nearly all client districts of OREd, a database of Planning Segments is constructed. Although similar to the planning units used in the SPDM, Planning Segments have slightly different requirements related to the eventual use in later OREd tasks such as attendance boundary optimization. Most notable of these requirements are: the K‐12 student count should fall between 50 and 100 per segment and Planning Segment boundaries must preserve existing school district boundaries. As in the case of the SPDM planning units, care is taken to keep neighborhoods intact when possible.
Through a series of community interviews with planning departments, utilities, surveyors, and others that may have information on county growth as well as extensive parcel‐level GIS analysis, existing and anticipated residential development data is entered into the Planning Segment database. Each segment contains the following data:
Current student counts
Current number of residential and residential/developed lots
Current student generation ratio, defined as students per developed lot
Information on anticipated residential development, including total number of lots/units and a
build‐out timeline
While the Planning Segment database resides within a GIS platform (either as a .shp file or within a geo‐database), the forecast model itself was developed as a spreadsheet. Like the Static AOG model and the SPDM, the Dynamic AOG model creates a distribution for a pre‐determined population curve. For all current versions of these models, the system‐wide forecast is calculated separately and used as input.
Each Planning Segment has an individual internally‐calculated growth curve, based on the following parameters:
Total number of residential lots, whether existing or anticipated
Total number of developed residential lots/units
Estimated years to build‐out
As the forecast year advances, the model “develops” available residential lots/units according to the growth curve which in turn yields the potential gain for that segment. This potential gain, when compared to all other potentials over the Planning Segments, becomes that segment’s Allocation of Gain for that year.
Strength of the Dynamic AOG model is ease of regular maintenance. As the user becomes aware of new developments, changed build‐outs or adjusted densities, it is an easy task to modify or enter new residential data for the relevant Planning Segment and update the forecast. The spreadsheet format as shown in Figure 2‐11 is familiar and usually easy to debug. As it relates to

Land Use Forecasting Models for Small Areas in North Carolina
2‐24 Center for Urban and Regional Studies at UNC Chapel Hill Institute for Transportation Research and Education (ITRE) at NC State University
school population forecasts, the system‐wide student population projection can be updated each year to provide district planners with the tools needed to plan for student growth with new facilities and data‐driven attendance zones.
Figure 2‐11 Residential Data Entry for Planning Segments
The Dynamic Allocation of Gain model is currently in use in a number of North Carolina school districts. These districts are characterized by significant residential growth and growth potential, a reasonably sophisticated county GIS department, and district staff resources.
2.3.4 Challenges and Opportunities
The gathering of information through community interviews and analysis is a central feature for every one of the OREd forecasting models. The task of data collection serves not only its explicit end but also as an opportunity for the community to invest in the planning of their schools.
While they are the most qualified for the task, county and municipal planners may be pushed to speculate when they are asked to provide accurate build‐out timelines and densities for developments that may be only conceptual when data is collected. When coupled with the realities of local and regional economics and politics, it is clearly a challenge for both planners and analysts to produce the kind of reliable forecasting needed for effective school planning.

Land Use Forecasting Models for Small Areas in North Carolina
Center for Urban and Regional Studies at UNC Chapel Hill 3‐1 Institute for Transportation Research and Education (ITRE) at NC State University
3 Description of Research Conducted
This section of the report describes the research carried out during course of the project. There are two main parts to the research described: a survey of land use forecasting practice at Rural Planning Organizations in North Carolina; and a pilot study for Statesville, North Carolina.
3.1 State of Practice in North Carolina
The first task of the research project was to find out the level of knowledge about land use forecasting and the state of practice among rural planning organizations in North Carolina. One purpose for this task was to understand where land use forecasting models might fit in with existing planning practice across the state. In order to discover the state of existing planning practice with land use forecasting, a survey was conducted with staff at Rural Planning Organizations. A brief summary is provided below and the detailed responses and the survey questionnaire are provided in the appendices.
3.1.1 Summary
A web‐based survey on land use forecasting in rural areas of North Carolina was made available to all Rural Planning Organizations (RPOs) in the state. The topic of the survey was presented at the North Carolina Association of RPOs (NCARPO) meeting on October 28, 2011, and paper copies of the survey were provided to those present, as well as a link to a web‐based version of the survey. A reminder email message was sent out to the RPO listserv on November 7, 2011, and the period for completing the surveys closed on November 21, 2011.
In all, 19 responses were received, representing 16 of the state’s 20 RPOs. It should be noted that one RPO submitted an incomplete survey, so they are coded as “no response” on the questions that were not completed.
In general, the results reflect a wide variety of levels of staff experience and expertise on the topic of land use forecasting. While the majority of respondents report having some experience with developing base year household and employment data, less than half reported experience with developing forecasts of land use data for a future year. There are also a sizeable number of respondents (about 25%) who report no experience at all with developing this type of data.
Appendix D provides the responses for individual questions to the survey and more detailed summaries of the survey data. Appendix E provides the survey questionnaire.
3.2 Pilot Study – Statesville, North Carolina
A key aspect of this research project was to choose a land use forecasting tool that showed potential for use by NCDOT and local planners, and to apply it in a pilot study to demonstrate its capabilities, and to get actual experience using the tool. During a meeting on March 7, 2012 candidate land use forecasting tools were presented to the NCDOT Steering and Implementation committee. After deliberating, the NCDOT Steering and Implementation committee recommended testing the TELUM product (Transportation, Economic, and Land Use Model). This
Land Use Forecasting Models for Small Areas in North Carolina
3‐2 Center for Urban and Regional Studies at UNC Chapel Hill Institute for Transportation Research and Education (ITRE) at NC State University
recommendation was based on TELUM providing a reasonable blend of modest input requirements, acceptable model capabilities, and a user interface, though it was also noted that there was no clear choice of platform to test. A list of locations where transportation studies were under way in North Carolina was reviewed to identify an appropriate location for the pilot study. Statesville, North Carolina was recommended by the NCDOT Steering and Implementation committee for the pilot study due to its appropriate (small) size (25,000 households) and the availability of information for the study area. Also, a transportation model for a current year (2009) and forecast year was available for Statesville. Model files and data were made available to the research team so they could apply the model as part of testing the land use forecasting tool.
The Statesville, North Carolina travel demand model is an aggregate trip based travel demand model developed in accordance with the “Small Area Travel Demand Model Procedures Manual.” (NCDOT Transportation Planning Branch, 2008) The Statesville study area is 179 square miles divided into 167 internal and twenty seven external zones. The highway network contains 843 highway links and approximately 319 miles of roadways. In 2009 there were 25,385 households, 64,025 resident population, and 29,141 total employees.
3.2.1 Introduction
TELUM—Transportation, Economic, and Land Use Model—is a platform for building models that forecast or project the future locations (by zone such as TAZ) of households and employment, conditioned on travel impedance. The model’s conceptual framework was developed by Stephen Putman, who developed DRAM, EMPAL, and METROPILUS, which have been used by multiple Metropolitan Planning Organizations to develop the socioeconomic inputs needed by zonal travel demand models.
With funding from Federal Highway Administration, TELUM was developed by, and is maintained by, staff with the TELUS Program at the New Jersey Institute of Technology. The software is free but not open source and may be downloaded from http://www.telus‐national.org/products/telum_download.htm. The software that was used in this project is the ArcGIS 10‐enabled version.
TELUM is being used by the MPO for Little Rock, Arkansas (Metroplan) to help develop the area’s long‐range transportation plan (for 2040). (Lupton, 2012) The platform also has been used by, among other agencies, the Pikes Peak Area Council of Governments, the MPO in Colorado Springs, CO. (Casper, 2009, pp. 45‐53) The published accounts of those agencies’ use of TELUM give the impression that the scenarios that have been assessed represent business‐as‐usual or trends, but the software is capable of assessing scenarios in which growth is constrained by a local policy intended to achieve, for example, a greater amount of compact and mixed‐use development. Because the TELUM‐based projections are influenced by travel impedances, which would be provided by an external travel demand model, the regional land‐use consequences of a substantial change in transportation infrastructure such as light rail or bus rapid transit may also be assessed comprehensively.
TELUM solves a vexing problem in transportation planning: how to forecast the locations of households and employment and those persons’ daily or peak‐hour travel demands when activity locations themselves depend upon the accessibility provided by the transportation network. That problem is especially challenging for “no‐build” or base‐case scenarios in which a study area’s
Land Use Forecasting Models for Small Areas in North Carolina
Center for Urban and Regional Studies at UNC Chapel Hill 3‐3 Institute for Transportation Research and Education (ITRE) at NC State University
transportation infrastructure in the future is either the same as it is in the current year or is changing according to previously‐adopted plans.
The forecasting problem is solved through: spatial allocation of regional control totals of population and employment using a TELUM model of the study area; two‐way linkage between the land‐use model and a travel demand model; and recursion. With a calibrated TELUM model at hand (assume it is calibrated to conditions in 2012) and forecasts of the study area’s regional population and employment in 2017, TELUM would forecast zonal population and employment, reflecting the transportation system and travel impedances as they were in 2012. Two more steps would be needed. The “first‐iteration” zonal population and employment forecasts would be provided to the travel demand model—of which the transportation infrastructure has been updated, if necessary; the model would be run; and the ensuing travel impedances would be calculated. Those first‐iteration travel impedances would subsequently be provided to the TELUM model; it would be run for a second time, using the same 2017 regional population and employment inputs; and the second‐iteration zonal population and employment forecasts would be made and provided to the travel demand model. Both models would be run sequentially and repeatedly until stable zonal socioeconomic forecasts and travel impedances emerge. The final result would be zonal socioeconomic and travel forecasts that reflect the future equilibrium of the land use and transportation systems but which were not made with any assumptions about the zonal locations of population or employment.
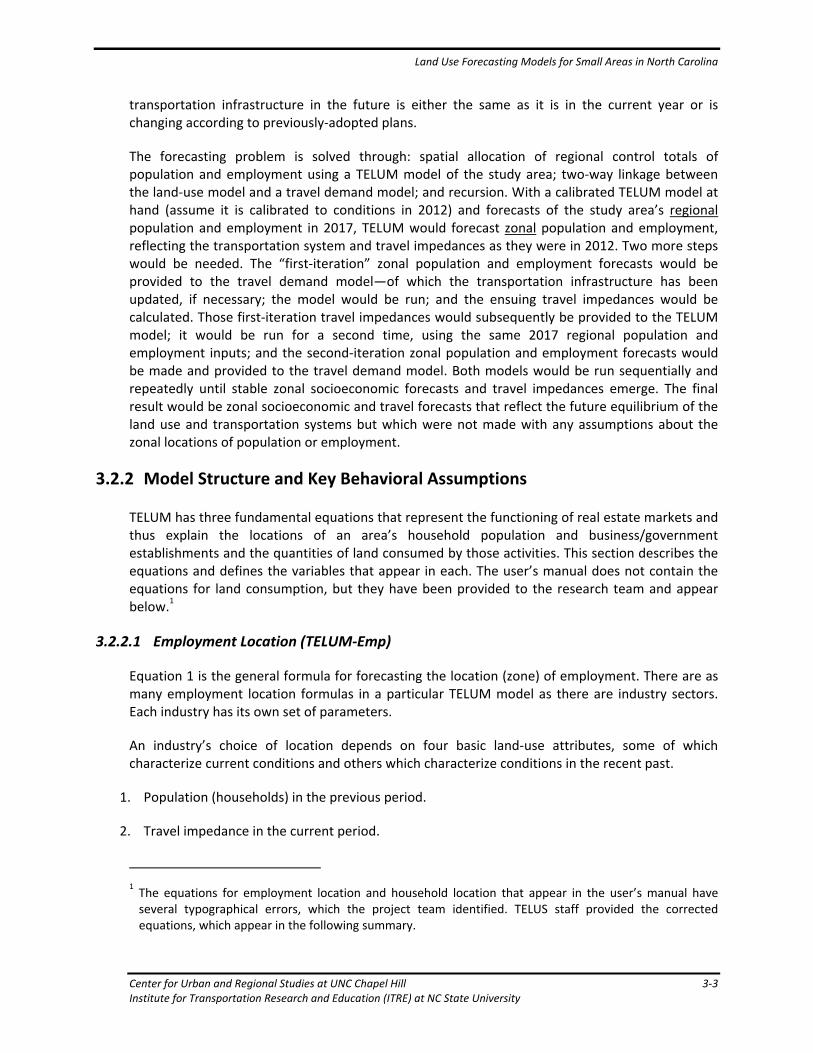
3.2.2 Model Structure and Key Behavioral Assumptions
TELUM has three fundamental equations that represent the functioning of real estate markets and thus explain the locations of an area’s household population and business/government establishments and the quantities of land consumed by those activities. This section describes the equations and defines the variables that appear in each. The user’s manual does not contain the equations for land consumption, but they have been provided to the research team and appear below.
1
3.2.2.1 Employment Location (TELUM‐Emp)
Equation 1 is the general formula for forecasting the location (zone) of employment. There are as many employment location formulas in a particular TELUM model as there are industry sectors. Each industry has its own set of parameters.
An industry’s choice of location depends on four basic land‐use attributes, some of which characterize current conditions and others which characterize conditions in the recent past.
1. Population (households) in the previous period.
2. Travel impedance in the current period.
1 The equations for employment location and household location that appear in the user’s manual have several typographical errors, which the project team identified. TELUS staff provided the corrected equations, which appear in the following summary.
Land Use Forecasting Models for Small Areas in North Carolina
3‐4 Center for Urban and Regional Studies at UNC Chapel Hill Institute for Transportation Research and Education (ITRE) at NC State University
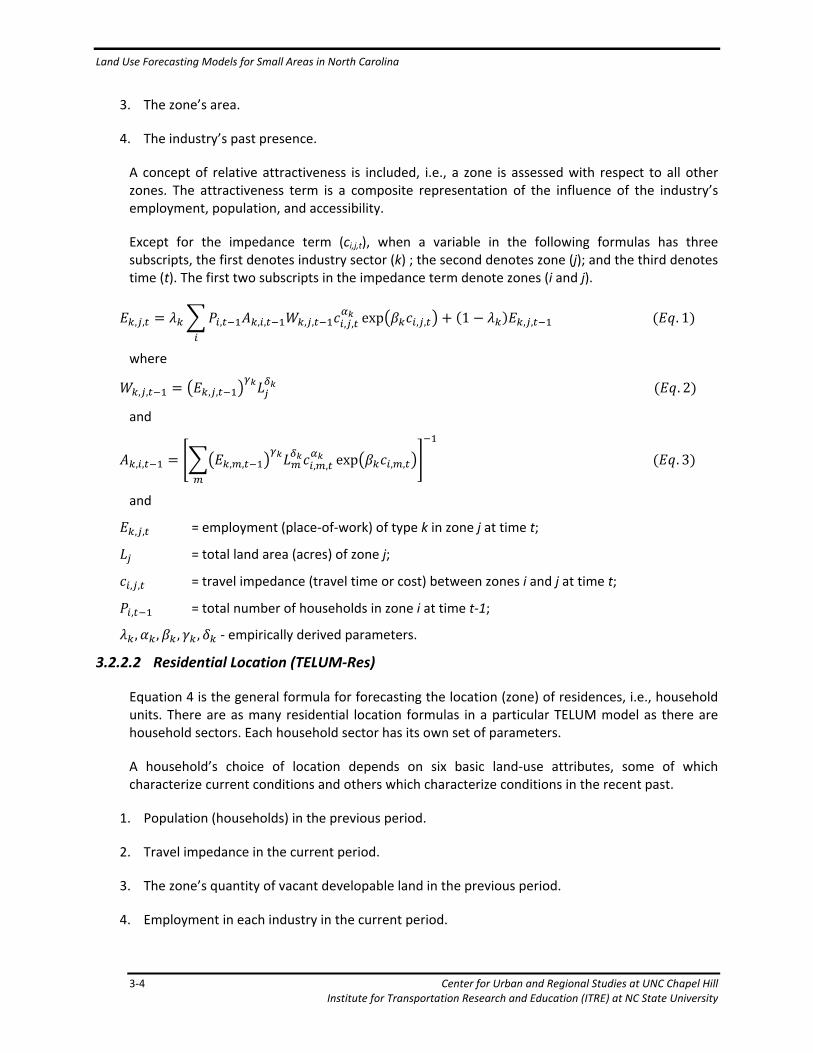
3. The zone’s area.
4. The industry’s past presence.
A concept of relative attractiveness is included, i.e., a zone is assessed with respect to all other zones. The attractiveness term is a composite representation of the influence of the industry’s employment, population, and accessibility.
Except for the impedance term (ci,j,t), when a variable in the following formulas has three subscripts, the first denotes industry sector (k) ; the second denotes zone (j); and the third denotes time (t). The first two subscripts in the impedance term denote zones (i and j).
, , , , , , , , , exp , , 1 , , . 1
where
, , , , . 2
and
, , , , , , exp , , . 3
and
, , = employment (place‐of‐work) of type k in zone j at time t;
= total land area (acres) of zone j;
, , = travel impedance (travel time or cost) between zones i and j at time t;
, = total number of households in zone i at time t‐1;
, , , , ‐ empirically derived parameters.
3.2.2.2 Residential Location (TELUM‐Res)
Equation 4 is the general formula for forecasting the location (zone) of residences, i.e., household units. There are as many residential location formulas in a particular TELUM model as there are household sectors. Each household sector has its own set of parameters.
A household’s choice of location depends on six basic land‐use attributes, some of which characterize current conditions and others which characterize conditions in the recent past.
1. Population (households) in the previous period.
2. Travel impedance in the current period.
3. The zone’s quantity of vacant developable land in the previous period.
4. Employment in each industry in the current period.

Land Use Forecasting Models for Small Areas in North Carolina
Center for Urban and Regional Studies at UNC Chapel Hill 3‐5 Institute for Transportation Research and Education (ITRE) at NC State University
5. The zone’s quantity of developable land that had been developed.
6. The zone’s quantity of land in residential use in the previous period.
A concept of relative attractiveness is included, i.e., a zone is assessed with respect to all other zones. The attractiveness term is a composite representation of the influence of vacant developable land; developable land that had been developed; residential land; population; and accessibility.
Except for the impedance term (ci,j,t), when a variable in the following formulas has three subscripts, the first denotes industry sector (k) ; the second denotes zone (j); and the third denotes time (t). The first two subscripts in the impedance term denote zones (i and j).
, , , , , , , , , , exp , , 1 , . 4
where
, , , , , . 5
and
, , , , , , exp , , . 6
and
, , , , , 1 , ,
,
. 7
and
, , = employment (place‐of‐work) of type k in zone j at time t;
, , = number of households of type h residing in zone i at time t;
, = total number of households residing in zone i at time t‐1;
, = vacant developable land (acres) in zone i at time t‐1;
, = 1 plus the percentage of developable land already developed in zone i at time t‐1;
, = residential land (acres) in zone i at time t‐1;
, = regional coefficient of type h households per type k employee;
, , = travel impedance (travel time or cost) between zones i and j at time t;
, , , , , , ‐ empirically derived parameters.
Land Use Forecasting Models for Small Areas in North Carolina
3‐6 Center for Urban and Regional Studies at UNC Chapel Hill Institute for Transportation Research and Education (ITRE) at NC State University
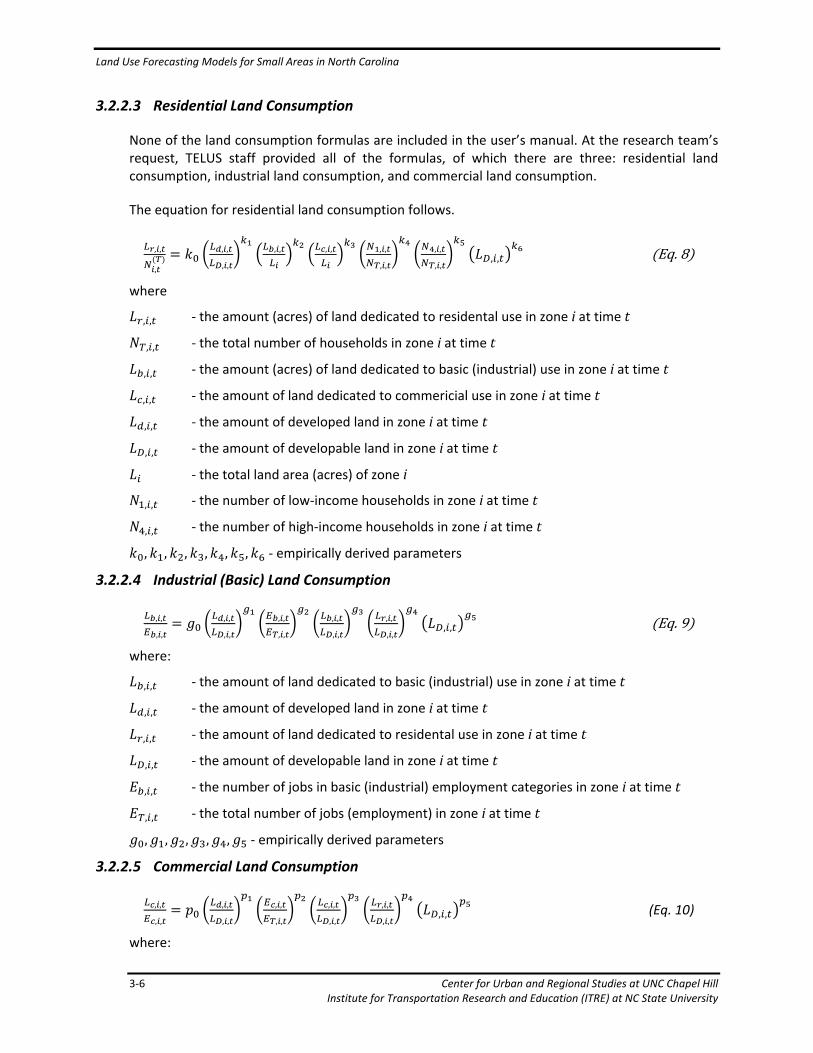
3.2.2.3 Residential Land Consumption
None of the land consumption formulas are included in the user’s manual. At the research team’s request, TELUS staff provided all of the formulas, of which there are three: residential land consumption, industrial land consumption, and commercial land consumption.
The equation for residential land consumption follows.
, ,
,
, ,
, ,
, , , , , ,
, ,
, ,
, ,, , Eq.8
where
, , ‐ the amount (acres) of land dedicated to residental use in zone i at time t
, , ‐ the total number of households in zone i at time t
, , ‐ the amount (acres) of land dedicated to basic (industrial) use in zone i at time t
, , ‐ the amount of land dedicated to commericial use in zone i at time t
, , ‐ the amount of developed land in zone i at time t
, , ‐ the amount of developable land in zone i at time t
‐ the total land area (acres) of zone i
, , ‐ the number of low‐income households in zone i at time t
, , ‐ the number of high‐income households in zone i at time t
, , , , , , ‐ empirically derived parameters
3.2.2.4 Industrial (Basic) Land Consumption
, ,
, ,
, ,
, ,
, ,
, ,
, ,
, ,
, ,
, ,, , Eq.9
where:
, , ‐ the amount of land dedicated to basic (industrial) use in zone i at time t
, , ‐ the amount of developed land in zone i at time t
, , ‐ the amount of land dedicated to residental use in zone i at time t
, , ‐ the amount of developable land in zone i at time t
, , ‐ the number of jobs in basic (industrial) employment categories in zone i at time t
, , ‐ the total number of jobs (employment) in zone i at time t
, , , , , ‐ empirically derived parameters
3.2.2.5 Commercial Land Consumption
, ,
, ,
, ,
, ,
, ,
, ,
, ,
, ,
, ,
, ,, , (Eq. 10)
where:

Land Use Forecasting Models for Small Areas in North Carolina
Center for Urban and Regional Studies at UNC Chapel Hill 3‐7 Institute for Transportation Research and Education (ITRE) at NC State University
, , ‐ the amount of land dedicated to commercial use in zone i at time t
, , ‐ the amount of developed land in zone i at time t
, , ‐ the amount of land dedicated to residental use in zone i at time t
, , ‐ the amount of developable land in zone i at time t
, , ‐ the number of jobs in commercial employment categories in zone i at time t
, , ‐ the total number of jobs (employment) in zone i at time t
, , , , , ‐ empirically derived parameters
3.2.3 Input Data for Calibration
The data that are required for calibrating the parameters of the location and land consumption equations describe Statesville’s population, labor force, economy, commuting patterns, and land use in the recent past—specifically, in a “current” year and “lag” year. The ideal current year is the base year in the travel demand model for which a TELUM model is being developed. The ideal lag year is five years prior to the current year. The Statesville travel demand model’s base year is 2009. The data that are available permitted use of 2009 as the current year and 2004 as the lag year.
Our methods for collecting data are summarized in this section, in the order that TELUM’s user interface requests them. Appendix A provides additional details and provides a summary that is organized in a complementary way, i.e., by type of datum.
3.2.3.1 Household and Employment Sectors and Regional Data: Initial Data Entry Unit
The first module that is encountered when building a TELUM model is the Initial Data Entry Unit or IDEU. Table 3‐1 provides the Statesville model’s IDEU inputs.
Before describing the most important details of the data provided to the model at this stage, a crucial, overarching data issue will be discussed. We initially attempted to calibrate the model with the 2009 data provided by the Transportation Planning Branch (TPB),
2 in Book1.xlsx, which
contains the travel demand model’s socioeconomic inputs. Those data were generated by TPB and Lake Norman RPO and local government staff, who began with, and made adjustments to, 2009 data obtained from ESRI. (Hansen, 2010) (ESRI, 2009) The calibration process failed with those data for the Office employment category even after steps were taken to facilitate calibration by merging two empty (no households and no employment) zones with adjacent occupied zones. We contacted ESRI about obtaining 2004 data in the same series as their 2009 data, but we were told that the 2004 data were no longer available. The calibration process was completely successful when additional spatial aggregation was made and the TELUM model was provided with TPB’s
2 The Transportation Planning Branch works closely with local government staff when developing the socioeconomic inputs for travel demand models. For convenience, we will use the term “Transportation Planning Branch” or “TPB” as a shorthand reference for the state‐local group that developed the inputs for the Statesville travel demand model.

Land Use Forecasting Models for Small Areas in North Carolina
3‐8 Center for Urban and Regional Studies at UNC Chapel Hill Institute for Transportation Research and Education (ITRE) at NC State University
households for the current year (2009), U.S. Bureau of the Census employment for the current year, and U.S. Bureau of the Census households and employment for the lag year (2004).
A successful calibration required several efforts to accommodate the original zone structure, household and employment categories, and zone‐specific values of “Office” employment to TELUM’s requirements. Those adjustments have very little or no effect on the forecasts provided to the travel demand model because we made further efforts to compensate for the adjustments. We describe the adjustments and the offsetting compensations in this section’s and the next section’s narrative of the TELUM model’s inputs.
The number of zones (136) is less than the number of internal TAZs (167) in the travel demand model. Each of 31 TAZs was merged with another TAZ. We will refer to the 136 zones in the TELUM model as “Super TAZs.” Two mergers were made because zones had neither households nor employment. The other mergers were made because zones had either no households or no employment in 2004 or 2009. In general, the mergers were made to facilitate calibration.
Table 3‐1 Data Entered into the Initial Data Entry Module
Datum Value
Name of your region Statesville
Number of zones 136
Total regional population 64,156
Current data year 2009
Lag data year 2004
Number of employment categories 4
Employment category 1 IND (industrial)
Employment category 2 RHT (retail and high‐traffic retail)
Employment category 3 SERV (service)
Employment category 4 OFF (office)
Number of household categories 5
Household category 1 ONE (1‐person households)
Household category 2 TWO (2‐person households)
Household category 3 THREE (3‐person households)
Household category 4 FOUR (4‐person households)
Household category 5 FIVE (households with 5 or more persons)
Total land area of region (acres) 114,331.81
Number of forecast periods 6 (in 5‐year increments ending in 2040)†
Total number of persons working in region (2009)
27,346
Total jobs in region (2009) 29,168
† In the Ini al Data Entry Module, the last forecast year is labeled “2039,” but the values that were entered for population and employment correspond to the year 2040. The spatial aggregation that was made during development of the TELUM model must be reversed after preparation of forecasts to ensure compatibility with the travel demand model’s zone structure. The research team developed an Excel workbook to spatially disaggregate the forecasts.

Land Use Forecasting Models for Small Areas in North Carolina
Center for Urban and Regional Studies at UNC Chapel Hill 3‐9 Institute for Transportation Research and Education (ITRE) at NC State University
The total regional population is the number of persons living in the study area in 2009. The total comprises the residents of households and residents of group quarters.
The TELUM model has four employment categories, one less than the travel demand model. The latter’s high‐traffic retail category and retail category were combined. The number of employment categories was reduced to reduce the number of zones with very small employment, which impeded calibration.
Five household categories are present in the TELUM model. The defining characteristic of a category is household size. The travel demand model has 20 household categories: one‐person household with zero autos, one‐person household with one auto, one‐person household with two autos, one‐person household with three or more autos and so on, the last category being households with five or more persons and three or more autos. The TELUM software can accommodate only eight household categories. The most obvious approach to aggregating the travel demand model’s categories involved aggregation on the basis of household size.
Thus the TELUM model has fewer, more aggregate household and employment categories than the travel demand model. The same Excel workbook that reverses the spatial aggregation also reverses the category aggregation, to exactly match the travel demand model.
Based on the TAZ shape file that was provided by TPB, the total land area of the Statesville modeling domain is 112,763 acres, but the value that had to be provided to the TELUM model is slightly larger, about 114,332 acres. The increase in area was necessary to accommodate the adjustments (increases) to employment in the Office sector in some Super TAZs. The increase in total land area exactly preserves the actual average rate of land consumption by the enterprises in the Office sector.
In the Initial Data Entry Module, the last two inputs—total number of persons working in Statesville in the current year and total jobs in Statesville in the current year—are used only in the calculation of the regional jobs per employee in the current year, which TELUM calculates automatically: total jobs ÷ total number of working persons.3 We obtained both inputs from an LED OnTheMap Area Profile Analysis for the study area defined by importing the Statesville internal zone shape file into OnTheMap.4 To estimate the total number of persons working in Statesville, we used these settings: primary jobs by place of work, 2009. The “primary jobs” setting counts each worker’s highest paying job, so each worker is only counted once. The “by place of work” setting includes all employees working in the study area, regardless of where they live. To estimate total jobs in Statesville, we used these settings: all jobs by place of work, 2009.
3 Strictly speaking, neither value is used when TELUM calibrates the model’s parameters, but total number of persons and total jobs in Statesville must be entered into the Initial Data Entry Module. Therefore, considering work flow, it is most convenient to discuss those values at this point.
4 OnTheMap is an online, interactive GIS provided by the U.S. Census Bureau for studies of local labor markets and commuting patterns: http://onthemap.ces.census.gov/. “LED” is the acronym for Local Employment‐ Dynamics.
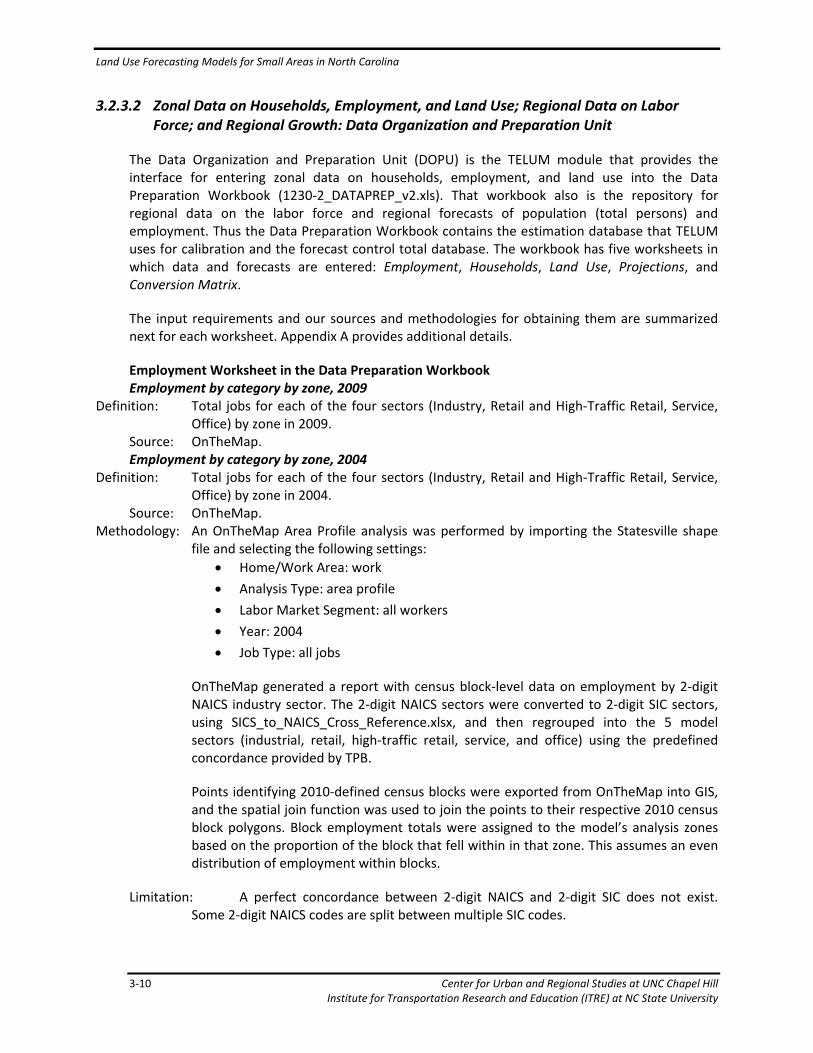
Land Use Forecasting Models for Small Areas in North Carolina
3‐10 Center for Urban and Regional Studies at UNC Chapel Hill Institute for Transportation Research and Education (ITRE) at NC State University
3.2.3.2 Zonal Data on Households, Employment, and Land Use; Regional Data on Labor Force; and Regional Growth: Data Organization and Preparation Unit
The Data Organization and Preparation Unit (DOPU) is the TELUM module that provides the interface for entering zonal data on households, employment, and land use into the Data Preparation Workbook (1230‐2_DATAPREP_v2.xls). That workbook also is the repository for regional data on the labor force and regional forecasts of population (total persons) and employment. Thus the Data Preparation Workbook contains the estimation database that TELUM uses for calibration and the forecast control total database. The workbook has five worksheets in which data and forecasts are entered: Employment, Households, Land Use, Projections, and Conversion Matrix.
The input requirements and our sources and methodologies for obtaining them are summarized next for each worksheet. Appendix A provides additional details.
Employment Worksheet in the Data Preparation Workbook Employment by category by zone, 2009
Definition: Total jobs for each of the four sectors (Industry, Retail and High‐Traffic Retail, Service, Office) by zone in 2009.
Source: OnTheMap. Employment by category by zone, 2004
Definition: Total jobs for each of the four sectors (Industry, Retail and High‐Traffic Retail, Service, Office) by zone in 2004.
Source: OnTheMap. Methodology: An OnTheMap Area Profile analysis was performed by importing the Statesville shape
file and selecting the following settings:
Home/Work Area: work
Analysis Type: area profile
Labor Market Segment: all workers
Year: 2004
Job Type: all jobs
OnTheMap generated a report with census block‐level data on employment by 2‐digit NAICS industry sector. The 2‐digit NAICS sectors were converted to 2‐digit SIC sectors, using SICS_to_NAICS_Cross_Reference.xlsx, and then regrouped into the 5 model sectors (industrial, retail, high‐traffic retail, service, and office) using the predefined concordance provided by TPB.
Points identifying 2010‐defined census blocks were exported from OnTheMap into GIS, and the spatial join function was used to join the points to their respective 2010 census block polygons. Block employment totals were assigned to the model’s analysis zones based on the proportion of the block that fell within in that zone. This assumes an even distribution of employment within blocks.
Limitation: A perfect concordance between 2‐digit NAICS and 2‐digit SIC does not exist. Some 2‐digit NAICS codes are split between multiple SIC codes.

Land Use Forecasting Models for Small Areas in North Carolina
Center for Urban and Regional Studies at UNC Chapel Hill 3‐11 Institute for Transportation Research and Education (ITRE) at NC State University
Table 3‐2 summarizes study‐area total employment by employment category for 2004 and 2009, including both TPB’s 2009 totals and the TELUM model’s 2009 totals. Overall, the TELUM model has about 9% greater employment in 2009.
Table 3‐2 2004 and 2009 Employment by Sector
Employment Category 2004 OnTheMap
2009 TPB 2009 TELUM
Industry 12,449 10,286 8,939
RHT (Retail & High‐Traffic Retail) 8,701 6,863 8,306
Service 9,865 7,563 9,257
Office 2,533 2,208 2,827
Total 33,548 26,920 29,329
Households Worksheet in the Data Preparation Workbook Households by type by zone, 2009
Definition: Number of households in each of five categories (1‐person, 2‐person, 3‐person, etc.) in each zone in 2009.
Source: TPB. Population in group quarters by zone, 2009
Definition: Number of persons living in group quarters, either institutional or non‐institutional, in each zone in 2009.
Source: TPB. Total household population by zone, 2009
Definition: Total number of persons living in households in each zone in 2009. Source: TPB. Total households by zone, 2004 Definition: Total number of households in each zone in 2004.
Source: Census Transportation Planning Package (2000) and Census Population Estimates Program.
Methodology: The total number of households in 2004 in each zone was estimated by applying a growth rate, obtained from the Census Bureau, to the total number of households by census block in 2000 and then aggregating across census blocks.
Land Use Worksheet in the Data Preparation Workbook The Land Use worksheet requires land use area totals by zone for each land use type: residential, basic (industrial), commercial, streets, vacant/developable, unusable, and usable. Residential, basic, commercial, streets, and vacant/developable land area by zone, 2009
Definition: Area in acres occupied by residential land uses, basic (industrial) land uses, commercial land uses, streets, and vacant land in each zone in 2009.
Source: Iredell County parcels layer, appraisal table, and land use codes. Methodology: Land use codes were extracted from the Iredell County 2010 appraisal table and joined
(based on PIN) to the parcel shape file that contains the acreage of each parcel. Land uses for each parcel were recoded as TELUM land use categories (residential, basic, commercial, or vacant/developable) based on a concordance that was established.
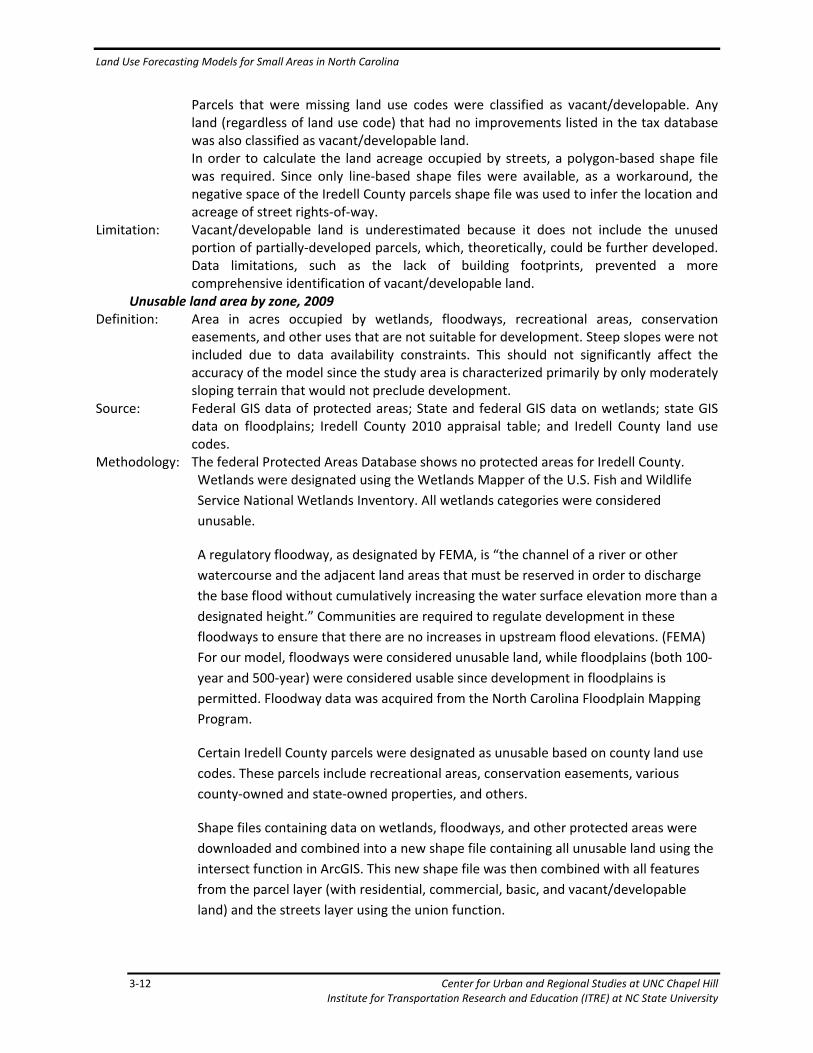
Land Use Forecasting Models for Small Areas in North Carolina
3‐12 Center for Urban and Regional Studies at UNC Chapel Hill Institute for Transportation Research and Education (ITRE) at NC State University
Parcels that were missing land use codes were classified as vacant/developable. Any land (regardless of land use code) that had no improvements listed in the tax database was also classified as vacant/developable land. In order to calculate the land acreage occupied by streets, a polygon‐based shape file was required. Since only line‐based shape files were available, as a workaround, the negative space of the Iredell County parcels shape file was used to infer the location and acreage of street rights‐of‐way.
Limitation: Vacant/developable land is underestimated because it does not include the unused portion of partially‐developed parcels, which, theoretically, could be further developed. Data limitations, such as the lack of building footprints, prevented a more comprehensive identification of vacant/developable land.
Unusable land area by zone, 2009 Definition: Area in acres occupied by wetlands, floodways, recreational areas, conservation
easements, and other uses that are not suitable for development. Steep slopes were not included due to data availability constraints. This should not significantly affect the accuracy of the model since the study area is characterized primarily by only moderately sloping terrain that would not preclude development.
Source: Federal GIS data of protected areas; State and federal GIS data on wetlands; state GIS data on floodplains; Iredell County 2010 appraisal table; and Iredell County land use codes.
Methodology: The federal Protected Areas Database shows no protected areas for Iredell County. Wetlands were designated using the Wetlands Mapper of the U.S. Fish and Wildlife
Service National Wetlands Inventory. All wetlands categories were considered
unusable.
A regulatory floodway, as designated by FEMA, is “the channel of a river or other
watercourse and the adjacent land areas that must be reserved in order to discharge
the base flood without cumulatively increasing the water surface elevation more than a
designated height.” Communities are required to regulate development in these
floodways to ensure that there are no increases in upstream flood elevations. (FEMA)
For our model, floodways were considered unusable land, while floodplains (both 100‐
year and 500‐year) were considered usable since development in floodplains is
permitted. Floodway data was acquired from the North Carolina Floodplain Mapping
Program.
Certain Iredell County parcels were designated as unusable based on county land use
codes. These parcels include recreational areas, conservation easements, various
county‐owned and state‐owned properties, and others.
Shape files containing data on wetlands, floodways, and other protected areas were
downloaded and combined into a new shape file containing all unusable land using the
intersect function in ArcGIS. This new shape file was then combined with all features
from the parcel layer (with residential, commercial, basic, and vacant/developable
land) and the streets layer using the union function.
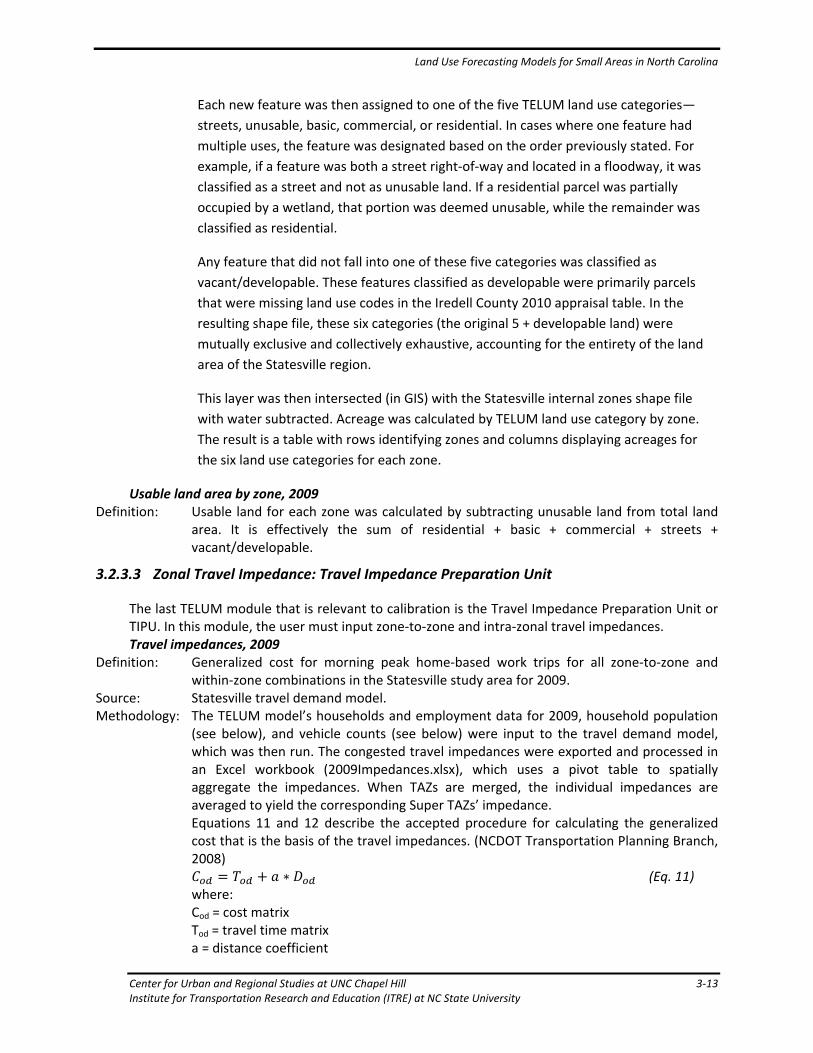
Land Use Forecasting Models for Small Areas in North Carolina
Center for Urban and Regional Studies at UNC Chapel Hill 3‐13 Institute for Transportation Research and Education (ITRE) at NC State University
Each new feature was then assigned to one of the five TELUM land use categories—
streets, unusable, basic, commercial, or residential. In cases where one feature had
multiple uses, the feature was designated based on the order previously stated. For
example, if a feature was both a street right‐of‐way and located in a floodway, it was
classified as a street and not as unusable land. If a residential parcel was partially
occupied by a wetland, that portion was deemed unusable, while the remainder was
classified as residential.
Any feature that did not fall into one of these five categories was classified as
vacant/developable. These features classified as developable were primarily parcels
that were missing land use codes in the Iredell County 2010 appraisal table. In the
resulting shape file, these six categories (the original 5 + developable land) were
mutually exclusive and collectively exhaustive, accounting for the entirety of the land
area of the Statesville region.
This layer was then intersected (in GIS) with the Statesville internal zones shape file
with water subtracted. Acreage was calculated by TELUM land use category by zone.
The result is a table with rows identifying zones and columns displaying acreages for
the six land use categories for each zone.
Usable land area by zone, 2009 Definition: Usable land for each zone was calculated by subtracting unusable land from total land
area. It is effectively the sum of residential + basic + commercial + streets + vacant/developable.
3.2.3.3 Zonal Travel Impedance: Travel Impedance Preparation Unit
The last TELUM module that is relevant to calibration is the Travel Impedance Preparation Unit or TIPU. In this module, the user must input zone‐to‐zone and intra‐zonal travel impedances. Travel impedances, 2009
Definition: Generalized cost for morning peak home‐based work trips for all zone‐to‐zone and within‐zone combinations in the Statesville study area for 2009.
Source: Statesville travel demand model. Methodology: The TELUM model’s households and employment data for 2009, household population
(see below), and vehicle counts (see below) were input to the travel demand model, which was then run. The congested travel impedances were exported and processed in an Excel workbook (2009Impedances.xlsx), which uses a pivot table to spatially aggregate the impedances. When TAZs are merged, the individual impedances are averaged to yield the corresponding Super TAZs’ impedance. Equations 11 and 12 describe the accepted procedure for calculating the generalized cost that is the basis of the travel impedances. (NCDOT Transportation Planning Branch, 2008)
∗ (Eq. 11) where: Cod = cost matrix Tod = travel time matrix a = distance coefficient
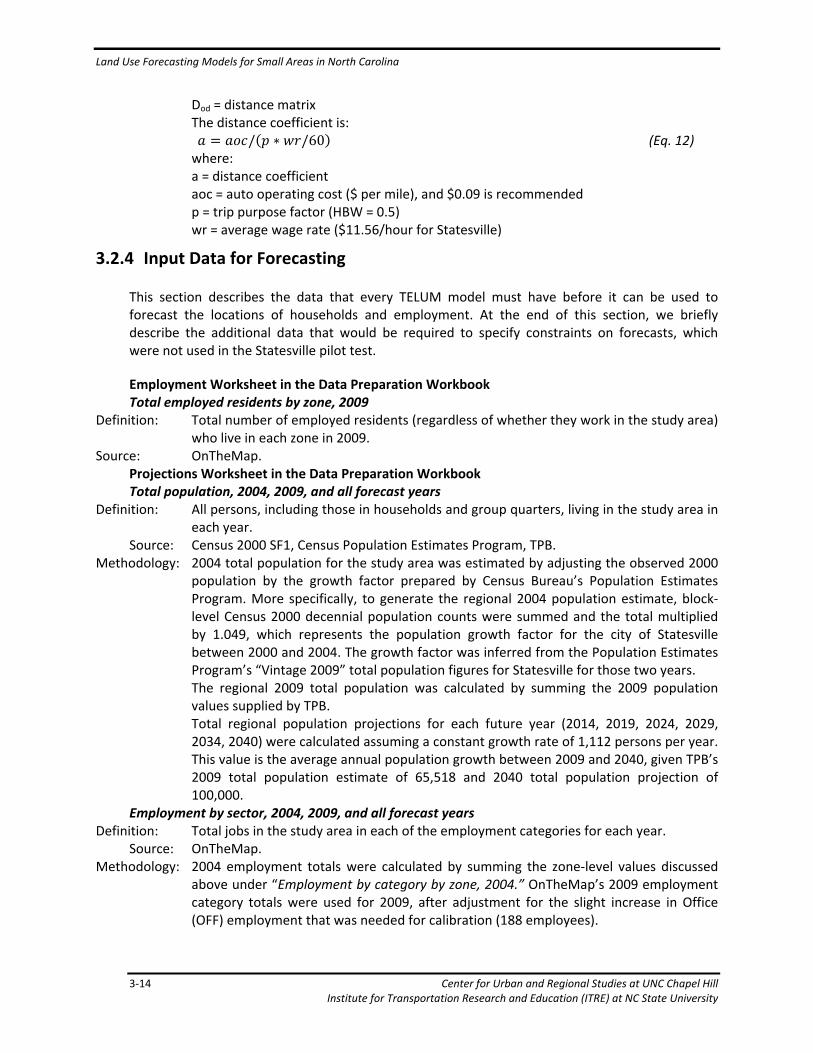
Land Use Forecasting Models for Small Areas in North Carolina
3‐14 Center for Urban and Regional Studies at UNC Chapel Hill Institute for Transportation Research and Education (ITRE) at NC State University
Dod = distance matrix The distance coefficient is:
/ ∗ /60 (Eq. 12) where: a = distance coefficient aoc = auto operating cost ($ per mile), and $0.09 is recommended p = trip purpose factor (HBW = 0.5) wr = average wage rate ($11.56/hour for Statesville)
3.2.4 Input Data for Forecasting
This section describes the data that every TELUM model must have before it can be used to forecast the locations of households and employment. At the end of this section, we briefly describe the additional data that would be required to specify constraints on forecasts, which were not used in the Statesville pilot test.
Employment Worksheet in the Data Preparation Workbook Total employed residents by zone, 2009
Definition: Total number of employed residents (regardless of whether they work in the study area) who live in each zone in 2009.
Source: OnTheMap. Projections Worksheet in the Data Preparation Workbook Total population, 2004, 2009, and all forecast years
Definition: All persons, including those in households and group quarters, living in the study area in each year.
Source: Census 2000 SF1, Census Population Estimates Program, TPB. Methodology: 2004 total population for the study area was estimated by adjusting the observed 2000
population by the growth factor prepared by Census Bureau’s Population Estimates Program. More specifically, to generate the regional 2004 population estimate, block‐level Census 2000 decennial population counts were summed and the total multiplied by 1.049, which represents the population growth factor for the city of Statesville between 2000 and 2004. The growth factor was inferred from the Population Estimates Program’s “Vintage 2009” total population figures for Statesville for those two years.
The regional 2009 total population was calculated by summing the 2009 population values supplied by TPB.
Total regional population projections for each future year (2014, 2019, 2024, 2029, 2034, 2040) were calculated assuming a constant growth rate of 1,112 persons per year. This value is the average annual population growth between 2009 and 2040, given TPB’s 2009 total population estimate of 65,518 and 2040 total population projection of 100,000.
Employment by sector, 2004, 2009, and all forecast years Definition: Total jobs in the study area in each of the employment categories for each year.
Source: OnTheMap. Methodology: 2004 employment totals were calculated by summing the zone‐level values discussed
above under “Employment by category by zone, 2004.” OnTheMap’s 2009 employment category totals were used for 2009, after adjustment for the slight increase in Office (OFF) employment that was needed for calibration (188 employees).
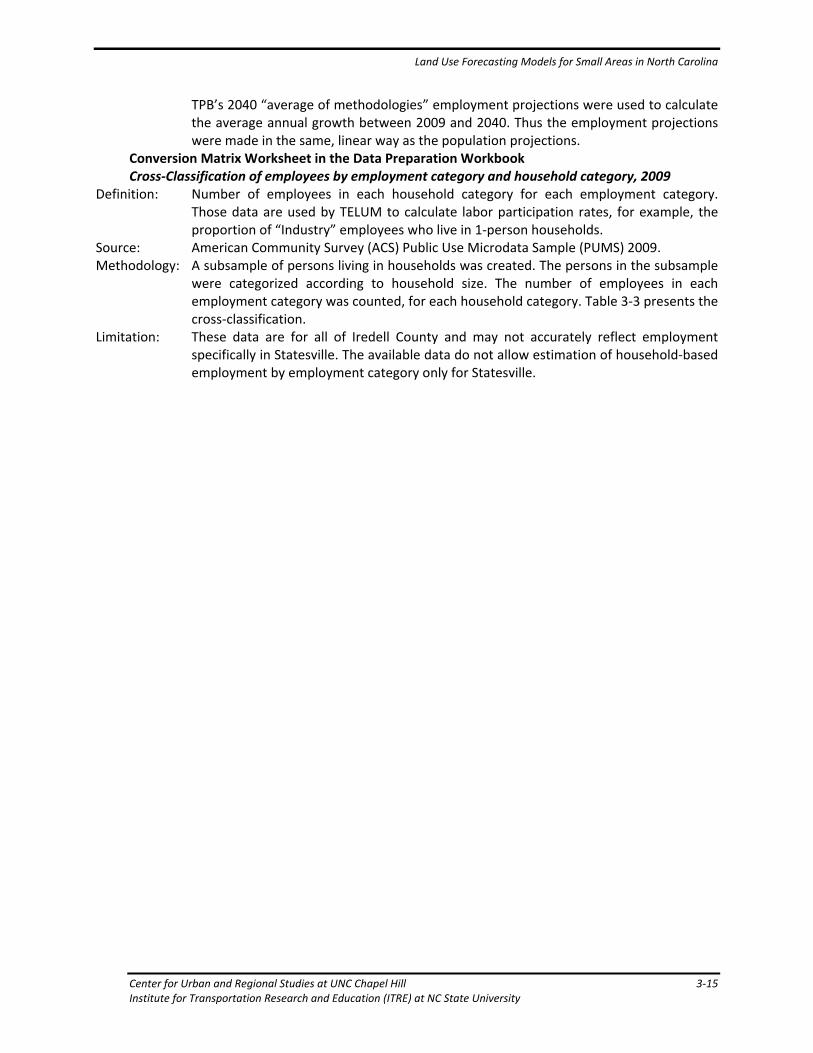
Land Use Forecasting Models for Small Areas in North Carolina
Center for Urban and Regional Studies at UNC Chapel Hill 3‐15 Institute for Transportation Research and Education (ITRE) at NC State University
TPB’s 2040 “average of methodologies” employment projections were used to calculate the average annual growth between 2009 and 2040. Thus the employment projections were made in the same, linear way as the population projections.
Conversion Matrix Worksheet in the Data Preparation Workbook Cross‐Classification of employees by employment category and household category, 2009
Definition: Number of employees in each household category for each employment category. Those data are used by TELUM to calculate labor participation rates, for example, the proportion of “Industry” employees who live in 1‐person households.
Source: American Community Survey (ACS) Public Use Microdata Sample (PUMS) 2009. Methodology: A subsample of persons living in households was created. The persons in the subsample
were categorized according to household size. The number of employees in each employment category was counted, for each household category. Table 3‐3 presents the cross‐classification.
Limitation: These data are for all of Iredell County and may not accurately reflect employment specifically in Statesville. The available data do not allow estimation of household‐based employment by employment category only for Statesville.
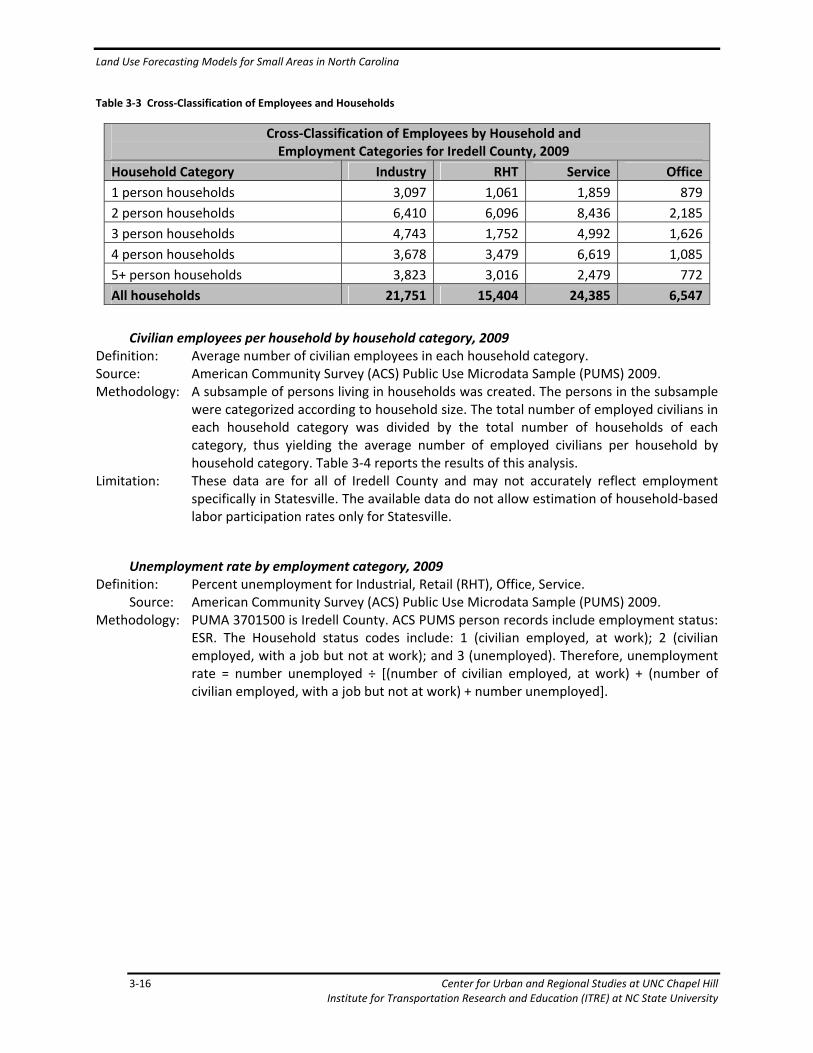
Land Use Forecasting Models for Small Areas in North Carolina
3‐16 Center for Urban and Regional Studies at UNC Chapel Hill Institute for Transportation Research and Education (ITRE) at NC State University
Table 3‐3 Cross‐Classification of Employees and Households
Cross‐Classification of Employees by Household and Employment Categories for Iredell County, 2009
Household Category Industry RHT Service Office
1 person households 3,097 1,061 1,859 879
2 person households 6,410 6,096 8,436 2,185
3 person households 4,743 1,752 4,992 1,626
4 person households 3,678 3,479 6,619 1,085
5+ person households 3,823 3,016 2,479 772
All households 21,751 15,404 24,385 6,547
Civilian employees per household by household category, 2009 Definition: Average number of civilian employees in each household category. Source: American Community Survey (ACS) Public Use Microdata Sample (PUMS) 2009. Methodology: A subsample of persons living in households was created. The persons in the subsample
were categorized according to household size. The total number of employed civilians in each household category was divided by the total number of households of each category, thus yielding the average number of employed civilians per household by household category. Table 3‐4 reports the results of this analysis.
Limitation: These data are for all of Iredell County and may not accurately reflect employment specifically in Statesville. The available data do not allow estimation of household‐based labor participation rates only for Statesville.
Unemployment rate by employment category, 2009 Definition: Percent unemployment for Industrial, Retail (RHT), Office, Service.
Source: American Community Survey (ACS) Public Use Microdata Sample (PUMS) 2009. Methodology: PUMA 3701500 is Iredell County. ACS PUMS person records include employment status:
ESR. The Household status codes include: 1 (civilian employed, at work); 2 (civilian employed, with a job but not at work); and 3 (unemployed). Therefore, unemployment rate = number unemployed ÷ [(number of civilian employed, at work) + (number of civilian employed, with a job but not at work) + number unemployed].
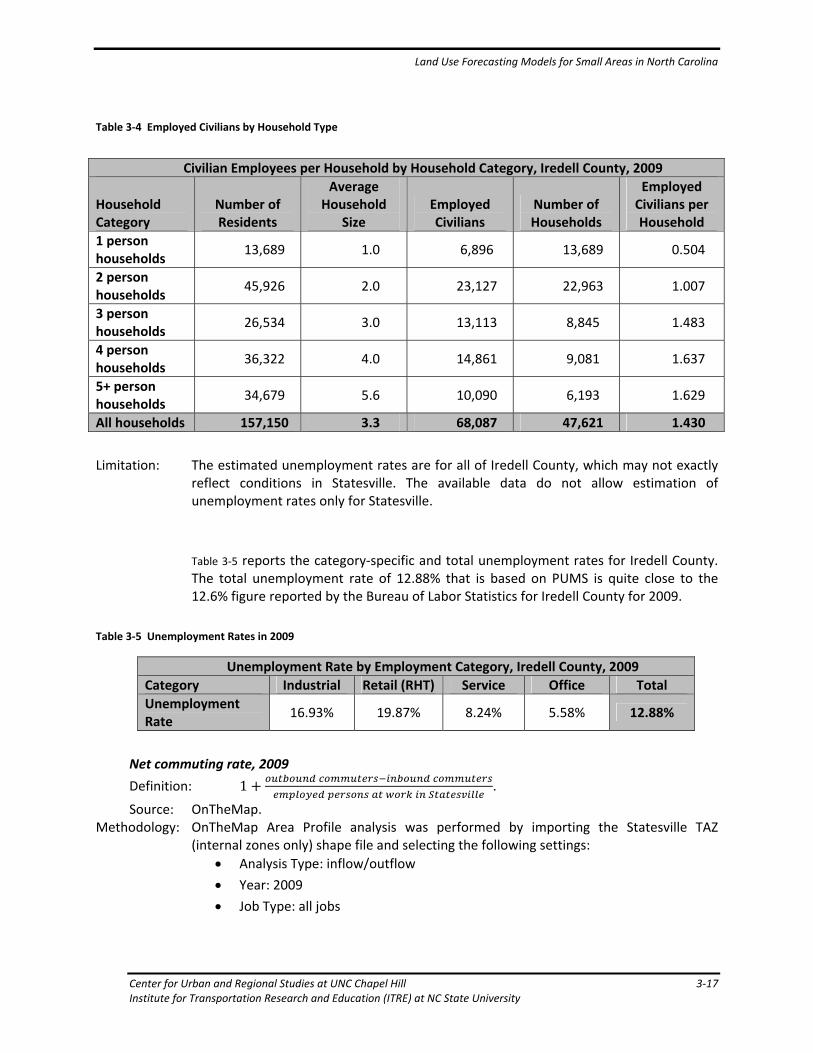
Land Use Forecasting Models for Small Areas in North Carolina
Center for Urban and Regional Studies at UNC Chapel Hill 3‐17 Institute for Transportation Research and Education (ITRE) at NC State University
Table 3‐4 Employed Civilians by Household Type
Limitation: The estimated unemployment rates are for all of Iredell County, which may not exactly reflect conditions in Statesville. The available data do not allow estimation of unemployment rates only for Statesville.
Table 3‐5 reports the category‐specific and total unemployment rates for Iredell County. The total unemployment rate of 12.88% that is based on PUMS is quite close to the 12.6% figure reported by the Bureau of Labor Statistics for Iredell County for 2009.
Table 3‐5 Unemployment Rates in 2009
Unemployment Rate by Employment Category, Iredell County, 2009
Category Industrial Retail (RHT) Service Office Total
Unemployment Rate
16.93% 19.87% 8.24% 5.58% 12.88%
Net commuting rate, 2009
Definition: 1
.
Source: OnTheMap. Methodology: OnTheMap Area Profile analysis was performed by importing the Statesville TAZ
(internal zones only) shape file and selecting the following settings:
Analysis Type: inflow/outflow
Year: 2009
Job Type: all jobs
Civilian Employees per Household by Household Category, Iredell County, 2009
Household Category
Number of Residents
Average Household
Size Employed Civilians
Number of Households
Employed Civilians per Household
1 person households
13,689 1.0 6,896 13,689 0.504
2 person households
45,926 2.0 23,127 22,963 1.007
3 person households
26,534 3.0 13,113 8,845 1.483
4 person households
36,322 4.0 14,861 9,081 1.637
5+ person households
34,679 5.6 10,090 6,193 1.629
All households 157,150 3.3 68,087 47,621 1.430

Land Use Forecasting Models for Small Areas in North Carolina
3‐18 Center for Urban and Regional Studies at UNC Chapel Hill Institute for Transportation Research and Education (ITRE) at NC State University
Outbound commuters are persons who live in the selection area but are employed outside (16,745). Inbound commuters are persons who are employed in the selection area but are living outside (19,013). Employed persons at work in Statesville are persons who are employed in the selection area (29,168).
Net commuting rate 1 0.92. Travel Impedance Preparation Unit Future impedances Forecast‐year travel impedances may be provided to the TELUM model for each year in the planning horizon. We did so for 2014. The 2014 impedances were generated by the travel demand model, which had been provided with TELUM‐based forecasts of that year’s households, employment, household population, and vehicle ownership.
Model Forecasting Calculation Unit Employment Constraints and Household Constraints The TELUM software allows future employment and households to be constrained according to specifications provided by the user. The constraints would be specified by year, sector, and zone. Four general types of constraint may be imposed. Using the example of one‐person households, a target number of one‐person households may be set for a particular zone and a particular year (“Type 1” constraint); the maximum number of one‐person households may be similarly set (“Type 3”); and the minimum number of one‐person households may be specified (“Type 4”). The total number of households (and total employment) may be set by zone and by year (“Type 2” constraint). To apply constraints, one would need to first run the “baseline” forecast and subsequently create a “policy” forecast that has one or more constraints.
Among other purposes, constraints may be used to force activity into a zone in which activity is not present in a model’s current year. The model’s basic structure (location equations) ensures that a zone with no households in the current year will not have any households in the future and that a zone with no employment in the current year will not have any employment in the future.
5 A
constraint would need to be applied to ensure that development occurs in the zone of interest, and only one is necessary, in the year when the transition from no development to development occurs; in effect, that constraint triggers sustained development.
3.2.5 Post‐Processing TELUM’s Output, Household Population, and Vehicle Counts
The TELUM model’s households and employment data for 2009 were reformatted to match the travel demand model’s input requirements. The aggregation of TAZs to create Super TAZs was reversed, as was the aggregation of employment categories. Outside of the TELUM model, the
5 More precisely, the model will locate a minimal level of activity (for example, one employee) in a zone that has no activity in the current year. Additional activity will not be located without specification of a constraint such as a minimum constraint (Type 4).

Land Use Forecasting Models for Small Areas in North Carolina
Center for Urban and Regional Studies at UNC Chapel Hill 3‐19 Institute for Transportation Research and Education (ITRE) at NC State University
household population and vehicle ownership (or availability) to household residents were estimated. An Excel workbook was created to post‐process the TELUM model’s outputs and provide a single worksheet in which all of the travel demand model’s socioeconomic inputs and vehicle counts may found.
The travel demand model requires for each TAZ an estimate of the number of privately‐owned vehicles that are available to households. The number of available vehicles is estimated using a process that begins with data on vehicle availability that were obtained from the 2009 ACS for the Public Use Microdata Area that corresponds to Iredell County. Those data were summarized in a cross tabulation of number of available vehicles and household size. The cross tabulation provides the proportion of households having each combination of those attributes, for example, the proportion of one‐person households which reported one available vehicle. For each TAZ, the TELUM model (DRAM output) predicts the number of one‐person households, the number of two‐person households, etc. Each such prediction is then multiplied by the corresponding household‐size/available‐vehicles proportion, yielding zone‐specific predictions of the number of one‐person households having zero available vehicles, the number of one‐person households having one available vehicle, and so on for each combination of household size and number of available vehicles. Finally, the total number of available vehicles in each TAZ is inferred directly from the previous calculation. Essentially, the total number of available vehicles equals this sum: number of households with one available vehicle times one (vehicle); number of households with two available vehicles times two (vehicles); number of households with three or more available vehicles times the average number of vehicles available to the households that have three or more available vehicles. The predictions assume that households’ vehicle availability rates do not change over time.


Land Use Forecasting Models for Small Areas in North Carolina
Center for Urban and Regional Studies at UNC Chapel Hill 4‐1 Institute for Transportation Research and Education (ITRE) at NC State University
4 Findings and Conclusions
This report section describes the results obtained in the course of conducting the pilot study. It also shows comparisons to projections that were prepared by local planning agencies provided by TPB. Some observations and conclusions are drawn from the findings.
4.1 Projections Using the Final Statesville TELUM Model
The locations of employment and households were projected for 2014, 2019, 2024, 2029, 2034, and 2040.
6 To begin the projection process, the Statesville travel demand model was run with the
2009 socioeconomic inputs provided by the TELUM model and the corresponding vehicle ownership figures, and the resulting “congested” travel impedances were provided to the TELUM model. Thus the 2009 TELUM model has socioeconomic inputs and travel impedances that are consistent. Next, the socioeconomic projections were made for 2014, using the 2009 congested travel impedances. The Statesville travel demand model was again run, with the 2014 socioeconomic (and vehicle ownership) projections. The congested 2014 travel impedances were provided to the TELUM model, and it was run to generate the 2019 socioeconomic projections. The feedback loop involving the TELUM model and the travel demand model was repeated for each forecast year (see Table 4‐1). Thus, the projections represent the land‐use and transport consequences of the “no‐build” scenario, with feedback between the land‐use and travel demand models.
Table 4‐1 Simulations Conducted with the Statesville TELUM Model
Forecast yr. 2014 2019 2024 2029 2034 2040 2040†
Impedances 2009 2014 2019 2025 2029 2034 2040
†Results for the 2040 forecasts using the 2040 impedances are illustrated in Figure 4‐2 and Figure 4‐5. The 2040 projections that were made with the TELUM model provide the basis for a comparison with TPB’s projections, which were prepared only for 2040. The 2040 projections made with the TELUM model come in two versions, and the version that is used for the comparison has the 2040 impedances.
7 For simplicity, the comparison involves two broad socioeconomic sectors: total
employment and total households. TPB’s projections are contained in the “Statesville_CTP_Employment_Data” shape file. The purpose of comparison is to gain broad
6 Appendix C reports the results of the calibration process. In the TELUM software’s user interface, the last forecast year is labeled as “2039,” but the regional control totals for population and employment correspond to the year 2040.
7 Use of the 2034‐vintage impedances lead to trivial differences in the spatial allocation of activity: the maximum zone‐to‐zone difference is two households or employees.

Land Use Forecasting Models for Small Areas in North Carolina
4‐2 Center for Urban and Regional Studies at UNC Chapel Hill Institute for Transportation Research and Education (ITRE) at NC State University
insights into how the projected changes in total employment and total households, by TAZ, vary with the projection methodology.
Figure 4‐1 and Figure 4‐2 illustrate TPB’s employment projections and the TELUM‐based
projections, respectively. Figure 4‐3 illustrates the relative differences in employment: .
The projections differ by more than 10% in absolute value in very nearly all zones. The projection methodology has a substantial influence on the regional pattern of future employment.
Figure 4‐4, Figure 4‐5, and Figure 4‐6 present similar summaries of the models’ projections of household locations. Again, differences in methodology matter: the projections differ by more than 10% in absolute value in very nearly all zones.
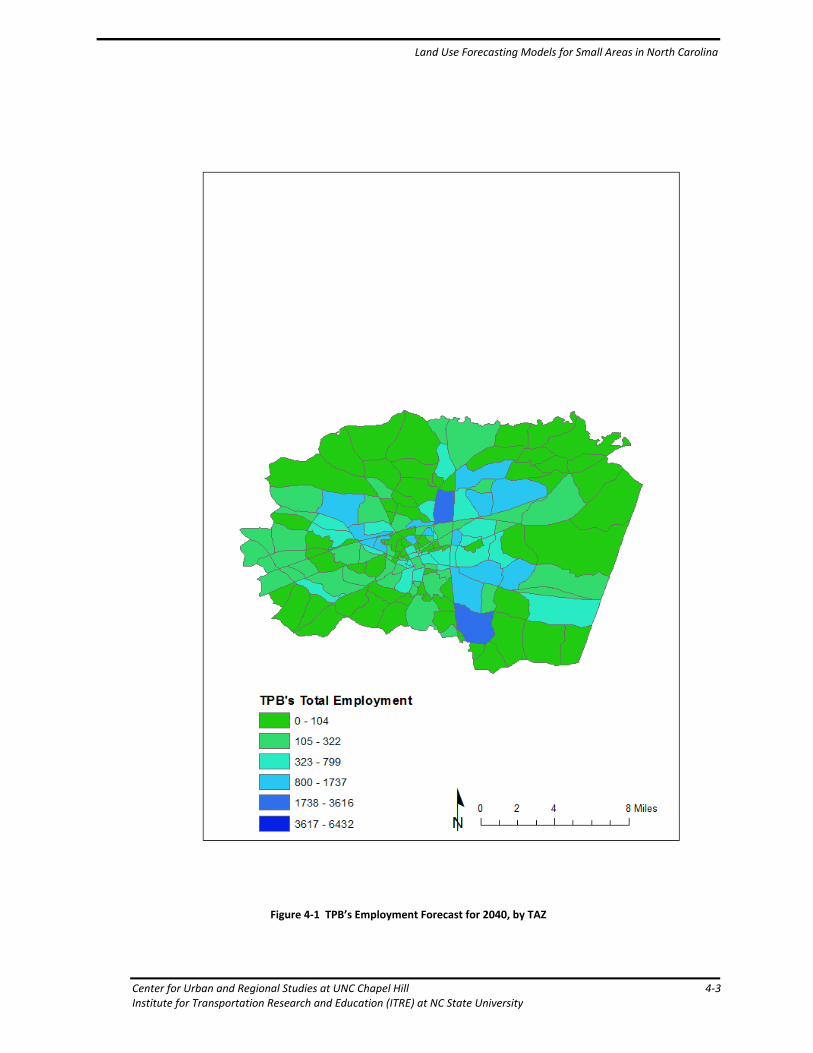
Land Use Forecasting Models for Small Areas in North Carolina
Center for Urban and Regional Studies at UNC Chapel Hill 4‐3 Institute for Transportation Research and Education (ITRE) at NC State University
Figure 4‐1 TPB’s Employment Forecast for 2040, by TAZ
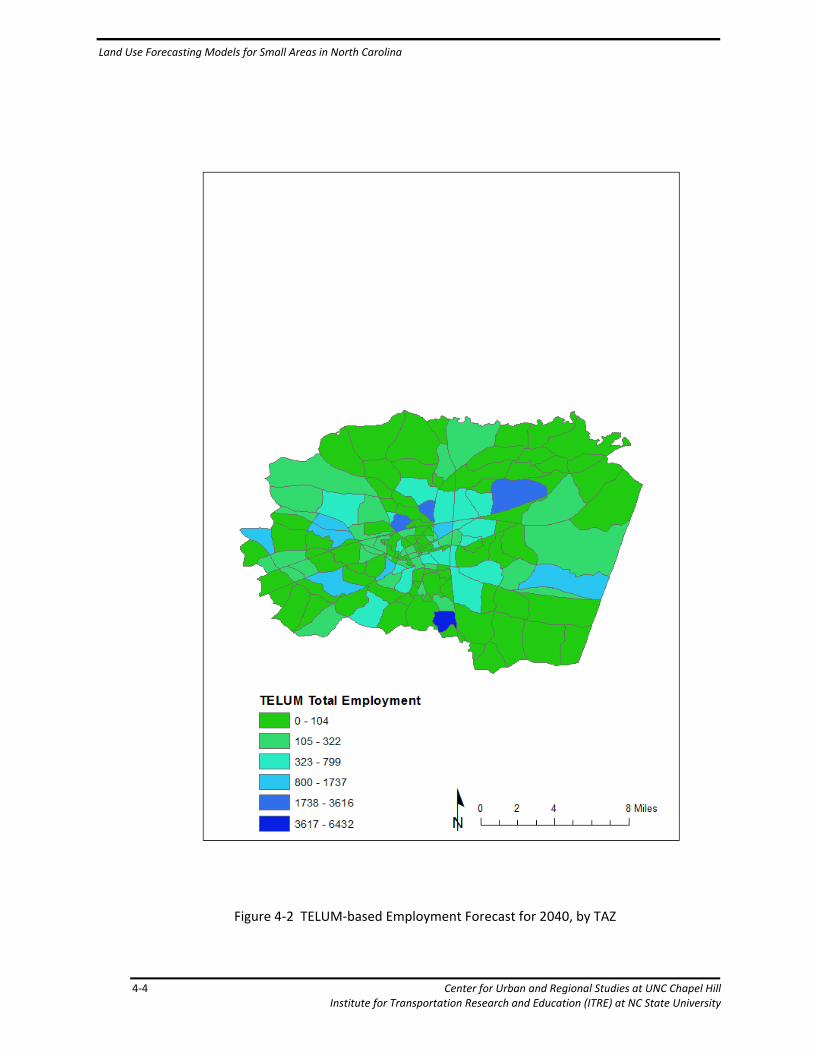
Land Use Forecasting Models for Small Areas in North Carolina
4‐4 Center for Urban and Regional Studies at UNC Chapel Hill Institute for Transportation Research and Education (ITRE) at NC State University
Figure 4‐2 TELUM‐based Employment Forecast for 2040, by TAZ

Land Use Forecasting Models for Small Areas in North Carolina
Center for Urban and Regional Studies at UNC Chapel Hill 4‐5 Institute for Transportation Research and Education (ITRE) at NC State University
Figure 4‐3 Comparison of Employment Forecasts for 2040, by TAZ
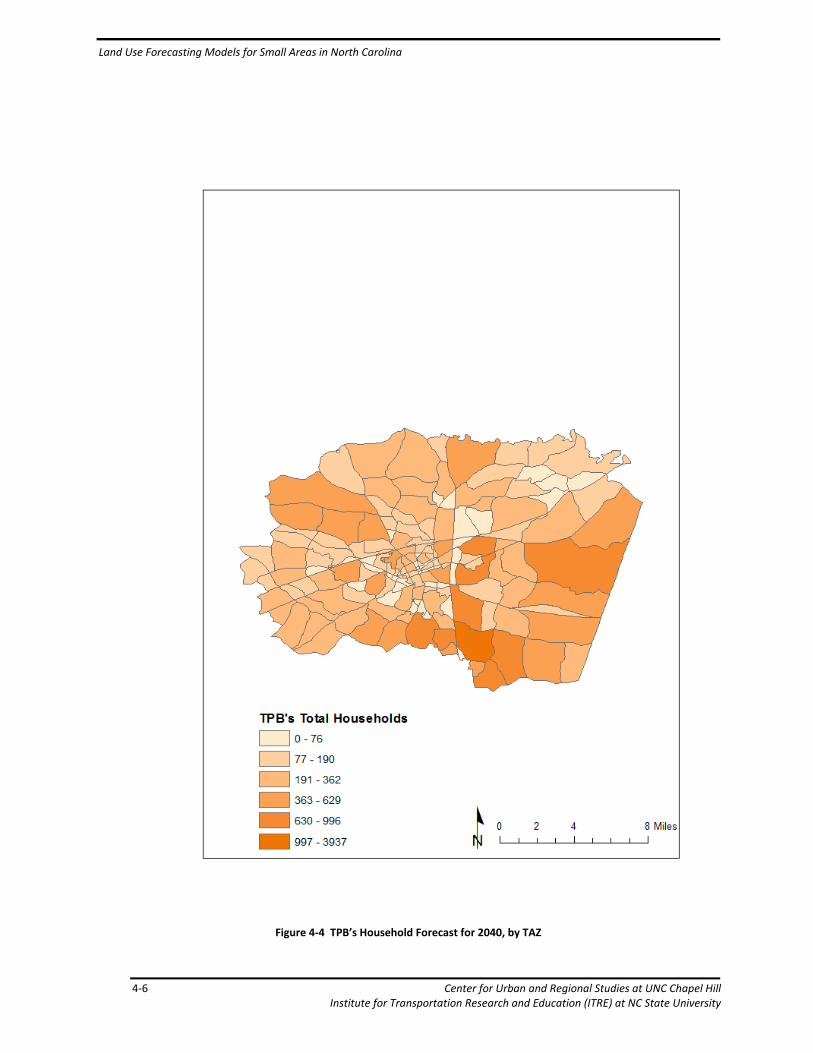
Land Use Forecasting Models for Small Areas in North Carolina
4‐6 Center for Urban and Regional Studies at UNC Chapel Hill Institute for Transportation Research and Education (ITRE) at NC State University
Figure 4‐4 TPB’s Household Forecast for 2040, by TAZ

Land Use Forecasting Models for Small Areas in North Carolina
Center for Urban and Regional Studies at UNC Chapel Hill 4‐7 Institute for Transportation Research and Education (ITRE) at NC State University
Figure 4‐5 TELUM‐based Household Forecast for 2040, by TAZ
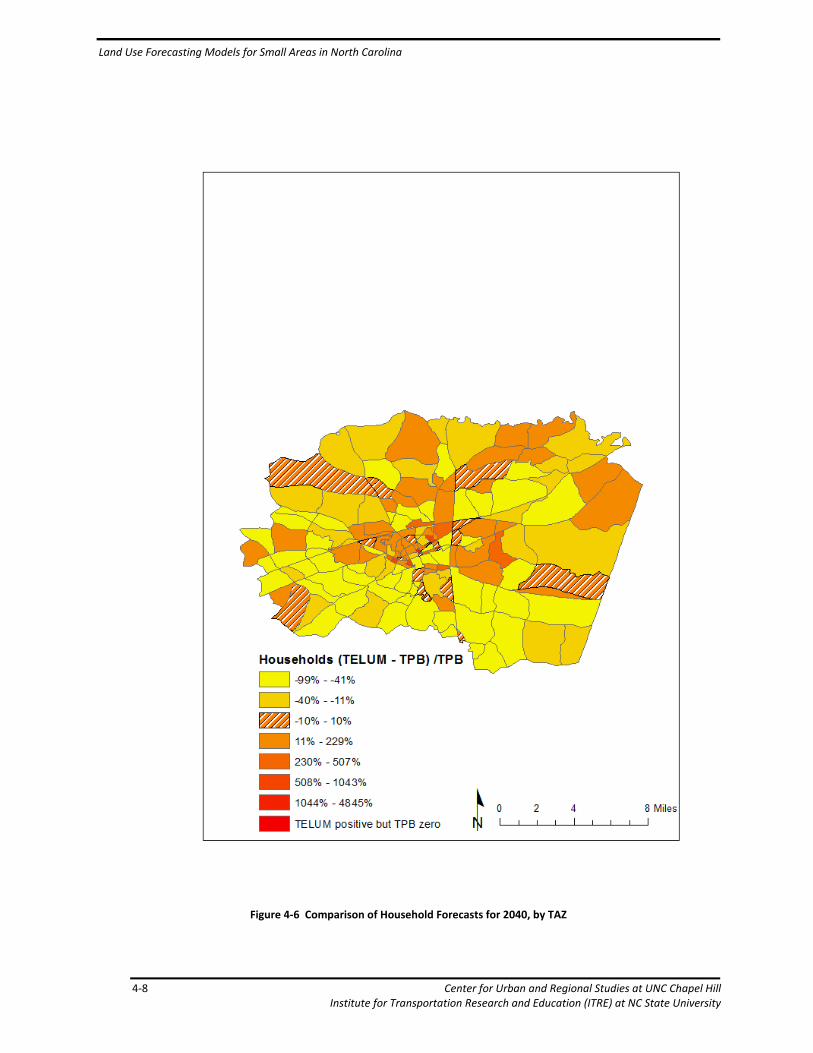
Land Use Forecasting Models for Small Areas in North Carolina
4‐8 Center for Urban and Regional Studies at UNC Chapel Hill Institute for Transportation Research and Education (ITRE) at NC State University
Figure 4‐6 Comparison of Household Forecasts for 2040, by TAZ

Land Use Forecasting Models for Small Areas in North Carolina
Center for Urban and Regional Studies at UNC Chapel Hill 6‐9 Institute for Transportation Research and Education (ITRE) at NC State University
5 Recommendations
TELUM is a mature, flexible, and capable model platform with modest demands for the data that are needed for calibration and forecasting. The software is easy to use, and it is well documented. Staff with the New Jersey Institute of Technology provides excellent technical support. The calibration and forecasting modules run quickly; in less than five minutes for the Statesville model. TELUM‐based models make projections in five‐year increments; that feature alone gives TELUM‐based projections an advantage over the conventionally‐made projections, which typically are made for only one year, the end of the planning horizon. The research team has developed auxiliary spreadsheet‐based tools for linking the Statesville TELUM model and Statesville travel demand model. In conclusion, the success of the Statesville pilot test definitely demonstrates that the TELUM modeling platform provides another approach—either an alternative approach or a complementary approach—to developing the socioeconomic inputs needed for North Carolina’s small‐area travel demand models.
6 Implementation and Technology Transfer Plan
This report section recommends how the research findings can be incorporated in transportation demand forecasting procedures used by NCDOT Transportation Planning Branch. The recommendations describe how the land use model might be implemented in conjunction with travel forecasting procedures, but do not prescribe a specific approach.
6.1 Recommendations for Implementation
Using TELUM as the analytic engine for projecting future land uses, the research team built and demonstrated a modeling system that projects all of the socioeconomic and vehicle‐count inputs that are needed to drive a small area’s four‐step travel demand model for multiple future years.
All of the data that are required for the land‐use model and for projecting vehicle counts are in the public domain and provided by standard sources: parcel inventories; floodplain inventories; protected area inventories; the Local Employment and Household Dynamics program; decennial census; and American Community Survey. Those databases can be easily found, quickly downloaded and summarized with such standard tools as American Fact Finder, DataFerrett, OnTheMap, ArcGIS, and Excel. All of the procedures for developing the land‐use model’s inputs have been developed and documented in detail. Excel workbooks were developed to facilitate transfer of inputs and outputs to and from TELUM and the Statesville travel demand model.
In view of those data sources and the tools that the research team built, the technical skills that are desirable for developing the inputs that additional TELUM‐based forecasting models would require are intermediate‐level GIS skills and Excel skills (especially pivot tables and lookup functions, which are used extensively). Those skills should be a prerequisite for anyone who is expected to be the primary resource for developing the calibration and forecasting databases. Basic familiarity with the decennial census and American Community Survey is also very desirable and should also be considered as a prerequisite. The online tools for accessing census and Local Employment Dynamics databases—American Fact Finder, DataFerrett, and OnTheMap—can be learned in less than a week. Acquisition of facility with those tools could be considered suitable for

Land Use Forecasting Models for Small Areas in North Carolina
6‐10 Center for Urban and Regional Studies at UNC Chapel Hill Institute for Transportation Research and Education (ITRE) at NC State University
on‐the‐job training. A quantitatively‐oriented second‐year Masters student in city and regional planning would be a good choice for database builder.
A two‐person team is recommended: the primary database developer and a reviewer. The reviewer can provide a sounding board for ideas about how to develop the calibration and forecasting databases, which is not a cookie‐cutter process. More important, the draft databases need to be scrutinized for errors and inconsistencies, and they are most likely to be found by someone who can take a fresh look at the databases.
Several important data and methodological issues are likely to arise during the course of implementation and are best resolved in consultation with a study area’s local government staff. First, the calibration database for a TELUM model must include historical data, i.e., lag year data, but historical data seem to be atypical in the transportation planning context; for example, the socioeconomic data prepared recently for the Statesville travel demand model are 2009 or “current year” data.
Second, the calibration database must contain estimates of vacant, developable land in each zone. It is likely that our analysis of Iredell County’s parcel data underestimated the quantity of vacant, developable land. The primary reason is the lack of data on building footprints, without which the amount of land in partially‐developed parcels that could support additional development is unavoidably excluded from the estimate of developable land.
Third, zone size is likely to be an issue. In this pilot test, more than one zone appeared to be too small: the presence of multiple zones with no employment in the current year prevented calibration of all parameters.
Fourth and finally, the spatial extent of the land‐use model should not be considered to be a settled matter because the spatial extent of the study area travel demand model may not be optimal—probably too small—for the land‐use model. A fundamental premise of TELUM’s residential location model is that households’ choice of where to live is sensitive to the accessibility provided by the transportation network but only the accessibility to destinations in the study area is influential (see equation (4) above). The premise is likely to be violated when a large proportion of study area residents work outside the study area: accessibility to “external” destinations is also likely to be influential. In Statesville, the share of employed residents who commute to workplaces that are outside the area is more than 66%. In that circumstance, the calibration of the residential location model is likely to be better with a larger modeling domain.
Implementing a TELUM model within existing travel demand forecasting practices at NCDOT TPB is possible without need for creating additional specialized tools or model interfaces. Following the pilot study example requires straightforward adaptation of the Statesville spreadsheets that translate inputs between the platforms. This approach is both flexible and capable. It should be noted that a TELUM forecast is not necessarily “better” than locally produced forecasts of population and employment. Users in other regions indicate that a primary benefit of the TELUM forecast is to reveal relationships between development and accessibility that would not otherwise be apparent. In the Statesville pilot study TELUM helped identify the important role of external development and employment. Understanding the influences on study area growth should help improve land use forecasts regardless of tool chosen for the job.
Land Use Forecasting Models for Small Areas in North Carolina
Center for Urban and Regional Studies at UNC Chapel Hill 7‐1 Institute for Transportation Research and Education (ITRE) at NC State University
7 Works Cited
Casper, C. T. (2009). Application of TELUM by the Pikes Peak, Colorado, Area Council of Governments. Transportation Research Record: Journal of the Transportation Research Board, no. 2119, 45‐53.
Duthie, J. K. (2007). Applications of integreated models of land use and transport: A comparison of ITLUP and UrbanSim land use models. Austin: http://www.ce.utexas.edu/prof/kickelman/public_html/RSAI07TELUMUrbanSim.pdf.
ESRI. (2009, May). ESRI Demographic Update Methodology: 2009/2014. Retrieved from http://www.esri.com/~/media/Files/PDFs/library/whitepapers/pdfs/demographic‐update‐methodology‐2009.pdf
FEMA. (n.d.). Retrieved from http://www.fema.gov/plan/prevent/floodplain/nfipkeywords/floodway.shtm
Hansen, B. E. (2010, May 27). Statesville Comprehensive Transportation Plan Socio‐Economic Data Methodology.
Lupton, J. (2012). TELUM and Metroplan: Land use modeling as a learning experience. 13th National Conference on Transportation Planning in Small and Medium‐Sized Communities. Big Sky, MT.
Miller, M. A. (2008). Planning for Enrollment Growth: Using Land Use Data to Determine Future School Sites. Transportation Research Record: Journal of the Transportation Research Board, no. 2074, 12‐20.
NCDOT Transportation Planning Branch. (2008). Small Area Travel Demand Model Procedures Manual. Raleigh: NCDOT.
New Jersey Institute of Technology. (2005). Users manual; TELUM (Transportation Economic and Land Use Model): Version 5.0. Retrieved from http://www.telus‐national.org/products/TELUMUserManual.pdf
Spasovic, L. N. (2008). Transportation Economic and Land Use System (TELUS). Florida DOT Conference (p. 22). Tallahassee, FL: http://www.telus‐national.org/documentation/2008‐04‐02_TELUS_FL_Presentation.ppt.
Spasovic, L. N. (n.d.). TELUM: Interactive software for integrated land use and transportation modeling. Retrieved 2012, from New Jersey Institute of Technology, Newark, NJ: http://www.telus‐national.org/products/TELUM_Overview.pps
Valsaraj, V. K. (2007). Forecasting employment and population in Texas: An investigation on TELUM requirements, assumptions, and results, including a study of zone size effects, for the Austin and Waco regions. Austin: http://www.ce.utexas.edu/prof/kockelman/G‐LUM_Website/InvestigationOfTELUM.pdf.
Zhou, B. (. (2009). Applications of integrated transport and gravity‐based land use models for policy analysis. Transportation Research Record: Journal of the Transportation Research Board, no. 2133, 123‐132.

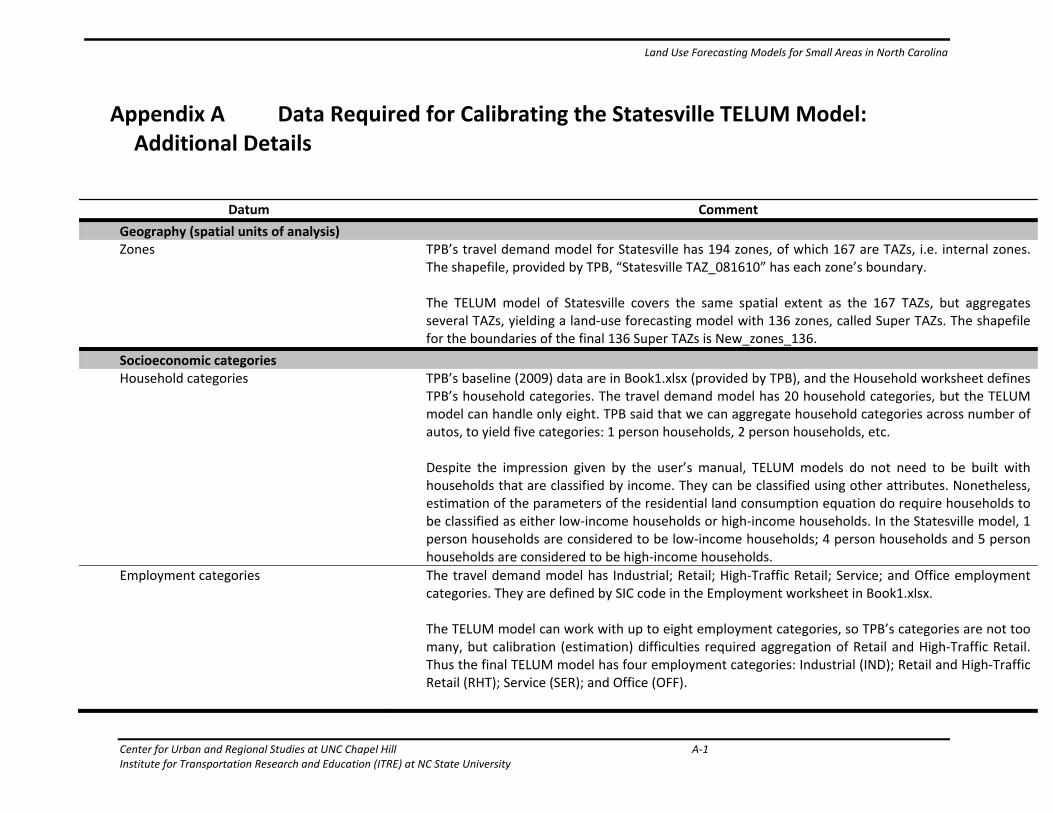
Land Use Forecasting Models for Small Areas in North Carolina
Center for Urban and Regional Studies at UNC Chapel Hill A‐1 Institute for Transportation Research and Education (ITRE) at NC State University
Appendix A Data Required for Calibrating the Statesville TELUM Model: Additional Details
Datum Comment
Geography (spatial units of analysis) Zones TPB’s travel demand model for Statesville has 194 zones, of which 167 are TAZs, i.e. internal zones.
The shapefile, provided by TPB, “Statesville TAZ_081610” has each zone’s boundary. The TELUM model of Statesville covers the same spatial extent as the 167 TAZs, but aggregates several TAZs, yielding a land‐use forecasting model with 136 zones, called Super TAZs. The shapefile for the boundaries of the final 136 Super TAZs is New_zones_136.
Socioeconomic categories Household categories TPB’s baseline (2009) data are in Book1.xlsx (provided by TPB), and the Household worksheet defines
TPB’s household categories. The travel demand model has 20 household categories, but the TELUM model can handle only eight. TPB said that we can aggregate household categories across number of autos, to yield five categories: 1 person households, 2 person households, etc. Despite the impression given by the user’s manual, TELUM models do not need to be built with households that are classified by income. They can be classified using other attributes. Nonetheless, estimation of the parameters of the residential land consumption equation do require households to be classified as either low‐income households or high‐income households. In the Statesville model, 1 person households are considered to be low‐income households; 4 person households and 5 person households are considered to be high‐income households.
Employment categories The travel demand model has Industrial; Retail; High‐Traffic Retail; Service; and Office employment categories. They are defined by SIC code in the Employment worksheet in Book1.xlsx. The TELUM model can work with up to eight employment categories, so TPB’s categories are not too many, but calibration (estimation) difficulties required aggregation of Retail and High‐Traffic Retail. Thus the final TELUM model has four employment categories: Industrial (IND); Retail and High‐Traffic Retail (RHT); Service (SER); and Office (OFF).
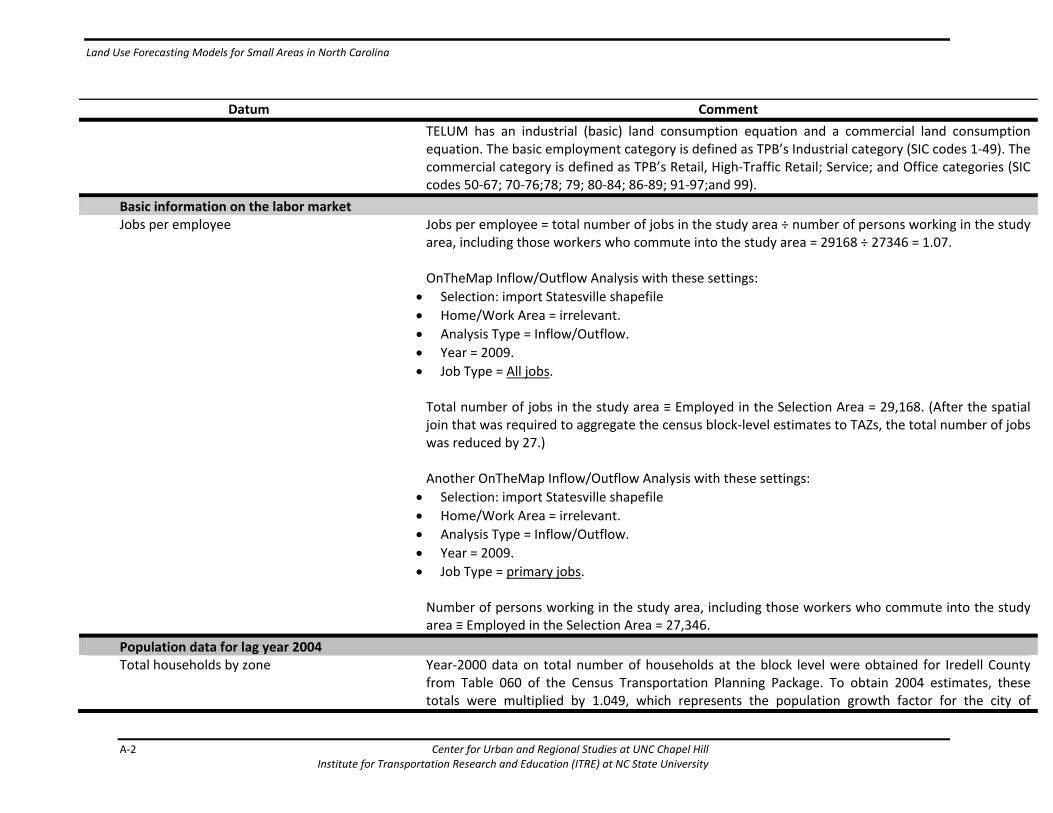
Land Use Forecasting Models for Small Areas in North Carolina
A‐2 Center for Urban and Regional Studies at UNC Chapel Hill Institute for Transportation Research and Education (ITRE) at NC State University
Datum Comment
TELUM has an industrial (basic) land consumption equation and a commercial land consumption equation. The basic employment category is defined as TPB’s Industrial category (SIC codes 1‐49). The commercial category is defined as TPB’s Retail, High‐Traffic Retail; Service; and Office categories (SIC codes 50‐67; 70‐76;78; 79; 80‐84; 86‐89; 91‐97;and 99).
Basic information on the labor market Jobs per employee Jobs per employee = total number of jobs in the study area ÷ number of persons working in the study
area, including those workers who commute into the study area = 29168 ÷ 27346 = 1.07. OnTheMap Inflow/Outflow Analysis with these settings:
Selection: import Statesville shapefile
Home/Work Area = irrelevant.
Analysis Type = Inflow/Outflow.
Year = 2009.
Job Type = All jobs. Total number of jobs in the study area ≡ Employed in the Selection Area = 29,168. (After the spatial join that was required to aggregate the census block‐level estimates to TAZs, the total number of jobs was reduced by 27.) Another OnTheMap Inflow/Outflow Analysis with these settings:
Selection: import Statesville shapefile
Home/Work Area = irrelevant.
Analysis Type = Inflow/Outflow.
Year = 2009.
Job Type = primary jobs. Number of persons working in the study area, including those workers who commute into the study area ≡ Employed in the Selection Area = 27,346.
Population data for lag year 2004 Total households by zone Year‐2000 data on total number of households at the block level were obtained for Iredell County
from Table 060 of the Census Transportation Planning Package. To obtain 2004 estimates, these totals were multiplied by 1.049, which represents the population growth factor for the city of

Land Use Forecasting Models for Small Areas in North Carolina
Center for Urban and Regional Studies at UNC Chapel Hill A‐3 Institute for Transportation Research and Education (ITRE) at NC State University
Datum Comment
Statesville between 2000 and 2004, calculated from the Population Estimates Program “Vintage 2009” total population figures for Statesville for those two years. Block‐level household totals were allocated to TAZs using the intersect tool in ArcGIS, under the assumption that households are evenly distributed within each block. Each TAZ was assigned a number of households from the blocks it overlapped proportional to the acreage of the overlapping area. The population growth factor and each zone’s total number of households are computed in “Compilation of Model Calibration Data.xlsx.” Spatial aggregation from 167 TAZs to 136 Super TAZs is done in 167_to_136_TAZs_9‐27‐2012.xlsx. Census Transportation Planning Package (CTPP 2000) http://www.transtats.bts.gov/Tables.asp?DB_ID=630&DB_Name=Census%20Transportation%20Planning%20Package%20%28CTPP%29%202000&DB_Short_Name=CTPP%202000 Population Estimates Program http://factfinder2.census.gov/faces/nav/jsf/pages/wc_pep.xhtml
Population data for current year 2009 Total employed residents by zone OnTheMap Area Profile Analysis with these settings:
Selection: import Statesville shapefile
Home/Work Area = home.
Analysis Type = area profile.
Labor Market Segment: all workers
Year = 2009.
Job Type = primary jobs. “A primary job is defined as the one job for each worker that provides the most earnings. By analyzing primary jobs, you are seeing ‘one job per worker,’ whereas analyzing ‘All Jobs’ you are seeing all the jobs held by the workers selected through your spatial query.” (http://lehd.ces.census.gov/led/datatools/onthemap.php?name=FAQs#6) Even when Job Type = primary jobs, LED estimates the number of employed persons living in group
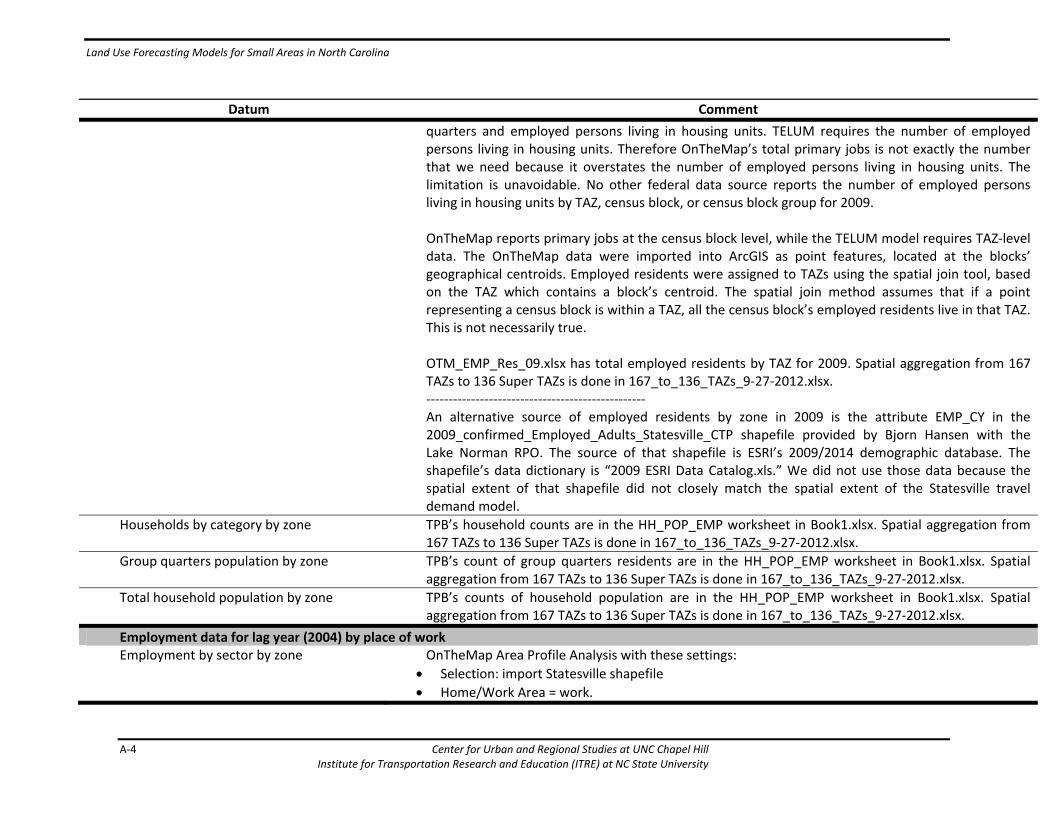
Land Use Forecasting Models for Small Areas in North Carolina
A‐4 Center for Urban and Regional Studies at UNC Chapel Hill Institute for Transportation Research and Education (ITRE) at NC State University
Datum Comment
quarters and employed persons living in housing units. TELUM requires the number of employed persons living in housing units. Therefore OnTheMap’s total primary jobs is not exactly the number that we need because it overstates the number of employed persons living in housing units. The limitation is unavoidable. No other federal data source reports the number of employed persons living in housing units by TAZ, census block, or census block group for 2009. OnTheMap reports primary jobs at the census block level, while the TELUM model requires TAZ‐level data. The OnTheMap data were imported into ArcGIS as point features, located at the blocks’ geographical centroids. Employed residents were assigned to TAZs using the spatial join tool, based on the TAZ which contains a block’s centroid. The spatial join method assumes that if a point representing a census block is within a TAZ, all the census block’s employed residents live in that TAZ. This is not necessarily true. OTM_EMP_Res_09.xlsx has total employed residents by TAZ for 2009. Spatial aggregation from 167 TAZs to 136 Super TAZs is done in 167_to_136_TAZs_9‐27‐2012.xlsx. ‐‐‐‐‐‐‐‐‐‐‐‐‐‐‐‐‐‐‐‐‐‐‐‐‐‐‐‐‐‐‐‐‐‐‐‐‐‐‐‐‐‐‐‐‐‐‐‐‐ An alternative source of employed residents by zone in 2009 is the attribute EMP_CY in the 2009_confirmed_Employed_Adults_Statesville_CTP shapefile provided by Bjorn Hansen with the Lake Norman RPO. The source of that shapefile is ESRI’s 2009/2014 demographic database. The shapefile’s data dictionary is “2009 ESRI Data Catalog.xls.” We did not use those data because the spatial extent of that shapefile did not closely match the spatial extent of the Statesville travel demand model.
Households by category by zone TPB’s household counts are in the HH_POP_EMP worksheet in Book1.xlsx. Spatial aggregation from 167 TAZs to 136 Super TAZs is done in 167_to_136_TAZs_9‐27‐2012.xlsx.
Group quarters population by zone TPB’s count of group quarters residents are in the HH_POP_EMP worksheet in Book1.xlsx. Spatial aggregation from 167 TAZs to 136 Super TAZs is done in 167_to_136_TAZs_9‐27‐2012.xlsx.
Total household population by zone TPB’s counts of household population are in the HH_POP_EMP worksheet in Book1.xlsx. Spatial aggregation from 167 TAZs to 136 Super TAZs is done in 167_to_136_TAZs_9‐27‐2012.xlsx.
Employment data for lag year (2004) by place of work Employment by sector by zone OnTheMap Area Profile Analysis with these settings:
Selection: import Statesville shapefile
Home/Work Area = work.
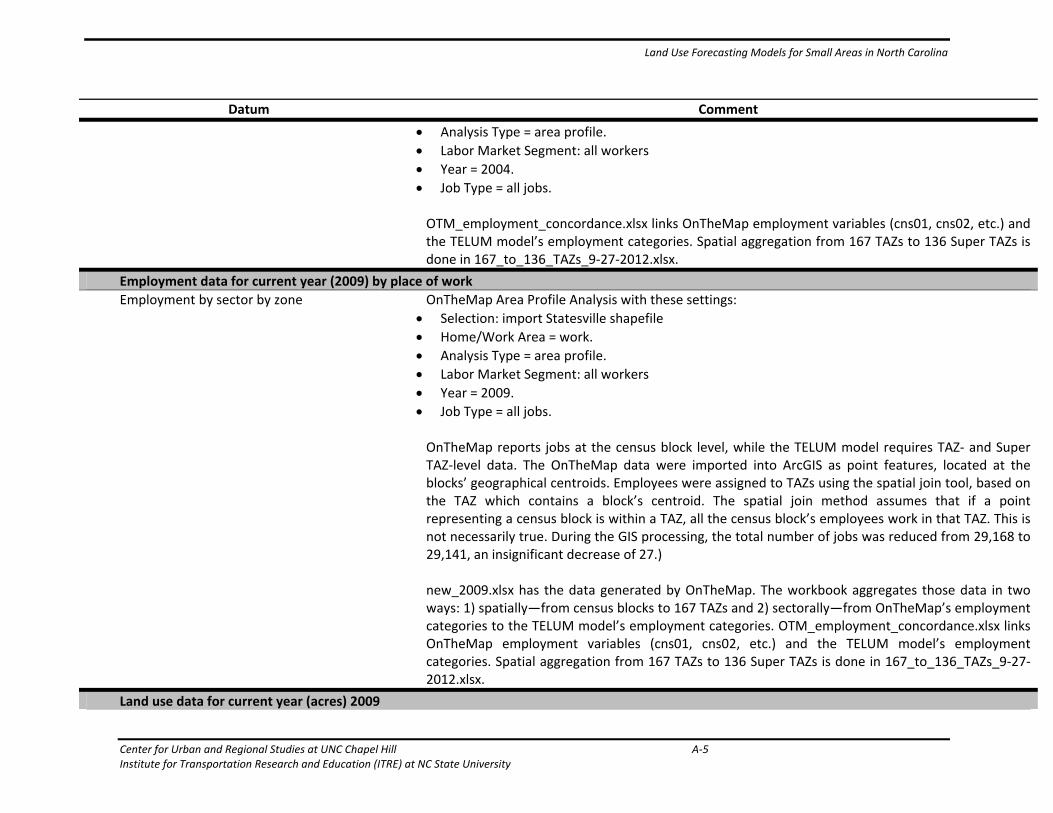
Land Use Forecasting Models for Small Areas in North Carolina
Center for Urban and Regional Studies at UNC Chapel Hill A‐5 Institute for Transportation Research and Education (ITRE) at NC State University
Datum Comment
Analysis Type = area profile.
Labor Market Segment: all workers
Year = 2004.
Job Type = all jobs. OTM_employment_concordance.xlsx links OnTheMap employment variables (cns01, cns02, etc.) and the TELUM model’s employment categories. Spatial aggregation from 167 TAZs to 136 Super TAZs is done in 167_to_136_TAZs_9‐27‐2012.xlsx.
Employment data for current year (2009) by place of work
Employment by sector by zone OnTheMap Area Profile Analysis with these settings:
Selection: import Statesville shapefile
Home/Work Area = work.
Analysis Type = area profile.
Labor Market Segment: all workers
Year = 2009.
Job Type = all jobs. OnTheMap reports jobs at the census block level, while the TELUM model requires TAZ‐ and Super TAZ‐level data. The OnTheMap data were imported into ArcGIS as point features, located at the blocks’ geographical centroids. Employees were assigned to TAZs using the spatial join tool, based on the TAZ which contains a block’s centroid. The spatial join method assumes that if a point representing a census block is within a TAZ, all the census block’s employees work in that TAZ. This is not necessarily true. During the GIS processing, the total number of jobs was reduced from 29,168 to 29,141, an insignificant decrease of 27.) new_2009.xlsx has the data generated by OnTheMap. The workbook aggregates those data in two ways: 1) spatially—from census blocks to 167 TAZs and 2) sectorally—from OnTheMap’s employment categories to the TELUM model’s employment categories. OTM_employment_concordance.xlsx links OnTheMap employment variables (cns01, cns02, etc.) and the TELUM model’s employment categories. Spatial aggregation from 167 TAZs to 136 Super TAZs is done in 167_to_136_TAZs_9‐27‐2012.xlsx.
Land use data for current year (acres) 2009
Land Use Forecasting Models for Small Areas in North Carolina
A‐6 Center for Urban and Regional Studies at UNC Chapel Hill Institute for Transportation Research and Education (ITRE) at NC State University
Datum Comment
Total land area by zone Calculated in GIS by subtracting water area from total area. Water area is contained in the 48States_WaterBodies_Pr shapefile prepared for NCHRP 25‐36. Total area was calculated in GIS using the Statesville TAZ_081610 shapefile. The TAZs‐minus_water shapefile has the attribute Area_no_water for each TAZ.
Land area occupied by basic employment by zone
Calculated in GIS. Land use codes were extracted from the Iredell County 2010 appraisal table and joined (based on PIN) to the parcel shapefile that contains the acreage of each parcel. The parcels with a land use code that connotes “basic employment” were identified after a concordance was established between the TELUM model’s employment categories and Iredell County’s land use codes. The concordance appears in Concordance_Iredell_LUCodes_and_TELUM_LUCategories.xlsx and “Compilation of Model Calibration Data.xlsx.” Parcels with missing land use codes were classified by default as “vacant, developable land.”. Iredell County GIS resources http://www.co.iredell.nc.us/Departments/GISMaps/datadownloads.aspx Iredell County parcels layer http://gis.co.iredell.nc.us/website/datadownloads/Parcels.zip Iredell County 2010 appraisal table http://gis.co.iredell.nc.us/website/datadownloads/APPRFILE2010.zip Iredell County land use codes: pages 11.44 through 11.50 in the code descriptions document http://gis.co.iredell.nc.us/website/datadownloads/Code_Descriptions.pdf
Land area occupied by commercial employment by zone
Calculated in GIS. Land use codes were extracted from the Iredell County 2010 appraisal table and joined (based on PIN) to the parcel shapefile that contains the acreage of each parcel. The parcels with a land use code that connotes “commercial employment” were identified after a concordance was established between the TELUM model’s employment categories and Iredell County’s land use codes. The concordance appears in Concordance_Iredell_LUCodes_and_TELUM_LUCategories.xlsx and “Compilation of Model Calibration Data.xlsx.” Parcels with missing land use codes were classified by default as “vacant, developable land.” Iredell County GIS resources http://www.co.iredell.nc.us/Departments/GISMaps/datadownloads.aspx
Land Use Forecasting Models for Small Areas in North Carolina
Center for Urban and Regional Studies at UNC Chapel Hill A‐7 Institute for Transportation Research and Education (ITRE) at NC State University
Datum Comment
Iredell County parcels layer http://gis.co.iredell.nc.us/website/datadownloads/Parcels.zip Iredell County 2010 appraisal table http://gis.co.iredell.nc.us/website/datadownloads/APPRFILE2010.zip Iredell County land use codes: pages 11.44 through 11.50 in the code descriptions document http://gis.co.iredell.nc.us/website/datadownloads/Code_Descriptions.pdf
Unusable land by zone Calculated in GIS. The operational definition of unusable land is wetlands, floodways, recreational areas, conservation easements, and other uses that are not suitable for development. Wetlands Mapper of the U.S. Fish and Wildlife Service National Wetlands Inventory http://www.fws.gov/wetlands/Data/Mapper.htm Protected Areas Database of the United States version 1.2 http://gapanalysis.usgs.gov/padus/data/ North Carolina Floodplain Mapping Program http://www.ncfloodmaps.com/ Iredell County parcels layer http://gis.co.iredell.nc.us/website/datadownloads/Parcels.zip Iredell County 2010 appraisal table http://gis.co.iredell.nc.us/website/datadownloads/APPRFILE2010.zip Iredell County land use codes: pages 11.44 through 11.50 in the code descriptions document http://gis.co.iredell.nc.us/website/datadownloads/Code_Descriptions.pdf
Residentially‐occupied land by zone Calculated in GIS. Land use codes were extracted from the Iredell County 2010 appraisal table and joined (based on PIN) to the parcel shapefile that contains the acreage of each parcel. The parcels with a land use code that connotes “residential occupation” were identified after a concordance was established between the TELUM model’s employment categories and Iredell County’s land use codes. The concordance appears in Concordance_Iredell_LUCodes_and_TELUM_LUCategories.xlsx and “Compilation of Model Calibration Data.xlsx.” Parcels with missing land use codes were classified by

Land Use Forecasting Models for Small Areas in North Carolina
A‐8 Center for Urban and Regional Studies at UNC Chapel Hill Institute for Transportation Research and Education (ITRE) at NC State University
Datum Comment
default as “vacant, developable land.” Iredell County GIS resources http://www.co.iredell.nc.us/Departments/GISMaps/datadownloads.aspx Iredell County parcels layer http://gis.co.iredell.nc.us/website/datadownloads/Parcels.zip Iredell County 2010 appraisal table http://gis.co.iredell.nc.us/website/datadownloads/APPRFILE2010.zip Iredell County land use codes: pages 11.44 through 11.50 in the code descriptions document http://gis.co.iredell.nc.us/website/datadownloads/Code_Descriptions.pdf
Land used for streets and highways by zone
Calculated in GIS. The negative space of the Iredell County parcel shapefile was used to infer the location and acreage of street rights‐of‐way.
Vacant, developable land by zone Calculated in GIS. Parcels that were missing land use codes were classified as vacant/developable. Any land (regardless of land use code) that had no improvements listed in the tax database were also classified as vacant/developable land.
Total usable land by zone Calculated in GIS. Usable land = total land area – unusable land.
Travel Impedances for current year (2009) Travel impedances, including intrazonal impedances
Generalized cost for morning‐peak home‐based work trips. The impedances that are exported from the travel demand model must be aggregated spatially and formatted according to TELUM’s requirements. TELUM requires the friction factors to be in a prn‐formatted file that has two columns which are each 10 spaces wide. The columns must not have headers. The first column contains the numbers that identify Super TAZ‐Super TAZ pairs. The order in which the impedances are recorded must align with the order in which the Super TAZs appear in the DATAPREP workbook. For example, the first 136 rows of the TELUM impedance file must contain the impedances for Super TAZ 1 – Super TAZ 1, Super TAZ 1 – Super TAZ 2, etc. The second column contains the impedances, including intrazonal impedances. The travel demand
Land Use Forecasting Models for Small Areas in North Carolina
Center for Urban and Regional Studies at UNC Chapel Hill A‐9 Institute for Transportation Research and Education (ITRE) at NC State University
Datum Comment
model’s impedances must be multiplied by 100 before they are provided to the TELUM model. All processing of the travel demand model’s impedances is done in an Excel workbook, of which two have been created, 2009Impedances.xlsx and 2014Impedances.xlsx. The workbooks use pivot tables to spatially aggregate and average the impedances that are exported from the travel demand model.


Land Use Forecasting Models for Small Areas in North Carolina
Center for Urban and Regional Studies at UNC Chapel Hill B‐1 Institute for Transportation Research and Education (ITRE) at NC State University
Appendix B Data Required for Forecasting with the Statesville TELUM Model: Additional Details
Datum Comment
Initial Data Entry Unit (study area) for current year 2009
Net commuting rate 1
OnTheMap Inflow/Outflow Analysis with these settings:
Selection: import Statesville shapefile
Home/Work Area = irrelevant.
Analysis Type = Inflow/Outflow.
Year = 2009.
Job Type = All jobs. Outbound commuters ≡ Living in the Selection Area but Employed Outside = 16,745 Inbound commuters ≡ Employed in the Selection Area but Living Outside = 19,013 Employed persons at work in Statesville ≡ Employed in the Selection Area = 29,168
net commuting rate = 1 ≈ 0.92.
Population and employment forecasts for each future year (“Projections” worksheet in TELUM’s “dataprep” workbook) Total study‐area population, including persons in group quarters
Source of 2040 regional control totals: “Sheet1” in “Statesville CTP SE Data for NCDOT 3‐29‐10.xls.” Linear interpolation was used to prepare regional control totals for the years between 2009 and 2040. Those calculations are made in DOPU_projections_worksheet_11‐19‐2012.xlsx.
Total study‐area employment, by economic sector
Source of 2040 regional control totals: “Sheet1” in “Statesville CTP SE Data for NCDOT 3‐29‐10.xls.” Linear interpolation was used to prepare regional control totals for the years between 2009 and 2040. Those calculations are made in DOPU_projections_worksheet_11‐19‐2012.xlsx.
Conversion factors (study area) for current year 2009 (“Conversion Matrix” worksheet in TELUM’s “dataprep” workbook)
Unemployment rate by employment category
Estimated from the person records in 2009 ACS PUMS data for PUMA 3701500 (Iredell County). DataFerrett was used. The variables in the analysis are employment status recode (ESR); relationship
Land Use Forecasting Models for Small Areas in North Carolina
B‐2 Center for Urban and Regional Studies at UNC Chapel Hill Institute for Transportation Research and Education (ITRE) at NC State University
Datum Comment
(REL), which allows differentiation between members of the household population and members of the group quarters population; industry recode (INDP); and person’s weight (PWGTP). The unemployment rate for each of the TELUM model’s employment categories was calculated with this formula: number unemployed ÷ [(number of civilian employed, at work) + (number of civilian employed, with a job but not at work) + number unemployed]. INDP identifies the industry in which someone is employed (presumably the primary job’s industry) with a 4‐digit code. ACS also uses narrative labels to identify industries. The ACS codes and labels can be correlated with NAICS codes. A concordance of labels and NAICS codes appears in the data dictionary, beginning on page 57; see also p. 127 for a note on NAICS equivalents. NAICS codes are also provided in Industry.pdf. The NAICS codes were aggregated to match TELUM’s employment categories. The latter are based on the SIC codes in the Employment worksheet in Book1.xlsx. A concordance between 4‐digit NAICS and 2‐digit SIC codes was established using SICS_to_NAICS_Cross_Reference.xlsx to aggregate the NAICS data from PUMS into TELUM’s employment categories. That concordance is documented in worksheet “SIC to NAICS” in 2009_unemployment_by_sector.xlsx. ACS person records include persons living in group quarters and persons living in households. Ideally, unemployment rates are calculated only for the persons living in households because the TELUM‐Res Conversion Procedure is intended to generate households, not group quarters population (Users Manual, pp. 4.17‐4.18). 2009 ACS PUMS Data Dictionary http://www.census.gov/acs/www/Downloads/data_documentation/pums/DataDict/PUMSDataDict09.pdf Industry.pdf Industry.pdf and other code lists are contained in the portfolio ACSPUMS2009CodeLists.pdf. http://www.census.gov/acs/www/Downloads/data_documentation/pums/CodeLists/ACSPUMS2009CodeLists.pdf Census Bureau’s DataFerrett

Land Use Forecasting Models for Small Areas in North Carolina
Center for Urban and Regional Studies at UNC Chapel Hill B‐3 Institute for Transportation Research and Education (ITRE) at NC State University
Datum Comment
http://dataferrett.census.gov/run.html Data quality check. Compare Iredell County’s overall unemployment rate to the unemployment rate calculated bottom‐up. (Caveat: the bottom‐up estimates include persons not in labor force, implying an overestimate of unemployment rates.] Obtain Iredell County’s overall unemployment rate from BLS. The aggregate unemployment rate is included in the Local Area Unemployment Statistics (LAUS) program. http://www.bls.gov/lau/ Use the “one screen” data extraction tool. http://data.bls.gov/pdq/querytool.jsp?survey=la The extracted data comprise: labor force (LAUPA37105003); employment (LAUPA37105004); unemployment (LAUPA37105005); and unemployment rate (LAUPA37105006). The numbers in parentheses are LAU series codes. The data were downloaded to “SeriesReport‐20120509102727.xls.” According to BLS statistics, Iredell’s 2009 unemployment was 12.6%.

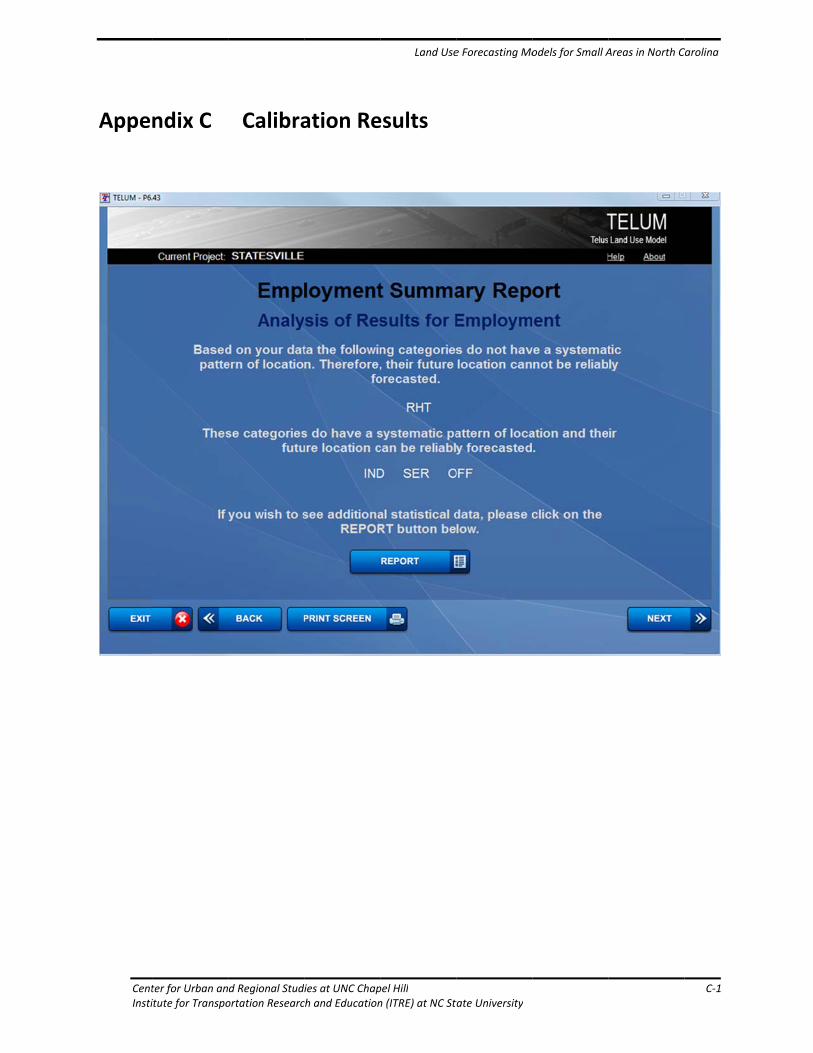
CentInsti
Appe
ter for Urban anitute for Transpo
ndix C
d Regional Studortation Researc
Calibra
ies at UNC Chapch and Education
ation Re
Land Use
pel Hilln (ITRE) at NC Sta
esults
e Forecasting Mo
tate University
odels for Small AAreas in North CCarolina
C‐1
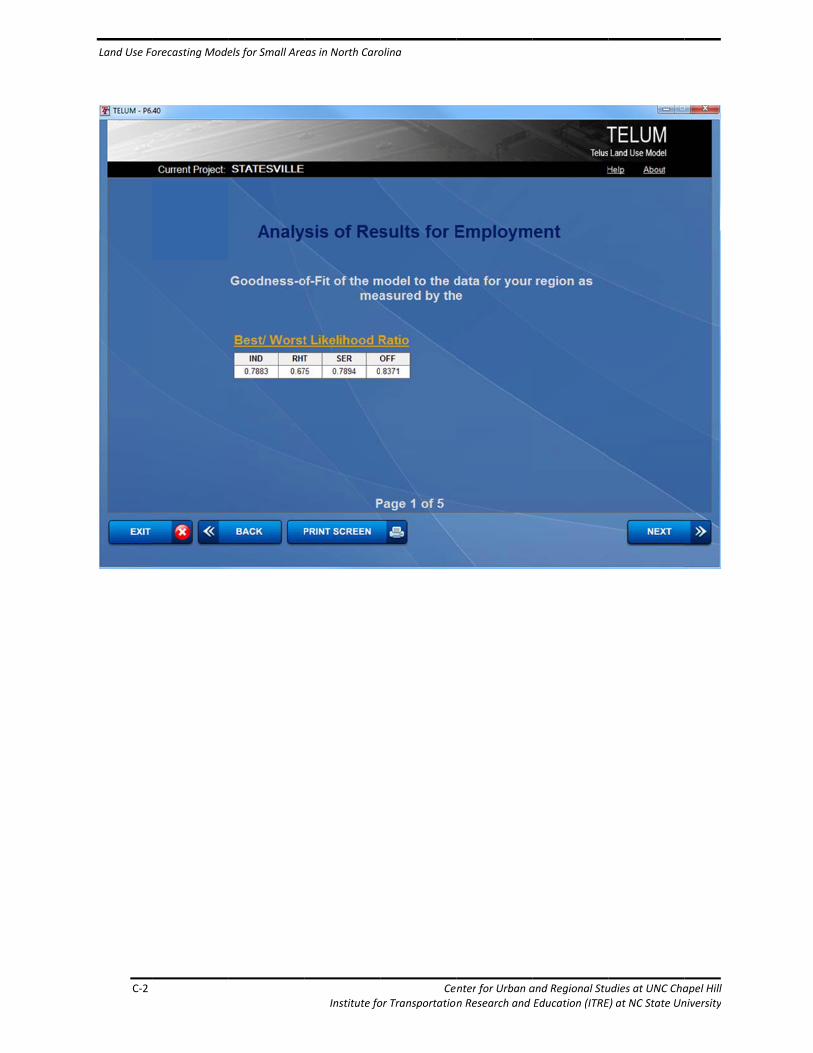
Land Use Fo
C‐2
orecasting Modeels for Small Are
eas in North Caro
Institute fo
olina
Ceor Transportation
nter for Urban an Research and
and Regional StuEducation (ITRE
udies at UNC ChaE) at NC State Un
apel Hill niversity
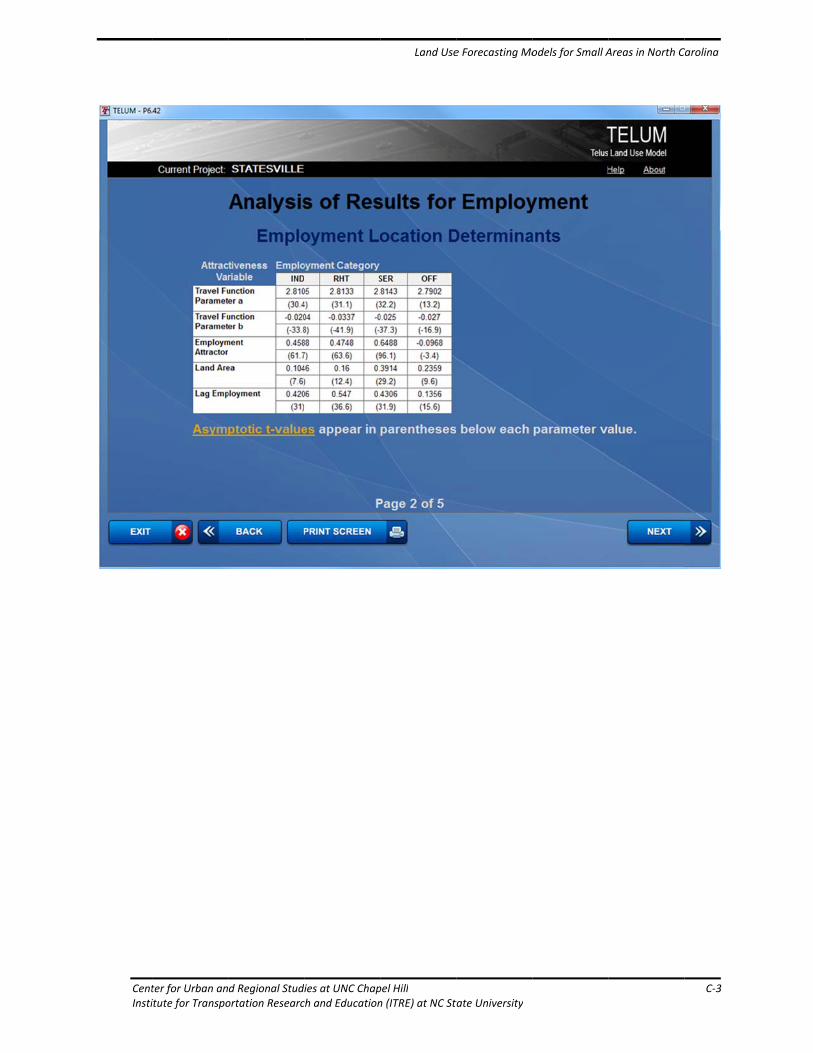
CentInsti
ter for Urban anitute for Transpo
d Regional Studortation Researc
ies at UNC Chapch and Education
Land Use
pel Hilln (ITRE) at NC Sta
e Forecasting Mo
tate University
odels for Small AAreas in North CCarolina
C‐3
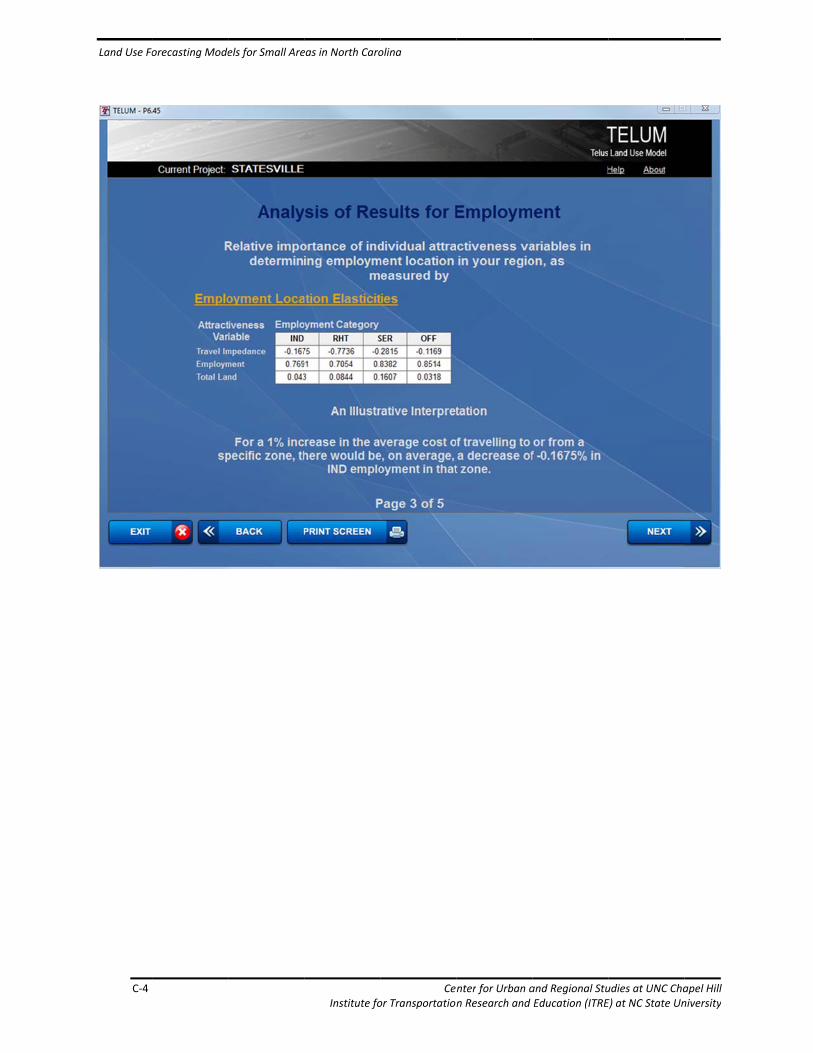
Land Use Fo
C‐4
orecasting Modeels for Small Are
eas in North Caro
Institute fo
olina
Ceor Transportation
nter for Urban an Research and
and Regional StuEducation (ITRE
udies at UNC ChaE) at NC State Un
apel Hill niversity
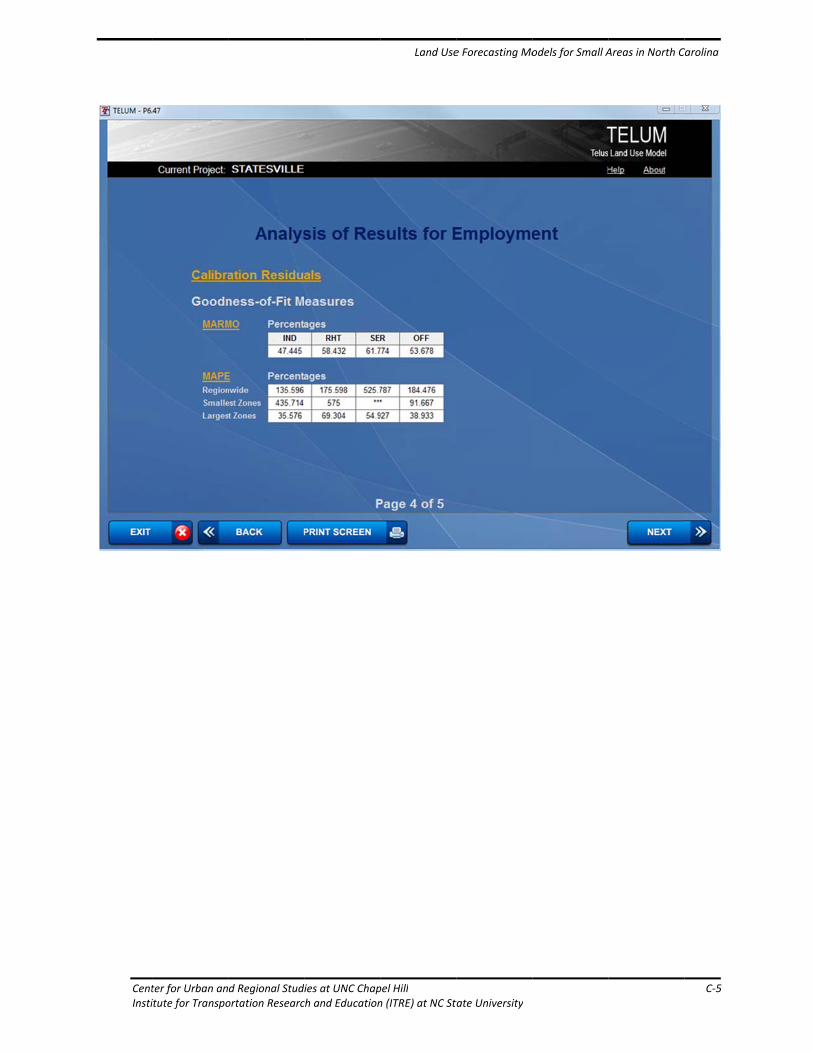
CentInsti
ter for Urban anitute for Transpo
d Regional Studortation Researc
ies at UNC Chapch and Education
Land Use
pel Hilln (ITRE) at NC Sta
e Forecasting Mo
tate University
odels for Small AAreas in North CCarolina
C‐5

Land Use Fo
C‐6
orecasting Modeels for Small Are
eas in North Caro
Institute fo
olina
Ceor Transportation
nter for Urban an Research and
and Regional StuEducation (ITRE
udies at UNC ChaE) at NC State Un
apel Hill niversity
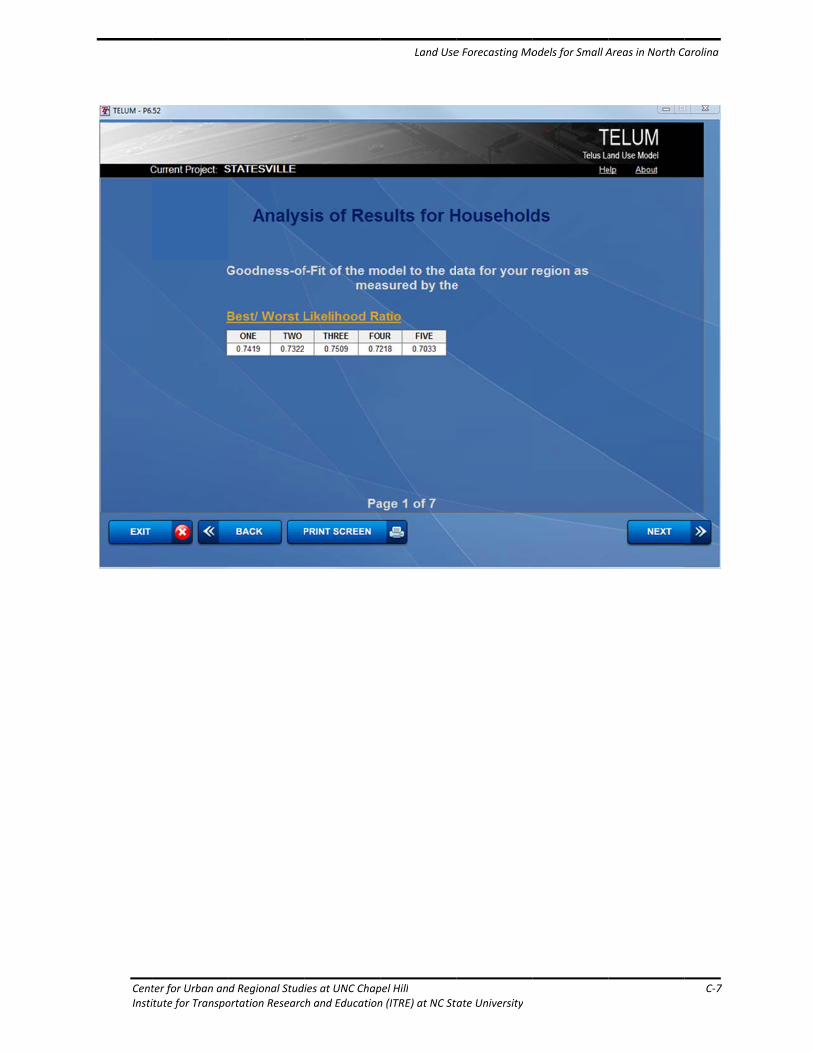
CentInsti
ter for Urban anitute for Transpo
d Regional Studortation Researc
ies at UNC Chapch and Education
Land Use
pel Hilln (ITRE) at NC Sta
e Forecasting Mo
tate University
odels for Small AAreas in North CCarolina
C‐7
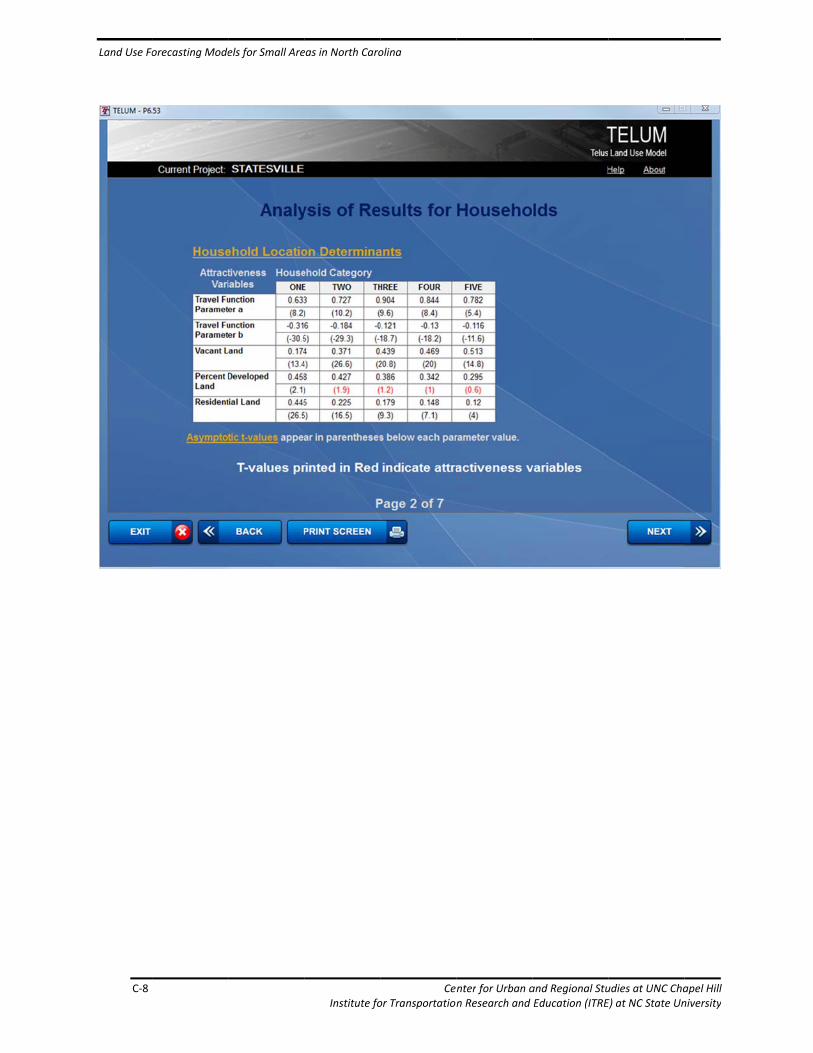
Land Use Fo
C‐8
orecasting Modeels for Small Are
eas in North Caro
Institute fo
olina
Ceor Transportation
nter for Urban an Research and
and Regional StuEducation (ITRE
udies at UNC ChaE) at NC State Un
apel Hill niversity

CentInsti
ter for Urban anitute for Transpo
d Regional Studortation Researc
ies at UNC Chapch and Education
Land Use
pel Hilln (ITRE) at NC Sta
e Forecasting Mo
tate University
odels for Small AAreas in North CCarolina
C‐9

Land Use Fo
C‐10
orecasting Mode
0
els for Small Are
eas in North Caro
Institute fo
olina
Ceor Transportation
nter for Urban an Research and
and Regional StuEducation (ITRE
udies at UNC ChaE) at NC State Un
apel Hill niversity

CentInsti
ter for Urban anitute for Transpo
d Regional Studortation Researc
ies at UNC Chapch and Education
Land Use
pel Hilln (ITRE) at NC Sta
e Forecasting Mo
tate University
odels for Small AAreas in North CCarolina
C‐11
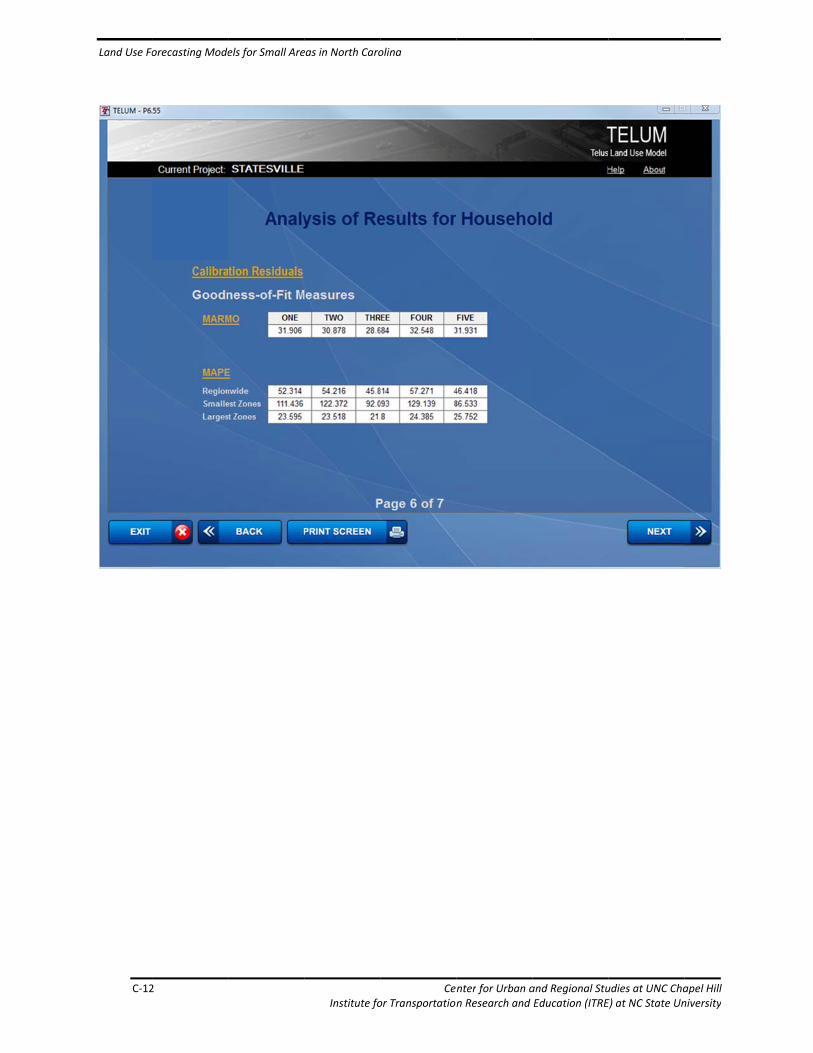
Land Use Fo
C‐12
orecasting Mode
2
els for Small Are
eas in North Caro
Institute fo
olina
Ceor Transportation
nter for Urban an Research and
and Regional StuEducation (ITRE
udies at UNC ChaE) at NC State Un
apel Hill niversity

CentInsti
ter for Urban anitute for Transpo
d Regional Studortation Researc
ies at UNC Chapch and Education
Land Use
pel Hilln (ITRE) at NC Sta
e Forecasting Mo
tate University
odels for Small AAreas in North CCarolina
C‐13
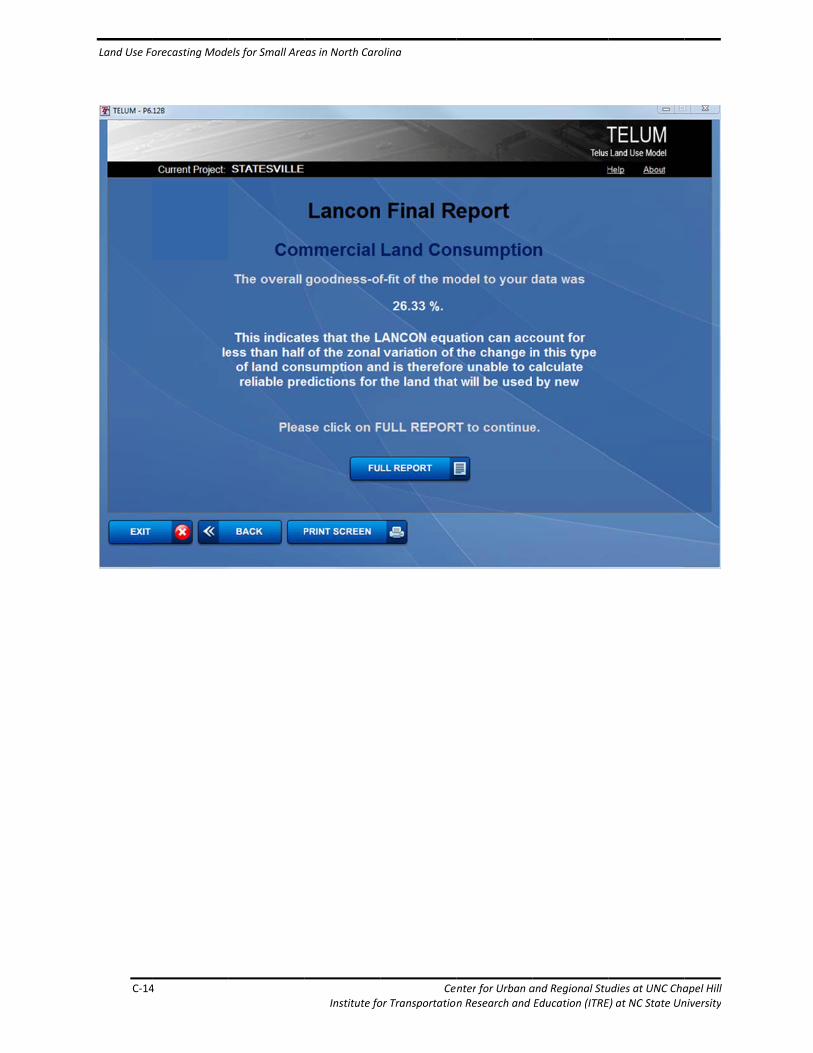
Land Use Fo
C‐14
orecasting Mode
4
els for Small Are
eas in North Caro
Institute fo
olina
Ceor Transportation
nter for Urban an Research and
and Regional StuEducation (ITRE
udies at UNC ChaE) at NC State Un
apel Hill niversity

CentInsti
ter for Urban anitute for Transpo
d Regional Studortation Researc
ies at UNC Chapch and Education
Land Use
pel Hilln (ITRE) at NC Sta
e Forecasting Mo
tate University
odels for Small AAreas in North CCarolina
C‐15

Land Use Fo
C‐16
orecasting Mode
6
els for Small Are
eas in North Caro
Institute fo
olina
Ceor Transportation
nter for Urban an Research and
and Regional StuEducation (ITRE
udies at UNC ChaE) at NC State Un
apel Hill niversity
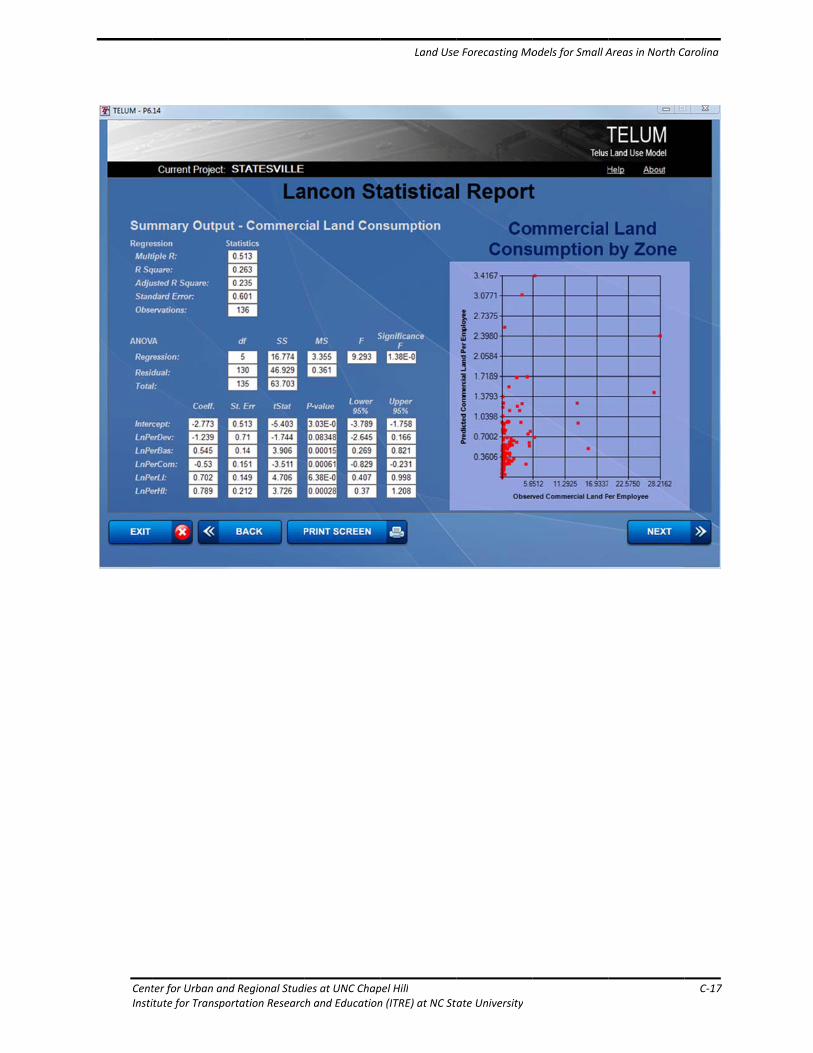
CentInsti
ter for Urban anitute for Transpo
d Regional Studortation Researc
ies at UNC Chapch and Education
Land Use
pel Hilln (ITRE) at NC Sta
e Forecasting Mo
tate University
odels for Small AAreas in North CCarolina
C‐17

Land Use Fo
C‐18
orecasting Mode
8
els for Small Areeas in North Caro
Institute fo
olina
Ceor Transportation
nter for Urban an Research and
and Regional StuEducation (ITRE
udies at UNC ChaE) at NC State Un
apel Hill niversity

Land Use Forecasting Models for Small Areas in North Carolina
Center for Urban and Regional Studies at UNC Chapel Hill D‐1 Institute for Transportation Research and Education (ITRE) at NC State University
Appendix D Survey Responses
Detailed responses to all questions from the RPO survey are provided below.
Question 1 – To begin the survey, please tell us which RPO you are associated with
Table 1 Question 1 Number of responses by RPO
Name of RPO Number of Respondents (N = 19)
Albemarle 1
Cape Fear 1
Down East 1
Eastern Carolina 1
High Country 1
Isothermal 0
Kerr‐Tar 2
Lake Norman 1
Land of Sky 2
Lumber River 1
Mid‐Carolina 1
Mid‐East 0
Northwest Piedmont 0
Peanut Belt 1
Piedmont Triad 2
Rocky River 1
Southwestern 1
Triangle Area 1
Unifour 0
Upper Coastal Plain 1
Figure 7‐1 Question 1 RPO association
Sixteen of the twenty RPOs in the state responded to the request to complete the survey. Three of the responding RPOs had more than one person complete and submit a survey.
No Response
One Response
Two Responses
MPO Areas (outside RPOs)

Land Use Forecasting Models for Small Areas in North Carolina
D‐2 Center for Urban and Regional Studies at UNC Chapel Hill Institute for Transportation Research and Education (ITRE) at NC State University
Question 2 – Which of the following best describes your role/involvement in transportation planning?
Figure 7‐2 Question 2 Role in transportation planning
While only fourteen of the respondents self‐reported as ‘RPO Planner/Coordinator,’ it should be noted that almost all of the respondents were affiliated with the RPO staff. The respondent who marked ‘Local Government Staff Member’ works for a local government that administers an RPO and routinely performs RPO‐related work. The respondent who marked ‘Other COG Staff’ similarly works for a COG that administers an RPO and routinely performs RPO work. Both respondents who marked ‘Other’ noted connections to the RPO staff. Only one respondent was truly from outside the RPO staff umbrella, a planner from the North Carolina Department of Transportation.
Question 3 – Please list the CTPs that have been completed in your RPO. Please do not include CTPs that are currently underway (we will ask about those in a later question). If the adoption year is unknown, leave the adoption year cell blank. For each CTP, please also indicate whether you had any involvement in developing the plan.
Table 2 Question 3 Full list of responses
Name of CTP Area Adoption Year Involvement in Developing CTP
Beulaville 2009 Yes, I was involved
Brunswick County 2009 Yes, I was involved
Buncombe/Haywood Non‐urban 2006 No, I was not involved
Rural Buncombe County 2008 No, I was not involved
Caswell County 2006 Yes, I was involved
Caswell County 2009 Yes, I was involved
Cleveland County 2011 Yes, I was involved
Columbus County 2004
Currituck County 2011 Yes, I was involved
Davidson County 2009 Yes, I was involved
Davidson County 2011 Yes, I was involved
RPO Planner/ Coordinator, 14
Local Government Staff Member, 1
Other COG Staff (non‐RPO), 1
NCDOT Staff, 1 Other, 2
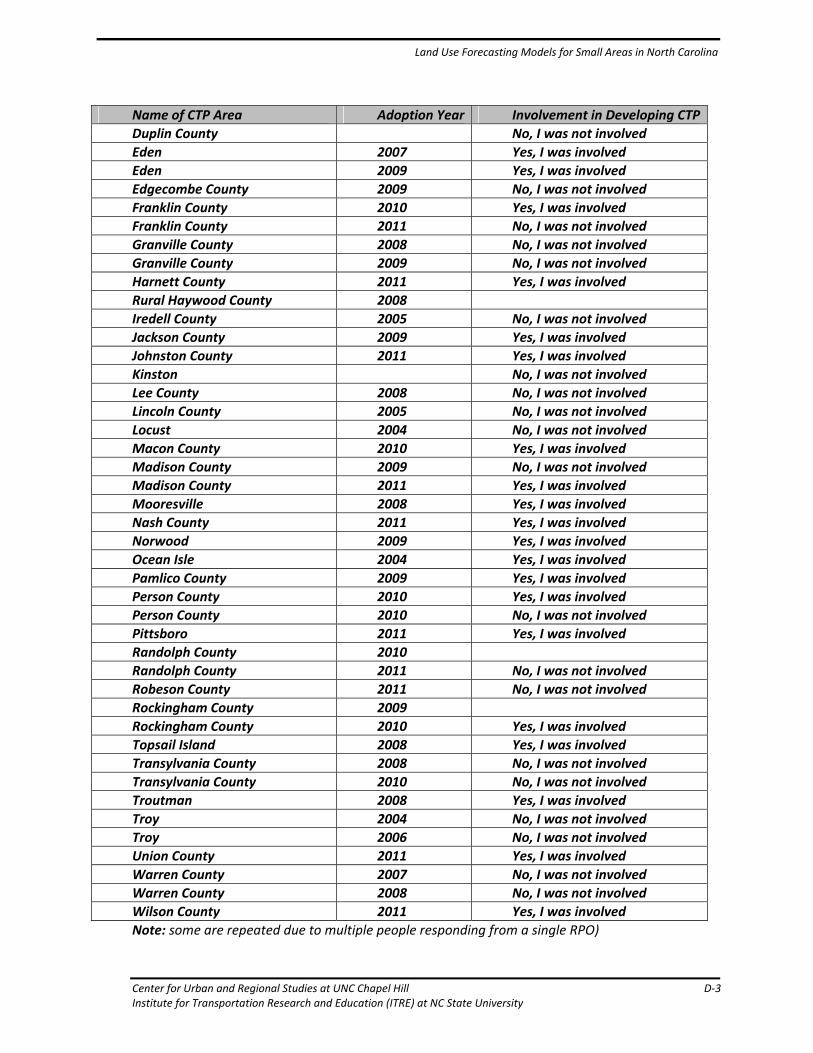
Land Use Forecasting Models for Small Areas in North Carolina
Center for Urban and Regional Studies at UNC Chapel Hill D‐3 Institute for Transportation Research and Education (ITRE) at NC State University
Name of CTP Area Adoption Year Involvement in Developing CTP
Duplin County No, I was not involved
Eden 2007 Yes, I was involved
Eden 2009 Yes, I was involved
Edgecombe County 2009 No, I was not involved
Franklin County 2010 Yes, I was involved
Franklin County 2011 No, I was not involved
Granville County 2008 No, I was not involved
Granville County 2009 No, I was not involved
Harnett County 2011 Yes, I was involved
Rural Haywood County 2008
Iredell County 2005 No, I was not involved
Jackson County 2009 Yes, I was involved
Johnston County 2011 Yes, I was involved
Kinston No, I was not involved
Lee County 2008 No, I was not involved
Lincoln County 2005 No, I was not involved
Locust 2004 No, I was not involved
Macon County 2010 Yes, I was involved
Madison County 2009 No, I was not involved
Madison County 2011 Yes, I was involved
Mooresville 2008 Yes, I was involved
Nash County 2011 Yes, I was involved
Norwood 2009 Yes, I was involved
Ocean Isle 2004 Yes, I was involved
Pamlico County 2009 Yes, I was involved
Person County 2010 Yes, I was involved
Person County 2010 No, I was not involved
Pittsboro 2011 Yes, I was involved
Randolph County 2010
Randolph County 2011 No, I was not involved
Robeson County 2011 No, I was not involved
Rockingham County 2009
Rockingham County 2010 Yes, I was involved
Topsail Island 2008 Yes, I was involved
Transylvania County 2008 No, I was not involved
Transylvania County 2010 No, I was not involved
Troutman 2008 Yes, I was involved
Troy 2004 No, I was not involved
Troy 2006 No, I was not involved
Union County 2011 Yes, I was involved
Warren County 2007 No, I was not involved
Warren County 2008 No, I was not involved
Wilson County 2011 Yes, I was involved
Note: some are repeated due to multiple people responding from a single RPO)
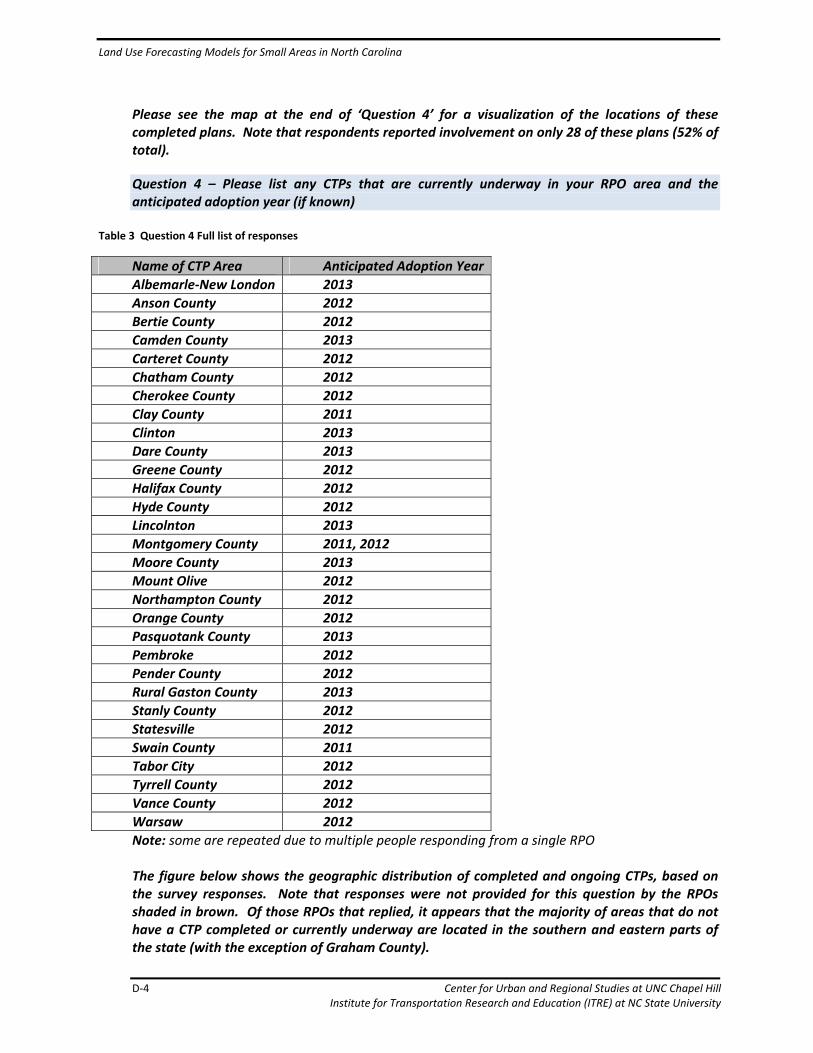
Land Use Forecasting Models for Small Areas in North Carolina
D‐4 Center for Urban and Regional Studies at UNC Chapel Hill Institute for Transportation Research and Education (ITRE) at NC State University
Please see the map at the end of ‘Question 4’ for a visualization of the locations of these completed plans. Note that respondents reported involvement on only 28 of these plans (52% of total).
Question 4 – Please list any CTPs that are currently underway in your RPO area and the anticipated adoption year (if known)
Table 3 Question 4 Full list of responses
Name of CTP Area Anticipated Adoption Year
Albemarle‐New London 2013
Anson County 2012
Bertie County 2012
Camden County 2013
Carteret County 2012
Chatham County 2012
Cherokee County 2012
Clay County 2011
Clinton 2013
Dare County 2013
Greene County 2012
Halifax County 2012
Hyde County 2012
Lincolnton 2013
Montgomery County 2011, 2012
Moore County 2013
Mount Olive 2012
Northampton County 2012
Orange County 2012
Pasquotank County 2013
Pembroke 2012
Pender County 2012
Rural Gaston County 2013
Stanly County 2012
Statesville 2012
Swain County 2011
Tabor City 2012
Tyrrell County 2012
Vance County 2012
Warsaw 2012
Note: some are repeated due to multiple people responding from a single RPO The figure below shows the geographic distribution of completed and ongoing CTPs, based on the survey responses. Note that responses were not provided for this question by the RPOs shaded in brown. Of those RPOs that replied, it appears that the majority of areas that do not have a CTP completed or currently underway are located in the southern and eastern parts of the state (with the exception of Graham County).
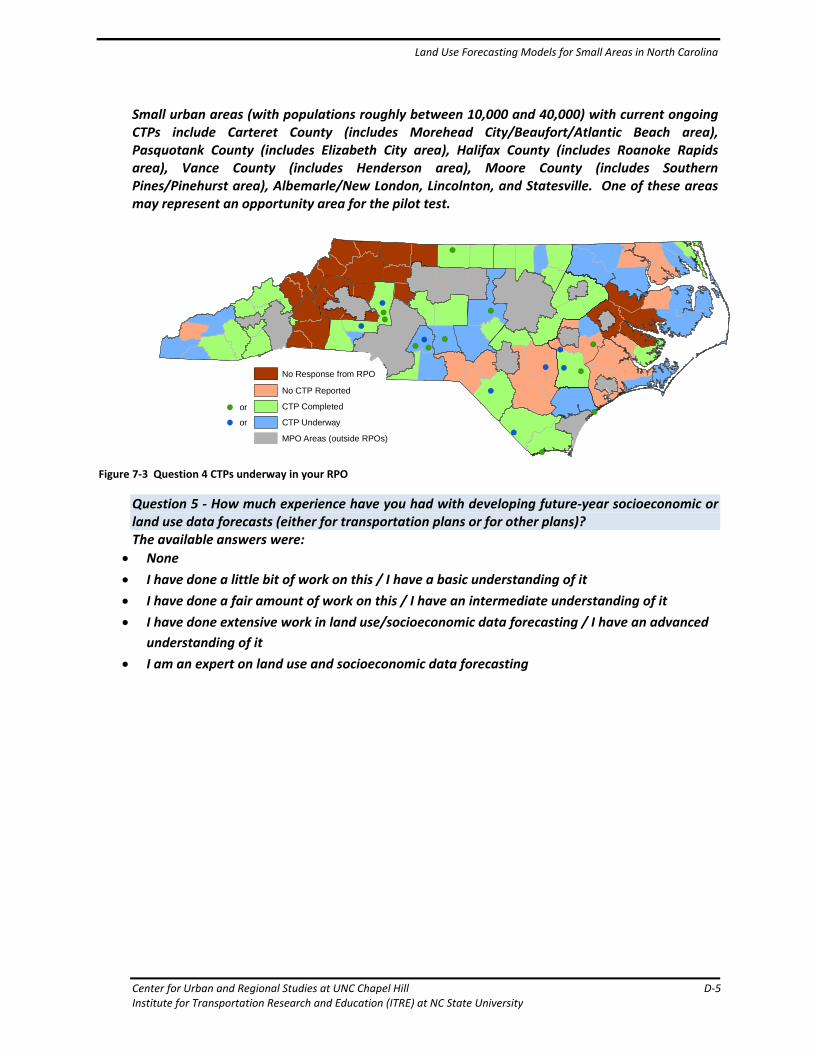
Land Use Forecasting Models for Small Areas in North Carolina
Center for Urban and Regional Studies at UNC Chapel Hill D‐5 Institute for Transportation Research and Education (ITRE) at NC State University
Small urban areas (with populations roughly between 10,000 and 40,000) with current ongoing CTPs include Carteret County (includes Morehead City/Beaufort/Atlantic Beach area), Pasquotank County (includes Elizabeth City area), Halifax County (includes Roanoke Rapids area), Vance County (includes Henderson area), Moore County (includes Southern Pines/Pinehurst area), Albemarle/New London, Lincolnton, and Statesville. One of these areas may represent an opportunity area for the pilot test.
Figure 7‐3 Question 4 CTPs underway in your RPO
Question 5 ‐ How much experience have you had with developing future‐year socioeconomic or land use data forecasts (either for transportation plans or for other plans)? The available answers were:
None
I have done a little bit of work on this / I have a basic understanding of it
I have done a fair amount of work on this / I have an intermediate understanding of it
I have done extensive work in land use/socioeconomic data forecasting / I have an advanced
understanding of it
I am an expert on land use and socioeconomic data forecasting
!(
!(
!(!(
!(
!(
!(
!(
!(!(
!(
!(
!(
!(
!(
!(
!(
!(
!(
!(
No CTP Reported
CTP Completed
CTP Underway
MPO Areas (outside RPOs)
No Response from RPO
or
!( or
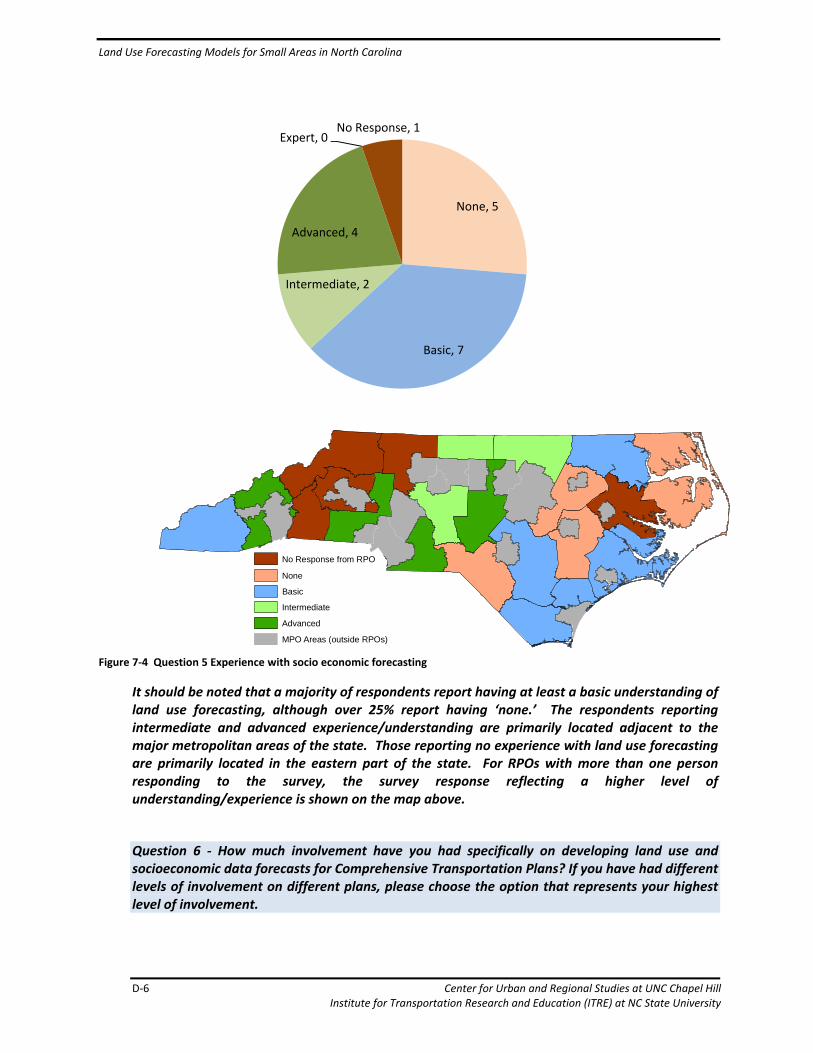
Land Use Forecasting Models for Small Areas in North Carolina
D‐6 Center for Urban and Regional Studies at UNC Chapel Hill Institute for Transportation Research and Education (ITRE) at NC State University
Figure 7‐4 Question 5 Experience with socio economic forecasting
It should be noted that a majority of respondents report having at least a basic understanding of land use forecasting, although over 25% report having ‘none.’ The respondents reporting intermediate and advanced experience/understanding are primarily located adjacent to the major metropolitan areas of the state. Those reporting no experience with land use forecasting are primarily located in the eastern part of the state. For RPOs with more than one person responding to the survey, the survey response reflecting a higher level of understanding/experience is shown on the map above.
Question 6 ‐ How much involvement have you had specifically on developing land use and socioeconomic data forecasts for Comprehensive Transportation Plans? If you have had different levels of involvement on different plans, please choose the option that represents your highest level of involvement.
None, 5
Basic, 7
Intermediate, 2
Advanced, 4
Expert, 0No Response, 1
None
Intermediate
Advanced
MPO Areas (outside RPOs)
No Response from RPO
Basic
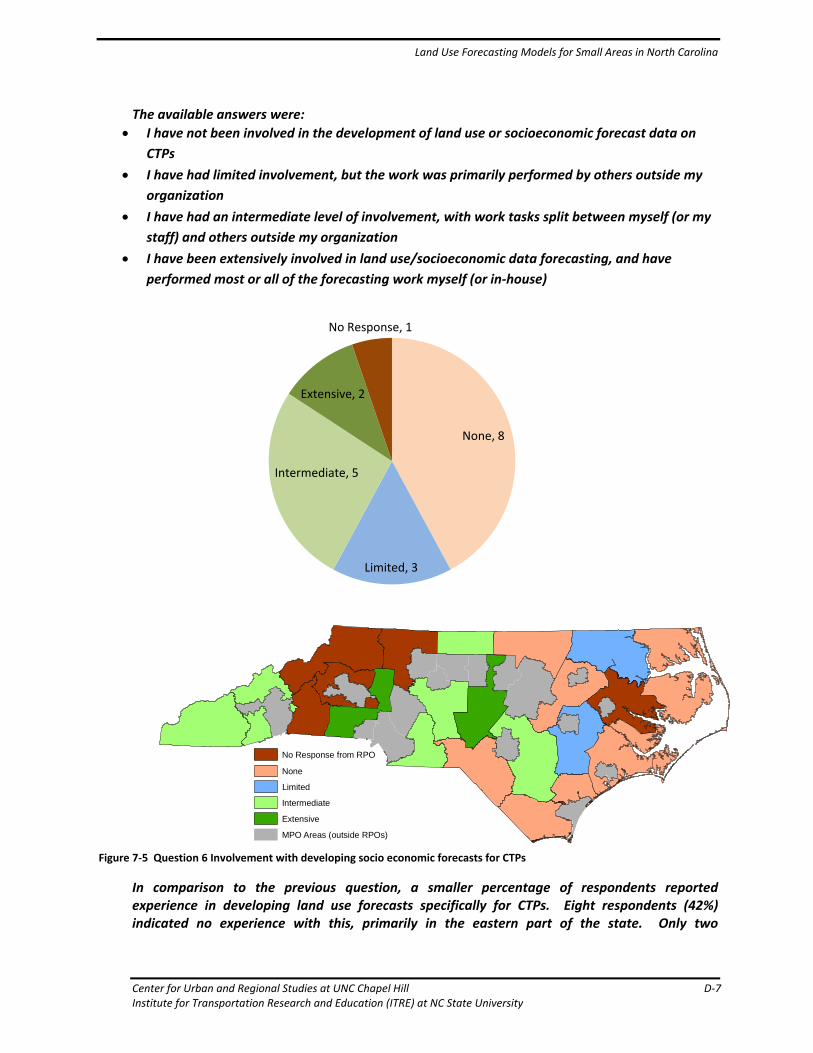
Land Use Forecasting Models for Small Areas in North Carolina
Center for Urban and Regional Studies at UNC Chapel Hill D‐7 Institute for Transportation Research and Education (ITRE) at NC State University
The available answers were:
I have not been involved in the development of land use or socioeconomic forecast data on
CTPs
I have had limited involvement, but the work was primarily performed by others outside my
organization
I have had an intermediate level of involvement, with work tasks split between myself (or my
staff) and others outside my organization
I have been extensively involved in land use/socioeconomic data forecasting, and have
performed most or all of the forecasting work myself (or in‐house)
Figure 7‐5 Question 6 Involvement with developing socio economic forecasts for CTPs
In comparison to the previous question, a smaller percentage of respondents reported experience in developing land use forecasts specifically for CTPs. Eight respondents (42%) indicated no experience with this, primarily in the eastern part of the state. Only two
None, 8
Limited, 3
Intermediate, 5
Extensive, 2
No Response, 1
None
Intermediate
Extensive
MPO Areas (outside RPOs)
No Response from RPO
Limited
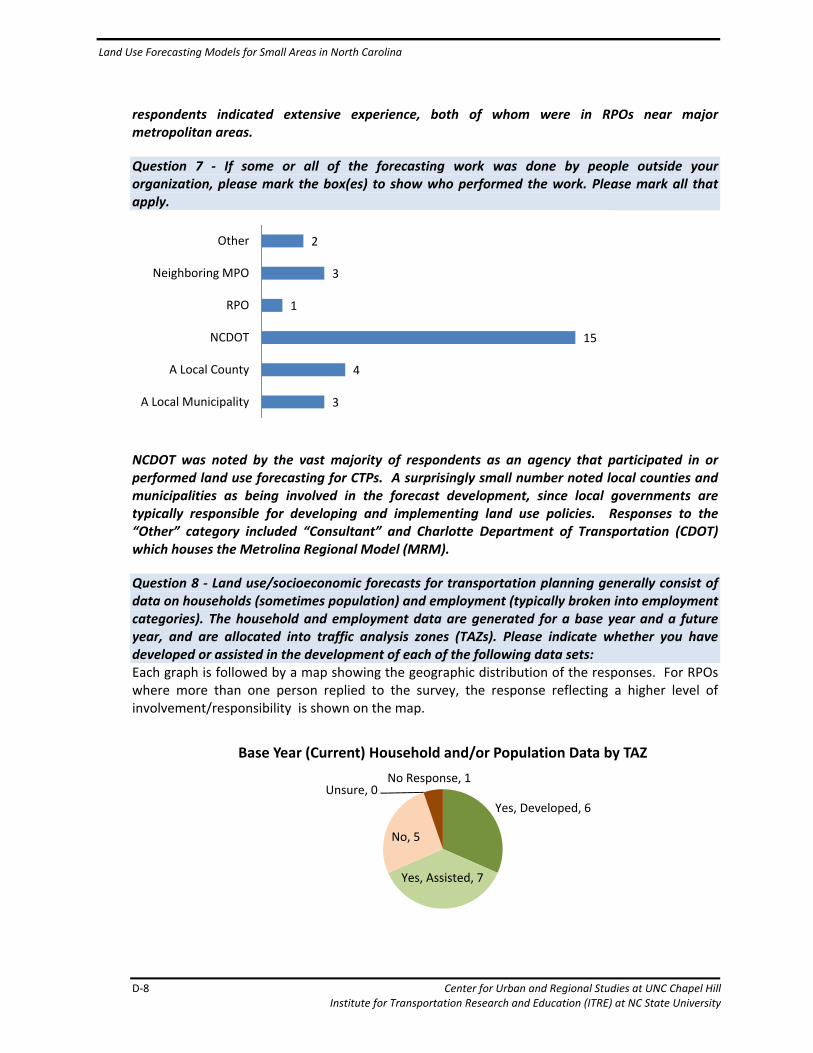
Land Use Forecasting Models for Small Areas in North Carolina
D‐8 Center for Urban and Regional Studies at UNC Chapel Hill Institute for Transportation Research and Education (ITRE) at NC State University
respondents indicated extensive experience, both of whom were in RPOs near major metropolitan areas.
Question 7 ‐ If some or all of the forecasting work was done by people outside your organization, please mark the box(es) to show who performed the work. Please mark all that apply.
NCDOT was noted by the vast majority of respondents as an agency that participated in or performed land use forecasting for CTPs. A surprisingly small number noted local counties and municipalities as being involved in the forecast development, since local governments are typically responsible for developing and implementing land use policies. Responses to the “Other” category included “Consultant” and Charlotte Department of Transportation (CDOT) which houses the Metrolina Regional Model (MRM).
Question 8 ‐ Land use/socioeconomic forecasts for transportation planning generally consist of data on households (sometimes population) and employment (typically broken into employment categories). The household and employment data are generated for a base year and a future year, and are allocated into traffic analysis zones (TAZs). Please indicate whether you have developed or assisted in the development of each of the following data sets: Each graph is followed by a map showing the geographic distribution of the responses. For RPOs where more than one person replied to the survey, the response reflecting a higher level of involvement/responsibility is shown on the map.
3
4
15
1
3
2
A Local Municipality
A Local County
NCDOT
RPO
Neighboring MPO
Other
Yes, Developed, 6
Yes, Assisted, 7
No, 5
Unsure, 0No Response, 1
Base Year (Current) Household and/or Population Data by TAZ
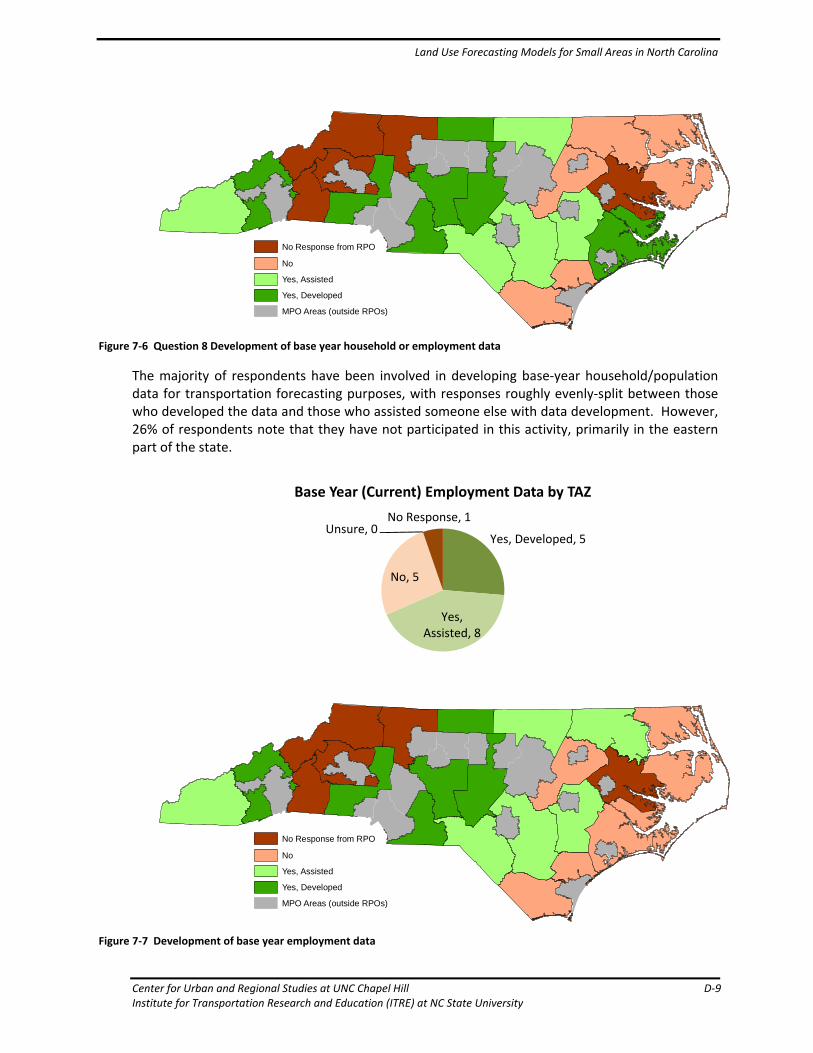
Land Use Forecasting Models for Small Areas in North Carolina
Center for Urban and Regional Studies at UNC Chapel Hill D‐9 Institute for Transportation Research and Education (ITRE) at NC State University
Figure 7‐6 Question 8 Development of base year household or employment data
The majority of respondents have been involved in developing base‐year household/population data for transportation forecasting purposes, with responses roughly evenly‐split between those who developed the data and those who assisted someone else with data development. However, 26% of respondents note that they have not participated in this activity, primarily in the eastern part of the state.
Figure 7‐7 Development of base year employment data
No
Yes, Assisted
Yes, Developed
MPO Areas (outside RPOs)
No Response from RPO
Yes, Developed, 5
Yes, Assisted, 8
No, 5
Unsure, 0No Response, 1
Base Year (Current) Employment Data by TAZ
No
Yes, Assisted
Yes, Developed
MPO Areas (outside RPOs)
No Response from RPO

Land Use Forecasting Models for Small Areas in North Carolina
D‐10 Center for Urban and Regional Studies at UNC Chapel Hill Institute for Transportation Research and Education (ITRE) at NC State University
The response to this item was very similar to the previous question, with the primary change being a shift to a slightly larger number of respondents stating they have ‘assisted’ in the development of this data, rather than developing the data themselves. Additionally, one respondent that reported no involvement in developing household data reported involvement with employment data, and one that reported involvement with household data reported no involvement with developing employment data.

Land Use Forecasting Models for Small Areas in North Carolina
Center for Urban and Regional Studies at UNC Chapel Hill D‐11 Institute for Transportation Research and Education (ITRE) at NC State University
Figure 7‐8 Development of future household and population data
The majority of respondents selected either ‘no’ or ‘unsure’ in response to this question. Of the eight respondents who stated experience with the development of household/population data forecasts, four stated they had developed this data and four stated they had assisted in data development. The respondents who have developed this type of data are all associated with RPOs adjacent to large metropolitan areas. It should be noted that the ‘unsure’ response came from an RPO that had two people respond to the survey—the second respondent noted that they had not been involved in developing this data, so that is how the answer has been recorded on the map.
Yes, Developed, 4
Yes, Assisted, 4No, 9
Unsure, 1
No Response, 1
Future Year (Forecast) Household and/or Population Data by TAZ
No/Unsure
Yes, Assisted
Yes, Developed
MPO Areas (outside RPOs)
No Response from RPO
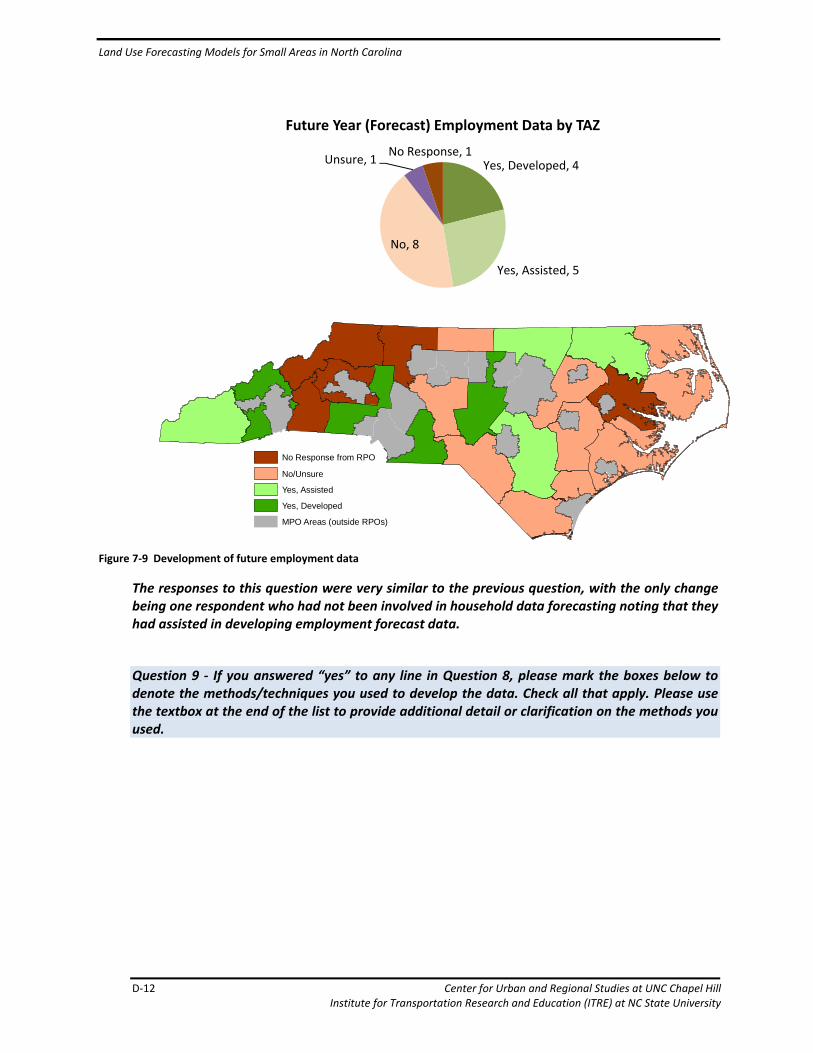
Land Use Forecasting Models for Small Areas in North Carolina
D‐12 Center for Urban and Regional Studies at UNC Chapel Hill Institute for Transportation Research and Education (ITRE) at NC State University
Figure 7‐9 Development of future employment data
The responses to this question were very similar to the previous question, with the only change being one respondent who had not been involved in household data forecasting noting that they had assisted in developing employment forecast data.
Question 9 ‐ If you answered “yes” to any line in Question 8, please mark the boxes below to denote the methods/techniques you used to develop the data. Check all that apply. Please use the textbox at the end of the list to provide additional detail or clarification on the methods you used.
Yes, Developed, 4
Yes, Assisted, 5
No, 8
Unsure, 1No Response, 1
Future Year (Forecast) Employment Data by TAZ
No/Unsure
Yes, Assisted
Yes, Developed
MPO Areas (outside RPOs)
No Response from RPO

Land Use Forecasting Models for Small Areas in North Carolina
Center for Urban and Regional Studies at UNC Chapel Hill D‐13 Institute for Transportation Research and Education (ITRE) at NC State University
Table 4 Question 9 Additional descriptive information provided by respondents
Analog regions‐‐looked at areas that were similar in the past to current forecast area that already developed‐‐e.g., Wake Forest as analog for Pittsboro
I worked on gathering base year data ‐ no forecasts.
Unsure, another staff person has worked with TAZs in the past.
MRM works with model team members on a monthly basis. Each mpo/rpo has a different methodology of collecting data for the MRM.
For Transylvania CTP (done when I worked at NCDOT), I used a variety of techniques. In particular, I had to use different techniques for the urban and rural parts of the county (based on differences in plans, potential for development, etc.)
Local knowledge is clearly the number one method used by the respondents in developing land use forecasts, with a majority of respondents noting that method as one that they use. The next highest‐selected methods were the use of local comprehensive plans and the development or use of control totals.
6
7
11
5
4
5
3
0 2 4 6 8 10 12
The development or use of control totals for futurepopulation and employment
Use of local comprehensive plan or land developmentplan to generate parcel‐ or zone‐level totals
Use of local knowledge to guide data development
The development of land use forecasts based on acontinuation of historic trends (trendline analysis)
Use of an analysis performed by an economist,demographer, or other outside expert (other than thecounty‐level projections typically provided by the
Census Bureau and State Data Center)
Use of a land suitability analysis to determine areas offuture growth (typically done using GIS)
Other. Please use the box below to describe.
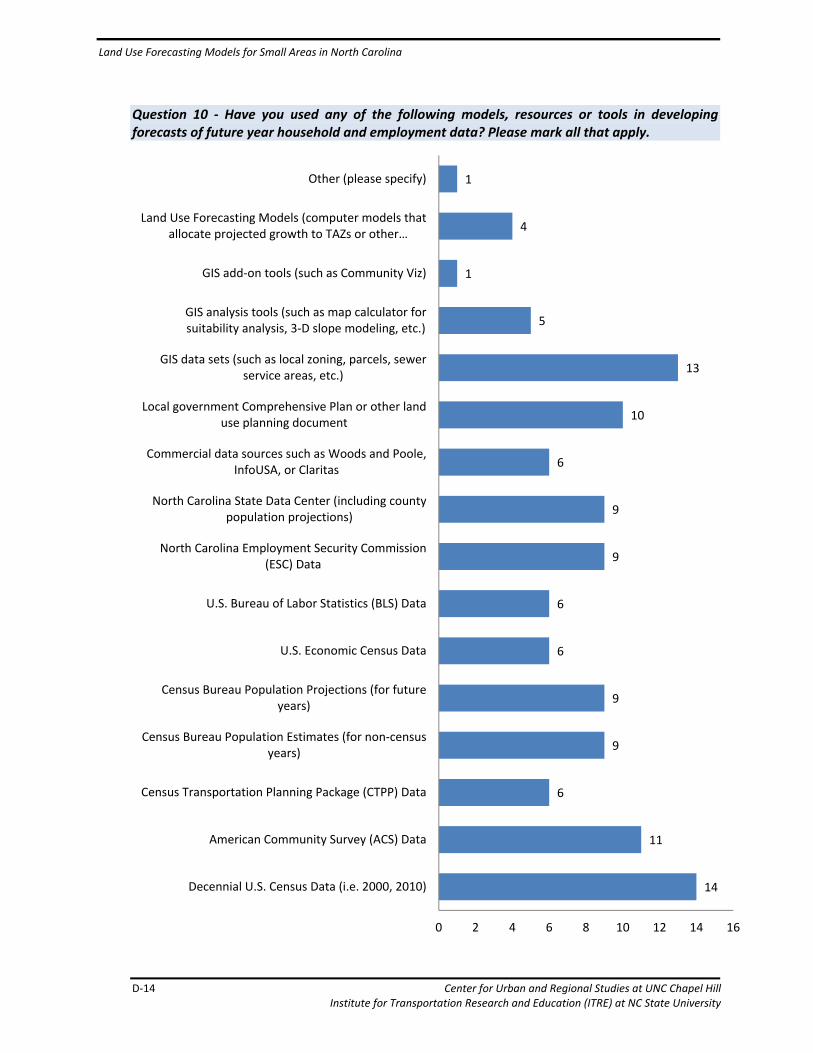
Land Use Forecasting Models for Small Areas in North Carolina
D‐14 Center for Urban and Regional Studies at UNC Chapel Hill Institute for Transportation Research and Education (ITRE) at NC State University
Question 10 ‐ Have you used any of the following models, resources or tools in developing forecasts of future year household and employment data? Please mark all that apply.
14
11
6
9
9
6
6
9
9
6
10
13
5
1
4
1
0 2 4 6 8 10 12 14 16
Decennial U.S. Census Data (i.e. 2000, 2010)
American Community Survey (ACS) Data
Census Transportation Planning Package (CTPP) Data
Census Bureau Population Estimates (for non‐censusyears)
Census Bureau Population Projections (for futureyears)
U.S. Economic Census Data
U.S. Bureau of Labor Statistics (BLS) Data
North Carolina Employment Security Commission(ESC) Data
North Carolina State Data Center (including countypopulation projections)
Commercial data sources such as Woods and Poole,InfoUSA, or Claritas
Local government Comprehensive Plan or other landuse planning document
GIS data sets (such as local zoning, parcels, sewerservice areas, etc.)
GIS analysis tools (such as map calculator forsuitability analysis, 3‐D slope modeling, etc.)
GIS add‐on tools (such as Community Viz)
Land Use Forecasting Models (computer models thatallocate projected growth to TAZs or other…
Other (please specify)

Land Use Forecasting Models for Small Areas in North Carolina
Center for Urban and Regional Studies at UNC Chapel Hill D‐15 Institute for Transportation Research and Education (ITRE) at NC State University
The four highest‐selected tools or resources used in developing forecasts are decennial census data, American Community Survey (ACS) data, GIS data sets, and local government comprehensive plans/land use planning documents. Each of these was selected by more than 50% of respondents as a tool or resource they had used. It should be noted that more advanced tools, such as land use forecasting models and GIS analysis or add‐on tools were selected by relatively few respondents, meaning there is relatively little experience with these types of tools at the RPOs currently. It should also be noted that one respondent reported use of a tool called LUSAM that was developed by the Charlotte DOT, which has been investigated and found to be specific to the Charlotte region, and therefore is not recommended for use in this study.
Question 11 ‐ Once land use/socioeconomic data are developed for a CTP, do you track or update the data in an ongoing way? The available answers were:
Yes, we have an ongoing method for tracking or updating the data
No, the data are developed as a ‘snapshot’ and would not be updated until another CTP is done
in the future
No, we do not develop or track this information
Figure 7‐10 Question 11 Do you track or update data?
Table 5 Question 11 If you selected “Yes” above, please briefly explain your update and/or tracking process
The FBRMPO updates their model every 5 years and includes the RPO regions for the SE Data portion of their LRTP update every 5 years.
Most of the RPO is located in the Metrolina Regional Travel Demand Model, and we are required to update the baseline every year, with new future year projections every four years.
MRM has a yearly update so everything gets updated, but Anson County does not because it is not in model... Just Union and Stanly
No basis upon which to formulate a response.
Yes, we track/
update, 3
No, the data are static, 9
No, we do not develop data, 5
No Response, 2

Land Use Forecasting Models for Small Areas in North Carolina
D‐16 Center for Urban and Regional Studies at UNC Chapel Hill Institute for Transportation Research and Education (ITRE) at NC State University
Only three respondents reported that they regularly update or track their land use forecasts. Of these, two noted that the land use data were updated annually as part of the regular update cycle for the Metrolina Regional Model (Charlotte region) and the other noted that the land use data were updated as part of the neighboring MPO’s Long Range Transportation Plan process every five years.
Question 12 ‐ On average, how much time/effort do you (or your staff) spend developing land use/socioeconomic data and forecasts for a CTP?
Figure 7‐11 How much time used to develop forecasts?
The majority of respondents report spending less than 40 hours on this task.
Question 13 ‐ In your experience, what forecasting methods/resources have worked best? Do different methods work better in different circumstances?
Table 6 Question 13 Full list of responses
Different in different circumstances.
I've never used different methods
It is better to use two or three methods. It can identify errors or trends. We often use historic growth rates combined with "share" of the overall county, when looking at sub‐county geographies.
I have personally done little.
Historic trends and current development have been our most successful method of anticipating what is to come.
Yearly updates are critical. Working with local staff and review building permits...
Simple methods are easier for policy level decision makers, elected officials
The simple trend line, which is easy to explain to the public with an allocation by consensus with local staff to TAZs.
It depends. When I did the SE forecast for Chapel Hill back in the early 2000s, we based it primarily on known development/redevelopment plans (with a few exceptions), because most of the land in the town's jurisdiction was already "built out". In Transylvania County I was able to
Less than 40 hours, 10
40‐80 hours, 0
80‐160 hours, 3
Greater than 160 hours, 2
No Response, 4
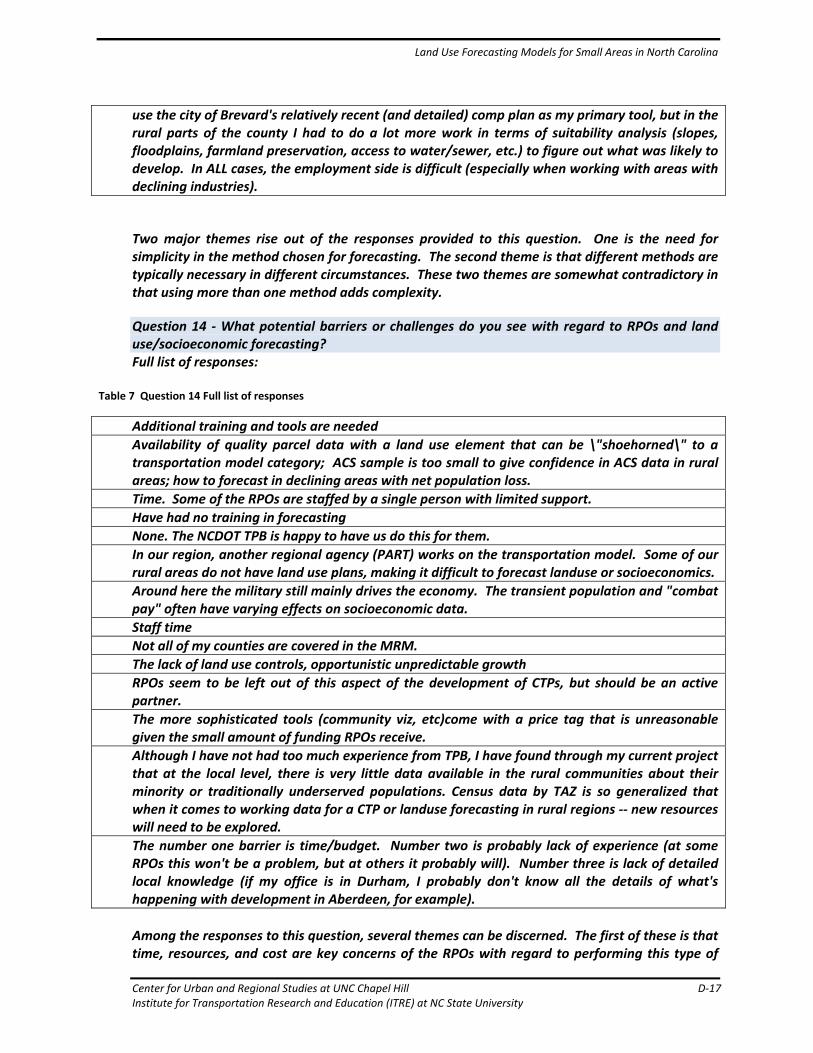
Land Use Forecasting Models for Small Areas in North Carolina
Center for Urban and Regional Studies at UNC Chapel Hill D‐17 Institute for Transportation Research and Education (ITRE) at NC State University
use the city of Brevard's relatively recent (and detailed) comp plan as my primary tool, but in the rural parts of the county I had to do a lot more work in terms of suitability analysis (slopes, floodplains, farmland preservation, access to water/sewer, etc.) to figure out what was likely to develop. In ALL cases, the employment side is difficult (especially when working with areas with declining industries).
Two major themes rise out of the responses provided to this question. One is the need for simplicity in the method chosen for forecasting. The second theme is that different methods are typically necessary in different circumstances. These two themes are somewhat contradictory in that using more than one method adds complexity.
Question 14 ‐ What potential barriers or challenges do you see with regard to RPOs and land use/socioeconomic forecasting? Full list of responses:
Table 7 Question 14 Full list of responses
Additional training and tools are needed
Availability of quality parcel data with a land use element that can be \"shoehorned\" to a transportation model category; ACS sample is too small to give confidence in ACS data in rural areas; how to forecast in declining areas with net population loss.
Time. Some of the RPOs are staffed by a single person with limited support.
Have had no training in forecasting
None. The NCDOT TPB is happy to have us do this for them.
In our region, another regional agency (PART) works on the transportation model. Some of our rural areas do not have land use plans, making it difficult to forecast landuse or socioeconomics.
Around here the military still mainly drives the economy. The transient population and "combat pay" often have varying effects on socioeconomic data.
Staff time
Not all of my counties are covered in the MRM.
The lack of land use controls, opportunistic unpredictable growth
RPOs seem to be left out of this aspect of the development of CTPs, but should be an active partner.
The more sophisticated tools (community viz, etc)come with a price tag that is unreasonable given the small amount of funding RPOs receive.
Although I have not had too much experience from TPB, I have found through my current project that at the local level, there is very little data available in the rural communities about their minority or traditionally underserved populations. Census data by TAZ is so generalized that when it comes to working data for a CTP or landuse forecasting in rural regions ‐‐ new resources will need to be explored.
The number one barrier is time/budget. Number two is probably lack of experience (at some RPOs this won't be a problem, but at others it probably will). Number three is lack of detailed local knowledge (if my office is in Durham, I probably don't know all the details of what's happening with development in Aberdeen, for example).
Among the responses to this question, several themes can be discerned. The first of these is that time, resources, and cost are key concerns of the RPOs with regard to performing this type of

Land Use Forecasting Models for Small Areas in North Carolina
D‐18 Center for Urban and Regional Studies at UNC Chapel Hill Institute for Transportation Research and Education (ITRE) at NC State University
work, particularly for the more sophisticated forecasting tools and methods. A second concern is the need for training of RPO staff on how to perform these tasks. A third primary barrier is the lack of adequate demographic and land use data, from both local and state/federal sources, and the lack of adequate land use planning and controls.
Question 15 ‐ Do you have any final thoughts or comments that may help the researchers understand the current state of land use/socioeconomic forecasting in rural areas of North Carolina?
Table 8 Question 15 Full list of responses
There are really 2 "rural" areas in NC: the "non‐metro" places like Wilson or Salisbury or Boone, and truly rural areas like Spruce Pine or Camden County. Approaching them with the same tools may not yield the best result.
We need more opportunities for input and training. When these are done by neighboring metropolitan areas, we are often not engaged or consulted.
We need more training and development on this. Also help making it mandatory for towns and counties to work with RPOs with land use plans
Just be sure to document methodology.
I think, in general more time would be needed than what I currently have to devote to the process.

Land Use Forecasting Models for Small Areas in North Carolina
Center for Urban and Regional Studies at UNC Chapel Hill E‐1 Institute for Transportation Research and Education (ITRE) at NC State University
Appendix E Survey Instrument

Land Use Forecasting Models for Small Areas in North Carolina
E‐2 Center for Urban and Regional Studies at UNC Chapel Hill Institute for Transportation Research and Education (ITRE) at NC State University
Land Use Forecasting Models for Small Areas in North Carolina
Center for Urban and Regional Studies at UNC Chapel Hill E‐3 Institute for Transportation Research and Education (ITRE) at NC State University

Land Use Forecasting Models for Small Areas in North Carolina
E‐4 Center for Urban and Regional Studies at UNC Chapel Hill Institute for Transportation Research and Education (ITRE) at NC State University
Land Use Forecasting Models for Small Areas in North Carolina
Center for Urban and Regional Studies at UNC Chapel Hill E‐5 Institute for Transportation Research and Education (ITRE) at NC State University

Land Use Forecasting Models for Small Areas in North Carolina
E‐6 Center for Urban and Regional Studies at UNC Chapel Hill Institute for Transportation Research and Education (ITRE) at NC State University