final report on the youth transition demonstration evaluation
TRANSCRIPT

Final Report on the Youth Transition Demonstration Evaluation
November 11, 2014
Thomas Fraker Arif Mamun Todd Honeycutt Allison Thompkins Erin Jacobs Valentine
Submitted to: Social Security Administration Office of Research, Demonstration, and Employment Support 500 E St., SW, Room 905 Washington, DC 20254 Project Officer: Joyanne Cobb Contract Number: SS00-05-60084
Submitted by: Mathematica Policy Research 1100 1st Street, NE 12th Floor Washington, DC 20002-4221 Telephone: (202) 484-9220 Facsimile: (202) 863-1763
Project Director: Thomas Fraker Reference Number: 06209.162

This page has been left blank for double-sided copying.

iii
ACKNOWLEDGMENTS
Many people contributed to the Youth Transition Demonstration (YTD) and its evaluation, which after nine years culminates with the publication of this final report. We thank all of those people for their contributions. We especially thank the 5,273 adolescents and young adults who enrolled in the evaluation and provided data about their lives through baseline and follow-up surveys. We also acknowledge the support of the staff at the Office of Research, Demonstrations, and Employment Support at the Social Security Administration, most notably the YTD project officers, Jamie Kendall and Joyanne Cobb, and their colleagues Christa Bucks Camacho, Steve Fear, and Jeffrey Hemmeter. Those individuals provided invaluable support and guidance to the demonstration and evaluation. The evaluation’s technical working group also provided guidance on both the design of the interventions and the evaluation. Its members were Harold Beebout, Michael Callahan, Nancye Campbell, Jessica Croner, Patti Hackett-Hunter, Alexandra Kielty, K. Charlie Lakin, Rebecca Maynard, Howard Rolston, Betsy Valnes, and Mary Wagner.
The staff of the six YTD projects that participated in the evaluation were dedicated to improving the lives of the youth they served. Without their willingness to subject their programs to rigorous evaluation, this study would not have been possible. We thank each of the project teams, led by the following directors and managers: William Ebenstein and Ashleigh Thompson at the City University of New York; Judy Emery and Peter Pike at Colorado WIN Partners, Susan Locke-Scott and David Bowens at the Erie 1 Board of Cooperative Educational Services, David Higgins and Marcela Vieira at the Florida regional office of ServiceSource, Larry Abramson and Kathy Bridgeman at Saint Luke’s House in Maryland, and Carolyn Feathers and Taylor Runner at the Human Resource Development Foundation in West Virginia.
Staff of TransCen, Inc., under the direction of Richard Luecking, provided excellent programmatic technical assistance to the YTD projects. The individuals who delivered that assistance or provided administrative and technical support for it were Kelli Crane, Jose´ Diaz, Amy Dwyre, Hyun Kim, Debra Martin Luecking, Marianne Mooney, Sara Murphy, Christy Stuart, George Tilson, and Dale Verstegen.
At MDRC, David Butler led an intensive recruitment and assessment effort that resulted in the selection of three additional YTD projects into the evaluation, joining three projects that had been operating at the outset of the study. John Martinez, also at MDRC, directed the process analysis component of the evaluation. His colleagues at MDRC who also worked on the evaluation in various capacities included Peter Baird, Alison Black, Howard Bloom, Joseph Broadus, Sally Dai, Melina Davis, Carolina Ferrerosa Young, Nicholas Gerry-Bullard, Jesse Handsher, Allen LeBlanc, Inho Lee, Michelle Manno, Lisa Matus-Grossman, Reanin McRoberts, and Sara Muller-Ravett.
At Mathematica, Anne Ciemnecki and Karen CyBulski directed the baseline and follow-up surveys of the evaluation enrollees. Under the direct supervision of Margie Rosa, telephone interviewers in Mathematica’s Princeton, NJ, survey operations center, augmented by field staff in the research sites, achieved outstanding response rates of 87 percent and 82 percent, respectively, for the 12-month and 36-month follow-up surveys. Kirsten Barrett, Anne Hower, Giuseppe Scaturro, Erin Slyne, and Hong Zhang provided programming support for the surveys.

FINAL REPORT ON THE YTD EVALUATION ACKNOWLEDGMENTS
iv
At Mathematica, Anu Rangarajan and Deborah Reed provided high-level support for the design and execution of the evaluation. Bonnie O’Day and David Wittenburg had oversight responsibilities for several of the YTD projects and conducted the process analysis of those projects, assisted by Laura Guy and Lauren Murphy. Christian DeSimone, Kate D’Anello, and Karen Katz managed the evaluation project, preparing monthly cost analyses and progress reports. Miki Sataki efficiently prepared the survey data for the impact analysis, while Cathy Lu and Frank Potter generated the survey nonresponse weights. Patsy Lloyd, Miriam Loewenberg, and Joel Smith helped process the SSA administrative data used in the evaluation. Lucy Lu and Carol Razafindrakoto provided programming support for various analyses. Maura Bardos, Brendan Kirwan, and Meghan O’Toole provided excellent research assistance. Patricia Guroff, Lesley Hildebrand, Laura Kosar, and Cherisse Sawyer prepared the evaluation’s data security plan and monitored its implementation. Molly and James Cameron edited the evaluation reports. Alfreda Holmes provided clerical support to the evaluation, including preparation of the final versions of the evaluation reports.

v
CONTENTS
ACRONYMS ............................................................................................................................................... xiii
EXECUTIVE SUMMARY ............................................................................................................................. xv
I INTRODUCTION .............................................................................................................................. 1
A. The YTD conceptual framework ................................................................................................ 2 B. The YTD evaluation ................................................................................................................... 6 C. The YTD projects ....................................................................................................................... 8 D. Research objectives for this report .......................................................................................... 10 E. Organization of this report ...................................................................................................... 11
II DATA SOURCES AND METHODS ............................................................................................... 13
A. Impact analysis ........................................................................................................................ 13 B. Cost analysis ........................................................................................................................... 22
III BRONX COUNTY, NEW YORK .................................................................................................... 25
A. Project overview ...................................................................................................................... 25 B. Baseline characteristics of the analytic sample ....................................................................... 26 C. Review of findings from the process analysis ......................................................................... 28 D. Review of impacts one year after enrollment .......................................................................... 29 E. Impacts three years after enrollment ....................................................................................... 31 F. Costs of providing services ...................................................................................................... 39 G. Summary and discussion of findings ....................................................................................... 41
IV COLORADO ................................................................................................................................... 43
A. Project overview ...................................................................................................................... 43 B. Baseline characteristics of the analytic sample ....................................................................... 44 C. Review of findings from the process analysis ......................................................................... 46 D. Review of impacts one year after enrollment .......................................................................... 48 E. Impacts three years after enrollment ....................................................................................... 49 F. Costs of providing services ...................................................................................................... 57 G. Summary and discussion of findings ....................................................................................... 59
V ERIE COUNTY, NEW YORK ......................................................................................................... 61
A. Project overview ...................................................................................................................... 61 B. Baseline characteristics of the analytic sample ....................................................................... 62 C. Review of findings from the process analysis ......................................................................... 64 D. Review of impacts one year after enrollment .......................................................................... 65 E. Impacts three years after enrollment ....................................................................................... 67 F. Cost of providing services ....................................................................................................... 76 G. Summary and discussion of findings ....................................................................................... 78
VI MIAMI-DADE COUNTY, FLORIDA ................................................................................................ 81
A. Project overview ...................................................................................................................... 81 B. Baseline characteristics of the analytic sample ....................................................................... 82 C. Review of findings from the process analysis ......................................................................... 84 D. Review of impacts one year after enrollment .......................................................................... 85 E. Impacts three years after enrollment ....................................................................................... 87 F. Costs of providing services ...................................................................................................... 95 G. Summary and discussion of findings ....................................................................................... 97

FINAL REPORT ON THE YTD EVALUATION CONTENTS
vi
VII MONTGOMERY COUNTY, MARYLAND ...................................................................................... 99
A. Project overview ...................................................................................................................... 99 B. Baseline characteristics of the analytic sample ..................................................................... 101 C. Review of findings from the process analysis ....................................................................... 102 D. Review of impacts one year after enrollment ........................................................................ 104 E. Impacts three years after enrollment ..................................................................................... 106 F. Costs of providing services .................................................................................................... 115 G. Summary and discussion of findings ..................................................................................... 116
VIII WEST VIRGINIA .......................................................................................................................... 119
A. Project overview .................................................................................................................... 119 B. Baseline characteristics of the analytic sample ..................................................................... 120 C. Review of findings from the process analysis ....................................................................... 122 D. Review of impacts one year after enrollment ........................................................................ 124 E. Impacts three years after enrollment ..................................................................................... 126 F. Costs of providing services .................................................................................................... 134 G. Summary and discussion of findings ..................................................................................... 136
IX SUMMARY AND CONCLUSIONS ............................................................................................... 137
A. Phased entry of projects into the evaluation ......................................................................... 137 B. Summary of the evaluation findings ...................................................................................... 138 C. Discussion of the evaluation findings .................................................................................... 143 D. Limitations of the evaluation .................................................................................................. 144 E. Implications for policy and practice ....................................................................................... 145 F. Lessons for future evaluations............................................................................................... 146
REFERENCES .......................................................................................................................................... 149
APPENDIX A: ADDITIONAL ANALYSES AND TECHNICAL DISCUSSION .......................................... A.1
A. Baseline characteristics of the analytic samples .................................................................... A.3 B. Comparison of unadjusted means and regression-adjusted means ...................................... A.3 C. Non-response to the 36-month follow-up survey and survey weights.................................... A.5 D. Missing data on control variables and outcome measures .................................................... A.5 E. Impact estimates for subgroups ............................................................................................. A.6
APPENDIX B: THE SSA WAIVERS FOR YTD ....................................................................................... B.1

vii
TABLES
ES.1 The six projects in the YTD random assignment evaluation ........................................................... xv
ES.2 Qualitative summary of year-three impacts of YTD projects ......................................................... xix
ES.3 The cost per participant of the YTD projects ................................................................................. xxi
I.1 Overview of the projects in the YTD random assignment evaluation .............................................. 9
II.1 Outcome measures for the YTD three-year impact analysis, by domain ...................................... 15
II.2 YTD sample sizes and 36-month survey response rates, by site .................................................. 18
III.1 Bronx Co., NY: baseline characteristics of the analytic sample .................................................... 27
III.2 Bronx Co., NY: one-year impacts on service receipt and selected outcome measures ............... 30
III.3 Bronx Co., NY: three-year impacts on employment and earnings ............................................... 33
III.4 Bronx Co., NY: three-year impacts on youth income .................................................................... 34
III.5 Bronx Co., NY: three-year impacts on productive activities .......................................................... 36
III.6 Bronx Co., NY: three-year impacts on contact with the justice system ........................................ 37
III.7 Bronx Co., NY: three-year impacts on self-determination ............................................................. 39
III.8 Bronx Co., NY: project costs in the cost accounting period, by program component ................... 41
III.9 Bronx Co., NY: average project cost per participant ...................................................................... 41
IV.1 Colorado: baseline characteristics of the analytic sample ............................................................ 45
IV.2 Colorado: one-year impacts on service receipt and selected outcome measures ....................... 49
IV.3 Colorado: three-year impacts on employment and earnings ........................................................ 51
IV.4 Colorado: three-year impacts on youth income ............................................................................ 52
IV.5 Colorado: three-year impacts on productive activities .................................................................. 54
IV.6 Colorado: three-year impacts on contact with the justice system ................................................. 55
IV.7 Colorado: three-year impacts on self-determination ...................................................................... 57
IV.8 Colorado: project costs in the cost accounting period, by program component ................................. 58
IV.9 Colorado: average project cost per participant .............................................................................. 59
V.1 Erie Co., NY: baseline characteristics of the analytic sample ....................................................... 63
V.2 Erie Co., NY: one-year impacts on service receipt and selected outcome measures .................. 67
V.3 Erie Co., NY: three-year impacts on employment and earnings .................................................. 69
V.4 Erie Co., NY: three-year impacts on youth income ....................................................................... 71
V.5 Erie Co., NY: three-year impacts on productive activities ............................................................. 72
V.6 Erie Co., NY: three-year impacts on contact with the justice system ........................................... 74

FINAL REPORT ON THE YTD EVALUATION TABLES
viii
V.7 Erie Co., NY: three-year impacts on self-determination ................................................................ 76
V.8 Erie Co., NY: project costs in the cost accounting period, by program component ...................... 77
V.9 Erie Co., NY: average project cost per participant ......................................................................... 78
VI.1 Miami-Dade Co., FL: baseline characteristics of the analytic sample .......................................... 83
VI.2 Miami-Dade Co., FL: one-year impacts on service receipt and selected outcome measures ...................................................................................................................................... 87
VI.3 Miami-Dade Co., FL: three-year impacts on employment and earnings ...................................... 89
VI.4 Miami-Dade Co., FL: three-year impacts on youth income .......................................................... 91
VI.5 Miami-Dade Co., FL: three-year impacts on productive activities ................................................ 92
VI.6 Miami-Dade Co., FL: three-year impacts on contact with the justice system ............................... 93
VI.7 Miami-Dade Co., FL: three-year impacts on self-determination .................................................... 95
VI.8 Miami-Dade Co., FL: project costs in the cost accounting period, by program component .......... 97
VI.9 Miami-Dade Co., FL: average project cost per participant ............................................................ 97
VII.1 Montgomery Co., MD: baseline characteristics of the analytic sample ...................................... 102
VII.2 Montgomery Co., MD: one-year impacts on service receipt and selected outcome measures .................................................................................................................................... 105
VII.3 Montgomery Co., MD: three-year impacts on employment and earnings .................................. 107
VII.4 Montgomery Co., MD: three-year impacts on youth income ...................................................... 110
VII.5 Montgomery Co., MD: three-year impacts on productive activities ............................................ 111
VII.6 Montgomery Co., MD: three-year impacts on contact with the justice system ........................... 112
VII.7 Montgomery Co., MD: three-year impacts on self-determination ................................................ 114
VII.8 Montgomery Co., MD: project costs in the cost accounting period, by program component ...... 116
VII.9 Montgomery Co., MD: average project cost per participant ........................................................ 117
VIII.1 West Virginia: baseline characteristics of the analytic sample ................................................... 121
VIII.2 West Virginia: one-year impacts on service receipt and selected outcome measures .............. 125
VIII.3 West Virginia: three-year impacts on employment and earnings ............................................... 127
VIII.4 West Virginia: three-year impacts on youth income ................................................................... 129
VIII.5 West Virginia: three-year impacts on productive activities ......................................................... 130
VIII.6 West Virginia: three-year impacts on contact with the justice system ........................................ 132
VIII.7 West Virginia: three-year impacts on self-determination ............................................................. 133
VIII.8 West Virginia: project costs in the cost accounting period, by program component ................... 135
VIII.9 West Virginia: average project cost per participant ..................................................................... 135

FINAL REPORT ON THE YTD EVALUATION TABLES
ix
IX.1 Intensity of services for YTD participants in Phase 1 projects ..................................................... 138
IX.2 Intensity of services for YTD participants in Phase 2 projects ..................................................... 139
IX.3 Qualitative summary of year-three impacts of Phase 1 YTD projects ......................................... 139
IX.4 Qualitative summary of year-three impacts of Phase 2 YTD projects ......................................... 141
APPENDIX TABLES
A.1a Bronx Co., NY: baseline characteristics of the analytic sample ................................................... A.8
A.1b Colorado: baseline characteristics of the analytic sample ......................................................... A.10
A.1c Erie Co., NY: baseline characteristics of the analytic sample .................................................... A.12
A.1d Miami-Dade Co., FL: baseline characteristics of the analytic sample ....................................... A.14
A.1e Montgomery Co., MD: baseline characteristics of the analytic sample ..................................... A.16
A.1f West Virginia: baseline characteristics of the analytic sample .................................................. A.18
A.2 Control variables for regression-adjusted analysis of impacts.................................................... A.20
A.3a Bronx Co., NY: Descriptive statistics on outcomes by treatment status and unadjusted impacts ....................................................................................................................................... A.21
A.3b Colorado: Descriptive statistics on outcomes by treatment status and unadjusted impacts ..... A.24
A.3c Erie Co., NY: Descriptive statistics on outcomes by treatment status and unadjusted impacts ....................................................................................................................................... A.27
A.3d Miami-Dade Co., FL: Descriptive statistics on outcomes by treatment status and unadjusted impacts .................................................................................................................... A.30
A.3e Montgomery Co., MD: Descriptive statistics on outcomes by treatment status and unadjusted impacts .................................................................................................................... A.33
A.3f West Virginia: Descriptive statistics on outcomes by treatment status and unadjusted impacts ....................................................................................................................................... A.36
A.4 Difference in unadjusted means vs. difference in regression-adjusted means for primary outcomes .................................................................................................................................... A.39
A.5a Bronx Co., NY: baseline characteristics of respondents and non-respondents to the 36-month survey .............................................................................................................................. A.41
A.5b Colorado: baseline characteristics of respondents and non-respondents to the baseline survey ......................................................................................................................................... A.43
A.5c Erie Co., NY: baseline characteristics of respondents and non-respondents to the 36-month survey .............................................................................................................................. A.45
A.5d Miami-Dade Co., FL: baseline characteristics of respondents and non-respondents to the 36-month survey ........................................................................................................................ A.47
A.5e Montgomery Co., MD: baseline characteristics for respondents and non-respondents to the 36-month survey .................................................................................................................. A.49

FINAL REPORT ON THE YTD EVALUATION TABLES
x
A.5f West Virginia: baseline characteristics of respondents and non-respondents to the 36-month survey .............................................................................................................................. A.51
A.6 Impacts on outcomes measured from administrative records, 36-month survey respondent sample and full research sample ............................................................................ A.53
A.7a Bronx Co., NY: Impacts on primary outcomes, by subgroup ..................................................... A.56
A.7b Colorado: Impacts on primary outcomes, by subgroup ............................................................. A.58
A.7c Erie Co., NY: Impacts on primary outcomes, by subgroup ........................................................ A.60
A.7d Miami-Dade Co., FL: Impacts on primary outcomes, by subgroup ........................................... A.62
A.7e Montgomery Co., MD: Impacts on primary outcomes, by subgroup ......................................... A.64
A.7f West Virginia: Impacts on primary outcomes, by subgroup ....................................................... A.66

xi
FIGURES
ES.1 Conceptual framework for SSA's YTD projects ............................................................................. xvi
I.1 Conceptual framework for SSA’s YTD projects ............................................................................... 5

xii
This page has been left blank for double-sided copying.

xiii
ACRONYMS
ARRA American Recovery and Reinvestment Act of 2009
BHBF Broadened Horizons, Brighter Futures
BLS Bureau of Labor Statistics
BOCES (Erie 1) Board of Cooperative Educational Services
CDB Childhood Disability Benefits
CDR Continuing Disability Review
CED Center for Excellence in Disabilities
CEO Community Employment Office
CTP Career Transition Program
CUNY City University of New York
CWP Colorado WIN Partners
DAF Disability Analysis File
DI Social Security Disability Insurance
EIE Earned Income Exclusion
ETO Efforts to Outcomes
GED General Educational Development
HRDF Human Resource Development Foundation
HSC Human Services Coalition
IDA Individual Development Account
IEP Individualized Education Program
IRS Internal Revenue Service
LEADS Linking Employment, Academics, and Disability Services
MCPS Montgomery County (Maryland) Public Schools
NASET National Alliance for Secondary Education and Transition
NCWD/Y National Collaborative on Workforce and Disability for Youth
NDI National Disability Institute
NLS Neighborhood Legal Services
OLS Ordinary Least Squares
PASS Plan for Achieving Self-Support
SEIE Student Earned Income Exclusion
SLH St. Luke’s House
FINAL REPORT ON THE YTD EVALUATION ACRONYMS
xiv
SNAP Supplemental Nutrition Assistance Program
SSA Social Security Administration
SSI Supplemental Security Income
TANF Temporary Assistance for Needy Families
TETD Transitional Employment Training Demonstration
WIB Workforce Investment Board
WIPA Work Incentives Planning and Assistance
YTD Youth Transition Demonstration
YTDP Youth Transition Demonstration Project

xv
EXECUTIVE SUMMARY
Youth with disabilities often have particularly difficult transitions to adulthood. In addition to the issues facing all transition-age youth, those with disabilities face special challenges related to health, social isolation, service needs, and the potential loss of benefits (Osgood, Foster, and Courtney 2010). These complicate their planning for education and work, which may result in poor education and employment outcomes and a possible lifetime of dependence on benefits (Davies, Rupp, and Wittenburg 2009). Cash assistance provided to these youth through the Supplemental Security Income (SSI) and Social Security Disability Insurance (DI) programs, administered by the Social Security Administration (SSA), has increased by 55 percent since 2000. Benefits totaled more than $10 billion in 2012, leading to growing concerns about costs.
Recognizing the importance of helping young people with disabilities achieve their full economic potential at this critical juncture in their lives, SSA undertook the Youth Transition Demonstration (YTD) evaluation. The purpose of the evaluation was to identify and test the most promising service strategies, combined with SSA waivers of certain program rules to enhance work incentives, for helping youth with disabilities maximize their economic self-sufficiency as they transition to adulthood. SSA selected six project sites into the evaluation based on their adoption of promising strategies to support youth with disabilities and on their capacity and willingness to support evaluation activities. These projects are identified in Table ES.1. The target population for YTD was youth ages 14 to 25 who were receiving SSA disability benefits or were at high risk of receiving such benefits in the future.
Table ES.1. The six projects in the YTD random assignment evaluation
Location Project name Enrollment start date
Project end date
Number of youth in research
sample
Bronx Co., NY Youth Transition Demonstration Project 8/2006 9/2010 884 Colorado (4 counties) Colorado Youth WINS 8/2006 1/2010 842 Erie Co., NY Transition WORKS 1/2007 12/2009 827 Miami-Dade Co., FL Broadened Horizons, Brighter Futures 4/2008 3/2012 840 Montgomery Co., MD Career Transition Program 4/2008 3/2012 798 West Virginia (19 counties) West Virginia Youth Works 4/2008 3/2012 842
Under contract to SSA, Mathematica Policy Research conducted a rigorous evaluation of the YTD projects using a random assignment evaluation design. Across the six project sites, more than 5,000 youth enrolled in the evaluation and were randomly assigned to either a treatment group that could participate in the YTD projects or a control group that could not. Mathematica and its partners in the evaluation conducted site-specific analysis to assess the impacts of the interventions one year and three years after youth enrolled in the evaluation. The one-year analysis found that all six projects had positive and statistically significant impacts on the receipt of employment-promoting services by youth, but only three projects had positive impacts on employment (Fraker et al. 2011a-c and 2012a-c). In this report, we present estimates of the impacts of the YTD projects on paid employment and earnings, total income from earnings and benefits, participation in productive activities, contact with the justice system, and self-determination. We also present estimates of each project’s average cost per participant.

FINAL REPORT ON THE YTD EVALUATION EXECUTIVE SUMMARY
xvi
A. The YTD program model
The YTD program model was informed by a conceptual framework for the evaluation (Figure ES.1), which was based on promising lessons on what works in promoting successful transitions for youth with disabilities. The transitions to adulthood made by youth with disabilities are shaped by their personal characteristics and their social, educational, and employment environments. However, several barriers may inhibit those transitions. The YTD program model was designed to address the barriers, working within the environment of each demonstration site to enhance the transition efforts of youth, thereby allowing them to achieve improved outcomes in both the short term and longer term.
Because SSA wanted to test a program model that was grounded in best practices, the model was based on Guideposts for Success, a handbook developed by the National Collaborative on Workforce and Disability for Youth (2005 and 2009). Guideposts was informed by an extensive review of research, demonstration projects, and best practices in promoting successful transitions to adult life by youth with disabilities. Guideposts identifies five components of effective transition programs: school-based preparatory services, career preparation and work-based learning experiences, youth development and leadership, connecting activities, and family involvement and supports.
Figure ES.1. Conceptual framework for SSA’s YTD projects
Short Term Employment-promoting activities
Paid employment
Total income from earnings and benefits
Attitudes and expectations
Education
Longer Term Paid employment and earnings Total income from earnings and benefits Engagement in productive activities Reduced contact with the justice system Self-determination
Key Outcomes
Transition Efforts by
Youth
Transition Environment • Youth characteristics and assets • Schools, special education,
postsecondary education, and training • VR, TTW, and WIA programs • Mental health and MR/DD systems • SSA disability benefit programs • Health care delivery & financing systems • Community-based service providers • Employers and economic climate
YTD Intervention Components • Individualized work-based
experiences • Youth empowerment • Family supports • System linkages • Social and health services • SSA waivers to encourage work • Benefits counseling
Barriers • Low expectations for working and self-
sufficiency • Lack of access to employment services
and work-based experiences • Uncoordinated handoff to adult services • Inadequate access to social and health
services • Financial disincentives to work • Lack of knowledge about how benefits
change when a person works

FINAL REPORT ON THE YTD EVALUATION EXECUTIVE SUMMARY
xvii
The YTD program model included the components identified in Guideposts, although these were adapted and expanded to better meet the needs of the YTD target population (Luecking and Wittenburg 2009). Foremost among the components were work-based experiences. These included worksite tours; volunteer work; subsidized jobs; and most notably, competitive paid employment in integrated settings, where people with disabilities work alongside able-bodied individuals. A youth empowerment component enabled youth to acquire the skills and knowledge they needed to chart their own courses and advocate for themselves. YTD fostered empowerment by engaging youth in intensive planning that focused on education, employment, health care, and independent living. Family supports included family-focused training activities, support for parent networking, and the provision of transition-related information. YTD also facilitated system linkages, or the connections with service providers that youth may need to access health care, education programs, transportation, and accommodations and assistive technologies for education and employment. SSA’s waivers for YTD—and the benefits counseling that youth needed to understand the waivers—were also central to the model.
Another noteworthy feature of YTD was the intensive technical assistance that was provided to projects under the evaluation contract. As a subcontractor to Mathematica, TransCen, Inc., a leading organization in the design and implementation of employment programs for youth with disabilities, delivered technical assistance focused on helping project staff network with employers to identify competitive paid jobs and match youth with appropriate jobs.
B. Phased entry of projects into the evaluation
Projects entered the YTD random assignment evaluation in two phases spaced several years apart. There were systematic differences between the phases in how the projects were implemented and their impacts on youth. The first group of three projects (the Phase 1 projects) entered the evaluation in 2006-7. SSA selected these from among seven projects that it had been funding through cooperative agreements since 2003. The second group of three projects (the Phase 2 projects) entered the evaluation in 2008. SSA selected these from among five pilot projects that it had funded in 2007 through its contract with Mathematica. From their inception, the Phase 2 projects had formal relationships with the Mathematica-led evaluation and technical assistance team, whereas the Phase 1 projects had been operating for several years prior to SSA’s awarding of the YTD evaluation contract to Mathematica in 2005. This affected the projects’ receptiveness to technical assistance; broadly speaking, the Phase 2 projects were more receptive and responsive to technical assistance from the Mathematica-led team than were the Phase 1 projects. Also, the Phase 2 projects benefited from refinements to technical assistance that were made based on the experiences of the Phase 1 projects and the interim evaluation findings for those projects.
Findings from the evaluation’s process analysis, presented in a series of project-specific interim reports (Fraker et al. 2011a-c and 2012a-c), show that the Phase 2 projects delivered more hours of services and services that were more sharply focused on employment than did the Phase 1 projects. The average amount of all services received by participants in the Phase 1 projects was high in the Bronx (43 hours) but low in Colorado and Erie County (7 and 13 hours, respectively). Only about half of the Colorado participants received employment services, such as assistance in preparing resumes and placement in paid jobs. Among the participants in the Phase 1 projects who did receive employment services, the average number of hours of those services was 21 in the Bronx but just 4 and 6, respectively, in Colorado and Erie County. In

FINAL REPORT ON THE YTD EVALUATION EXECUTIVE SUMMARY
xviii
contrast, the average amount of all services received by participants in the Phase 2 projects was consistently high—about 30 hours. Virtually all of the participants in those projects received employment services and the average number of hours of those services per participant was higher than for two of the three Phase 1 projects: 14 in Miami-Dade County, 10 in Montgomery County, and 24 in West Virginia.
From the outset of the evaluation, the technical assistance that was provided to the YTD projects was geared toward the achievement of desirable employment outcomes by project participants. However, the process analysis of the Phase 1 projects revealed a need to sharpen the focus of the technical assistance on services directly linked to paid employment and also to closely monitor both the delivery of those services and the outcomes achieved by participants. Technical assistance for the Phase 2 projects was adjusted accordingly. The adjustments were designed to help the Phase 2 projects focus more closely on connecting youth with competitive paid jobs and thus better fulfill the goals of the YTD initiative.
C. Findings from the three-year impact analysis
The YTD evaluation’s three-year impact analysis examined each project’s impacts on youth outcomes in five domains: (1) paid employment and earnings, (2) youth income, (3) participation in productive activities, (4) contact with the justice system, and (5) self-determination. Table ES.2 provides a qualitative summary of the findings from that analysis. Within each domain, our principal findings are based on estimated impacts on one or two primary outcome measures. The most notable of our findings from the three-year impact analysis are discussed below.
1. Findings for the Phase 1 projects The Phase 1 YTD projects had few statistically significant year-three impacts on the primary
outcomes in the evaluation’s five domains. The Colorado project had no statistically significant desirable impacts, whereas the projects in the Bronx and Erie County had two each.
Bronx County. Despite having no impacts on employment or earnings during the third year after youth enrolled in the evaluation, the YTD project in the Bronx had a statistically significant positive impact on the total income received by youth during that year. This impact was a product of the project’s positive impact on disability benefit amounts, which we attribute to SSA’s Section 301 waiver for YTD (which delayed the effectuation of a negative age-18 disability determination), combined with the project’s counseling of youth and parents on benefits, work incentives, and waivers. The Bronx County project also had a statistically significant impact on the primary outcome in the domain of contact with the justice system; it reduced the share of youth who had been arrested or charged with delinquency or a criminal complaint during the third year following enrollment. The design for the YTD evaluation cannot support a determination of which components of the intervention were responsible for this impact; however, we speculate that workshops for parents may have contributed to it by improving their parenting and advocacy skills. The intervention’s positive impact on youth total income may also have been a factor.
Colorado. Given the low intensity of services provided by the Colorado YTD project, it is not surprising that it had no statistically significant desirable impacts on the evaluation’s primary

FINAL REPORT ON THE YTD EVALUATION EXECUTIVE SUMMARY
xix
Table ES.2. Qualitative summary of year-three impacts of YTD projects
Phase 1 Projects Phase 2 projects
Outcome measure Bronx Co.,
NY Colorado Erie
Co., NY Miami-Dade
Co., FL Montgomery
Co., MD West
Virginia
Domain: paid employment and earnings
• Primary outcome: had a paid job 0 0 + + - + + 0 0
• Primary outcome: annual earnings 0 0 0 - + + + + 0
Had a paid job based on IRS recordsa 0 0 0 - + 0 +
Annual earnings based on IRS recordsa 0 0 0 - 0 0 0
Domain: youth income
• Primary outcome: total income + + + 0 + + + - + + + + + + + +
Total amount of disability benefitsa + + + 0 + + - + + + 0 + + +
Domain: participation in productive activities
• Primary outcome: participated in any employment, education, or training
0 0 0 -
+ + 0 + +
Participated in any education or training 0 0 0 - 0 0 +
Domain: contact with the justice system
• Primary outcome: arrested or charged with delinquency/criminal complaint
– – + 0
-
– – 0 0
Domain: self-determination
• Primary outcome: index of self-determination
0 0 0 -
0 0 0
Sources: YTD 36-month survey and SSA administrative records. Notes: This table provides a qualitative summary of regression-adjusted impact estimates. We measured the explanatory variables in the
regression models before youth enrolled in the evaluation by using data from the evaluation’s baseline survey and SSA administrative files. The actual quantitative impact estimates can be found in Chapters III-VIII of this report.
a The analysis of these measures was based on data for all youth in the research sample (not just those who responded to the 36-month survey, as is the case for the other measures), less those who were identified as deceased at the time of the 36-month survey. +/+ +/+ + + Impact estimate is positive and statistically significant at the .10/.05/.01 level using a two-tailed t-test. –/– –/– – – Impact estimate is negative and statistically significant at the .10/.05/.01 level using a two-tailed t-test. 0 Impact estimate is not statistically different from zero at the .10 level using a two-tailed t-test.
outcomes in the third year after youth enrolled in the evaluation. The project did have a significant undesirable impact on one primary outcome; it increased the share of youth who had been arrested or charged with delinquency or a criminal complaint during the third post- enrollment year. Unfortunately, findings from the process analysis provide no insight into what components of the Colorado project may have been responsible for this impact.
Erie County. The Erie County YTD project had positive and statistically significant impacts on the share of youth who were employed for pay during the third year following enrollment in the evaluation and on their total income. These impacts are surprising because the project provided participants with few hours of services and had no significant impacts on employment and income during the first year following enrollment (Fraker et al. 2011a). Given the small dose of services, we speculate that SSA’s waivers for YTD may have contributed to the year-three impacts.

FINAL REPORT ON THE YTD EVALUATION EXECUTIVE SUMMARY
xx
2. Findings for Phase 2 projects Consistent with the generally greater intensity of services that they provided to participating
youth, the Phase 2 projects overall had more statistically significant impacts on primary outcomes for youth during the third year after they enrolled in the evaluation than did the Phase 1 projects. The project in Miami-Dade County had significant impacts in desirable directions on five of the evaluation’s six primary outcomes, whereas the projects in West Virginia and Montgomery County had significant and desirable impacts on two primary outcomes (Table ES.2). All of these projects had significant positive impacts on at least one of the two primary outcomes in the domain of paid employment and earnings and on youth total income.
Miami-Dade County. The YTD project in Miami-Dade County had statistically significant impacts in desirable directions on outcomes in all domains of the evaluation except self-determination. It had significant positive impacts on paid employment and earnings during the third year after youth enrolled in the evaluation, which contributed in turn to positive and significant impacts on youth total income and participation in productive activities. Notably, the project had a significant negative impact on youth contact with the justice system during the third year following enrollment. The intervention did not include services that were explicitly designed to produce this result, which may have been a by-product of greater participation in productive activities by treatment group youth and their higher total income relative to youth in the control group.
Montgomery County. Although the Montgomery County YTD project had no impact on paid employment during the third year following enrollment, it did have positive and statistically significant impacts on earnings and, consequently, youth total income. The impact on earnings was driven by a significant positive impact on the number of hours that youth worked during the year (result not shown in the table). On the whole, the youth who enrolled in the evaluation in Montgomery County did not need YTD services to find jobs, but those services did help them to work more hours and achieve higher earnings.
West Virginia. The West Virginia YTD project had a statistically significant positive impact during the third post-enrollment year on a measure of paid employment based on data from IRS records, but not on a measure based on data from the evaluation’s follow-up survey.1 Despite having no impact on earnings during that year, the project did have a significant positive impact on youth total income because it increased the amount of disability benefits that youth received, presumably via SSA’s waivers for YTD. The West Virginia project also had a significant positive impact on participation in productive activities, primarily by increasing participation in education and training.
D. Findings from the cost analysis
The YTD evaluation contract did not specify a benefit-cost analysis because it would have been premature to conduct one based on estimated impacts on earnings, benefits, and other
1 The survey-based estimate of the West Virginia project’s impact on paid employment during the third post-
enrollment year is positive, but with a p-value of .11 it fall just short of the threshold for statistical significance at the .10 level.

FINAL REPORT ON THE YTD EVALUATION EXECUTIVE SUMMARY
xxi
outcomes measured during the evaluation’s relatively brief follow-up period. Three years after enrolling in the evaluation, many of the enrollees had not yet attained the ages at which young people typically engage in substantial market labor. Furthermore, most of the treatment group youth who actually had participated in the YTD projects still had another year of eligibility for SSA’s waivers for YTD, which made it unlikely that any of the projects would have had a negative impact on the receipt of disability benefits. SSA plans to use administrative data on benefits and earnings to estimate the impacts of the YTD projects in later years, extending perhaps 25 years beyond when youth enrolled in the evaluation. SSA will incorporate those estimates in a long-term benefit-cost analysis of the YTD projects.
To facilitate the long-term benefit-cost analysis, we estimated the costs of operating the YTD projects. These estimates are summarized in Table ES.3. This table shows that the average value (in 2008 dollars) of the resources required to operate the YTD projects ranged from a low of $5,232 per participant in Erie County to a high of $8,628 per participant in Bronx County.
In lieu of a benefit-cost analysis at this time, it is a useful exercise to consider the size of the negative impact on disability benefits that would be necessary to offset the cost of a YTD project. Consider a hypothetical project that, on average, used resources valued at $7,500 per participant to deliver services.2 Table ES.3 shows that half of the YTD projects had an average cost above this amount and half had an average cost below it. We would like to know the amount by which disability benefits would need to decline as a result of this project to fully offset its cost. Let us assume that the project has a positive impact on benefits of $500 per year for the first four years following enrollment (due to the SSA waivers)3 and then a negative impact of a fixed amount per year for the next 21 years. If we further assume that the discount rate, or time value of money, is 2 percent, then the break-even point would be achieved with a negative impact on
Table ES.3. The cost per participant of the YTD projects
YTD site Average cost per participant
Bronx Co., NY $8,628
Colorado $7,114
Erie Co., NY $5,232
Miami-Dade Co., FL $6,540
Montgomery Co., MD $8,443
West Virginia $7,971 Notes: Section B of Chapter II presents the methodology for estimating the average cost per participant. Chapters III−VIII present
detailed findings from the implementation of that methodology. All dollar amounts shown in the table are in 2008 dollars.
2 If 80 percent of treatment group youth participated in YTD services, then the average cost of this hypothetical
YTD project per treatment group member would be 0.8 x $7,500 = $6,000. 3 We derived the $500 annual impact on benefits by taking the average of the estimated impacts on benefits for
the three calendar years following youth enrollment in the evaluation across all six YTD projects. Because most of the youth who participated in services provided by YTD projects were able to take advantage of the YTD waivers for four years, for the purposes of the current exercise we assume that the average positive impact on benefits applies to the first four years following enrollment.

FINAL REPORT ON THE YTD EVALUATION EXECUTIVE SUMMARY
xxii
benefits equivalent to $503 per year in years 5 through 25.4 As a point of reference, the average annual benefit received by control group members in the third year following enrollment in the evaluation ranged from $4,659 in Miami-Dade County to $6,678 in Erie County (excluding Montgomery County, because the YTD project there did not exclusively target disability beneficiaries). Thus, a benefit reduction of roughly 8 to 11 percent in years 5 through 25 would result in YTD being cost neutral to SSA in this exercise.
E. Implications for policy and practice
The implications of the YTD evaluation for policy and practice will not be fully known until findings from SSA’s long-term benefit-cost analysis become available. At a minimum, that will be several years in the future. In the meantime, we present the following six implications based on the findings presented in this report and the site-specific interim reports (Fraker et al. 2011a-c and 2012a-c):
1. Interventions that provide substantial doses of well-designed services, including employment services, to youth with disabilities can improve key transition outcomes in the short-to-medium term.
2. Most of the YTD projects struggled to develop and maintain a focus on employment in their delivery of services. For several of them, technical assistance provided under the evaluation contract greatly facilitated the delivery of employment services. Funders and operators of future interventions with objectives and target populations similar to those of YTD should consider the utility of giving service providers access to high quality technical assistance on the design and delivery of employment services.
3. This evaluation has provided mixed evidence on whether the YTD impacts in the domain of paid employment and earnings are sustainable. Findings based on IRS records for the three calendar years following enrollment show declining impacts over time in most of the research sites. On the other hand, findings based on data from the evaluation’s follow-up surveys reveal the emergence of statistically significant positive impacts in this domain in Erie County and Montgomery County in the third year following enrollment, whereas there were no significant impacts in those sites in the first year. It is difficult to draw clear implications from these seemingly conflicting findings.
4. The evaluation findings indicate that interventions sharply focused on employment (such as the Miami-Dade County YTD project), as well as interventions with more comprehensive objectives (such as the Bronx County YTD project), can have beneficial impacts in the domain of contact with the justice system by youth with disabilities. Because the costs of criminal activities for various levels of government and society as a whole are high, the savings from reductions in such activities could be substantial. Thus, these impacts have the potential to swing the findings from a comprehensive benefit-cost analysis strongly toward positive net benefits of the YTD projects in these sites. An expansion of the YTD conceptual
4 Using a 2 percent discount rate, the present value of an impact on benefits of $500 per year in years 1 through
4 and -$503 per year in years 5 through 25 is -$6,000, which would fully offset the average cost of the hypothetical YTD project per treatment group member, as derived in the earlier footnote.
FINAL REPORT ON THE YTD EVALUATION EXECUTIVE SUMMARY
xxiii
framework to include service components explicitly designed to deter contact with the justice system could possibly result in enhanced impacts in this domain.
5. The evaluation’s findings of statistically significant positive impacts on primary outcomes in the domain of paid employment and earnings in the third year following enrollment in the Erie County and Montgomery County sites are based on youth survey responses that encompass both formal and informal jobs. The evaluation’s findings based on IRS records show no significant impacts on formal employment or earnings in these sites in the third calendar year following enrollment. SSA and other government agencies should be aware that, to the extent that the impacts of YTD or other similar interventions for youth with disabilities are driven by informal employment, the prospects for greater income and payroll tax revenues and reduced disability benefits due to more countable income being reported to SSA will be dampened.
6. This evaluation has produced no evidence that the YTD projects reduced the amount of disability benefits received by enrolled youth. This finding is not surprising because SSA’s waivers for YTD made it very unlikely that the projects would reduce the amount of benefits received by enrollees during the evaluation’s three year follow-up period, even if they did increase their earnings. However, the prospects for negative impacts on benefits in the post-waiver years are uncertain at best.
F. Lessons for future evaluations
We draw seven lessons from the YTD evaluation for future evaluations of interventions for youth with disabilities.
1. Concern about random assignment among youth and their parents was not prevalent and did not constitute a significant barrier to the recruitment of youth into the YTD evaluation. Therefore, the designers of future evaluations of interventions for youth with disabilities should not allow anxieties about random assignment to deter them from specifying a rigorous experimental evaluation design. However, it should be noted that enrollment targets may need to be higher under an experimental design to allow the formation of control groups.
2. The YTD evaluation team, working in partnership with the YTD projects, used all available tools and resources, and worked very hard to achieve evaluation enrollment rates ranging from 16 to 30 percent of eligible youth (Figure I.1 in Fraker et al. 2011a-c and 2012a-b). Given this experience, enrollment rates in excess of this range are likely to be unobtainable in current and future evaluations with similar target populations and the same extent of resources available.
3. SSA’s waivers for YTD were one of the first things that evaluation outreach staff at Mathematica mentioned to prospective enrollees in the evaluation and their parents; likewise for YTD project staff when they first spoke with treatment group youth to engage them in services. The waivers opened doors and generated strong initial interest in the YTD study and the YTD projects, thus facilitating recruitment. SSA should consider the value of waivers as a recruitment tool, in addition to their value in attaining the substantive objectives of an intervention, in future evaluations.
4. In future evaluations of interventions that include waivers, SSA should consider specifying a waiver period that is shorter than the evaluation’s follow-up period. This would allow for an

FINAL REPORT ON THE YTD EVALUATION EXECUTIVE SUMMARY
xxiv
assessment of the intervention’s impact on benefits during the post-waiver segment of the evaluation period.
5. The Phase 1 YTD projects began operating several years before SSA awarded the evaluation contract to Mathematica. Consequently, intenstive programmatic technical assistance under the evaluation contract was not provided to those projects until well after they had begun delivering services, whereas it was provided to the Phase 2 projects from their inception. In general, the latter projects were more receptive and responsive to an intensive and thorough technical assistance approach than were the former projects. This experience underscores the value of bringing a technical assistance contractor for future interventions on board before the service providers begin operating.
6. If SSA were to determine that an impact of 5 percentage points on employment is large enough to be policy relevant, then the sample sizes for the agency’s future evaluations of youth-focused demonstrations should be approximately twice those for the YTD evaluation to ensure the impacts of that size are estimated precisely. (The YTD evaluation’s samples of approximately 700 survey respondents per site provided 80 percent power to detect an employment impact of 8 percentage points at the .10 level of statistical significance.) Notably, SSA’s ongoing PROMISE evaluation is designed to yield follow-up survey data on approximately 1,600 youth per site, which is expected to be adequate to detect employment impacts of 5 percentage points.
7. Neither of the two most commonly used methodologies for gathering data on the self-determination of youth (Shogren et al. 2008) could be implemented as part of the YTD evaluation. Recent advances in using subsets of questions from the assessments underlying the Arc’s index of self-determination (Seong et al. under development, Shogren et al. 2014 and in press) should make it more feasible to collect the data needed to construct validated sub-indices of key components of self-determination and possibly a comprehensive index of self-determination.

1
I. INTRODUCTION
Youth with disabilities often have particularly difficult transitions to adulthood. In addition to the host of issues facing all transition-age youth, those with disabilities face special challenges related to health, social isolation, service needs, and lack of access to supports (Osgood et al. 2010). These challenges complicate their planning for education, work, and adult life in general. Many of these youth experience poor educational and employment outcomes, high risk of dependency on public benefits, and a lifetime of poverty (Davies et al. 2009). Despite broad recognition of these challenges and poor outcomes (Loprest and Wittenburg 2007; Wittenburg and Loprest 2007; Wittenburg 2011), little is known about how best to help transitioning youth with disabilities improve their employment and earnings opportunities in adulthood.
Helping youth with disabilities to better transition to adulthood would address a growing concern about the cost of providing disability benefits to them. The Supplemental Security Income (SSI) and Social Security Disability Insurance (DI) programs, administered by the Social Security Administration (SSA), are the primary federal programs that provide cash assistance to children and adults with disabilities. The children’s component of the SSI program is growing rapidly; between 2000 and 2012 the number of recipients under age 18 increased by 55 percent (SSA 2013), while the total number of children under age 18 in the U.S. grew by only 4.7 percent (Federal Interagency Forum on Child and Family Statistics 2001 and 2014a). In 2012, 1,162,000 youth ages 13 to 25 received SSI benefits totaling $8.5 billion (SSA 2013). In the same year, 213,000 people age 25 and under received DI benefits totaling $1.6 billion (SSA 2014).
Recognizing the importance of helping young people with disabilities achieve their full economic potential at this critical juncture in their lives, SSA undertook the Youth Transition Demonstration (YTD) evaluation. The purpose of the evaluation was to identify and test the most promising service strategies for helping youth with disabilities maximize their economic self-sufficiency as they transition from school to work. SSA also was interested in testing the effectiveness of altering certain benefit program rules as an incentive to encourage youth with disabilities to initiate work or increase their work activity to increase earnings. The target population for YTD was youth ages 14 to 25 who were receiving SSA disability benefits or were at high risk of receiving such benefits in the future.5
Using a rigorous random assignment methodology, the YTD evaluation assessed the extent to which the various work-promoting services and incentives helped youth with disabilities
5 The SSA disability population eligible for YTD included beneficiaries of the following programs: child and
adult SSI, DI, and Childhood Disability Benefits (CDB). SSI is a means-tested program in which eligibility is based on severe functional limitations (for child SSI benefits) or a medically determined disability that prevents substantial gainful employment (for adult SSI benefits). DI beneficiaries are individuals with an earnings history and a disability that prevents substantial gainful employment. CDB beneficiaries must be age 18 or older, have a disabling condition with an onset before age 22, and a parent receiving Social Security benefits (Rangarajan et al. 2009, pp. 18–19).

FINAL REPORT ON THE YTD EVALUATION CHAPTER I: INTRODUCTION
2
achieve greater economic self-sufficiency as they transitioned to adulthood.6 Under YTD, SSA selected six project sites for evaluation based on their adoption of promising strategies to support youth with disabilities. The earliest of these projects began operations in 2006 and ended in 2009. The latest started in 2008 and ended in 2012. The YTD projects sought to improve youth empowerment, self-sufficiency, and employment by providing employment services, benefits counseling, links to services in the broader community, and other family and youth supports. In addition, SSA provided special waivers for YTD to improve work incentives by allowing participating youth to retain more of their disability benefits and health insurance for four years while they worked or engaged in work-based experiences.
As part of the YTD evaluation, Mathematica Policy Research and its subcontractors conducted site-specific analysis to assess the impacts of the interventions during the three years after youth enrolled in the evaluation. In this comprehensive final report, we present estimates of the impacts of each of the six YTD projects on paid employment and earnings, total income from earnings and benefits, participation in productive activities, contact with the justice system, and self-determination. We also present estimates of each project’s average cost per participant of providing YTD services.
A. The YTD conceptual framework
The YTD evaluation tested whether the provision of services and enhanced work incentives to youth with disabilities can help young people overcome the barriers they face during their transition to adulthood. Many youth with disabilities, particularly those whose impairments are sufficiently severe to qualify them for SSA disability benefits, do not reach their full potential; instead, they experience high rates of unemployment, poverty, and incarceration (Loprest and Wittenburg 2007). Youth with disabilities may benefit from interventions designed to reduce the barriers they face in transitioning to adulthood.
Findings from previous demonstration programs indicated the need for developing customized supports to meet the specific needs of youth with disabilities. Of particular note was the Transitional Employment Training Demonstration (TETD), funded by SSA, which provided employment supports to SSI recipients ages 18 to 40 with intellectual disabilities in 13 communities. Decker and Thornton (1995) found that TETD increased cumulative earnings by 72 percent over the six years following program entry, with larger impacts in sites that customized the delivery of supports in comparison to those that employed standardized approaches. More recently, Ivry and Doolittle (2003) found that the mixed results from studies of youth programs can be explained largely by the under enrollment of key subgroups of young people, inconsistent participation among enrollees, and high rates of attrition. Similar to the TETD findings, their results underscore the importance of matching employment supports to meet the specific needs of youth rather than providing standardized supports with limited flexibility.
6 Under SSA contract #SS00-05-60084, Mathematica Policy Research, a nonpartisan firm that conducts policy research and surveys, assembled a multidisciplinary team, including key partner organizations MDRC and TransCen, Inc., to design and conduct the YTD evaluation and provide technical assistance to the projects as they developed and implemented their YTD interventions. The YTD project was advised by a technical working group that reviewed the evaluation design and a number of interim evaluation reports.
FINAL REPORT ON THE YTD EVALUATION CHAPTER I: INTRODUCTION
3
The YTD program model (summarized in Rangarajan et al. 2009) was based on promising lessons in what works in promoting successful transitions for youth with disabilities. In addition to the research cited above, the development of the model drew upon two major studies that synthesized promising practices in promoting employment and independent living outcomes for transition-age youth with disabilities. The first was conducted by the National Alliance for Secondary Education and Transition (NASET). Through representatives of more than 30 national advocacy groups, professional organizations, and education associations, NASET conducted a thorough review of research on what youth need to succeed as they transition from secondary education. Using this research synthesis, NASET produced a set of standards and quality indicators for identifying critical needs for all youth, including those with disabilities (NASET 2005).
Drawing from the NASET framework, the National Collaborative on Workforce and Disability for Youth (NCWD/Y) conducted its own extensive review of research, demonstration projects, and recognized effective practices. From this review, it developed a practical tool, Guideposts for Success (NCWD/Y 2005), to help practitioners and policymakers conceptualize optimum service delivery for youth with disabilities. Guideposts features nearly the same components as NASET, but slightly reconstituted: school-based preparatory experiences, career preparation and work-based experiences, youth development and leadership, connecting activities, and family involvement and supports. Thus, Guideposts offers a framework, based on an intensive review of the research, for organizing approaches to achieving the desired transition outcomes of employment and career paths for youth with disabilities. Each of the components of the Guideposts represents a set of factors influencing the ability of youth to reach the key transition objectives of a job and a career path. The importance of paid employment as both a critical youth service intervention and an optimum adult outcome was central to the intervention design for YTD.
The YTD intervention design was informed by a conceptual framework (Figure I.1) based on the research evidence and informed by SSA’s goals for the intervention. The transitions to adulthood made by youth with disabilities are shaped by the youths’ characteristics and their social, educational, and employment environments. However, several barriers may inhibit those transitions. The YTD intervention was intended to address the barriers and work within the environment of each demonstration site to facilitate better transitions.
Youth with disabilities face many barriers that can affect the success of their transition to adulthood. Some of these are the product of youths’ perceptions of their impairments and opportunities, which can lead to low expectations about working and self-sufficiency. Low expectations can, in turn, lead to marginalization, isolation, and diminished expectations about a youth’s abilities among family members, teachers, and employers. Other barriers arise because youth do not identify or obtain appropriate support services, and a lack of high quality employment services and opportunities for work-based experiences can create barriers to successful entry into the adult labor market (Mank et al. 2003; Wehman 2006). Furthermore, youth with disabilities may have to deal with school support systems that have significant gaps in both student services and critical linkages to adult services. The latter can lead to an uncoordinated handoff to adult services. Program rules that often reduce cash benefits with a rise in earnings or result in possible redetermination of a youth’s status as disabled may create financial disincentives to work. Finally, lack of knowledge about work incentives in SSA benefit
FINAL REPORT ON THE YTD EVALUATION CHAPTER I: INTRODUCTION
4
programs and the interaction of work experiences, benefits, and SSA incentives can inhibit beneficiaries’ interest in pursuing employment. Together, these barriers can lead to significant challenges in navigating the transition to adulthood successfully.
As shown in Figure I.1, the YTD projects were designed to address each of these barriers by providing services and financial incentives directly to youth with disabilities and their families. The key components of the projects—services and incentives—included work experiences, youth empowerment, family support, system linkages, social and health services, SSA waivers to encourage work, and benefits counseling. Although the projects were not intended to bring about systems change, they may have improved the transition environment indirectly. For example, the YTD project in Colorado was based in One-Stop Workforce Centers, where through their daily activities, the project staff demonstrated strategies for delivering employment services to youth with disabilities for the broader staff of the Workforce Centers (Martinez et al. 2008).7 The YTD evaluation did not test this potentially indirect effect (shown by the dashed arrow in the conceptual framework).
YTD was intended to help youth become as economically self-sufficient as possible as they transitioned to adulthood. The YTD model stressed the importance of paid employment experiences in achieving self-sufficiency. The projects offered a range of work-based service options, including career exploration, job shadowing, volunteer work, internships, apprenticeships, and paid employment. These experiences helped youth learn workplace skills and identify the career preferences, workplace supports, and accommodations that may be essential to employment success. The YTD intervention’s various options were designed to address the lack of access to employment services and paid work experiences faced by youth with disabilities. In addition, recognizing that education is an important determinant of future work success, some YTD projects supported educational goals, such as completing high school, obtaining a General Educational Development (GED) credential, and enrolling in postsecondary education.
By emphasizing youth empowerment—the acquisition of skills and knowledge that enable youth to control their life choices—the YTD intervention addressed youths’ low expectations associated with working and self-sufficiency. Empowerment is critical to choices about participation in services that will influence youths’ education, employment, and career directions. The YTD projects facilitated empowerment by involving youth in developing person-centered plans for services that promote success in achieving future goals. Through this process, the YTD projects identified the key barriers relevant to each youth and specified steps for addressing them.
Another important component of the YTD intervention was the provision of support to families so they would be better able to encourage and guide their youth in making appropriate choices about work, education, and services. Such support helped families address the barriers of low expectations and inadequate access to social and health services. In addition, to address the barriers resulting from uncoordinated service environments and inadequate access to services,
7 One-Stop Workforce Centers have been referred to as American Job Centers since 2012, but we use the
previous name in this report because that is what was being used when the YTD projects were providing services.

FINAL REPORT ON THE YTD EVALUATION CHAPTER I: INTRODUCTION
5
Figure I.1. Conceptual framework for SSA’s YTD projects
the intervention emphasized linkages between systems, particularly those between academic coursework and work-based experiences, and effective coordination of social and health services after school exit.
To enhance work incentives, the YTD projects also provided SSA waivers of certain disability program regulations. Youth who actually participated in YTD services were eligible for the waivers for four years following random assignment, or until age 22, whichever came later. All wavier eligibility ceased in September 2013. One barrier faced by youth is the disincentive to work due to SSA program rules that reduce benefits as earnings rise, effectively reducing the extent to which employment financially benefits youth with disabilities. In response, the waivers for YTD encouraged paid employment by allowing youth to keep more of their monthly benefits while working and earning.
• Under the standard SSI earned income exclusion (EIE), benefits are reduced by $1 for every $2 earned above a base amount.8 An important SSA waiver for YTD made the EIE more generous, so that benefits were reduced by only $1 for every $4 earned above a base amount.
8 The base amount per month is the first $65 of earned income plus the unused portion of the $20 general
income exclusion (SSA 2014b).
Short Term Employment-promoting activities
Paid employment
Total income from earnings and benefits
Attitudes and expectations
Education
Longer Term Paid employment and earnings Total income from earnings and benefits Engagement in productive activities Reduced contact with the justice system Self-determination
Key Outcomes
Transition Efforts by
Youth
Transition Environment • Youth characteristics and assets • Schools, special education,
postsecondary education, and training • VR, TTW, and WIA programs • Mental health and MR/DD systems • SSA disability benefit programs • Health care delivery & financing systems • Community-based service providers • Employers and economic climate
YTD Intervention Components • Individualized work-based
experiences • Youth empowerment • Family supports • System linkages • Social and health services • SSA waivers to encourage work • Benefits counseling
Barriers • Low expectations for working and self-
sufficiency • Lack of access to employment services
and work-based experiences • Uncoordinated handoff to adult services • Inadequate access to social and health
services • Financial disincentives to work • Lack of knowledge about how benefits
change when a person works

FINAL REPORT ON THE YTD EVALUATION CHAPTER I: INTRODUCTION
6
• For the student earned income exclusion (SEIE), which disregards up to $1,750 per month (in 2014) of a student’s earnings for those age 21 and younger, a waiver extended the earnings exclusion to all youth participating in YTD who were attending school, regardless of age.
• For youth who were determined ineligible for disability insurance for medical reasons based on a continuing disability review (CDR) or age-18 medical redetermination, a waiver delayed the cessation of benefits for the duration of the other waivers.
In addition to the above waivers, SSA provided YTD participants with enhanced incentives for investing in self-sufficiency goals and accumulating savings. For youth with approved plans for achieving self-sufficiency goals (known as the “plan for achieving self-support” or PASS), SSA disregarded the funds used for the PASS activities from eligibility determination and adjusted benefits to compensate partially for these expenses. The YTD waiver expanded eligible PASS activities to include postsecondary education and career exploration. Finally, SSA encourages asset accumulation in federally funded individual development accounts (IDAs) by not including any beneficiary deposits in the calculation of earned income that would reduce benefits and by disregarding matching deposits, account balances, and interest earned from eligibility determinations. For YTD participants, these exclusions were extended to IDAs that were not federally funded. Appendix B of this report provides further explanation of the five SSA waivers for YTD.
Finally, the YTD intervention provided benefits counseling to compensate for the lack of information about benefits and clarify the relationship between benefits and work. YTD benefits counseling assisted youth and their families in understanding the complexity of work incentives under SSA program rules and informed them about SSA’s waivers for YTD.
The YTD evaluation team identified the key intervention components deemed best practices and required all projects to consider these components as part of their service models. TransCen, Inc. provided the projects with training and technical assistance on the implementation of the components. However, each project enjoyed the flexibility to customize its approach to service delivery in the manner it determined to be most effective in improving outcomes for youth. It also should be noted that the components were delivered within the existing transition environment and the projects, to varying degrees, leveraged services available in their communities. For these reasons, the projects differed in their service models and implementation, which in turn may have led to differential impacts on youth outcomes.
B. The YTD evaluation
In addition to informing the interventions, the conceptual framework for YTD (Figure I.1) guided the evaluation. The evaluation assessed whether eligible youth who had been offered YTD services achieved improved short- and longer-term outcomes relative to eligible youth who had not been offered the services. In the short term, as examined in a series of site-specific interim reports on the YTD projects (Fraker et al. 2011a–c and 2012a–c), we assessed whether a project had delivered its planned intervention; the intervention’s impacts on service use; and its short-term impacts on employment, earnings, education, income, and expectations. In the longer term, as examined in this report, we assessed whether YTD affected key markers of a successful

FINAL REPORT ON THE YTD EVALUATION CHAPTER I: INTRODUCTION
7
transition to adult life: employment, earnings, income, participation in productive activities, contact with the justice system, and self-determination.
The YTD evaluation design called for six projects to be selected for participation in the national impact evaluation. The projects were required to meet four key criteria. First, they had to offer high quality intervention services that were expected to improve self-sufficiency. Second, as a group, the sites had to reflect a mix of service strategies and target populations. Third, they had to demonstrate their ability and willingness to participate in a random assignment evaluation. Finally, they had to be sufficiently large to serve 400 youth over a two- to three-year period because the evaluation required that this many youth be served to have sufficient statistical power to assess whether the intervention was effective.
In 2003, SSA entered into cooperative agreements with seven organizations to implement YTD projects that emphasized employment and youth empowerment. In 2006, SSA selected three of the seven projects for the random assignment evaluation.9 The choice of projects, based on recommendations from the evaluation team, included those with the capacity to serve the large number of youth required by the evaluation and a willingness to use a random assignment design. The projects were the Colorado Youth WINS project; the Transition WORKS project in Erie County, New York; and the City University of New York’s (CUNY) Youth Transition Demonstration Project (YTDP) in Bronx County, New York.
Also in 2006, the evaluation team conducted a nationwide search for potential new YTD projects by reaching out to organizations that either were operating strong transition programs or had the capacity to do so and met the evaluation requirements of an adequately sized target population and a willingness to implement random assignment. That search resulted in the selection of five organizations in fall 2006 to run pilot projects in 2007. Based on recommendations from the evaluation team, in November 2007, SSA selected three of the five organizations to implement their interventions fully and participate in the national impact study: these were the Florida regional office of Service Source; St. Luke’s House, Inc. in Montgomery County, Maryland; and the Human Resource Development Foundation, Inc. in West Virginia.10
The YTD evaluation was based on a multicomponent design to provide strong evidence on the extent to which the intervention led to intended changes in the transition outcomes of youth. The process analysis examined the implementation of YTD in the six sites and considered how well the intended intervention was delivered. The impact analysis was based on a rigorous random assignment design. The target number of voluntarily enrolled youth for each site was between 840 and 880, with approximately 54 percent randomly assigned to a treatment group and the remainder assigned to a control group. Youth in the treatment group could receive YTD services as well as the SSA waivers, while those in the control group could receive only those
9 Among the four original YTD projects that did not participate in the random assignment evaluation, two
(located in Iowa and Maryland) ceased operations in 2007 and two others (in California and Mississippi) continued providing services through 2009. Descriptions of the seven original YTD projects can be found in Martinez et al. (2010).
10 SSA funding for the two pilot projects (located in Vermont and Washington) not selected into the random assignment evaluation ceased on December 31, 2007.
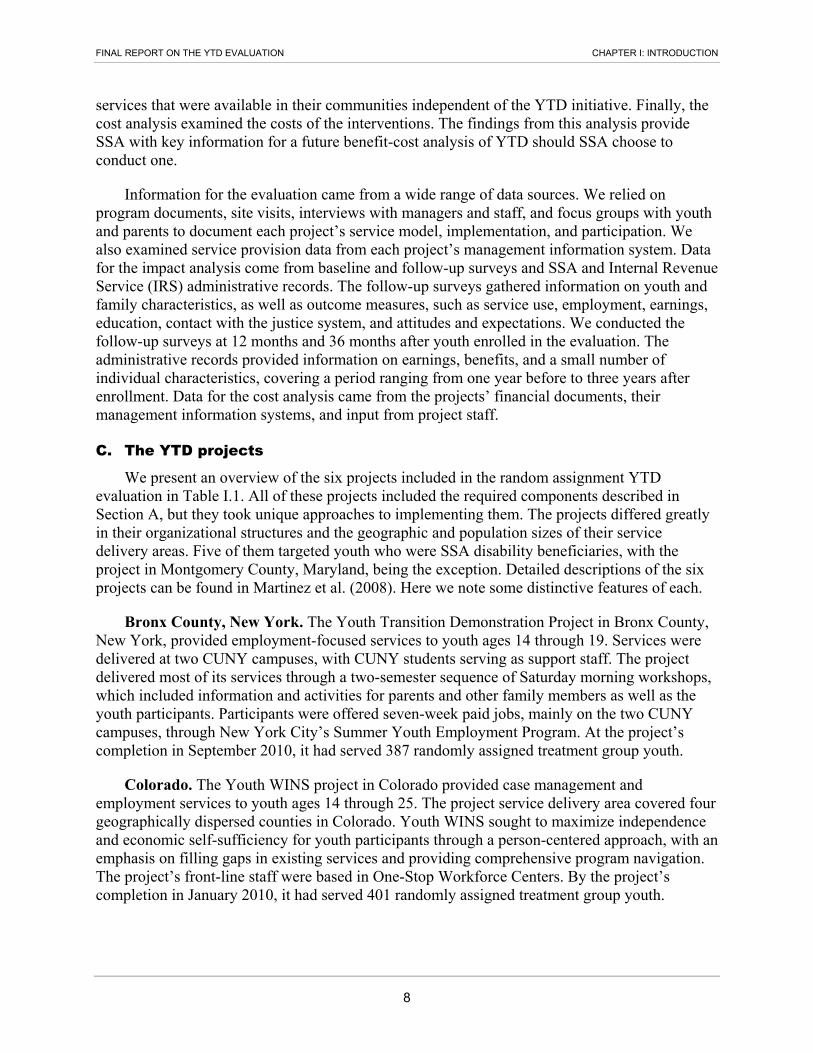
FINAL REPORT ON THE YTD EVALUATION CHAPTER I: INTRODUCTION
8
services that were available in their communities independent of the YTD initiative. Finally, the cost analysis examined the costs of the interventions. The findings from this analysis provide SSA with key information for a future benefit-cost analysis of YTD should SSA choose to conduct one.
Information for the evaluation came from a wide range of data sources. We relied on program documents, site visits, interviews with managers and staff, and focus groups with youth and parents to document each project’s service model, implementation, and participation. We also examined service provision data from each project’s management information system. Data for the impact analysis come from baseline and follow-up surveys and SSA and Internal Revenue Service (IRS) administrative records. The follow-up surveys gathered information on youth and family characteristics, as well as outcome measures, such as service use, employment, earnings, education, contact with the justice system, and attitudes and expectations. We conducted the follow-up surveys at 12 months and 36 months after youth enrolled in the evaluation. The administrative records provided information on earnings, benefits, and a small number of individual characteristics, covering a period ranging from one year before to three years after enrollment. Data for the cost analysis came from the projects’ financial documents, their management information systems, and input from project staff.
C. The YTD projects
We present an overview of the six projects included in the random assignment YTD evaluation in Table I.1. All of these projects included the required components described in Section A, but they took unique approaches to implementing them. The projects differed greatly in their organizational structures and the geographic and population sizes of their service delivery areas. Five of them targeted youth who were SSA disability beneficiaries, with the project in Montgomery County, Maryland, being the exception. Detailed descriptions of the six projects can be found in Martinez et al. (2008). Here we note some distinctive features of each.
Bronx County, New York. The Youth Transition Demonstration Project in Bronx County, New York, provided employment-focused services to youth ages 14 through 19. Services were delivered at two CUNY campuses, with CUNY students serving as support staff. The project delivered most of its services through a two-semester sequence of Saturday morning workshops, which included information and activities for parents and other family members as well as the youth participants. Participants were offered seven-week paid jobs, mainly on the two CUNY campuses, through New York City’s Summer Youth Employment Program. At the project’s completion in September 2010, it had served 387 randomly assigned treatment group youth.
Colorado. The Youth WINS project in Colorado provided case management and employment services to youth ages 14 through 25. The project service delivery area covered four geographically dispersed counties in Colorado. Youth WINS sought to maximize independence and economic self-sufficiency for youth participants through a person-centered approach, with an emphasis on filling gaps in existing services and providing comprehensive program navigation. The project’s front-line staff were based in One-Stop Workforce Centers. By the project’s completion in January 2010, it had served 401 randomly assigned treatment group youth.
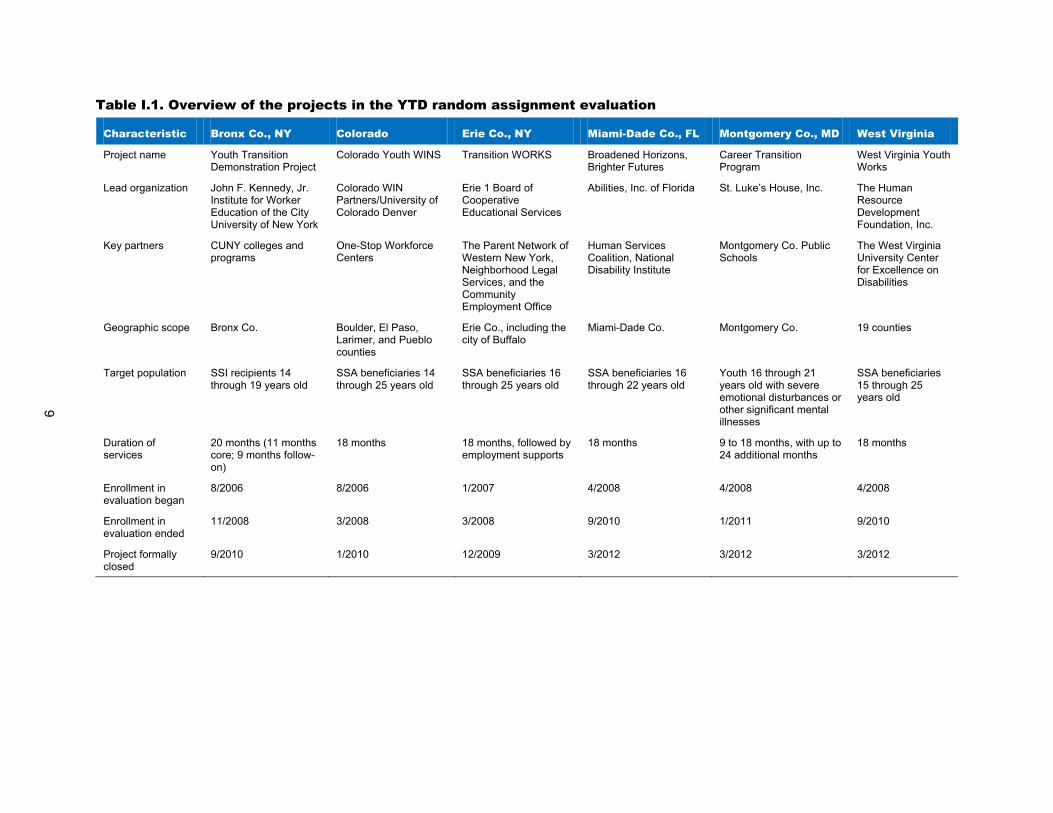
9
Table I.1. Overview of the projects in the YTD random assignment evaluation
Characteristic Bronx Co., NY Colorado Erie Co., NY Miami-Dade Co., FL Montgomery Co., MD West Virginia
Project name Youth Transition Demonstration Project
Colorado Youth WINS Transition WORKS Broadened Horizons, Brighter Futures
Career Transition Program
West Virginia Youth Works
Lead organization John F. Kennedy, Jr. Institute for Worker Education of the City University of New York
Colorado WIN Partners/University of Colorado Denver
Erie 1 Board of Cooperative Educational Services
Abilities, Inc. of Florida St. Luke’s House, Inc. The Human Resource Development Foundation, Inc.
Key partners CUNY colleges and programs
One-Stop Workforce Centers
The Parent Network of Western New York, Neighborhood Legal Services, and the Community Employment Office
Human Services Coalition, National Disability Institute
Montgomery Co. Public Schools
The West Virginia University Center for Excellence on Disabilities
Geographic scope Bronx Co. Boulder, El Paso, Larimer, and Pueblo counties
Erie Co., including the city of Buffalo
Miami-Dade Co. Montgomery Co. 19 counties
Target population SSI recipients 14 through 19 years old
SSA beneficiaries 14 through 25 years old
SSA beneficiaries 16 through 25 years old
SSA beneficiaries 16 through 22 years old
Youth 16 through 21 years old with severe emotional disturbances or other significant mental illnesses
SSA beneficiaries 15 through 25 years old
Duration of services
20 months (11 months core; 9 months follow-on)
18 months 18 months, followed by employment supports
18 months 9 to 18 months, with up to 24 additional months
18 months
Enrollment in evaluation began
8/2006 8/2006 1/2007 4/2008 4/2008 4/2008
Enrollment in evaluation ended
11/2008 3/2008 3/2008 9/2010 1/2011 9/2010
Project formally closed
9/2010 1/2010 12/2009 3/2012 3/2012 3/2012

FINAL REPORT ON THE YTD EVALUATION CHAPTER I: INTRODUCTION
10
Erie County, New York. The Transition WORKS project in Erie County, New York (which includes the city of Buffalo), provided employment services and workshops on self-determination and self-advocacy to youth ages 16 through 25. The project was designed to fill gaps in existing transition services and to maximize the economic self-sufficiency and independence of youth with disabilities by improving their self-determination and educational and employment outcomes. By the project’s completion in December 2009, it had served 380 randomly assigned treatment group youth.
Miami-Dade County, Florida. The Broadened Horizons, Brighter Futures (BHBF) project in Miami-Dade County, Florida, served youth ages 16 through 22. In addition to the core YTD services, BHBF leveraged its relationships with its partners to provide its participants with financial literacy training and assistance in establishing individual development accounts. The project used its case management system to monitor the delivery of employment services to participants and to target services to youth to reduce the risk that they would not have a paid work experience. At the project’s completion in March 2012, it had served 388 randomly assigned treatment group youth.
Montgomery County, Maryland. The Career Transition Program (CTP) in Montgomery County, Maryland provided employment, education, and mental health services to youth ages 16 to 21 who had been diagnosed with severe emotional disturbances or significant mental illnesses. It recruited primarily students who were due to complete their high school educations within one or two years. Most of the youth who received CTP services were not receiving disability benefits but were believed to be at high risk of receiving them in the future, absent effective intervention. By the project’s completion in March 2012, it had served 374 randomly assigned treatment group youth.
West Virginia. West Virginia Youth Works provided employment-focused services to youth ages 15 through 25 in 19 of the state’s 55 counties. The project’s service delivery area included many of the state’s larger municipalities as well as a number of predominately rural counties. Within this area, services for youth with disabilities who were not participating in Youth Works were generally quite limited. The project used monitoring procedures and reports to focus staff service efforts on participants who had not yet had a paid work experience. By the project’s completion in March 2012, it had served 388 randomly assigned treatment group youth.
D. Research objectives for this report
In this final report on the YTD evaluation, we examine whether each of the six YTD projects improved outcomes for youth 36 months after they enrolled in the evaluation. If the SSA waivers for YTD and the services provided by the projects were effective, we would expect youth who had been randomly selected for the opportunity to participate in a YTD project (treatment group members) to have improved outcomes relative to youth who had been randomly assigned to a control group that was ineligible for the YTD waivers and services. Given that the YTD program model emphasized paid employment and provided enhanced work incentives through the SSA waivers, it is essential to assess impacts on paid employment, earnings, benefits, and total income. The YTD projects also provided education services, although those tended to be fairly limited; thus, it is useful to assess whether the projects increased youth’s participation in productive activities, defined to include education and training programs and

FINAL REPORT ON THE YTD EVALUATION CHAPTER I: INTRODUCTION
11
employment. None of the YTD projects provided services designed to directly reduce contact with the justice system; however, such reduction could have been a byproduct of other services provided or of project impacts on other outcome measures, such as employment and income. Thus, this report presents impacts of the YTD projects on contact with the justice system. Finally, all of the YTD projects emphasized youth empowerment through person-centered planning, so this report presents impacts of the projects on self-determination.
This report also presents our assessment of the cost of services delivered by the YTD projects. Based on data collected from each project, we calculated the total cost of the resources used to deliver services during a one-year period that was generally free of start-up and close-out activities. Based on that calculation, this report presents for each project an estimate of the total project cost, estimates of the costs of various project components, and an estimate of the average cost per participant.
E. Organization of this report
This report presents findings from the three-year impact analysis and the cost analysis for each of the six YTD projects. In Chapter II, we describe our approach to conducting those analyses, including the data sources, samples, key measures, and analytic methodology. This chapter is followed by six site-specific chapters (Chapters III through VIII), each of which includes an overview of the YTD project in that site, provides descriptive statistics on the analytic sample, summarizes process analysis and one-year impact analysis findings from the evaluation’s interim report on the project, and presents new findings from the three-year impact and cost analyses. In Chapter IX, the final chapter, we summarize and compare findings across sites and present general conclusions. In Appendix A, we present supplementary analyses and technical discussions. In Appendix B, we provide descriptions of the SSA waivers for YTD.

This page has been left blank for double-sided copying.

13
II. DATA SOURCES AND METHODS
Rigorous assessment of the impacts of the YTD projects is a central component of the YTD evaluation. An experimental design, often considered the gold standard for evaluations, allows us to infer with a high degree of certainty whether the projects had any impacts on youth. As important as it is to estimate project impacts, it is also critical to document the cost of the services delivered as part of the YTD interventions. Together with findings from the process analysis of the implementation of the YTD projects (presented in the site-specific interim evaluation reports), the findings from the impact and cost analyses will be valuable information for those considering the development of similar interventions. In this chapter, we describe our approach to conducting the impact and cost analyses.
A. Impact analysis
The YTD evaluation is based on a rigorous random assignment design. Youth identified as eligible for the evaluation were randomly assigned either to a treatment or a control group; the treatment group youth were eligible to receive YTD services and the SSA waivers for YTD, whereas the control group youth had no access to YTD services or waivers but could use other services available in their communities. Random assignment should lead to the creation of two groups with virtually identical pre-intervention experiences and characteristics. As a result, any observed differences in outcomes for the two groups over time may be attributed with a measurable degree of certainty to the effects of the program.
It should be noted that youth enrollment in the evaluation was voluntary. Therefore, we would expect that youth particularly interested in receiving employment-related services were more likely to have volunteered to enroll. As a result, youth assigned to a control group and thus not eligible for YTD services might have been likely to seek similar services from other sources. Hence, the impacts captured by the evaluation are the effects of the YTD interventions relative to other services in the community that youth may have used, rather than a counterfactual environment of “no services.” The impact analysis in this final report examines whether each of the six YTD projects was effective in improving the outcomes of the youth who were offered YTD services and SSA waivers, covering the period up to three years after the youth enrolled in the evaluation.
1. Outcome measures As detailed in the conceptual framework for the YTD intervention and evaluation in
Chapter I (Figure I.1), by providing expanded services and waiving certain disability program rules, the YTD projects were expected to improve employment and other outcomes for youth. If a YTD project succeeded in implementing YTD services and waivers, the impacts of the intervention should be reflected by youth who had been randomly assigned to the treatment group achieving more paid employment and greater earnings from employment. We would also expect to observe treatment group youth having greater income resulting from both increased earnings and higher benefits due to the waivers; increased participation in productive activities, including both employment and participation in educational activities; less contact with the justice system; and increased self-determination. We estimated these impacts based on data from the YTD evaluation’s 36-month survey as well as SSA and IRS administrative data on benefit receipt and earnings.

FINAL REPORT ON THE YTD EVALUATION CHAPTER II: DATA SOURCES AND METHODS
14
Although all of the above outcomes are important and it is useful to assess the intervention’s impacts on each one, we must be mindful of the statistical problem of “multiple comparisons” (Schochet 2008). This problem arises when we estimate program impacts on a large number of outcomes such that at least a few of the estimates are likely to be statistically significant by chance, even if no true impacts occurred. For example, if we were to examine 50 independent outcomes, we would expect to find statistically significant impacts (at the 10 percent level of statistical significance) for five outcomes simply by chance, even in the absence of any true impacts. We addressed this problem by specifying, a priori, a small number of primary outcomes. We chose five domains or areas in which we expected to see longer-term impacts of the YTD projects and identified one or (for one domain only) two primary outcomes to be tested in each domain. Our goal was to be as parsimonious as possible in defining the domains and primary outcomes while capturing the major areas in which the intervention might produce impacts. The primary outcomes were the basis for the tests of our main hypotheses. In addition, we examined a number of supplementary outcomes to help explain impacts on the primary outcomes. Even if we did not find a statistically significant impact on a primary outcome, we examined the related supplementary outcomes to enhance our understanding of the lack of impact on the primary outcome. We also considered whether there was a pattern of impacts on the supplementary outcomes that suggested the project may have had an impact that our primary outcome measure did not capture. By limiting the number of main hypotheses being tested, this approach reduced the likelihood of finding spurious impacts due to chance alone without significantly undermining the evaluation’s statistical power to detect true impacts.
Guided by the YTD conceptual framework, our analysis plan for the final evaluation report (Fraker and Mamun 2013) identified the domains and primary outcomes to be examined in our impact analyses (Rangarajan et al. 2009). In Table II.1, we show the domains for which we expected the YTD projects to have longer-term impacts and describe the primary and supplementary outcomes examined as part of each domain. Below, we discuss the primary outcome measure(s) in the five domains for the three-year impact analysis.
• Paid employment and earnings. A core YTD service component was helping youth find paid employment in the short term to put them on paths to consistent paid employment in the longer term. Hence, paid employment and earnings constituted an important domain for the three-year impact analysis. The primary outcome measures in this domain are whether a youth was employed for pay at any time during the year preceding the 36-month survey and his or her total earnings from employment during that year. We calculated the total earnings from youth reports of their hours worked and wage rates on all paid jobs during the year.
• Youth income. YTD was expected to improve the incomes of youth by increasing their earnings from employment while providing them with enhanced work incentives (for a minimum of four years) that permitted them to retain more of their SSA disability benefits as their earnings increased. The primary outcome measure in the domain of youth income is the total income from earnings and disability benefits received by a youth during the year preceding the 36-month survey. We measure income by summing earning amounts, as captured by the survey, and disability benefit amounts, as obtained from SSA administrative files.
• Participation in productive activities. Given YTD’s primary focus on employment and secondary focus on education, there is reason to expect the interventions to have
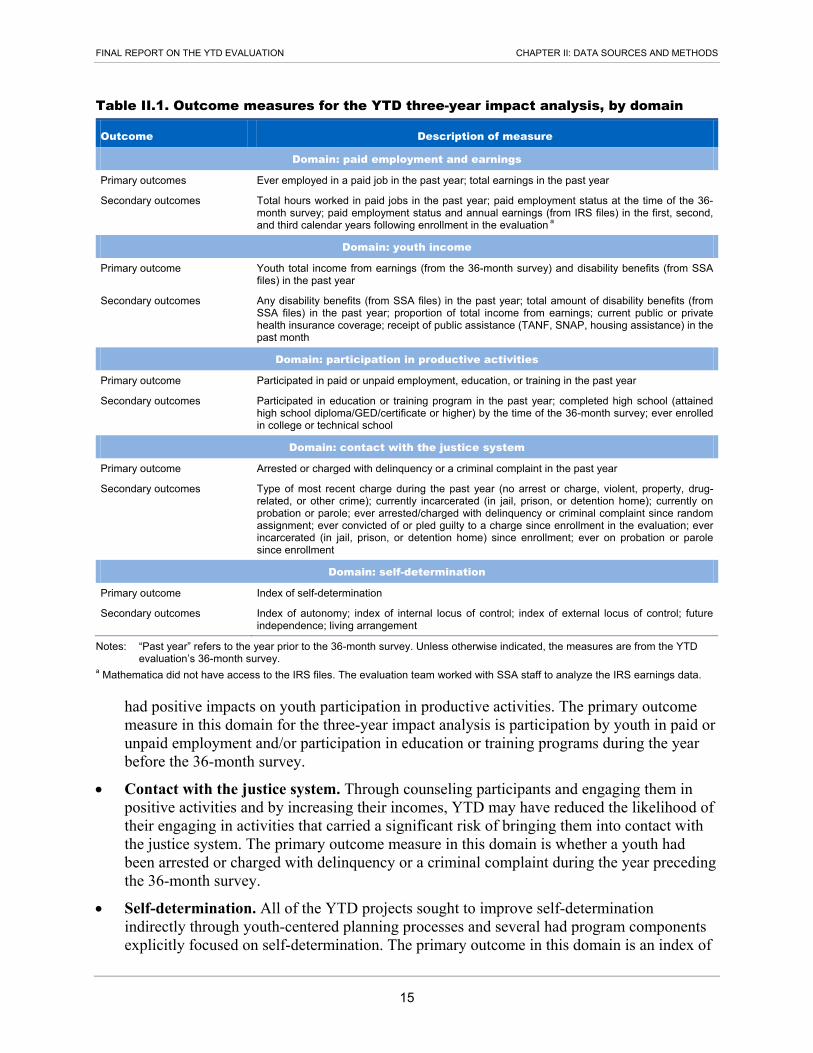
FINAL REPORT ON THE YTD EVALUATION CHAPTER II: DATA SOURCES AND METHODS
15
Table II.1. Outcome measures for the YTD three-year impact analysis, by domain
Outcome Description of measure
Domain: paid employment and earnings
Primary outcomes Ever employed in a paid job in the past year; total earnings in the past year
Secondary outcomes Total hours worked in paid jobs in the past year; paid employment status at the time of the 36-month survey; paid employment status and annual earnings (from IRS files) in the first, second, and third calendar years following enrollment in the evaluation a
Domain: youth income
Primary outcome Youth total income from earnings (from the 36-month survey) and disability benefits (from SSA files) in the past year
Secondary outcomes Any disability benefits (from SSA files) in the past year; total amount of disability benefits (from SSA files) in the past year; proportion of total income from earnings; current public or private health insurance coverage; receipt of public assistance (TANF, SNAP, housing assistance) in the past month
Domain: participation in productive activities
Primary outcome Participated in paid or unpaid employment, education, or training in the past year
Secondary outcomes Participated in education or training program in the past year; completed high school (attained high school diploma/GED/certificate or higher) by the time of the 36-month survey; ever enrolled in college or technical school
Domain: contact with the justice system
Primary outcome Arrested or charged with delinquency or a criminal complaint in the past year
Secondary outcomes Type of most recent charge during the past year (no arrest or charge, violent, property, drug-related, or other crime); currently incarcerated (in jail, prison, or detention home); currently on probation or parole; ever arrested/charged with delinquency or criminal complaint since random assignment; ever convicted of or pled guilty to a charge since enrollment in the evaluation; ever incarcerated (in jail, prison, or detention home) since enrollment; ever on probation or parole since enrollment
Domain: self-determination
Primary outcome Index of self-determination
Secondary outcomes Index of autonomy; index of internal locus of control; index of external locus of control; future independence; living arrangement
Notes: “Past year” refers to the year prior to the 36-month survey. Unless otherwise indicated, the measures are from the YTD evaluation’s 36-month survey.
a Mathematica did not have access to the IRS files. The evaluation team worked with SSA staff to analyze the IRS earnings data.
had positive impacts on youth participation in productive activities. The primary outcome measure in this domain for the three-year impact analysis is participation by youth in paid or unpaid employment and/or participation in education or training programs during the year before the 36-month survey.
• Contact with the justice system. Through counseling participants and engaging them in positive activities and by increasing their incomes, YTD may have reduced the likelihood of their engaging in activities that carried a significant risk of bringing them into contact with the justice system. The primary outcome measure in this domain is whether a youth had been arrested or charged with delinquency or a criminal complaint during the year preceding the 36-month survey.
• Self-determination. All of the YTD projects sought to improve self-determination indirectly through youth-centered planning processes and several had program components explicitly focused on self-determination. The primary outcome in this domain is an index of

FINAL REPORT ON THE YTD EVALUATION CHAPTER II: DATA SOURCES AND METHODS
16
self-determination, constructed as the average of three subindices—autonomy, internal locus of control, and external locus of control—each of which measures a particular aspect of self-determination. “Autonomy” refers to an individual’s level of self-care, self-direction, and personal control over her life (Wehmeyer 1995; Berry et al. 2012). “Internal locus of control” refers to an individual’s belief that she can determine the direction of her life by her own decisions and actions, whereas “external locus of control” refers to an individual’s belief that her life circumstances are primarily determined by others. We constructed the indices based on youth responses to a series of questions in the 36-month survey.11 Each takes on values ranging from one to four, with higher values indicating higher levels of self-determination.
The reference period for most of the outcome measures is the entire year preceding the 36-month survey, which corresponded closely to the third year following a youth’s enrollment in the evaluation. For example, the measure of paid employment captures employment at any time during the third year and the measure of earnings captures earnings from employment over that entire year. For other measures, the reference period may be the date of the 36-month survey or the month preceding the survey. For measures of employment and earnings based on IRS administrative data, we use three reference periods, corresponding to the first, second, and third calendar years following enrollment in the evaluation.
2. Data sources and analytic sample Data sources. As noted above, the three-year impact analysis relied on both survey and
administrative data. We collected survey data at baseline (just before our receipt of written consent for a youth to enroll in the evaluation) and at 36 months following enrollment. We collected the data primarily through interviews with the youth, but if a youth was unable to respond to questions, we asked the parent or guardian for the relevant information. Below, we briefly discuss the various data sources used in the three-year impact analysis; we provide a more detailed discussion of these sources in the evaluation’s data collection and survey plan (Rangarajan et al. 2007).
The baseline survey was conducted as part of the YTD evaluation’s sample intake process from July 2006 through December 2010 across the six research sites. The survey collected data on demographic characteristics and personal and family background for all youth enrolled in the evaluation (both treatment and control groups). The baseline survey was the principal source of the control variables in the regression models used to improve the precision of impact estimates and control for observable pre-existing differences between the two groups. It also was a source for variables that identified subgroups of youth for which we separately estimated impacts.
The 36-month survey of evaluation enrollees, which was conducted from September 2009 through April 2014, gathered large amounts of data on a wide range of youth outcomes. The
11 We obtained these questions from (1) the Canadian Youth in Transition Survey (Human Resources
Development Canada 2000), (2) a self-determination assessment tool developed by The Arc of the United States (Wehmeyer and Kelchner 1995), and (3) recommendations by the TransCen technical assistance team for YTD-specific questions. The statistical analysis underlying the construction of the self-determination indices we used is described in Jacobs (2013).

FINAL REPORT ON THE YTD EVALUATION CHAPTER II: DATA SOURCES AND METHODS
17
survey response rates for each evaluation site are shown in Table II.2. Excluding youth who were deceased at the time of the survey, the response rates range from 74.6 percent in Montgomery County to 86.8 percent in Erie County, for an overall response rate of 82.3 percent (not shown in the table). In all sites, the difference between the response rates for the treatment and the control group is less than 5 percentage points. The survey gathered information on outcomes primarily pertaining to the third year following enrollment in the evaluation; however, for some outcomes, such as enrollment in education or training programs and contact with the justice system, the survey information covers the entire period following enrollment in the evaluation. For other outcomes, such as living arrangements and educational attainment, the survey information is specific to the time of the survey.
In addition to survey data, we relied on data from SSA administrative files for the impact analysis. SSA benefit receipt and benefit amounts are of particular interest for assessing SSA disability program savings. We obtained benefit information from the SSA’s Disability Analysis File (DAF), which includes monthly information on the receipt of any disability benefit, type of benefit, and dollar amount of benefits (Kosar et al. 2014).12 In addition, we used data from SSA’s Master Earnings File, which contains annual earnings as reported by employers to the IRS, to estimate impacts on paid employment and earnings.13 Finally, for all evaluation enrollees, we used information from SSA records on gender, age, language, primary disabling condition, and representative payee type to document the characteristics of youth at the time of their enrollment in the YTD evaluation and as control variables in regression models.
Analytic sample. We treated as our main sample for the interim impact analysis the evaluation enrollees who completed the 36-month survey, which provided information on many of our primary outcomes. We refer to this sample as the “analytic sample.” However, we also had a larger sample of all nondeceased randomly assigned evaluation enrollees for whom we had three years of follow-up data on benefits and annual earnings from administrative records. We refer to this sample as the “research sample.” In Table II.2, we show the sizes of the research and analytic samples by site. For outcomes obtained from administrative records—paid employment, annual earnings, and measures of SSA benefits—we report impact analysis results based on the research samples—the larger of the two types of samples. For these outcomes, we found no meaningful differences in the impact analysis results when, in a methodological investigation, we limited the analysis to the smaller sample of youth who had completed the 36-month survey (Appendix A, Table A.6).
The process for recruiting youth and formally enrolling them in the evaluation is described in the evaluation’s site-specific interim reports (Fraker et al. 2011a-c and 2012a-c). The baseline characteristics of treatment and control group youth in the analytic sample for each site, along
12 The DAF is an ongoing data extraction and file creation effort that originally was undertaken to support the
evaluation of SSA’s Ticket to Work program, which provides SSA beneficiaries with vouchers (“Tickets”) that can be used to obtain employment services from Employment Networks of their choice. To support the YTD evaluation, the DAF was expanded to include SSI beneficiaries as young as 10 years old. Previously, the minimum age for inclusion in the file was 18.
13 Mathematica did not have access to the IRS files. The evaluation team worked with SSA staff to analyze the IRS earnings data.
FINAL REPORT ON THE YTD EVALUATION CHAPTER II: DATA SOURCES AND METHODS
18
Table II.2. YTD sample sizes and 36-month survey response rates, by site
Sample type Treatment Control Total
Bronx County, New York
Evaluation enrollees (research sample) 491 393 884
36-month survey respondents (analytic sample) 420 320 740
36-month survey response rate (%) 85.5 81.4 83.7
Colorado
Evaluation enrollees (research sample) 462 380 842
36-month survey respondents (analytic sample) 403 324 727
36-month survey response rate (%) 87.2 85.3 86.3
Erie County, New York
Evaluation enrollees (research sample) 454 373 827
36-month survey respondents (analytic sample) 397 321 718
36-month survey response rate (%) 87.4 86.1 86.8
Miami-Dade County, Florida
Evaluation enrollees (research sample) 448 392 840
36-month survey respondents (analytic sample) 375 310 685
36-month survey response rate (%) 83.7 79.1 81.5
Montgomery County, Maryland
Evaluation enrollees (research sample) 416 382 798
36-month survey respondents (analytic sample) 320 275 595
36-month survey response rate (%) 76.9 72.0 74.6
West Virginia
Evaluation enrollees (research sample) 449 393 842
36-month survey respondents (analytic sample) 365 311 676
36-month survey response rate (%) 81.3 79.1 80.3
Notes: The counts of evaluation enrollees do not include youth who were deceased as of the three-year anniversary of their enrollment. There were 70 deceased youth across the six sites.
with an assessment of the equivalence of these two groups at the time of enrollment, is provided in Chapters III−VIII, the site-specific chapters of this report.
3. Estimating overall impacts Although well-executed random assignment ensures that a simple comparison of mean
values of outcomes will yield unbiased estimates of program impacts, we estimated regression-adjusted impacts to increase the precision of the estimates. In addition, the regression-adjustment approach allowed us to control for chance differences in baseline characteristics between treatment and control group members, which may be correlated with outcome measures. We estimated ordinary least squares regression models for continuous outcome measures, logistic regressions for binary outcomes, and multinomial logit models for categorical outcomes. We estimated impacts for all youth in the analytic sample, without any exclusions. In particular, we
FINAL REPORT ON THE YTD EVALUATION CHAPTER II: DATA SOURCES AND METHODS
19
included all treatment group members in the analytic sample, regardless of whether they actually participated in YTD project services.14
The impact estimates address the policy question: “What were the effects of a YTD project on eligible youth who were interested in the project and were offered the opportunity to participate in it?” The impacts reflect both the decisions of those who were offered the opportunity but declined to participate in project services and the effects of the project on those who accepted the offer. Youth in the treatment group who declined to participate are a self-selected subset of treatment group youth who are likely to have different baseline characteristics, on average, than project participants. If these youth were excluded from the analysis, the control group would no longer provide a valid basis for comparison with the participant subsample.
Our regression models used 18 to 23 distinct variables or sets of related variables, depending on the YTD project, to control for baseline characteristics. An important consideration in selecting the control variables was the need to adjust for any pre-existing differences at baseline between the treatment and control groups. We also used as controls (1) variables believed or known to have strong behavioral relationships with the outcome measures (for example, baseline work experience or education); (2) variables that could be used to target intervention services to youth upon whom they would have the greatest impacts (for example, age and school enrollment); and (3) variables related to the enrollment cohort or timing of random assignment. The list of control variables used in the impact analysis for each project is shown in Table A.2 of Appendix A.
To provide context for interpreting the impact estimates, we report the estimated impacts, along with the regression-adjusted mean values of the outcome measures for the treatment and the control groups. When we find a significant program impact and want to describe its magnitudes in proportional terms, we use the control group mean value as our base.15
We tested the sensitivity of the estimated impact on the primary outcome in each domain to the use of either regression adjustment or a comparison of simple mean values (Appendix A, Table A.4) and found that for most of the primary outcomes the impact estimates were robust with respect to the particular estimation approach. For a few outcomes the two estimation approaches led to different statistical significance of the estimated impacts, which can be explained by two features of the regression adjustment: improvement in the precision of the impact estimates and control for differences between treatment and control group youth in their characteristics at enrollment. Overall, the use of regression adjustment in estimating impacts allowed us to arrive at robust conclusions about the impact of the YTD projects.
14 Chapters III−VIII of this report document the rate at which treatment group youth enrolled in the YTD
projects. This rate ranged from a low of 79 percent in Bronx County to a high of 89 percent in Montgomery County. In five of the six evaluation sites, the enrollment rate was at least 83 percent. Analysis of data from the YTD projects’ management information systems showed that a minimum of 96 percent of the youth who enrolled in a YTD project received services (Fraker et al. 2011a-c; 2012a-c).
15 We show the observed treatment and control group means for all outcome measures for all six evaluation sites in Tables A.3a–A.3f of Appendix A.

FINAL REPORT ON THE YTD EVALUATION CHAPTER II: DATA SOURCES AND METHODS
20
4. Estimating subgroup impacts In addition to the impacts of each YTD project on outcomes for all eligible youth, we were
interested in estimating whether a project had different impacts on different types of youth. The subgroup analysis examined whether the intervention worked better for some youth versus others. Subgroup analysis can inform decisions about targeting scarce resources to specific groups. However, the limited size of the analytic sample for each evaluation site meant that, for some subgroups, the sample sizes were insufficient to allow us to detect impacts of policy-relevant magnitudes. Further, to be responsive to the multiple comparisons problem, we estimated subgroup impacts on primary outcome measures only and restricted the number of subgroups examined. We specified four pairs of subgroups in our analysis plan for the YTD final evaluation report (Fraker and Mamun 2013). These were defined by the school enrollment status, age, and work experience of youth when they enrolled in the YTD evaluation, and whether they enrolled in the first or second half of a site’s enrollment period. We subsequently dropped the subgroup pair defined by the timing of enrollment from the analysis as results for this subgroup pair have limited policy relevance.
To estimate subgroup impacts, we modified the regression models to include the interaction of the treatment status indicator with a 0/1 indicator variable for a specific subgroup pair. For each subgroup, we conducted a test to determine the statistical significance of the subgroup impact.
5. Other analytic considerations Survey non-response. As noted, the site-specific response rates to the 36-month survey
were quite high and fairly similar for the treatment and control groups. Even with relatively high response rates, if respondents differed systematically from non-respondents and we did not account for the differences, the estimated impacts could be biased in that they would not represent all youth who enrolled in the evaluation.
We found that in all of the evaluation sites, the survey respondents did differ from the non-respondents on a number of baseline characteristics. The differences varied by site, but key differences included survey respondents being more likely than non-respondents at the time of enrollment to have (1) had work experience in the year prior, (2) been living with both parents, (3) health insurance, (4) family income of $25,000 or more, and (5) not been receiving Special Nutrition Assistance Program (SNAP, previously Food Stamps) (Appendix Tables A.5a–A.5f). To account for the differences between the respondent and non-respondent samples, we used survey weights that adjusted the estimated impacts for survey non-response in all of our impact analyses for outcomes measured in survey data. The weights made the respondent cases more representative of the original samples of all youth who enrolled in the evaluation and reduced the potential for non-response bias. To calculate the weights, we used logistic models to estimate the propensity for a sample member to respond to the 36-month survey. In Section C of Appendix A, we describe the calculation of survey weights.
The availability of administrative data on employment and benefit outcomes for all evaluation enrollees during the three years following enrollment allowed us to assess whether non-respondents experienced changes in these outcomes after random assignment that may have been correlated with non-response status. Using administrative data on paid employment, annual

FINAL REPORT ON THE YTD EVALUATION CHAPTER II: DATA SOURCES AND METHODS
21
earnings, SSA disability benefit receipt, and benefit amount, we estimated impacts for the analytic samples (the 36-month survey respondents) and the full research samples (all evaluation enrollees) and found little difference in the estimated impacts (Appendix A, Table A.6). Overall, the results suggest that non-response to the 36-month survey did not introduce substantial bias in the estimated impacts—not surprising, given the high overall response rates of between 75 percent and 87 percent across the six evaluation sites.
Missing data. For most of the control variables in our regression models, only a few observations had missing data; we replaced the missing data with the mean values of those variables from the non-missing observations. For any control variable for which the value was missing for more than 5 percent of the observations, we included a dummy variable in our regression models to indicate that the value were missing. Examples include “highest grade completed” (Bronx County), “mother completed high school” (Colorado), “youth expects to live independently” (Erie County), “father completed high school” (Miami-Dade County), “mother employed at baseline” (Montgomery County), and “primary disabling condition” (West Virginia).
For outcome measures, we typically excluded observations with missing data from analyses of those outcomes. However, for some outcome measures, data were non-randomly missing; that is, missing conditional on the values of other measures. For example, for youth who reported that they did not work for pay during the year preceding the 36-month survey, earnings in that year are known to be zero. Thus, missing information on earnings could arise only for youth who worked for pay during the year. Excluding observations with missing information on earnings thus would exclude only youth who worked, leading to an underestimate of average earnings. For outcome measures for which data were missing conditional on another outcome, we used a multiple imputation procedure.16 In Section D of Appendix A, we provide a full description of our approach to dealing with missing information for control variables and outcome measures.
Inflation adjustment. We used a price deflator to convert all outcomes measured in dollars into constant December 2008 dollars. Specifically, we used the consumer price index (not seasonally adjusted) for urban wage earners and clerical workers (CPI-W), created by the U.S. Bureau of Labor Statistics (BLS), to adjust the dollar amounts; SSA uses the same index as the basis for its annual cost-of-living adjustments to SSA benefits. For all yearly outcomes measured in dollars, we used the annual average of the CPI-W to make the adjustments. Measuring all dollar amounts in December 2008 dollars allows us to adjust for inflation and also makes all monetary amounts presented in the YTD final report directly comparable to those presented in the interim reports. We also use the same index in the cost analysis.
16 We used a multiple imputation procedure for measures of earnings, hours worked in paid jobs, employment
status at the time of the survey, youth total income, fraction of income from earnings, and measures of contact with the justice system. For nearly all of these variables, no more than 13.5 percent of observations had missing data across all six YTD projects. The only exceptions were in the Montgomery County YTD project, for which larger proportions of the sample had missing data on hours worked in paid jobs and earnings (data were missing for 22.0 percent and 24.2 percent of the observations, respectively), and on whether youth had ever been convicted of or pled guilty to a charge since enrollment in the evaluation (data were missing for 17.6 percent of the observations).
FINAL REPORT ON THE YTD EVALUATION CHAPTER II: DATA SOURCES AND METHODS
22
B. Cost analysis
The YTD cost analysis produced estimates of the total cost of each project, the cost per participant, and the costs of specific activities within a project. These values were calculated from the perspective of an individual YTD project, or of an agency that might fund or implement a YTD-like project in the future. Costs were defined broadly to include not just inputs paid for by a project but also those that required no payment by the project, such as donated services/facilities and technical assistance funded by third parties. Thus, the cost estimates capture the value of all resources required to operate a project.
SSA provided funding of approximately $3.9 million over four years to each YTD project for the purpose of providing services to youth with disabilities. In addition to those services, the funding covered start-up activities (for example, developing an implementation plan and hiring staff) and close-out activities (such as helping participants transition to other service providers). One approach to estimating the cost per participant is to divide the SSA funding amount by the number of youth served. However, this approach is simplistic, in that it does not capture inputs that required no payments by a project and those paid for out of other funds. Furthermore, it captures start-up and close-out costs that are not relevant to steady-state operations. Our cost analysis avoids these errors of inclusion and exclusion by defining a one-year steady-state period (the cost accounting period) for the analysis and constructing measures of costs based on the inputs or resources actually used.
The findings presented in the cost analysis sections of the site-specific chapters in this report are based on cost data and statistics in a series of project-specific cost memos prepared under the YTD evaluation (Honeycutt and Murphy 2013, 2014a, b, c, d, and e). These memos provide more complete information than can be included in the limited space available in this final report on the methods, data, and findings for the cost analysis.
1. Data We gathered data from a number of sources for the cost analysis, some of which were
consistent across the projects and others that varied. For all projects, we obtained data from their management information systems on the number of participants who received services and how long they received them. We also collected data from project staff through interviews and two one-week self-assessments on the amount of time they spent on specific work activities. The interviews were especially helpful in identifying the use of donated services and facilities. Data sources that varied across projects included financial documents, accounting reports, budgets, and subcontractor invoices and documentation.
2. Method Our method for estimating YTD project costs reflects a broad perspective and entails
identifying and assigning dollar values to all of the inputs used by a project during the cost accounting period. We used a seven-step approach to cost analysis developed by Handwerger and Thornton (1988) to collect cost data for inputs such as labor and subcontractor payments, sum the input costs to obtain a measure of total project cost, and then calculate the unit cost of the project (that is, a measure of total project cost adjusted for the duration of participation). We
FINAL REPORT ON THE YTD EVALUATION CHAPTER II: DATA SOURCES AND METHODS
23
began by identifying five program components common to the YTD projects, such as benefits counseling (Step 1).17 We gathered data from administrative records, staff interviews, and published reports on the costs of delivering project services, which we assigned to four overarching cost categories (Step 2).18 We assessed costs for the cost accounting period in which there were few start-up or close-out activities (Step 3). For unbudgeted costs for which no internal project valuations were available, we assigned dollar values equal to what it would have cost to purchase those resources in the open market (Step 4). Using the information from Steps 1 through 4, we calculated the cost of a YTD project during the cost accounting period for each of the four cost categories identified in Step 2 and in total (Step 5), and the costs associated with the five programmatic components (Step 6). Finally, we combined the measure of total project cost with data on participation (the number of youth involved and the duration of their involvement) to calculate the average cost per enrollment month (the unit cost) and the average cost per participant (Step 7). We calculated unit cost by dividing the total project cost during the cost accounting period by the total number of months that participants were enrolled in the project during that period. To estimate the project’s average cost per participant, we multiplied the average number of months that participants were enrolled in the project over the full duration of the demonstration by the measure of unit cost. All cost information is adjusted for inflation to December 2008 dollars using the CPI-W.
Activities associated with the enrollment of treatment group youth in project services generally occurred early on and accounted for small shares of total staff effort over the full performance periods of the projects, typically ranging between 5 percent and 12 percent. However, for the Colorado project, enrollment activities accounted for 27 percent of total staff effort. This statistic reflects that project’s strong emphasis on meeting its enrollment target and its relatively low intensity of services for participants (as discussed in Chapter IV). Four of the six projects (all but those in Miami-Dade County and West Virginia) had some enrollment activities during at least part of their cost accounting periods. Even if the YTD projects had not been involved in an evaluation, they would have had staff efforts and costs related to enrollment. Therefore, with one exception, we do not attempt to isolate enrollment costs and exclude them from the cost analysis. The exception is for the Montgomery County project. This project differed from the others in that its staff were responsible for both the recruitment of youth into the evaluation and the enrollment of treatment group youth in project services. In the other demonstration sites, Mathematica was responsible for recruiting youth into the evaluation. For this reason, we adjusted our measure of the Montgomery County project’s total cost downward
17 The five program components are project administration (activities related to the management and oversight
of the project and staff), employment services (activities related to youth employment, such as career counseling and vocational assessments), empowerment services and case management (working with youth on issues such as goal identification, and time management, and connecting youth to social and health services), education services (activities related to secondary and postsecondary education and training), and benefits counseling (providing youth and their parents with education and troubleshooting regarding SSA benefits and work incentives, as well as assistance on other benefits, such as SNAP).
18 The four overarching categories of project costs are direct labor costs (wages and fringe benefits), other direct costs (payments made to or on behalf of participants, such as transportation vouchers and purchased job coaching services), indirect costs (administrative costs and overhead costs for items such as office space and Internet service), and unbudgeted costs (examples include volunteer labor and donated meeting space).

FINAL REPORT ON THE YTD EVALUATION CHAPTER II: DATA SOURCES AND METHODS
24
to fully offset the cost of its recruitment and enrollment activities. We estimate that those activities accounted for 12 percent of total staff effort over the full demonstration period.19
3. Benefit-cost analysis In addition to presenting the cost analysis statistics in this report, we will develop two
benefit-cost analysis memos as contract deliverables to SSA. The first memo will present a framework for a benefit-cost analysis utilizing impact estimates based on administrative data only (not on follow-up survey data). This memo will serve as a guide to SSA in conducting possible longer-term benefit-cost analyses of YTD. SSA could use future administrative data to estimate the longer-term impacts of YTD on earnings and benefits and, following the analysis framework in this memo, incorporate those estimates in a benefit-cost analysis covering potentially many years after youth enrolled in the evaluation. The second memo will present findings from implementing the analysis framework in the first memo for the initial three years following enrollment. This preliminary benefit-cost analysis will utilize the impact estimates that are presented in this report, but just those based on administrative data. Even for a project that had a positive impact on employment, this analysis at the three-year mark is unlikely to find that the combined dollar value of the impacts on earnings and benefits outweighs the cost of the intervention, particularly as benefits could be larger for youth in the treatment group due to SSA’s waivers for YTD. This is why it may be useful for SSA to conduct one or more longer-term benefit cost analyses using the framework present in the first of the two planned memos.
19 Our raw cost data (data on how project staff spent their time on the job) for the Montgomery County project
are not so detailed as to allow us to distinguish the cost of recruiting youth into the evaluation from the cost of enrolling treatment group youth in project services.

25
III. BRONX COUNTY, NEW YORK
The City University of New York (CUNY) Youth Transition Demonstration Project (YTDP) in Bronx County, New York, was well-implemented and increased services received by youth, but it had no impact on youth employment or earnings three years after their enrollment in the YTD evaluation. The project provided services to promote independence and economic self-sufficiency among youth who were receiving SSI benefits. Our interim report showed that the project maintained a high degree of fidelity to its program model and to the YTD conceptual framework and that it had statistically significant impacts on the receipt of services and employment in paid jobs during the year after enrollment (Fraker et al. 2011b). Our analysis of data collected 36 months after youth enrolled in the evaluation revealed some longer-term impacts of the project. We found that it increased youth income, primarily by increasing SSI benefit amounts, and decreased contact with the justice system during the third year following enrollment, but it did not have any impacts on employment in paid jobs and earnings, participation in productive activities, or self-determination. The project’s average cost per participant was $8,628.
A. Project overview
The John F. Kennedy, Jr. Institute for Worker Education at CUNY administered the YTDP on two of the university’s college campuses—Lehman College and Hostos Community College. To strengthen the project, the Institute drew on the services of its Work Incentives Planning and Assistance (WIPA) program and the CUNY Linking Employment, Academics, and Disability Services (LEADS) program. The Institute also worked with the New York City Department of Youth and Community Development, the New York City Department of Education, and the Mosholu Montefiore Community Center, each of which played a key role in the summer employment component of the project. The deputy director of the Institute served as the director of the YTDP. The key staff included a project manager, an administrator of the project’s management information system, and two campus-based teams, totaling 8 key staff and more than 50 auxiliary staff. The key members of the campus-based teams were three benefits advisors, three career development specialists, and two parent advocates.
The CUNY YTDP provided youth with services intended to promote their independence and economic self-sufficiency. The project was designed to respond to gaps in transition services for youth and to promote self-determination and self-advocacy by the youth and their parents. Project services for youth included recreational and artistic activities; workshops on self-determination, career development, and benefits planning; and individualized services, such as person-centered planning, benefits counseling, and referrals for supplementary services. Additionally, paid summer employment was available for all interested participants. The YTDP also engaged youths’ parents and other family members through one-on-one mentoring, as well as counseling and workshops on benefits planning, advocacy, and community services.
The YTDP served a sufficient number of youth to support a rigorous evaluation. The target population for the project was youth ages 14 through 19 who were receiving SSI and living in the Bronx at the time of their enrollment in the study. Using lists of SSI recipients provided by SSA, Mathematica identified youth who met the project eligibility criteria and recruited 918 of

FINAL REPORT ON THE YTD EVALUATION CHAPTER III: BRONX COUNTY, NEW YORK
26
them into the study.20 Sample members were randomly assigned to a treatment group, which was eligible for YTDP services and the SSA waivers for YTD, or to a control group, which was eligible for neither but could access other services available in the community. The project staff enrolled 79 percent of the treatment group members in project services in three cohorts corresponding to the summer and fall of each year, 2006−2008. Participants could receive up to 20 months of services, including 11 months of core services based on the YTDP curriculum and 9 months of limited, post-curriculum services. All services ended in May 2010 and the project formally closed in September of that year.
B. Baseline characteristics of the analytic sample
The analytic sample for the three-year impact analysis of the CUNY YTDP consists of the 740 randomly assigned evaluation enrollees who completed the 36-month follow-up survey.21 As shown in Table III.1, about two-thirds of sample members were male and, consistent with the project’s targeting criteria, all were between 14 and 19 years old when they enrolled in the evaluation. The largest racial category among the youth in the analytic sample was black (43 percent), followed by white (32 percent), and other or unknown (21 percent). More than two- thirds of the youth across racial groups reported being Hispanic. Not surprisingly, given their ages, the vast majority of sample members were attending school at baseline, with more than half attending a regular high school and 40 percent attending a special high school or other type of school (including college). About two-thirds of the youth had never worked for pay at baseline.
Given that all youth in the analytic sample were receiving SSI, which is means tested, it is not surprising that most were from low-income families. Eighty-five percent of the sample members’ families had incomes of less than $25,000 per year. Nearly all of the sample members were living with their families and 80 percent of them were living with a single parent. Forty-six percent of the youth had a mother who had graduated from high school and 49 percent had a father who had done so.
Despite having significant mental or physical impairments and mixed current health status, most of the youth in the analytic sample had positive expectations for themselves in the future. The youth’s primary disabling conditions recorded in baseline SSA files can be grouped into five categories, the largest of which is cognitive and developmental disabilities (33 percent). This is followed by learning disabilities and attention deficit disorder (24 percent); physical disabilities
20 Of the 918 youth recruited into the evaluation, 889 were randomly assigned—492 to the treatment group and
397 to the control group. The remaining 29 youth had siblings already in the evaluation and were automatically assigned to the same groups as their siblings (18 treatment cases and 11 control cases); they were not included in the analysis for the evaluation.
21 There is a larger sample of randomly assigned evaluation enrollees for whom we have data on earnings and benefits from administrative records. This full research sample consists of the 889 youth who enrolled in the evaluation and were randomly assigned to treatment or control status, less 5 youth who had died as of the three-year anniversary of their enrollment, for a total of 884 youth (491 treatment and 393 control cases). These cases also constitute the denominator for the calculation of the response rate to the 36-month survey, which was 83.7 percent. For outcomes based on administrative data, we report impact analysis results for the full research sample, less the deceased youth.

FINAL REPORT ON THE YTD EVALUATION CHAPTER III: BRONX COUNTY, NEW YORK
27
Table III.1. Bronx Co., NY: baseline characteristics of the analytic sample (percentages, unless otherwise noted)
Characteristic All Treatment Control Difference - p-value
Male 67.7 68.3 67.0 1.3 -- 0.71 Age in years - - - - ** 0.04
14–15 21.2 19.6 23.1 -3.6 - - 16 45.4 49.5 40.2 9.3 - - 17–19 33.5 30.9 36.7 -5.8 - -
Race - - - - - 0.92 White 32.1 32.4 31.7 0.7 - - Black 43.0 42.1 44.2 -2.1 - - American Indian/AK/HI/Pacific Island 2.6 2.3 3.0 -0.7 - - Asian 0.9 0.9 0.9 0.0 - - Other or unknown 21.4 22.3 20.2 2.1 - -
Ethnicity: Hispanic 70.2 71.5 68.5 3.0 - 0.38 School attendance - - - - * 0.08
Does not attend school 6.4 6.8 6.0 0.8 - - Attends regular high school 53.4 50.3 57.4 -7.1 - - Attends special high school 34.9 35.9 33.6 2.3 - - Attends other school 5.2 7.0 3.0 4.0 - -
Employment and earnings - - - - - - Worked for pay in last year 18.4 19.0 17.5 1.6 - 0.59 Never worked for pay at baseline 67.5 67.6 67.3 0.3 - 0.94 Earnings in calendar year before enrollment ($) 117 117 117 -1 - 0.98
Living arrangement - - - - - 0.81 Two-parent family 19.3 18.9 19.9 -1.0 - - Single-parent family 80.1 80.3 79.9 0.4 - - Group home 0.0 0.0 0.0 0.0 - - Other institution 0.2 0.2 0.3 -0.1 - - Lives alone or with friends 0.4 0.6 0.0 0.6 - -
Family annual income - - - - - 0.32 Less than $10,000 41.8 43.2 40.1 3.2 - - $10,000–$24,999 42.7 43.2 42.1 1.0 - - $25,000 or more 15.5 13.6 17.8 -4.2 - -
Parents’ education - - - - - - Mother is high school graduate 45.7 45.2 46.3 -1.0 - 0.78 Father is high school graduate 48.7 44.9 53.4 -8.5 * 0.07
Expectations about the future - - - - - - Expects to live independently (w/ or w/o help) 71.8 72.1 71.5 0.6 - 0.87 Expects to continue education 96.9 97.1 96.7 0.3 - 0.80 Expects to work at least part time for pay 95.2 95.5 94.9 0.6 - 0.74
SSA benefits - - - - - - Received SSI (only or concurrent with CDB or DI) 100 100 100 0.0 - 1.00 Duration of benefit entitlement (years) 8.8 8.8 8.8 0.1 - 0.87
Primary disabling condition - - - - - 0.69 Mental illness 12.7 13.7 11.5 2.2 - - Cognitive/developmental disability 33.0 31.2 35.3 -4.1 - - Learning disability/ADD 24.3 25.6 22.7 2.9 - - Physical disability 17.9 17.4 18.6 -1.2 - - Speech, hearing, visual impairment 12.0 12.0 11.9 0.1 - -
Self-reported health status - - - - - 0.28 Excellent 20.6 18.9 22.8 -3.8 - - Very good/good 61.8 61.9 61.6 0.2 - - Fair/poor 17.6 19.2 15.6 3.6 - -
Sample size 740 420 320 - - -
Sources: YTD baseline survey and SSA administrative records. Notes: We weighted statistics to adjust for non-response to the 36-month survey. Baseline survey item non-response may have resulted
in smaller sample sizes for some characteristics than indicated at the bottom of the table. Missing information on primary disabling condition resulted in a smaller sample size for this characteristic than shown at the bottom of the table. See Appendix Table A.1a for statistics on the full set of baseline characteristics we examined. All dollar amounts shown in the table are in 2008 dollars.
*/**/*** Treatment-control difference is statistically different from zero at the .10/.05/.01 level using either a two-tailed t-test or a chi-square test.

FINAL REPORT ON THE YTD EVALUATION CHAPTER III: BRONX COUNTY, NEW YORK
28
(18 percent); mental illness (13 percent); and speech, hearing, and visual impairments (12 percent). On average, the sample members had been receiving disability benefits due to these conditions for nearly nine years. Sixty-two percent reported being in good or very good health, whereas 18 percent reported excellent health and 21 percent reported fair or poor health. Notwithstanding their disabilities and mixed health status, nearly three-quarters of the youth reported that they expected to live independently in the future (72 percent) and even larger shares expected to continue their education (97 percent) and to work at least part time for pay (95 percent).
On average, these baseline characteristics are similar for members of the treatment and control groups, as expected, given that they were assigned to these groups at random. We compared 49 baseline characteristics of treatment and control group members in the analytic sample, 19 of which we report in Table III.1 (p-values are shown in the table for these characteristics). We did observe some statistically significant differences between the treatment and control groups, not all of which are shown in the table. For example, at baseline, a larger share of treatment group members was 16 years old (50 vs. 40 percent), but smaller shares of treatment group members attended a regular high school (50 vs. 57 percent) and had fathers who had graduated from high school (45 vs. 53 percent). However, we found that the two groups were very similar overall and the incidence of statistically significant differences was about what we would expect based on chance alone, assuming that the considered baseline characteristics are independent. For example, of the 49 characteristics we investigated, we would expect 2 or 3 to be significantly different at the 5 percent level or lower and about 5 to be significantly different at the 10 percent level or lower. We found statistically significant differences between the treatment and control groups for 2 characteristics at the 5 percent level and 5 at the 10 percent level. Thus, the treatment and control groups in the analytic sample for the three-year impact analysis of the YTDP can be considered equivalent at baseline.
C. Review of findings from the process analysis
The process analysis of the YTDP, described in detail in the interim report (Fraker et al. 2011b), involved assessing the project’s intervention design, implementation, and intensity of services. To inform this analysis, we used a variety of methods to gather information, including a review of project documents, site visits, interviews with managers and staff, and focus groups with participating youth and their parents. We also analyzed data from the project’s management information system to document the efforts of project staff to enroll treatment group youth in the YTDP and deliver services to them.
The process analysis found that, although the YTDP evolved over time, the goal of the project remained to “achieve maximum independence and economic self-sufficiency” among participating youth (CUNY JFK, Jr. Institute 2003). The original program model was piloted for two years by the project before its selection into the YTD random assignment evaluation. Changes in the model for the national evaluation included targeting SSI beneficiaries only (as opposed to a mix of beneficiaries and special education students at risk of becoming beneficiaries), adding Hostos Community College as a service delivery site to accommodate a larger scale of operations, and expanding the career development and benefits counseling components of the intervention. In addition, the project substantially modified the sequence and mode of service delivery; most notably, a summer institute and associated work experience were

FINAL REPORT ON THE YTD EVALUATION CHAPTER III: BRONX COUNTY, NEW YORK
29
dropped. The YTDP replaced them with a two-semester series of Saturday recreational activities and workshops, complementary individualized services, and a culminating summer work experience, potentially followed by nine months of individualized follow-on services. The Saturday workshops for youth and parents focused on self-determination, career development, and benefits planning. The redesigned project retained its original emphasis on fostering independence and self-sufficiency so the participants could have more productive working lives. Another stable aspect of the project was its emphasis on engaging and empowering parents to support the transition efforts of their children and to advocate for them.
The YTDP was an integral part of the community it served, which was critical to its success at engaging youth in the project. It succeeded in enrolling 387 (79 percent) of the 492 randomly assigned treatment group youth in project services. A staffing plan that emphasized the hiring of well-networked community members, combined with the use of workshops and other group activities as the primary service-delivery mechanism, led to high levels of family involvement; this involvement was key to achieving and sustaining a high degree of youth engagement. To encourage family involvement, the YTDP reimbursed all family members for their transportation costs of attending the Saturday workshops, provided food for all attendees, and made daycare available for the siblings of participating youth.
All of the youth who agreed to participate in the YTDP received some project services and their frequency of participation in the workshops was notable. On average, participants had 43 service contacts with project staff, received 43 hours of services, and attended 9 of the 19 scheduled workshops. Employment services were especially well utilized; 92 percent of participants received some type of employment service for an average of 21 hours and half of them had a summer work experience. However, although the amount of services delivered was noteworthy, the project’s 11-month core service-delivery period was short relative to those of the other YTD projects. Furthermore, the brief duration (seven weeks) of the summer work experience and the fact that the youth were paid by the YTDP or New York City’s Summer Youth Employment Program rather than their employers may have limited its potential to positively influence longer-term employment outcomes.
D. Review of impacts one year after enrollment
The YTD evaluation’s interim report on the YTDP (Fraker et al. 2011b) presented the project’s impacts on outcomes in five domains based on data collected 12 months after youth enrolled in the evaluation and were randomly assigned to treatment and control groups: employment-promoting services, paid employment, educational progress, youth income, and attitudes and expectations. Within each domain, we analyzed one primary outcome and a number of supplementary outcomes.
Consistent with the YTD conceptual framework, the YTDP increased the use of employment-promoting services by youth with disabilities. Slightly more than two-thirds of treatment group youth reported having used any employment-promoting service in the year following their enrollment in the evaluation, whereas only slightly more than half of control group youth did so (Table III.2). The impact of the YTDP was a statistically significant increase of 16 percentage points in the use of employment-promoting services. This overall impact was a product of impacts on the use of several specific types of employment services. The largest of
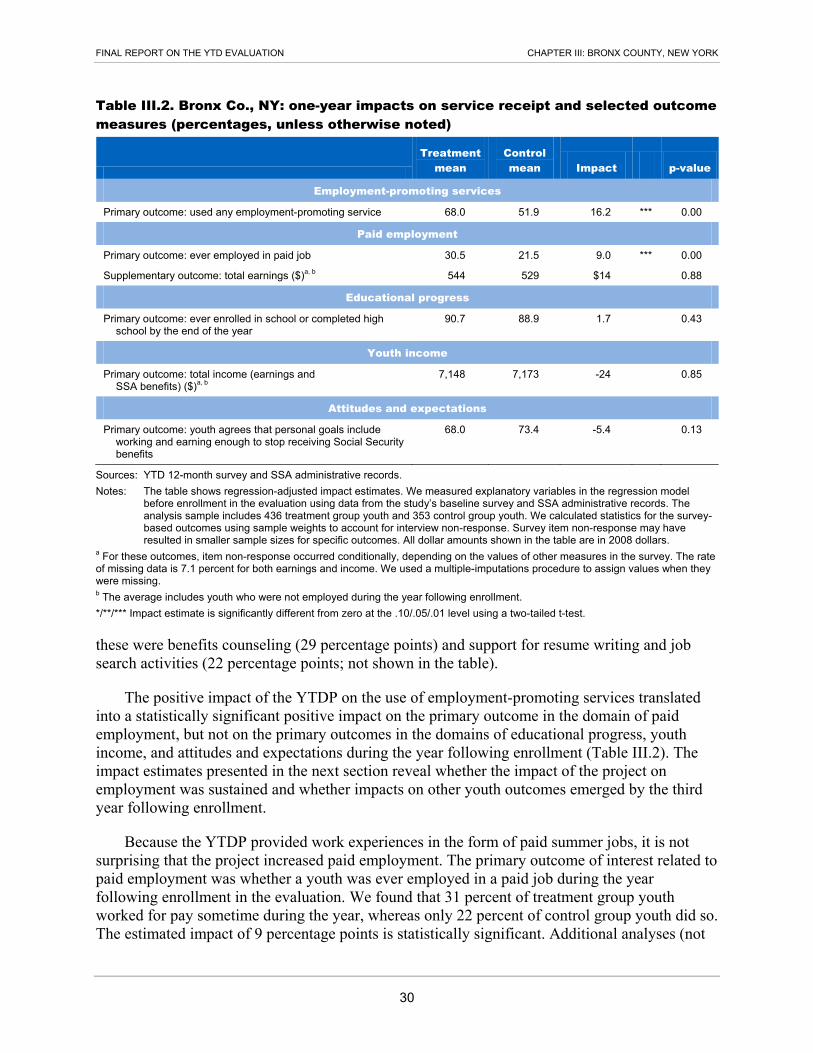
FINAL REPORT ON THE YTD EVALUATION CHAPTER III: BRONX COUNTY, NEW YORK
30
Table III.2. Bronx Co., NY: one-year impacts on service receipt and selected outcome measures (percentages, unless otherwise noted)
-
Treatment mean
Control mean Impact - p-value
Employment-promoting services
Primary outcome: used any employment-promoting service 68.0 51.9 16.2 *** 0.00
Paid employment
Primary outcome: ever employed in paid job 30.5 21.5 9.0 *** 0.00
Supplementary outcome: total earnings ($)a, b 544 529 $14 - 0.88
Educational progress
Primary outcome: ever enrolled in school or completed high school by the end of the year
90.7 88.9 1.7 - 0.43
Youth income
Primary outcome: total income (earnings and SSA benefits) ($)a, b
7,148 7,173 -24 - 0.85
Attitudes and expectations
Primary outcome: youth agrees that personal goals include working and earning enough to stop receiving Social Security benefits
68.0 73.4 -5.4 - 0.13
Sources: YTD 12-month survey and SSA administrative records. Notes: The table shows regression-adjusted impact estimates. We measured explanatory variables in the regression model
before enrollment in the evaluation using data from the study’s baseline survey and SSA administrative records. The analysis sample includes 436 treatment group youth and 353 control group youth. We calculated statistics for the survey-based outcomes using sample weights to account for interview non-response. Survey item non-response may have resulted in smaller sample sizes for specific outcomes. All dollar amounts shown in the table are in 2008 dollars.
a For these outcomes, item non-response occurred conditionally, depending on the values of other measures in the survey. The rate of missing data is 7.1 percent for both earnings and income. We used a multiple-imputations procedure to assign values when they were missing. b The average includes youth who were not employed during the year following enrollment. */**/*** Impact estimate is significantly different from zero at the .10/.05/.01 level using a two-tailed t-test.
these were benefits counseling (29 percentage points) and support for resume writing and job search activities (22 percentage points; not shown in the table).
The positive impact of the YTDP on the use of employment-promoting services translated into a statistically significant positive impact on the primary outcome in the domain of paid employment, but not on the primary outcomes in the domains of educational progress, youth income, and attitudes and expectations during the year following enrollment (Table III.2). The impact estimates presented in the next section reveal whether the impact of the project on employment was sustained and whether impacts on other youth outcomes emerged by the third year following enrollment.
Because the YTDP provided work experiences in the form of paid summer jobs, it is not surprising that the project increased paid employment. The primary outcome of interest related to paid employment was whether a youth was ever employed in a paid job during the year following enrollment in the evaluation. We found that 31 percent of treatment group youth worked for pay sometime during the year, whereas only 22 percent of control group youth did so. The estimated impact of 9 percentage points is statistically significant. Additional analyses (not

FINAL REPORT ON THE YTD EVALUATION CHAPTER III: BRONX COUNTY, NEW YORK
31
shown in the table) revealed that this impact was concentrated in the summer months, confirming that the impact mainly reflected the jobs arranged by the project. Despite the impact on paid employment, we did not find a significant impact on the supplementary outcome of earnings in the year following enrollment. This result is not surprising, given the brevity of the summer jobs into which the YTDP placed many of its participants.
The YTDP provided education services to youth who had education goals or expressed a need for such services. For this reason, we estimated the impacts of the intervention on outcomes in the domain of educational progress. The primary outcome in this domain was whether a youth was ever enrolled in school during the year following enrollment or had successfully completed high school by the time of the 12-month follow-up survey. We found that about 90 percent of both treatment and control group youth achieved this outcome and the project was not a significant determinant of that percentage.
In the domain of youth income, we found that the YTDP had no impact on the primary outcome—total youth income from earnings and disability benefits—during the year following enrollment. Furthermore, although the intervention did improve knowledge of SSA work incentives and requirements, that did not translate into treatment group youth receiving more benefits than control group youth. We found no impact on the total amount of benefits received during the year following enrollment (not shown in table).
Finally, we found that the YTDP had no impact on the primary outcome in the domain of attitudes and expectations. Table III.2 shows that nearly 7 in 10 treatment group youth agreed that their personal goals included working and earning enough to stop receiving disability benefits. However, this proportion was not statistically different from that for the control group.
E. Impacts three years after enrollment
The findings in this section show whether the services provided by the YTDP, combined with SSA’s waivers for YTD, led to longer-term impacts on youth outcomes in five domains. The impact estimates indicate that the project did not increase the paid employment or earnings of youth during the third year following enrollment; however, it did increase their total income, primarily through its impact on benefits. Also, the YTDP decreased the amount of contact youth had with the justice system but it did not significantly affect youth participation in productive activities or self-determination.
This section also presents impact estimates for three pairs of subgroups (six total subgroups) of youth defined by their work experience, age, and highest grade completed when they enrolled in the evaluation. The subgroup analysis focused on the primary outcomes in the five domains. The findings show that for a few subgroups, the project’s impacts on some of the primary outcomes differed from those for the full analytic sample. For youth younger than 17, the YTDP had a positive and statistically significant impact on earnings, whereas for older youth it had a negative and statistically significant impact on this outcome. The project also had negative and statistically significant impacts on participation in any productive activity for youth with work experience and for those who had completed at least the 10th grade at enrollment. Finally, the project’s significant negative impact on contact with the justice system for the full analytic sample was concentrated among youth who had work experience, youth who were younger than 17, and youth who had not completed the 10th grade when they enrolled in the evaluation.
FINAL REPORT ON THE YTD EVALUATION CHAPTER III: BRONX COUNTY, NEW YORK
32
1. The YTDP had no impact on paid employment and earnings The YTDP had no impacts on the two primary outcomes in the domain of employment and
earnings three years after enrollment in the evaluation. Thirty-three percent of the treatment group youth were ever employed in paid jobs during the third year following enrollment (Table III.3); the share was nearly identical for the control group and the difference is not statistically significant.22 The project also had no impact on earnings, which we calculated from youth reports of their hours worked and wage rates on all paid jobs during the third post-enrollment year. This measure of earnings averaged $1,002 among treatment group youth and $976 among control group youth. The difference is not statistically significant.
The YTDP also had no impact on the intensity of employment during the third year following enrollment or employment at the end of the year. Our measure of the intensity of employment is the total hours worked in paid jobs during the year. On average, youth in the treatment group were employed for 128 hours, which is 6 hours less than youth in the control group were employed, but the impact is not statistically significant (Table III.3). Furthermore, we found that the project had no impact on the share of youth with paid jobs at the time of the 36-month survey. Ten percent of the treatment youth were employed at the time of the survey, compared with 14 percent of the control youth, but the difference is not statistically significant. Thus, the project had no impact on either the share of youth with paid jobs at any time during the third year following enrollment or the share employed for pay when last observed at the end of that year.
Consistent with the survey-based findings, when we analyzed employment and earnings based on data from IRS administrative records, we found that the YTDP had no impacts on these outcomes in the third calendar year following enrollment. The share of youth in the treatment group with paid jobs decreased from 48 percent in the first calendar year after enrollment to 35 percent in the second year and remained at 35 percent in the third year (Table III.3). The share in the first calendar year after enrollment is 24 percentage points higher than that for the control group and the difference is statistically significant; however, the shares in the second and third calendar years are not significantly different from the corresponding shares for the control group. Our analysis of the IRS data also revealed no impact of the YTDP on earnings in any of the three calendar years, thus confirming our survey-based finding of no impact on earnings in the third year following enrollment. The mean annual earnings of youth in the treatment group increased from $643 in the first calendar year after enrollment to $865 in the second year and to $1,094 in the third year (Table III.3). These mean values are $120 higher than the control group mean in the first year and $65 and $291 lower than the control group means in the second and third years, respectively, but the differences are not statistically significant.
Subgroup findings. The absence in the full analytic sample of statistically significant impacts of the YTDP on the survey-based measure of paid employment during the third year following enrollment in the evaluation was manifested in all six of the subgroups considered: youth with and without work experience, youth younger than 17 and 17 or older, and youth who had and had not completed the 10th grade (see Appendix Table A.7a). In contrast, unlike the
22 We also found that the YTDP had no statistically significant impact on the share of youth who were employed in any job, without regard for whether they were being paid (results not shown in the table).

FINAL REPORT ON THE YTD EVALUATION CHAPTER III: BRONX COUNTY, NEW YORK
33
Table III.3. Bronx Co., NY: three-year impacts on employment and earnings (percentages, unless otherwise noted)
-
Treatment mean
Control mean Impact - p-value
Primary outcomes
Ever employed in a paid job in the past year a 32.7 32.8 -0.1 - 0.98
Total earnings in the past year ($)a, b, c 1,002 976 25 - 0.89
Supplementary outcomes
Total hours worked in paid jobs in the past yeara, b, c 127.6 133.1 -5.5 - 0.80
Employed in paid job at the time of the 36-month surveya, c 10.4 13.8 -3.4 - 0.16
Calendar year employment (based on IRS records)d - - - - -
First calendar year following enrollment 48.1 24.3 23.8 *** 0.00
Second calendar year following enrollment 34.8 30.0 4.9 - 0.11
Third calendar year following enrollment 34.5 33.7 0.8 - 0.79
Calendar year earnings (based on IRS records) ($)b, d - - - - -
First calendar year following enrollment 643 523 120 - 0.18
Second calendar year following enrollment 865 930 -65 - 0.69
Third calendar year following enrollment 1,094 1,385 -291 - 0.20
Sources: YTD 36-month survey and SSA administrative records. Notes: The treatment and control group means and the impact estimates reported in the table are regression adjusted (see
Chapter II, Section A.3). We measured explanatory variables in the regression model before enrollment in the evaluation by using data from the study’s baseline survey and SSA files. “Past year” refers to the year preceding the 36-month survey. All dollar amounts shown in the table are in 2008 dollars.
a Statistics for these measures are based on data for all youth in the analysis sample, which comprises 420 treatment group youth and 320 control group youth who completed the 36-month survey. We calculated the statistics using sample weights to account for interview non-response. Survey item non-response may have resulted in smaller sample sizes for specific outcomes. See Appendix A, Table A.3a for sample sizes for all outcomes. b We included youth who were not employed during the reference period in our calculation of the mean values of these measures. c For these outcomes, item non-response occurred conditionally, depending on the values of other measures in the survey. The rate of missing data ranges from 0.4 percent to 13.1 percent. We used a multiple-imputations procedure to assign values when they were missing. See Appendix A, Section D for more information on this procedure. d Statistics for these measures are based on data for all youth in the research sample, less 5 youth who were identified as deceased at the time of the 36-month survey. The adjusted research sample comprises 491 treatment group youth and 393 control group youth. */**/*** Impact estimate is significantly different from zero at the .10/.05/.01 level using a two-tailed t-test.
results for the full analytic sample, the project had a statistically significant impact on the survey-based measure of earnings during the third year following enrollment for two of the subgroups: youth younger than 17, for whom the impact was positive, and youth 17 or older, for whom the impact was negative. For both of these subgroups, the impact on earnings was underpinned by the project’s statistically significant impact on total hours worked in paid jobs during the third year following enrollment: for youth younger than 17 this impact was positive, whereas for youth 17 or older it was negative.
2. The YTDP increased youth income and the amount of disability benefits The YTDP had a positive impact on the primary outcome in the domain of youth income.
We measured this outcome—youth total income in the third year after enrollment in the evaluation—by combining earnings based on youth reports in the survey with disability benefit
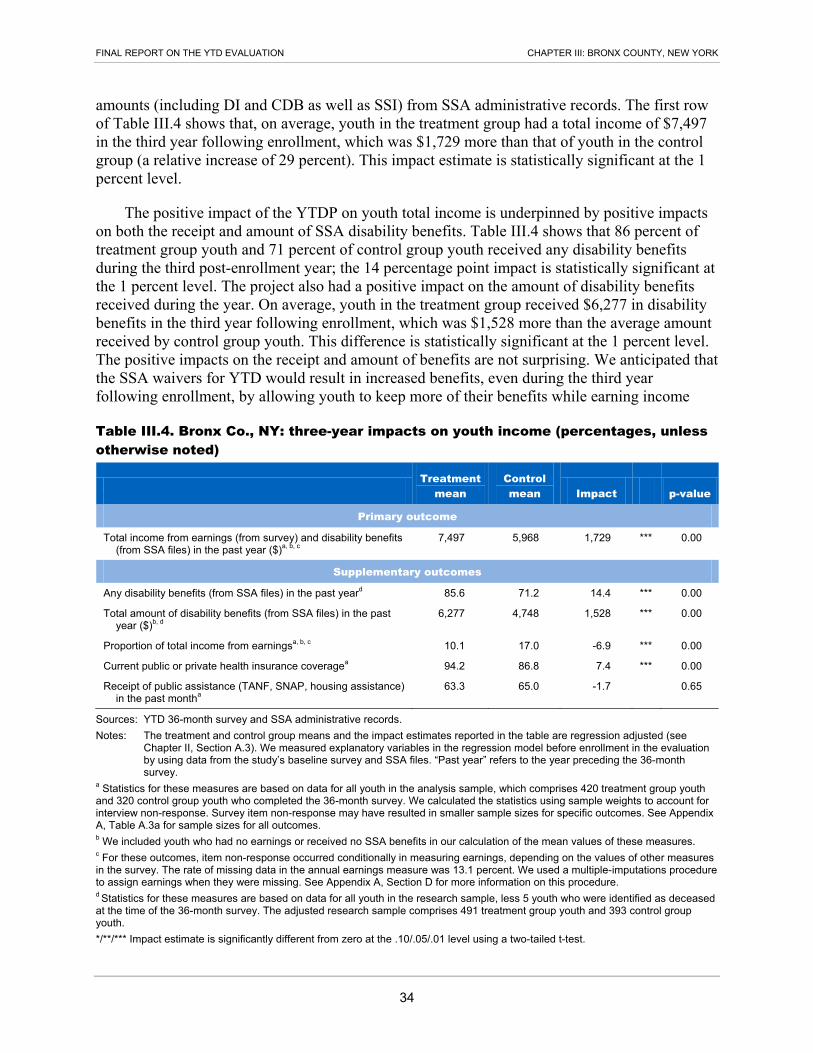
FINAL REPORT ON THE YTD EVALUATION CHAPTER III: BRONX COUNTY, NEW YORK
34
amounts (including DI and CDB as well as SSI) from SSA administrative records. The first row of Table III.4 shows that, on average, youth in the treatment group had a total income of $7,497 in the third year following enrollment, which was $1,729 more than that of youth in the control group (a relative increase of 29 percent). This impact estimate is statistically significant at the 1 percent level.
The positive impact of the YTDP on youth total income is underpinned by positive impacts on both the receipt and amount of SSA disability benefits. Table III.4 shows that 86 percent of treatment group youth and 71 percent of control group youth received any disability benefits during the third post-enrollment year; the 14 percentage point impact is statistically significant at the 1 percent level. The project also had a positive impact on the amount of disability benefits received during the year. On average, youth in the treatment group received $6,277 in disability benefits in the third year following enrollment, which was $1,528 more than the average amount received by control group youth. This difference is statistically significant at the 1 percent level. The positive impacts on the receipt and amount of benefits are not surprising. We anticipated that the SSA waivers for YTD would result in increased benefits, even during the third year following enrollment, by allowing youth to keep more of their benefits while earning income
Table III.4. Bronx Co., NY: three-year impacts on youth income (percentages, unless otherwise noted)
- Treatment
mean Control mean Impact - p-value
Primary outcome
Total income from earnings (from survey) and disability benefits (from SSA files) in the past year ($)a, b, c
7,497 5,968 1,729 *** 0.00
Supplementary outcomes
Any disability benefits (from SSA files) in the past yeard 85.6 71.2 14.4 *** 0.00
Total amount of disability benefits (from SSA files) in the past year ($)b, d
6,277 4,748 1,528 *** 0.00
Proportion of total income from earningsa, b, c 10.1 17.0 -6.9 *** 0.00
Current public or private health insurance coveragea 94.2 86.8 7.4 *** 0.00
Receipt of public assistance (TANF, SNAP, housing assistance) in the past montha
63.3 65.0 -1.7 -- 0.65
Sources: YTD 36-month survey and SSA administrative records. Notes: The treatment and control group means and the impact estimates reported in the table are regression adjusted (see
Chapter II, Section A.3). We measured explanatory variables in the regression model before enrollment in the evaluation by using data from the study’s baseline survey and SSA files. “Past year” refers to the year preceding the 36-month survey.
a Statistics for these measures are based on data for all youth in the analysis sample, which comprises 420 treatment group youth and 320 control group youth who completed the 36-month survey. We calculated the statistics using sample weights to account for interview non-response. Survey item non-response may have resulted in smaller sample sizes for specific outcomes. See Appendix A, Table A.3a for sample sizes for all outcomes. b We included youth who had no earnings or received no SSA benefits in our calculation of the mean values of these measures. c For these outcomes, item non-response occurred conditionally in measuring earnings, depending on the values of other measures in the survey. The rate of missing data in the annual earnings measure was 13.1 percent. We used a multiple-imputations procedure to assign earnings when they were missing. See Appendix A, Section D for more information on this procedure. d Statistics for these measures are based on data for all youth in the research sample, less 5 youth who were identified as deceased at the time of the 36-month survey. The adjusted research sample comprises 491 treatment group youth and 393 control group youth. */**/*** Impact estimate is significantly different from zero at the .10/.05/.01 level using a two-tailed t-test.

FINAL REPORT ON THE YTD EVALUATION CHAPTER III: BRONX COUNTY, NEW YORK
35
through work. Of particular relevance is the Section 301 waiver, which delayed the effectuation of a negative age-18 SSI eligibility redetermination. Very few of the YTDP participants had already been through the redetermination process when they enrolled in the evaluation; most of the others were able to use the Section 301 waiver when their time for redetermination arrived.
Given the findings of no impact on earnings and a positive impact on disability benefit amounts, it is not surprising that we found that the YTDP decreased the share of youth income from earnings relative to benefits. We estimated that 10 percent of the total annual income of treatment group youth came from earnings, compared with 17 percent for control group youth (Table III.4); the negative impact of 7 percentage points (a relative decrease of 41 percent) is statistically significant at the 1 percent level.
The YTDP had an impact on one of two additional indicators of the economic well-being of the youth and their families: it increased health insurance coverage but had no impact on the receipt of public assistance. We found that 94 percent of treatment group youth were covered by either public or private health insurance at the time of the 36-month survey, compared with 87 percent of youth in the control group; the 8 percentage point impact (a relative increase of 9 percent) is statistically significant at the 1 percent level. This finding is explained primarily by a statistically significant increase in public health insurance coverage (not shown in the table). We also found that 63 percent of treatment group youth and 65 percent of control group youth lived in households that received SNAP, TANF, or housing assistance in the month preceding the 36-month survey; however, the 2 percentage point difference is not statistically significant.
Subgroup findings. The significant positive impact in the full analytic sample of the YTDP on youth total income in the third year following enrollment in the evaluation was manifested in all six of the subgroups considered (see Appendix Table A.7a).
3. The YTDP had no impact on participation in productive activities The YTDP had no impact on the primary outcome in the domain of productive activities.
This outcome is a composite measure of a youth’s participation in education, training, and paid or unpaid employment during the third year following enrollment in the evaluation. As shown in Table III.5, 83 percent of treatment group youth and 87 percent of control group youth participated in at least one productive activity, but the 4 percentage point difference is not statistically significant.
Analysis of supplementary outcomes in the domain of productive activities revealed that the YTDP had no impact on participation in education and training programs, completion of high school, or enrollment in a college or technical school. We found that 77 percent of treatment group youth participated in education or training programs during the third year following enrollment in the evaluation, compared with 80 percent of control group youth, but the 3 percentage point difference is not statistically significant. We also found that 37 percent of both treatment and control group youth had completed high school as of the 36-month survey, but again, the difference is not statistically significant. Finally, we found that 9 percent of treatment group youth had enrolled at any time in a college or technical school, compared with 7 percent of control group youth, but the 3 percentage point difference is not statistically significant.
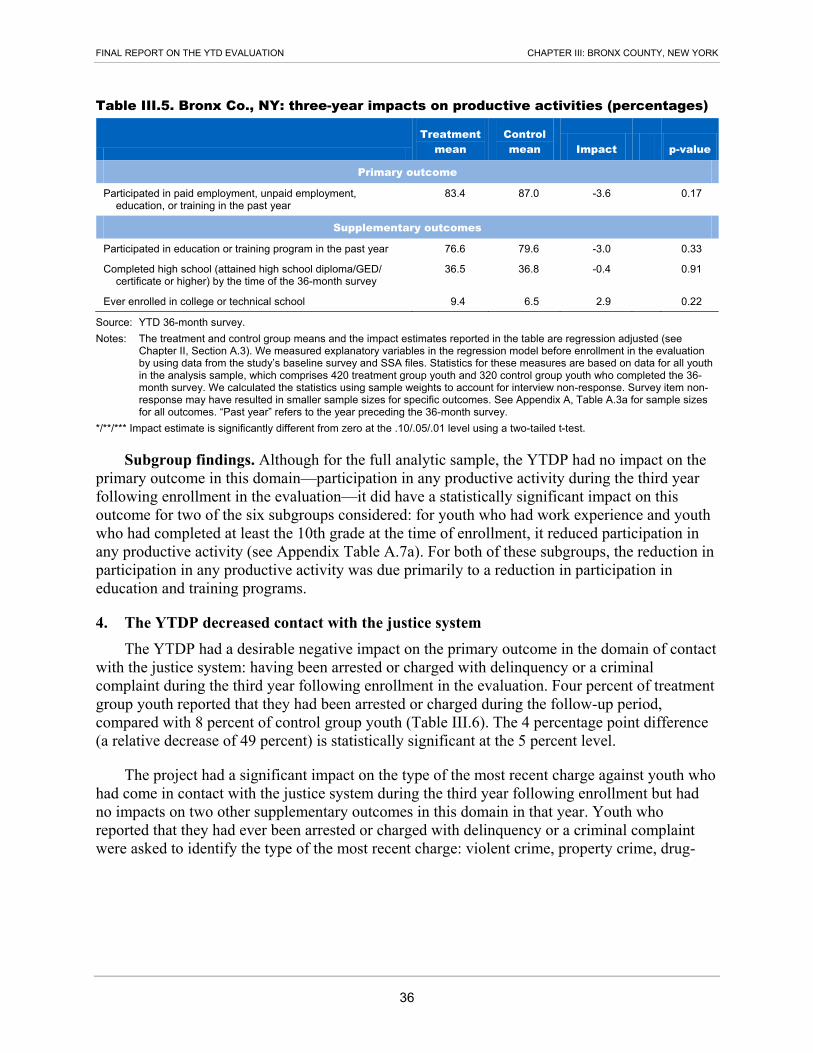
FINAL REPORT ON THE YTD EVALUATION CHAPTER III: BRONX COUNTY, NEW YORK
36
Table III.5. Bronx Co., NY: three-year impacts on productive activities (percentages)
-
Treatment mean
Control mean Impact - p-value
Primary outcome
Participated in paid employment, unpaid employment, education, or training in the past year
83.4 87.0 -3.6 - 0.17
Supplementary outcomes
Participated in education or training program in the past year 76.6 79.6 -3.0 - 0.33
Completed high school (attained high school diploma/GED/ certificate or higher) by the time of the 36-month survey
36.5 36.8 -0.4 - 0.91
Ever enrolled in college or technical school 9.4 6.5 2.9 - 0.22
Source: YTD 36-month survey. Notes: The treatment and control group means and the impact estimates reported in the table are regression adjusted (see
Chapter II, Section A.3). We measured explanatory variables in the regression model before enrollment in the evaluation by using data from the study’s baseline survey and SSA files. Statistics for these measures are based on data for all youth in the analysis sample, which comprises 420 treatment group youth and 320 control group youth who completed the 36-month survey. We calculated the statistics using sample weights to account for interview non-response. Survey item non-response may have resulted in smaller sample sizes for specific outcomes. See Appendix A, Table A.3a for sample sizes for all outcomes. “Past year” refers to the year preceding the 36-month survey.
*/**/*** Impact estimate is significantly different from zero at the .10/.05/.01 level using a two-tailed t-test.
Subgroup findings. Although for the full analytic sample, the YTDP had no impact on the primary outcome in this domain—participation in any productive activity during the third year following enrollment in the evaluation—it did have a statistically significant impact on this outcome for two of the six subgroups considered: for youth who had work experience and youth who had completed at least the 10th grade at the time of enrollment, it reduced participation in any productive activity (see Appendix Table A.7a). For both of these subgroups, the reduction in participation in any productive activity was due primarily to a reduction in participation in education and training programs.
4. The YTDP decreased contact with the justice system The YTDP had a desirable negative impact on the primary outcome in the domain of contact
with the justice system: having been arrested or charged with delinquency or a criminal complaint during the third year following enrollment in the evaluation. Four percent of treatment group youth reported that they had been arrested or charged during the follow-up period, compared with 8 percent of control group youth (Table III.6). The 4 percentage point difference (a relative decrease of 49 percent) is statistically significant at the 5 percent level.
The project had a significant impact on the type of the most recent charge against youth who had come in contact with the justice system during the third year following enrollment but had no impacts on two other supplementary outcomes in this domain in that year. Youth who reported that they had ever been arrested or charged with delinquency or a criminal complaint were asked to identify the type of the most recent charge: violent crime, property crime, drug-

FINAL REPORT ON THE YTD EVALUATION CHAPTER III: BRONX COUNTY, NEW YORK
37
Table III.6. Bronx Co., NY: three-year impacts on contact with the justice system (percentages)
-
Treatment mean
Control mean Impact - p-value
Primary outcome
Arrested or charged with delinquency or a criminal complaint in the past yeara
4.0 7.8 -3.8 ** 0.03
Supplementary outcomes
Type of most recent charge during the past yearb - - - * 0.08
No arrest or criminal or delinquent charge 96.2 92.6 3.6 - -
Violent crime 0.7 2.3 -1.6 - -
Property crime 0.7 0.0 0.7 - -
Drug-related crime 1.0 0.6 0.4 - -
Other crime 1.4 3.5 -2.1 - -
Multiple crimes 0.0 1.0 -1.0 - -
Currently incarcerated (in jail, prison, or detention home)a, c 0.5 1.8 -1.3 - 0.21
Currently on probation or parolea, c 0.8 1.2 -0.4 - 0.69
Since enrollment in the evaluation: - - - - -
Ever arrested or charged with delinquency or a criminal complaint
7.5 10.4 -2.9 - 0.16
Ever convicted of or pled guilty to a chargea 5.7 8.0 -2.3 - 0.25
Ever incarcerated (in jail, prison, or detention home)a, c 0.5 2.0 -1.4 - 0.18
Ever on probation or parolea, c 1.2 2.1 -0.9 - 0.48
Source: YTD 36-month survey. Notes: The treatment and control group means and the impact estimates reported in the table are regression adjusted (see
Chapter II, Section A.3). We measured explanatory variables in the regression model before enrollment in the evaluation by using data from the study’s baseline survey and SSA files. Statistics for these outcomes are based on data for all youth in the analysis sample, which comprises 420 treatment group youth and 320 control group youth who completed the 36-month survey. We calculated the statistics using sample weights to account for interview non-response. “Past year” refers to the year preceding the 36-month survey; “currently” indicates at the time of the 36-month survey.
a Survey item non-response may have resulted in smaller sample sizes for specific outcomes. See Appendix A, Table A.3a for sample sizes for all outcomes. For these outcomes, item non-response occurred conditionally, depending on the values of ever being arrested or charged in the survey. The rate of missing data ranges from 3.9 percent to 10.4 percent. We used a multiple-imputations procedure to assign values when they were missing. See Appendix A, Section D for more information on this procedure. b The estimates for this outcome are not regression adjusted, as the regression model did not converge. c We used linear regression models to estimate impacts on these outcomes, as logistic regression models did not converge. */**/*** Impact estimate is significantly different from zero at the .10/.05/.01 level using a two-tailed t-test or a chi-square test.
related crime, other crime, and multiple crimes.23 To determine the impact of the project on the type of the most recent charge, we conducted a test of the difference between the distributions of treatment and control group youth across these charge types. The project had a significant impacton this distribution by increasing the share of youth who reported no arrest or charge and
23 The shares of treatment and control group youth who reported no arrest or charge of delinquency or a criminal complaint during the third year following enrollment in the evaluation are slightly different from what we would expect based on the corresponding shares for the primary outcome in this domain. This lack of full correspondence is explained by differential rates of item non-response to the underlying survey questions and imputation of conditional missing values for the primary outcome.

FINAL REPORT ON THE YTD EVALUATION CHAPTER III: BRONX COUNTY, NEW YORK
38
reducing the shares who reported being arrested for or charged with a violent crime, other crime, or multiple crimes. However, the YTDP did not affect the shares of youth who were incarcerated or were on probation or parole at the time of the 36-month survey. Less than 1 percent of youth in the treatment group were incarcerated at the time of the survey, compared with 2 percent of youth in the control group; the difference of about 1 percentage point is not statistically significant. About 1 percent of both treatment and control group youth were on probation or parole at the time of the 36-month survey.
The YTDP had no impacts on four supplementary outcomes in this domain pertaining to the entire time between when youth enrolled in the evaluation and when they completed the 36-month survey. The first of these outcomes is whether the youth had ever been arrested or charged with delinquency or a criminal complaint following enrollment. Eight percent of treatment group youth and 10 percent of control group youth reported that this had happened to them. The difference is not statistically significant. Slightly smaller shares of youth reported that they had ever been convicted or pled guilty to a charge (the second outcome) following enrollment. This had happened to 6 percent of treatment youth and 8 percent of control youth. Again, the difference is not statistically significant. Finally, the project had no impacts on whether youth had ever been incarcerated (the third outcome) or had ever been on probation or parole (the fourth outcome) since enrollment.
Subgroup findings. The YTDP’s impact on the primary outcome in the domain of contact with the justice system for the full analytic sample was concentrated in three of the six subgroups considered: youth who had no work experience, youth who were younger than 17, and youth who had not completed the 10th grade when they enrolled in the evaluation. For these youth, the project had a desirable negative and statistically significant impact on the share who had been arrested or charged with delinquency or a criminal complaint during the third year following enrollment (see Appendix Table A.7a).
5. The YTDP had no impact on self-determination Although the YTDP was designed to improve the self-determination of participating youth, it
did not have an impact on any aspect of self-determination that we measured in the 36-month survey. The project sought to improve self-determination both directly, through workshops on self-determination, and indirectly, through services designed to increase self-sufficiency. However, the project had no impact on the primary outcome in the domain of self-determination, which is an index of self-determination measured on a four-point scale, as described in Chapter II. The average value of this index for both treatment and control group youth is 2.9 (Table III.7). Furthermore, the project had no impacts on the three subindices of self-determination, measuring youths’ senses of autonomy, internal locus of control, and external locus of control.
The YTDP also had no impacts on two additional supplementary outcomes in the domain of self-determination: future independence and living arrangement. The binary measure of future independence indicates whether youth agree with the statement that their “goals include working or continuing to work in a paid job.” Eighty-four percent of treatment group youth and 87 percent of control group youth agreed with the statement. The 3 percentage point difference is not statistically significant (Table III.7). The project also had no impact on the living arrangements of youth at the time of the 36-month survey. Focusing first on youth in the treatment group, the table shows that they were most commonly living with their parents or guardians and not receiving

FINAL REPORT ON THE YTD EVALUATION CHAPTER III: BRONX COUNTY, NEW YORK
39
Table III.7. Bronx Co., NY: three-year impacts on self-determination
-
Treatment mean
Control mean Impact - p-value
Primary outcome
Index of self-determinationa (4-point scale) 2.9 2.9 0.0 - 0.64
Supplementary outcomes
Subindices of self-determination (4-point scales) - - - - -
Index of autonomya 2.8 2.8 0.0 - 0.76
Index of internal locus of controla 3.2 3.2 -0.1 - 0.28
Index of external locus of controla 2.6 2.6 0.0 - 0.93
Future independencea (%) 83.8 86.9 -3.1 - 0.30
Living arrangement (%) - - - - 0.35
Independently, without help 2.9 3.3 -0.3 - -
With parents or guardians, without help 59.7 60.2 -0.5 - -
Independently or with parents or guardians, with help 35.7 32.7 3.0 - -
Institutional setting or homeless 1.6 3.9 -2.2 - -
Source: YTD 36-month survey. Notes: The treatment and control group means and the impact estimates reported in the table are regression adjusted (see Chapter
II, Section A.3). We measured explanatory variables in the regression model before enrollment in the evaluation by using data from the study’s baseline survey and SSA files. Statistics for these measures are based on data for all youth in the analysis sample, which comprises 420 treatment group youth and 320 control group youth who completed the 36-month survey. For these outcomes, item non-response ranges from 3.6 percent to 19.5 percent. We calculated the statistics using sample weights to account for interview non-response. Survey item non-response may have resulted in smaller sample sizes for specific outcomes. See Appendix A, Table A.3a for sample sizes for all outcomes.
a See Chapter II, Section A.1 for explanations of these measures of various aspects of self-determination. */**/*** Impact estimate is significantly different from zero at the .10/.05/.01 level using a two-tailed t-test or a chi-square test.
professional help with activities of daily living (60 percent). Three percent were living independently (alone, with a spouse or partner, with his or her own child, or with a roommate or friend) and also were not receiving professional help with activities of daily living. In contrast, 36 percent were receiving professional help with activities of daily living while living either independently or with their parents or guardians. Finally, 2 percent of treatment group youth were living in institutional settings or were homeless. The distribution of living arrangements for control group youth is very similar to that for treatment group youth and the difference is not statistically significant.
Subgroup findings. The absence in the full analytic sample of a statistically significant impact of the YTDP on the primary outcome in the domain of self-determination was manifested in all six of the subgroups considered (see Appendix Table A.7a).
F. Costs of providing services
The cost of the resources used by the YTDP to deliver services was $8,628 per participant, on average. Based on data that we systematically collected from CUNY (the grantee), the project staff, and other sources, we calculated this and other measures of project costs using the methodology outlined in Chapter II (Honeycutt and Murphy 2014c). In this section, we summarize our findings from that analysis, giving particular attention to the total project cost and the costs of project components, in addition to the average cost per participant.

FINAL REPORT ON THE YTD EVALUATION CHAPTER III: BRONX COUNTY, NEW YORK
40
1. The total one-year cost of the YTDP was $1,292,889 The total one-year cost for the YTDP to deliver services to 385 participants was $1,292,889.24
This amount represents the cost of all resources used to operate the project in a selected one-year cost accounting period—September 30, 2007 through September 29, 2008—when project start-up and close-out costs were negligible but enrollment was still ongoing.25, 26
Direct labor was the project’s largest cost category. Wages, salaries, and fringe benefits accounted for 71 percent of total project costs. Indirect costs accounted for 17 percent of total costs, with general administrative costs (including, for example, the cost of support provided by a human resources department), rent and utilities, and food costs for the project’s Saturday workshops being the largest cost components in this category. Other direct costs (payments made directly to participants or to vendors on behalf of participants) accounted for 8 percent of total project costs. These included the wages paid to project participants who had been placed in summer jobs and transportation passes for participants and their families to attend the Saturday workshops. Unbudgeted costs (those that did not entail cash outlays by the project but involved essential resources) accounted for 4 percent of total costs. At no cost to the project, CUNY provided the YTDP with space for its administrative offices, two adjunct faculty members to teach classes as part of the Saturday workshops, and university students to assist in youth recreational activities in conjunction with the workshops.
2. Project administration was the largest cost component Project administration (activities related to the oversight of the YTDP) accounted for a
relatively high 44 percent of total project costs (Table III.8). One reason why administrative costs were high is that the project classified staff preparation for the Saturday workshops as an administrative function. Direct services accounted for the remainder of project costs. Among the four components of direct services, empowerment services (such as the Saturday workshops) and general case management together represented 22 percent of total costs. Employment services (such as facilitating summer work experiences for participants and providing them with job coaches) accounted for 20 percent of total costs. Education services accounted for 9 percent of project costs. Benefits counseling constituted the smallest direct service component, representing only 5 percent of all project costs.
24 Of the 492 randomly assigned treatment group members, 387 participated in YTDP, as did 16 of the 18 non-
randomly assigned treatment group members. We included the latter youth in the cost analysis (but not in the impact analysis) because the project provided services to them and incurred costs in doing so. Only 385 participants were enrolled in the project at some time during the cost accounting period.
25 Enrollment occurred from August 2006 through December 2008. 26 The one-year cost of the YTDP was more than the total funding received from SSA for the same period,
which was $983,882. The primary reason for this difference is that the YTDP received sizeable funding from several other sources, which was unique across the YTD projects. The WIPA program supported the salaries of the YTDP benefits advisors. Funding from Vocational and Educational Services for Individuals with Disabilities supported the salaries of the YTDP project manager and career development specialists and also covered program administration and direct payments to participants. New York State’s Office of Mental Retardation and Developmental Disabilities paid for the costs associated with instructional materials and American Sign Language interpreters. The YTDP also leveraged funds from the New York City Department of Youth and Community Development in the form of wages for youth participating in the Summer Youth Employment Program.

FINAL REPORT ON THE YTD EVALUATION CHAPTER III: BRONX COUNTY, NEW YORK
41
Table III.8. Bronx Co., NY: project costs in the cost accounting period, by program component
Program component Cost in cost
accounting period Percentage of
total cost
Project administration $562,687 44
Direct services - -
Benefits counseling $66,771 5
Education services $122,648 9
Employment services $252,621 20
Empowerment services and case management $288,163 22
Total $1,292,889 100
Sources: YTDP expense reports, personal communication with YTDP staff, and YTDP staff activity reports. Note: All dollar amounts shown in the table are in 2008 dollars.
3. The average cost per YTDP participant was $8,628 The average cost per YTDP participant is a measure of the commitment of resources to serve
youth who enrolled in the project. In the one-year cost accounting period, 385 youth were enrolled in the YTDP for a total of 3,042 months (Table III.9). By dividing the total cost of the project in the accounting period by the total number of enrollment months, we calculate an average cost per enrollment month of $425. This is a measure of the project’s unit cost during the cost accounting period. When we apply the unit cost to the average number of months that youth were enrolled in the YTDP over the entire life of the project—20.3 months—the result is $8,628, which is our estimate of the average cost per participant over the life of the project.
Table III.9. Bronx Co., NY: average project cost per participant
Number of participants in
cost accounting period
(A)
Total person-months of
enrollment in cost accounting
period (B)
Total project cost in cost accounting
period (C)
Average cost per enrollment month in cost
accounting period (D=C/B)
Average number of months of
enrollment over life of project
(E)
Average cost per participant
over life of project (F=DxE)
385 3,042 $1,292,889 $425 20.3 $8,628
Notes: Dollar values are in 2008 dollars. The number of enrollment months for an individual youth is calculated as the number of months from enrollment in the YTDP to the last receipt of services. In Column B, this calculation is bounded by the beginning and ending months of the cost accounting period and is shown in aggregate for all participants in the cost accounting period. In Column E, it is unbounded and is shown as an average for all YTDP participants. All dollar amounts shown in the table are in 2008 dollars.
G. Summary and discussion of findings
This chapter has presented findings that the CUNY Youth Transition Demonstration Project in Bronx County, New York, had no impacts on the primary outcomes in the domains of employment and earnings, participation in productive activities, and self-determination three years after youth enrolled in the YTD evaluation. However, the project did increase youth total income and reduce the share of youth who had been arrested or charged with delinquency or a criminal complaint during the third year following enrollment. The finding of no three-year impact on paid employment stands in contrast to the interim evaluation finding that the YTDP

FINAL REPORT ON THE YTD EVALUATION CHAPTER III: BRONX COUNTY, NEW YORK
42
increased paid employment during the initial post-enrollment year by a statistically significant 9 percentage points (Fraker et al. 2011b).
The YTDP provided youth with a substantial dose of services; participants in the intervention received an average of 43 hours of services of any type (Fraker et al. 2011b). Among the 92 percent of participants who received services specifically focused on employment, the average number of hours of those services was 21. In addition, half of the YTDP participants had seven-week paid work experiences arranged by the project in conjunction with New York City’s Summer Youth Employment Program. The interim impact analysis found that the summer work experiences were critical to the project’s positive impact on paid employment during the year following enrollment. It is possible that certain aspects of those experiences (job placement by the YTDP, short duration, part-time hours, paychecks provided by the Summer Youth Employment Program or YTDP rather than employers) may have limited the extent to which they prepared youth for conventional competitive jobs. This may have been a factor behind the decay of impacts on paid employment between the first and third years following enrollment in the evaluation.
The YTDP’s positive impact on youth total income during the third year after enrollment was due entirely to the project’s impact on the average annual disability benefit amount. The increase in the benefit amount received by treatment cases relative to control cases appears to have been related to a significantly higher rate of receipt of benefits during the third year by youth in the treatment group relative to youth in the control group; 86 percent of treatment youth received benefits, whereas just 74 percent of control youth did so. The positive impact on the rate of receipt of benefits was probably related to the SSA waivers for YTD, particularly the Section 301 waiver, which delayed the effectuation of a negative age-18 redetermination. From the interim evaluation report on this project, we know that at 12-months after enrollment, the YTDP had a 10 percentage point impact on use of the Section 301 waiver. To the extent that the treatment group youth maintained this edge in the rate of use of Section 301 waiver during the third year following enrollment, they would have been more likely to remain eligible for benefits even as many of their control group counterparts were losing their eligibility as a consequence of negative redeterminations.
The YTDP’s negative impact on contact with the justice system is notable. Only 4 percent of treatment group youth had been arrested or charged with delinquency or a criminal complaint during the third year after enrollment, compared with 8 percent of control group youth. The project had no impact on a similar outcome during the initial post-enrollment year. There are several mechanisms by which the project could have achieved this impact several years after services ended. One possible mechanism is that by increasing youth total income, the project reduced the motivation for participants to engage in criminal activities. Another is that by engaging parents and guardians in Saturday workshops, the project improved their parenting and advocacy skills. It is unclear whether these possible mechanisms would have been strong enough to generate the estimated impact on contact with the justice system.

43
IV. COLORADO
Colorado Youth WINS (Youth WINS) increased services received by youth but did not shift away from its original program model, which emphasized case management, to one focused on employment services. Consequently, the project had no impacts on employment and other key outcomes for youth three years after their enrollment in the YTD evaluation. The project provided case management services to youth who were current or recent recipients of Social Security disability benefits (including SSI, DI, and CDB). Our interim report showed that the project maintained fidelity to its original program model but not to the YTD conceptual framework and that it had a statistically significant impact on receipt of services but no impact on paid employment during the year after enrollment (Fraker et al. 2011c). Our analysis of data collected 36 months after youth enrolled in the evaluation revealed that the project had no impacts on employment in paid jobs, earnings, total income, participation in productive activities, or self-determination during the third year following enrollment. However, it did have the undesirable effect of increasing contact with the justice system. The project’s average cost per participant was $7,114.
A. Project overview
Colorado WIN Partners (CWP) of the University of Colorado Denver administered Youth WINS. CWP built on its strong historical relationship with One-Stop Workforce Centers in Colorado to arrange the placement of Youth WINS front-line staff in Centers located in four counties.27 This integration with the Workforce Centers was a unique aspect of the project; the Centers provided an institutional structure that facilitated contact with various Workforce Investment Act partners. A three-person team based in Denver provided centralized management for the project. The team consisted of a project director who was responsible for overall program implementation and management, a project manager who coordinated day-to-day project activities, and a management information system administrator. The Youth WINS front-line staff were organized into four I-Teams (standing for “Independence Teams”), which were based in Workforce Centers in Boulder and Larimer counties north of Denver and Pueblo and El Paso counties south of Denver. Each I-Team consisted of a disability program navigator, a benefits planner, and at least one career counselor. Each I-Team operated under a dual management structure: the local Workforce Center manager provided immediate supervision and the CWP management team provided strategic direction.
Youth WINS engaged participants in a structured discovery and planning process and then provided them with services consistent with their identified needs and goals, primarily by connecting them with the existing service system. Project services for youth included person-centered planning, case management, referrals for supplementary services, benefits planning, and career development. Case management was defined broadly to include goal setting, problem identification, crisis intervention, and meeting identified service needs. Youth WINS engaged families in transition planning and had limited funds to purchase supports for families as well as participants.
27 One-Stop Workforce Centers are now referred to as American Job Centers.
FINAL REPORT ON THE YTD EVALUATION CHAPTER IV: COLORADO
44
Each of the three positions on the I-Teams had a special focus in service delivery. The disability program navigators helped participants understand the services provided by government agencies and community-based organizations to which they were entitled and facilitated access to those services. The benefits planners provided planning services that were focused on but not limited to SSI and DI benefits. They also educated participants about SSA’s waivers for YTD (enhanced work incentives) and encouraged their use through employment. After helping participants explore career options and develop employment goals, the career counselors provided them with assistance in finding jobs consistent with those goals.
Youth WINS served a sufficient number of youth to support a rigorous evaluation. The target population for the project was youth ages 14 through 25 who were receiving Social Security disability benefits and living in the four counties in which the project operated at the time of their enrollment in the study. Using lists of Social Security beneficiaries provided by SSA, Mathematica identified youth who met the project eligibility criteria and recruited 880 of them into the study.28 Sample members were randomly assigned to a treatment group, which was eligible for Youth WINS services and the SSA waivers for YTD, or to a control group, which was eligible for neither but could access other services available in their communities. The project staff enrolled 86 percent of the treatment group members in project services between August 2006 and May 2008. Participants could receive up to 18 months of services. All services ended in fall 2009 and the project formally closed in January 2010.
B. Baseline characteristics of the analytic sample
The analytic sample for the three-year impact analysis of Youth WINS consists of the 727 randomly assigned evaluation enrollees who completed the 36-month follow-up survey.29 As shown in Table IV.1, about three-fifths of sample members were male and about three-quarters were between 18 and 25 years old when they enrolled in the evaluation. The largest racial category among the youth in the analytic sample was white (72 percent), followed by other/unknown (14 percent). Just under one-quarter of the youth across racial groups reported being Hispanic. A little more than half of the sample members were not attending school at baseline, whereas a little less than a third were attending a regular high school; the remainder were attending a special high school or other type of school (including college). A sizable minority of youth (46 percent) had never worked for pay at baseline.
28 Of the 880 youth recruited into the evaluation, 855 were randomly assigned—468 to the treatment group and
387 to the control group. The remaining 25 youth had siblings already in the evaluation and were automatically assigned to the same groups as their siblings (20 treatment cases and 5 control cases); they were not included in the analysis for the evaluation.
29 There is a larger sample of randomly assigned evaluation enrollees for whom we have data on earnings and benefits from administrative records. This full research sample consists of the 855 youth who enrolled in the evaluation and were randomly assigned to treatment or control status, less 13 youth who had died as of the three-year anniversary of their enrollment, for a total of 842 youth (462 treatment and 380 control cases). These cases also constitute the denominator for the calculation of the response rate to the 36-month survey, which was 86.3 percent. For outcomes based on administrative data, we report impact analysis results for the full research sample, less the deceased youth.

FINAL REPORT ON THE YTD EVALUATION CHAPTER IV: COLORADO
45
Table IV.1. Colorado: baseline characteristics of the analytic sample (percentages, unless otherwise noted)
Characteristic All Treatment Control Difference - p-value
Male 57.8 61.8 52.9 8.9 ** 0.02 Age in years - - - - - 0.91
Less than 14 0.1 0.2 0.0 0.2 - - 14–17 24.2 24.8 23.5 1.3 - - 18–21 42.0 42.0 42.1 -0.1 - - 22–25 33.7 33.0 34.4 -1.4 - -
Race - - - - * 0.05 White 71.7 71.1 72.5 -1.4 - - Black 7.7 9.0 6.2 2.8 - - American Indian/AK/HI/Pacific Island 5.0 4.4 5.8 -1.4 - - Asian 1.8 0.7 3.2 -2.5 - - Other or unknown 13.7 14.9 12.4 2.5 - -
Ethnicity: Hispanic 23.2 21.9 24.8 -2.9 0.37 School attendance - - - - - 0.80
Does not attend school 55.8 54.7 57.1 -2.4 - - Attends regular high school 29.2 29.3 29.1 0.2 - - Attends special high school 4.2 4.9 3.5 1.4 - - Attends other school 10.7 11.1 10.3 0.8 - -
Employment and earnings - - - - - - Worked for pay in last year 34.7 37.3 31.6 5.7 - 0.12 Never worked for pay at baseline 45.9 43.7 48.5 -4.7 - 0.22 Earnings in calendar year before enrollment ($) 983 989 977 12 - 0.95
Living arrangement - - - - - 0.92 Two-parent family 46.3 46.9 45.6 1.3 - - Single-parent family 35.0 35.4 34.5 0.9 - - Group home 2.1 2.3 1.9 0.4 - - Other institution 2.6 2.2 3.0 -0.8 - - Lives alone or with friends 14.0 13.2 14.9 -1.7 - -
Family annual income - - - - - 0.68 Less than $10,000 25.1 23.8 26.8 -3.0 - - $10,000–$24,999 27.1 27.2 27.0 0.2 - - $25,000 or more 47.8 49.0 46.2 2.8 - -
Parents’ education - - - - - - Mother is high school graduate 79.3 77.9 81.1 -3.2 - 0.32 Father is high school graduate 79.7 79.1 80.3 -1.2 - 0.74
Expectations about the future - - - - - - Expects to live independently (w/ or w/o help) 70.8 67.6 74.3 -6.6 - 0.11 Expects to continue education 70.2 70.6 69.8 0.9 - 0.83 Expects to work at least part time for pay 87.8 88.4 87.0 1.4 - 0.63
SSA benefits - - - - - - Received SSI (only or concurrent with CDB or DI) 92.4 91.3 93.8 -2.5 - 0.22 Duration of benefit entitlement (years) 6.4 6.5 6.2 0.3 - 0.48
Primary disabling condition - - - - - 0.17 Mental illness 17.3 15.0 20.3 -5.3 - - Cognitive/developmental disability 43.2 45.6 40.2 5.4 - - Learning disability/ADD 7.1 7.8 6.3 1.6 - - Physical disability 24.2 24.8 23.5 1.2 - - Speech, hearing, visual impairment 8.2 6.8 9.8 -3.0 - -
Self-reported health status - - - - * 0.09 Excellent 20.4 21.1 19.6 1.5 - - Very good/good 55.9 58.4 52.8 5.6 - - Fair/poor 23.7 20.5 27.6 -7.1 - -
Sample size 727 403 324 - - -
Sources: YTD baseline survey and SSA administrative records. Notes: We weighted statistics to adjust for non-response to the 36-month survey. Baseline survey item non-response may have resulted in
smaller sample sizes for some characteristics than indicated at the bottom of the table. Missing information on primary disabling condition resulted in a smaller sample size for this characteristic than shown at the bottom of the table. See Appendix Table A.1b for statistics on the full set of baseline characteristics we examined. All dollar amounts shown in the table are in 2008 dollars.
*/**/*** Treatment-control difference is statistically different from zero at the .10/.05/.01 level using either a two-tailed t-test or a chi-square test.

FINAL REPORT ON THE YTD EVALUATION CHAPTER IV: COLORADO
46
Given that almost all of the youth in the analytic sample were receiving SSI, which is means tested, it is not surprising that most were from low-income families. Slightly more than half of the sample members’ families had incomes of less than $25,000 per year. Almost half of the sample members were living with two parents, whereas about a third were living with a single parent; the remainder were either living by themselves or had other arrangements. Almost 80 percent of the youth had a mother who had graduated from high school and a similar proportion had a father who had done so.
Despite having significant mental or physical impairments and mixed current health status, most of the youth in the analytic sample had positive expectations for themselves in the future. The youth’s primary disabling conditions recorded in baseline SSA files can be grouped into five categories, the largest of which is cognitive and developmental disabilities (43 percent). This is followed by physical disabilities (24 percent); mental illness (17 percent); speech, hearing, and visual impairments (8 percent); and learning disabilities and attention deficit disorder (7 percent). On average, the sample members had been receiving disability benefits due to these conditions for more than six years. Fifty-six percent reported being in good or very good health, whereas 20 percent reported excellent health and 24 percent reported fair or poor health. Notwithstanding their disabilities and mixed health status, nearly three-quarters of the youth reported that they expected to live independently in the future (71 percent) and continue their education (70 percent), and an even larger share expected to work at least part time for pay (88 percent).
On average, these baseline characteristics are similar for the members of the treatment and control groups, as expected, given that they were assigned to these groups at random. We compared 50 baseline characteristics of treatment and control group members in the analytic sample, 19 of which we report in Table IV.1 (p-values are shown in the table for these characteristics). We did observe some statistically significant differences between the treatment and control groups, not all of which are shown in the table. For example, at baseline, larger shares of treatment group members were male (62 vs. 53 percent) and had worked for pay in the last month (24 vs. 18 percent). Treatment group members also had somewhat better self-reported health status, with a smaller share reporting fair or poor health (21 vs. 28 percent). However, we found that the two groups were very similar overall and the incidence of statistically significant differences was about what we would expect based on chance alone, assuming that the considered baseline characteristics are independent. For example, of the 50 characteristics we investigated, we would expect 2 or 3 to be significantly different at the 5 percent level or lower and 5 to be significantly different at the 10 percent level or lower. We found statistically significant differences between the treatment and control groups for 2 characteristics at the 5 percent level and 5 at the 10 percent level. Thus, the treatment and control groups in the analytic sample for the three-year impact analysis of Youth WINS can be considered equivalent at baseline.
C. Review of findings from the process analysis
The process analysis of Youth WINS, described in detail in the interim report (Fraker et al. 2011c), involved assessing the project’s intervention design, implementation, and intensity of services. To inform this analysis, we used a variety of methods to gather information, including a review of project documents, site visits, interviews with managers and staff, and focus groups with participating youth and their parents. We also analyzed data from the project’s management

FINAL REPORT ON THE YTD EVALUATION CHAPTER IV: COLORADO
47
information system to document the efforts of project staff to enroll treatment group youth in Youth WINS and deliver services to them.
Youth WINS had been operating for several years prior to its selection into the YTD random assignment evaluation. To facilitate the project’s inclusion in the evaluation, the management of Youth WINS modified the original program model, which had specified a case management intervention focused on brokering services to address the fragmentation of services in the project’s four catchment areas. The modified model included all of the core intervention components in the YTD conceptual framework, including the delivery of employment services. Nevertheless, the project continued to rely heavily on the leveraging of existing services and, over time, it became apparent that the service systems in the study counties could not adequately deliver the job development, job placement, and other employment services that were central to the YTD conceptual framework. While the project was able to shift some staff and training resources to partially address the need for employment services, it ultimately lacked a strong emphasis on employment services and individualized work-based experiences.
Project services began with an assessment of participants’ goals and unmet needs related to their transition to adulthood. Upon completing this assessment, short- and long-term goals for the youth were identified and incorporated into an evolving person-centered plan. The plan specified the services the youth needed to achieve their goals. The I-Teams then arranged for those services to be delivered, either directly by team members or indirectly through referrals to other service providers. Participating youth engaged in benefits planning, disability program navigation services, and career counseling. Youth also participated in employment-related services, including vocational assessments, career exploration, job shadowing, and placement in either unpaid internships or paid employment.
The project succeeded in enrolling 401 (86 percent) of the 468 randomly assigned treatment group youth and delivered services to nearly all of them; 96 percent of the youth who agreed to participate in Youth WINS received some project services. Most participants received case management services (93 percent) and benefits planning services (88 percent). However, only slightly more than half of them (54 percent) received employment-related services, whereas a quarter received education services. The services tended to be of low intensity. Among the youth who received any Youth WINS services, the average number of service contacts was 15 and the average total duration of those contacts was seven hours over the 15-month reference period of the process analysis. Just four of those seven hours of services were specifically focused on employment.
Several aspects of the design and implementation of Youth WINS may have limited the delivery of services in general and employment services in particular. First, Youth WINS management was strongly committed to the original case management program model, which contributed to the project’s lack of focus on employment.30 Second, a lack of clear objectives for
30 The management of Youth WINS disagreed with the characterization that the project lacked focus on employment. For more details on their perspective, see Appendix E to the interim evaluation report on Youth WINS (Fraker et al. 2011a).
FINAL REPORT ON THE YTD EVALUATION CHAPTER IV: COLORADO
48
specific I-Team positions and inadequate training for I-Team members led staff to focus on crisis intervention and case management rather than delivering coordinated services to improve employment outcomes. Finally, the hiring and training of new I-Team members in response to staff turnover was a persistent weakness in the implementation of Youth WINS. Three of the four I-Teams experienced significant staff turnover and two of those were chronically short of staff.
D. Review of impacts one year after enrollment
The YTD evaluation’s interim report on Youth WINS (Fraker et al. 2011c) presented the project’s impacts on outcomes in five domains based on data collected 12 months after youth enrolled in the evaluation and were randomly assigned to treatment and control groups: employment-promoting services, paid employment, educational progress, youth income, and attitudes and expectations. Within each domain, we analyzed one primary outcome and a number of supplementary outcomes.
Consistent with the YTD conceptual framework, Youth WINS increased the use of employment-promoting services by youth with disabilities. Nearly 62 percent of treatment group youth reported having used any employment-promoting service (from Youth WINS or from other service providers) in the year following their enrollment in the evaluation, whereas only 49 percent of the control group youth did so (Table IV.2). The impact of Youth WINS was a statistically significant 12 percentage point increase in the use of employment-promoting services. However, supplementary analyses revealed that this overall impact was the product of impacts on career counseling and benefits counseling, as opposed to services that more directly target employment, such as support for resume writing and job search activities.
Although Youth WINS led to increased use of employment-promoting services, this did not translate into statistically significant impacts on the primary outcomes in the domains of paid employment, educational progress, youth income, and attitudes and expectations during the year following enrollment (Table IV.2). The impact estimates presented in the next section reveal whether impacts of the project on employment and other youth outcomes emerged by the third year following enrollment.
The primary outcome of interest related to paid employment was whether a youth was ever employed in a paid job during the year following enrollment in the evaluation. We found that 34 percent of treatment group youth worked for pay sometime during the year, but this is not significantly different from the 33 percent employment rate that we estimated for control group youth. Similarly, there was no impact on total earnings during the year.
Education services were a component of the Youth WINS program model but were not one of its central features. Thus, we were not surprised to find that the project had no impact on the primary outcome in the domain of educational progress, which was whether a youth was ever enrolled in school during the year following enrollment or had successfully completed high school by the time of the 12-month follow-up survey.
In the domain of youth income, we found that Youth WINS had no impact on the primary outcome—total youth income from earnings and disability benefits—during the year following enrollment. Furthermore, although the intervention did improve knowledge of SSA work incentives and requirements, that did not translate into treatment group youth receiving more

FINAL REPORT ON THE YTD EVALUATION CHAPTER IV: COLORADO
49
Table IV.2. Colorado: one-year impacts on service receipt and selected outcome measures (percentages, unless otherwise noted)
- Treatment
mean Control mean Impact - p-Value
Employment-promoting services
Primary outcome: used any employment-promoting service 61.7 49.3 12.4 *** 0.00
Paid employment
Primary outcome: ever employed in paid job 34.4 33.2 1.3 - 0.67
Supplementary outcome: total earnings ($)a, b 1,574 1,848 -274 - 0.26
Educational progress
Primary outcome: ever enrolled in school or completed high school by the end of the year
86.9 86.8 0.0 - 1.00
Youth income
Primary outcome: total income (earnings and SSA benefits) ($)a, b
--8,314 8,597 -$283 - 0.28
Attitudes and expectations
Primary outcome: youth agrees that personal goals include working and earning enough to stop receiving Social Security benefits
65.9 64.9 1.1
-
0.79
Sources: YTD 12-month survey and SSA administrative records. Notes: The table reports regression-adjusted impact estimates. We measured explanatory variables in the regression model
before enrollment in the evaluation using data from the study’s baseline survey and SSA administrative records. The analysis sample includes 413 treatment group youth and 337 control group youth. We calculated statistics for the survey-based outcomes using sample weights to account for interview non-response. Survey item non-response may have resulted in smaller sample sizes for specific outcomes. All dollar amounts shown in the table are in 2008 dollars.
a For these outcomes, item non-response occurred conditionally, depending on the values of other measures in the survey. The rate of missing data is 8.3 percent for both earnings and income. We used a multiple-imputations procedure to assign values when they were missing. b The average includes youth who were not employed during the year following enrollment. */**/*** Impact estimate is significantly different from zero at the .10/.05/.01 level using a two-tailed t-test.
benefits than did control group youth. We found no impact on the total amount of benefits received during the year following enrollment (not shown in the table).
Finally, we found that Youth WINS had no impact on the primary outcome in the domain of attitudes and expectations. Table V.2 shows that about two-thirds of treatment group youth agreed that their personal goals included working and earning enough to stop receiving disability benefits. However, this proportion was essentially the same for the control group.
E. Impacts three years after enrollment
The findings in this section show whether the services provided by Youth WINS, combined with SSA’s waivers for YTD, led to longer-term impacts on youth outcomes in five domains. The impact estimates indicate that the project had the undesirable effect of increasing youth contact with the justice system during the third year following enrollment. It did not significantly affect youth employment and earnings, total income, participation in productive activities, or self-determination.

FINAL REPORT ON THE YTD EVALUATION CHAPTER IV: COLORADO
50
This section also presents impact estimates for three pairs of subgroups (six total subgroups) of youth defined by their work experience, age, and school enrollment status when they enrolled in the evaluation. The subgroup analysis focused on the primary outcomes in the five domains. The findings show that the undesirable positive impact of Youth WINS on contact with the justice system for the full analytic sample was concentrated among youth who were age 18 or older. Also, in contrast to the absence of an impact on participation in productive activities for the full analytic sample, the project reduced participation in productive activities for youth who were in school when they enrolled in the evaluation. Youth WINS had no statistically significant impacts on any of the other possible combinations of primary outcomes and subgroups.
1. Youth WINS had no impacts on paid employment and earnings Youth WINS had no impacts on the two primary outcomes in the domain of employment and
earnings three years after enrollment in the evaluation. Thirty-eight percent of the treatment group youth were ever employed in paid jobs during the third year following enrollment (Table IV.3); the share was nearly identical for the control group and the difference is not statistically significant.31 The project also had no impact on earnings, which we calculated from youth reports of their hours worked and wage rates on all paid jobs during the third post-enrollment year. This measure of earnings averaged $1,988 among treatment group youth and $2,082 among control group youth. The difference is not statistically significant.
Youth WINS also had no impact on the intensity of employment during the third year following enrollment or employment at the end of the year. Our measure of the intensity of employment is the total hours worked in paid jobs during the year. On average, youth in the treatment group were employed for 255 hours, which is 29 hours less than youth in the control group were employed, but the impact is not statistically significant (Table IV.3). Furthermore, we found that the project had no impact on the share of youth with paid jobs at the time of the 36-month survey. Twenty-five percent of the treatment youth were employed at the time of the survey, compared with 27 percent of the control youth, but the difference of 2 percentage points is not statistically significant. Thus, the project had no impact on either the share of youth with paid jobs at any time during the third year following enrollment or the share who were employed for pay when we last observed them at the end of that year.
Consistent with our survey-based findings, when we analyzed employment and earnings based on data from IRS administrative records, we found that Youth WINS had no impact on these outcomes in the third calendar year following enrollment. The share of youth in the treatment group with paid jobs increased from 39 percent in the first calendar year after enrollment to 43 percent in the second year and then decreased to 37 percent in the third year (Table IV.3). The shares in the first and the third calendar years are very similar to the corresponding shares for the control group, but the share in the second calendar year is 5.2 percentage points larger than that for the control group. Only the difference in the second calendar year is statistically significant at the 10 percent level. Our analysis of the IRS data revealed no impact of Youth WINS on earnings in any of the three calendar years, thus confirming our survey-based finding of no impact on
31 We also found that the Youth WINS project had no statistically significant impact on the share of youth who
were employed in any job, without regard for whether they were being paid (results not shown in the table).

FINAL REPORT ON THE YTD EVALUATION CHAPTER IV: COLORADO
51
Table IV.3. Colorado: three-year impacts on employment and earnings (percentages, unless otherwise noted)
- Treatment
mean Control mean Impact - p-value
Primary outcomes
Ever employed in a paid job in the past year a 37.9 37.7 0.2 - 0.96
Total earnings in the past year ($)a, b, c 1,988 2,082 -94 - 0.76
Supplementary outcomes
Total hours worked in paid jobs in the past yeara, b, c 255.3 284.7 -29.3 - 0.43
Employed in paid job at the time of the 36-month surveya, c 24.7 26.8 -2.1 - 0.48
Calendar year employment (based on IRS records)d - - - -- -
First calendar year following enrollment 38.6 38.6 0.0 - 0.99
Second calendar year following enrollment 42.8 37.7 5.2 * 0.09
Third calendar year following enrollment 36.7 35.6 1.1 - 0.73
Calendar year earnings (based on IRS records) ($)b, d - - - - -
First calendar year following enrollment 1,571 1,413 157 - 0.43
Second calendar year following enrollment 1,807 1,569 239 - 0.34
Third calendar year following enrollment 1,793 1,719 74 - 0.80
Sources: YTD 36-month survey and SSA administrative records. Notes: The treatment and control group means and the impact estimates reported in the table are regression adjusted (see
Chapter II, Section A.3). We measured explanatory variables in the regression model before enrollment in the evaluation by using data from the study’s baseline survey and SSA files. “Past year” refers to the year preceding the 36-month survey. All dollar amounts shown in the table are in 2008 dollars.
a Statistics for these measures are based on data for all youth in the analysis sample, which comprises 403 treatment group youth and 324 control group youth who completed the 36-month survey. We calculated the statistics using sample weights to account for interview non-response. Survey item non-response may have resulted in smaller sample sizes for specific outcomes. See Appendix A, Table A.3b for sample sizes for all outcomes. b We included youth who were not employed during the reference period in our calculation of the mean values of these measures. c For these outcomes, item non-response occurred conditionally, depending on the values of other measures in the survey. The rate of missing data ranges from 0.3 percent to 10.3 percent. We used a multiple-imputations procedure to assign values when they were missing. See Appendix A, Section D for more information on this procedure. d Statistics for these measures are based on data for all youth in the research sample, less 13 youth who were identified as deceased at the time of the 36-month survey. The adjusted research sample comprises 462 treatment group youth and 380 control group youth. */**/*** Impact estimate is significantly different from zero at the .10/.05/.01 level using a two-tailed t-test.
earnings in the third year following enrollment. The mean annual earnings of youth in the treatment group increased from $1,571 in the first calendar year after enrollment to $1,807 in the second year and then decreased slightly to $1,793 in the third year (Table IV.3). These mean values are $157, $239, and $74 higher than the control group means in the three respective years, but the differences are not statistically significant.
Subgroup findings. The absence in the full analytic sample of statistically significant impacts of Youth WINS on the survey-based measures of paid employment and earnings during the third year following enrollment in the evaluation was manifested in all six of the subgroups considered: youth with and without work experience, youth younger than 18 and 18 or older, and in-school and out-of-school youth (see Appendix Table A.7b).

FINAL REPORT ON THE YTD EVALUATION CHAPTER IV: COLORADO
52
2. Youth WINS had no impacts on youth income and the amount of disability benefits Youth WINS had no impact on the primary outcome in the domain of youth income. We
measured this outcome—youth total income in the third year after enrollment in the evaluation—by combining earnings based on youth reports in the survey with disability benefit amounts from SSA administrative records. The first row of Table IV.4 shows that, on average, youth in the treatment group had a total income of $8,863 in the third year following enrollment, which was $82 more than that of youth in the control group; however, the difference is not statistically significant.
The absence of an impact by Youth WINS on youth total income is underpinned by the project’s lack of impacts on both SSA disability benefits as well as earnings. Table IV.4 shows that 93 percent of treatment group youth and 90 percent of control group youth received any disability benefits during the third post-enrollment year, but the difference is not statistically significant. The project also had no impact on the amount of disability benefits received over the course of that year. On average, youth in the treatment group received $6,841 in disability benefits in the third year following enrollment, which was $287 more than the average amount received by control group youth; however, this difference is not statistically significant. The
Table IV.4. Colorado: three-year impacts on youth income (percentages, unless otherwise noted)
- Treatment
mean Control mean Impact - p-value
Primary outcome
Total income from earnings (from survey) and disability benefits (from SSA files) in the past year ($)a, b, c
8,863 8,781 82 - 0.80
Supplementary outcomes
Any disability benefits (from SSA files) in the past yeard 92.6 90.3 2.3 - 0.19
Total amount of disability benefits (from SSA files) in the past year ($)b, d
6,841 6,553 287 - 0.16
Proportion of total income from earningsa, b, c 15.1 16.3 -1.2 - 0.54
Current public or private health insurance coveragea 93.8 93.8 0.0 - 0.99
Receipt of public assistance (TANF, SNAP, housing assistance) in the past montha
35.4 41.5 -6.1 * 0.09
Sources: YTD 36-month survey and SSA administrative records. Notes: The treatment and control group means and the impact estimates reported in the table are regression adjusted (see
Chapter II, Section A.3). We measured explanatory variables in the regression model before enrollment in the evaluation by using data from the study’s baseline survey and SSA files. “Past year” refers to the year preceding the 36-month survey. All dollar amounts shown in the table are in 2008 dollars.
a Statistics for these measures are based on data for all youth in the analysis sample, which comprises 403 treatment group youth and 324 control group youth who completed the 36-month survey. We calculated the statistics using sample weights to account for interview non-response. Survey item non-response may have resulted in smaller sample sizes for specific outcomes. See Appendix A, Table A.3b for sample sizes for all outcomes. b We included youth who had no earnings or received no SSA benefits in our calculation of the mean values of these measures. c For these outcomes, item non-response occurred conditionally in measuring earnings, depending on the values of other measures in the survey. The rate of missing data in the annual earnings measure was 10.3 percent. We used a multiple-imputations procedure to assign earnings when they were missing. See Appendix A, Section D for more information on this procedure. d Statistics for these measures are based on data for all youth in the research sample, less 13 youth who were identified as deceased at the time of the 36-month survey. The adjusted research sample comprises 462 treatment group youth and 380 control group youth. */**/*** Impact estimate is significantly different from zero at the .10/.05/.01 level using a two-tailed t-test.

FINAL REPORT ON THE YTD EVALUATION CHAPTER IV: COLORADO
53
absence of impacts on the amount of benefits received by youth and on their earnings, as documented in Table IV.3, accounts for the project’s lack of an impact on youth total income.
Youth WINS did not shift the source of youth income away from benefits and toward earnings. We estimated that 15 percent of the total annual income of the treatment group youth came from earnings, compared with 16 percent for the control group youth (Table IV.4); the difference is not statistically significant.
We also estimated the project’s impacts on two indicators of the economic well-being of the youth and their families: a measure of health insurance coverage and a measure of the receipt of public assistance. Youth WINS decreased the receipt of public assistance by youth who had enrolled in the evaluation and their families, but had no impact on youth health insurance coverage. Table IV.4 shows that 35 percent of treatment group youth and 42 percent of control group youth lived in households that received SNAP, TANF, or housing assistance in the month preceding the 36-month survey. The negative impact of 6 percentage points (a relative decrease of 15 percent) is statistically significant at the 10 percent level. On the other hand, we found no difference between the treatment and control groups in the rate of health insurance coverage; 94 percent of the youth in both groups were covered by either public or private health insurance at the time of the 36-month survey.
Subgroup findings. The absence in the full analytic sample of a statistically significant impact of Youth WINS on youth total income in the third year following enrollment in the evaluation was manifested in all six of the subgroups considered (see Appendix Table A.7b).
3. Youth WINS had no impact on participation in productive activities Youth WINS had no impact on the primary outcome in the domain of productive activities.
This outcome is a composite measure of a youth’s participation in education, training, and paid or unpaid employment during the third year following enrollment in the evaluation. As shown in Table IV.5, 65 percent of treatment group youth and 67 percent of control group youth participated in at least one productive activity, but the 2 percentage point difference is not statistically significant.
Analysis of supplementary outcomes in the domain of productive activities revealed that Youth WINS had no impact on participation in education and training programs, completion of high school, or enrollment in a college or a technical school. We found that 41 percent of treatment group youth participated in education or training programs during the third year following enrollment in the evaluation, compared with 43 percent of control group youth, but the 2 percentage point difference is not statistically significant. We also found that 71 percent of treatment group youth and 67 percent of control group youth had completed high school as of the 36-month survey, but again, the difference is not statistically significant. Finally, we found that about 13 percent of both treatment group and control group youth had enrolled at any time in a college or technical school.

FINAL REPORT ON THE YTD EVALUATION CHAPTER IV: COLORADO
54
Table IV.5. Colorado: three-year impacts on productive activities (percentages)
- Treatment
mean Control mean Impact - p-value
Primary outcome
Participated in paid employment, unpaid employment, education, or training in the past year
65.0 67.4 -2.4 - 0.48
Supplementary outcomes
Participated in education or training program in the past year 40.5 42.9 -2.3 - 0.49
Completed high school (attained high school diploma/GED/ certificate or higher) by the time of the 36-month survey
71.0 66.7 4.3 - 0.16
Ever enrolled in college or technical school 13.5 13.1 0.4 - 0.86
Source: YTD 36-month survey. Notes: The treatment and control group means and the impact estimates reported in the table are regression adjusted (see
Chapter II, Section A.3). We measured explanatory variables in the regression model before enrollment in the evaluation by using data from the study’s baseline survey and SSA files. Statistics for these measures are based on data for all youth in the analysis sample, which comprises 403 treatment group youth and 324 control group youth who completed the 36-month survey. We calculated the statistics using sample weights to account for interview non-response. Survey item non-response may have resulted in smaller sample sizes for specific outcomes. See Appendix A, Table A.3b for sample sizes for all outcomes. “Past year” refers to the year preceding the 36-month survey.
*/**/*** Impact estimate is significantly different from zero at the .10/.05/.01 level using a two-tailed t-test.
Subgroup findings. Although for the full analytic sample Youth WINS had no impact on the primary outcome in this domain—participation in any productive activity during the third year following enrollment in the evaluation—it did have a statistically significant impact on this outcome for one of the six subgroups considered: for youth who were in school at the time of enrollment, it reduced participation in any productive activity (see Appendix Table A.7b).
4. Youth WINS increased contact with the justice system Youth WINS had an undesirable positive impact on the primary outcome in the domain of
contact with the justice system: having been arrested or charged with delinquency or a criminal complaint during the third year following enrollment in the evaluation. Four percent of treatment youth reported that they had been arrested or charged during the follow-up period, compared with 1 percent of control youth (Table IV.6). The 3 percentage point difference is statistically significant at the 10 percent level. This impact is unexpected and findings from the process analysis provide no insight into what components of the Colorado project may have been responsible for it.
The project had no impacts on three supplementary outcomes in this domain in the third year following enrollment. It did not affect the type of the most recent charge against youth who had come in contact with the justice system during that year (Table IV.6).32 Neither did it affect the shares of youth who were incarcerated or were on probation or parole at the time of the 36-month
32 The shares of treatment and control group youth who reported no arrest or charge of delinquency or a criminal
complaint during the third year following enrollment in the evaluation are slightly different from what we would expect based on the corresponding shares for the primary outcome in this domain. This lack of full correspondence is explained by differential rates of item non-response to the underlying survey questions and imputation of conditional missing values for the primary outcome.
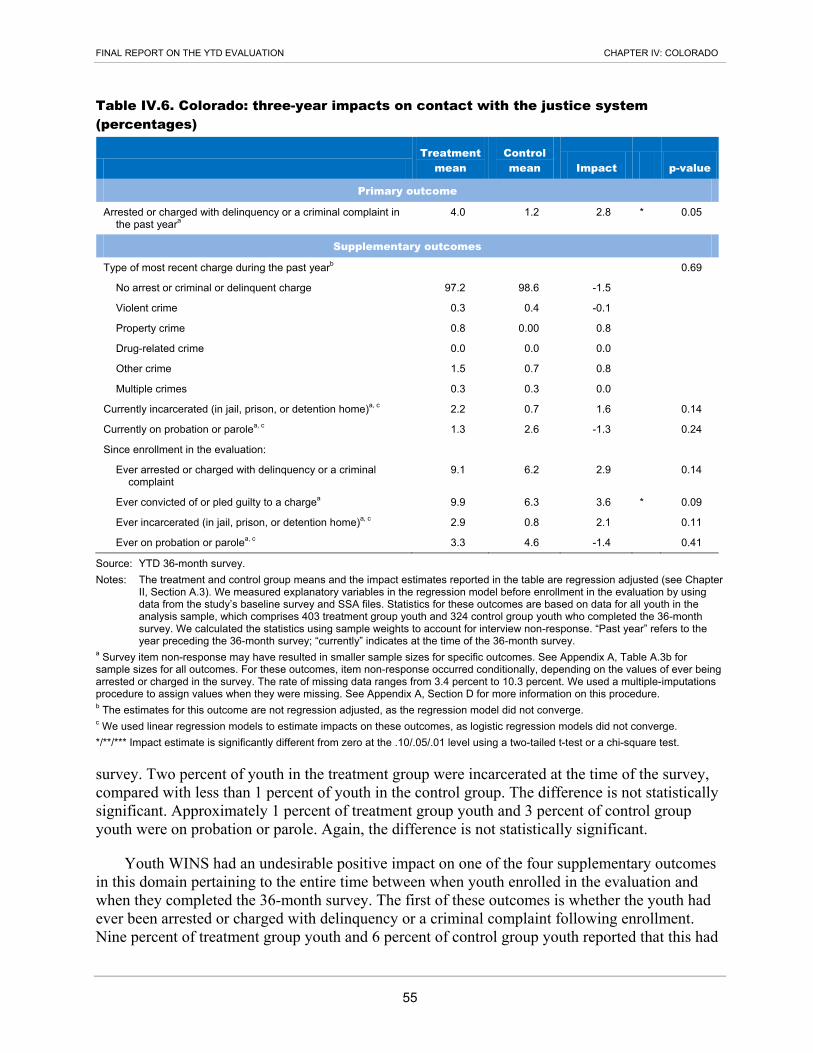
FINAL REPORT ON THE YTD EVALUATION CHAPTER IV: COLORADO
55
Table IV.6. Colorado: three-year impacts on contact with the justice system (percentages)
- Treatment
mean Control mean Impact - p-value
Primary outcome
Arrested or charged with delinquency or a criminal complaint in the past yeara
4.0 1.2 2.8 * 0.05
Supplementary outcomes
Type of most recent charge during the past yearb - - - - 0.69
No arrest or criminal or delinquent charge 97.2 98.6 -1.5 - -
Violent crime 0.3 0.4 -0.1 - -
Property crime 0.8 0.00 0.8 - -
Drug-related crime 0.0 0.0 0.0 - -
Other crime 1.5 0.7 0.8 - -
Multiple crimes 0.3 0.3 0.0 - -
Currently incarcerated (in jail, prison, or detention home)a, c 2.2 0.7 1.6 - 0.14
Currently on probation or parolea, c 1.3 2.6 -1.3 - 0.24
Since enrollment in the evaluation: - - - - -
Ever arrested or charged with delinquency or a criminal complaint
9.1 6.2 2.9 - 0.14
Ever convicted of or pled guilty to a chargea 9.9 6.3 3.6 * 0.09
Ever incarcerated (in jail, prison, or detention home)a, c 2.9 0.8 2.1 - 0.11
Ever on probation or parolea, c 3.3 4.6 -1.4 - 0.41
Source: YTD 36-month survey. Notes: The treatment and control group means and the impact estimates reported in the table are regression adjusted (see Chapter
II, Section A.3). We measured explanatory variables in the regression model before enrollment in the evaluation by using data from the study’s baseline survey and SSA files. Statistics for these outcomes are based on data for all youth in the analysis sample, which comprises 403 treatment group youth and 324 control group youth who completed the 36-month survey. We calculated the statistics using sample weights to account for interview non-response. “Past year” refers to the year preceding the 36-month survey; “currently” indicates at the time of the 36-month survey.
a Survey item non-response may have resulted in smaller sample sizes for specific outcomes. See Appendix A, Table A.3b for sample sizes for all outcomes. For these outcomes, item non-response occurred conditionally, depending on the values of ever being arrested or charged in the survey. The rate of missing data ranges from 3.4 percent to 10.3 percent. We used a multiple-imputations procedure to assign values when they were missing. See Appendix A, Section D for more information on this procedure. b The estimates for this outcome are not regression adjusted, as the regression model did not converge. c We used linear regression models to estimate impacts on these outcomes, as logistic regression models did not converge. */**/*** Impact estimate is significantly different from zero at the .10/.05/.01 level using a two-tailed t-test or a chi-square test.
survey. Two percent of youth in the treatment group were incarcerated at the time of the survey, compared with less than 1 percent of youth in the control group. The difference is not statistically significant. Approximately 1 percent of treatment group youth and 3 percent of control group youth were on probation or parole. Again, the difference is not statistically significant.
Youth WINS had an undesirable positive impact on one of the four supplementary outcomes in this domain pertaining to the entire time between when youth enrolled in the evaluation and when they completed the 36-month survey. The first of these outcomes is whether the youth had ever been arrested or charged with delinquency or a criminal complaint following enrollment. Nine percent of treatment group youth and 6 percent of control group youth reported that this had

FINAL REPORT ON THE YTD EVALUATION CHAPTER IV: COLORADO
56
happened to them. The difference is not statistically significant. The analysis of whether youth had ever been convicted or pled guilty to a charge (the second outcome) following enrollment showed that this had happened to 10 percent of treatment group youth and 6 percent of control group youth; the difference of 4 percentage points is statistically significant at the 10 percent level. Finally, the project had no impacts on whether youth had ever been incarcerated (the third outcome) or had ever been on probation or parole (the fourth outcome) since enrollment.
Subgroup findings. Youth WINS’ impact on the primary outcome in the domain of contact with the justice system for the full analytic sample was concentrated in two of the six subgroups considered: youth who were 18 or older and youth who were in school when they enrolled in the evaluation. For youth in both of these subgroups, the project had an undesirable positive and statistically significant impact on the share who had been arrested or charged with delinquency or a criminal complaint during the third year following enrollment (see Appendix Table A.7b).
5. Youth WINS had no impact on self-determination Youth WINS provided few services designed to directly improve the self-determination of
participating youth (Fraker et al. 2011c); however, the program model, with its emphasis on person-centered planning, had the potential to indirectly result in participants becoming more self-determined. Nevertheless, the project had no impact on the primary outcome in the domain of self-determination, which is an index of self-determination measured on a four-point scale, as described in Chapter II. The average value of this index for both treatment and control group youth is 2.9 (Table IV.7). Furthermore, the project had no impacts on the three subindices of self-determination, measuring youths’ senses of autonomy, internal locus of control, and external locus of control.
Youth WINS also had no impacts on two additional supplementary outcomes in the domain of self-determination: future independence and living arrangement. The binary measure of future independence indicates whether youth agree with the statement that their “goals include working or continuing to work in a paid job.” Eighty-five percent of treatment group youth and 81 percent of control group youth agreed with the statement (Table IV.7). The 4 percentage point difference is not statistically significant. The project also had no impact on the living arrangements of youth at the time of the 36-month survey. Focusing first on youth in the treatment group, the table shows that they were most commonly living with their parents or guardians and not receiving professional help with activities of daily living (44 percent). Sixteen percent were living independently (alone, with a spouse or partner, with his or her own child, or with a roommate or friend) and also were not receiving professional help with activities of daily living. In contrast, 31 percent were receiving professional help with activities of daily living while living either independently or with their parents or guardians. Finally, 9 percent of treatment group youth were living in institutional settings or were homeless. The distribution of living arrangements for control group youth is very similar to that for treatment group youth and the difference is not statistically significant.
Subgroup findings. The absence in the full analytic sample of a statistically significant impact of Youth WINS on the primary outcome in the domain of self-determination was manifested in all six of the subgroups considered (see Appendix Table A.7b).

FINAL REPORT ON THE YTD EVALUATION CHAPTER IV: COLORADO
57
Table IV.7. Colorado: three-year impacts on self-determination
- Treatment
mean Control mean Impact - p-value
Primary outcome
Index of self-determinationa (4-point scale) 2.9 2.9 0.0 0.74
Supplementary outcomes
Subindices of self-determination (4-point scales)
Index of autonomya 2.9 2.9 0.0 0.82
Index of internal locus of controla 3.2 3.2 0.0 0.61
Index of external locus of controla 2.6 2.7 -0.1 0.15
Future independencea (%) 84.8 80.6 4.2 0.20
Living arrangement (%) 0.24
Independently, without help 15.9 15.7 0.2
With parents or guardians, without help 44.3 40.4 3.9
Independently or with parents or guardians, with help 30.9 37.5 -6.6
Institutional setting or homeless 8.8 6.3 2.6
Source: YTD 36-month survey. Notes: The treatment and control group means and the impact estimates reported in the table are regression adjusted (see Chapter
II, Section A.3). We measured explanatory variables in the regression model before enrollment in the evaluation by using data from the study’s baseline survey and SSA files. Statistics for these measures are based on data for all youth in the analysis sample, which comprises 403 treatment group youth and 324 control group youth who completed the 36-month survey. We calculated the statistics using sample weights to account for interview non-response. Survey item non-response may have resulted in smaller sample sizes for specific outcomes. See Appendix A, Table A.3b for sample sizes for all outcomes.
a See Chapter II, Section A.1 for explanations of these measures of various aspects of self-determination. */**/*** Impact estimate is significantly different from zero at the .10/.05/.01 level using a two-tailed t-test or a chi-square test.
F. Costs of providing services
The cost of the resources used by Youth WINS to deliver services was $7,114 per participant, on average. Based on data that we systematically collected from Colorado WIN Partners (the grantee), One-Stop Workforce Center staff, and other sources, we calculated this and other measures of project costs using the methodology outlined in Chapter II (Honeycutt and Murphy 2014d). In this section, we summarize our findings from that analysis, giving particular attention to the total project cost and the costs of project components, in addition to the average cost per participant.
1. The total one-year cost of Youth WINS was $1,292,533 The total one-year cost for Youth WINS to deliver services to 417 participants was
$1,292,533.33 This amount represents the cost of all resources used to operate the project in a selected one-year cost accounting period—October 2007 through September 2008—when project
33 Of the 468 randomly assigned treatment group youth, 401 participated in Youth WINS, as did 17 of the 20
non-randomly assigned treatment group youth. We included the latter in the cost analysis (but not in the impact analysis) because the project provided services to them and incurred costs in doing so. All but one of the 418 participants was enrolled in the project at some time during the cost accounting period.

FINAL REPORT ON THE YTD EVALUATION CHAPTER IV: COLORADO
58
start-up and close-out costs were negligible but enrollment was still ongoing.34 Youth WINS had a distinctive organizational structure, with Colorado WIN Partners administering the project and four Workforce Centers providing direct services. Colorado WIN Partners accounted for more than one-third (36 percent) of the total cost, whereas each Workforce Center accounted for 14 percent to 19 percent of the total cost.
Direct labor was the project’s largest cost category. Wages, salaries, and fringe benefits accounted for 75 percent of total project costs. Indirect costs accounted for 22 percent of total costs, with general administrative costs (including, for example, the cost of support provided by a human resources department) and rent and utilities being the two largest cost components in this category. Indirect costs accounted for a much larger percentage of Colorado WIN Partners’ project costs (32 percent) than was the case for the Workforce Centers (15 percent to 18 percent). Other direct costs and unbudgeted costs were both small, each representing less than 2 percent of the project’s total cost. Most of the other direct costs were incurred by the Workforce Center in El Paso County, which paid some participants stipends during their employment experiences and relied on a staffing agency for job coaches. These costs represented 7 percent of that agency’s total cost of operating Youth WINS. Also, the El Paso Workforce Center incurred the project’s only unbudgeted costs (those that did not entail cash outlays by the project but involved essential resources); a supervisor at that Workforce Center provided oversight to the local I-Team members but was not funded by Youth WINS.
2. Project administration was the largest cost component Project administration (activities related to the oversight of Youth WINS) accounted for more
than half (57 percent) of total project costs (Table IV.8). In part, this was a function of the project’s organizational structure, in which Colorado WIN Partners incurred 36 percent of all costs but provided no services directly to participants. Thus, 100 percent of WIN Partners’ costs were for project administration. In contrast to WIN Partners, the four Workforce Centers, which provided all of the project’s services, had lower proportions of their costs associated with project administration (from 21 percent to 49 percent).
Table IV.8. Colorado: project costs in the cost accounting period, by program component
Program component Cost in cost
accounting period Percentage of
total cost
Project administration $732,570 57 Direct services - -
Benefits counseling $113,867 9 Education services $29,108 2 Employment services $165,840 13 Empowerment services and case management $251,149 19
Total $1,292,533 100 Sources: Finance system reports from the University of Colorado Reporting System, subcontractor expense reports, personal
communication with Youth WINS staff, and Youth WINS staff activity reports. Note: All dollar amounts shown in the table are in 2008 dollars.
34 Enrollment occurred from August 2006 through May 2008.
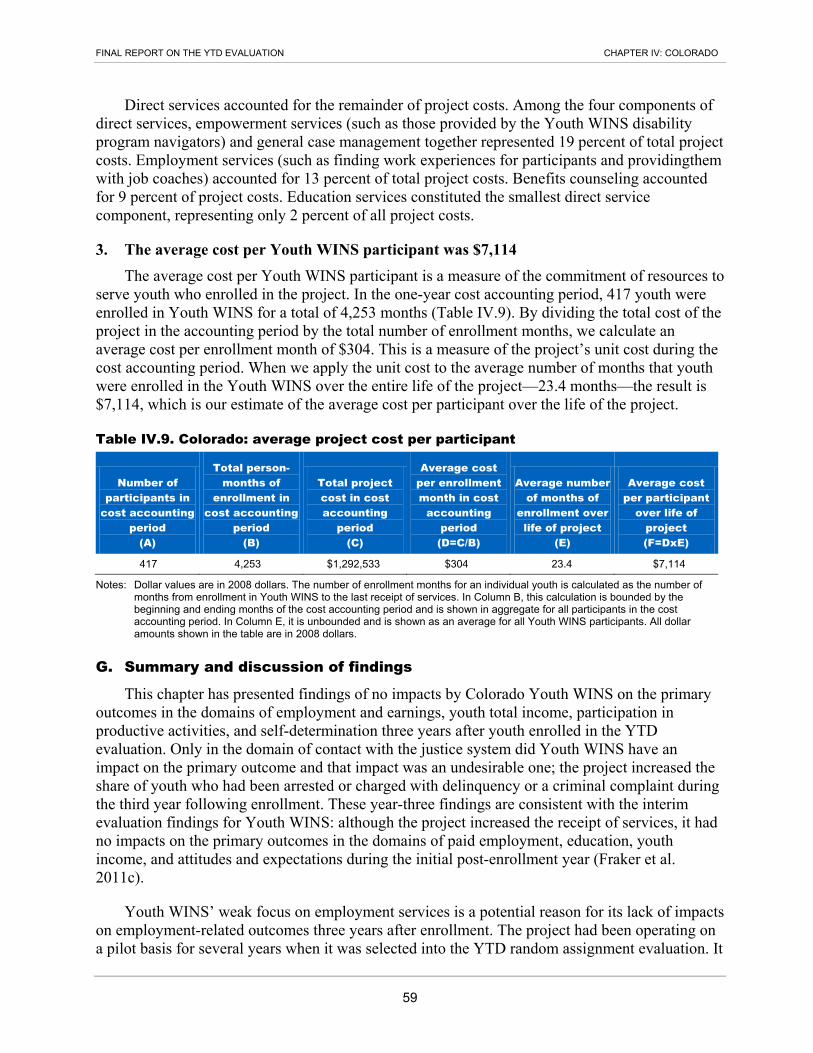
FINAL REPORT ON THE YTD EVALUATION CHAPTER IV: COLORADO
59
Direct services accounted for the remainder of project costs. Among the four components of direct services, empowerment services (such as those provided by the Youth WINS disability program navigators) and general case management together represented 19 percent of total project costs. Employment services (such as finding work experiences for participants and providingthem with job coaches) accounted for 13 percent of total project costs. Benefits counseling accounted for 9 percent of project costs. Education services constituted the smallest direct service component, representing only 2 percent of all project costs.
3. The average cost per Youth WINS participant was $7,114 The average cost per Youth WINS participant is a measure of the commitment of resources to
serve youth who enrolled in the project. In the one-year cost accounting period, 417 youth were enrolled in Youth WINS for a total of 4,253 months (Table IV.9). By dividing the total cost of the project in the accounting period by the total number of enrollment months, we calculate an average cost per enrollment month of $304. This is a measure of the project’s unit cost during the cost accounting period. When we apply the unit cost to the average number of months that youth were enrolled in the Youth WINS over the entire life of the project—23.4 months—the result is $7,114, which is our estimate of the average cost per participant over the life of the project.
Table IV.9. Colorado: average project cost per participant
Number of participants in
cost accounting period
(A)
Total person-months of
enrollment in cost accounting
period (B)
Total project cost in cost accounting
period (C)
Average cost per enrollment month in cost
accounting period (D=C/B)
Average number of months of
enrollment over life of project
(E)
Average cost per participant
over life of project (F=DxE)
417 4,253 $1,292,533 $304 23.4 $7,114
Notes: Dollar values are in 2008 dollars. The number of enrollment months for an individual youth is calculated as the number of months from enrollment in Youth WINS to the last receipt of services. In Column B, this calculation is bounded by the beginning and ending months of the cost accounting period and is shown in aggregate for all participants in the cost accounting period. In Column E, it is unbounded and is shown as an average for all Youth WINS participants. All dollar amounts shown in the table are in 2008 dollars.
G. Summary and discussion of findings
This chapter has presented findings of no impacts by Colorado Youth WINS on the primary outcomes in the domains of employment and earnings, youth total income, participation in productive activities, and self-determination three years after youth enrolled in the YTD evaluation. Only in the domain of contact with the justice system did Youth WINS have an impact on the primary outcome and that impact was an undesirable one; the project increased the share of youth who had been arrested or charged with delinquency or a criminal complaint during the third year following enrollment. These year-three findings are consistent with the interim evaluation findings for Youth WINS: although the project increased the receipt of services, it had no impacts on the primary outcomes in the domains of paid employment, education, youth income, and attitudes and expectations during the initial post-enrollment year (Fraker et al. 2011c).
Youth WINS’ weak focus on employment services is a potential reason for its lack of impacts on employment-related outcomes three years after enrollment. The project had been operating on a pilot basis for several years when it was selected into the YTD random assignment evaluation. It
FINAL REPORT ON THE YTD EVALUATION CHAPTER IV: COLORADO
60
had a fully developed program model that emphasized case management and filling gaps in a fragmented service system, but did not include a strong employment component. The commitment of Youth WINS management and staff to the original program model was a persistent barrier to their modifying it to substantially increase the emphasis on employment. One manifestation of this was resistance by project management to technical assistance offered by TransCen, which resulted in staff who were not well trained to deliver individualized job development and job placement services to youth with disabilities (Fraker et al. 2011c).
In addition, the project’s management structure may have resulted in a low intensity of services, which in turn may have contributed to the lack of impacts on employment-related outcomes. The dual management structure of Youth WINS—central management by Colorado WIN Partners in Denver and supervision of the I-Team front-line staff by the directors of the four One-Stop Workforce Centers where they were housed—made it difficult to resolve staff-related issues quickly. In particular, there were chronic staff vacancies on the I-Teams, which may have contributed to the generally low intensity of services received by Youth WINS participants. On average, participants received just seven hours of project services of any type, of which only four hours were specifically focused on employment.
Given the limitations of the program model, weaknesses in project management, and lack of intensity in services, the finding of no desirable impacts of Youth WINS three years after youth enrolled in the evaluation is not surprising. The absence of impacts suggests that, without strong and well-designed services, enhanced SSA work incentives may be insufficient to produce positive impacts on employment and earnings among youth recipients of SSA disability benefits.

61
V. ERIE COUNTY, NEW YORK
The Transition WORKS project in Erie County, New York, was well-implemented, increased services received by youth, and increased the employment and income of youth three years after their enrollment in the YTD evaluation. The project provided services to promote self-determination and employment among youth who were receiving Social Security disability benefits (including SSI, DI, and CDB). Our interim report showed that the project maintained a high degree of fidelity to its program model and to the YTD conceptual framework and that it had a statistically significant impact on the receipt of services but no impact on paid employment during the year after enrollment (Fraker et al. 2011a). However, our analysis of data collected 36 months after youth enrolled in the evaluation revealed longer-term impacts of the project on employment-related outcomes. We found that it had positive and statistically significant impacts on employment in paid jobs as well as earnings and income during the third year following enrollment, but it did not have any impacts on participation in productive activities, contact with the justice system, or self-determination. The project’s average cost per participant was $5,232.
A. Project overview
The Erie 1 Board of Cooperative Educational Services (BOCES) partnered with three other prominent community organizations to implement the Transition WORKS project. Erie 1 BOCES, one of 37 regional public education service organizations that serve school districts throughout New York State, administered the project and directly delivered many of its services. To strengthen the project, it established formal partnerships with Neighborhood Legal Services (NLS), the Community Employment Office (CEO), and the Parent Network of Western New York. The project was directed by the assistant director for School Support Services at Erie 1 BOCES and staffed by employees of Erie 1 BOCES and the three formal partner organizations. The key staff included an assistant project director, two transition coordinators, and five job developers at Erie 1 BOCES, three full-time and three part-time benefits planners at NLS, a full-time employment specialist and a part-time assistant at the CEO, and several part-time trainers at the Parent Network.
Transition WORKS provided youth with services intended to promote their self-determination and economic self-sufficiency. The project was designed to fill gaps in existing transition services in Erie County. It provided training on self-determination and self-advocacy for youth and their parents or guardians, transition planning, work-based experiences and other employment services, education support services, training on the organization of benefits-related paperwork, social and health services, and counseling on SSA benefits and waivers.
There was considerable specialization among the partner organizations in the delivery of these services. Erie 1 BOCES provided most project services, including self-determination workshops, education services, and most employment services. The Parent Network provided training for parents on youth benefits and services, the NLS provided benefits-planning services, and the CEO provided pre-employment services, such as assistance with preparing resumes and mock interviewing.
Transition WORKS served a sufficient number of youth to support a rigorous evaluation. The target population for the project was youth ages 16 through 25 who were receiving Social

FINAL REPORT ON THE YTD EVALUATION CHAPTER V: ERIE COUNTY, NY
62
Security disability benefits and living in Erie County at the time of their enrollment in the study. Using lists of Social Security beneficiaries provided by SSA, Mathematica identified youth who met the project eligibility criteria and recruited 880 of them into the study.35 Sample members were randomly assigned to a treatment group, which was eligible for Transition WORKS services and the SSA waivers for YTD, or to a control group, which was eligible for neither but could access other services available in the community. The project staff enrolled 83 percent of the treatment group members in project services between January 2007 and May 2008. Participants could receive up to 18 months of services. All services ended in fall 2009 and the project formally closed in December of that year.
B. Baseline characteristics of the analytic sample
The analytic sample for the three-year impact analysis of Transition WORKS consists of the 718 randomly assigned evaluation enrollees who completed the 36-month follow-up survey.36 As shown in Table V.1, about three in five of the sample members were male and about three-quarters were between 18 and 25 years old when they enrolled in the evaluation. The largest racial category among the youth in the analytic sample was white (55 percent), followed by black (35 percent). Only 9 percent of the youth across racial groups reported being Hispanic. About half of the sample members were not attending school at baseline, whereas a little more than a quarter were attending a regular high school; the rest were attending a special high school or other type of school (including college). A sizeable minority of the youth (42 percent) had never worked for pay at baseline.
Given that almost all of the youth in the analytic sample were receiving SSI, which is means tested, it is not surprising that most were from low-income families. More than two-thirds of the sample members’ families had incomes of less than $25,000 per year. Half of the sample members were living with a single parent, whereas only about a third were living with two parents; the remainder either were living by themselves or had other arrangements. About three-quarters of the youth had a mother who had graduated from high school and a similar fraction had a father who had done so.
Despite having significant mental or physical impairments and mixed current health status, most of the youth in the analytic sample had positive expectations for themselves in the future. The youth’s primary disabling conditions recorded in baseline SSA files can be grouped into five categories, the largest of which is cognitive and developmental disabilities (45 percent). This is
35 Of the 880 youth recruited into the evaluation, 843 were randomly assigned––459 to the treatment group and
384 to the control group. The remaining 37 youth had siblings already in the evaluation and were automatically assigned to the same groups as their siblings (21 treatment cases and 16 control cases); they were not included in the analysis for the evaluation.
36 There is a larger sample of randomly assigned evaluation enrollees for whom we have data on earnings and benefits from administrative records. This full research sample consists of the 843 youth who enrolled in the evaluation and were randomly assigned to treatment or control status, less 16 youth who had died as of the three-year anniversary of their enrollment, for a total of 827 youth (454 treatment and 373 control cases). These cases also constitute the denominator for the calculation of the response rate to the 36-month survey, which was 86.8 percent. For outcomes based on administrative data, we report impact analysis results for the full research sample, less the deceased youth.
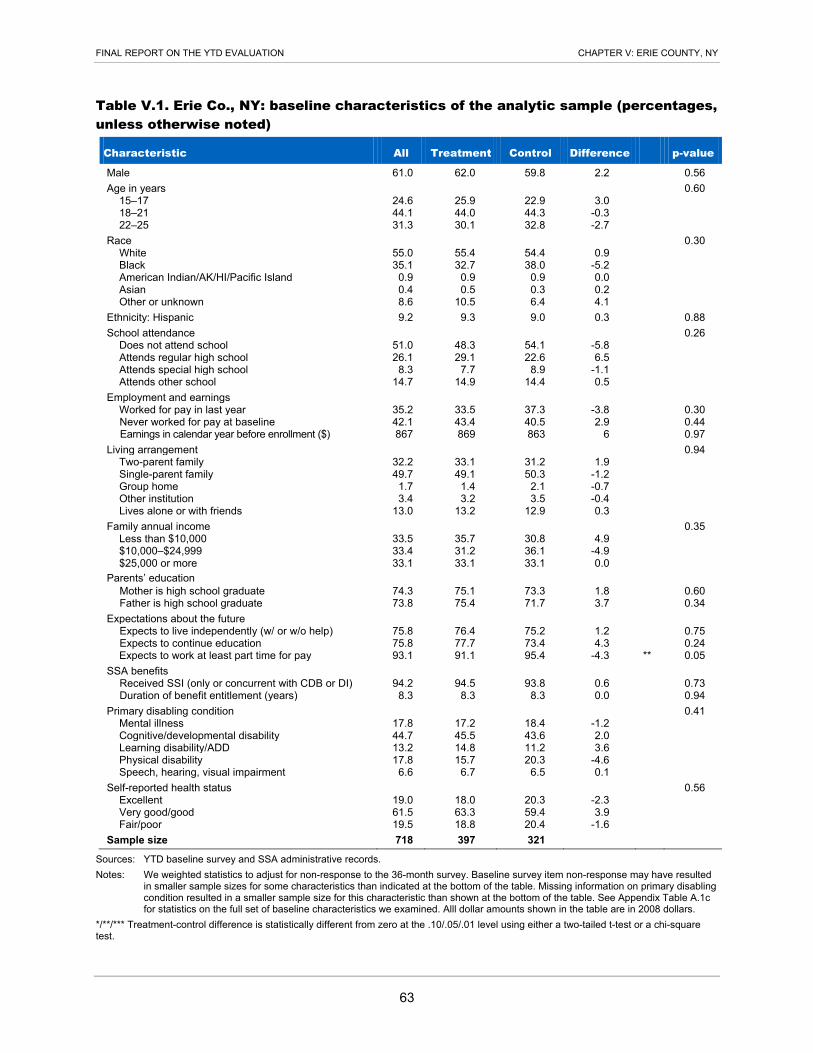
FINAL REPORT ON THE YTD EVALUATION CHAPTER V: ERIE COUNTY, NY
63
Table V.1. Erie Co., NY: baseline characteristics of the analytic sample (percentages, unless otherwise noted)
Characteristic All Treatment Control Difference - p-value
Male 61.0 62.0 59.8 2.2 - 0.56 Age in years - - - - - 0.60
15–17 24.6 25.9 22.9 3.0 - - 18–21 44.1 44.0 44.3 -0.3 - - 22–25 31.3 30.1 32.8 -2.7 - -
Race - - - - - 0.30 White 55.0 55.4 54.4 0.9 - - Black 35.1 32.7 38.0 -5.2 - - American Indian/AK/HI/Pacific Island 0.9 0.9 0.9 0.0 - - Asian 0.4 0.5 0.3 0.2 - - Other or unknown 8.6 10.5 6.4 4.1 - -
Ethnicity: Hispanic 9.2 9.3 9.0 0.3 - 0.88 School attendance - - - - - 0.26
Does not attend school 51.0 48.3 54.1 -5.8 - - Attends regular high school 26.1 29.1 22.6 6.5 - - Attends special high school 8.3 7.7 8.9 -1.1 - - Attends other school 14.7 14.9 14.4 0.5 - -
Employment and earnings - - - - - - Worked for pay in last year 35.2 33.5 37.3 -3.8 - 0.30 Never worked for pay at baseline 42.1 43.4 40.5 2.9 - 0.44 Earnings in calendar year before enrollment ($) 867 869 863 6 - 0.97
Living arrangement - - - - - 0.94 Two-parent family 32.2 33.1 31.2 1.9 - - Single-parent family 49.7 49.1 50.3 -1.2 - - Group home 1.7 1.4 2.1 -0.7 - - Other institution 3.4 3.2 3.5 -0.4 - - Lives alone or with friends 13.0 13.2 12.9 0.3 - -
Family annual income - - - - - 0.35 Less than $10,000 33.5 35.7 30.8 4.9 - - $10,000–$24,999 33.4 31.2 36.1 -4.9 - - $25,000 or more 33.1 33.1 33.1 0.0 - -
Parents’ education - - - - - - Mother is high school graduate 74.3 75.1 73.3 1.8 - 0.60 Father is high school graduate 73.8 75.4 71.7 3.7 - 0.34
Expectations about the future - - - - - - Expects to live independently (w/ or w/o help) 75.8 76.4 75.2 1.2 - 0.75 Expects to continue education 75.8 77.7 73.4 4.3 - 0.24 Expects to work at least part time for pay 93.1 91.1 95.4 -4.3 ** 0.05
SSA benefits - - - - - - Received SSI (only or concurrent with CDB or DI) 94.2 94.5 93.8 0.6 - 0.73 Duration of benefit entitlement (years) 8.3 8.3 8.3 0.0 - 0.94
Primary disabling condition - - - - - 0.41 Mental illness 17.8 17.2 18.4 -1.2 - - Cognitive/developmental disability 44.7 45.5 43.6 2.0 - - Learning disability/ADD 13.2 14.8 11.2 3.6 - - Physical disability 17.8 15.7 20.3 -4.6 - - Speech, hearing, visual impairment 6.6 6.7 6.5 0.1 - -
Self-reported health status - - - - - 0.56 Excellent 19.0 18.0 20.3 -2.3 - - Very good/good 61.5 63.3 59.4 3.9 - - Fair/poor 19.5 18.8 20.4 -1.6 - -
Sample size 718 397 321 - - -
Sources: YTD baseline survey and SSA administrative records. Notes: We weighted statistics to adjust for non-response to the 36-month survey. Baseline survey item non-response may have resulted
in smaller sample sizes for some characteristics than indicated at the bottom of the table. Missing information on primary disabling condition resulted in a smaller sample size for this characteristic than shown at the bottom of the table. See Appendix Table A.1c for statistics on the full set of baseline characteristics we examined. Alll dollar amounts shown in the table are in 2008 dollars.
*/**/*** Treatment-control difference is statistically different from zero at the .10/.05/.01 level using either a two-tailed t-test or a chi-square test.

FINAL REPORT ON THE YTD EVALUATION CHAPTER V: ERIE COUNTY, NY
64
followed by mental illness (18 percent); physical disabilities (18 percent); learning disabilities and attention deficit disorder (13 percent); and speech, hearing, and visual impairments (7 percent). On average, the sample members had been receiving disability benefits due to these conditions for more than eight years. Sixty-two percent reported being in good or very good health, whereas 19 percent reported excellent health and the same share reported fair or poor health. Notwithstanding their disabilities and mixed health status, more than three-quarters of the youth reported that they expected to live independently in the future (76 percent) and continue their education (76 percent), and an even larger share expected to work at least part time for pay (93 percent).
On average, these baseline characteristics are similar for members of the treatment and control groups, as expected, given that they were assigned to these groups at random. We compared 50 baseline characteristics of treatment and control group members in the analytic sample, 19 of which we report in Table V.1 (p-values are shown in the table for these characteristics). We did observe some statistically significant differences between the treatment and control groups, not all of which are shown in the table. For example, at baseline, smaller shares of treatment group members had a high school diploma, GED, or certificate of completion (37 vs. 44 percent); worked for pay in the last month (16 vs. 22 percent); and expected to work at least part time for pay (91 vs. 95 percent). However, we found that the two groups were very similar overall and the incidence of statistically significant differences was about what we would expect based on chance alone, assuming that the considered baseline characteristics are independent. For example, of the 50 characteristics we investigated, we would expect 2 or 3 to be significantly different at the 5 percent level or lower and 5 to be significantly different at the 10 percent level or lower. We found statistically significant differences between the treatment and control groups for one characteristic at the 5 percent level and 3 at the 10 percent level. Thus, the treatment and control groups in the analytic sample for the three-year impact analysis of Transition WORKS can be considered equivalent at baseline.
C. Review of findings from the process analysis
The process analysis of Transition WORKS, described in detail in the interim report (Fraker et al. 2011a), involved assessing the project’s intervention design, implementation, and intensity of services. To inform this analysis, we used a variety of methods to gather information, including a review of project documents, site visits, interviews with managers and staff, and focus groups with participating youth and their parents. We also analyzed data from the project’s management information system to document the efforts of project staff to enroll treatment group youth in Transition WORKS and deliver services to them.
Transition WORKS evolved over time but maintained a strong focus on youth empowerment through self-determination. The original program model was piloted by the project before its selection into the YTD random assignment evaluation. The model specified a school classroom-based intervention, centered on a self-determination curriculum, which encompassed career exploration activities but stopped short of delivering employment services to participating youth. That design also included basic education services. To facilitate the project’s inclusion in the evaluation, Erie 1 BOCES replaced the classroom-based structure with a more individualized approach to delivering transition services and expanded the program model to include the provision of employment services. The redesigned project retained its emphasis on
FINAL REPORT ON THE YTD EVALUATION CHAPTER V: ERIE COUNTY, NY
65
youth empowerment through a self-determination workshop series based on the original classroom curriculum. It also retained a basic education services component in recognition of the need for some youth to participate in postsecondary or vocational education to prepare for jobs in their desired careers.
The project delivered a structured sequence of services to most of the treatment group youth. It succeeded in enrolling 380 (83 percent) of the 459 randomly assigned treatment group youth and delivered services to them with a high degree of fidelity to the redesigned program model. Project services began with an assessment of participants’ level of self-determination, followed by their participation in two self-determination workshops. While youth were participating in those workshops, their parents or guardians were receiving information on health insurance and cash benefits, vocational services, and how to incorporate transition services into Individualized Education Programs (IEPs). Upon completing the workshops, the participating youth engaged in benefits planning and general transition planning. At that point, they were considered ready to participate in education and employment-related services, including educational counseling, career exploration, job shadowing, internships, informational interviews, placement in paid jobs, and job coaching.
Nearly all (98 percent) of the youth who agreed to participate in Transition WORKS received some project services. Two-thirds or more of the youth received services in each of the major program components noted above, with the exception of education services, which were not heavily emphasized by the project and were received by only 17 percent of participants. The services tended to be of low intensity. Among the youth who received any Transition WORKS services, the average number of service contacts was 15 and the average total duration of those contacts was 13 hours over the 15-month reference period of the process analysis. Less than half of the service hours (6 hours, on average) were focused on employment.
Several aspects of the design and implementation of Transition WORKS may have limited the intensity of youth participation in services in general and employment services in particular. First, the staff of the four partner organizations were not co-located; rather, they were geographically dispersed by function, which may have been a barrier to participation in the full range of project services for some participants. Second, the structured sequence of project services, beginning with the workshops on self-determination, meant that employment services typically were not initiated until about four months after youth enrolled in the project, which may have made it more challenging for staff to engage youth in employment services. Finally, project staff struggled to find time to serve enrollees adequately due to (1) the competing demand on their time to enroll treatment group youth in the project and (2) large caseloads resulting from staff turnover and protracted staff vacancies.
D. Review of impacts one year after enrollment
The YTD evaluation’s interim report on Transition WORKS (Fraker et al. 2011a) presented the project’s impacts on outcomes in five domains based on data collected 12 months after youth enrolled in the evaluation and were randomly assigned to treatment and control groups: employment-promoting services, paid employment, educational progress, youth income, and attitudes and expectations. Within each domain, we analyzed one primary outcome and a number of supplementary outcomes.
FINAL REPORT ON THE YTD EVALUATION CHAPTER V: ERIE COUNTY, NY
66
Consistent with the YTD conceptual framework, Transition WORKS increased the use of employment-promoting services by youth with disabilities. Two-thirds of treatment group youth reported having used any employment-promoting service in the year following their enrollment in the evaluation, whereas only slightly more than half of control group youth did so (Table V.2). The impact of Transition WORKS was a statistically significant increase of 14 percentage points in the use of employment-promoting services. This overall impact was a product of impacts on the use of several specific types of employment services. The largest of these were support for resume writing and job search activities (15 percentage points) and benefits counseling (14 percentage points; not shown in the table).
Although Transition WORKS led to increased use of employment-promoting services, this did not translate into statistically significant impacts on the primary outcomes in the domains of paid employment, educational progress, youth income, and attitudes and expectations during the year following enrollment (Table V.2). The impact estimates presented in the next section reveal whether impacts of the project on employment and other youth outcomes emerged by the third year following enrollment.
The primary outcome of interest related to paid employment was whether a youth was ever employed in a paid job during the year following enrollment in the evaluation. We found that 44 percent of treatment group youth worked for pay sometime during the year, but this is not significantly different from the 41 percent employment rate that we estimated for control group youth. Similarly, there was no impact on total earnings during the year.
Education services were a component of the Transition WORKS program model but were not one of the central features of the project as it was actually implemented. Although educational advancement was initially a primary goal of the project, as the transition coordinators juggled provision of education services with enrollment, empowerment training, and case management, attention to education services became less of a project focus (Fraker et al. 2011a). Thus, we were not surprised to find that the project had no impact on the primary outcome in the domain of educational progress, which was whether a youth was ever enrolled in school during the year following enrollment or had successfully completed high school by the time of the 12-month follow-up survey.
In the domain of youth income, we found that Transition WORKS had no impact on the primary outcome—total youth income from earnings and disability benefits—during the year following enrollment. Furthermore, although the intervention did improve knowledge of SSA work incentives and requirements, that did not translate into treatment group youth receiving more benefits than control group youth. We found no impact on the total amount of benefits received during the year following enrollment (not shown in the table).
Finally, we found that Transition WORKS had no impact on the primary outcome in the domain of attitudes and expectations. Table V.2 shows that about two-thirds of treatment group youth agreed that their personal goals included working and earning enough to stop receiving disability benefits. However, this proportion was essentially the same for the control group.

FINAL REPORT ON THE YTD EVALUATION CHAPTER V: ERIE COUNTY, NY
67
Table V.2. Erie Co., NY: one-year impacts on service receipt and selected outcome measures (percentages, unless otherwise noted)
- Treatment
mean Control mean Impact - p-value
Employment-promoting services
Primary outcome: used any employment-promoting service 66.3 52.6 13.7 *** 0.00
Paid employment
Primary outcome: ever employed in paid job 43.6 40.7 2.9 - 0.39
Supplementary outcome: total earnings ($)a, b 1,842 1,806 35 - 0.89
Educational progress
Primary outcome: ever enrolled in school or completed high school by the end of the year
82.0 85.0 -3.0 - 0.22
Youth income
Primary outcome: total income (earnings and SSA benefits) ($)a, b
9,013 8,830 183 - 0.55
Attitudes and expectations
Primary outcome: youth agrees that personal goals include working and earning enough to stop receiving Social Security benefits
67.3 69.7 -2.4 – 0.53
Sources: YTD 12-month survey and SSA administrative records. Notes: The table shows regression-adjusted impact estimates. We measured explanatory variables in the regression model
before enrollment in the evaluation using data from the study’s baseline survey and SSA administrative records. The analysis sample includes 416 treatment group youth and 330 control group youth. We calculated statistics for the survey-based outcomes using sample weights to account for interview non-response. Survey item non-response may have resulted in smaller sample sizes for specific outcomes. All dollar amounts shown in the table are in 2008 dollars.
a For these outcomes, item non-response occurred conditionally, depending on the values of other measures in the survey. The rate of missing data is 10 percent for both earnings and income. We used a multiple-imputations procedure to assign values when they were missing. b The average includes youth who were not employed during the year following enrollment. */**/*** Impact estimate is significantly different from zero at the .10/.05/.01 level using a two-tailed t-test.
E. Impacts three years after enrollment
The findings in this section show whether the services provided by Transition WORKS, combined with SSA’s waivers for YTD, led to longer-term impacts on youth outcomes in five domains. The impact estimates indicate that the project did increase the paid employment (but not the earnings) of youth during the third year following enrollment. It also increased their total income, primarily through its impact on benefits; however, it did not significantly affect youth participation in productive activities, contact with the justice system, or self-determination. These findings suggest that positive impacts of Transition WORKS on paid employment and income materialized in the longer term despite the fact that the project had no significant impacts on these outcomes in the initial post-enrollment year.
This section also presents impact estimates for three pairs of subgroups (six total subgroups) of youth defined by their work experience, age, and school enrollment status when they enrolled in the evaluation. The subgroup analysis focused on the primary outcomes in the five domains. The findings show that the impacts of Transition Works tended to be stronger for youth who were in school when they enrolled in the evaluation, youth who were 18 or older, and youth who had paid work experience. For these three subgroups, the project had positive and statistically

FINAL REPORT ON THE YTD EVALUATION CHAPTER V: ERIE COUNTY, NY
68
significant impacts on paid employment and total income during the third year following enrollment. For youth with work experience, the project also had positive and statistically significant impacts on annual earnings and participation in productive activities, as well as a desirable negative and statistically significant impact on contact with the justice system.
1. Transition WORKS increased paid employment but not earnings Transition WORKS had a positive impact on one of the two primary outcomes in the
domain of employment and earnings three years after enrollment in the evaluation. The project increased the share of youth with paid employment but did not increase their earnings. Forty-five percent of the treatment group youth were ever employed in paid jobs during the third year following enrollment, compared with 37 percent of the youth in the control group (Table V.3). The estimated impact of 8 percentage points (a relative increase of 21 percent) is statistically significant at the 5 percent level.37 Despite its positive impact on paid employment, the project had no statistically significant impact on earnings, which we calculated from youth reports of their hours worked and wage rates on all paid jobs during the third post-enrollment year. This measure of earnings averaged $2,462 among treatment group youth and $1,941 among control group youth. The difference of $521 falls just short of being statistically significant at the 10 percent level.
Transition WORKS had no impact on the intensity of employment during the third year following enrollment or employment at the end of the year. Our measure of the intensity of employment is the total hours worked in paid jobs during the year. On average, youth in the treatment group were employed for 329 hours, which is 37 hours more than youth in the control group were employed, but the impact is not statistically significant (Table V.3). Furthermore, we found that the project had no impact on the share of youth with paid jobs at the time of the 36-month survey. Thirty-one percent of the treatment youth were employed at the time of the survey, compared with 26 percent of the control youth, but the difference of 5 percentage points is not statistically significant. This implies that, although the project increased the share of youth with paid jobs at any time during the third year following enrollment, it was less effective at helping them maintain employment until the end of that year.
In contrast to the survey-based finding of a positive impact on employment, when we analyzed employment based on data from IRS administrative records, we found that Transition WORKS had no impact on paid employment in any of the three calendar years following enrollment. The share of youth in the treatment group with paid jobs decreased from 44 percent in the first calendar year after enrollment to 38 percent in the second year and then slightly increased to 39 percent in the third year (Table V.3). These shares are not significantly different from the corresponding shares for the control group. Our analysis of the IRS data also revealed no impact of Transition WORKS on earnings in any of the three calendar years, thus confirming our survey-based finding of no impact on earnings in the third year following enrollment. The mean earnings of youth in the treatment group increased from $1,649 in the first calendar year
37 We also found that Transition WORKS had a statistically significant positive impact of 7 percentage points
on the share of youth who were employed in any job, without regard for whether they were being paid (results not shown in the table).
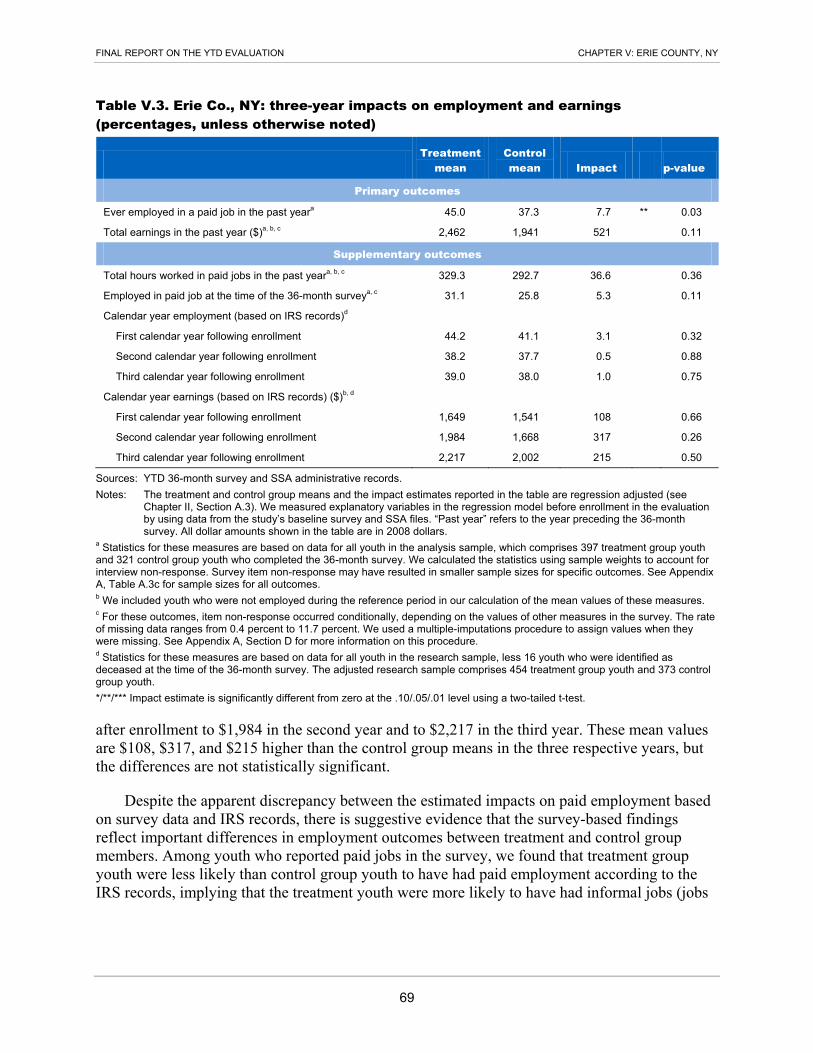
FINAL REPORT ON THE YTD EVALUATION CHAPTER V: ERIE COUNTY, NY
69
Table V.3. Erie Co., NY: three-year impacts on employment and earnings (percentages, unless otherwise noted)
- Treatment
mean Control mean Impact - p-value
Primary outcomes
Ever employed in a paid job in the past yeara 45.0 37.3 7.7 ** 0.03
Total earnings in the past year ($)a, b, c 2,462 1,941 521 - 0.11
Supplementary outcomes
Total hours worked in paid jobs in the past yeara, b, c 329.3 292.7 36.6 - 0.36
Employed in paid job at the time of the 36-month surveya, c 31.1 25.8 5.3 - 0.11
Calendar year employment (based on IRS records)d - - - - -
First calendar year following enrollment 44.2 41.1 3.1 - 0.32
Second calendar year following enrollment 38.2 37.7 0.5 - 0.88
Third calendar year following enrollment 39.0 38.0 1.0 - 0.75
Calendar year earnings (based on IRS records) ($)b, d - - - - -
First calendar year following enrollment 1,649 1,541 108 - 0.66
Second calendar year following enrollment 1,984 1,668 317 - 0.26
Third calendar year following enrollment 2,217 2,002 215 - 0.50
Sources: YTD 36-month survey and SSA administrative records. Notes: The treatment and control group means and the impact estimates reported in the table are regression adjusted (see
Chapter II, Section A.3). We measured explanatory variables in the regression model before enrollment in the evaluation by using data from the study’s baseline survey and SSA files. “Past year” refers to the year preceding the 36-month survey. All dollar amounts shown in the table are in 2008 dollars.
a Statistics for these measures are based on data for all youth in the analysis sample, which comprises 397 treatment group youth and 321 control group youth who completed the 36-month survey. We calculated the statistics using sample weights to account for interview non-response. Survey item non-response may have resulted in smaller sample sizes for specific outcomes. See Appendix A, Table A.3c for sample sizes for all outcomes. b We included youth who were not employed during the reference period in our calculation of the mean values of these measures. c For these outcomes, item non-response occurred conditionally, depending on the values of other measures in the survey. The rate of missing data ranges from 0.4 percent to 11.7 percent. We used a multiple-imputations procedure to assign values when they were missing. See Appendix A, Section D for more information on this procedure. d Statistics for these measures are based on data for all youth in the research sample, less 16 youth who were identified as deceased at the time of the 36-month survey. The adjusted research sample comprises 454 treatment group youth and 373 control group youth. */**/*** Impact estimate is significantly different from zero at the .10/.05/.01 level using a two-tailed t-test.
after enrollment to $1,984 in the second year and to $2,217 in the third year. These mean values are $108, $317, and $215 higher than the control group means in the three respective years, but the differences are not statistically significant.
Despite the apparent discrepancy between the estimated impacts on paid employment based on survey data and IRS records, there is suggestive evidence that the survey-based findings reflect important differences in employment outcomes between treatment and control group members. Among youth who reported paid jobs in the survey, we found that treatment group youth were less likely than control group youth to have had paid employment according to the IRS records, implying that the treatment youth were more likely to have had informal jobs (jobs

FINAL REPORT ON THE YTD EVALUATION CHAPTER V: ERIE COUNTY, NY
70
for which earnings were not reported to the IRS).38 We conclude that the survey-based estimate of Transition WORKS’ impact on paid employment captures real differences between treatment and control cases in their employment in both formal and informal jobs, whereas the estimates based on the IRS data capture only differences in employment in formal jobs.39, 40
Subgroup findings. Transition WORKS’ positive impact for the full analytic sample on the survey-based measure of paid employment during the third year following enrollment in the evaluation was concentrated in three of the six subgroups considered. The project had a positive and statistically significant impact on paid employment for youth who had work experience, youth who were in school, and youth who were 18 or older when they enrolled (see Appendix Table A.7c). For the former two subgroups only, it also had a positive and statistically significant impact on earnings.
2. Transition WORKS increased youth income and the amount of disability benefits Transition WORKS had a positive impact on the primary outcome in the domain of youth
income. We measured this outcome—youth total income in the third year after enrollment in the evaluation—by combining earnings based on youth reports in the survey with disability benefit amounts from SSA administrative records. The first row of Table V.4 shows that, on average, youth in the treatment group had a total income of $9,865 in the third year following enrollment, which was $1,106 more than that of youth in the control group (a relative increase of 13 percent). This impact estimate is statistically significant at the 1 percent level.
The positive impact of Transition WORKS on youth total income is underpinned by positive impacts on both SSA disability benefits and annual earnings. Table V.4 shows that although the project did not significantly increase the share of youth who received any disability benefits during the third post-enrollment year, it did have a positive impact on the amount of disability benefits they received. On average, youth in the treatment group received $7,280 in disability benefits in the third year following enrollment, which was $618 more than the average amount received by control group youth. This difference is statistically significant at the 5 percent level. The positive impact on the annual benefit amount is not surprising. We anticipated that the SSA
38 We found that, among youth who reported paid employment in the survey but had no paid employment in
the IRS records, annual earnings calculated from the survey data were about 85 percent less than for those who had paid employment in the IRS records: the median annual earnings of youth in the former group was $960, compared with $6,210 for those in the latter group. The lower earnings are suggestive of employment in informal jobs.
39 We also found that among youth who were employed for pay according to the IRS records, treatment group youth were more likely than control group youth to have reported paid employment in the survey (72 percent versus 66 percent). Thus, youth in the treatment group were more likely to recall and report on formal jobs than their control group counterparts. This factor provides additional support for the feasibility of a positive impact on the survey-based measure of paid employment even when there is a lack of impact on paid employment according to the IRS records.
40 In addition, we investigated whether the estimated impact on the survey-based measure of paid employment is suspect due to potential non-response bias; we found no evidence to support that possibility. Using data from IRS records, we calculated the share of youth with paid employment for the full research sample as well as for the analytic sample (the survey respondents). We found that the values of this statistic are not substantively different between the two samples.
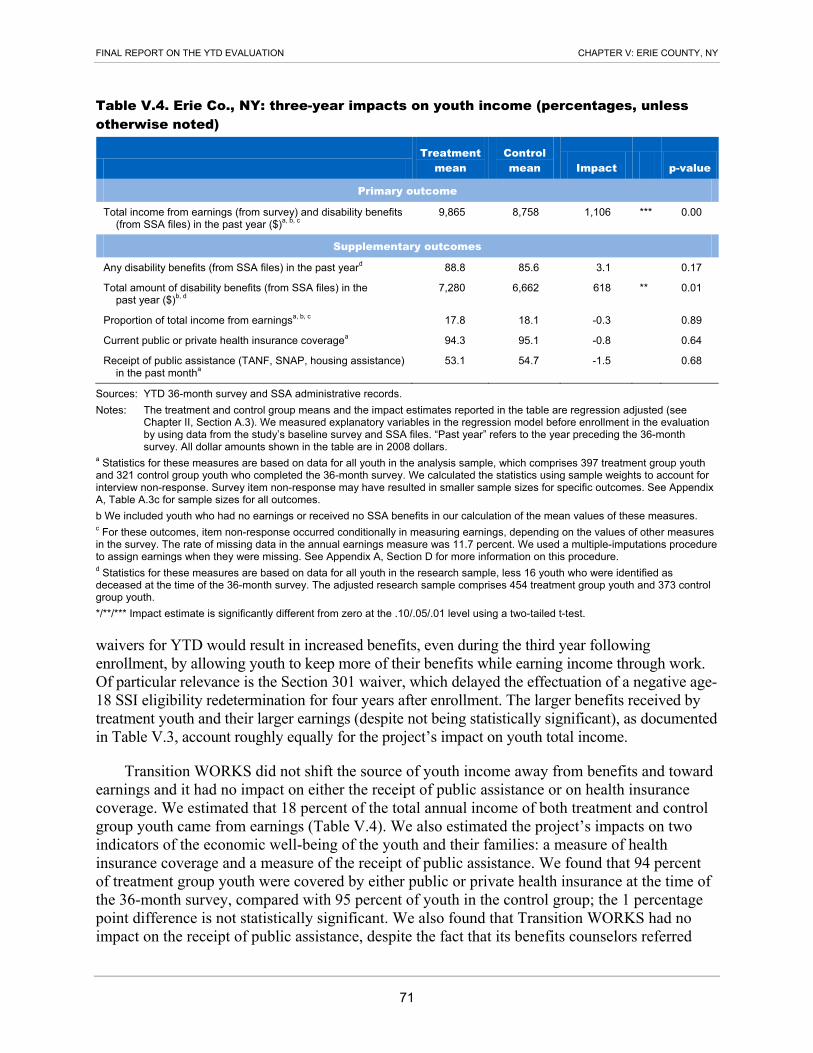
FINAL REPORT ON THE YTD EVALUATION CHAPTER V: ERIE COUNTY, NY
71
Table V.4. Erie Co., NY: three-year impacts on youth income (percentages, unless otherwise noted)
- Treatment
mean Control mean Impact - p-value
Primary outcome
Total income from earnings (from survey) and disability benefits (from SSA files) in the past year ($)a, b, c
9,865 8,758 1,106 *** 0.00
Supplementary outcomes
Any disability benefits (from SSA files) in the past yeard 88.8 85.6 3.1 - 0.17
Total amount of disability benefits (from SSA files) in the past year ($)b, d
7,280 6,662 618 ** 0.01
Proportion of total income from earningsa, b, c 17.8 18.1 -0.3 - 0.89
Current public or private health insurance coveragea 94.3 95.1 -0.8 - 0.64
Receipt of public assistance (TANF, SNAP, housing assistance) in the past montha
53.1 54.7 -1.5 - 0.68
Sources: YTD 36-month survey and SSA administrative records. Notes: The treatment and control group means and the impact estimates reported in the table are regression adjusted (see
Chapter II, Section A.3). We measured explanatory variables in the regression model before enrollment in the evaluation by using data from the study’s baseline survey and SSA files. “Past year” refers to the year preceding the 36-month survey. All dollar amounts shown in the table are in 2008 dollars.
a Statistics for these measures are based on data for all youth in the analysis sample, which comprises 397 treatment group youth and 321 control group youth who completed the 36-month survey. We calculated the statistics using sample weights to account for interview non-response. Survey item non-response may have resulted in smaller sample sizes for specific outcomes. See Appendix A, Table A.3c for sample sizes for all outcomes. b We included youth who had no earnings or received no SSA benefits in our calculation of the mean values of these measures. c For these outcomes, item non-response occurred conditionally in measuring earnings, depending on the values of other measures in the survey. The rate of missing data in the annual earnings measure was 11.7 percent. We used a multiple-imputations procedure to assign earnings when they were missing. See Appendix A, Section D for more information on this procedure. d Statistics for these measures are based on data for all youth in the research sample, less 16 youth who were identified as deceased at the time of the 36-month survey. The adjusted research sample comprises 454 treatment group youth and 373 control group youth. */**/*** Impact estimate is significantly different from zero at the .10/.05/.01 level using a two-tailed t-test.
waivers for YTD would result in increased benefits, even during the third year following enrollment, by allowing youth to keep more of their benefits while earning income through work. Of particular relevance is the Section 301 waiver, which delayed the effectuation of a negative age-18 SSI eligibility redetermination for four years after enrollment. The larger benefits received by treatment youth and their larger earnings (despite not being statistically significant), as documented in Table V.3, account roughly equally for the project’s impact on youth total income.
Transition WORKS did not shift the source of youth income away from benefits and toward earnings and it had no impact on either the receipt of public assistance or on health insurance coverage. We estimated that 18 percent of the total annual income of both treatment and control group youth came from earnings (Table V.4). We also estimated the project’s impacts on two indicators of the economic well-being of the youth and their families: a measure of health insurance coverage and a measure of the receipt of public assistance. We found that 94 percent of treatment group youth were covered by either public or private health insurance at the time of the 36-month survey, compared with 95 percent of youth in the control group; the 1 percentage point difference is not statistically significant. We also found that Transition WORKS had no impact on the receipt of public assistance, despite the fact that its benefits counselors referred

FINAL REPORT ON THE YTD EVALUATION CHAPTER V: ERIE COUNTY, NY
72
participants and their families to any public assistance for which they were possibly eligible. Table V.4 shows that 53 percent of treatment group youth and 55 percent of control group youth lived in households that received SNAP, TANF, or housing assistance in the month preceding the 36-month survey; however, the 2 percentage point difference is not statistically significant.
Subgroup findings. The impact of Transition WORKS on youth total income in the third year following enrollment in the evaluation was positive for youth both with and without work experience, but only for the former is the impact statistically significant (see Appendix Table A.7c). The project’s impact on this outcome was positive and statistically significant for youth both younger than 18 and 18 or older. Finally, the project’s impact on youth total income was positive for both in-school and out-of-school youth, but only for the former is the impact statistically significant.
3. Transition WORKS had no impact on participation in productive activities Transition WORKS had no impact on the primary outcome in the domain of productive
activities. This outcome is a composite measure of a youth’s participation in education, training, and paid or unpaid employment during the third year following enrollment in the evaluation. As shown in Table V.5, 72 percent of treatment group youth and 67 percent of control group youth participated in at least one productive activity, but the 5 percentage point difference is not statistically significant.
We have reported earlier that the project had positive impacts of 8 percentage points on paid employment and 7 percentage points on any (paid or unpaid) employment, so the absence of an impact on participation in any productive activity is surprising. These seemingly inconsistent findings can be reconciled in part by the fact that a smaller share of treatment youth than control youth participated in education or training only, without engaging in employment. Specifically, 24 percent of treatment group youth participated in education or training only, compared with 26
Table V.5. Erie Co., NY: three-year impacts on productive activities (percentages)
- Treatment
mean Control mean Impact - p-value
Primary outcome
Participated in paid employment, unpaid employment, education, or training in the past year
71.8 66.9 4.9 - 0.14
Supplementary outcomes
Participated in education or training program in the past year 49.9 46.7 3.2 - 0.38
Completed high school (attained high school diploma/GED/ certificate or higher) by the time of the 36-month survey
61.3 63.7 -2.4 - 0.46
Ever enrolled in college or technical school 15.9 13.3 2.6 - 0.19
Source: YTD 36-month survey. Notes: The treatment and control group means and the impact estimates reported in the table are regression adjusted (see
Chapter II, Section A.3). We measured explanatory variables in the regression model before enrollment in the evaluation by using data from the study’s baseline survey and SSA files. Statistics for these measures are based on data for all youth in the analysis sample, which comprises 397 treatment group youth and 321 control group youth who completed the 36-month survey. We calculated the statistics using sample weights to account for interview non-response. Survey item non-response may have resulted in smaller sample sizes for specific outcomes. See Appendix A, Table A.3c for sample sizes for all outcomes. “Past year” refers to the year preceding the 36-month survey.
*/**/*** Impact estimate is significantly different from zero at the .10/.05/.01 level using a two-tailed t-test.
FINAL REPORT ON THE YTD EVALUATION CHAPTER V: ERIE COUNTY, NY
73
percent of control group youth (not shown in the table). Consequently, compared with the impact on any employment, the impact on the composite measure of productive activities is smaller and not statistically significant.
Analysis of supplementary outcomes in the domain of productive activities revealed that Transition WORKS had no impact on participation in education and training programs, completion of high school, or enrollment in a college or technical school. Fifty percent of treatment group youth participated in education or training programs during the third year following enrollment in the evaluation, compared with 47 percent of control group youth, but the 3 percentage point difference is not statistically significant. Although the interim analysis showed a negative impact of the project on completing high school with a credential as of the 12-month survey, the current analysis shows no significant impact on high school completion as of the 36-month survey. The negative interim impact may have been a result of Transition WORKS encouraging youth to strive for a high school diploma, which might have required more than four years, rather than settling for a certificate of attendance after four years of high school. In any case, the three-year findings indicate that the treatment group youth subsequently caught up with the control group youth in high school completion. Finally, we found that Transition WORKS had no impact on the share of youth who had enrolled at any time in a college or technical school. Sixteen percent of treatment group youth had ever enrolled in such a program, compared with 13 percent of control group youth, but the 3 percentage point difference is not statistically significant.
Subgroup findings. Although for the full analytic sample Transition WORKS had no impact on the primary outcome in this domain—participation in any productive activity during the third year following enrollment in the evaluation—it did have a statistically significant impact on this outcome for one of the six subgroups considered: for youth who had work experience at the time of enrollment, it increased participation in any productive activity (see Appendix Table A.7c).
4. Transition WORKS had no impact on contact with the justice system Transition WORKS had no impact on the primary outcome in the domain of contact with the
justice system: having been arrested or charged with delinquency or a criminal complaint during the third year following enrollment in the evaluation. Four percent of treatment group youth reported that they had been arrested or charged during the follow-up period, compared with 5 percent of control group youth (Table V.6). The difference is not statistically significant.
The project had no impacts on three supplementary outcomes in this domain in the third year following enrollment. It did not affect the type of the most recent charge against youth who had come in contact with the justice system during that year (Table V.6).41 Neither did it affect the shares of youth who were incarcerated or were on probation or parole at the time of the
41 The shares of treatment and control group youth who reported no arrest or charge of delinquency or a
criminal complaint during the third year following enrollment in the evaluation are slightly different from what we would expect based on the corresponding shares for the primary outcome in this domain. This lack of full correspondence is explained by differential rates of item non-response to the underlying survey questions and imputation of conditional missing values for the primary outcome.

FINAL REPORT ON THE YTD EVALUATION CHAPTER V: ERIE COUNTY, NY
74
Table V.6. Erie Co., NY: three-year impacts on contact with the justice system (percentages)
- Treatment
mean Control mean Impact - p-value
Primary outcome
Arrested or charged with delinquency or a criminal complaint in the past yeara
3.9 4.5 -0.6 - 0.72
Supplementary outcomes
Type of most recent charge during the past yearb - - - - 0.43
No arrest or criminal or delinquent charge 96.5 95.6 0.9 - -
Violent crime 1.3 0.3 1.0 - -
Property crime 0.6 1.1 -0.5 - -
Drug-related crime 0.0 0.6 -0.6 - -
Other crime 1.0 1.0 0.0 - -
Multiple crimes 0.6 1.5 -0.9 - -
Currently incarcerated (in jail, prison, or detention home)a, c 1.7 0.5 1.2 - 0.26
Currently on probation or parolea, c 1.5 0.3 1.2 - 0.11
Since enrollment in the evaluation: - - - - -
Ever arrested or charged with delinquency or a criminal complaint
10.4 7.3 3.1 - 0.16
Ever convicted of or pled guilty to a chargea 8.6 5.2 3.4 - 0.10
Ever incarcerated (in jail, prison, or detention home)a, c 1.9 2.2 -0.3 - 0.84
Ever on probation or parolea, c 2.2 1.5 0.7 - 0.57
Source: YTD 36-month survey. Notes: The treatment and control group means and the impact estimates reported in the table are regression adjusted (see
Chapter II, Section A.3). We measured explanatory variables in the regression model before enrollment in the evaluation by using data from the study’s baseline survey and SSA files. Statistics for these outcomes are based on data for all youth in the analysis sample, which comprises 397 treatment group youth and 321 control group youth who completed the 36-month survey. We calculated the statistics using sample weights to account for interview non-response. “Past year” refers to the year preceding the 36-month survey; “currently” indicates at the time of the 36-month survey.
a Survey item non-response may have resulted in smaller sample sizes for specific outcomes. See Appendix A, Table A.3c for sample sizes for all outcomes. For these outcomes, item non-response occurred conditionally, depending on the values of ever being arrested or charged in the survey. The rate of missing data ranges from 3.8 percent to 8.4 percent. We used a multiple-imputations procedure to assign values when they were missing. See Appendix A, Section D for more information on this procedure. b The estimates for this outcome are not regression adjusted, as the regression model did not converge. c We used linear regression models to estimate impacts on these outcomes, as logistic regression models did not converge. */**/*** Impact estimate is significantly different from zero at the .10/.05/.01 level using a two-tailed t-test or a chi-square test.
36-month survey. Nearly 2 percent of youth in the treatment group were incarcerated at the time of the survey, compared with less than 1 percent of youth in the control group. The difference of about 1 percentage point is not statistically significant. We found similar results for the share of youth who were on probation or parole at the time of the 36-month survey.
Transition WORKS also had no impacts on four supplementary outcomes in this domain pertaining to the entire time between when youth enrolled in the evaluation and when they completed the 36-month survey. The first of these outcomes is whether the youth had ever been arrested or charged with delinquency or a criminal complaint following enrollment. Ten percent of treatment group youth and 7 percent of control group youth reported that this had happened to
FINAL REPORT ON THE YTD EVALUATION CHAPTER V: ERIE COUNTY, NY
75
them. The difference is not statistically significant. Slightly smaller shares of youth reported that they had ever been convicted or pled guilty to a charge (the second outcome) following enrollment. This had happened to 9 percent of treatment group youth and 5 percent of control group youth. Again, the difference is not statistically significant. Finally, the project had no impacts on whether youth had ever been incarcerated (the third outcome) or had ever been on probation or parole (the fourth outcome) since enrollment.
Subgroup findings. Although Transition WORKS had no impact on the primary outcome in the domain of contact with the justice system for the full analytic sample, it did have a statistically significant impact on this outcome for one of the six subgroups considered: youth who had work experience when they enrolled in the evaluation. The project reduced the share of these youth who had been arrested or charged with delinquency or a criminal complaint during the third year following enrollment (see Appendix Table A.7c).
5. Transition WORKS had no impact on self-determination Although Transition WORKS was designed to improve the self-determination of participating
youth, it did not have an impact on any aspect of self-determination that we measured in the 36-month survey. The project sought to improve self-determination both directly, through an assessment of each participant’s level of self-determination followed by two self-determination workshops, and indirectly, through services designed to increase self-sufficiency. However, the project had no impact on the primary outcome in the domain of self-determination, which is an index of self-determination measured on a four-point scale, as described in Chapter II. The average value of this index is 3.0 for treatment group youth, compared with 2.9 for control group youth (Table V.7), but the difference is not statistically significant. Furthermore, the project had no impacts on the three subindices of self-determination, measuring youths’ senses of autonomy, internal locus of control, and external locus of control.
Transition WORKS also had no impacts on two additional supplementary outcomes in the domain of self-determination: future independence and living arrangement. The binary measure of future independence indicates whether youth agree with the statement that their “goals include working or continuing to work in a paid job.” Eighty-five percent of treatment group youth and 86 percent of control group youth agreed with the statement; the difference is not statistically significant (Table V.7). The project also had no impact on the living arrangements of youth at the time of the 36-month survey. Focusing first on treatment group youth, the table shows that they were most commonly living with their parents or guardians and not receiving professional help with activities of daily living (40 percent). Nineteen percent were living independently (alone, with a spouse or partner, with his or her own child, or with a roommate or friend) and also were not receiving professional help with activities of daily living. In contrast, 35 percent were receiving professional help while living either independently or with their parents or guardians. Finally, 7 percent of treatment group youth were living in institutional settings or were homeless. The distribution of living arrangements for control group youth is very similar to that for treatment group youth and the difference is not statistically significant.
Subgroup findings. The absence in the full analytic sample of a statistically significant impact of Transition WORKS on the primary outcome in the domain of self-determination was manifested in all six of the subgroups considered (see Appendix Table A.7c).

FINAL REPORT ON THE YTD EVALUATION CHAPTER V: ERIE COUNTY, NY
76
Table V.7. Erie Co., NY: three-year impacts on self-determination
- Treatment
mean Control mean Impact - p-value
Primary outcome
Index of self-determinationa (4-point scale) 3.0 2.9 0.1 0.24
Supplementary outcomes
Subindices of self-determination (4-point scales) - - - -
Index of autonomya 3.0 2.9 0.0 0.38
Index of internal locus of controla 3.2 3.2 0.0 0.42
Index of external locus of controla 2.7 2.6 0.1 0.24
Future independencea (%) 85.3 85.6 -0.3 0.92
Living arrangement (%) - - - 0.18
Independently, without help 19.0 13.3 5.7
With parents or guardians, without help 39.6 41.3 -1.8
Independently or with parents or guardians, with help 34.7 36.4 -1.7
Institutional setting or homeless 6.8 8.9 -2.2
Source: YTD 36-month survey. Notes: The treatment and control group means and the impact estimates reported in the table are regression adjusted (see
Chapter II, Section A.3). We measured explanatory variables in the regression model before enrollment in the evaluation by using data from the study’s baseline survey and SSA files. Statistics for these measures are based on data for all youth in the analysis sample, which comprises 397 treatment group youth and 321 control group youth who completed the 36-month survey. For these outcomes, item non-response ranges from 3.2 percent to 26.2 percent. We calculated the statistics using sample weights to account for interview non-response. Survey item non-response may have resulted in smaller sample sizes for specific outcomes. See Appendix A, Table A.3c for sample sizes for all outcomes.
a See Chapter II, Section A.1 for explanations of these measures of various aspects of self-determination. */**/*** Impact estimate is significantly different from zero at the .10/.05/.01 level using a two-tailed t-test or a chi-square test.
F. Cost of providing services
The cost of the resources used by Transition WORKS to deliver services was $5,232 per participant, on average. Based on data that we systematically collected from Erie 1 BOCES (the grantee), the project staff, and other sources, we calculated this and other measures of project costs using the methodology outlined in Chapter II (Honeycutt and Murphy 2013). In this section, we summarize our findings from that analysis, giving particular attention to the total project cost and the costs of project components, in addition to the average cost per participant.
1. The total one-year cost of Transition WORKS was $997,543 The total one-year cost for Transition WORKS to deliver services to 400 participants was
$997,543.42 This amount represents the cost of all resources used to operate the project in a selected one-year cost accounting period—October 2007 through September 2008—when project start-up and close-out costs were negligible but enrollment was still ongoing.43 Erie 1
42 Of the 459 randomly assigned treatment group youth, 380 participated in Transition WORKS, as did 20 of
the 21 non-randomly assigned treatment group youth. We included the latter in the cost analysis (but not in the impact analysis) because the project provided services to them and incurred costs in doing so. All of the 400 participants were enrolled in the project at some time during the cost accounting period.
43 Enrollment occurred from January 2007 through May 2008.

FINAL REPORT ON THE YTD EVALUATION CHAPTER V: ERIE COUNTY, NY
77
BOCES (which administered the project and provided case management and employment services) accounted for 64 percent of the total cost. Among its partners, NLS (benefits counseling) accounted for 21 percent of the total cost, the CEO (employment services) accounted for 12 percent, and the Parent Network (empowerment services for parents) accounted for 3 percent.
Direct labor was the project’s largest cost category. Wages, salaries, and fringe benefits accounted for 79 percent of total project costs. Indirect costs accounted for 16 percent of total costs, with general administrative costs (including, for example, the cost of support provided by a human resources department) and rent and utilities being the two largest cost components in this category. Unbudgeted costs (those that did not entail cash outlays by the project but involved essential resources) accounted for 4 percent of total costs. Transition WORKS received donated space for some meetings and the CEO received donated office space and administrative support. Other direct costs (payments made directly to participants, or to vendors on behalf of participants) were small, accounting for just 1 percent of total project costs.
2. Project administration and employment services were the largest cost components Direct services accounted for 67 percent of total project costs, whereas project
administration (activities related to the oversight of Transition WORKS) accounted for the remaining 33 percent (Table V.8). Among the four components of direct services, employment services (such as finding work experiences for participants and providing employed participants with job coaching) was the largest, representing 32 percent of all project costs. Empowerment services (such as advocacy training for parents and workshops on self-determination for youth) and general case management together accounted for 17 percent of total costs. Benefits counseling accounted for 14 percent of project costs. Education services constituted the smallest direct service component, representing only 3 percent of all project costs.
Table V.8. Erie Co., NY: project costs in the cost accounting period, by program component
Program component Cost in cost
accounting period Percentage of
total cost
Project administration $329,784 33
Direct services - -
Benefits counseling $139,355 14
Education services $31,878 3
Employment services $322,711 32
Empowerment services and case management $173,815 17
Total $997,543 100
Sources: Erie 1 BOCES employee earnings reports, budgetary account activity reports, subcontractor invoices, personal communication with Transition WORKS staff, and Transition WORKS staff activity reports.
Note: All dollar values shown in the table are in 2008 dollars.
3. The average cost per Transition WORKS participant was $5,232 The average cost per Transition WORKS participant is a measure of the commitment of
resources to serve youth who enrolled in the project. In the one-year cost accounting period, 400 youth were enrolled in the Transition WORKS for a total of 4,160 months (Table V.9). By

FINAL REPORT ON THE YTD EVALUATION CHAPTER V: ERIE COUNTY, NY
78
dividing the total cost of the project in the accounting period by the total number of enrollment months, we calculate an average cost per enrollment month of $240. This is a measure of the project’s unit cost during the cost accounting period. When we apply the unit cost to the average number of months that youth were enrolled in the Transition WORKS over the entire life of the project—21.8 months—the result is $5,232, which is our estimate of the average cost per participant over the life of the project.
Table V.9. Erie Co., NY: average project cost per participant
Number of participants in
cost accounting period
(A)
Total person-months of
enrollment in cost accounting
period (B)
Total project cost in cost accounting
period (C)
Average cost per enrollment month in cost
accounting period (D=C/B)
Average number of months of
enrollment over life of project
(E)
Average cost per participant
over life of project (F=DxE)
400 4,160 $997,543 $240 21.8 $5,232
Notes: Dollar values are in 2008 dollars. The number of enrollment months for an individual youth is calculated as the number of months from enrollment in Transition WORKS to the last receipt of services. In Column B, this calculation is bounded by the beginning and ending months of the cost accounting period and is shown in aggregate for all participants in the cost accounting period. In Column E, it is unbounded and is shown as an average for all Transition WORKS participants. All dollar amounts shown in the table are in 2008 dollars.
G. Summary and discussion of findings
This chapter has presented findings that Transition WORKS in Erie County, New York, had positive impacts on employment and total income three years after youth enrolled in the YTD evaluation. However, the project had no impacts during that year on participation in productive activities, self-determination, and contact with the justice system.
Analyses of data from the YTD 36-month survey and from IRS administrative files yielded somewhat inconsistent findings regarding the impact of Transition WORKS on employment. According to the survey data, the share of treatment group youth who were employed for pay during the third post-enrollment year was a statistically significant 8 percentage points larger than the corresponding share of control group youth. However, this finding is not confirmed by the IRS data, which showed that the project had no significant impact on employment in the third calendar year following enrollment. One interpretation of these different findings is that Transition WORKS had a positive impact on employment in all jobs (both formal and informal jobs), as measured by the survey, but did not have an impact on employment in formal jobs only, as measured on the basis of earnings reported by employers to the IRS.
Transition WORKS increased youth total income, defined as earnings plus benefits, during the third year following enrollment in the evaluation. The average value of the survey-based measure of earnings in that year was $528 larger for treatment group youth than for control group youth; however, that difference falls just short of being statistically significant. Treatment group youth did receive significantly more disability benefits than their control group counterparts in that year—an average difference of $627. As a consequence of their higher earnings and benefits, treatment group youth received an average of $1,222 more total income in the third year following enrollment than did control group youth; this difference is statistically significant.
FINAL REPORT ON THE YTD EVALUATION CHAPTER V: ERIE COUNTY, NY
79
Transition WORKS’ positive impacts on employment and income three years after youth enrolled in the evaluation are somewhat unexpected, but they likely reflect real differences in these outcomes between treatment and control group youth. In contrast to the finding of positive and statistically significant impacts on employment, benefits, and total income during the third year following enrollment, the interim report on Transition WORKS found no significant impacts on these outcomes during the first year (Fraker et al. 2011a). Furthermore, that report presented findings from the evaluation’s process analysis showing that the project delivered only 13 hours of services to participating youth, of which less than half were focused on employment. Given that weak dose of services and the absence of an impact on employment during the initial post-enrollment year, the finding of a positive and statistically significant impact on employment in the third post-enrollment year is surprising. Although we cannot rule out the possibility that this survey-based finding is spurious, the evidence suggests that it represents a real delayed response to the limited services that the project did provide and to SSA’s waivers for YTD.

This page has been left blank for double-sided copying.

81
VI. MIAMI-DADE COUNTY, FLORIDA
The Broadened Horizons, Brighter Futures (BHBF) project in Miami-Dade County, Florida, was well-implemented, increased services received by youth, and increased the employment and income of youth three years after their enrollment in the YTD evaluation. The project provided services to promote financial literacy, employment, and economic self-sufficiency among youth who were receiving Social Security disability benefits (including SSI, DI, and CDB). Our interim report showed that the project maintained a high degree of fidelity to its program model and to the YTD conceptual framework and that it had statistically significant impacts on the receipt of services, paid employment, and income from earnings and benefits during the year after enrollment (Fraker et al. 2012b). Our analysis of data collected 36 months after youth enrolled in the evaluation revealed longer-term impacts of the project. We found that it had positive and statistically significant impacts on employment in paid jobs, earnings, total income, and participation in productive activities, as well as a desirable negative and statistically significant impact on contact with the justice system during the third year following enrollment, but it did not have any impact on youth self-determination during the same period. The project’s average cost per participant was $6,540.
A. Project overview
The Florida regional office of ServiceSource, a private, nonprofit organization that has served individuals with disabilities in the state since 1959, administered BHBF and directly delivered most of its services.44 To strengthen the project, ServiceSource established formal partnerships with two other private, nonprofit organizations: the Human Services Coalition (HSC) and the National Disability Institute (NDI). The project also benefited from informal partnerships between ServiceSource and the Florida Division of Vocational Rehabilitation, Miami-Dade County Public Schools, the South Florida WIB, and the Business Leadership Network of Miami-Dade County. The BHBF management team consisted of the executive director of ServiceSource, who served as the project director, a project manager, and an administrator of the project’s management information system. The front-line staff, located in two geographically separated offices, included five community employment development specialists, three benefits specialists, and up to three employment specialists.
BHBF provided participating youth with person-centered planning, customized employment services, benefits counseling, education support services, financial literacy training, and access to IDAs. It also provided participants with case management services, including referrals to other organizations for services that BHBF could not provide directly. As the project matured, case management services became increasingly focused on reducing barriers to employment. ServiceSource bore most of the responsibility for delivering those services, with support from its two formal partners in the project. NDI provided training to BHBF staff on public benefits specific to Florida that were relevant to youth with disabilities. HSC delivered training to participants on financial literacy and connected them with local organizations that administered IDAs.
44 The Florida regional office of ServiceSource went by the name “Abilities, Inc. of Florida” at the outset of
BHBF. Its name was changed effective July 1, 2011, before BHBF formally closed.

FINAL REPORT ON THE YTD EVALUATION CHAPTER VI: MIAMI-DADE COUNTY, FLORIDA
82
BHBF served a sufficient number of youth to support a rigorous evaluation. The target population for the project was youth ages 16 through 22 who were receiving Social Security disability benefits and living in Miami-Dade County at the time of their enrollment in the study. Using lists of Social Security beneficiaries provided by SSA, Mathematica identified youth meeting the BHBF eligibility criteria and recruited 880 of them into the study.45 Sample members were randomly assigned to a treatment group, which was eligible for BHBF services and the SSA waivers for YTD, or to a control group, which was eligible for neither but could access other services available in the community. The project staff enrolled 84 percent of the treatment group members in project services between April 2008 and September 2010. Participants were eligible for 18 months of services, but some received services for as many as 36 months. The project delivered services through March 2012, when it formally closed.
B. Baseline characteristics of the analytic sample
The analytic sample for the three-year impact analysis of BHBF consists of the 685 randomly assigned evaluation enrollees who completed the 36-month follow-up survey.46 As shown in Table VI.1, about three in five of the sample members were male and about two-thirds were between 18 and 21 years old when they enrolled in the evaluation. The largest racial category among the youth in the analytic sample was black (52 percent), followed by white (36 percent). Forty-three percent of the youth across racial groups reported being Hispanic. A little more than two-fifths of the sample members were not attending school at baseline, whereas a third were attending a regular high school; the remainder were attending a special high school or other type of school (including college). About two-thirds of the youth had never worked for pay at baseline.
Given that almost all of the youth in the analytic sample were receiving SSI, which is means tested, it is not surprising that most were from low-income families. More than three-quarters of the sample members' families had incomes of less than $25,000 per year. Nearly two-thirds of the sample members were living with a single parent, whereas only a little over a quarter were living with two parents; the remainder either were living by themselves or had other arrangements. About two-thirds of the youth had a mother who had graduated from high school and a similar fraction had a father who had done so.
Despite having significant mental or physical impairments and mixed current health status, most of the youth in the analytic sample had positive expectations for themselves in the future. The youth’s primary disabling conditions recorded in baseline SSA files can be grouped into five
45 Of the 880 youth recruited into the evaluation, 859 were randomly assigned—460 to the treatment group and
399 to the control group. The remaining 21 youth had siblings already in the evaluation and were automatically assigned to the same groups as their siblings (13 treatment cases and 8 control cases); they were not included in the analysis for the evaluation.
46 There is a larger sample of randomly assigned evaluation enrollees for whom we have data on earnings and benefits from administrative records. This full research sample consists of the 859 youth who enrolled in the evaluation and were randomly assigned to treatment or control status, less 19 youth who had died as of the three-year anniversary of their enrollment, for a total of 840 youth (448 treatment and 392 control cases). These cases also constitute the denominator for the calculation of the response rate to the 36-month survey, which was 81.5 percent. For outcomes based on administrative data, we report impact analysis results for the full research sample, less the deceased youth.

FINAL REPORT ON THE YTD EVALUATION CHAPTER VI: MIAMI-DADE COUNTY, FLORIDA
83
Table VI.1. Miami-Dade Co., FL: baseline characteristics of the analytic sample (percentages, unless otherwise noted)
Characteristic All Treatment Control Difference - p-value
Male 58.3 56.9 59.8 -2.8 - 0.46 Age in years - - - - - 0.78
16–17 20.5 20.8 20.0 0.8 - - 18–21 68.3 67.2 69.5 -2.3 - - 22–23 11.3 12.0 10.4 1.5 - -
Race - - - - - 0.61 White 36.2 36.4 35.9 0.5 - - Black 51.6 50.4 53.0 -2.6 - - American Indian/AK/HI/Pacific Island 2.3 2.8 1.8 1.0 - - Asian 0.8 1.2 0.3 0.9 - - Other or unknown 9.1 9.2 9.0 0.2 - -
Ethnicity: Hispanic 42.5 43.0 41.8 1.1 0.77 School attendance - - - - - 0.47
Does not attend school 42.1 41.6 42.6 -1.0 - - Attends regular high school 33.4 33.1 33.7 -0.6 - - Attends special high school 8.5 7.5 9.8 -2.3 - - Attends other school 16.0 17.8 13.9 3.9 - -
Employment and earnings - - - - - - Worked for pay in last year 18.7 19.9 17.4 2.5 0.41 Never worked for pay at baseline 65.2 63.8 66.7 -2.9 0.44 Earnings in calendar year before enrollment ($) 728 860 568 293 0.14
Living arrangement - - - - - 0.56 Two-parent family 28.3 26.3 30.7 -4.4 - - Single-parent family 63.6 65.2 61.9 3.3 - - Group home 0.9 0.5 1.2 -0.7 - - Other institution 2.8 3.0 2.5 0.5 - - Lives alone or with friends 4.4 4.9 3.7 1.2 - -
Family annual income - - - - - 0.90 Less than $10,000 37.9 38.5 37.3 1.2 - - $10,000–$24,999 38.6 38.8 38.5 0.3 - - $25,000 or more 23.5 22.8 24.3 -1.5 - -
Parents’ education - - - - - - Mother is high school graduate 65.9 70.8 60.4 10.3 *** 0.01 Father is high school graduate 62.9 61.7 64.2 -2.6 - 0.58
Expectations about the future - - - - - - Expects to live independently (w/ or w/o help) 67.5 67.2 67.8 -0.6 - 0.88 Expects to continue education 87.9 89.2 86.4 2.9 - 0.32 Expects to work at least part time for pay 90.5 91.6 89.3 2.3 - 0.38
SSA benefits - - - - - - Received SSI (only or concurrent with CDB or DI) 96.4 96.3 96.5 -0.2 - 0.90 Duration of benefit entitlement (years) 8.7 8.8 8.5 0.3 - 0.50
Primary disabling condition - - - - - 0.20 Mental illness 15.7 16.8 14.3 2.5 - - Cognitive/developmental disability 45.2 42.8 47.8 -5.0 - - Learning disability/ADD 20.7 20.2 21.4 -1.2 - - Physical disability 13.3 13.3 13.4 -0.1 - - Speech, hearing, visual impairment 5.1 6.9 3.1 3.7 - -
Self-reported health status - - - - - 0.98 Excellent 23.0 22.7 23.3 -0.7 - - Very good/good 55.1 55.3 54.9 0.5 - - Fair/poor 21.9 22.0 21.8 0.2 - -
Sample size 685 375 310 - - -
Sources: YTD baseline survey and SSA administrative records. Notes: We weighted statistics to adjust for non-response to the 36-month survey. Baseline survey item non-response may have resulted
in smaller sample sizes for some characteristics than indicated at the bottom of the table. Missing information on primary disabling condition resulted in a smaller sample size for this characteristic than shown at the bottom of the table. See Appendix Table A.1d for statistics on the full set of baseline characteristics we examined. All dollar amounts shown in the table are in 2008 dollars.
*/**/*** Treatment-control difference is statistically different from zero at the .10/.05/.01 level using either a two-tailed t-test or a chi-square test.
FINAL REPORT ON THE YTD EVALUATION CHAPTER VI: MIAMI-DADE COUNTY, FLORIDA
84
categories, the largest of which is cognitive and developmental disabilities (45 percent). This is followed by learning disabilities and attention deficit disorder (21 percent); mental illness (16 percent); physical disabilities (13 percent); and speech, hearing, and visual impairments (5 percent). On average, the sample members had been receiving disability benefits due to these conditions for almost nine years. Fifty-five percent reported being in good or very good health, whereas 23 percent reported excellent health and 22 percent reported fair or poor health. Notwithstanding their disabilities and mixed health status, more than two-thirds of the youth reported that they expected to live independently in the future (68 percent) and even larger shares expected to continue their education (88 percent) and to work at least part time for pay (91 percent).
On average, these baseline characteristics are similar for members of the treatment and control groups, as expected, given that they were assigned to these groups at random. We compared 50 baseline characteristics of treatment and control group members in the analytic sample, 19 of which we report in Table VI.1 (p-values are shown in the table for these characteristics). We did observe some statistically significant differences between the treatment and control groups, not all of which are shown in the table. For example, at baseline a larger share of treatment group members had mothers who had graduated from high school (71 vs. 60 percent), but smaller shares of treatment group members had worked as volunteers in the preceding year (14 vs. 18 percent) and had fathers who were employed (55 vs. 64 percent). However, we found that the two groups were very similar overall and the incidence of statistically significant differences was about what we would expect based on chance alone, assuming that the considered baseline characteristics are independent. For example, of the 50 characteristics we investigated, we would expect 2 or 3 to be significantly different at the 5 percent level or lower and 5 to be significantly different at the 10 percent level or lower. We found statistically significant differences between the treatment and control groups for 2 characteristics at the 5 percent level and 3 at the 10 percent level. Thus, the treatment and control groups in the analytic sample for the three-year impact analysis of BHBF can be considered equivalent at baseline.
C. Review of findings from the process analysis
The process analysis of the BHBF, described in detail in the interim report (Fraker et al. 2012b), involved assessing the project’s intervention design, implementation, and intensity of services. To inform this analysis, we used a variety of methods to gather information, including a review of project documents, site visits, interviews with managers and staff, and focus group discussions with participating youth and their parents. We also analyzed data from the project’s management information system to document the efforts of project staff to enroll treatment group youth in BHBF and deliver services to them.
BHBF evolved over time but maintained a strong focus on economic self-sufficiency and independence for youth with severe disabilities. The original program model piloted by the project before its selection into the YTD random assignment evaluation targeted in-school youth and focused on case management and pre-employment services. To facilitate its inclusion in the evaluation, BHBF agreed to broaden its target population to include out-of-school youth, expand its array of services to include benefits planning and education support services, and sharpen its focus on helping participants to have paid work experiences. However, during the project’s
FINAL REPORT ON THE YTD EVALUATION CHAPTER VI: MIAMI-DADE COUNTY, FLORIDA
85
initial year in the evaluation, staff continued to provide primarily case management and pre-employment services, which may have crowded out the delivery of services designed to more immediately help participants find jobs. Beginning in the project’s second year, services became more sharply focused on employment, especially paid employment.
The project delivered services to most of the treatment group youth. It succeeded in enrolling 388 (84 percent) of the 460 treatment group youth and delivered services to them with a high degree of fidelity to the program model. Project services began with identifying participants’ employment and/or education goals and service needs and empowering them through a person-centered planning process. Youth enrolled in the project received benefits planning services, employment-related services (such as job development, resume writing, job site tours, opportunities to attend project-sponsored job fairs, unpaid work experiences, competitive paid employment, and on-the-job training) and education-related services (such as encouragement and support to complete high school and/or enroll in postsecondary education). Families of participants were encouraged to be actively involved in enrollment interviews and throughout the delivery of project services. Participants who achieved paid employment were offered financial literacy training and assistance in establishing IDAs.
All of the youth who agreed to participate in BHBF received some project services and the intensity of those services was generally high. Among participating youth, 99 percent received employment services and benefits planning services from the project. A similarly large proportion, 96 percent, received case management services. A somewhat smaller proportion, 84 percent, received education services. Among all participants, the average number of service contacts was 49 and the average total duration of those contacts was 29 hours over the 15-month reference period of the process analysis. Half of the service hours were focused on employment.
A year after BHBF entered the YTD random assignment evaluation, analysis of data from its management information system revealed a lack of focus of service hours on employment and a relatively small number of participants who had had paid work experiences. With technical assistance from TransCen, BHBF management instituted programmatic changes that resulted in a larger proportion of service hours being devoted to employment. They also began to systematically monitor the placement of participants in paid jobs. By the time the project ended, more than 50 percent of the participants had held paid jobs at some point during their involvement in the project. However, the development of customized jobs for participants with especially challenging barriers to employment remained a weak aspect of BHBF for the duration of the project. Project staff rarely negotiated with prospective employers to “carve out” new combinations of work responsibilities for project participants; rather, they helped youth obtain employment in response to existing openings for standard jobs.
D. Review of impacts one year after enrollment
The YTD evaluation’s interim report on BHBF (Fraker et al. 2012b) presented the project’s impacts on outcomes in five domains based on data collected 12 months after youth enrolled in the evaluation and were randomly assigned to treatment and control groups: employment-promoting services, paid employment, educational progress, youth income, and attitudes and expectations. Within each domain, we analyzed one primary outcome and a number of supplementary outcomes.

FINAL REPORT ON THE YTD EVALUATION CHAPTER VI: MIAMI-DADE COUNTY, FLORIDA
86
Consistent with the YTD conceptual framework, BHBF increased the use of employment-promoting services by youth with disabilities. Nearly 6 in 10 treatment group youth reported having used any employment-promoting service in the year following their enrollment in the evaluation, whereas less than half of control group youth did so (Table VI.2). The impact of BHBF was a statistically significant increase of 13 percentage points in the use of employment-promoting services. This overall impact was a product of impacts on the use of several specific types of employment services. The largest of these were support for resume writing and job search activities (19 percentage points) and benefits counseling (11 percentage points; not shown in the table).
The positive impact of BHBF on the use of employment-promoting services translated into statistically significant positive impacts on the primary outcomes in the domains of paid employment and youth income, but not on the primary outcomes in the domains of educational progress and attitudes and expectations during the year following enrollment (Table VI.2). The impact estimates presented in the next section reveal whether the impacts of the project on employment and youth income were sustained and whether impacts on other youth outcomes emerged by the third year following enrollment.
The primary outcome of interest related to paid employment was whether a youth was ever employed in a paid job during the year following enrollment in the evaluation. We found that 23 percent of treatment group youth worked for pay sometime during the year, whereas only 13 percent of control group youth did so. The estimated impact of more than 9 percentage points is statistically significant. We also estimated the impact on earnings in the year following enrollment, a supplementary outcome of considerable policy interest in this domain. We found that BHBF increased earnings by a statistically significant $306 (a relative increase of 52 percent); treatment group youth earned an average of $895, whereas control group youth earned just $588.
Although BHBF did not place great emphasis on the provision of education services, it did offer such services to participants who identified education goals during the person-centered planning process or subsequently requested such services. For this reason, we estimated impacts of the intervention on outcomes in the domain of educational progress. The primary outcome in this domain was whether a youth was ever enrolled in school during the year following enrollment or had successfully completed high school by the time of the 12-month follow-up survey. We found that 82 percent of the treatment group youth and 84 percent of control group youth achieved this outcome and the difference between these two percentages is not statistically significant.
In the domain of youth income, we found that BHBF had a positive impact on the primary outcome—total youth income from earnings and disability benefits—during the year following enrollment. The impact of $424 per year is statistically significant and represents an increase of 7 percent over the income of the control group youth. We have noted that the project had a positive impact on earnings. It also had statistically significant positive impacts on the total amount of disability benefits received by youth during the year following enrollment (not shown in the table). The positive impact on benefits may be related, in part, to the fact that that BHBF significantly improved youths’ knowledge of SSA work incentives and requirements (results not shown).

FINAL REPORT ON THE YTD EVALUATION CHAPTER VI: MIAMI-DADE COUNTY, FLORIDA
87
Table VI.2. Miami-Dade Co., FL: one-year impacts on service receipt and selected outcome measures (percentages, unless otherwise noted)
- Treatment
mean Control mean Impact - p-value
Employment-promoting services
Primary outcome: used any employment-promoting service 58.2 45.7 12.5 *** 0.00
Paid employment
Primary outcome: ever employed in paid job 22.8 13.4 9.4 *** 0.00
Supplementary outcome: total earnings ($)a, b 895 588 306 * 0.07
Educational progress
Primary outcome: ever enrolled in school or completed high school by the end of the year
81.6 84.0 -2.5 - 0.37
Youth income
Primary outcome: total income (earnings and SSA benefits) ($)a, b
$6,762 $6,388 $424 * 0.07
Attitudes and expectations
Primary outcome: youth agrees that personal goals include working and earning enough to stop receiving Social Security benefits
70.1 72.2 -2.2 - 0.59
Sources: YTD 12-month survey and SSA administrative records. Notes: The table shows regression-adjusted impact estimates. We measured explanatory variables in the regression model
before enrollment in the evaluation using data from the study’s baseline survey and SSA administrative records. The analysis sample includes 398 treatment group youth and 332 control group youth. We calculated statistics for the survey-based outcomes using sample weights to account for interview non-response. Survey item non-response may have resulted in smaller sample sizes for specific outcomes. All dollar amounts shown in the table are in 2008 dollars.
a For these outcomes, item non-response occurred conditionally, depending on the values of other measures in the survey. The rate of missing data is 4.7 percent for both earnings and income. We used a multiple-imputations procedure to assign values when they were missing. b The average includes youth who were not employed during the year following enrollment. */**/*** Impact estimate is significantly different from zero at the .10/.05/.01 level using a two-tailed t-test.
Finally, we found that BHBF had no impact on the primary outcome in the domain of attitudes and expectations. Table VI.2 shows that 7 in 10 treatment group youth agreed that their personal goals included working and earning enough to stop receiving disability benefits. However, this proportion was essentially the same for the control group.
E. Impacts three years after enrollment
The findings in this section show whether the services provided by BHBF, combined with SSA’s waivers for YTD, led to longer-term impacts on youth outcomes in five domains. The impact estimates indicate that the project did increase the paid employment and earnings of youth during the third year following enrollment. It also increased their total income and participation in productive activities and decreased their contact with the justice system; however, the project did not significantly affect their self-determination. These findings indicate that the positive impacts of BHBF on paid employment, earnings, and income during the initial post-enrollment year persisted in the longer term.
This section also presents impact estimates for three pairs of subgroups (six total subgroups) of youth defined by their work experience, age, and school enrollment status when they enrolled

FINAL REPORT ON THE YTD EVALUATION CHAPTER VI: MIAMI-DADE COUNTY, FLORIDA
88
in the evaluation. The subgroup analysis focused on the primary outcomes in the five domains. The findings show that the positive impact of BHBF on paid employment for the full analytic sample was concentrated in three of the subgroups: youth who had no work experience, youth who were 18 or older, and youth who were out of school. The project’s overall positive impact on earnings was concentrated in just the last two of those subgroups. BHBF’s positive impact on youth income for the full analytic sample was manifested in all of the subgroups. However, in contrast to the absence of impacts on contact with the justice system and self-determination for the full analytic sample, the project reduced contact with the justice system for youth who had no work experience and improved self-determination for out-of-school youth.
1. BHBF increased paid employment and earnings BHBF had positive impacts on the two primary outcomes in the domain of employment and
earnings three years after enrollment in the evaluation. The project increased the share of youth with paid employment and also increased their earnings. One-third of the treatment group youth were ever employed in paid jobs during the third year following enrollment, compared with one-quarter of the youth in the control group (Table VI.3). The estimated impact of 8 percentage points (a relative increase of 31 percent) is statistically significant at the 5 percent level.47 The impact on paid employment was accompanied by a significant impact on earnings, which we calculated from youth reports of their hours worked and wage rates on all paid jobs during the third post-enrollment year. This measure of earnings averaged $1,834 among treatment group youth and $1,219 among control group youth. The difference of $615 (a relative difference of 50 percent) is statistically significant at the 5 percent level.
BHBF also had a positive impact on the intensity of employment during the third year following enrollment but had no impact on employment at the end of the year. Our measure of the intensity of employment is the total hours worked in paid jobs during the year. On average, youth in the treatment group were employed for 237 hours, which is 66 hours more than youth in the control group were employed (a relative increase of 39 percent). The impact is statistically significant at the 10 percent level (Table VI.3). Despite the project’s positive impacts on several outcomes in the domain of employment and earnings, we found that it had no impact on the share of youth with paid jobs at the time of the 36-month survey. Seventeen percent of the treatment youth were employed at the time of the survey, compared with 16 percent of the control youth, but the difference of 1.6 percentage points is not statistically significant. This implies that, although the project increased the share of youth with paid jobs at any time during the third year following enrollment, it was less effective at helping them maintain employment until the end of that year.
Consistent with the survey-based finding of a positive impact on employment, when we analyzed employment based on data from IRS administrative records, we found that BHBF had a positive impact on employment in each of the three calendar years following enrollment. The share of youth in the treatment group with paid jobs increased from 31 percent in the first
47 We also found that BHBF had a statistically significant positive impact of 8 percentage points on the share
of youth who were employed in any job, without regard for whether they were being paid (results not shown in the table).

FINAL REPORT ON THE YTD EVALUATION CHAPTER VI: MIAMI-DADE COUNTY, FLORIDA
89
Table VI.3. Miami-Dade Co., FL: three-year impacts on employment and earnings (percentages, unless otherwise noted)
- Treatment
mean Control mean Impact - p-value
Primary outcomes
Ever employed in a paid job in the past yeara 32.7 24.9 7.8 ** 0.02
Total earnings in the past year ($)a, b, c 1,834 1,219 615 ** 0.04
Supplementary outcomes
Total hours worked in paid jobs in the past yeara, b, c 237.1 170.9 66.2 * 0.07
Employed in paid job at the time of the 36-month surveya, c 17.4 15.8 1.6 - 0.59
Calendar year employment (based on IRS records)d - - - - -
First calendar year following enrollment 30.6 23.0 7.6 *** 0.01
Second calendar year following enrollment 35.5 28.4 7.1 ** 0.02
Third calendar year following enrollmente 36.4 29.9 6.5 * 0.05
Calendar year earnings (based on IRS records) ($)b, d - - - - -
First calendar year following enrollment 1,376 1,074 302 - 0.13
Second calendar year following enrollment 1,988 1,451 537 ** 0.04
Third calendar year following enrollmente 2,386 2,104 282 - 0.46
Sources: YTD 36-month survey and SSA administrative records. Notes: The treatment and control group means and the impact estimates reported in the table are regression adjusted (see
Chapter II, Section A.3). We measured explanatory variables in the regression model before enrollment in the evaluation by using data from the study’s baseline survey and SSA files. “Past year” refers to the year preceding the 36-month survey. All dollar amounts shown in the table are in 2008 dollars.
a Statistics for these measures are based on data for all youth in the analysis sample, which comprises 375 treatment group youth and 310 control group youth who completed the 36-month survey. We calculated the statistics using sample weights to account for interview non-response. Survey item non-response may have resulted in smaller sample sizes for specific outcomes. See Appendix A, Table A.3d for sample sizes for all outcomes. b We included youth who were not employed during the reference period in our calculation of the mean values of these measures. c For these outcomes, item non-response occurred conditionally, depending on the values of other measures in the survey. The rate of missing data ranges from 0.6 percent to 10.1 percent. We used a multiple-imputations procedure to assign values when they were missing. See Appendix A, Section D for more information on this procedure. d Statistics for these measures are based on data for all youth in the research sample, less 19 youth who were identified as deceased at the time of the 36-month survey. The adjusted research sample comprises 448 treatment group youth and 392 control group youth. e Administrative data for the third calendar year after youth’s enrollment in the evaluation were not available for 17.3 percent of the youth in the research sample. Consequently, statistics for these measures are based on data for a subset of all youth in the research sample. */**/*** Impact estimate is significantly different from zero at the .10/.05/.01 level using a two-tailed t-test.
calendar year after enrollment to 35 percent in the second year and to 36 percent in the third year (Table VI.3). These shares are 7.6, 7.1, and 6.5 percentage points larger than the corresponding shares for the control group and the differences are statistically significant at least at the 10 percent level. However, the IRS data were less supportive of the survey-based finding of a positive impact on earnings. The mean earnings of youth in the treatment group increased from $1,376 in the first calendar year after enrollment to $1,988 in the second year and to $2,386 in the third year. These mean values are $302, $537, and $282 higher than the control group means in the three respective years, but only the difference in the second year is statistically significant (at the 5 percent level).

FINAL REPORT ON THE YTD EVALUATION CHAPTER VI: MIAMI-DADE COUNTY, FLORIDA
90
Subgroup findings. BHBF’s positive impacts for the full analytic sample on the survey-based measures of paid employment and earnings during the third year following enrollment in the evaluation were concentrated in three of the six subgroups considered. The project had a positive and statistically significant impacts on employment and earnings for youth who were 18 or older, youth who were out of school, and youth who had no work experience when they enrolled (see Appendix Table A.7d).
2. BHBF increased youth income and the amount of disability benefits BHBF had a positive impact on the primary outcome in the domain of youth income. We
measured this outcome—youth total income in the third year after enrollment in the evaluation—by combining earnings based on youth reports in the survey with disability benefit amounts from SSA administrative records. The first row of Table VI.4 shows that, on average, youth in the treatment group had a total income of $7,414 in the third year following enrollment, which was $1,246 more than that of youth in the control group (a relative increase of 20 percent). This impact estimate is statistically significant at the 1 percent level.
The positive impact of BHBF on youth total income is underpinned by positive impacts on both SSA disability benefits and annual earnings. Table VI.4 shows that 77 percent of treatment group youth and 68 percent of control group youth received any disability benefits during the third post-enrollment year; the 9 percentage point difference is statistically significant at the 1 percent level. The project also had a positive impact on the amount of disability benefits received during the year. On average, youth in the treatment group received $5,340 in disability benefits in the third year following enrollment, which was $698 more than the average amount received by control group youth. This difference is statistically significant at the 1 percent level. The positive impacts on the receipt and amount of benefits are not surprising. We anticipated that the SSA waivers for YTD would result in increased benefits even during the third year following enrollment, by allowing youth to keep more of their benefits while earning income through work. Of particular relevance is the Section 301 waiver, which delayed the effectuation of a negative age-18 SSI eligibility redetermination for four years after enrollment. The larger benefits received by treatment youth and their larger earnings, as documented in Table VI.3, account roughly equally for the project’s impact on youth total income.
BHBF did not shift the source of youth income away from benefits and toward earnings. We estimated that 17 percent of the total annual income of both treatment and control group youth came from earnings (Table VI.4).
We also estimated the project’s impacts on two indicators of the economic well-being of the youth and their families: a measure of health insurance coverage and a measure of the receipt of public assistance. BHBF increased health insurance coverage and the receipt of public assistance. We found that 84 percent of treatment group youth were covered by either public or private health insurance at the time of the 36-month survey, compared with 78 percent of youth in the control group; the 6 percentage point impact (a relative increase of 8 percent) is statistically significant at the 10 percent level. This finding is explained primarily by a statistically significant impact on public health insurance coverage (not shown in table). We also found that 65 percent of treatment group youth and 56 percent of control group youth lived in households that received SNAP, TANF, or housing assistance in the month preceding the 36-month survey. The positive impact of 9 percentage points (a relative increase of 16 percent) is statistically significant at the 5 percent level.

FINAL REPORT ON THE YTD EVALUATION CHAPTER VI: MIAMI-DADE COUNTY, FLORIDA
91
Table VI.4. Miami-Dade Co., FL: three-year impacts on youth income (percentages, unless otherwise noted)
- Treatment
mean Control mean Impact - p-value
Primary outcome
Total income from earnings (from survey) and disability benefits (from SSA files) in the past year ($)a, b, c
7,414 6,167 1,246 *** 0.00
Supplementary outcomes
Any disability benefits (from SSA files) in the past yeard 76.8 67.5 9.4 *** 0.00
Total amount of disability benefits (from SSA files) in the past year ($)b, d
5,340 4,642 698 *** 0.00
Proportion of total income from earningsa, b, c 17.3 17.1 0.1 - 0.96
Current public or private health insurance coveragea 84.1 78.1 6.0 * 0.05
Receipt of public assistance (TANF, SNAP, housing assistance) in the past montha
65.1 56.3 8.8 ** 0.02
Sources: YTD 36-month survey and SSA administrative records. Notes: The treatment and control group means and the impact estimates reported in the table are regression adjusted (see
Chapter II, Section A.3). We measured explanatory variables in the regression model before enrollment in the evaluation by using data from the study’s baseline survey and SSA files. “Past year” refers to the year preceding the 36-month survey. All dollar amounts shown in the table are in 2008 dollars.
a Statistics for these measures are based on data for all youth in the analysis sample, which comprises 375 treatment group youth and 310 control group youth who completed the 36-month survey. We calculated the statistics using sample weights to account for interview non-response. Survey item non-response may have resulted in smaller sample sizes for specific outcomes. See Appendix A, Table A.3d for sample sizes for all outcomes. b We included youth who had no earnings or received no SSA benefits in our calculation of the mean values of these measures. c For these outcomes, item non-response occurred conditionally in measuring earnings, depending on the values of other measures in the survey. The rate of missing data in the annual earnings measure was 10.1 percent. We used a multiple-imputations procedure to assign earnings when they were missing. See Appendix A, Section D for more information on this procedure. d Statistics for these measures are based on data for all youth in the research sample, less 19 youth who were identified as deceased at the time of the 36-month survey. The adjusted research sample comprises 448 treatment group youth and 392 control group youth. */**/*** Impact estimate is significantly different from zero at the .10/.05/.01 level using a two-tailed t-test.
Subgroup findings. The project’s positive and statistically significant impact on youth total income in the third year following enrollment in the evaluation for the full analytic sample was manifested in five of the six subgroups considered Appendix Table A.7d). Except for the subgroup of youth who had work experience when they enrolled in the evaluation, the project had a positive and statistically significant impact on youth total income.
3. BHBF increased participation in productive activities BHBF had a positive impact on the primary outcome in the domain of productive activities.
This outcome is a composite measure of a youth’s participation in education, training, and paid or unpaid employment during the third year following enrollment in the evaluation. As shown in Table VI.5, 71 percent of treatment group youth participated in at least one productive activity, compared with just 63 percent of control group youth. The 8 percentage point difference is statistically significant at the 5 percent level.
Analysis of supplementary outcomes in the domain of productive activities revealed that BHBF’s positive impact on participation in productive activities was driven by its impact on employment, discussed above, rather than by its impact on participation in education or training

FINAL REPORT ON THE YTD EVALUATION CHAPTER VI: MIAMI-DADE COUNTY, FLORIDA
92
Table VI.5. Miami-Dade Co., FL: three-year impacts on productive activities (percentages)
- Treatment
mean Control mean Impact - p-value
Primary outcome
Participated in paid employment, unpaid employment, education, or training in the past year
71.0 62.6 8.4 ** 0.02
Supplementary outcomes
Participated in education or training program in the past year 53.4 50.8 2.6 - 0.48
Completed high school (attained high school diploma/GED/ certificate or higher) by the time of the 36-month survey
62.7 61.6 1.1 - 0.76
Ever enrolled in college or technical school 10.9 10.4 0.4 - 0.85
Source: YTD 36-month survey. Notes: The treatment and control group means and the impact estimates reported in the table are regression adjusted (see
Chapter II, Section A.3). We measured explanatory variables in the regression model before enrollment in the evaluation by using data from the study’s baseline survey and SSA files. Statistics for these measures are based on data for all youth in the analysis sample, which comprises 375 treatment group youth and 310 control group youth who completed the 36-month survey. We calculated the statistics using sample weights to account for interview non-response. Survey item non-response may have resulted in smaller sample sizes for specific outcomes. See Appendix A, Table A.3d for sample sizes for all outcomes. “Past year” refers to the year preceding the 36-month survey.
*/**/*** Impact estimate is significantly different from zero at the .10/.05/.01 level using a two-tailed t-test.
programs. We found that 53 percent of treatment group youth participated in education or training programs during the third year following enrollment in the evaluation, compared with 51 percent of control group youth, but the difference is not statistically significant.
We also found that BHBF had no impacts on high school completion by the time of the 36-month survey or on the share of youth who had ever enrolled in a college or technical school. Sixty-three percent of treatment group youth and 62 percent of control group youth had completed high school, but the 1 percentage point difference is not statistically significant. Slightly more than 10 percent of both treatment group and control group youth had enrolled at any time in a college or technical school.
Subgroup findings. BHBF’s positive impact on the primary outcome in this domain for the full analytic sample was manifested in four of the six subgroups considered: youth who were 18 or older, youth who were out of school, and youth both with and without work experience when they enrolled in the evaluation. For these youth, the project had a positive and statistically significant impact on participation in any productive activity during the third year following enrollment in the evaluation (see Appendix Table A.7d).
4. BHBF decreased contact with the justice system BHBF had a desirable negative impact on the primary outcome in the domain of contact
with the justice system: having been arrested or charged with delinquency or a criminal complaint during the third year following enrollment in the evaluation. Less than 1 percent of treatment group youth reported that they had been arrested or charged during the follow-up period, compared with more than 3 percent of control group youth (Table VI.6). The 3 percentage point difference (a relative decrease of 84 percent) is statistically significant at the 5 percent level.
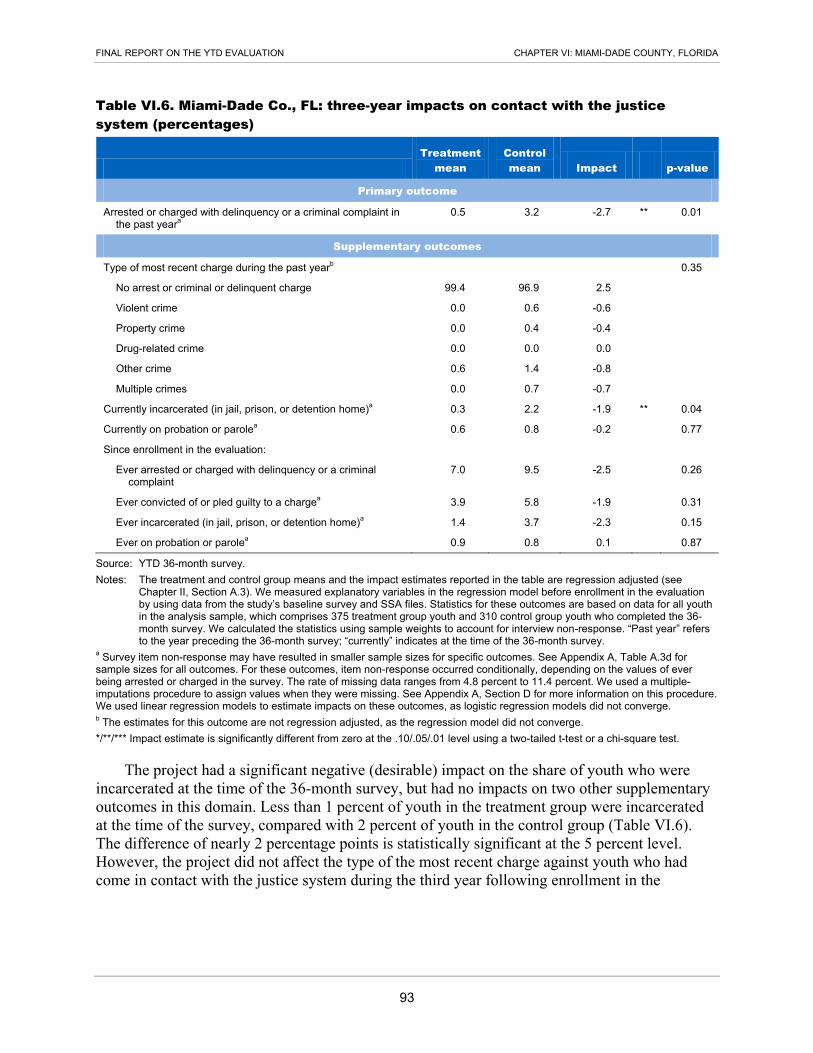
FINAL REPORT ON THE YTD EVALUATION CHAPTER VI: MIAMI-DADE COUNTY, FLORIDA
93
Table VI.6. Miami-Dade Co., FL: three-year impacts on contact with the justice system (percentages)
Treatment
mean Control mean Impact p-value
Primary outcome
Arrested or charged with delinquency or a criminal complaint in the past yeara
0.5 3.2 -2.7 ** 0.01
Supplementary outcomes
Type of most recent charge during the past yearb - - - - 0.35
No arrest or criminal or delinquent charge 99.4 96.9 2.5 - -
Violent crime 0.0 0.6 -0.6 - -
Property crime 0.0 0.4 -0.4 - -
Drug-related crime 0.0 0.0 0.0 - -
Other crime 0.6 1.4 -0.8 - -
Multiple crimes 0.0 0.7 -0.7 - -
Currently incarcerated (in jail, prison, or detention home)a 0.3 2.2 -1.9 ** 0.04
Currently on probation or parolea 0.6 0.8 -0.2 - 0.77
Since enrollment in the evaluation: - - - - -
Ever arrested or charged with delinquency or a criminal complaint
7.0 9.5 -2.5 - 0.26
Ever convicted of or pled guilty to a chargea 3.9 5.8 -1.9 - 0.31
Ever incarcerated (in jail, prison, or detention home)a 1.4 3.7 -2.3 - 0.15
Ever on probation or parolea 0.9 0.8 0.1 - 0.87
Source: YTD 36-month survey. Notes: The treatment and control group means and the impact estimates reported in the table are regression adjusted (see
Chapter II, Section A.3). We measured explanatory variables in the regression model before enrollment in the evaluation by using data from the study’s baseline survey and SSA files. Statistics for these outcomes are based on data for all youth in the analysis sample, which comprises 375 treatment group youth and 310 control group youth who completed the 36-month survey. We calculated the statistics using sample weights to account for interview non-response. “Past year” refers to the year preceding the 36-month survey; “currently” indicates at the time of the 36-month survey.
a Survey item non-response may have resulted in smaller sample sizes for specific outcomes. See Appendix A, Table A.3d for sample sizes for all outcomes. For these outcomes, item non-response occurred conditionally, depending on the values of ever being arrested or charged in the survey. The rate of missing data ranges from 4.8 percent to 11.4 percent. We used a multiple-imputations procedure to assign values when they were missing. See Appendix A, Section D for more information on this procedure. We used linear regression models to estimate impacts on these outcomes, as logistic regression models did not converge. b The estimates for this outcome are not regression adjusted, as the regression model did not converge. */**/*** Impact estimate is significantly different from zero at the .10/.05/.01 level using a two-tailed t-test or a chi-square test.
The project had a significant negative (desirable) impact on the share of youth who were incarcerated at the time of the 36-month survey, but had no impacts on two other supplementary outcomes in this domain. Less than 1 percent of youth in the treatment group were incarcerated at the time of the survey, compared with 2 percent of youth in the control group (Table VI.6). The difference of nearly 2 percentage points is statistically significant at the 5 percent level. However, the project did not affect the type of the most recent charge against youth who had come in contact with the justice system during the third year following enrollment in the

FINAL REPORT ON THE YTD EVALUATION CHAPTER VI: MIAMI-DADE COUNTY, FLORIDA
94
evaluation.48 Neither did it affect the share of youth who were on probation or parole at the time of the 36-month survey. Less than 1 percent of both treatment and control group youth were on probation or parole at that time.
BHBF had no impacts on four supplementary outcomes in this domain pertaining to the entire time between when youth enrolled in the evaluation and when they completed the 36-month survey. The first of these outcomes is whether the youth had ever been arrested or charged with delinquency or a criminal complaint following enrollment. Seven percent of treatment group youth and 10 percent of control group youth reported that this had happened to them. The difference is not statistically significant. Smaller shares of youth reported that they had ever been convicted or pled guilty to a charge (the second outcome) following enrollment. This had happened to 4 percent of treatment group youth and 6 percent of control group youth. Again, the difference is not statistically significant. Finally, the project had no impacts on whether youth had ever been incarcerated (the third outcome) or had ever been on probation or parole (the fourth outcome) since enrollment.
Subgroup findings. BHBF’s positive impact on the primary outcome in the domain of contact with the justice system for the full analytic sample was manifested in four of the six subgroups considered: youth who had no work experience, in-school and out-of-school youth, and youth who were younger than 18 when they enrolled in the evaluation. Among these youth, the project reduced the share who had been arrested or charged with delinquency or a criminal complaint during the third year following enrollment (see Appendix Table A.7d).
5. BHBF had no impact on self-determination BHBF provided few services designed to directly improve the self-determination of
participating youth; however, the program model, with its emphasis on person-centered planning and paid work experience, had the potential to indirectly result in participants becoming more self-determined. Nevertheless, the project had no impact on the primary outcome in the domain of self-determination, which is an index of self-determination measured on a four-point scale, as described in Chapter II. The average value of this index for both treatment and control group youth is 2.8 (Table VI.7). Furthermore, the project had no impacts on the three subindices of self-determination, measuring youths’ senses of autonomy, internal locus of control, and external locus of control.
BHBF also had no impacts on two additional supplementary outcomes in the domain of self-determination: future independence and living arrangement. The binary measure of future independence indicates whether youth agree with the statement that their “goals include working or continuing to work in a paid job.” Eighty-six percent of treatment group youth and 82 percent of control group youth agreed with the statement (Table VI.7), but the 4.6 percentage point difference is not statistically significant. The project also had no impact on the living arrangements of youth at the time of the 36-month survey. Focusing first on youth in the
48 The shares of treatment and control group youth who reported no arrest or charge of delinquency or a
criminal complaint during the third year following enrollment in the evaluation are slightly different from what we would expect based on the corresponding shares for the primary outcome in this domain. This lack of full correspondence is explained by differential rates of item non-response to the underlying survey questions and imputation of conditional missing values for the primary outcome.

FINAL REPORT ON THE YTD EVALUATION CHAPTER VI: MIAMI-DADE COUNTY, FLORIDA
95
Table VI.7. Miami-Dade Co., FL: three-year impacts on self-determination
- Treatment
mean Control mean Impact - p-value
Primary outcome
Index of self-determinationa (4-point scale) 2.8 2.8 0.1 - 0.20
Supplementary outcomes
Subindices of self-determination (4-point scales) --- -- -- -- -
Index of autonomya 2.7 2.6 0.1 -- 0.24
Index of internal locus of controla 3.2 3.1 0.1 -- 0.39
Index of external locus of controla 2.5 2.5 0.1 -- 0.44
Future independencea (%) 86.2 81.5 4.6 -- 0.17
Living arrangement (%) - - - -- 0.63
Independently, without help 8.4 6.8 1.5 -- -
With parents or guardians, without help 48.3 52.6 -4.2 -- --
Independently or with parents or guardians, with help 37.0 33.7 3.3 -- --
Institutional setting or homeless 6.3 6.9 -0.6 -- --
Source: YTD 36-month survey. Notes: The treatment and control group means and the impact estimates reported in the table are regression adjusted (see
Chapter II, Section A.3). We measured explanatory variables in the regression model before enrollment in the evaluation by using data from the study’s baseline survey and SSA files. Statistics for these measures are based on data for all youth in the analysis sample, which comprises 375 treatment group youth and 310 control group youth who completed the 36-month survey. We calculated the statistics using sample weights to account for interview non-response. Survey item non-response may have resulted in smaller sample sizes for specific outcomes. See Appendix A, Table A.3d for sample sizes for all outcomes.
a See Chapter II, Section A.1 for explanations of these measures of various aspects of self-determination. */**/*** Impact estimate is sign ificantly different from zero at the .10/.05/.01 level using a two-tailed t-test or a chi-square test.
treatment group, the table shows that they were most commonly living with their parents or guardians and not receiving professional help with activities of daily living (48 percent). Eight percent were living independently (alone, with a spouse or partner, with his or her own child, or with a roommate or friend) and also were not receiving professional help with activities of daily living. In contrast, 37 percent were receiving professional help with activities of daily living while living either independently or with their parents or guardians. Finally, 6 percent of treatment group youth were living in institutional settings or were homeless. The distribution of living arrangements for control group youth is very similar to that for treatment group youth and the difference is not statistically significant.
Subgroup findings. Although BHBF had no impact on the primary outcome in the domain of self-determination for the full analytic sample, it did have a statistically significant positive impact on this outcome for one of the six subgroups considered: youth who were out of school when they enrolled in the evaluation (Appendix Table A.7d).
F. Costs of providing services
The cost of the resources used by BHBF to deliver services was $6,540 per participant, on average. Based on data that we systematically collected from ServiceSource (the grantee), the project staff, and other sources, we calculated this and other measures of project costs using the methodology outlined in Chapter II (Honeycutt and Murphy 2014a). In this section, we
FINAL REPORT ON THE YTD EVALUATION CHAPTER VI: MIAMI-DADE COUNTY, FLORIDA
96
summarize our findings from that analysis, giving particular attention to the total project cost and the costs of project components, in addition to the average cost per participant.
1. The total one-year cost of BHBF was $838,332 The total one-year cost for BHBF to deliver services to 374 participants was $838,332.49
This amount represents the cost of all resources used to operate the project in a selected one-year cost accounting period—October 2010 through September 2011—when project start-up and close-out costs were negligible and enrollment had been completed.50 ServiceSource (which administered the project and provided most services) accounted for 96 percent of the total cost. One of two partner agencies, HSC (which provided training to participants on financial literacy), accounted for 4 percent of the total cost. The other partner agency, NDI, had no costs during the cost accounting period; it provided staff training and technical assistance on local economic and benefit issues during the first two years of the project, in 2008 and 2009.51
Direct labor was the project’s largest cost category. Wages, salaries, and fringe benefits accounted for 65 percent of total project costs. Indirect costs accounted for 28 percent of total costs, with general administrative costs (including, for example, the cost of support provided by a human resources department) being the largest cost component in this category, followed by rent and utilities, with staff travel also being a substantive component. Other direct costs (payments made directly to participants or to vendors on behalf of participants) accounted for just 5 percent of total project costs. Most of these costs were payments to HSC to provide support on financial literacy issues and IDAs. Unbudgeted costs (those that did not entail cash outlays by the project but involved essential resources) accounted for just 2 percent of total costs. In addition to bus passes for participants, BHBF received donated items from companies (food and raffle prizes) for its job fairs, as well as meeting space for the fairs.
2. Employment services were the largest cost component Direct services accounted for 86 percent of total project costs, whereas project
administration (activities related to the oversight of BHBF) accounted for the remaining 14 percent (Table VI.8). Among the four components of direct services, employment services (finding work experiences for participants and providing employed participants with job coaching) was the largest, representing 45 percent of all project costs. Benefits counseling accounted for 21 percent of project costs. Empowerment services and general case management (such as referring youth to other programs for services not directly related to employment) together accounted for 16 percent of total costs. Education services constituted the smallest direct service component, representing only 4 percent of all project costs.
49 Of the 460 randomly assigned treatment group members, 388 participated in BHBF, as did 12 of the 13 non-
randomly assigned treatment group members. We included the latter youth in the cost analysis (but not in the impact analysis) because the project provided services to them and incurred costs in doing so. Only 374 of the 400 participants were enrolled in the project at some time during the cost accounting period.
50 Enrollment occurred from April 2008 through September 2010. 51 Although NDI had no expenditures during the cost accounting period, its budgeted costs in 2008 and 2009
represented less than 1 percent of the project’s total budget. By comparison, HSC’s budgeted costs represented 5 percent of the project’s total budget, with the remainder accounted for by ServiceSource.

FINAL REPORT ON THE YTD EVALUATION CHAPTER VI: MIAMI-DADE COUNTY, FLORIDA
97
Table VI.8. Miami-Dade Co., FL: project costs in the cost accounting period, by program component
Program component Cost in cost
accounting period Percentage of
total cost
Project administration $119,704 14
Direct services - -
Benefits counseling $177,328 21
Education services $28,996 4
Employment services $375,657 45
Empowerment services and case management $136,647 16
Total $838,332 100
Sources: BHBF expenditure summary, memoranda of understanding with subcontractors, leases, indirect cost rate agreement, personal communication with BHBF staff, and BHBF staff activity reports.
Note: All dollar amounts shown in the table are in 2008 dollars.
3. The average cost per BHBF participant was $6,540 The average cost per BHBF participant is a measure of the commitment of resources to
serve youth who enrolled in the project. In the one-year cost accounting period, 374 youth were enrolled in the BHBF for a total of 3,852 months (Table VI.9). By dividing the total cost of the project in the accounting period by the total number of enrollment months, we calculate an average cost per enrollment month of $218. This is a measure of the project’s unit cost during the cost accounting period. When we apply the unit cost to the average number of months that youth were enrolled in the BHBF over the entire life of the project—30.0 months—the result is $6,540, which is our estimate of the average cost per participant over the life of the project.
Table VI.9. Miami-Dade Co., FL: average project cost per participant
Number of participants in
cost accounting period
(A)
Total person-months of
enrollment in cost accounting
period (B)
Total project cost in cost accounting
period (C)
Average cost per enrollment month in cost
accounting period (D=C/B)
Average number of months of
enrollment over life of project
(E)
Average cost per participant
over life of project (F=DxE)
374 3,852 $838,332 $218 30.0 $6,540
Notes: Dollar values are in 2008 dollars. The number of enrollment months for an individual youth is calculated as the number of months from enrollment in BHBF to the last receipt of services. In Column B, this calculation is bounded by the beginning and ending months of the cost accounting period and is shown in aggregate for all participants in the cost accounting period. In Column E, it is unbounded and is shown as an average for all BHBF participants. All dollar amounts shown in the table are in 2008 dollars.
G. Summary and discussion of findings
This chapter has presented findings that BHBF in Miami-Dade County, Florida, had positive and statistically significant impacts three years after youth enrolled in the YTD evaluation on primary outcomes in the domains of employment and earnings, youth total income, and participation in productive activities. However, the project had no impacts during that year on self-determination and contact with the justice system. These findings are broadly consistent with those from the interim report on BHBF, which found that the project had positive impacts
FINAL REPORT ON THE YTD EVALUATION CHAPTER VI: MIAMI-DADE COUNTY, FLORIDA
98
on employment, earnings, and youth total income during the initial post-enrollment year (Fraker et al. 2012b).
Findings from several data sources confirm BHBF’s positive impacts on outcomes related to employment and income. According to data from the 36-month survey, the share of treatment group youth who were employed for pay during the third post-enrollment year was 8 percentage points larger than the corresponding share of control group youth. This finding is reinforced by the results of an analysis of IRS earnings data, which showed that treatment group youth were approximately 7 percentage points more likely than control group youth to be employed for pay in each of the three calendar years following enrollment. On average, treatment group members received $631 more earnings, $711 more disability benefits, and $1,285 more total income from earnings and benefits than control group members during the third year following enrollment. All of these treatment-control differences are statistically significant at the 10 percent level or lower.
BHBF delivered a substantial dose of services to youth in Miami-Dade County. On average, participants in the intervention received 29 hours of project services of all types, of which half were designed to directly improve their employment outcomes (Fraker et al. 2012b). Although BHBF staff provided employment services over the full life of the project, they were especially focused on developing work experiences for youth and placing them in paid competitive jobs during the second half of the project’s period of performance. This adjustment was made in response to technical assistance provided by TransCen, which had determined that project staff had devoted disproportionate effort during the initial year to general case management, while giving insufficient attention to job development and job placement. In response to TransCen’s technical assistance, BHBF management implemented changes in staffing, training, and monitoring to focus project services more sharply on employment. This included using the project’s management information system to monitor both the number of staff service hours being devoted to employment and the paid employment outcomes of individual participants.
The flexibility and receptiveness of BHBF management and staff to technical assistance facilitated the project’s delivery of services that were focused on the achievement of positive employment outcomes for participating youth. This approach to services, combined with SSA’s waivers for YTD, resulted in a consistent pattern of statistically significant positive impacts on youth employment, earnings, and total income over the full three-year follow-up period for the YTD evaluation.

99
VII. MONTGOMERY COUNTY, MARYLAND
The Career Transition Program (CTP) in Montgomery County, Maryland, was well- implemented and increased services received by youth, but it had no impact on youth employment or earnings three years after their enrollment in the YTD evaluation. The project provided services to promote educational advancement, employment, and self-sufficiency among youth who had been diagnosed with severe emotional disturbances or other mental illnesses. Our interim report showed that the project maintained a high degree of fidelity to its program model and to the YTD conceptual framework and that it had a statistically significant impact on the receipt of services but no impacts on paid employment or earnings during the year after enrollment (Fraker et al. 2012c). However, our analysis of data collected 36 months after youth enrolled in the evaluation revealed longer-term impacts of the project on employment-related outcomes. We found that it had positive and statistically significant impacts on earnings and total income during the third year following enrollment, but it did not have any impacts on employment in paid jobs, participation in productive activities, contact with the justice system, or self-determination. The project’s average cost per participant was $8,443.
A. Project overview
St. Luke’s House, Inc. (SLH), a comprehensive community mental health services provider in Montgomery County, Maryland, originally implemented CTP in 1993 and continued to administer the project during the period of its participation in the YTD evaluation.52 SLH maintained formal partnerships with Montgomery County Public Schools (MCPS), non-public high schools in Montgomery County, and the Maryland Division of Rehabilitation Services. In addition, the CTP staff had informal relationships with a number of agencies that served youth with disabilities, including the local One-Stop Workforce Center,53 local community college, and local mental health services agency. The vocational director at SLH had ultimate administrative responsibility for CTP as the project director. A full-time project manager was responsible for the day-to-day operations of CTP, assisted by two management-level staff, each of whom supervised a team of up to seven career transition specialists who were the project’s principal front-line staff. Additional project staff included a workforce development specialist, a management information system administrator, a benefits specialist, and a recruitment specialist.
CTP sought to increase participants’ self-sufficiency by providing them with counseling, linkages to available services, and individualized work experiences. The project provided about one year of core services to individual participants. These included formal assessments and goal setting as key elements in a person-centered planning process, assistance in obtaining either competitive paid employment, employment support, education counseling and support, benefits information and planning, and comprehensive case management, including referrals for additional services that CTP could not provide directly. The career transition specialists delivered most of these services; in doing so, they often formed strong one-to-one bonds with the participants. Participants who achieved their established goals could receive “follow-along”
52 On July 1, 2012, SLH merged with Threshold Services to form St. Luke’s House & Threshold Services United, Inc. This organization subsequently changed its name to Cornerstone Montgomery, Inc.
53 One-Stop Workforce Centers are now referred to as American Job Centers.

FINAL REPORT ON THE YTD EVALUATION CHAPTER VII: MONTGOMERY COUNTY, MARYLAND
100
services. During this phase, participants were eligible for all CTP services, but their contacts with the career transition specialists were initiated by the youth and typically were less frequent than when they were receiving core services.
The target population for the project was Montgomery County residents ages 16 to 21 who had been classified by MCPS or the public mental health system as having severe emotional disturbances or significant mental illnesses, and were either in their last two years of high school or had graduated or left school within the past year.54 In contrast to the other five random assignment YTD projects, CTP did not restrict enrollment to Social Security disability beneficiaries (including those receiving SSI, DI, and CDB).55 Another distinctive feature of CTP’s involvement in the evaluation is that the project, rather than Mathematica, was responsible for identifying eligible youth and recruiting them into the YTD evaluation. Recruitment was a major challenge for CTP, requiring repeated adjustments to strategies and staffing during the first 18 months of the project’s involvement in the evaluation. To meet target numbers, CTP may have loosened its interpretation of target population criteria, enrolling some youth that it might not previously have served, such as youth with Asperger’s syndrome and less significant mental health needs. Also, the CTP recruiters emphasized during their outreach efforts to youth that those who enrolled in the evaluation would have a chance to participate in a program that would help them find jobs. This may have yielded enrollees who were especially motivated to become employed.
CTP served a sufficient number of youth to support a rigorous evaluation: 840 youth agreed to participate in the study, provided formal consent, and completed the baseline survey.56 These youth were randomly assigned to a treatment group that was eligible for CTP services and the SSA waivers for YTD (if they were beneficiaries), or to a control group that was eligible for neither but could access other services available in the community. The project staff enrolled 89 percent of the treatment group youth in project services between April 2008 and January 2011.57 CTP’s involvement in the YTD evaluation formally ended in March 2012 but it leveraged funding from other sources to continue to enroll and serve youth after that date.
54 Severe emotional disturbances include conditions such as schizophrenia; personality, mood, conduct, and
anxiety disorders; attention deficit disorder; attention deficit hyperactivity disorder; and depression. Significant mental illnesses include conditions such as depression, bipolar disorder, schizophrenia, dissociative identity disorder, and attention deficit hyperactivity disorder.
55 As documented in Table VII.1 below, approximately one-fifth of the youth who enrolled in the evaluation had received SSA disability benefits in the year prior to enrollment.
56 Of the 840 youth recruited into the evaluation, 805 were randomly assigned––422 to the treatment group and 383 to the control group. The remaining 35 youth had siblings already in the evaluation and were automatically assigned to the same group as their siblings (27 treatment cases and 8 control cases); they were not included in the analysis for the evaluation.
57 Only one youth enrolled in CTP project services in January 2011.

FINAL REPORT ON THE YTD EVALUATION CHAPTER VII: MONTGOMERY COUNTY, MARYLAND
101
B. Baseline characteristics of the analytic sample
The analytic sample for the three-year impact analysis of CTP consists of the 595 randomly assigned evaluation enrollees who completed the 36-month follow-up survey.58 As shown in Table VII.1, about two-thirds of the sample members were male and a little less than half were younger than 18 when they enrolled in the evaluation. The largest racial category among the youth in the analytic sample was white (41 percent), closely followed by black (40 percent). Twenty-three percent of the youth across racial groups reported being Hispanic. About one in five of the sample members were not attending school at baseline, whereas a little more than a half were attending a regular high school; the rest were attending a special high school or other type of school (including college). Notably, about three-quarters of the youth had worked for pay sometime before enrolling in the evaluation and more than half of them had done so in the previous year. These youth had been able to find jobs without the assistance of CTP.
Given that only 21 percent of the youth in the analytic sample were receiving SSI, which is means tested, it is not surprising that most of them were not from low-income families. Nearly two-thirds of the sample members' families had incomes of $25,000 or more per year. Forty-five percent of the sample members were living with two parents and another 44 percent were living with a single parent; the remainder were either living by themselves or had other arrangements. Slightly more than three-quarters of the youth had a mother who had graduated from high school and a similar fraction had a father who had done so.
Despite having significant emotional and mental health issues, most of the youth in the analytic sample considered themselves to be in good health and had positive expectations for themselves in the future. Sixty-one percent reported being in good or very good health, whereas 27 percent reported excellent health and 12 percent reported fair or poor health. About four-fifths of the youth reported that they expected to live independently in the future (79 percent) and nearly all of them expected to continue their education (95 percent) and work at least part time for pay (98 percent).
On average, these baseline characteristics are similar for members of the treatment and control groups, as expected, given that they were assigned to these groups at random. We compared 44 baseline characteristics of treatment and control group members in the analytic sample, 17 of which we report in Table VII.1 (p-values are shown in the table for these characteristics). We did not observe any statistically significant differences in baseline characteristics between the treatment and control groups. Thus, the treatment and control groups in the analytic sample for the three-year impact analysis of CTP can be considered equivalent at baseline.
58 There is a larger sample of randomly assigned evaluation enrollees for whom we have data on earnings and
benefits from administrative records. This full research sample consists of the 805 youth who enrolled in the evaluation and were randomly assigned to treatment or control status, less 7 youth who had died as of the three-year anniversary of their enrollment, for a total of 798 youth (416 treatment and 382 control cases). These cases also constitute the denominator for the calculation of the response rate to the 36-month survey, which was 74.6 percent. For outcomes based on administrative data, we report impact analysis results for the full research sample, less the deceased youth.

FINAL REPORT ON THE YTD EVALUATION CHAPTER VII: MONTGOMERY COUNTY, MARYLAND
102
Table VII.1. Montgomery Co., MD: baseline characteristics of the analytic sample (percentages, unless otherwise noted)
Characteristic All Treatment Control Difference p-value
Male 67.7 68.1 67.2 0.8 0.83 Age in years - - - - 0.32
15–17 45.39 45.96 44.77 1.19 - 18–21 53.23 51.98 54.59 -2.61 - 22–23 1.38 2.06 0.64 1.42 -
Race - - - - 0.11 White 40.9 43.1 38.6 4.5 - Black 39.7 40.9 38.3 2.6 - American Indian/AK/HI/Pacific Island 0.7 1.1 0.3 0.8 - Asian 4.7 4.2 5.2 -1.0 - Other or unknown 14.0 10.7 17.6 -6.9 -
Ethnicity: Hispanic 22.9 22.2 23.8 -1.6 0.65 School attendance - - - - 0.61
Does not attend school 22.1 23.8 20.1 3.7 - Attends regular high school 54.3 54.2 54.4 -0.2 - Attends special high school 13.5 12.0 15.2 -3.2 - Attends other school 10.1 9.9 10.3 -0.3 -
Employment and earnings - - - - - Worked for pay in last year 56.9 59.7 53.9 5.8 0.16 Never worked for pay at baseline 25.7 25.9 25.5 0.5 0.90 Earnings in calendar year before enrollment ($) 1,046 1,322 725 597 0.16
Living arrangement 0.32 Two-parent family 45.1 46.2 44.0 2.2 - Single-parent family 43.8 40.6 47.2 -6.7 - Group home 1.6 1.6 1.5 0.1 - Other institution 5.0 6.4 3.5 2.9 - Lives alone or with friends 4.5 5.2 3.8 1.4 -
Family annual income 0.95 Less than $10,000 18.3 18.2 18.5 -0.3 - $10,000–$24,999 16.6 16.1 17.0 -0.9 - $25,000 or more 65.1 65.7 64.4 1.3 -
Parents’ education - - - - - Mother is high school graduate 79.1 77.6 80.6 -2.9 0.40 Father is high school graduate 75.1 78.2 71.8 6.4 0.12
Expectations about the future - - - - - Expects to live independently (w/ or w/o help) 79.4 79.4 79.4 -0.1 0.99 Expects to continue education 94.8 94.6 95.0 -0.5 0.80 Expects to work at least part time for pay 97.9 98.2 97.5 0.7 0.58
SSA benefits - - - - - Received SSA benefits in the last year 21.2 20.9 21.6 -0.6 0.85
Self-reported health status - - - - 0.30 Excellent 27.3 25.6 29.2 -3.6 - Very good/good 61.2 64.1 58.0 6.2 - Fair/poor 11.5 10.3 12.9 -2.6 -
Sample size 595 320 275 - -
Sources: YTD baseline survey and SSA administrative records. Notes: We weighted statistics to adjust for non-response to the 36-month survey. Baseline survey item non-response may have resulted
in smaller sample sizes for some characteristics than indicated at the bottom of the table. See Appendix Table A.1e for statistics on the full set of baseline characteristics we examined. All dollar amounts shown in the table are in 2008 dollars.
*/**/*** Treatment-control difference is statistically different from zero at the .10/.05/.01 level using either a two-tailed t-test or a chi-square test
C. Review of findings from the process analysis
The process analysis of CTP, described in detail in the interim report (Fraker et al. 2012c), involved assessing the project’s intervention design, implementation, and intensity of services. To inform this analysis, we used a variety of methods to gather information, including a review

FINAL REPORT ON THE YTD EVALUATION CHAPTER VII: MONTGOMERY COUNTY, MARYLAND
103
of project documents, site visits, interviews with managers and staff, and focus group discussions with participating youth and their parents. We also analyzed data from the project’s management information system to document the efforts of project staff to enroll treatment group youth in CTP and deliver services to them.
Throughout its involvement in the YTD evaluation, CTP maintained a strong focus on assisting youth in achieving both educational and employment outcomes through a combination of mental health, educational, and career/vocational supports. The program model reflected the principles of supported employment through individualized placement and support. It had been refined through 14 years of operation prior to CTP’s selection into the YTD evaluation. To facilitate its selection, CTP expanded its capacity to allow it to serve three times as many youth per year as it had served in the past. During a pilot phase, prior to CTP’s final selection into the evaluation, the project’s management and staff demonstrated their ability to recruit and enroll youth in a random assignment context, while refining the project’s management structure for expanded operations, building capacity for job development, and increasing the focus on benefits planning. The restructured project retained its emphasis on improving the participants’ self-sufficiency by enabling them to graduate from high school, providing them with competitive employment experiences, and helping them matriculate into postsecondary education programs if they were interested in doing so.
The project delivered comprehensive employment-focused services to most of the treatment group youth with a high degree of fidelity to the program model. Out of the 422 randomly assigned treatment group youth, 374 (89 percent) participated in project services. Each participant was matched with a career transition specialist to develop an individualized plan specifying his or her transition goals for employment and education and the services that would promote the attainment of those goals. Work-based experiences, such as informational interviews and visits to job sites, were used both to refine those goals and as stepping stones to competitive paid employment. The project supported the development and attainment of education goals that were well integrated with employment objectives. Once a participant obtained competitive employment, often through the job development and placement efforts of CTP staff, the project provided employment supports, such as job coaching. At virtually any time during their involvement in CTP, participants could receive counseling on Social Security and other benefits. The project used its extensive relationships with other service providers in Montgomery County to ensure that participants had access to the supports and services they needed to be successful, but which the project itself may not have been well situated to deliver directly. CTP staff provided follow-along services to youth as needed for up to two years after they had achieved their transition goals.
Nearly all (99 percent) of the youth who agreed to participate in CTP received some project services and the intensity of the services was generally high. At least 98 percent of the participating youth received each of the following four types of services: employment services, education services, benefits planning services, and case management services. Among all participants, the average number of service contacts was 72 and the average total duration of those contacts was 28 hours over the 15-month reference period of the process analysis. More than one-third of the service hours were focused on employment.
FINAL REPORT ON THE YTD EVALUATION CHAPTER VII: MONTGOMERY COUNTY, MARYLAND
104
The process analysis identified three notable challenges for CTP during the period of its participation in the YTD evaluation. First, because of the substantial staff time required to recruit youth into the evaluation, CTP struggled to find a good balance between recruitment activities and the delivery of services, while simultaneously scaling up to a much larger size. This diversion of project resources may have negatively impacted the quantity and quality of services delivered, primarily by reducing the amount of supervision that the career transition specialists received, as project managers shouldered most of the recruitment responsibilities. Second, turnover among the career transition specialists was high and, given that there were as many as 14 of these positions, this meant that vacancies and staff recruitment were an ongoing reality for the project. This turnover had the potential to weaken the relationships between the career transition specialists and participants, which were an important component of the CTP program model. CTP management anticipated the high turnover and filled vacant positions quickly. Our discussions with participants and staff did not reveal obvious negative ramifications of the turnover; however, it may have subtly constrained the effectiveness of the career transition specialists. The third challenge had to do with the transition from a small project that relied on the guidance of a hands-on project manager and several seasoned front-line staff to ensure consistency in services, to a much larger project that was more reliant on management structures and formal written procedures. The development of those written procedures was staff driven, which was problematic. A management-driven process might have yielded more comprehensive results on a shorter schedule, thus providing the career transition specialists with more timely guidance on the performance of their duties.
The process analysis also revealed a number of other service providers in Montgomery County that were serving youth with disabilities. Most notably, Montgomery County Public Schools provided a transition support teacher to every public high school in the county. Furthermore, during the evaluation, the school district added five new staff members who served as vocational rehabilitation counselors for students with disabilities. Both of these categories of school staff tended to focus their efforts on students who did not have access to CTP. Notably, this included students in the evaluation’s control group. Additionally, the Maryland Division of Rehabilitation Services had dedicated youth counselors and young adults accounted for a third of the agency’s cases and successful job placements. Although no other agency or program in Montgomery County provided youth with severe emotional disturbances with the same range of services as CTP, a resource-rich environment meant that there were many available service options for control group youth as well as for treatment group youth.
D. Review of impacts one year after enrollment
The YTD evaluation’s interim report on CTP (Fraker et al. 2012c) presented the project’s impacts on outcomes in five domains based on data collected 12 months after youth enrolled in the evaluation and were randomly assigned to treatment and control groups: employment-promoting services, paid employment, educational progress, youth income, and attitudes and expectations. Within each domain, we analyzed one primary outcome and a number of supplementary outcomes.
Consistent with the YTD conceptual framework, CTP increased the use of employment-promoting services by youth with disabilities. Three-quarters of treatment group youth reported having used any employment-promoting service in the year following their enrollment in the

FINAL REPORT ON THE YTD EVALUATION CHAPTER VII: MONTGOMERY COUNTY, MARYLAND
105
evaluation, whereas only slightly more than half of control group youth did so (Table VII.2). The impact of CTP was a statistically significant increase of 22 percentage points in the use of employment-promoting services. This overall impact was a product of impacts on the use of several specific types of employment services. The largest of these were support for resume writing and job search activities (31 percentage points), career counseling (12 percentage points), and benefits counseling (10 percentage points; not shown in the table).
Although CTP led to increased use of employment-promoting services, this did not translate into statistically significant impacts on the primary outcomes in the domains of paid employment, educational progress, youth income, and attitudes and expectations during the year following enrollment (Table VII.2). The impact estimates presented in the next section reveal whether impacts of the project on employment and other youth outcomes emerged by the third year following enrollment.
The primary outcome of interest related to paid employment was whether a youth was ever employed in a paid job during the year following enrollment in the evaluation. We found that 53 percent of treatment group youth worked for pay sometime during the year, but this is not
Table VII.2. Montgomery Co., MD: one-year impacts on service receipt and selected outcome measures (percentages, unless otherwise noted)
-
Treatment mean
Control mean Impact - p-value
Employment-promoting services
Primary outcome: used any employment-promoting service 76.0 54.0 22.0 *** 0.00
Paid employment
Primary outcome: ever employed in paid job 53.4 57.5 -4.2 - 0.29
Supplementary outcome: total earnings ($)a, b 2,591 2,938 -346 - 0.33
Educational progress
Primary outcome: ever enrolled in school or completed high school by the end of the year
91.3 90.1 1.2 - 0.60
Youth income
Primary outcome: total income (earnings and SSA benefits) ($)a, b
4,239 4,625 -386 - 0.31
Attitudes and expectations
Primary outcome: youth agrees that personal goals include working and earning enough to stop receiving Social Security benefits
81.6 83.9 -2.3 - 0.49
Sources: YTD 12-month survey and SSA administrative records. Notes: The table shows regression-adjusted impact estimates. We measured explanatory variables in the regression model
before enrollment in the evaluation using data from the study’s baseline survey and SSA administrative records. The analysis sample includes 344 treatment group youth and 295 control group youth. We calculated statistics for the survey-based outcomes using sample weights to account for interview non-response. Survey item non-response may have resulted in smaller sample sizes for specific outcomes. All dollar amounts shown in the table are in 2008 dollars.
a For these outcomes, item non-response occurred conditionally, depending on the values of other measures in the survey. The rate of missing data is 9.1 percent for both earnings and income. We used a multiple-imputations procedure to assign values when they were missing. b The average includes youth who were not employed during the year following enrollment. */**/*** Impact estimate is significantly different from zero at the .10/.05/.01 level using a two-tailed t-test.
FINAL REPORT ON THE YTD EVALUATION CHAPTER VII: MONTGOMERY COUNTY, MARYLAND
106
significantly different from the 57 percent employment rate that we estimated for control group youth. Similarly, there was no impact on total earnings during the year.
Education services were a central component of the CTP program model and the project delivered them to virtually all participating youth. However, those services did not translate into an impact on the primary outcome in the domain of educational progress, which was whether a youth was ever enrolled in school during the year following enrollment or had successfully completed high school by the time of the 12-month survey.
In the domain of youth income, we found that CTP had no impact on the primary outcome—total youth income from earnings and disability benefits—during the year following enrollment. We also found no impacts on two supplementary outcomes in this domain: whether a youth had received any SSA disability benefits during the year following enrollment and the total amount of benefits received during that year (not shown in the table).
Finally, we found that CTP had no impact on the primary outcome in the domain of attitudes and expectations. Table VII.2 shows that 82 percent of treatment group youth agreed that their personal goals included working and earning enough to stop receiving disability benefits. However, this proportion was essentially the same for the control group.
E. Impacts three years after enrollment
The findings in this section show whether services provided by CTP, combined with SSA’s waivers for YTD, led to longer-term impacts on youth outcomes in five domains. The impact estimates indicate that the project did increase the earnings (but not the paid employment) of youth during the third year following enrollment. It also increased their total income; however, it did not significantly affect their participation in productive activities, contact with the justice system, or self-determination. These findings suggest that positive impacts of CTP on earnings and income materialized in the longer term despite the fact that the project had no significant impacts on these outcomes in the initial post-enrollment year.
This section also presents impact estimates for three pairs of subgroups (six total subgroups) of youth defined by their work experience, age, and school enrollment status when they enrolled in the evaluation. The subgroup analysis focused on the primary outcomes in the five domains. The findings show that, in contrast to the absence of impacts on youth total income and self-determination for the full analytic sample, the project increased total income and reduced self-determination for youth who had paid work experience and youth who were in school when they enrolled in the evaluation. CTP had no statistically significant impacts on any of the other possible combinations of primary outcomes and subgroups.
1. CTP increased earnings but not paid employment CTP had a positive impact on one of the two primary outcomes in the domain of
employment and earnings three years after enrollment in the evaluation. The project did not increase the share of youth with paid employment but it did increase their earnings. Sixty-nine percent of the treatment group youth were ever employed in paid jobs during the third year following enrollment (Table VII.3); the share was 66 percent for the control group, but the

FINAL REPORT ON THE YTD EVALUATION CHAPTER VII: MONTGOMERY COUNTY, MARYLAND
107
Table VII.3. Montgomery Co., MD: three-year impacts on employment and earnings (percentages, unless otherwise noted)
-
Treatment mean
Control mean Impact - p-value
Primary outcomes
Ever employed in a paid job in the past yeara 69.4 65.8 3.6 - 0.35
Total earnings in the past year ($)a, b, c 6,823 5,660 1,162 ** 0.06
Supplementary outcomes
Total hours worked in paid jobs in the past yeara, b, c 750.0 640.5 109.5 * 0.06
Employed in paid job at the time of the 36-month surveya, c 46.5 45.3 1.3 - 0.75
Calendar year employment (based on IRS records)d - - - - -
First calendar year following enrollment 58.0 56.0 2.0 - 0.55
Second calendar year following enrollment 62.8 61.4 1.4 - 0.68
Third calendar year following enrollmente 61.8 66.0 -4.1 - 0.34
Calendar year earnings (based on IRS records) ($)b, d - - - - -
First calendar year following enrollment 2,555 2,534 21 - 0.94
Second calendar year following enrollment 3,386 3,598 -212 - 0.55
Third calendar year following enrollmente 4,534 4,488 47 - 0.93
Sources: YTD 36-month survey and SSA administrative records. Notes: The treatment and control group means and the impact estimates reported in the table are regression adjusted (see
Chapter II, Section A.3). We measured explanatory variables in the regression model before enrollment in the evaluation by using data from the study’s baseline survey and SSA files. “Past year” refers to the year preceding the 36-month survey. All dollar amounts shown in the table are in 2008 dollars.
a Statistics for these measures are based on data for all youth in the analysis sample, which comprises 320 treatment group youth and 275 control group youth who completed the 36-month survey. We calculated the statistics using sample weights to account for interview non-response. Survey item non-response may have resulted in smaller sample sizes for specific outcomes. See Appendix A, Table A3e for sample sizes for all outcomes. b We included youth who were not employed during the reference period in our calculation of the mean values of these measures. c For these outcomes, item non-response occurred conditionally, depending on the values of other measures in the survey. The rate of missing data ranges from 0.5 percent to 24.2 percent. We used a multiple-imputations procedure to assign values when they were missing. See Appendix A, Section D for more information on this procedure. d Statistics for these measures are based on data for all youth in the research sample, less 7 youth who were identified as deceased at the time of the 36-month survey. The adjusted research sample comprises 416 treatment group youth and 382 control group youth. e Administrative data for the third calendar year after youth’s enrollment in the evaluation were not available for 40.1 percent of the youth in the research sample. Consequently, statistics for these measures are based on data for a subset of all youth in the research sample. */**/*** Impact estimate is significantly different from zero at the .10/.05/.01 level using a two-tailed t-test.
difference is not statistically significant.59 Despite the lack of impact on paid employment, the project had a positive impact on earnings, which we calculated from youth reports of their hours worked and wage rates on all paid jobs during the third post-enrollment year. This measure of earnings averaged $6,823 among treatment group youth and $5,660 among control group youth. The difference of $1,162 (a relative increase of 21 percent) is statistically significant at the 10 percent level.
59 We also found that CTP had no statistically significant impact on the share of youth who were employed in
any job, without regard for whether they were being paid (results not shown in the table).

FINAL REPORT ON THE YTD EVALUATION CHAPTER VII: MONTGOMERY COUNTY, MARYLAND
108
The project’s positive impact on earnings is underpinned by its positive impact on the intensity of employment during the third year following enrollment, as measured by the total hours worked in paid jobs during the year. On average, youth in the treatment group were employed for 750 hours, which is 110 hours more than youth in the control group were employed (a relative increase of 17 percent). The impact is statistically significant at the 10 percent level (Table VII.3). Despite the project’s positive impacts on some outcomes in the domain of employment and earnings, we found that it had no impact on the share of youth with paid jobs at the time of the 36-month survey. Forty-seven percent of the treatment youth were employed at the time of the survey, compared with 45 percent of the control youth, but the difference is not statistically significant. Thus, the project had no impact on either the share of youth with paid jobs at any time during the third year following enrollment or the share who were employed for pay when last observed at the end of that year.
Consistent with the survey-based findings, when we analyzed employment based on data from IRS administrative records, we found that CTP had no impacts on this outcome in any of the three calendar years following enrollment. The share of youth in the treatment group with paid jobs increased from 58 percent in the first calendar year after enrollment to 63 percent in the second year and then slightly decreased to 62 percent in the third year (Table VII.3). These shares are not significantly different from the corresponding shares for the control group. However, the IRS data were less supportive of the survey-based finding of a positive impact on earnings. The mean annual earnings of youth in the treatment group increased from $2,555 in the first calendar year after enrollment to $3,386 in the second year and to $4,534 in the third year (Table VII.3). These mean values are $21 higher than the control group mean in the first year, $212 lower than the control group mean in the second year, and $47 higher than the control group mean in the third year, respectively, but the differences are not statistically significant.
Despite the apparent discrepancy between the estimated impacts on earnings based on survey data and IRS records, there is suggestive evidence that the survey-based findings reflect important differences in earnings between treatment and control group members. Among youth who reported paid jobs in the survey, we found that treatment group youth were less likely than control group youth to have had paid employment according to the IRS records, implying that the treatment youth were more likely to have had informal jobs (jobs for which earnings were not reported to the IRS).60, 61 We conclude that the survey-based estimate of CTP’s impact on
60 We found that, among youth who reported paid employment in the survey but had no paid employment in
the IRS records, annual earnings calculated from the survey data were about 65 percent less than for those who had paid employment in the IRS records: the median annual earnings of youth in the former group was $2,466, compared with $7,081 for those in the latter group. The lower earnings are suggestive of employment in informal jobs.
61 There is also suggestive evidence that there might have been some underreporting by employers of earnings paid to Montgomery County evaluation enrollees on formal jobs (through either non-reporting of employees or underreporting of wages paid to employees), which may have played a role in CTP’s lack of impacts on IRS earnings measures. Among youth who had paid jobs during the third post-enrollment year according to the IRS records as well as reports in the survey, we found that the median annual earnings based on the IRS records ($5,730) is about 19 percent lower than the median earnings based on the survey data ($7,081). This suggests that either not all jobs in which youth were employed were reported to the IRS, or the earnings of some of these youth were under reported.

FINAL REPORT ON THE YTD EVALUATION CHAPTER VII: MONTGOMERY COUNTY, MARYLAND
109
earnings captures real differences between treatment and control cases in their earnings from both formal and informal jobs, whereas the estimates based on the IRS data capture only differences in earnings from formal jobs.62, 63
Subgroup findings. The absence in the full analytic sample of statistically significant impact of CTP on the survey-based measure of paid employment during the third year following enrollment in the evaluation was manifested in all six of the subgroups considered: youth with and without work experience, youth younger than 18 and 18 or older, and in-school and out-of-school youth (see Appendix Table A.7e). However, the project’s positive and statistically significant impact for the full analytic sample on the survey-based measure of earnings was concentrated among youth who were in school and youth who had work experience when they enrolled in the evaluation.
2. CTP increased youth income but had no impact on the amount of disability benefits CTP had a positive impact on the primary outcome in the domain of youth income. We
measured this outcome—youth total income in the third year after enrollment in the evaluation—by combining earnings based on youth reports in the survey with disability benefit amounts from SSA administrative records. The first row of Table VII.4 shows that, on average, youth in the treatment group had total income of $8,682 in the third year following enrollment, which was $1,382 more than that of youth in the control group. The difference is statistically significant at the 5 percent level.
The impact of CTP on youth total income is underpinned by the previously discussed positive impact on earnings, combined with a positive, albeit statistically insignificant, impact on SSA disability benefits. Table VII.4 shows that, on average, youth in the treatment group received $1,625 in disability benefits in the third year following enrollment, which was $229 more than the average amount received by control group youth. This difference is not statistically significant, but it does account, in part, for the project’s positive impact on youth total income. Consistent with the absence of a statistically significant impact on the average disability benefit amount, CTP also had no impact on the share of youth who received any disability benefits. Twenty-four percent of treatment group youth and 21 percent of control group youth received any disability benefits during the third post-enrollment year; the difference is not statistically significant.
62 We also found that among youth who were employed for pay according to the IRS records, treatment group
youth were more likely than control group youth to have reported paid employment in the survey (71 percent versus 63 percent). Thus, youth in the treatment group were more likely to recall and report on formal jobs than their control group counterparts. This factor provides additional support for the feasibility of a positive impact on the survey-based measure of earnings even when there is a lack of impact on earnings according to the IRS records.
63 In addition, we investigated whether the estimated impact on the survey-based measure of earnings is suspect due to potential survey non-response bias; we found no evidence to support that possibility. Using data from IRS records, we calculated the average earnings of youth for the full research sample as well as for the analytic sample (the survey respondents). We found that the values of this statistic are not substantively different between the two samples.

FINAL REPORT ON THE YTD EVALUATION CHAPTER VII: MONTGOMERY COUNTY, MARYLAND
110
Table VII.4. Montgomery Co., MD: three-year impacts on youth income (percentages, unless otherwise noted)
- Treatment
mean Control mean Impact - p-value
Primary outcome
Total income from earnings (from survey) and disability benefits (from SSA files) in the past year ($)a, b, c
8,682 7,300 1,382 ** 0.02
Supplementary outcomes
Any disability benefits (from SSA files) in the past yeard 23.8 20.8 3.0 - 0.25
Total amount of disability benefits (from SSA files) in the past year ($)b, d
1,625 1,396 229 - 0.24
Proportion of total income from earningsa, b, c 69.2 66.8 2.5 - 0.51
Current public or private health insurance coveragea 76.9 79.6 -2.7 - 0.45
Receipt of public assistance (TANF, SNAP, housing assistance) in the past montha
23.9 26.1 -2.2 - 0.54
Sources: YTD 36-month survey and SSA administrative records. Notes: The treatment and control group means and the impact estimates reported in the table are regression adjusted (see
Chapter II, Section A.3). We measured explanatory variables in the regression model before enrollment in the evaluation by using data from the study’s baseline survey and SSA files. “Past year” refers to the year preceding the 36-month survey. All dollar amounts shown in the table are in 2008 dollars.
a Statistics for these measures are based on data for all youth in the analysis sample, which comprises 320 treatment group youth and 275 control group youth who completed the 36-month survey. We calculated the statistics using sample weights to account for interview non-response. Survey item non-response may have resulted in smaller sample sizes for specific outcomes. See Appendix A, Table A.3e for sample sizes for all outcomes. b We included youth who had no earnings or received no SSA benefits in our calculation of the mean values of these measures. c For these outcomes, item non-response occurred conditionally in measuring earnings, depending on the values of other measures in the survey. The rate of missing data in the annual earnings measure was 24.2 percent. We used a multiple-imputations procedure to assign earnings when they were missing. See Appendix A, Section D for more information on this procedure. d Statistics for these measures are based on data for all youth in the research sample, less 7 youth who were identified as deceased at the time of the 36-month survey. The adjusted research sample comprises 416 treatment group youth and 382 control group youth. */**/*** Impact estimate is significantly different from zero at the .10/.05/.01 level using a two-tailed t-test.
CTP did not shift the source of youth income away from benefits and toward earnings and it had no impact on either the receipt of public assistance or on health insurance coverage. We estimated that 69 percent of the total annual income of treatment group youth came from earnings, compared with 67 percent for control group youth, but the difference is not statistically significant (Table VII.4). We also estimated the project’s impacts on two indicators of the economic well-being of the youth and their families: a measure of health insurance coverage and a measure of the receipt of public assistance. We found that 77 percent of treatment group youth and 80 percent of control group youth were covered by either public or private health insurance at the time of the 36-month survey; the difference is not statistically significant. We also found that the project had no impact on the receipt of public assistance, despite the fact that the career transition specialists and benefits specialist frequently referred participants to public assistance for which they were thought to have been eligible. Table VII.4 shows that 24 percent of treatment group youth and 26 percent of control group youth lived in households that received SNAP, TANF, or housing assistance in the month preceding the 36-month survey; however, the 2 percentage point difference is not statistically significant.

FINAL REPORT ON THE YTD EVALUATION CHAPTER VII: MONTGOMERY COUNTY, MARYLAND
111
Subgroup findings. The project’s positive and statistically significant impact on youth total income in the third year following enrollment was concentrated in three of the six subgroups considered: youth who had work experience, youth who were in school, and youth who were younger than 18 when they enrolled in the evaluation (see Appendix Table A.7e).
3. CTP had no impact on productive activities CTP had no impact on the primary outcome in the domain of productive activities. This
outcome is a composite measure of a youth’s participation in education, training, and paid or unpaid employment during the third year following enrollment in the evaluation. As shown in Table VII.5, 87 percent of treatment group youth and 89 percent of control group youth participated in at least one productive activity and the difference is not statistically significant.
Analysis of supplementary outcomes in the domain of productive activities revealed that CTP had no impact on participation in education and training programs, completion of high school, or enrollment in a college or technical school. We found that 52 percent of treatment group youth participated in education or training programs during the third year following enrollment in the evaluation, compared with 57 percent of control group youth. We also found that 78 percent of treatment group youth had completed high school as of the 36-month survey, compared with 81 percent of control group youth. Finally, we found that 27 percent of treatment group youth had enrolled at any time in a college or technical school, compared with 31 percent of control group youth. For none of these outcomes are the treatment-control differences statistically significant.
Subgroup findings. The absence in the full analytic sample of a statistically significant impact of CTP on the primary outcome in this domain—participation in any productive activity during the third year following enrollment in the evaluation—was manifested in all six of the subgroups considered (see Appendix Table A.7e).
Table VII.5. Montgomery Co., MD: three-year impacts on productive activities (percentages)
-
Treatment mean
Control mean Impact - p-value
Primary outcome
Participated in paid employment, unpaid employment, education, or training in the past year
87.1 89.0 -1.9 - 0.49
Supplementary outcomes
Participated in education or training program in the past year 52.1 56.7 -4.6 - 0.26
Completed high school (attained high school diploma/GED/ certificate or higher) by the time of the 36-month survey
78.0 80.7 -2.7 - 0.41
Ever enrolled in college or technical school 26.5 31.0 -4.4 - 0.25
Source: YTD 36-month survey. Notes: The treatment and control group means and the impact estimates reported in the table are regression adjusted (see
Chapter II, Section A.3). We measured explanatory variables in the regression model before enrollment in the evaluation by using data from the study’s baseline survey and SSA files. Statistics for these measures are based on data for all youth in the analysis sample, which comprises 320 treatment group youth and 275 control group youth who completed the 36-month survey. We calculated the statistics using sample weights to account for interview non-response. Survey item non-response may have resulted in smaller sample sizes for specific outcomes. See Appendix A, Table A.3e for sample sizes for all outcomes. “Past year” refers to the year preceding the 36-month survey.
*/**/*** Impact estimate is significantly different from zero at the .10/.05/.01 level using a two-tailed t-test.

FINAL REPORT ON THE YTD EVALUATION CHAPTER VII: MONTGOMERY COUNTY, MARYLAND
112
4. CTP had no impact on contact with the justice system CTP had no impact on the primary outcome in the domain of contact with the justice
system: having been arrested or charged with delinquency or a criminal complaint during the third year following enrollment in the evaluation. Five percent of the treatment group youth and 7 percent of the control group youth reported that they had been arrested or charged during the follow-up period (Table VII.6). The difference between the two groups is not statistically significant.
Table VII.6. Montgomery Co., MD: three-year impacts on contact with the justice system (percentages)
-
Treatment mean
Control mean Impact - p-value
Primary outcome
Arrested or charged with delinquency or a criminal complaint in the past yeara
5.2 6.7 -1.5 - 0.46
Supplementary outcomes
Type of most recent charge during the past yearb - - - - 0.75
No arrest or criminal or delinquent charge 95.1 93.9 1.2 - -
Violent crime 0.0 0.5 -0.5 - -
Property crime 0.6 1.5 -0.9 - -
Drug-related crime 1.0 1.6 -0.6 - -
Other crime 1.3 0.8 0.5 - -
Multiple crimes 1.9 1.6 0.4 - -
Currently incarcerated (in jail, prison, or detention home)a, c 1.4 3.5 -2.1 - 0.20
Currently on probation or parole a, c 1.9 6.2 -4.2 ** 0.03
Since random assignment - - - - -
Ever arrested or charged with delinquency or a criminal complaint
13.1 17.9 -4.7 - 0.13
Ever convicted of or pled guilty to a chargea 10.1 16.1 -6.0 * 0.07
Ever incarcerated (in jail, prison, or detention home)a, c 4.0 4.4 -0.5 - 0.80
Ever on probation or parolea 3.7 9.7 -6.0 ** 0.01
Source: YTD 36-month survey. Notes: The treatment and control group means and the impact estimates reported in the table are regression adjusted (see
Chapter II, Section A.3). We measured explanatory variables in the regression model before enrollment in the evaluation by using data from the study’s baseline survey and SSA files. Statistics for these outcomes are based on data for all youth in the analysis sample, which comprises 420 treatment group youth and 320 control group youth who completed the 36-month survey. We calculated the statistics using sample weights to account for interview non-response. “Past year” refers to the year preceding the 36-month survey; “currently” indicates at the time of the 36-month survey.
a Survey item non-response may have resulted in smaller sample sizes for specific outcomes. See Appendix A, Table 3e for sample sizes for all outcomes. For these outcomes, item non-response occurred conditionally, depending on the values of ever being arrested or charged in the survey. The rate of missing data ranges from 7.1 percent to 17.6 percent. We used a multiple-imputations procedure to assign values when they were missing. See Appendix A, Section D for more information on this procedure. b The estimates for this outcome are not regression adjusted, as the regression model did not converge. c We used linear regression models to estimate impacts on these outcomes, as logistic regression models did not converge. */**/*** Impact estimate is significantly different from zero at the .10/.05/.01 level using a two-tailed t-test or a chi-square test.

FINAL REPORT ON THE YTD EVALUATION CHAPTER VII: MONTGOMERY COUNTY, MARYLAND
113
The project had a significant negative (desirable) impact on one of three supplementary outcomes in this domain in the third year following enrollment. Two percent of youth in the treatment group were on probation or parole at the time of the 36-month survey, compared with 6 percent of youth in the control group (Table VII.6). The difference of 4 percentage points is statistically significant at the 5 percent level. However, the project did not affect the type of the most recent charge against youth who had come in contact with the justice system during the third year following enrollment.64 Neither did it affect the share of youth who were incarcerated at the time of the survey. About 1 percent of youth in the treatment were incarcerated at that time, compared with 3.5 percent of youth in the control group. The difference is not statistically significant.
CTP also had desirable negative impacts on two of the four supplementary outcomes in this domain pertaining to the entire time between when youth enrolled in the evaluation and when they completed the 36-month survey. Ten percent of treatment group youth and 16 percent of control group youth reported that they had been convicted or pled guilty to a charge since enrollment; the negative impact of 6 percentage points is statistically significant at the 10 percent level. Additionally, 4 percent of treatment group youth and 10 percent of control group youth had ever been on probation or parole since enrollment; the negative difference of 6 percentage point is statistically significant at the 5 percent level. However, the project had no impacts on two other supplementary outcomes pertaining to the entire time since enrollment: whether youth had been arrested or charged with delinquency or a criminal complaint and whether youth had been incarcerated.
Subgroup findings. In contrast to the finding of no impact for the full analytic sample, CTP had a desirable negative and statistically significant impact on the primary outcome in the domain of contact with the justice system for one of the six subgroups considered. Among youth who had no work experience when they enrolled in the evaluation, the project reduced the share who had been arrested or charged with delinquency or a criminal complaint during the third year following enrollment in the evaluation (see Appendix Table A.7e).
5. CTP had no impact on self-determination CTP sought to promote independence and self-sufficiency among participants through
identification of goals and person-centered planning (Fraker et al. 2012c). Thus, the project was expected to improve outcomes related to youths’ attitudes and beliefs about themselves. Nevertheless, it had no impact on the primary outcome in the domain of self-determination, which is an index of self-determination measured on a four-point scale, as described in Chapter II. The average value of this index for both treatment and control group youth is 3.1 (Table VII.7). Furthermore, the project had no impacts on two of the three subindices of self-determination—the index of internal locus of control and the index of external locus of control. However, it did have a negative impact on the index of autonomy. The average value of this
64 The shares of treatment and control group youth who reported no arrest or charge of delinquency or a
criminal complaint during the third year following enrollment in the evaluation are slightly different from what we would expect based on the corresponding shares for the primary outcome in this domain. This lack of full correspondence is explained by differential rates of item non-response to the underlying survey questions and imputation of conditional missing values for the primary outcome.

FINAL REPORT ON THE YTD EVALUATION CHAPTER VII: MONTGOMERY COUNTY, MARYLAND
114
Table VII.7. Montgomery Co., MD: three-year impacts on self-determination
Treatment mean
Control mean Impact p-value
Primary outcome
Index of self-determinationa (4-point scale) 3.1 3.1 0.0 - 0.26
Supplementary outcomes
Subindices of self-determination (4-point scales) - - - - -
Index of autonomya 2.9 3.0 -0.1 ** 0.03
Index of internal locus of controla 3.4 3.4 0.0 - 0.61
Index of external locus of controla 2.9 3.0 0.0 - 0.83
Future independencea (%) 93.8 94.3 -0.5 - 0.83
Living arrangement (%) - - - - 0.55
Independently, without help 16.7 12.9 3.8 - -
With parents or guardians, without help 53.9 58.9 -5.0 - -
Independently or with parents or guardians, with help 23.5 21.9 1.5 - -
Institutional setting or homeless 5.9 6.2 -0.3 - -
Source: YTD 36-month survey. Notes: The treatment and control group means and the impact estimates reported in the table are regression adjusted (see
Chapter II, Section A.3). We measured explanatory variables in the regression model before random assignment by using data from the study’s baseline survey and SSA files. Statistics for these measures are based on data for all youth in the analysis sample, which comprises 320 treatment group youth and 275 control group youth who completed the 36-month survey. We calculated the statistics using sample weights to account for interview non-response. Survey item non-response may have resulted in smaller sample sizes for specific outcomes. See Appendix A, Table A.3e for sample sizes for all outcomes.
a See Chapter II, Section A.1 for explanations of these measures of various aspects of self-determination. */**/*** Impact estimate is significantly different from zero at the .10/.05/.01 level using a two-tailed t-test or a chi-square test.
index for treatment group youth is 2.9, compared with 3.0 for control group youth. The difference of 0.1 is significant at the 5 percent level. It is not clear why CTP would have decreased youths’ sense of autonomy. Given the absence of impacts on all other outcomes in this domain, this difference may be spurious.
CTP also had no impacts on two additional supplementary outcomes in the domain of self-determination: future independence and living arrangement. The binary measure of future independence indicates whether youth agree with the statement that their “goals include working or continuing to work in a paid job.” Ninety-four percent of both treatment and control group youth agreed with the statement (Table VII.7). The project also had no impact on the living arrangements of youth at the time of the 36-month survey. Focusing first on youth in the treatment group, the table shows that they were most commonly living with their parents or guardians and not receiving professional help with activities of daily living (54 percent). Seventeen percent were living independently (alone, with a spouse or partner, with his or her own child, or with a roommate or friend) and also were not receiving professional help with activities of daily living. In contrast, 24 percent were receiving professional help with activities of daily living while living either independently or with their parents or guardians. Finally, 6 percent of treatment group youth were living in institutional settings or were homeless. The distribution of living arrangements for control group youth is very similar to that for treatment group youth and the difference is not statistically significant.

FINAL REPORT ON THE YTD EVALUATION CHAPTER VII: MONTGOMERY COUNTY, MARYLAND
115
Subgroup findings. In contrast to the results for the full analytic sample, the project had a statistically significant negative (undesirable) impact on the primary outcome in the domain of self-determination in the third year following enrollment for two of the six subgroups considered: youth who had work experience and youth who were in school when they enrolled in the evaluation. The absence in the full analytic sample of a statistically significant impact of CTP on this outcome was manifested in the other four subgroups (see Appendix Table A.7e).
F. Costs of providing services
The cost of the resources used by CTP to deliver services to youth was $8,443 per participant, on average. Based on data that we systematically collected from SLH (the grantee), the project staff, and other sources, we calculated this and other measures of project costs using the methodology outlined in Chapter II (Honeycutt and Murphy 2014b). In this section, we summarize our findings from that analysis, giving particular attention to the total project cost and the costs of project components, in addition to the average cost per participant.
1. The total one-year cost of CTP was $1,031,779 The total one-year cost for CTP to deliver services to 395 participants was $1,031,779.65
This amount represents the cost of all resources used to operate the project in a selected one-year cost accounting period—January 2010 through December 2010—when project start-up and close-out costs were negligible but recruitment and enrollment were still ongoing.66, 67
Direct labor was the project’s largest cost category. Wages, salaries, and fringe benefits accounted for 74 percent of total project costs. Indirect costs accounted for 23 percent of total costs, with general administrative costs (including, for example, the cost of support provided by a human resources department), rent and utilities, and staff travel being the largest cost components in this category. Unbudgeted costs (those that did not entail cash outlays by the project but involved essential resources) accounted for 3 percent of total costs. During the cost accounting period, CTP benefited from the unpaid part-time labor of 12 individuals, of whom 6 were business mentors who assisted with job development and 6 were individuals who were fulfilling professional certification requirements (such as for a social work degree) by performing functions of the career transition specialists. Other direct costs (payments made directly to participants, or to vendors on behalf of participants) were small, accounting for less than 1 percent of total project costs.
65 Of the 422 randomly assigned treatment group members, 374 participated in CTP, as did 26 of the 27 non-
randomly assigned treatment group members. We included the latter in the cost analysis (but not in the impact analysis) because the project provided services to them and incurred costs in doing so. All but 5 of the 400 participants were enrolled in the project at some time during the cost accounting period.
66 Recruitment and enrollment occurred from April 2008 through January 2011. 67 The actual cost of CTP during the cost accounting period was $1,172,085, which was higher than its total
cost of delivering services. Because the recruitment and enrollment responsibilities of CTP in support of the random assignment evaluation were distinctly greater than those of other YTD projects, we have removed the cost associated with that activity from the statistics presented here.

FINAL REPORT ON THE YTD EVALUATION CHAPTER VII: MONTGOMERY COUNTY, MARYLAND
116
2. Project administration and employment services were the largest cost components Direct services accounted for 61 percent of total project costs, whereas project
administration (activities related to the oversight of CTP) accounted for the remaining 39 percent (Table VII.8). Among the four components of direct services, employment services (such as finding work experiences for participants and providing employed participants with job coaching) was the largest, representing 28 percent of all project costs. Empowerment services and general case management (such as engaging youth in the project and addressing their social and health service needs) together accounted for 19 percent of total costs. Education services accounted for 11 percent of project costs. Benefits counseling constituted the smallest direct service component, representing only 4 percent of all project costs.
Table VII.8. Montgomery Co., MD: project costs in the cost accounting period, by program component
Program component Cost in cost
accounting period Percentage of
total cost
Project administration $398,893 39
Direct services - -
Benefits counseling $41,751 4
Education services $110,685 11
Employment services $288,574 28
Empowerment services and case management $191,876 19
Total $1,031,779 100
Sources: St. Luke’s House transaction detail by account report, personal communication with CTP staff, and CTP staff activity reports.
Note: All dollar amounts shown in the table are in 2008 dollars.
3. The average cost per CTP participant was $8,443 The average cost per CTP participant is a measure of the commitment of resources to serve
youth who enrolled in the project. In the one-year cost accounting period, 395 youth were enrolled in the CTP for a total of 3,753 months (Table VII.9). By dividing the total cost of the project in the accounting period by the total number of enrollment months, we calculate an average cost per enrollment month of $275. This is a measure of the project’s unit cost during the cost accounting period. When we apply the unit cost to the average number of months that youth were enrolled in the CTP over the entire life of the project—30.7 months—the result is $8,443, which is our estimate of the average cost per participant over the life of the project.
G. Summary and discussion of findings
This chapter has presented findings that the Career Transition Program in Montgomery County, Maryland, had positive and statistically significant impacts on several outcomes related to employment during the third year after youth enrolled in the YTD evaluation. Although the project had no impact on whether youth were ever employed in paid jobs during that year, it did have positive impacts on the total of hours that they worked for pay and, hence, on their annual earnings and total income (earnings plus disability benefits). CTP had no impacts on the primary outcomes in the other domains considered: participation in productive activities, contact with the

FINAL REPORT ON THE YTD EVALUATION CHAPTER VII: MONTGOMERY COUNTY, MARYLAND
117
Table VII.9. Montgomery Co., MD: average project cost per participant
Number of participants in
cost accounting period
(A)
Total person-months of
enrollment in cost accounting
period (B)
Total project cost in cost accounting
period (C)
Average cost per enrollment month in cost
accounting period (D=C/B)
Average number of months of
enrollment over life of project
(E)
Average cost per participant
over life of project (F=DxE)
395 3,753 $1,031,779 $275 30.7 $8,443
Notes: Dollar values are in 2008 dollars. The number of enrollment months for an individual youth is calculated as the number of months from enrollment in CTP to the last receipt of services. In Column B, this calculation is bounded by the beginning and ending months of the cost accounting period and is shown in aggregate for all participants in the cost accounting period. In Column E, it is unbounded and is shown as an average for all CTP participants. All dollar amounts shown in the table are in 2008 dollars.
justice system, and self-determination. However, it did have significant negative (desirable) impacts on several supplementary outcomes in the domain of contact with the justice system.
In several respects, these three-year impact findings are unexpected in the context of the interim evaluation findings for CTP: although the project increased the receipt of services, it had no impacts on the primary outcomes in the domains of paid employment, educational progress, youth income, and attitudes and expectations during the initial post-enrollment year (Fraker et al. 2012c). The key differences between the two sets of findings are that the project had positive impacts on earnings and total income during the third year following enrollment, whereas it had no significant impacts on these outcomes during the first year. Regarding other primary outcomes, the impact findings are broadly consistent across the two years: the project had no impact on paid employment in either year and it had no impacts on the primary outcomes in any of the other domains considered.
CTP provided youth with a substantial dose of services; participants in the intervention received an average of 28 hours of services of any type, which included 10 hours of services specifically focused on employment (Fraker et al. 2012c). However, those services were no more or less effective than non-CTP services available to youth in the control group at improving employment and most of the other primary evaluation outcomes during the third year after youth enrolled in the evaluation, with the notable exceptions of annual earnings and the related measure of annual total income.
We hypothesize that the absence of impacts on employment by CTP may have been due in part to the fact that the youth who were recruited into the evaluation in Montgomery County did not have consistently large barriers to employment. CTP did not target Social Security disability beneficiaries, as reflected in the fact that less than one-fifth of the evaluation enrollees had received benefits in the year prior to enrollment. Although some of the non-beneficiaries may have been sufficiently disabled to qualify for benefits if their family resources had not exceeded allowable limits, others probably would have been found ineligible due to the insufficient severity of their disabilities. Thus, it may be that the evaluation enrollees in Montgomery County had less severe disabilities on average than their counterparts in the other YTD evaluation sites, where the interventions did target beneficiaries. Furthermore, while recruiting youth into the evaluation, CTP staff stressed that those who did enroll would have a chance to participate in a program that would help them obtain jobs. Given this recruiting pitch, it is likely that youth who

FINAL REPORT ON THE YTD EVALUATION CHAPTER VII: MONTGOMERY COUNTY, MARYLAND
118
already were motivated to work enrolled in the evaluation. Baseline statistics support this explanation, as about three-fifths of the youth in the analytic sample for the three-year impact analysis had worked for pay in the year prior to enrollment. The implication of these points is that many youth in the control group were able and ready to find jobs without assistance specifically from CTP, although they may have received assistance from other sources.68
Our thoughts regarding how CTP had positive impacts on annual hours of work and earnings during the third post-enrollment year, while having no impact on any paid employment, are speculative. We begin by pointing out that these impacts did not necessarily occur only because treatment group youth generally worked and earned more in any given week; it may also be that they retained their jobs longer and/or found new jobs more quickly than did their control group counterparts. So, we need to consider whether the services that CTP provided to participants were such that they would result several years later in more hours worked per week, greater job retention, and/or shorter spells out of work. Findings from the process analysis presented in the interim evaluation report on CTP document that the project emphasized the quality of job matches, participant buy-in to the job search process, and post-employment job coaching (Fraker et al 2012c). Possibly, these features of the project resulted in better employment experiences for youth during the service-delivery period, which allowed them to acquire more human capital, develop better connections with potential future employers, and obtain better references, which paid off several years later in the form of more hours of work and earnings.
We conclude our speculation about the features of CTP that may have contributed to its positive impacts on hours of work and earnings by noting that, given its target population, the project was constrained in the ways that it could make differences in the lives of its participants. Simply helping them to find jobs was not going to make much of a difference because most of them did not need CTP’s help to find jobs. We suspect that on some level the project’s managers and staff were aware of this and thus sought to provide value added in other ways. This may have resulted in services that were subtly crafted to improve the initial employment experience, which paid off later in the form of positive impacts on annual hours of work and earnings.
68 Among the six sites for the YTD evaluation, Montgomery County had the highest rates of youth
employment. As shown in Table VII.3, about two-thirds of both treatment and control group members in the analytic sample for the three-year impact analysis had paid jobs during the third year following enrollment.

119
VIII. WEST VIRGINIA
The West Virginia Youth Works (Youth Works) was well-implemented, increased services received by youth, and increased the employment and income of youth three years after their enrollment in the YTD evaluation. The project provided services to promote employment and foster self-sufficiency among youth who were receiving Social Security disability benefits (including SSI, DI, and CDB). Our interim report showed that the project maintained a high degree of fidelity to its program model and to the YTD conceptual framework and that it had statistically significant impacts on the receipt of services, paid employment, and youth income during the year after enrollment (Fraker et al. 2012a). Our analysis of data collected 36 months after youth enrolled in the evaluation revealed longer-term impacts of the project. We found that it increased youth income, primarily by increasing disability benefit amounts, and participation in productive activities during the third year following enrollment. We also found mixed evidence regarding possible positive impacts on employment in paid jobs during the same period. The project did not have any impacts on contact with the justice system, or self-determination. The project’s average cost per participant was $7,971.
A. Project overview
The Human Resource Development Foundation (HRDF) partnered with the Center for Excellence in Disabilities (CED) at West Virginia University to implement the Youth Works project. HRDF, a private, nonprofit corporation that has provided employment and training services to economically disadvantaged West Virginians since 1967, administered the project and directly delivered most of its services. To strengthen the project, HRDF established a formal partnership with the CED, which was the sole WIPA provider in the state, to deliver the benefits counseling services. The project also worked closely with other organizations that serve youth with disabilities, including the West Virginia Division of Rehabilitation Services, WorkForce West Virginia, Medicaid waiver service providers, and the public school districts.
The service delivery area for Youth Works comprised 19 of West Virginia’s 55 counties. These widely dispersed counties were grouped into two regions, north and south, to facilitate project administration. The five-person management team for Youth Works consisted of the director of education, training, and employment services at HRDF, who served as the project director; a project manager who was responsible for the day-to-day operations of the project; a regional coordinator who was directly responsible for operations in the project’s eight-county southern region; an administrator of the project’s management information system; and the supervisor of benefit counselors at the CED. Between 14 and 16 front-line staff delivered services to Youth Works participants, including 8 customized employment specialists, 4 job developers, and 2 benefits counselors; 2 additional staff were added prior to enrolling the second of two cohorts of youth in the project to help with recruitment and to serve as job coaches.
Youth Works provided youth with services intended to promote their economic self-sufficiency and independence. The project was designed to meet the unique service needs of individual participants and project staff often met with them one on one in their homes, schools, community centers, and workplaces. It provided participants with person-centered planning (such as work-readiness assessments and services), customized employment services (such as career exploration, job development, job coaching, job placement, and post-placement support),

FINAL REPORT ON THE YTD EVALUATION CHAPTER VIII: WEST VIRGINIA
120
and benefits counseling. It also provided participants with case management services, including transportation assistance and referrals to other organizations for services that Youth Works was not well positioned to provide directly.
Youth Works served a sufficient number of youth to support a rigorous evaluation. The target population for the project was youth ages 15 through 25 who were receiving Social Security disability benefits and living in the project’s service delivery area at the time of their enrollment in the study. Using lists of Social Security beneficiaries provided by SSA, Mathematica identified youth who met the project eligibility criteria and recruited 875 of them into the study.69 Sample members were randomly assigned to a treatment group, which was eligible for Youth Works services and the SSA waivers for YTD, or to a control group, which was eligible for neither but could access other services available in their communities. The project staff enrolled 85 percent of the treatment group members in project services in two distinct phases: April 2008 through May 2009 in the northern region and December 2009 through September 2010 in the southern region. Participants were eligible for 18 months of project services, but the project continued to serve some of them past that point. All services ended in fall 2011 and the project formally closed in March 2012.
B. Baseline characteristics of the analytic sample
The analytic sample for the three-year impact analysis of Youth Works consists of the 676 randomly assigned evaluation enrollees who completed the 36-month follow-up survey.70 As shown in Table VIII.1, about three in five of the sample members were male and about four in five were between 18 and 25 years old when they enrolled in the evaluation. The largest racial category among the youth in the analytic sample was white (80 percent), followed by black (9 percent). Only 3 percent of the youth across racial groups reported being Hispanic. Nearly two-thirds of the sample members were not attending school at baseline, whereas a little more than a quarter were attending a regular high school; the remainder were attending a special high school or other type of school (including college). A sizeable minority of the youth (45 percent) had never worked for pay at baseline.
Given that almost all of the youth in the analytic sample were receiving SSI, which is means tested, it is not surprising that most were from low-income families. More than two-thirds of the sample members’ families had incomes of less than $25,000 per year. A little less than half of the sample members were living with two parents, whereas about a third were living with a
69 Of the 875 youth recruited into the evaluation, 852 were randomly assigned––455 to the treatment group and
397 to the control group. The remaining 23 youth had siblings already in the evaluation and were automatically assigned to the same group as their siblings (17 treatment cases and 6 control cases); they were not included in the analysis for the evaluation.
70 There is a larger sample of randomly assigned evaluation enrollees for whom we have data on earnings and benefits from administrative records. This full research sample consists of the 852 youth who enrolled in the evaluation and were randomly assigned to treatment or control status, less 10 youth who had died as of the three-year anniversary of their enrollment, for a total of 842 youth (449 treatment and 393 control cases). These cases also constitute the denominator for the calculation of the response rate to the 36-month survey, which was 80.3 percent. For outcomes based on administrative data, we report impact analysis results for the full research sample, less the deceased youth.
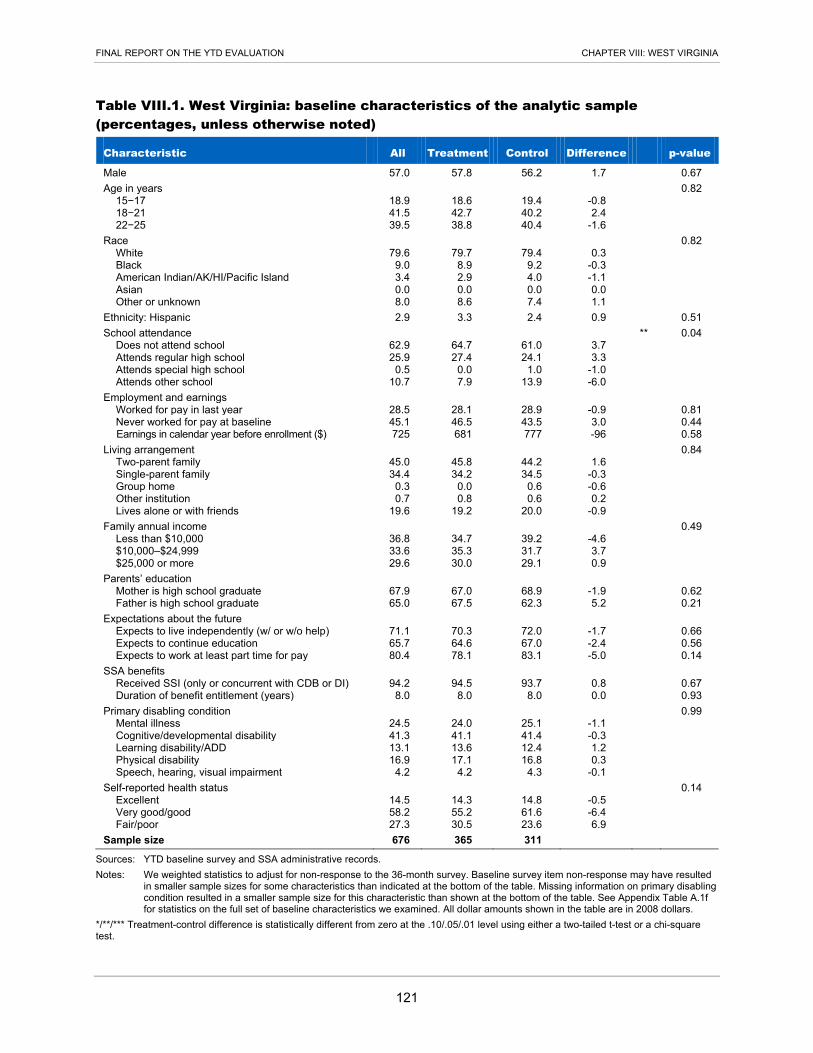
FINAL REPORT ON THE YTD EVALUATION CHAPTER VIII: WEST VIRGINIA
121
Table VIII.1. West Virginia: baseline characteristics of the analytic sample (percentages, unless otherwise noted)
Characteristic All Treatment Control Difference - p-value
Male 57.0 57.8 56.2 1.7 -- 0.67 Age in years - - - - - 0.82
15−17 18.9 18.6 19.4 -0.8 - - 18−21 41.5 42.7 40.2 2.4 - - 22−25 39.5 38.8 40.4 -1.6 - -
Race - - - - - 0.82 White 79.6 79.7 79.4 0.3 - - Black 9.0 8.9 9.2 -0.3 - - American Indian/AK/HI/Pacific Island 3.4 2.9 4.0 -1.1 - - Asian 0.0 0.0 0.0 0.0 - - Other or unknown 8.0 8.6 7.4 1.1 - -
Ethnicity: Hispanic 2.9 3.3 2.4 0.9 - 0.51 School attendance - - - - ** 0.04
Does not attend school 62.9 64.7 61.0 3.7 - - Attends regular high school 25.9 27.4 24.1 3.3 - - Attends special high school 0.5 0.0 1.0 -1.0 - - Attends other school 10.7 7.9 13.9 -6.0 - -
Employment and earnings - - - - - - Worked for pay in last year 28.5 28.1 28.9 -0.9 - 0.81 Never worked for pay at baseline 45.1 46.5 43.5 3.0 - 0.44 Earnings in calendar year before enrollment ($) 725 681 777 -96 - 0.58
Living arrangement - - - - - 0.84 Two-parent family 45.0 45.8 44.2 1.6 - - Single-parent family 34.4 34.2 34.5 -0.3 - - Group home 0.3 0.0 0.6 -0.6 - - Other institution 0.7 0.8 0.6 0.2 - - Lives alone or with friends 19.6 19.2 20.0 -0.9 - -
Family annual income - - - - - 0.49 Less than $10,000 36.8 34.7 39.2 -4.6 - - $10,000–$24,999 33.6 35.3 31.7 3.7 - - $25,000 or more 29.6 30.0 29.1 0.9 - -
Parents’ education - - - - - - Mother is high school graduate 67.9 67.0 68.9 -1.9 - 0.62 Father is high school graduate 65.0 67.5 62.3 5.2 - 0.21
Expectations about the future - - - - - - Expects to live independently (w/ or w/o help) 71.1 70.3 72.0 -1.7 - 0.66 Expects to continue education 65.7 64.6 67.0 -2.4 - 0.56 Expects to work at least part time for pay 80.4 78.1 83.1 -5.0 - 0.14
SSA benefits - - - - - - Received SSI (only or concurrent with CDB or DI) 94.2 94.5 93.7 0.8 - 0.67 Duration of benefit entitlement (years) 8.0 8.0 8.0 0.0 - 0.93
Primary disabling condition - - - - - 0.99 Mental illness 24.5 24.0 25.1 -1.1 - - Cognitive/developmental disability 41.3 41.1 41.4 -0.3 - - Learning disability/ADD 13.1 13.6 12.4 1.2 - - Physical disability 16.9 17.1 16.8 0.3 - - Speech, hearing, visual impairment 4.2 4.2 4.3 -0.1 - -
Self-reported health status - - - - - 0.14 Excellent 14.5 14.3 14.8 -0.5 - - Very good/good 58.2 55.2 61.6 -6.4 - - Fair/poor 27.3 30.5 23.6 6.9 - -
Sample size 676 365 311 - - -
Sources: YTD baseline survey and SSA administrative records. Notes: We weighted statistics to adjust for non-response to the 36-month survey. Baseline survey item non-response may have resulted
in smaller sample sizes for some characteristics than indicated at the bottom of the table. Missing information on primary disabling condition resulted in a smaller sample size for this characteristic than shown at the bottom of the table. See Appendix Table A.1f for statistics on the full set of baseline characteristics we examined. All dollar amounts shown in the table are in 2008 dollars.
*/**/*** Treatment-control difference is statistically different from zero at the .10/.05/.01 level using either a two-tailed t-test or a chi-square test.

FINAL REPORT ON THE YTD EVALUATION CHAPTER VIII: WEST VIRGINIA
122
single parent; the remainder either were living by themselves or had other arrangements. About two-thirds of the youth had a mother who had graduated from high school and a similar fraction had a father who had done so.
Despite having significant mental or physical impairments and mixed current health status, most of the youth in the analytic sample had positive expectations for themselves in the future. The youth’s primary disabling conditions recorded in baseline SSA files can be grouped into five categories, the largest of which is cognitive and developmental disabilities (41 percent). This is followed by mental illness (25 percent); physical disabilities (17 percent); learning disabilities and attention deficit disorder (13 percent); and speech, hearing, and visual impairments (4 percent). On average, the sample members had been receiving disability benefits due to these conditions for eight years. Fifty-eight percent reported being in good or very good health, whereas 15 percent reported excellent health and 27 percent reported fair or poor health. Notwithstanding their disabilities and mixed health status, more than 7 out of 10 youth reported that they expected to live independently in the future (71 percent); about two-thirds expected to continue their education (66 percent) and an even larger share expected to work at least part time for pay (80 percent).
On average, these baseline characteristics are similar for members of the treatment and control groups, as expected, given that they were assigned to these groups at random. We compared 50 baseline characteristics of treatment and control group members in the analytic sample, 19 of which we report in Table VIII.1 (p-values are shown in the table for these characteristics). We did observe some statistically significant differences between the treatment and control groups, not all of which are shown in the table. For example, at baseline, smaller shares of treatment group members were attending a school other than regular or special high school (8 vs. 14 percent); needed reading, hearing, speaking, or walking aids (16 vs. 22 percent); and picked their own clothes to wear (95 vs. 97 percent). However, we found that the two groups were very similar overall and the incidence of statistically significant differences was about what we would expect based on chance alone, assuming that the considered baseline characteristics are independent. For example, of the 50 characteristics we investigated, we would expect 2 or 3 to be significantly different at the 5 percent level or lower and 5 to be significantly different at the 10 percent level or lower. We found statistically significant differences between the treatment and control groups for one characteristic at the 5 percent level and 3 at the 10 percent level. Thus, the treatment and control groups in the analytic sample for the three-year impact analysis of Youth Works can be considered equivalent at baseline.
C. Review of findings from the process analysis
The process analysis of Youth Works, described in detail in the interim report (Fraker et al. 2012a), involved assessing the project’s intervention design, implementation, and intensity of services. To inform this analysis, we used a variety of methods to gather information, including a review of project documents, site visits, interviews with managers and staff, and focus groups with participating youth and their parents. We also analyzed data from the project’s management information system to document the efforts of project staff to enroll treatment group youth in Youth Works and deliver services to them.

FINAL REPORT ON THE YTD EVALUATION CHAPTER VIII: WEST VIRGINIA
123
Youth Works maintained essentially the same service model throughout its implementation, upholding a strong focus on youth’s economic self-sufficiency through paid employment. The original program model was piloted by the project before its selection into the YTD random assignment evaluation. The model specified a structured sequence of services that encompassed goal identification through person-centered planning, work-based experiences, follow-up services, benefits counseling, and case management services. The principal refinement to the model between the pilot phase and full implementation was the expansion from two front-line staff categories—customized employment specialist and benefits counselor—to three categories through the addition of the job developer. This was done in recognition of the centrality of the project’s goal of promoting employment among youth with disabilities.
The project delivered services to most of the treatment group youth. It succeeded in enrolling 388 (85 percent) of the 455 randomly assigned treatment group youth and delivered services to them with a high degree of fidelity to the refined program model. Project services began with the customized employment specialists working with participants to identify their interests, abilities, challenges, and employment goals, and develop a person-centered plan (an individualized plan for achieving self-identified goals). Soon after enrollment in project services, benefits counselors at the CED provided participants and families with information on SSA benefits and waivers. Following the development of the person-centered plan, Youth Works provided assistance with employment preparation, job identification, and job applications. For youth who were not employed, the project provided work experiences, such as job shadowing, occupational training, subsidized on-the-job training, and volunteer work. Job developers at Youth Works networked with employers to identify paid, competitive jobs for participants. Once youth were in such jobs, the project provided follow-up services, including additional benefits counseling, job coaching, and performance evaluations.
All of the youth who agreed to participate in Youth Works received some project services and the intensity of the services was high. The process analysis revealed that 99 percent of participating youth received both benefits planning and case management services. A similarly large proportion of participants, 96 percent, received employment services from the project. Consistent with the absence of a distinct emphasis on education in the Youth Works design, a smaller proportion of participants, 72 percent, received education services. Among the youth who received any Youth Works services, the average number of service contacts was 46 over the 15-month reference period of the process analysis and the average total duration of those contacts was 34 hours, of which 24 hours were for employment services.
The process analysis also found that the project’s sharp focus on employment was facilitated by two aspects of project implementation. First, Youth Works management and front-line staff systematically monitored services and participant outcomes. With technical assistance from TransCen, they developed two forms: one to capture the efforts of the job developers to reach out to employers to identify or create employment opportunities for project participants and another to report on the job readiness and employment status of the participants. Both of these forms were central to the day-to-day operation of Youth Works, as they helped identify participants who had been engaged in internships and subsidized employment but not in competitive paid employment, which in turn served to focus the attention of job developers and the customized employment specialists on forming relationships with employers and helping these participants obtain competitive paid jobs. Second, case management in Youth Works supported the

FINAL REPORT ON THE YTD EVALUATION CHAPTER VIII: WEST VIRGINIA
124
attainment of the project’s employment goals. The project used a pool of flexible funds to improve access to transportation so that participants could travel to and from their jobs. It also provided participants with referrals for vocational rehabilitation services, mental health services, and other services to promote their work readiness.
D. Review of impacts one year after enrollment
The YTD evaluation’s interim report on Youth Works (Fraker et al. 2012a) presented the project’s impacts on outcomes in five domains based on data collected 12 months after youth enrolled in the evaluation and were randomly assigned to treatment and control groups: employment-promoting services, paid employment, educational progress, youth income, and attitudes and expectations. Within each domain, we analyzed one primary outcome and a number of supplementary outcomes.
Consistent with the YTD program model, Youth Works increased the use of employment-promoting services by youth with disabilities. Slightly less than two-thirds of treatment group youth reported having used any employment-promoting service in the year following their enrollment in the evaluation, whereas only about one-third of control group youth did so (Table VIII.2). The impact of Youth Works was a statistically significant increase of 30 percentage points in the use of employment-promoting services. This overall impact was a product of impacts on the use of several specific types of employment services. The largest of these were support for resume writing and job search activities (31 percentage points) and benefits counseling (24 percentage points; not shown in the table).
The positive impact of Youth Works on the use of employment-promoting services translated into statistically significant positive impacts on the primary outcomes in the domains of paid employment and youth income, but not on the primary outcomes in the other domains of educational progress and attitudes and expectations during the year following enrollment (Table VIII.2). The impact estimates presented in the next section reveal whether the impacts of the project on employment and youth income were sustained and whether impacts on other youth outcomes emerged by the third year following enrollment.
The primary outcome of interest related to paid employment was whether a youth was ever employed in a paid job during the year following enrollment. We found that 43 percent of treatment group youth worked for pay sometime during the year, whereas only 24 percent of control group youth did so. The estimated impact of 19 percentage points is statistically significant. We also estimated the impact on earnings in the year following enrollment, a supplementary outcome of considerable policy interest in this domain. We found that Youth Works increased earnings by about 50 percent; treatment group youth earned an average of $1,559, whereas control group youth earned just $1,035.
Youth Works provided education services to youth who had education goals or expressed a need for such services. For this reason, we estimated the impacts of the intervention on outcomes in the domain of educational progress. Our primary outcome in this domain was whether a youth was ever enrolled in school during the year following enrollment or had successfully completed high school by the time of the 12-month follow-up survey. We found that 82 percent of treatment group youth and 79 percent of control group youth achieved this outcome, but the difference between these two percentages is not statistically significant.

FINAL REPORT ON THE YTD EVALUATION CHAPTER VIII: WEST VIRGINIA
125
Table VIII.2. West Virginia: one-year impacts on service receipt and selected outcome measures (percentages, unless otherwise noted)
-
Treatment mean
Control mean Impact - p-value
Employment-promoting services
Primary outcome: used any employment-promoting service 63.6 33.8 29.8 *** 0.00
Paid employment
Primary outcome: ever employed in paid job 42.7 23.6 19.1 *** 0.00
Supplementary outcome: total earnings ($)a, b 1,559 1,035 524 *** 0.01
Educational progress
Primary outcome: ever enrolled in school or completed high school by the end of the year
82.4 78.6 3.7 - 0.19
Youth income
Primary outcome: total income (earnings and SSA benefits) ($)a, b
8,060 7,343 717 *** 0.00
Attitudes and expectations
Primary outcome: youth agrees that personal goals include working and earning enough to stop receiving Social Security benefits
66.0 67.0 -1.1 - 0.78
Sources: YTD 12-month survey and SSA administrative records. Notes: The table shows regression-adjusted impact estimates. We measured explanatory variables in the regression model
before enrollment using data from the study’s baseline survey and SSA administrative records. The analysis sample includes 389 treatment group youth and 344 control group youth. We calculated statistics for the survey-based outcomes using sample weights to account for interview non-response. Survey item non-response may have resulted in smaller sample sizes for specific outcomes. All dollar amounts shown in the table are in 2008 dollars.
a For these outcomes, item non-response occurred conditionally, depending on the values of other measures in the survey. The rate of missing data is 6.7 percent for both earnings and income. We used a multiple-imputations procedure to assign values when they were missing. b The average includes youth who were not employed during the year following enrollment. */**/*** Impact estimate is significantly different from zero at the .10/.05/.01 level using a two-tailed t-test.
In the domain of youth income, we found that Youth Works had a positive impact on the primary outcome—total youth income from earnings and disability benefits—during the year following enrollment. The impact of $717 per year is statistically significant and represents an increase of 10 percent over the income of the control group youth. We have noted that the project had a positive impact on earnings. It also had a statistically significant positive impact on the total amount of disability benefits received by youth during the year following enrollment (not shown in the table). The positive impact on benefits may be related, in part, to the fact that Youth Works significantly improved youths’ knowledge of SSA work incentives and requirements (results not shown).
Finally, we found that Youth Works had no impact on the primary outcome in the domain of attitudes and expectations. Table VIII.2 shows that about two-thirds of treatment group youth agreed that their personal goals included working and earning enough to stop receiving disability benefits. However, this proportion was essentially the same for the control group.

FINAL REPORT ON THE YTD EVALUATION CHAPTER VIII: WEST VIRGINIA
126
E. Impacts three years after enrollment
The findings in this section show whether the services provided by Youth Works, combined with SSA’s waivers for YTD, led to longer-term impacts on youth outcomes in five domains. The impact estimates provide suggestive evidence that the project did increase the paid employment (but not the earnings) of youth during the third year following enrollment. It also increased their total income (through its impact on benefits) and participation in productive activities; however, it did not significantly affect youth contact with the justice system or self-determination. These findings suggest that the positive impacts of Youth Works on paid employment and income during the initial post-enrollment year persisted in the longer term.
This section also presents impact estimates for three pairs of subgroups (six total subgroups) of youth defined by their work experience, age, and school enrollment status when they enrolled in the evaluation. The subgroup analysis focused on the primary outcomes in the five domains. The findings show that the positive impacts of Youth Works on paid employment and participation in productive activities for the full analytic sample were concentrated in three of the subgroups: youth who had no work experience, youth who were 18 or older, and youth who were out of school. For all of the subgroups, the impacts (or lack thereof) on earnings, youth total income, contact with the justice system, and self-determination were similar to those for the full analytic sample.
1. There is suggestive evidence that Youth Works increased paid employment, but it had no impact on earnings Youth Works had no impacts on the two primary outcomes in the domain of employment
and earnings three years after enrollment in the evaluation. Thirty-six percent of the treatment group youth were ever employed in paid jobs during the third year following enrollment, compared with 30 percent of the youth in the control group (Table VIII.3). The difference of 5.7 percentage points falls just short of being statistically significant at the 10 percent level.71 The project also had no impact on earnings, which we calculated from youth reports of their hours worked and wage rates on all paid jobs during the third post-enrollment year. This measure of earnings averaged $1,971 among treatment group youth and $1,730 among control group youth. The difference is not statistically significant.
Youth Works also had no impact on the intensity of employment during the third year following enrollment or employment at the end of the year. Our measure of the intensity of employment is the total hours worked in paid jobs during the year. On average, youth in the treatment group were employed for 270 hours, which is 29 hours more than youth in the control group were employed, but the impact is not statistically significant (Table VIII.3). Furthermore, we found that the project had no impact on the share of youth with paid jobs at the time of the 36-month survey. Twenty-three percent of the treatment youth were employed at the time of the survey, compared with 19 percent of the control youth, but the difference of 4 percentage points is not statistically significant. Thus, the project had no impact on either the share of youth with
71 However, we found that Youth Works had a statistically significant positive impact of 6.1 percentage points
on the share of youth who were employed in any job, without regard for whether they were being paid (results not shown in the table).
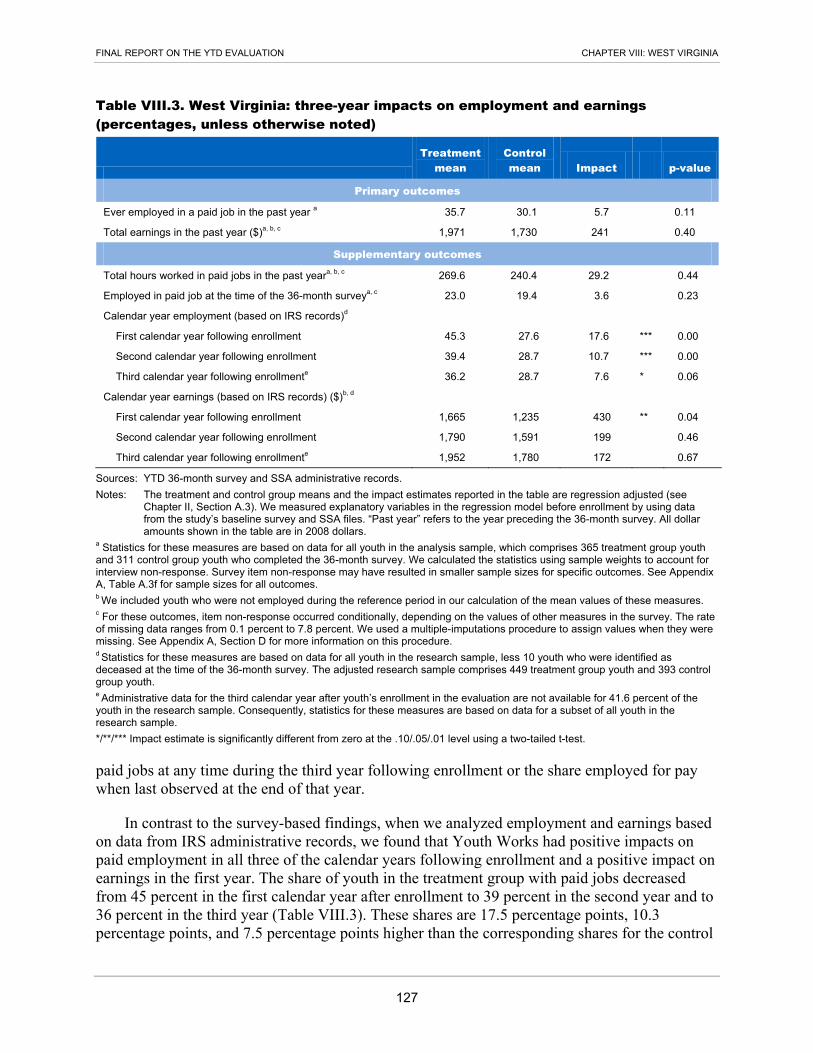
FINAL REPORT ON THE YTD EVALUATION CHAPTER VIII: WEST VIRGINIA
127
Table VIII.3. West Virginia: three-year impacts on employment and earnings (percentages, unless otherwise noted)
-
Treatment mean
Control mean Impact - p-value
Primary outcomes
Ever employed in a paid job in the past year a 35.7 30.1 5.7 - 0.11
Total earnings in the past year ($)a, b, c 1,971 1,730 241 - 0.40
Supplementary outcomes
Total hours worked in paid jobs in the past yeara, b, c 269.6 240.4 29.2 - 0.44
Employed in paid job at the time of the 36-month surveya, c 23.0 19.4 3.6 - 0.23
Calendar year employment (based on IRS records)d - - - - -
First calendar year following enrollment 45.3 27.6 17.6 *** 0.00
Second calendar year following enrollment 39.4 28.7 10.7 *** 0.00
Third calendar year following enrollmente 36.2 28.7 7.6 * 0.06
Calendar year earnings (based on IRS records) ($)b, d - - - - -
First calendar year following enrollment 1,665 1,235 430 ** 0.04
Second calendar year following enrollment 1,790 1,591 199 - 0.46
Third calendar year following enrollmente 1,952 1,780 172 - 0.67
Sources: YTD 36-month survey and SSA administrative records. Notes: The treatment and control group means and the impact estimates reported in the table are regression adjusted (see
Chapter II, Section A.3). We measured explanatory variables in the regression model before enrollment by using data from the study’s baseline survey and SSA files. “Past year” refers to the year preceding the 36-month survey. All dollar amounts shown in the table are in 2008 dollars.
a Statistics for these measures are based on data for all youth in the analysis sample, which comprises 365 treatment group youth and 311 control group youth who completed the 36-month survey. We calculated the statistics using sample weights to account for interview non-response. Survey item non-response may have resulted in smaller sample sizes for specific outcomes. See Appendix A, Table A.3f for sample sizes for all outcomes. b We included youth who were not employed during the reference period in our calculation of the mean values of these measures. c For these outcomes, item non-response occurred conditionally, depending on the values of other measures in the survey. The rate of missing data ranges from 0.1 percent to 7.8 percent. We used a multiple-imputations procedure to assign values when they were missing. See Appendix A, Section D for more information on this procedure. d Statistics for these measures are based on data for all youth in the research sample, less 10 youth who were identified as deceased at the time of the 36-month survey. The adjusted research sample comprises 449 treatment group youth and 393 control group youth. e Administrative data for the third calendar year after youth’s enrollment in the evaluation are not available for 41.6 percent of the youth in the research sample. Consequently, statistics for these measures are based on data for a subset of all youth in the research sample. */**/*** Impact estimate is significantly different from zero at the .10/.05/.01 level using a two-tailed t-test.
paid jobs at any time during the third year following enrollment or the share employed for pay when last observed at the end of that year.
In contrast to the survey-based findings, when we analyzed employment and earnings based on data from IRS administrative records, we found that Youth Works had positive impacts on paid employment in all three of the calendar years following enrollment and a positive impact on earnings in the first year. The share of youth in the treatment group with paid jobs decreased from 45 percent in the first calendar year after enrollment to 39 percent in the second year and to 36 percent in the third year (Table VIII.3). These shares are 17.5 percentage points, 10.3 percentage points, and 7.5 percentage points higher than the corresponding shares for the control

FINAL REPORT ON THE YTD EVALUATION CHAPTER VIII: WEST VIRGINIA
128
group and the differences are statistically significant at least at the 10 percent level. The mean earnings of youth in the treatment group increased from $1,665 in the first calendar year after enrollment to $1,790 in the second year and to $1,952 in the third year. These mean values are $430, $199, and $172 higher than the control group means in the three respective years, but only the difference in the first year is statistically significant (at the 5 percent level).
Subgroup findings. Although the impact of Youth Works on the survey-based measure of paid employment during the third year following enrollment in the evaluation falls just short of being statistically significant for the full analytic sample, the project did have a positive and statistically significant impact on this outcome for three of the six subgroups considered. For youth who had no work experience, youth who were 18 or older, and youth who were out of school at enrollment, the project increased paid employment in year three by 9, 7.5, and 8 percentage points, respectively (see Appendix Table A.7f). All three of these impacts are significant at the 10 percent level or lower. In contrast, Youth Works had no statistically significant impact on the survey-based measure of earnings in the third post-enrollment year for any of the six subgroups considered.
Discussion. The preponderance of evidence presented in this section suggests that Youth Works did improve paid employment during the third year following enrollment in the evaluation, at least for certain subgroups of youth and perhaps for the full sample. First, the full-sample impact on the survey-based measure of paid employment is positive and statistically significant at the 11 percent level. Second, the impact on this outcome is positive and statistically significant for three subgroups of youth, most notably for youth who had no work experience when they enrolled in the evaluation. Third, the full-sample impact on the IRS-based measure of paid employment during the third calendar year following enrollment is positive and statistically significant. Considering all of this evidence, we conclude that Youth Works increased paid employment during the third post-enrollment year.
2. Youth Works increased youth income and the amount of disability benefits Youth Works had a positive impact on the primary outcome in the domain of youth income.
We measured this outcome—youth total income in the third year after enrollment in the evaluation—by combining earnings based on youth reports in the survey with disability benefit amounts from SSA administrative records. The first row of Table VIII.4 shows that, on average, youth in the treatment group had total income of $8,405 in the third year following enrollment, which was $1,010 more than that of youth in the control group (a relative increase of 14 percent). This impact estimate is statistically significant at the 1 percent level.
The positive impact of Youth Works on youth total income is underpinned by increases in both SSA disability benefits and annual earnings. Table VIII.4 shows that 89 percent of treatment group youth and 81 percent of control group youth received any disability benefits during the third post-enrollment year; the 9 percentage point difference is statistically significant at the 1 percent level. The project also had a positive impact on the amount of disability benefits received during the year. On average, youth in the treatment group received $6,278 in disability benefits in the third year following enrollment, which was $748 more than the average amount received by control group youth. This difference is statistically significant at the 1 percent level. The positive impacts on the receipt and amount of benefits are not surprising. We anticipated that the SSA waivers for YTD would result in increased benefits even during the third year following

FINAL REPORT ON THE YTD EVALUATION CHAPTER VIII: WEST VIRGINIA
129
Table VIII.4. West Virginia: three-year impacts on youth income (percentages, unless otherwise noted)
- Treatment
mean Control mean Impact - p-value
Primary outcome
Total income from earnings (from survey) and disability benefits (from SSA files) in the past year ($)a, b, c
8,405 7,394 1,010 *** 0.00
Supplementary outcomes
Any disability benefits (from SSA files) in the past yeard 88.6 79.9 8.7 *** 0.00
Total amount of disability benefits (from SSA files) in the past year ($)b, d
6,278 5,530 748 *** 0.00
Proportion of total income from earningsa, b, c 16.5 17.3 -0.8 - 0.74
Current public or private health insurance coveragea 90.5 87.6 2.9 - 0.22
Receipt of public assistance (TANF, SNAP, housing assistance) in the past montha
50.2 53.0 -2.8 - 0.44
Sources: YTD 36-month survey and SSA administrative records. Notes: The treatment and control group means and the impact estimates reported in the table are regression adjusted (see
Chapter II, Section A.3). We measured explanatory variables in the regression model before enrollment by using data from the study’s baseline survey and SSA files. “Past year” refers to the year preceding the 36-month survey. All dollar amounts shown in the table are in 2008 dollars.
a Statistics for these measures are based on data for all youth in the analysis sample, which comprises 365 treatment group youth and 311 control group youth who completed the 36-month survey. We calculated the statistics using sample weights to account for interview non-response. Survey item non-response may have resulted in smaller sample sizes for specific outcomes. See Appendix A, Table A.3f for sample sizes for all outcomes. b We included youth who had no earnings or received no SSA benefits in our calculation of the mean values of these measures. c For these outcomes, item non-response occurred conditionally in measuring earnings, depending on the values of other measures in the survey. The rate of missing data in the annual earnings measure was 7.8 percent. We used a multiple-imputations procedure to assign earnings when they were missing. See Appendix A, Section D for more information on this procedure. d Statistics for these measures are based on data for all youth in the research sample, less 10 youth who were identified as deceased at the time of the 36-month survey. The adjusted research sample comprises 449 treatment group youth and 393 control group youth. */**/*** Impact estimate is significantly different from zero at the .10/.05/.01 level using a two-tailed t-test.
enrollment, by allowing youth to keep more of their benefits while earning income through work. Of particular relevance is the Section 301 waiver, which delayed the effectuation of a negative age-18 SSI eligibility redetermination for four years after enrollment. The larger benefits received by treatment youth and their larger earnings (despite not being statistically significant), as documented in Table VIII.3, account for the project’s impact on youth total income.
Youth Works did not shift the source of youth income away from benefits and toward earnings and it had no impact on either the receipt of public assistance or on health insurance coverage. We estimated that 17 percent of the total annual income of both treatment and control group youth came from earnings (Table VIII.4). We also estimated the project’s impacts on two indicators of the economic well-being of the youth and their families: a measure of health insurance coverage and a measure of the receipt of public assistance. We found that 91 percent of treatment group youth were covered by either public or private health insurance at the time of the 36-month survey, compared with 88 percent of youth in the control group; the 3 percentage point difference is not statistically significant. We also found that 50 percent of treatment group youth and 53 percent of control group youth lived in households that received SNAP, TANF, or housing assistance in the month preceding the 36-month survey; however, the 3 percentage point difference is not statistically significant.

FINAL REPORT ON THE YTD EVALUATION CHAPTER VIII: WEST VIRGINIA
130
Subgroup findings. The project’s positive and statistically significant impact on youth total income in the third year after enrollment for the full analytic sample was manifested in five of the six subgroups considered (see Appendix Table A.7f). The only subgroup for which the project did not increase total income was youth who had work experience when they enrolled in the evaluation.
3. Youth Works increased participation in productive activities Youth Works had a positive impact on the primary outcome in the domain of productive
activities. This outcome is a composite measure of a youth’s participation in education, training, and paid or unpaid employment during the third year following enrollment in the evaluation. As shown in Table VIII.5, 54 percent of treatment group youth participated in at least one productive activity, compared with 46 percent of control group youth. The 8 percentage point difference is statistically significant at the 5 percent level.
Analysis of supplementary outcomes in the domain of productive activities revealed that Youth Works’ positive impact on participation in productive activities was driven by its impact on employment as well as by its impact on participation in education or training programs. We have reported earlier that the project had a positive impact of 6 percentage points on any (paid or unpaid) employment. We also found that 27 percent of treatment group youth participated in education or training programs during the third year following enrollment in the evaluation, compared with 22 percent of control group youth; the impact of 5 percentage points is statistically significant at the 10 percent level. Thus, it is not surprising that the impact on the composite measure of productive activities is positive and statistically significant.
We also found that Youth Works had no impact on high school completion by the time of the 36-month survey, but it reduced the share of youth who had ever enrolled in a college or technical school. Sixty-nine percent of treatment group youth and 66 percent of control group youth had completed high school, but the 3 percentage point difference is not statistically
Table VIII.5. West Virginia: three-year impacts on productive activities (percentages)
- Treatment
mean Control mean Impact - p-value
Primary outcome
Participated in paid employment, unpaid employment, education, or training in the past year
53.5 45.9 7.6 ** 0.04
Supplementary outcomes
Participated in education or training program in the past year 27.0 21.9 5.1 * 0.09
Completed high school (attained high school diploma/GED/ certificate or higher) by the time of the 36-month survey
69.3 66.0 3.3 - 0.34
Ever enrolled in college or technical school 10.4 13.9 -3.5 * 0.09
Source: YTD 36-month survey. Notes: The treatment and control group means and the impact estimates reported in the table are regression adjusted (see Chapter II,
Section A.3). We measured explanatory variables in the regression model before enrollment by using data from the study’s baseline survey and SSA files. Statistics for these measures are based on data for all youth in the analysis sample, which comprises 365 treatment group youth and 311 control group youth who completed the 36-month survey. We calculated the statistics using sample weights to account for interview non-response. Survey item non-response may have resulted in smaller sample sizes for specific outcomes. See Appendix A, Table A.3f for sample sizes for all outcomes. “Past year” refers to the year preceding the 36-month survey.
*/**/*** Impact estimate is significantly different from zero at the .10/.05/.01 level using a two-tailed t-test.

FINAL REPORT ON THE YTD EVALUATION CHAPTER VIII: WEST VIRGINIA
131
significant. Ten percent of treatment group youth had enrolled at any time in a college or technical school, compared with 14 percent of control group youth. The difference of 4 percentage points is statistically significant at the 10 percent level.
Subgroup findings. Youth Works’ positive impact on the primary outcome in this domain for the full analytic sample was concentrated in three of the six subgroups considered: youth who were 18 or older, youth who were out of school, and youth who had no work experience when they enrolled in the evaluation. For these youth, the project had a positive and statistically significant impact on participation in any productive activity during the third year following enrollment (see Appendix Table A.7f).
4. Youth Works had no impact on contact with the justice system Youth Works had no impact on the primary outcome in the domain of contact with the
justice system: having been arrested or charged with delinquency or a criminal complaint during the third year following enrollment in the evaluation. Four percent of treatment group youth reported that they had been arrested or charged during the follow-up period, compared with 5 percent of control group youth (Table VIII.6). The difference is not statistically significant.
The project had no impacts on three supplementary outcomes in this domain in the third year following enrollment. It did not affect the type of most recent charge against youth who had come in contact with the justice system during that year (Table VIII.6).72 Neither did it affect the shares of youth who were incarcerated or were on probation or parole at the time of the 36-month survey. Over 1 percent of youth in the treatment group were incarcerated at the time of the survey, compared with 2 percent of youth in the control group. The difference of about 1 percentage point is not statistically significant. Less than 1 percent of both treatment and control group youth were on probation or parole at the time of the 36-month survey.
Youth Works also had no impacts on four supplementary outcomes in this domain pertaining to the entire time between when youth enrolled in the evaluation and when they completed the 36-month survey. The first of these outcomes is whether the youth had ever been arrested or charged with delinquency or a criminal complaint following enrollment. Over 5 percent of treatment group youth and 6 percent of control group youth reported that this had happened to them. The difference is not statistically significant. The analysis of whether youth had ever been convicted or pled guilty to a charge (the second outcome) following enrollment yielded similar results, again with no statistically significant impact. Finally, the project had no impacts on whether youth had ever been incarcerated (the third outcome) or had ever been on probation or parole (the fourth outcome) since enrollment.
Subgroup findings. The absence in the full analytic sample of a statistically significant impact of Youth Works on the primary outcome in the domain of contact with the justice system was manifested in all six of the subgroups considered (see Appendix Table A.7f).
72 The shares of treatment and control group youth who reported no arrest or charge of delinquency or a
criminal complaint during the third year following enrollment in the evaluation are slightly different from what we would expect based on the corresponding shares for the primary outcome in this domain. This lack of full correspondence is explained by differential rates of item non-response to the underlying survey questions and imputation of conditional missing values for the primary outcome.

FINAL REPORT ON THE YTD EVALUATION CHAPTER VIII: WEST VIRGINIA
132
Table VIII.6. West Virginia: three-year impacts on contact with the justice system (percentages)
-
Treatment mean
Control mean Impact - p-value
Primary outcome
Arrested or charged with delinquency or a criminal complaint in the past yeara
3.9 4.7 -0.8 - 0.66
Supplementary outcomes
Type of most recent charge during the past yearb - - - - 0.26
No arrest or criminal or delinquent charge 96.8 96.0 0.8 - -
Violent crime 0.6 0.0 0.6 - -
Property crime 0.4 0.3 0.1 - -
Drug-related crime 0.0 0.0 0.0 - -
Other crime 0.6 2.5 -2.0 - -
Multiple crimes 1.6 1.1 0.5 - -
Currently incarcerated (in jail, prison, or detention home)a, c 1.4 2.2 -0.8 - 0.54
Currently on probation or parole a, c 0.7 0.3 0.4 - 0.40
Since random assignment - - - - -
Ever arrested or charged with delinquency or a criminal complaint
5.4 5.7 -0.3 - 0.88
Ever convicted of or pled guilty to a chargea, c 5.4 4.7 0.6 - 0.74
Ever incarcerated (in jail, prison, or detention home)a, c 1.6 2.7 -1.1 - 0.40
Ever on probation or parolea, c 1.4 0.6 0.8 - 0.29
Source: YTD 36-month survey. Notes: The treatment and control group means and the impact estimates reported in the table are regression adjusted (see
Chapter II, Section A.3). We measured explanatory variables in the regression model before enrollment by using data from the study’s baseline survey and SSA files. Statistics for these outcomes are based on data for all youth in the analysis sample, which comprises 365 treatment group youth and 311 control group youth who completed the 36-month survey. We calculated the statistics using sample weights to account for interview non-response. “Past year” refers to the year preceding the 36-month survey; “currently” indicates at the time of the 36-month survey.
a Survey item non-response may have resulted in smaller sample sizes for specific outcomes. See Appendix A, Table A.3f for sample sizes for all outcomes. For these outcomes, item non-response occurred conditionally, depending on the values of ever being arrested or charged in the survey. The rate of missing data ranges from 3.6 percent to 18.9 percent. We used a multiple-imputations procedure to assign values when they were missing. See Appendix A, Section D for more information on this procedure. b The estimates for this outcome are not regression adjusted, as the regression model did not converge. c We used linear regression models to estimate impacts on these outcomes, as logistic regression models did not converge. */**/*** Impact estimate is significantly different from zero at the .10/.05/.01 level using a two-tailed t-test or a chi-square test.
5. Youth Works had no impact on self-determination Youth Works provided few services designed to directly improve the self-determination of
participating youth; however, the program model, with its emphasis on person-centered planning and paid work experience, had the potential to indirectly result in participants becoming more self-determined. Nevertheless, the project had no impact on the primary outcome in the domain of self-determination, which is an index of self-determination measured on a four-point scale, as described in Chapter II. The average value of this index is 2.9 for treatment group youth, compared with 2.8 for the control group youth (Table VIII.7), but the difference is not statistically significant. Furthermore, the project had no impacts on the three subindices of self-

FINAL REPORT ON THE YTD EVALUATION CHAPTER VIII: WEST VIRGINIA
133
determination, measuring youths’ senses of autonomy, internal locus of control, and external locus of control.
Youth Works also had no impacts on two additional supplementary outcomes in the domain of self-determination: future independence and living arrangement. The binary measure of future independence indicates whether youth agree with the statement that their “goals include working or continuing to work in a paid job.” Seventy-nine percent of treatment group youth agreed with the statement, compared with 74 percent of control group youth, but the 5 percentage point difference is not statistically significant (Table VIII.7). The project also had no impact on the living arrangements of youth at the time of the 36-month survey. Focusing first on youth in the treatment group, the table shows that they were most commonly living with their parents or guardians and not receiving professional help with activities of daily living (41 percent). Twenty-six percent were living independently (alone, with a spouse or partner, with his or her own child, or with a roommate or friend) and also were not receiving professional help with activities of daily living. In contrast, 27 percent were receiving professional help with activities of daily living while living either independently or with their parents or guardians. Finally, 5 percent of treatment group youth were living in institutional settings or were homeless. The distribution of living arrangements for control group youth is very similar to that for treatment group youth and the difference is not statistically significant.
Table VIII.7. West Virginia: three-year impacts on self-determination
-
Treatment mean
Control mean Impact - p-value
Primary outcome
Index of self-determinationa (4-point scale) 2.9 2.8 0.0 - 0.48
Supplementary outcomes
Subindices of self-determination (4-point scales) - - - - -
Index of autonomya 2.8 2.8 0.1 - 0.32
Index of internal locus of controla 3.2 3.1 0.1 - 0.17
Index of external locus of controla 2.5 2.6 -0.1 - 0.40
Future independencea (%) 78.9 73.5 5.4 - 0.12
Living arrangement (%) - - - - 0.25
Independently, without help 26.0 28.4 -2.4 - -
With parents or guardians, without help 41.2 44.2 -3.0 - -
Independently or with parents or guardians, with help 27.4 24.9 2.5 - -
Institutional setting or homeless 5.4 2.5 2.9 - -
Source: YTD 36-month survey. Notes: The treatment and control group means and the impact estimates reported in the table are regression adjusted (see
Chapter II, Section A.3). We measured explanatory variables in the regression model before enrollment by using data from the study’s baseline survey and SSA files. Statistics for these measures are based on data for all youth in the analysis sample, which comprises 365 treatment group youth and 311 control group youth who completed the 36-month survey. We calculated the statistics using sample weights to account for interview non-response. Survey item non-response may have resulted in smaller sample sizes for specific outcomes. See Appendix A, Table A.3f for sample sizes for all outcomes.
a See Chapter II, Section A.1 for explanations of these measures of various aspects of self-determination. */**/*** Impact estimate is significantly different from zero at the .10/.05/.01 level using a two-tailed t-test or a chi-square test.

FINAL REPORT ON THE YTD EVALUATION CHAPTER VIII: WEST VIRGINIA
134
Subgroup findings. The absence in the full analytic sample of a statistically significant impact of Youth Works on the primary outcome in the domain of self-determination was manifested in all six of the subgroups considered (see Appendix Table A.7f).
F. Costs of providing services
The cost of the resources used by Youth Works to deliver services was $7,971 per participant, on average. Based on data that we systematically collected from HRDF (the grantee), the project staff, and other sources, we calculated this and other measures of project costs using the methodology outlined in Chapter II (Honeycutt and Murphy 2014e). In this section, we summarize our findings from that analysis, giving particular attention to the total project cost and the costs of project components, in addition to the average cost per participant.
1. The total one-year cost of Youth Works was $986,671 The total one-year cost for Youth Works to deliver services to 250 participants was
$986,671.73 This amount represents the cost of all resources used to operate the project in a selected one-year cost accounting period—October 2010 through September 2011—when project start-up and close-out costs were negligible and enrollment had been completed.74 HRDF (which administered the project and provided most services) accounted for 90 percent of the total cost. Its partner, the CED at West Virginia University (which provided benefits counseling services) accounted for 10 percent of the total cost.
Direct labor was the project’s largest cost category. Wages, salaries, and fringe benefits accounted for 80 percent of total project costs. Indirect costs accounted for 17 percent of total costs, with staff travel and rent and utilities being the two largest cost components in this category. Unlike the other YTD projects, HRDF had minimal general administrative costs, as it accounted for those costs directly. Other direct costs (payments made directly to participants, or to vendors on behalf of participants) were small, accounting for just 3 percent of total project costs. Wage subsidies and training stipends provided to participants accounted for most of these costs. Unbudgeted costs (those that did not entail cash outlays by the project but involved essential resources) were minimal, accounting for less than 1 percent of total costs.
2. Employment services and project administration were the largest cost components Direct services accounted for 62 percent of total project costs, whereas project
administration (activities related to the oversight of Youth Works) accounted for the remaining 38 percent (Table VIII.8). Among the four components of direct services, employment services (such as finding work experiences for participants and providing employed participants with job coaching) was by far the largest, representing 39 percent of all project costs. Empowerment services and general case management (such as referring participants to other programs for
73 Of the 455 randomly assigned treatment group members, 388 participated in Youth Works, as did 16 of the 17 non-randomly assigned treatment group members. We included the latter youth in the cost analysis (but not in the impact analysis) because the project provided services to them and incurred costs in doing so. Because of the project’s two-phase design for enrollment and service delivery, only 250 of the 404 participants were enrolled in the project at some time during the cost accounting period.
74 Enrollment occurred from April 2008 through September 2010.

FINAL REPORT ON THE YTD EVALUATION CHAPTER VIII: WEST VIRGINIA
135
Table VIII.8. West Virginia: project costs in the cost accounting period, by program component
Program component Cost in cost
accounting period Percentage of
total cost
Project administration $374,660 38
Direct services - -
Benefits counseling $90,843 9
Education services $19,449 2
Employment services $384,485 39
Empowerment services and case management $117,233 12
Total $986,671 100
Sources: HRDF accounting worksheet, HRDF-CED memorandum of understanding, personal communication with Youth Works staff, and Youth Works staff activity reports.
Note: All dollar amounts shown in the table are in 2008 dollars.
services not directly related to employment) together accounted for 12 percent of total costs. Benefits counseling (delivered primarily by CED staff) accounted for 9 percent of project costs. Education services constituted the smallest direct service component, representing only 2 percent of all project costs.
3. The average cost per Youth Works participant was $7,971 The average cost per Youth Works participant is a measure of the commitment of resources to
serve youth who enrolled in the project. In the one-year cost accounting period, 250 youth were enrolled in the Youth Works for a total of 2,625 months (Table VIII.9). By dividing the total cost of the project in the accounting period by the total number of enrollment months, we calculate an average cost per enrollment month of $376. This is a measure of the project’s unit cost during the cost accounting period. When we apply the unit cost to the average number of months that youth were enrolled in the Youth Works over the entire life of the project—21.2 months—the result is $7,971, which is our estimate of the average cost per participant over the life of the project.
Table VIII.9. West Virginia: average project cost per participant
Number of participants in
cost accounting period
(A)
Total person-months of
enrollment in cost accounting
period (B)
Total project cost in cost accounting
period (C)
Average cost per enrollment month in cost
accounting period (D=C/B)
Average number of months of
enrollment over life of project
(E)
Average cost per participant
over life of project (F=DxE)
250 2,625 $986,671 $376 21.2 $7,971
Notes: Dollar values are in 2008 dollars. The number of enrollment months for an individual youth is calculated as the number of months from enrollment in Youth Works to the last receipt of services. In Column B, this calculation is bounded by the beginning and ending months of the cost accounting period and is shown in aggregate for all participants in the cost accounting period. In Column E, it is unbounded and is shown as an average for all Youth Works participants. All dollar amounts shown in the table are in 2008 dollars.
FINAL REPORT ON THE YTD EVALUATION CHAPTER VIII: WEST VIRGINIA
136
G. Summary and discussion of findings
This chapter has presented evidence that West Virginia Youth Works had positive and statistically significant impacts on employment, youth total income, and participation in productive activities three years after youth enrolled in the YTD evaluation. However, the project had no impacts during that year on self-determination and contact with the justice system. These findings are broadly consistent with those from the interim report on Youth Works, which found that the project had positive impacts on employment, earnings, and youth total income during the initial post-enrollment year (Fraker et al. 2012a).
Analyses of data from the YTD 36-month survey and from IRS administrative files yielded broadly consistent findings of a positive impact of Youth Wins on employment. According to the survey data, the share of treatment group youth who were employed for pay during the third post-enrollment year was 6 percentage points larger than the corresponding share of control group youth; however, this difference falls just short of being statistically significant, with a p-value of 0.11. Analysis of IRS earnings data revealed that the treatment-control differential in the employment rate was a statistically significant 8 percentage points in the third calendar year following enrollment. On balance, the findings based on the 36-month survey data and the IRS data are strongly suggestive that Youth Works had a positive impact on employment during the third year following enrollment.
Despite the preponderance of evidence that Youth Works had a positive impact on employment during the third post-enrollment year, the project had no impact on earnings. The survey data show that treatment group youth earned $277 more, on average, than their control group counterparts during the third year following enrollment, whereas the IRS data show a differential in average earnings of $172 during the third calendar year following enrollment. Neither of these differences is statistically significant. However, because treatment group youth received significantly more disability benefits than control group youth, their average total income in the third post-enrollment year was higher by a statistically significant $1,002.
Youth Works delivered a substantial dose of services to youth in West Virginia. On average, participants in the intervention received 34 hours of project services of all types, of which 70 percent were designed to directly improve their employment outcomes (Fraker et al. 2012a). TransCen trained Youth Works staff on job development and the placement of participating youth in both subsidized jobs and paid competitive jobs. TransCen also developed empirical tools that project managers and staff used to monitor staff efforts and to track the progression of youth through project activities. A key function of these tools was to identify participants with protracted spells in internships and subsidized employment so that staff could focus on helping them to achieve competitive paid employment.
In summary, Youth Works leveraged available technical assistance to implement an intervention with a strong focus on helping participants find paid jobs. This, along with SSA’s waivers for YTD, yielded dividends in positive impacts on youth employment, participation in productive activities, and total income during the third year after youth enrolled in the evaluation. However, the absence of an impact on earnings during that year is notable.

137
IX. SUMMARY AND CONCLUSIONS
SSA’s broad objective for the YTD projects was to improve the self-sufficiency of transition-age youth with disabilities who were receiving (or were at risk of receiving) disability benefits through the SSI or DI programs, with a long-range goal of reducing their dependency on those benefits. The design and delivery of project services was guided by a conceptual framework that emphasized employment-focused services—services to help youth quickly obtain paid jobs. Informed by compilations of best practices in serving youth with disabilities (NASET 2005; NCWD/Y 2005), the conceptual framework also included service components such as family supports and linkages to other service providers. It also specified outcome measures for youth, most notably paid employment, but also measures such as self-determination and contact with the justice system. Paid employment captures a key dimension of self-sufficiency and also may signal the potential for future reductions in disability benefits. SSA hopes that such reductions ultimately will more than offset the costs of operating interventions for youth, such as those implemented under YTD.
This chapter begins with a description of the phased selection of projects into the YTD evaluation, as several of the key research findings are related to the timing the projects’ entry into the evaluation. It continues with summaries of the findings from the evaluation’s process analysis, three-year impact analysis, and cost analysis. It then provides a discussion of key aspects of those findings, followed by an assessment of the evaluation’s limitations. The chapter concludes by identifying implications of the evaluation findings for policy and practice and lessons for future evaluations.
A. Phased entry of projects into the evaluation
Projects entered the YTD random assignment evaluation in two phases spaced several years apart. This is important because there were systematic differences between the phases in how the projects were implemented and their impacts on youth. The first group of three projects (the Phase 1 projects) entered the evaluation in 2006-7. SSA selected these from among seven projects that it had been funding through cooperative agreements since 2003. The second group of three projects (the Phase 2 projects) entered the evaluation in 2008. SSA selected these from among five pilot projects that it had funded in 2007 through its contract with Mathematica. From their inception, the Phase 2 projects had formal relationships with the Mathematica-led evaluation and technical assistance team, whereas the Phase 1 projects had been operating for several years prior to SSA’s awarding of the YTD evaluation and technical assistance contract to Mathematica in 2005. This affected the projects’ receptiveness to technical assistance; broadly speaking, the Phase 2 projects were more receptive and responsive to technical assistance from the Mathematica-led team than were the Phase 1 projects. Also, the Phase 2 projects benefited from refinements to technical assistance that were made based on the experiences of the Phase 1 projects and the interim evaluation findings for those projects. As documented in detail in the preceding chapters of this report and as summarized in the next section of this chapter, the Phase 2 projects generally had desirable impacts on more outcome measures three years after youth enrolled in the evaluation than did the Phase 1 projects.
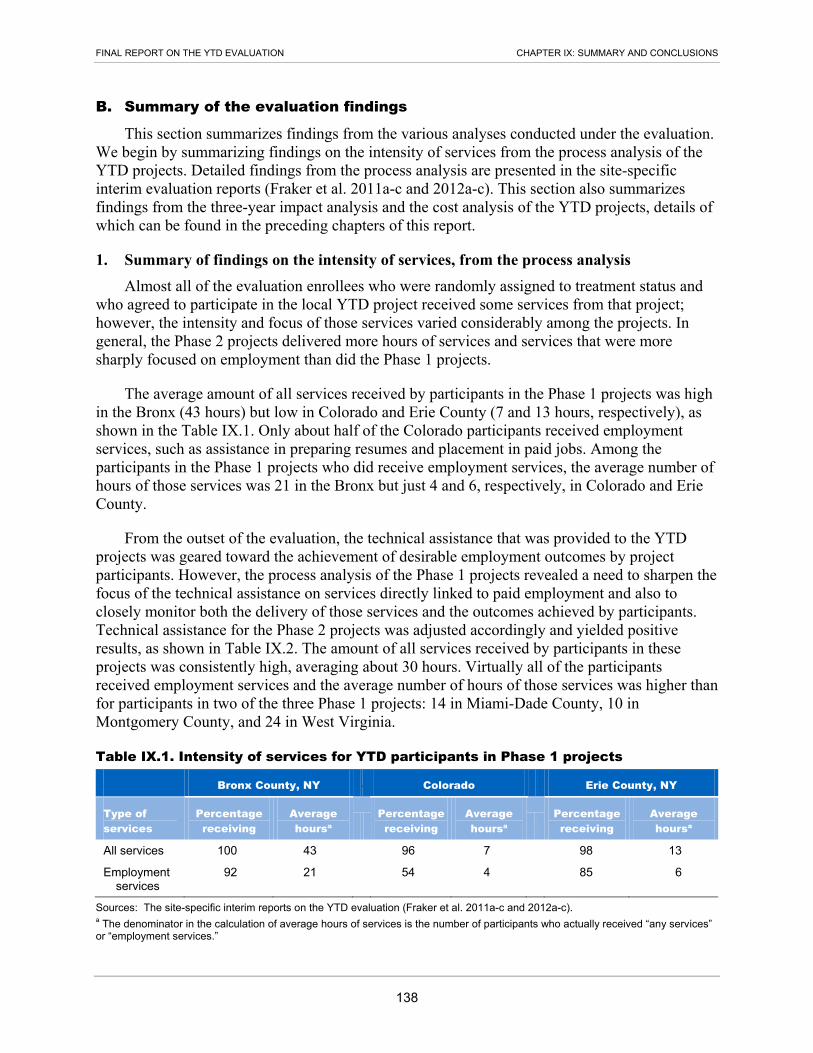
FINAL REPORT ON THE YTD EVALUATION CHAPTER IX: SUMMARY AND CONCLUSIONS
138
B. Summary of the evaluation findings
This section summarizes findings from the various analyses conducted under the evaluation. We begin by summarizing findings on the intensity of services from the process analysis of the YTD projects. Detailed findings from the process analysis are presented in the site-specific interim evaluation reports (Fraker et al. 2011a-c and 2012a-c). This section also summarizes findings from the three-year impact analysis and the cost analysis of the YTD projects, details of which can be found in the preceding chapters of this report.
1. Summary of findings on the intensity of services, from the process analysis Almost all of the evaluation enrollees who were randomly assigned to treatment status and
who agreed to participate in the local YTD project received some services from that project; however, the intensity and focus of those services varied considerably among the projects. In general, the Phase 2 projects delivered more hours of services and services that were more sharply focused on employment than did the Phase 1 projects.
The average amount of all services received by participants in the Phase 1 projects was high in the Bronx (43 hours) but low in Colorado and Erie County (7 and 13 hours, respectively), as shown in the Table IX.1. Only about half of the Colorado participants received employment services, such as assistance in preparing resumes and placement in paid jobs. Among the participants in the Phase 1 projects who did receive employment services, the average number of hours of those services was 21 in the Bronx but just 4 and 6, respectively, in Colorado and Erie County.
From the outset of the evaluation, the technical assistance that was provided to the YTD projects was geared toward the achievement of desirable employment outcomes by project participants. However, the process analysis of the Phase 1 projects revealed a need to sharpen the focus of the technical assistance on services directly linked to paid employment and also to closely monitor both the delivery of those services and the outcomes achieved by participants. Technical assistance for the Phase 2 projects was adjusted accordingly and yielded positive results, as shown in Table IX.2. The amount of all services received by participants in these projects was consistently high, averaging about 30 hours. Virtually all of the participants received employment services and the average number of hours of those services was higher than for participants in two of the three Phase 1 projects: 14 in Miami-Dade County, 10 in Montgomery County, and 24 in West Virginia.
Table IX.1. Intensity of services for YTD participants in Phase 1 projects
- Bronx County, NY - Colorado - Erie County, NY
Type of services
Percentage receiving
Average hoursa -
Percentage receiving
Average hoursa -
Percentage receiving
Average hoursa
All services 100 43 - 96 7 - 98 13
Employment services
92 21 -
54 4 -
85 6
Sources: The site-specific interim reports on the YTD evaluation (Fraker et al. 2011a-c and 2012a-c). a The denominator in the calculation of average hours of services is the number of participants who actually received “any services” or “employment services.”

FINAL REPORT ON THE YTD EVALUATION CHAPTER IX: SUMMARY AND CONCLUSIONS
139
Table IX.2. Intensity of services for YTD participants in Phase 2 projects
- Miami-Dade County, FL - Montgomery County, MD - West Virginia
Type of services
Percentage receiving
Average hours -
Percentage receiving
Average hours -
Percentage receiving
Average hours
All services 100 29 - 99 28 - 100 34
Employment services
99 14 -
99 10 -
96 24
Sources: The site-specific interim reports on the YTD evaluation (Fraker et al. 2011a-c and 2012a-c). a The denominator in the calculation of average hours of services is the number of participants who actually received “any services” or “employment services.”
The refinements to technical assistance for the Phase 2 projects were designed to help them focus more closely on connecting youth with competitive paid jobs and thus better fulfill the goals of YTD. This resulted in three-year impacts on key outcomes for youth that were generally larger than those achieved by the Phase 1 projects, as summarized below.
2. Summary of findings from the year-three impact analysis: Phase 1 projects The Phase 1 projects had few statistically significant year-three impacts on the primary
outcomes in the evaluation’s five domains. The Colorado project had no statistically significant desirable impacts, whereas the projects in the Bronx and Erie County had two each (Table IX.3).
Table IX.3. Qualitative summary of year-three impacts of Phase 1 YTD projects
Primary outcome Bronx County Colorado Erie
County
Domain: paid employment and earnings
Ever employed in a paid job in the past year 0 0 + +
Total earnings in the past year 0 0 0
Domain: youth income
Total income from earnings and disability benefits in the past year
+ + + 0 + + +
Domain: participation in productive activities
Participated in paid employment, unpaid employment, education, or training in the past year
0 0 0
Domain: contact with the justice system
Arrested or charged with delinquency or a criminal complaint in the past year
– – + 0
Domain: self-determination
Index of self-determination 0 0 0
Sources: YTD 36-month survey and SSA administrative records. Notes: Estimates of the quantitative impacts of the phase 2 YTD projects can be found in Chapters III-V of this report. +/+ +/+ + + Statistically significant positive impact at the .10/.05/.01 level using a two-tailed test. –/– –/– – – Statistically significant negative impact at the .10/.05/.01 level using a two-tailed test. 0 Impact is not significantly different from zero.

FINAL REPORT ON THE YTD EVALUATION CHAPTER IX: SUMMARY AND CONCLUSIONS
140
Bronx County. Despite having no impacts on employment or earnings during the third year after youth enrolled in the evaluation, the YTD project in the Bronx had a statistically significant positive impact on the total income received by youth during that year. This impact was a product of the project’s positive impact on disability benefit amounts, which we attribute to SSA’s Section 301 waiver for YTD (which delayed the effectuation of a negative age-18 disability determination), combined with the project’s counseling of youth and parents on benefits, work incentives, and waivers. The Bronx County project also had a statistically significant impact on the primary outcome in the domain of contact with the justice system; it reduced the share of youth who had been arrested or charged with delinquency or a criminal complaint during the third year following enrollment. The design for the YTD evaluation cannot support a determination of which components of the intervention were responsible for this impact; however, we speculate that workshops for parents may have contributed to it by improving their parenting and advocacy skills. The intervention’s positive impact on youth total income may also have been a factor.
Colorado. Given the low intensity of services provided by the Colorado YTD project, it is not surprising that it had no statistically significant desirable impacts on the evaluation’s primary outcomes in the third year after youth enrolled in the evaluation. The project did have a significant undesirable impact on one primary outcome; it increased the share of youth who had been arrested or charged with delinquency or a criminal complaint during the third post-enrollment year. Unfortunately, findings from the process analysis provide no insight into what components of the Colorado project may have been responsible for this impact.
Erie County. The Erie County YTD project had positive and statistically significant impacts on the share of youth who were employed for pay during the third year following enrollment in the evaluation and on their total income. These impacts are surprising because the project provided participants with few hours of services and had no significant impacts on employment and income during the first year following enrollment (Fraker et al. 2011a). Given the small dose of services, we speculate that SSA’s waivers for YTD may have contributed to the year-three impacts.
3. Summary of findings from the year-three impact analysis: Phase 2 projects Consistent with the generally greater intensity of services that they provided to participating
youth, the Phase 2 projects overall had more statistically significant impacts on primary outcomes for youth during the third year after they enrolled in the evaluation than did the Phase 1 projects. The project in Miami-Dade County had significant impacts in desirable directions on five of the evaluation’s six primary outcomes, whereas the projects in West Virginia and Montgomery County had significant and desirable impacts on three and two primary outcomes, respectively (Table IX.4). All of these projects had significant positive impacts on at least one of the two primary outcomes in the domain of paid employment and earnings and on youth total income.
Miami-Dade County. The YTD project in Miami-Dade County had statistically significant impacts in desirable directions on outcomes in all domains of the evaluation except self-determination. It had significant positive impacts on paid employment and earnings during the third year after youth enrolled in the evaluation, which contributed in turn to positive and significant impacts on youth total income and participation in productive activities. Notably, the

FINAL REPORT ON THE YTD EVALUATION CHAPTER IX: SUMMARY AND CONCLUSIONS
141
Table IX.4. Qualitative summary of year-three impacts of Phase 2 YTD projects
Primary outcome Miami-Dade
County Montgomery
County West
Virginia
Domain: paid employment and earnings
Ever employed in a paid job in the past year + + 0 +
Total earnings in the past year + + + 0
Domain: youth income
Total income from earnings and disability benefits in the past year
+ + + + + + + +
Domain: participation in productive activities
Participated in paid employment, unpaid employment, education, or training in the past year
+ + 0 + +
Domain: contact with the justice system
Arrested or charged with delinquency or a criminal complaint in the past year
– – 0 0
Domain: self-determination
Index of self-determination 0 0 0
Sources: YTD 36-month survey and SSA administrative records. Notes: Estimates of the quantitative impacts of the phase 2 YTD projects can be found in Chapters VI-VIII of this report. +/+ +/+ + + Statistically significant positive impact at the .10/.05/.01 level using a two-tailed test. –/– –/– – – Statistically significant negative impact at the .10/.05/.01 level using a two-tailed test. 0 Impact is not significantly different from zero.
project had a significant negative impact on youth contact with the justice system during the third year following enrollment. The intervention did not include services that were explicitly designed to produce this result, which may have been a by-product of greater participation in productive activities by treatment group youth and their higher total income relative to control group members.
Montgomery County. Although the Montgomery County YTD project had no impact on paid employment during the third year following enrollment, it did have positive and statistically significant impacts on earnings and, consequently, youth total income. The impact on earnings was driven by a significant positive impact on the number of hours that youth worked during the year. On the whole, the youth who enrolled in the evaluation in Montgomery County did not need YTD services to find jobs, but those services did help them to work more hours and achieve higher earnings.
West Virginia. The West Virginia YTD project had a statistically significant positive impact on paid employment during the third year following enrollment, which was reflected in a significant positive impact on participation in productive activities. Despite having no impact on earnings during that year, the project did have a significant positive impact on youth total income because it increased the amount of disability benefits that youth received, presumably via SSA’s waivers for YTD.

FINAL REPORT ON THE YTD EVALUATION CHAPTER IX: SUMMARY AND CONCLUSIONS
142
4. Summary of findings from the cost analysis SSA’s contract with Mathematica for the YTD evaluation does not specify a benefit-cost
analysis because it would be premature to conduct one based on estimated impacts on earnings, benefits, and other outcomes just three years after youth enrolled in the evaluation. At that time, many of the enrollees had not yet attained the ages at which young people typically engage in substantial market labor. Furthermore, the youth who had actually participated in the YTD projects still had one more year of eligibility for SSA’s waivers for YTD, which made it unlikely that the projects would have had negative impacts on disability benefit amounts.
SSA plans to use administrative data on benefits (from SSA records) and earnings (from IRS records) to estimate the impacts of the YTD projects in later years, extending as many as 25 years beyond when youth enrolled in the evaluation. SSA will incorporate those estimates in a long-term benefit-cost analysis, which will also require estimates of the average cost per participant of operating the YTD projects, as presented in Chapters III-VIII of this report. This ranged from a low of $5,232 (in 2008 dollars) in Erie County to a high of $8,628 in the Bronx, as shown below:
• Bronx County, NY: average cost per participant = $8,628
• Colorado: average cost per participant = $7,114
• Erie County, NY: average cost per participant = $5,232
• Miami-Dade County, FL: average cost per participant = $6,540
• Montgomery County, MD: average cost per participant = $8,443
• West Virginia: average cost per participant = $7,971
In lieu of a benefit-cost analysis at this time, it is a useful exercise to consider the size of the negative impact on disability benefits that would be necessary to offset the cost of a YTD project. Consider a hypothetical project that, on average, used resources valued at $7,500 per participant to deliver services.75 As shown above, half of the YTD projects had an average cost above this amount and half had an average cost below it. We would like to know the amount by which disability benefits would need to decline as a result of this project to fully offset its cost. Let us assume that the project has a positive impact on benefits of $500 per year for the first four years following enrollment (due to the SSA waivers)76 and then a negative impact of a fixed amount per year for the next 21 years. If we further assume that the discount rate, or time value of money, is 2 percent, then the break-even point would be achieved with a negative impact on
75 If 80 percent of treatment group youth participated in YTD services, then the average cost of this
hypothetical YTD project per treatment group member would be 0.8 x $7,500 = $6,000. 76 We derived the $500 annual impact on benefits by taking the average of the estimated impacts on benefits
for the three calendar years following youth enrollment in the evaluation across all six YTD projects. Because the majority of the youth who participated in services provided by YTD projects were able to take advantage of the YTD waivers for four years, for the purposes of the current exercise we assume that the average positive impact on benefits applies to the first four years following enrollment.

FINAL REPORT ON THE YTD EVALUATION CHAPTER IX: SUMMARY AND CONCLUSIONS
143
benefits equivalent to $503 per year in years 5 through 25.77 As a point of reference, the average annual benefit received by control group members in the third year following enrollment in the evaluation ranged from $4,659 in Miami-Dade County to $6,678 in Erie County. Thus, a benefit reduction of roughly 8 to 11 percent in years 5 through 25 would result in YTD being cost neutral to SSA in this exercise.
C. Discussion of the evaluation findings
Here we note five particularly salient aspects of the evaluation findings:
1. The Phase 2 YTD projects received technical assistance that was sharply focused on helping them to improve employment outcomes for their participants. As a group, these projects were more receptive and responsive to technical assistance than were the Phase 1 projects. Each of the Phase 2 projects had a statistically significant positive impact in the third year following enrollment in the evaluation on at least one of the two primary outcomes in the domain of paid employment and earnings.
2. The projects in Erie County and Montgomery County had statistically significant positive impacts in the domain of paid employment and earnings in the third year following enrollment despite having had no significant impacts in this domain in the initial post-enrollment year. This suggests that project services other than rapid placement into paid jobs (for example, support to finish high school or enroll in college) may have had beneficial effects on employment several years later.
3. Five of the projects had statistically significant positive impacts on youth total income in the third year following enrollment. Those were driven primarily by positive impacts on disability benefits in the Bronx and West Virginia, a positive impact on earnings in Montgomery County, and positive impacts on both benefits and earnings in Erie County and Miami-Dade County.
4. Two of the YTD projects (in the Bronx and Miami-Dade County) that provided relatively intensive services to participants had statistically significant negative (desirable) impacts on youth being arrested or charged with delinquency or a criminal complaint during the third year following enrollment in the evaluation. In contrast, the Colorado project provided few hours of services and had a significant positive (undesirable) impact on this outcome. We do not know what components of these projects generated these impacts, but they do suggest that well-designed and well-implemented interventions may be able to reduce criminal activities among youth with disabilities.
5. Although the YTD conceptual model included improved youth self-determination as a longer-term objective and two of the projects (in the Bronx and Erie County) had service components designed specifically to improve self-determination, none of the projects had a significant impact on an index of self-determination in the third year following enrollment in the evaluation.
77 Using a 2 percent discount rate, the present value of an impact on benefits of $500 per year in years 1 though
4 and -$503 per year in years 5 through 25 is -$6,000, which would fully offset the average cost of the hypothetical YTD project per treatment group member, as derived in the earlier footnote.

FINAL REPORT ON THE YTD EVALUATION CHAPTER IX: SUMMARY AND CONCLUSIONS
144
D. Limitations of the evaluation
The YTD evaluation had a strong random assignment research design, which means that we can confidently interpret statistically significant treatment-control differences in outcome measures as effects of the interventions. Nevertheless, the evaluation did have a number of second-order limitations, as discussed below:
1. In a few instances, the evaluation failed to detect impacts that some might consider to be of policy-relevant size. For example, in the West Virginia site an impact estimate of 5.7 percentage points on the survey-based measure of paid employment in the third post-enrollment year just missed the .10 threshold for statistical significance (p=.11). The evaluation was designed to have 80 percent power to detect impacts on employment of 7 percentage points based on a site’s full research sample and 8 percentage points based on the sample of survey respondents (Rangarajan et al. 2009). For actual impacts smaller than what the study was designed to detect, the evaluation had an elevated risk of generating estimates that were not statistically significant. To minimize the risk of incorrectly concluding that a YTD project had no impact on a primary outcome, we considered the estimated impact on that outcome along with the pattern of evidence for other related outcomes to arrive at a final conclusion.
2. The youth who enrolled in the YTD evaluation were volunteers who were not representative of all YTD-eligible youth in the research sites. More specifically, in the five sites where disability recipients constituted the YTD target population, those who enrolled in the evaluation were not representative of all youth disability recipients. Hence, it would be inadvisable to make inferences about the likely effects of a hypothetical YTD-like intervention that would be mandatory for all youth disability recipients based on the findings from this evaluation. However, current and future interventions for youth disability recipients are more likely to be voluntary, like the ongoing PROMISE initiative, than mandatory. The YTD findings may be instructive regarding the likely effects of such voluntary interventions.
3. Many of the youth who enrolled in the YTD evaluation already possessed some of the key attitudes that the YTD conceptual model was designed to affect. For example, across the research sites, between 80 and 98 percent of the youth who enrolled in the evaluation reported in the baseline survey that they expected to work at least part-time for pay in the future.78 This may have been due in large measure to the voluntary nature of the evaluation, as discussed above. The YTD projects might have had larger impacts on key outcomes if fewer of the enrollees had possessed such attitudes. Nevertheless, four of the six projects did have statistically significant positive three-year impacts on either one or both of the primary outcomes in the domain of paid employment and earnings.
4. The period from August 2006, when the first youth enrolled in the YTD evaluation, to March 2012, when the last YTD project services were delivered, encompassed the Great Recession of December 2007 to June 2009 and the federal fiscal policy response—the American Recovery and Reinvestment Act of 2009 (ARRA). These events may have indirectly influenced the impacts of the YTD projects, but that influence was probably small because
78 This statistic can be found in the first table in each of the site-specific chapters in this report (Chapters III–
VIII).
FINAL REPORT ON THE YTD EVALUATION CHAPTER IX: SUMMARY AND CONCLUSIONS
145
both treatment and control group youth experienced them. There is one way in which ARRA may have directly influenced the YTD impacts on employment. Under ARRA, federal funds were made available to states and localities to provide summer jobs for youth. Both treatment and control group youth could apply for those jobs, but several of the YTD projects (including those in the Bronx, West Virginia, and Miami-Dade County) provided their participants with strong encouragement and assistance to do so. This may have enhanced the positive impacts of those projects on employment in the year after youth enrolled in the evaluation (Fraker et al. 2011b and 2012a&b). ARRA’s direct influence on the three-year impact estimates presented in this report was probably small because the funds for youth summer employment had been exhausted by the time most of the evaluation enrollees had entered their third post-enrollment year.
5. The limited time that could be allocated for administering the evaluation’s follow-up surveys while still achieving high response rates, combined with competing priorities of the evaluation for survey data on a wide range of outcomes, meant that it was not possible to include a full battery of questions from either of the two most commonly used methodologies for measuring the self-determination of youth (Shogren et al. 2008). Instead, data from a very limited set of questions were the basis for the evaluation’s index of self-determination. These questions and the methodology for constructing the index have not been subject to independent validation tests. This limitation of the evaluation’s index of self-determination may have resulted in it being less sensitive to the effects of the interventions and, thus, may have contributed to the consistent finding across the research sites of no impacts on self-determination.
E. Implications for policy and practice
The implications of the YTD evaluation for policy and practice will not be fully known until findings from SSA’s long term benefit-cost analysis become available. At a minimum, that will be several years in the future. In the meantime, we present the following six implications based on the findings presented in this report and the site-specific interim reports (Fraker et al. 2011a-c and 2012a-c):
1. Interventions that provide substantial doses of well-designed services, including employment services, to youth with disabilities can improve key transition outcomes in the short-to-medium term.
2. Most of the YTD projects struggled to develop and maintain a focus on employment in their delivery of services. For several of them, technical assistance provided under the evaluation contract greatly facilitated the delivery of employment services. Funders and operators of future interventions with objectives and target populations similar to those of YTD should consider the utility of giving service providers access to high quality technical assistance on the design and delivery of employment services.
3. This evaluation has provided mixed evidence on whether the YTD impacts in the domain of paid employment and earnings are sustainable. Findings based on IRS records for the three calendar years following enrollment show declining impacts over time in most of the research sites. On the other hand, findings based on data from the evaluation’s follow-up surveys reveal the emergence of statistically significant positive impacts in this domain in Erie County and Montgomery County in the third year following enrollment, whereas there

FINAL REPORT ON THE YTD EVALUATION CHAPTER IX: SUMMARY AND CONCLUSIONS
146
were no significant impacts in those sites in the first year. It is difficult to draw clear implications from these seemingly conflicting findings.
4. The evaluation findings indicate that interventions sharply focused on employment (such as the Miami-Dade County YTD project), as well as interventions with more comprehensive objectives (such as the Bronx County YTD project), can have beneficial impacts in the domain of contact with the justice system by youth with disabilities. Because the costs of criminal activities for various levels of government and society as a whole are high, the savings from reductions in such activities could be substantial. Thus, these impacts have the potential to swing the findings from a comprehensive benefit-cost analysis strongly toward positive net benefits of the YTD projects in these sites. An expansion of the YTD conceptual model to include service components explicitly designed to deter contact with the justice system could possibly result in enhanced impacts in this domain.
5. The evaluation’s findings of statistically significant positive impacts on primary outcomes in the domain of paid employment and earnings in the third year following enrollment in the Erie County and Montgomery County sites are based on youth survey responses that encompass both formal and informal jobs. The evaluation’s findings based on IRS records show no significant impacts on formal employment or earnings in these sites in the third calendar year following enrollment. SSA and other government agencies should be aware that, to the extent that the impacts of YTD or other similar interventions for youth with disabilities are driven by informal employment, the prospects for greater income and payroll tax revenues and reduced disability benefits due to more countable income being reported to SSA will be dampened.
6. This evaluation has produced no evidence that the YTD projects reduced the amount of disability benefits received by enrolled youth. This finding is not surprising because SSA’s waivers for YTD made it very unlikely that the projects would reduce the amount of benefits received by enrollees during the evaluation’s three year follow-up period, even if they did increase their earnings. However, the prospects for negative impacts on benefits in the post-waiver years are uncertain at best.
F. Lessons for future evaluations
We draw seven lessons from the YTD evaluation for future evaluations of interventions for youth with disabilities.
1. Concern about random assignment among youth and their parents was not prevalent and did not constitute a significant barrier to the recruitment of youth into the YTD evaluation. Therefore, the designers of future evaluations of interventions for youth with disabilities should not allow anxieties about random assignment to deter them from specifying a rigorous experimental evaluation design. However, it should be noted that enrollment targets may need to be higher under an experimental design to allow the formation of control groups.
2. SSA’s waivers for YTD were one of the first things that evaluation outreach staff at Mathematica mentioned to prospective enrollees in the evaluation and their parents; likewise for YTD project staff when they first spoke with treatment group youth to engage them in services. The waivers opened doors and generated strong initial interest in the YTD study and the YTD projects, thus facilitating recruitment. SSA should consider the value of waivers
FINAL REPORT ON THE YTD EVALUATION CHAPTER IX: SUMMARY AND CONCLUSIONS
147
as a recruitment tool, in addition to their value in attaining the substantive objectives of an intervention, in future evaluations.
3. In future evaluations of interventions that include waivers, SSA should consider specifying a waiver period that is shorter than the evaluation’s follow-up period. This would allow for an assessment of the intervention’s impact on benefits during the post-waiver segment of the evaluation period.
4. The YTD evaluation team, working in partnership with the YTD projects, used all available tools and resources, and worked very hard to achieve evaluation enrollment rates ranging from 16 to 30 percent of eligible youth (Figure I.1 in Fraker et al. 2011a-c and 2012a-b). Given this experience, enrollment rates in excess of this range are likely to be unobtainable in current and future evaluations with similar target populations and the same extent of resources available.
5. The Phase 1 YTD projects began operating several years before SSA awarded the evaluation contract to Mathematica. Consequently, intenstive programmatic technical assistance under the evaluation contract was not provided to those projects until well after they had begun delivering services, whereas it was provided to the Phase 2 projects from their inception. In general, the latter projects were more receptive and responsive to an intensive and thorough technical assistance approach than were the former projects. This experience underscores the value of bringing a technical assistance contractor for future interventions on board before the service providers begin operating.
6. If SSA were to determine that an impact of 5 percentage points on employment is large enough to be policy relevant, then the sample sizes for the agency’s future evaluations of youth-focused demonstrations should be approximately twice as large as those for the YTD evaluation to ensure the impacts of that size are estimated precisely. (As noted in Section D, above, the YTD evaluation’s samples of approximately 700 survey respondents per site provided 80 percent power to detect an employment impact of 8 percentage points at the .10 level of statistical significance.) Notably, SSA’s ongoing PROMISE evaluation is designed to yield follow-up survey data on approximately 1,600 youth per site, which is expected to be adequate to detect employment impacts of 5 percentage points.
7. As noted in Section D, above, neither of the two most commonly used methodologies for gathering data on the self-determination of youth could be implemented as part of the YTD evaluation. Recent advances in using subsets of questions from the assessments underlying the Arc’s index of self-determination (Seong et al. under development, Shogren et al. 2014 and in press) should make it more feasible to collect the data needed to construct validated sub-indices of key components of self-determination and possibly a comprehensive index of self-determination.

This page has been left blank for double-sided copying.
149
REFERENCES
Berry, Hugh G., Michael Ward, and Leslie Caplan. 2012. “Self-Determination and Access to Postsecondary Education in Transitioning Youths Receiving Supplemental Security Income Benefits.” Career Development and Transition for Exceptional Individuals, vol. 35, no. 2, 2012, pp. 68–75.
Carlin, J.B., J.C. Galati, and P. Royston. “New Framework for Managing and Analyzing Multiply Imputed Data.” Stata Journal, vol. 8, no. 1, 2008, pp. 49–67.
City University of New York, John F. Kennedy, Jr. Institute. “Application for Cooperative Agreement to fund Youth Transition Demonstration Project.” Submitted to Social Security Administration. Announcement No. SSA-OPDR-03-01. 2003.
Davies, Paul, Kalman Rupp, and David Wittenburg. “A Life-Cycle Perspective on the Transition to Adulthood Among Children Receiving Supplementary Security Income Payments.” Journal of Vocational Rehabilitation, vol. 30, 2009, pp. 133–151.
Decker, Paul, and Craig Thornton. “The Long-Term Effects of Transitional Employment Services.” Social Security Bulletin, vol. 58, 1995, pp. 71–81.
Federal Interagency Forum on Child and Family Statistics. “America’s Children: Key National Indicators of Well-Being.” 2014. Available at http://www.childstats.gov/pdf/ac2013/ac_13.pdf. Accessed October 16, 2014.
Federal Interagency Forum on Child and Family Statistics. “America’s Children: Key National Indicators of Well-Being 2001.” 2001. Available at http://www.childstats.gov/pdf/ac2001/front.pdf. Accessed October 16, 2014.
Fraker, Thomas and Arif Mamun. “Analysis Plan and Outline for the Final Report on the Evaluation of the Social Security Administration’s Youth Transition Demonstration Projects.” Report submitted to the Social Security Administration. Washington, DC: Mathematica Policy Research, May 6, 2013.
Fraker, Thomas, Arif Mamun, Michelle Manno, John Martinez, Debbie Reed, Allison Thompkins, and David Wittenburg. “The Social Security Administration’s Youth Transition Demonstration Projects: Interim Report on West Virginia Youth Works.” Report submitted to the Social Security Administration. Washington, DC: Mathematica Policy Research, December 3, 2012a.
Fraker, Thomas, Todd Honeycutt, Arif Mamun, Michelle Manno, John Martinez, Bonnie O’Day, Debbie Reed, and Allison Thompkins. “The Social Security Administration’s Youth Transition Demonstration Projects: Interim Report on Broadened Horizons Brighter Futures.” Report submitted to the Social Security Administration. Washington, DC: Mathematica Policy Research, December 3, 2012b.

FINAL REPORT ON THE YTD EVALUATION REFERENCES
150
Fraker, Thomas, Peter Baird, Arif Mamun, Michelle Manno, John Martinez, Debbie Reed, and Allison Thompkins. “The Social Security Administration’s Youth Transition Demonstration Projects: Interim Report on the Career Transition Program.” Report submitted to the Social Security Administration. Washington, DC: Mathematica Policy Research, December 21, 2012c.
Fraker, Thomas, Alison Black, Arif Mamun, Michelle Manno, John Martinez, Bonnie O’Day, Meghan O’Toole, Anu Rangarajan, and Debbie Reed. “The Social Security Administration’s Youth Transition Demonstration Projects: Interim Report on Transition WORKS.” Report submitted to the Social Security Administration, Office of Program Development and Research. Washington, DC: Mathematica Policy Research, February 22, 2011a.
Fraker, Thomas, Alison Black, Joseph Broadus, Arif Mamun, Michelle Manno, John Martinez, Reanin McRoberts, Anu Rangarajan, and Debbie Reed. “The Social Security Administration’s Youth Transition Demonstration Projects: Interim Report on the City University of New York’s Project.” Report submitted to the Social Security Administration, Office of Program Development and Research. Washington, DC: Mathematica Policy Research, April 5, 2011b.
Fraker, Thomas, Peter Baird, Alison Black, Arif Mamun, Michelle Manno, John Martinez, Anu Rangarajan, and Debbie Reed. “The Social Security Administration’s Youth Transition Demonstration Projects: Interim Report on Colorado Youth WINS.” Report submitted to the Social Security Administration, Office of Program Development and Research. Washington, DC: Mathematica Policy Research, April 7, 2011c.
Freedman, D. “On Regression Adjustments to Experimental Data.” University of California Statistics Department Working Paper. 2006. Available at http://www.stat.berkeley.edu/~census/neyregr.pdf. Accessed October 16, 2014.
Handwerger, Sharon and Craig Thornton. “The Minority Female Single Parent Demonstration: Analysis of Program Operation Costs.” Princeton, NJ: Mathematica Policy Research, 1988.
Honeycutt, Todd and Lauren Murphy. “YTD Cost Analysis for Broadened Horizons, Brighter Futures.” Memorandum submitted to Tom Fraker (YTD 0483). Princeton, NJ: Mathematica Policy Research, May 1, 2014a.
Honeycutt, Todd and Lauren Murphy. “YTD Cost Analysis for the Career Transition Program.” Memorandum submitted to Tom Fraker (YTD 0482). Princeton, NJ: Mathematica Policy Research, May 1, 2014b.
Honeycutt, Todd and Lauren Murphy. “YTD Cost Analysis for City University of New York’s Project.” Memorandum submitted to Tom Fraker (YTD 0480). Princeton, NJ: Mathematica Policy Research, May 1, 2014c.
Honeycutt, Todd and Lauren Murphy. “YTD Cost Analysis for Colorado Youth Wins.” Memorandum submitted to Tom Fraker (YTD 0481). Princeton, NJ: Mathematica Policy Research, May 1, 2014d.
FINAL REPORT ON THE YTD EVALUATION REFERENCES
151
Honeycutt, Todd and Lauren Murphy. “YTD Cost Analysis for West Virginia Youth Works.” Memorandum submitted to Tom Fraker (YTD 0484). Princeton, NJ: Mathematica Policy Research, May 1, 2014e.
Honeycutt, Todd and Lauren Murphy. “YTD Cost Analysis for Transition Works.” Memorandum submitted to Tom Fraker (YTD 0479). Princeton, NJ: Mathematica Policy Research, November 20, 2013.
Human Resources Development Canada. “Youth in Transition Survey: Project Overview.” Applied Research Branch, Strategic Policy, Human Resources Development Canada, Technical Paper T-00-5E, September 2000.
Ivry, Robert and Fred Doolittle. “Improving the Economic and Live Outcomes of At-Risk Youth.” New York: MDRC, 2003. Available at http://mdrc.org/sites/default/files/full_403.pdf. Accessed October 16, 2014.
Jacobs, Erin. “YTD: Creation of Self-Determination Outcomes.” Memorandum submitted to the Social Security Administration (YTD 0473). New York, NY: MDRC, October 4, 2013.
Kosar, Laura, Benjamin Fischer, Dawn Phelps, Svetlana Bronnikov, Patsy Lloyd, Xiao Barry, Joseph Mastrianni, Lesley Hildebrand, Miriam Loewenberg. “Disability Analysis File 2012 (DAF12) Documentation: Data from January 1994 through December 2012. Volume I: How to Use the Disability Analysis File (DAF) and Understand Its Data.” Washington, DC: Mathematica Policy Research, March 2014.
Loprest, Pamela J. and David C. Wittenburg. “Post-Transition Experiences of Former Child SSI Recipients.” Social Service Review, vol. 81, no. 4, 2007, pp. 583–608.
Luecking, R.G. and Wittenburg, D.C. “Providing Supports to Youth with Disabilities Transitioning to Adulthood.” Journal of Vocational Rehabilitation, vol. 30, no. 3, 2009, pp. 223-240.
Mank, D., A. Cioffi, and P. Yovanoff. “Supported Employment Outcomes Across a Decade: Is There Evidence of Improvement in the Quality of Implementation?” Mental Retardation, vol. 41, 2003, pp. 199–197.
Martinez, J., T. Fraker, M. Manno, P. Baird, A. Mamun, B. O’Day, A. Rangarajan, and D. Wittenburg. “The Social Security Administration’s Youth Transition Demonstration Projects: Implementation Lessons from the Original Sites.” Washington, DC: Mathematica Policy Research, 2010.
Martinez, J., M. Manno, P. Baird, T. Fraker, T. Honeycutt, A. Mamun, B. O’Day, and A. Rangarajan. “The Social Security Administration’s Youth Transition Demonstration Projects: Profiles of the Random Assignment Projects.” Princeton, NJ: Mathematica Policy Research, 2008.

FINAL REPORT ON THE YTD EVALUATION REFERENCES
152
National Alliance for Secondary Education and Transition (NASET). “National Standards and Quality Indicators: Transition Toolkit for Systems Improvement.” Minneapolis: University of Minnesota, Institute on Community Integration, 2005. Available at http://www.nasetalliance.org/toolkit/. Accessed October 16, 2014.
National Collaborative on Workforce and Disability for Youth. “Guideposts for Success (1st ed.).” Washington, DC: Institute for Educational Leadership, 2005.
National Collaborative on Workforce and Disability for Youth. “Guideposts for Success (2nd ed.).” Washington, DC: Institute for Educational Leadership, 2009.
Osgood, D.W., E.M. Foster, and M.E. Courtney. “Vulnerable Populations and the Transition to Adulthood.” The Future of Children, vol. 20, no. 1, 2010, pp. 209–229.
Puma, M.J., R.B. Olsen, S.H. Bell, and C. Price. “What to Do When Data Are Missing in Group Randomized Controlled Trials (NCEE 2009-0049).” Washington, DC: National Center for Education Evaluation and Regional Assistance, Institute of Education Sciences, U.S. Department of Education, October 2009.
Rangarajan, A., L. Grossman, J. Martinez, T. Fraker, K. CyBulski, A. Ciemnecki, and G. Livermore. “Data Collection and Survey Plan for the Youth Transition Demonstration Evaluation.” Washington, DC: Mathematica Policy Research, 2007.
Rangarajan, A., T. Fraker, T. Honeycutt, A. Mamun, J. Martinez, B. O’Day, and D. Wittenburg. “SSA’s Youth Transition Demonstration Projects: Evaluation Design Report.” Princeton, NJ: Mathematica Policy Research, 2009.
Royston, P. “Multiple Imputation of Missing Values: Update of ICE.” Stata Journal, vol. 7, no. 4, 2007, pp. 445-464.
Royston, P., J. B. Carlin, and I. R. White. “Multiple Imputation of Missing Values: New Features for MIM”. Stata Journal, vol. 9, no. 2, 2009, pp. 252-264.
Schochet, Peter. “Is Regression Adjustment Supported by the Neyman Model for Causal Inference?” Journal of Statistical Planning and Inference, vol. 140, January 2010, pp. 246-259.
Schochet, Peter. “Technical Methods Report: Guidelines for Multiple Testing in Impact Evaluations (NCEE 2008-4018).” Washington, DC: National Center for Education Evaluation and Regional Assistance, Institute of Education Sciences, U.S. Department of Education, 2008.
Seong, Y., M.L. Wehmeyer, and K.A. Shogren. “Examining Psychometric Properties of the Adolescent Self-Determination Assessment—Short Form.” Lawrence, KS: Kansas University Center on Developmental Disabilities, manuscript under development.

FINAL REPORT ON THE YTD EVALUATION REFERENCES
153
Shogren, K.A., M.L. Wehmeyer, S.B. Plamer, J.H. Soukup, T.D. Little, N. Garner, and M. Lawrence. “Understanding the Construct of Self-Determination: Examining the Relationship Between the Arc’s Self-Determination Scale and the American Institutes for Research Self-Determination Scale.” Assessment for Effective Intervention, vol. 33, March 2008, pp. 94-107.
Shogren, K.A., M.L. Wehmeyer, S.B. Plamer, A. Forber-Pratt, T.D. Little, and S.J. Lopez. “Self-Determination Inventory: Self-Report [Pilot Version].” Lawrence, KS: Kansas University Center on Developmental Disabilities, 2014.
Shogren, K.A., M.L. Wehmeyer, S.B. Plamer, A. Forber-Pratt, T.D. Little, and S.J. Lopez. “Causal Agency Theory: Reconceptualizing a Functional Model of Self-Determination.” Education and Training in Autism and Developmental Disabilities, in press.
Social Security Administration. “Annual Statistical Supplement to the Social Security Bulletin, 2013.” Publication No. 13-11700. Table 7.A1. Washington, DC: Social Security Administration, 2014a. Available at http://ssa.gov/policy/docs/statcomps/supplement/2013. Accessed October 16, 2014.
Social Security Administration. “2014 Red Book.” Publication No. 64-030. Baltimore, MD: Social Security Administration, 2014b. Available at http://www.ssa.gov/redbook/documents/TheRedBook2014.pdf. Accessed October 16, 2014.
Social Security Administration. “SSI Annual Statistical Report, 2012.” Publication No. 13-11827. Tables 4 and 35. Washington, DC: Social Security Administration, 2013. Available at http://ssa.gov/policy/docs/statcomps/ssi_asr/2012. Accessed October 16, 2014.
Wehman, P. Life Beyond the Classroom: Transition Strategies for Young People with Disabilities (4th ed.). Baltimore, MD: Paul H. Brookes Publishing Co., 2006.
Wehmeyer, Michael L. The Arc’s Self-Determination Scale: Procedural Guidelines. Arlington, TX: The Arc, 1995.
Wehmeyer, Michael and Kathy Kelchner. The Arc’s Self-Determination Scale. Arlington, TX: The Arc, 1995.
Wittenburg, David. Testimony for Hearing on Supplemental Security Income Benefits for Children.” Presented at the Subcommittee on Human Resources Committee on Ways and Means, U.S. House of Representatives. Washington, DC: Mathematica Policy Research, 2011.
Wittenburg, David C., and Pamela J. Loprest. “Early Transition Experiences of Transition-Age Child SSI Recipients: New Evidence from the National Survey of Children and Families.” Journal of Disability Policy Studies, vol. 18, no. 3, winter 2007, pp. 176–187.

This page has been left blank for double-sided copying.

APPENDIX A
ADDITIONAL ANALYSES AND TECHNICAL DISCUSSION

This page has been left blank for double-sided copying.

FINAL REPORT ON THE YTD EVALUATION APPENDIX A: ADDITIONAL ANALYSES
A.3
In this appendix, we provide a detailed discussion of some of the analytic issues raised in Chapter II. We begin by presenting the baseline characteristics of the analytic samples, followed by a discussion of the comparison of impact estimates based on simple and regression-adjusted means for the primary outcomes. We then discuss response and non-response to the 36-month survey and our treatment of missing information for control variables and outcome measures. In the final section of the appendix, we present estimated impacts on primary outcomes for subgroups of youth enrolled in the evaluation.
A. Baseline characteristics of the analytic samples The analytic samples for the three-year impact analysis of the six YTD projects consist of
the randomly assigned evaluation enrollees who completed the 36-month follow-up survey. In Section B of Chapters III-VIII, we discuss the baseline characteristics of the analytic sample in each evaluation site and note the statistical equivalence of the treatment and control group youth. That discussion focuses on the subset of baseline characteristics presented in Table 1 in each of the site specific chapters. In the Appendix Tables A.1a–A.1f, we present the full set of baseline characteristics we analyzed. These tables further confirm what was noted in the site-specific chapters: the treatment and control groups in the analytic sample for the three-year impact analysis for the YTD project can be considered equivalent at baseline.
B. Comparison of unadjusted means and regression-adjusted means In the text, we report regression-adjusted impact estimates. We estimated the regressions by
using ordinary least squares (OLS) for continuous variables, logistic regression for binary variables, and multinomial logistic regression for categorical variables.79 The regression adjustments control for small differences in baseline characteristics between the treatment and control groups. In addition, the regression-adjusted approach tends to yield more precise estimates—that is, estimates with smaller standard errors—thereby providing greater statistical power to detect small impacts. In Table A.2, we list the variables in the regression models for each of the six evaluation sites.80 The control variables used are largely similar across the sites; however, there is some variation to address treatment-control differences in baseline characteristics for specific sites.
Some research suggests that the use of OLS multivariate regression models may not always be justified for impact estimation, even with the availability of control variables with significant power to explain the variation in outcome measures (Freedman 2006). Freedman’s argument is that multivariate models, under some circumstances, may lead to biases in the standard errors of impact estimates. Schochet (2010) examined data from several large-scale random assignment evaluations and found that, in practice, regression adjustments did not lead to biases in the standard errors of impact estimates. In general, as long as there is a fairly even split in the sample
79 For the logistic and multinomial logistic regressions, we computed the estimated impact as the difference between the estimated outcome if all sample youth were in the treatment group (that is, the predicted value with the treatment dummy equal to one) less the estimated outcome if all sample youth were in the control group (that is, the predicted value with the treatment dummy equal to zero). The reported p-value for the estimated impact is the p-value on the treatment dummy in the regression model.
80 The control variables in the regression model were chosen, in part, to include characteristics for which the baseline difference between treatment and control groups was substantial and/or statistically significant.

FINAL REPORT ON THE YTD EVALUATION APPENDIX A: ADDITIONAL ANALYSES
A.4
between treatment and control groups, the regression-adjusted estimates do not lead to biases in the standard errors of impact estimates. The analytic samples in the YTD projects are only slightly unbalanced (ranging from 54 percent to 57 percent in the treatment group) and so should not introduce bias in the regression-based standard errors.
To provide a relevant reference point for understanding the regression-adjusted impact estimates, we report regression-adjusted means for the treatment and the control groups in the tables in Chapters III through VIII. For most outcome measures, the unadjusted treatment and control group means do not differ substantially from the regression-adjusted means.81 For some outcomes, the unadjusted and regression-adjusted means differ, as regression adjustment accounts for the underlying differences between treatment and control group members in their characteristics at enrollment. In reporting impact estimates, we note the proportional size of the estimates relative to the adjusted control group means. In Tables A.3a–A.3f, we provide the impact estimates based on differences in the unadjusted means for the treatment and control groups for all outcomes.
We compare results from the two approaches for estimating impacts (the difference in regression-adjusted means and the difference in unadjusted means) for the primary outcomes for each YTD project in Table A.4. For most of the primary outcomes, the magnitudes of the impact estimates and their statistical significance are congruent between the two estimation approaches. In a few cases where the two estimation approaches led to differences in the statistical significance of the estimated impacts, the differences can be explained by either or both of two factors emanating from regression adjustment: the improvement in the precision of the estimated impacts and the ability to account for differences between treatment and control group youth at enrollment. For example, in the Colorado site, the impact on youth having been arrested or charged with delinquency or a criminal complaint during the third year following enrollment is not statistically significant when estimated based on the treatment-control difference in unadjusted means, but it is statistically significant when estimated based on the difference in regression-adjusted means. This is due to the greater precision of the regression-adjusted estimate. The same is true for the impact in the West Virginia site on youth participation in any productive activity in the third year following enrollment. The Montgomery County site provides an example of the importance of controlling for differences in characteristics between treatment and control group youth at enrollment. In that site, the impacts on earnings and income during the third post-enrollment year are statistically significant when estimated based on treatment-control differences in unadjusted means but they are not statistically significant when estimated based on regression-adjusted means. In that site, treatment group youth were more likely than their control group counterparts to have had paid work experience when they enrolled in the evaluation (as shown in Table VII.1), and regression adjustment controlled for that difference. These examples illustrate how regression adjustment allowed us to arrive at more robust conclusions about the impacts of the YTD projects than would have been possible based on comparisons of treatment-control differences in unadjusted mean values.
81 All continuous outcome variables measured using the 36-month survey data were top-coded by assigning to
the highest 2 percent of observations the value of the 98th percentile.
FINAL REPORT ON THE YTD EVALUATION APPENDIX A: ADDITIONAL ANALYSES
A.5
C. Non-response to the 36-month follow-up survey and survey weights For the 36-month follow-up survey, if respondents differed systematically from non-
respondents in characteristics that also were correlated with the outcomes of interest, the estimated impacts could be biased if we did not account for the differences. We found that respondents did differ from non-respondents on several baseline characteristics. The differences varied by site, but key differences included survey respondents being more likely than non-respondents at the time of enrollment to have (1) had work experience in the year prior, (2) been living with both parents, (3) health insurance, (4) family income of $25,000 or more, and (5) not been receiving SNAP (previously Food Stamps) assistance (Appendix Tables A.5a–A.5f).
In our analysis, we used weights that adjust for survey non-response to make respondent cases more representative of the original sample and reduce the potential for non-response bias. For the weight adjustments, we used forward and backward stepwise logistic models to estimate the propensity for a sample member to respond. We used the inverse of the propensity score as the non-response weight. We computed the models separately for treatment and control observations in each site. To select variables in the logistic model, we included variables with a statistical significance level of 0.30 or lower (instead of the standard 0.05) because the purpose of the model was to improve estimation of the propensity score, not to identify statistically significant factors related to response. For both the control and treatment groups, the explanatory variables included the following characteristics measured at the time youth were enrolled in the evaluation: age, race, representative payee type, primary disabling condition, duration of disability, duration of benefit entitlement, self-reported health status, school attendance, highest grade completed, ever received special education services, family income level, received SNAP assistance, received TANF or family assistance, living arrangement, lived with others with disabilities, number of people in the household, needed help with personal care needs, used reading, hearing, speaking or walking aids, received job training during the year before enrollment, had paid work experience, and were employed at the time of enrollment. Additional characteristics for the control group included gender. For the treatment group, additional characteristics included whether youth had achieved a high school diploma or GED at the time of their enrollment in the evaluation.
In addition, using data from administrative records for the survey respondent and full research samples, we compared the estimated impacts of each YTD project on employment, earnings, benefit receipt, and benefit amount for each evaluation site (Table A.5). Across these outcomes, we found only small differences in levels and estimated impacts between the respondent and full research samples—not surprising, given the high overall survey response rates of between 75 percent and 87 percent across the six evaluation sites.
D. Missing data on control variables and outcome measures For most of the control variables (explanatory variables) used in our regression models, we
had few observations with missing information. For these variables, generally with far fewer than 5 percent of observations missing information, we replaced the missing information with the mean value from the non-missing observations. Across the six evaluation sites, there are eight variables with a larger share of missing observations; we used dummy variables to indicate that the information was missing. These variables are the following: highest grade completed, mother completed high school, father completed high school, mother currently employed, father

FINAL REPORT ON THE YTD EVALUATION APPENDIX A: ADDITIONAL ANALYSES
A.6
currently employed, youth expects to live independently, youth expects to work for pay, and primary disabling condition. For the subgroup analyses, we omitted observations if the subgroup information was missing.
We typically excluded observations with missing information on an outcome measure (dependent variable) from any analysis of that outcome. For some outcome measures, however, the elimination of missing observations would produce potential bias. Specifically, the potential for bias occurs when the outcome is known to have a specific value for some observations conditional on another outcome. For example, for youth reporting that they did not work for pay in the third year following enrollment in the evaluation, earnings in that year are known to be zero. Missing information thus arises only for observations of youth who worked for pay during the year. In this example, the elimination of missing observations would imply elimination only of observations for youth who worked for pay, resulting in an underestimate of average earnings. The degree to which the earnings estimate is too low could differ by treatment status (for example, if treatment youth were more likely to work for pay and just as likely to respond to questions on earnings). For almost all outcome measures with conditionally missing data, across all six evaluation sites, no more than 13.5 percent of observations had missing data. The only exceptions were for the Montgomery County site, where larger proportions of the sample had missing data on hours worked in paid jobs and earnings (data were missing for 22.0 percent and 24.2 percent of the observations, respectively), and on whether youth had ever been convicted of or pled guilty to a charge since enrollment in the evaluation (data were missing for 17.6 percent of the observations). In Tables A.3a–A3f, we provide the sample size (N) for every outcome measure in each of the six evaluation sites.
For outcome measures for which information was missing conditional on another outcome, we used a multiple imputation procedure, as described in Puma et al. (2009). Here we provide a conceptual description of the imputation process. We first imputed the missing values by using a stochastic regression model. The imputation model included all variables in our impact analysis model, plus key outcome measures and a stochastic residual term to match the observed variance in the sample. We performed the process 10 times to create 10 separate analytic data sets. We then conducted the impact analysis separately on each of the 10 data sets. The impact estimate is computed as the simple average of the impact estimates across the 10 data sets. The standard error of the combined impact estimate is calculated from within-imputation variance and between-imputation variance components. To implement the analysis, we used Stata 13 procedures developed following user-written commands by Royston (2007), Carlin et al. (2008), and Royston et al. (2009).82
E. Impact estimates for subgroups The subgroup analysis examined whether the intervention worked better for some types of
youth than others. Subgroup analysis can inform decisions about targeting scarce resources to
82 Impact estimates for outcomes with conditionally missing data would be biased if we did not adjust for
missing information. However, when we calculated the biased impact estimates by dropping observations with missing outcome information, we found results very similar to those of the multiple imputation procedure. The impact estimates were slightly different but the pattern of statistical significance was the same. The similarity of the findings is not surprising, given the relatively small share of observations with missing outcome information.

FINAL REPORT ON THE YTD EVALUATION APPENDIX A: ADDITIONAL ANALYSES
A.7
specific groups. However, the limited size of the analytic sample for each evaluation site meant that, for some subgroups, the sample sizes were insufficient to allow us to detect impacts of policy-relevant magnitudes. Further, to be responsive to the multiple comparisons problem, we estimated subgroup impacts on primary outcome measures only and restricted the number of subgroups examined.
We specified four pairs of subgroups in our analysis plan for the YTD final evaluation report (Fraker and Mamun 2013). These were defined by the school enrollment status, age, and work experience of youth when they enrolled in the YTD evaluation, and whether they enrolled in the first or second half of a site’s enrollment period. We subsequently dropped the subgroup pair defined by the timing of enrollment from the analysis, as results for this subgroup pair have limited policy relevance. To estimate subgroup impacts, we modified the regression models to include the interaction of the treatment status indicator with a 0/1 indicator variable for a specific subgroup pair. For each subgroup, we conducted a test to determine the statistical significance of the impact on each arm of a subgroup pair. We conducted another test to determine whether the estimated impacts for the two arms of a subgroup pair were statistically different from each other.
We highlighted key subgroup results for each domain in the site-specific chapters of this report (Chapters III through VIII) but did not present the full results in tables. In Tables A.7a through A.7f, we present the estimated impacts on the primary outcomes for the six subgroups we examined for each evaluation site. In discussing the subgroup results in the site-specific chapters, we highlighted the subgroups arms for which the estimated impacts on a primary outcome are statistically significant. However, in many instances, even when the estimated impact is statistically significant for one arm of a subgroup pair, the difference between the estimated impacts for the two arms is not statistically significant. Thus, the subgroup impacts should be considered cautiously for drawing policy conclusions.

FINAL REPORT ON THE YTD EVALUATION APPENDIX A: ADDITIONAL ANALYSES
A.8
Table A.1a. Bronx Co., NY: baseline characteristics of the analytic sample (percentages, unless otherwise noted)
Characteristic All Treatment Control Difference - p-value
Baseline survey data Demographic characteristics - - - - - - Race - - - - - 0.92 White 32.1 32.4 31.7 0.7 - - Black 43.0 42.1 44.2 -2.1 - - HI/Pacific/Am Ind/AK 2.6 2.3 3.0 -0.7 - - Asian 0.9 0.9 0.9 0.0 - - Other or unknown 21.4 22.3 20.2 2.1 - - Hispanic 70.2 71.5 68.5 3.0 - 0.38 Primarily speaks English at home 70.9 69.8 72.4 -2.6 - 0.45 Education - - - - - - School attendance - - - - * 0.08 Does not attend school 6.4 6.8 6.0 0.8 - - Attends regular high school 53.4 50.3 57.4 -7.1 - - Attends special high school 34.9 35.9 33.6 2.3 - - Attends other school 5.2 7.0 3.0 4.0 - - Attainment - highest grade - - - - - 0.27 9th grade or less 39.7 37.5 42.4 -5.0 - - 10th or 11th grade 46.0 48.5 42.8 5.7 - - 12th grade 5.0 3.9 6.4 -2.5 - - College or technical school 0.1 0.2 0.0 0.2 - - Other 9.2 9.9 8.3 1.6 - - HS diploma, GED, or certificate of completion 0.3 0.2 0.3 -0.1 - 0.79 Ever received special education 86.8 87.6 85.9 1.6 - 0.52 Employment - - - - - - Received job training in last year 21.1 23.2 18.6 4.6 - 0.14 Worked as a volunteer in last year 11.1 13.2 8.5 4.6 * 0.05 Worked for pay in last year 18.4 19.0 17.5 1.6 - 0.59 Worked for pay in last month 7.4 9.2 5.2 4.0 ** 0.04 Never worked for pay at baseline 67.5 67.6 67.3 0.3 - 0.94 Living arrangements and household composition - - - - - - Living arrangements - - - - - 0.81 Two-parent family 19.3 18.9 19.9 -1.0 - - Single-parent family 80.1 80.3 79.9 0.4 - - Group home - - - - - - Other institution 0.2 0.2 0.3 -0.1 - - Lives alone or with friends 0.4 0.6 0.0 0.6 - - Average number of people in household 4.0 4.0 4.1 0.0 - 0.70 Lives with others with disabilities 47.1 48.6 45.1 3.5 - 0.35 Health insurance coverage - - - - - - Covered by public health insurance 96.7 96.4 97.1 -0.8 - 0.57 Covered by private health insurance 8.3 7.8 9.0 -1.1 - 0.58 Covered by both public and private health ins. 6.2 5.5 7.1 -1.5 - 0.40 Covered by public or private health insurance 98.7 98.6 98.7 -0.1 - 0.95 Family socio-economic status - - - - - - Annual income level - - - - - 0.32 Less than $10,000 41.8 43.2 40.1 3.2 - - $10,000 - $24,999 42.7 43.2 42.1 1.0 - - $25,000 or more 15.5 13.6 17.8 -4.2 - - Public assistance - - - - - - TANF/family assistance 15.3 16.6 13.6 2.9 - 0.28 SNAP (food stamps) 46.6 44.6 49.2 -4.6 - 0.22 Parents' education - - - - - - Mother HS graduate 45.7 45.2 46.3 -1.0 - 0.78 Father HS graduate 48.7 44.9 53.4 -8.5 * 0.07 Parents' employment status - - - - - - Mother currently employed 39.9 38.2 42.1 -3.9 - 0.29 Father currently employed 59.2 60.8 57.3 3.5 - 0.47 Self-reported health status - - - - - 0.28 Excellent 20.6 18.9 22.8 -3.8 - - Very good/good 61.8 61.9 61.6 0.2 - - Fair/poor 17.6 19.2 15.6 3.6 - -

FINAL REPORT ON THE YTD EVALUATION APPENDIX A: ADDITIONAL ANALYSES
TABLE A.1.a (CONTINUED
A.9
Characteristic All Treatment Control Difference - p-value Assistance - - - - - Reading, hearing, speaking, or walking aids 11.1 11.9 10.1 1.9 - 0.43 Help with personal care needs 11.9 12.6 11.1 1.4 - 0.56 Independent activities - - - - - - Decide by selves how to spend money 80.6 80.2 81.2 -1.1 - 0.72 Pick clothes to wear 92.9 93.1 92.6 0.5 - 0.80 Make snacks or sandwiches 90.4 91.3 89.2 2.2 - 0.32 Ride public transportation alone 73.4 72.2 74.9 -2.7 - 0.42 Decide how to spend free time 90.4 90.6 90.1 0.5 - 0.83 Expectations about the future - - - - - - Expects to live independently (w/ or w/o help) 71.8 72.1 71.5 0.6 - 0.87 Expects to continue education 96.9 97.1 96.7 0.3 - 0.80 Expects to work at least part-time for pay 95.2 95.5 94.9 0.6 - 0.74 Random assignment cohort - - - - - 0.69 Year 1 cohort 18.2 19.3 16.9 2.3 - - Year 2 cohort 42.3 42.2 42.4 -0.2 - - Year 3 cohort 39.5 38.5 40.6 -2.1 - -
Administrative data Demographic characteristics - - - - - - Male 67.7 68.3 67.0 1.3 - 0.71 Age (in years) - - - - ** 0.04
14-15 21.2 19.6 23.1 -3.6 - - 16 45.4 49.5 40.2 9.3 - - 17-19 33.5 30.9 36.7 -5.8 - -
Average age (in years) 16.2 16.2 16.2 0.0 - 0.81 Language - - - - - 0.61 English 68.8 68.5 69.2 -0.8 - - Spanish 26.3 25.9 26.7 -0.8 - - Other - - - - - - Unknown/missing 4.9 5.6 4.0 1.6 - - Benefits - - - - - - Representative payee type - - - - - 0.13 None 1.1 1.4 0.7 0.7 - - Natural/adoptive/step parent 83.4 82.8 84.1 -1.4 - - Other relative 14.4 15.4 13.2 2.3 - - Other 1.2 0.4 2.1 -1.6 - - SSA beneficiary status - - - - - - SSI (only or concurrent with CDB or DI) 100 100 100 0.0 - 1.00 Duration of benefit entitlement (in years) 8.8 8.8 8.8 0.1 - 0.87 Benefit amount in prior year ($) 6,410 6,399 6,423 -23 - 0.89 Health status - - - - - 0.69 Primary disabling condition (SSA data) 12.7 13.7 11.5 2.2 - - Mental illness 33.0 31.2 35.3 -4.1 - - Cognitive/developmental disability 24.3 25.6 22.7 2.9 - - Learning disability/ADD 17.9 17.4 18.6 -1.2 - - Physical disability 12.0 12.0 11.9 0.1 - - Speech, hearing, visual impairment 9.3 9.3 9.2 0.1 - 0.85 Duration of disability (in years) 67.7 68.3 67.0 1.3 - 0.71 Earnings - - - - - - Earnings in prior year ($) 117 117 117 -1 - 0.98 Sample size 740 420 320 - - -
Sources: YTD baseline survey and SSA administrative records. Notes: Baseline survey item non-response may have resulted in smaller sample sizes for some characteristics than indicated at
the bottom of the table. Missing information on primary disabling condition resulted in a smaller sample size for this characteristic than shown at the bottom of the table. All dollar amounts shown in the table are in 2008 dollars.
*/**/*** Treatment-control difference is statistically different from zero at the .10/.05/.01 level using either a two-tailed t-test or a chi-square test.

FINAL REPORT ON THE YTD EVALUATION APPENDIX A: ADDITIONAL ANALYSES
A.10
Table A.1b. Colorado: baseline characteristics of the analytic sample (percentages, unless otherwise noted)
Characteristic All Treatment Control Difference - p-value
Baseline survey data Demographic characteristics - - - - - - Race - - - - * 0.05 White 71.7 71.1 72.5 -1.4 - - Black 7.7 9.0 6.2 2.8 - - HI/Pacific/Am Ind/AK 5.0 4.4 5.8 -1.4 - - Asian 1.8 0.7 3.2 -2.5 - - Other or unknown 13.7 14.9 12.4 2.5 - - Hispanic 23.2 21.9 24.8 -2.9 - 0.37 Primarily speaks English at home 95.3 96.2 94.2 2.0 - 0.22 Education - - - - - - School attendance - - - - - 0.80 Does not attend school 55.8 54.7 57.1 -2.4 - - Attends regular high school 29.2 29.3 29.1 0.2 - - Attends special high school 4.2 4.9 3.5 1.4 - - Attends other school 10.7 11.1 10.3 0.8 - - Attainment - highest grade - - - - - 0.65 9th grade or less 17.5 16.9 18.2 -1.4 - - 10th or 11th grade 21.0 21.0 21.1 -0.1 - - 12th grade 48.7 47.5 50.1 -2.6 - - College or technical school 3.0 3.2 2.7 0.6 - - Other 9.8 11.5 7.9 3.6 - - HS diploma, GED, or certificate of completion 44.7 44.9 44.5 0.5 - 0.90 Ever received special education 85.3 84.1 86.8 -2.7 - 0.33 Employment - - - - - - Received job training in last year 36.0 35.2 37.1 -1.9 - 0.60 Worked as a volunteer in last year 14.2 14.0 14.5 -0.5 - 0.86 Worked for pay in last year 34.7 37.3 31.6 5.7 - 0.12 Worked for pay in last month 21.3 23.9 18.1 5.8 * 0.07 Never worked for pay at baseline 45.9 43.7 48.5 -4.7 - 0.22 Living arrangements and household composition - - - - - - Living arrangements - - - - - 0.92 Two-parent family 46.3 46.9 45.6 1.3 - - Single-parent family 35.0 35.4 34.5 0.9 - - Group home 2.1 2.3 1.9 0.4 - - Other institution 2.6 2.2 3.0 -0.8 - - Lives alone or with friends 14.0 13.2 14.9 -1.7 - - Average number of people in household 3.8 3.8 3.9 -0.1 - 0.52 Lives with others with disabilities 31.7 33.6 29.2 4.4 - 0.24 Health insurance coverage - - - - - - Covered by public health insurance 91.9 92.1 91.6 0.6 - 0.79 Covered by private health insurance 26.6 28.4 24.4 4.0 - 0.24 Covered by both public and private health ins. 21.2 22.9 19.1 3.8 - 0.22 Covered by public or private health ins. 97.0 97.3 96.7 0.6 - 0.67 Family socio-economic status - - - - - - Annual income level - - - - - 0.68 Less than $10,000 25.1 23.8 26.8 -3.0 - - $10,000 - $24,999 27.1 27.2 27.0 0.2 - - $25,000 or more 47.8 49.0 46.2 2.8 - - Public assistance - - - - - - TANF/family assistance 4.8 3.8 6.0 -2.2 - 0.20 SNAP (food stamps) 23.8 22.0 26.1 -4.0 - 0.23 Parents' education - - - - - - Mother HS graduate 79.3 77.9 81.1 -3.2 - 0.32 Father HS graduate 79.7 79.1 80.3 -1.2 - 0.74 Parents' employment status - - - - - - Mother currently employed 61.0 58.4 64.3 -6.0 - 0.13 Father currently employed 71.0 70.8 71.2 -0.4 - 0.93 Self-reported health status - - - - * 0.09 Excellent 20.4 21.1 19.6 1.5 - - Very good/good 55.9 58.4 52.8 5.6 - - Fair/poor 23.7 20.5 27.6 -7.1 - -
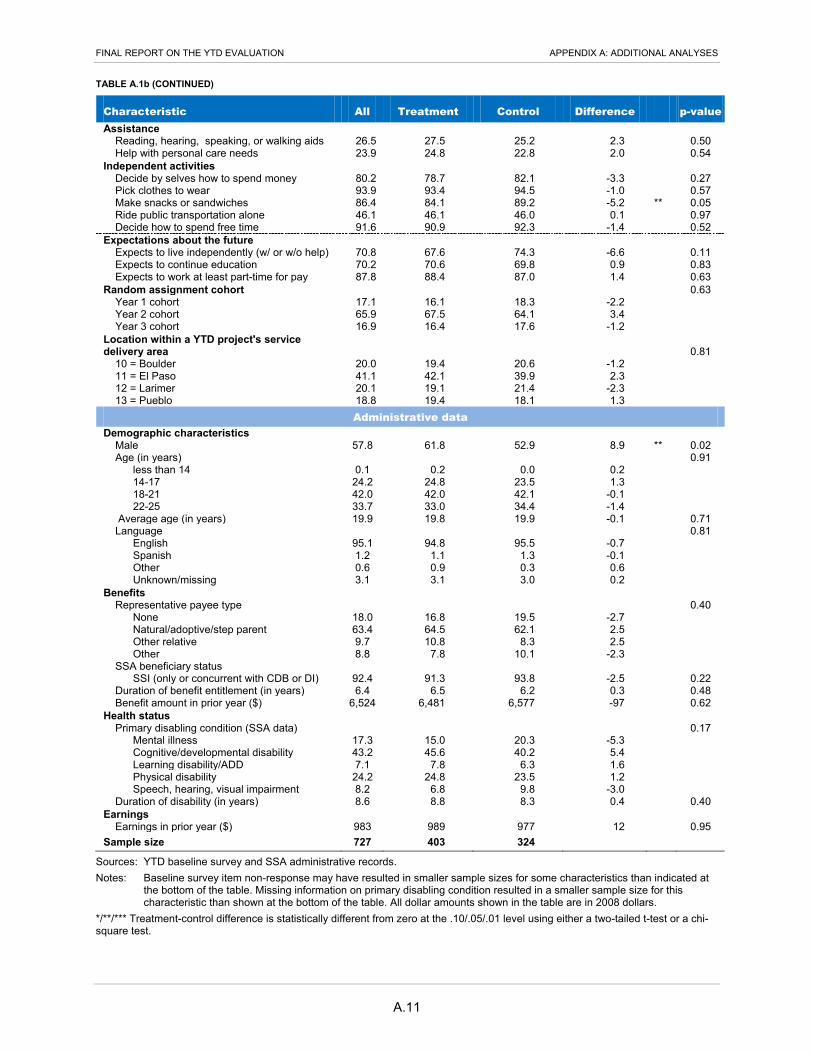
FINAL REPORT ON THE YTD EVALUATION APPENDIX A: ADDITIONAL ANALYSES
TABLE A.1b (CONTINUED)
A.11
Characteristic All Treatment Control Difference - p-value Assistance - - - - - - Reading, hearing, speaking, or walking aids 26.5 27.5 25.2 2.3 - 0.50 Help with personal care needs 23.9 24.8 22.8 2.0 - 0.54 Independent activities - Decide by selves how to spend money 80.2 78.7 82.1 -3.3 - 0.27 Pick clothes to wear 93.9 93.4 94.5 -1.0 - 0.57 Make snacks or sandwiches 86.4 84.1 89.2 -5.2 ** 0.05 Ride public transportation alone 46.1 46.1 46.0 0.1 - 0.97 Decide how to spend free time 91.6 90.9 92.3 -1.4 - 0.52 Expectations about the future - - - - - - Expects to live independently (w/ or w/o help) 70.8 67.6 74.3 -6.6 - 0.11 Expects to continue education 70.2 70.6 69.8 0.9 - 0.83 Expects to work at least part-time for pay 87.8 88.4 87.0 1.4 - 0.63 Random assignment cohort - - - - - 0.63 Year 1 cohort 17.1 16.1 18.3 -2.2 - - Year 2 cohort 65.9 67.5 64.1 3.4 - - Year 3 cohort 16.9 16.4 17.6 -1.2 - - Location within a YTD project's service delivery area - - - - - 0.81 10 = Boulder 20.0 19.4 20.6 -1.2 - - 11 = El Paso 41.1 42.1 39.9 2.3 - - 12 = Larimer 20.1 19.1 21.4 -2.3 - - 13 = Pueblo 18.8 19.4 18.1 1.3 - -
Administrative data Demographic characteristics - - - - - - Male 57.8 61.8 52.9 8.9 ** 0.02 Age (in years) - - - - - 0.91 less than 14 0.1 0.2 0.0 0.2 - - 14-17 24.2 24.8 23.5 1.3 - - 18-21 42.0 42.0 42.1 -0.1 - - 22-25 33.7 33.0 34.4 -1.4 - - Average age (in years) 19.9 19.8 19.9 -0.1 - 0.71 Language - - - - - 0.81 English 95.1 94.8 95.5 -0.7 - - Spanish 1.2 1.1 1.3 -0.1 - - Other 0.6 0.9 0.3 0.6 - - Unknown/missing 3.1 3.1 3.0 0.2 - - Benefits - - - - - - Representative payee type - - - - - 0.40 None 18.0 16.8 19.5 -2.7 - - Natural/adoptive/step parent 63.4 64.5 62.1 2.5 - - Other relative 9.7 10.8 8.3 2.5 - - Other 8.8 7.8 10.1 -2.3 - - SSA beneficiary status - - - - - - SSI (only or concurrent with CDB or DI) 92.4 91.3 93.8 -2.5 - 0.22 Duration of benefit entitlement (in years) 6.4 6.5 6.2 0.3 - 0.48 Benefit amount in prior year ($) 6,524 6,481 6,577 -97 - 0.62 Health status - - - - - - Primary disabling condition (SSA data) - - - - - 0.17 Mental illness 17.3 15.0 20.3 -5.3 - - Cognitive/developmental disability 43.2 45.6 40.2 5.4 - - Learning disability/ADD 7.1 7.8 6.3 1.6 - - Physical disability 24.2 24.8 23.5 1.2 - - Speech, hearing, visual impairment 8.2 6.8 9.8 -3.0 - - Duration of disability (in years) 8.6 8.8 8.3 0.4 - 0.40 Earnings - - - - - - Earnings in prior year ($) 983 989 977 12 - 0.95 Sample size 727 403 324 - - -
Sources: YTD baseline survey and SSA administrative records. Notes: Baseline survey item non-response may have resulted in smaller sample sizes for some characteristics than indicated at
the bottom of the table. Missing information on primary disabling condition resulted in a smaller sample size for this characteristic than shown at the bottom of the table. All dollar amounts shown in the table are in 2008 dollars.
*/**/*** Treatment-control difference is statistically different from zero at the .10/.05/.01 level using either a two-tailed t-test or a chi-square test.

FINAL REPORT ON THE YTD EVALUATION APPENDIX A: ADDITIONAL ANALYSES
A.12
Table A.1c. Erie Co., NY: baseline characteristics of the analytic sample (percentages, unless otherwise noted)
Characteristic All Treatment Control Difference - p-value
Baseline survey data Demographic characteristics - - - - - - Race - - - - - 0.30 White 55.0 55.4 54.4 0.9 - - Black 35.1 32.7 38.0 -5.2 - - HI/Pacific/Am Ind/AK 0.9 0.9 0.9 0.0 - - Asian 0.4 0.5 0.3 0.2 - - Other or unknown 8.6 10.5 6.4 4.1 - - Hispanic 9.2 9.3 9.0 0.3 - 0.88 Primarily speaks English at home 96.6 96.6 96.6 0.0 - 0.98 Education - - - - - - School attendance - - - - - 0.26 Does not attend school 51.0 48.3 54.1 -5.8 - - Attends regular high school 26.1 29.1 22.6 6.5 - - Attends special high school 8.3 7.7 8.9 -1.1 - - Attends other school 14.7 14.9 14.4 0.5 - - Attainment - highest grade - - - - - 0.36 9th grade or less 8.5 10.6 6.0 4.6 - - 10th or 11th grade 31.4 31.3 31.4 -0.1 - - 12th grade 43.7 42.2 45.5 -3.3 - - College or technical school 3.5 3.1 4.0 -0.9 - - Other 13.0 12.8 13.2 -0.3 - - HS diploma, GED, or certificate of completion 40.6 37.4 44.4 -7.0 * 0.06 Ever received special education 82.8 82.0 83.7 -1.7 - 0.55 Employment - - - - - - Received job training in last year 38.5 37.6 39.7 -2.1 - 0.57 Worked as a volunteer in last year 10.4 10.9 9.7 1.2 - 0.61 Worked for pay in last year 35.2 33.5 37.3 -3.8 - 0.30 Worked for pay in last month 18.5 16.3 21.3 -5.0 * 0.09 Never worked for pay at baseline 42.1 43.4 40.5 2.9 - 0.44 Living arrangements and household composition - - - - - - Living arrangements - - - - - 0.94 Two-parent family 32.2 33.1 31.2 1.9 - - Single-parent family 49.7 49.1 50.3 -1.2 - - Group home 1.7 1.4 2.1 -0.7 - - Other institution 3.4 3.2 3.5 -0.4 - - Lives alone or with friends 13.0 13.2 12.9 0.3 - - Average number of people in household 3.7 3.7 3.6 0.1 - 0.40 Lives with others with disabilities 43.4 44.6 41.8 2.8 - 0.49 Health insurance coverage - - - - - - Covered by public health insurance 96.0 96.4 95.5 0.9 - 0.55 Covered by private health insurance 23.8 24.7 22.7 2.0 - 0.54 Covered by both public and private health ins. 20.8 22.1 19.1 3.0 - 0.33 Covered by public or private health insurance 98.4 98.5 98.3 0.3 - 0.78 Family socio-economic status - - - - - - Annual income level - - - - - 0.35 Less than $10,000 33.5 35.7 30.8 4.9 - - $10,000 - $24,999 33.4 31.2 36.1 -4.9 - - $25,000 or more 33.1 33.1 33.1 0.0 - - Public assistance - - - - - - TANF/family assistance 10.0 9.9 10.2 -0.3 - 0.91 SNAP (food stamps) 38.5 41.1 35.3 5.8 - 0.13 Parents' education - - - - - - Mother HS graduate 74.3 75.1 73.3 1.8 - 0.60 Father HS graduate 73.8 75.4 71.7 3.7 - 0.34 Parents' employment status - - - - - - Mother currently employed 49.2 46.9 52.0 -5.1 - 0.20 Father currently employed 58.0 58.2 57.6 0.6 - 0.89 Self-reported health status - - - - - 0.56 Excellent 19.0 18.0 20.3 -2.3 - - Very good/good 61.5 63.3 59.4 3.9 - - Fair/poor 19.5 18.8 20.4 -1.6 - -

FINAL REPORT ON THE YTD EVALUATION APPENDIX A: ADDITIONAL ANALYSES
TABLE A.1c (CONTINUED)
A.13
Characteristic All Treatment Control Difference - p-value Assistance - - - - - - Reading, hearing, speaking, or walking aids 16.0 15.1 17.1 -2.0 - 0.47 Help with personal care needs 17.7 15.8 20.0 -4.2 - 0.15 Independent activities - - - - - - Decide by selves how to spend money 84.7 85.2 84.0 1.3 - 0.65 Pick clothes to wear 94.1 94.1 94.1 0.1 - 0.97 Make snacks or sandwiches 90.5 90.4 90.7 -0.2 - 0.92 Ride public transportation alone 56.8 54.4 59.6 -5.3 - 0.16 Decide how to spend free time 93.1 93.8 92.3 1.5 - 0.44 Expectations about the future - - - - - - Expects to live independently (w/ or w/o help) 75.8 76.4 75.2 1.2 - 0.75 Expects to continue education 75.8 77.7 73.4 4.3 - 0.24 Expects to work at least part-time for pay 93.1 91.1 95.4 -4.3 ** 0.05 Random assignment cohort - - - - - 0.19 Year 1 cohort 84.5 86.1 82.5 3.6 - - Year 2 cohort 15.5 13.9 17.5 -3.6 - - Location within a YTD project's service delivery area - - - - - 0.95 30 = Erie Buffalo 57.0 56.9 57.1 -0.3 - - 31 = Erie North 25.4 25.2 25.7 -0.6 - - 32 = Erie South 17.6 18.0 17.1 0.9 - -
Administrative data Demographic characteristics - - - - - - Male 61.0 62.0 59.8 2.2 - 0.56 Age (in years) - - - - - 0.60 15-17 24.6 25.9 22.9 3.0 - - 18-21 44.1 44.0 44.3 -0.3 - - 22-25 31.3 30.1 32.8 -2.7 - - Average age (in years) 19.9 19.8 20.0 -0.2 - 0.33 Language - - - - - 0.13 English 94.0 95.7 91.8 3.9 - -- Spanish 2.2 2.0 2.5 -0.5 - -- Other 0.1 0.0 0.3 -0.3 - - Unknown/missing 3.7 2.3 5.4 -3.1 - - Benefits - - - - - - Representative payee type - - - - - 0.30 None 16.6 17.1 15.9 1.2 - - Natural/adoptive/step parent 65.9 65.7 66.2 -0.5 - - Other relative 10.2 11.3 8.8 2.5 - - Other 7.3 5.8 9.1 -3.2 - - SSA beneficiary status - - - - - 0.73 SSI (only or concurrent with CDB or DI) 94.2 94.5 93.8 0.6 - - Duration of benefit entitlement (in years) 8.3 8.3 8.3 0.0 - 0.94 Benefit amount in prior year ($) 7,104 7,013 7,215 -202 - 0.32 Health status - - - - - - Primary disabling condition (SSA data) - - - - - 0.41 Mental illness 17.8 17.2 18.4 -1.2 - - Cognitive/developmental disability 44.7 45.5 43.6 2.0 - - Learning disability/ADD 13.2 14.8 11.2 3.6 - - Physical disability 17.8 15.7 20.3 -4.6 - - Speech, hearing, visual impairment 6.6 6.7 6.5 0.1 - - Duration of disability (in years) 9.8 9.6 10.1 -0.4 - 0.40 Earnings - - - - - - Earnings in prior year ($) 867 869 863 6 - 0.97 Sample size 718 397 321 - - -
Sources: YTD baseline survey and SSA administrative records. Notes: Baseline survey item non-response may have resulted in smaller sample sizes for some characteristics than indicated at
the bottom of the table. Missing information on primary disabling condition resulted in a smaller sample size for this characteristic than shown at the bottom of the table. All dollar amounts shown in the table are in 2008 dollars.
*/**/*** Treatment-control difference is statistically different from zero at the .10/.05/.01 level using either a two-tailed t-test or a chi-square test.

FINAL REPORT ON THE YTD EVALUATION APPENDIX A: ADDITIONAL ANALYSES
A.14
Table A.1d. Miami-Dade Co., FL: baseline characteristics of the analytic sample (percentages, unless otherwise noted)
Characteristic All Treatment Control Difference - p-value
Baseline survey data Demographic characteristics - - - - - - Race - - - - - 0.61 White 36.2 36.4 35.9 0.5 - - Black 51.6 50.4 53.0 -2.6 - - HI/Pacific/Am Ind/AK 2.3 2.8 1.8 1.0 - - Asian 0.8 1.2 0.3 0.9 - - Other or unknown 9.1 9.2 9.0 0.2 - - Hispanic 42.5 43.0 41.8 1.1 - 0.77 Primarily speaks English at home 76.2 73.8 78.8 -5.0 - 0.14 Education - - - - - - School attendance - - - - - 0.47 Does not attend school 42.1 41.6 42.6 -1.0 - - Attends regular high school 33.4 33.1 33.7 -0.6 - - Attends special high school 8.5 7.5 9.8 -2.3 - - Attends other school 16.0 17.8 13.9 3.9 - - Attainment - highest grade - - - - - 0.79 9th grade or less 10.2 8.9 11.6 -2.7 - - 10th or 11th grade 33.6 33.2 34.0 -0.7 - - 12th grade 49.3 50.9 47.7 3.2 - - College or technical school 1.0 1.2 0.7 0.5 - - Other 5.9 5.8 6.1 -0.2 - - HS diploma, GED, or certificate of completion 32.4 32.8 31.9 0.9 - 0.80 Ever received special education 76.8 75.8 78.0 -2.2 - 0.50 Employment - - - - - - Received job training in last year 25.1 22.5 28.1 -5.6 - 0.10 Worked as a volunteer in last year 15.8 13.6 18.4 -4.8 * 0.09 Worked for pay in last year 18.7 19.9 17.4 2.5 - 0.41 Worked for pay in last month 8.5 8.2 9.0 -0.8 - 0.71 Never worked for pay at baseline 65.2 63.8 66.7 -2.9 - 0.44 Living arrangements and household composition - - - - - - Living arrangements - - - - - 0.56 Two-parent family 28.3 26.3 30.7 -4.4 - - Single-parent family 63.6 65.2 61.9 3.3 - - Group home 0.9 0.5 1.2 -0.7 - - Other institution 2.8 3.0 2.5 0.5 - - Lives alone or with friends 4.4 4.9 3.7 1.2 - - Average number of people in household 4.1 4.1 4.0 0.1 - 0.57 Lives with others with disabilities 41.0 41.9 40.0 1.9 - 0.63 Health insurance coverage - - - - - - Covered by public health insurance 89.6 89.7 89.6 0.1 - 0.96 Covered by private health insurance 9.1 8.0 10.3 -2.3 - 0.31 Covered by both public and private health ins. 5.9 5.1 6.9 -1.8 - 0.33 Covered by public or private health insurance 92.4 92.0 92.8 -0.8 - 0.69 Family socio-economic status - - - - - - Annual income level - - - - - 0.90 Less than $10,000 37.9 38.5 37.3 1.2 - - $10,000 - $24,999 38.6 38.8 38.5 0.3 - - $25,000 or more 23.5 22.8 24.3 -1.5 - - Public assistance - - - - - - TANF/family assistance 8.6 8.9 8.2 0.8 - 0.73 SNAP (food stamps) 47.6 46.4 49.0 -2.7 - 0.50 Parents' education - - - - - - Mother HS graduate 65.9 70.6 60.4 10.1 *** 0.01 Father HS graduate 62.9 61.7 64.2 -2.6 - 0.58 Parents' employment status - - - - - - Mother currently employed 45.3 47.1 43.3 3.8 - 0.34 Father currently employed 59.0 54.7 63.9 -9.2 * 0.05 Self-reported health status - - - - - 0.98 Excellent 23.0 22.7 23.3 -0.7 - - Very good/good 55.1 55.3 54.9 0.5 - - Fair/poor 21.9 22.0 21.8 0.2 - -

FINAL REPORT ON THE YTD EVALUATION APPENDIX A: ADDITIONAL ANALYSES
TABLE A.1d (CONTINUED)
A.15
Characteristic All Treatment Control Difference - p-value Assistance - - - - - - Reading, hearing, speaking, or walking aids 16.2 17.7 14.4 3.3 - 0.25 Help with personal care needs 20.1 20.0 20.2 -0.2 - 0.94 Independent activities - - - - - - Decide by selves how to spend money 76.6 77.1 76.1 1.0 - 0.76 Pick clothes to wear 91.7 92.3 91.1 1.2 - 0.57 Make snacks or sandwiches 84.2 85.1 83.1 2.0 - 0.47 Ride public transportation alone 54.2 56.9 51.2 5.7 - 0.14 Decide how to spend free time 85.4 85.0 85.9 -0.9 - 0.75 Expectations about the future - - - - - - Expects to live independently (w/ or w/o help) 67.5 67.2 67.8 -0.6 - 0.88 Expects to continue education 87.9 89.2 86.4 2.9 - 0.32 Expects to work at least part-time for pay 90.5 91.6 89.3 2.3 - 0.38 Random assignment cohort - - - - - - Randomly assigned before July 1, 2009 67.9 68.8 66.9 1.9 - 0.60 Location within a YTD project's service delivery area - - - - - -
Miami north (40) 30.6 31.8 29.2 2.6 - 0.47 Administrative data
Demographic characteristics - - - - - - Male 58.3 56.9 59.8 -2.8 - 0.46 Age (in years) - - - - - 0.78 16-17 20.5 20.8 20.0 0.8 - - 18-21 68.3 67.2 69.5 -2.3 - - 22-23 11.3 12.0 10.4 1.5 - - Average age (in years) 19.1 19.1 19.1 0.1 - 0.71 Language - - - - - 0.14 English 73.3 70.8 76.1 -5.2 - - Spanish 24.8 27.9 21.2 6.7 - - Other 0.7 0.5 0.9 -0.4 - - Unknown/missing 1.3 0.8 1.9 -1.1 - - Benefits - - - - - - Representative payee type - - - - - 0.17 None 13.0 15.2 10.5 4.8 - - Natural/adoptive/step parent 70.2 69.5 71.0 -1.4 - - Other relative 13.3 11.4 15.3 -3.9 - - Other 3.6 3.8 3.2 0.6 - - SSA beneficiary status - - - - - - SSI (only or concurrent with CDB or DI) 96.4 96.3 96.5 -0.2 - 0.90 Duration of benefit entitlement (in years) 8.7 8.8 8.5 0.3 - 0.50 Benefit amount in prior year ($) 6,293 6,144 6,463 -319 * 0.10 Health status - - - - - - Primary disabling condition (SSA data) - - - - - 0.20 Mental illness 15.7 16.8 14.3 2.5 - - Cognitive/developmental disability 45.2 42.8 47.8 -5.0 - - Learning disability/ADD 20.7 20.2 21.4 -1.2 - - Physical disability 13.3 13.3 13.4 -0.1 - - Speech, hearing, visual impairment 5.1 6.9 3.1 3.7 - - Duration of disability (in years) 9.1 9.2 9.0 0.2 - 0.57 Earnings - - - - - - Earnings in prior year ($) - - - - - - Sample size 685 375 310 - - -
Sources: YTD baseline survey and SSA administrative records. Notes: Baseline survey item non-response may have resulted in smaller sample sizes for some characteristics than indicated at
the bottom of the table. Missing information on primary disabling condition resulted in a smaller sample size for this characteristic than shown at the bottom of the table. All dollar amounts shown in the table are in 2008 dollars.
*/**/*** Treatment-control difference is statistically different from zero at the .10/.05/.01 level using either a two-tailed t-test or a chi-square test.

FINAL REPORT ON THE YTD EVALUATION APPENDIX A: ADDITIONAL ANALYSES
A.16
Table A.1e. Montgomery Co., MD: baseline characteristics of the analytic sample (percentages, unless otherwise noted)
Characteristic All Treatment Control Difference - p-value
Baseline survey data Demographic characteristics - - - - - - Race - - - - - 0.11 White 40.9 43.1 38.6 4.5 - - Black 39.7 40.9 38.3 2.6 - - HI/Pacific/Am Ind/AK 0.7 1.1 0.3 0.8 - - Asian 4.7 4.2 5.2 -1.0 - - Other or unknown 14.0 10.7 17.6 -6.9 - - Hispanic 22.9 22.2 23.8 -1.6 - 0.65 Primarily speaks English at home 85.8 85.8 85.8 0.0 - 1.00 Education - - - - - - School attendance - - - - - 0.61 Does not attend school 22.1 23.8 20.1 3.7 - - Attends regular high school 54.3 54.2 54.4 -0.2 - - Attends special high school 13.5 12.0 15.2 -3.2 - - Attends other school 10.1 9.9 10.3 -0.3 - - Attainment - highest grade - - - - - 0.15 9th grade or less 6.0 5.8 6.3 -0.4 - - 10th or 11th grade 42.3 43.0 41.4 1.6 - - 12th grade 48.6 47.1 50.4 -3.3 - - College or technical school 2.0 3.4 0.4 2.9 - - Other 1.1 0.7 1.5 -0.8 - - HS diploma, GED, or certificate of completion 19.1 18.5 19.7 -1.1 - 0.73 Ever received special education 73.2 74.5 71.9 2.7 - 0.48 Employment - - - - - - Received job training in last year 36.5 34.5 38.6 -4.1 - 0.31 Worked as a volunteer in last year 14.9 14.5 15.4 -0.9 - 0.76 Worked for pay in last year 56.9 59.7 53.9 5.8 - 0.16 Worked for pay in last month 27.8 28.3 27.3 1.0 - 0.79 Never worked for pay at baseline 25.7 25.9 25.5 0.5 - 0.90 Living arrangements and household composition - - - - - - Living arrangements - - - - - 0.32 Two-parent family 45.1 46.2 44.0 2.2 - - Single-parent family 43.8 40.6 47.2 -6.7 - - Group home 1.6 1.6 1.5 0.1 - - Other institution 5.0 6.4 3.5 2.9 - - Lives alone or with friends 4.5 5.2 3.8 1.4 - - Average number of people in household 4.0 4.1 4.0 0.1 - 0.69 Lives with others with disabilities 27.6 29.0 26.3 2.7 - 0.49 Health insurance coverage - - - - - - Covered by public health insurance 47.6 48.4 46.7 1.6 - 0.70 Covered by private health insurance 51.1 49.9 52.4 -2.5 - 0.56 Covered by both public and private health ins. 6.6 6.7 6.5 0.2 - 0.93 Covered by public or private health insurance 91.0 90.9 91.0 -0.1 - 0.97 Family socio-economic status - - - - - - Annual income level - - - - - 0.95 Less than $10,000 18.3 18.2 18.5 -0.3 - - $10,000 - $24,999 16.6 16.1 17.0 -0.9 - - $25,000 or more 65.1 65.7 64.4 1.3 - - Public assistance - - - - - - TANF/family assistance 3.2 2.3 4.2 -1.9 - 0.20 SNAP (food stamps) 19.3 20.3 18.3 1.9 - 0.57 Parents' education - - - - - - Mother HS graduate 79.1 77.6 80.6 -2.9 - 0.40 Father HS graduate 75.1 78.2 71.8 6.4 - 0.12 Parents' employment status - - - - - - Mother currently employed 70.4 68.5 72.4 -3.9 - 0.32 Father currently employed 76.9 76.8 77.0 -0.2 - 0.96 Self-reported health status - - - - - 0.30 Excellent 27.3 25.6 29.2 -3.6 - - Very good/good 61.2 64.1 58.0 6.2 - - Fair/poor 11.5 10.3 12.9 -2.6 - -

FINAL REPORT ON THE YTD EVALUATION APPENDIX A: ADDITIONAL ANALYSES
TABLE A.1e (CONTINUED)
A.17
Characteristic All Treatment Control Difference - p-value Assistance - - - - - - Reading, hearing, speaking, or walking aids 5.4 6.5 4.1 2.4 - 0.22 Help with personal care needs 2.0 1.4 2.7 -1.3 - 0.27 Independent activities - - - - - - Decide by selves how to spend money 95.3 96.7 93.7 2.9 - 0.10 Pick clothes to wear 98.7 98.4 99.1 -0.6 - 0.49 Make snacks or sandwiches 96.8 96.7 97.0 -0.3 - 0.85 Ride public transportation alone 81.7 83.5 79.8 3.7 - 0.26 Decide how to spend free time 98.0 97.6 98.3 -0.7 - 0.54 Expectations about the future - - - - - - Expects to live independently (w/ or w/o help) 79.4 79.4 79.4 -0.1 - 0.99 Expects to continue education 94.8 94.6 95.0 -0.5 - 0.80 Expects to work at least part-time for pay 97.9 98.2 97.5 0.7 - 0.58 Random assignment cohort - - - - - - Randomly assigned before October 1, 2009 49.1 49.7 48.5 1.3 - 0.77
Administrative data Demographic characteristics - - - - - - Male 67.7 68.1 67.2 0.8 - 0.83 Age (in years) - - - - - 0.32 15-17 45.4 46.0 44.8 1.2 - - 18-21 53.2 52.0 54.6 -2.6 - - 22-23 1.4 2.1 0.6 1.4 - - Average age (in years) 17.7 17.7 17.7 -0.1 - 0.59 Benefits - - - - - - Received SSA benefits in prior year 21.2 20.9 21.6 -0.6 - 0.85 Benefit amount in prior year ($) 1,301 1,186 1,436 -251 - 0.32 Earnings - - - - - - Earnings in prior year ($) 1,046 1,322 725 597 - 0.16 Sample size 595 320 275 - - -
Sources: YTD baseline survey and SSA administrative records. Notes: Baseline survey item non-response may have resulted in smaller sample sizes for some characteristics than indicated at
the bottom of the table. Missing information on primary disabling condition resulted in a smaller sample size for this characteristic than shown at the bottom of the table. All dollar amounts shown in the table are in 2008 dollars.
*/**/*** Treatment-control difference is statistically different from zero at the .10/.05/.01 level using either a two-tailed t-test or a chi-square test.

FINAL REPORT ON THE YTD EVALUATION APPENDIX A: ADDITIONAL ANALYSES
A.18
Table A.1f. West Virginia: baseline characteristics of the analytic sample (percentages, unless otherwise noted)
Characteristic All Treatment Control Difference - p-value
Baseline survey data Demographic characteristics - - - - - - Race - - - - - 0.82 White 79.6 79.7 79.4 0.3 - - Black 9.0 8.9 9.2 -0.3 - - HI/Pacific/Am Ind/AK 3.4 2.9 4.0 -1.1 - - Asian - - - - - - Other or unknown 8.0 8.6 7.4 1.1 - Hispanic 2.9 3.3 2.4 0.9 - 0.51 Primarily speaks English at home 98.2 97.9 98.5 -0.6 - 0.55 Education - - - - - - School attendance - - - - ** 0.04 Does not attend school 62.9 64.7 61.0 3.7 - - Attends regular high school 25.9 27.4 24.1 3.3 - - Attends special high school 0.5 0.0 1.0 -1.0 - - Attends other school 10.7 7.9 13.9 -6.0 - - Attainment - highest grade - - - - - 0.66 9th grade or less 15.4 14.4 16.6 -2.2 - - 10th or 11th grade 28.5 27.4 29.8 -2.4 - - 12th grade 48.0 50.7 44.7 6.0 - - College or technical school 3.8 3.7 3.9 -0.1 - - Other 4.4 3.8 5.1 -1.3 - - HS diploma, GED, or certificate of completion 47.6 48.6 46.4 2.2 - 0.57 Ever received special education 73.6 74.0 73.1 0.9 - 0.79 Employment - - - - - - Received job training in last year 27.9 28.0 27.7 0.3 - 0.92 Worked as a volunteer in last year 10.6 11.4 9.6 1.8 - 0.46 Worked for pay in last year 28.5 28.1 28.9 -0.9 - 0.81 Worked for pay in last month 12.9 13.6 12.1 1.5 - 0.56 Never worked for pay at baseline 45.1 46.5 43.5 3.0 0.44 Living arrangements and household composition - - - - - - Living arrangements - - - - - 0.84 Two-parent family 45.0 45.8 44.2 1.6 - - Single-parent family 34.4 34.2 34.5 -0.3 - - Group home 0.3 0.0 0.6 -0.6 - - Other institution 0.7 0.8 0.6 0.2 - - Lives alone or with friends 19.6 19.2 20.0 -0.9 - - Average number of people in household 3.6 3.6 3.6 0.0 - 1.00 Lives with others with disabilities 45.8 45.2 46.4 -1.2 - 0.77 Health insurance coverage - - - - - - Covered by public health insurance 93.3 92.0 94.8 -2.9 - 0.14 Covered by private health insurance 16.5 15.8 17.4 -1.7 - 0.57 Covered by both public and private health ins. 14.3 13.1 15.7 -2.6 - 0.34 Covered by public or private health insurance 95.4 94.6 96.3 -1.7 - 0.30 Family socio-economic status - - - - - - Annual income level - - - - - 0.49 Less than $10,000 36.8 34.7 39.2 -4.6 - - $10,000 - $24,999 33.6 35.3 31.7 3.7 - - $25,000 or more 29.6 30.0 29.1 0.9 - - Public assistance - - - - - - TANF/family assistance 7.3 6.8 7.9 -1.1 - 0.59 SNAP (food stamps) 42.9 42.9 43.0 -0.1 - 0.99 Parents' education - - - - - - Mother HS graduate 67.9 67.0 68.9 -1.9 - 0.62 Father HS graduate 65.0 67.5 62.3 5.2 - 0.21 Parents' employment status - - - - - - Mother currently employed 38.2 40.4 35.7 4.7 - 0.24 Father currently employed 57.5 55.6 59.7 -4.1 - 0.36 Self-reported health status - - - - - 0.14 Excellent 14.5 14.3 14.8 -0.5 - - Very good/good 58.2 55.2 61.6 -6.4 - - Fair/poor 27.3 30.5 23.6 6.9 - -

FINAL REPORT ON THE YTD EVALUATION APPENDIX A: ADDITIONAL ANALYSES
TABLE A.1f (CONTINUED)
A.19
Characteristic All Treatment Control Difference - p-value Assistance - - - - - - Reading, hearing, speaking, or walking aids 18.7 16.1 21.6 -5.5 * 0.07 Help with personal care needs 15.0 15.4 14.6 0.8 - 0.77 Independent activities - - - - - - Decide by selves how to spend money 85.7 86.1 85.3 0.7 - 0.79 Pick clothes to wear 96.0 94.7 97.5 -2.8 * 0.07 Make snacks or sandwiches 92.5 93.0 92.0 1.0 - 0.61 Ride public transportation alone 43.6 44.1 43.0 1.1 - 0.77 Decide how to spend free time 94.3 94.2 94.3 -0.1 - 0.95 Expectations about the future - - - - - - Expects to live independently (w/ or w/o help) 71.1 70.3 72.0 -1.7 - 0.66 Expects to continue education 65.7 64.6 67.0 -2.4 - 0.56 Expects to work at least part-time for pay 80.4 78.1 83.1 -5.0 - 0.14 Random assignment cohort - - - - - - Randomly assigned before June 1, 2009 50.1 50.8 49.3 1.5 - 0.69 Location within a YTD project's service delivery area - - - - - 0.97 WV region 1 (North) 48.6 49.6 47.3 2.3 - 0.55
Administrative data Demographic characteristics - - - - - - Male 57.0 57.8 56.2 1.7 - 0.67 Age (in years) - - - - - 0.82 14-17 18.9 18.6 19.4 -0.8 - 18-21 41.5 42.7 40.2 2.4 - 22-25 39.5 38.8 40.4 -1.6 - Average age (in years) 20.5 20.4 20.6 -0.1 - 0.54 Language - - - - - 0.86 English 98.0 98.1 97.9 0.2 - Spanish - - - - - - Other - - - - - - Unknown/missing 2.0 1.9 2.1 -0.2 - - Benefits - - - - - - Representative payee type - - - - - 0.42 None 27.2 27.8 26.6 1.1 - - Natural/adoptive/step parent 56.6 55.1 58.3 -3.2 - - Other relative 9.1 10.7 7.3 3.4 - - Other 7.1 6.5 7.8 -1.3 - - SSA beneficiary status - - - - - - SSI (only or concurrent with CDB or DI) 94.2 94.5 93.7 0.8 - 0.67 Received SSA benefits in prior year 95.5 96.0 94.9 1.1 - 0.51 Duration of benefit entitlement (in years) 8.0 8.0 8.0 0.0 - 0.93 Benefit amount in prior year ($) 6,466 6,501 6,426 75 - 0.69 Health status - - - - - - Primary disabling condition (SSA data) - - - - - 0.99 Mental illness 24.5 24.0 25.1 -1.1 - - Cognitive/developmental disability 41.3 41.1 41.4 -0.3 - - Learning disability/ADD 13.1 13.6 12.4 1.2 - - Physical disability 16.9 17.1 16.8 0.3 - - Speech, hearing, visual impairment 4.2 4.2 4.3 -0.1 - - Duration of disability (in years) 8.3 8.4 8.3 0.1 - 0.82 Earnings - - - - - - Earnings in prior year ($) 725 681 777 -96 - 0.58 Sample size 676 365 311 - -
Sources: YTD baseline survey and SSA administrative records. Notes: Baseline survey item non-response may have resulted in smaller sample sizes for some characteristics than indicated at
the bottom of the table. Missing information on primary disabling condition resulted in a smaller sample size for this characteristic than shown at the bottom of the table. All dollar amounts shown in the table are in 2008 dollars.
*/**/*** Treatment-control difference is statistically different from zero at the .10/.05/.01 level using either a two-tailed t-test or a chi-square test.
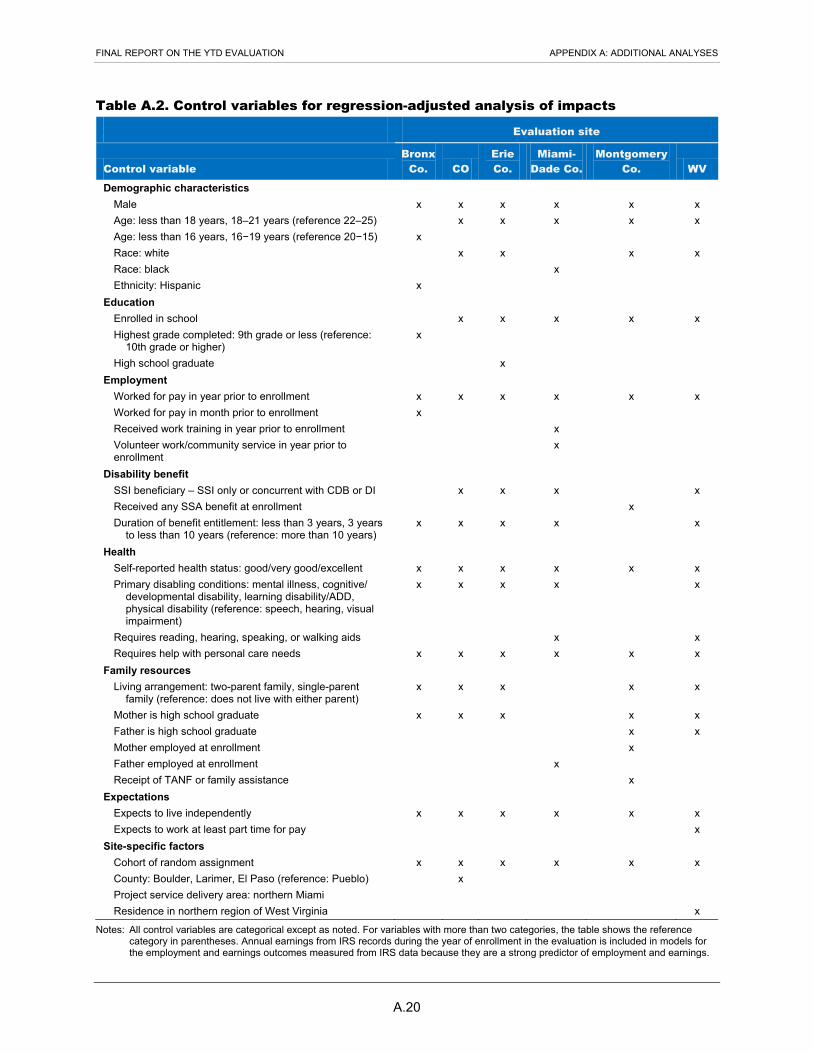
FINAL REPORT ON THE YTD EVALUATION APPENDIX A: ADDITIONAL ANALYSES
A.20
Table A.2. Control variables for regression-adjusted analysis of impacts
- Evaluation site
Control variable Bronx
Co. CO Erie Co.
Miami-Dade Co.
Montgomery Co. WV
Demographic characteristics - - - - - - Male x x x x x x Age: less than 18 years, 18–21 years (reference 22–25) - x x x x x Age: less than 16 years, 16−19 years (reference 20−15) x - - - - - Race: white - x x - x x Race: black - - - x - - Ethnicity: Hispanic x - - - - -
Education - - - - - - Enrolled in school - x x x x x Highest grade completed: 9th grade or less (reference:
10th grade or higher) x - - - - -
High school graduate - - x - - - Employment - - - - - -
Worked for pay in year prior to enrollment x x x x x x Worked for pay in month prior to enrollment x - - - - - Received work training in year prior to enrollment - - - x - - Volunteer work/community service in year prior to enrollment
- - - x - -
Disability benefit - - - - - - SSI beneficiary – SSI only or concurrent with CDB or DI - x x x - x Received any SSA benefit at enrollment - - - - x - Duration of benefit entitlement: less than 3 years, 3 years
to less than 10 years (reference: more than 10 years) x x x x - x
Health - - - - - - Self-reported health status: good/very good/excellent x x x x x x Primary disabling conditions: mental illness, cognitive/
developmental disability, learning disability/ADD, physical disability (reference: speech, hearing, visual impairment)
x x x x - x
Requires reading, hearing, speaking, or walking aids - - - x - x Requires help with personal care needs x x x x x x
Family resources - - - - - - Living arrangement: two-parent family, single-parent
family (reference: does not live with either parent) x x x - x x
Mother is high school graduate x x x - x x Father is high school graduate - - - - x x Mother employed at enrollment - - - - x - Father employed at enrollment - - - x - - Receipt of TANF or family assistance - - - - x -
Expectations - - - - - - Expects to live independently x x x x x x Expects to work at least part time for pay - - - - - x
Site-specific factors - - - - - - Cohort of random assignment x x x x x x County: Boulder, Larimer, El Paso (reference: Pueblo) - x - - - - Project service delivery area: northern Miami - - - x - - Residence in northern region of West Virginia - - - - - x
Notes: All control variables are categorical except as noted. For variables with more than two categories, the table shows the reference category in parentheses. Annual earnings from IRS records during the year of enrollment in the evaluation is included in models for the employment and earnings outcomes measured from IRS data because they are a strong predictor of employment and earnings.
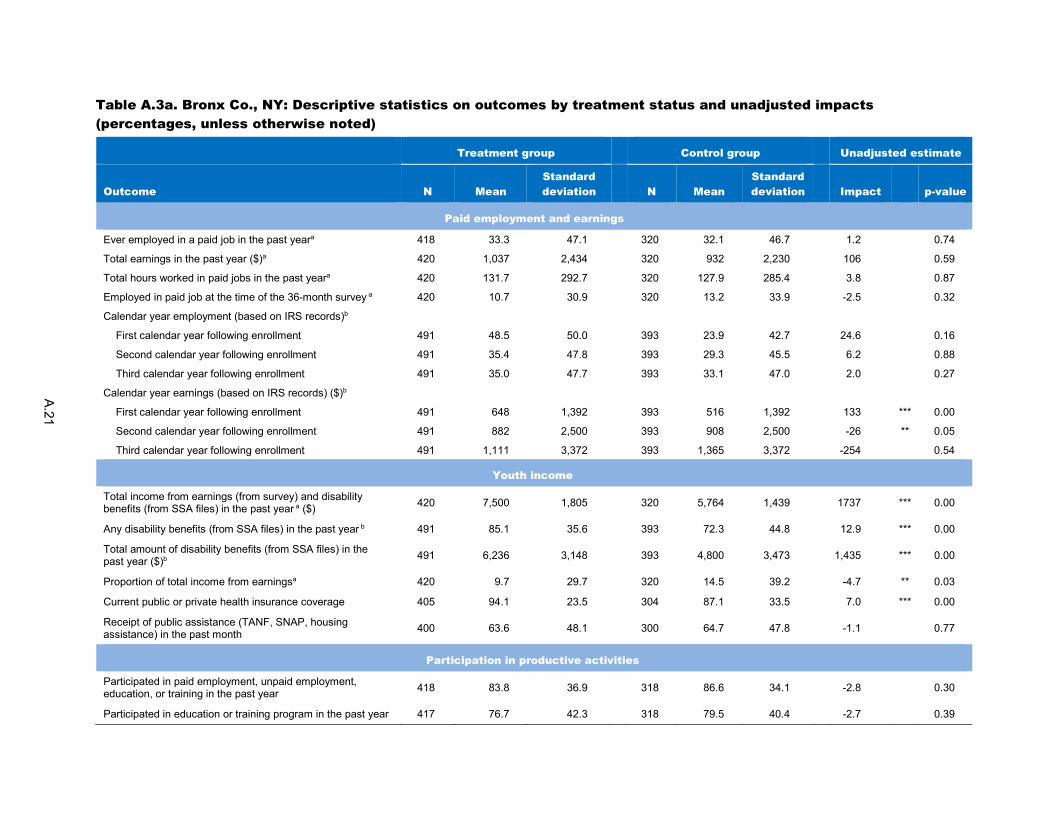
A.21
Table A.3a. Bronx Co., NY: Descriptive statistics on outcomes by treatment status and unadjusted impacts (percentages, unless otherwise noted)
- Treatment group - Control group - Unadjusted estimate
Outcome N Mean Standard deviation - N Mean
Standard deviation - Impact - p-value
Paid employment and earnings
Ever employed in a paid job in the past yeara 418 33.3 47.1 - 320 32.1 46.7 - 1.2 - 0.74
Total earnings in the past year ($)a 420 1,037 2,434 - 320 932 2,230 - 106 - 0.59
Total hours worked in paid jobs in the past yeara 420 131.7 292.7 - 320 127.9 285.4 - 3.8 - 0.87
Employed in paid job at the time of the 36-month survey a 420 10.7 30.9 - 320 13.2 33.9 - -2.5 - 0.32
Calendar year employment (based on IRS records)b - - - - - - - - - - -
First calendar year following enrollment 491 48.5 50.0 - 393 23.9 42.7 - 24.6 - 0.16
Second calendar year following enrollment 491 35.4 47.8 - 393 29.3 45.5 - 6.2 - 0.88
Third calendar year following enrollment 491 35.0 47.7 - 393 33.1 47.0 - 2.0 - 0.27
Calendar year earnings (based on IRS records) ($)b - - - - - - - - - - -
First calendar year following enrollment 491 648 1,392 - 393 516 1,392 - 133 *** 0.00
Second calendar year following enrollment 491 882 2,500 - 393 908 2,500 - -26 ** 0.05
Third calendar year following enrollment 491 1,111 3,372 - 393 1,365 3,372 - -254 - 0.54
Youth income
Total income from earnings (from survey) and disability benefits (from SSA files) in the past year a ($) 420 7,500 1,805 - 320 5,764 1,439 - 1737 *** 0.00
Any disability benefits (from SSA files) in the past year b 491 85.1 35.6 - 393 72.3 44.8 - 12.9 *** 0.00
Total amount of disability benefits (from SSA files) in the past year ($)b 491 6,236 3,148 - 393 4,800 3,473 - 1,435 *** 0.00
Proportion of total income from earningsa 420 9.7 29.7 - 320 14.5 39.2 - -4.7 ** 0.03
Current public or private health insurance coverage 405 94.1 23.5 - 304 87.1 33.5 - 7.0 *** 0.00
Receipt of public assistance (TANF, SNAP, housing assistance) in the past month 400 63.6 48.1 - 300 64.7 47.8 - -1.1 - 0.77
Participation in productive activities
Participated in paid employment, unpaid employment, education, or training in the past year 418 83.8 36.9 - 318 86.6 34.1 - -2.8 - 0.30
Participated in education or training program in the past year 417 76.7 42.3 - 318 79.5 40.4 - -2.7 - 0.39

TABLE A.3a (CONTINUED)
A.22
- Treatment group - Control group - Unadjusted estimate
Outcome N Mean Standard deviation - N Mean
Standard deviation - Impact - p-value
Completed high school (attained high school diploma/GED/ certificate or higher) by the time of the 36-month survey 420 37.2 48.3 - 320 36.0 48.0 - 1.2 - 0.74
Ever enrolled in college or technical school 309 9.3 29.0 - 224 6.8 25.2 - 2.5 - 0.31
Contact with the justice system
Arrested or charged with delinquency or a criminal complaint in the past yeara 411 4.0 19.5 - 309 7.9 26.9 - -3.9 ** 0.03
Type of most recent charge during the past year 411 - - - 309 - - - - * 0.08
No arrest or criminal or delinquent charge - 96.2 - - - 92.6 - - 3.6 - -
Violent crime - 0.7 - - - 2.3 - - -1.6 - -
Property crime - 0.7 - - - 0.0 - - 0.7 - -
Drug-related crime - 1.0 - - - 0.6 - - 0.4 - -
Other crime - 1.4 - - - 3.5 - - -2.1 - -
Multiple crimes - 0.0 - - - 1.0 - - -1.0 - -
Currently incarcerated (in jail, prison, or detention home) a 413 0.5 7.3 - 310 1.7 13.0 - -1.2 - 0.24
Currently on probation or parolea 413 0.8 9.0 - 309 1.1 10.6 - -0.3 - 0.73
Since enrollment in the evaluation: - - - - - - - - - - -
Ever arrested or charged with delinquency or a criminal complaint 411 7.6 26.4 - 309 10.3 30.4 - -2.8 - 0.20
Ever convicted of or pled guilty to a chargea 411 6.0 23.7 - 309 7.6 26.5 - -1.6 - 0.43
Ever incarcerated (in jail, prison, or detention home) a 413 0.6 7.6 - 310 1.9 13.7 - -1.3 - 0.21
Ever on probation or parolea 413 1.4 11.7 - 309 2.0 13.9 - -0.6 - 0.62
Self-determination
Index of self-determinationa (4-point scale) 343 2.8 0.5 - 253 2.9 0.5 - 0.0 - 0.37
Subindices of self-determination (4-point scales) - - - - - - - - - - -
Index of autonomya 353 2.7 0.7 - 255 2.8 0.7 - 0.0 - 0.51
Index of internal locus of controla 347 3.2 0.7 - 253 3.2 0.6 - -0.1 - 0.19
Index of external locus of controla 346 2.6 0.8 - 253 2.6 0.8 - 0.0 - 0.69
Future independencea (%) 348 83.7 37.0 - 253 87.0 33.6 - -3.3 - 0.26

TABLE A.3a (CONTINUED)
A.23
- Treatment group - Control group - Unadjusted estimate
Outcome N Mean Standard deviation - N Mean
Standard deviation - Impact - p-value
Living arrangement (%) 405 - - - 308 - - - - - 0.44
Independently, without help - 2.8 - - - 3.5 - - -0.7 - -
With parents or guardians, without help - 59.9 - - - 60.0 - - -0.1 - -
Independently or with parents or guardians, with help - 35.5 - - - 33.0 - - 2.5 - -
Institutional setting or homeless - 1.8 - - - 3.6 - - -1.8 - -
Analytic sample size 420 - - - 320 - - - - - -
Research sample size 491 - - - 393 - - - - -
Source: YTD 36-month survey. Notes: We weighted the statistics to adjust for non-response to the 36-month survey. All dollar amounts shown in the table are in 2008 dollars. a Indicates outcome measures for which we used a multiple imputation procedure for missing information. See Section D of this appendix for more information on this procedure. b Indicates outcomes based on SSA administrative records. For all outcomes from administrative records, we used the full research sample and did not weight to adjust for non-response to the 36-month survey. */**/*** Impact estimate is significantly different from zero at the .10/.05/.01 level using a two-tailed t-test or a chi-square test.

A.24
Table A.3b. Colorado: Descriptive statistics on outcomes by treatment status and unadjusted impacts (percentages, unless otherwise noted)
- Treatment group - Control group - Unadjusted estimate
Outcome N Mean Standard deviation - N Mean
Standard deviation - Impact - p-value
Paid employment and earnings
Ever employed in a paid job in the past yeara 402 39.3 48.8 - 324 35.9 48.0 - 3.4 - 0.36
Total earnings in the past year ($)a 403 2,117 4,393 - 324 1,925 4,116 - 192 - 0.56
Total hours worked in paid jobs in the past yeara 403 273.4 499.8 - 324 262.7 545.9 - 10.8 - 0.79
Employed in paid job at the time of the 36-month survey a 403 26.3 44.0 - 324 24.8 43.2 - 1.5 - 0.66
Calendar year employment (based on IRS records)b - - - - - - - - - - -
First calendar year following enrollment 462 40.0 49.0 - 380 36.8 48.2 - 3.2 - 0.34
Second calendar year following enrollment 462 44.6 49.7 - 380 35.5 47.9 - 9.1 *** 0.01
Third calendar year following enrollment 462 38.3 48.6 - 380 33.7 47.3 - 4.6 - 0.16
Calendar year earnings (based on IRS records) ($)b - - - - - - - - - - -
First calendar year following enrollment 462 1,572 3,579 - 380 1,411 3,579 - 161 - 0.52
Second calendar year following enrollment 462 1,855 4,119 - 380 1,511 4,119 - 343 - 0.23
Third calendar year following enrollment 462 1,855 4,510 - 380 1,644 4,510 - 211 - 0.50
Youth income
Total income from earnings (from survey) and disability benefits (from SSA files) in the past year a ($) 403 9,016 3,043 - 324 8,594 3,883 - 422 - 0.21
Any disability benefits (from SSA files) in the past year b 462 92.6 26.1 - 380 90.3 29.7 - 2.4 - 0.22
Total amount of disability benefits (from SSA files) in the past year ($)b
462 6,855 3,039 - 380 6,536 3,069 - 320 - 0.13
Proportion of total income from earningsa 403 15.3 36.0 - 324 14.9 35.6 - 0.4 - 0.84
Current public or private health insurance coverage 389 94.4 22.9 - 317 94.2 23.5 - 0.3 - 0.88
Receipt of public assistance (TANF, SNAP, housing assistance) in the past month 384 34.2 47.4 - 313 43.0 49.5 - -8.8 ** 0.02
Participation in productive activities
Participated in paid employment, unpaid employment, education, or training in the past year 401 66.3 47.3 - 323 65.8 47.4 - 0.6 - 0.88
Participated in education or training program in the past year 402 40.4 49.1 - 323 43.0 49.5 - -2.6 - 0.49

TABLE A.3b (CONTINUED)
A.25
- Treatment group - Control group - Unadjusted estimate
Outcome N Mean Standard deviation - N Mean
Standard deviation - Impact - p-value
Completed high school (attained high school diploma/GED/ certificate or higher) by the time of the 36-month survey
401 70.8 45.5 - 324 67.0 47.0 - 3.8 - 0.28
Ever enrolled in college or technical school 359 13.2 33.8 - 286 13.5 34.2 - -0.3 - 0.92
Contact with the justice system
Arrested or charged with delinquency or a criminal complaint in the past yeara 393 3.6 18.6 - 318 1.4 11.7 - 2.2 - 0.10
Type of most recent charge during the past year 393 - - - 318 - - - - - 0.69
No arrest or criminal or delinquent charge - 97.2 - - - 98.6 - - -1.5 - -
Violent crime - 0.3 - - - 0.4 - - -0.1 - -
Property crime - 0.8 - - - 0.0 - - 0.8 - -
Drug-related crime - 0.0 - - - 0.0 - - 0.0 - -
Other crime - 1.5 - - - 0.7 - - 0.8 - -
Multiple crimes - 0.3 - - - 0.3 - - 0.0 - -
Currently incarcerated (in jail, prison, or detention home) a 394 2.2 14.5 - 318 0.7 8.6 - 1.4 - 0.21
Currently on probation or parolea 393 1.2 11.0 - 318 2.8 16.4 - -1.5 - 0.17
Since enrollment in the evaluation: - - - - - - - - - - -
Ever arrested or charged with delinquency or a criminal complaint
393 8.6 28.0 - 318 6.8 25.1 - 1.8 - 0.38
Ever convicted of or pled guilty to a chargea 393 8.9 28.5 - 318 7.1 25.7 - 1.8 - 0.43
Ever incarcerated (in jail, prison, or detention home) a 394 2.7 16.3 - 318 1.0 10.0 - 1.7 - 0.19
Ever on probation or parolea 394 3.0 17.0 - 318 5.0 21.8 - -2.0 - 0.22
Self-determination
Index of self-determinationa (4-point scale) 275 2.9 0.0 - 228 2.9 0.0 - 0.0 - 0.85
Subindices of self-determination (4-point scales) - - - - - - - - - - -
Index of autonomya 278 2.9 0.0 - 232 2.9 0.0 - 0.0 - 0.72
Index of internal locus of controla 277 3.2 0.0 - 230 3.2 0.0 - 0.0 - 0.80
Index of external locus of controla 279 2.7 0.0 - 231 2.7 0.0 - -0.1 - 0.35
Future independencea (%) 277 85.2 35.5 - 233 80.0 40.0 - 5.2 - 0.13

TABLE A.3b (CONTINUED)
A.26
- Treatment group - Control group - Unadjusted estimate
Outcome N Mean Standard deviation - N Mean
Standard deviation - Impact - p-value
Living arrangement (%) 391 - - - 315 - - - - - 0.11
Independently, without help - 15.3 - - - 16.4 - - -1.1 - -
With parents or guardians, without help - 45.5 - - - 39.0 - - 6.5 - -
Independently or with parents or guardians, with help - 30.4 - - - 38.2 - - -7.7 - -
Institutional setting or homeless - 8.7 - - - 6.4 - - 2.4 - -
Analytic sample size 403 - - - 324 - - - - - -
Research sample size 462 - - - 380 - - - - - -
Source: YTD 36-month survey. Notes: We weighted the statistics to adjust for non-response to the 36-month survey. All dollar amounts shown in the table are in 2008 dollars. a Indicates outcome measures for which we used a multiple imputation procedure for missing information. See Section D of this appendix for more information on this procedure. b Indicates outcomes based on SSA administrative records. For all outcomes from administrative records, we used the full research sample and did not weight to adjust for non-response to the 36-month survey. */**/*** Impact estimate is significantly different from zero at the .10/.05/.01 level using a two-tailed t-test or a chi-square test.
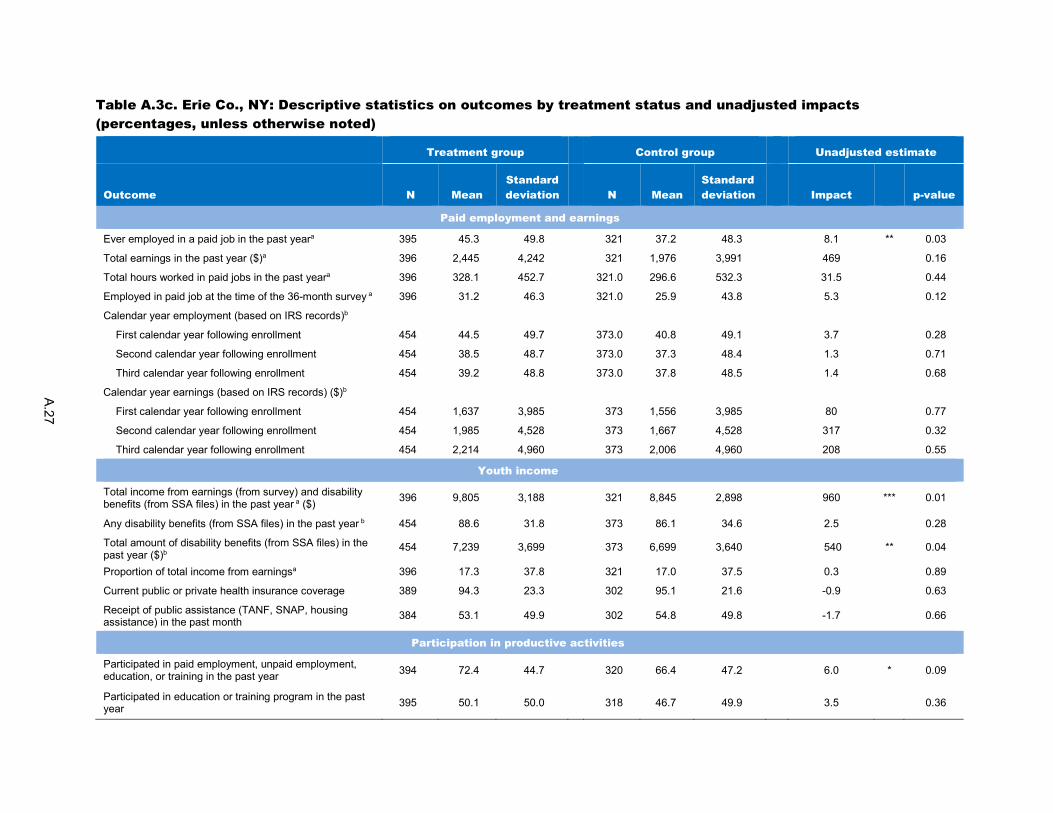
A.27
Table A.3c. Erie Co., NY: Descriptive statistics on outcomes by treatment status and unadjusted impacts (percentages, unless otherwise noted)
- Treatment group - Control group -- Unadjusted estimate
Outcome N Mean Standard deviation - N Mean
Standard deviation -- Impact - p-value
Paid employment and earnings
Ever employed in a paid job in the past yeara 395 45.3 49.8 - 321 37.2 48.3 - 8.1 ** 0.03
Total earnings in the past year ($)a 396 2,445 4,242 - 321 1,976 3,991 - 469 - 0.16
Total hours worked in paid jobs in the past yeara 396 328.1 452.7 - 321.0 296.6 532.3 - 31.5 - 0.44
Employed in paid job at the time of the 36-month survey a 396 31.2 46.3 - 321.0 25.9 43.8 - 5.3 - 0.12
Calendar year employment (based on IRS records)b - - - - - - - - - - -
First calendar year following enrollment 454 44.5 49.7 - 373.0 40.8 49.1 - 3.7 - 0.28
Second calendar year following enrollment 454 38.5 48.7 - 373.0 37.3 48.4 - 1.3 - 0.71
Third calendar year following enrollment 454 39.2 48.8 - 373.0 37.8 48.5 - 1.4 - 0.68
Calendar year earnings (based on IRS records) ($)b - - - - - - - - - - -
First calendar year following enrollment 454 1,637 3,985 - 373 1,556 3,985 - 80 - 0.77
Second calendar year following enrollment 454 1,985 4,528 - 373 1,667 4,528 - 317 - 0.32
Third calendar year following enrollment 454 2,214 4,960 - 373 2,006 4,960 - 208 - 0.55
Youth income
Total income from earnings (from survey) and disability benefits (from SSA files) in the past year a ($) 396 9,805 3,188 - 321 8,845 2,898 - 960 *** 0.01
Any disability benefits (from SSA files) in the past year b 454 88.6 31.8 - 373 86.1 34.6 - 2.5 - 0.28
Total amount of disability benefits (from SSA files) in the past year ($)b
454 7,239 3,699 - 373 6,699 3,640 - 540 ** 0.04
Proportion of total income from earningsa 396 17.3 37.8 - 321 17.0 37.5 - 0.3 - 0.89
Current public or private health insurance coverage 389 94.3 23.3 - 302 95.1 21.6 - -0.9 - 0.63
Receipt of public assistance (TANF, SNAP, housing assistance) in the past month 384 53.1 49.9 - 302 54.8 49.8 - -1.7 - 0.66
Participation in productive activities
Participated in paid employment, unpaid employment, education, or training in the past year 394 72.4 44.7 - 320 66.4 47.2 - 6.0 * 0.09
Participated in education or training program in the past year 395 50.1 50.0 - 318 46.7 49.9 - 3.5 - 0.36

TABLE A.3c (CONTINUED)
A.28
- Treatment group - Control group -- Unadjusted estimate
Outcome N Mean Standard deviation - N Mean
Standard deviation -- Impact - p-value
Completed high school (attained high school diploma/GED/ certificate or higher) by the time of the 36-month survey
395 61.0 48.8 - 321 64.1 48.0 - -3.1 - 0.40
Ever enrolled in college or technical school 374 15.2 35.9 - 302 14.4 35.1 - 0.9 - 0.75
Contact with the justice system
Arrested or charged with delinquency or a criminal complaint in the past yeara 390 3.8 19.2 - 310 4.5 20.8 - -0.7 - 0.68
Type of most recent charge during the past year 390 - - - 310.0 - - - - - 0.43
No arrest or criminal or delinquent charge - 96.5 - - - 95.6 - - 0.90 - -
Violent crime - 1.3 - - - 0.3 - - 1.00 - -
Property crime - 0.6 - - - 1.1 - - -0.50 - -
Drug-related crime - 0.0 - - - 0.6 - - -0.60 - -
Other crime - 1.0 - - - 1.0 - - 0.00 - -
Multiple crimes - 0.6 - - - 1.5 - - -0.90 - -
Currently incarcerated (in jail, prison, or detention home) a 391 1.7 13.1 - 310 0.5 6.8 - 1.3 - 0.23
Currently on probation or parolea 391 1.4 11.9 - 310 0.3 5.6 - 1.1 * 0.09
Since enrollment in the evaluation: - - - - - - - - - - -
Ever arrested or charged with delinquency or a criminal complaint
390 10.6 30.8 - 310 7.1 25.7 - 3.47 - 0.12
Ever convicted of or pled guilty to a chargea 390 8.6 28.1 - 310 5.2 22.1 - 3.5 - 0.12
Ever incarcerated (in jail, prison, or detention home) a 391 2.0 13.9 - 310 2.2 14.6 - -0.2 - 0.86
Ever on probation or parolea 391 2.2 14.6 - 310 1.5 12.0 - 0.7 - 0.51
Self-determination
Index of self-determinationa (4-point scale) 303 3.0 0.5 - 227 2.9 0.5 - 0.0 - 0.39
Subindices of self-determination (4-point scales) - - - - - - - - - - -
Index of autonomya 305 3.0 0.6 - 229 2.9 0.6 - 0.0 - 0.43
Index of internal locus of controla 304 3.2 0.7 - 230 3.2 0.7 - 0.0 - 0.60
Index of external locus of controla 305 2.7 0.8 - 230 2.6 0.8 - 0.0 - 0.45
Future independencea (%) 303 85.6 35.1 - 231 85.3 35.4 - 0.3 - 0.92

TABLE A.3c (CONTINUED)
A.29
- Treatment group - Control group -- Unadjusted estimate
Outcome N Mean Standard deviation - N Mean
Standard deviation -- Impact - p-value
Living arrangement (%) 388 - - - 307 - - - - - 0.44
Independently, without help - 27.9 - - - 28.5 - - -0.6 - -
With parents or guardians, without help - 56.1 - - - 59.8 - - -3.7 - -
Independently or with parents or guardians, with help - 26.6 - - - 24.9 - - 1.7 - -
Institutional setting or homeless - 26.8 - - - 24.2 - - 2.6 - -
Analytic sample size 397 - - - 321 - - - - - -
Research sample size 454 - - - 373 - - - - - -
Source: YTD 36-month survey. Notes: We weighted the statistics to adjust for non-response to the 36-month survey. All dollar amounts shown in the table are in 2008 dollars. a Indicates outcome measures for which we used a multiple imputation procedure for missing information. See Section D of this appendix for more information on this procedure. b Indicates outcomes based on SSA administrative records. For all outcomes from administrative records, we used the full research sample and did not weight to adjust for non-response to the 36-month survey. */**/*** Impact estimate is significantly different from zero at the .10/.05/.01 level using a two-tailed t-test or a chi-square test.

A.30
Table A.3d. Miami-Dade Co., FL: Descriptive statistics on outcomes by treatment status and unadjusted impacts (percentages, unless otherwise noted)
- Treatment group - Control group - Unadjusted estimate
Outcome N Mean Standard deviation - N Mean
Standard deviation - Impact - p-value
Paid employment and earnings
Ever employed in a paid job in the past yeara 373 32.7 46.9 - 309 24.9 43.2 - 7.8 ** 0.03
Total earnings in the past year ($)a 375 1,830 4,108 - 310 1,223 3,396 - 607 ** 0.05
Total hours worked in paid jobs in the past yeara 375 238.0 499.0 - 310.0 170.0 440.3 - 68.0 * 0.07
Employed in paid job at the time of the 36-month survey a 375 17.2 37.7 - 310.0 16.0 36.6 - 1.2 - 0.69
Calendar year employment (based on IRS records)b - - - - - - - - - - -
First calendar year following enrollment 448 30.1 45.9 - 392 23.5 42.4 - 6.7 ** 0.03
Second calendar year following enrollment 448 35.0 47.7 - 392 28.8 45.3 - 6.2 * 0.05
Third calendar year following enrollmentc 371 35.8 48.0 - 324 30.6 46.1 - 5.3 - 0.14
Calendar year earnings (based on IRS records) ($)b - - - - - - - - - - -
First calendar year following enrollment 448 1,371 3,203 - 392 1,080 3,203 - 291 - 0.19
Second calendar year following enrollment 448 1,950 4,107 - 392 1,494 4,107 - 456 - 0.11
Third calendar year following enrollmentc 371 2,385 5,155 - 324 2,105 5,155 - 280 - 0.48
Youth income
Total income from earnings (from survey) and disability benefits (from SSA files) in the past year a ($) 375 7,387 4,584 - 310 6,198 4,241 - 1189 *** 0.00
Any disability benefits (from SSA files) in the past year b 448 77.0 42.1 - 392 67.4 46.9 - 9.7 *** 0.00
Total amount of disability benefits (from SSA files) in the past year ($)b
448 5,337 3,349 - 392 4,645 3,624 - 692 *** 0.00
Proportion of total income from earningsa 375 16.1 36.8 - 310 13.8 34.5 - 2.3 - 0.37
Current public or private health insurance coverage 354 84.1 36.6 - 289 78.3 41.2 - 5.8 * 0.06
Receipt of public assistance (TANF, SNAP, housing assistance) in the past month 350 65.3 47.6 - 295 55.9 49.6 - 9.4 ** 0.02
Participation in productive activities
Participated in paid employment, unpaid employment, education, or training in the past year 370 71.2 45.3 - 308 62.6 48.4 - 8.7 ** 0.02
Participated in education or training program in the past year 371 54.0 49.8 - 308 50.3 50.0 - 3.7 - 0.34
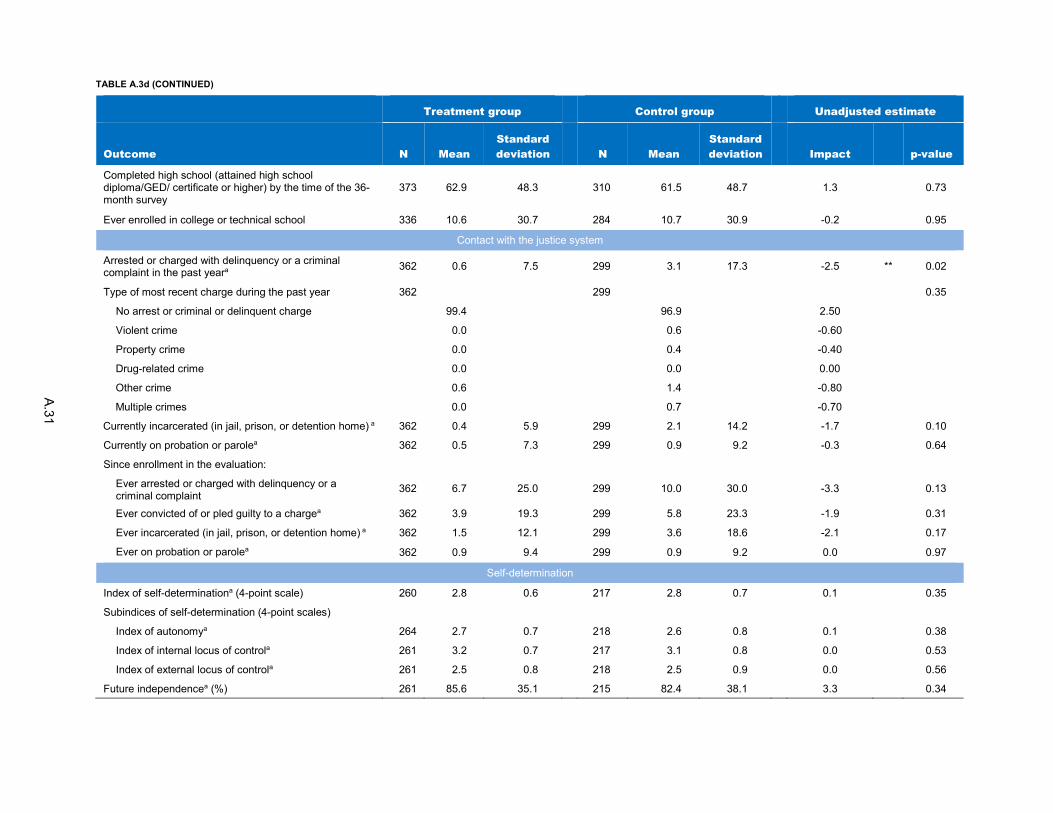
TABLE A.3d (CONTINUED)
A.31
- Treatment group - Control group - Unadjusted estimate
Outcome N Mean Standard deviation - N Mean
Standard deviation - Impact - p-value
Completed high school (attained high school diploma/GED/ certificate or higher) by the time of the 36-month survey
373 62.9 48.3 - 310 61.5 48.7 - 1.3 - 0.73
Ever enrolled in college or technical school 336 10.6 30.7 - 284 10.7 30.9 - -0.2 - 0.95
Contact with the justice system
Arrested or charged with delinquency or a criminal complaint in the past yeara 362 0.6 7.5 - 299 3.1 17.3 - -2.5 ** 0.02
Type of most recent charge during the past year 362 - - - 299 - - - - - 0.35
No arrest or criminal or delinquent charge - 99.4 - - - 96.9 - - 2.50 - -
Violent crime - 0.0 - - - 0.6 - - -0.60 - -
Property crime - 0.0 - - - 0.4 - - -0.40 - -
Drug-related crime - 0.0 - - - 0.0 - - 0.00 - -
Other crime - 0.6 - - - 1.4 - - -0.80 - -
Multiple crimes - 0.0 - - - 0.7 - - -0.70 - -
Currently incarcerated (in jail, prison, or detention home) a 362 0.4 5.9 - 299 2.1 14.2 - -1.7 - 0.10
Currently on probation or parolea 362 0.5 7.3 - 299 0.9 9.2 - -0.3 - 0.64
Since enrollment in the evaluation: - - - - - - - - - - -
Ever arrested or charged with delinquency or a criminal complaint
362 6.7 25.0 - 299 10.0 30.0 - -3.3 - 0.13
Ever convicted of or pled guilty to a chargea 362 3.9 19.3 - 299 5.8 23.3 - -1.9 - 0.31
Ever incarcerated (in jail, prison, or detention home) a 362 1.5 12.1 - 299 3.6 18.6 - -2.1 - 0.17
Ever on probation or parolea 362 0.9 9.4 - 299 0.9 9.2 - 0.0 - 0.97
Self-determination
Index of self-determinationa (4-point scale) 260 2.8 0.6 - 217 2.8 0.7 - 0.1 - 0.35
Subindices of self-determination (4-point scales) - - - - - - - - - - -
Index of autonomya 264 2.7 0.7 - 218 2.6 0.8 - 0.1 - 0.38
Index of internal locus of controla 261 3.2 0.7 - 217 3.1 0.8 - 0.0 - 0.53
Index of external locus of controla 261 2.5 0.8 - 218 2.5 0.9 - 0.0 - 0.56
Future independencea (%) 261 85.6 35.1 - 215 82.4 38.1 - 3.3 - 0.34
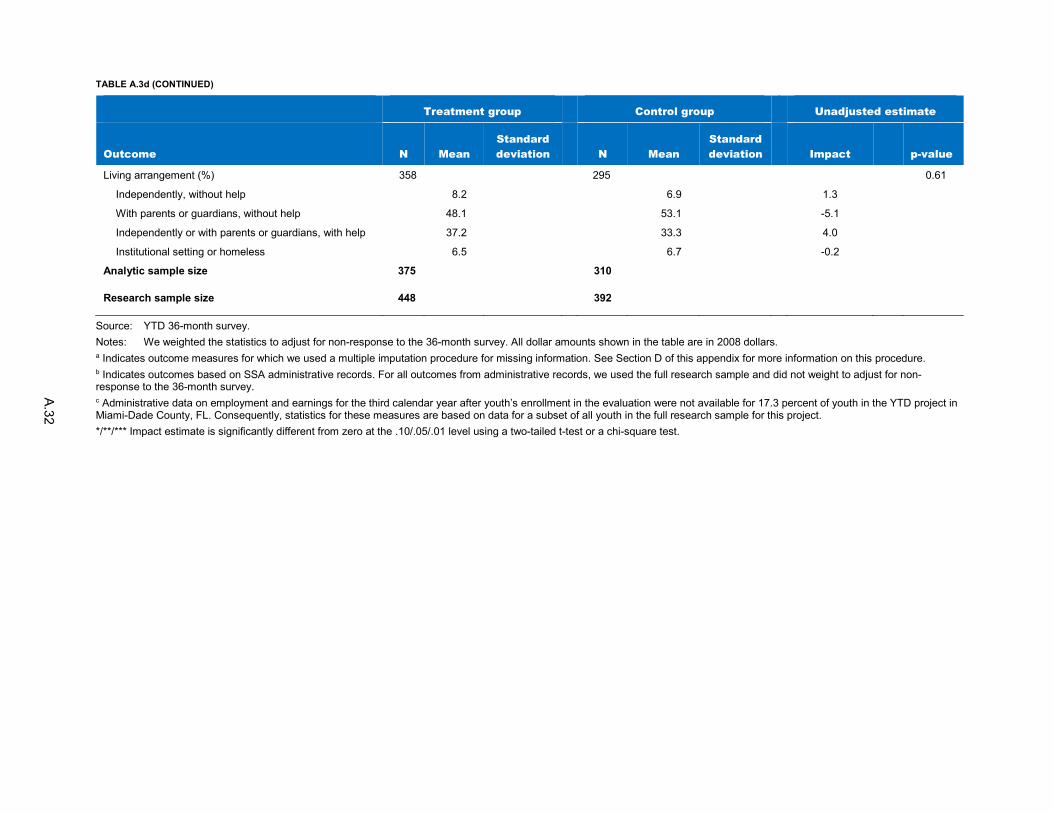
TABLE A.3d (CONTINUED)
A.32
- Treatment group - Control group - Unadjusted estimate
Outcome N Mean Standard deviation - N Mean
Standard deviation - Impact - p-value
Living arrangement (%) 358 - - - 295 - - - - - 0.61
Independently, without help - 8.2 - - - 6.9 - - 1.3 - -
With parents or guardians, without help - 48.1 - - 53.1 - - -5.1 - -
Independently or with parents or guardians, with help - 37.2 - - - 33.3 - - 4.0 - -
Institutional setting or homeless - 6.5 - - - 6.7 - - -0.2 - -
Analytic sample size 375 - - - 310 - - - - - -
Research sample size 448 - - - 392 - - - - - -
Source: YTD 36-month survey. Notes: We weighted the statistics to adjust for non-response to the 36-month survey. All dollar amounts shown in the table are in 2008 dollars. a Indicates outcome measures for which we used a multiple imputation procedure for missing information. See Section D of this appendix for more information on this procedure. b Indicates outcomes based on SSA administrative records. For all outcomes from administrative records, we used the full research sample and did not weight to adjust for non-response to the 36-month survey. c Administrative data on employment and earnings for the third calendar year after youth’s enrollment in the evaluation were not available for 17.3 percent of youth in the YTD project in Miami-Dade County, FL. Consequently, statistics for these measures are based on data for a subset of all youth in the full research sample for this project. */**/*** Impact estimate is significantly different from zero at the .10/.05/.01 level using a two-tailed t-test or a chi-square test.

A.33
Table A.3e. Montgomery Co., MD: Descriptive statistics on outcomes by treatment status and unadjusted impacts (percentages, unless otherwise noted)
- Treatment group - Control group - Unadjusted estimate
Outcome N Mean Standard deviation - N Mean
Standard deviation - Impact p-value
Paid employment and earnings
Ever employed in a paid job in the past yeara 320 70.0 45.8 - 271 65.2 47.6 - 4.7 -- 0.23
Total earnings in the past year ($)a 320 6,981 8,224 - 275 5,488 6,648 - 1493 ** 0.03
Total hours worked in paid jobs in the past yeara 320 765.3 837.5 - 275.0 623.7 689.7 - 141.7 ** 0.04
Employed in paid job at the time of the 36-month survey a 320 47.3 49.9 - 275.0 44.5 49.7 - 2.8 - 0.50
Calendar year employment (based on IRS records)b - - - - - - - - - - -
First calendar year following enrollment 416 59.1 49.2 - 382 54.7 49.8 - 4.4 - 0.21
Second calendar year following enrollment 416 63.2 48.2 - 382 61.0 48.8 - 2.2 - 0.52
Third calendar year following enrollmentc 251 62.5 48.4 - 227 65.2 47.6 - -2.7 - 0.55
Calendar year earnings (based on IRS records) ($)b - - - - - - - - - - -
First calendar year following enrollment 416 2,833 6,032 - 382 2,232 6,032 - 601 - 0.16
Second calendar year following enrollment 416 3,632 6,350 - 382 3,330 6,350 - 303 - 0.50
Third calendar year following enrollmentc 251 4,816 6,981 - 227 4,176 6,981 - 640 - 0.32
Youth income
Total income from earnings (from survey) and disability benefits (from SSA files) in the past year a ($) 320 8,777 5,998
- 275 7,197 4,654
- 1,579 ** 0.01
Any disability benefits (from SSA files) in the past year b 416 22.6 41.8 - 382 22.0 41.4 - 0.6 - 0.84
Total amount of disability benefits (from SSA files) in the past year ($)b
416 1,560 3,094 - 382 1,467 2,998 - 93.3 - 0.67
Proportion of total income from earningsa 320 59.5 49.1 - 275 53.3 49.9 - 6.3 - 0.12
Current public or private health insurance coverage 285 77.1 42.0 - 255 79.5 40.4 - -2.4 - 0.51
Receipt of public assistance (TANF, SNAP, housing assistance) in the past month 298 23.8 42.6 - 262 26.3 44.0 - -2.5 - 0.50
Participation in productive activities
Participated in paid employment, unpaid employment, education, or training in the past year 320 87.2 33.4 - 274 88.8 31.5 - -1.6 - 0.57
Participated in education or training program in the past year 320 52.2 50.0 - 273 56.6 49.6 - -4.4 - 0.29

TABLE A.3e (CONTINUED)
A.34
- Treatment group - Control group - Unadjusted estimate
Outcome N Mean Standard deviation - N Mean
Standard deviation - Impact p-value
Completed high school (attained high school diploma/GED/ certificate or higher) by the time of the 36-month survey
320 78.3 41.2 - 274 80.4 39.7 - -2.1 - 0.54
Ever enrolled in college or technical school 312 27.1 44.4 - 264 30.4 46.0 - -3.3 - 0.39
Contact with the justice system
Arrested or charged with delinquency or a criminal complaint in the past yeara 304 5.3 22.5 - 260 6.5 24.6 - -1.1 - 0.59
Type of most recent charge during the past year 304 - -- - 260 - - - - - 0.75
No arrest or criminal or delinquent charge - 95.1 -- - -- 93.9 - - 1.2 - -
Violent crime - 0.0 -- - -- 0.5 - - -0.5 - -
Property crime - 0.6 -- - -- 1.5 - - -0.9 -
Drug-related crime - 1.0 -- - -- 1.6 - - -0.6 -
Other crime - 1.3 -- - -- 0.8 - - 0.5 -
Multiple crimes - 1.9 -- - -- 1.6 - - 0.4 -
Currently incarcerated (in jail, prison, or detention home) a 304 1.5 12.2 - 261 3.4 18.1 - -1.9 - 0.26
Currently on probation or parolea 304 1.8 13.3 - 261 6.3 24.3 - -4.5 ** 0.04
Since enrollment in the evaluation: - - - - - - - - - - -
Ever arrested or charged with delinquency or a criminal complaint
304 13.0 33.6 - 260 18.1 38.5 - -5.2 * 0.10
Ever convicted of or pled guilty to a chargea 304 9.8 29.7 - 260 16.5 37.1 - -6.7 ** 0.04
Ever incarcerated (in jail, prison, or detention home) a 304 4.0 19.6 - 261 4.4 20.5 - -0.4 - 0.86
Ever on probation or parolea 304 3.9 19.4 - 261 9.3 29.1 - -5.4 ** 0.03
Self-determination
Index of self-determinationa (4-point scale) 269 3.1 0.5 - 220 3.1 0.6 - 0.0 - 0.54
Subindices of self-determination (4-point scales) - - - - - - - - - - -
Index of autonomya 270 2.9 0.7 - 223 3.0 0.7 - -0.1 * 0.07
Index of internal locus of controla 271 3.4 0.6 - 221 3.4 0.6 - 0.0 - 0.60
Index of external locus of controla 272 3.0 0.9 - 222 2.9 0.9 - 0.0 - 0.65
Future independencea (%) 272 93.8 24.1 - 221 94.3 23.2 - -0.5 - 0.82
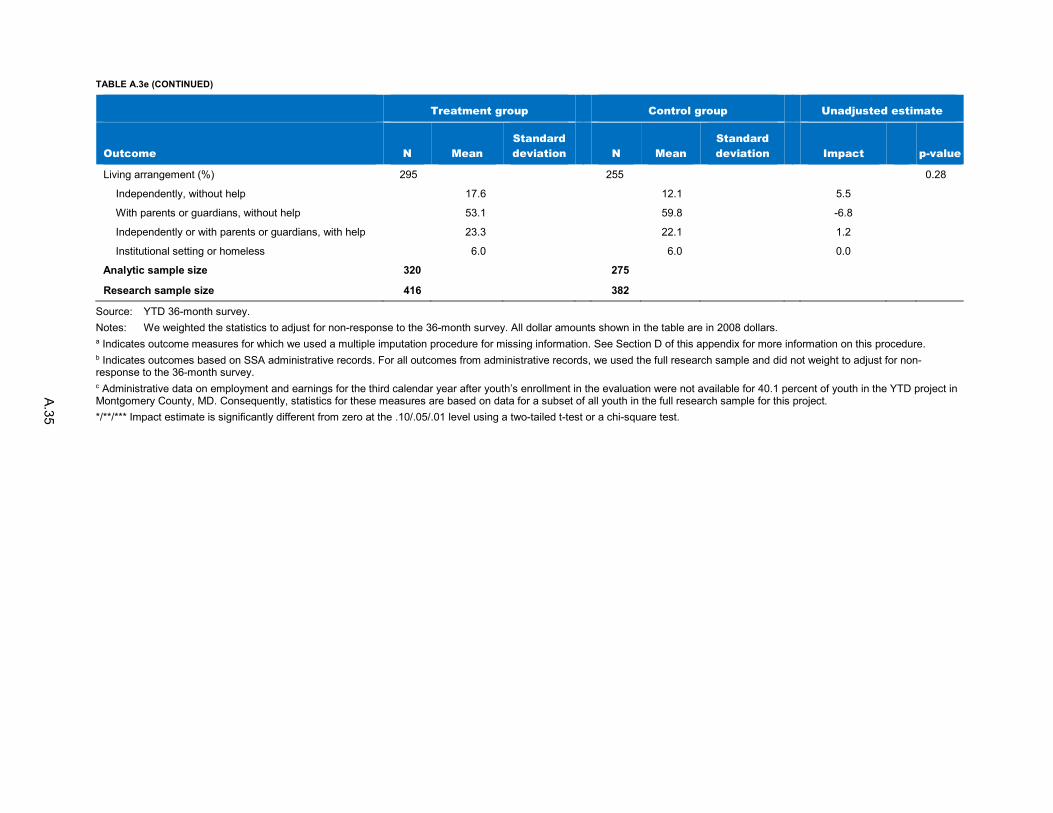
TABLE A.3e (CONTINUED)
A.35
- Treatment group - Control group - Unadjusted estimate
Outcome N Mean Standard deviation - N Mean
Standard deviation - Impact p-value
Living arrangement (%) 295 - - - 255 - - - - - 0.28
Independently, without help - 17.6 - - - 12.1 - - 5.5 - -
With parents or guardians, without help - 53.1 - - - 59.8 - - -6.8 - -
Independently or with parents or guardians, with help - 23.3 - - - 22.1 - - 1.2 - -
Institutional setting or homeless - 6.0 - - - 6.0 - - 0.0 - -
Analytic sample size 320 - - - 275 - - - - - -
Research sample size 416 - - - 382 - - - - - -
Source: YTD 36-month survey. Notes: We weighted the statistics to adjust for non-response to the 36-month survey. All dollar amounts shown in the table are in 2008 dollars. a Indicates outcome measures for which we used a multiple imputation procedure for missing information. See Section D of this appendix for more information on this procedure. b Indicates outcomes based on SSA administrative records. For all outcomes from administrative records, we used the full research sample and did not weight to adjust for non-response to the 36-month survey. c Administrative data on employment and earnings for the third calendar year after youth’s enrollment in the evaluation were not available for 40.1 percent of youth in the YTD project in Montgomery County, MD. Consequently, statistics for these measures are based on data for a subset of all youth in the full research sample for this project. */**/*** Impact estimate is significantly different from zero at the .10/.05/.01 level using a two-tailed t-test or a chi-square test.

A.36
Table A.3f. West Virginia: Descriptive statistics on outcomes by treatment status and unadjusted impacts (percentages, unless otherwise noted)
- Treatment group - Control group - Unadjusted estimate
Outcome N Mean Standard deviation - N Mean
Standard deviation - Impact - p-value
Paid employment and earnings
Ever employed in a paid job in the past yeara 364 35.2 47.7 - 310 30.6 46.1 - 4.5 - 0.22
Total earnings in the past year ($)a 364 1,917 3,781 - 311 1,792 3,852 - 125 - 0.68
Total hours worked in paid jobs in the past yeara 364 263.3 519.8 - 311.0 247.5 494.4 - 15.8 - 0.70
Employed in paid job at the time of the 36-month survey a 364 22.7 41.9 - 311.0 19.6 39.7 - 3.1 *** 0.00
Calendar year employment (based on IRS records)b - - - - - - - - - - -
First calendar year following enrollment 449 44.3 49.7 - 393.0 28.5 45.1 - 15.8 *** 0.00
Second calendar year following enrollment 449 38.3 48.6 - 393.0 29.8 45.7 - 8.5 *** 0.01
Third calendar year following enrollmentc 266 35.3 47.8 - 226.0 29.6 17.2 - 5.7 - 0.18
Calendar year earnings (based on IRS records) ($)b - - - - - - - - - - -
First calendar year following enrollment 449 1,619 3,514 - 393 1,288 3,514 - 331 - 0.17
Second calendar year following enrollment 449 1,734 4,250 - 393 1,655 4,250 - 79 - 0.79
Third calendar year following enrollmentc 266 1,777 4,935 - 226 1,986 4,935 - -209 - 0.64
Youth income
Total income from earnings (from survey) and disability benefits (from SSA files) in the past year a ($) 364 8,351 4,109 - 311 7,456 4,107 - 895 *** 0.01
Any disability benefits (from SSA files) in the past year b 449 88.6 31.7 - 393 79.9 40.1 - 8.7 *** 0.00
Total amount of disability benefits (from SSA files) in the past year ($)b
449 6,281 2,862 - 393 5,527 3,364 - 754 *** 0.00
Proportion of total income from earningsa 364 15.7 36.4 - 311 16.1 36.7 - -0.4 - 0.87
Current public or private health insurance coverage 341 90.8 28.9 - 298 87.4 33.2 - 3.4 - 0.17
Receipt of public assistance (TANF, SNAP, housing assistance) in the past month 351 50.7 50.0 - 298 52.6 49.9 - -1.9 - 0.64
Participation in productive activities
Participated in paid employment, unpaid employment, education, or training in the past year 362 52.8 49.9 - 310 46.9 49.9 - 5.9 - 0.13
Participated in education or training program in the past year 361 26.3 44.0 - 311 22.7 41.9 - 3.6 - 0.29

TABLE A.3f (CONTINUED)
A.37
- Treatment group - Control group - Unadjusted estimate
Outcome N Mean Standard deviation - N Mean
Standard deviation - Impact - p-value
Completed high school (attained high school diploma/GED/ certificate or higher) by the time of the 36-month survey
364 69.0 46.3 - 310 66.4 47.2 - 2.6 - 0.48
Ever enrolled in college or technical school 355 9.7 29.6 - 305 14.9 35.6 - -5.2 ** 0.04
Contact with the justice system
Arrested or charged with delinquency or a criminal complaint in the past yeara 355 3.3 18.0 - 303 3.9 19.5 - -0.6 - 0.69
Type of most recent charge during the past year 355 - - - 303 - - - - 0.26
No arrest or criminal or delinquent charge - 96.8 - - - 96.0 - - 0.8 - -
Violent crime - 0.6 - - - 0.0 - - 0.6 - -
Property crime - 0.4 - - - 0.3 - - 0.1 - -
Drug-related crime - 0.0 - - - 0.0 - - 0.0 - -
Other crime - 0.6 - - - 2.5 - - -2.0 - -
Multiple crimes - 1.6 - - - 1.1 - - 0.5 - -
Currently incarcerated (in jail, prison, or detention home) a 355 1.4 11.6 - 304 2.3 14.8 - -0.9 - 0.49
Currently on probation or parolea 355 0.6 7.8 - 304 0.3 5.7 - 0.3 - 0.59
Since enrollment in the evaluation: - - - - - - - - - - -
Ever arrested or charged with delinquency or a criminal complaint
355 5.4 22.5 - 303 5.8 23.4 - -0.4 - 0.81
Ever convicted of or pled guilty to a chargea 355 5.3 22.4 - 303 4.8 21.5 - 0.4 - 0.82
Ever incarcerated (in jail, prison, or detention home) a 355 1.6 12.4 - 304 2.8 16.4 - -1.2 - 0.37
Ever on probation or parolea 355 1.4 11.8 - 304 0.7 8.1 - 0.8 - 0.33
Self-determination
Index of self-determinationa (4-point scale) 272 2.8 0.5 - 234 2.8 0.6 - 0.0 - 0.95
Subindices of self-determination (4-point scales) - - - - - - - - - - -
Index of autonomya 278 2.8 0.7 - 239 2.8 0.7 - 0.0 - 0.62
Index of internal locus of controla 277 3.2 0.7 - 238 3.1 0.7 - 0.0 - 0.49
Index of external locus of controla 277 2.5 0.8 - 234 2.6 0.8 - -0.1 - 0.22
Future independencea (%) 276 78.0 41.4 - 239 74.7 43.5 - 3.3 - 0.38

TABLE A.3f (CONTINUED)
A.38
- Treatment group - Control group - Unadjusted estimate
Outcome N Mean Standard deviation - N Mean
Standard deviation - Impact - p-value
Living arrangement (%) 352 - - - 303 - - - - - 0.19
Independently, without help - 25.9 - - - 28.5 - - -2.7 - -
With parents or guardians, without help - 41.5 - - - 43.9 - - -2.4 - -
Independently or with parents or guardians, with help - 27.1 - - - 25.2 - - 1.9 - -
Institutional setting or homeless - 5.6 - - - 2.4 - - 3.2 - -
Analytic sample size 365 - - - 311 - - - - - -
Research sample size 449 - - - 393 - - - - - -
Source: YTD 36-month survey. Notes: We weighted the statistics to adjust for non-response to the 36-month survey. All dollar amounts shown in the table are in 2008 dollars. a Indicates outcome measures for which we used a multiple imputation procedure for missing information. See Section D of this appendix for more information on this procedure. b Indicates outcomes based on SSA administrative records. For all outcomes from administrative records, we used the full research sample and did not weight to adjust for non-response to the 36-month survey. c Administrative data on employment and earnings for the third calendar year after youth’s enrollment in the evaluation were not available for 41.6 percent of youth in the YTD project in West Virginia. Consequently, statistics for these measures are based on data for a subset of all youth in the full research sample for this project. */**/*** Impact estimate is significantly different from zero at the .10/.05/.01 level using a two-tailed t-test or a chi-square test.

FINAL REPORT ON THE YTD EVALUATION APPENDIX A: ADDITIONAL ANALYSES
A.39
Table A.4. Difference in unadjusted means vs. difference in regression-adjusted means for primary outcomes (percentages, unless otherwise noted)
-
Difference in unadjusted means -
Difference in regression-adjusted means
Outcome Impact
estimate - p-value - Impact
estimate - p-value
Bronx County, New York
Ever employed in a paid job in the past year 1.2 - 0.74 - -0.1 - 0.98
Total earnings in the past year ($)a, b 106 - 0.59 - 25 - 0.89
Total income from earnings (from survey) and disability benefits (from SSA files) in the past year ($)a, b
1737 *** 0.00 - 1,729 *** 0.00
Participated in paid employment, unpaid employment, education, or training in the past year
-2.8 - 0.30 - -3.6 - 0.17
Arrested or charged with delinquency or a criminal complaint in the past yearb
-3.9 ** 0.03 - -3.8 ** 0.03
Index of self-determination (4-point scale) 0.0 - 0.37 - -0.0 - 0.64
Colorado
Ever employed in a paid job in the past year 3.4 - 0.36 - 0.2 - 0.96
Total earnings in the past year ($)a, b 192 - 0.56 - -94 - 0.76
Total income from earnings (from survey) and disability benefits (from SSA files) in the past year ($)a, b
422 - 0.21 - 82 - 0.80
Participated in paid employment, unpaid employment, education, or training in the past year
0.6 - 0.88 - -2.4 - 0.48
Arrested or charged with delinquency or a criminal complaint in the past yearb
2.2 - 0.10 - 2.8 * 0.05
Index of self-determination (4-point scale) 0.0 - 0.85 - 0.0 - 0.74
Erie County, New York
Ever employed in a paid job in the past year 8.1 ** 0.03 - 7.7 ** 0.03
Total earnings in the past year ($)a, b 469 0.16 - 521 0.11
Total income from earnings (from survey) and disability benefits (from SSA files) in the past year ($)a, b
960 *** 0.01 - 1,106 *** 0.00
Participated in paid employment, unpaid employment, education, or training in the past year
6.0 * 0.09 - 4.9 - 0.14
Arrested or charged with delinquency or a criminal complaint in the past yearb
-0.7 - 0.68 - -0.6 - 0.72
Index of self-determination (4-point scale) 0.0 - 0.39 - 0.1 - 0.24
Miami-Dade County, Florida
Ever employed in a paid job in the past year 7.8 ** 0.03 - 7.8 ** 0.02
Total earnings in the past year ($)a, b 607 ** 0.05 - 615 ** 0.04
Total income from earnings and disability benefits (from SSA files) in the past year ($)a, b
1,189 *** 0.00 - 1,246 *** 0.00

FINAL REPORT ON THE YTD EVALUATION APPENDIX A: ADDITIONAL ANALYSES
TABLE A.4 (CONTINUED)
A.40
-
Difference in unadjusted means -
Difference in regression-adjusted means
Outcome Impact
estimate - p-value - Impact
estimate - p-value
Participated in paid employment, unpaid employment, education, or training in the past year
8.7 ** 0.02 - 8.4 ** 0.02
Arrested or charged with delinquency or a criminal complaint in the past yearb
-2.5 ** 0.02 - -2.7 ** 0.01
Index of self-determination (4-point scale) 0.1 - 0.35 - 0.1 - 0.20
Montgomery County, Maryland
Ever employed in a paid job in the past year 4.7 - 0.23 - 3.6 - 0.35
Total earnings in the past year ($)a, b 1,493 ** 0.03 - 1,162 * 0.06
Total income from earnings (from survey) and disability benefits (from SSA files) in the past year ($)a, b
1,579 ** 0.01 - 1,382 ** 0.02
Participated in paid employment, unpaid employment, education, or training in the past year
-1.6 - 0.57 - -1.9 - 0.49
Arrested or charged with delinquency or a criminal complaint in the past yearb
-1.1 - 0.59 - -1.5 - 0.46
Index of self-determination (4-point scale) 0.0 - 0.54 - 0.0 - 0.26
West Virginia
Ever employed in a paid job in the past year 4.5 - 0.22 - 5.7 - 0.11
Total earnings in the past year ($)a, b 125 - 0.68 - 241 - 0.40
Total income from earnings (from survey) and disability benefits (from SSA files) in the past year ($)a, b
895 *** 0.01 - 1,010 *** 0.00
Participated in paid employment, unpaid employment, education, or training in the past year
5.9 - 0.13 - 7.6 ** 0.04
Arrested or charged with delinquency or a criminal complaint in the past yearb
-0.6 - 0.69 - -0.8 - 0.66
Index of self-determination (4-point scale) 0.0 - 0.95 - 0.0 - 0.48
Sources: YTD 36-month follow-up survey and SSA administrative records. Notes: The sample includes all youth who completed the study’s 36-month follow-up survey. We measured explanatory
variables in the regression model before random assignment using data from the study’s baseline survey and SSA administrative records. We calculated all statistics using sample weights to account for interview non-response. “Past year” refers to the year preceding the 36-month survey. All dollar amounts shown in the table are in 2008 dollars. See Table A.2 for sample sizes for all outcomes.
a We included youth who had no earnings or received no SSA benefits in our calculation of the mean values of these measures. b For these outcomes, item non-response occurred conditionally, depending on the values of other measures in the survey. We used a multiple-imputations procedure to assign values when they were missing. See Section D of this appendix for more information on this procedure. */**/***Impact estimate is significantly different from zero at the .10/.05/.01 level using a two-tailed t-test.

FINAL REPORT ON THE YTD EVALUATION APPENDIX A: ADDITIONAL ANALYSES
A.41
Table A.5a. Bronx Co., NY: baseline characteristics of respondents and non-respondents to the 36-month survey (percentages, unless otherwise noted)
Characteristic All Respondents Non-
respondents Difference p-value
Baseline survey data Demographic characteristics - - - - - - Race - - - - - 0.47 White 32.5 31.8 36.1 -4.3 - - Black 42.7 44.0 36.1 7.9 - - HI/Pacific/Am Ind/AK 2.7 2.7 2.8 -0.1 - - Asian 0.6 0.7 0.0 0.7 - - Other or unknown 21.5 20.8 25.0 -4.2 - - Hispanic 69.9 69.8 70.1 -0.3 - 0.94 Primarily speaks English at home 71.4 71.1 72.9 -1.9 - 0.65 Education - - - - - - School attendance - - - - - 0.28 Does not attend school 6.7 6.0 10.5 -4.5 - - Attends regular high school 52.9 53.7 48.9 4.8 - - Attends special high school 35.2 35.2 35.3 -0.1 - - Attends other school 5.2 5.1 5.3 -0.1 - - Attainment - highest grade - - - - - 0.22 9th grade or less 39.6 39.5 40.3 -0.8 - 10th or 11th grade 45.7 46.1 43.4 2.7 - 12th grade 5.3 4.6 9.3 -4.7 - College or technical school 0.1 0.1 0.0 0.1 - Other 9.3 9.7 7.0 2.8 - HS diploma, GED, or certificate of completion 0.2 0.3 0.0 0.3 - 0.54 Ever received special education 87.2 86.7 89.4 -2.7 - 0.38 Employment - - - - - - Received job training in last year 21.2 21.8 18.4 3.3 - 0.38 Worked as a volunteer in last year 11.3 11.0 12.7 -1.7 - 0.56 Worked for pay in last year 18.3 19.3 13.2 6.1 * 0.08 Worked for pay in last month 7.2 8.0 3.5 4.5 * 0.06 Never worked for pay at baseline 68.0 66.7 74.8 -8.1 * 0.06 Living arrangements and household composition
- - - - - -
Living arrangements - - - - *** 0.00 Two-parent family 18.1 18.9 14.0 4.9 - - Single-parent family 80.4 80.4 80.4 0.0 - - Group home 0.0 0.0 0.0 0.0 - - Other institution 0.6 0.3 2.1 -1.8 - - Lives alone or with friends 0.9 0.4 3.5 -3.1 - - Average number of people in household 4.0 4.0 4.1 -0.1 - 0.45 Lives with others with disabilities 47.3 47.1 48.2 -1.1 - 0.81 Health insurance coverage - - - - - - Covered by public health insurance 96.8 96.7 97.2 -0.5 - 0.78 Covered by private health insurance 7.9 8.3 5.6 2.7 - 0.28 Covered by both public and private health ins. 6.1 6.2 5.6 0.6 - 0.79 Covered by public or private health insurance 98.4 98.6 97.2 1.5 - 0.21 Family socio-economic status - - - - - - Annual income level - - - - - 0.16 Less than $10,000 41.7 40.8 46.7 -5.9 - - $10,000 - $24,999 43.7 43.7 43.7 0.0 - - $25,000 or more 14.5 15.5 9.6 5.9 - - Public assistance - - - - - - TANF/family assistance 16.0 15.2 19.7 -4.5 - 0.18 SNAP (food stamps) 47.8 46.3 55.9 -9.7 ** 0.03 Parents' education - - - - - - Mother HS graduate 46.2 46.2 46.0 0.2 - 0.97 Father HS graduate 47.4 48.9 36.8 12.2 * 0.06 Parents' employment status - - - - - - Mother currently employed 39.8 39.7 40.7 -1.0 - 0.82 Father currently employed 58.8 59.1 56.5 2.6 - 0.69 Self-reported health status - - - - - 0.36 Excellent 21.1 20.2 25.5 -5.3 - - Very good/good 61.3 61.9 58.2 3.7 - - Fair/poor 17.7 17.9 16.3 1.6 - -

FINAL REPORT ON THE YTD EVALUATION APPENDIX A: ADDITIONAL ANALYSES
TABLE A.5a (CONTINUED)
A.42
Characteristic All Respondents Non-
respondents Difference p-value Assistance - - - - - - Reading, hearing, speaking, or walking aids 11.0 11.0 11.4 -0.5 - 0.88 Help with personal care needs 11.8 11.8 11.8 0.0 - 0.99 Independent activities - - - - - - Decide by selves how to spend money 81.3 80.9 83.0 -2.1 - 0.57 Pick clothes to wear 93.3 93.0 95.1 -2.1 - 0.36 Make snacks or sandwiches 90.2 90.4 89.4 1.0 - 0.72 Ride public transportation alone 74.0 73.0 78.9 -5.8 - 0.15 Decide how to spend free time 90.5 90.2 92.2 -2.0 - 0.46 Expectations about the future - - - - - - Expects to live independently (w/ or w/o help) 72.2 71.9 73.5 -1.6 - 0.73 Expects to continue education 96.7 96.9 96.1 0.8 - 0.66 Expects to work at least part-time for pay 95.4 95.5 95.0 0.4 - 0.84 Random assignment cohort - - - - - 0.34 Year 1 cohort 18.6 18.4 19.4 -1.1 - - Year 2 cohort 41.5 42.6 36.1 6.5 - - Year 3 cohort 39.9 39.1 44.4 -5.4 - -
Administrative data Demographic characteristics - - - - - - Male 67.9 67.3 70.8 -3.5 - 0.41 Age (in years) - - - - - 0.93
14-15 20.8 20.8 20.8 0.0 - - 16 45.0 45.3 43.8 1.5 - - 17-19 34.2 33.9 35.4 -1.5 - -
Average age (in years) 16.2 16.2 16.2 -0.1 - 0.44 Language - - - - - 0.80 English 69.2 68.8 71.5 -2.7 - - Spanish 25.7 26.1 23.6 2.5 - - Other 0.0 0.0 0.0 0.0 - - Unknown/missing 5.1 5.1 4.9 0.3 - - Benefits - - - - - - Representative payee type - - - - - 0.29 None 1.0 0.9 1.4 -0.4 - - Natural/adoptive/step parent 84.2 83.2 88.9 -5.6 - - Other relative 13.7 14.6 9.0 5.6 - - Other 1.1 1.2 0.7 0.5 - - SSA beneficiary status - - - - - - SSI (only or concurrent with CDB or DI) 100 100 100 0.0 1.00 Duration of benefit entitlement (in years) 8.8 9.0 7.8 1.2 *** 0.00 Benefit amount in prior year ($) 6,471 6,390 6,884 -494 ** 0.02 Health status - - - - - - Primary disabling condition (SSA data) - - - - - 0.25 Mental illness 12.6 12.9 11.2 1.7 - - Cognitive/developmental disability 32.3 32.8 29.9 3.0 - - Learning disability/ADD 24.6 23.4 30.6 -7.2 - - Physical disability 17.9 18.8 13.4 5.3 - - Speech, hearing, visual impairment 12.5 12.1 14.9 -2.9 - - Duration of disability (in years) 9.3 9.4 8.4 1.0 ** 0.02 Earnings - - - - - - Earnings in prior year ($) 109 117 73 44 - 0.24 Sample size 884 740 144 - - -
Sources: YTD baseline survey and SSA administrative records. Notes: Baseline survey item non-response may have resulted in smaller sample sizes for some characteristics than indicated at
the bottom of the table. Missing information on primary disabling condition resulted in a smaller sample size for this characteristic than shown at the bottom of the table. All dollar amounts shown in the table are in 2008 dollars.
*/**/*** Respondent-non-respondent difference is statistically different from zero at the .10/.05/.01 level using either a two-tailed t-test or a chi-square test.

FINAL REPORT ON THE YTD EVALUATION APPENDIX A: ADDITIONAL ANALYSES
A.43
Table A.5b. Colorado: baseline characteristics of respondents and non-respondents to the baseline survey (percentages, unless otherwise noted)
Characteristic All Respondents Non-
respondents Difference - p-value
Baseline survey data Demographic characteristics - - - - - - Race - - - - - 0.92 White 71.0 70.8 72.2 -1.4 - - Black 8.3 8.1 9.6 -1.4 - - HI/Pacific/Am Ind/AK 5.4 5.2 6.1 -0.8 - - Asian 1.7 1.9 0.0 1.9 - - Other or unknown 13.7 13.9 12.2 1.8 - - Hispanic 24.4 23.3 31.6 -8.3 * 0.06 Primarily speaks English at home 94.7 95.3 91.2 4.1 * 0.07 Education - - - - - - School attendance - - - - - 0.78 Does not attend school 55.7 55.8 54.5 1.3 - - Attends regular high school 29.0 29.0 29.1 0.0 - - Attends special high school 4.5 4.2 6.4 -2.2 - - Attends other school 10.8 10.9 10.0 0.9 - - Attainment - highest grade - - - - * 0.08 9th grade or less 17.3 17.3 17.3 0.0 - - 10th or 11th grade 21.2 19.6 30.8 -11.1 - - 12th grade 49.0 49.8 44.2 5.5 - - College or technical school 2.8 3.1 1.0 2.2 - - Other 9.7 10.2 6.7 3.5 - - HS diploma, GED, or certificate of completion 44.6 45.2 40.5 4.7 - 0.36 Ever received special education 85.3 85.1 86.1 -1.0 - 0.79 Employment - - - - - - Received job training in last year 36.3 38.8 20.4 18.4 *** 0.00 Worked as a volunteer in last year 13.8 14.2 11.3 2.9 - 0.41 Worked for pay in last year 34.8 35.9 27.8 8.1 * 0.09 Worked for pay in last month 21.4 22.3 15.7 6.6 - 0.11 Never worked for pay at baseline 44.8 45.5 40.9 4.6 - 0.36 Living arrangements and household composition - - - - - - Living arrangements - - - - - 0.39 Two-parent family 46.0 47.1 39.1 7.9 - - Single-parent family 35.3 34.8 38.3 -3.4 - - Group home 2.2 1.9 3.5 -1.5 - - Other institution 2.5 2.6 1.7 0.9 - - Lives alone or with friends 14.0 13.5 17.4 -3.9 - - Average number of people in household 3.8 3.8 3.8 0.0 - 0.93 Lives with others with disabilities 31.9 31.5 34.6 -3.1 - 0.52 Health insurance coverage - - - - - - Covered by public health insurance 91.6 91.6 91.3 0.3 - 0.91 Covered by private health insurance 25.0 26.8 13.3 13.6 *** 0.00 Covered by both public and private health ins. 20.0 21.3 11.3 10.0 ** 0.01 Covered by public or private health insurance 96.3 96.8 93.0 3.8 ** 0.05 Family socio-economic status - - - - - - Annual income level * 0.07 Less than $10,000 25.5 24.4 32.0 -7.6 - - $10,000 - $24,999 27.2 26.5 31.0 -4.5 - - $25,000 or more 47.4 49.0 37.0 12.0 - - Public assistance - - - - - - TANF/family assistance 4.9 4.5 7.6 -3.1 - 0.17 SNAP (food stamps) 24.3 22.6 34.6 -12.0 *** 0.01 Parents' education - - - - - - Mother HS graduate 79.1 79.8 74.0 5.9 - 0.18 Father HS graduate 79.9 80.9 71.0 9.9 * 0.05 Parents' employment status - - - - - - Mother currently employed 60.0 61.5 50.0 11.5 ** 0.03 Father currently employed 70.8 70.9 70.1 0.7 - 0.90 Self-reported health status - - - - - 0.76 Excellent 20.0 20.3 18.4 1.9 - - Very good/good 56.2 56.4 55.3 1.1 - - Fair/poor 23.7 23.3 26.3 -3.0 - -

FINAL REPORT ON THE YTD EVALUATION APPENDIX A: ADDITIONAL ANALYSES
TABLE A.5b (CONTINUED)
A.44
Characteristic All Respondents Non-
respondents Difference - p-value Assistance - - - - - - Reading, hearing, speaking, or walking aids 26.3 26.9 22.6 4.3 - 0.34 Help with personal care needs 23.8 24.2 20.9 3.3 - 0.43 Independent activities - - - - - - Decide by selves how to spend money 80.4 80.0 82.6 -2.6 - 0.52 Pick clothes to wear 93.8 93.9 93.0 0.9 - 0.71 Make snacks or sandwiches 86.6 86.1 89.6 -3.5 - 0.31 Ride public transportation alone 47.4 46.3 53.9 -7.6 - 0.13 Decide how to spend free time 91.6 91.6 92.1 -0.5 - 0.85 Expectations about the future - - - - - - Expects to live independently (w/ or w/o help) 71.0 69.9 77.9 -8.0 - 0.13 Expects to continue education 72.2 69.8 87.2 -17.5 *** 0.00 Expects to work at least part-time for pay 89.0 88.3 93.2 -4.9 - 0.18 Random assignment cohort - - - - *** 0.00 Year 1 cohort 16.0 17.3 7.8 9.5 - - Year 2 cohort 65.2 65.3 64.3 1.0 - - Year 3 cohort 18.8 17.3 27.8 -10.5 - - Location within a YTD project's service delivery area - - - - - 0.22 10 = Boulder 19.0 20.1 12.2 7.9 - - 11 = El Paso 41.9 41.1 47.0 -5.8 - - 12 = Larimer 19.6 19.7 19.1 0.5 - - 13 = Pueblo 19.5 19.1 21.7 -2.6 - -
Administrative data Demographic characteristics - - - - - - Male 57.4 56.4 63.5 -7.1 - 0.15 Age (in years) - - - - * 0.10 less than 14 0.1 0.1 0.0 0.1 - - 14-17 24.6 23.1 33.9 -10.8 - - 18-21 42.0 42.8 37.4 5.4 - - 22-25 33.3 34.0 28.7 5.3 - - Average age (in years) 19.8 19.9 19.3 0.6 * 0.06 Language - - - - - 0.96 English 95.2 95.0 96.5 -1.5 - - Spanish 1.1 1.1 0.9 0.2 - - Other 0.6 0.7 0.0 0.7 - - Unknown/missing 3.1 3.2 2.6 0.6 - - Benefits - - - - - - Representative payee type - - - - - 0.69 None 18.1 17.5 21.7 -4.3 - - Natural/adoptive/step parent 63.2 63.7 60.0 3.7 - - Other relative 9.9 10.0 8.7 1.3 - - Other 8.9 8.8 9.6 -0.8 - - SSA beneficiary status - - - - - - SSI (only or concurrent with CDB or DI) 93.1 92.3 98.3 -6.0 ** 0.02 Duration of benefit entitlement (in years) 6.4 6.4 6.3 0.1 0.87 Benefit amount in prior year ($) 6,505 6,507 6,487 20 0.94 Health status - - - - - - Primary disabling condition (SSA data) - - - - ** 0.01 Mental illness 17.6 16.4 24.8 -8.3 - - Cognitive/developmental disability 43.5 45.2 32.7 12.5 - - Learning disability/ADD 7.2 6.3 12.4 -6.1 - - Physical disability 23.5 23.7 22.1 1.6 - - Speech, hearing, visual impairment 8.2 8.3 8.0 0.3 - - Duration of disability (in years) 8.7 8.7 8.1 0.6 - 0.36 Earnings - - - - - - Earnings in prior year ($) 949 983 763 220 - 0.39 Sample size 842 727 115 - - -
Sources: YTD baseline survey and SSA administrative records. Notes: Baseline survey item non-response may have resulted in smaller sample sizes for some characteristics than indicated at
the bottom of the table. Missing information on primary disabling condition resulted in a smaller sample size for this characteristic than shown at the bottom of the table. All dollar amounts shown in the table are in 2008 dollars.
*/**/*** Respondent-non-respondent difference is statistically different from zero at the .10/.05/.01 level using either a two-tailed t-test or a chi-square test.

FINAL REPORT ON THE YTD EVALUATION APPENDIX A: ADDITIONAL ANALYSES
A.45
Table A.5c. Erie Co., NY: baseline characteristics of respondents and non-respondents to the 36-month survey (percentages, unless otherwise noted)
Characteristic All Respondents Non-
respondents Difference - p-value
Baseline survey data Demographic characteristics - - - - - - Race - - - - - 0.70 White 54.9 55.6 50.5 5.1 - - Black 35.3 34.5 40.4 -5.8 - - HI/Pacific/Am Ind/AK 1.1 1.0 1.8 -0.9 - - Asian 0.4 0.4 0.0 0.4 - - Other or unknown 8.3 8.5 7.3 1.2 - - Hispanic 9.0 8.4 13.0 -4.5 - 0.12 Primarily speaks English at home 96.2 96.8 92.6 4.2 ** 0.03 Education - - - - - - School attendance - - - - - 0.54 Does not attend school 50.5 51.0 47.5 3.4 - - Attends regular high school 26.8 25.9 32.7 -6.8 - - Attends special high school 8.3 8.5 6.9 1.6 - - Attends other school 14.4 14.6 12.9 1.8 - - Attainment - highest grade - - - - - 0.97 9th grade or less 8.3 8.4 7.5 0.9 - - 10th or 11th grade 31.6 31.3 33.3 -2.0 - - 12th grade 44.0 44.0 44.1 -0.1 - - College or technical school 3.1 3.3 2.2 1.1 - - Other 13.0 13.0 12.9 0.1 - - HS diploma, GED, or certificate of completion 40.1 41.4 32.1 9.2 * 0.07 Ever received special education 83.1 82.8 85.3 -2.5 - 0.51 Employment - - - - - - Received job training in last year 38.3 40.2 25.7 14.5 *** 0.00 Worked as a volunteer in last year 10.1 9.9 11.0 -1.1 - 0.73 Worked for pay in last year 35.1 35.7 31.2 4.5 - 0.36 Worked for pay in last month 18.6 19.1 15.6 3.5 - 0.38 Never worked for pay at baseline 42.2 41.8 45.0 -3.2 - 0.53 Living arrangements and household composition - - - - - - Living arrangements - - - - - 0.22 Two-parent family 32.2 33.3 25.0 8.3 - - Single-parent family 49.9 48.8 57.4 -8.6 - - Group home 1.8 1.8 1.9 0.0 - - Other institution 3.2 3.5 0.9 2.6 - - Lives alone or with friends 12.8 12.6 14.8 -2.3 - - Average number of people in household 3.7 3.7 3.9 -0.2 - 0.22 Lives with others with disabilities 43.2 42.4 48.9 -6.6 - 0.23 Health insurance coverage - - - - - - Covered by public health insurance 96.0 95.9 96.3 -0.4 - 0.85 Covered by private health insurance 23.7 24.8 16.5 8.3 * 0.06 Covered by both public and private health ins. 20.6 21.5 14.7 6.9 * 0.10 Covered by public or private health insurance 98.3 98.5 97.2 1.2 - 0.37 Family socio-economic status - - - - - - Annual income level - - - - - 0.19 Less than $10,000 32.6 31.6 39.3 -7.7 - - $10,000 - $24,999 33.7 33.5 34.8 -1.3 - - $25,000 or more 33.7 34.8 25.8 9.0 - - Public assistance - - - - - - TANF/family assistance 10.1 9.7 13.0 -3.3 - 0.31 SNAP (food stamps) 38.1 37.2 44.0 -6.8 - 0.19 Parents' education - - - - - - Mother HS graduate 73.4 74.7 64.6 10.1 ** 0.03 Father HS graduate 73.3 74.6 62.7 12.0 ** 0.04 Parents' employment status - - - - - - Mother currently employed 49.5 50.1 45.4 4.8 - 0.38 Father currently employed 57.6 58.7 47.5 11.3 * 0.10 Self-reported health status - - - - - 0.70 Excellent 18.8 18.7 19.3 -0.6 - - Very good/good 61.9 62.4 58.7 3.7 - - Fair/poor 19.3 18.9 22.0 -3.2 - -

FINAL REPORT ON THE YTD EVALUATION APPENDIX A: ADDITIONAL ANALYSES
TABLE A.5c (CONTINUED)
A.46
Characteristic All Respondents Non-
respondents Difference - p-value Assistance - - - - - - Reading, hearing, speaking, or walking aids 16.0 15.7 17.4 -1.7 - 0.65 Help with personal care needs 17.5 17.5 17.4 0.1 - 0.98 Independent activities - - - - - - Decide by selves how to spend money 84.4 84.8 81.5 3.3 - 0.37 Pick clothes to wear 94.2 94.3 93.6 0.7 - 0.77 Make snacks or sandwiches 90.6 90.8 89.0 1.8 - 0.55 Ride public transportation alone 57.0 56.1 63.0 -6.9 - 0.18 Decide how to spend free time 93.5 93.2 95.4 -2.3 - 0.38 Expectations about the future - - - - - - Expects to live independently (w/ or w/o help) 75.9 75.4 78.7 -3.2 - 0.51 Expects to continue education 76.3 75.4 82.0 -6.6 - 0.17 Expects to work at least part-time for pay 92.6 93.2 89.0 4.2 - 0.15 Random assignment cohort - - - - - 0.23 Year 1 cohort 83.8 84.4 79.8 4.6 - - Year 2 cohort 16.2 15.6 20.2 -4.6 - - Location within a YTD project's service delivery area - - - - ** 0.02 30 = Erie Buffalo 58.2 56.4 69.7 -13.3 - - 31 = Erie North 25.3 25.9 21.1 4.8 - - 32 = Erie South 16.6 17.7 9.2 8.5 - -
Administrative data Demographic characteristics - - - - - - Male 61.3 60.7 65.1 -4.4 - 0.38 Age (in years) - - - - - 0.34 14-17 24.5 24.4 25.7 -1.3 - - 18-21 44.7 44.0 49.5 -5.5 - - 22-25 30.7 31.6 24.8 6.8 - - Average age (in years) 19.9 19.9 19.5 0.5 - 0.11 Language - - - - - 0.78 English 94.3 94.0 96.3 -2.3 - - Spanish 2.1 2.1 1.8 0.3 - - Other 0.1 0.1 0.0 0.1 - - Unknown/missing 3.5 3.8 1.8 1.9 - - Benefits - - - - - - Representative payee type - - - - - 0.63 None 16.1 16.6 12.8 3.7 - - Natural/adoptive/step parent 66.1 65.5 70.6 -5.2 - - Other relative 10.2 10.4 8.3 2.2 - - Other 7.6 7.5 8.3 -0.7 - - SSA beneficiary status - - - - - - SSI (only or concurrent with CDB or DI) 94.7 94.2 98.2 -4.0 * 0.08 Duration of benefit entitlement (in years) 8.3 8.2 8.9 -0.7 - 0.25 Benefit amount in prior year ($) 7,064 7,098 6,844 254 - 0.34 Health status - - - - - - Primary disabling condition (SSA data) - - - - - 0.90 Mental illness 17.7 18.0 15.5 2.5 - - Cognitive/developmental disability 45.0 44.7 46.6 -1.9 - - Learning disability/ADD 13.5 13.2 15.5 -2.3 - - Physical disability 17.7 17.7 17.5 0.2 - - Speech, hearing, visual impairment 6.1 6.3 4.9 1.5 - - Duration of disability (in years) 9.8 9.9 9.6 0.3 - 0.71 Earnings - - - - - - Earnings in prior year ($) 853 867 769 97 - 0.67 Sample size 827 718 109 - - -
Sources: YTD baseline survey and SSA administrative records. Notes: Baseline survey item non-response may have resulted in smaller sample sizes for some characteristics than indicated at
the bottom of the table. Missing information on primary disabling condition resulted in a smaller sample size for this characteristic than shown at the bottom of the table. All dollar amounts shown in the table are in 2008 dollars.
*/**/*** Respondent-non-respondent difference is statistically different from zero at the .10/.05/.01 level using either a two-tailed t-test or a chi-square test.
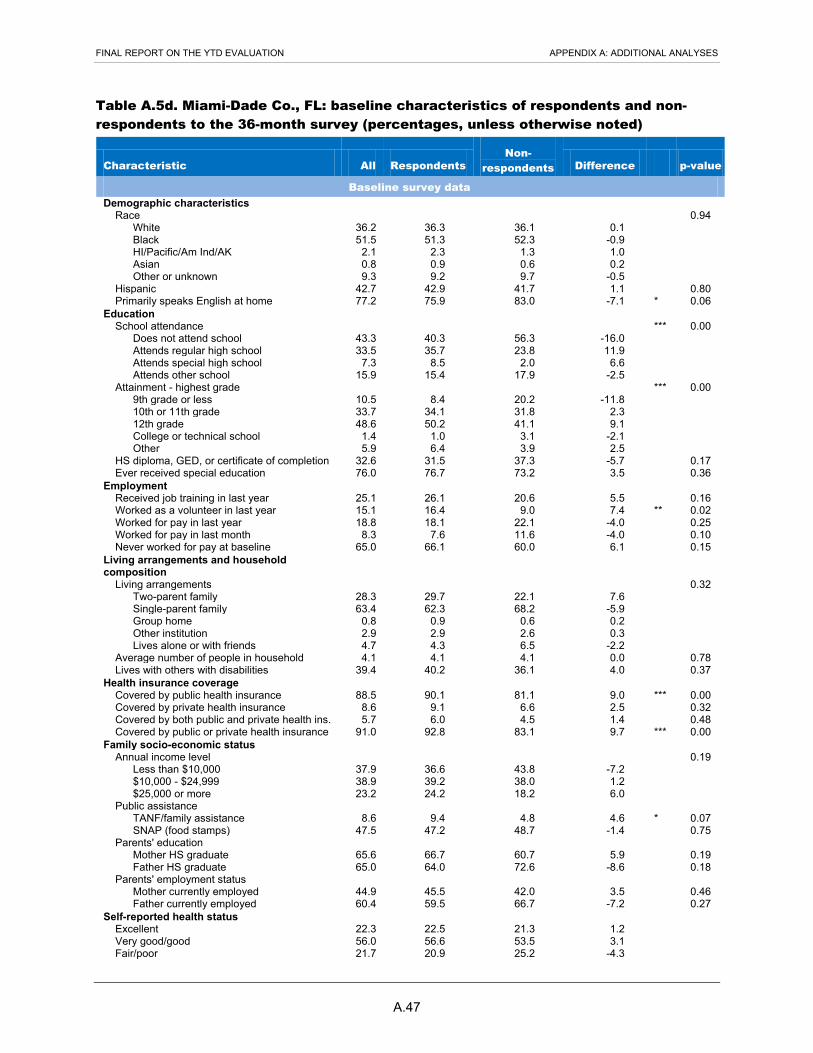
FINAL REPORT ON THE YTD EVALUATION APPENDIX A: ADDITIONAL ANALYSES
A.47
Table A.5d. Miami-Dade Co., FL: baseline characteristics of respondents and non-respondents to the 36-month survey (percentages, unless otherwise noted)
Characteristic All Respondents Non-
respondents Difference - p-value
Baseline survey data Demographic characteristics - - - - - - Race - - - - - 0.94 White 36.2 36.3 36.1 0.1 - - Black 51.5 51.3 52.3 -0.9 - - HI/Pacific/Am Ind/AK 2.1 2.3 1.3 1.0 - - Asian 0.8 0.9 0.6 0.2 - - Other or unknown 9.3 9.2 9.7 -0.5 - - Hispanic 42.7 42.9 41.7 1.1 - 0.80 Primarily speaks English at home 77.2 75.9 83.0 -7.1 * 0.06 Education - - - - - - School attendance - - - - *** 0.00 Does not attend school 43.3 40.3 56.3 -16.0 - - Attends regular high school 33.5 35.7 23.8 11.9 - - Attends special high school 7.3 8.5 2.0 6.6 - - Attends other school 15.9 15.4 17.9 -2.5 - - Attainment - highest grade - - - - *** 0.00 9th grade or less 10.5 8.4 20.2 -11.8 - - 10th or 11th grade 33.7 34.1 31.8 2.3 - - 12th grade 48.6 50.2 41.1 9.1 - - College or technical school 1.4 1.0 3.1 -2.1 - - Other 5.9 6.4 3.9 2.5 - - HS diploma, GED, or certificate of completion 32.6 31.5 37.3 -5.7 - 0.17 Ever received special education 76.0 76.7 73.2 3.5 - 0.36 Employment - - - - - - Received job training in last year 25.1 26.1 20.6 5.5 - 0.16 Worked as a volunteer in last year 15.1 16.4 9.0 7.4 ** 0.02 Worked for pay in last year 18.8 18.1 22.1 -4.0 - 0.25 Worked for pay in last month 8.3 7.6 11.6 -4.0 - 0.10 Never worked for pay at baseline 65.0 66.1 60.0 6.1 - 0.15 Living arrangements and household composition - - - - - - Living arrangements - - - - - 0.32 Two-parent family 28.3 29.7 22.1 7.6 - - Single-parent family 63.4 62.3 68.2 -5.9 - - Group home 0.8 0.9 0.6 0.2 - - Other institution 2.9 2.9 2.6 0.3 - - Lives alone or with friends 4.7 4.3 6.5 -2.2 - - Average number of people in household 4.1 4.1 4.1 0.0 - 0.78 Lives with others with disabilities 39.4 40.2 36.1 4.0 - 0.37 Health insurance coverage - - - - - - Covered by public health insurance 88.5 90.1 81.1 9.0 *** 0.00 Covered by private health insurance 8.6 9.1 6.6 2.5 - 0.32 Covered by both public and private health ins. 5.7 6.0 4.5 1.4 - 0.48 Covered by public or private health insurance 91.0 92.8 83.1 9.7 *** 0.00 Family socio-economic status - - - - - - Annual income level - - - - - 0.19 Less than $10,000 37.9 36.6 43.8 -7.2 - - $10,000 - $24,999 38.9 39.2 38.0 1.2 - - $25,000 or more 23.2 24.2 18.2 6.0 - - Public assistance - - - - - - TANF/family assistance 8.6 9.4 4.8 4.6 * 0.07 SNAP (food stamps) 47.5 47.2 48.7 -1.4 - 0.75 Parents' education - - - - - - Mother HS graduate 65.6 66.7 60.7 5.9 - 0.19 Father HS graduate 65.0 64.0 72.6 -8.6 - 0.18 Parents' employment status - - - - - - Mother currently employed 44.9 45.5 42.0 3.5 - 0.46 Father currently employed 60.4 59.5 66.7 -7.2 - 0.27 Self-reported health status - - - - - - Excellent 22.3 22.5 21.3 1.2 - - Very good/good 56.0 56.6 53.5 3.1 - - Fair/poor 21.7 20.9 25.2 -4.3 - -
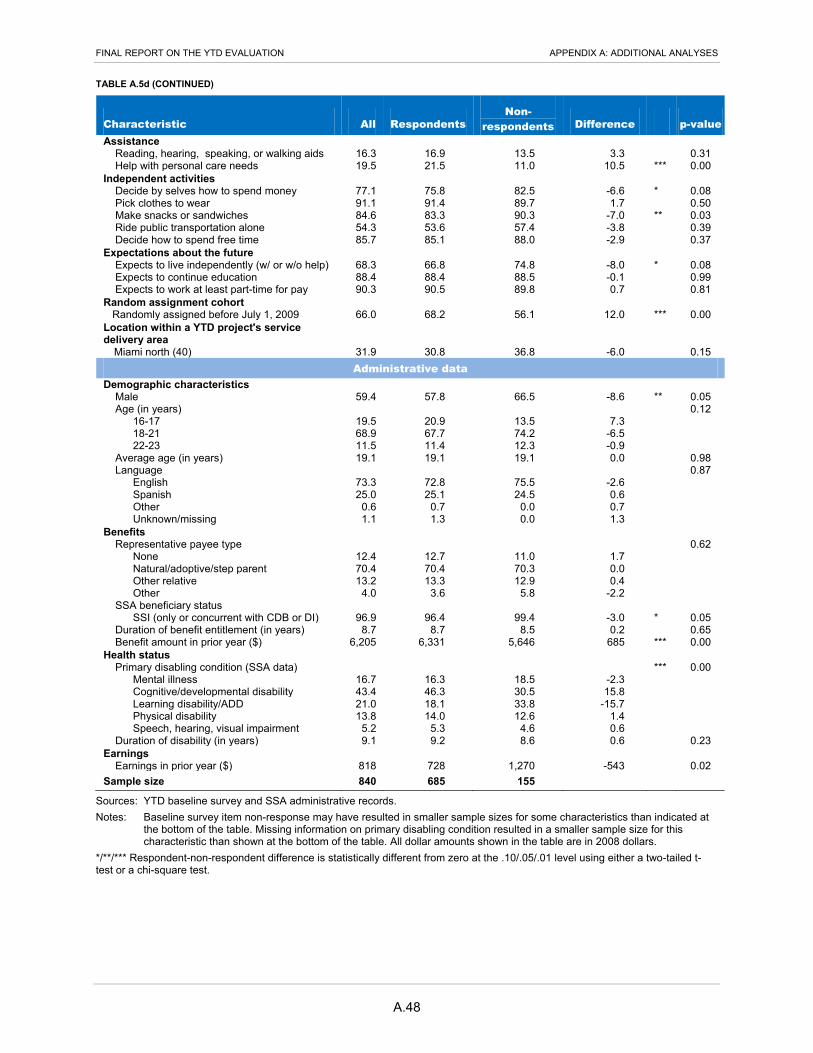
FINAL REPORT ON THE YTD EVALUATION APPENDIX A: ADDITIONAL ANALYSES
TABLE A.5d (CONTINUED)
A.48
Characteristic All Respondents Non-
respondents Difference - p-value Assistance - - - - - - Reading, hearing, speaking, or walking aids 16.3 16.9 13.5 3.3 - 0.31 Help with personal care needs 19.5 21.5 11.0 10.5 *** 0.00 Independent activities - - - - - - Decide by selves how to spend money 77.1 75.8 82.5 -6.6 * 0.08 Pick clothes to wear 91.1 91.4 89.7 1.7 - 0.50 Make snacks or sandwiches 84.6 83.3 90.3 -7.0 ** 0.03 Ride public transportation alone 54.3 53.6 57.4 -3.8 - 0.39 Decide how to spend free time 85.7 85.1 88.0 -2.9 - 0.37 Expectations about the future - - - - - - Expects to live independently (w/ or w/o help) 68.3 66.8 74.8 -8.0 * 0.08 Expects to continue education 88.4 88.4 88.5 -0.1 - 0.99 Expects to work at least part-time for pay 90.3 90.5 89.8 0.7 - 0.81 Random assignment cohort - - - - - - Randomly assigned before July 1, 2009 66.0 68.2 56.1 12.0 *** 0.00 Location within a YTD project's service delivery area - - - - - -
Miami north (40) 31.9 30.8 36.8 -6.0 - 0.15 Administrative data
Demographic characteristics - - - - - - Male 59.4 57.8 66.5 -8.6 ** 0.05 Age (in years) - - - - - 0.12 16-17 19.5 20.9 13.5 7.3 - - 18-21 68.9 67.7 74.2 -6.5 - - 22-23 11.5 11.4 12.3 -0.9 - - Average age (in years) 19.1 19.1 19.1 0.0 - 0.98 Language - - - - - 0.87 English 73.3 72.8 75.5 -2.6 - - Spanish 25.0 25.1 24.5 0.6 - - Other 0.6 0.7 0.0 0.7 - - Unknown/missing 1.1 1.3 0.0 1.3 - - Benefits - - - - - - Representative payee type - - - - - 0.62 None 12.4 12.7 11.0 1.7 - - Natural/adoptive/step parent 70.4 70.4 70.3 0.0 - - Other relative 13.2 13.3 12.9 0.4 - - Other 4.0 3.6 5.8 -2.2 - - SSA beneficiary status - - - - - - SSI (only or concurrent with CDB or DI) 96.9 96.4 99.4 -3.0 * 0.05 Duration of benefit entitlement (in years) 8.7 8.7 8.5 0.2 - 0.65 Benefit amount in prior year ($) 6,205 6,331 5,646 685 *** 0.00 Health status - - - - - - Primary disabling condition (SSA data) - - - - *** 0.00 Mental illness 16.7 16.3 18.5 -2.3 - - Cognitive/developmental disability 43.4 46.3 30.5 15.8 - - Learning disability/ADD 21.0 18.1 33.8 -15.7 - - Physical disability 13.8 14.0 12.6 1.4 - - Speech, hearing, visual impairment 5.2 5.3 4.6 0.6 - - Duration of disability (in years) 9.1 9.2 8.6 0.6 - 0.23 Earnings - - - - - - Earnings in prior year ($) 818 728 1,270 -543 - 0.02 Sample size 840 685 155 - - -
Sources: YTD baseline survey and SSA administrative records. Notes: Baseline survey item non-response may have resulted in smaller sample sizes for some characteristics than indicated at
the bottom of the table. Missing information on primary disabling condition resulted in a smaller sample size for this characteristic than shown at the bottom of the table. All dollar amounts shown in the table are in 2008 dollars.
*/**/*** Respondent-non-respondent difference is statistically different from zero at the .10/.05/.01 level using either a two-tailed t-test or a chi-square test.

FINAL REPORT ON THE YTD EVALUATION APPENDIX A: ADDITIONAL ANALYSES
A.49
Table A.5e. Montgomery Co., MD: baseline characteristics for respondents and non-respondents to the 36-month survey (percentages, unless otherwise noted)
Characteristic All Respondents Non-
respondents Difference - p-value
Baseline survey data Demographic characteristics - - - - - - Race - - - - *** 0.00 White 40.2 44.1 28.6 15.5 - - Black 40.0 36.5 50.2 -13.7 - - HI/Pacific/Am Ind/AK 1.4 0.8 3.0 -2.1 - - Asian 4.6 4.9 3.9 0.9 - - Other or unknown 13.8 13.6 14.3 -0.6 - - Hispanic 23.2 22.4 25.6 -3.2 - 0.35 Primarily speaks English at home 86.6 86.4 87.2 -0.8 - 0.77 Education - - - - - - School attendance - - - - - 0.40 Does not attend school 22.9 22.1 25.3 -3.1 - - Attends regular high school 54.6 53.9 56.6 -2.7 - - Attends special high school 12.9 13.9 9.9 4.0 - - Attends other school 9.6 10.0 8.2 1.8 - - Attainment - highest grade - - - - - 0.36 9th grade or less 6.6 5.7 8.9 -3.2 - - 10th or 11th grade 42.8 42.1 44.7 -2.7 - - 12th grade 47.7 49.1 43.7 5.4 - - College or technical school 1.8 2.0 1.1 1.0 - - Other 1.2 1.1 1.6 -0.5 - - HS diploma, GED, or certificate of completion 17.6 19.4 12.3 7.1 ** 0.02 Ever received special education 71.8 74.3 64.3 10.0 *** 0.01 Employment - - - - - - Received job training in last year 34.8 35.8 32.0 3.7 - 0.33 Worked as a volunteer in last year 14.5 15.2 12.3 2.9 - 0.31 Worked for pay in last year 56.6 56.6 56.7 -0.1 - 0.98 Worked for pay in last month 27.9 26.9 30.5 -3.6 - 0.32 Never worked for pay at baseline 25.8 26.3 24.6 1.6 - 0.65 Living arrangements and household composition - - - - - - Living arrangements - - - - *** 0.00 Two-parent family 45.1 48.7 34.3 14.4 - - Single-parent family 41.3 41.7 40.3 1.4 - - Group home 1.9 1.5 3.0 -1.5 - - Other institution 5.7 4.0 10.4 -6.4 - - Lives alone or with friends 6.0 4.0 11.9 -7.9 - - Average number of people in household 4.1 4.1 4.2 -0.1 - 0.43 Lives with others with disabilities 27.4 27.7 26.5 1.3 - 0.74 Health insurance coverage - - - - - - Covered by public health insurance 46.7 45.3 50.8 -5.5 - 0.18 Covered by private health insurance 50.5 53.5 41.6 11.9 *** 0.00 Covered by both public and private health ins. 6.2 6.6 5.0 1.6 - 0.41 Covered by public or private health insurance 89.5 91.1 84.9 6.2 ** 0.01 Family socio-economic status - - - - - - Annual income level - - - - - 0.15 Less than $10,000 17.1 15.8 21.6 -5.8 - - $10,000 - $24,999 16.5 16.0 18.3 -2.3 - - $25,000 or more 66.4 68.2 60.1 8.1 - - Public assistance - - - - - - TANF/family assistance 3.7 3.3 4.8 -1.5 - 0.35 SNAP (food stamps) 18.4 18.5 18.2 0.3 - 0.93 Parents' education - - - - - - Mother HS graduate 79.5 80.1 77.3 2.7 - 0.46 Father HS graduate 75.9 76.7 72.8 3.9 - 0.38 Parents' employment status - - - - - - Mother currently employed 70.6 70.6 70.7 -0.2 - 0.97 Father currently employed 78.2 78.3 78.1 0.2 - 0.97 Self-reported health status - - - - - - Excellent 27.7 26.4 31.5 -5.1 - - Very good/good 60.9 62.2 57.1 5.0 - - Fair/poor 11.4 11.4 11.3 0.1 - -

FINAL REPORT ON THE YTD EVALUATION APPENDIX A: ADDITIONAL ANALYSES
TABLE A.5e (CONTINUED)
A.50
Characteristic All Respondents Non-
respondents Difference - p-value Assistance - - - - - - Reading, hearing, speaking, or walking aids 5.8 5.7 5.9 -0.2 - 0.92 Help with personal care needs 2.1 2.2 2.0 0.2 - 0.86 Independent activities - - - - - - Decide by selves how to spend money 95.5 95.3 96.1 -0.8 - 0.65 Pick clothes to wear 98.7 98.7 99.0 -0.4 - 0.69 Make snacks or sandwiches 97.1 96.8 98.0 -1.2 - 0.37 Ride public transportation alone 82.8 80.6 89.2 -8.5 *** 0.01 Decide how to spend free time 97.1 97.8 95.1 2.7 ** 0.04 Expectations about the future - - - - - - Expects to live independently (w/ or w/o help) 80.4 78.5 86.1 -7.6 ** 0.02 Expects to continue education 95.2 94.6 97.0 -2.4 - 0.18 Expects to work at least part-time for pay 98.2 97.7 99.5 -1.8 - 0.11 Random assignment cohort - - - - - - Randomly assigned before October 1, 2009 50.6 50.1 52.2 -2.1 - 0.60
Administrative data Demographic characteristics - - - - - - Male 67.0 67.2 66.5 0.7 - 0.85 Age (in years) - - - - - 0.99 15-17 46.4 46.2 46.8 -0.6 - - 18-21 52.1 52.3 51.7 0.5 - - 22-23 1.5 1.5 1.5 0.0 - - Average age (in years) 17.7 17.7 17.7 0.0 - 0.72 Benefits - - - - - - Received SSA benefits in prior year 20.9 20.8 21.2 -0.3 - 0.92 Benefit amount in prior year ($) 1,326 1,301 1,398 -97 - 0.70 Earnings - - - - - - Earnings in prior year ($) 1,028 1,046 975 71 - 0.85 Sample size 798 595 203 - - -
Sources: YTD baseline survey and SSA administrative records. Notes: Baseline survey item non-response may have resulted in smaller sample sizes for some characteristics than indicated at
the bottom of the table. Missing information on primary disabling condition resulted in a smaller sample size for this characteristic than shown at the bottom of the table. All dollar amounts shown in the table are in 2008 dollars.
*/**/*** Respondent-non-respondent difference is statistically different from zero at the .10/.05/.01 level using either a two-tailed t-test or a chi-square test.
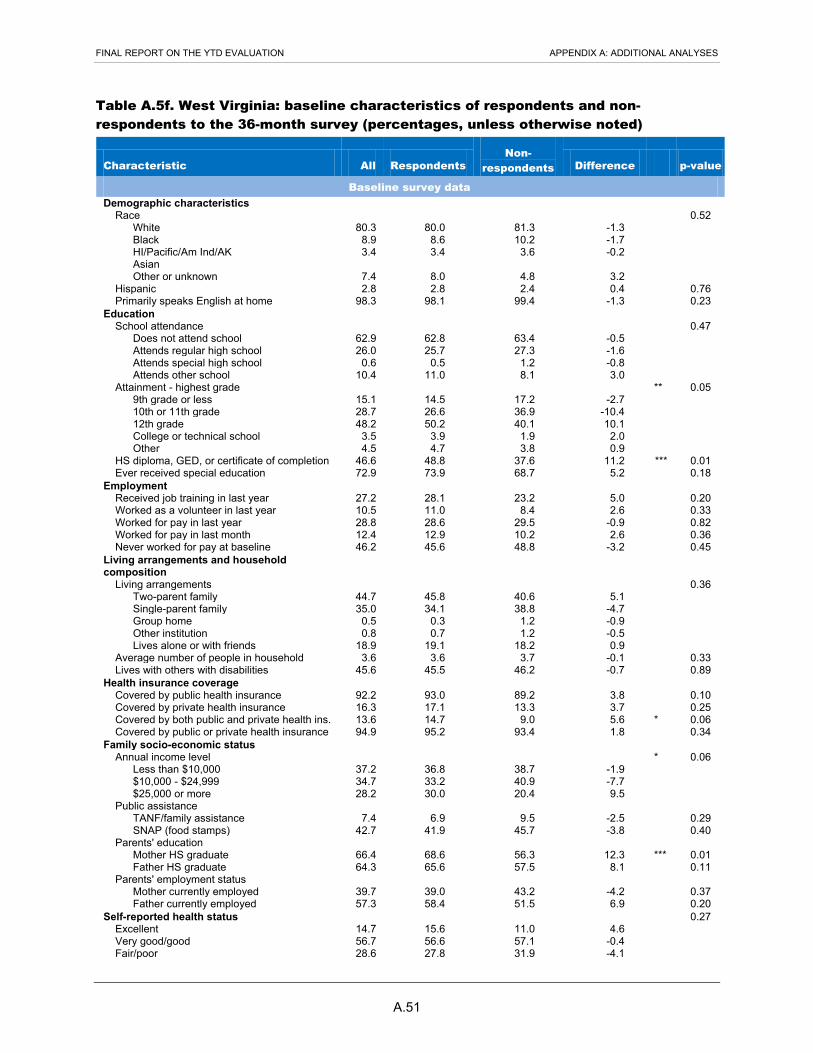
FINAL REPORT ON THE YTD EVALUATION APPENDIX A: ADDITIONAL ANALYSES
A.51
Table A.5f. West Virginia: baseline characteristics of respondents and non-respondents to the 36-month survey (percentages, unless otherwise noted)
Characteristic All Respondents Non-
respondents Difference - p-value
Baseline survey data Demographic characteristics - - - - - - Race - - - - - 0.52 White 80.3 80.0 81.3 -1.3 - - Black 8.9 8.6 10.2 -1.7 - - HI/Pacific/Am Ind/AK 3.4 3.4 3.6 -0.2 - - Asian - - - - - - Other or unknown 7.4 8.0 4.8 3.2 - - Hispanic 2.8 2.8 2.4 0.4 - 0.76 Primarily speaks English at home 98.3 98.1 99.4 -1.3 - 0.23 Education - - - - - - School attendance - - - - - 0.47 Does not attend school 62.9 62.8 63.4 -0.5 - - Attends regular high school 26.0 25.7 27.3 -1.6 - - Attends special high school 0.6 0.5 1.2 -0.8 - - Attends other school 10.4 11.0 8.1 3.0 - - Attainment - highest grade - - - - ** 0.05 9th grade or less 15.1 14.5 17.2 -2.7 - - 10th or 11th grade 28.7 26.6 36.9 -10.4 - - 12th grade 48.2 50.2 40.1 10.1 - - College or technical school 3.5 3.9 1.9 2.0 - - Other 4.5 4.7 3.8 0.9 - - HS diploma, GED, or certificate of completion 46.6 48.8 37.6 11.2 *** 0.01 Ever received special education 72.9 73.9 68.7 5.2 - 0.18 Employment - - - - - - Received job training in last year 27.2 28.1 23.2 5.0 - 0.20 Worked as a volunteer in last year 10.5 11.0 8.4 2.6 - 0.33 Worked for pay in last year 28.8 28.6 29.5 -0.9 - 0.82 Worked for pay in last month 12.4 12.9 10.2 2.6 - 0.36 Never worked for pay at baseline 46.2 45.6 48.8 -3.2 - 0.45 Living arrangements and household composition - - - - - - Living arrangements - - - - - 0.36 Two-parent family 44.7 45.8 40.6 5.1 - - Single-parent family 35.0 34.1 38.8 -4.7 - - Group home 0.5 0.3 1.2 -0.9 - - Other institution 0.8 0.7 1.2 -0.5 - - Lives alone or with friends 18.9 19.1 18.2 0.9 - - Average number of people in household 3.6 3.6 3.7 -0.1 - 0.33 Lives with others with disabilities 45.6 45.5 46.2 -0.7 - 0.89 Health insurance coverage - - - - - - Covered by public health insurance 92.2 93.0 89.2 3.8 - 0.10 Covered by private health insurance 16.3 17.1 13.3 3.7 - 0.25 Covered by both public and private health ins. 13.6 14.7 9.0 5.6 * 0.06 Covered by public or private health insurance 94.9 95.2 93.4 1.8 - 0.34 Family socio-economic status - - - - - - Annual income level - - - - * 0.06 Less than $10,000 37.2 36.8 38.7 -1.9 - - $10,000 - $24,999 34.7 33.2 40.9 -7.7 - - $25,000 or more 28.2 30.0 20.4 9.5 - - Public assistance - - - - - - TANF/family assistance 7.4 6.9 9.5 -2.5 - 0.29 SNAP (food stamps) 42.7 41.9 45.7 -3.8 - 0.40 Parents' education - - - - - - Mother HS graduate 66.4 68.6 56.3 12.3 *** 0.01 Father HS graduate 64.3 65.6 57.5 8.1 - 0.11 Parents' employment status - - - - - - Mother currently employed 39.7 39.0 43.2 -4.2 - 0.37 Father currently employed 57.3 58.4 51.5 6.9 - 0.20 Self-reported health status - - - - - 0.27 Excellent 14.7 15.6 11.0 4.6 - - Very good/good 56.7 56.6 57.1 -0.4 - - Fair/poor 28.6 27.8 31.9 -4.1 - -

FINAL REPORT ON THE YTD EVALUATION APPENDIX A: ADDITIONAL ANALYSES
TABLE A.5f (CONTINUED)
A.52
Characteristic All Respondents Non-
respondents Difference - p-value Assistance - - - - - - Reading, hearing, speaking, or walking aids 18.1 18.7 15.8 2.9 - 0.38 Help with personal care needs 14.4 15.3 10.8 4.4 - 0.15 Independent activities - - - - - - Decide by selves how to spend money 85.9 85.4 88.0 -2.6 - 0.39 Pick clothes to wear 96.0 95.9 96.4 -0.5 - 0.76 Make snacks or sandwiches 92.6 92.5 93.4 -0.9 - 0.69 Ride public transportation alone 44.5 43.1 50.3 -7.2 * 0.09 Decide how to spend free time 94.3 94.2 94.6 -0.4 - 0.84 Expectations about the future - - - - - - Expects to live independently (w/ or w/o help) 72.9 70.6 81.6 -11.0 *** 0.01 Expects to continue education 65.9 65.5 67.6 -2.1 - 0.64 Expects to work at least part-time for pay 77.9 80.1 69.4 10.6 *** 0.01 Random assignment cohort - - - - - - Randomly assigned before June 1, 2009 49.8 49.3 51.8 -2.5 - 0.56 Location within a YTD project's service delivery area - - - - - - WV region 1 (North) 46.7 48.2 40.4 7.9 * 0.07
Administrative data Demographic characteristics - - - - - - Male 57.6 56.8 60.8 -4.0 - 0.35 Age (in years) - - - - - 0.71 14-17 18.5 18.3 19.3 -0.9 - - 18-21 42.5 42.0 44.6 -2.6 - - 22-25 39.0 39.6 36.1 3.5 - - Average age (in years) 20.5 20.5 20.3 0.2 - 0.33 Language - - - - - 0.23 English 98.3 98.1 99.4 -1.3 - - Spanish - - - - - - Other - - - - - - Unknown/missing 1.7 1.9 0.6 1.3 - - Benefits - - - - - - Representative payee type - - - - - 0.79 None 27.1 26.8 28.3 -1.5 - - Natural/adoptive/step parent 56.8 57.5 53.6 3.9 - - Other relative 9.0 8.9 9.6 -0.8 - - Other 7.1 6.8 8.4 -1.6 - - SSA beneficiary status - - - - - - SSI (only or concurrent with CDB or DI) 93.8 94.1 92.8 1.3 - 0.53 Duration of benefit entitlement (in years) 7.9 8.0 7.1 0.9 * 0.08 Benefit amount in prior year ($) 6,395 6,459 6,134 325 - 0.13 Health status - - - - - - Primary disabling condition (SSA data) - - - - - 0.55 Mental illness 24.1 24.4 23.1 1.3 - - Cognitive/developmental disability 41.2 41.9 38.5 3.5 - - Learning disability/ADD 13.9 12.8 18.2 -5.4 - - Physical disability 16.4 16.7 15.4 1.3 - - Speech, hearing, visual impairment 4.3 4.2 4.9 -0.7 - - Duration of disability (in years) 8.2 8.4 7.6 0.8 - 0.15 Earnings - - - - - - Earnings in prior year ($) 755 725 920 -195 - 0.32 Sample size 842 676 166 - - -
Sources: YTD baseline survey and SSA administrative records. Notes: Baseline survey item non-response may have resulted in smaller sample sizes for some characteristics than indicated at
the bottom of the table. Missing information on primary disabling condition resulted in a smaller sample size for this characteristic than shown at the bottom of the table. All dollar amounts shown in the table are in 2008 dollars.
*/**/*** Respondent-non-respondent difference is statistically different from zero at the .10/.05/.01 level using either a two-tailed t-test or a chi-square test.

A.53
Table A.6. Impacts on outcomes measured from administrative records, 36-month survey respondent sample and full research sample (percentages, unless otherwise noted)
- 36-month survey respondent sample - Full research sample
Outcome Treatment
mean Control mean Impact - p-value -
Treatment mean
Control mean Impact - p-value
Bronx County, New York Calendar year employment (based on IRS records) - - - - - - - - - -
First calendar year following enrollment 49.4 25.0 24.5 *** 0.00 48.1 24.3 23.8 *** 0.00 Second calendar year following enrollment 34.8 30.6 4.2 0.22 34.8 30.0 4.9 0.11 Third calendar year following enrollment 33.9 34.4 -0.5 0.88 34.5 33.7 0.8 0.79
Calendar year earnings (based on IRS records) ($)a - - - - - - - - First calendar year following enrollment 617 562 55 0.61 643 523 120 0.18 Second calendar year following enrollment 828 880 -52 0.75 865 930 -65 0.69 Third calendar year following enrollment 954 1,342 -388 0.13 1,094 1,385 -291 0.20
Any disability benefits (from SSA files) in the past year 88.7 74.2 14.6 *** 0.00 85.7 73.9 11.8 *** 0.00 Total amount of disability benefits (from SSA files) in the past year ($)a
6,557 4,938 1,619 *** 0.00 6,322 4,868 1,454 *** 0.00
Sample size 420 320 - - 491 393 - -
Colorado Calendar year employment (based on IRS records) - - - - - - - -
First calendar year following enrollment 38.6 37.8 0.9 0.78 38.6 38.6 0.0 0.99 Second calendar year following enrollment 44.8 38.0 6.8 ** 0.04 42.8 37.7 5.2 * 0.09 Third calendar year following enrollment 38.8 35.0 3.8 0.25 36.7 35.6 1.1 0.73
Calendar year earnings (based on IRS records) ($)a - - - - - - - - First calendar year following enrollment 1,587 1,385 203 0.34 1,571 1,413 157 0.43 Second calendar year following enrollment 1,894 1,512 382 0.14 1,807 1,569 239 0.34 Third calendar year following enrollment 1,885 1,620 265 0.37 1,793 1,719 74 0.80
Any disability benefits (from SSA files) in the past year 92.5 91.4 1.1 0.55 93.1 90.3 2.8 * 0.10 Total amount of disability benefits (from SSA files) in the past year ($)a
6,922 6,716 205 0.35 6,878 6,569 309 0.13
Sample size 403 324 - - 462 380 - -
Erie County, New York Calendar year employment (based on IRS records) - - - - - - - -
First calendar year following enrollment 44.1 41.2 3.0 0.37 44.2 41.1 3.1 0.32 Second calendar year following enrollment 38.2 37.9 0.3 0.93 38.2 37.7 0.5 0.88
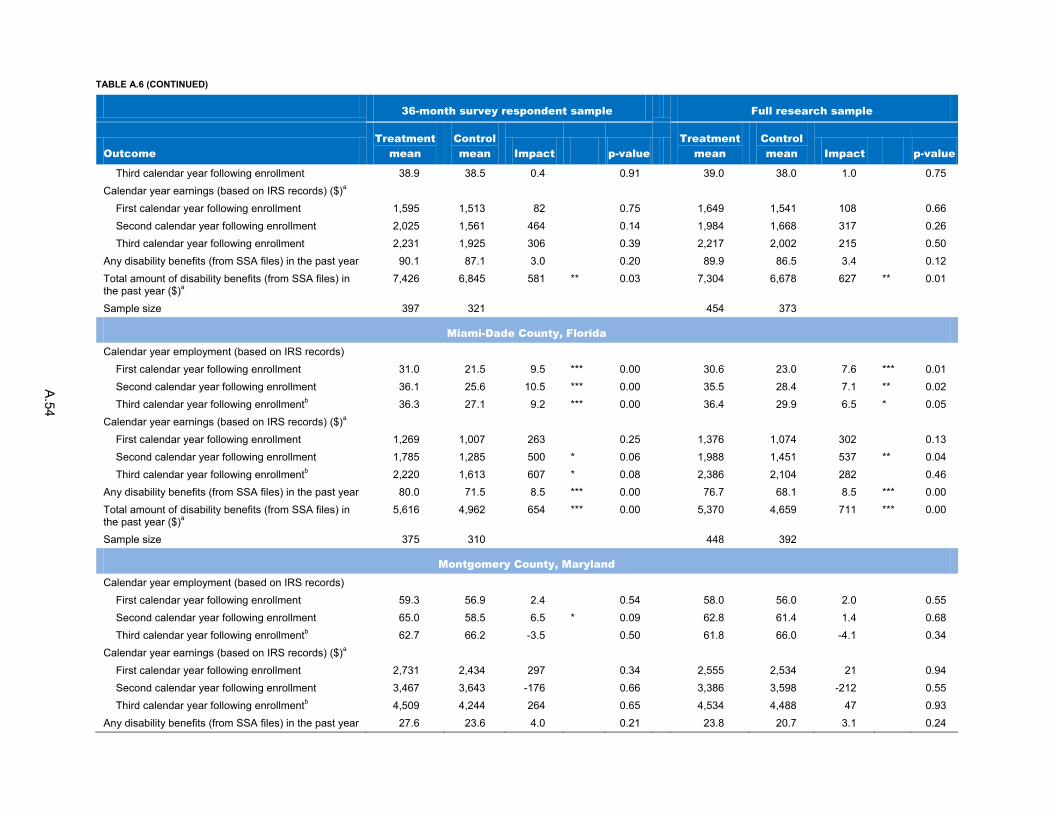
TABLE A.6 (CONTINUED)
A.54
- 36-month survey respondent sample - Full research sample
Outcome Treatment
mean Control mean Impact - p-value -
Treatment mean
Control mean Impact - p-value
Third calendar year following enrollment 38.9 38.5 0.4 0.91 39.0 38.0 1.0 0.75 Calendar year earnings (based on IRS records) ($)a - - - - - - - -
First calendar year following enrollment 1,595 1,513 82 0.75 1,649 1,541 108 0.66 Second calendar year following enrollment 2,025 1,561 464 0.14 1,984 1,668 317 0.26 Third calendar year following enrollment 2,231 1,925 306 0.39 2,217 2,002 215 0.50
Any disability benefits (from SSA files) in the past year 90.1 87.1 3.0 0.20 89.9 86.5 3.4 0.12 Total amount of disability benefits (from SSA files) in the past year ($)a
7,426 6,845 581 ** 0.03 7,304 6,678 627 ** 0.01
Sample size 397 321 - - 454 373 - -
Miami-Dade County, Florida Calendar year employment (based on IRS records) - - - - - - - -
First calendar year following enrollment 31.0 21.5 9.5 *** 0.00 30.6 23.0 7.6 *** 0.01 Second calendar year following enrollment 36.1 25.6 10.5 *** 0.00 35.5 28.4 7.1 ** 0.02 Third calendar year following enrollmentb 36.3 27.1 9.2 *** 0.00 36.4 29.9 6.5 * 0.05
Calendar year earnings (based on IRS records) ($)a - - - - - - - - First calendar year following enrollment 1,269 1,007 263 0.25 1,376 1,074 302 0.13 Second calendar year following enrollment 1,785 1,285 500 * 0.06 1,988 1,451 537 ** 0.04 Third calendar year following enrollmentb 2,220 1,613 607 * 0.08 2,386 2,104 282 0.46
Any disability benefits (from SSA files) in the past year 80.0 71.5 8.5 *** 0.00 76.7 68.1 8.5 *** 0.00 Total amount of disability benefits (from SSA files) in the past year ($)a
5,616 4,962 654 *** 0.00 5,370 4,659 711 *** 0.00
Sample size 375 310 - - 448 392 - -
Montgomery County, Maryland Calendar year employment (based on IRS records) - - - - - - - -
First calendar year following enrollment 59.3 56.9 2.4 0.54 58.0 56.0 2.0 0.55 Second calendar year following enrollment 65.0 58.5 6.5 * 0.09 62.8 61.4 1.4 0.68 Third calendar year following enrollmentb 62.7 66.2 -3.5 0.50 61.8 66.0 -4.1 0.34
Calendar year earnings (based on IRS records) ($)a - - - - - - - - First calendar year following enrollment 2,731 2,434 297 0.34 2,555 2,534 21 0.94 Second calendar year following enrollment 3,467 3,643 -176 0.66 3,386 3,598 -212 0.55 Third calendar year following enrollmentb 4,509 4,244 264 0.65 4,534 4,488 47 0.93
Any disability benefits (from SSA files) in the past year 27.6 23.6 4.0 0.21 23.8 20.7 3.1 0.24

TABLE A.6 (CONTINUED)
A.55
- 36-month survey respondent sample - Full research sample
Outcome Treatment
mean Control mean Impact - p-value -
Treatment mean
Control mean Impact - p-value
Total amount of disability benefits (from SSA files) in the past year ($)a
1,830 1,700 130 0.59 1,603 1,441 162 0.41
Sample size 320 275 - - 416 382 - -
West Virginia Calendar year employment (based on IRS records) - - - - - - - -
First calendar year following enrollment 46.8 26.0 20.8 *** 0.00 45.3 27.6 17.6 *** 0.00 Second calendar year following enrollment 40.3 27.3 12.9 *** 0.00 39.4 28.7 10.7 *** 0.00 Third calendar year following enrollmentb 35.4 24.6 10.8 ** 0.01 36.2 28.7 7.6 * 0.06
Calendar year earnings (based on IRS records) ($)a - - - - - - - - First calendar year following enrollment 1,531 1,252 280 0.17 1,665 1,235 430 ** 0.04 Second calendar year following enrollment 1,734 1,609 125 0.68 1,790 1,591 199 0.46 Third calendar year following enrollmentb 1,799 1,561 238 0.60 1,952 1,780 172 0.67
Any disability benefits (from SSA files) in the past year 90.4 84.0 6.4 ** 0.01 88.6 80.9 7.8 *** 0.00 Total amount of disability benefits (from SSA files) in the past year ($)a
6,575 5,845 730 *** 0.00 6,395 5,668 727 *** 0.00
Sample size 365 311 - - 449 393 - -
Sources: SSA administrative records. Notes: The treatment and control group means and the impact estimates reported in the table are regression adjusted (see Chapter II, Section A.3). We measured explanatory
variables in the regression model before random assignment by using data from the study’s baseline survey and SSA files. For the 36-month survey respondent sample (also referred to as the analytic sample), we calculated all statistics using sample weights to account for interview non-response. The full randomly assigned sample (also referred to as the full research sample) includes all youth enrolled in the evaluation except those who were deceased at the time of the 36-month follow-up survey. “Past year” refers to the year preceding the 36-month survey. All dollar amounts shown in the table are in 2008 dollars.
a We included youth who had no earnings or received no SSA benefits in our calculation of the mean values of these measures. b Administrative data for the third calendar year after youth’s enrollment in the evaluation were not available for 17.3, 40.1, and 41.6 percent of youth in the YTD projects in Miami-Dade County, Montgomery County, and West Virginia, respectively. Consequently, statistics for these measures are based on data for a subset of all youth in the full research sample for each of these projects. */**/*** Impact estimate is significantly different from zero at the .10/.05/.01 level using a two-tailed t-test.
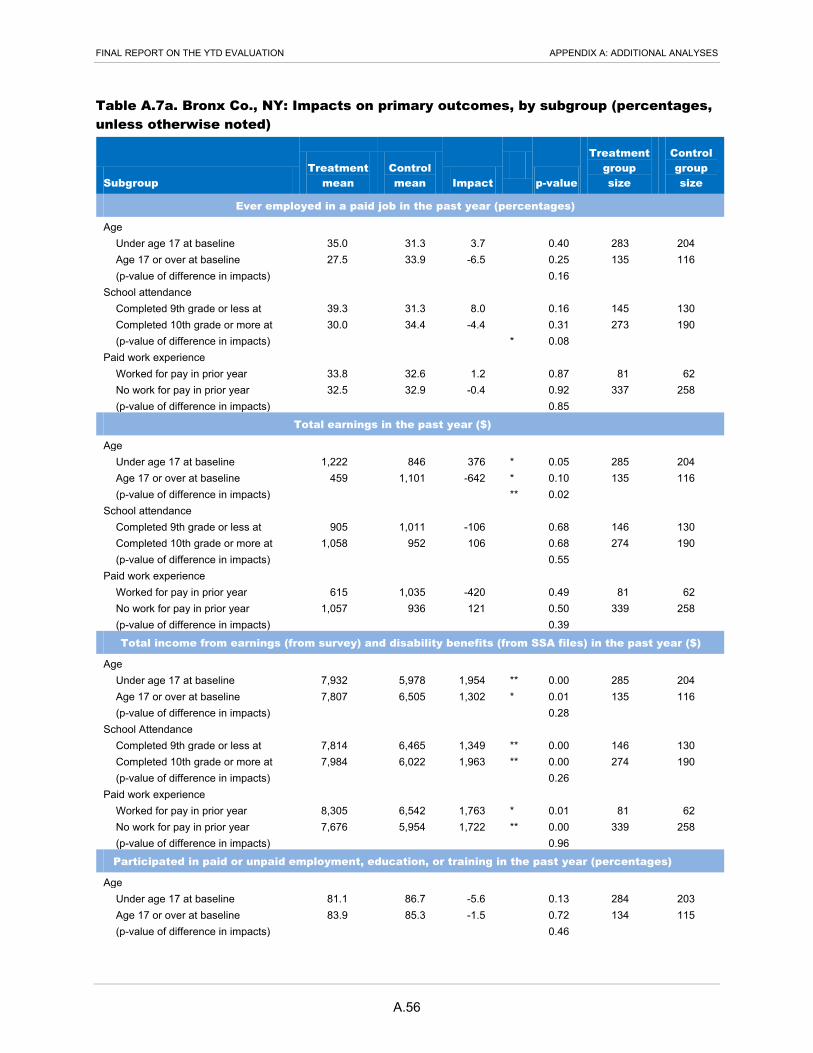
FINAL REPORT ON THE YTD EVALUATION APPENDIX A: ADDITIONAL ANALYSES
A.56
Table A.7a. Bronx Co., NY: Impacts on primary outcomes, by subgroup (percentages, unless otherwise noted)
Subgroup Treatment
mean Control mean Impact
p-value
Treatment group size
Control group size
Ever employed in a paid job in the past year (percentages)
Age - - - - - - - Under age 17 at baseline 35.0 31.3 3.7 - 0.40 283 204 Age 17 or over at baseline 27.5 33.9 -6.5 - 0.25 135 116 (p-value of difference in impacts) - - - - 0.16 - -
School attendance - - - - - - - Completed 9th grade or less at
39.3 31.3 8.0 - 0.16 145 130
Completed 10th grade or more at
30.0 34.4 -4.4 - 0.31 273 190 (p-value of difference in impacts) - - - * 0.08 - -
Paid work experience - - - - - - -
Worked for pay in prior year 33.8 32.6 1.2 - 0.87 81 62 No work for pay in prior year 32.5 32.9 -0.4 - 0.92 337 258 (p-value of difference in impacts) - - - - 0.85 - -
Total earnings in the past year ($)
Age - - - - - - - Under age 17 at baseline 1,222 846 376 * 0.05 285 204 Age 17 or over at baseline 459 1,101 -642 * 0.10 135 116 (p-value of difference in impacts) - - - ** 0.02 - -
School attendance - - - - - - - Completed 9th grade or less at
905 1,011 -106 0.68 146 130
Completed 10th grade or more at
1,058 952 106 0.68 274 190 (p-value of difference in impacts) - - - 0.55 - -
Paid work experience - - - - - - -
Worked for pay in prior year 615 1,035 -420 0.49 81 62 No work for pay in prior year 1,057 936 121 0.50 339 258 (p-value of difference in impacts) - - - - 0.39 - -
Total income from earnings (from survey) and disability benefits (from SSA files) in the past year ($)
Age - - - - - - - Under age 17 at baseline 7,932 5,978 1,954 ** 0.00 285 204 Age 17 or over at baseline 7,807 6,505 1,302 * 0.01 135 116 (p-value of difference in impacts) - - - - 0.28 - -
School Attendance - - - - - - - Completed 9th grade or less at
7,814 6,465 1,349 ** 0.00 146 130
Completed 10th grade or more at
7,984 6,022 1,963 ** 0.00 274 190 (p-value of difference in impacts) - - - - 0.26 - -
Paid work experience - - - - - - - Worked for pay in prior year 8,305 6,542 1,763 * 0.01 81 62 No work for pay in prior year 7,676 5,954 1,722 ** 0.00 339 258 (p-value of difference in impacts) - - - - 0.96 - -
Participated in paid or unpaid employment, education, or training in the past year (percentages)
Age - - - - - - - Under age 17 at baseline 81.1 86.7 -5.6 - 0.13 284 203 Age 17 or over at baseline 83.9 85.3 -1.5 - 0.72 134 115 (p-value of difference in impacts) - - - - 0.46 - -

FINAL REPORT ON THE YTD EVALUATION APPENDIX A: ADDITIONAL ANALYSES
TABLE A.7 (CONTINUED)
A.57
Subgroup Treatment
mean Control mean Impact
p-value
Treatment group size
Control group size
School attendance - - - - - - - Completed 9th grade or less at
85.9 84.8 1.1 - 0.81 146 130
Completed 10th grade or more at
80.7 87.3 -6.6 * 0.06 272 188 (p-value of difference in impacts) - - - - 0.20 - -
Paid work experience - - - - - - - Worked for pay in prior year 70.8 86.3 -15.5 * 0.05 80 61 No work for pay in prior year 83.9 85.8 -1.9 - 0.51 338 257 (p-value of difference in impacts) - - - - 0.14 - -
Arrested or charged with delinquency or a criminal complaint in the past year (percentages)
Age - - - - - - -
Under age 17 at baseline 2.8 8.1 -5.3 *** 0.00 285 204 Age 17 or over at baseline 6.6 5.5 1.1 - 0.74 135 116 (p-value of difference in impacts) - - - * 0.07 - -
School attendance - - - - - - - Completed 9th grade or less at
2.4 7.6 -5.1 *** 0.01 146 130
Completed 10th grade or more at
5.4 5.8 -0.3 - 0.91 274 190 (p-value of difference in impacts) - - - - 0.13 - -
Paid work experience - - - - - - - Worked for pay in prior year 3.1 6.4 -3.3 - 0.18 81 62 No work for pay in prior year 3.7 7.1 -3.4 * 0.08 339 258 (p-value of difference in impacts) - - - - 0.89 - -
Index of self-determination (4-point scale)
Age - - - - - - -
Under age 17 at baseline 2.9 2.9 0.0 - 0.77 232 158 Age 17 or over at baseline 2.8 2.9 -0.1 - 0.24 111 95 (p-value of difference in impacts) - - - - 0.27 - -
School attendance - - - - - - - Completed 9th grade or less at
2.8 2.9 -0.1 - 0.39 123 107
Completed 10th grade or more at
2.9 2.9 0.0 - 0.93 220 146 (p-value of difference in impacts) - - - - 0.47 - -
Paid work experience - - - - - - - Worked for pay in prior year 2.9 2.9 0.0 - 0.70 72 54 No work for pay in prior year 2.8 2.9 0.0 - 0.50 271 199 (p-value of difference in impacts) - - - - 0.51 - -
Sources: YTD 36-month survey and SSA administrative records. Notes: The treatment and control group means and the impact estimates reported in the table are regression adjusted (see
Chapter II, Section A.3). We measured explanatory variables in the regression model before enrollment in the evaluation by using data from the study’s baseline survey and SSA files. Statistics for the outcome measures are based on data for all youth in the analysis sample for the YTD project, which comprises treatment and control group youth who completed the 36-month survey. We calculated all statistics with sample weights to account for interview non-response. Survey item non-response may have resulted in smaller sample sizes for specific outcomes, as indicated in the table. “Past year” refers to the year preceding the 36-month survey. All dollar amounts shown in the table are in 2008 dollars.
*/**/*** Impact estimate is significantly different from zero at the .10/.05/.01 level using a two-tailed t-test.
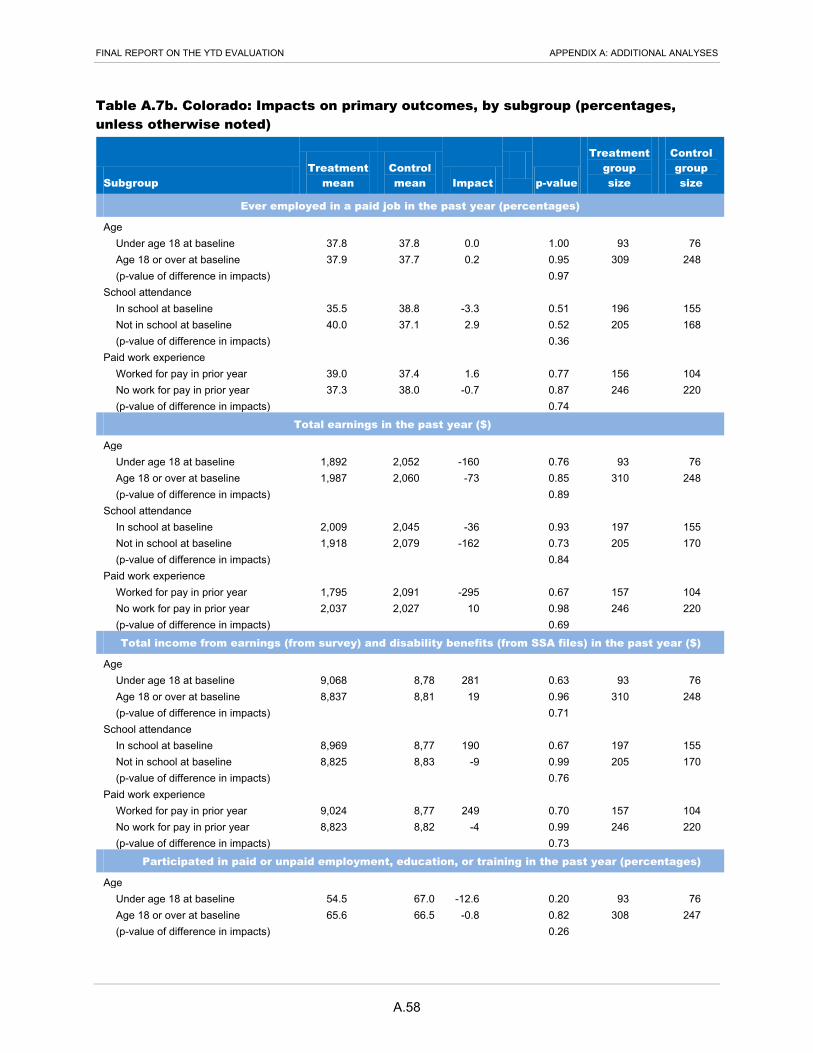
FINAL REPORT ON THE YTD EVALUATION APPENDIX A: ADDITIONAL ANALYSES
A.58
Table A.7b. Colorado: Impacts on primary outcomes, by subgroup (percentages, unless otherwise noted)
Subgroup Treatment
mean Control mean Impact
p-value
Treatment group size
Control group size
Ever employed in a paid job in the past year (percentages)
Age - - - - - - - Under age 18 at baseline 37.8 37.8 0.0 - 1.00 93 76 Age 18 or over at baseline 37.9 37.7 0.2 - 0.95 309 248 (p-value of difference in impacts) - - - - 0.97 - -
School attendance - - - - - - - In school at baseline 35.5 38.8 -3.3 - 0.51 196 155 Not in school at baseline 40.0 37.1 2.9 - 0.52 205 168 (p-value of difference in impacts) - - - - 0.36 - -
Paid work experience - - - - - - -
Worked for pay in prior year 39.0 37.4 1.6 - 0.77 156 104 No work for pay in prior year 37.3 38.0 -0.7 - 0.87 246 220 (p-value of difference in impacts) - - - - 0.74 - -
Total earnings in the past year ($)
Age - - - - - - - Under age 18 at baseline 1,892 2,052 -160 - 0.76 93 76 Age 18 or over at baseline 1,987 2,060 -73 - 0.85 310 248 (p-value of difference in impacts) - - - - 0.89 - -
School attendance - - - - - - - In school at baseline 2,009 2,045 -36 - 0.93 197 155 Not in school at baseline 1,918 2,079 -162 - 0.73 205 170 (p-value of difference in impacts) - - - - 0.84 - -
Paid work experience - - - - - - -
Worked for pay in prior year 1,795 2,091 -295 - 0.67 157 104 No work for pay in prior year 2,037 2,027 10 - 0.98 246 220 (p-value of difference in impacts) - - - - 0.69 - -
Total income from earnings (from survey) and disability benefits (from SSA files) in the past year ($)
Age - - - - - - - Under age 18 at baseline 9,068 8,78
281 - 0.63 93 76
Age 18 or over at baseline 8,837 8,81
19 - 0.96 310 248 (p-value of difference in impacts) - - - - 0.71 - -
School attendance - - - - - - - In school at baseline 8,969 8,77
190 - 0.67 197 155
Not in school at baseline 8,825 8,83
-9 - 0.99 205 170 (p-value of difference in impacts) - - - - 0.76 - -
Paid work experience - - - - - - - Worked for pay in prior year 9,024 8,77
249 - 0.70 157 104
No work for pay in prior year 8,823 8,82
-4 - 0.99 246 220 (p-value of difference in impacts) - - - - 0.73 - -
Participated in paid or unpaid employment, education, or training in the past year (percentages)
Age - - - - - - - Under age 18 at baseline 54.5 67.0 -12.6 - 0.20 93 76 Age 18 or over at baseline 65.6 66.5 -0.8 - 0.82 308 247 (p-value of difference in impacts) - - - - 0.26 - -
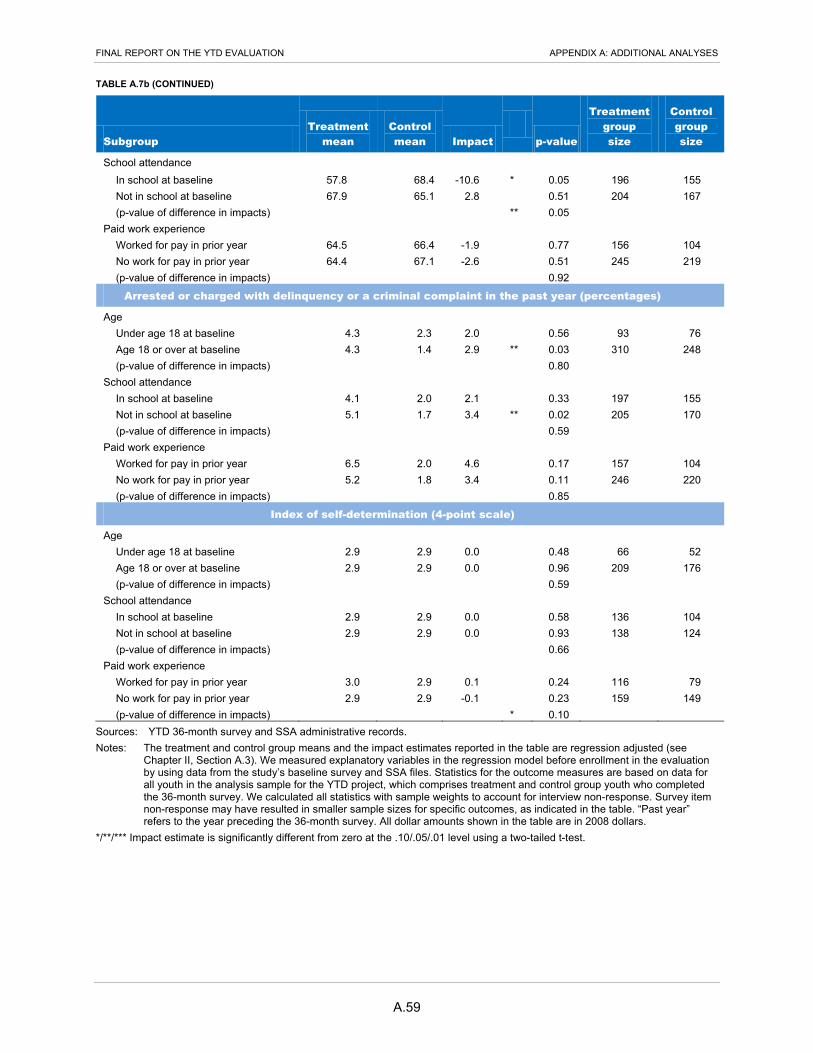
FINAL REPORT ON THE YTD EVALUATION APPENDIX A: ADDITIONAL ANALYSES
TABLE A.7b (CONTINUED)
A.59
Subgroup Treatment
mean Control mean Impact
p-value
Treatment group size
Control group size
School attendance - - - - - - -
In school at baseline 57.8 68.4 -10.6 * 0.05 196 155 Not in school at baseline 67.9 65.1 2.8 - 0.51 204 167 (p-value of difference in impacts) - - - ** 0.05 - -
Paid work experience - - - - - - - Worked for pay in prior year 64.5 66.4 -1.9 - 0.77 156 104 No work for pay in prior year 64.4 67.1 -2.6 - 0.51 245 219 (p-value of difference in impacts) - - - - 0.92 - -
Arrested or charged with delinquency or a criminal complaint in the past year (percentages)
Age - - - - - - - Under age 18 at baseline 4.3 2.3 2.0 - 0.56 93 76 Age 18 or over at baseline 4.3 1.4 2.9 ** 0.03 310 248 (p-value of difference in impacts) - - - - 0.80 - -
School attendance - - - - - - -
In school at baseline 4.1 2.0 2.1 - 0.33 197 155 Not in school at baseline 5.1 1.7 3.4 ** 0.02 205 170 (p-value of difference in impacts) - - - - 0.59 - -
Paid work experience - - - - - - - Worked for pay in prior year 6.5 2.0 4.6 - 0.17 157 104 No work for pay in prior year 5.2 1.8 3.4 - 0.11 246 220 (p-value of difference in impacts) - - - - 0.85 - -
Index of self-determination (4-point scale)
Age - - - - - - - Under age 18 at baseline 2.9 2.9 0.0 - 0.48 66 52 Age 18 or over at baseline 2.9 2.9 0.0 - 0.96 209 176 (p-value of difference in impacts) - - - - 0.59 - -
School attendance - - - - - - -
In school at baseline 2.9 2.9 0.0 - 0.58 136 104 Not in school at baseline 2.9 2.9 0.0 - 0.93 138 124 (p-value of difference in impacts) - - - - 0.66 - -
Paid work experience - - - - - - - Worked for pay in prior year 3.0 2.9 0.1 - 0.24 116 79 No work for pay in prior year 2.9 2.9 -0.1 - 0.23 159 149 (p-value of difference in impacts) - - - * 0.10 - -
Sources: YTD 36-month survey and SSA administrative records. Notes: The treatment and control group means and the impact estimates reported in the table are regression adjusted (see
Chapter II, Section A.3). We measured explanatory variables in the regression model before enrollment in the evaluation by using data from the study’s baseline survey and SSA files. Statistics for the outcome measures are based on data for all youth in the analysis sample for the YTD project, which comprises treatment and control group youth who completed the 36-month survey. We calculated all statistics with sample weights to account for interview non-response. Survey item non-response may have resulted in smaller sample sizes for specific outcomes, as indicated in the table. “Past year” refers to the year preceding the 36-month survey. All dollar amounts shown in the table are in 2008 dollars.
*/**/*** Impact estimate is significantly different from zero at the .10/.05/.01 level using a two-tailed t-test.
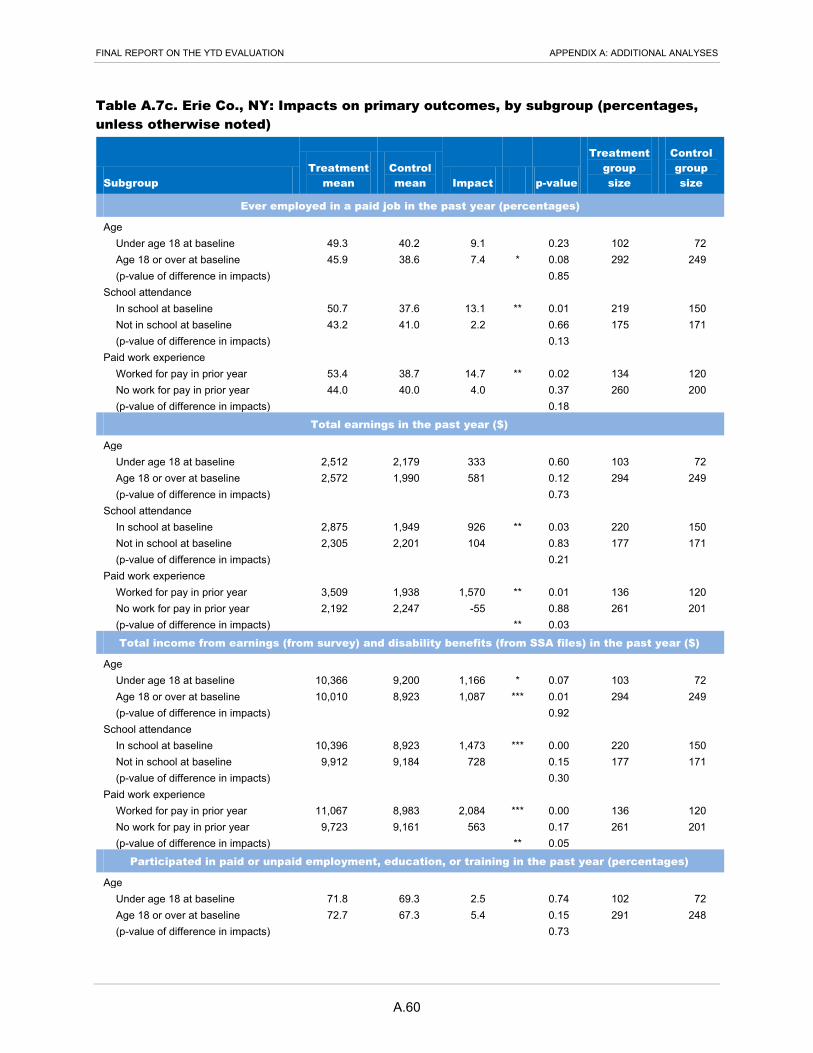
FINAL REPORT ON THE YTD EVALUATION APPENDIX A: ADDITIONAL ANALYSES
A.60
Table A.7c. Erie Co., NY: Impacts on primary outcomes, by subgroup (percentages, unless otherwise noted)
Subgroup Treatment
mean Control mean Impact p-value
Treatment group size
Control group size
Ever employed in a paid job in the past year (percentages)
Age - - - - - - - Under age 18 at baseline 49.3 40.2 9.1 - 0.23 102 72 Age 18 or over at baseline 45.9 38.6 7.4 * 0.08 292 249 (p-value of difference in impacts) - - - - 0.85 - -
School attendance - - - - - - - In school at baseline 50.7 37.6 13.1 ** 0.01 219 150 Not in school at baseline 43.2 41.0 2.2 - 0.66 175 171 (p-value of difference in impacts) - - - - 0.13 - -
Paid work experience - - - - - - -
Worked for pay in prior year 53.4 38.7 14.7 ** 0.02 134 120 No work for pay in prior year 44.0 40.0 4.0 - 0.37 260 200 (p-value of difference in impacts) - - - - 0.18 - -
Total earnings in the past year ($)
Age - - - - - - - Under age 18 at baseline 2,512 2,179 333 - 0.60 103 72 Age 18 or over at baseline 2,572 1,990 581 - 0.12 294 249 (p-value of difference in impacts) - - - - 0.73 - -
School attendance - - - - - - - In school at baseline 2,875 1,949 926 ** 0.03 220 150 Not in school at baseline 2,305 2,201 104 - 0.83 177 171 (p-value of difference in impacts) - - - - 0.21 - -
Paid work experience - - - - - - -
Worked for pay in prior year 3,509 1,938 1,570 ** 0.01 136 120 No work for pay in prior year 2,192 2,247 -55 - 0.88 261 201 (p-value of difference in impacts) - - - ** 0.03 - -
Total income from earnings (from survey) and disability benefits (from SSA files) in the past year ($)
Age - - - - - - - Under age 18 at baseline 10,366 9,200 1,166 * 0.07 103 72 Age 18 or over at baseline 10,010 8,923 1,087 *** 0.01 294 249 (p-value of difference in impacts) - - - - 0.92 - -
School attendance - - - - - - - In school at baseline 10,396 8,923 1,473 *** 0.00 220 150 Not in school at baseline 9,912 9,184 728 - 0.15 177 171 (p-value of difference in impacts) - - - - 0.30 - -
Paid work experience - - - - - - - Worked for pay in prior year 11,067 8,983 2,084 *** 0.00 136 120 No work for pay in prior year 9,723 9,161 563 - 0.17 261 201 (p-value of difference in impacts) - - - ** 0.05 - -
Participated in paid or unpaid employment, education, or training in the past year (percentages)
Age - - - - - - - Under age 18 at baseline 71.8 69.3 2.5 - 0.74 102 72 Age 18 or over at baseline 72.7 67.3 5.4 - 0.15 291 248 (p-value of difference in impacts) - - - - 0.73 - -
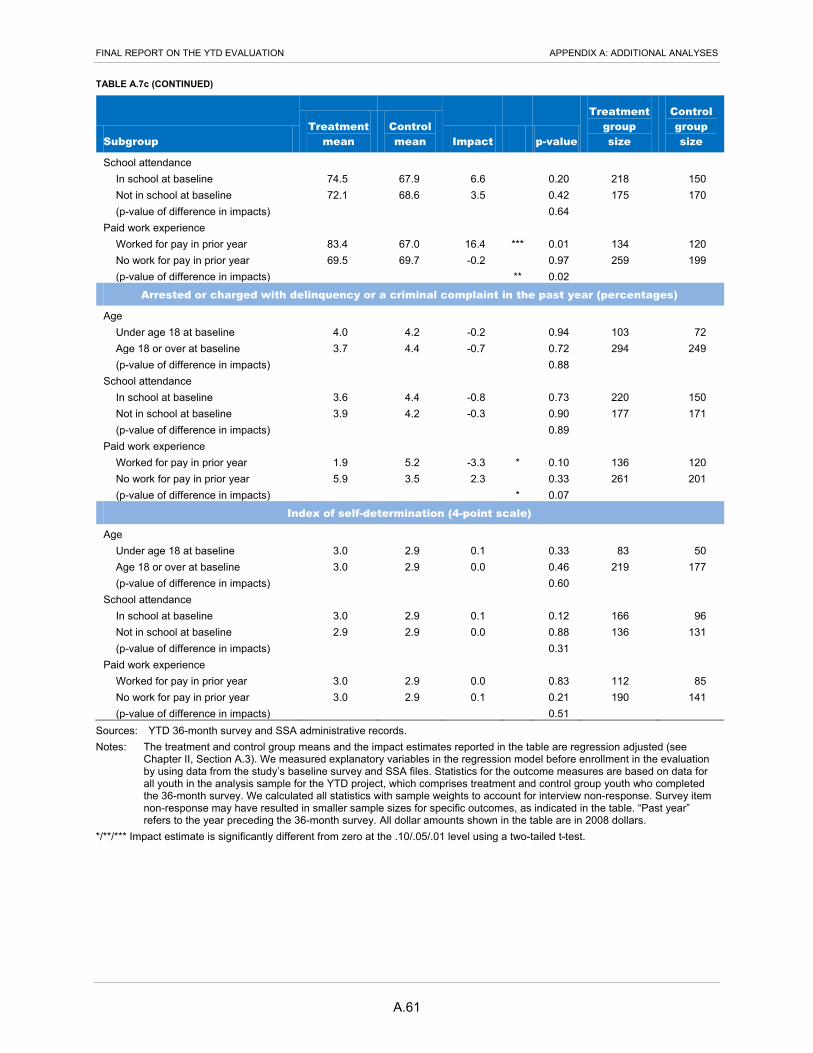
FINAL REPORT ON THE YTD EVALUATION APPENDIX A: ADDITIONAL ANALYSES
TABLE A.7c (CONTINUED)
A.61
Subgroup Treatment
mean Control mean Impact p-value
Treatment group size
Control group size
School attendance - - - - - - - In school at baseline 74.5 67.9 6.6 - 0.20 218 150 Not in school at baseline 72.1 68.6 3.5 - 0.42 175 170 (p-value of difference in impacts) - - - - 0.64 - -
Paid work experience - - - - - - - Worked for pay in prior year 83.4 67.0 16.4 *** 0.01 134 120 No work for pay in prior year 69.5 69.7 -0.2 - 0.97 259 199 (p-value of difference in impacts) - - - ** 0.02 - -
Arrested or charged with delinquency or a criminal complaint in the past year (percentages)
Age - - - - - - -
Under age 18 at baseline 4.0 4.2 -0.2 - 0.94 103 72 Age 18 or over at baseline 3.7 4.4 -0.7 - 0.72 294 249 (p-value of difference in impacts) - - - - 0.88 - -
School attendance - - - - - - - In school at baseline 3.6 4.4 -0.8 - 0.73 220 150 Not in school at baseline 3.9 4.2 -0.3 - 0.90 177 171 (p-value of difference in impacts) - - - - 0.89 - -
Paid work experience - - - - - - - Worked for pay in prior year 1.9 5.2 -3.3 * 0.10 136 120 No work for pay in prior year 5.9 3.5 2.3 - 0.33 261 201 (p-value of difference in impacts) - - - * 0.07 - -
Index of self-determination (4-point scale)
Age - - - - - - -
Under age 18 at baseline 3.0 2.9 0.1 - 0.33 83 50 Age 18 or over at baseline 3.0 2.9 0.0 - 0.46 219 177 (p-value of difference in impacts) - - - - 0.60 - -
School attendance - - - - - - - In school at baseline 3.0 2.9 0.1 - 0.12 166 96 Not in school at baseline 2.9 2.9 0.0 - 0.88 136 131 (p-value of difference in impacts) - - - - 0.31 - -
Paid work experience - - - - - - - Worked for pay in prior year 3.0 2.9 0.0 - 0.83 112 85 No work for pay in prior year 3.0 2.9 0.1 - 0.21 190 141 (p-value of difference in impacts) - - - - 0.51 - -
Sources: YTD 36-month survey and SSA administrative records. Notes: The treatment and control group means and the impact estimates reported in the table are regression adjusted (see
Chapter II, Section A.3). We measured explanatory variables in the regression model before enrollment in the evaluation by using data from the study’s baseline survey and SSA files. Statistics for the outcome measures are based on data for all youth in the analysis sample for the YTD project, which comprises treatment and control group youth who completed the 36-month survey. We calculated all statistics with sample weights to account for interview non-response. Survey item non-response may have resulted in smaller sample sizes for specific outcomes, as indicated in the table. “Past year” refers to the year preceding the 36-month survey. All dollar amounts shown in the table are in 2008 dollars.
*/**/*** Impact estimate is significantly different from zero at the .10/.05/.01 level using a two-tailed t-test.

FINAL REPORT ON THE YTD EVALUATION APPENDIX A: ADDITIONAL ANALYSES
A.62
Table A.7d. Miami-Dade Co., FL: Impacts on primary outcomes, by subgroup (percentages, unless otherwise noted)
Subgroup Treatment
mean Control mean Impact p-value
Treatment group size
Control group size
Ever employed in a paid job in the past year (percentages)
Age - - - - - - - Under age 18 at baseline 31.7 28.7 3.0 - 0.69 78 65 Age 18 or over at baseline 34.5 25.3 9.2 ** 0.02 294 244 (p-value of difference in impacts) - - - - 0.46 - -
School attendance - - - - - - - In school at baseline 30.2 28.5 1.7 - 0.69 227 191 Not in school at baseline 43.0 25.5 17.6 *** 0.00 145 118 (p-value of difference in impacts) - - - ** 0.03 - -
Paid work experience - - - - - - -
Worked for pay in prior year 31.9 28.6 3.3 - 0.66 74 50 No work for pay in prior year 34.6 25.4 9.2 ** 0.02 298 259 (p-value of difference in impacts) - - - - 0.45 - -
Total earnings in the past year ($)
Age - - - - - - - Under age 18 at baseline 1,220 1,587 -367 - 0.55 78 65 Age 18 or over at baseline 2,050 1,179 871 ** 0.01 297 245 (p-value of difference in impacts) - - - * 0.08 - -
School attendance - - - - - - - In school at baseline 1,551 1,549 2 - 1.00 228 192 Not in school at baseline 2,753 1,223 1,530 *** 0.00 146 119 (p-value of difference in impacts) - - - ** 0.01 - -
Paid work experience - - - - - - -
Worked for pay in prior year 2,425 1,442 982 - 0.24 74 50 No work for pay in prior year 1,850 1,320 530 * 0.10 301 260 (p-value of difference in impacts) - - - - 0.62 - -
Total income from earnings (from survey) and disability benefits (from SSA files) in the past year ($)
Age - - - - - - - Under age 18 at baseline 9,104 6,548 2,556 *** 0.00 78 65 Age 18 or over at baseline 7,355 6,450 905 ** 0.02 297 245 (p-value of difference in impacts) - - - ** 0.04 - -
School attendance - - - - - - - In school at baseline 7,746 6,406 1,340 *** 0.00 228 192 Not in school at baseline 7,712 6,596 1,116 * 0.06 146 119 (p-value of difference in impacts) - - - - 0.75 - -
Paid work experience - - - - - - - Worked for pay in prior year 8,165 6,674 1,491 - 0.12 74 50 No work for pay in prior year 7,514 6,324 1,190 *** 0.00 301 260 (p-value of difference in impacts) - - - - 0.77 - -
Participated in paid or unpaid employment, education, or training in the past year (percentages)
Age - - - - - - - Under age 18 at baseline 65.9 67.2 -1.3 - 0.90 77 65 Age 18 or over at baseline 72.1 62.5 9.6 *** 0.01 292 243 (p-value of difference in impacts) - - - - 0.32 - -

FINAL REPORT ON THE YTD EVALUATION APPENDIX A: ADDITIONAL ANALYSES
TABLE A.7d (CONTINUED)
A.63
Subgroup Treatment
mean Control mean Impact p-value
Treatment group size
Control group size
School attendance - - - - - - - In school at baseline 68.2 66.7 1.5 - 0.74 226 190 Not in school at baseline 77.0 63.1 13.9 *** 0.00 143 118 (p-value of difference in impacts) - - - ** 0.04 - -
Paid work experience - - - - - - - Worked for pay in prior year 80.6 65.6 15.0 * 0.08 74 50 No work for pay in prior year 70.8 64.1 6.8 * 0.06 295 258 (p-value of difference in impacts) - - - - 0.33 - -
Arrested or charged with delinquency or a criminal complaint in the past year (percentages)
Age - - - - - - -
Under age 18 at baseline -6.2 2.7 -8.9 *** 0.01 78 65 Age 18 or over at baseline 1.2 2.2 -1.0 - 0.31 297 245 (p-value of difference in impacts) - - - ** 0.03 - -
School attendance - - - - - - - In school at baseline 0.3 2.4 -2.2 * 0.06 228 192 Not in school at baseline -1.0 2.5 -3.4 * 0.08 146 119 (p-value of difference in impacts) - - - - 0.59 - -
Paid work experience - - - - - - - Worked for pay in prior year -1.8 2.2 -4.0 - 0.22 74 50 No work for pay in prior year 0.4 2.8 -2.4 ** 0.02 301 260 (p-value of difference in impacts) - - - - 0.62 - -
Index of self-determination (4-point scale)
Age - - - - - - -
Under age 18 at baseline 2.9 2.8 0.1 - 0.47 56 47 Age 18 or over at baseline 2.8 2.8 0.1 - 0.29 203 170 (p-value of difference in impacts) - - - - 0.90 - -
School attendance - - - - - - - In school at baseline 2.8 2.8 0.0 - 0.84 146 130 Not in school at baseline 2.9 2.8 0.2 ** 0.04 113 87 (p-value of difference in impacts) - - - * 0.09 - -
Paid work experience - - - - - - - Worked for pay in prior year 2.8 2.8 0.1 - 0.62 59 43 No work for pay in prior year 2.8 2.8 0.1 - 0.24 200 174 (p-value of difference in impacts) - - - - 0.92 - -
Sources: YTD 36-month survey and SSA administrative records. Notes: The treatment and control group means and the impact estimates reported in the table are regression adjusted (see
Chapter II, Section A.3). We measured explanatory variables in the regression model before enrollment in the evaluation by using data from the study’s baseline survey and SSA files. Statistics for the outcome measures are based on data for all youth in the analysis sample for the YTD project, which comprises treatment and control group youth who completed the 36-month survey. We calculated all statistics with sample weights to account for interview non-response. Survey item non-response may have resulted in smaller sample sizes for specific outcomes, as indicated in the table. “Past year” refers to the year preceding the 36-month survey. All dollar amounts shown in the table are in 2008 dollars.
*/**/*** Impact estimate is significantly different from zero at the .10/.05/.01 level using a two-tailed t-test.

FINAL REPORT ON THE YTD EVALUATION APPENDIX A: ADDITIONAL ANALYSES
A.64
Table A.7e. Montgomery Co., MD: Impacts on primary outcomes, by subgroup (percentages, unless otherwise noted)
Subgroup Treatment
mean Control mean Impact p-value
Treatment group size
Control group size
Ever employed in a paid job in the past year (percentages)
Age - - - - - - - Under age 18 at baseline 70.4 66.8 3.6 - 0.51 150 123 Age 18 or over at baseline 70.2 66.7 3.5 - 0.51 170 148 (p-value of difference in impacts) - - - - 0.99 - -
School attendance - - - - - - - In school at baseline 70.1 66.0 4.1 - 0.33 248 220 Not in school at baseline 68.9 67.6 1.3 - 0.88 72 51 (p-value of difference in impacts) - - - - 0.78 - -
Paid work experience - - - - - - -
Worked for pay in prior year 70.1 66.6 3.5 - 0.51 185 149 No work for pay in prior year 70.2 66.9 3.3 - 0.56 134 122 (p-value of difference in impacts) - - - - 0.98 - -
Total earnings in the past year ($)
Age - - - - - - - Under age 18 at baseline 7,313 5,936 1,376 - 0.12 150 125 Age 18 or over at baseline 6,995 5,980 1,015 - 0.25 170 150 (p-value of difference in impacts) - - - - 0.77 - -
School attendance - - - - - - - In school at baseline 6,989 5,777 1,212 * 0.07 248 223 Not in school at baseline 7,200 6,142 1,058 - 0.52 72 52 (p-value of difference in impacts) - - - - 0.93 - -
Paid work experience - - - - - - -
Worked for pay in prior year 7,524 5,695 1,829 ** 0.04 185 151 No work for pay in prior year 6,508 6,198 309 - 0.74 134 125 (p-value of difference in impacts) - - - - 0.26 - -
Total income from earnings (from survey) and disability benefits (from SSA files) in the past year ($)
Age - - - - - - - Under age 18 at baseline 9,382 7,592 1,790 ** 0.04 150 125 Age 18 or over at baseline 8,788 7,720 1,069 - 0.20 170 150 (p-value of difference in impacts) - - - - 0.55 - -
School attendance - - - - - - - In school at baseline 8,919 7,412 1,508 ** 0.02 248 223 Not in school at baseline 8,887 7,905 981 - 0.54 72 52 (p-value of difference in impacts) - - - - 0.76 - -
Paid work experience - - - - - - - Worked for pay in prior year 9,588 7,314 2,274 *** 0.01 185 151 No work for pay in prior year 8,234 7,964 270 - 0.77 134 125 (p-value of difference in impacts) - - - - 0.12 - -
Participated in paid or unpaid employment, education, or training in the past year (percentages)
Age - - - - - - - Under age 18 at baseline 87.7 88.1 -0.4 - 0.93 150 125 Age 18 or over at baseline 85.6 88.9 -3.2 - 0.41 170 149 (p-value of difference in impacts) - - - - 0.64 - -

FINAL REPORT ON THE YTD EVALUATION APPENDIX A: ADDITIONAL ANALYSES
TABLE A.7e (CONTINUED)
A.65
Subgroup Treatment
mean Control mean Impact p-value
Treatment group size
Control group size
School attendance - - - - - - - In school at baseline 86.6 88.8 -2.2 - 0.50 248 222 Not in school at baseline 87.0 88.1 -1.1 - 0.86 72 52 (p-value of difference in impacts) - - - - 0.88 - -
Paid work experience - - - - - - - Worked for pay in prior year 86.0 88.7 -2.7 - 0.51 185 150 No work for pay in prior year 86.9 88.2 -1.4 - 0.74 134 124 (p-value of difference in impacts) - - - - 0.82 - -
Arrested or charged with delinquency or a criminal complaint in the past year (percentages)
Age - - - - - - -
Under age 18 at baseline 6.0 5.9 0.1 - 0.97 150 125 Age 18 or over at baseline 3.6 6.7 -3.1 - 0.22 170 150 (p-value of difference in impacts) - - - - 0.37 - -
School attendance - - - - - - - In school at baseline 5.2 6.3 -1.1 - 0.63 248 223 Not in school at baseline 4.0 6.3 -2.3 - 0.50 72 52 (p-value of difference in impacts) - - - - 0.75 - -
Paid work experience - - - - - - - Worked for pay in prior year 9.1 5.1 4.0 - 0.32 185 151 No work for pay in prior year 3.1 7.4 -4.3 * 0.07 134 125 (p-value of difference in impacts) - - - * 0.06 - -
Index of self-determination (4-point scale)
Age - - - - - - -
Under age 18 at baseline 3.1 3.1 -0.1 - 0.36 127 95 Age 18 or over at baseline 3.1 3.1 0.0 - 0.49 142 125 (p-value of difference in impacts) - - - - 0.86 - -
School attendance - - - - - - - In school at baseline 3.1 3.1 -0.1 * 0.07 213 180 Not in school at baseline 3.2 3.1 0.1 - 0.34 56 40 (p-value of difference in impacts) - - - - 0.12 - -
Paid work experience - - - - - - - Worked for pay in prior year 3.0 3.1 -0.1 * 0.05 159 121 No work for pay in prior year 3.1 3.1 0.0 - 0.61 109 99 (p-value of difference in impacts) - - - * 0.10 - -
Sources: YTD 36-month survey and SSA administrative records. Notes: The treatment and control group means and the impact estimates reported in the table are regression adjusted (see
Chapter II, Section A.3). We measured explanatory variables in the regression model before enrollment in the evaluation by using data from the study’s baseline survey and SSA files. Statistics for the outcome measures are based on data for all youth in the analysis sample for the YTD project, which comprises treatment and control group youth who completed the 36-month survey. We calculated all statistics with sample weights to account for interview non-response. Survey item non-response may have resulted in smaller sample sizes for specific outcomes, as indicated in the table. “Past year” refers to the year preceding the 36-month survey. All dollar amounts shown in the table are in 2008 dollars.
*/**/*** Impact estimate is significantly different from zero at the .10/.05/.01 level using a two-tailed t-test.

FINAL REPORT ON THE YTD EVALUATION APPENDIX A: ADDITIONAL ANALYSES
A.66
Table A.7f. West Virginia: Impacts on primary outcomes, by subgroup (percentages, unless otherwise noted)
Subgroup Treatment
mean Control mean Impact p-value
Treatment group size
Control group size
Ever employed in a paid job in the past year (percentages)
Age - - - - - - - Under age 18 at baseline 32.0 33.2 -1.2 - 0.88 63 60 Age 18 or over at baseline 37.4 29.9 7.5 * 0.06 301 250 (p-value of difference in impacts) - - - - 0.34 - -
School attendance - - - - - - - In school at baseline 35.5 32.3 3.3 - 0.56 132 126 Not in school at baseline 38.5 30.5 8.0 * 0.08 232 183 (p-value of difference in impacts) - - - - 0.50 - -
Paid work experience - - - - - - -
Worked for pay in prior year 32.9 32.8 0.1 - 0.98 103 90 No work for pay in prior year 38.6 29.8 8.8 ** 0.04 260 219 (p-value of difference in impacts) - - - - 0.22 - -
Total earnings in the past year ($)
Age - - - - - - - Under age 18 at baseline 1,477 1,900 -424 - 0.52 64 60 Age 18 or over at baseline 2,082 1,687 395 - 0.21 301 251 (p-value of difference in impacts) - - - - 0.26 - -
School attendance - - - - - - - In school at baseline 1,968 1,832 136 - 0.80 133 126 Not in school at baseline 2,064 1,753 311 - 0.36 232 185 (p-value of difference in impacts) - - - - 0.78 - -
Paid work experience - - - - - - -
Worked for pay in prior year 2,106 1,805 301 - 0.67 103 90 No work for pay in prior year 2,012 1,750 261 - 0.37 261 222 (p-value of difference in impacts) - - - - 0.96 - -
Total income from earnings (from survey) and disability benefits (from SSA files) in the past year ($)
Age - - - - - - - Under age 18 at baseline 10,002 7,708 2,294 *** 0.00 64 60 Age 18 or over at baseline 8,336 7,622 714 ** 0.03 301 251 (p-value of difference in impacts) - - - * 0.05 - -
School attendance - - - - - - - In school at baseline 9,265 7,610 1,655 *** 0.00 133 126 Not in school at baseline 8,339 7,720 618 * 0.08 232 185 (p-value of difference in impacts) - - - * 0.10 - -
Paid work experience - - - - - - - Worked for pay in prior year 8,808 7,762 1,046 - 0.13 103 90 No work for pay in prior year 8,560 7,521 1,039 *** 0.00 261 222 (p-value of difference in impacts) - - - - 0.99 - -
Participated in paid or unpaid employment, education, or training in the past year (percentages)
Age - - - - - - - Under age 18 at baseline 48.9 50.1 -1.2 - 0.88 64 60 Age 18 or over at baseline 55.3 45.8 9.6 ** 0.02 298 250 (p-value of difference in impacts) - - - - 0.23 - -

FINAL REPORT ON THE YTD EVALUATION APPENDIX A: ADDITIONAL ANALYSES
TABLE A.7f (CONTINUED)
A.67
Subgroup Treatment
mean Control mean Impact p-value
Treatment group size
Control group size
School attendance - - - - - - - In school at baseline 54.0 48.9 5.1 - 0.39 131 126 Not in school at baseline 55.9 46.7 9.3 ** 0.03 231 183 (p-value of difference in impacts) - - - - 0.54 - -
Paid work experience - - - - - - - Worked for pay in prior year 53.5 49.2 4.3 - 0.54 102 90 No work for pay in prior year 55.2 46.3 8.9 ** 0.03 259 219 (p-value of difference in impacts) - - - - 0.56 - -
Arrested or charged with delinquency or a criminal complaint in the past year (percentages)
Age - - - - - - -
Under age 18 at baseline 12.7 3.9 8.7 - 0.28 64 60 Age 18 or over at baseline 3.3 5.2 -1.9 - 0.30 301 251 (p-value of difference in impacts) - - - - 0.18 - -
School attendance - - - - - - - In school at baseline 3.5 4.5 -0.9 - 0.78 133 126 Not in school at baseline 3.8 4.6 -0.7 - 0.72 232 185 (p-value of difference in impacts) - - - - 0.96 - -
Paid work experience - - - - - - - Worked for pay in prior year 4.9 4.2 0.7 - 0.81 103 90 No work for pay in prior year 3.2 4.9 -1.7 - 0.47 261 222 (p-value of difference in impacts) - - - - 0.52 - -
Index of self-determination (4-point scale)
Age - - - - - - -
Under age 18 at baseline 2.8 2.8 0.0 - 0.76 48 48 Age 18 or over at baseline 2.9 2.8 0.0 - 0.36 224 186 (p-value of difference in impacts) - - - - 0.49 - -
School attendance - - - - - - - In school at baseline 2.9 2.8 0.0 - 0.61 98 91 Not in school at baseline 2.9 2.8 0.0 - 0.79 174 143 (p-value of difference in impacts) - - - - 0.82 - -
Paid work experience - - - - - - - Worked for pay in prior year 2.8 2.9 0.0 - 0.63 77 69 No work for pay in prior year 2.9 2.8 0.1 - 0.20 194 164 (p-value of difference in impacts) - - - - 0.27 - -
Sources: YTD 36-month survey and SSA administrative records. Notes: The treatment and control group means and the impact estimates reported in the table are regression adjusted (see
Chapter II, Section A.3). We measured explanatory variables in the regression model before enrollment in the evaluation by using data from the study’s baseline survey and SSA files. Statistics for the outcome measures are based on data for all youth in the analysis sample for the YTD project, which comprises treatment and control group youth who completed the 36-month survey. We calculated all statistics with sample weights to account for interview non-response. Survey item non-response may have resulted in smaller sample sizes for specific outcomes, as indicated in the table. “Past year” refers to the year preceding the 36-month survey. All dollar amounts shown in the table are in 2008 dollars.
*/**/*** Impact estimate is significantly different from zero at the .10/.05/.01 level using a two-tailed t-test.

This page has been left blank for double-sided copying.

APPENDIX B
THE SSA WAIVERS FOR YTD

This page has been left blank for double-sided copying.

FINAL REPORT ON THE YTD EVALUATION APPENDIX B: THE SSA WAIVERS FOR YTD
B.3
An important element of YTD was the modification of selected SSA program rules for project participants. These modifications, or waivers, were designed to encourage and reward the efforts of youth to begin working, increase their earnings, or continue their education.
Student Earned Income Exclusion (SEIE). Under the SEIE, Social Security disregards up to $1,750 per month of a student’s earnings, subject to a cap of $7,060 for the year (in 2014—the monthly and yearly amounts are adjusted for inflation each year.) Normally, the SEIE applies only to students who are age 21 or younger. For YTD participants, the SEIE applies regardless of age. As long as a YTD participant regularly attends school, he or she is eligible for the SEIE.
Earned Income Exclusion (EIE). For all SSI recipients who work, Social Security disregards $65 plus half of any earnings over that amount when it determines eligibility for SSI. For YTD participants, Social Security disregards $65 plus three-fourths of any additional earnings. This waiver allows YTD participants to keep more of their SSI benefits when they work. (The EIE is applied to earnings in addition to all other applicable exclusions, including the SEIE.)
Plan for Achieving Self-Support (PASS). Normally, a PASS must specify a particular employment or self-employment goal, list the steps that will be taken to achieve the goal, and identify the income and/or assets (other than SSI benefits) that will be used to meet the plan’s expenses. YTD participants may specify postsecondary education or career exploration as the goal of a PASS.
If Social Security approves a PASS, it disregards the funds used to pursue the plan when it determines eligibility for SSI. Such funds may include, for example wages, SSDI benefits, childhood disability benefits, or deemed parental income. If the individual is eligible for SSI without the PASS, SSI benefits replace all of the funds used for PASS expenses. If the PASS creates eligibility for SSI (which generally conveys eligibility for Medicaid, as well), SSI benefits replace part of the funds used for PASS expenses.
Individual Development Accounts (IDAs). This waiver expands the options for YTD participants to acquire certain kinds of assets. IDAs are trust-like savings accounts. For each dollar of earnings the account holder deposits, a participating nonprofit organization sets aside a matching contribution of 50 cents to four dollars (the average is one dollar). In IDA programs that involve federal funds, a federal match also is set aside. Federally funded IDAs must be used to help buy a home, pay for postsecondary education, or start a small business. All IDA participants undergo financial literacy training.
Under current rules, Social Security deducts account-holder deposits from countable earned income and disregards matching deposits, IDA account balances, and any interest earned by the account when determining SSI eligibility for someone who has a federally funded IDA. For YTD participants, these disregards also apply to IDAs that do not involve federal funds, including those that may be used for purposes other than the purchase of a home, postsecondary education, or a business startup. The IDA may be part of an existing state or local program, or a program established by a YTD project for its participants.

FINAL REPORT ON THE YTD EVALUATION APPENDIX B: THE SSA WAIVERS FOR YTD
B.4
Continuing Disability Review (CDR) or Age-18 Medical Redetermination. YTD participants will receive coverage under Section 301 that will allow for continued benefit eligibility throughout the project, regardless of the outcome of a continuing disability review (CDR) or age-18 medical redetermination. Under existing SSA rules, a CDR is scheduled to determine whether there has been an improvement in a disabling condition. Moreover, when an SSI recipient turns 18, there is a medical redetermination in which the SSI recipient must meet the adult criteria for disability. While this coverage does not eliminate these reviews, YTD participants who are determined ineligible for benefits for medical reasons can continue to receive SSI benefit payments under Section 301.

www.mathematica-mpr.com
Improving public well-being by conducting high quality, objective research and data collection PRINCETON, NJ ■ ANN ARBOR, MI ■ CAMBRIDGE, MA ■ CHICAGO, IL ■ OAKLAND, CA ■ WASHINGTON, DC
Mathematica® is a registered trademark of Mathematica Policy Research, Inc.