final report on key comparison ccauv.v...
TRANSCRIPT
Hans-Jürgen von Martens, Clemens Elster, Alfred Link,
Angelika Täubner, Wolfgang Wabinski
FINAL REPORT ON KEY COMPARISON CCAUV.V-K1
PTB-1.22
Braunschweig, October 1, 2002

2
Table of contents page
1 Introduction 9
2 Participants 9
3 Task and purpose of the comparison 10
4 Conditions of measurement 11
5 Transfer standards 11
6 Circulation type and transportation 12
7 Measurement instructions 12
8 Communication of the results to the pilot laboratory 13
9 RESULTS OF THE MEASUREMENTS 13
9.1 RESULTS - PART 1: Data of individual transfer standards (accelerometers) 14
9.2 RESULTS - PART 2: Laboratory individual measurements(stated results for standard frequency series) 23
9.3 RESULTS - PART 3: All individual measurements of the laboratories 28
10 Discussion of the measurement results 65
11 Conclusions 66
Acknowledgement 67
Bibliography 68
Appendix A: Key comparison reference value 69
A.1 Analysis of 5 different methods to compute KCRVs and degrees of equivalence 69
A.2 Method proposed by the pilot laboratory 73
A.3 Individual comments on the method proposed by the pilot laboratory 75
A.4 Consensus of the participants 81
Appendix B: KCRVs and degrees of equivalence 82
B.1 Proposed reference values 82
B.2 Proposed degrees of equivalence relative to the key comparison reference value 84
B.3 Matrix of equivalence between the laboratories(tables and graphs selected for BIPM database) 90
Appendix C: Matrix of equivalence between the laboratories (all 22 frequencies, 2 accelerometers) 98

3
Tables and Figures page
Table 1: List of participating institutes 10
Table 2: Numbering of the participating NMIs 14
Table S1a: Charge sensitivity of BB accelerometer as a function offrequency.PTB results
16
Figure S1a: Frequency response of BB accelerometer according to TableS1a
16
Table S1b: Charge sensitivity of SE accelerometer as a function offrequency.PTB results
17
Figure S1b: Frequency response of SE accelerometer according to TableS1b
17
Table S2a: Charge sensitivity of BB accelerometer as a function of time.PTB results
18
Figure S2a: Long-term stability of BB accelerometer according to Table S2a 18
Table S2b: Charge sensitivity of SE accelerometer as a function of time.PTB results
19
Figure S2b: Long-term stability of SE accelerometer according to Table S2b 19
Table S3a: Charge sensitivity of BB accelerometer as a function ofacceleration amplitude. PTB results at 5 kHz
21
Figure S3a: Amplitude linearity of BB accelerometer according to Table S3a 21
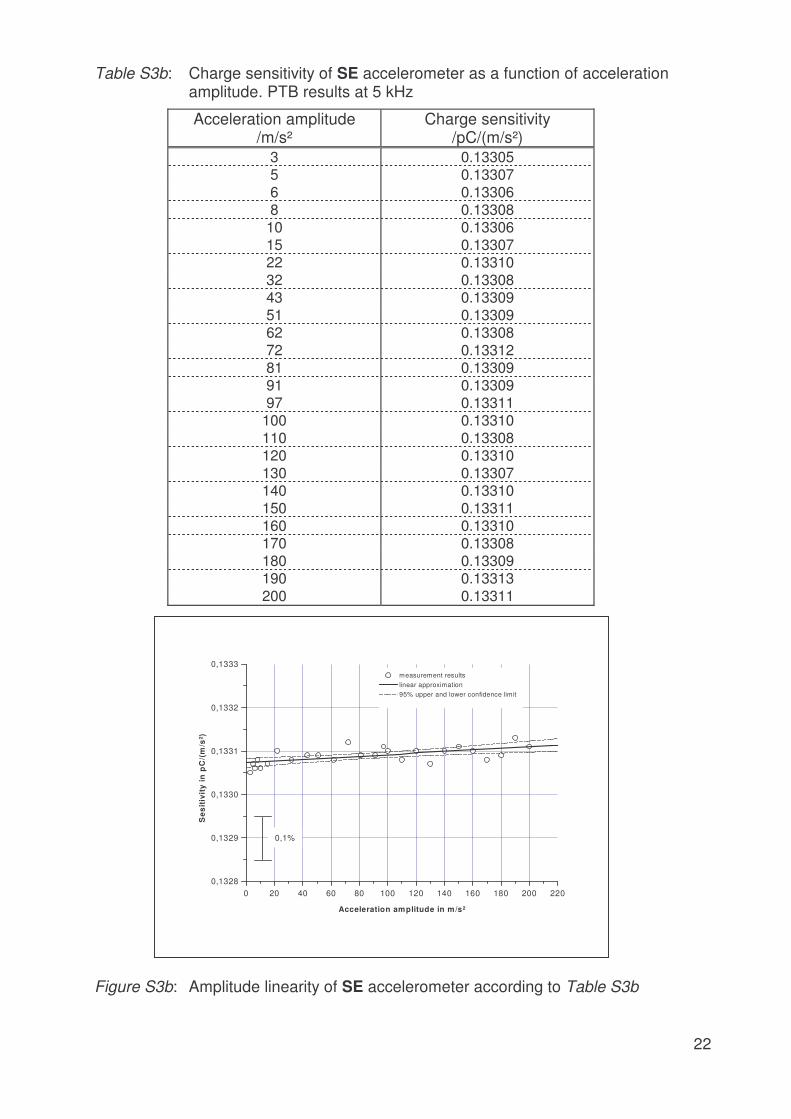
Table S3b: Charge sensitivity of SE accelerometer as a function ofacceleration amplitude. PTB results at 5 kHz
22
Figure S3b: Amplitude linearity of SE accelerometer according to Table S3b 22
Table R1a: Charge sensitivity of back-to-back (BB) accelerometer type8305 S/N 1483337.Individual mean results and measurement uncertainties statedfor the standard frequencies
24
Table R1b: Charge sensitivity of single-ended (SE) accelerometer type 8305WH 2335 S/N 1610174.Individual mean results and measurement uncertainties statedfor the standard frequencies
26
Table Lab 1a: Results “PTB 1“ of PTB for charge sensitivity of BBaccelerometer as a function of frequency (standard frequencies)
29
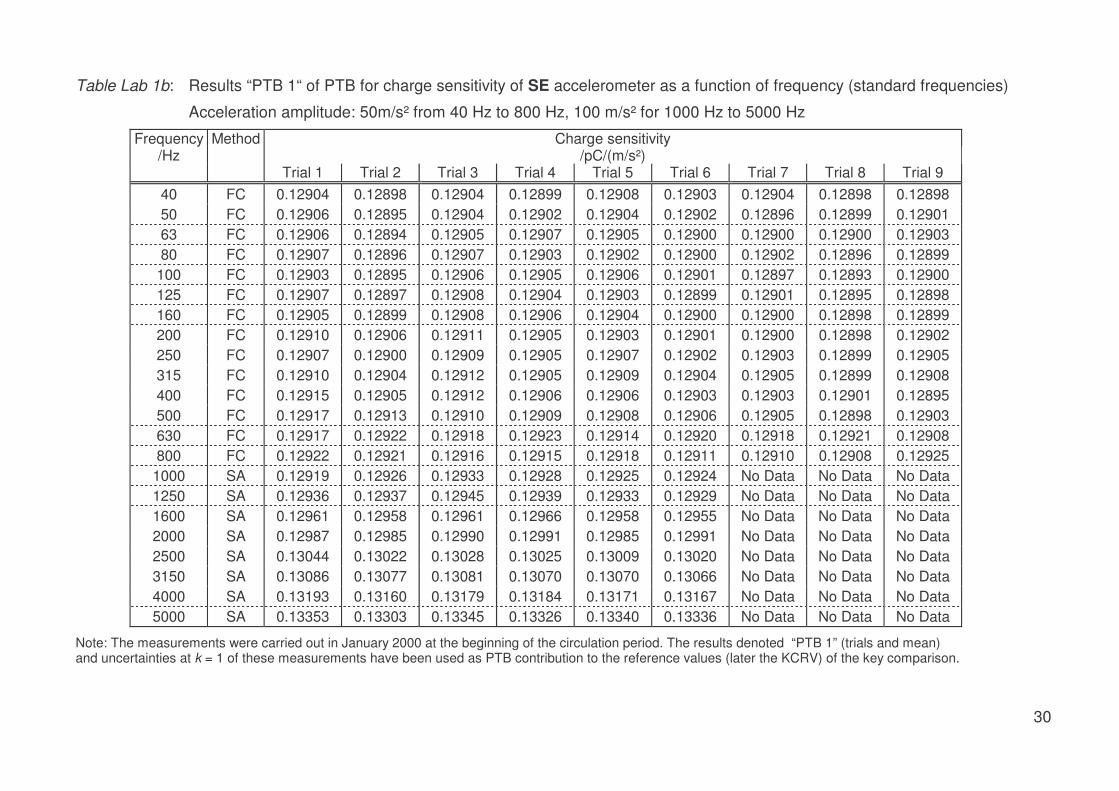
Table Lab 1b: Results “PTB 1“ of PTB for charge sensitivity of SEaccelerometer as a function of frequency (standard frequencies)
30
Table Lab 1a*: Results “PTB 2“ of PTB for charge sensitivity of BBaccelerometer as a function of frequency (standard frequencies)
31
Table Lab 1b*: Results “PTB 2“ of PTB for charge sensitivity of SEaccelerometer as a function of frequency (standard frequencies)
32

4
Tables and Figures page
Table Lab 1a**: Results “PTB (alternative)“ of PTB for charge sensitivity of BBaccelerometer as a function of frequency (standard frequencies)
33
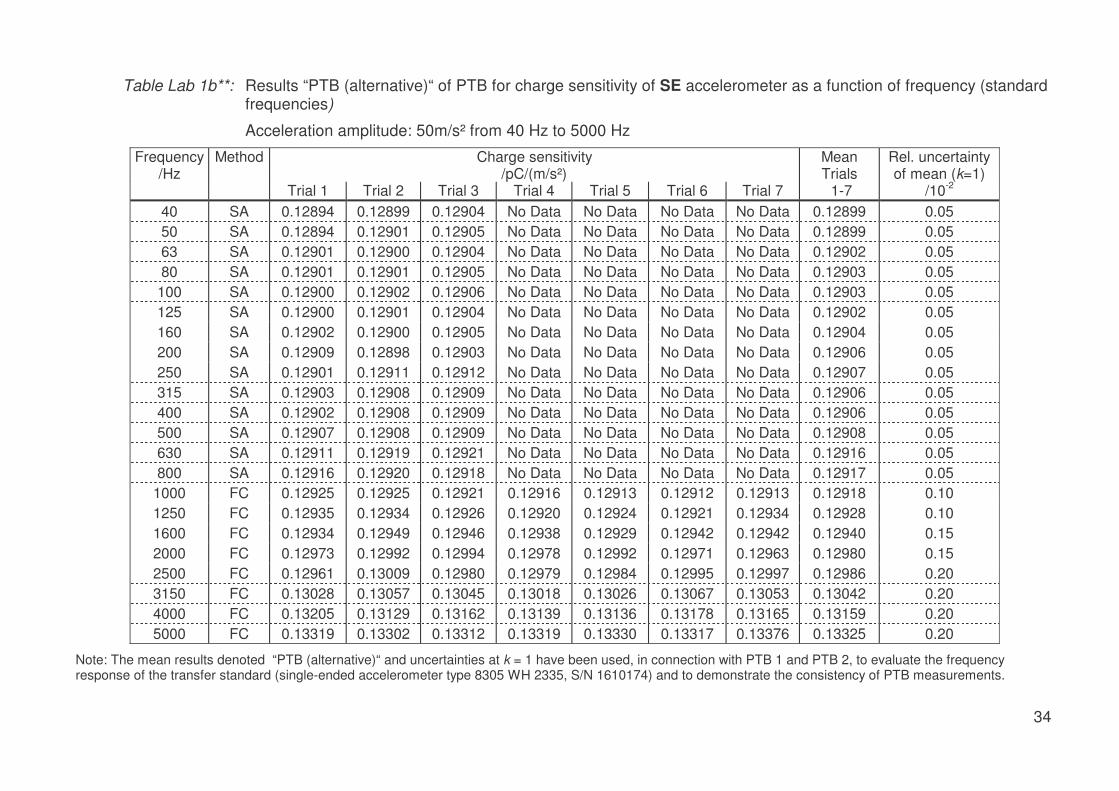
Table Lab 1b**: Results “PTB (alternative)“ of PTB for charge sensitivity of SEaccelerometer as a function of frequency (standard frequencies)
34
Table Lab 1a+: Results of PTB for charge sensitivity of BB accelerometer,different acceleration amplitudes at 160 Hz
35
Table Lab 1b+: Results of PTB for charge sensitivity of SE accelerometer,different acceleration amplitudes at 160 Hz
35
Table Lab 2a: Results of BNM – CESTA for charge sensitivity of BBaccelerometer as a function of frequency (standard frequencies)
36
Table Lab 2b: Results of BNM - CESTA for charge sensitivity of SEaccelerometer as a function of frequency (standard frequencies)
37
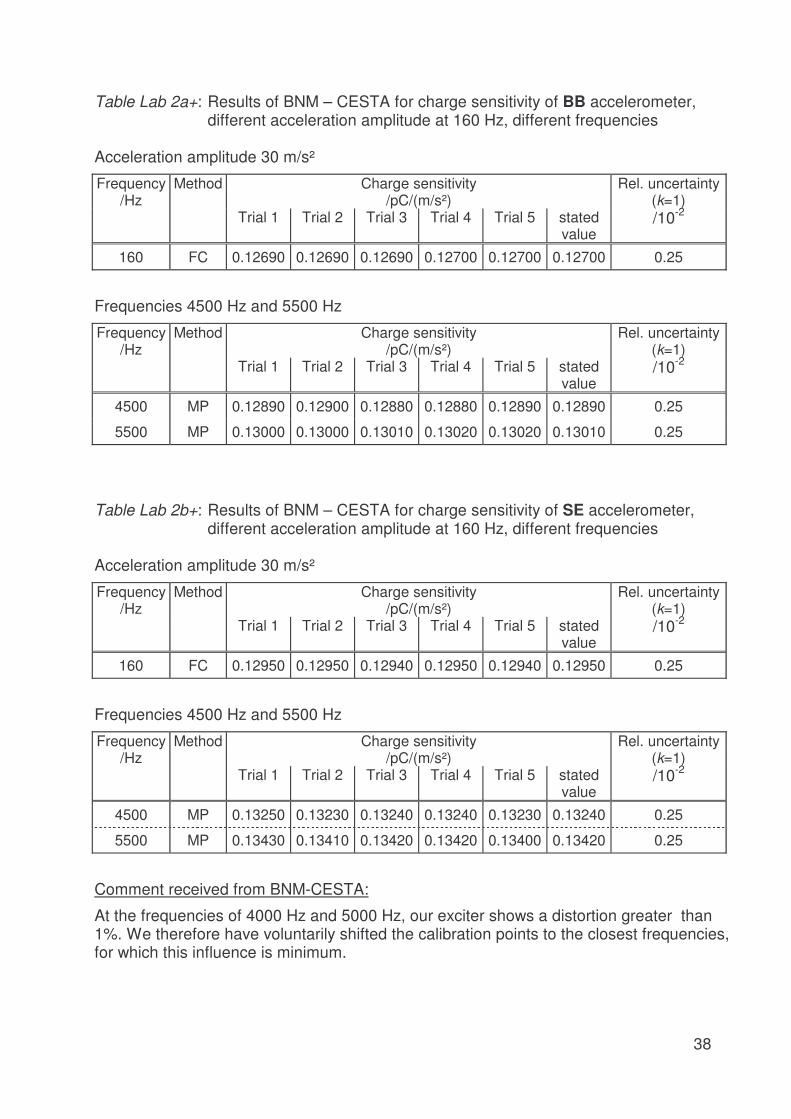
Table Lab 2a+: Results of BNM – CESTA for charge sensitivity of BBaccelerometer, different acceleration amplitude at 160 Hz,different frequencies
38
Table Lab 2b+: Results of BNM – CESTA for charge sensitivity of SEaccelerometer, different acceleration amplitude at 160 Hz,different frequencies
38
Table Lab 3a: Results of CSIRO-NML for charge sensitivity of BBaccelerometer as a function of frequency (standard frequencies)
39
Table Lab 3b: Results of CSIRO-NML for charge sensitivity of SEaccelerometer as a function of frequency (standard frequencies)
40
Table Lab 4a: Results of CMI for charge sensitivity of BB accelerometer as afunction of frequency (standard frequencies)
41
Table Lab 4b: Results of CMI for charge sensitivity of SE accelerometer as afunction of frequency (standard frequencies)
42
Table Lab 4a+: Results of CMI for charge sensitivity of BB accelerometer,different acceleration amplitudes at 160 Hz
43
Table Lab 4b+: Results of CMI for charge sensitivity of SE accelerometer,different acceleration amplitudes at 160 Hz
43
Table Lab 5a: Results of CSIR-NML for charge sensitivity of BB accelerometeras a function of frequency (standard frequencies)
44
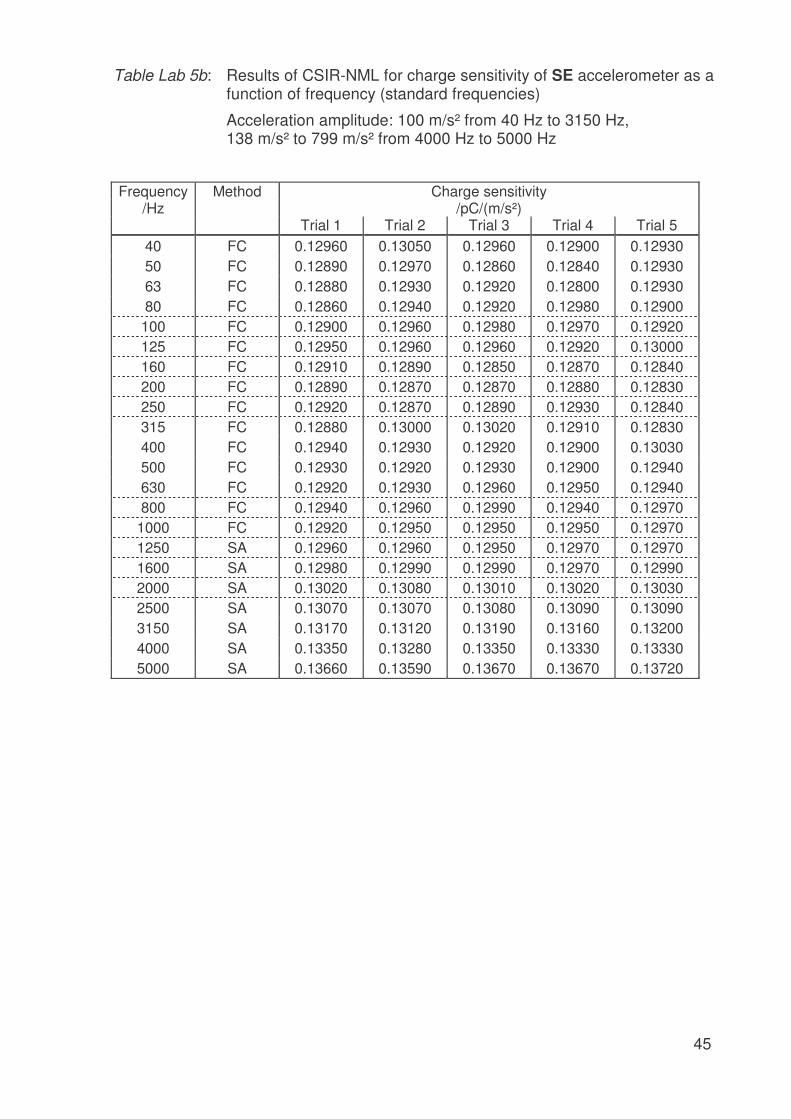
Table Lab 5b: Results of CSIR-NML for charge sensitivity of SE accelerometeras a function of frequency (standard frequencies)
45
Table Lab 5a+: Results of CSIR-NML for charge sensitivity of BBaccelerometer, different acceleration amplitudes at 160 Hz
46
Table Lab 5b+: Results of CSIR-NML for charge sensitivity of SE accelerometer,different acceleration amplitudes at 160 Hz
46
Table Lab 6a: Results of CENAM for charge sensitivity of BB accelerometeras a function of frequency (standard frequencies)
47
Table Lab 6b: Results of CENAM for charge sensitivity of SE accelerometeras a function of frequency (standard frequencies)
48
5
Tables and Figures page
Table Lab 7a: Results of NRC for charge sensitivity of BB accelerometer as afunction of frequency (standard frequencies)
49
Table Lab 7b: Results of NRC for charge sensitivity of SE accelerometer as afunction of frequency (standard frequencies)
50
Table Lab 7a+: Results of NRC for charge sensitivity of BB accelerometer,different acceleration amplitude at 160 Hz
51
Table Lab 7b+: Results of NRC for charge sensitivity of SE accelerometer,different acceleration amplitude at 160 Hz
51
Table Lab 8a: Results of KRISS for charge sensitivity of BB accelerometer asa function of frequency (standard frequencies)
52
Table Lab 8b: Results of KRISS for charge sensitivity of SE accelerometer asa function of frequency (standard frequencies)
53
Table Lab 8a+: Results of KRISS for charge sensitivity of BB accelerometer,different acceleration amplitude at 160 Hz
54
Table Lab 8b+: Results of KRISS for charge sensitivity of SE accelerometer,different acceleration amplitude at 160 Hz
54
Table Lab 9a: Results of NMIJ for charge sensitivity of BB accelerometer as afunction of frequency (standard frequencies)
55
Table Lab 9b: Results of NMIJ for charge sensitivity of SE accelerometer as afunctionof frequency (standard frequencies)
56
Table Lab 9a+: Results of NMIJ for charge sensitivity of BB accelerometer,different acceleration amplitude at 160 Hz
57
Table Lab 9b+: Results of NMIJ for charge sensitivity of SE accelerometer,different acceleration amplitude at 160 Hz
57
Table Lab 10a: Results of VNIIM for charge sensitivity of BB accelerometer asa function of frequency (standard frequencies)
58
Table Lab 10b: Results of VNIIM for charge sensitivity of SE accelerometer as afunction of frequency (standard frequencies)
59
Table Lab 11a: Results of NIST for charge sensitivity of BB accelerometer as afunction of frequency (standard frequencies)
60
Table Lab 11b: Results of NIST for charge sensitivity of SE accelerometer as afunction of frequency (standard frequencies)
61
Table Lab 12a: Results of NMi - VSL for charge sensitivity of BB accelerometeras a function of frequency (standard frequencies)
62
Table Lab 12b: Results of NMi - VSL for charge sensitivity of SE accelerometeras a function of frequency (standard frequencies)
63
Table Lab 12a+: Results of NMi - VSL for charge sensitivity of BB accelerometer,different acceleration amplitude at 160 Hz, different method at1000 Hz
64
6
Tables and Figures page
Table Lab 12b+: Results of NMi - VSL for charge sensitivity of SE accelerometer,different acceleration amplitude at 160 Hz, different method at1000 Hz
64
Tables and Figures – Appendix A page
Table A1a: Relative deviations of the reference values obtained by differentmethods from those of the weighted mean for BBaccelerometer.
70
Figure A1a: Relative deviations of the reference values obtained by differentmethods from those of the weighted mean for BBaccelerometer.
72
Table A1b: Relative deviations of the reference values obtained by differentmethods from those of the weighted mean for SEaccelerometer.
71
Figure A1b: Relative deviations of the reference values obtained by differentmethods from those of the weighted mean for SEaccelerometer.
72
Tables and Figures – Appendix B page
Table B1ab: Reference values and associated standard uncertainties for BBand SE accelerometer (basis: weighted mean)
82
Figure B1ab: Key comparison reference values, xR, versus frequency, f, andstandard uncertainty uR, for BB and SE accelerometer
83
Table B2a: Degrees of equivalence relative to the key comparisonreference value for BB accelerometer
84
Table B2b: Degrees of equivalence relative to the key comparisonreference value for SE accelerometer
87
Table B3a: Matrix of equivalence for BB accelerometer at 40 Hz 90
Figure B3a: Degrees of equivalence for BB accelerometer at 40 Hz 91
Table B4a: Matrix of equivalence for BB accelerometer at 160 Hz 92
Figure B4a: Degrees of equivalence for BB accelerometer at 160 Hz 93
Table B4b: Matrix of equivalence for SE accelerometer at 160 Hz 94
Figure B4b: Degrees of equivalence for SE accelerometer at 160 Hz 95
Table B5a: Matrix of equivalence for BB accelerometer at 5 kHz 96
Figure B5a: Degrees of equivalence for BB accelerometer at 5 kHz 97
7
Tables and Figures – Appendix C page
Table C1a: Matrix of equivalence for BB accelerometer at 40 Hz 98
Table C1b: Matrix of equivalence for SE accelerometer at 40 Hz 99
Table C2a: Matrix of equivalence for BB accelerometer at 50 Hz 100
Table C2b: Matrix of equivalence for SE accelerometer at 50 Hz 101
Table C3a: Matrix of equivalence for BB accelerometer at 63 Hz 102
Table C3b: Matrix of equivalence for SE accelerometer at 63 Hz 103
Table C4a: Matrix of equivalence for BB accelerometer at 80 Hz 104
Table C4b: Matrix of equivalence for SE accelerometer at 80 Hz 105
Table C5a: Matrix of equivalence for BB accelerometer at 100 Hz 106
Table C5b: Matrix of equivalence for SE accelerometer at 100 Hz 107
Table C6a: Matrix of equivalence for BB accelerometer at 125 Hz 108
Table C6b: Matrix of equivalence for SE accelerometer at 125 Hz 109
Table C7a: Matrix of equivalence for BB accelerometer at 160 Hz 110
Table C7b: Matrix of equivalence for SE accelerometer at 160 Hz 111
Table C8a: Matrix of equivalence for BB accelerometer at 200 Hz 112
Table C8b: Matrix of equivalence for SE accelerometer at 200 Hz 113
Table C9a: Matrix of equivalence for BB accelerometer at 250 Hz 114
Table C9b: Matrix of equivalence for SE accelerometer at 250 Hz 115
Table C10a: Matrix of equivalence for BB accelerometer at 315 Hz 116
Table C10b: Matrix of equivalence for SE accelerometer at 315 Hz 117
Table C11a: Matrix of equivalence for BB accelerometer at 400 Hz 118
Table C11b: Matrix of equivalence for SE accelerometer at 400 Hz 119
Table C12a: Matrix of equivalence for BB accelerometer at 500 Hz 120
Table C12b: Matrix of equivalence for SE accelerometer at 500 Hz 121
Table C13a: Matrix of equivalence for BB accelerometer at 630 Hz 122
Table C13b: Matrix of equivalence for SE accelerometer at 630 Hz 123
Table C14a: Matrix of equivalence for BB accelerometer at 800 Hz 124
Table C14b: Matrix of equivalence for SE accelerometer at 800 Hz 125
Table C15a: Matrix of equivalence for BB accelerometer at 1000 Hz 126
Table C15b: Matrix of equivalence for SE accelerometer at 1000 Hz 127
Table C16a: Matrix of equivalence for BB accelerometer at 1250 Hz 128
Table C16b: Matrix of equivalence for SE accelerometer at 1250 Hz 129
Table C17a: Matrix of equivalence for BB accelerometer at 1600 Hz 130
Table C17b: Matrix of equivalence for SE accelerometer at 1600 Hz 131

8
Table C18a: Matrix of equivalence for BB accelerometer at 2000 Hz 132
Table C18b: Matrix of equivalence for SE accelerometer at 2000 Hz 133
Table C19a: Matrix of equivalence for BB accelerometer at 2500 Hz 134
Table C19b: Matrix of equivalence for SE accelerometer at 2500 Hz 135
Table C20a: Matrix of equivalence for BB accelerometer at 3150 Hz 136
Table C20b: Matrix of equivalence for SE accelerometer at 3150 Hz 137
Table C21a: Matrix of equivalence for BB accelerometer at 4000 Hz 138
Table C21b: Matrix of equivalence for SE accelerometer at 4000 Hz 139
Table C22a: Matrix of equivalence for BB accelerometer at 5000 Hz 140
Table C22b: Matrix of equivalence for SE accelerometer at 5000 Hz 141

9
1 Introduction
This report presents the results of the first key comparison in the area of “vibration”(quantity of acceleration), CCAUV.V-K1. It has the status of a Final report and, as such,supersedes the Draft B report of July 15, 2002 which was approved on 1 October 2002 atthe 3rd Meeting of the Consultative Committee for Acoustics, ultrasound and vibration(CCAUV ) that took place at the BIPM in Sèvres. The Draft B report was based on theDraft A report of December 15, 2001 [ 1 ] which was circulated only to the participants inthe project. All participants made use of the opportunity to comment on and agree to thecontents. The complete set of results was accepted as presented in Draft A report. Nocontroversial or contradictory comments were received by the pilot institute. Theparticipants have reached consensus on the method considered most appropriate for theparticular comparison to compute the key comparison reference values (KCRVs) and thedegrees of equivalence. As the method proposed by the pilot institute is subject toconfirmation not only by all participants but also by the key comparison working group andthe Consultative Committee, Draft B was subdivided into the main report (sections 1 to11), which does not contain any specific statement on the method proposed by theparticipants, and the Appendices (A, B, C) which contain proposals for the KCRVs and thedegrees of equivalence. In accordance with the Guidelines for CIPM key comparisons[ 2 ], this subdivision allowed Draft B not to be considered confidential and to be thesubject of a publication, with the exception of the Appendices containing proposals for theKCRVs and degrees of equivalence.
The Consultative Committee CCAUV has approved this Final report of the key comparisonCCAUV.C-K1 for publication.
The Technical Protocol of December 15, 1999 [ 3 ] specifies in detail the aim and thetask of the comparison, the conditions of measurement, the transfer standards used,measurement instructions, time schedule and other items. A brief survey is given in thefollowing sections.
2 Participants
12 National Metrology Institutes (NMIs) from the 5 Regional Metrology OrganizationsAPMP, COOMET, EUROMET, SADCMET, and SIM have participated in the Keycomparison CCAUV.V-K1 (cf. Table 1).

10
Table 1: List of participating institutesParticipant (laboratory name)* Acronym Country Country
CodeCalibrationperiod
Bureau National de Métrology - C.E.A -C.E.S.T.A
BNM-CESTA France F Jan./Feb. 00
Centro National de Metrologia CENAM Mexico MX Jul./Aug. 00
Czech Institute of Metrology CMI Czech Republic CZ May/Jun. 00
CSIR National Metrology Laboratory of SouthAfrica
CSIR-NML South Africa ZA Aug./Sep. 00
CSIRO National Measurement Laboratory CSIRO-NML Australia AU Apr./May 00
Korea Research Institute of Science andStandards
KRISS Korea KR Feb./Mar. 01
National Institute of Standards and Technology NIST United States US Nov./Dec. 00
Netherlands Meetinstituut, Van SwindenLaboratorium
NMi-VSL Netherlands NL Feb./Mar. 00
National Research Council of CanadaInstitute for National Measurement Standard
NRC Canada CA Oct./Nov. 00
National Metrology Institute of Japan NMIJ Japan JP Mar. 2001
Physikalisch-Technische Bundesanstalt PTB Germany DE Jan. 00 (PTB 1)Jun. 01(PTB 2)**
D. I. Mendeleyev Institute for Metrology VNIIM RussianFederation
RU May/Jun. 01
* The NMIs are listed here in alphabetical order. Note that in the tables and graphs presenting the results,the numbers i have been assigned in another order (cf. section 9).
** In addition, interim calibrations/checks were carried out at the PTB in March/April 2000, June/July 2000,September/October 2000, December 2000/January 2001 and May 2001 (cf. Results Part 1).
3 Task and purpose of the comparison
In the field of vibration and shock, the first key comparison (CCAUV.V-K1) was organizedin order to compare measurements of sinusoidal linear accelerations in the frequencyrange from 40 Hz to 5 kHz. Moreover, the calibration and measurement capabilities(CMCs) of the NMIs for accelerometer calibration (i.e. measurement of charge sensitivityand voltage sensitivity of accelerometers) were to be examined and compared.
During the circulation period from January 2000 to June 2001, 12 national metrologyinstitutes (NMIs) from five regional metrology organizations (RMOs) calibrated twoaccelerometers as transfer standards.
It was the task of the comparison to measure the charge sensitivity of two accelerometerstandards (one of single-ended design and one of back-to-back design) at differentfrequencies and acceleration amplitudes as specified in section 4. The charge sensitivitywas calculated as the ratio of the amplitude of the accelerometer output charge to theamplitude of the acceleration at its reference surface. The reference surface was definedas the base surface (mounting surface) of the accelerometer of single-ended design (SE),

11
and the top surface of the accelerometer of back-to-back design (BB). The chargesensitivity was given in pico coulomb per metres per second squared: pC/(m/s²), for thedifferent measurement conditions specified in clause 4. A calibrated charge amplifier wasused to measure the output charge of the accelerometer standards, applying the electricalcalibration method specified in the Technical Protocol [ 3 ].
For the calibration of the two accelerometers, all NMIs applied laser interferometry incompliance with the international standard ISO 16063-11:1999 [ 4 ], in order to cover theentire frequency range chosen, within a specified range of the acceleration amplitude withspecified uncertainties. Though the Technical Protocol left the option to apply othermethods with similar known uncertainties, no other method (e.g. the reciprocity method)was applied.
4 Conditions of measurement
The participating laboratories observed fully or to a large extent the conditions stated inthe Technical Protocol, i.e.
• frequencies in hertz:40, 50, 63, 80, 100, 125, 160 (reference frequency), 200, 250, 315, 400, 500, 630, 800,1000, 1250, 1600, 2000, 2500, 3150, 4000, 5000
• amplitudes:A range of 10 m/s² to 200 m/s² was allowed. At the reference frequency (160 Hz), twoor more values were to be applied.
• ambient temperature and accelerometer temperature during the calibration:23°C ± 2 K (actual values should be stated within tolerances of ± 0.3 K).
• relative humidity: max. 75%
• mounting torque of the accelerometer: (2 ± 0.1) N m
The comparison was performed in compliance with the “Guidelines for CIPM keycomparisons” [ 2 ].
5 Transfer standards
During the preparatory stage of 18 months (July 1999 to December 2000), the pilotlaboratory thoroughly investigated the characteristics (long-term stability, linearity, etc.) ofvarious reference standard accelerometers (property of PTB) considered to be candidatesfor the transfer standards to be used in the key comparison. The following twoaccelerometers were selected:• 1 transfer standard accelerometer (single-ended), type 8305 WH 2335, S/N 1610174
(manufacturer: Brüel & Kjær), charge sensitivity 0.13 pC/(m/s²) (rounded value)
• 1 reference standard accelerometer (back-to-back) type 8305, S/N 1483337(manufacturer: Brüel & Kjær), charge sensitivity 0.13 pC/(m/s²) (rounded value)
The investigation of the long-term stability was continued throughout the circulation period.The results of the PTB stability measurements and other individual data of the transferstandards are given in Section 9 (RESULTS – PART 1).
12
6 Circulation type and transportation
A modified star type was applied with loops through two participating laboratories and thepilot laboratory. The pilot laboratory checked the long-term stability and the state of themounting surfaces. In all cases, the mounting surfaces were re-lapped to provide optimumconditions for the following loop.
The transfer standards were transported in a closed box hand-carried by a representativeof the NMI. Normally, one transport was carried out by a representative of the pilotlaboratory, and other transport by the participating laboratory.
7 Measurement instructions
In accordance with the Technical Protocol [ 3 ], the participating laboratories observed thefollowing instructions fully or to a large extent:
• The charge amplifier used in the laboratory was to be calibrated using a standardcapacitor and standard voltmeter, both traceable to national standards. The calibrationof the charge amplifier was to be carried out shortly before the calibration, using valuesof the electric quantities similar to those found in accelerometer calibration.
• In order to suppress the effect of any non-rectilinearity of the motion, the displacementwas to be measured at least at three different points. These points were to be equallyspaced on the top surface of the back-to-back accelerometer or on the base surface ofthe single-ended accelerometer.
• For the accelerometer of single-ended design, the reference surface for accelerationmeasurement is, by definition, the basis surface (mounting surface) of theaccelerometer. If this surface was covered during calibration, the motion had to besensed on the moving part close to the accelerometer. Alternatively, the motion couldbe sensed at the base surface of the accelerometer via longitudinal holes in the movingpart of the vibration exciter.
• For the accelerometer of back-to-back design, the motion was to be sensed at the topsurface (polished) without any dummy mass; no reflector (e.g. corner cube) had to beattached to the top surface. The reflectivity of the polished top surface was to be 80%or higher, and the flatness over the top surface was in the order of 1 µm.
• The mounting surfaces of the accelerometer and the moving part of the vibration exciterwere to be slightly lubricated before mounting.
For each of the two accelerometers, a complete measurement series was to be carriedout on each of five or more different days under nominally the same conditions, exceptthat the accelerometer was re-mounted and the cable re-fixed for each measurement day.The (mean) results of the daily measurement series were to be given separately.

13
8 Communication of the results to the pilot laboratory
The calibration reports submitted to the pilot laboratory contained descriptions of:
• the calibration equipment• the calibration method(s) used• the ambient conditions• the mounting technique• the calibration results• the uncertainty budget(s).
For the first five items, ISO 16063-11:1999, clause 10 was taken into account. For the lastitem (uncertainty), in accordance with ISO 16063-11:1999, Annex A list(s) of the mainprincipal components of the uncertainty budget were provided for the primary calibrationby laser interferometry according to method 1 ("fringe-counting method"), method 2("minimum-point method") and/or method 3 ("sine-approximation method"). In each case,the uncertainties were evaluated in accordance with the Guide to the expression ofuncertainty in measurement (GUM), which had been adapted to the calibration of vibrationand shock transducers as stated in ISO 16063-1:1998, Annex A. The last calibrationreport was submitted on October 4, 2001 to the pilot laboratory.
9 RESULTS OF THE MEASUREMENTS
Explanation: A great number of tables and figures will be given in the following to presentthe results. To order the tables and figures in a systematic way, they have been assigneda number together with the letter S (for transfer standard characteristics), R (for individuallaboratory results), A, B or C (for Appendix A, B or C), and the letter “a” for the back-to-back (BB) accelerometer or “b” for the single-ended (SE) accelerometer. For specialpresentations, the laboratories have been numbered 1 to 12 as shown in Table 2. ThePTB’s individual results measured in January 2000 (“PTB 1”, Lab. 1) have been used, inthe same way as the results of the other 11 laboratories, to compute the reference values.The PTB results measured in June 2001 (“PTB 2”) have only been used to demonstratethe long-term stability of the transfer standards and the consistency of the PTB’smeasurements (see sub-clause 9.1 and clause 10).

14
Table 2: Numbering of the participating NMIs
numbering i NMI
Lab. 1 PTB
Lab. 2 BNM-CESTA
Lab. 3 CSIRO-NML
Lab. 4 CMI
Lab. 5 CSIR-NML
Lab. 6 CENAM
Lab. 7 NRC
Lab. 8 KRISS
Lab. 9 NMIJ
Lab. 10 VNIIM
Lab. 11 NIST
Lab. 12 NMi-VSL
9.1 RESULTS - PART 1: Data of individual transfer standards (accelerometers)
The Technical Protocol specified for the individual accelerometer standards (brieflyreferred to as BB and SE accelerometers, cf. clause 5)
• the rounded value of charge sensitivity of 0.13 pC/(m/s²) and• the transverse sensitivity of 1.0% (BB) and 0.5% (SE).
In addition, the PTB measured
• the frequency response,• the long-term stability,• the amplitude linearity,• the temperature sensitivity and• the torque sensitivity.
In the following, a brief description is given of the PTB’s investigations of the transferstandards. The results of these investigations are given.
FREQUENCY RESPONSE (cf. Tables S1a, S1b and Figures S1a and S1b)
When calibrating single-ended accelerometers by laser interferometry, any laboratoryfaces the well-known problem that the motion to be measured at the reference surface(i.e. mounting surface at the bottom of the accelerometer) is usually not accessible to themeasuring laser light beam. The motion sensed by the laser light spot close to the

15
accelerometer may differ from that to which the accelerometer is exposed. Such “relativemotion“ often occurs at high frequencies in the kilohertz range due to membrane-likevibrations of the exciter’s moving part or of any mounting fixture used (e.g. an opticallyreflecting steel disk mounted between moving table and accelerometer).
Piezo-electric accelerometers behave like second-order mechanical systems with a highresonance frequency. The measurement of their frequency response is distorted just bythe amount of the relative motion which also increases with frequency.
The special acceleration exciters designed and developed at the PTB as sub-systems ofthe national standards used (medium-frequency acceleration standard and high-frequencyacceleration standard described in [ 5 ]) are free of significant relative motion effects overthe operational frequency ranges. This was confirmed by investigations using scanninginterferometry and differential “two-point” laser vibrometers. Moreover, to measure thefrequency response of the transfer standards accurately and reliably, primary calibrationsof each of the two accelerometers were carried out at the PTB by using different methodsand techniques: The PTB 1 results (measured at the beginning of the circulation period)and PTB 2 results (measured at the end of the circulation period) were obtained by“normal” PTB procedures, with the medium-frequency acceleration standard from 40 Hz to800 Hz (Michelson homodyne interferometer, fringe-counting method), and the high-frequency acceleration standard from 1 kHz to 5 kHz (Mach-Zehnder heterodyneinterferometer, sine-approximation method). The air-borne acceleration exciters of the twostandard devices (national standards) differ largely in design and dimensions.
Alternatively, the accelerometers were re-calibrated in the opposite way: the Mach-Zehnder interferometer with the sine-approximation method (i.e. the high-frequencyacceleration standard) was used for the frequencies from 40 Hz to 800 Hz, and theMichelson homodyne interferometer with the modified fringe-counting method (describedin [ 6 ]) for frequencies from 1 kHz to 5 kHz.
Further information on the “real” frequency response of the accelerometers was obtainedby PTB measurements of their resonance frequencies and damping.
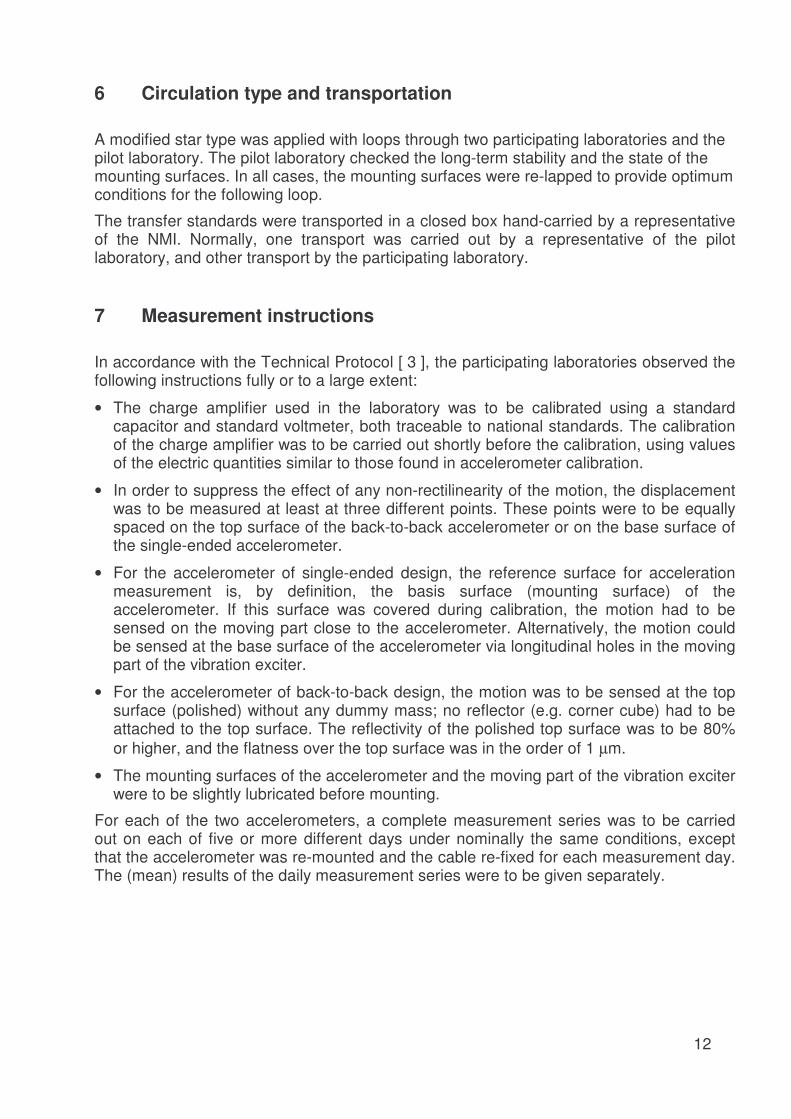
The investigations revealed that the transfer standards behave in good approximation assecond-order systems whose charge sensitivity increases by (relative) 2×10⁻² (BBaccelerometer) and 3×10⁻² (SE accelerometer) if the frequency changes from 40 Hz to5 kHz. A slight relative deviation by about 5×10⁻⁴ from the frequency response of an idealsecond-order system was identified at 630 Hz for the SE accelerometer, as this deviationwas indicated independent from the different methods and techniques applied (seeTable S1b and Figure S1b).
16
Table S1a: Charge sensitivity of BB accelerometer as a function of frequency.PTB results
Frequency Sensitivity (PTB 1) Sensitivity (PTB 2) Sensitivity (alternat.)/Hz /pC/(m/s²) /pC/(m/s²) /pC/(m/s²)40 0.12665 0.12664 0.1265350 0.12664 0.12661 0.1265463 0.12662 0.12662 0.1265980 0.12662 0.12661 0.12660
100 0.12662 0.12661 0.12660125 0.12663 0.12661 0.12662160 0.12664 0.12664 0.12663200 0.12662 0.12668 0.12652250 0.12665 0.12667 0.12653315 0.12667 0.12669 0.12658400 0.12664 0.12667 0.12656500 0.12662 0.12667 0.12660630 0.12668 0.12679 0.12664800 0.12669 0.12678 0.126651000 0.12678 0.12681 0.126731250 0.12685 0.12692 0.126751600 0.12698 0.12702 0.126942000 0.12716 0.12723 0.127012500 0.12741 0.12744 0.127243150 0.12773 0.12782 0.127594000 0.12849 0.12847 0.128055000 0.12934 0.12929 0.12883
Note: “PTB 1“ and “PTB 2“ denote the mean results obtained by the PTB standard procedures in January2000 and June 2001, respectively. “PTB (alternative methods)“ denotes the results obtained withthe methods and techniques changed.
Figure S1a: Frequency response of BB accelerometer according to Table S1a
0,1263
0,1265
0,1267
0,1269
0,1271
0,1273
0,1275
0,1277
0,1279
0,1281
0,1283
0,1285
0,1287
0,1289
0,1291
0,1293
0,1295
10 100 1000 10000
Frequency in Hz
Cha
rge
sens
itivi
ty in
pC
/(m/s
²)
PTB 1 PTB 2 alternative methods

17
Table S1b: Charge sensitivity of SE accelerometer as a function of frequency.PTB results
Frequency Sensitivity (PTB 1) Sensitivity (PTB 2) Sensitivity (alternat.)/Hz /pC/(m/s²) /pC/(m/s²) /pC/(m/s²)40 0.12902 0.12901 0.1289950 0.12901 0.12899 0.1289963 0.12902 0.12899 0.1290280 0.12901 0.12899 0.12903
100 0.12901 0.12899 0.12903125 0.12901 0.12902 0.12902160 0.12902 0.12901 0.12904200 0.12904 0.12905 0.12906250 0.12904 0.12902 0.12907315 0.12906 0.12903 0.12906400 0.12905 0.12910 0.12906500 0.12908 0.12914 0.12908630 0.12918 0.12923 0.12916800 0.12916 0.12925 0.129171000 0.12926 0.12930 0.129201250 0.12937 0.12942 0.129291600 0.12960 0.12958 0.129402000 0.12988 0.12991 0.129802500 0.13025 0.13024 0.129863150 0.13075 0.13073 0.130424000 0.13176 0.13174 0.131595000 0.13334 0.13332 0.13325
Note: “PTB 1“ and “PTB 2“ denote the mean results obtained by the PTB standard procedures in January2000 and June 2001, respectively. “PTB (alternative methods)“ denotes the results obtained withthe methods and techniques changed.
Figure S1b: Frequency response of SE accelerometer according to Table S1b
0,1288
0,1292
0,1296
0,1300
0,1304
0,1308
0,1312
0,1316
0,1320
0,1324
0,1328
0,1332
10 100 1000 10000
Frequency in Hz
Cha
rge
sens
itivi
ty in
pC
/(m/s
²)
PTB 1 PTB 2 Alternative methods
18
LONG-TERM STABILITY (cf. Tables S2a, S2b and Figures S2a, S2b)
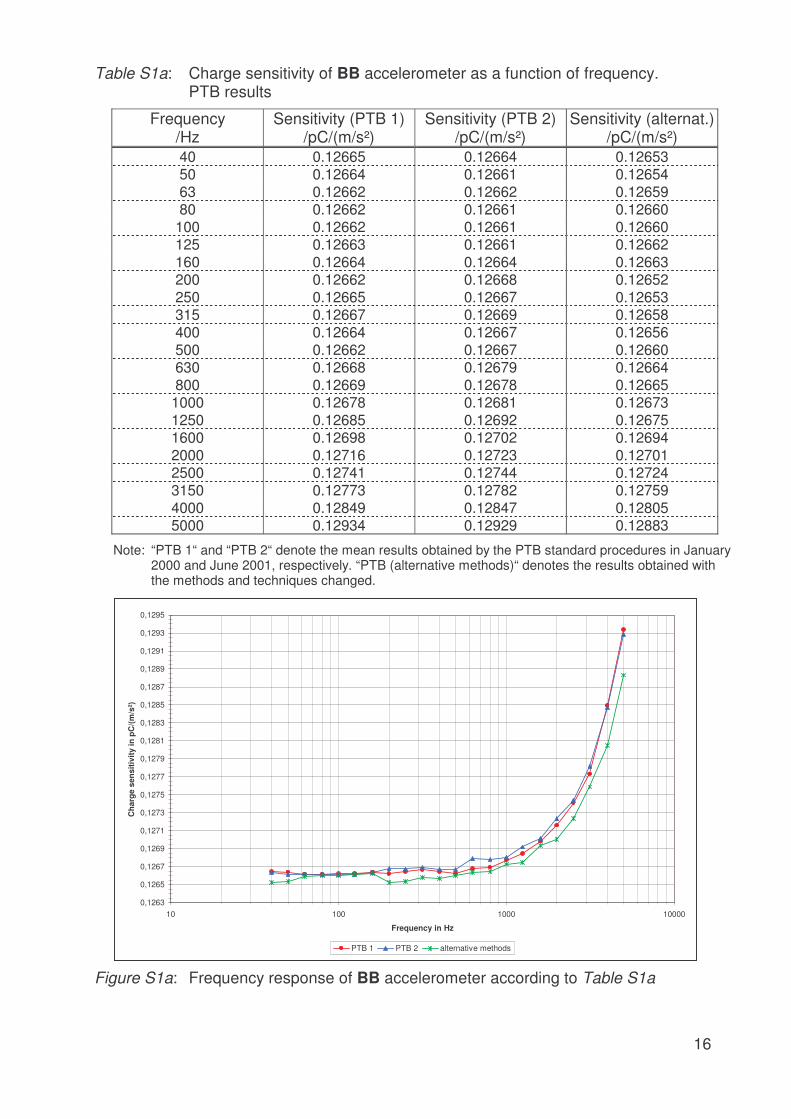
Two different tests were carried out at the PTB to investigate the long-term stability of thetransfer standards. At the reference frequency of 160 Hz, repeated series of sensitivitymeasurements were carried out over about three years, which was possible because ofthe circulation type according to sections 2 and 6. A linear approximation (see Figures S2aand S2b) revealed a relative linear drift for both accelerometers far below 1×10⁻³ over theperiod of 36 months. For all frequencies, the calibration results measured at the end of thecirculation period (June 2001, PTB 2) were compared with the results obtained at thebeginning (January 2002, PTB 1). No significant change in the charge sensitivity occurredin this 18-month test. In this way, the long-term stability investigations proved that stablebehaviour of both accelerometers during the circulation period was given.
Table S2a: Charge sensitivity of BB accelerometer as a function of time. PTB results
Time Charge sensitivity/days /pC/(m/s²)
0 0.12670120 0.12668210 0.12662360 0.12670373 0.12666379 0.12661380 0.12663550 0.12659600 0.12656640 0.12660760 0.12664850 0.12665
Figure S2a: Long-term stability of BB accelerometer according to Table S2a
0 100 200 300 400 500 600 700 800 9000,1262
0,1263
0,1264
0,1265
0,1266
0,1267
0,1268
0,1269
0,1270
0,1%
measurement results linear approximation 95% upper and lower confidence limit
Ch
arg
e se
nsi
tivi
ty i
n p
C/(
m/s
²)
Time in days

19
Table S2b: Charge sensitivity of SE accelerometer as a function of time. PTB results
Time Charge sensitivity/days /pC/(m/s²)
0 0.12905120 0.12899420 0.12908510 0.12906610 0.12904620 0.12900621 0.12900781 0.12898831 0.12899860 0.12899980 0.12897
1070 0.12904
Figure S2b: Long-term stability of SE accelerometer according to Table S2b
0 100 200 300 400 500 600 700 800 900 1000 11000,1286
0,1287
0,1288
0,1289
0,1290
0,1291
0,1292
0,1293
0,1294
0,1%
measurement results linear approximation 95% upper and lower confidence limit
Ch
arg
e se
siti
vity
in p
C/(
m/s
²)
Time in days

20
AMPLITUDE LINEARITY (see Tables S3a, S3b and Figures S3a, S3b)
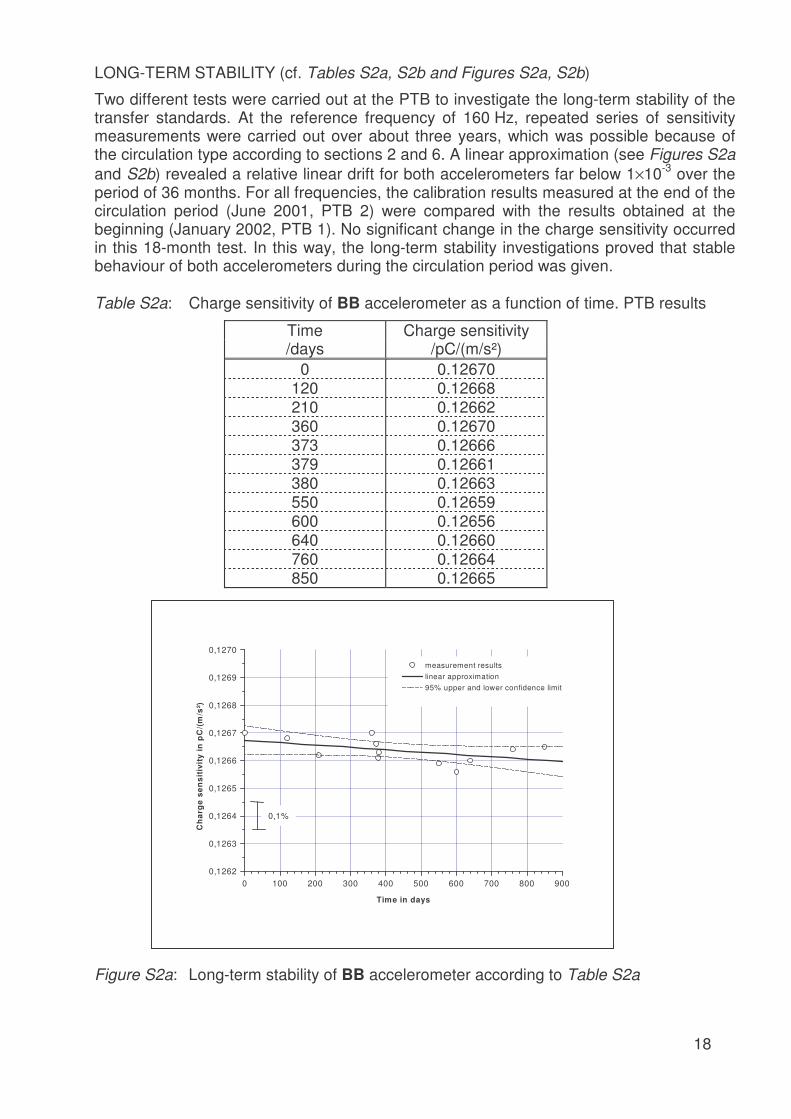
In addition to the measurements of the charge sensitivity of both accelerometersperformed at the reference frequency of 160 Hz at different acceleration amplitudes(requirement of clause 4 of the Technical Protocol), a more representative linearityinvestigation was carried out at 5 kHz, covering the whole dynamic range from 10 m/s² to200 m/s² applicable according to clause 4. It revealed that the charge sensitivity of bothaccelerometers was constant (relative standard uncertainty of linearity test: 2×10⁻⁴), i.e.amplitude-linear behaviour of the accelerometers is given.
21
Table S3a: Charge sensitivity of BB accelerometer as a function of accelerationamplitude. PTB results at 5 kHz
Acceleration amplitude Charge sensitivity/m/s2 /pC/(m/s²)7.7 0.129258.8 0.12929
18.2 0.1291723.2 0.1292937.7 0.1292948.4 0.1292357.3 0.1293266.3 0.1292678.7 0.1292790.2 0.1293196.5 0.12931
110.5 0.12932123.1 0.12930151.0 0.12924186.0 0.12923
Figure S3a: Amplitude linearity of BB accelerometer according to Table S3a
0 20 40 60 80 100 120 140 160 180 2000,1290
0,1291
0,1292
0,1293
0,1294
0,1295
0,1%
measurement results linear approximation 95% upper and lower confidence limit
Ses
itiv
ity
in p
C/(
m/s
²)
Acceleration amplitude in m/s²
22
Table S3b: Charge sensitivity of SE accelerometer as a function of accelerationamplitude. PTB results at 5 kHz
Acceleration amplitude Charge sensitivity/m/s² /pC/(m/s²)
3 0.133055 0.133076 0.133068 0.1330810 0.1330615 0.1330722 0.1331032 0.1330843 0.1330951 0.1330962 0.1330872 0.1331281 0.1330991 0.1330997 0.13311
100 0.13310110 0.13308120 0.13310130 0.13307140 0.13310150 0.13311160 0.13310170 0.13308180 0.13309190 0.13313200 0.13311
Figure S3b: Amplitude linearity of SE accelerometer according to Table S3b
0 20 40 60 80 100 120 140 160 180 200 2200,1328
0,1329
0,1330
0,1331
0,1332
0,1333
0,1%
measurement results linear approximation 95% upper and lower confidence limit
Ses
itiv
ity
in p
C/(
m/s
²)
Acceleration amplitude in m/s²
23
TEMPERATURE SENSITIVITY
The temperature sensitivity (temperature coefficient) was measured at PTB.2×10-4/K were found for the BB accelerometer and 3×10⁻⁴/K for the SE accelerometer,expressed as the relative change of the charge sensitivity per kelvin in the applicabletemperature range stated in clause 4.
TORQUE SENSITIVITY
Based on PTB measurements, the relative change in the charge sensitivity due todeviations from the nominal torque (cf. clause 4) was 1×10⁻⁴/(N m) for the BBaccelerometer and 6×10⁻⁴/(N m) for the SE accelerometer.
9.2 RESULTS - PART 2: Laboratory individual measurements(stated results for standard frequency series)
The stated results given in the following Table R1a and Table R1b are not in allcases the arithmetic mean values of the measurement results (trials) given inTable Lab 1a to Table Lab 12a, and Table Lab 1b to Table Lab 12b, respectively.

24
Table R1a: Charge sensitivity of back-to-back (BB) accelerometer type 8305 S/N 1483337.Individual mean results and measurement uncertainties stated for the standard frequencies
MEASURAND: Charge sensitivity
xi: result of measurement carried out by laboratory iui: relative combined standard uncertainty of xi
Back-to-back (BB) accelerometer type 8305 S/N 1483337
Frequency 40 Hz 50 Hz 63 Hz 80 Hz 100 Hz 125 Hz 160 Hz 200 HzLab i xi ui /xi xi ui /xi xi ui /xi xi ui /xi xi ui /xi xi ui /xi xi ui /xi xi ui /xi
/pC/(m/s2) /10-2 /pC/(m/s2) /10-2 /pC/(m/s2) /10-2 /pC/(m/s2) /10-2 /pC/(m/s2) /10-2 /pC/(m/s2) /10-2 /pC/(m/s2) /10-2 /pC/(m/s2) /10-2
PTB 0.12665 0.05 0.12664 0.05 0.12662 0.05 0.12662 0.05 0.12662 0.05 0.12663 0.05 0.12664 0.05 0.12662 0.05BNM-CESTA 0.12670 0.25 0.12670 0.25 0.12670 0.25 0.12680 0.25 0.12680 0.25 0.12670 0.25 0.12670 0.25 0.12680 0.25CSIRO-NML 0.12670 0.20 0.12670 0.20 0.12660 0.15 0.12660 0.15 0.12660 0.15 0.12660 0.15 0.12660 0.15 0.12660 0.15CMI 0.12649 0.23 0.12654 0.22 0.12658 0.23 0.12660 0.22 0.12661 0.23 0.12660 0.22 0.12660 0.23 0.12661 0.23CSIR-NML 0.12750 0.45 0.12700 0.35 0.12620 0.35 0.12610 0.35 0.12640 0.30 0.12620 0.30 0.12660 0.25 0.12620 0.25CENAM 0.12641 0.25 0.12636 0.25 0.12648 0.25 0.12647 0.25 0.12645 0.25 0.12646 0.25 0.12660 0.25 0.12662 0.25NRC 0.12647 0.15 0.12646 0.15 0.12641 0.15 0.12697 0.15 0.12666 0.15 0.12672 0.15 0.12675 0.15 0.12669 0.15KRISS 0.12647 0.18 0.12648 0.18 0.12646 0.18 0.12647 0.18 0.12644 0.18 0.12646 0.18 0.12649 0.18 0.12651 0.18NMIJ 0.12629 0.21 0.12649 0.21 0.12655 0.22 0.12656 0.24 0.12658 0.24 0.12656 0.21 0.12660 0.22 0.12657 0.22VNIIM 0.12604 0.20 0.12616 0.20 0.12610 0.20 0.12612 0.20 0.12610 0.20 0.12646 0.20 0.12682 0.20 0.12686 0.22NIST 0.12670 0.15 0.12660 0.15 0.12660 0.14 0.12650 0.15 0.12670 0.14 0.12640 0.16 0.12650 0.15 0.12650 0.15NMi-VSL 0.12650 0.13 0.12651 0.12 0.12639 0.11 0.12641 0.11 0.12645 0,10 0.12645 0.10 0.12660 0.17 0.12651 0.11

25
Back-to-back (BB) accelerometer type 8305 S/N 1483337, continued
Frequency 250 Hz 315 Hz 400 Hz 500 Hz 630 Hz 800 Hz 1000 Hz 1250 HzLab i xi ui /xi xi ui /xi xi ui /xi xi ui /xi xi ui /xi xi ui /xi xi ui /xi xi ui /xi
/pC/(m/s2) /10-2 /pC/(m/s2) /10-2 /pC/(m/s2) /10-2 /pC/(m/s2) /10-2 /pC/(m/s2) /10-2 /pC/(m/s2) /10-2 /pC/(m/s2) /10-2 /pC/(m/s2) /10-2
PTB 0.12665 0.05 0.12667 0.05 0.12664 0.05 0.12662 0.05 0.12668 0.05 0.12669 0.05 0.12678 0.05 0.12685 0.05BNM-CESTA 0.12680 0.25 0.12690 0.25 0.12700 0.25 O.12690 0.25 0.12690 0.25 0.12700 0.25 0.12700 0.25 0.12700 0.25CSIRO-NML 0.12660 0.15 0.12670 0.15 0.12670 0.15 0.12670 0.15 0.12670 0.15 0.12670 0.15 0.12690 0.15 0.12690 0.15CMI 0.12665 0.25 0.12660 0.26 0.12665 0.27 0.12670 0.27 0.12666 0.27 0.12670 0.27 0.12673 0.27 0.12682 0.27CSIR-NML 0.12650 0.25 0.12660 0.25 0.12710 0.30 0.12710 0.30 0.12680 0.25 0.12690 0.25 0.12680 0.30 0.12690 0.30CENAM 0.12651 0.25 0.12649 0.25 0.12658 0.25 0.12657 0.25 0.12661 0.25 0.12667 0.25 0.12674 0.40 0.12677 0.40NRC 0.12669 0.15 0.12656 0.15 0.12677 0.15 0.12650 0.23 0.12669 0.17 0.12687 0.22 0.12690 0.27 0.12695 0.29KRISS 0.12655 0.18 0.12655 0.18 0.12658 0.18 0.12659 0.18 0.12663 0.18 0.12665 0.18 0.12670 0.19 0.12675 0.19NMIJ 0.12653 0.22 0.12646 0.24 0.12667 0.32 0.12655 0.25 0.12657 0.23 0.12661 0.26 0.12672 0.16 0.12683 0.15VNIIM 0.12670 0.22 0.12680 0.22 0.12680 0.22 0.12694 0.22 0.12694 0.22 0.12708 0.22 0.12744 0.22 0.12772 0.22NIST 0.12660 0.15 0.12660 0.16 0.12660 0.15 0.12640 0.17 0.12630 0.20 0.12640 0.43 0.12640 0.22 0.12650 0.21NMi-VSL 0.12658 0.11 0.12671 0.13 0.12649 0.20 0.12662 0.13 0.12707 0.14 0.12721 0.25 0.12705 0.53 0.12670 0.28
Frequency 1600 Hz 2000 Hz 2500 Hz 3150 Hz 4000 Hz 5000 HzLab i xi ui /xi xi ui /xi xi ui /xi xi ui /xi xi ui /xi xi ui /xi
/pC/(m/s2) /10-2 /pC/(m/s2) /10-2 /pC/(m/s2) /10-2 /pC/(m/s2) /10-2 /pC/(m/s2) /10-2 /pC/(m/s2) /10-2
PTB 0.12698 0.05 0.12716 0.05 0.12741 0.10 0.12773 0.10 0.12849 0.10 0.12934 0.10BNM-CESTA 0.12710 0.25 0.12730 0.25 0.12750 0.25 0.12780 0.25 - * - * - * - *CSIRO-NML 0.12700 0.15 0.12710 0.15 0.12740 0.15 0.12790 0.15 0.12850 0.15 0.12950 0.20CMI 0.12688 0.26 0.12706 0.24 0.12720 0.23 0.12751 0.35 0.12801 0.30 0.12935 0.30CSIR-NML 0.12710 0.30 0.12710 0.30 0.12720 0.30 0.12770 0.35 0.12820 0.35 0.12920 0.35CENAM 0.12702 0.40 0.12721 0.40 0.12727 0.40 0.12798 0.40 0.12828 0.40 0.12931 0.40NRC 0.12703 0.31 0.12720 0.33 0.12710 0.34 0.12732 0.43 0.12836 0.47 0.12930 0.54KRISS 0.12683 0.19 0.12702 0.19 0.12724 0.19 0.12767 0.22 0.12834 0.22 0.12946 0.22NMIJ 0.12686 0.23 0.12702 0.23 0.12722 0.24 0.12779 0.54 0.12845 0.56 0.12931 0.66VNIIM 0.12840 0.22 0.12890 0.22 0.12922 0.34 0.12920 0.34 0.12898 0.34 0.13074 0.34NIST 0.12660 0.21 0.12670 0.34 0.12670 0.58 0.12810 0.63 0.12860 0.59 0.12920 0.60NMi-VSL 0.12682 0.38 0.12692 0.21 0.12708 0.27 0.12757 0.78 0.12826 1.16 0.12929 1.89* The measurements were carried out at shifted frequencies, see page 38

26
Table R1b: Charge sensitivity of single-ended (SE) accelerometer type 8305 WH 2335 S/N 1610174.Individual mean results and measurement uncertainties stated for the standard frequencies
MEASURAND: Charge sensitivity
xi: result of measurement carried out by laboratory iui: relative combined standard uncertainty of xi
Single-ended (SE) accelerometer type 8305 WH 2335 S/N 1610174
Frequency 40 Hz 50 Hz 63 Hz 80 Hz 100 Hz 125 Hz 160 Hz 200 HzLab i xi ui /xi xi ui /xi xi ui /xi xi ui /xi xi ui /xi xi ui /xi xi ui /xi xi ui /xi
/pC/(m/s2) /10-2 /pC/(m/s2) /10-2 /pC/(m/s2) /10-2 /pC/(m/s2) /10-2 /pC/(m/s2) /10-2 /pC/(m/s2) /10-2 /pC/(m/s2) /10-2 /pC/(m/s2) /10-2
PTB 0.12902 0.05 0.12901 0.05 0.12902 0.05 0.12901 0.05 0.12901 0.05 0.12901 0.05 0.12902 0.05 0.12904 0.05BNM-CESTA 0.12910 0.25 0.12920 0.25 0.12910 0.25 0.12930 0.25 0.12920 0.25 0.12920 0.25 0.12930 0.25 0.12920 0.25CSIRO-NML 0.12910 0.20 0.12910 0.20 0.12900 0.15 0.12890 0.15 0.12900 0.15 0.12900 0.15 0.12890 0.15 0.12900 0.15CMI 0.12875 0.23 0.12880 0.23 0.12881 0.23 0.12885 0.23 0.12890 0.23 0.12895 0.23 0.12900 0.23 0.12905 0.23CSIR-NML 0.12960 0.35 0.12900 0.35 0.12890 0.35 0.12920 0.35 0.12950 0.30 0.12960 0.30 0.12870 0.25 0.12870 0.25CENAM 0.12893 0.25 0.12893 0.25 0.12898 0.25 0.12895 0.25 0.12893 0.25 0.12888 0.25 0.12886 0.25 0.12888 0.25NRC 0.12876 0.15 0.12877 0.15 0.12872 0.15 0.12937 0.15 0.12901 0.15 0.12906 0.15 0.12914 0.15 0.12911 0.15KRISS 0.12872 0.18 0.12873 0.18 0.12873 0.18 0.12873 0.18 0.12875 0.18 0.12877 0.18 0.12880 0.18 0.12882 0.18NMIJ 0.12853 0.21 0.12866 0.21 0.12877 0.22 0.12878 0.24 0.12871 0.23 0.12877 0.21 0.12878 0.22 0.12879 0.23VNIIM 0.12832 0.20 0.12852 0.20 0.12880 0.20 0.12858 0.20 0.12856 0.20 0.12888 0.20 0.12882 0.20 0.12900 0.22NIST 0.12960 0.15 0.12930 0.15 0.12910 0.14 0.12900 0.15 0.12910 0.14 0.12910 0.16 0.12910 0.15 0.12910 0.15NMi-VSL 0.12905 0.46 0.12898 0.29 0.12881 0.16 0.12881 0.12 0.12879 0.11 0.12881 0.10 0.12895 0.17 0.12888 0.10

27
Single-ended (SE) accelerometer type 8305 WH 2335 S/N 1610174, continued
Frequency 250 Hz 315 Hz 400 Hz 500 Hz 630 Hz 800 Hz 1000 Hz 1250 HzLab i xi ui /xi xi ui /xi xi ui /xi xi ui /xi xi ui /xi xi ui /xi xi ui /xi xi ui /xi
/pC/(m/s2) /10-2 /pC/(m/s2) /10-2 /pC/(m/s2) /10-2 /pC/(m/s2) /10-2 /pC/(m/s2) /10-2 /pC/(m/s2) /10-2 /pC/(m/s2) /10-2 /pC/(m/s2) /10-2
PTB 0.12904 0.05 0.12906 0.05 0.12905 0.05 0.12908 0.05 0.12918 0.05 0.12916 0.05 0.12926 0.05 0.12937 0.05BNM-CESTA 0.12910 0.25 0.12950 0.25 0.12950 0.25 0.12940 0.25 0.12940 0.25 0.12950 0.25 0.12930 0.25 0.12950 0.25CSIRO-NML 0.12910 0.15 0.12910 0.15 0.12910 0.15 0.12910 0.15 0.12920 0.15 0.12910 0.15 0.12920 0.15 0.12940 0.15CMI 0.12910 0.24 0.12915 0.23 0.12916 0.23 0.12920 0.26 0.12931 0.33 0.12940 0.33 0.12943 0.33 0.12970 0.31CSIR-NML 0.12890 0.25 0.12930 0.25 0.12940 0.30 0.12930 0.30 0.12940 0.30 0.12960 0.30 0.12950 0.30 0.12960 0.30CENAM 0.12894 0.25 0.12904 0.25 0.12910 0.25 0.12915 0.25 0.12913 0.25 0.12923 0.25 0.12941 0.40 0.12946 0.40NRC 0.12916 0.15 0.12892 0.15 0.12903 0.15 0.12897 0.23 0.12885 0.17 0.12944 0.22 0.12935 0.27 0.12956 0.29KRISS 0.12883 0.18 0.12884 0.18 0.12888 0.18 0.12892 0.18 0.12895 0.18 0.12900 0.18 0.12905 0.24 0.12911 0.24NMIJ 0.12882 0.26 0.12881 0.32 0.12884 0.56 0.12893 0.75 0.12879 0.36 0.12890 0.34 0.12955 0.24 0.12972 0.17VNIIM 0.12880 0.22 0.12872 0.22 0.12868 0.22 0.12858 0.22 0.12866 0.22 0.12872 0.22 0.12882 0.22 0.12860 0.22NIST 0.12910 0.15 0.12910 0.16 0.12920 0.15 0.12920 0.17 0.12920 0.20 0.12940 0.43 0.12950 0.22 0.12950 0.21NMi-VSL 0.12892 0.11 0.12899 0.12 0.12907 0.19 0.12929 0.12 0.12946 0.13 0.12981 0.21 0.12973 0.80 0.12958 0.63
Frequency 1600 Hz 2000 Hz 2500 Hz 3150 Hz 4000 Hz 5000 HzLab i xi ui /xi xi ui /xi xi ui /xi xi ui /xi xi ui /xi xi ui /xi
/pC/(m/s2) /10-2 /pC/(m/s2) /10-2 /pC/(m/s2) /10-2 /pC/(m/s2) /10-2 /pC/(m/s2) /10-2 /pC/(m/s2) /10-2
PTB 0.12960 0.05 0.12988 0.05 0.13025 0.10 0.13075 0.10 0.13176 0.10 0.13334 0.10BNM-CESTA 0.12960 0.25 0.12990 0.25 0.13000 0.25 0.13080 0.25 - * - * - * - *CSIRO-NML 0.12960 0.15 0.12980 0.15 0.13020 0.15 0.13100 0.15 0.13200 0.15 0.13360 0.20CMI 0.12983 0.31 0.13005 0.31 0.13041 0.35 0.13099 0.40 0.13162 0.40 0.13280 0.40CSIR-NML 0.12980 0.30 0.13030 0.30 0.13080 0.35 0.13170 0.40 0.13330 0.45 0.13660 0.50CENAM 0.12967 0.40 0.12995 0.40 0.13028 0.40 0.13028 0.40 0.13122 0.40 0.13203 0.40NRC 0.12940 0.31 0.12957 0.33 0.12974 0.34 0.12992 0.43 0.13085 0.47 0.13203 0.54KRISS 0.12926 0.24 0.12948 0.24 0.12968 0.28 0.13014 0.30 0.13080 0.33 0.13186 0.33NMIJ 0.13022 0.25 0.13101 0.25 0.13194 0.26 0.13341 0.53 0.13653 0.66 0.14152 0.76VNIIM 0.12890 0.22 0.12912 0.22 0.12916 0.34 0.12944 0.34 0.13134 0.34 0.13230 0.34NIST 0.12960 0.21 0.12970 0.34 0.13050 0.58 0.13150 0.63 0.13230 0.59 0.13360 0.60NMi-VSL 0.12990 0.86 0.13041 0.49 0.13116 0.79 0.13243 0.31 0.13475 2.85 0.13810 1.69
* The measurements were carried out at shifted frequencies, see page 38
28
9.3 RESULTS - PART 3: All individual measurements of thelaboratoriesAll 12 laboratories fulfilled the requirement to apply laser interferometry in accordance withISO 16063 11:1999. Whether the method 1, method 2 and/or method 3 was used by thelaboratory has been marked in the tables by the abbreviation FC (for fringe-countingmethod = method 1), MP (for minimum-point method = method 2) and SA (for sine-approximation method = method 3). As a special version of method 2, fringedisappearance [ 4 ] has been marked by FD.
To simplify the calculations using Excel files [ 7 ], the same number of decimal places wasgiven for all individual laboratory results. If any table indicates 0 at the 5th decimal place,e.g. 0.12620 pC/(m/s²) throughout any measurement series of 22 different standardfrequencies (40 Hz to 5 kHz), this indicates that 0 was added by the pilot laboratory, i.e.the result stated by the laboratory was 0.1262 pC/(m/s²), cf. next pages.

29
Table Lab 1a: Results “PTB 1“ of PTB for charge sensitivity of BB accelerometer as a function of frequency (standard frequencies)
Acceleration amplitude: 50m/s² from 40 Hz to 800 Hz, 100 m/s² for 1000 Hz to 5000 Hz
Frequency Method Charge sensitivity/Hz /pC/(m/s²)
Trial 1 Trial 2 Trial 3 Trial 4 Trial 5 Trial 6 Trial 7 Trial 8 Trial 940 FC 0.12668 0.12666 0.12667 0.12663 0.12668 0.12664 0.12666 0.12659 0.1266050 FC 0.12669 0.12670 0.12662 0.12671 0.12665 0.12660 0.12661 0.12658 0.1265863 FC 0.12666 0.12665 0.12661 0.12659 0.12666 0.12662 0.12662 0.12656 0.1265880 FC 0.12666 0.12664 0.12660 0.12660 0.12667 0.12660 0.12664 0.12657 0.12657
100 FC 0.12660 0.12666 0.12662 0.12665 0.12666 0.12662 0.12664 0.12656 0.12657125 FC 0.12666 0.12665 0.12661 0.12669 0.12666 0.12659 0.12664 0.12657 0.12657160 FC 0.12670 0.12668 0.12662 0.12670 0.12666 0.12661 0.12663 0.12659 0.12656200 FC 0.12666 0.12667 0.12661 0.12664 0.12664 0.12660 0.12663 0.12658 0.12656250 FC 0.12670 0.12667 0.12663 0.12665 0.12670 0.12662 0.12668 0.12659 0.12657315 FC 0.12671 0.12671 0.12667 0.12670 0.12670 0.12663 0.12668 0.12662 0.12658400 FC 0.12666 0.12675 0.12658 0.12668 0.12665 0.12661 0.12665 0.12661 0.12661500 FC 0.12671 0.12664 0.12662 0.12664 0.12663 0.12658 0.12663 0.12658 0.12657630 FC 0.12671 0.12660 0.12664 0.12674 0.12666 0.12665 0.12672 0.12671 0.12667800 FC 0.12666 0.12672 0.12667 0.12668 0.12679 0.12669 0.12672 0.12664 0.126671000 SA 0.12675 0.12678 0.12688 0.12672 0.12678 0.12676 0.12677 0.12678 0.126761250 SA 0.12688 0.12680 0.12690 0.12680 0.12687 0.12686 0.12686 0.12683 0.126811600 SA 0.12696 0.12700 0.12706 0.12693 0.12697 0.12695 0.12698 0.12700 0.127002000 SA 0.12716 0.12719 0.12722 0.12709 0.12717 0.12710 0.12717 0.12717 0.127182500 SA 0.12732 0.12753 0.12747 0.12730 0.12738 0.12743 0.12748 0.12737 0.127403150 SA 0.12774 0.12783 0.12786 0.12768 0.12773 0.12774 0.12765 0.12775 0.127604000 SA 0.12840 0.12845 0.12844 0.12826 0.12859 0.12853 0.12862 0.12857 0.128595000 SA 0.12931 0.12927 0.12930 0.12938 0.12947 0.12942 0.12931 0.12920 0.12937
Note: The measurements were carried out in January 2000 at the beginning of the circulation period. The results denoted “PTB 1” (trials and mean)and uncertainties at k = 1 of these measurements have been used as PTB contribution to the reference values (later the KCRV) of the key comparison.
30
Table Lab 1b: Results “PTB 1“ of PTB for charge sensitivity of SE accelerometer as a function of frequency (standard frequencies)
Acceleration amplitude: 50m/s² from 40 Hz to 800 Hz, 100 m/s² for 1000 Hz to 5000 Hz
Frequency Method Charge sensitivity/Hz /pC/(m/s²)
Trial 1 Trial 2 Trial 3 Trial 4 Trial 5 Trial 6 Trial 7 Trial 8 Trial 940 FC 0.12904 0.12898 0.12904 0.12899 0.12908 0.12903 0.12904 0.12898 0.1289850 FC 0.12906 0.12895 0.12904 0.12902 0.12904 0.12902 0.12896 0.12899 0.1290163 FC 0.12906 0.12894 0.12905 0.12907 0.12905 0.12900 0.12900 0.12900 0.1290380 FC 0.12907 0.12896 0.12907 0.12903 0.12902 0.12900 0.12902 0.12896 0.12899
100 FC 0.12903 0.12895 0.12906 0.12905 0.12906 0.12901 0.12897 0.12893 0.12900125 FC 0.12907 0.12897 0.12908 0.12904 0.12903 0.12899 0.12901 0.12895 0.12898160 FC 0.12905 0.12899 0.12908 0.12906 0.12904 0.12900 0.12900 0.12898 0.12899200 FC 0.12910 0.12906 0.12911 0.12905 0.12903 0.12901 0.12900 0.12898 0.12902250 FC 0.12907 0.12900 0.12909 0.12905 0.12907 0.12902 0.12903 0.12899 0.12905315 FC 0.12910 0.12904 0.12912 0.12905 0.12909 0.12904 0.12905 0.12899 0.12908400 FC 0.12915 0.12905 0.12912 0.12906 0.12906 0.12903 0.12903 0.12901 0.12895500 FC 0.12917 0.12913 0.12910 0.12909 0.12908 0.12906 0.12905 0.12898 0.12903630 FC 0.12917 0.12922 0.12918 0.12923 0.12914 0.12920 0.12918 0.12921 0.12908800 FC 0.12922 0.12921 0.12916 0.12915 0.12918 0.12911 0.12910 0.12908 0.129251000 SA 0.12919 0.12926 0.12933 0.12928 0.12925 0.12924 No Data No Data No Data1250 SA 0.12936 0.12937 0.12945 0.12939 0.12933 0.12929 No Data No Data No Data1600 SA 0.12961 0.12958 0.12961 0.12966 0.12958 0.12955 No Data No Data No Data2000 SA 0.12987 0.12985 0.12990 0.12991 0.12985 0.12991 No Data No Data No Data2500 SA 0.13044 0.13022 0.13028 0.13025 0.13009 0.13020 No Data No Data No Data3150 SA 0.13086 0.13077 0.13081 0.13070 0.13070 0.13066 No Data No Data No Data4000 SA 0.13193 0.13160 0.13179 0.13184 0.13171 0.13167 No Data No Data No Data5000 SA 0.13353 0.13303 0.13345 0.13326 0.13340 0.13336 No Data No Data No Data
Note: The measurements were carried out in January 2000 at the beginning of the circulation period. The results denoted “PTB 1” (trials and mean)and uncertainties at k = 1 of these measurements have been used as PTB contribution to the reference values (later the KCRV) of the key comparison.

31
Table Lab 1a*: Results “PTB 2“ of PTB for charge sensitivity of BB accelerometer as a function of frequency (standard frequencies)
Acceleration amplitude: 50m/s² from 40 Hz to 800 Hz, 100 m/s² for 1000 Hz to 5000 Hz
Frequency Method Charge sensitivity Mean Rel. uncertainty/Hz /pC/(m/s²) Trials of mean (k=1)
Trial 1 Trial 2 Trial 3 Trial 4 Trial 5 Trial 6 Trial 7 Trial 8 1-8 /10-2
40 FC 0.12659 0.12665 0.12662 0.12667 0.12659 0.12669 No Data No Data 0.12664 0.0550 FC 0.12658 0.1266 0.1266 0.12665 0.12656 0.12668 No Data No Data 0.12661 0.0563 FC 0.12659 0.12661 0.12662 0.12663 0.12656 0.1267 No Data No Data 0.12662 0.0580 FC 0.12658 0.12660 0.12661 0.12662 0.12658 0.12667 No Data No Data 0.12661 0.05
100 FC 0.12661 0.12661 0.12662 0.12666 0.12654 0.12665 No Data No Data 0.12661 0.05125 FC 0.12659 0.12660 0.12661 0.12665 0.12659 0.12664 No Data No Data 0.12661 0.05160 FC 0.12661 0.12664 0.12662 0.12667 0.12665 0.12664 No Data No Data 0.12664 0.05200 FC 0.12667 0.12672 0.12670 0.12672 0.12663 0.12662 No Data No Data 0.12668 0.05250 FC 0.12669 0.12674 0.12667 0.12670 0.12666 0.12659 No Data No Data 0.12667 0.05315 FC 0.12674 0.12677 0.12671 0.12673 0.12664 0.12652 No Data No Data 0.12669 0.05400 FC 0.12667 0.12676 0.12668 0.12667 0.12668 0.12657 No Data No Data 0.12667 0.05500 FC 0.12663 0.12675 0.12665 0.12671 0.12665 0.12661 No Data No Data 0.12667 0.05630 FC 0.12688 0.12684 0.12683 0.12687 0.12674 0.12656 No Data No Data 0.12679 0.05800 FC 0.12676 0.12686 0.12679 0.12681 0.12669 No Data No Data No Data 0.12678 0.051000 SA 0.12670 0.12670 0.12667 0.12687 0.12691 0.12684 0.12688 0.12689 0.12681 0.051250 SA 0.12680 0.12680 0.12677 0.12698 0.12701 0.12696 0.12701 0.12702 0.12692 0.051600 SA 0.12691 0.12691 0.12691 0.12709 0.12712 0.12704 0.12709 0.12708 0.12702 0.052000 SA 0.12710 0.12709 0.12716 0.12729 0.12729 0.12728 0.12731 0.12733 0.12723 0.052500 SA 0.12735 0.12732 0.12743 0.12747 0.12746 0.12738 0.12754 0.12757 0.12744 0.103150 SA 0.12765 0.12767 0.12780 0.12787 0.12785 0.12788 0.12791 0.12791 0.12782 0.104000 SA 0.12837 0.12839 0.12862 0.12853 0.12844 0.12845 0.12852 0.12846 0.12847 0.105000 SA 0.12898 0.12909 0.12919 0.12924 0.12927 0.12947 0.12953 0.12953 0.12929 0.10
Note: The measurements were carried out in June 2001 at the end of the circulation period. The results denoted “PTB 2“ (trials and mean) and uncertainties atk = 1 of these measurements have been used to evaluate the long-term stability of the transfer standard (back-to-back accelerometer type 8305 S/N 1483337).

32
Table Lab 1b*: Results “PTB 2“ of PTB for charge sensitivity of SE accelerometer as a function of frequency (standard frequencies)
Acceleration amplitude: 50m/s² from 40 Hz to 800 Hz, 100 m/s² for 1000 Hz to 5000 Hz
Frequency Method Charge sensitivity Mean Uncertainty/Hz /pC/(m/s²) Trials of mean (k=1)
Trial 1 Trial 2 Trial 3 Trial 4 Trial 5 Trial 6 Trial 7 Trial 8 1-8 /10-2
40 FC 0.12900 0.12896 0.12905 0.12896 0.12903 0.12907 No Data No Data 0.12901 0.0550 FC 0.12898 0.12894 0.12905 0.12900 0.12895 0.12903 No Data No Data 0.12899 0.0563 FC 0.12898 0.12896 0.12903 0.12896 0.12897 0.12902 No Data No Data 0.12899 0.0580 FC 0.12896 0.12897 0.12904 0.12897 0.12900 0.12901 No Data No Data 0.12899 0.05
100 FC 0.12896 0.12897 0.12902 0.12897 0.12899 0.12904 No Data No Data 0.12899 0.05125 FC 0.12906 0.12899 0.12904 0.12901 0.12900 0.12903 No Data No Data 0.12902 0.05160 FC 0.12896 0.12901 0.12906 0.12904 0.12898 0.12901 No Data No Data 0.12901 0.05200 FC 0.12911 0.12906 0.12910 0.12903 0.12897 0.12901 No Data No Data 0.12905 0.05250 FC 0.12899 0.12903 0.12908 0.12907 0.12899 0.12899 No Data No Data 0.12902 0.05315 FC 0.12913 0.12897 0.12908 0.12904 0.12896 0.12898 No Data No Data 0.12903 0.05400 FC 0.12920 0.12913 0.12912 0.12912 0.12899 0.12905 No Data No Data 0.12910 0.05500 FC 0.12913 0.12912 0.12918 0.12911 0.12913 0.12918 No Data No Data 0.12914 0.05630 FC 0.12926 0.12915 0.12931 0.12923 0.12927 0.12919 No Data No Data 0.12923 0.05800 FC 0.12925 0.12925 0.12924 0.12923 0.12929 0.12923 No Data No Data 0.12925 0.051000 SA 0.12927 0.12927 0.12925 0.12927 0.12934 0.12935 0.12932 0.12935 0.12930 0.051250 SA 0.12940 0.12939 0.12937 0.12941 0.12945 0.12947 0.12944 0.12947 0.12942 0.051600 SA 0.12957 0.12960 0.12955 0.12953 0.12957 0.12946 0.12966 0.12969 0.12958 0.052000 SA 0.12987 0.12988 0.12987 0.12987 0.13002 0.12992 0.12992 0.12996 0.12991 0.052500 SA 0.13026 0.13023 0.13023 0.13023 0.13024 0.13021 0.13024 0.13025 0.13024 0.103150 SA 0.13069 0.13074 0.13077 0.13076 0.13078 0.13081 0.13063 0.13065 0.13073 0.104000 SA 0.13170 0.13176 0.13170 0.13179 0.13161 0.13173 0.13181 0.13179 0.13174 0.105000 SA 0.13331 0.13332 0.13314 0.13340 0.13331 0.13313 0.13348 0.13344 0.13332 0.10
Note: The measurements were carried out in June 2001 at the end of the circulation period. The results denoted “PTB 2“ (trials and mean) and uncertainties atk = 1 of these measurements have been used, in connection with PTB 1, to evaluate the long-term stability of the transfer standard (single-ended accelerometertype 8305 WH 2335, S/N 1610174).

33
Table Lab 1a**: Results “PTB (alternative)“ of PTB for charge sensitivity of BB accelerometer as a function of frequency (standardfrequencies)
Acceleration amplitude: 50m/s² from 40 Hz to 5000 Hz
Frequency Method Charge sensitivity Mean Rel. uncertainty/Hz /pC/(m/s²) Trials of mean (k=1)
Trial 1 Trial 2 Trial 3 Trial 4 Trial 5 Trial 6 Trial 7 1-7 /10-2
40 SA 0.12639 0.12657 0.12663 No Data No Data No Data No Data 0.12653 0.0550 SA 0.12651 0.12652 0.12659 No Data No Data No Data No Data 0.12654 0.0563 SA 0.12655 0.12658 0.12665 No Data No Data No Data No Data 0.12659 0.0580 SA 0.12657 0.12658 0.12665 No Data No Data No Data No Data 0.12660 0.05100 SA 0.12655 0.12659 0.12666 No Data No Data No Data No Data 0.12660 0.05125 SA 0.12656 0.12661 0.12667 No Data No Data No Data No Data 0.12662 0.05160 SA 0.12661 0.12662 0.12665 No Data No Data No Data No Data 0.12663 0.05200 SA 0.12635 0.12652 0.12649 No Data No Data No Data No Data 0.12645 0.05250 SA 0.12651 0.12641 0.12667 No Data No Data No Data No Data 0.12653 0.05315 SA 0.12652 0.12653 0.12667 No Data No Data No Data No Data 0.12658 0.05400 SA 0.12652 0.12650 0.12667 No Data No Data No Data No Data 0.12656 0.05500 SA 0.12654 0.12657 0.12669 No Data No Data No Data No Data 0.12660 0.05630 SA 0.12664 0.12653 0.12674 No Data No Data No Data No Data 0.12664 0.05800 SA 0.12661 0.12660 0.12674 No Data No Data No Data No Data 0.12665 0.05
1000 FC 0.12671 0.12674 0.12680 0.12681 0.12668 0.12666 0.12675 0.12674 0.101250 FC 0.12671 0.12678 0.12681 0.12680 0.12682 0.12659 0.12675 0.12675 0.101600 FC 0.12698 0.12685 0.12702 0.12692 0.12709 0.12679 0.12690 0.12694 0.152000 FC 0.12679 0.12697 0.12715 0.12706 0.12717 0.12689 0.12701 0.12701 0.152500 FC 0.12728 0.12704 0.12738 0.12726 0.12735 0.12718 0.12715 0.12724 0.203150 FC 0.12756 0.12749 0.12784 0.12756 0.12765 0.12744 0.12758 0.12759 0.204000 FC 0.12780 0.12786 0.12794 0.12834 0.12804 0.12808 0.12828 0.12805 0.205000 FC 0.12918 0.12914 0.12914 0.12847 0.12860 0.12874 0.12856 0.12883 0.20
Note: The mean results denoted “PTB (alternative)“ and uncertainties at k = 1 have been used, in connection with PTB 1 and PTB 2, to evaluate the frequencyresponse of the transfer standard (back-to-back accelerometer type 8305 S/N 1483337) and to demonstrate the consistency of PTB measurements.
34
Table Lab 1b**: Results “PTB (alternative)“ of PTB for charge sensitivity of SE accelerometer as a function of frequency (standardfrequencies)
Acceleration amplitude: 50m/s² from 40 Hz to 5000 Hz
Frequency Method Charge sensitivity Mean Rel. uncertainty/Hz /pC/(m/s²) Trials of mean (k=1)
Trial 1 Trial 2 Trial 3 Trial 4 Trial 5 Trial 6 Trial 7 1-7 /10-2
40 SA 0.12894 0.12899 0.12904 No Data No Data No Data No Data 0.12899 0.0550 SA 0.12894 0.12901 0.12905 No Data No Data No Data No Data 0.12899 0.0563 SA 0.12901 0.12900 0.12904 No Data No Data No Data No Data 0.12902 0.0580 SA 0.12901 0.12901 0.12905 No Data No Data No Data No Data 0.12903 0.05100 SA 0.12900 0.12902 0.12906 No Data No Data No Data No Data 0.12903 0.05125 SA 0.12900 0.12901 0.12904 No Data No Data No Data No Data 0.12902 0.05160 SA 0.12902 0.12900 0.12905 No Data No Data No Data No Data 0.12904 0.05200 SA 0.12909 0.12898 0.12903 No Data No Data No Data No Data 0.12906 0.05250 SA 0.12901 0.12911 0.12912 No Data No Data No Data No Data 0.12907 0.05315 SA 0.12903 0.12908 0.12909 No Data No Data No Data No Data 0.12906 0.05400 SA 0.12902 0.12908 0.12909 No Data No Data No Data No Data 0.12906 0.05500 SA 0.12907 0.12908 0.12909 No Data No Data No Data No Data 0.12908 0.05630 SA 0.12911 0.12919 0.12921 No Data No Data No Data No Data 0.12916 0.05800 SA 0.12916 0.12920 0.12918 No Data No Data No Data No Data 0.12917 0.05
1000 FC 0.12925 0.12925 0.12921 0.12916 0.12913 0.12912 0.12913 0.12918 0.101250 FC 0.12935 0.12934 0.12926 0.12920 0.12924 0.12921 0.12934 0.12928 0.101600 FC 0.12934 0.12949 0.12946 0.12938 0.12929 0.12942 0.12942 0.12940 0.152000 FC 0.12973 0.12992 0.12994 0.12978 0.12992 0.12971 0.12963 0.12980 0.152500 FC 0.12961 0.13009 0.12980 0.12979 0.12984 0.12995 0.12997 0.12986 0.203150 FC 0.13028 0.13057 0.13045 0.13018 0.13026 0.13067 0.13053 0.13042 0.204000 FC 0.13205 0.13129 0.13162 0.13139 0.13136 0.13178 0.13165 0.13159 0.205000 FC 0.13319 0.13302 0.13312 0.13319 0.13330 0.13317 0.13376 0.13325 0.20
Note: The mean results denoted “PTB (alternative)“ and uncertainties at k = 1 have been used, in connection with PTB 1 and PTB 2, to evaluate the frequencyresponse of the transfer standard (single-ended accelerometer type 8305 WH 2335, S/N 1610174) and to demonstrate the consistency of PTB measurements.

35
Table Lab 1a+: Results of PTB for charge sensitivity of BB accelerometer, differentacceleration amplitudes at 160 Hz
Accelerationamplitude
Charge sensitivity Rel. uncertainty(k=1)
/m/s2 /pC/(m/s²) /10-2
7 0.12654 0.0518 0.12657 0.0520 0.12658 0.0528 0.12658 0.0536 0.12658 0.0543 0.12659 0.0550 0.12659 0.0568 0.12660 0.0578 0.12660 0.0586 0.12659 0.05
Table Lab 1b+: Results of PTB for charge sensitivity of SE accelerometer, differentacceleration amplitudes at 160 Hz
Accelerationamplitude
Charge sensitivity Rel. uncertainty(k=1)
/m/s2 /pC/(m/s²) /10-2
9 0.12897 0.0519 0.12890 0.0532 0.12891 0.0543 0.12892 0.0553 0.12895 0.0563 0.12894 0.0573 0.12896 0.0584 0.12895 0.0594 0.12894 0.05

36
Table Lab 2a: Results of BNM – CESTA for charge sensitivity of BB accelerometer as afunction of frequency (standard frequencies)
Acceleration amplitude: 98 m/s² at 160 Hz; 30 m/s² to 100 m/s² from40 Hz to 315 Hz, 41 m/s² to 230 m/s² at higher frequencies
Frequency Method Charge sensitivity/Hz /pC/(m/s²)
Trial 1 Trial 2 Trial 3 Trial 4 Trial 540 FC 0.12670 0.12670 0.12670 0.12670 0.1267050 FC 0.12670 0.12670 0.12670 0.12670 0.1267063 FC 0.12670 0.12670 0.12670 0.12670 0.1267080 FC 0.12680 0.12680 0.12680 0.12680 0.12680100 FC 0.12680 0.12680 0.12680 0.12680 0.12680125 FC 0.12670 0.12670 0.12670 0.12670 0.12670160 FC 0.12670 0.12670 0.12680 0.12670 0.12680200 FC 0.12680 0.12680 0.12680 0.12680 0.12680250 FC 0.12680 0.12680 0.12680 0.12680 0.12680315 FC 0.12690 0.12690 0.12690 0.12690 0.12690400 FC 0.12700 0.12700 0.12700 0.12700 0.12710500 FC 0.12700 0.12690 0.12690 0.12690 0.12700630 FC 0.12690 0.12690 0.12690 0.12690 0.12700800 FC 0.12710 0.12690 0.12680 0.12710 0.12700
1000 MP 0.12710 0.12690 0.12690 0.12690 0.127001250 MP 0.12700 0.12700 0.12700 0.12700 0.127001600 MP 0.12700 0.12720 0.12710 0.12720 0.127102000 MP 0.12730 0.12720 0.12740 0.12720 0.127302500 MP 0.12750 0.12740 0.12740 0.12760 0.127703150 MP 0.12780 0.12790 0.12770 0.12770 0.12780
See page 38

37
Table Lab 2b: Results of BNM - CESTA for charge sensitivity of SE accelerometer as afunction of frequency (standard frequencies)
Acceleration amplitude: 98 m/s² at 160 Hz; 30 m/s² to 100 m/s² from40 Hz to 315 Hz, 41 m/s² to 230 m/s² at higher frequencies
Frequency Method Charge sensitivity/Hz /pC/(m/s²)
Trial 1 Trial 2 Trial 3 Trial 4 Trial 540 FC 0.12910 0.12920 0.12910 0.12920 0.1291050 FC 0.12920 0.12920 0.12910 0.12920 0.1292063 FC 0.12910 0.12920 0.12910 0.12920 0.1291080 FC 0.12930 0.12930 0.12920 0.12930 0.12920100 FC 0.12920 0.12930 0.12920 0.12930 0.12920125 FC 0.12920 0.12920 0.12920 0.12920 0.12920160 FC 0.12930 0.12930 0.12920 0.12930 0.12920200 FC 0.12920 0.12930 0.12920 0.12930 0.12920250 FC 0.12910 0.12920 0.12910 0.12920 0.12910315 FC 0.12950 0.12950 0.12950 0.12950 0.12950400 FC 0.12950 0.12950 0.12950 0.12950 0.12950500 FC 0.12940 0.12940 0.12940 0.12940 0.12940630 FC 0.12940 0.12940 0.12940 0.12940 0.12940800 FC 0.12940 0.12950 0.12940 0.12950 0.12950
1000 MP 0.12930 0.12930 0.12920 0.12930 0.129201250 MP 0.12950 0.12950 0.12950 0.12950 0.129501600 MP 0.12960 0.12970 0.12960 0.12960 0.129602000 MP 0.12990 0.12990 0.12990 0.12990 0.129802500 MP 0.13010 0.13000 0.13010 0.13000 0.129803150 MP 0.13080 0.13100 0.13080 0.13070 0.13070
See page 38
38
Table Lab 2a+: Results of BNM – CESTA for charge sensitivity of BB accelerometer,different acceleration amplitude at 160 Hz, different frequencies
Acceleration amplitude 30 m/s²
Frequency Method Charge sensitivity Rel. uncertainty/Hz /pC/(m/s²) (k=1)
Trial 1 Trial 2 Trial 3 Trial 4 Trial 5 statedvalue
/10-2
160 FC 0.12690 0.12690 0.12690 0.12700 0.12700 0.12700 0.25
Frequencies 4500 Hz and 5500 Hz
Frequency Method Charge sensitivity Rel. uncertainty/Hz /pC/(m/s²) (k=1)
Trial 1 Trial 2 Trial 3 Trial 4 Trial 5 statedvalue
/10-2
4500 MP 0.12890 0.12900 0.12880 0.12880 0.12890 0.12890 0.25
5500 MP 0.13000 0.13000 0.13010 0.13020 0.13020 0.13010 0.25
Table Lab 2b+: Results of BNM – CESTA for charge sensitivity of SE accelerometer,different acceleration amplitude at 160 Hz, different frequencies
Acceleration amplitude 30 m/s²
Frequency Method Charge sensitivity Rel. uncertainty/Hz /pC/(m/s²) (k=1)
Trial 1 Trial 2 Trial 3 Trial 4 Trial 5 statedvalue
/10-2
160 FC 0.12950 0.12950 0.12940 0.12950 0.12940 0.12950 0.25
Frequencies 4500 Hz and 5500 Hz
Frequency Method Charge sensitivity Rel. uncertainty/Hz /pC/(m/s²) (k=1)
Trial 1 Trial 2 Trial 3 Trial 4 Trial 5 statedvalue
/10-2
4500 MP 0.13250 0.13230 0.13240 0.13240 0.13230 0.13240 0.25
5500 MP 0.13430 0.13410 0.13420 0.13420 0.13400 0.13420 0.25
Comment received from BNM-CESTA:
At the frequencies of 4000 Hz and 5000 Hz, our exciter shows a distortion greater than1%. We therefore have voluntarily shifted the calibration points to the closest frequencies,for which this influence is minimum.

39
Table Lab 3a: Results of CSIRO-NML for charge sensitivity of BB accelerometer as afunction of frequency (standard frequencies)
Acceleration amplitude: 30 m/s² to 70 m/s² from 40 Hz to 2500 Hz,76 m/s² to 190 m/s² from 3150 Hz to 5000 Hz
Frequency Method Charge sensitivity/Hz /pC/(m/s²)
Trial 1 Trial 2 Trial 3 Trial 4 Trial 540 FC 0.12680 0.12680 0.12690 0.12690 0.1269050 FC 0.12690 0.12680 0.12680 0.12680 0.1270063 FC 0.12660 0.12670 0.12680 0.12660 0.1267080 FC 0.12660 0.12660 0.12660 0.12660 0.12660100 FC 0.12660 0.12660 0.12660 0.12660 0.12660125 FC 0.12660 0.12660 0.12650 0.12660 0.12660160 FC 0.12650 0.12650 0.12650 0.12660 0.12660200 FC 0.12660 0.12650 0.12640 0.12670 0.12670250 FC 0.12660 0.12660 0.12660 0.12640 0.12660315 FC 0.12660 0.12640 0.12650 0.12660 0.12660400 FC 0.12670 0.12650 0.12650 0.12660 0.12660500 FC 0.12670 0.12650 0.12660 0.12670 0.12660630 FC 0.12690 0.12660 0.12660 0.12670 0.12670800 FC 0.12710 0.12660 0.12660 0.12670 0.12680
1000 FC 0.12710 0.12680 0.12670 0.12690 0.127001250 FC 0.12700 0.12690 0.12690 0.12750 0.127201600 FC 0.12730 0.12710 0.12710 0.12720 0.127102000 FC 0.12720 0.12730 0.12730 0.12740 0.127302500 FC 0.12770 0.12740 0.12750 0.12750 0.127603150 FC/MP 0.12790 0.12810 0.12810 0.12830 0.128004000 MP 0.12880 0.12850 0.12860 0.12850 0.128605000 MP 0.12960 0.12950 0.12940 0.12960 0.12940

40
Table Lab 3b: Results of CSIRO-NML for charge sensitivity of SE accelerometer as afunction of frequency (standard frequencies)
Acceleration amplitude: 30 m/s² to 70 m/s² from 40 Hz to 2500 Hz,76 m/s² to 190 m/s² from 3150 Hz to 5000 Hz
Frequency Method Charge sensitivity/Hz /pC/(m/s²)
Trial 1 Trial 2 Trial 3 Trial 4 Trial 540 FC 0.12930 0.12930 0.12920 0.12930 0.1291050 FC 0.12930 0.12940 0.12930 0.12930 0.1291063 FC 0.12910 0.12910 0.12910 0.12910 0.1291080 FC 0.12900 0.12900 0.12900 0.12900 0.12910100 FC 0.12900 0.12900 0.12900 0.12900 0.12910125 FC 0.12890 0.12900 0.12900 0.12900 0.12910160 FC 0.12890 0.12900 0.12900 0.12900 0.12910200 FC 0.12890 0.12900 0.12890 0.12900 0.12910250 FC 0.12920 0.12900 0.12900 0.12940 0.12920315 FC 0.12890 0.12900 0.12900 0.12900 0.12910400 FC 0.12900 0.12900 0.12900 0.12900 0.12920500 FC 0.12910 0.12900 0.12900 0.12910 0.12930630 FC 0.12930 0.12910 0.12910 0.12920 0.12930800 FC 0.12920 0.12920 0.12920 0.12930 0.12950
1000 FC 0.12930 0.12930 0.12930 0.12960 0.129501250 FC 0.12950 0.12950 0.12950 0.12990 0.129601600 FC 0.12970 0.12980 0.12980 0.12970 0.129702000 FC 0.12990 0.13000 0.13000 0.13000 0.130002500 FC 0.13030 0.13030 0.13030 0.13030 0.130403150 FC 0.13080 0.13110 0.13100 0.13100 0.131104000 MP 0.13220 0.13210 0.13190 0.13190 0.132105000 MP 0.13360 0.13360 0.13360 0.13340 0.13390

41
Table Lab 4a: Results of CMI for charge sensitivity of BB accelerometer as a function offrequency (standard frequencies)
Acceleration amplitude: 50 m/s² from 40 Hz to 630 Hz, 100 m/s² from 800Hz to 1000 Hz, 12 m/s² to 191 m/s² from 1250 Hz to 5000 Hz
Frequency Method Charge sensitivity/Hz /pC/(m/s²)
Trial 1 Trial 2 Trial 3 Trial 4 Trial 540 FC 0.12653 0.12652 0.12645 0.12645 0.1265050 FC 0.12657 0.12656 0.12650 0.12650 0.1265663 FC 0.12664 0.12659 0.12656 0.12647 0.1266380 FC 0.12660 0.12664 0.12660 0.12653 0.12662100 FC 0.12666 0.12666 0.12657 0.12649 0.12665125 FC 0.12660 0.12664 0.12656 0.12656 0.12663160 FC 0.12658 0.12659 0.12654 0.12659 0.12669200 FC 0.12652 0.12664 0.12657 0.12667 0.12665250 FC 0.12670 0.12669 0.12650 0.12665 0.12670315 FC 0.12665 0.12655 0.12652 0.12668 0.12661400 FC 0.12637 0.12674 0.12648 0.12678 0.12688500 FC 0.12646 0.12690 0.12643 0.12685 0.12685630 FC 0.12651 0.12685 0.12635 0.12675 0.12684800 FC 0.12642 0.12689 0.12651 0.12695 0.12675
1000 FC 0.12648 0.12695 0.12652 0.12698 0.126721250 MP 0.12682 0.12709 0.12660 0.12693 0.126641600 MP 0.12674 0.12700 0.12688 0.12704 0.126762000 MP 0.12692 0.12721 0.12698 0.12711 0.127062500 MP 0.12721 0.12734 0.12713 0.12709 0.127253150 MP 0.12754 0.12773 0.12761 0.12693 0.127764000 MP 0.12774 0.12781 0.12804 0.12832 0.128145000 MP 0.12947 0.12907 0.12939 0.12951 0.12931

42
Table Lab 4b: Results of CMI for charge sensitivity of SE accelerometer as a function offrequency (standard frequencies)
Acceleration amplitude: 50 m/s² from 40 Hz to 630 Hz, 100 m/s² from 800Hz to 1000 Hz, 12 m/s² to 191 m/s² from 1250 Hz to 5000 Hz
Frequency Method Charge sensitivity/Hz /pC/(m/s²)
Trial 1 Trial 2 Trial 3 Trial 4 Trial 540 FC 0.12876 0.12875 0.12877 0.12882 0.1286450 FC 0.12886 0.12874 0.12877 0.12889 0.1287263 FC 0.12887 0.12879 0.12883 0.12886 0.1287080 FC 0.12895 0.12881 0.12884 0.12891 0.12875100 FC 0.12902 0.12885 0.12887 0.12894 0.12883125 FC 0.12902 0.12893 0.12895 0.12901 0.12886160 FC 0.12896 0.12896 0.12903 0.12909 0.12895200 FC 0.12912 0.12906 0.12898 0.12915 0.12892250 FC 0.12922 0.12895 0.12895 0.12925 0.12912315 FC 0.12915 0.12909 0.12918 0.12911 0.12922400 FC 0.12921 0.12923 0.12924 0.12915 0.12899500 FC 0.12924 0.12926 0.12944 0.12893 0.12914630 FC 0.12904 0.12979 0.12953 0.12894 0.12924800 FC 0.12932 0.12987 0.12968 0.12913 0.12901
1000 FC 0.12923 0.12990 0.12981 0.12915 0.129081250 MP 0.12948 0.13008 0.12997 0.12938 0.129571600 MP 0.12958 0.13004 0.13009 0.12955 0.129892000 MP 0.12981 0.13014 0.13025 0.12977 0.130292500 MP 0.13026 0.13058 0.13051 0.12997 0.130753150 MP 0.13094 0.13111 0.13124 0.13024 0.131414000 MP 0.13146 0.13200 0.13164 0.13101 0.131985000 MP 0.13252 0.13314 0.13251 0.13264 0.13319

43
Table Lab 4a+: Results of CMI for charge sensitivity of BB accelerometer, differentacceleration amplitudes at 160 Hz
Acceleration Charge sensitivity Rel. uncertaintyamplitude (k=1)
/m/s² /pC/(m/s²) /10-2
10 0.12656 0.2550 0.12660 0.23
100 0.12661 0.23150 0.12662 0.24200 0.12666 0.25
Table Lab 4b+: Results of CMI for charge sensitivity of SE accelerometer, differentacceleration amplitudes at 160 Hz
Acceleration Charge sensitivity Rel. uncertaintyamplitude (k=1)
/m/s² /pC/(m/s²) /10-2
10 0.12894 0.2550 0.12900 0.23
100 0.12903 0.23150 0.12905 0.24200 0.12909 0.25

44
Table Lab 5a: Results of CSIR-NML for charge sensitivity of BB accelerometer as afunction of frequency (standard frequencies)
Acceleration amplitude: 100 m/s² from 40 Hz to 3150 Hz,138 m/s² to 799 m/s² from 4000 Hz to 5000 Hz
Frequency Method Charge sensitivity/Hz /pC/(m/s²)
Trial 1 Trial 2 Trial 3 Trial 4 Trial 540 FC 0.12770 0.12710 0.12760 0.12760 0.1275050 FC 0.12740 0.12630 0.12670 0.12720 0.1272063 FC 0.12600 0.12610 0.12670 0.12610 0.1261080 FC 0.12610 0.12590 0.12580 0.12630 0.12630100 FC 0.12600 0.12690 0.12650 0.12620 0.12630125 FC 0.12640 0.12680 0.12620 0.12580 0.12570160 FC 0.12660 0.12620 0.12660 0.12690 0.12680200 FC 0.12630 0.12600 0.12630 0.12620 0.12630250 FC 0.12650 0.12660 0.12640 0.12670 0.12660315 FC 0.12660 0.12650 0.12670 0.12660 0.12650400 FC 0.12700 0.12700 0.12700 0.12720 0.12720500 FC 0.12710 0.12700 0.12710 0.12720 0.12720630 FC 0.12680 0.12670 0.12660 0.12690 0.12680800 FC 0.12680 0.12680 0.12670 0.12700 0.12690
1000 FC 0.12690 0.12680 0.12690 0.12680 0.126601250 SA 0.12680 0.12670 0.12700 0.12700 0.127001600 SA 0.12710 0.12690 0.12710 0.12700 0.127102000 SA 0.12690 0.12720 0.12720 0.12720 0.127102500 SA 0.12730 0.12730 0.12720 0.12720 0.127203150 SA 0.12780 0.12780 0.12790 0.12760 0.127704000 SA 0.12810 0.12840 0.12840 0.12790 0.128005000 SA 0.12930 0.12940 0.12940 0.12910 0.12910
45
Table Lab 5b: Results of CSIR-NML for charge sensitivity of SE accelerometer as afunction of frequency (standard frequencies)
Acceleration amplitude: 100 m/s² from 40 Hz to 3150 Hz,138 m/s² to 799 m/s² from 4000 Hz to 5000 Hz
Frequency Method Charge sensitivity/Hz /pC/(m/s²)
Trial 1 Trial 2 Trial 3 Trial 4 Trial 540 FC 0.12960 0.13050 0.12960 0.12900 0.1293050 FC 0.12890 0.12970 0.12860 0.12840 0.1293063 FC 0.12880 0.12930 0.12920 0.12800 0.1293080 FC 0.12860 0.12940 0.12920 0.12980 0.12900100 FC 0.12900 0.12960 0.12980 0.12970 0.12920125 FC 0.12950 0.12960 0.12960 0.12920 0.13000160 FC 0.12910 0.12890 0.12850 0.12870 0.12840200 FC 0.12890 0.12870 0.12870 0.12880 0.12830250 FC 0.12920 0.12870 0.12890 0.12930 0.12840315 FC 0.12880 0.13000 0.13020 0.12910 0.12830400 FC 0.12940 0.12930 0.12920 0.12900 0.13030500 FC 0.12930 0.12920 0.12930 0.12900 0.12940630 FC 0.12920 0.12930 0.12960 0.12950 0.12940800 FC 0.12940 0.12960 0.12990 0.12940 0.12970
1000 FC 0.12920 0.12950 0.12950 0.12950 0.129701250 SA 0.12960 0.12960 0.12950 0.12970 0.129701600 SA 0.12980 0.12990 0.12990 0.12970 0.129902000 SA 0.13020 0.13080 0.13010 0.13020 0.130302500 SA 0.13070 0.13070 0.13080 0.13090 0.130903150 SA 0.13170 0.13120 0.13190 0.13160 0.132004000 SA 0.13350 0.13280 0.13350 0.13330 0.133305000 SA 0.13660 0.13590 0.13670 0.13670 0.13720

46
Table Lab 5a+: Results of CSIR-NML for charge sensitivity of BB accelerometer,different acceleration amplitudes at 160 Hz
Acceleration Charge sensitivity Rel. uncertaintyamplitude (k=1)
/m/s² /pC/(m/s²) /10-2
4.9 0.1265 0.2510 0.1266 0.2520 0.1266 0.25
49.9 0.1265 0.2599.8 0.1265 0.25
198.6 0.1266 0.25
Table Lab 5b+: Results of CSIR-NML for charge sensitivity of SE accelerometer,different acceleration amplitudes at 160 Hz
Acceleration Charge sensitivity Rel. uncertaintyamplitude (k=1)
/m/s² /pC/(m/s²) /10-2
4.9 0.1289 0.259.8 0.1289 0.25
19.7 0.1289 0.2549.2 0.1292 0.2598.1 0.1291 0.25
195.9 0.1289 0.25

47
Table Lab 6a: Results of CENAM for charge sensitivity of BB accelerometer as afunction of frequency (standard frequencies)
Acceleration amplitude: 10 m/s² to 100 m/s² from 40 Hz to 1000 Hz,50 m/s² to 310 m/s² from 1250 Hz to 5000 Hz
Frequency Method Charge sensitivity/Hz /pC/(m/s²)
Trial 1 Trial 2 Trial 3 Trial 4 Trial 540 FC 0.12639 0.12644 0.12640 0.12639 0.1264350 FC 0.12635 0.12636 0.12635 0.12636 0.1263963 FC 0.12647 0.12647 0.12648 0.12650 0.1265180 FC 0.12647 0.12646 0.12642 0.12647 0.12651100 FC 0.12650 0.12646 0.12630 0.12646 0.12650125 FC 0.12652 0.12644 0.12645 0.12646 0.12644160 FC 0.12656 0.12651 0.12664 0.12665 0.12663200 FC 0.12655 0.12661 0.12663 0.12666 0.12666250 FC 0.12646 0.12640 0.12624 0.12669 0.12676315 FC 0.12655 0.12644 0.12651 0.12649 0.12645400 FC 0.12671 0.12651 0.12655 0.12658 0.12654500 FC 0.12667 0.12646 0.12653 0.12663 0.12657630 FC/FD 0.12660 0.12660 0.12660 0.12662 0.12662800 FC/FD 0.12669 0.12669 0.12661 0.12663 0.12672
1000 FD 0.12671 0.12669 0.12675 0.12672 0.126821250 FD 0.12684 0.12686 0.12669 0.12673 0.126701600 FD 0.12711 0.12690 0.12694 0.12709 0.127082000 FD 0.12719 0.12722 0.12706 0.12730 0.127272500 FD 0.12724 0.12737 0.12729 0.12725 0.127243150 FD 0.12791 0.12793 0.12796 0.12807 0.128024000 FD 0.12786 0.12817 0.12852 0.12842 0.128435000 FD 0.12888 0.12979 0.12913 0.12911 0.12965

48
Table Lab 6b: Results of CENAM for charge sensitivity of SE accelerometer as afunction of frequency (standard frequencies)
Acceleration amplitude: 10 m/s² to 100 m/s² from 40 Hz to 1000 Hz, 50m/s² to 310 m/s² from 1250 Hz to 5000 Hz
Frequency Method Charge sensitivity/Hz /pC/(m/s²)
Trial 1 Trial 2 Trial 3 Trial 4 Trial 540 FC 0.12890 0.12893 0.12897 0.12895 0.1288750 FC 0.12889 0.12887 0.12898 0.12893 0.1290063 FC 0.12897 0.12899 0.12898 0.12899 0.1289680 FC 0.12895 0.12897 0.12895 0.12894 0.12894100 FC 0.12893 0.12894 0.12891 0.12892 0.12892125 FC 0.12889 0.12888 0.12888 0.12888 0.12887160 FC 0.12887 0.12888 0.12886 0.12885 0.12884200 FC 0.12887 0.12888 0.12888 0.12888 0.12889250 FC 0.12882 0.12882 0.12901 0.12900 0.12905315 FC 0.12914 0.12915 0.12895 0.12896 0.12899400 FC 0.12915 0.12913 0.12914 0.12913 0.12897500 FC 0.12917 0.12917 0.12913 0.12914 0.12913630 FC/FD 0.12913 0.12912 0.12909 0.12914 0.12917800 FC/FD 0.12923 0.12925 0.12924 0.12922 0.12923
1000 FD 0.12943 0.12949 0.12937 0.12938 0.129401250 FD 0.12955 0.12945 0.12946 0.12945 0.129411600 FD 0.12972 0.12967 0.12964 0.12967 0.129652000 FD 0.12997 0.12996 0.12993 0.12995 0.129952500 FD 0.13032 0.13031 0.13027 0.13027 0.130223150 FD 0.13032 0.13031 0.13027 0.13027 0.130224000 FD 0.13128 0.13123 0.13111 0.13120 0.131305000 FD 0.13202 0.13206 0.13195 0.13209 0.13203

49
Table Lab 7a: Results of NRC for charge sensitivity of BB accelerometer as a function offrequency (standard frequencies)
Acceleration amplitude: 100 m/s² from 40 Hz to 1600 Hz,75 m/s² to 191 m/s² from 2000 Hz to 5000 Hz
Frequency Method Charge sensitivity/Hz /pC/(m/s²)
Trial 1 Trial 2 Trial 3 Trial 4 Trial 540 FC 0.12649 0.12646 0.12646 0.12648 0.1264450 FC 0.12646 0.12646 0.12646 0.12647 0.1264563 FC 0.12641 0.12641 0.12640 0.12642 0.1264080 FC 0.12697 0.12697 0.12698 0.12697 0.12696100 FC 0.12666 0.12666 0.12665 0.12668 0.12664125 FC 0.12672 0.12672 0.12673 0.12672 0.12669160 FC 0.12675 0.12677 0.12677 0.12674 0.12674200 FC 0.12660 0.12673 0.12672 0.12669 0.12669250 FC 0.12674 0.12672 0.12672 0.12663 0.12664315 FC 0.12652 0.12653 0.12660 0.12659 0.12655400 FC 0.12676 0.12677 0.12675 0.12676 0.12678500 FC 0.12669 0.12676 0.12615 0.12628 0.12662630 FC 0.12658 0.12666 0.12683 0.12668 0.12669800 MP 0.12702 0.12688 0.12678 0.12679 0.12689
1000 MP 0.12695 0.12690 0.12684 0.12692 0.126881250 MP 0.12700 0.12683 0.12692 0.12696 0.127041600 MP 0.12739 0.12704 0.12701 0.12688 0.126822000 MP 0.12724 0.12716 0.12703 0.12720 0.127372500 MP 0.12717 0.12715 0.12709 0.12681 0.127303150 MP 0.12705 0.12724 0.12735 0.12726 0.127714000 MP 0.12833 0.12809 0.12853 0.12851 0.128355000 MP 0.12928 0.12963 0.12903 0.12933 0.12923
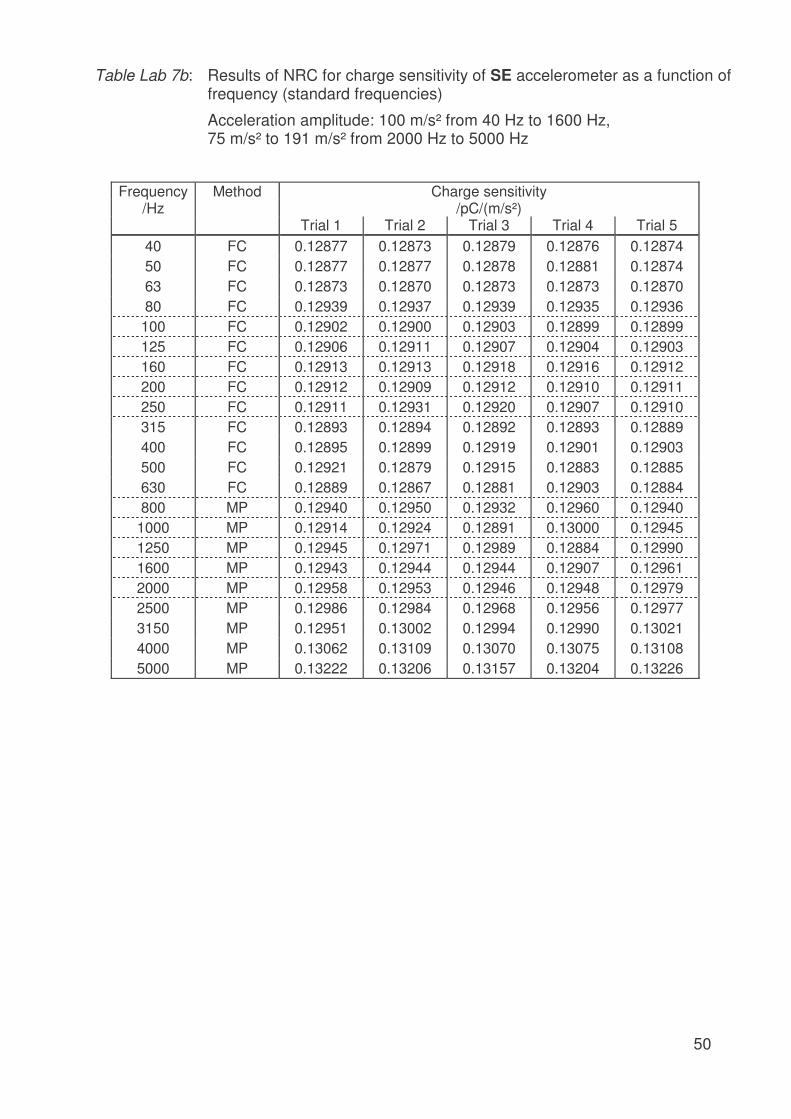
50
Table Lab 7b: Results of NRC for charge sensitivity of SE accelerometer as a function offrequency (standard frequencies)
Acceleration amplitude: 100 m/s² from 40 Hz to 1600 Hz,75 m/s² to 191 m/s² from 2000 Hz to 5000 Hz
Frequency Method Charge sensitivity/Hz /pC/(m/s²)
Trial 1 Trial 2 Trial 3 Trial 4 Trial 540 FC 0.12877 0.12873 0.12879 0.12876 0.1287450 FC 0.12877 0.12877 0.12878 0.12881 0.1287463 FC 0.12873 0.12870 0.12873 0.12873 0.1287080 FC 0.12939 0.12937 0.12939 0.12935 0.12936100 FC 0.12902 0.12900 0.12903 0.12899 0.12899125 FC 0.12906 0.12911 0.12907 0.12904 0.12903160 FC 0.12913 0.12913 0.12918 0.12916 0.12912200 FC 0.12912 0.12909 0.12912 0.12910 0.12911250 FC 0.12911 0.12931 0.12920 0.12907 0.12910315 FC 0.12893 0.12894 0.12892 0.12893 0.12889400 FC 0.12895 0.12899 0.12919 0.12901 0.12903500 FC 0.12921 0.12879 0.12915 0.12883 0.12885630 FC 0.12889 0.12867 0.12881 0.12903 0.12884800 MP 0.12940 0.12950 0.12932 0.12960 0.12940
1000 MP 0.12914 0.12924 0.12891 0.13000 0.129451250 MP 0.12945 0.12971 0.12989 0.12884 0.129901600 MP 0.12943 0.12944 0.12944 0.12907 0.129612000 MP 0.12958 0.12953 0.12946 0.12948 0.129792500 MP 0.12986 0.12984 0.12968 0.12956 0.129773150 MP 0.12951 0.13002 0.12994 0.12990 0.130214000 MP 0.13062 0.13109 0.13070 0.13075 0.131085000 MP 0.13222 0.13206 0.13157 0.13204 0.13226
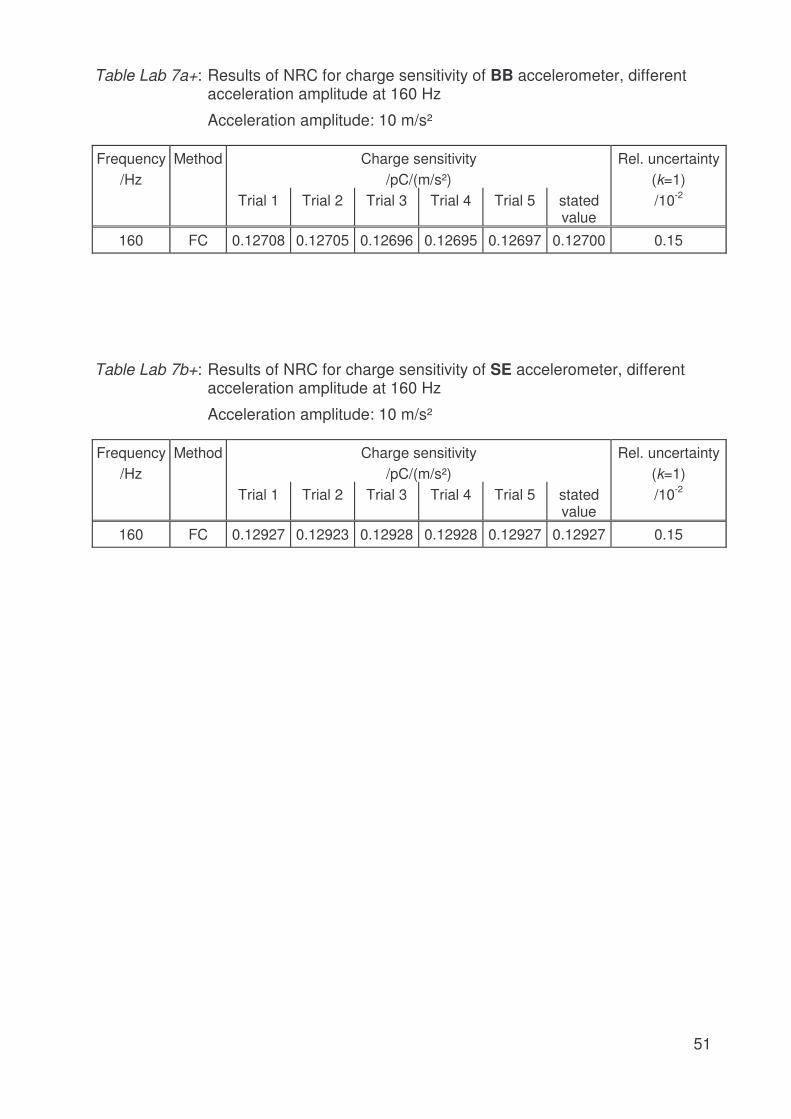
51
Table Lab 7a+: Results of NRC for charge sensitivity of BB accelerometer, differentacceleration amplitude at 160 Hz
Acceleration amplitude: 10 m/s²
Frequency Method Charge sensitivity Rel. uncertainty/Hz /pC/(m/s²) (k=1)
Trial 1 Trial 2 Trial 3 Trial 4 Trial 5 statedvalue
/10-2
160 FC 0.12708 0.12705 0.12696 0.12695 0.12697 0.12700 0.15
Table Lab 7b+: Results of NRC for charge sensitivity of SE accelerometer, differentacceleration amplitude at 160 Hz
Acceleration amplitude: 10 m/s²
Frequency Method Charge sensitivity Rel. uncertainty/Hz /pC/(m/s²) (k=1)
Trial 1 Trial 2 Trial 3 Trial 4 Trial 5 statedvalue
/10-2
160 FC 0.12927 0.12923 0.12928 0.12928 0.12927 0.12927 0.15
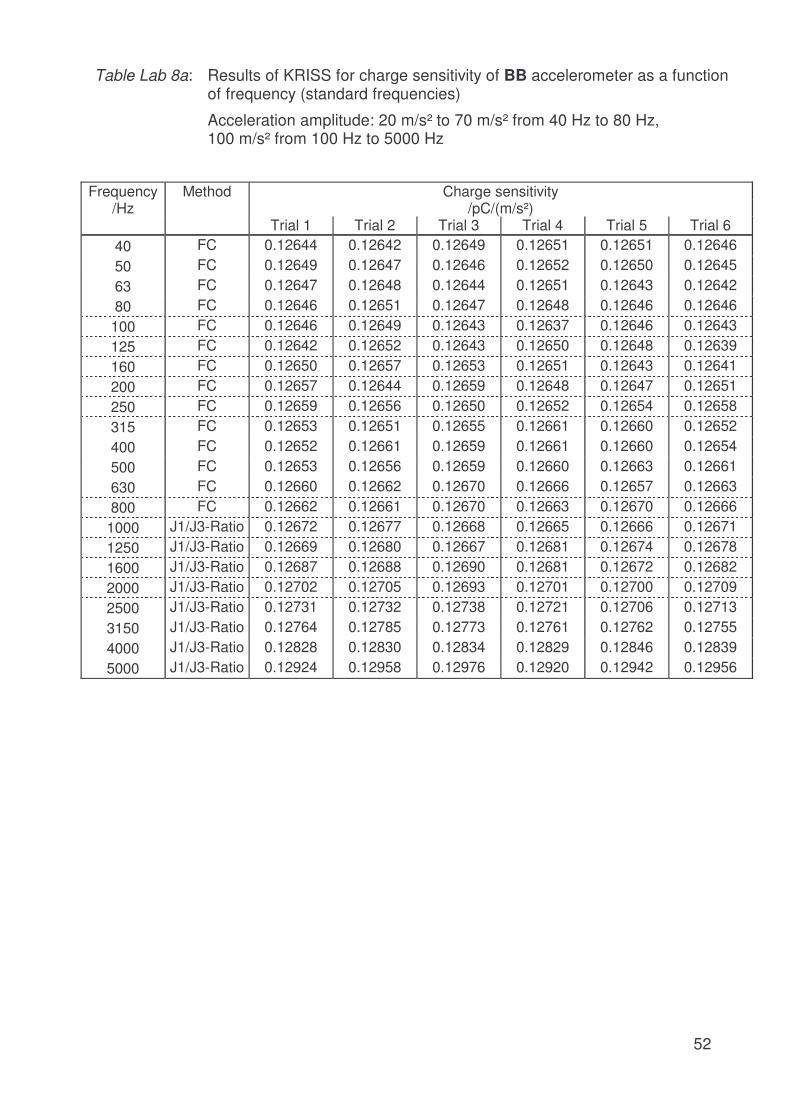
52
Table Lab 8a: Results of KRISS for charge sensitivity of BB accelerometer as a functionof frequency (standard frequencies)
Acceleration amplitude: 20 m/s² to 70 m/s² from 40 Hz to 80 Hz,100 m/s² from 100 Hz to 5000 Hz
Frequency Method Charge sensitivity/Hz /pC/(m/s²)
Trial 1 Trial 2 Trial 3 Trial 4 Trial 5 Trial 640 FC 0.12644 0.12642 0.12649 0.12651 0.12651 0.1264650 FC 0.12649 0.12647 0.12646 0.12652 0.12650 0.1264563 FC 0.12647 0.12648 0.12644 0.12651 0.12643 0.1264280 FC 0.12646 0.12651 0.12647 0.12648 0.12646 0.12646100 FC 0.12646 0.12649 0.12643 0.12637 0.12646 0.12643125 FC 0.12642 0.12652 0.12643 0.12650 0.12648 0.12639160 FC 0.12650 0.12657 0.12653 0.12651 0.12643 0.12641200 FC 0.12657 0.12644 0.12659 0.12648 0.12647 0.12651250 FC 0.12659 0.12656 0.12650 0.12652 0.12654 0.12658315 FC 0.12653 0.12651 0.12655 0.12661 0.12660 0.12652400 FC 0.12652 0.12661 0.12659 0.12661 0.12660 0.12654500 FC 0.12653 0.12656 0.12659 0.12660 0.12663 0.12661630 FC 0.12660 0.12662 0.12670 0.12666 0.12657 0.12663800 FC 0.12662 0.12661 0.12670 0.12663 0.12670 0.12666
1000 J1/J3-Ratio 0.12672 0.12677 0.12668 0.12665 0.12666 0.126711250 J1/J3-Ratio 0.12669 0.12680 0.12667 0.12681 0.12674 0.126781600 J1/J3-Ratio 0.12687 0.12688 0.12690 0.12681 0.12672 0.126822000 J1/J3-Ratio 0.12702 0.12705 0.12693 0.12701 0.12700 0.127092500 J1/J3-Ratio 0.12731 0.12732 0.12738 0.12721 0.12706 0.127133150 J1/J3-Ratio 0.12764 0.12785 0.12773 0.12761 0.12762 0.127554000 J1/J3-Ratio 0.12828 0.12830 0.12834 0.12829 0.12846 0.128395000 J1/J3-Ratio 0.12924 0.12958 0.12976 0.12920 0.12942 0.12956

53
Table Lab 8b: Results of KRISS for charge sensitivity of SE accelerometer as a functionof frequency (standard frequencies)
Acceleration amplitude: 20 m/s² to 70 m/s² from 40 Hz to 80 Hz,100 m/s² from 100 Hz to 5000 Hz
Frequency Method Charge sensitivity/Hz /pC/(m/s²)
Trial 1 Trial 2 Trial 340 FC 0.12883 0.12865 0.1286850 FC 0.12881 0.12867 0.1287163 FC 0.12873 0.12870 0.1287580 FC 0.12876 0.12872 0.12872100 FC 0.12873 0.12875 0.12876125 FC 0.12874 0.12881 0.12877160 FC 0.12867 0.12886 0.12888200 FC 0.12894 0.12877 0.12874250 FC 0.12897 0.12872 0.12878315 FC 0.12889 0.12898 0.12866400 FC 0.12873 0.12897 0.12894500 FC 0.12902 0.12883 0.12890630 FC 0.12913 0.12886 0.12886800 FC 0.12901 0.12903 0.12895
1000 J1/J3-Ratio 0.12923 0.12895 0.128951250 J1/J3-Ratio 0.12921 0.12918 0.128951600 J1/J3-Ratio 0.12936 0.12925 0.129162000 J1/J3-Ratio 0.12964 0.12940 0.129402500 J1/J3-Ratio 0.12979 0.12969 0.129563150 J1/J3-Ratio 0.13027 0.13026 0.129894000 J1/J3-Ratio 0.13069 0.13108 0.130625000 J1/J3-Ratio 0.13194 0.13199 0.13164

54
Table Lab 8a+: Results of KRISS for charge sensitivity of BB accelerometer, differentacceleration amplitude at 160 Hz
Acceleration amplitude: 10 m/s²
Frequency Method Charge sensitivity Rel. uncertainty/Hz /pC/(m/s²) (k=1)
Trial 1 Trial 2 Trial 3 Trial 4 Trial 5 Trial 6 statedvalue
/10-2
160 FC 0.12662 0.12659 0.12645 0.12655 0.12634 0.12642 0.12650 0.18
Table Lab 8b+: Results of KRISS for charge sensitivity of SE accelerometer, differentacceleration amplitude at 160 Hz
Acceleration amplitude: 10 m/s²
Frequency Method Charge sensitivity Rel. uncertainty/Hz /pC/(m/s²) (k=1)
Trial 1 Trial 2 Trial 3 stated value /10-2
160 FC 0.12868 0.12885 0.12889 0.12881 0.18

55
Table Lab 9a: Results of NMIJ for charge sensitivity of BB accelerometer as a functionof frequency (standard frequencies)
Acceleration amplitude: 10 m/s² from 40 Hz to 800 Hz, 100 m/s² from1000 Hz to 4000 Hz and 130 m/s² for 5000 Hz
Frequency Method Charge sensitivity/Hz /pC/(m/s²)
Trial 1 Trial 2 Trial 3 Trial 440 FC 0.12637 0.12625 0.12621 0.1263350 FC 0.12658 0.12647 0.12643 0.1264963 FC 0.12654 0.12653 0.12652 0.1265980 FC 0.12662 0.12654 0.12654 0.12656
100 SA 0.12666 0.12650 0.12641 0.12674125 SA 0.12656 0.12649 0.12658 0.12663160 SA 0.12659 0.12663 0.12656 0.12663200 SA 0.12658 0.12666 0.12645 0.12658250 SA 0.12665 0.12661 0.12634 0.12653315 SA 0.12646 0.12635 0.12650 0.12651400 SA 0.12665 0.12646 0.12673 0.12685500 SA 0.12657 0.12643 0.12657 0.12662630 SA 0.12660 0.12647 0.12637 0.12682800 SA 0.12670 0.12640 0.12645 0.126891000 SA 0.12663 0.12666 0.12681 0.126801250 SA 0.12678 0.12676 0.12691 0.126851600 SA 0.12678 0.12689 0.12695 0.126822000 SA 0.12685 0.12712 0.12711 0.126982500 SA 0.12713 0.12698 0.12747 0.127303150 SA 0.12774 0.12751 0.12787 0.128034000 SA 0.12857 0.12805 0.12860 0.128575000 SA 0.12902 0.12912 0.12947 0.12964

56
Table Lab 9b: Results of NMIJ for charge sensitivity of SE accelerometer as a functionof frequency (standard frequencies)
Acceleration amplitude: 10 m/s² from 40 Hz to 800 Hz, 100 m/s² from1000 Hz to 4000 Hz and 130 m/s² for 5000 Hz
Frequency Method Charge sensitivity/Hz /pC/(m/s²)
Trial 1 Trial 2 Trial 3 Trial 440 FC 0.12867 0.12850 0.12844 0.1285050 FC 0.12869 0.12868 0.12860 0.1286663 FC 0.12880 0.12878 0.12871 0.1287780 FC 0.12888 0.12881 0.12871 0.12872
100 SA 0.12873 0.12877 0.12866 0.12870125 SA 0.12876 0.12885 0.12874 0.12874160 SA 0.12877 0.12889 0.12867 0.12878200 SA 0.12885 0.12878 0.12883 0.12869250 SA 0.12887 0.12886 0.12877 0.12878315 SA 0.12893 0.12882 0.12891 0.12856400 SA 0.12861 0.12887 0.12903 0.12883500 SA 0.12880 0.12883 0.12887 0.12921630 SA 0.12888 0.12946 0.12859 0.12825800 SA 0.12914 0.12882 0.12855 0.129101000 SA 0.12955 0.12951 0.12951 0.129621250 SA 0.12962 0.12971 0.12972 0.129811600 SA 0.13024 0.13016 0.13034 0.130132000 SA 0.13081 0.13092 0.13094 0.131352500 SA 0.13208 0.13197 0.13169 0.132043150 SA 0.13324 0.13344 0.13324 0.133714000 SA 0.13659 0.13662 0.13616 0.136735000 SA 0.14098 0.14110 0.14077 0.14322

57
Table Lab 9a+: Results of NMIJ for charge sensitivity of BB accelerometer, differentacceleration amplitude at 160 Hz
Acceleration amplitude: 100 m/s²
Frequency Method Charge sensitivity Rel. uncertainty/Hz /pC/(m/s²) (k=1)
Trial 1 Trial 2 Trial 3 Trial 4 statedvalue
/10-2
160 SA 0.12661 0.12664 0.12657 0.12660 0.12661 0.12
Table Lab 9b+: Results of NMIJ for charge sensitivity of SE accelerometer, differentacceleration amplitude at 160 Hz
Acceleration amplitude: 100 m/s²
Frequency Method Charge sensitivity Rel. uncertainty/Hz /pC/(m/s²) (k=1)
Trial 1 Trial 2 Trial 3 Trial 4 statedvalue
/10-2
160 FC 0.12904 0.12906 0.12900 0.12902 0.12903 0.12

58
Table Lab 10a: Results of VNIIM for charge sensitivity of BB accelerometer as a functionof frequency (standard frequencies)
Acceleration amplitude: not specified
Frequency Method Charge sensitivity/Hz /pC/(m/s²)
Trial 1 Trial 2 Trial 3 Trial 4 Trial 540 FC 0.12600 0.12600 0.12610 0.12600 0.1261050 FC 0.12610 0.12620 0.12610 0.12620 0.1262063 FC 0.12610 0.12620 0.12610 0.12610 0.1260080 FC 0.12620 0.12610 0.12610 0.12610 0.12610100 FC 0.12610 0.12620 0.12610 0.12610 0.12600125 FC 0.12630 0.12640 0.12650 0.12650 0.12660160 FC 0.12670 0.12670 0.12680 0.12690 0.12700200 FC 0.12680 0.12680 0.12690 0.12690 0.12690250 FC 0.12660 0.12670 0.12670 0.12670 0.12680315 FC 0.12670 0.12680 0.12680 0.12680 0.12690400 FC 0.12680 0.12680 0.12680 0.12680 0.12680500 FC 0.12690 0.12680 0.12690 0.12700 0.12710630 FC 0.12700 0.12700 0.12690 0.12690 0.12690800 FC 0.12710 0.12690 0.12710 0.12710 0.12720
1000 FC 0.12750 0.12760 0.12730 0.12730 0.127501250 FC 0.12820 0.12800 0.12740 0.12740 0.127601600 FC/Modulation 0.12860 0.12850 0.12820 0.12830 0.128402000 FC/Modulation 0.12900 0.12890 0.12890 0.12880 0.128902500 FC/Modulation 0.12920 0.12930 0.12920 0.12910 0.129303150 FC/Modulation 0.12920 0.12920 0.12920 0.12920 0.129204000 FC/Modulation 0.12900 0.12920 0.12900 0.12880 0.128905000 FC/Modulation 0.13020 0.13130 0.13050 0.13080 0.13090
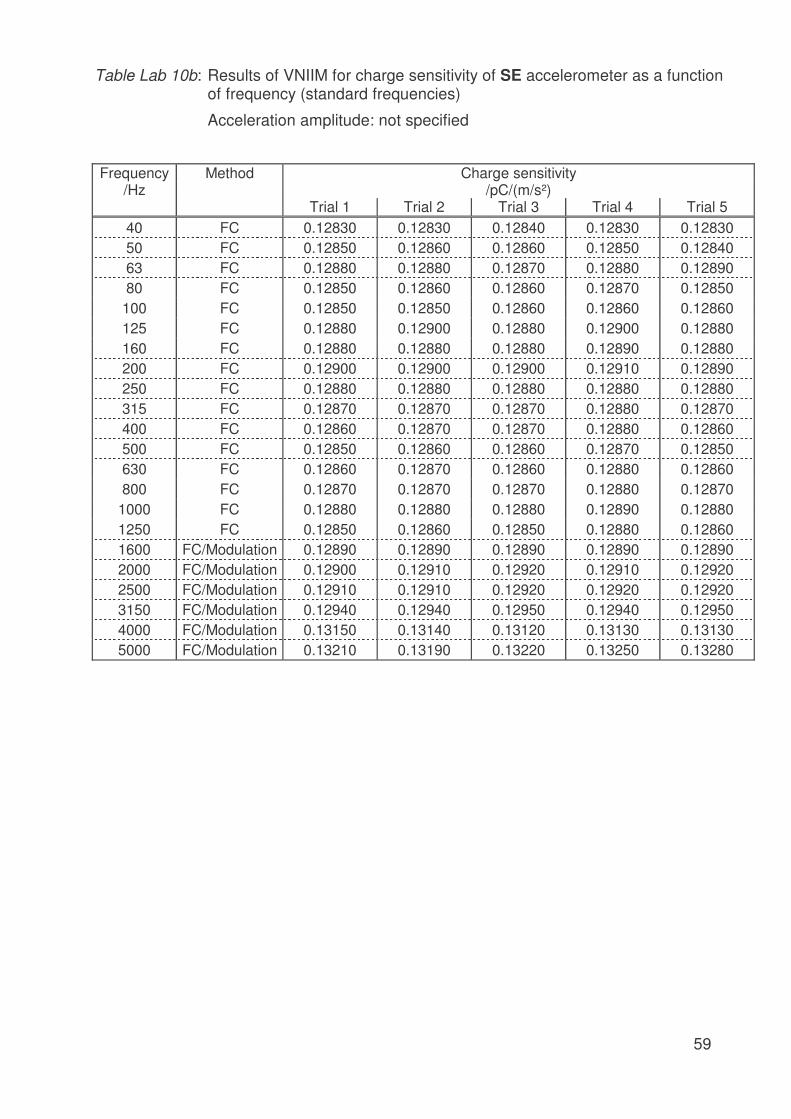
59
Table Lab 10b: Results of VNIIM for charge sensitivity of SE accelerometer as a functionof frequency (standard frequencies)
Acceleration amplitude: not specified
Frequency Method Charge sensitivity/Hz /pC/(m/s²)
Trial 1 Trial 2 Trial 3 Trial 4 Trial 540 FC 0.12830 0.12830 0.12840 0.12830 0.1283050 FC 0.12850 0.12860 0.12860 0.12850 0.1284063 FC 0.12880 0.12880 0.12870 0.12880 0.1289080 FC 0.12850 0.12860 0.12860 0.12870 0.12850100 FC 0.12850 0.12850 0.12860 0.12860 0.12860125 FC 0.12880 0.12900 0.12880 0.12900 0.12880160 FC 0.12880 0.12880 0.12880 0.12890 0.12880200 FC 0.12900 0.12900 0.12900 0.12910 0.12890250 FC 0.12880 0.12880 0.12880 0.12880 0.12880315 FC 0.12870 0.12870 0.12870 0.12880 0.12870400 FC 0.12860 0.12870 0.12870 0.12880 0.12860500 FC 0.12850 0.12860 0.12860 0.12870 0.12850630 FC 0.12860 0.12870 0.12860 0.12880 0.12860800 FC 0.12870 0.12870 0.12870 0.12880 0.12870
1000 FC 0.12880 0.12880 0.12880 0.12890 0.128801250 FC 0.12850 0.12860 0.12850 0.12880 0.128601600 FC/Modulation 0.12890 0.12890 0.12890 0.12890 0.128902000 FC/Modulation 0.12900 0.12910 0.12920 0.12910 0.129202500 FC/Modulation 0.12910 0.12910 0.12920 0.12920 0.129203150 FC/Modulation 0.12940 0.12940 0.12950 0.12940 0.129504000 FC/Modulation 0.13150 0.13140 0.13120 0.13130 0.131305000 FC/Modulation 0.13210 0.13190 0.13220 0.13250 0.13280

60
Table Lab 11a: Results of NIST for charge sensitivity of BB accelerometer as a function offrequency (standard frequencies)
Acceleration amplitude: not specified
Frequency Method Charge sensitivity/Hz /pC/(m/s²)
Trial 1 Trial 2 Trial 3 Trial 4 Trial 540 FC 0.12690 0.12680 0.12670 0.12670 0.1266050 FC 0.12670 0.12660 0.12650 0.12660 0.1265063 FC 0.12650 0.12650 0.12670 0.12670 0.1267080 FC 0.12660 0.12680 0.12650 0.12640 0.12640100 FC 0.12680 0.12680 0.12670 0.12670 0.12670125 FC 0.12650 0.12620 0.12630 0.12640 0.12650160 FC 0.12650 0.12650 0.12650 0.12650 0.12650200 FC 0.12650 0.12650 0.12650 0.12660 0.12660250 FC 0.12650 0.12660 0.12660 0.12660 0.12660315 FC 0.12670 0.12660 0.12650 0.12660 0.12660400 FC 0.12680 0.12650 0.12660 0.12640 0.12650500 FC 0.12670 0.12650 0.12630 0.12630 0.12620630 FC 0.12650 0.12630 0.12630 0.12620 0.12630800 FC 0.12670 0.12640 0.12610 0.12650 0.12630
1000 MP 0.12650 0.12630 0.12640 0.12650 0.126401250 MP 0.12660 0.12640 0.12640 0.12660 0.126501600 MP 0.12670 0.12650 0.12640 0.12670 0.126602000 MP 0.12670 0.12640 0.12650 0.12680 0.127002500 MP 0.12680 0.12630 0.12640 0.12710 0.127103150 FD 0.12830 0.12810 0.12730 0.12820 0.128504000 FD 0.12900 0.12860 0.12810 0.12850 0.128705000 FD 0.12990 0.12920 0.12880 0.12910 0.12910

61
Table Lab 11b: Results of NIST for charge sensitivity of SE accelerometer as a function offrequency (standard frequencies)
Acceleration amplitude: not specified
Frequency Method Charge sensitivity/Hz /pC/(m/s²)
Trial 1 Trial 2 Trial 3 Trial 4 Trial 540 FC 0.12960 0.12950 0.12960 0.12950 0.1295050 FC 0.12930 0.12950 0.12940 0.12930 0.1292063 FC 0.12900 0.12920 0.12910 0.12900 0.1290080 FC 0.12920 0.12910 0.12900 0.12890 0.12900100 FC 0.12910 0.12900 0.12930 0.12900 0.12910125 FC 0.12930 0.12900 0.12910 0.12900 0.12890160 FC 0.12930 0.12910 0.12900 0.12910 0.12900200 FC 0.12930 0.12910 0.12910 0.12900 0.12910250 FC 0.12930 0.12910 0.12910 0.12900 0.12900315 FC 0.12940 0.12910 0.12910 0.12900 0.12900400 FC 0.12940 0.12920 0.12920 0.12920 0.12910500 FC 0.12920 0.12910 0.12920 0.12910 0.12920630 FC 0.12930 0.12920 0.12920 0.12920 0.12910800 FC 0.12950 0.12960 0.12950 0.12950 0.12940
1000 MP 0.12940 0.12980 0.12970 0.12930 0.129301250 MP 0.12950 0.12960 0.12960 0.12930 0.129401600 MP 0.12950 0.12950 0.12970 0.12950 0.129702000 MP 0.12970 0.12980 0.12990 0.12980 0.129602500 MP 0.13050 0.13060 0.13060 0.13070 0.130203150 FD 0.13160 0.13160 0.13160 0.13140 0.131404000 FD 0.13210 0.13220 0.13240 0.13220 0.132405000 FD 0.13350 0.13350 0.13350 0.13350 0.13360

62
Table Lab 12a: Results of NMi - VSL for charge sensitivity of BB accelerometer as afunction of frequency (standard frequencies)
Acceleration amplitude 10 m/s² to 135 m/s² from 40 Hz to 5000 Hz
Frequency Method Charge sensitivity/Hz /pC/(m/s²)
Trial 1 Trial 2 Trial 3 Trial 4 Trial 540 FC 0.12660 0.12647 0.12640 0.12663 0.1264350 FC 0.12653 0.12650 0.12647 0.12660 0.1265063 FC 0.12643 0.12640 0.12640 0.12640 0.1263380 FC 0.12650 0.12640 0.12643 0.12643 0.12640100 FC 0.12650 0.12643 0.12647 0.12647 0.12643125 FC 0.12647 0.12650 0.12643 0.12643 0.12640160 FC 0,12657 0,12653 0,12650 0,12647 0,12643200 FC 0.12653 0.12653 0.12650 0.12650 0.12650250 FC 0.12663 0.12660 0.12650 0.12660 0.12653315 FC 0.12690 0.12670 0.12660 0.12670 0.12667400 FC 0.12617 0.12650 0.12650 0.12660 0.12670500 FC 0.12647 0.12653 0.12660 0.12673 0.12673630 FC 0.12693 0.12700 0.12700 0.12723 0.12720800 FC 0.12707 0.12687 0.12710 0.12747 0.12750
1000 FC/MP 0.12683 0.12713 0.12750 0.12800 0.128001250 MP 0.12670 No Data No Data No Data No Data1600 MP 0.12680 No Data No Data No Data No Data2000 MP 0.12693 No Data No Data No Data No Data2500 MP 0.12707 No Data No Data No Data No Data3150 MP 0.12757 No Data No Data No Data No Data4000 MP 0.12827 No Data No Data No Data No Data5000 MP 0.12927 No Data No Data No Data No Data

63
Table Lab 12b: Results of NMi - VSL for charge sensitivity of SE accelerometer as afunction of frequency (standard frequencies)
Acceleration amplitude 10 m/s² to 135 m/s² from 40 Hz to 5000 Hz
Frequency Method Charge sensitivity/Hz /pC/(m/s²)
Trial 1 Trial 2 Trial 3 Trial 4 Trial 540 FC 0.12893 0.12877 0.12970 0.12863 0.1288350 FC 0.12903 0.12880 0.12957 0.12873 0.1288063 FC 0.12877 0.12873 0.12907 0.12870 0.1287780 FC 0.12880 0.12877 0.12897 0.12873 0.12880100 FC 0.12880 0.12880 0.12887 0.12877 0.12877125 FC 0.12883 0.12883 0.12887 0.12877 0.12880160 FC 0.12890 0.12890 0.12883 0.12883 0.12887200 FC 0.12890 0.12890 0.12887 0.12883 0.12887250 FC 0.12880 0.12900 0.12893 0.12893 0.12893315 FC 0.12900 0.12910 0.12910 0.12893 0.12893400 FC 0.12927 0.12880 0.12903 0.12903 0.12930500 FC 0.12923 0.12927 0.12920 0.12937 0.12940630 FC 0.12933 0.12947 0.12937 0.12957 0.12960800 FC 0.12957 0.12973 0.12963 0.12997 0.13010
1000 FC/MP 0.12987 0.13000 0.12980 0.13023 0.130501250 MP 0.12957 No Data No Data No Data No Data1600 MP 0.12990 No Data No Data No Data No Data2000 MP 0.13040 No Data No Data No Data No Data2500 MP 0.13117 No Data No Data No Data No Data3150 MP 0.13247 No Data No Data No Data No Data4000 MP 0.13473 No Data No Data No Data No Data5000 MP 0.13813 No Data No Data No Data No Data

64
Table Lab 12a+: Results of NMi - VSL for charge sensitivity of BB accelerometer,different acceleration amplitude at 160 Hz, different method at 1000 Hz
Frequency: 160 Hz
Acceleration amplitude Charge sensitivity Rel. uncertainty (k=1)/m/s² /pC/(m/s²) /10-2
10 0.12668 0.13100 0.12651 0.11
Frequency: 1000 Hz
Method Charge sensitivity Rel. uncertainty (k=1)/pC/(m/s²) /10-2
FC 0.12748 0.42MP 0.12662 0.33
Table Lab 12b+: Results of NMi - VSL for charge sensitivity of SE accelerometer,different acceleration amplitude at 160 Hz, different method at 1000 Hz
Frequency: 160 Hz
Acceleration amplitude Charge sensitivity Rel. uncertainty (k=1)/m/s² /pC/(m/s²) /10-2
10 0.12903 0.14100 0.12886 0.10
Frequency: 1000 Hz
Method Charge sensitivity Rel. uncertainty (k=1)/pC/(m/s²) /10-2
FC 0.13009 0.25MP 0.12936 0.76

65
10 Discussion of the measurement results
As mentioned in section 1, an appropriate method to compute KCRVs and degrees ofequivalence is to be proposed in the Appendix to the Draft B report. To facilitate thechoice of the method, some significant aspects will be indicated and discussed in thissection.
Though all 12 participants applied laser interferometry in accordance with ISO 16063-11as required [ 4 ], this international standard also specifies that three differentinterferometric methods (cf. section 9.3) are applicable in various versions (e.g. homodyneor heterodyne interferometry) and techniques. The primary calibration systems (nationalstandards) applied to CCAUV.V-K1 were largely different with respect to vibration exciters,laser interferometers, vibration isolation systems, hardware and signal processingconfigurations and measurement procedures. This explains the following observations.
Ratio between smallest and largest declared uncertainty:
• The uncertainties declared by different laboratories for the same frequency and for thesame accelerometer largely differed from one another; ratio 4 to ratio 19.
Frequency dependence of uncertainty:
• The declared uncertainties were frequency-dependent; the ratio of the highest (at5 kHz) to lowest value (at 160 Hz or lower) in the same laboratory was between 2 and20.
Ratio between smallest and second smallest uncertainty:
• Under equal conditions (i.e. frequencies), the ratio of the smallest uncertainty (declaredby pilot laboratory PTB) to the second smallest uncertainty (declared by any NMI) wasbetween 1:1.5 and 1:3.
Acceleration measurement capability:
• A comparison of the acceleration measurements (main task, cf. clause 3) is describedby the calibration results for the back-to-back (BB) accelerometers as the motion wassensed at the reflecting top surface which was the reference surface. All laboratories(except for Lab. 10 at high frequencies >1 kHz) in this case demonstrated very goodmeasurement capabilities (i.e. the relative deviations from the reference value wereclearly below 1×10⁻² and mostly below 5×10⁻³).
Accelerometer calibration capability:
• The above results which also stand for the measurement capabilities for the (charge)sensitivity of accelerometers, would reflect the calibration capabilities for single-endedaccelerometers only if there was no relative motion between the laser light spotsensing the motion close to the accelerometer and its reference surface (i.e. mountingsurface at the bottom of the accelerometer). As commercial vibrators usually do nothave a reflecting mounting surface, most of the NMIs used special adapters (i.e. anoptically reflecting disc). When calibrating the single-ended accelerometer (SE), 3laboratories measured far too high sensitivity values in the kHz range, which might bedue to mechanical resonance effects of the moving part of the exciter or any adapterused.

66
Credibility of uncertainty statements:
• ISO Standard 16063-11:1999 [ 4 ] provides well-established uncertainty budgets whichwere included as a formal part in the Technical Protocol. Accordingly, all 12laboratories submitted uncertainty budgets in compliance with the GUM.
• The credibility of the lowest uncertainty values (expanded uncertainty of 0.1% specifiedby the PTB between 40 Hz and to 2 kHz, 0.2% at higher frequencies) is demonstratedby the three versions of measurement series PTB 1 (January 2000), PTB 2 (June2001) and PTB (alternative methods); cf. Tables S1a, S1b and Figures S1a, S1b. ThePTB has also confirmed its uncertainty statements in all four previous comparisonsreported in [ 5 ]. The calibration capabilities of the PTB for SE accelerometers are thesame as for BB accelerometers because the acceleration exciters applied havespecifically designed, air-borne moving parts ensuring rigid body motion at least up to5 kHz. These moving parts have an optically reflecting mounting surface, so noadapter need be used.
Some larger systematic (resonance-like) deviations occurring in some laboratories werereflected by relatively moderate declared uncertainties, though in some cases even suchconservative estimations turned out to be too optimistic.
Taking the above observations into account, a comparison between five different methods(weighted mean, model-based fit, arithmetic mean, median and maximum likelihoodestimator) leads to a method considered by all participants most appropriate for theparticular comparison to compute the key comparison reference value(s) and the degreesof equivalence (see Appendix A).
11 Conclusions12 NMIs measured the charge sensitivity of two different transfer standards (single-endedaccelerometer and back-to-back accelerometer (briefly referred to as SE and BB) at22 frequencies from 40 Hz to 5 kHz (third-octave frequency series). The results of theCCAUV.V-K1 are a set of KCRVs, their uncertainties and degrees of equivalenceregarding the KCRV and regarding all laboratories with respect to one another. Using themethod for computing the KCRVs proposed by the pilot laboratory and agreed to by allparticipants (cf. Appendix A), 44 matrices of equivalence were computed (22 frequencies,2 accelerometers, cf. Appendix C). From this complete set of results, four matrices ofequivalence were selected and demonstrated by graphs (cf. Annex B) which arerecommended for inclusion in the BIPM key comparison database. The four casesselected are the reference frequency of 160 Hz (BB and SE accelerometer), the lowestfrequency of 40 Hz (BB accelerometer) and the highest frequency of 5 kHz (BBaccelerometer).
The BB accelerometer is given preference because the key comparison mainly aims atcomparing the measurement capabilities for the quantity of acceleration [TechnicalProtocol) [ 3 ]. Only the back-to-back accelerometer converts the acceleration sensed bythe laser interferometer at the reference surface (optically reflecting top surface) into anelectrical charge, both quantities being used for the calculation of the charge sensitivity asa measurand in the key comparison. In the calibration of the SE accelerometer, thereference surface (mounting surface) is not accessible to the laser light beam. Relativemotion between the acceleration acting on and converted by the SE accelerometer andthe acceleration sensed by the laser interferometer (close to the accelerometer) mayhave been present. In each case, the calibration results obtained for the BB and the SE

67
accelerometer represent the current calibration capabilities of the participatinglaboratories for the charge sensitivity of back-to-back accelerometers and single-endedaccelerometers, respectively. However, the calibration results for the BB accelerometerrepresent the measurement capabilities for the physical quantity of acceleration. Thesystematic deviations of SE accelerometer calibrations at high frequencies as identifiedby the key comparison has assisted the laboratories concerned in investigating andimproving their calibration facilities.
At the reference frequency of 160 Hz (specified in ISO 16063-11:1999), all participatinglaboratories calibrated both transfer standards with a relative expanded uncertainty (k = 2)smaller than 5×10⁻³, i.e. the limit specified by the ISO standard [ 2 ], cf. also TechnicalProtocol [ 3 ].
To disseminate the KCRVs to the regional metrology organizations (RMOs), robustreference values are available for APMP (3 participating NMIs), EUROMET (4 NMIs) andSIM (3 NMIs). Special efforts are to be made by COOMET (1 NMI) and SADCMET (1NMI). All 5 RMOs will profit from the key comparison reference values and degrees ofequivalence established with low uncertainties. The regional key comparisonEUROMET.AUV.V-K1 is already in preparation (the circulation period is planned to start inJuly 2003).
AcknowledgementThe authors wish to thank N. Clark from CSIRO, Dr. Smirnov from VNIIM, and Dr. V.Nedzelnitzky, D. J. Evans and B. Payne from NIST for their contributions to the TechnicalProtocol. Valuable discussions with the experts from NIST including also Dr. A. L. Rukhin,Dr. N. Sedransk, S. D. Leigh and Dr. S. E. Fick, on the different methods considered bythe pilot laboratory as candidates for computing the key comparison reference value(KCRV) under the special conditions of CCAUV.V-K1 are also gratefully acknowledged. Athorough statistical analysis of, and valuable comments on, the results presented in theDraft A report were received not only from NIST but also from CENAM; so we wish tothank Dr. J. S. Echeverria and Dr. G. Silva de Pineda.It was possible to recommend an appropriate method for the KCRV in the Draft B reportalso thanks to the valuable discussions which had taken place during the 2nd Meeting ofthe Consultative Committee CCAUV held at the BIPM in October 2001. The project leaderwishes to thank the Executive Secretary of the CCAUV, Dr. P. Allisy-Roberts, in particularfor her advice and guidance in the preparation of and in proceeding with the keycomparison, and to Dr. Claudine Thomas, BIPM, for her advice in how to present thetables and graphs.The project leader would also like to take this opportunity to thank his colleagues for theirefforts in preparing the Draft B report.

68
Bibliography
[ 1 ] Report on Key comparison CCAUV.V-K1, Draft A. PTB, H.-J. von Martens et al.,15 December 2001
[ 2 ] Guidelines for CIPM key comparisons (Appendix F to the "Mutual recognition ofnational measurements standards and of measurement certificates issued bynational metrology institutes" (MRA)). March 1, 1999
[ 3 ] Technical Protocol of the Key comparison CCAUV.V-K1 (Vibration). PTB,H.-J. von Martens, 15 December 1999
[ 4 ] ISO 16063-11:1999 "Methods for the calibration of vibration and shock transducers- Part 11: Primary vibration calibration by laser interferometry"
[ 5 ] H.-J. von Martens: Current state and trends of ensuring traceability for vibrationmeasurements. Metrologia 36 (1999) 357-373
[ 6 ] H.-J. von Martens: Interferometric counting methods for measuring displacements inthe range 10-9 to 1 m. Metrologia 24 (1987) 163-170
[ 7 ] C. Thomas: Presentation of Results of Key and supplementary comparisons inEXCEL files built according to a unified template. BIPM, 27 April 2000
[ 8 ] C. Elster, A. Link and H.-J. von Martens: Model-based analysis of key comparisonsapplied to accelerometer calibrations. Meas. Sci. Technol. 12 (2001), 1672-1677
[ 9 ] C. Elster and A. Link: Analysis of key comparison data: assessment of currentmethods for determining a reference value. Meas. Sci. Technol. 12 (2001),1431-1438
[ 10 ] H.-J. von Martens, A. Link and C. Elster: Preliminary analysis of CCAUV.V-K1 keycomparison data. Doc. CCAUV/01-04, BIPM 2001
[ 11 ] K. Weise, W. Wöger (2000). Removing model and data non-conformity inmeasurement evaluation. Meas. Sci. Technol. 11 (2000), 1649-1658

69
Appendix A:Key comparison reference value
A.1 Analysis of 5 different methods to compute KCRVs and degrees of equivalence
At the 2nd CCAUV Meeting, the project leader presented and explained the analysis Doc.CCAUV/01-04 [ 10 ], which led to the recommendation to use the “weighted meanmethod“ to treat the calibration results obtained within CCAUV.V-K1. Five differentmethods were compared which make use of
• weighted mean• model-based fit• (arithmetic) mean• median• maximum likelihood estimator,respectively.
The methods have been described in references [ 8 ] [ 9 ].
In the Draft A report [ 1 ], the tables of [ 10 ] were updated and the reasons why the pilotlaboratory has considered the weighted mean method to be most appropriate for theparticular comparison to calculate the KCRV(s) were stated.
For the Draft B report (cf. Tables and Figures A1a and A1b), in addition to thepresentations of the Draft A report, the weighted mean was computed from the results ofall (11) laboratories except that of the Pilot Laboratory PTB. The (last) column of TablesA1a and A1b shows the deviation of the weighted mean computed without PTB resultsfrom the weighted mean of the results of all (12) laboratories. This demonstrates that thePTB results have little effect (maximum relative deviation of 8×10⁻⁴ for BB accelerometer,6×10-4 for SE accelerometer) on the reference value, despite the relatively great weightingfactor based on the low uncertainty specified by the PTB.
It was also observed that the five methods lead to reference values which show relativedeviations within ±1×10⁻³ for the BB accelerometer at all frequencies and for the SEaccelerometer up to 2.5 kHz. The consistency test presented in Appendix A2 shows thatno reference value should be specified for the SE accelerometer at high frequenciesabove 2 kHz and for the BB accelerometer at 1.6 kHz and 2.0 kHz if in the latter case theresults of Lab. 10 are not excluded.
Based on the results obtained in the consistency test and confirmed by the commentsreceived from NIST (cf. Appendix A3), the project leader decided to base the weightedmean for the BB accelerometer on the results of 11 laboratories (without Lab. 10) atfrequencies higher than 1 kHz. At the frequencies of 4 kHz and 5 kHz, no results werereceived from Lab. 2 for the reason explained on page 38.
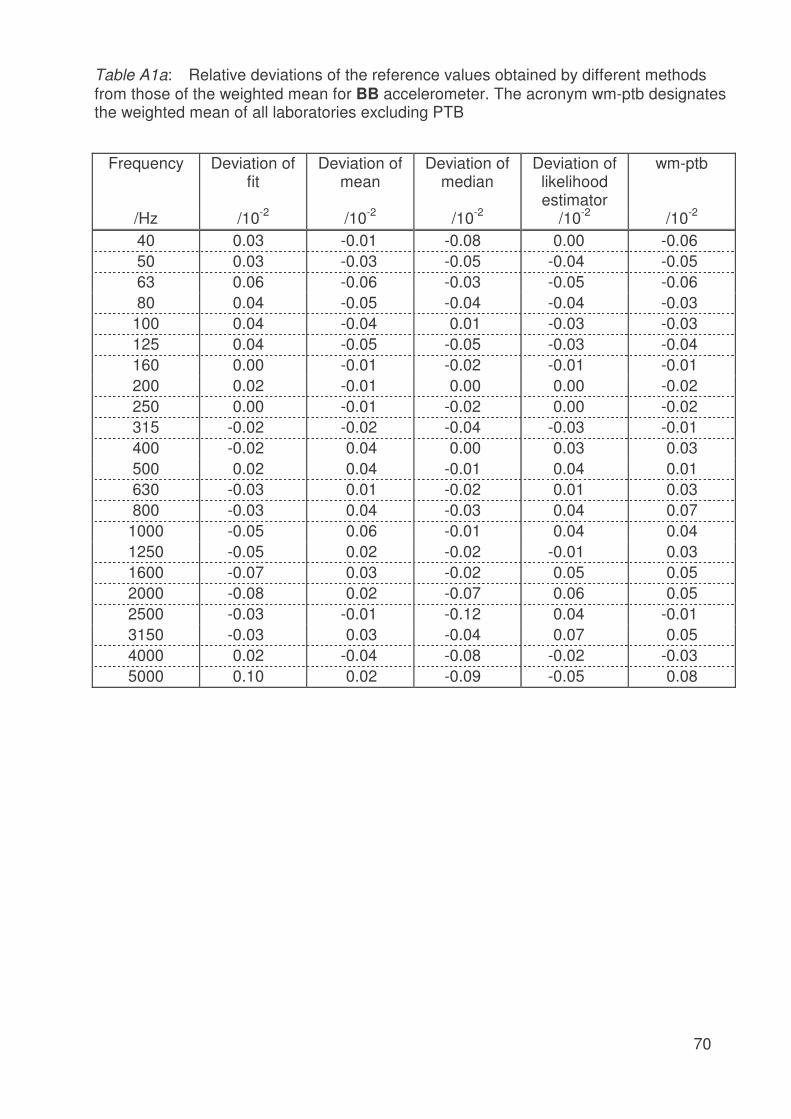
70
Table A1a: Relative deviations of the reference values obtained by different methodsfrom those of the weighted mean for BB accelerometer. The acronym wm-ptb designatesthe weighted mean of all laboratories excluding PTB
Frequency Deviation offit
Deviation ofmean
Deviation ofmedian
Deviation oflikelihoodestimator
wm-ptb
/Hz /10-2 /10-2 /10-2 /10-2 /10-2
40 0.03 -0.01 -0.08 0.00 -0.0650 0.03 -0.03 -0.05 -0.04 -0.0563 0.06 -0.06 -0.03 -0.05 -0.0680 0.04 -0.05 -0.04 -0.04 -0.03
100 0.04 -0.04 0.01 -0.03 -0.03125 0.04 -0.05 -0.05 -0.03 -0.04160 0.00 -0.01 -0.02 -0.01 -0.01200 0.02 -0.01 0.00 0.00 -0.02250 0.00 -0.01 -0.02 0.00 -0.02315 -0.02 -0.02 -0.04 -0.03 -0.01400 -0.02 0.04 0.00 0.03 0.03500 0.02 0.04 -0.01 0.04 0.01630 -0.03 0.01 -0.02 0.01 0.03800 -0.03 0.04 -0.03 0.04 0.07
1000 -0.05 0.06 -0.01 0.04 0.041250 -0.05 0.02 -0.02 -0.01 0.031600 -0.07 0.03 -0.02 0.05 0.052000 -0.08 0.02 -0.07 0.06 0.052500 -0.03 -0.01 -0.12 0.04 -0.013150 -0.03 0.03 -0.04 0.07 0.054000 0.02 -0.04 -0.08 -0.02 -0.035000 0.10 0.02 -0.09 -0.05 0.08

71
Table A1b: Relative deviations of the reference values obtained by different methodsfrom those of the weighted mean for SE accelerometer. The acronym wm-ptbdesignates the weighted mean of all laboratories excluding PTB
Frequency Deviation offit
Deviation ofmean
Deviation ofmedian
Deviation oflikelihoodestimator
wm-ptb
/Hz /10-2 /10-2 /10-2 /10-2 /10-2
40 0.03 -0.03 -0.02 -0.04 -0.0350 0.04 -0.05 -0.02 -0.04 -0.0463 0.05 -0.06 -0.09 -0.05 -0.0680 0.04 -0.02 -0.05 -0.02 -0.03
100 0.05 -0.01 0.00 -0.02 -0.04125 0.04 0.01 -0.01 -0.02 -0.03160 0.04 -0.04 -0.09 -0.03 -0.03200 0.03 -0.03 0.00 -0.02 -0.03250 0.02 -0.03 -0.03 -0.02 -0.02315 0.00 0.00 0.00 -0.02 -0.01400 0.00 0.01 0.01 0.00 0.02500 -0.02 -0.01 0.02 -0.01 0.03630 -0.05 -0.03 0.01 -0.02 -0.01800 -0.04 0.06 0.09 0.07 0.05
1000 -0.04 0.08 0.09 0.08 0.011250 -0.06 0.04 0.09 0.03 0.021600 -0.08 0.02 0.01 0.01 -0.022000 -0.11 0.04 0.01 0.02 -0.012500 -0.11 0.05 -0.01 0.00 0.023150 -0.06 0.14 0.03 0.04 0.064000 0.04 0.45 -0.04 0.27 0.055000 0.15 0.77 0.02 0.46 -0.03

72
-0.3
-0.2
-0.1
0
0.1
0.2
0.3
10 100 1000 10000Frequency/Hz
rel.
devi
atio
n fr
om w
eigh
ted
mea
n/10
-2
fitmeanmedianlikelihood wm-ptb
Figure A1a: Relative deviations of the reference values obtained by different methodsfrom those of the weighted mean for BB accelerometer. The acronym wm-ptbdesignates the weighted mean of the results of all laboratories excluding PTB
-0.2
-0.1
0
0.1
0.2
0.3
0.4
0.5
10 100 1000 10000Frequency/Hz
rel.
devi
atio
n fr
om w
eigh
ted
mea
n/10
-2
fitmeanmedianlikelihood wm-ptb
Figure A1b: Relative deviations of the reference values obtained by different methodsfrom those of the weighted mean for SE accelerometer. The acronym wm-ptb designates the weighted mean of the results of all laboratories excludingPTB

73
A.2 Method proposed by the pilot laboratory
Proposal to establish Key Comparison Reference ValuesThe weighted mean is proposed by the pilot laboratory to calculate the KCRVs for theCCAUV.V-K1 data. KCRVs are calculated separately at each frequency. The weightedmean method is a recommended standard method applicable on the basis of theuncertainty budgets established and submitted by all 12 participating laboratories incompliance with the GUM. It reflects the different levels of accuracy (uncertainty)demonstrated by the uncertainties declared by different NMIs for the same measurementconditions (i.e. same frequency).This proposal is supported by a consistency check of the key comparison data and bytheir visual inspection as well as by the comments received from the participants (cf.Appendix A3).
Back-to-back accelerometerFor the BB accelerometer it is proposed establishing KCRVs for all frequencies givenunder the conditions of measurement, i.e., for all of the frequencies from 40 Hz to 5 kHz.The chi-squared consistency check (with k = 3, see below) fails at frequencies of 1.6 kHzand 2 kHz if the results of all 12 laboratories are used. Visual inspection of the data showsa systematic tendency of the results of Lab 10 beyond 1 kHz (except 4 kHz). Taking alsothe comments received from NIST into account (cf. A.3), the pilot laboratory decided toexclude the results of Lab. 10 at frequencies from 1.25 kHz to 5 kHz from the calculationof the KCRVs.
Singled-ended accelerometerFor the SE accelerometer it is proposed that KCRVs be established at the frequenciesfrom 40 Hz to 2 kHz.At frequencies beyond 2000 Hz, the chi-squared consistency check (with k = 3) fails andthe reported results begin to diverge significantly.
Calculation of KCRVs using the weighted mean methodTables R1a and R1b contain the data for the two accelerometers BB and SE of all 12participating laboratories. For each laboratory i these data are (1) xi,f : best estimate ofsensitivity at frequency f, and (2) u(xi,f): associated standard uncertainty. Most of thelaboratories submitted also (3) νi,f : associated degree of freedom. Information about thecorrelation is not available and hence the results of the different laboratories were treatedas being uncorrelated.
For each of the two transfer standards and at each frequency f, a key comparisonreference value xR,f has been determined as the weighted mean of the results of nlaboratories according to
∑∑ =
=
=n
ififin
ifi
f xuxxu
x1
,2
,
1,
2,R )(/
)(/1
1(1)
∑=
=n
ifi
f
xuxu
1,
2,R
2
)(/1
1)( (2)
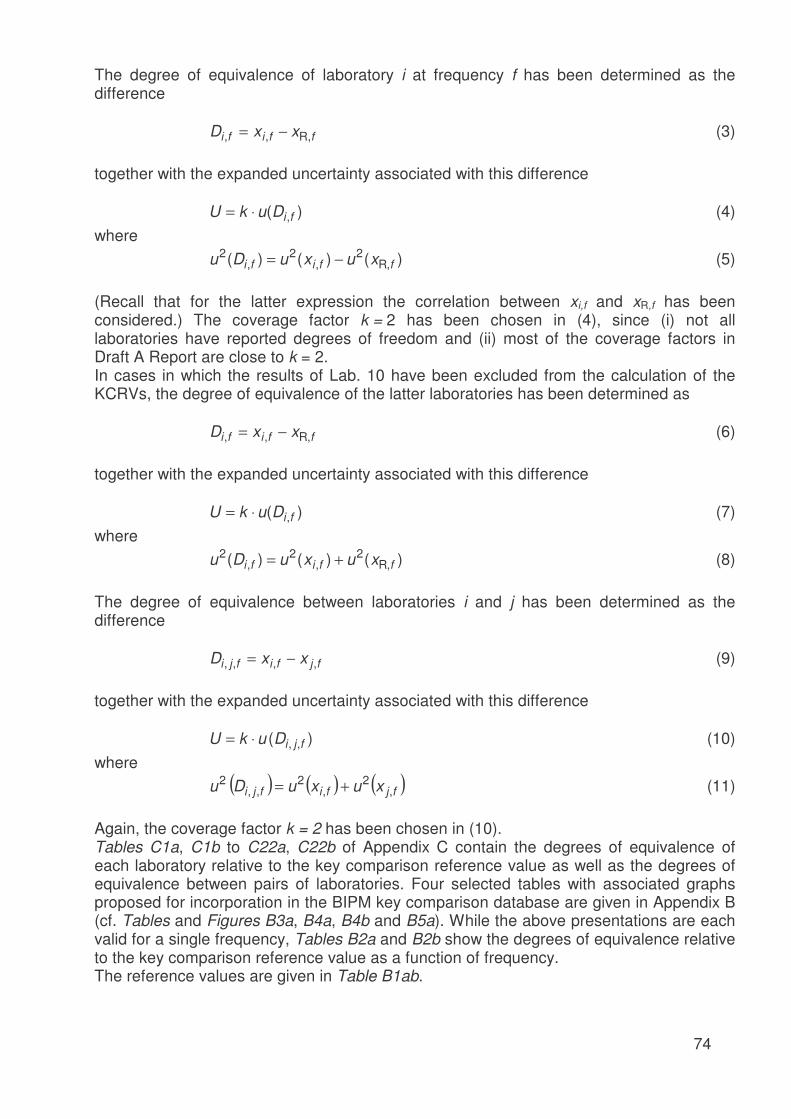
74
The degree of equivalence of laboratory i at frequency f has been determined as thedifference
ffifi xxD R,,, −= (3)
together with the expanded uncertainty associated with this difference
)( ,fiDukU ⋅= (4)where
)()()( ,R2
,2
,2
ffifi xuxuDu −= (5)
(Recall that for the latter expression the correlation between xi,f and xR,f has beenconsidered.) The coverage factor k = 2 has been chosen in (4), since (i) not alllaboratories have reported degrees of freedom and (ii) most of the coverage factors inDraft A Report are close to k = 2.In cases in which the results of Lab. 10 have been excluded from the calculation of theKCRVs, the degree of equivalence of the latter laboratories has been determined as
ffifi xxD ,R,, −= (6)
together with the expanded uncertainty associated with this difference
)( ,fiDukU ⋅= (7)where
)()()( ,R2
,2
,2
ffifi xuxuDu += (8)
The degree of equivalence between laboratories i and j has been determined as thedifference
fjfifji xxD ,,,, −= (9)
together with the expanded uncertainty associated with this difference
)( ,, fjiDukU ⋅= (10)where
( ) ( ) ( )fjfifji xuxuDu ,2
,2
,,2 += (11)
Again, the coverage factor k = 2 has been chosen in (10).Tables C1a, C1b to C22a, C22b of Appendix C contain the degrees of equivalence ofeach laboratory relative to the key comparison reference value as well as the degrees ofequivalence between pairs of laboratories. Four selected tables with associated graphsproposed for incorporation in the BIPM key comparison database are given in Appendix B(cf. Tables and Figures B3a, B4a, B4b and B5a). While the above presentations are eachvalid for a single frequency, Tables B2a and B2b show the degrees of equivalence relativeto the key comparison reference value as a function of frequency.The reference values are given in Table B1ab.

75
Consistency checkApplication of the weighted mean is justified when the data including the stateduncertainties are consistent with one another. To check this, the following criterion hasbeen applied:
( ) )1(2)1()(/min1
,22
, −+−≤−∑=
nknxuxn
ififi ζζ (12)
where n denotes the number of laboratories concerned, cf., e.g., [ 11 ]; xi,f and u(xi,f)denote the results and associated standard uncertainties of the n laboratories atfrequency f.
A.3 Individual comments on the method proposed by the pilot laboratory
The application of the weighted mean proposed by the pilot laboratory in [ 1 ] wassupported by 9 of the 12 participants without specific comments. The pilot laboratoryreceived such specific comments, including various tables and graphs, from the CENAMand the NIST. To save space, this appendix will give only those parts of CENAM‘s andNIST’s extensive comments, which characterize in essence the findings and conclusions(omitting the tables and graphs). The PTB, as the pilot laboratory, continued the analysisof the individual measurement results, upgrading the analysis given in [ 1 ] and [ 10 ].Since the NIST has also made a thorough analysis of the individual measurement resultspresented in the Draft A report, the pilot laboratory kept close contact to NIST within thescope of scientifico-technical discussions. This is the reason why two successive NISTcomments are given in the following. In-between, the PTB had informed the NIST about itslatest findings (in particular, the need for re-calculation of the degrees of equivalence onthe basis of the coverage factor k = 2 instead of the coverage probability of 95% and theconformity test).
CENAM comment of March 6, 2002
We have discussed the results of the report very thoroughly. Guillermo has made ananalysis of the different possibilities taking as Reference Value the simple mean and theweighted mean, similarly to what you presented in the last CCAUV Meeting. Hiscomments and observations are in the attached file.In general, we agree with yourdecision of using the weighted mean as a good estimator of the KCRV. However, I stillwonder whether the degree of equivalence graphs add any value to the overall result ofthe comparison. If those values were not reported, we would be rather satisfied. I canmention, for instance, that in other comparisons like the CCAUV.A-K1, a different figure ofmerit has been used.

76
Subject: CENAM's conclusions of the ILC CCAUV.V-K1
The simple average is an unbiased estimator of the mean. Is the weighted average anunbiased estimator? What does it mean?
At the frequency of 63 Hz, if the KCRV is estimated using the simple mean, deviations ofthe results declared by the PL are similar to its declared uncertainty. This measurementcondition should be investigated.
At the frequency of 80 Hz, the NRCC (Canada) does not overlap the estimated KCRV,therefore this condition of measurement should be improved.
At frequencies above 3 kHz, the SE accelerometer shows larger variability than the BBtype, perhaps the experimental technique needs additional improvements.
For the SE accelerometer, at 5 kHz: (a) if we use the weighted mean, 7 out of 12 NMI's,which is the 58%, do not overlap the KCRV; and (b) if we use the simple mean, 10 out of12 NMI's, which is the 83%, do not overlap the KCRV. Therefore, one may say that someadditional sources of variation should be investigated because, at this measurementcondition, the level of confidence is low.
Five measurements were asked in the Comparison Protocol, however, it seems that thePL is considering for itself more than five measurements; the number of effective degreesof freedom for each participating NMI, including the PL, should be highlighted.
In our analysis, three different estimators of the KCRV were considered, i.e., the simplemean, the weighted mean, and the weighted mean without considering the PL (because ithas the smallest uncertainty). The aim of this analysis is to find the influence of the PL onthe KCRV if the weighted mean is used: first, we calculate the weighted mean consideringall the NMI's (including the PL); and second, we calculate the weighted mean withoutconsidering PL's values. An aspect to analyze is how close the two weighted mean valuesare from the simple mean.
Conclusion SE accelerometer: in 12 frequencies the weighted mean without consideringthe values of the PL are closer to the simple mean; and only in 6 frequencies the weightedmean considering all the NMI's is closer to the simple mean.
Conclusion BB accelerometer: in 14 frequencies the weighted mean without consideringthe values of the PL are closer to the simple mean; and only in 6 frequencies the weightedmean, considering all the NMI's, is closer to the simple mean.
General conclusionsIn 19 frequencies, the weighted mean considering all the NMI's and the weighted meanwithout considering the PL are at opposite sides with respect to the simple mean, seegraphs of results. It seems that the deviations of the PL may have a strong influence onthe estimation of the KCRV by the use of a weighted mean.
In general, good agreement of the KCRV is obtained between the use of a simple meanand a weighted mean. Therefore, as far as CENAM is concerned, the use of either simpleor weighted mean values to establish the KCRV makes no difference, except at 4 kHz.
End of CENAM comment of March 6, 2002
77
NIST comment of May 3, 2002
Use of weighted mean.
The weighted mean estimator can be a good and useful method to establish KeyComparison Reference Values when certain conditions are met for that key comparison.When these conditions do not hold, the weighted mean can exhibit undesirable propertiesthat can make it a poor choice for estimating a Key Comparison Reference Value (KCRV).Specific conditions required for the weighted mean to be an optimal method are that alllaboratories have the same mean, the variances for all the laboratories are all known andfixed, and the combined uncertainty for each laboratory is known and is dominated by theexperimental variance („type A“). These assumptions are not necessarily valid, not evenapproximately valid, in the case of the CCAUV.V-K1. However, PTB and NISTindependently verified by use of multiple methodologies including the Maximum LikelihoodEstimation (MLE) method that for the back-to-back accelerometer data, the results of thecomputations of the KCRVs and their uncertainties are „robust“ with respect to method ofestimation; that is, these are effectively „methodology-independent“ for these particulardata. The data for the single-ended accelerometer present more difficulties because of theseveral laboratories with large relative deviations from the KCRVs, particularly for highfrequencies. For the single-ended accelerometer data at frequencies from 40 Hz up to andincluding 2 kHz, the computations of the KCRVs and their uncertainties are againrelatively robust with respect to methodology. At frequencies greater than 2 kHz, the datado not appear to come from a symmetric distribution. Consequently, summary statistics(KCRV) and the probability levels for a given coverage factor can not be obtained usingthe gaussian distribution. Even when the several laboratories with large relative deviationsfrom the KCRVs (based on the results of all twelve laboratories) are excluded from theanalysis, the discrepancies among methodologies are reduced but still are too large toignore, especially at 4 kHz and 5 kHz.
The weighted mean and other methods have been in widespread use for many years, butthere is no single standard method for combining laboratory means because the requiredassumptions differ among methods, and those for the weighted mean are not met in allcases. In general, the weighted mean performs well when the weights are functions ofprecisely measured variances (or precisions), but not when the weights are functions ofuncertainties that include significant systematic or „Type B“ components. Using theweighted mean does not eliminate the influence of outliers or of systematic deviations; infact, the influence of stated uncertainties including systematic deviations is directly builtinto the weights. Nor does the weighted mean necessarily keep the uncertainty of theKCRV lower than the smallest of the declared uncertainty values. In this regard, it shouldbe noted that the formula for the uncertainty of the reference value on page 62 and theequations on page 63 are not valid in general because the sample variance is substitutedfor the true variance in the weights; and also there is a further substitution of the combineduncertainty for the variance. With these substitutions, the covariance between a laboratoryand the reference value does not in general equal the variance of the reference value.Additionally, in this key comparison, the systematic deviations or „Type B“ uncertaintiesare very unequal.
The potential shortcomings of weighted means are influenced by the systematicdeviations or by „Type B“ uncertainty components. Consequently, it is impracticable toverify that the necessary assumptions are approximately true unless the UncertaintyBudgets for all the participating laboratories are available. A further consideration is thesource of the variance or „Type A“ uncertainty; from the key comparison data and the

78
uncertainty budgets the validity of both the „Type A“ and „Type B“ uncertainty componentsreported by the laboratories could be checked.
Since the results of computations of the Key Comparison Reference Values for CCAUV.V-K1 were found to be robust with respect to the choice of methodology for the back-to-backdata, NIST has no objections in this particular case to the use of the weighted meanestimator to establish the KCRVs and their uncertainties. Similarly, for the single-endeddata for the frequency range from 40 Hz to 3.15 kHz, NIST has no objections in thisparticular case to the use of the weighted mean estimator to establish the KCRVs andtheir uncertainties. For the single-ended data at 4 kHz and 5 kHz, the informationcontained in the report is not sufficient either to validate or to invalidate the use of theweighted mean by comparison with methodologies for asymmetric distributions for whichthe requisite assumptions can be met.
For other Key Comparisons, unless the necessary assumptions can be shown to be valid,there would be serious reservations about the choice of weighted mean over othermethods for which the required assumptions were tenable.
End of NIST comment of May 3, 2002
After some correspondence by e-mail on specific results of the on-going statisticalanalysis of the comparison results, carried out in parallel at PTB and NIST, theproject leader received the NIST comment of July 12, 2002
NIST comment of July 12, 2002
Based on the results reported for CCAUV.V-K1, the use of a fixed coverage factor of 2 toobtain the expanded uncertainties makes much more sense than to attempt to assessstatistical confidence intervals. Therefore, NIST accepts the use of a coverage factor of 2to compute the expanded uncertainties for this key comparison.
Considering in the case of the single-ended accelerometer that:
(1) the results submitted by the laboratories begin to diverge significantly at2.5 kHz;
(2) the divergence in the reported results at 2.5 kHz and beyond is biased in onedirection;
(3) at frequencies beyond 2.5 kHz the variance of the reported results increasesand diverges significantly;
(4) when the results of the several laboratories with large relative deviations fromthe KCRVs (based on the results of all twelve laboratories) are excluded fromthe analysis of determining KCRVs, the discrepancies amongst the KCRVresults obtained using differing methodologies are reduced but are still toolarge to ignore at 2.5 kHz and beyond;
NIST agrees that no KCRVs should be calculated or reported for CCAUV.V-K1 in the caseof the single-ended results at 2.5 kHz, 3.15 kHz, 4 kHz and 5 kHz.

79
Considering next the results for the back-to-back accelerometer at 1000 Hz and above, itis noted that fringe counting, with or without modulation, is used as the method ofcalibration by only two laboratories and that the details of the implementation at highfrequencies are not specified for Lab 10 in Draft A of the report. (It is difficult to commenton the results for Lab 3 until discrepancies between their trial means and their overallmeans as reported in Table Lab 3a have been resolved.) Nonetheless, the agreementamongst the results reported by the laboratories using other methods of calibration iscomparable throughout this range to the agreement amongst the results reported by alltwelve laboratories using fringe counting at the lower frequencies.
As remarks communicated to NIST by Mr. Link of PTB suggest, in the frequency range of1250 Hz and above, the KCRVs for the back-to-back accelerometer are influenced by therelatively large values of sensitivity reported for Lab 10 coupled with the relatively largeweights applied to these values due to the small combined uncertainties reported forLab 10.
A series of statistical tests were performed at NIST which yield results in the case of theback-to-back accelerometer that support a single, uniform decision for all the frequenciesof 1250 Hz and above and that also would establish the equivalence at all frequencies ofresults from multiple methods of analysis. The results of these tests indicate that theagreement of mean values for eleven of the twelve laboratories (omitting Lab 10) issufficiently good that:
(1) Multiple methods of analysis: weighted means, unweighted means, maximumlikelihood, medians; all give very similar results for the KCRV.
(2) There are no distinguishing results remaining that raise questions for individuallaboratories, although a variety of calibration methods are utilized.
(3) The variation in mean values among the eleven laboratories is small relative tothe stated uncertainties at frequencies above 1000 Hz.
In this circumstance, the use of the weighted mean (based on eleven laboratories) todefine the KCRV is acceptable for this particular key comparison at frequencies above1000 Hz.
Inclusion of Lab 10 alters the results of these tests for frequencies above 1000 Hz. (Notethat for frequencies of 1600 Hz and above, Lab 10 uniquely utilizes a method of FringeCounting with Modulation.)
Further, it is noted that:
(1) Based on the Grubbs Test**, a standard test for significant outliers, the means forLab 10 are all highly significant outliers (alpha <0.01) for all frequencies from1250 Hz to 5000 Hz, with the exception of 4000 Hz. (Other tests for outliers givesimilar results and are not quoted here.)
(2) When Lab 10 is excluded, the discrepancies between KCRVs computed bymultiple methods differ very little. However, when all twelve laboratories areincluded, the median, the MLE, the unweighted mean, and the weighted mean
80
KCRVs diverge.
(3) For frequencies of 1250 Hz and above, from 74% to 96% of the total variationamong laboratories is accounted for by Lab 10 alone (except at 4000 Hz, whenLab 10 accounts for 54% of the total variation among laboratories). (For thispurpose, variation is measured by summing the squared deviations from thelaboratory average for the twelve laboratories. The fraction attributed to Lab 10 isthe squared deviation for Lab 10 divided by the total sum of squared deviationsfor all twelve laboratories. Note that for 4000 Hz and 5000 Hz, only elevenlaboratories submitted results; so for these two frequencies these computationsare based on eleven laboratories rather than twelve.)
(4) Because of the systematic discrepancies in the results for Lab 10, fromwhatever cause, a single decision should apply for all frequencies from1250 Hz to 5000 Hz for the back-to-back results.
Given time and other constraints, NIST defers to the discretion of PTB as the PilotLab to formulate this decision.
(5) Regarding this decision, it is noted that the deviations in the values of the KCRVsusing the weighted mean with and without the inclusion of Lab 10, whilestatistically significant, are of the order of 0.01% to 0.04% which is smaller thanthe stated combined uncertainties of the laboratories individually. Therefore, thechoice between these computations for establishing the KCRVs does not appearto affect the individual laboratories in any practical sense.
(6) A single decision with respect to the assertion of equivalence of laboratories inthe case of the back-to-back accelerometer should apply to all frequencies from1250 Hz to 5000 Hz.
** Grubbs, F.E. (1969). Procedures for detecting outlying observations in samples.Technometrics 11, 1-21.
End of NIST comment of July 12, 2002

81
A.4 Consensus of the participants
A consensus has been reached between all 12 participating laboratories on the weightedmean method considered most appropriate for the particular comparison to compute thekey comparison reference value(s) and the degrees of equivalence. KCRVs werecalculated separately at each frequency. Generally, the results of all 12 laboratories wereused to calculate the KCRVs. For the back-to-back (BB) accelerometer, the KCRVs arebased on the results of 12 laboratories at the frequencies from 40 Hz to 1 kHz, of11 laboratories from 1.25 kHz to 3.15 kHz and of 10 laboratories at 4 kHz and 5 kHz.
For the single-ended (SE) accelerometer, the KCRVs are based on the results of12 laboratories at all frequencies from 40 Hz to 2 kHz. For higher frequencies, no KCRV isavailable.
The detailed explanations for this consensus are given in sections A1, A2 and A3 of thisAppendix A.

82
Appendix B: KCRVs and degrees of equivalenceB.1 Proposed reference valuesKey comparison CCAUV.V-K1MEASURAND : Charge sensitivity
One key comparison value, xR, is computed for each accelerometer and for each frequency as a weighted mean of the participant results.*
The combined standard uncertainty, uR, of each key comparison reference value is obtained as the standard deviation of the weighted mean.
The degree of equivalence of each laboratory with respect toFrequency xR uR uR/xR x R u R u R /x R the reference value is given by a pair of terms:
/ Hz / pC/(m/s2) / pC/(m/s2) / 10-2 / pC/(m/s2) / pC/(m/s2) / 10-2 the deviation D i = x i - x R, and its expanded
40 0.12658 0.00005 0.04 0.12898 0.00005 0.04 uncertainty (k = 2), Ui ,
50 0.12658 0.00005 0.04 0.12897 0.00005 0.04 U i = 2(u i2 - u R
2)1/2 **.
63 0.12654 0.00005 0.04 0.12896 0.00005 0.0480 0.12658 0.00005 0.04 0.12898 0.00005 0.04 The degree of equivalence between two laboratories i and j100 0.12658 0.00005 0.04 0.12896 0.00005 0.04 is given by two terms:125 0.12658 0.00005 0.04 0.12898 0.00005 0.04 the deviation D ij = x i - x j and its expanded
160 0.12663 0.00005 0.04 0.12899 0.00005 0.04 uncertainty (k = 2), Uij ,
200 0.12660 0.00005 0.04 0.12900 0.00005 0.04 U ij = 2(u i2 + u j
2)1/2.
250 0.12663 0.00005 0.04 0.12902 0.00005 0.04315 0.12665 0.00005 0.04 0.12905 0.00005 0.04 The full matrices of equivalence are computed in four cases:400 0.12666 0.00005 0.04 0.12906 0.00005 0.04 - BB accelerometer at frequencies 40 Hz, 160 Hz and 5 kHz500 0.12663 0.00005 0.04 0.12910 0.00005 0.04 - SE accelerometer at the frequency 160 Hz630 0.12670 0.00005 0.04 0.12917 0.00005 0.04800 0.12673 0.00005 0.04 0.12919 0.00005 0.04 * For the BB accelerometer, xR is based on 12 laboratories
1000 0.12680 0.00005 0.04 0.12926 0.00005 0.04 at frequencies of 40 Hz to 1 kHz, 11 laboratories at 1.25 kHz1250 0.12683 0.00005 0.04 0.12938 0.00005 0.04 to 3.15 kHz and 10 laboratories at 4 kHz and 5 kHz. 1600 0.12696 0.00005 0.04 0.12959 0.00005 0.04 For the SE accelerometer no reference value is available2000 0.12713 0.00005 0.04 0.12988 0.00005 0.04 from 2.5 kHz to 5 kHz.2500 0.12732 0.00008 0.063150 0.12776 0.00009 0.07 ** U i = 2(u i
2 + u R2)1/2 for the laboratory excluded
4000 0.12843 0.00009 0.07 from the calculation of x R
5000 0.12936 0.00010 0.08
Back-to-back accelerometer type 8305 S/N 1483337
Single-ended accelerometer type 8305 WH 2335 S/N
no KCRV
Table B1ab: Reference values and associated standard uncertainties for BB and SE accelerometer (basis: weighted mean)

83
Figure B1ab: Key comparison reference values, xR, versus frequency, f, and standard uncertainty uR, for BB and SE accelerometer
Key comparison CCAUV.V-K1 Measurand: Charge sensitivityKey comparison reference values, x R, versus frequency, and standard uncertainty u R
0,12600
0,12650
0,12700
0,12750
0,12800
0,12850
0,12900
0,12950
0,13000
0 500 1000 1500 2000 2500 3000 3500 4000 4500 5000
Frequency / Hz
xR /
pC /
(m/s
2 )
Back-to-back accelerometer type 8305 S/N 1483337
Single-ended accelerometer type 8305 WH 2335 S/N 1610174

84
B.2 Proposed degrees of equivalence relative to the key comparison reference value
Table B2a: Degrees of equivalence relative to the key comparison reference value for BB accelerometer
Key comparison CCAUV.V-K1Degrees of equivalence relative to the key comparison reference value
Back-to-back (BB) accelerometer type 8305 S/N 1483337
FrequencyLab i D i U i D i U i D i U i D i U i D i U i D i U i D i U i D i U i
PTB 0,6 0,8 0,6 0,9 0,7 0,9 0,4 0,9 0,4 0,9 0,5 0,9 0,1 0,8 0,3 0,9BNM-CESTA 1,2 6,3 1,2 6,3 1,6 6,3 2,2 6,3 2,2 6,3 1,3 6,3 0,7 6,3 2,0 6,3CSIRO-NML 1,2 5,0 1,2 5,0 0,6 3,7 0,3 3,7 0,3 3,7 0,3 3,7 -0,3 3,7 0,1 3,7CMI -0,9 5,7 -0,5 5,5 0,4 5,8 0,3 5,5 0,3 5,8 0,3 5,5 -0,3 5,7 0,2 5,8CSIR-NML 9,2 11,4 4,2 8,8 -3,4 8,8 -4,8 8,8 -1,8 7,5 -3,7 7,5 -0,3 6,3 -4,0 6,2CENAM -1,7 6,2 -2,2 6,2 -0,7 6,3 -1,1 6,3 -1,3 6,3 -1,1 6,3 -0,3 6,3 0,2 6,3NRC -1,1 3,7 -1,2 3,7 -1,3 3,7 3,9 3,6 0,8 3,6 1,5 3,6 1,2 3,6 0,9 3,6KRISS -1,1 4,5 -1,0 4,5 -0,9 4,5 -1,0 4,5 -1,4 4,5 -1,2 4,5 -1,4 4,5 -0,9 4,5NMIJ -2,9 5,2 -0,9 5,4 0,1 5,6 -0,2 6,0 0,1 5,9 -0,2 5,2 -0,3 5,4 -0,3 5,5VNIIM -5,4 5,0 -4,2 5,0 -4,4 5,0 -4,6 5,0 -4,8 5,0 -1,1 5,0 1,9 5,0 2,6 5,5NIST 1,2 3,7 0,2 3,7 0,6 3,4 -0,8 3,7 1,2 3,4 -1,7 3,9 -1,3 3,7 -1,0 3,7NMi-VSL -0,9 3,1 -0,7 2,8 -1,5 2,5 -1,7 2,5 -1,3 2,5 -1,2 2,5 -0,3 4,2 -0,9 2,5
40 Hz 50 Hz 63 Hz 80 Hz 100 Hz 125 Hz 160 Hz 200 Hz
pC/(m/s²)x10-4 pC/(m/s²)x10-4 pC/(m/s²)x10-4 pC/(m/s²)x10-4 pC/(m/s²)x10-4 pC/(m/s²)x10-4 pC/(m/s²)x10-4 pC/(m/s²)x10-4

85
Back-to-back (BB) accelerometer type 8305 S/N 1483337, Continued
Degrees of equivalence relative to the key comparison reference value
FrequencyLab i D i U i D i U i D i U i D i U i D i U i D i U i D i U i D i U i
PTB 0,2 0,9 0,2 0,9 -0,2 0,8 -0,2 0,8 -0,3 0,8 -0,4 0,8 -0,2 0,8 0,2 0,8BNM-CESTA 1,7 6,3 2,5 6,3 3,4 6,3 2,7 6,3 2,0 6,3 2,7 6,3 2,0 6,3 1,7 6,3CSIRO-NML -0,3 3,7 0,5 3,7 0,4 3,7 0,7 3,7 -0,1 3,7 -0,4 3,7 1,0 3,7 0,7 3,7CMI 0,3 6,3 -0,6 6,5 -0,2 6,8 0,7 6,8 -0,4 6,8 -0,4 6,8 -0,7 6,8 -0,2 6,8CSIR-NML -1,3 6,3 -0,6 6,3 4,4 7,6 4,7 7,6 1,0 6,3 1,7 6,3 0,1 7,5 0,7 7,5CENAM -1,2 6,3 -1,6 6,3 -0,8 6,3 -0,7 6,3 -0,9 6,3 -0,6 6,3 -0,6 10,1 -0,7 10,1NRC 0,6 3,7 -0,9 3,6 1,1 3,7 -1,3 5,8 -0,2 4,1 1,4 5,4 1,0 6,7 1,2 7,2KRISS -0,8 4,5 -1,0 4,5 -0,9 4,5 -0,5 4,5 -0,7 4,5 -0,8 4,4 -1,0 4,7 -0,8 4,7NMIJ -1,0 5,6 -1,9 6,1 0,1 8,0 -0,8 6,3 -1,3 5,7 -1,2 6,6 -0,8 3,9 -0,1 3,5VNIIM 0,7 5,5 1,5 5,5 1,4 5,5 3,1 5,5 2,4 5,5 3,5 5,5 6,4 5,5 8,9 5,7NIST -0,3 3,7 -0,6 3,9 -0,7 3,7 -2,3 4,2 -4,0 5,0 -3,3 10,8 -4,0 5,5 -3,3 5,2NMi-VSL -0,5 2,5 0,6 3,2 -1,7 4,8 -0,2 3,1 3,7 3,6 4,7 6,3 2,5 13,4 -1,4 7,0
Laboratory results at the frequencies of 1250 Hz to 5000 Hz excluded from calculation of the reference value
pC/(m/s²)x10-4 pC/(m/s²)x10-4 pC/(m/s²)x10-4pC/(m/s²)x10-4 pC/(m/s²)x10-4pC/(m/s²)x10-4 pC/(m/s²)x10-4 pC/(m/s²)x10-4
630 Hz 800 Hz 1000 Hz 1250 Hz250 Hz 315 Hz 400 Hz 500 Hz

86
Back-to-back (BB) accelerometer type 8305 S/N 1483337, Continued
Degrees of equivalence relative to the key comparison reference value
FrequencyLab i D i U i D i U i D i U i D i U i D i U i D i U i
PTB 0,3 0,7 0,4 0,7 0,9 2,0 -0,3 1,9 0,7 1,8 -0,3 1,7
BNM-CESTA 1,4 6,3 1,7 6,3 1,8 6,2 0,5 6,2
CSIRO-NML 0,4 3,7 -0,3 3,7 0,8 3,5 1,4 3,4 0,7 3,4 1,4 4,8
CMI -0,8 6,5 -0,7 6,0 -1,2 5,6 -2,5 8,8 -4,2 7,5 -0,2 7,5
CSIR-NML 1,4 7,6 -0,3 7,6 -1,2 7,5 -0,6 8,8 -2,3 8,8 -1,6 8,8
CENAM 0,6 10,1 0,8 10,1 -0,5 10,1 2,2 10,1 -1,5 10,1 -0,6 10,2
NRC 0,7 7,7 0,7 8,3 -2,2 8,5 -4,4 10,9 -0,7 11,9 -0,7 13,8
KRISS -1,3 4,7 -1,1 4,7 -0,9 4,6 -0,9 5,2 -0,9 5,2 0,9 5,2
NMIJ -1,0 5,7 -1,1 5,6 -1,0 5,9 0,4 13,6 0,2 14,3 -0,6 17,0
VNIIM 14,4 5,7 17,7 5,8 19,0 8,9 14,4 9,0 5,5 9,0 13,8 9,1
NIST -3,6 5,2 -4,3 8,6 -6,2 14,6 3,4 16,0 1,7 15,1 -1,6 15,4
NMi-VSL -1,4 9,6 -2,1 5,4 -2,4 6,7 -1,8 20,0 -1,7 29,7 -0,8 48,8
No data (measurement at displaced frequency)
Laboratory results at the frequencies of 1250 Hz to 5000 Hz excluded from calculation of the reference value
1600 Hz 2000 Hz 2500 Hz 3150 Hz
pC/(m/s²)x10-4 pC/(m/s²)x10-4 pC/(m/s²)x10-4 pC/(m/s²)x10-4
4000 Hz 5000 Hz
pC/(m/s²)x10-4 pC/(m/s²)x10-4
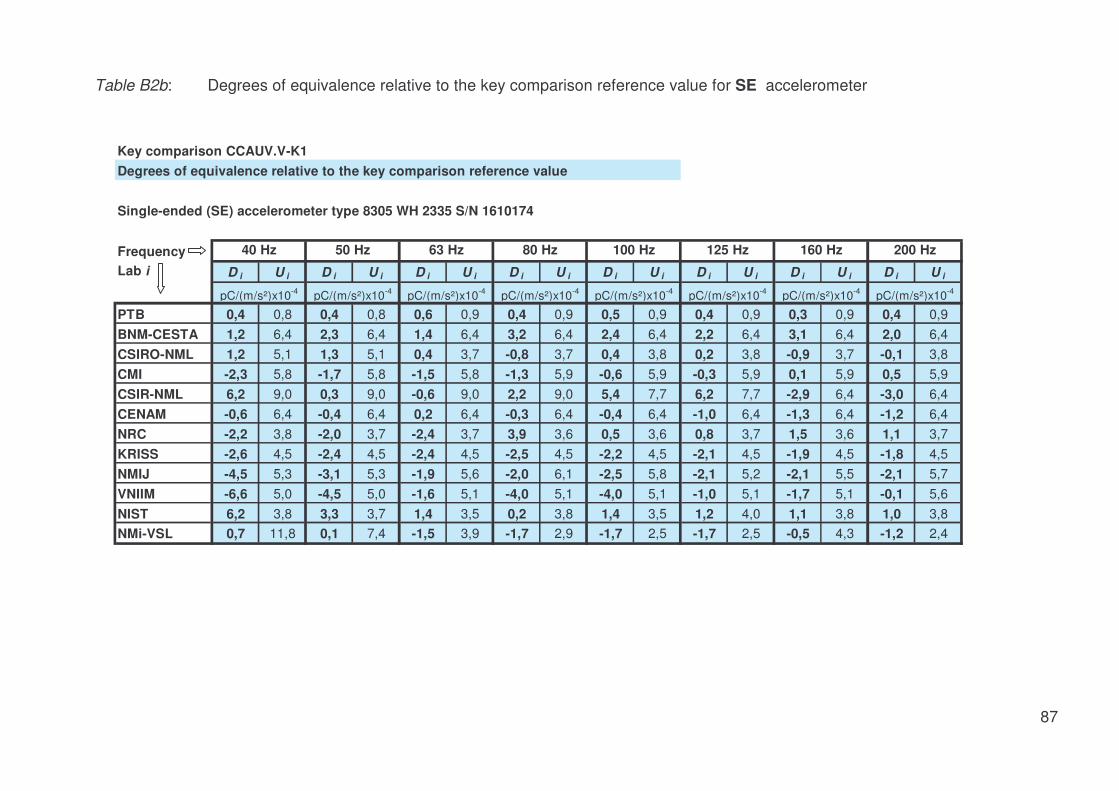
87
Table B2b: Degrees of equivalence relative to the key comparison reference value for SE accelerometer
Key comparison CCAUV.V-K1Degrees of equivalence relative to the key comparison reference value
Single-ended (SE) accelerometer type 8305 WH 2335 S/N 1610174
FrequencyLab i D i U i D i U i D i U i D i U i D i U i D i U i D i U i D i U i
PTB 0,4 0,8 0,4 0,8 0,6 0,9 0,4 0,9 0,5 0,9 0,4 0,9 0,3 0,9 0,4 0,9BNM-CESTA 1,2 6,4 2,3 6,4 1,4 6,4 3,2 6,4 2,4 6,4 2,2 6,4 3,1 6,4 2,0 6,4CSIRO-NML 1,2 5,1 1,3 5,1 0,4 3,7 -0,8 3,7 0,4 3,8 0,2 3,8 -0,9 3,7 -0,1 3,8CMI -2,3 5,8 -1,7 5,8 -1,5 5,8 -1,3 5,9 -0,6 5,9 -0,3 5,9 0,1 5,9 0,5 5,9CSIR-NML 6,2 9,0 0,3 9,0 -0,6 9,0 2,2 9,0 5,4 7,7 6,2 7,7 -2,9 6,4 -3,0 6,4CENAM -0,6 6,4 -0,4 6,4 0,2 6,4 -0,3 6,4 -0,4 6,4 -1,0 6,4 -1,3 6,4 -1,2 6,4NRC -2,2 3,8 -2,0 3,7 -2,4 3,7 3,9 3,6 0,5 3,6 0,8 3,7 1,5 3,6 1,1 3,7KRISS -2,6 4,5 -2,4 4,5 -2,4 4,5 -2,5 4,5 -2,2 4,5 -2,1 4,5 -1,9 4,5 -1,8 4,5NMIJ -4,5 5,3 -3,1 5,3 -1,9 5,6 -2,0 6,1 -2,5 5,8 -2,1 5,2 -2,1 5,5 -2,1 5,7VNIIM -6,6 5,0 -4,5 5,0 -1,6 5,1 -4,0 5,1 -4,0 5,1 -1,0 5,1 -1,7 5,1 -0,1 5,6NIST 6,2 3,8 3,3 3,7 1,4 3,5 0,2 3,8 1,4 3,5 1,2 4,0 1,1 3,8 1,0 3,8NMi-VSL 0,7 11,8 0,1 7,4 -1,5 3,9 -1,7 2,9 -1,7 2,5 -1,7 2,5 -0,5 4,3 -1,2 2,4
40 Hz 50 Hz 63 Hz 80 Hz 100 Hz 125 Hz 160 Hz 200 Hz
pC/(m/s²)x10-4 pC/(m/s²)x10-4 pC/(m/s²)x10-4 pC/(m/s²)x10-4 pC/(m/s²)x10-4 pC/(m/s²)x10-4 pC/(m/s²)x10-4 pC/(m/s²)x10-4

88
Single-ended (SE) accelerometer type 8305 WH 2335 S/N 1610174, Continued
Degrees of equivalence relative to the key comparison ref. value
FrequencyLab i D i U i D i U i D i U i D i U i D i U i D i U i D i U i D i U i
PTB 0,3 0,9 0,2 0,9 -0,2 0,8 -0,2 0,8 0,2 0,8 -0,3 0,8 -0,1 0,7 -0,2 0,8BNM-CESTA 0,8 6,4 4,5 6,4 4,4 6,4 3,0 6,4 2,3 6,4 3,1 6,4 0,4 6,4 1,2 6,4CSIRO-NML 0,8 3,8 0,6 3,8 0,4 3,7 0,1 3,7 0,4 3,7 -0,9 3,7 -0,6 3,7 0,3 3,7CMI 0,8 6,1 1,0 5,9 1,0 5,9 1,0 5,9 1,4 8,5 2,1 8,5 1,7 8,5 3,2 8,0CSIR-NML -1,2 6,4 2,5 6,4 3,4 7,7 2,0 7,7 2,3 7,7 4,1 7,7 2,4 7,7 2,2 7,7CENAM -0,8 6,4 -0,1 6,4 0,4 6,4 0,6 6,4 -0,4 6,4 0,4 6,4 1,5 10,3 0,8 10,3NRC 1,4 3,8 -1,3 3,7 -0,4 3,8 -1,3 5,9 -3,2 4,2 2,5 5,5 0,9 6,8 1,8 7,3KRISS -1,9 4,5 -2,0 4,5 -1,8 4,5 -1,8 4,5 -2,2 4,5 -1,9 4,5 -2,2 6,1 -2,6 6,1NMIJ -2,0 6,6 -2,4 8,1 -2,2 14,5 -1,7 19,3 -3,8 9,2 -2,9 8,6 2,9 6,0 3,4 4,4VNIIM -2,2 5,6 -3,3 5,6 -3,8 5,6 -5,2 5,6 -5,1 5,6 -4,7 5,6 -4,4 5,6 -7,8 5,6NIST 0,8 3,8 0,6 4,0 1,4 3,7 1,0 4,3 0,4 5,1 2,1 11,1 2,4 5,6 1,2 5,3NMi-VSL -1,0 2,8 -0,5 2,9 0,1 4,8 1,9 2,9 2,9 3,2 6,2 5,3 4,7 20,7 2,1 16,3
pC/(m/s²)x10-4 pC/(m/s²)x10-4pC/(m/s²)x10-4 pC/(m/s²)x10-4 pC/(m/s²)x10-4 pC/(m/s²)x10-4 pC/(m/s²)x10-4 pC/(m/s²)x10-4
630 Hz 800 Hz 1000 Hz 1250 Hz250 Hz 315 Hz 400 Hz 500 Hz

89
Single-ended (SE) accelerometer type 8305 WH 2335 S/N 1610174, Continued
Degrees of equivalence relative to the key comparison ref. value
FrequencyLab i D i U i D i U i D i U i D i U i D i U i D i U i
PTB 0,2 0,7 0,1 0,7
BNM-CESTA 0,2 6,4 0,3 6,4
CSIRO-NML 0,2 3,7 -0,8 3,7
CMI 2,4 8,0 1,7 8,0
CSIR-NML 2,1 7,7 4,2 7,7
CENAM 0,9 10,3 0,8 10,3
NRC -1,9 7,9 -3,1 8,5
KRISS -3,3 6,1 -4,0 6,1
NMIJ 6,3 6,6 11,3 6,3
VNIIM -6,9 5,6 -7,6 5,6
NIST 0,2 5,3 -1,8 8,8
NMi-VSL 3,2 22,4 5,3 12,7
4000 Hz 5000 Hz
pC/(m/s²)x10-4 pC/(m/s²)x10-4
1600 Hz 2000 Hz
pC/(m/s²)x10-4 pC/(m/s²)x10-4 pC/(m/s²)x10-4 pC/(m/s²)x10-4
2500 Hz 3150 Hz
no KCRV no KCRV no KCRV no KCRV

90
B.3 Matrix of equivalence between the laboratories (tables and graphs selected for BIPM database)
Key comparison CCAUV.V-K2 Back-to-back (BB) accelerometer type 8305 S/N 1483337 Frequency: 40 Hz
Lab j
Lab i
D i U i D ij U ij D ij U ij D ij U ij D ij U ij D ij U ij D ij U ij
PTB 0,6 0,8 -0,6 6,5 -0,6 5,2 1,6 6,0 -8,5 11,5 2,4 6,4BNM-CESTA 1,2 6,3 0,6 6,5 0,0 8,1 2,1 8,6 -8,0 13,1 2,9 8,9CSIRO-NML 1,2 5,0 0,6 5,2 0,0 8,1 2,1 7,7 -8,0 12,5 2,9 8,1CMI -0,9 5,7 -1,6 6,0 -2,1 8,6 -2,1 7,7 -10,1 12,9 0,8 8,6CSIR-NML 9,2 11,4 8,5 11,5 8,0 13,1 8,0 12,5 10,1 12,9 10,9 13,1CENAM -1,7 6,2 -2,4 6,4 -2,9 8,9 -2,9 8,1 -0,8 8,6 -10,9 13,1NRC -1,1 3,7 -1,8 4,0 -2,3 7,4 -2,3 6,3 -0,2 7,0 -10,3 12,1 0,6 7,4KRISS -1,1 4,5 -1,7 4,7 -2,3 7,8 -2,3 6,8 -0,2 7,4 -10,3 12,3 0,6 7,8NMIJ -2,9 5,2 -3,6 5,5 -4,1 8,3 -4,1 7,3 -2,0 7,9 -12,1 12,6 -1,2 8,3VNIIM -5,4 5,0 -6,1 5,2 -6,6 8,1 -6,6 7,1 -4,5 7,7 -14,6 12,5 -3,7 8,1NIST 1,2 3,7 0,6 4,0 0,0 7,4 0,0 6,3 2,1 7,0 -8,0 12,1 2,9 7,4NMi-VSL -0,9 3,1 -1,5 3,5 -2,0 7,1 -2,0 6,0 0,1 6,7 -10,0 11,9 0,9 7,1
Lab i
D i U i D ij U ij D ij U ij D ij U ij D ij U ij D ij U ij D ij U ij
PTB 0,6 0,8 1,8 4,0 1,7 4,7 3,6 5,5 6,1 5,2 -0,6 4,0 1,5 3,5BNM-CESTA 1,2 6,3 2,3 7,4 2,3 7,8 4,1 8,3 6,6 8,1 0,0 7,4 2,0 7,1CSIRO-NML 1,2 5,0 2,3 6,3 2,3 6,8 4,1 7,3 6,6 7,1 0,0 6,3 2,0 6,0CMI -0,9 5,7 0,2 7,0 0,2 7,4 2,0 7,9 4,5 7,7 -2,1 7,0 -0,1 6,7CSIR-NML 9,2 11,4 10,3 12,1 10,3 12,3 12,1 12,6 14,6 12,5 8,0 12,1 10,0 11,9CENAM -1,7 6,2 -0,6 7,4 -0,6 7,8 1,2 8,3 3,7 8,1 -2,9 7,4 -0,9 7,1NRC -1,1 3,7 -0,1 5,9 1,8 6,5 4,3 6,3 -2,3 5,4 -0,3 5,0KRISS -1,1 4,5 0,1 5,9 1,8 7,0 4,3 6,8 -2,3 5,9 -0,3 5,6NMIJ -2,9 5,2 -1,8 6,5 -1,8 7,0 2,5 7,3 -4,1 6,5 -2,1 6,2VNIIM -5,4 5,0 -4,3 6,3 -4,3 6,8 -2,5 7,3 -6,6 6,3 -4,6 6,0NIST 1,2 3,7 2,3 5,4 2,3 5,9 4,1 6,5 6,6 6,3 2,0 5,0NMi-VSL -0,9 3,1 0,3 5,0 0,3 5,6 2,1 6,2 4,6 6,0 -2,0 5,0
Matrix of equivalence
NMi-VSL
pC/(m/s²)x10-4 pC/(m/s²)x10-4 pC/(m/s²)x10-4 pC/(m/s²)x10-4 pC/(m/s²)x10-4 pC/(m/s²)x10-4 pC/(m/s²)x10-4
NRC KRISS NMIJ VNIIM
CSIR-NMLCSIRO-NML CMI
NIST
CENAM
pC/(m/s²)x10-4 pC/(m/s²)x10-4 pC/(m/s²)x10-4 pC/(m/s²)x10-4 pC/(m/s²)x10-4 pC/(m/s²)x10-4 pC/(m/s²)x10-4
PTB BNM-CESTA
Table B3a: Matrix of equivalence for BB accelerometer at 40 Hz

91Figure B3a: Degrees of equivalence for BB accelerometer at 40 Hz
CCAUV.V-K1 Charge sensitivity, BB accelerometer, frequency: 40 HzDegrees of equivalence [ D i and its expanded uncertainty (k = 2), U i ]
-25
-20
-15
-10
-5
0
5
10
15
20
25
PTB BNM-CESTA
CSIRO-NML
CMI CSIR-NML
CENAM NRC KRISS NMIJ VNIIM NIST NMi-VSL
Di
/ pC
/ (m
/s2 )x
10-4

92
Key comparison CCAUV.V-K1 Back-to-back (BB) accelerometer type 8305 S/N 1483337 Frequency: 160 Hz
Lab j
Lab i
D i U i D ij U ij D ij U ij D ij U ij D ij U ij D ij U ij D ij U ij
PTB 0,1 0,8 -0,6 6,5 0,4 4,0 0,4 6,0 0,4 6,5 0,4 6,5BNM-CESTA 0,7 6,3 0,6 6,5 1,0 7,4 1,0 8,6 1,0 9,0 1,0 9,0CSIRO-NML -0,3 3,7 -0,4 4,0 -1,0 7,4 0,0 7,0 0,0 7,4 0,0 7,4CMI -0,3 5,7 -0,4 6,0 -1,0 8,6 0,0 7,0 0,0 8,6 0,0 8,6CSIR-NML -0,3 6,3 -0,4 6,5 -1,0 9,0 0,0 7,4 0,0 8,6 0,0 9,0CENAM -0,3 6,3 -0,4 6,5 -1,0 9,0 0,0 7,4 0,0 8,6 0,0 9,0NRC 1,2 3,6 1,1 3,9 0,5 7,3 1,5 5,3 1,5 6,9 1,5 7,3 1,5 7,3KRISS -1,4 4,5 -1,4 4,7 -2,1 7,8 -1,1 5,9 -1,1 7,4 -1,1 7,8 -1,1 7,8NMIJ -0,3 5,4 -0,4 5,6 -1,0 8,4 0,0 6,6 0,0 8,0 0,0 8,3 0,0 8,3VNIIM 1,9 5,0 1,8 5,2 1,2 8,1 2,2 6,3 2,2 7,7 2,2 8,1 2,2 8,1NIST -1,3 3,7 -1,4 4,0 -2,0 7,4 -1,0 5,4 -1,0 7,0 -1,0 7,4 -1,0 7,4NMi-VSL -0,3 4,2 -0,4 4,5 -1,0 7,7 0,0 5,7 0,0 7,2 0,0 7,7 0,0 7,7
Lab i
D i U i D ij U ij D ij U ij D ij U ij D ij U ij D ij U ij D ij U ij
PTB 0,1 0,8 -1,1 3,9 1,4 4,7 0,4 5,6 -1,8 5,2 1,4 4,0 0,4 4,5BNM-CESTA 0,7 6,3 -0,5 7,3 2,1 7,8 1,0 8,4 -1,2 8,1 2,0 7,4 1,0 7,7CSIRO-NML -0,3 3,7 -1,5 5,3 1,1 5,9 0,0 6,6 -2,2 6,3 1,0 5,4 0,0 5,7CMI -0,3 5,7 -1,5 6,9 1,1 7,4 0,0 8,0 -2,2 7,7 1,0 7,0 0,0 7,2CSIR-NML -0,3 6,3 -1,5 7,3 1,1 7,8 0,0 8,3 -2,2 8,1 1,0 7,4 0,0 7,7CENAM -0,3 6,3 -1,5 7,3 1,1 7,8 0,0 8,3 -2,2 8,1 1,0 7,4 0,0 7,7NRC 1,2 3,6 2,6 5,9 1,5 6,6 -0,7 6,3 2,5 5,3 1,5 5,7KRISS -1,4 4,5 -2,6 5,9 -1,1 7,1 -3,3 6,8 -0,1 5,9 -1,1 6,3NMIJ -0,3 5,4 -1,5 6,6 1,1 7,1 -2,2 7,4 1,0 6,6 0,0 6,9VNIIM 1,9 5,0 0,7 6,3 3,3 6,8 2,2 7,4 3,2 6,3 2,2 6,7NIST -1,3 3,7 -2,5 5,3 0,1 5,9 -1,0 6,6 -3,2 6,3 -1,0 5,7NMi-VSL -0,3 4,2 -1,5 5,7 1,1 6,3 0,0 6,9 -2,2 6,7 1,0 5,7
CENAM
pC/(m/s²)x10-4 pC/(m/s²)x10-4 pC/(m/s²)x10-4 pC/(m/s²)x10-4 pC/(m/s²)x10-4 pC/(m/s²)x10-4 pC/(m/s²)x10-4
PTB BNM-CESTA
KRISS NMIJ VNIIM
CSIR-NMLCSIRO-NML CMI
NIST
Matrix of equivalence
NMi-VSL
pC/(m/s²)x10-4 pC/(m/s²)x10-4 pC/(m/s²)x10-4 pC/(m/s²)x10-4 pC/(m/s²)x10-4 pC/(m/s²)x10-4 pC/(m/s²)x10-4
NRC
Table B4a: Matrix of equivalence for BB accelerometer at 160 Hz

93Figure B4a: Degrees of equivalence for BB accelerometer at 160 Hz
CCAUV.V-K1 Charge sensitivity, BB accelerometer, frequency: 160 HzDegrees of equivalence [ D i and its expanded uncertainty (k = 2), U i ]
-25
-20
-15
-10
-5
0
5
10
15
20
25
PTB BNM-CESTA
CSIRO-NML
CMI CSIR-NML
CENAM NRC KRISS NMIJ VNIIM NIST NMi-VSL
Di
/ pC
/ (m
/s2 )x
10-4
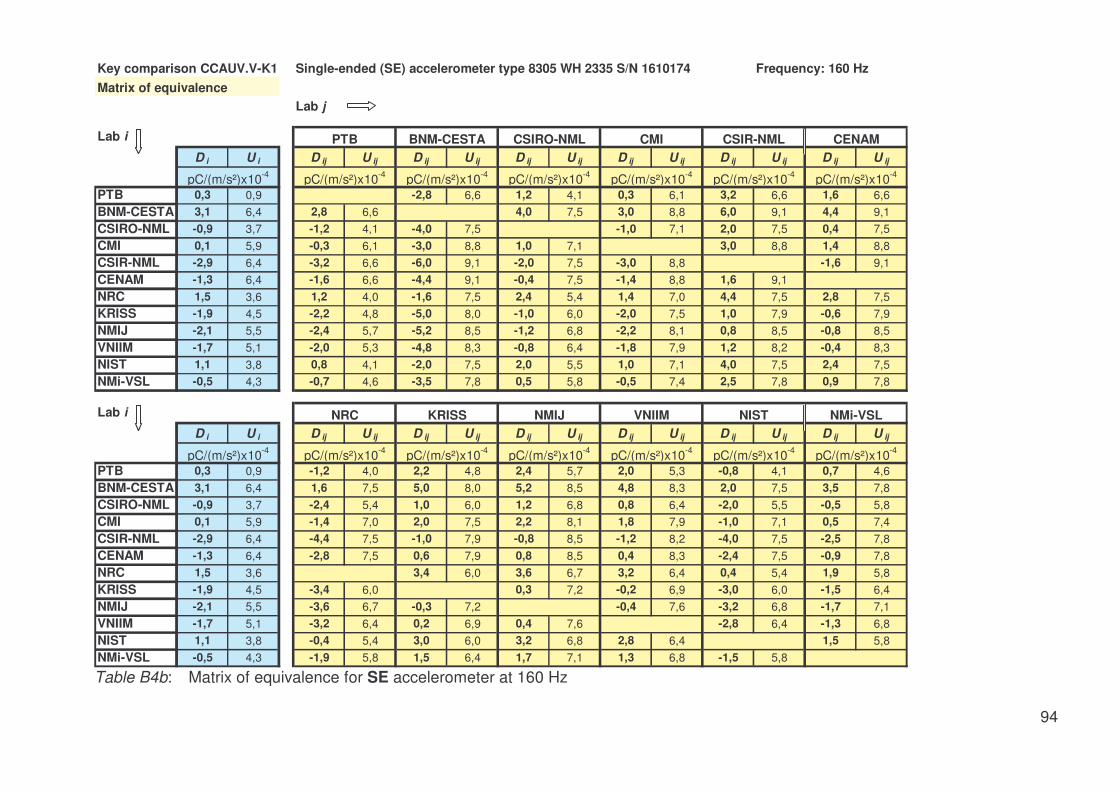
94
Key comparison CCAUV.V-K1 Single-ended (SE) accelerometer type 8305 WH 2335 S/N 1610174 Frequency: 160 Hz
Lab j
Lab i
D i U i D ij U ij D ij U ij D ij U ij D ij U ij D ij U ij D ij U ij
PTB 0,3 0,9 -2,8 6,6 1,2 4,1 0,3 6,1 3,2 6,6 1,6 6,6BNM-CESTA 3,1 6,4 2,8 6,6 4,0 7,5 3,0 8,8 6,0 9,1 4,4 9,1CSIRO-NML -0,9 3,7 -1,2 4,1 -4,0 7,5 -1,0 7,1 2,0 7,5 0,4 7,5CMI 0,1 5,9 -0,3 6,1 -3,0 8,8 1,0 7,1 3,0 8,8 1,4 8,8CSIR-NML -2,9 6,4 -3,2 6,6 -6,0 9,1 -2,0 7,5 -3,0 8,8 -1,6 9,1CENAM -1,3 6,4 -1,6 6,6 -4,4 9,1 -0,4 7,5 -1,4 8,8 1,6 9,1NRC 1,5 3,6 1,2 4,0 -1,6 7,5 2,4 5,4 1,4 7,0 4,4 7,5 2,8 7,5KRISS -1,9 4,5 -2,2 4,8 -5,0 8,0 -1,0 6,0 -2,0 7,5 1,0 7,9 -0,6 7,9NMIJ -2,1 5,5 -2,4 5,7 -5,2 8,5 -1,2 6,8 -2,2 8,1 0,8 8,5 -0,8 8,5VNIIM -1,7 5,1 -2,0 5,3 -4,8 8,3 -0,8 6,4 -1,8 7,9 1,2 8,2 -0,4 8,3NIST 1,1 3,8 0,8 4,1 -2,0 7,5 2,0 5,5 1,0 7,1 4,0 7,5 2,4 7,5NMi-VSL -0,5 4,3 -0,7 4,6 -3,5 7,8 0,5 5,8 -0,5 7,4 2,5 7,8 0,9 7,8
Lab i
D i U i D ij U ij D ij U ij D ij U ij D ij U ij D ij U ij D ij U ij
PTB 0,3 0,9 -1,2 4,0 2,2 4,8 2,4 5,7 2,0 5,3 -0,8 4,1 0,7 4,6BNM-CESTA 3,1 6,4 1,6 7,5 5,0 8,0 5,2 8,5 4,8 8,3 2,0 7,5 3,5 7,8CSIRO-NML -0,9 3,7 -2,4 5,4 1,0 6,0 1,2 6,8 0,8 6,4 -2,0 5,5 -0,5 5,8CMI 0,1 5,9 -1,4 7,0 2,0 7,5 2,2 8,1 1,8 7,9 -1,0 7,1 0,5 7,4CSIR-NML -2,9 6,4 -4,4 7,5 -1,0 7,9 -0,8 8,5 -1,2 8,2 -4,0 7,5 -2,5 7,8CENAM -1,3 6,4 -2,8 7,5 0,6 7,9 0,8 8,5 0,4 8,3 -2,4 7,5 -0,9 7,8NRC 1,5 3,6 3,4 6,0 3,6 6,7 3,2 6,4 0,4 5,4 1,9 5,8KRISS -1,9 4,5 -3,4 6,0 0,3 7,2 -0,2 6,9 -3,0 6,0 -1,5 6,4NMIJ -2,1 5,5 -3,6 6,7 -0,3 7,2 -0,4 7,6 -3,2 6,8 -1,7 7,1VNIIM -1,7 5,1 -3,2 6,4 0,2 6,9 0,4 7,6 -2,8 6,4 -1,3 6,8NIST 1,1 3,8 -0,4 5,4 3,0 6,0 3,2 6,8 2,8 6,4 1,5 5,8NMi-VSL -0,5 4,3 -1,9 5,8 1,5 6,4 1,7 7,1 1,3 6,8 -1,5 5,8
CENAM
pC/(m/s²)x10-4 pC/(m/s²)x10-4 pC/(m/s²)x10-4 pC/(m/s²)x10-4 pC/(m/s²)x10-4 pC/(m/s²)x10-4 pC/(m/s²)x10-4
PTB BNM-CESTA
KRISS NMIJ VNIIM
CSIR-NMLCSIRO-NML CMI
NIST
Matrix of equivalence
NMi-VSL
pC/(m/s²)x10-4 pC/(m/s²)x10-4 pC/(m/s²)x10-4 pC/(m/s²)x10-4 pC/(m/s²)x10-4 pC/(m/s²)x10-4 pC/(m/s²)x10-4
NRC
Table B4b: Matrix of equivalence for SE accelerometer at 160 Hz

95
Figure B4b: Degrees of equivalence for SE accelerometer at 160 Hz
CCAUV.V-K1 Charge sensitivity, SE accelerometer, frequency: 160 HzDegrees of equivalence [ D i and its expanded uncertainty (k = 2), U i]
-25
-20
-15
-10
-5
0
5
10
15
20
25
PTB BNM-CESTA
CSIRO-NML
CMI CSIR-NML
CENAM NRC KRISS NMIJ VNIIM NIST NMi-VSL
Di
/ pC
/ (m
/s2 )x
10-4

96
Key comparison CCAUV.V-K1 Back-to-back (BB) accelerometer type 8305 S/N 1483337 Frequency: 5 kHz
Lab j
Lab i
D i U i D ij U ij D ij U ij D ij U ij D ij U ij D ij U ij D ij U ij
PTB -0.3 1.7 -1.6 5.8 -0.2 8.2 1.4 9.4 0.3 10.7BNM-CESTACSIRO-NML 1.4 4.8 1.6 5.8 1.5 9.3 3.0 10.4 1.9 11.6CMI -0.2 7.5 0.2 8.2 -1.5 9.3 1.5 11.9 0.4 12.9CSIR-NML -1.6 8.8 -1.4 9.4 -3.0 10.4 -1.5 11.9 -1.1 13.7CENAM -0.6 10.2 -0.3 10.7 -1.9 11.6 -0.4 12.9 1.1 13.7NRC -0.7 13.8 -0.4 14.2 -2.0 14.9 -0.5 16.0 1.0 16.6 -0.1 17.4KRISS 0.9 5.2 1.2 6.1 -0.4 7.6 1.1 9.6 2.6 10.6 1.5 11.7NMIJ -0.6 17.0 -0.3 17.3 -1.9 17.8 -0.4 18.8 1.1 19.3 0.0 20.0VNIIM 13.8 9.1 14.0 9.3 12.4 10.3 13.9 11.8 15.4 12.7 14.3 13.6NIST -1.6 15.4 -1.4 15.7 -3.0 16.3 -1.5 17.3 0.0 17.9 -1.1 18.6NMi-VSL -0.8 48.8 -0.5 48.9 -2.1 49.1 -0.6 49.5 0.9 49.7 -0.3 50.0
Lab i
D i U i D ij U ij D ij U ij D ij U ij D ij U ij D ij U ij D ij U ij
PTB -0.3 1.7 0.4 14.2 -1.2 6.1 0.3 17.3 -14.0 9.3 1.4 15.7 0.5 48.9BNM-CESTACSIRO-NML 1.4 4.8 2.0 14.9 0.4 7.6 1.9 17.8 -12.4 10.3 3.0 16.3 2.1 49.1CMI -0.2 7.5 0.5 16.0 -1.1 9.6 0.4 18.8 -13.9 11.8 1.5 17.3 0.6 49.5CSIR-NML -1.6 8.8 -1.0 16.6 -2.6 10.6 -1.1 19.3 -15.4 12.7 0.0 17.9 -0.9 49.7CENAM -0.6 10.2 0.1 17.4 -1.5 11.7 0.0 20.0 -14.3 13.6 1.1 18.6 0.3 50.0NRC -0.7 13.8 -1.6 15.0 -0.1 22.0 -14.4 16.5 1.0 20.8 0.2 50.8KRISS 0.9 5.2 1.6 15.0 1.5 18.0 -12.8 10.5 2.6 16.5 1.7 49.2NMIJ -0.6 17.0 0.1 22.0 -1.5 18.0 -14.3 19.2 1.1 23.1 0.3 51.8VNIIM 13.8 9.1 14.4 16.5 12.8 10.5 14.3 19.2 15.4 17.9 14.5 49.7NIST -1.6 15.4 -1.0 20.8 -2.6 16.5 -1.1 23.1 -15.4 17.9 -0.9 51.3NMi-VSL -0.8 48.8 -0.2 50.8 -1.7 49.2 -0.3 51.8 -14.5 49.7 0.9 51.3
Matrix of equivalence
CSIRO-NML CMIPTB BNM-CESTA
pC/(m/s²)x10-4 pC/(m/s²)x10-4
No data (measure-ment at shifted frequency)
Laboratory result at this frequency excluded from calculation of the reference value
NMi-VSL
CSIR-NML CENAM
pC/(m/s²)x10-4
NRC KRISS NISTNMIJ VNIIM
pC/(m/s²)x10-4 pC/(m/s²)x10-4 pC/(m/s²)x10-4 pC/(m/s²)x10-4
pC/(m/s²)x10-4 pC/(m/s²)x10-4 pC/(m/s²)x10-4pC/(m/s²)x10-4 pC/(m/s²)x10-4 pC/(m/s²)x10-4 pC/(m/s²)x10-4
Table B5a: Matrix of equivalence for BB accelerometer at 5 kHz

97
Figure B5a: Degrees of equivalence for BB accelerometer at 5 kHz
CCAUV.V-K1 Charge sensitivity, BB accelerometer, frequency: 5 kHzDegrees of equivalence [ D i and its expanded uncertainty (k = 2), U i ]
-25
-20
-15
-10
-5
0
5
10
15
20
25
PTB BNM-CESTA
CSIRO-NML
CMI CSIR-NML
CENAM NRC KRISS NMIJ VNIIM NIST NMi-VSL
Di
/ pC
/ (m
/s2 )x
10-4

98
Appendix C: Matrix of equivalence between the laboratories(all 22 frequencies, 2 accelerometers)
Table C1a: Matrix of equivalence for BB accelerometer at 40 Hz
Key comparison CCAUV.V-K2 Back-to-back (BB) accelerometer type 8305 S/N 1483337
Lab j Frequency: 40 Hz
Lab i
D i U i D ij U ij D ij U ij D ij U ij D ij U ij D ij U ij D ij U ij
PTB 0,6 0,8 -0,6 6,5 -0,6 5,2 1,6 6,0 -8,5 11,5 2,4 6,4
BNM-CESTA 1,2 6,3 0,6 6,5 0,0 8,1 2,1 8,6 -8,0 13,1 2,9 8,9
CSIRO-NML 1,2 5,0 0,6 5,2 0,0 8,1 2,1 7,7 -8,0 12,5 2,9 8,1
CMI -0,9 5,7 -1,6 6,0 -2,1 8,6 -2,1 7,7 -10,1 12,9 0,8 8,6
CSIR-NML 9,2 11,4 8,5 11,5 8,0 13,1 8,0 12,5 10,1 12,9 10,9 13,1
CENAM -1,7 6,2 -2,4 6,4 -2,9 8,9 -2,9 8,1 -0,8 8,6 -10,9 13,1
NRC -1,1 3,7 -1,8 4,0 -2,3 7,4 -2,3 6,3 -0,2 7,0 -10,3 12,1 0,6 7,4
KRISS -1,1 4,5 -1,7 4,7 -2,3 7,8 -2,3 6,8 -0,2 7,4 -10,3 12,3 0,6 7,8
NMIJ -2,9 5,2 -3,6 5,5 -4,1 8,3 -4,1 7,3 -2,0 7,9 -12,1 12,6 -1,2 8,3
VNIIM -5,4 5,0 -6,1 5,2 -6,6 8,1 -6,6 7,1 -4,5 7,7 -14,6 12,5 -3,7 8,1
NIST 1,2 3,7 0,6 4,0 0,0 7,4 0,0 6,3 2,1 7,0 -8,0 12,1 2,9 7,4
NMi-VSL -0,9 3,1 -1,5 3,5 -2,0 7,1 -2,0 6,0 0,1 6,7 -10,0 11,9 0,9 7,1
Lab i
D i U i D ij U ij D ij U ij D ij U ij D ij U ij D ij U ij D ij U ij
PTB 0,6 0,8 1,8 4,0 1,7 4,7 3,6 5,5 6,1 5,2 -0,6 4,0 1,5 3,5
BNM-CESTA 1,2 6,3 2,3 7,4 2,3 7,8 4,1 8,3 6,6 8,1 0,0 7,4 2,0 7,1
CSIRO-NML 1,2 5,0 2,3 6,3 2,3 6,8 4,1 7,3 6,6 7,1 0,0 6,3 2,0 6,0
CMI -0,9 5,7 0,2 7,0 0,2 7,4 2,0 7,9 4,5 7,7 -2,1 7,0 -0,1 6,7
CSIR-NML 9,2 11,4 10,3 12,1 10,3 12,3 12,1 12,6 14,6 12,5 8,0 12,1 10,0 11,9
CENAM -1,7 6,2 -0,6 7,4 -0,6 7,8 1,2 8,3 3,7 8,1 -2,9 7,4 -0,9 7,1
NRC -1,1 3,7 -0,1 5,9 1,8 6,5 4,3 6,3 -2,3 5,4 -0,3 5,0
KRISS -1,1 4,5 0,1 5,9 1,8 7,0 4,3 6,8 -2,3 5,9 -0,3 5,6
NMIJ -2,9 5,2 -1,8 6,5 -1,8 7,0 2,5 7,3 -4,1 6,5 -2,1 6,2
VNIIM -5,4 5,0 -4,3 6,3 -4,3 6,8 -2,5 7,3 -6,6 6,3 -4,6 6,0
NIST 1,2 3,7 2,3 5,4 2,3 5,9 4,1 6,5 6,6 6,3 2,0 5,0
NMi-VSL -0,9 3,1 0,3 5,0 0,3 5,6 2,1 6,2 4,6 6,0 -2,0 5,0
pC/(m/s²)x10-4 pC/(m/s²)x10-4 pC/(m/s²)x10-4
Matrix of equivalence
pC/(m/s²)x10-4
pC/(m/s²)x10-4
pC/(m/s²)x10-4
NMIJ VNIIM
PTB
NIST
BNM-CESTA
NRC KRISS
CSIR-NML
pC/(m/s²)x10-4 pC/(m/s²)x10-4
pC/(m/s²)x10-4
CENAMCSIRO-NML CMI
pC/(m/s²)x10-4
pC/(m/s²)x10-4 pC/(m/s²)x10-4 pC/(m/s²)x10-4 pC/(m/s²)x10-4
NMi-VSL

99
Table C1b: Matrix of equivalence for SE accelerometer at 40 Hz
Key comparison CCAUV.V-K1 Single-ended (SE) accelerometer type 8305 WH 2335 S/N 1610174
Lab j Frequency 40 Hz
Lab i
D i U i D ij U ij D ij U ij D ij U ij D ij U ij D ij U ij D ij U ij
PTB 0,4 0,8 -0,8 6,6 -0,8 5,3 2,7 6,1 -5,8 9,2 0,9 6,6
BNM-CESTA 1,2 6,4 0,8 6,6 0,0 8,3 3,5 8,8 -5,0 11,1 1,7 9,1
CSIRO-NML 1,2 5,1 0,8 5,3 0,0 8,3 3,5 7,9 -5,0 10,4 1,7 8,3
CMI -2,3 5,8 -2,7 6,1 -3,5 8,8 -3,5 7,9 -8,5 10,8 -1,8 8,8
CSIR-NML 6,2 9,0 5,8 9,2 5,0 11,1 5,0 10,4 8,5 10,8 6,7 11,1
CENAM -0,6 6,4 -0,9 6,6 -1,7 9,1 -1,7 8,3 1,8 8,8 -6,7 11,1
NRC -2,2 3,8 -2,6 4,1 -3,4 7,5 -3,4 6,5 0,1 7,1 -8,4 9,9 -1,7 7,5
KRISS -2,6 4,5 -2,9 4,8 -3,8 7,9 -3,8 6,9 -0,3 7,5 -8,8 10,2 -2,1 7,9
NMIJ -4,5 5,3 -4,9 5,6 -5,7 8,4 -5,7 7,5 -2,2 8,0 -10,7 10,6 -4,0 8,4
VNIIM -6,6 5,0 -7,0 5,3 -7,8 8,2 -7,8 7,3 -4,3 7,8 -12,8 10,4 -6,1 8,2
NIST 6,2 3,8 5,8 4,1 5,0 7,5 5,0 6,5 8,5 7,1 0,0 9,9 6,7 7,5
NMi-VSL 0,7 11,8 0,3 11,9 -0,5 13,5 -0,5 12,9 3,0 13,3 -5,5 14,9 1,2 13,5
Lab i
D i U i D ij U ij D ij U ij D ij U ij D ij U ij D ij U ij D ij U ij
PTB 0,4 0,8 2,6 4,1 2,9 4,8 4,9 5,6 7,0 5,3 -5,8 4,1 -0,3 11,9
BNM-CESTA 1,2 6,4 3,4 7,5 3,8 7,9 5,7 8,4 7,8 8,2 -5,0 7,5 0,5 13,5
CSIRO-NML 1,2 5,1 3,4 6,5 3,8 6,9 5,7 7,5 7,8 7,3 -5,0 6,5 0,5 12,9
CMI -2,3 5,8 -0,1 7,1 0,3 7,5 2,2 8,0 4,3 7,8 -8,5 7,1 -3,0 13,3
CSIR-NML 6,2 9,0 8,4 9,9 8,8 10,2 10,7 10,6 12,8 10,4 0,0 9,9 5,5 14,9
CENAM -0,6 6,4 1,7 7,5 2,1 7,9 4,0 8,4 6,1 8,2 -6,7 7,5 -1,2 13,5
NRC -2,2 3,8 0,4 6,0 2,3 6,7 4,4 6,4 -8,4 5,5 -2,9 12,5
KRISS -2,6 4,5 -0,4 6,0 1,9 7,1 4,0 6,9 -8,8 6,0 -3,3 12,7
NMIJ -4,5 5,3 -2,3 6,7 -1,9 7,1 2,1 7,4 -10,7 6,7 -5,2 13,0
VNIIM -6,6 5,0 -4,4 6,4 -4,0 6,9 -2,1 7,4 -12,8 6,4 -7,3 12,9
NIST 6,2 3,8 8,4 5,5 8,8 6,0 10,7 6,7 12,8 6,4 5,5 12,5
NMi-VSL 0,7 11,8 2,9 12,5 3,3 12,7 5,2 13,0 7,3 12,9 -5,5 12,5
NIST
pC/(m/s²)x10-4 pC/(m/s²)x10-4
NRC KRISS
pC/(m/s²)x10-4
CSIR-NML CENAMCSIRO-NML CMIPTB BNM-CESTA
pC/(m/s²)x10-4
Matrix of equivalence
pC/(m/s²)x10-4
pC/(m/s²)x10-4
NMIJ
pC/(m/s²)x10-4
pC/(m/s²)x10-4 pC/(m/s²)x10-4 pC/(m/s²)x10-4 pC/(m/s²)x10-4 pC/(m/s²)x10-4 pC/(m/s²)x10-4
pC/(m/s²)x10-4
NMi-VSLVNIIM
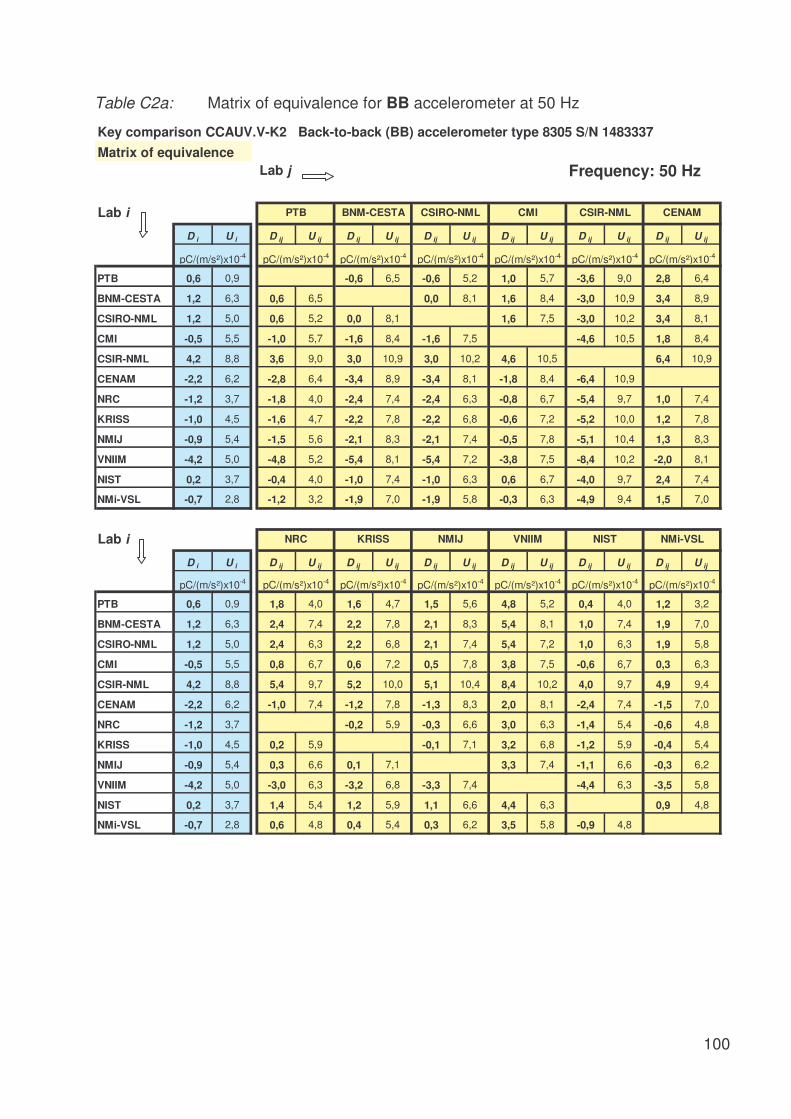
100
Table C2a: Matrix of equivalence for BB accelerometer at 50 Hz
Key comparison CCAUV.V-K2 Back-to-back (BB) accelerometer type 8305 S/N 1483337
Lab j Frequency: 50 Hz
Lab i
D i U i D ij U ij D ij U ij D ij U ij D ij U ij D ij U ij D ij U ij
PTB 0,6 0,9 -0,6 6,5 -0,6 5,2 1,0 5,7 -3,6 9,0 2,8 6,4
BNM-CESTA 1,2 6,3 0,6 6,5 0,0 8,1 1,6 8,4 -3,0 10,9 3,4 8,9
CSIRO-NML 1,2 5,0 0,6 5,2 0,0 8,1 1,6 7,5 -3,0 10,2 3,4 8,1
CMI -0,5 5,5 -1,0 5,7 -1,6 8,4 -1,6 7,5 -4,6 10,5 1,8 8,4
CSIR-NML 4,2 8,8 3,6 9,0 3,0 10,9 3,0 10,2 4,6 10,5 6,4 10,9
CENAM -2,2 6,2 -2,8 6,4 -3,4 8,9 -3,4 8,1 -1,8 8,4 -6,4 10,9
NRC -1,2 3,7 -1,8 4,0 -2,4 7,4 -2,4 6,3 -0,8 6,7 -5,4 9,7 1,0 7,4
KRISS -1,0 4,5 -1,6 4,7 -2,2 7,8 -2,2 6,8 -0,6 7,2 -5,2 10,0 1,2 7,8
NMIJ -0,9 5,4 -1,5 5,6 -2,1 8,3 -2,1 7,4 -0,5 7,8 -5,1 10,4 1,3 8,3
VNIIM -4,2 5,0 -4,8 5,2 -5,4 8,1 -5,4 7,2 -3,8 7,5 -8,4 10,2 -2,0 8,1
NIST 0,2 3,7 -0,4 4,0 -1,0 7,4 -1,0 6,3 0,6 6,7 -4,0 9,7 2,4 7,4
NMi-VSL -0,7 2,8 -1,2 3,2 -1,9 7,0 -1,9 5,8 -0,3 6,3 -4,9 9,4 1,5 7,0
Lab i
D i U i D ij U ij D ij U ij D ij U ij D ij U ij D ij U ij D ij U ij
PTB 0,6 0,9 1,8 4,0 1,6 4,7 1,5 5,6 4,8 5,2 0,4 4,0 1,2 3,2
BNM-CESTA 1,2 6,3 2,4 7,4 2,2 7,8 2,1 8,3 5,4 8,1 1,0 7,4 1,9 7,0
CSIRO-NML 1,2 5,0 2,4 6,3 2,2 6,8 2,1 7,4 5,4 7,2 1,0 6,3 1,9 5,8
CMI -0,5 5,5 0,8 6,7 0,6 7,2 0,5 7,8 3,8 7,5 -0,6 6,7 0,3 6,3
CSIR-NML 4,2 8,8 5,4 9,7 5,2 10,0 5,1 10,4 8,4 10,2 4,0 9,7 4,9 9,4
CENAM -2,2 6,2 -1,0 7,4 -1,2 7,8 -1,3 8,3 2,0 8,1 -2,4 7,4 -1,5 7,0
NRC -1,2 3,7 -0,2 5,9 -0,3 6,6 3,0 6,3 -1,4 5,4 -0,6 4,8
KRISS -1,0 4,5 0,2 5,9 -0,1 7,1 3,2 6,8 -1,2 5,9 -0,4 5,4
NMIJ -0,9 5,4 0,3 6,6 0,1 7,1 3,3 7,4 -1,1 6,6 -0,3 6,2
VNIIM -4,2 5,0 -3,0 6,3 -3,2 6,8 -3,3 7,4 -4,4 6,3 -3,5 5,8
NIST 0,2 3,7 1,4 5,4 1,2 5,9 1,1 6,6 4,4 6,3 0,9 4,8
NMi-VSL -0,7 2,8 0,6 4,8 0,4 5,4 0,3 6,2 3,5 5,8 -0,9 4,8
pC/(m/s²)x10-4
pC/(m/s²)x10-4 pC/(m/s²)x10-4 pC/(m/s²)x10-4 pC/(m/s²)x10-4 pC/(m/s²)x10-4 pC/(m/s²)x10-4
pC/(m/s²)x10-4
NMi-VSLVNIIM
PTB BNM-CESTA
pC/(m/s²)x10-4
Matrix of equivalence
pC/(m/s²)x10-4
pC/(m/s²)x10-4
NMIJ
CSIR-NML CENAMCSIRO-NML CMI
NIST
pC/(m/s²)x10-4 pC/(m/s²)x10-4
NRC KRISS
pC/(m/s²)x10-4

101
Table C2b: Matrix of equivalence for SE accelerometer at 50 Hz
Key comparison CCAUV.V-K1 Single-ended (SE) accelerometer type 8305 WH 2335 S/N 1610174
Lab j Frequency 50 Hz
Lab i
D i U i D ij U ij D ij U ij D ij U ij D ij U ij D ij U ij D ij U ij
PTB 0,4 0,8 -1,9 6,6 -0,9 5,3 2,1 6,1 0,1 9,1 0,8 6,6
BNM-CESTA 2,3 6,4 1,9 6,6 1,0 8,3 4,0 8,8 2,0 11,1 2,7 9,1
CSIRO-NML 1,3 5,1 0,9 5,3 -1,0 8,3 3,0 7,9 1,0 10,4 1,7 8,3
CMI -1,7 5,8 -2,1 6,1 -4,0 8,8 -3,0 7,9 -2,0 10,8 -1,3 8,8
CSIR-NML 0,3 9,0 -0,1 9,1 -2,0 11,1 -1,0 10,4 2,0 10,8 0,7 11,1
CENAM -0,4 6,4 -0,8 6,6 -2,7 9,1 -1,7 8,3 1,3 8,8 -0,7 11,1
NRC -2,0 3,7 -2,4 4,1 -4,3 7,5 -3,3 6,5 -0,3 7,1 -2,3 9,8 -1,6 7,5
KRISS -2,4 4,5 -2,8 4,8 -4,7 8,0 -3,7 6,9 -0,7 7,5 -2,7 10,1 -2,0 7,9
NMIJ -3,1 5,3 -3,5 5,6 -5,4 8,4 -4,4 7,5 -1,4 8,0 -3,4 10,5 -2,7 8,4
VNIIM -4,5 5,0 -4,9 5,3 -6,8 8,3 -5,8 7,3 -2,8 7,8 -4,8 10,4 -4,1 8,2
NIST 3,3 3,7 2,9 4,1 1,0 7,5 2,0 6,5 5,0 7,1 3,0 9,8 3,7 7,5
NMi-VSL 0,1 7,4 -0,4 7,6 -2,2 9,9 -1,2 9,1 1,8 9,5 -0,3 11,7 0,5 9,9
Lab i
D i U i D ij U ij D ij U ij D ij U ij D ij U ij D ij U ij D ij U ij
PTB 0,4 0,8 2,4 4,1 2,8 4,8 3,5 5,6 4,9 5,3 -2,9 4,1 0,4 7,6
BNM-CESTA 2,3 6,4 4,3 7,5 4,7 8,0 5,4 8,4 6,8 8,3 -1,0 7,5 2,2 9,9
CSIRO-NML 1,3 5,1 3,3 6,5 3,7 6,9 4,4 7,5 5,8 7,3 -2,0 6,5 1,2 9,1
CMI -1,7 5,8 0,3 7,1 0,7 7,5 1,4 8,0 2,8 7,8 -5,0 7,1 -1,8 9,5
CSIR-NML 0,3 9,0 2,3 9,8 2,7 10,1 3,4 10,5 4,8 10,4 -3,0 9,8 0,3 11,7
CENAM -0,4 6,4 1,6 7,5 2,0 7,9 2,7 8,4 4,1 8,2 -3,7 7,5 -0,5 9,9
NRC -2,0 3,7 0,4 6,0 1,1 6,7 2,5 6,4 -5,3 5,5 -2,1 8,4
KRISS -2,4 4,5 -0,4 6,0 0,7 7,1 2,1 6,9 -5,7 6,0 -2,5 8,8
NMIJ -3,1 5,3 -1,1 6,7 -0,7 7,1 1,4 7,5 -6,4 6,7 -3,2 9,2
VNIIM -4,5 5,0 -2,5 6,4 -2,1 6,9 -1,4 7,5 -7,8 6,4 -4,6 9,1
NIST 3,3 3,7 5,3 5,5 5,7 6,0 6,4 6,7 7,8 6,4 3,2 8,4
NMi-VSL 0,1 7,4 2,1 8,4 2,5 8,8 3,2 9,2 4,6 9,1 -3,2 8,4
NIST
pC/(m/s²)x10-4 pC/(m/s²)x10-4
NRC KRISS
pC/(m/s²)x10-4
CSIR-NML CENAMCSIRO-NML CMIPTB BNM-CESTA
pC/(m/s²)x10-4
Matrix of equivalence
pC/(m/s²)x10-4
pC/(m/s²)x10-4
NMIJ
pC/(m/s²)x10-4
pC/(m/s²)x10-4 pC/(m/s²)x10-4 pC/(m/s²)x10-4 pC/(m/s²)x10-4 pC/(m/s²)x10-4 pC/(m/s²)x10-4
pC/(m/s²)x10-4
NMi-VSLVNIIM

102
Table C3a: Matrix of equivalence for BB accelerometer at 63 Hz
Key comparison CCAUV.V-K2 Back-to-back (BB) accelerometer type 8305 S/N 1483337
Lab j Frequency 63 Hz
Lab i
D i U i D ij U ij D ij U ij D ij U ij D ij U ij D ij U ij D ij U ij
PTB 0,7 0,9 -0,8 6,5 0,2 4,0 0,4 6,0 4,2 8,9 1,4 6,4
BNM-CESTA 1,6 6,3 0,8 6,5 1,0 7,4 1,2 8,6 5,0 10,9 2,2 9,0
CSIRO-NML 0,6 3,7 -0,2 4,0 -1,0 7,4 0,2 7,0 4,0 9,6 1,2 7,4
CMI 0,4 5,8 -0,4 6,0 -1,2 8,6 -0,2 7,0 3,8 10,6 1,0 8,6
CSIR-NML -3,4 8,8 -4,2 8,9 -5,0 10,9 -4,0 9,6 -3,8 10,6 -2,8 10,9
CENAM -0,7 6,3 -1,4 6,4 -2,2 9,0 -1,2 7,4 -1,0 8,6 2,8 10,9
NRC -1,3 3,7 -2,1 4,0 -2,9 7,4 -1,9 5,4 -1,7 6,9 2,1 9,6 -0,7 7,4
KRISS -0,9 4,5 -1,6 4,7 -2,4 7,8 -1,4 5,9 -1,2 7,4 2,6 9,9 -0,3 7,8
NMIJ 0,1 5,6 -0,7 5,8 -1,5 8,5 -0,5 6,8 -0,3 8,1 3,5 10,5 0,7 8,5
VNIIM -4,4 5,0 -5,2 5,2 -6,0 8,1 -5,0 6,3 -4,8 7,7 -1,0 10,2 -3,8 8,1
NIST 0,6 3,4 -0,2 3,8 -1,0 7,3 0,0 5,2 0,2 6,8 4,0 9,5 1,2 7,2
NMi-VSL -1,5 2,5 -2,3 2,9 -3,1 6,9 -2,1 4,6 -1,9 6,4 1,9 9,2 -0,9 6,9
Lab i
D i U i D ij U ij D ij U ij D ij U ij D ij U ij D ij U ij D ij U ij
PTB 0,7 0,9 2,1 4,0 1,6 4,7 0,7 5,8 5,2 5,2 0,2 3,8 2,3 2,9
BNM-CESTA 1,6 6,3 2,9 7,4 2,4 7,8 1,5 8,5 6,0 8,1 1,0 7,3 3,1 6,9
CSIRO-NML 0,6 3,7 1,9 5,4 1,4 5,9 0,5 6,8 5,0 6,3 0,0 5,2 2,1 4,6
CMI 0,4 5,8 1,7 6,9 1,2 7,4 0,3 8,1 4,8 7,7 -0,2 6,8 1,9 6,4
CSIR-NML -3,4 8,8 -2,1 9,6 -2,6 9,9 -3,5 10,5 1,0 10,2 -4,0 9,5 -1,9 9,2
CENAM -0,7 6,3 0,7 7,4 0,3 7,8 -0,7 8,5 3,8 8,1 -1,2 7,2 0,9 6,9
NRC -1,3 3,7 -0,5 5,9 -1,4 6,8 3,1 6,3 -1,9 5,2 0,2 4,6
KRISS -0,9 4,5 0,5 5,9 -0,9 7,3 3,6 6,8 -1,4 5,8 0,7 5,3
NMIJ 0,1 5,6 1,4 6,8 0,9 7,3 4,5 7,6 -0,5 6,7 1,6 6,3
VNIIM -4,4 5,0 -3,1 6,3 -3,6 6,8 -4,5 7,6 -5,0 6,2 -2,9 5,7
NIST 0,6 3,4 1,9 5,2 1,4 5,8 0,5 6,7 5,0 6,2 2,1 4,4
NMi-VSL -1,5 2,5 -0,2 4,6 -0,7 5,3 -1,6 6,3 2,9 5,7 -2,1 4,4
Matrix of equivalence
pC/(m/s²)x10-4
NMIJ VNIIM
PTB BNM-CESTA
pC/(m/s²)x10-4
NIST
pC/(m/s²)x10-4 pC/(m/s²)x10-4
NRC KRISS
pC/(m/s²)x10-4
CSIR-NML CENAMCSIRO-NML CMI
pC/(m/s²)x10-4
pC/(m/s²)x10-4 pC/(m/s²)x10-4 pC/(m/s²)x10-4 pC/(m/s²)x10-4 pC/(m/s²)x10-4 pC/(m/s²)x10-4
pC/(m/s²)x10-4 pC/(m/s²)x10-4
NMi-VSL

103
Table C3b: Matrix of equivalence for SE accelerometer at 63 Hz
Key comparison CCAUV.V-K1 Single-ended (SE) accelerometer type 8305 WH 2335 S/N 1610174
Lab j Frequency 63 Hz
Lab i
D i U i D ij U ij D ij U ij D ij U ij D ij U ij D ij U ij D ij U ij
PTB 0,6 0,9 -0,8 6,6 0,3 4,1 2,1 6,1 1,2 9,1 0,5 6,6
BNM-CESTA 1,4 6,4 0,8 6,6 1,0 7,5 2,9 8,8 2,0 11,1 1,2 9,1
CSIRO-NML 0,4 3,7 -0,3 4,1 -1,0 7,5 1,9 7,1 1,0 9,8 0,2 7,5
CMI -1,5 5,8 -2,1 6,1 -2,9 8,8 -1,9 7,1 -0,9 10,8 -1,7 8,8
CSIR-NML -0,6 9,0 -1,2 9,1 -2,0 11,1 -1,0 9,8 0,9 10,8 -0,8 11,1
CENAM 0,2 6,4 -0,5 6,6 -1,2 9,1 -0,2 7,5 1,7 8,8 0,8 11,1
NRC -2,4 3,7 -3,0 4,1 -3,8 7,5 -2,8 5,5 -0,9 7,1 -1,8 9,8 -2,6 7,5
KRISS -2,4 4,5 -3,0 4,8 -3,7 7,9 -2,7 6,0 -0,9 7,5 -1,7 10,1 -2,6 7,9
NMIJ -1,9 5,6 -2,5 5,8 -3,3 8,6 -2,3 6,9 -0,4 8,2 -1,3 10,7 -2,1 8,6
VNIIM -1,6 5,1 -2,2 5,3 -3,0 8,3 -2,0 6,4 -0,1 7,9 -1,0 10,4 -1,8 8,3
NIST 1,4 3,5 0,8 3,8 0,0 7,4 1,0 5,3 2,9 6,9 2,0 9,7 1,2 7,4
NMi-VSL -1,5 3,9 -2,1 4,2 -2,9 7,6 -1,9 5,6 -0,1 7,1 -0,9 9,9 -1,7 7,6
Lab i
D i U i D ij U ij D ij U ij D ij U ij D ij U ij D ij U ij D ij U ij
PTB 0,6 0,9 3,0 4,1 3,0 4,8 2,5 5,8 2,2 5,3 -0,8 3,8 2,1 4,2
BNM-CESTA 1,4 6,4 3,8 7,5 3,7 7,9 3,3 8,6 3,0 8,3 0,0 7,4 2,9 7,6
CSIRO-NML 0,4 3,7 2,8 5,5 2,7 6,0 2,3 6,9 2,0 6,4 -1,0 5,3 1,9 5,6
CMI -1,5 5,8 0,9 7,1 0,9 7,5 0,4 8,2 0,1 7,9 -2,9 6,9 0,1 7,1
CSIR-NML -0,6 9,0 1,8 9,8 1,7 10,1 1,3 10,7 1,0 10,4 -2,0 9,7 0,9 9,9
CENAM 0,2 6,4 2,6 7,5 2,6 7,9 2,1 8,6 1,8 8,3 -1,2 7,4 1,7 7,6
NRC -2,4 3,7 -0,1 6,0 -0,5 6,9 -0,8 6,4 -3,8 5,3 -0,9 5,6
KRISS -2,4 4,5 0,1 6,0 -0,5 7,3 -0,8 6,9 -3,7 5,9 -0,8 6,1
NMIJ -1,9 5,6 0,5 6,9 0,5 7,3 -0,3 7,7 -3,3 6,7 -0,4 6,9
VNIIM -1,6 5,1 0,8 6,4 0,8 6,9 0,3 7,7 -3,0 6,3 -0,1 6,5
NIST 1,4 3,5 3,8 5,3 3,7 5,9 3,3 6,7 3,0 6,3 2,9 5,4
NMi-VSL -1,5 3,9 0,9 5,6 0,8 6,1 0,4 6,9 0,1 6,5 -2,9 5,4
NIST
pC/(m/s²)x10-4 pC/(m/s²)x10-4
NRC KRISS
pC/(m/s²)x10-4
CSIR-NML CENAMCSIRO-NML CMIPTB BNM-CESTA
pC/(m/s²)x10-4
Matrix of equivalence
pC/(m/s²)x10-4
pC/(m/s²)x10-4
NMIJ
pC/(m/s²)x10-4
pC/(m/s²)x10-4 pC/(m/s²)x10-4 pC/(m/s²)x10-4 pC/(m/s²)x10-4 pC/(m/s²)x10-4 pC/(m/s²)x10-4
pC/(m/s²)x10-4
NMi-VSLVNIIM

104
Table C4a: Matrix of equivalence for BB accelerometer at 80 Hz
Key comparison CCAUV.V-K2 Back-to-back (BB) accelerometer type 8305 S/N 1483337
Lab j Frequency 80 Hz
Lab i
D i U i D ij U ij D ij U ij D ij U ij D ij U ij D ij U ij D ij U ij
PTB 0,4 0,9 -1,8 6,5 0,2 4,0 0,2 5,7 5,2 8,9 1,5 6,4
BNM-CESTA 2,2 6,3 1,8 6,5 2,0 7,4 2,0 8,4 7,0 10,9 3,3 9,0
CSIRO-NML 0,3 3,7 -0,2 4,0 -2,0 7,4 0,0 6,7 5,0 9,6 1,3 7,4
CMI 0,3 5,5 -0,2 5,7 -2,0 8,4 0,0 6,7 5,0 10,4 1,3 8,4
CSIR-NML -4,8 8,8 -5,2 8,9 -7,0 10,9 -5,0 9,6 -5,0 10,4 -3,7 10,9
CENAM -1,1 6,3 -1,5 6,4 -3,3 9,0 -1,3 7,4 -1,3 8,4 3,7 10,9
NRC 3,9 3,6 3,5 3,9 1,7 7,3 3,7 5,3 3,7 6,7 8,7 9,6 5,0 7,3
KRISS -1,0 4,5 -1,4 4,7 -3,3 7,8 -1,3 5,9 -1,3 7,2 3,7 9,9 0,1 7,8
NMIJ -0,2 6,0 -0,6 6,2 -2,4 8,8 -0,4 7,2 -0,4 8,2 4,6 10,7 0,9 8,8
VNIIM -4,6 5,0 -5,0 5,2 -6,8 8,1 -4,8 6,3 -4,8 7,5 0,2 10,2 -3,5 8,1
NIST -0,8 3,7 -1,2 4,0 -3,0 7,4 -1,0 5,4 -1,0 6,7 4,0 9,6 0,3 7,4
NMi-VSL -1,7 2,5 -2,1 2,9 -3,9 6,9 -1,9 4,6 -1,9 6,2 3,1 9,2 -0,6 6,9
Lab i
D i U i D ij U ij D ij U ij D ij U ij D ij U ij D ij U ij D ij U ij
PTB 0,4 0,9 -3,5 3,9 1,4 4,7 0,6 6,2 5,0 5,2 1,2 4,0 2,1 2,9
BNM-CESTA 2,2 6,3 -1,7 7,3 3,3 7,8 2,4 8,8 6,8 8,1 3,0 7,4 3,9 6,9
CSIRO-NML 0,3 3,7 -3,7 5,3 1,3 5,9 0,4 7,2 4,8 6,3 1,0 5,4 1,9 4,6
CMI 0,3 5,5 -3,7 6,7 1,3 7,2 0,4 8,2 4,8 7,5 1,0 6,7 1,9 6,2
CSIR-NML -4,8 8,8 -8,7 9,6 -3,7 9,9 -4,6 10,7 -0,2 10,2 -4,0 9,6 -3,1 9,2
CENAM -1,1 6,3 -5,0 7,3 -0,1 7,8 -0,9 8,8 3,5 8,1 -0,3 7,4 0,6 6,9
NRC 3,9 3,6 5,0 5,9 4,1 7,1 8,5 6,3 4,7 5,3 5,6 4,5
KRISS -1,0 4,5 -5,0 5,9 -0,9 7,6 3,5 6,8 -0,3 5,9 0,7 5,3
NMIJ -0,2 6,0 -4,1 7,1 0,9 7,6 4,4 7,9 0,6 7,2 1,5 6,6
VNIIM -4,6 5,0 -8,5 6,3 -3,5 6,8 -4,4 7,9 -3,8 6,3 -2,9 5,7
NIST -0,8 3,7 -4,7 5,3 0,3 5,9 -0,6 7,2 3,8 6,3 0,9 4,6
NMi-VSL -1,7 2,5 -5,6 4,5 -0,7 5,3 -1,5 6,6 2,9 5,7 -0,9 4,6
pC/(m/s²)x10-4
pC/(m/s²)x10-4 pC/(m/s²)x10-4 pC/(m/s²)x10-4 pC/(m/s²)x10-4 pC/(m/s²)x10-4 pC/(m/s²)x10-4
pC/(m/s²)x10-4 pC/(m/s²)x10-4
NMi-VSL
CSIR-NML CENAMCSIRO-NML CMI
NIST
pC/(m/s²)x10-4 pC/(m/s²)x10-4
NRC KRISS
pC/(m/s²)x10-4
Matrix of equivalence
pC/(m/s²)x10-4
NMIJ VNIIM
PTB BNM-CESTA
pC/(m/s²)x10-4

105
Table C4b: Matrix of equivalence for SE accelerometer at 80 Hz
Key comparison CCAUV.V-K1 Single-ended (SE) accelerometer type 8305 WH 2335 S/N 1610174
Lab j Frequency 80 Hz
Lab i
D i U i D ij U ij D ij U ij D ij U ij D ij U ij D ij U ij D ij U ij
PTB 0,4 0,9 -2,9 6,6 1,1 4,1 1,6 6,1 -1,9 9,1 0,7 6,6
BNM-CESTA 3,2 6,4 2,9 6,6 4,0 7,5 4,5 8,8 1,0 11,1 3,5 9,1
CSIRO-NML -0,8 3,7 -1,1 4,1 -4,0 7,5 0,5 7,1 -3,0 9,8 -0,5 7,5
CMI -1,3 5,9 -1,6 6,1 -4,5 8,8 -0,5 7,1 -3,5 10,8 -1,0 8,8
CSIR-NML 2,2 9,0 1,9 9,1 -1,0 11,1 3,0 9,8 3,5 10,8 2,5 11,1
CENAM -0,3 6,4 -0,7 6,6 -3,5 9,1 0,5 7,5 1,0 8,8 -2,5 11,1
NRC 3,9 3,6 3,6 4,0 0,7 7,5 4,7 5,4 5,2 7,0 1,7 9,8 4,2 7,5
KRISS -2,5 4,5 -2,8 4,8 -5,7 8,0 -1,7 6,0 -1,2 7,5 -4,7 10,2 -2,2 7,9
NMIJ -2,0 6,1 -2,3 6,3 -5,2 8,9 -1,2 7,3 -0,7 8,6 -4,2 11,0 -1,7 8,9
VNIIM -4,0 5,1 -4,3 5,3 -7,2 8,3 -3,2 6,4 -2,7 7,8 -6,2 10,4 -3,7 8,2
NIST 0,2 3,8 -0,2 4,1 -3,0 7,5 1,0 5,5 1,5 7,1 -2,0 9,8 0,5 7,5
NMi-VSL -1,7 2,9 -2,1 3,3 -4,9 7,2 -0,9 5,0 -0,5 6,7 -3,9 9,6 -1,4 7,2
Lab i
D i U i D ij U ij D ij U ij D ij U ij D ij U ij D ij U ij D ij U ij
PTB 0,4 0,9 -3,6 4,0 2,8 4,8 2,3 6,3 4,3 5,3 0,2 4,1 2,1 3,3
BNM-CESTA 3,2 6,4 -0,7 7,5 5,7 8,0 5,2 8,9 7,2 8,3 3,0 7,5 4,9 7,2
CSIRO-NML -0,8 3,7 -4,7 5,4 1,7 6,0 1,2 7,3 3,2 6,4 -1,0 5,5 0,9 5,0
CMI -1,3 5,9 -5,2 7,0 1,2 7,5 0,7 8,6 2,7 7,8 -1,5 7,1 0,5 6,7
CSIR-NML 2,2 9,0 -1,7 9,8 4,7 10,2 4,2 11,0 6,2 10,4 2,0 9,8 3,9 9,6
CENAM -0,3 6,4 -4,2 7,5 2,2 7,9 1,7 8,9 3,7 8,2 -0,5 7,5 1,4 7,2
NRC 3,9 3,6 6,4 6,0 5,9 7,2 7,9 6,4 3,7 5,4 5,6 4,9
KRISS -2,5 4,5 -6,4 6,0 -0,5 7,7 1,5 6,9 -2,7 6,0 -0,8 5,6
NMIJ -2,0 6,1 -5,9 7,2 0,5 7,7 2,0 8,0 -2,2 7,3 -0,3 6,9
VNIIM -4,0 5,1 -7,9 6,4 -1,5 6,9 -2,0 8,0 -4,2 6,4 -2,3 6,0
NIST 0,2 3,8 -3,7 5,4 2,7 6,0 2,2 7,3 4,2 6,4 1,9 5,0
NMi-VSL -1,7 2,9 -5,6 4,9 0,8 5,6 0,3 6,9 2,3 6,0 -1,9 5,0
NIST
pC/(m/s²)x10-4 pC/(m/s²)x10-4
NRC KRISS
pC/(m/s²)x10-4
CSIR-NML CENAMCSIRO-NML CMIPTB BNM-CESTA
pC/(m/s²)x10-4
Matrix of equivalence
pC/(m/s²)x10-4
pC/(m/s²)x10-4
NMIJ
pC/(m/s²)x10-4
pC/(m/s²)x10-4 pC/(m/s²)x10-4 pC/(m/s²)x10-4 pC/(m/s²)x10-4 pC/(m/s²)x10-4 pC/(m/s²)x10-4
pC/(m/s²)x10-4
NMi-VSLVNIIM

106
Table C5a: Matrix of equivalence for BB accelerometer at 100 Hz
Key comparison CCAUV.V-K2 Back-to-back (BB) accelerometer type 8305 S/N 1483337
Lab j Frequency 100 Hz
Lab i
D i U i D ij U ij D ij U ij D ij U ij D ij U ij D ij U ij D ij U ij
PTB 0,4 0,9 -1,8 6,5 0,2 4,0 0,1 6,0 2,2 7,7 1,7 6,4
BNM-CESTA 2,2 6,3 1,8 6,5 2,0 7,4 1,9 8,6 4,0 9,9 3,5 9,0
CSIRO-NML 0,3 3,7 -0,2 4,0 -2,0 7,4 -0,1 7,0 2,0 8,5 1,5 7,4
CMI 0,3 5,8 -0,1 6,0 -1,9 8,6 0,1 7,0 2,1 9,6 1,6 8,6
CSIR-NML -1,8 7,5 -2,2 7,7 -4,0 9,9 -2,0 8,5 -2,1 9,6 -0,5 9,9
CENAM -1,3 6,3 -1,7 6,4 -3,5 9,0 -1,5 7,4 -1,6 8,6 0,5 9,9
NRC 0,8 3,6 0,4 3,9 -1,4 7,3 0,6 5,3 0,5 6,9 2,6 8,4 2,1 7,3
KRISS -1,4 4,5 -1,8 4,7 -3,6 7,8 -1,6 5,9 -1,7 7,4 0,4 8,8 -0,1 7,8
NMIJ 0,1 5,9 -0,4 6,1 -2,2 8,7 -0,2 7,1 -0,3 8,3 1,8 9,6 1,3 8,7
VNIIM -4,8 5,0 -5,2 5,2 -7,0 8,1 -5,0 6,3 -5,1 7,7 -3,0 9,1 -3,5 8,1
NIST 1,2 3,4 0,8 3,8 -1,0 7,3 1,0 5,2 0,9 6,8 3,0 8,4 2,5 7,2
NMi-VSL -1,3 2,5 -1,7 2,9 -3,5 6,9 -1,5 4,6 -1,6 6,4 0,6 8,0 0,1 6,9
Lab i
D i U i D ij U ij D ij U ij D ij U ij D ij U ij D ij U ij D ij U ij
PTB 0,4 0,9 -0,4 3,9 1,8 4,7 0,4 6,1 5,2 5,2 -0,8 3,8 1,7 2,9
BNM-CESTA 2,2 6,3 1,4 7,3 3,6 7,8 2,2 8,7 7,0 8,1 1,0 7,3 3,5 6,9
CSIRO-NML 0,3 3,7 -0,6 5,3 1,6 5,9 0,2 7,1 5,0 6,3 -1,0 5,2 1,5 4,6
CMI 0,3 5,8 -0,5 6,9 1,7 7,4 0,3 8,3 5,1 7,7 -0,9 6,8 1,6 6,4
CSIR-NML -1,8 7,5 -2,6 8,4 -0,4 8,8 -1,8 9,6 3,0 9,1 -3,0 8,4 -0,6 8,0
CENAM -1,3 6,3 -2,1 7,3 0,1 7,8 -1,3 8,7 3,5 8,1 -2,5 7,2 -0,1 6,9
NRC 0,8 3,6 2,2 5,9 0,8 7,0 5,6 6,2 -0,4 5,1 2,1 4,5
KRISS -1,4 4,5 -2,2 5,9 -1,4 7,5 3,4 6,8 -2,6 5,8 -0,2 5,3
NMIJ 0,1 5,9 -0,8 7,0 1,4 7,5 4,8 7,8 -1,2 6,9 1,3 6,5
VNIIM -4,8 5,0 -5,6 6,2 -3,4 6,8 -4,8 7,8 -6,0 6,2 -3,5 5,7
NIST 1,2 3,4 0,4 5,1 2,6 5,8 1,2 6,9 6,0 6,2 2,5 4,4
NMi-VSL -1,3 2,5 -2,1 4,5 0,2 5,3 -1,3 6,5 3,5 5,7 -2,5 4,4
pC/(m/s²)x10-4
pC/(m/s²)x10-4 pC/(m/s²)x10-4 pC/(m/s²)x10-4 pC/(m/s²)x10-4 pC/(m/s²)x10-4 pC/(m/s²)x10-4
pC/(m/s²)x10-4 pC/(m/s²)x10-4
NMi-VSL
CSIR-NML CENAMCSIRO-NML CMI
NIST
pC/(m/s²)x10-4 pC/(m/s²)x10-4
NRC KRISS
pC/(m/s²)x10-4
Matrix of equivalence
pC/(m/s²)x10-4
NMIJ VNIIM
PTB BNM-CESTA
pC/(m/s²)x10-4

107
Table C5b: Matrix of equivalence for SE accelerometer at 100 Hz
Key comparison CCAUV.V-K1 Single-ended (SE) accelerometer type 8305 WH 2335 S/N 1610174
Lab j Frequency 100 Hz
Lab i
D i U i D ij U ij D ij U ij D ij U ij D ij U ij D ij U ij D ij U ij
PTB 0,5 0,9 -1,9 6,6 0,1 4,1 1,1 6,1 -4,9 7,9 0,8 6,6
BNM-CESTA 2,4 6,4 1,9 6,6 2,0 7,5 3,0 8,8 -3,0 10,1 2,7 9,1
CSIRO-NML 0,4 3,8 -0,1 4,1 -2,0 7,5 1,0 7,1 -5,0 8,7 0,7 7,5
CMI -0,6 5,9 -1,1 6,1 -3,0 8,8 -1,0 7,1 -6,0 9,8 -0,3 8,8
CSIR-NML 5,4 7,7 4,9 7,9 3,0 10,1 5,0 8,7 6,0 9,8 5,7 10,1
CENAM -0,4 6,4 -0,8 6,6 -2,7 9,1 -0,7 7,5 0,3 8,8 -5,7 10,1
NRC 0,5 3,6 0,1 4,0 -1,9 7,5 0,1 5,4 1,1 7,0 -4,9 8,6 0,8 7,5
KRISS -2,2 4,5 -2,6 4,8 -4,6 8,0 -2,6 6,0 -1,5 7,5 -7,6 9,0 -1,8 7,9
NMIJ -2,5 5,8 -3,0 6,1 -4,9 8,8 -2,9 7,1 -1,9 8,4 -7,9 9,8 -2,2 8,8
VNIIM -4,0 5,1 -4,5 5,3 -6,4 8,3 -4,4 6,4 -3,4 7,8 -9,4 9,3 -3,7 8,2
NIST 1,4 3,5 0,9 3,8 -1,0 7,4 1,0 5,3 2,0 6,9 -4,0 8,6 1,7 7,4
NMi-VSL -1,7 2,5 -2,1 3,0 -4,1 7,0 -2,1 4,7 -1,1 6,5 -7,1 8,2 -1,4 7,0
Lab i
D i U i D ij U ij D ij U ij D ij U ij D ij U ij D ij U ij D ij U ij
PTB 0,5 0,9 -0,1 4,0 2,6 4,8 3,0 6,1 4,5 5,3 -0,9 3,8 2,1 3,0
BNM-CESTA 2,4 6,4 1,9 7,5 4,6 8,0 4,9 8,8 6,4 8,3 1,0 7,4 4,1 7,0
CSIRO-NML 0,4 3,8 -0,1 5,4 2,6 6,0 2,9 7,1 4,4 6,4 -1,0 5,3 2,1 4,7
CMI -0,6 5,9 -1,1 7,0 1,5 7,5 1,9 8,4 3,4 7,8 -2,0 6,9 1,1 6,5
CSIR-NML 5,4 7,7 4,9 8,6 7,6 9,0 7,9 9,8 9,4 9,3 4,0 8,6 7,1 8,2
CENAM -0,4 6,4 -0,8 7,5 1,8 7,9 2,2 8,8 3,7 8,2 -1,7 7,4 1,4 7,0
NRC 0,5 3,6 2,7 6,0 3,0 7,0 4,5 6,4 -0,9 5,2 2,2 4,6
KRISS -2,2 4,5 -2,7 6,0 0,4 7,5 1,8 6,9 -3,5 5,9 -0,5 5,4
NMIJ -2,5 5,8 -3,0 7,0 -0,4 7,5 1,5 7,8 -3,9 6,9 -0,8 6,5
VNIIM -4,0 5,1 -4,5 6,4 -1,8 6,9 -1,5 7,8 -5,4 6,3 -2,3 5,8
NIST 1,4 3,5 0,9 5,2 3,5 5,9 3,9 6,9 5,4 6,3 3,1 4,5
NMi-VSL -1,7 2,5 -2,2 4,6 0,5 5,4 0,8 6,5 2,3 5,8 -3,1 4,5
NIST
pC/(m/s²)x10-4 pC/(m/s²)x10-4
NRC KRISS
pC/(m/s²)x10-4
CSIR-NML CENAMCSIRO-NML CMIPTB BNM-CESTA
pC/(m/s²)x10-4
Matrix of equivalence
pC/(m/s²)x10-4
pC/(m/s²)x10-4
NMIJ
pC/(m/s²)x10-4
pC/(m/s²)x10-4 pC/(m/s²)x10-4 pC/(m/s²)x10-4 pC/(m/s²)x10-4 pC/(m/s²)x10-4 pC/(m/s²)x10-4
pC/(m/s²)x10-4
NMi-VSLVNIIM

108
Table C6a: Matrix of equivalence for BB accelerometer at 125 Hz
Key comparison CCAUV.V-K2 Back-to-back (BB) accelerometer type 8305 S/N 1483337
Lab j Frequency 125 Hz
Lab i
D i U i D ij U ij D ij U ij D ij U ij D ij U ij D ij U ij D ij U ij
PTB 0,5 0,9 -0,7 6,5 0,3 4,0 0,3 5,7 4,3 7,7 1,7 6,4
BNM-CESTA 1,3 6,3 0,7 6,5 1,0 7,4 1,0 8,4 5,0 9,9 2,4 9,0
CSIRO-NML 0,3 3,7 -0,3 4,0 -1,0 7,4 0,0 6,7 4,0 8,5 1,4 7,4
CMI 0,3 5,5 -0,3 5,7 -1,0 8,4 0,0 6,7 4,0 9,4 1,4 8,4
CSIR-NML -3,7 7,5 -4,3 7,7 -5,0 9,9 -4,0 8,5 -4,0 9,4 -2,6 9,9
CENAM -1,1 6,3 -1,7 6,4 -2,4 9,0 -1,4 7,4 -1,4 8,4 2,6 9,9
NRC 1,5 3,6 0,9 3,9 0,2 7,3 1,2 5,3 1,2 6,7 5,2 8,4 2,6 7,3
KRISS -1,2 4,5 -1,7 4,7 -2,4 7,8 -1,4 5,9 -1,4 7,2 2,6 8,8 -0,1 7,8
NMIJ -0,2 5,2 -0,7 5,5 -1,4 8,3 -0,4 6,5 -0,4 7,7 3,6 9,3 1,0 8,3
VNIIM -1,1 5,0 -1,7 5,2 -2,4 8,1 -1,4 6,3 -1,4 7,5 2,6 9,1 0,0 8,1
NIST -1,7 3,9 -2,3 4,2 -3,0 7,5 -2,0 5,5 -2,0 6,9 2,0 8,6 -0,6 7,5
NMi-VSL -1,2 2,5 -1,8 2,9 -2,5 6,9 -1,5 4,6 -1,5 6,2 2,5 8,0 -0,1 6,9
Lab i
D i U i D ij U ij D ij U ij D ij U ij D ij U ij D ij U ij D ij U ij
PTB 0,5 0,9 -0,9 3,9 1,7 4,7 0,7 5,5 1,7 5,2 2,3 4,2 1,8 2,9
BNM-CESTA 1,3 6,3 -0,2 7,3 2,4 7,8 1,4 8,3 2,4 8,1 3,0 7,5 2,5 6,9
CSIRO-NML 0,3 3,7 -1,2 5,3 1,4 5,9 0,4 6,5 1,4 6,3 2,0 5,5 1,5 4,6
CMI 0,3 5,5 -1,2 6,7 1,4 7,2 0,4 7,7 1,4 7,5 2,0 6,9 1,5 6,2
CSIR-NML -3,7 7,5 -5,2 8,4 -2,6 8,8 -3,6 9,3 -2,6 9,1 -2,0 8,6 -2,5 8,0
CENAM -1,1 6,3 -2,6 7,3 0,1 7,8 -1,0 8,3 0,0 8,1 0,6 7,5 0,1 6,9
NRC 1,5 3,6 2,6 5,9 1,6 6,5 2,6 6,3 3,2 5,5 2,7 4,6
KRISS -1,2 4,5 -2,6 5,9 -1,0 7,0 -0,1 6,8 0,6 6,1 0,1 5,3
NMIJ -0,2 5,2 -1,6 6,5 1,0 7,0 1,0 7,3 1,6 6,7 1,1 5,9
VNIIM -1,1 5,0 -2,6 6,3 0,1 6,8 -1,0 7,3 0,6 6,5 0,1 5,7
NIST -1,7 3,9 -3,2 5,5 -0,6 6,1 -1,6 6,7 -0,6 6,5 -0,5 4,8
NMi-VSL -1,2 2,5 -2,7 4,6 -0,1 5,3 -1,1 5,9 -0,1 5,7 0,5 4,8
pC/(m/s²)x10-4
pC/(m/s²)x10-4 pC/(m/s²)x10-4 pC/(m/s²)x10-4 pC/(m/s²)x10-4 pC/(m/s²)x10-4 pC/(m/s²)x10-4
pC/(m/s²)x10-4 pC/(m/s²)x10-4
NMi-VSL
CSIR-NML CENAMCSIRO-NML CMI
NIST
pC/(m/s²)x10-4 pC/(m/s²)x10-4
NRC KRISS
pC/(m/s²)x10-4
Matrix of equivalence
pC/(m/s²)x10-4
NMIJ VNIIM
PTB BNM-CESTA
pC/(m/s²)x10-4

109
Table C6b: Matrix of equivalence for SE accelerometer at 125 Hz
Key comparison CCAUV.V-K1 Single-ended (SE) accelerometer type 8305 WH 2335 S/N 1610174
Lab j Frequency 125 Hz
Lab i
D i U i D ij U ij D ij U ij D ij U ij D ij U ij D ij U ij D ij U ij
PTB 0,4 0,9 -1,9 6,6 0,2 4,1 0,7 6,1 -5,9 7,9 1,3 6,6
BNM-CESTA 2,2 6,4 1,9 6,6 2,0 7,5 2,5 8,8 -4,0 10,1 3,2 9,1
CSIRO-NML 0,2 3,8 -0,2 4,1 -2,0 7,5 0,5 7,1 -6,0 8,7 1,2 7,5
CMI -0,3 5,9 -0,7 6,1 -2,5 8,8 -0,5 7,1 -6,5 9,8 0,7 8,8
CSIR-NML 6,2 7,7 5,9 7,9 4,0 10,1 6,0 8,7 6,5 9,8 7,2 10,1
CENAM -1,0 6,4 -1,3 6,6 -3,2 9,1 -1,2 7,5 -0,7 8,8 -7,2 10,1
NRC 0,8 3,7 0,5 4,0 -1,4 7,5 0,6 5,4 1,1 7,0 -5,4 8,6 1,8 7,5
KRISS -2,1 4,5 -2,4 4,8 -4,3 8,0 -2,3 6,0 -1,8 7,5 -8,3 9,1 -1,1 7,9
NMIJ -2,1 5,2 -2,4 5,4 -4,3 8,3 -2,3 6,5 -1,8 7,9 -8,3 9,4 -1,1 8,3
VNIIM -1,0 5,1 -1,3 5,3 -3,2 8,3 -1,2 6,4 -0,7 7,9 -7,2 9,3 0,0 8,3
NIST 1,2 4,0 0,9 4,3 -1,0 7,7 1,0 5,7 1,5 7,2 -5,0 8,8 2,2 7,7
NMi-VSL -1,7 2,5 -2,1 3,0 -3,9 7,0 -1,9 4,7 -1,4 6,5 -7,9 8,2 -0,7 7,0
Lab i
D i U i D ij U ij D ij U ij D ij U ij D ij U ij D ij U ij D ij U ij
PTB 0,4 0,9 -0,5 4,0 2,4 4,8 2,4 5,4 1,3 5,3 -0,9 4,3 2,1 3,0
BNM-CESTA 2,2 6,4 1,4 7,5 4,3 8,0 4,3 8,3 3,2 8,3 1,0 7,7 3,9 7,0
CSIRO-NML 0,2 3,8 -0,6 5,4 2,3 6,0 2,3 6,5 1,2 6,4 -1,0 5,7 1,9 4,7
CMI -0,3 5,9 -1,1 7,0 1,8 7,5 1,8 7,9 0,7 7,9 -1,5 7,2 1,4 6,5
CSIR-NML 6,2 7,7 5,4 8,6 8,3 9,1 8,3 9,4 7,2 9,3 5,0 8,8 7,9 8,2
CENAM -1,0 6,4 -1,8 7,5 1,1 7,9 1,1 8,3 0,0 8,3 -2,2 7,7 0,7 7,0
NRC 0,8 3,7 2,9 6,0 2,9 6,5 1,8 6,4 -0,4 5,6 2,5 4,6
KRISS -2,1 4,5 -2,9 6,0 0,1 7,0 -1,1 6,9 -3,3 6,2 -0,4 5,4
NMIJ -2,1 5,2 -2,9 6,5 -0,1 7,0 -1,1 7,4 -3,3 6,7 -0,4 5,9
VNIIM -1,0 5,1 -1,8 6,4 1,1 6,9 1,1 7,4 -2,2 6,6 0,7 5,8
NIST 1,2 4,0 0,4 5,6 3,3 6,2 3,3 6,7 2,2 6,6 2,9 4,9
NMi-VSL -1,7 2,5 -2,5 4,6 0,4 5,4 0,4 5,9 -0,7 5,8 -2,9 4,9
NIST
pC/(m/s²)x10-4 pC/(m/s²)x10-4
NRC KRISS
pC/(m/s²)x10-4
CSIR-NML CENAMCSIRO-NML CMIPTB BNM-CESTA
pC/(m/s²)x10-4
Matrix of equivalence
pC/(m/s²)x10-4
pC/(m/s²)x10-4
NMIJ
pC/(m/s²)x10-4
pC/(m/s²)x10-4 pC/(m/s²)x10-4 pC/(m/s²)x10-4 pC/(m/s²)x10-4 pC/(m/s²)x10-4 pC/(m/s²)x10-4
pC/(m/s²)x10-4
NMi-VSLVNIIM

110
Table C7a: Matrix of equivalence for BB accelerometer at 160 Hz
Key comparison CCAUV.V-K2 Back-to-back (BB) accelerometer type 8305 S/N 1483337
Lab j Frequency 160 Hz
Lab i
D i U i D ij U ij D ij U ij D ij U ij D ij U ij D ij U ij D ij U ij
PTB 0,1 0,8 -0,6 6,5 0,4 4,0 0,4 6,0 0,4 6,5 0,4 6,5
BNM-CESTA 0,7 6,3 0,6 6,5 1,0 7,4 1,0 8,6 1,0 9,0 1,0 9,0
CSIRO-NML -0,3 3,7 -0,4 4,0 -1,0 7,4 0,0 7,0 0,0 7,4 0,0 7,4
CMI -0,3 5,7 -0,4 6,0 -1,0 8,6 0,0 7,0 0,0 8,6 0,0 8,6
CSIR-NML -0,3 6,3 -0,4 6,5 -1,0 9,0 0,0 7,4 0,0 8,6 0,0 9,0
CENAM -0,3 6,3 -0,4 6,5 -1,0 9,0 0,0 7,4 0,0 8,6 0,0 9,0
NRC 1,2 3,6 1,1 3,9 0,5 7,3 1,5 5,3 1,5 6,9 1,5 7,3 1,5 7,3
KRISS -1,4 4,5 -1,4 4,7 -2,1 7,8 -1,1 5,9 -1,1 7,4 -1,1 7,8 -1,1 7,8
NMIJ -0,3 5,4 -0,4 5,6 -1,0 8,4 0,0 6,6 0,0 8,0 0,0 8,3 0,0 8,3
VNIIM 1,9 5,0 1,8 5,2 1,2 8,1 2,2 6,3 2,2 7,7 2,2 8,1 2,2 8,1
NIST -1,3 3,7 -1,4 4,0 -2,0 7,4 -1,0 5,4 -1,0 7,0 -1,0 7,4 -1,0 7,4
NMi-VSL -0,3 4,2 -0,4 4,5 -1,0 7,7 0,0 5,7 0,0 7,2 0,0 7,7 0,0 7,7
Lab i
D i U i D ij U ij D ij U ij D ij U ij D ij U ij D ij U ij D ij U ij
PTB 0,1 0,8 -1,1 3,9 1,4 4,7 0,4 5,6 -1,8 5,2 1,4 4,0 0,4 4,5
BNM-CESTA 0,7 6,3 -0,5 7,3 2,1 7,8 1,0 8,4 -1,2 8,1 2,0 7,4 1,0 7,7
CSIRO-NML -0,3 3,7 -1,5 5,3 1,1 5,9 0,0 6,6 -2,2 6,3 1,0 5,4 0,0 5,7
CMI -0,3 5,7 -1,5 6,9 1,1 7,4 0,0 8,0 -2,2 7,7 1,0 7,0 0,0 7,2
CSIR-NML -0,3 6,3 -1,5 7,3 1,1 7,8 0,0 8,3 -2,2 8,1 1,0 7,4 0,0 7,7
CENAM -0,3 6,3 -1,5 7,3 1,1 7,8 0,0 8,3 -2,2 8,1 1,0 7,4 0,0 7,7
NRC 1,2 3,6 2,6 5,9 1,5 6,6 -0,7 6,3 2,5 5,3 1,5 5,7
KRISS -1,4 4,5 -2,6 5,9 -1,1 7,1 -3,3 6,8 -0,1 5,9 -1,1 6,3
NMIJ -0,3 5,4 -1,5 6,6 1,1 7,1 -2,2 7,4 1,0 6,6 0,0 6,9
VNIIM 1,9 5,0 0,7 6,3 3,3 6,8 2,2 7,4 3,2 6,3 2,2 6,7
NIST -1,3 3,7 -2,5 5,3 0,1 5,9 -1,0 6,6 -3,2 6,3 -1,0 5,7
NMi-VSL -0,3 4,2 -1,5 5,7 1,1 6,3 0,0 6,9 -2,2 6,7 1,0 5,7
pC/(m/s²)x10-4
pC/(m/s²)x10-4 pC/(m/s²)x10-4 pC/(m/s²)x10-4 pC/(m/s²)x10-4 pC/(m/s²)x10-4 pC/(m/s²)x10-4
pC/(m/s²)x10-4 pC/(m/s²)x10-4
NMi-VSL
CSIR-NML CENAMCSIRO-NML CMI
NIST
pC/(m/s²)x10-4 pC/(m/s²)x10-4
NRC KRISS
pC/(m/s²)x10-4
Matrix of equivalence
pC/(m/s²)x10-4
NMIJ VNIIM
PTB BNM-CESTA
pC/(m/s²)x10-4

111
Table C7b: Matrix of equivalence for SE accelerometer at 160 Hz
Key comparison CCAUV.V-K1 Single-ended (SE) accelerometer type 8305 WH 2335 S/N 1610174
Lab j Frequency 160 Hz
Lab i
D i U i D ij U ij D ij U ij D ij U ij D ij U ij D ij U ij D ij U ij
PTB 0,3 0,9 -2,8 6,6 1,2 4,1 0,3 6,1 3,2 6,6 1,6 6,6
BNM-CESTA 3,1 6,4 2,8 6,6 4,0 7,5 3,0 8,8 6,0 9,1 4,4 9,1
CSIRO-NML -0,9 3,7 -1,2 4,1 -4,0 7,5 -1,0 7,1 2,0 7,5 0,4 7,5
CMI 0,1 5,9 -0,3 6,1 -3,0 8,8 1,0 7,1 3,0 8,8 1,4 8,8
CSIR-NML -2,9 6,4 -3,2 6,6 -6,0 9,1 -2,0 7,5 -3,0 8,8 -1,6 9,1
CENAM -1,3 6,4 -1,6 6,6 -4,4 9,1 -0,4 7,5 -1,4 8,8 1,6 9,1
NRC 1,5 3,6 1,2 4,0 -1,6 7,5 2,4 5,4 1,4 7,0 4,4 7,5 2,8 7,5
KRISS -1,9 4,5 -2,2 4,8 -5,0 8,0 -1,0 6,0 -2,0 7,5 1,0 7,9 -0,6 7,9
NMIJ -2,1 5,5 -2,4 5,7 -5,2 8,5 -1,2 6,8 -2,2 8,1 0,8 8,5 -0,8 8,5
VNIIM -1,7 5,1 -2,0 5,3 -4,8 8,3 -0,8 6,4 -1,8 7,9 1,2 8,2 -0,4 8,3
NIST 1,1 3,8 0,8 4,1 -2,0 7,5 2,0 5,5 1,0 7,1 4,0 7,5 2,4 7,5
NMi-VSL -0,5 4,3 -0,7 4,6 -3,5 7,8 0,5 5,8 -0,5 7,4 2,5 7,8 0,9 7,8
Lab i
D i U i D ij U ij D ij U ij D ij U ij D ij U ij D ij U ij D ij U ij
PTB 0,3 0,9 -1,2 4,0 2,2 4,8 2,4 5,7 2,0 5,3 -0,8 4,1 0,7 4,6
BNM-CESTA 3,1 6,4 1,6 7,5 5,0 8,0 5,2 8,5 4,8 8,3 2,0 7,5 3,5 7,8
CSIRO-NML -0,9 3,7 -2,4 5,4 1,0 6,0 1,2 6,8 0,8 6,4 -2,0 5,5 -0,5 5,8
CMI 0,1 5,9 -1,4 7,0 2,0 7,5 2,2 8,1 1,8 7,9 -1,0 7,1 0,5 7,4
CSIR-NML -2,9 6,4 -4,4 7,5 -1,0 7,9 -0,8 8,5 -1,2 8,2 -4,0 7,5 -2,5 7,8
CENAM -1,3 6,4 -2,8 7,5 0,6 7,9 0,8 8,5 0,4 8,3 -2,4 7,5 -0,9 7,8
NRC 1,5 3,6 3,4 6,0 3,6 6,7 3,2 6,4 0,4 5,4 1,9 5,8
KRISS -1,9 4,5 -3,4 6,0 0,3 7,2 -0,2 6,9 -3,0 6,0 -1,5 6,4
NMIJ -2,1 5,5 -3,6 6,7 -0,3 7,2 -0,4 7,6 -3,2 6,8 -1,7 7,1
VNIIM -1,7 5,1 -3,2 6,4 0,2 6,9 0,4 7,6 -2,8 6,4 -1,3 6,8
NIST 1,1 3,8 -0,4 5,4 3,0 6,0 3,2 6,8 2,8 6,4 1,5 5,8
NMi-VSL -0,5 4,3 -1,9 5,8 1,5 6,4 1,7 7,1 1,3 6,8 -1,5 5,8
NIST
pC/(m/s²)x10-4 pC/(m/s²)x10-4
NRC KRISS
pC/(m/s²)x10-4
CSIR-NML CENAMCSIRO-NML CMIPTB BNM-CESTA
pC/(m/s²)x10-4
Matrix of equivalence
pC/(m/s²)x10-4
pC/(m/s²)x10-4
NMIJ
pC/(m/s²)x10-4
pC/(m/s²)x10-4 pC/(m/s²)x10-4 pC/(m/s²)x10-4 pC/(m/s²)x10-4 pC/(m/s²)x10-4 pC/(m/s²)x10-4
pC/(m/s²)x10-4
NMi-VSLVNIIM
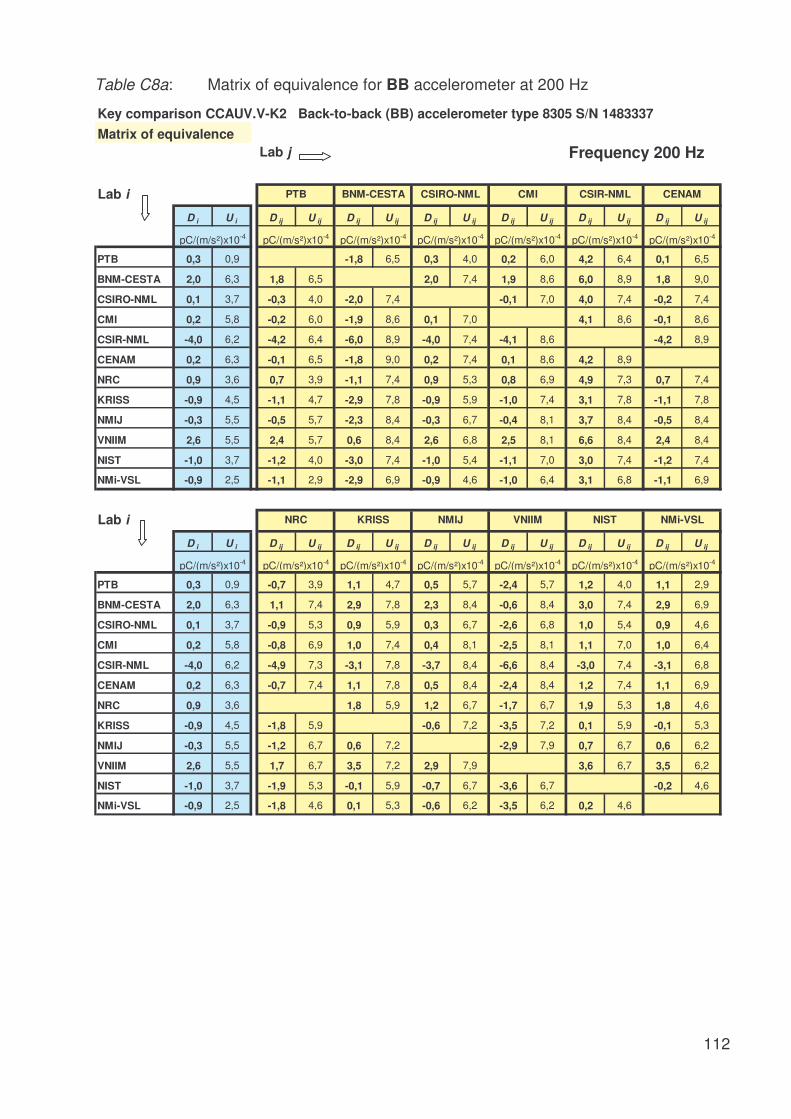
112
Table C8a: Matrix of equivalence for BB accelerometer at 200 Hz
Key comparison CCAUV.V-K2 Back-to-back (BB) accelerometer type 8305 S/N 1483337
Lab j Frequency 200 Hz
Lab i
D i U i D ij U ij D ij U ij D ij U ij D ij U ij D ij U ij D ij U ij
PTB 0,3 0,9 -1,8 6,5 0,3 4,0 0,2 6,0 4,2 6,4 0,1 6,5
BNM-CESTA 2,0 6,3 1,8 6,5 2,0 7,4 1,9 8,6 6,0 8,9 1,8 9,0
CSIRO-NML 0,1 3,7 -0,3 4,0 -2,0 7,4 -0,1 7,0 4,0 7,4 -0,2 7,4
CMI 0,2 5,8 -0,2 6,0 -1,9 8,6 0,1 7,0 4,1 8,6 -0,1 8,6
CSIR-NML -4,0 6,2 -4,2 6,4 -6,0 8,9 -4,0 7,4 -4,1 8,6 -4,2 8,9
CENAM 0,2 6,3 -0,1 6,5 -1,8 9,0 0,2 7,4 0,1 8,6 4,2 8,9
NRC 0,9 3,6 0,7 3,9 -1,1 7,4 0,9 5,3 0,8 6,9 4,9 7,3 0,7 7,4
KRISS -0,9 4,5 -1,1 4,7 -2,9 7,8 -0,9 5,9 -1,0 7,4 3,1 7,8 -1,1 7,8
NMIJ -0,3 5,5 -0,5 5,7 -2,3 8,4 -0,3 6,7 -0,4 8,1 3,7 8,4 -0,5 8,4
VNIIM 2,6 5,5 2,4 5,7 0,6 8,4 2,6 6,8 2,5 8,1 6,6 8,4 2,4 8,4
NIST -1,0 3,7 -1,2 4,0 -3,0 7,4 -1,0 5,4 -1,1 7,0 3,0 7,4 -1,2 7,4
NMi-VSL -0,9 2,5 -1,1 2,9 -2,9 6,9 -0,9 4,6 -1,0 6,4 3,1 6,8 -1,1 6,9
Lab i
D i U i D ij U ij D ij U ij D ij U ij D ij U ij D ij U ij D ij U ij
PTB 0,3 0,9 -0,7 3,9 1,1 4,7 0,5 5,7 -2,4 5,7 1,2 4,0 1,1 2,9
BNM-CESTA 2,0 6,3 1,1 7,4 2,9 7,8 2,3 8,4 -0,6 8,4 3,0 7,4 2,9 6,9
CSIRO-NML 0,1 3,7 -0,9 5,3 0,9 5,9 0,3 6,7 -2,6 6,8 1,0 5,4 0,9 4,6
CMI 0,2 5,8 -0,8 6,9 1,0 7,4 0,4 8,1 -2,5 8,1 1,1 7,0 1,0 6,4
CSIR-NML -4,0 6,2 -4,9 7,3 -3,1 7,8 -3,7 8,4 -6,6 8,4 -3,0 7,4 -3,1 6,8
CENAM 0,2 6,3 -0,7 7,4 1,1 7,8 0,5 8,4 -2,4 8,4 1,2 7,4 1,1 6,9
NRC 0,9 3,6 1,8 5,9 1,2 6,7 -1,7 6,7 1,9 5,3 1,8 4,6
KRISS -0,9 4,5 -1,8 5,9 -0,6 7,2 -3,5 7,2 0,1 5,9 -0,1 5,3
NMIJ -0,3 5,5 -1,2 6,7 0,6 7,2 -2,9 7,9 0,7 6,7 0,6 6,2
VNIIM 2,6 5,5 1,7 6,7 3,5 7,2 2,9 7,9 3,6 6,7 3,5 6,2
NIST -1,0 3,7 -1,9 5,3 -0,1 5,9 -0,7 6,7 -3,6 6,7 -0,2 4,6
NMi-VSL -0,9 2,5 -1,8 4,6 0,1 5,3 -0,6 6,2 -3,5 6,2 0,2 4,6
pC/(m/s²)x10-4
pC/(m/s²)x10-4 pC/(m/s²)x10-4 pC/(m/s²)x10-4 pC/(m/s²)x10-4 pC/(m/s²)x10-4 pC/(m/s²)x10-4
pC/(m/s²)x10-4 pC/(m/s²)x10-4
NMi-VSL
CSIR-NML CENAMCSIRO-NML CMI
NIST
pC/(m/s²)x10-4 pC/(m/s²)x10-4
NRC KRISS
pC/(m/s²)x10-4
Matrix of equivalence
pC/(m/s²)x10-4
NMIJ VNIIM
PTB BNM-CESTA
pC/(m/s²)x10-4

113
Table C8b: Matrix of equivalence for SE accelerometer at 200 Hz
Key comparison CCAUV.V-K1 Single-ended (SE) accelerometer type 8305 WH 2335 S/N 1610174
Lab j Frequency 200 Hz
Lab i
D i U i D ij U ij D ij U ij D ij U ij D ij U ij D ij U ij D ij U ij
PTB 0,4 0,9 -1,6 6,6 0,4 4,1 -0,1 6,1 3,4 6,6 1,6 6,6
BNM-CESTA 2,0 6,4 1,6 6,6 2,0 7,5 1,5 8,8 5,0 9,1 3,2 9,1
CSIRO-NML -0,1 3,8 -0,4 4,1 -2,0 7,5 -0,5 7,1 3,0 7,5 1,2 7,5
CMI 0,5 5,9 0,1 6,1 -1,5 8,8 0,5 7,1 3,5 8,8 1,7 8,8
CSIR-NML -3,0 6,4 -3,4 6,6 -5,0 9,1 -3,0 7,5 -3,5 8,8 -1,8 9,1
CENAM -1,2 6,4 -1,6 6,6 -3,2 9,1 -1,2 7,5 -1,7 8,8 1,8 9,1
NRC 1,1 3,7 0,7 4,0 -0,9 7,5 1,1 5,4 0,6 7,1 4,1 7,5 2,3 7,5
KRISS -1,8 4,5 -2,2 4,8 -3,8 8,0 -1,8 6,0 -2,3 7,5 1,2 7,9 -0,6 7,9
NMIJ -2,1 5,7 -2,5 5,9 -4,1 8,7 -2,1 7,0 -2,6 8,3 0,9 8,7 -0,9 8,7
VNIIM -0,1 5,6 -0,4 5,8 -2,0 8,6 0,0 6,9 -0,5 8,2 3,0 8,6 1,2 8,6
NIST 1,0 3,8 0,6 4,1 -1,0 7,5 1,0 5,5 0,5 7,1 4,0 7,5 2,2 7,5
NMi-VSL -1,2 2,4 -1,6 2,9 -3,2 7,0 -1,2 4,6 -1,7 6,5 1,8 6,9 -0,1 6,9
Lab i
D i U i D ij U ij D ij U ij D ij U ij D ij U ij D ij U ij D ij U ij
PTB 0,4 0,9 -0,7 4,0 2,2 4,8 2,5 5,9 0,4 5,8 -0,6 4,1 1,6 2,9
BNM-CESTA 2,0 6,4 0,9 7,5 3,8 8,0 4,1 8,7 2,0 8,6 1,0 7,5 3,2 7,0
CSIRO-NML -0,1 3,8 -1,1 5,4 1,8 6,0 2,1 7,0 0,0 6,9 -1,0 5,5 1,2 4,6
CMI 0,5 5,9 -0,6 7,1 2,3 7,5 2,6 8,3 0,5 8,2 -0,5 7,1 1,7 6,5
CSIR-NML -3,0 6,4 -4,1 7,5 -1,2 7,9 -0,9 8,7 -3,0 8,6 -4,0 7,5 -1,8 6,9
CENAM -1,2 6,4 -2,3 7,5 0,6 7,9 0,9 8,7 -1,2 8,6 -2,2 7,5 0,1 6,9
NRC 1,1 3,7 2,9 6,0 3,2 6,9 1,1 6,8 0,1 5,4 2,3 4,6
KRISS -1,8 4,5 -2,9 6,0 0,3 7,4 -1,8 7,3 -2,8 6,0 -0,6 5,3
NMIJ -2,1 5,7 -3,2 6,9 -0,3 7,4 -2,1 8,1 -3,1 7,0 -0,9 6,3
VNIIM -0,1 5,6 -1,1 6,8 1,8 7,3 2,1 8,1 -1,0 6,9 1,2 6,2
NIST 1,0 3,8 -0,1 5,4 2,8 6,0 3,1 7,0 1,0 6,9 2,2 4,7
NMi-VSL -1,2 2,4 -2,3 4,6 0,6 5,3 0,9 6,3 -1,2 6,2 -2,2 4,7
NIST
pC/(m/s²)x10-4 pC/(m/s²)x10-4
NRC KRISS
pC/(m/s²)x10-4
CSIR-NML CENAMCSIRO-NML CMIPTB BNM-CESTA
pC/(m/s²)x10-4
Matrix of equivalence
pC/(m/s²)x10-4
pC/(m/s²)x10-4
NMIJ
pC/(m/s²)x10-4
pC/(m/s²)x10-4 pC/(m/s²)x10-4 pC/(m/s²)x10-4 pC/(m/s²)x10-4 pC/(m/s²)x10-4 pC/(m/s²)x10-4
pC/(m/s²)x10-4
NMi-VSLVNIIM

114
Table C9a: Matrix of equivalence for BB accelerometer at 250 Hz
Key comparison CCAUV.V-K2 Back-to-back (BB) accelerometer type 8305 S/N 1483337
Lab j Frequency 250 Hz
Lab i
D i U i D ij U ij D ij U ij D ij U ij D ij U ij D ij U ij D ij U ij
PTB 0,2 0,9 -1,5 6,5 0,5 4,0 -0,1 6,5 1,5 6,5 1,4 6,5
BNM-CESTA 1,7 6,3 1,5 6,5 2,0 7,4 1,5 9,0 3,0 9,0 2,9 9,0
CSIRO-NML -0,3 3,7 -0,5 4,0 -2,0 7,4 -0,5 7,4 1,0 7,4 0,9 7,4
CMI 0,3 6,3 0,1 6,5 -1,5 9,0 0,5 7,4 1,5 9,0 1,4 9,0
CSIR-NML -1,3 6,3 -1,5 6,5 -3,0 9,0 -1,0 7,4 -1,5 9,0 -0,1 8,9
CENAM -1,2 6,3 -1,4 6,5 -2,9 9,0 -0,9 7,4 -1,4 9,0 0,1 8,9
NRC 0,6 3,7 0,5 4,0 -1,1 7,4 0,9 5,4 0,4 7,4 1,9 7,4 1,8 7,4
KRISS -0,8 4,5 -1,0 4,7 -2,5 7,8 -0,5 5,9 -1,0 7,8 0,5 7,8 0,4 7,8
NMIJ -1,0 5,6 -1,2 5,8 -2,7 8,5 -0,7 6,8 -1,2 8,5 0,3 8,5 0,2 8,5
VNIIM 0,7 5,5 0,6 5,7 -1,0 8,4 1,0 6,7 0,5 8,4 2,0 8,4 1,9 8,4
NIST -0,3 3,7 -0,5 4,0 -2,0 7,4 0,0 5,4 -0,5 7,4 1,0 7,4 0,9 7,4
NMi-VSL -0,5 2,5 -0,6 2,9 -2,2 6,9 -0,2 4,6 -0,7 6,9 0,8 6,9 0,7 6,9
Lab i
D i U i D ij U ij D ij U ij D ij U ij D ij U ij D ij U ij D ij U ij
PTB 0,2 0,9 -0,5 4,0 1,0 4,7 1,2 5,8 -0,6 5,7 0,5 4,0 0,6 2,9
BNM-CESTA 1,7 6,3 1,1 7,4 2,5 7,8 2,7 8,5 1,0 8,4 2,0 7,4 2,2 6,9
CSIRO-NML -0,3 3,7 -0,9 5,4 0,5 5,9 0,7 6,8 -1,0 6,7 0,0 5,4 0,2 4,6
CMI 0,3 6,3 -0,4 7,4 1,0 7,8 1,2 8,5 -0,5 8,4 0,5 7,4 0,7 6,9
CSIR-NML -1,3 6,3 -1,9 7,4 -0,5 7,8 -0,3 8,5 -2,0 8,4 -1,0 7,4 -0,8 6,9
CENAM -1,2 6,3 -1,8 7,4 -0,4 7,8 -0,2 8,5 -1,9 8,4 -0,9 7,4 -0,7 6,9
NRC 0,6 3,7 1,4 5,9 1,6 6,9 -0,1 6,8 0,9 5,4 1,1 4,6
KRISS -0,8 4,5 -1,4 5,9 0,2 7,3 -1,5 7,2 -0,5 5,9 -0,4 5,3
NMIJ -1,0 5,6 -1,6 6,9 -0,2 7,3 -1,7 8,0 -0,7 6,8 -0,6 6,3
VNIIM 0,7 5,5 0,1 6,8 1,5 7,2 1,7 8,0 1,0 6,7 1,2 6,2
NIST -0,3 3,7 -0,9 5,4 0,5 5,9 0,7 6,8 -1,0 6,7 0,2 4,6
NMi-VSL -0,5 2,5 -1,1 4,6 0,4 5,3 0,6 6,3 -1,2 6,2 -0,2 4,6
pC/(m/s²)x10-4
pC/(m/s²)x10-4 pC/(m/s²)x10-4 pC/(m/s²)x10-4 pC/(m/s²)x10-4 pC/(m/s²)x10-4 pC/(m/s²)x10-4
pC/(m/s²)x10-4 pC/(m/s²)x10-4
NMi-VSL
CSIR-NML CENAMCSIRO-NML CMI
NIST
pC/(m/s²)x10-4 pC/(m/s²)x10-4
NRC KRISS
pC/(m/s²)x10-4
Matrix of equivalence
pC/(m/s²)x10-4
NMIJ VNIIM
PTB BNM-CESTA
pC/(m/s²)x10-4

115
Table C9b: Matrix of equivalence for SE accelerometer at 250 Hz
Key comparison CCAUV.V-K1 Single-ended (SE) accelerometer type 8305 WH 2335 S/N 1610174
Lab j Frequency 250 Hz
Lab i
D i U i D ij U ij D ij U ij D ij U ij D ij U ij D ij U ij D ij U ij
PTB 0,3 0,9 -0,6 6,6 -0,6 4,1 -0,6 6,3 1,4 6,6 1,0 6,6
BNM-CESTA 0,8 6,4 0,6 6,6 0,0 7,5 0,0 8,9 2,0 9,1 1,6 9,1
CSIRO-NML 0,8 3,8 0,6 4,1 0,0 7,5 0,0 7,3 2,0 7,5 1,6 7,5
CMI 0,8 6,1 0,6 6,3 0,0 8,9 0,0 7,3 2,0 8,9 1,6 8,9
CSIR-NML -1,2 6,4 -1,4 6,6 -2,0 9,1 -2,0 7,5 -2,0 8,9 -0,4 9,1
CENAM -0,8 6,4 -1,0 6,6 -1,6 9,1 -1,6 7,5 -1,6 8,9 0,4 9,1
NRC 1,4 3,8 1,2 4,1 0,6 7,5 0,6 5,5 0,6 7,3 2,6 7,5 2,2 7,5
KRISS -1,9 4,5 -2,2 4,8 -2,7 7,9 -2,7 6,0 -2,7 7,7 -0,8 7,9 -1,2 7,9
NMIJ -2,0 6,6 -2,2 6,8 -2,8 9,3 -2,8 7,7 -2,8 9,1 -0,8 9,3 -1,2 9,3
VNIIM -2,2 5,6 -2,4 5,8 -3,0 8,6 -3,0 6,9 -3,0 8,4 -1,0 8,6 -1,4 8,6
NIST 0,8 3,8 0,6 4,1 0,0 7,5 0,0 5,5 0,0 7,3 2,0 7,5 1,6 7,5
NMi-VSL -1,0 2,8 -1,3 3,2 -1,8 7,1 -1,8 4,9 -1,8 6,9 0,2 7,1 -0,3 7,1
Lab i
D i U i D ij U ij D ij U ij D ij U ij D ij U ij D ij U ij D ij U ij
PTB 0,3 0,9 -1,2 4,1 2,2 4,8 2,2 6,8 2,4 5,8 -0,6 4,1 1,3 3,2
BNM-CESTA 0,8 6,4 -0,6 7,5 2,7 7,9 2,8 9,3 3,0 8,6 0,0 7,5 1,8 7,1
CSIRO-NML 0,8 3,8 -0,6 5,5 2,7 6,0 2,8 7,7 3,0 6,9 0,0 5,5 1,8 4,9
CMI 0,8 6,1 -0,6 7,3 2,7 7,7 2,8 9,1 3,0 8,4 0,0 7,3 1,8 6,9
CSIR-NML -1,2 6,4 -2,6 7,5 0,8 7,9 0,8 9,3 1,0 8,6 -2,0 7,5 -0,2 7,1
CENAM -0,8 6,4 -2,2 7,5 1,2 7,9 1,2 9,3 1,4 8,6 -1,6 7,5 0,3 7,1
NRC 1,4 3,8 3,4 6,1 3,4 7,7 3,6 6,9 0,6 5,5 2,4 4,9
KRISS -1,9 4,5 -3,4 6,1 0,1 8,1 0,3 7,3 -2,7 6,0 -0,9 5,5
NMIJ -2,0 6,6 -3,4 7,7 -0,1 8,1 0,2 8,8 -2,8 7,7 -1,0 7,3
VNIIM -2,2 5,6 -3,6 6,9 -0,3 7,3 -0,2 8,8 -3,0 6,9 -1,2 6,4
NIST 0,8 3,8 -0,6 5,5 2,7 6,0 2,8 7,7 3,0 6,9 1,8 4,9
NMi-VSL -1,0 2,8 -2,4 4,9 0,9 5,5 1,0 7,3 1,2 6,4 -1,8 4,9
NIST
pC/(m/s²)x10-4 pC/(m/s²)x10-4
NRC KRISS
pC/(m/s²)x10-4
CSIR-NML CENAMCSIRO-NML CMIPTB BNM-CESTA
pC/(m/s²)x10-4
Matrix of equivalence
pC/(m/s²)x10-4
pC/(m/s²)x10-4
NMIJ
pC/(m/s²)x10-4
pC/(m/s²)x10-4 pC/(m/s²)x10-4 pC/(m/s²)x10-4 pC/(m/s²)x10-4 pC/(m/s²)x10-4 pC/(m/s²)x10-4
pC/(m/s²)x10-4
NMi-VSLVNIIM

116
Table C10a: Matrix of equivalence for BB accelerometer at 315 Hz
Key comparison CCAUV.V-K2 Back-to-back (BB) accelerometer type 8305 S/N 1483337
Lab j Frequency 315 Hz
Lab i
D i U i D ij U ij D ij U ij D ij U ij D ij U ij D ij U ij D ij U ij
PTB 0,2 0,9 -2,3 6,5 -0,4 4,0 0,7 6,7 0,7 6,5 1,8 6,5
BNM-CESTA 2,5 6,3 2,3 6,5 2,0 7,4 3,0 9,1 3,0 9,0 4,1 9,0
CSIRO-NML 0,5 3,7 0,4 4,0 -2,0 7,4 1,0 7,6 1,0 7,4 2,1 7,4
CMI -0,6 6,5 -0,7 6,7 -3,0 9,1 -1,0 7,6 0,0 9,1 1,1 9,1
CSIR-NML -0,6 6,3 -0,7 6,5 -3,0 9,0 -1,0 7,4 0,0 9,1 1,1 8,9
CENAM -1,6 6,3 -1,8 6,5 -4,1 9,0 -2,1 7,4 -1,1 9,1 -1,1 8,9
NRC -0,9 3,6 -1,1 4,0 -3,4 7,4 -1,4 5,3 -0,4 7,6 -0,4 7,4 0,7 7,4
KRISS -1,0 4,5 -1,2 4,7 -3,5 7,8 -1,5 5,9 -0,5 8,0 -0,5 7,8 0,6 7,8
NMIJ -1,9 6,1 -2,1 6,3 -4,4 8,9 -2,4 7,3 -1,4 9,0 -1,4 8,9 -0,3 8,9
VNIIM 1,5 5,5 1,3 5,7 -1,0 8,4 1,0 6,8 2,0 8,6 2,0 8,4 3,1 8,4
NIST -0,6 3,9 -0,7 4,2 -3,0 7,5 -1,0 5,6 0,0 7,7 0,0 7,5 1,1 7,5
NMi-VSL 0,6 3,2 0,5 3,5 -1,9 7,1 0,2 5,0 1,1 7,4 1,1 7,1 2,2 7,1
Lab i
D i U i D ij U ij D ij U ij D ij U ij D ij U ij D ij U ij D ij U ij
PTB 0,2 0,9 1,1 4,0 1,2 4,7 2,1 6,3 -1,3 5,7 0,7 4,2 -0,5 3,5
BNM-CESTA 2,5 6,3 3,4 7,4 3,5 7,8 4,4 8,9 1,0 8,4 3,0 7,5 1,9 7,1
CSIRO-NML 0,5 3,7 1,4 5,3 1,5 5,9 2,4 7,3 -1,0 6,8 1,0 5,6 -0,2 5,0
CMI -0,6 6,5 0,4 7,6 0,5 8,0 1,4 9,0 -2,0 8,6 0,0 7,7 -1,1 7,4
CSIR-NML -0,6 6,3 0,4 7,4 0,5 7,8 1,4 8,9 -2,0 8,4 0,0 7,5 -1,1 7,1
CENAM -1,6 6,3 -0,7 7,4 -0,6 7,8 0,3 8,9 -3,1 8,4 -1,1 7,5 -2,2 7,1
NRC -0,9 3,6 0,1 5,9 1,0 7,2 -2,4 6,7 -0,4 5,5 -1,5 5,0
KRISS -1,0 4,5 -0,1 5,9 0,9 7,7 -2,5 7,2 -0,5 6,1 -1,6 5,6
NMIJ -1,9 6,1 -1,0 7,2 -0,9 7,7 -3,4 8,3 -1,4 7,4 -2,5 7,0
VNIIM 1,5 5,5 2,4 6,7 2,5 7,2 3,4 8,3 2,0 6,9 0,9 6,5
NIST -0,6 3,9 0,4 5,5 0,5 6,1 1,4 7,4 -2,0 6,9 -1,1 5,2
NMi-VSL 0,6 3,2 1,5 5,0 1,6 5,6 2,5 7,0 -0,9 6,5 1,1 5,2
pC/(m/s²)x10-4
pC/(m/s²)x10-4 pC/(m/s²)x10-4 pC/(m/s²)x10-4 pC/(m/s²)x10-4 pC/(m/s²)x10-4 pC/(m/s²)x10-4
pC/(m/s²)x10-4 pC/(m/s²)x10-4
NMi-VSL
CSIR-NML CENAMCSIRO-NML CMI
NIST
pC/(m/s²)x10-4 pC/(m/s²)x10-4
NRC KRISS
pC/(m/s²)x10-4
Matrix of equivalence
pC/(m/s²)x10-4
NMIJ VNIIM
PTB BNM-CESTA
pC/(m/s²)x10-4

117
Table C10b: Matrix of equivalence for SE accelerometer at 315 Hz
Key comparison CCAUV.V-K1 Single-ended (SE) accelerometer type 8305 WH 2335 S/N 1610174
Lab j Frequency 315 Hz
Lab i
D i U i D ij U ij D ij U ij D ij U ij D ij U ij D ij U ij D ij U ij
PTB 0,2 0,9 -4,4 6,6 -0,4 4,1 -0,9 6,1 -2,4 6,6 0,3 6,6
BNM-CESTA 4,5 6,4 4,4 6,6 4,0 7,5 3,5 8,8 2,0 9,1 4,6 9,1
CSIRO-NML 0,6 3,8 0,4 4,1 -4,0 7,5 -0,5 7,1 -2,0 7,5 0,6 7,5
CMI 1,0 5,9 0,9 6,1 -3,5 8,8 0,5 7,1 -1,5 8,8 1,1 8,8
CSIR-NML 2,5 6,4 2,4 6,6 -2,0 9,1 2,0 7,5 1,5 8,8 2,6 9,1
CENAM -0,1 6,4 -0,3 6,6 -4,6 9,1 -0,6 7,5 -1,1 8,8 -2,6 9,1
NRC -1,3 3,7 -1,4 4,0 -5,8 7,5 -1,8 5,4 -2,3 7,1 -3,8 7,5 -1,2 7,5
KRISS -2,0 4,5 -2,2 4,8 -6,6 8,0 -2,6 6,0 -3,1 7,5 -4,6 8,0 -2,0 7,9
NMIJ -2,4 8,1 -2,5 8,2 -6,9 10,4 -2,9 9,0 -3,4 10,1 -4,9 10,4 -2,3 10,4
VNIIM -3,3 5,6 -3,4 5,8 -7,8 8,6 -3,8 6,9 -4,3 8,2 -5,8 8,6 -3,2 8,6
NIST 0,6 4,0 0,4 4,3 -4,0 7,7 0,0 5,7 -0,5 7,2 -2,0 7,7 0,6 7,7
NMi-VSL -0,5 2,9 -0,7 3,4 -5,1 7,2 -1,1 5,0 -1,6 6,7 -3,1 7,2 -0,5 7,2
Lab i
D i U i D ij U ij D ij U ij D ij U ij D ij U ij D ij U ij D ij U ij
PTB 0,2 0,9 1,4 4,0 2,2 4,8 2,5 8,2 3,4 5,8 -0,4 4,3 0,7 3,4
BNM-CESTA 4,5 6,4 5,8 7,5 6,6 8,0 6,9 10,4 7,8 8,6 4,0 7,7 5,1 7,2
CSIRO-NML 0,6 3,8 1,8 5,4 2,6 6,0 2,9 9,0 3,8 6,9 0,0 5,7 1,1 5,0
CMI 1,0 5,9 2,3 7,1 3,1 7,5 3,4 10,1 4,3 8,2 0,5 7,2 1,6 6,7
CSIR-NML 2,5 6,4 3,8 7,5 4,6 8,0 4,9 10,4 5,8 8,6 2,0 7,7 3,1 7,2
CENAM -0,1 6,4 1,2 7,5 2,0 7,9 2,3 10,4 3,2 8,6 -0,6 7,7 0,5 7,2
NRC -1,3 3,7 0,8 6,0 1,1 9,0 2,0 6,8 -1,8 5,6 -0,8 4,9
KRISS -2,0 4,5 -0,8 6,0 0,4 9,3 1,2 7,3 -2,6 6,2 -1,5 5,6
NMIJ -2,4 8,1 -1,1 9,0 -0,4 9,3 0,9 9,9 -2,9 9,1 -1,8 8,7
VNIIM -3,3 5,6 -2,0 6,8 -1,2 7,3 -0,9 9,9 -3,8 7,0 -2,7 6,5
NIST 0,6 4,0 1,8 5,6 2,6 6,2 2,9 9,1 3,8 7,0 1,1 5,2
NMi-VSL -0,5 2,9 0,8 4,9 1,5 5,6 1,8 8,7 2,7 6,5 -1,1 5,2
NIST
pC/(m/s²)x10-4 pC/(m/s²)x10-4
NRC KRISS
pC/(m/s²)x10-4
CSIR-NML CENAMCSIRO-NML CMIPTB BNM-CESTA
pC/(m/s²)x10-4
Matrix of equivalence
pC/(m/s²)x10-4
pC/(m/s²)x10-4
NMIJ
pC/(m/s²)x10-4
pC/(m/s²)x10-4 pC/(m/s²)x10-4 pC/(m/s²)x10-4 pC/(m/s²)x10-4 pC/(m/s²)x10-4 pC/(m/s²)x10-4
pC/(m/s²)x10-4
NMi-VSLVNIIM

118
Table C11a: Matrix of equivalence for BB accelerometer at 400 Hz
Key comparison CCAUV.V-K2 Back-to-back (BB) accelerometer type 8305 S/N 1483337
Lab j Frequency 400 Hz
Lab i
D i U i D ij U ij D ij U ij D ij U ij D ij U ij D ij U ij D ij U ij
PTB -0,2 0,8 -3,6 6,5 -0,6 4,0 -0,1 7,0 -4,6 7,7 0,7 6,5
BNM-CESTA 3,4 6,3 3,6 6,5 3,0 7,4 3,5 9,3 -1,0 9,9 4,2 9,0
CSIRO-NML 0,4 3,7 0,6 4,0 -3,0 7,4 0,5 7,8 -4,0 8,5 1,2 7,4
CMI -0,2 6,8 0,1 7,0 -3,5 9,3 -0,5 7,8 -4,5 10,2 0,7 9,3
CSIR-NML 4,4 7,6 4,6 7,7 1,0 9,9 4,0 8,5 4,5 10,2 5,2 9,9
CENAM -0,8 6,3 -0,7 6,5 -4,2 9,0 -1,2 7,4 -0,7 9,3 -5,2 9,9
NRC 1,1 3,7 1,3 4,0 -2,3 7,4 0,7 5,4 1,2 7,8 -3,3 8,5 1,9 7,4
KRISS -0,9 4,5 -0,7 4,7 -4,2 7,8 -1,2 5,9 -0,7 8,2 -5,2 8,9 -0,1 7,8
NMIJ 0,1 8,0 0,3 8,2 -3,3 10,3 -0,3 9,0 0,2 10,6 -4,3 11,1 0,9 10,3
VNIIM 1,4 5,5 1,6 5,7 -2,0 8,5 1,0 6,8 1,5 8,8 -3,0 9,4 2,2 8,4
NIST -0,7 3,7 -0,5 4,0 -4,0 7,4 -1,0 5,4 -0,5 7,8 -5,0 8,5 0,2 7,4
NMi-VSL -1,7 4,8 -1,5 5,1 -5,1 8,0 -2,1 6,2 -1,6 8,4 -6,1 9,1 -0,9 8,0
Lab i
D i U i D ij U ij D ij U ij D ij U ij D ij U ij D ij U ij D ij U ij
PTB -0,2 0,8 -1,3 4,0 0,7 4,7 -0,3 8,2 -1,6 5,7 0,5 4,0 1,5 5,1
BNM-CESTA 3,4 6,3 2,3 7,4 4,2 7,8 3,3 10,3 2,0 8,5 4,0 7,4 5,1 8,0
CSIRO-NML 0,4 3,7 -0,7 5,4 1,2 5,9 0,3 9,0 -1,0 6,8 1,0 5,4 2,1 6,2
CMI -0,2 6,8 -1,2 7,8 0,7 8,2 -0,2 10,6 -1,5 8,8 0,5 7,8 1,6 8,4
CSIR-NML 4,4 7,6 3,3 8,5 5,2 8,9 4,3 11,1 3,0 9,4 5,0 8,5 6,1 9,1
CENAM -0,8 6,3 -1,9 7,4 0,1 7,8 -0,9 10,3 -2,2 8,4 -0,2 7,4 0,9 8,0
NRC 1,1 3,7 1,9 5,9 1,0 9,0 -0,3 6,8 1,7 5,4 2,8 6,2
KRISS -0,9 4,5 -1,9 5,9 -0,9 9,3 -2,2 7,2 -0,2 5,9 0,9 6,7
NMIJ 0,1 8,0 -1,0 9,0 0,9 9,3 -1,3 9,8 0,7 9,0 1,8 9,5
VNIIM 1,4 5,5 0,3 6,8 2,2 7,2 1,3 9,8 2,0 6,7 3,1 7,4
NIST -0,7 3,7 -1,7 5,4 0,2 5,9 -0,7 9,0 -2,0 6,7 1,1 6,2
NMi-VSL -1,7 4,8 -2,8 6,2 -0,9 6,7 -1,8 9,5 -3,1 7,4 -1,1 6,2
pC/(m/s²)x10-4
pC/(m/s²)x10-4 pC/(m/s²)x10-4 pC/(m/s²)x10-4 pC/(m/s²)x10-4 pC/(m/s²)x10-4 pC/(m/s²)x10-4
pC/(m/s²)x10-4 pC/(m/s²)x10-4
NMi-VSL
CSIR-NML CENAMCSIRO-NML CMI
NIST
pC/(m/s²)x10-4 pC/(m/s²)x10-4
NRC KRISS
pC/(m/s²)x10-4
Matrix of equivalence
pC/(m/s²)x10-4
NMIJ VNIIM
PTB BNM-CESTA
pC/(m/s²)x10-4

119
Table C11b: Matrix of equivalence for SE accelerometer at 400 Hz
Key comparison CCAUV.V-K1 Single-ended (SE) accelerometer type 8305 WH 2335 S/N 1610174
Lab j Frequency 400 Hz
Lab i
D i U i D ij U ij D ij U ij D ij U ij D ij U ij D ij U ij D ij U ij
PTB -0,2 0,8 -4,5 6,6 -0,5 4,1 -1,1 6,1 -3,5 7,9 -0,5 6,6
BNM-CESTA 4,4 6,4 4,5 6,6 4,0 7,5 3,4 8,8 1,0 10,1 4,0 9,1
CSIRO-NML 0,4 3,7 0,5 4,1 -4,0 7,5 -0,6 7,1 -3,0 8,7 0,0 7,5
CMI 1,0 5,9 1,1 6,1 -3,4 8,8 0,6 7,1 -2,4 9,8 0,6 8,8
CSIR-NML 3,4 7,7 3,5 7,9 -1,0 10,1 3,0 8,7 2,4 9,8 3,0 10,1
CENAM 0,4 6,4 0,5 6,6 -4,0 9,1 0,0 7,5 -0,6 8,8 -3,0 10,1
NRC -0,4 3,8 -0,3 4,1 -4,7 7,6 -0,7 5,5 -1,3 7,1 -3,7 8,7 -0,7 7,5
KRISS -1,8 4,5 -1,7 4,8 -6,2 8,0 -2,2 6,0 -2,8 7,5 -5,2 9,0 -2,2 7,9
NMIJ -2,2 14,5 -2,1 14,6 -6,6 15,9 -2,6 15,1 -3,2 15,7 -5,6 16,5 -2,6 15,9
VNIIM -3,8 5,6 -3,7 5,8 -8,2 8,6 -4,2 6,9 -4,8 8,2 -7,2 9,6 -4,2 8,6
NIST 1,4 3,7 1,5 4,1 -3,0 7,5 1,0 5,5 0,4 7,1 -2,0 8,7 1,0 7,5
NMi-VSL 0,1 4,8 0,3 5,1 -4,3 8,1 -0,3 6,2 -0,9 7,7 -3,3 9,2 -0,3 8,1
Lab i
D i U i D ij U ij D ij U ij D ij U ij D ij U ij D ij U ij D ij U ij
PTB -0,2 0,8 0,3 4,1 1,7 4,8 2,1 14,6 3,7 5,8 -1,5 4,1 -0,3 5,1
BNM-CESTA 4,4 6,4 4,7 7,6 6,2 8,0 6,6 15,9 8,2 8,6 3,0 7,5 4,3 8,1
CSIRO-NML 0,4 3,7 0,7 5,5 2,2 6,0 2,6 15,1 4,2 6,9 -1,0 5,5 0,3 6,2
CMI 1,0 5,9 1,3 7,1 2,8 7,5 3,2 15,7 4,8 8,2 -0,4 7,1 0,9 7,7
CSIR-NML 3,4 7,7 3,7 8,7 5,2 9,0 5,6 16,5 7,2 9,6 2,0 8,7 3,3 9,2
CENAM 0,4 6,4 0,7 7,5 2,2 7,9 2,6 15,9 4,2 8,6 -1,0 7,5 0,3 8,1
NRC -0,4 3,8 1,5 6,1 1,9 15,1 3,5 6,9 -1,7 5,5 -0,5 6,3
KRISS -1,8 4,5 -1,5 6,1 0,4 15,3 2,0 7,3 -3,2 6,0 -1,9 6,8
NMIJ -2,2 14,5 -1,9 15,1 -0,4 15,3 1,6 15,6 -3,6 15,1 -2,3 15,4
VNIIM -3,8 5,6 -3,5 6,9 -2,0 7,3 -1,6 15,6 -5,2 6,9 -3,9 7,5
NIST 1,4 3,7 1,7 5,5 3,2 6,0 3,6 15,1 5,2 6,9 1,3 6,3
NMi-VSL 0,1 4,8 0,5 6,3 1,9 6,8 2,3 15,4 3,9 7,5 -1,3 6,3
NIST
pC/(m/s²)x10-4 pC/(m/s²)x10-4
NRC KRISS
pC/(m/s²)x10-4
CSIR-NML CENAMCSIRO-NML CMIPTB BNM-CESTA
pC/(m/s²)x10-4
Matrix of equivalence
pC/(m/s²)x10-4
pC/(m/s²)x10-4
NMIJ
pC/(m/s²)x10-4
pC/(m/s²)x10-4 pC/(m/s²)x10-4 pC/(m/s²)x10-4 pC/(m/s²)x10-4 pC/(m/s²)x10-4 pC/(m/s²)x10-4
pC/(m/s²)x10-4
NMi-VSLVNIIM

120
Table C12a: Matrix of equivalence for BB accelerometer at 500 Hz
Key comparison CCAUV.V-K2 Back-to-back (BB) accelerometer type 8305 S/N 1483337
Lab j Frequency 500 Hz
Lab i
D i U i D ij U ij D ij U ij D ij U ij D ij U ij D ij U ij D ij U ij
PTB -0,2 0,8 -2,8 6,5 -0,8 4,0 -0,8 7,0 -4,8 7,7 0,5 6,5
BNM-CESTA 2,7 6,3 2,8 6,5 2,0 7,4 2,0 9,3 -2,0 9,9 3,3 9,0
CSIRO-NML 0,7 3,7 0,8 4,0 -2,0 7,4 0,0 7,8 -4,0 8,5 1,3 7,4
CMI 0,7 6,8 0,8 7,0 -2,0 9,3 0,0 7,8 -4,0 10,2 1,3 9,3
CSIR-NML 4,7 7,6 4,8 7,7 2,0 9,9 4,0 8,5 4,0 10,2 5,3 9,9
CENAM -0,7 6,3 -0,5 6,5 -3,3 9,0 -1,3 7,4 -1,3 9,3 -5,3 9,9
NRC -1,3 5,8 -1,2 6,0 -4,0 8,7 -2,0 7,0 -2,0 9,0 -6,0 9,6 -0,7 8,7
KRISS -0,5 4,5 -0,4 4,7 -3,1 7,8 -1,1 5,9 -1,1 8,2 -5,1 8,9 0,2 7,8
NMIJ -0,8 6,3 -0,7 6,5 -3,5 9,0 -1,5 7,4 -1,5 9,3 -5,5 9,9 -0,2 8,9
VNIIM 3,1 5,5 3,2 5,7 0,4 8,5 2,4 6,8 2,4 8,8 -1,6 9,5 3,7 8,4
NIST -2,3 4,2 -2,2 4,5 -5,0 7,7 -3,0 5,7 -3,0 8,1 -7,0 8,8 -1,7 7,6
NMi-VSL -0,2 3,1 -0,1 3,5 -2,8 7,1 -0,8 5,0 -0,8 7,6 -4,8 8,3 0,5 7,1
Lab iD i U i D ij U ij D ij U ij D ij U ij D ij U ij D ij U ij D ij U ij
PTB -0,2 0,8 1,2 6,0 0,4 4,7 0,7 6,5 -3,2 5,7 2,2 4,5 0,1 3,5
BNM-CESTA 2,7 6,3 4,0 8,7 3,1 7,8 3,5 9,0 -0,4 8,5 5,0 7,7 2,8 7,1
CSIRO-NML 0,7 3,7 2,0 7,0 1,1 5,9 1,5 7,4 -2,4 6,8 3,0 5,7 0,8 5,0
CMI 0,7 6,8 2,0 9,0 1,1 8,2 1,5 9,3 -2,4 8,8 3,0 8,1 0,8 7,6
CSIR-NML 4,7 7,6 6,0 9,6 5,1 8,9 5,5 9,9 1,6 9,5 7,0 8,8 4,8 8,3
CENAM -0,7 6,3 0,7 8,7 -0,2 7,8 0,2 8,9 -3,7 8,4 1,7 7,6 -0,5 7,1
NRC -1,3 5,8 -0,9 7,5 -0,5 8,7 -4,4 8,1 1,0 7,3 -1,2 6,8
KRISS -0,5 4,5 0,9 7,5 0,4 7,8 -3,5 7,2 1,9 6,3 -0,4 5,6
NMIJ -0,8 6,3 0,5 8,7 -0,4 7,8 -3,9 8,4 1,5 7,6 -0,7 7,1
VNIIM 3,1 5,5 4,4 8,1 3,5 7,2 3,9 8,4 5,4 7,0 3,2 6,5
NIST -2,3 4,2 -1,0 7,3 -1,9 6,3 -1,5 7,6 -5,4 7,0 -2,2 5,4
NMi-VSL -0,2 3,1 1,2 6,8 0,4 5,6 0,7 7,1 -3,2 6,5 2,2 5,4
pC/(m/s²)x10-4
pC/(m/s²)x10-4 pC/(m/s²)x10-4 pC/(m/s²)x10-4 pC/(m/s²)x10-4 pC/(m/s²)x10-4 pC/(m/s²)x10-4
pC/(m/s²)x10-4 pC/(m/s²)x10-4
NMi-VSL
CSIR-NML CENAMCSIRO-NML CMI
NIST
pC/(m/s²)x10-4 pC/(m/s²)x10-4
NRC KRISS
pC/(m/s²)x10-4
Matrix of equivalence
pC/(m/s²)x10-4
NMIJ VNIIM
PTB BNM-CESTA
pC/(m/s²)x10-4

121
Table C12b: Matrix of equivalence for SE accelerometer at 500 Hz
Key comparison CCAUV.V-K1 Single-ended (SE) accelerometer type 8305 WH 2335 S/N 1610174
Lab j Frequency 500 Hz
Lab i
D i U i D ij U ij D ij U ij D ij U ij D ij U ij D ij U ij D ij U ij
PTB -0,2 0,8 -3,2 6,6 -0,3 4,1 -1,2 6,1 -2,2 7,9 -0,7 6,6
BNM-CESTA 3,0 6,4 3,2 6,6 3,0 7,5 2,0 8,8 1,0 10,1 2,5 9,1
CSIRO-NML 0,1 3,7 0,3 4,1 -3,0 7,5 -1,0 7,1 -2,0 8,7 -0,5 7,5
CMI 1,0 5,9 1,2 6,1 -2,0 8,8 1,0 7,1 -1,0 9,8 0,5 8,8
CSIR-NML 2,0 7,7 2,2 7,9 -1,0 10,1 2,0 8,7 1,0 9,8 1,5 10,1
CENAM 0,6 6,4 0,7 6,6 -2,5 9,1 0,5 7,5 -0,5 8,8 -1,5 10,1
NRC -1,3 5,9 -1,1 6,2 -4,3 8,8 -1,3 7,2 -2,3 8,5 -3,3 9,8 -1,8 8,8
KRISS -1,8 4,5 -1,6 4,8 -4,8 8,0 -1,8 6,0 -2,9 7,5 -3,8 9,0 -2,3 8,0
NMIJ -1,7 19,3 -1,5 19,4 -4,7 20,4 -1,7 19,7 -2,7 20,2 -3,7 20,8 -2,2 20,4
VNIIM -5,2 5,6 -5,0 5,8 -8,2 8,6 -5,2 6,9 -6,2 8,2 -7,2 9,6 -5,7 8,6
NIST 1,0 4,3 1,2 4,6 -2,0 7,8 1,0 5,9 0,0 7,4 -1,0 8,9 0,5 7,8
NMi-VSL 1,9 2,9 2,1 3,4 -1,1 7,2 1,9 5,0 0,9 6,7 -0,2 8,4 1,4 7,2
Lab i
D i U i D ij U ij D ij U ij D ij U ij D ij U ij D ij U ij D ij U ij
PTB -0,2 0,8 1,1 6,2 1,6 4,8 1,5 19,4 5,0 5,8 -1,2 4,6 -2,1 3,4
BNM-CESTA 3,0 6,4 4,3 8,8 4,8 8,0 4,7 20,4 8,2 8,6 2,0 7,8 1,1 7,2
CSIRO-NML 0,1 3,7 1,3 7,2 1,8 6,0 1,7 19,7 5,2 6,9 -1,0 5,9 -1,9 5,0
CMI 1,0 5,9 2,3 8,5 2,9 7,5 2,7 20,2 6,2 8,2 0,0 7,4 -0,9 6,7
CSIR-NML 2,0 7,7 3,3 9,8 3,8 9,0 3,7 20,8 7,2 9,6 1,0 8,9 0,2 8,4
CENAM 0,6 6,4 1,8 8,8 2,3 8,0 2,2 20,4 5,7 8,6 -0,5 7,8 -1,4 7,2
NRC -1,3 5,9 0,6 7,6 0,4 20,3 3,9 8,3 -2,3 7,5 -3,2 6,8
KRISS -1,8 4,5 -0,6 7,6 -0,2 19,9 3,4 7,3 -2,9 6,4 -3,7 5,6
NMIJ -1,7 19,3 -0,4 20,3 0,2 19,9 3,5 20,2 -2,7 19,8 -3,6 19,6
VNIIM -5,2 5,6 -3,9 8,3 -3,4 7,3 -3,5 20,2 -6,2 7,2 -7,1 6,5
NIST 1,0 4,3 2,3 7,5 2,9 6,4 2,7 19,8 6,2 7,2 -0,9 5,4
NMi-VSL 1,9 2,9 3,2 6,8 3,7 5,6 3,6 19,6 7,1 6,5 0,9 5,4
NIST
pC/(m/s²)x10-4 pC/(m/s²)x10-4
NRC KRISS
pC/(m/s²)x10-4
CSIR-NML CENAMCSIRO-NML CMIPTB BNM-CESTA
pC/(m/s²)x10-4
Matrix of equivalence
pC/(m/s²)x10-4
pC/(m/s²)x10-4
NMIJ
pC/(m/s²)x10-4
pC/(m/s²)x10-4 pC/(m/s²)x10-4 pC/(m/s²)x10-4 pC/(m/s²)x10-4 pC/(m/s²)x10-4 pC/(m/s²)x10-4
pC/(m/s²)x10-4
NMi-VSLVNIIM

122
Table C13a: Matrix of equivalence for BB accelerometer at 630 HzKey comparison CCAUV.V-K2 Back-to-back (BB) accelerometer type 8305 S/N 1483337
Lab j Frequency 630 Hz
Lab i
D i U i D ij U ij D ij U ij D ij U ij D ij U ij D ij U ij D ij U ij
PTB -0,3 0,8 -2,2 6,5 -0,3 4,0 0,2 7,0 -1,2 6,5 0,7 6,5
BNM-CESTA 2,0 6,3 2,2 6,5 2,0 7,4 2,4 9,3 1,0 9,0 2,9 9,0
CSIRO-NML -0,1 3,7 0,3 4,0 -2,0 7,4 0,4 7,8 -1,0 7,4 0,9 7,4
CMI -0,4 6,8 -0,2 7,0 -2,4 9,3 -0,4 7,8 -1,4 9,3 0,5 9,3
CSIR-NML 1,0 6,3 1,2 6,5 -1,0 9,0 1,0 7,4 1,4 9,3 1,9 9,0
CENAM -0,9 6,3 -0,7 6,5 -2,9 9,0 -0,9 7,4 -0,5 9,3 -1,9 9,0
NRC -0,2 4,1 0,2 4,4 -2,1 7,6 -0,1 5,7 0,3 8,1 -1,1 7,6 0,8 7,6
KRISS -0,7 4,5 -0,5 4,7 -2,7 7,8 -0,7 5,9 -0,3 8,2 -1,7 7,8 0,2 7,8
NMIJ -1,3 5,7 -1,1 6,0 -3,3 8,6 -1,3 7,0 -0,9 9,0 -2,3 8,6 -0,4 8,6
VNIIM 2,4 5,5 2,6 5,7 0,4 8,5 2,4 6,8 2,8 8,8 1,4 8,4 3,3 8,4
NIST -4,0 5,0 -3,8 5,2 -6,0 8,1 -4,0 6,3 -3,6 8,5 -5,0 8,1 -3,1 8,1
NMi-VSL 3,7 3,6 3,9 3,9 1,7 7,3 3,7 5,3 4,1 7,8 2,7 7,3 4,6 7,3
Lab i
D i U i D ij U ij D ij U ij D ij U ij D ij U ij D ij U ij D ij U ij
PTB -0,3 0,8 -0,2 4,4 0,5 4,7 1,1 6,0 -2,6 5,7 3,8 5,2 -3,9 3,9
BNM-CESTA 2,0 6,3 2,1 7,6 2,7 7,8 3,3 8,6 -0,4 8,5 6,0 8,1 -1,7 7,3
CSIRO-NML -0,1 3,7 0,1 5,7 0,7 5,9 1,3 7,0 -2,4 6,8 4,0 6,3 -3,7 5,3
CMI -0,4 6,8 -0,3 8,1 0,3 8,2 0,9 9,0 -2,8 8,8 3,6 8,5 -4,1 7,8
CSIR-NML 1,0 6,3 1,1 7,6 1,7 7,8 2,3 8,6 -1,4 8,4 5,0 8,1 -2,7 7,3
CENAM -0,9 6,3 -0,8 7,6 -0,2 7,8 0,4 8,6 -3,3 8,4 3,1 8,1 -4,6 7,3
NRC -0,2 4,1 0,6 6,2 1,2 7,2 -2,5 7,0 3,9 6,6 -3,8 5,6
KRISS -0,7 4,5 -0,6 6,2 0,6 7,4 -3,1 7,2 3,3 6,8 -4,4 5,9
NMIJ -1,3 5,7 -1,2 7,2 -0,6 7,4 -3,7 8,1 2,7 7,7 -5,0 6,9
VNIIM 2,4 5,5 2,5 7,0 3,1 7,2 3,7 8,1 6,4 7,5 -1,3 6,7
NIST -4,0 5,0 -3,9 6,6 -3,3 6,8 -2,7 7,7 -6,4 7,5 -7,7 6,3
NMi-VSL 3,7 3,6 3,8 5,6 4,4 5,9 5,0 6,9 1,3 6,7 7,7 6,3
pC/(m/s²)x10-4
pC/(m/s²)x10-4 pC/(m/s²)x10-4 pC/(m/s²)x10-4 pC/(m/s²)x10-4 pC/(m/s²)x10-4 pC/(m/s²)x10-4
pC/(m/s²)x10-4 pC/(m/s²)x10-4
NMi-VSL
CSIR-NML CENAMCSIRO-NML CMI
NIST
pC/(m/s²)x10-4 pC/(m/s²)x10-4
NRC KRISS
pC/(m/s²)x10-4
Matrix of equivalence
pC/(m/s²)x10-4
NMIJ VNIIM
PTB BNM-CESTA
pC/(m/s²)x10-4

123
Table C13b: Matrix of equivalence for SE accelerometer at 630 Hz
Key comparison CCAUV.V-K1 Single-ended (SE) accelerometer type 8305 WH 2335 S/N 1610174
Lab j Frequency 630 Hz
Lab i
D i U i D ij U ij D ij U ij D ij U ij D ij U ij D ij U ij D ij U ij
PTB 0,2 0,8 -2,2 6,6 -0,3 4,1 -1,3 8,6 -2,2 7,9 0,5 6,6
BNM-CESTA 2,3 6,4 2,2 6,6 2,0 7,5 0,9 10,7 0,0 10,1 2,7 9,1
CSIRO-NML 0,4 3,7 0,3 4,1 -2,0 7,5 -1,1 9,4 -2,0 8,7 0,7 7,5
CMI 1,4 8,5 1,3 8,6 -0,9 10,7 1,1 9,4 -0,9 11,5 1,8 10,7
CSIR-NML 2,3 7,7 2,2 7,9 0,0 10,1 2,0 8,7 0,9 11,5 2,7 10,1
CENAM -0,4 6,4 -0,5 6,6 -2,7 9,1 -0,7 7,5 -1,8 10,7 -2,7 10,1
NRC -3,2 4,2 -3,3 4,5 -5,5 7,8 -3,5 5,8 -4,6 9,6 -5,5 8,9 -2,8 7,8
KRISS -2,2 4,5 -2,3 4,8 -4,5 8,0 -2,5 6,0 -3,6 9,7 -4,5 9,0 -1,8 8,0
NMIJ -3,8 9,2 -3,9 9,4 -6,1 11,3 -4,1 10,1 -5,2 12,6 -6,1 12,1 -3,4 11,3
VNIIM -5,1 5,6 -5,2 5,8 -7,4 8,6 -5,4 6,9 -6,5 10,2 -7,4 9,6 -4,7 8,6
NIST 0,4 5,1 0,3 5,3 -2,0 8,3 0,0 6,5 -1,1 10,0 -2,0 9,3 0,7 8,3
NMi-VSL 2,9 3,2 2,8 3,6 0,6 7,3 2,6 5,1 1,5 9,2 0,6 8,5 3,3 7,3
Lab i
D i U i D ij U ij D ij U ij D ij U ij D ij U ij D ij U ij D ij U ij
PTB 0,2 0,8 3,3 4,5 2,3 4,8 3,9 9,4 5,2 5,8 -0,3 5,3 -2,8 3,6
BNM-CESTA 2,3 6,4 5,5 7,8 4,5 8,0 6,1 11,3 7,4 8,6 2,0 8,3 -0,6 7,3
CSIRO-NML 0,4 3,7 3,5 5,8 2,5 6,0 4,1 10,1 5,4 6,9 0,0 6,5 -2,6 5,1
CMI 1,4 8,5 4,6 9,6 3,6 9,7 5,2 12,6 6,5 10,2 1,1 10,0 -1,5 9,2
CSIR-NML 2,3 7,7 5,5 8,9 4,5 9,0 6,1 12,1 7,4 9,6 2,0 9,3 -0,6 8,5
CENAM -0,4 6,4 2,8 7,8 1,8 8,0 3,4 11,3 4,7 8,6 -0,7 8,3 -3,3 7,3
NRC -3,2 4,2 -1,0 6,3 0,6 10,2 1,9 7,1 -3,5 6,7 -6,1 5,5
KRISS -2,2 4,5 1,0 6,3 1,6 10,4 2,9 7,3 -2,5 6,9 -5,1 5,7
NMIJ -3,8 9,2 -0,6 10,2 -1,6 10,4 1,3 10,9 -4,1 10,6 -6,7 9,9
VNIIM -5,1 5,6 -1,9 7,1 -2,9 7,3 -1,3 10,9 -5,4 7,7 -8,0 6,6
NIST 0,4 5,1 3,5 6,7 2,5 6,9 4,1 10,6 5,4 7,7 -2,6 6,2
NMi-VSL 2,9 3,2 6,1 5,5 5,1 5,7 6,7 9,9 8,0 6,6 2,6 6,2
NIST
pC/(m/s²)x10-4 pC/(m/s²)x10-4
NRC KRISS
pC/(m/s²)x10-4
CSIR-NML CENAMCSIRO-NML CMIPTB BNM-CESTA
pC/(m/s²)x10-4
Matrix of equivalence
pC/(m/s²)x10-4
pC/(m/s²)x10-4
NMIJ
pC/(m/s²)x10-4
pC/(m/s²)x10-4 pC/(m/s²)x10-4 pC/(m/s²)x10-4 pC/(m/s²)x10-4 pC/(m/s²)x10-4 pC/(m/s²)x10-4
pC/(m/s²)x10-4
NMi-VSLVNIIM

124
Table C14a: Matrix of equivalence for BB accelerometer at 800 Hz
Key comparison CCAUV.V-K2 Back-to-back (BB) accelerometer type 8305 S/N 1483337
Lab j Frequency 800 Hz
Lab i
D i U i D ij U ij D ij U ij D ij U ij D ij U ij D ij U ij D ij U ij
PTB -0,4 0,8 -3,1 6,5 -0,1 4,0 -0,1 7,0 -2,1 6,5 0,3 6,5
BNM-CESTA 2,7 6,3 3,1 6,5 3,0 7,4 3,0 9,3 1,0 9,0 3,3 9,0
CSIRO-NML -0,4 3,7 0,1 4,0 -3,0 7,4 0,0 7,8 -2,0 7,4 0,3 7,4
CMI -0,4 6,8 0,1 7,0 -3,0 9,3 0,0 7,8 -2,0 9,3 0,3 9,3
CSIR-NML 1,7 6,3 2,1 6,5 -1,0 9,0 2,0 7,4 2,0 9,3 2,3 9,0
CENAM -0,6 6,3 -0,3 6,5 -3,3 9,0 -0,3 7,4 -0,3 9,3 -2,3 9,0
NRC 1,4 5,4 1,8 5,6 -1,3 8,4 1,7 6,7 1,7 8,8 -0,3 8,4 2,0 8,4
KRISS -0,8 4,4 -0,4 4,7 -3,5 7,8 -0,5 5,9 -0,5 8,2 -2,5 7,8 -0,2 7,8
NMIJ -1,2 6,6 -0,8 6,8 -3,9 9,2 -0,9 7,7 -0,9 9,6 -2,9 9,2 -0,6 9,2
VNIIM 3,5 5,5 3,9 5,7 0,8 8,5 3,8 6,8 3,8 8,8 1,8 8,5 4,1 8,4
NIST -3,3 10,8 -2,9 10,9 -6,0 12,6 -3,0 11,5 -3,0 12,8 -5,0 12,6 -2,7 12,6
NMi-VSL 4,7 6,3 5,1 6,5 2,1 9,0 5,1 7,4 5,1 9,3 3,1 9,0 5,4 9,0
Lab i
D i U i D ij U ij D ij U ij D ij U ij D ij U ij D ij U ij D ij U ij
PTB -0,4 0,8 -1,8 5,6 0,4 4,7 0,8 6,8 -3,9 5,7 2,9 10,9 -5,1 6,5
BNM-CESTA 2,7 6,3 1,3 8,4 3,5 7,8 3,9 9,2 -0,8 8,5 6,0 12,6 -2,1 9,0
CSIRO-NML -0,4 3,7 -1,7 6,7 0,5 5,9 0,9 7,7 -3,8 6,8 3,0 11,5 -5,1 7,4
CMI -0,4 6,8 -1,7 8,8 0,5 8,2 0,9 9,6 -3,8 8,8 3,0 12,8 -5,1 9,3
CSIR-NML 1,7 6,3 0,3 8,4 2,5 7,8 2,9 9,2 -1,8 8,5 5,0 12,6 -3,1 9,0
CENAM -0,6 6,3 -2,0 8,4 0,2 7,8 0,6 9,2 -4,1 8,4 2,7 12,6 -5,4 9,0
NRC 1,4 5,4 2,2 7,1 2,6 8,7 -2,1 7,8 4,7 12,2 -3,4 8,4
KRISS -0,8 4,4 -2,2 7,1 0,5 8,1 -4,3 7,2 2,5 11,8 -5,5 7,8
NMIJ -1,2 6,6 -2,6 8,7 -0,5 8,1 -4,7 8,7 2,1 12,8 -6,0 9,2
VNIIM 3,5 5,5 2,1 7,8 4,3 7,2 4,7 8,7 6,8 12,2 -1,3 8,5
NIST -3,3 10,8 -4,7 12,2 -2,5 11,8 -2,1 12,8 -6,8 12,2 -8,1 12,6
NMi-VSL 4,7 6,3 3,4 8,4 5,5 7,8 6,0 9,2 1,3 8,5 8,1 12,6
pC/(m/s²)x10-4
pC/(m/s²)x10-4 pC/(m/s²)x10-4 pC/(m/s²)x10-4 pC/(m/s²)x10-4 pC/(m/s²)x10-4 pC/(m/s²)x10-4
pC/(m/s²)x10-4 pC/(m/s²)x10-4
NMi-VSL
CSIR-NML CENAMCSIRO-NML CMI
NIST
pC/(m/s²)x10-4 pC/(m/s²)x10-4
NRC KRISS
pC/(m/s²)x10-4
Matrix of equivalence
pC/(m/s²)x10-4
NMIJ VNIIM
PTB BNM-CESTA
pC/(m/s²)x10-4

125
Table C14b: Matrix of equivalence for SE accelerometer at 800 Hz
Key comparison CCAUV.V-K1 Single-ended (SE) accelerometer type 8305 WH 2335 S/N 1610174
Lab j Frequency 800 Hz
Lab i
D i U i D ij U ij D ij U ij D ij U ij D ij U ij D ij U ij D ij U ij
PTB -0,3 0,8 -3,4 6,6 0,6 4,1 -2,4 8,6 -4,4 7,9 -0,7 6,6
BNM-CESTA 3,1 6,4 3,4 6,6 4,0 7,5 1,0 10,7 -1,0 10,1 2,7 9,1
CSIRO-NML -0,9 3,7 -0,6 4,1 -4,0 7,5 -3,0 9,4 -5,0 8,7 -1,3 7,5
CMI 2,1 8,5 2,4 8,6 -1,0 10,7 3,0 9,4 -2,0 11,6 1,7 10,7
CSIR-NML 4,1 7,7 4,4 7,9 1,0 10,1 5,0 8,7 2,0 11,6 3,7 10,1
CENAM 0,4 6,4 0,7 6,6 -2,7 9,1 1,3 7,5 -1,7 10,7 -3,7 10,1
NRC 2,5 5,5 2,8 5,7 -0,6 8,6 3,4 6,8 0,4 10,2 -1,6 9,6 2,1 8,5
KRISS -1,9 4,5 -1,7 4,8 -5,0 8,0 -1,0 6,0 -4,0 9,7 -6,0 9,1 -2,3 8,0
NMIJ -2,9 8,6 -2,6 8,7 -6,0 10,8 -2,0 9,5 -5,0 12,1 -7,0 11,6 -3,3 10,8
VNIIM -4,7 5,6 -4,4 5,8 -7,8 8,6 -3,8 6,9 -6,8 10,2 -8,8 9,6 -5,1 8,6
NIST 2,1 11,1 2,4 11,2 -1,0 12,9 3,0 11,8 0,0 14,0 -2,0 13,6 1,7 12,9
NMi-VSL 6,2 5,3 6,4 5,6 3,1 8,5 7,1 6,7 4,1 10,1 2,1 9,5 5,8 8,5
Lab i
D i U i D ij U ij D ij U ij D ij U ij D ij U ij D ij U ij D ij U ij
PTB -0,3 0,8 -2,8 5,7 1,7 4,8 2,6 8,7 4,4 5,8 -2,4 11,2 -6,4 5,6
BNM-CESTA 3,1 6,4 0,6 8,6 5,0 8,0 6,0 10,8 7,8 8,6 1,0 12,9 -3,1 8,5
CSIRO-NML -0,9 3,7 -3,4 6,8 1,0 6,0 2,0 9,5 3,8 6,9 -3,0 11,8 -7,1 6,7
CMI 2,1 8,5 -0,4 10,2 4,0 9,7 5,0 12,1 6,8 10,2 0,0 14,0 -4,1 10,1
CSIR-NML 4,1 7,7 1,6 9,6 6,0 9,1 7,0 11,6 8,8 9,6 2,0 13,6 -2,1 9,5
CENAM 0,4 6,4 -2,1 8,5 2,3 8,0 3,3 10,8 5,1 8,6 -1,7 12,9 -5,8 8,5
NRC 2,5 5,5 4,4 7,3 5,4 10,3 7,2 8,0 0,4 12,5 -3,7 7,8
KRISS -1,9 4,5 -4,4 7,3 1,0 9,8 2,8 7,3 -4,0 12,1 -8,1 7,2
NMIJ -2,9 8,6 -5,4 10,3 -1,0 9,8 1,8 10,3 -5,0 14,1 -9,1 10,2
VNIIM -4,7 5,6 -7,2 8,0 -2,8 7,3 -1,8 10,3 -6,8 12,5 -10,9 7,9
NIST 2,1 11,1 -0,4 12,5 4,0 12,1 5,0 14,1 6,8 12,5 -4,1 12,4
NMi-VSL 6,2 5,3 3,7 7,8 8,1 7,2 9,1 10,2 10,9 7,9 4,1 12,4
NIST
pC/(m/s²)x10-4 pC/(m/s²)x10-4
NRC KRISS
pC/(m/s²)x10-4
CSIR-NML CENAMCSIRO-NML CMIPTB BNM-CESTA
pC/(m/s²)x10-4
Matrix of equivalence
pC/(m/s²)x10-4
pC/(m/s²)x10-4
NMIJ
pC/(m/s²)x10-4
pC/(m/s²)x10-4 pC/(m/s²)x10-4 pC/(m/s²)x10-4 pC/(m/s²)x10-4 pC/(m/s²)x10-4 pC/(m/s²)x10-4
pC/(m/s²)x10-4
NMi-VSLVNIIM

126
Table C15a: Matrix of equivalence for BB accelerometer at 1000 Hz
Key comparison CCAUV.V-K2 Back-to-back (BB) accelerometer type 8305 S/N 1483337
Lab j Frequency 1000 Hz
Lab i
D i U i D ij U ij D ij U ij D ij U ij D ij U ij D ij U ij D ij U ij
PTB -0,2 0,8 -2,2 6,5 -1,2 4,0 0,5 7,0 -0,3 7,7 0,4 10,2
BNM-CESTA 2,0 6,3 2,2 6,5 1,0 7,4 2,7 9,3 2,0 9,9 2,6 12,0
CSIRO-NML 1,0 3,7 1,2 4,0 -1,0 7,4 1,7 7,8 1,0 8,5 1,6 10,8
CMI -0,7 6,8 -0,5 7,0 -2,7 9,3 -1,7 7,8 -0,7 10,2 -0,1 12,2
CSIR-NML 0,1 7,5 0,3 7,7 -2,0 9,9 -1,0 8,5 0,7 10,2 0,6 12,7
CENAM -0,6 10,1 -0,4 10,2 -2,6 12,0 -1,6 10,8 0,1 12,2 -0,6 12,7
NRC 1,0 6,7 1,2 6,9 -1,0 9,3 0,0 7,8 1,7 9,6 1,0 10,2 1,6 12,2
KRISS -1,0 4,7 -0,8 5,0 -3,0 8,0 -2,0 6,1 -0,3 8,4 -1,0 9,0 -0,4 11,2
NMIJ -0,8 3,9 -0,6 4,2 -2,8 7,5 -1,8 5,6 -0,1 8,0 -0,8 8,6 -0,2 10,9
VNIIM 6,4 5,5 6,6 5,7 4,4 8,5 5,4 6,8 7,1 8,8 6,4 9,5 7,0 11,6
NIST -4,0 5,5 -3,8 5,7 -6,0 8,4 -5,0 6,7 -3,3 8,8 -4,0 9,4 -3,4 11,6
NMi-VSL 2,5 13,4 2,7 13,5 0,5 14,9 1,5 14,0 3,2 15,1 2,5 15,5 3,1 16,9
Lab i
D i U i D ij U ij D ij U ij D ij U ij D ij U ij D ij U ij D ij U ij
PTB -0,2 0,8 -1,2 6,9 0,8 5,0 0,6 4,2 -6,6 5,7 3,8 5,7 -2,7 13,5
BNM-CESTA 2,0 6,3 1,0 9,3 3,0 8,0 2,8 7,5 -4,4 8,5 6,0 8,4 -0,5 14,9
CSIRO-NML 1,0 3,7 0,0 7,8 2,0 6,1 1,8 5,6 -5,4 6,8 5,0 6,7 -1,5 14,0
CMI -0,7 6,8 -1,7 9,6 0,3 8,4 0,1 8,0 -7,1 8,8 3,3 8,8 -3,2 15,1
CSIR-NML 0,1 7,5 -1,0 10,2 1,0 9,0 0,8 8,6 -6,4 9,5 4,0 9,4 -2,5 15,5
CENAM -0,6 10,1 -1,6 12,2 0,4 11,2 0,2 10,9 -7,0 11,6 3,4 11,6 -3,1 16,9
NRC 1,0 6,7 2,0 8,3 1,8 7,9 -5,4 8,8 5,0 8,8 -1,5 15,1
KRISS -1,0 4,7 -2,0 8,3 -0,2 6,3 -7,4 7,4 3,0 7,4 -3,5 14,3
NMIJ -0,8 3,9 -1,8 7,9 0,2 6,3 -7,2 6,9 3,2 6,9 -3,3 14,1
VNIIM 6,4 5,5 5,4 8,8 7,4 7,4 7,2 6,9 10,4 7,9 3,9 14,6
NIST -4,0 5,5 -5,0 8,8 -3,0 7,4 -3,2 6,9 -10,4 7,9 -6,5 14,6
NMi-VSL 2,5 13,4 1,5 15,1 3,5 14,3 3,3 14,1 -3,9 14,6 6,5 14,6
pC/(m/s²)x10-4
pC/(m/s²)x10-4 pC/(m/s²)x10-4 pC/(m/s²)x10-4 pC/(m/s²)x10-4 pC/(m/s²)x10-4 pC/(m/s²)x10-4
pC/(m/s²)x10-4 pC/(m/s²)x10-4
NMi-VSL
CSIR-NML CENAMCSIRO-NML CMI
NIST
pC/(m/s²)x10-4 pC/(m/s²)x10-4
NRC KRISS
pC/(m/s²)x10-4
Matrix of equivalence
pC/(m/s²)x10-4
NMIJ VNIIM
PTB BNM-CESTA
pC/(m/s²)x10-4

127
Table C15b: Matrix of equivalence for SE accelerometer at 1000 Hz
Key comparison CCAUV.V-K1 Single-ended (SE) accelerometer type 8305 WH 2335 S/N 1610174
Lab j Frequency 1000 Hz
Lab i
D i U i D ij U ij D ij U ij D ij U ij D ij U ij D ij U ij D ij U ij
PTB -0,1 0,7 -0,4 6,6 0,6 4,1 -1,7 8,6 -2,4 7,9 -1,5 10,4
BNM-CESTA 0,4 6,4 0,4 6,6 1,0 7,5 -1,3 10,7 -2,0 10,1 -1,1 12,2
CSIRO-NML -0,6 3,7 -0,6 4,1 -1,0 7,5 -2,3 9,4 -3,0 8,7 -2,1 11,1
CMI 1,7 8,5 1,7 8,6 1,3 10,7 2,3 9,4 -0,7 11,5 0,2 13,4
CSIR-NML 2,4 7,7 2,4 7,9 2,0 10,1 3,0 8,7 0,7 11,5 0,9 12,9
CENAM 1,5 10,3 1,5 10,4 1,1 12,2 2,1 11,1 -0,2 13,4 -0,9 12,9
NRC 0,9 6,8 0,9 7,0 0,5 9,5 1,5 7,9 -0,8 11,0 -1,5 10,4 -0,6 12,5
KRISS -2,2 6,1 -2,1 6,3 -2,6 9,0 -1,6 7,3 -3,8 10,6 -4,6 9,9 -3,7 12,1
NMIJ 2,9 6,0 2,9 6,2 2,5 8,9 3,5 7,2 1,2 10,5 0,5 9,9 1,4 12,0
VNIIM -4,4 5,6 -4,4 5,8 -4,8 8,6 -3,8 6,9 -6,1 10,3 -6,8 9,6 -5,9 11,8
NIST 2,4 5,6 2,4 5,8 2,0 8,6 3,0 6,9 0,7 10,3 0,0 9,6 0,9 11,8
NMi-VSL 4,7 20,7 4,7 20,8 4,3 21,7 5,3 21,1 3,0 22,4 2,3 22,2 3,2 23,2
Lab i
D i U i D ij U ij D ij U ij D ij U ij D ij U ij D ij U ij D ij U ij
PTB -0,1 0,7 -0,9 7,0 2,1 6,3 -2,9 6,2 4,4 5,8 -2,4 5,8 -4,7 20,8
BNM-CESTA 0,4 6,4 -0,5 9,5 2,6 9,0 -2,5 8,9 4,8 8,6 -2,0 8,6 -4,3 21,7
CSIRO-NML -0,6 3,7 -1,5 7,9 1,6 7,3 -3,5 7,2 3,8 6,9 -3,0 6,9 -5,3 21,1
CMI 1,7 8,5 0,8 11,0 3,8 10,6 -1,2 10,5 6,1 10,3 -0,7 10,3 -3,0 22,4
CSIR-NML 2,4 7,7 1,5 10,4 4,6 9,9 -0,5 9,9 6,8 9,6 0,0 9,6 -2,3 22,2
CENAM 1,5 10,3 0,6 12,5 3,7 12,1 -1,4 12,0 5,9 11,8 -0,9 11,8 -3,2 23,2
NRC 0,9 6,8 3,0 9,3 -2,0 9,2 5,3 8,9 -1,5 9,0 -3,8 21,9
KRISS -2,2 6,1 -3,0 9,3 -5,1 8,7 2,3 8,4 -4,6 8,4 -6,9 21,7
NMIJ 2,9 6,0 2,0 9,2 5,1 8,7 7,3 8,3 0,5 8,3 -1,8 21,6
VNIIM -4,4 5,6 -5,3 8,9 -2,3 8,4 -7,3 8,3 -6,8 8,0 -9,1 21,5
NIST 2,4 5,6 1,5 9,0 4,6 8,4 -0,5 8,3 6,8 8,0 -2,3 21,5
NMi-VSL 4,7 20,7 3,8 21,9 6,9 21,7 1,8 21,6 9,1 21,5 2,3 21,5 0,0
NIST
pC/(m/s²)x10-4 pC/(m/s²)x10-4
NRC KRISS
pC/(m/s²)x10-4
CSIR-NML CENAMCSIRO-NML CMIPTB BNM-CESTA
pC/(m/s²)x10-4
Matrix of equivalence
pC/(m/s²)x10-4
pC/(m/s²)x10-4
NMIJ
pC/(m/s²)x10-4
pC/(m/s²)x10-4 pC/(m/s²)x10-4 pC/(m/s²)x10-4 pC/(m/s²)x10-4 pC/(m/s²)x10-4 pC/(m/s²)x10-4
pC/(m/s²)x10-4
NMi-VSLVNIIM

128
Table C16a: Matrix of equivalence for BB accelerometer at 1250 Hz
Key comparison CCAUV.V-K2 Back-to-back (BB) accelerometer type 8305 S/N 1483337
Lab j Frequency 1250 Hz
Lab i
D i U i D ij U ij D ij U ij D ij U ij D ij U ij D ij U ij D ij U ij
PTB 0,2 0,8 -1,5 6,5 -0,6 4,0 0,3 7,0 -0,6 7,7 0,8 10,2
BNM-CESTA 1,7 6,3 1,5 6,5 1,0 7,4 1,8 9,3 1,0 9,9 2,3 12,0
CSIRO-NML 0,7 3,7 0,6 4,0 -1,0 7,4 0,8 7,8 0,0 8,5 1,3 10,8
CMI -0,2 6,8 -0,3 7,0 -1,8 9,3 -0,8 7,8 -0,8 10,2 0,5 12,2
CSIR-NML 0,7 7,5 0,6 7,7 -1,0 9,9 0,0 8,5 0,8 10,2 1,3 12,7
CENAM -0,7 10,1 -0,8 10,2 -2,3 12,0 -1,3 10,8 -0,5 12,2 -1,3 12,7
NRC 1,2 7,2 1,0 7,4 -0,5 9,6 0,5 8,2 1,3 10,0 0,5 10,5 1,8 12,5
KRISS -0,8 4,7 -1,0 5,0 -2,5 8,0 -1,5 6,1 -0,7 8,4 -1,5 9,0 -0,2 11,2
NMIJ -0,1 3,5 -0,2 3,9 -1,7 7,3 -0,7 5,3 0,1 7,8 -0,7 8,5 0,6 10,8
VNIIM 8,9 5,7 8,7 5,8 7,2 8,5 8,2 6,8 9,0 8,9 8,2 9,5 9,5 11,6
NIST -3,3 5,2 -3,5 5,5 -5,0 8,3 -4,0 6,5 -3,2 8,7 -4,0 9,3 -2,7 11,4
NMi-VSL -1,4 7,0 -1,5 7,2 -3,0 9,5 -2,0 8,1 -1,2 9,9 -2,0 10,4 -0,7 12,4
Lab i
D i U i D ij U ij D ij U ij D ij U ij D ij U ij D ij U ij D ij U ij
PTB 0,2 0,8 -1,0 7,4 1,0 5,0 0,2 3,9 -8,7 5,8 3,5 5,5 1,5 7,2
BNM-CESTA 1,7 6,3 0,5 9,6 2,5 8,0 1,7 7,3 -7,2 8,5 5,0 8,3 3,0 9,5
CSIRO-NML 0,7 3,7 -0,5 8,2 1,5 6,1 0,7 5,3 -8,2 6,8 4,0 6,5 2,0 8,1
CMI -0,2 6,8 -1,3 10,0 0,7 8,4 -0,1 7,8 -9,0 8,9 3,2 8,7 1,2 9,9
CSIR-NML 0,7 7,5 -0,5 10,5 1,5 9,0 0,7 8,5 -8,2 9,5 4,0 9,3 2,0 10,4
CENAM -0,7 10,1 -1,8 12,5 0,2 11,2 -0,6 10,8 -9,5 11,6 2,7 11,4 0,7 12,4
NRC 1,2 7,2 2,0 8,7 1,2 8,1 -7,7 9,2 4,5 9,0 2,5 10,1
KRISS -0,8 4,7 -2,0 8,7 -0,8 6,1 -9,7 7,4 2,5 7,2 0,6 8,6
NMIJ -0,1 3,5 -1,2 8,1 0,8 6,1 -8,9 6,7 3,3 6,5 1,3 8,0
VNIIM 8,9 5,7 7,7 9,2 9,7 7,4 8,9 6,7 12,2 7,7 10,2 9,1
NIST -3,3 5,2 -4,5 9,0 -2,5 7,2 -3,3 6,5 -12,2 7,7 -2,0 8,9
NMi-VSL -1,4 7,0 -2,5 10,1 -0,6 8,6 -1,3 8,0 -10,2 9,1 2,0 8,9
pC/(m/s²)x10-4 pC/(m/s²)x10-4
pC/(m/s²)x10-4 pC/(m/s²)x10-4
pC/(m/s²)x10-4 pC/(m/s²)x10-4 pC/(m/s²)x10-4 pC/(m/s²)x10-4
NRC KRISS
CSIR-NML CENAMCSIRO-NML CMI
pC/(m/s²)x10-4
NMi-VSLNIST
pC/(m/s²)x10-4
Matrix of equivalence
pC/(m/s²)x10-4
NMIJ VNIIM
PTB BNM-CESTA
pC/(m/s²)x10-4
pC/(m/s²)x10-4
Laboratory result at this frequency excluded from calculation of the reference value
pC/(m/s²)x10-4

129
Table C16b: Matrix of equivalence for SE accelerometer at 1250 Hz
Key comparison CCAUV.V-K1 Single-ended (SE) accelerometer type 8305 WH 2335 S/N 1610174
Lab j Frequency 1250 Hz
Lab i
D i U i D ij U ij D ij U ij D ij U ij D ij U ij D ij U ij D ij U ij
PTB -0,2 0,8 -1,3 6,6 -0,4 4,1 -3,4 8,1 -2,3 7,9 -1,0 10,4
BNM-CESTA 1,2 6,4 1,3 6,6 1,0 7,5 -2,0 10,3 -1,0 10,1 0,4 12,2
CSIRO-NML 0,3 3,7 0,4 4,1 -1,0 7,5 -3,0 8,9 -2,0 8,7 -0,6 11,1
CMI 3,2 8,0 3,4 8,1 2,0 10,3 3,0 8,9 1,0 11,2 2,4 13,1
CSIR-NML 2,2 7,7 2,3 7,9 1,0 10,1 2,0 8,7 -1,0 11,2 1,4 13,0
CENAM 0,8 10,3 1,0 10,4 -0,4 12,2 0,6 11,1 -2,4 13,1 -1,4 13,0
NRC 1,8 7,3 2,0 7,5 0,6 9,8 1,6 8,4 -1,4 10,9 -0,4 10,7 1,0 12,7
KRISS -2,6 6,1 -2,5 6,3 -3,9 9,0 -2,9 7,3 -5,9 10,2 -4,9 9,9 -3,5 12,1
NMIJ 3,4 4,4 3,5 4,7 2,2 7,9 3,2 6,0 0,2 9,2 1,2 9,0 2,6 11,3
VNIIM -7,8 5,6 -7,7 5,8 -9,0 8,6 -8,0 6,9 -11,0 9,8 -10,0 9,6 -8,6 11,8
NIST 1,2 5,3 1,3 5,6 0,0 8,5 1,0 6,7 -2,0 9,7 -1,0 9,5 0,4 11,7
NMi-VSL 2,1 16,3 2,2 16,4 0,9 17,6 1,8 16,8 -1,2 18,2 -0,2 18,1 1,2 19,3
Lab i
D i U i D ij U ij D ij U ij D ij U ij D ij U ij D ij U ij D ij U ij
PTB -0,2 0,8 -2,0 7,5 2,5 6,3 -3,5 4,7 7,7 5,8 -1,3 5,6 -2,2 16,4
BNM-CESTA 1,2 6,4 -0,6 9,8 3,9 9,0 -2,2 7,9 9,0 8,6 0,0 8,5 -0,9 17,6
CSIRO-NML 0,3 3,7 -1,6 8,4 2,9 7,3 -3,2 6,0 8,0 6,9 -1,0 6,7 -1,8 16,8
CMI 3,2 8,0 1,4 10,9 5,9 10,2 -0,2 9,2 11,0 9,8 2,0 9,7 1,2 18,2
CSIR-NML 2,2 7,7 0,4 10,7 4,9 9,9 -1,2 9,0 10,0 9,6 1,0 9,5 0,2 18,1
CENAM 0,8 10,3 -1,0 12,7 3,5 12,1 -2,6 11,3 8,6 11,8 -0,4 11,7 -1,2 19,3
NRC 1,8 7,3 4,5 9,7 -1,6 8,7 9,6 9,3 0,6 9,2 -0,3 17,9
KRISS -2,6 6,1 -4,5 9,7 -6,1 7,7 5,1 8,4 -3,9 8,2 -4,7 17,5
NMIJ 3,4 4,4 1,6 8,7 6,1 7,7 11,2 7,3 2,2 7,1 1,4 16,9
VNIIM -7,8 5,6 -9,6 9,3 -5,1 8,4 -11,2 7,3 -9,0 7,8 -9,8 17,3
NIST 1,2 5,3 -0,6 9,2 3,9 8,2 -2,2 7,1 9,0 7,8 -0,9 17,2
NMi-VSL 2,1 16,3 0,3 17,9 4,7 17,5 -1,4 16,9 9,8 17,3 0,9 17,2
NIST
pC/(m/s²)x10-4 pC/(m/s²)x10-4
NRC KRISS
pC/(m/s²)x10-4
CSIR-NML CENAMCSIRO-NML CMIPTB BNM-CESTA
pC/(m/s²)x10-4
Matrix of equivalence
pC/(m/s²)x10-4
pC/(m/s²)x10-4
NMIJ
pC/(m/s²)x10-4
pC/(m/s²)x10-4 pC/(m/s²)x10-4 pC/(m/s²)x10-4 pC/(m/s²)x10-4 pC/(m/s²)x10-4 pC/(m/s²)x10-4
pC/(m/s²)x10-4
NMi-VSLVNIIM

130
Table C17a: Matrix of equivalence for BB accelerometer at 1600 Hz
Key comparison CCAUV.V-K2 Back-to-back (BB) accelerometer type 8305 S/N 1483337
Lab j Frequency 1600 Hz
Lab i
D i U i D ij U ij D ij U ij D ij U ij D ij U ij D ij U ij D ij U ij
PTB 0,3 0,7 -1,2 6,5 -0,2 4,0 1,0 6,7 -1,2 7,7 -0,4 10,2
BNM-CESTA 1,4 6,3 1,2 6,5 1,0 7,4 2,2 9,2 0,0 9,9 0,8 12,0
CSIRO-NML 0,4 3,7 0,2 4,0 -1,0 7,4 1,2 7,6 -1,0 8,5 -0,2 10,9
CMI -0,8 6,5 -1,0 6,7 -2,2 9,2 -1,2 7,6 -2,2 10,1 -1,4 12,1
CSIR-NML 1,4 7,6 1,2 7,7 0,0 9,9 1,0 8,5 2,2 10,1 0,8 12,7
CENAM 0,6 10,1 0,4 10,2 -0,8 12,0 0,2 10,9 1,4 12,1 -0,8 12,7
NRC 0,7 7,7 0,5 7,9 -0,7 10,1 0,3 8,7 1,5 10,2 -0,7 10,9 0,1 12,8
KRISS -1,3 4,7 -1,5 5,0 -2,7 8,0 -1,7 6,1 -0,5 8,2 -2,7 9,0 -1,9 11,2
NMIJ -1,0 5,7 -1,2 6,0 -2,4 8,6 -1,4 7,0 -0,2 8,8 -2,4 9,6 -1,6 11,7
VNIIM 14,4 5,7 14,2 5,8 13,0 8,5 14,0 6,8 15,2 8,7 13,0 9,5 13,8 11,6
NIST -3,6 5,2 -3,8 5,5 -5,0 8,3 -4,0 6,5 -2,8 8,5 -5,0 9,3 -4,2 11,5
NMi-VSL -1,4 9,6 -1,7 9,7 -2,8 11,5 -1,8 10,4 -0,7 11,7 -2,8 12,3 -2,0 14,0
Lab i
D i U i D ij U ij D ij U ij D ij U ij D ij U ij D ij U ij D ij U ij
PTB 0,3 0,7 -0,5 7,9 1,5 5,0 1,2 6,0 -14,2 5,8 3,8 5,5 1,7 9,7
BNM-CESTA 1,4 6,3 0,7 10,1 2,7 8,0 2,4 8,6 -13,0 8,5 5,0 8,3 2,8 11,5
CSIRO-NML 0,4 3,7 -0,3 8,7 1,7 6,1 1,4 7,0 -14,0 6,8 4,0 6,5 1,8 10,4
CMI -0,8 6,5 -1,5 10,2 0,5 8,2 0,2 8,8 -15,2 8,7 2,8 8,5 0,7 11,7
CSIR-NML 1,4 7,6 0,7 10,9 2,7 9,0 2,4 9,6 -13,0 9,5 5,0 9,3 2,8 12,3
CENAM 0,6 10,1 -0,1 12,8 1,9 11,2 1,6 11,7 -13,8 11,6 4,2 11,5 2,0 14,0
NRC 0,7 7,7 2,0 9,2 1,7 9,8 -13,7 9,6 4,3 9,5 2,1 12,4
KRISS -1,3 4,7 -2,0 9,2 -0,3 7,6 -15,7 7,4 2,3 7,2 0,2 10,8
NMIJ -1,0 5,7 -1,7 9,8 0,3 7,6 -15,4 8,1 2,6 7,9 0,5 11,3
VNIIM 14,4 5,7 13,7 9,6 15,7 7,4 15,4 8,1 18,0 7,8 15,8 11,2
NIST -3,6 5,2 -4,3 9,5 -2,3 7,2 -2,6 7,9 -18,0 7,8 -2,2 11,0
NMi-VSL -1,4 9,6 -2,1 12,4 -0,2 10,8 -0,5 11,3 -15,8 11,2 2,2 11,0
pC/(m/s²)x10-4 pC/(m/s²)x10-4
pC/(m/s²)x10-4 pC/(m/s²)x10-4
pC/(m/s²)x10-4 pC/(m/s²)x10-4 pC/(m/s²)x10-4 pC/(m/s²)x10-4
NRC KRISS
CSIR-NML CENAMCSIRO-NML CMI
pC/(m/s²)x10-4
NMi-VSLNIST
pC/(m/s²)x10-4
Matrix of equivalence
pC/(m/s²)x10-4
NMIJ VNIIM
PTB BNM-CESTA
pC/(m/s²)x10-4
pC/(m/s²)x10-4
Laboratory result at this frequency excluded from calculation of the reference value
pC/(m/s²)x10-4

131
Table C17b: Matrix of equivalence for SE accelerometer at 1600 Hz
Key comparison CCAUV.V-K1 Single-ended (SE) accelerometer type 8305 WH 2335 S/N 1610174
Lab j Frequency 1600 Hz
Lab i
D i U i D ij U ij D ij U ij D ij U ij D ij U ij D ij U ij D ij U ij
PTB 0,2 0,7 -0,1 6,6 -0,1 4,1 -2,3 8,2 -2,0 7,9 -0,7 10,5
BNM-CESTA 0,2 6,4 0,1 6,6 0,0 7,6 -2,3 10,3 -2,0 10,1 -0,7 12,2
CSIRO-NML 0,2 3,7 0,1 4,1 0,0 7,6 -2,3 8,9 -2,0 8,7 -0,7 11,1
CMI 2,4 8,0 2,3 8,2 2,3 10,3 2,3 8,9 0,3 11,2 1,6 13,1
CSIR-NML 2,1 7,7 2,0 7,9 2,0 10,1 2,0 8,7 -0,3 11,2 1,3 13,0
CENAM 0,9 10,3 0,7 10,5 0,7 12,2 0,7 11,1 -1,6 13,1 -1,3 13,0
NRC -1,9 7,9 -2,0 8,1 -2,0 10,3 -2,0 8,9 -4,3 11,3 -4,0 11,1 -2,7 13,1
KRISS -3,3 6,1 -3,4 6,3 -3,4 9,0 -3,4 7,3 -5,7 10,2 -5,4 10,0 -4,1 12,1
NMIJ 6,3 6,6 6,2 6,8 6,2 9,3 6,2 7,7 3,9 10,4 4,2 10,2 5,5 12,3
VNIIM -6,9 5,6 -7,0 5,8 -7,0 8,6 -7,0 6,9 -9,3 9,8 -9,0 9,6 -7,7 11,8
NIST 0,2 5,3 0,1 5,6 0,0 8,5 0,0 6,7 -2,3 9,7 -2,0 9,5 -0,7 11,7
NMi-VSL 3,2 22,4 3,1 22,5 3,0 23,4 3,0 22,8 0,7 23,9 1,0 23,8 2,3 24,8
Lab i
D i U i D ij U ij D ij U ij D ij U ij D ij U ij D ij U ij D ij U ij
PTB 0,2 0,7 2,0 8,1 3,4 6,3 -6,2 6,8 7,0 5,8 -0,1 5,6 -3,1 22,5
BNM-CESTA 0,2 6,4 2,0 10,3 3,4 9,0 -6,2 9,3 7,0 8,6 0,0 8,5 -3,0 23,4
CSIRO-NML 0,2 3,7 2,0 8,9 3,4 7,3 -6,2 7,7 7,0 6,9 0,0 6,7 -3,0 22,8
CMI 2,4 8,0 4,3 11,3 5,7 10,2 -3,9 10,4 9,3 9,8 2,3 9,7 -0,7 23,9
CSIR-NML 2,1 7,7 4,0 11,1 5,4 10,0 -4,2 10,2 9,0 9,6 2,0 9,5 -1,0 23,8
CENAM 0,9 10,3 2,7 13,1 4,1 12,1 -5,5 12,3 7,7 11,8 0,7 11,7 -2,3 24,8
NRC -1,9 7,9 1,4 10,1 -8,2 10,4 5,0 9,8 -2,0 9,6 -5,0 23,8
KRISS -3,3 6,1 -1,4 10,1 -9,6 9,1 3,6 8,4 -3,4 8,3 -6,5 23,3
NMIJ 6,3 6,6 8,2 10,4 9,6 9,1 13,2 8,7 6,2 8,6 3,2 23,4
VNIIM -6,9 5,6 -5,0 9,8 -3,6 8,4 -13,2 8,7 -7,0 7,9 -10,0 23,2
NIST 0,2 5,3 2,0 9,6 3,4 8,3 -6,2 8,6 7,0 7,9 -3,0 23,1
NMi-VSL 3,2 22,4 5,0 23,8 6,5 23,3 -3,2 23,4 10,0 23,2 3,0 23,1
NIST
pC/(m/s²)x10-4 pC/(m/s²)x10-4
NRC KRISS
pC/(m/s²)x10-4
CSIR-NML CENAMCSIRO-NML CMIPTB BNM-CESTA
pC/(m/s²)x10-4
Matrix of equivalence
pC/(m/s²)x10-4
pC/(m/s²)x10-4
NMIJ
pC/(m/s²)x10-4
pC/(m/s²)x10-4 pC/(m/s²)x10-4 pC/(m/s²)x10-4 pC/(m/s²)x10-4 pC/(m/s²)x10-4 pC/(m/s²)x10-4
pC/(m/s²)x10-4
NMi-VSLVNIIM

132
Table C18a: Matrix of equivalence for BB accelerometer at 2000 HzKey comparison CCAUV.V-K2 Back-to-back (BB) accelerometer type 8305 S/N 1483337
Lab j Frequency 2000 Hz
Lab i
D i U i D ij U ij D ij U ij D ij U ij D ij U ij D ij U ij D ij U ij
PTB 0,4 0,7 -1,4 6,5 0,6 4,0 1,0 6,2 0,6 7,7 -0,5 10,3
BNM-CESTA 1,7 6,3 1,4 6,5 2,0 7,4 2,4 8,8 2,0 9,9 0,9 12,0
CSIRO-NML -0,3 3,7 -0,6 4,0 -2,0 7,4 0,4 7,2 0,0 8,5 -1,1 10,9
CMI -0,7 6,0 -1,0 6,2 -2,4 8,8 -0,4 7,2 -0,4 9,8 -1,5 11,9
CSIR-NML -0,3 7,6 -0,6 7,7 -2,0 9,9 0,0 8,5 0,4 9,8 -1,1 12,7
CENAM 0,8 10,1 0,5 10,3 -0,9 12,0 1,1 10,9 1,5 11,9 1,1 12,7
NRC 0,7 8,3 0,4 8,5 -1,0 10,5 1,0 9,2 1,4 10,4 1,0 11,3 -0,1 13,2
KRISS -1,1 4,7 -1,5 5,0 -2,9 8,0 -0,9 6,2 -0,5 7,8 -0,9 9,0 -2,0 11,3
NMIJ -1,1 5,6 -1,4 5,9 -2,8 8,6 -0,8 6,9 -0,4 8,4 -0,8 9,5 -1,9 11,7
VNIIM 17,7 5,8 17,4 5,8 16,0 8,5 18,0 6,8 18,4 8,3 18,0 9,5 16,9 11,7
NIST -4,3 8,6 -4,6 8,7 -6,0 10,7 -4,0 9,4 -3,6 10,6 -4,0 11,5 -5,1 13,3
NMi-VSL -2,1 5,4 -2,5 5,6 -3,8 8,4 -1,8 6,7 -1,4 8,2 -1,8 9,4 -2,9 11,5
Lab i
D i U i D ij U ij D ij U ij D ij U ij D ij U ij D ij U ij D ij U ij
PTB 0,4 0,7 -0,4 8,5 1,5 5,0 1,4 5,9 -17,4 5,8 4,6 8,7 2,5 5,6
BNM-CESTA 1,7 6,3 1,0 10,5 2,9 8,0 2,8 8,6 -16,0 8,5 6,0 10,7 3,8 8,4
CSIRO-NML -0,3 3,7 -1,0 9,2 0,9 6,2 0,8 6,9 -18,0 6,8 4,0 9,4 1,8 6,7
CMI -0,7 6,0 -1,4 10,4 0,5 7,8 0,4 8,4 -18,4 8,3 3,6 10,6 1,4 8,2
CSIR-NML -0,3 7,6 -1,0 11,3 0,9 9,0 0,8 9,5 -18,0 9,5 4,0 11,5 1,8 9,4
CENAM 0,8 10,1 0,1 13,2 2,0 11,3 1,9 11,7 -16,9 11,7 5,1 13,3 2,9 11,5
NRC 0,7 8,3 1,9 9,7 1,8 10,2 -17,0 10,1 5,0 12,0 2,8 10,0
KRISS -1,1 4,7 -1,9 9,7 -0,1 7,5 -18,8 7,4 3,1 9,9 1,0 7,3
NMIJ -1,1 5,6 -1,8 10,2 0,1 7,5 -18,8 8,1 3,2 10,3 1,0 7,9
VNIIM 17,7 5,8 17,0 10,1 18,8 7,4 18,8 8,1 22,0 10,3 19,8 7,9
NIST -4,3 8,6 -5,0 12,0 -3,1 9,9 -3,2 10,3 -22,0 10,3 -2,2 10,2
NMi-VSL -2,1 5,4 -2,8 10,0 -1,0 7,3 -1,0 7,9 -19,8 7,9 2,2 10,2
pC/(m/s²)x10-4 pC/(m/s²)x10-4
pC/(m/s²)x10-4 pC/(m/s²)x10-4
pC/(m/s²)x10-4 pC/(m/s²)x10-4 pC/(m/s²)x10-4 pC/(m/s²)x10-4
NRC KRISS
CSIR-NML CENAMCSIRO-NML CMI
pC/(m/s²)x10-4
NMi-VSLNIST
pC/(m/s²)x10-4
Matrix of equivalence
pC/(m/s²)x10-4
NMIJ VNIIM
PTB BNM-CESTA
pC/(m/s²)x10-4
pC/(m/s²)x10-4
Laboratory result at this frequency excluded from calculation of the reference value
pC/(m/s²)x10-4

133
Table C18b: Matrix of equivalence for SE accelerometer at 2000 Hz
Key comparison CCAUV.V-K1 Single-ended (SE) accelerometer type 8305 WH 2335 S/N 1610174
Lab j Frequency 2000 Hz
Lab i
D i U i D ij U ij D ij U ij D ij U ij D ij U ij D ij U ij D ij U ij
PTB 0,1 0,7 -0,2 6,6 0,8 4,1 -1,7 8,2 -4,2 7,9 -0,7 10,5
BNM-CESTA 0,3 6,4 0,2 6,6 1,0 7,6 -1,5 10,4 -4,0 10,2 -0,5 12,3
CSIRO-NML -0,8 3,7 -0,8 4,1 -1,0 7,6 -2,5 9,0 -5,0 8,7 -1,5 11,1
CMI 1,7 8,0 1,7 8,2 1,5 10,4 2,5 9,0 -2,5 11,2 1,0 13,2
CSIR-NML 4,2 7,7 4,2 7,9 4,0 10,2 5,0 8,7 2,5 11,2 3,5 13,0
CENAM 0,8 10,3 0,7 10,5 0,5 12,3 1,5 11,1 -1,0 13,2 -3,5 13,0
NRC -3,1 8,5 -3,1 8,6 -3,3 10,7 -2,3 9,4 -4,8 11,8 -7,3 11,6 -3,8 13,5
KRISS -4,0 6,1 -4,0 6,3 -4,2 9,0 -3,2 7,3 -5,7 10,2 -8,2 10,0 -4,7 12,1
NMIJ 11,3 6,3 11,3 6,5 11,1 9,1 12,1 7,5 9,6 10,3 7,1 10,1 10,6 12,2
VNIIM -7,6 5,6 -7,6 5,8 -7,8 8,6 -6,8 6,9 -9,3 9,9 -11,8 9,7 -8,3 11,8
NIST -1,8 8,8 -1,8 8,9 -2,0 11,0 -1,0 9,6 -3,5 11,9 -6,0 11,8 -2,5 13,6
NMi-VSL 5,3 12,7 5,3 12,8 5,1 14,3 6,1 13,4 3,6 15,1 1,1 15,0 4,6 16,5
Lab i
D i U i D ij U ij D ij U ij D ij U ij D ij U ij D ij U ij D ij U ij
PTB 0,1 0,7 3,1 8,6 4,0 6,3 -11,3 6,5 7,6 5,8 1,8 8,9 -5,3 12,8
BNM-CESTA 0,3 6,4 3,3 10,7 4,2 9,0 -11,1 9,1 7,8 8,6 2,0 11,0 -5,1 14,3
CSIRO-NML -0,8 3,7 2,3 9,4 3,2 7,3 -12,1 7,5 6,8 6,9 1,0 9,6 -6,1 13,4
CMI 1,7 8,0 4,8 11,8 5,7 10,2 -9,6 10,3 9,3 9,9 3,5 11,9 -3,6 15,1
CSIR-NML 4,2 7,7 7,3 11,6 8,2 10,0 -7,1 10,1 11,8 9,7 6,0 11,8 -1,1 15,0
CENAM 0,8 10,3 3,8 13,5 4,7 12,1 -10,6 12,2 8,3 11,8 2,5 13,6 -4,6 16,5
NRC -3,1 8,5 0,9 10,6 -14,4 10,7 4,5 10,3 -1,3 12,3 -8,4 15,4
KRISS -4,0 6,1 -0,9 10,6 -15,3 8,9 3,6 8,4 -2,2 10,8 -9,3 14,2
NMIJ 11,3 6,3 14,4 10,7 15,3 8,9 18,9 8,6 13,1 10,9 6,0 14,3
VNIIM -7,6 5,6 -4,5 10,3 -3,6 8,4 -18,9 8,6 -5,8 10,5 -12,9 14,0
NIST -1,8 8,8 1,3 12,3 2,2 10,8 -13,1 10,9 5,8 10,5 -7,1 15,5
NMi-VSL 5,3 12,7 8,4 15,4 9,3 14,2 -6,0 14,3 12,9 14,0 7,1 15,5
NIST
pC/(m/s²)x10-4 pC/(m/s²)x10-4
NRC KRISS
pC/(m/s²)x10-4
CSIR-NML CENAMCSIRO-NML CMIPTB BNM-CESTA
pC/(m/s²)x10-4
Matrix of equivalence
pC/(m/s²)x10-4
pC/(m/s²)x10-4
NMIJ
pC/(m/s²)x10-4
pC/(m/s²)x10-4 pC/(m/s²)x10-4 pC/(m/s²)x10-4 pC/(m/s²)x10-4 pC/(m/s²)x10-4 pC/(m/s²)x10-4
pC/(m/s²)x10-4
NMi-VSLVNIIM

134
Table C19a: Matrix of equivalence for BB accelerometer at 2500 Hz
Key comparison CCAUV.V-K2 Back-to-back (BB) accelerometer type 8305 S/N 1483337
Lab j Frequency 2500 Hz
Lab i
D i U i D ij U ij D ij U ij D ij U ij D ij U ij D ij U ij D ij U ij
PTB 0,9 2,0 -0,9 6,9 0,1 4,6 2,1 6,4 2,1 8,0 1,4 10,5
BNM-CESTA 1,8 6,2 0,9 6,9 1,0 7,4 3,0 8,7 3,0 9,9 2,3 12,0
CSIRO-NML 0,8 3,5 -0,1 4,6 -1,0 7,4 2,0 7,0 2,0 8,5 1,3 10,9
CMI -1,2 5,6 -2,1 6,4 -3,0 8,7 -2,0 7,0 0,0 9,6 -0,7 11,7
CSIR-NML -1,2 7,5 -2,1 8,0 -3,0 9,9 -2,0 8,5 0,0 9,6 -0,7 12,7
CENAM -0,5 10,1 -1,4 10,5 -2,3 12,0 -1,3 10,9 0,7 11,7 0,7 12,7
NRC -2,2 8,5 -3,1 9,0 -4,0 10,7 -3,0 9,5 -1,0 10,4 -1,0 11,5 -1,7 13,4
KRISS -0,9 4,6 -1,7 5,5 -2,6 8,0 -1,6 6,2 0,4 7,6 0,4 9,0 -0,4 11,3
NMIJ -1,0 5,9 -1,9 6,6 -2,8 8,8 -1,8 7,2 0,2 8,5 0,2 9,8 -0,5 11,9
VNIIM 19,0 8,9 18,1 9,1 17,2 10,9 18,2 9,6 20,2 10,6 20,2 11,6 19,5 13,4
NIST -6,2 14,6 -7,1 14,9 -8,0 16,0 -7,0 15,2 -5,0 15,8 -5,0 16,6 -5,7 17,9
NMi-VSL -2,4 6,7 -3,3 7,3 -4,2 9,4 -3,2 7,9 -1,2 9,0 -1,2 10,3 -1,9 12,3
Lab i
D i U i D ij U ij D ij U ij D ij U ij D ij U ij D ij U ij D ij U ij
PTB 0,9 2,0 3,1 9,0 1,7 5,5 1,9 6,6 -18,1 9,1 7,1 14,9 3,3 7,3
BNM-CESTA 1,8 6,2 4,0 10,7 2,6 8,0 2,8 8,8 -17,2 10,9 8,0 16,0 4,2 9,4
CSIRO-NML 0,8 3,5 3,0 9,5 1,6 6,2 1,8 7,2 -18,2 9,6 7,0 15,2 3,2 7,9
CMI -1,2 5,6 1,0 10,4 -0,4 7,6 -0,2 8,5 -20,2 10,6 5,0 15,8 1,2 9,0
CSIR-NML -1,2 7,5 1,0 11,5 -0,4 9,0 -0,2 9,8 -20,2 11,6 5,0 16,6 1,2 10,3
CENAM -0,5 10,1 1,7 13,4 0,4 11,3 0,5 11,9 -19,5 13,4 5,7 17,9 1,9 12,3
NRC -2,2 8,5 -1,4 9,9 -1,2 10,6 -21,2 12,3 4,0 17,1 0,2 11,0
KRISS -0,9 4,6 1,4 9,9 0,2 7,8 -19,8 10,0 5,4 15,5 1,6 8,4
NMIJ -1,0 5,9 1,2 10,6 -0,2 7,8 -20,0 10,7 5,2 15,9 1,4 9,2
VNIIM 19,0 8,9 21,2 12,3 19,8 10,0 20,0 10,7 25,2 17,1 21,4 11,1
NIST -6,2 14,6 -4,0 17,1 -5,4 15,5 -5,2 15,9 -25,2 17,1 -3,8 16,2
NMi-VSL -2,4 6,7 -0,2 11,0 -1,6 8,4 -1,4 9,2 -21,4 11,1 3,8 16,2
pC/(m/s²)x10-4
pC/(m/s²)x10-4 pC/(m/s²)x10-4 pC/(m/s²)x10-4 pC/(m/s²)x10-4 pC/(m/s²)x10-4 pC/(m/s²)x10-4
pC/(m/s²)x10-4
PTB BNM-CESTA
Matrix of equivalence
NMi-VSL
CSIR-NML CENAMCSIRO-NML CMI
Laboratory result at this frequency excluded from calculation of the reference value
pC/(m/s²)x10-4
pC/(m/s²)x10-4
NMIJ VNIIM NIST
pC/(m/s²)x10-4 pC/(m/s²)x10-4
NRC KRISS
pC/(m/s²)x10-4pC/(m/s²)x10-4

135
Table C19b: Matrix of equivalence for SE accelerometer at 2500 Hz
Key comparison CCAUV.V-K1 Single-ended (SE) accelerometer type 8305 WH 2335 S/N 1610174
Lab j Frequency 2500 Hz
Lab i
D i U i D ij U ij D ij U ij D ij U ij D ij U ij D ij U ij D ij U ij
PTB 2,5 7,0 0,5 4,7 -1,6 9,5 -5,5 9,5 -0,4 10,7
BNM-CESTA -2,5 7,0 -2,0 7,6 -4,1 11,2 -8,0 11,2 -2,8 12,3
CSIRO-NML -0,5 4,7 2,0 7,6 -2,1 9,9 -6,0 10,0 -0,8 11,1
CMI 1,6 9,5 4,1 11,2 2,1 9,9 -3,9 12,9 1,3 13,9
CSIR-NML 5,5 9,5 8,0 11,2 6,0 10,0 3,9 12,9 5,2 13,9
CENAM 0,4 10,7 2,8 12,3 0,8 11,1 -1,3 13,9 -5,2 13,9
NRC -5,1 9,2 -2,6 11,0 -4,6 9,6 -6,7 12,7 -10,6 12,7 -5,4 13,7
KRISS -5,6 7,6 -3,2 9,7 -5,2 8,1 -7,3 11,6 -11,2 11,6 -6,0 12,6
NMIJ 16,9 7,3 19,4 9,5 17,4 7,9 15,3 11,4 11,4 11,4 16,6 12,5
VNIIM -10,9 9,2 -8,4 10,9 -10,4 9,6 -12,5 12,7 -16,4 12,7 -11,2 13,6
NIST 2,5 15,4 5,0 16,5 3,0 15,6 0,9 17,7 -3,0 17,7 2,2 18,4
NMi-VSL 9,1 20,9 11,6 21,7 9,6 21,1 7,5 22,6 3,6 22,7 8,8 23,2
Lab i
D i U i D ij U ij D ij U ij D ij U ij D ij U ij D ij U ij D ij U ij
PTB 5,1 9,2 5,6 7,6 -16,9 7,3 10,9 9,2 -2,5 15,4 -9,1 20,9
BNM-CESTA 2,6 11,0 3,2 9,7 -19,4 9,5 8,4 10,9 -5,0 16,5 -11,6 21,7
CSIRO-NML 4,6 9,6 5,2 8,1 -17,4 7,9 10,4 9,6 -3,0 15,6 -9,6 21,1
CMI 6,7 12,7 7,3 11,6 -15,3 11,4 12,5 12,7 -0,9 17,7 -7,5 22,6
CSIR-NML 10,6 12,7 11,2 11,6 -11,4 11,4 16,4 12,7 3,0 17,7 -3,6 22,7
CENAM 5,4 13,7 6,0 12,6 -16,6 12,5 11,2 13,6 -2,2 18,4 -8,8 23,2
NRC 0,6 11,3 -22,0 11,2 5,8 12,4 -7,6 17,5 -14,2 22,5
KRISS -0,6 11,3 -22,6 9,9 5,2 11,3 -8,2 16,7 -14,7 21,9
NMIJ 22,0 11,2 22,6 9,9 27,8 11,1 14,4 16,6 7,8 21,8
VNIIM -5,8 12,4 -5,2 11,3 -27,8 11,1 -13,4 17,5 -20,0 22,5
NIST 7,6 17,5 8,2 16,7 -14,4 16,6 13,4 17,5 -6,6 25,7
NMi-VSL 14,2 22,5 14,7 21,9 -7,8 21,8 20,0 22,5 6,6 25,7
pC/(m/s²)x10-4pC/(m/s²)x10-4 pC/(m/s²)x10-4 pC/(m/s²)x10-4
CSIR-NML CENAM
NRC KRISS
PTB BNM-CESTA CSIRO-NML CMI
NMi-VSLNMIJ
pC/(m/s²)x10-4
pC/(m/s²)x10-4 pC/(m/s²)x10-4 pC/(m/s²)x10-4 pC/(m/s²)x10-4 pC/(m/s²)x10-4 pC/(m/s²)x10-4
VNIIM NIST
pC/(m/s²)x10-4
Matrix of equivalence
pC/(m/s²)x10-4
no KCRV
no KCRV
pC/(m/s²)x10-4
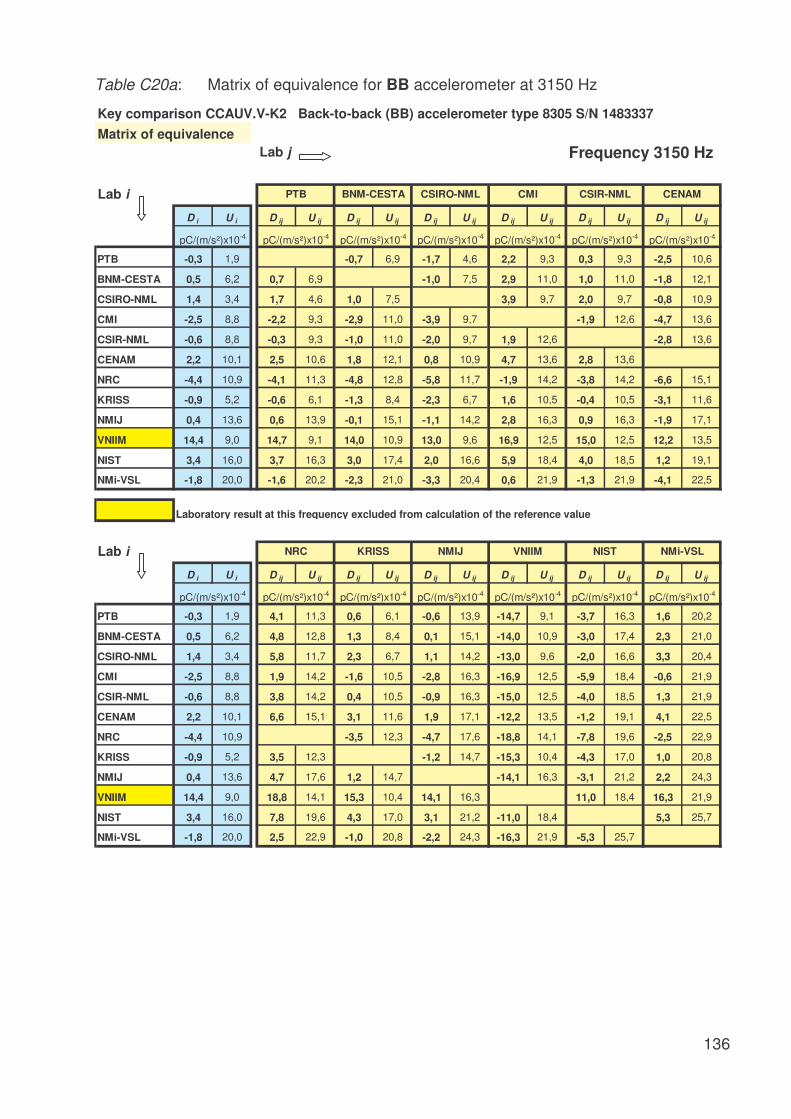
136
Table C20a: Matrix of equivalence for BB accelerometer at 3150 Hz
Key comparison CCAUV.V-K2 Back-to-back (BB) accelerometer type 8305 S/N 1483337
Lab j Frequency 3150 Hz
Lab i
D i U i D ij U ij D ij U ij D ij U ij D ij U ij D ij U ij D ij U ij
PTB -0,3 1,9 -0,7 6,9 -1,7 4,6 2,2 9,3 0,3 9,3 -2,5 10,6
BNM-CESTA 0,5 6,2 0,7 6,9 -1,0 7,5 2,9 11,0 1,0 11,0 -1,8 12,1
CSIRO-NML 1,4 3,4 1,7 4,6 1,0 7,5 3,9 9,7 2,0 9,7 -0,8 10,9
CMI -2,5 8,8 -2,2 9,3 -2,9 11,0 -3,9 9,7 -1,9 12,6 -4,7 13,6
CSIR-NML -0,6 8,8 -0,3 9,3 -1,0 11,0 -2,0 9,7 1,9 12,6 -2,8 13,6
CENAM 2,2 10,1 2,5 10,6 1,8 12,1 0,8 10,9 4,7 13,6 2,8 13,6
NRC -4,4 10,9 -4,1 11,3 -4,8 12,8 -5,8 11,7 -1,9 14,2 -3,8 14,2 -6,6 15,1
KRISS -0,9 5,2 -0,6 6,1 -1,3 8,4 -2,3 6,7 1,6 10,5 -0,4 10,5 -3,1 11,6
NMIJ 0,4 13,6 0,6 13,9 -0,1 15,1 -1,1 14,2 2,8 16,3 0,9 16,3 -1,9 17,1
VNIIM 14,4 9,0 14,7 9,1 14,0 10,9 13,0 9,6 16,9 12,5 15,0 12,5 12,2 13,5
NIST 3,4 16,0 3,7 16,3 3,0 17,4 2,0 16,6 5,9 18,4 4,0 18,5 1,2 19,1
NMi-VSL -1,8 20,0 -1,6 20,2 -2,3 21,0 -3,3 20,4 0,6 21,9 -1,3 21,9 -4,1 22,5
Lab i
D i U i D ij U ij D ij U ij D ij U ij D ij U ij D ij U ij D ij U ij
PTB -0,3 1,9 4,1 11,3 0,6 6,1 -0,6 13,9 -14,7 9,1 -3,7 16,3 1,6 20,2
BNM-CESTA 0,5 6,2 4,8 12,8 1,3 8,4 0,1 15,1 -14,0 10,9 -3,0 17,4 2,3 21,0
CSIRO-NML 1,4 3,4 5,8 11,7 2,3 6,7 1,1 14,2 -13,0 9,6 -2,0 16,6 3,3 20,4
CMI -2,5 8,8 1,9 14,2 -1,6 10,5 -2,8 16,3 -16,9 12,5 -5,9 18,4 -0,6 21,9
CSIR-NML -0,6 8,8 3,8 14,2 0,4 10,5 -0,9 16,3 -15,0 12,5 -4,0 18,5 1,3 21,9
CENAM 2,2 10,1 6,6 15,1 3,1 11,6 1,9 17,1 -12,2 13,5 -1,2 19,1 4,1 22,5
NRC -4,4 10,9 -3,5 12,3 -4,7 17,6 -18,8 14,1 -7,8 19,6 -2,5 22,9
KRISS -0,9 5,2 3,5 12,3 -1,2 14,7 -15,3 10,4 -4,3 17,0 1,0 20,8
NMIJ 0,4 13,6 4,7 17,6 1,2 14,7 -14,1 16,3 -3,1 21,2 2,2 24,3
VNIIM 14,4 9,0 18,8 14,1 15,3 10,4 14,1 16,3 11,0 18,4 16,3 21,9
NIST 3,4 16,0 7,8 19,6 4,3 17,0 3,1 21,2 -11,0 18,4 5,3 25,7
NMi-VSL -1,8 20,0 2,5 22,9 -1,0 20,8 -2,2 24,3 -16,3 21,9 -5,3 25,7
pC/(m/s²)x10-4
pC/(m/s²)x10-4 pC/(m/s²)x10-4 pC/(m/s²)x10-4 pC/(m/s²)x10-4 pC/(m/s²)x10-4 pC/(m/s²)x10-4
pC/(m/s²)x10-4
PTB BNM-CESTA
Matrix of equivalence
NMi-VSL
CSIR-NML CENAMCSIRO-NML CMI
Laboratory result at this frequency excluded from calculation of the reference value
pC/(m/s²)x10-4
pC/(m/s²)x10-4
NMIJ VNIIM NIST
pC/(m/s²)x10-4 pC/(m/s²)x10-4
NRC KRISS
pC/(m/s²)x10-4pC/(m/s²)x10-4
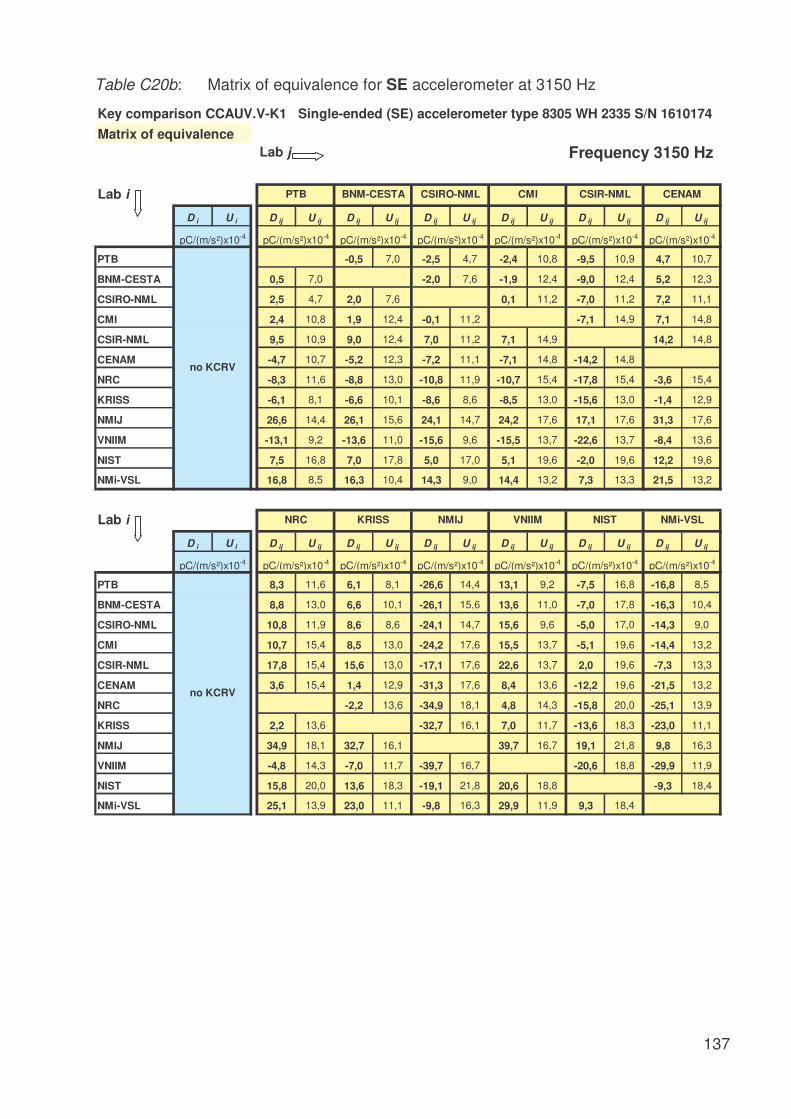
137
Table C20b: Matrix of equivalence for SE accelerometer at 3150 Hz
Key comparison CCAUV.V-K1 Single-ended (SE) accelerometer type 8305 WH 2335 S/N 1610174
Lab j Frequency 3150 Hz
Lab i
D i U i D ij U ij D ij U ij D ij U ij D ij U ij D ij U ij D ij U ij
PTB -0,5 7,0 -2,5 4,7 -2,4 10,8 -9,5 10,9 4,7 10,7
BNM-CESTA 0,5 7,0 -2,0 7,6 -1,9 12,4 -9,0 12,4 5,2 12,3
CSIRO-NML 2,5 4,7 2,0 7,6 0,1 11,2 -7,0 11,2 7,2 11,1
CMI 2,4 10,8 1,9 12,4 -0,1 11,2 -7,1 14,9 7,1 14,8
CSIR-NML 9,5 10,9 9,0 12,4 7,0 11,2 7,1 14,9 14,2 14,8
CENAM -4,7 10,7 -5,2 12,3 -7,2 11,1 -7,1 14,8 -14,2 14,8
NRC -8,3 11,6 -8,8 13,0 -10,8 11,9 -10,7 15,4 -17,8 15,4 -3,6 15,4
KRISS -6,1 8,1 -6,6 10,1 -8,6 8,6 -8,5 13,0 -15,6 13,0 -1,4 12,9
NMIJ 26,6 14,4 26,1 15,6 24,1 14,7 24,2 17,6 17,1 17,6 31,3 17,6
VNIIM -13,1 9,2 -13,6 11,0 -15,6 9,6 -15,5 13,7 -22,6 13,7 -8,4 13,6
NIST 7,5 16,8 7,0 17,8 5,0 17,0 5,1 19,6 -2,0 19,6 12,2 19,6
NMi-VSL 16,8 8,5 16,3 10,4 14,3 9,0 14,4 13,2 7,3 13,3 21,5 13,2
Lab i
D i U i D ij U ij D ij U ij D ij U ij D ij U ij D ij U ij D ij U ij
PTB 8,3 11,6 6,1 8,1 -26,6 14,4 13,1 9,2 -7,5 16,8 -16,8 8,5
BNM-CESTA 8,8 13,0 6,6 10,1 -26,1 15,6 13,6 11,0 -7,0 17,8 -16,3 10,4
CSIRO-NML 10,8 11,9 8,6 8,6 -24,1 14,7 15,6 9,6 -5,0 17,0 -14,3 9,0
CMI 10,7 15,4 8,5 13,0 -24,2 17,6 15,5 13,7 -5,1 19,6 -14,4 13,2
CSIR-NML 17,8 15,4 15,6 13,0 -17,1 17,6 22,6 13,7 2,0 19,6 -7,3 13,3
CENAM 3,6 15,4 1,4 12,9 -31,3 17,6 8,4 13,6 -12,2 19,6 -21,5 13,2
NRC -2,2 13,6 -34,9 18,1 4,8 14,3 -15,8 20,0 -25,1 13,9
KRISS 2,2 13,6 -32,7 16,1 7,0 11,7 -13,6 18,3 -23,0 11,1
NMIJ 34,9 18,1 32,7 16,1 39,7 16,7 19,1 21,8 9,8 16,3
VNIIM -4,8 14,3 -7,0 11,7 -39,7 16,7 -20,6 18,8 -29,9 11,9
NIST 15,8 20,0 13,6 18,3 -19,1 21,8 20,6 18,8 -9,3 18,4
NMi-VSL 25,1 13,9 23,0 11,1 -9,8 16,3 29,9 11,9 9,3 18,4
Matrix of equivalence
pC/(m/s²)x10-4
no KCRV
no KCRV
pC/(m/s²)x10-4 pC/(m/s²)x10-4
pC/(m/s²)x10-4 pC/(m/s²)x10-4 pC/(m/s²)x10-4 pC/(m/s²)x10-4 pC/(m/s²)x10-4 pC/(m/s²)x10-4
VNIIM NIST
pC/(m/s²)x10-4
CSIR-NML CENAM
NRC KRISS
PTB BNM-CESTA CSIRO-NML CMI
NMi-VSLNMIJ
pC/(m/s²)x10-4pC/(m/s²)x10-4 pC/(m/s²)x10-4 pC/(m/s²)x10-4

138
Table C21a: Matrix of equivalence for BB accelerometer at 4000 Hz
Key comparison CCAUV.V-K2 Back-to-back (BB) accelerometer type 8305 S/N 1483337
Lab j Frequency 4000 Hz
Lab i
D i U i D ij U ij D ij U ij D ij U ij D ij U ij D ij U ij D ij U ij
PTB 0,7 1,8 -0,1 4,6 4,8 8,1 2,9 9,3 2,1 10,6
BNM-CESTA
CSIRO-NML 0,7 3,4 0,1 4,6 4,9 8,6 3,0 9,8 2,2 11,0
CMI -4,2 7,5 -4,8 8,1 -4,9 8,6 -1,9 11,8 -2,7 12,8
CSIR-NML -2,3 8,8 -2,9 9,3 -3,0 9,8 1,9 11,8 -0,8 13,6
CENAM -1,5 10,1 -2,1 10,6 -2,2 11,0 2,7 12,8 0,8 13,6
NRC -0,7 11,9 -1,3 12,3 -1,4 12,7 3,5 14,3 1,6 15,0 0,8 15,8
KRISS -0,9 5,2 -1,5 6,1 -1,6 6,7 3,3 9,5 1,4 10,5 0,6 11,7
NMIJ 0,2 14,3 -0,5 14,6 -0,5 14,9 4,4 16,3 2,5 17,0 1,7 17,7
VNIIM 5,5 9,0 4,9 9,1 4,8 9,6 9,7 11,7 7,8 12,5 7,0 13,5
NIST 1,7 15,1 1,1 15,4 1,0 15,7 5,9 17,0 4,0 17,6 3,2 18,3
NMi-VSL -1,7 29,7 -2,4 29,9 -2,4 30,0 2,5 30,7 0,6 31,1 -0,3 31,5
Lab i
D i U i D ij U ij D ij U ij D ij U ij D ij U ij D ij U ij D ij U ij
PTB 0,7 1,8 1,3 12,3 1,5 6,1 0,5 14,6 -4,9 9,1 -1,1 15,4 2,4 29,9
BNM-CESTA
CSIRO-NML 0,7 3,4 1,4 12,7 1,6 6,7 0,5 14,9 -4,8 9,6 -1,0 15,7 2,4 30,0
CMI -4,2 7,5 -3,5 14,3 -3,3 9,5 -4,4 16,3 -9,7 11,7 -5,9 17,0 -2,5 30,7
CSIR-NML -2,3 8,8 -1,6 15,0 -1,4 10,5 -2,5 17,0 -7,8 12,5 -4,0 17,6 -0,6 31,1
CENAM -1,5 10,1 -0,8 15,8 -0,6 11,7 -1,7 17,7 -7,0 13,5 -3,2 18,3 0,3 31,5
NRC -0,7 11,9 0,2 13,3 -0,9 18,8 -6,2 14,9 -2,4 19,4 1,0 32,1
KRISS -0,9 5,2 -0,2 13,3 -1,1 15,4 -6,4 10,4 -2,6 16,1 0,8 30,3
NMIJ 0,2 14,3 0,9 18,8 1,1 15,4 -5,3 16,8 -1,5 20,9 1,9 33,1
VNIIM 5,5 9,0 6,2 14,9 6,4 10,4 5,3 16,8 3,8 17,5 7,2 31,0
NIST 1,7 15,1 2,4 19,4 2,6 16,1 1,5 20,9 -3,8 17,5 3,4 33,4
NMi-VSL -1,7 29,7 -1,0 32,1 -0,8 30,3 -1,9 33,1 -7,2 31,0 -3,4 33,4
Matrix of equivalence
pC/(m/s²)x10-4
PTB BNM-CESTA
pC/(m/s²)x10-4 pC/(m/s²)x10-4 pC/(m/s²)x10-4 pC/(m/s²)x10-4pC/(m/s²)x10-4pC/(m/s²)x10-4
pC/(m/s²)x10-4 pC/(m/s²)x10-4pC/(m/s²)x10-4
VNIIM NIST
CSIR-NML CENAMCSIRO-NML CMI
Laboratory result at this frequency excluded from calculation of the reference value
No data (measurement at shifted frequency)
pC/(m/s²)x10-4
NMIJ NMi-VSL
pC/(m/s²)x10-4 pC/(m/s²)x10-4 pC/(m/s²)x10-4
NRC KRISS

139
Table C21b: Matrix of equivalence for SE accelerometer at 4000 Hz
Key comparison CCAUV.V-K1 Single-ended (SE) accelerometer type 8305 WH 2335 S/N 1610174
Lab j Frequency 4000 Hz
Lab i
D i U i D ij U ij D ij U ij D ij U ij D ij U ij D ij U ij D ij U ij
PTB -2,4 4,8 1,4 10,9 -15,4 12,3 5,4 10,8
BNM-CESTA
CSIRO-NML 2,4 4,8 3,8 11,2 -13,0 12,6 7,8 11,2
CMI -1,4 10,9 -3,8 11,2 -16,8 16,0 4,0 14,9
CSIR-NML 15,4 12,3 13,0 12,6 16,8 16,0 20,8 15,9
CENAM -5,4 10,8 -7,8 11,2 -4,0 14,9 -20,8 15,9
NRC -9,1 12,6 -11,5 12,9 -7,7 16,2 -24,5 17,2 -3,7 16,2
KRISS -9,6 9,0 -12,0 9,5 -8,2 13,6 -25,0 14,8 -4,2 13,6
NMIJ 47,7 18,1 45,3 18,3 49,1 20,8 32,3 21,5 53,1 20,7
VNIIM -4,2 9,3 -6,6 9,8 -2,8 13,8 -19,6 15,0 1,2 13,8
NIST 5,4 15,8 3,0 16,1 6,8 18,8 -10,0 19,7 10,8 18,8NMi-VSL 29,9 77,0 27,5 77,0 31,3 77,7 14,5 77,9 35,3 77,7
Lab i
D i U i D ij U ij D ij U ij D ij U ij D ij U ij D ij U ij D ij U ij
PTB 9,1 12,6 9,6 9,0 -47,7 18,1 4,2 9,3 -5,4 15,8 -29,9 77,0
BNM-CESTA
CSIRO-NML 11,5 12,9 12,0 9,5 -45,3 18,3 6,6 9,8 -3,0 16,1 -27,5 77,0
CMI 7,7 16,2 8,2 13,6 -49,1 20,8 2,8 13,8 -6,8 18,8 -31,3 77,7
CSIR-NML 24,5 17,2 25,0 14,8 -32,3 21,5 19,6 15,0 10,0 19,7 -14,5 77,9
CENAM 3,7 16,2 4,2 13,6 -53,1 20,7 -1,2 13,8 -10,8 18,8 -35,3 77,7
NRC 0,6 15,0 -56,8 21,7 -4,9 15,2 -14,5 19,9 -39,0 77,9
KRISS -0,6 15,0 -57,3 19,9 -5,4 12,4 -15,0 17,8 -39,5 77,4
NMIJ 56,8 21,7 57,3 19,9 51,9 20,0 42,3 23,7 17,8 79,0
VNIIM 4,9 15,2 5,4 12,4 -51,9 20,0 -9,6 18,0 -34,1 77,5
NIST 14,5 19,9 15,0 17,8 -42,3 23,7 9,6 18,0 -24,5 78,5NMi-VSL 39,0 77,9 39,5 77,4 -17,8 79,0 34,1 77,5 24,5 78,5
NMi-VSL
CSIR-NML CENAMPTB BNM-CESTA CSIRO-NML CMI
Matrix of equivalence
pC/(m/s²)x10-4
no KCRV
No data (measurement at displaced frequency)
no KCRV
pC/(m/s²)x10-4
pC/(m/s²)x10-4 pC/(m/s²)x10-4 pC/(m/s²)x10-4 pC/(m/s²)x10-4 pC/(m/s²)x10-4 pC/(m/s²)x10-4
NRC KRISS
pC/(m/s²)x10-4
NMIJ VNIIM NIST
pC/(m/s²)x10-4 pC/(m/s²)x10-4pC/(m/s²)x10-4 pC/(m/s²)x10-4 pC/(m/s²)x10-4

140
Table C22a: Matrix of equivalence for BB accelerometer at 5000 Hz
Key comparison CCAUV.V-K2 Back-to-back (BB) accelerometer type 8305 S/N 1483337
Lab j Frequency 5000 Hz
Lab i
D i U i D ij U ij D ij U ij D ij U ij D ij U ij D ij U ij D ij U ij
PTB -0,3 1,7 -1,6 5,8 -0,2 8,2 1,4 9,4 0,3 10,7
BNM-CESTA
CSIRO-NML 1,4 4,8 1,6 5,8 1,5 9,3 3,0 10,4 1,9 11,6
CMI -0,2 7,5 0,2 8,2 -1,5 9,3 1,5 11,9 0,4 12,9
CSIR-NML -1,6 8,8 -1,4 9,4 -3,0 10,4 -1,5 11,9 -1,1 13,7
CENAM -0,6 10,2 -0,3 10,7 -1,9 11,6 -0,4 12,9 1,1 13,7
NRC -0,7 13,8 -0,4 14,2 -2,0 14,9 -0,5 16,0 1,0 16,6 -0,1 17,4
KRISS 0,9 5,2 1,2 6,1 -0,4 7,6 1,1 9,6 2,6 10,6 1,5 11,7
NMIJ -0,6 17,0 -0,3 17,3 -1,9 17,8 -0,4 18,8 1,1 19,3 0,0 20,0
VNIIM 13,8 9,1 14,0 9,3 12,4 10,3 13,9 11,8 15,4 12,7 14,3 13,6
NIST -1,6 15,4 -1,4 15,7 -3,0 16,3 -1,5 17,3 0,0 17,9 -1,1 18,6
NMi-VSL -0,8 48,8 -0,5 48,9 -2,1 49,1 -0,6 49,5 0,9 49,7 -0,3 50,0
Lab i
D i U i D ij U ij D ij U ij D ij U ij D ij U ij D ij U ij D ij U ij
PTB -0,3 1,7 0,4 14,2 -1,2 6,1 0,3 17,3 -14,0 9,3 1,4 15,7 0,5 48,9
BNM-CESTA
CSIRO-NML 1,4 4,8 2,0 14,9 0,4 7,6 1,9 17,8 -12,4 10,3 3,0 16,3 2,1 49,1
CMI -0,2 7,5 0,5 16,0 -1,1 9,6 0,4 18,8 -13,9 11,8 1,5 17,3 0,6 49,5
CSIR-NML -1,6 8,8 -1,0 16,6 -2,6 10,6 -1,1 19,3 -15,4 12,7 0,0 17,9 -0,9 49,7
CENAM -0,6 10,2 0,1 17,4 -1,5 11,7 0,0 20,0 -14,3 13,6 1,1 18,6 0,3 50,0
NRC -0,7 13,8 -1,6 15,0 -0,1 22,0 -14,4 16,5 1,0 20,8 0,2 50,8
KRISS 0,9 5,2 1,6 15,0 1,5 18,0 -12,8 10,5 2,6 16,5 1,7 49,2
NMIJ -0,6 17,0 0,1 22,0 -1,5 18,0 -14,3 19,2 1,1 23,1 0,3 51,8
VNIIM 13,8 9,1 14,4 16,5 12,8 10,5 14,3 19,2 15,4 17,9 14,5 49,7
NIST -1,6 15,4 -1,0 20,8 -2,6 16,5 -1,1 23,1 -15,4 17,9 -0,9 51,3
NMi-VSL -0,8 48,8 -0,2 50,8 -1,7 49,2 -0,3 51,8 -14,5 49,7 0,9 51,3
CSIR-NML CENAMCSIRO-NML
Matrix of equivalence
pC/(m/s²)x10-4
PTB BNM-CESTA
pC/(m/s²)x10-4
CMI
pC/(m/s²)x10-4 pC/(m/s²)x10-4
pC/(m/s²)x10-4 pC/(m/s²)x10-4 pC/(m/s²)x10-4
NMi-VSL
pC/(m/s²)x10-4 pC/(m/s²)x10-4 pC/(m/s²)x10-4
KRISS
pC/(m/s²)x10-4
NMIJ VNIIM
No data (measurement at shifted frequency)
Laboratory result at this frequency excluded from calculation of the reference value
pC/(m/s²)x10-4
NIST
pC/(m/s²)x10-4 pC/(m/s²)x10-4
NRC

141
Table C22b: Matrix of equivalence for SE accelerometer at 5000 Hz
Key comparison CCAUV.V-K1 Single-ended (SE) accelerometer type 8305 WH 2335 S/N 1610174
Lab j Frequency 5000 Hz
Lab i
D i U i D ij U ij D ij U ij D ij U ij D ij U ij D ij U ij D ij U ij
PTB -2,6 6,0 5,4 11,0 -32,6 13,9 13,1 10,9
BNM-CESTA
CSIRO-NML 2,6 6,0 8,0 11,9 -30,0 14,7 15,7 11,8
CMI -5,4 11,0 -8,0 11,9 -38,0 17,3 7,7 15,0
CSIR-NML 32,6 13,9 30,0 14,7 38,0 17,3 45,7 17,3
CENAM -13,1 10,9 -15,7 11,8 -7,7 15,0 -45,7 17,3
NRC -13,1 14,5 -15,7 15,2 -7,7 17,8 -45,7 19,7 0,0 17,7
KRISS -14,8 9,1 -17,4 10,2 -9,4 13,7 -47,4 16,2 -1,7 13,7
NMIJ 81,8 21,5 79,2 22,0 87,2 23,9 49,2 25,4 94,9 23,8
VNIIM -10,4 9,4 -13,0 10,5 -5,0 13,9 -43,0 16,4 2,7 13,9
NIST 2,6 16,3 0,0 16,9 8,0 19,2 -30,0 21,1 15,7 19,2NMi-VSL 47,6 46,8 45,0 47,0 53,0 47,9 15,0 48,6 60,7 47,9
Lab i
D i U i D ij U ij D ij U ij D ij U ij D ij U ij D ij U ij D ij U ij
PTB 13,1 14,5 14,8 9,1 -81,8 21,5 10,4 9,4 -2,6 16,3 -47,6 46,8
BNM-CESTA
CSIRO-NML 15,7 15,2 17,4 10,2 -79,2 22,0 13,0 10,5 0,0 16,9 -45,0 47,0
CMI 7,7 17,8 9,4 13,7 -87,2 23,9 5,0 13,9 -8,0 19,2 -53,0 47,9
CSIR-NML 45,7 19,7 47,4 16,2 -49,2 25,4 43,0 16,4 30,0 21,1 -15,0 48,6
CENAM 0,0 17,7 1,7 13,7 -94,9 23,8 -2,7 13,9 -15,7 19,2 -60,7 47,9
NRC 1,7 16,7 -94,9 25,7 -2,7 16,8 -15,7 21,4 -60,7 48,8
KRISS -1,7 16,7 -96,6 23,1 -4,4 12,5 -17,4 18,2 -62,4 47,5
NMIJ 94,9 25,7 96,6 23,1 92,2 23,2 79,2 26,7 34,2 51,3
VNIIM 2,7 16,8 4,4 12,5 -92,2 23,2 -13,0 18,4 -58,0 47,5
NIST 15,7 21,4 17,4 18,2 -79,2 26,7 13,0 18,4 -45,0 49,4NMi-VSL 60,7 48,8 62,4 47,5 -34,2 51,3 58,0 47,5 45,0 49,4
NMi-VSL
CSIR-NML CENAMPTB BNM-CESTA CSIRO-NML CMI
Matrix of equivalence
pC/(m/s²)x10-4
no KCRV
No data (measurement at displaced frequency)
no KCRV
pC/(m/s²)x10-4
pC/(m/s²)x10-4 pC/(m/s²)x10-4 pC/(m/s²)x10-4 pC/(m/s²)x10-4 pC/(m/s²)x10-4 pC/(m/s²)x10-4
NRC KRISS
pC/(m/s²)x10-4
NMIJ VNIIM NIST
pC/(m/s²)x10-4 pC/(m/s²)x10-4pC/(m/s²)x10-4 pC/(m/s²)x10-4 pC/(m/s²)x10-4