final report of the regional energy demand planning project
TRANSCRIPT
FINAL REPORT OF THE REGIONAL ENERGY DEMAND PLANNING PROJECT
FUTURE ENERGY SCENARIOS IN SOUTHEAST EUROPE AND THE POTENTIAL FOR ENERGY EFFICIENCY
June 2008 This publication was produced for review by the United States Agency for International Development. It was prepared by International Resources Group.


FINAL REPORT OF THE REGIONAL ENERGY DEMAND PLANNING PROJECT FUTURE ENERGY SCENARIOS IN SOUTHEAST EUROPE AND THE POTENTIAL FOR ENERGY EFFICIENCY USAID Contract No. EPP-I-00-03-00006-00 Task Order No. 1
International Resources Group 1211 Connecticut Avenue, NW, Suite 700 Washington, DC 20036 202-289-0100 Fax 202-289-7601 www.irgltd.com

DISCLAIMER The author’s views expressed in this publication do not necessarily reflect the views of the United States Agency for International Development or the United States Government.
SOUTH EAST EUROPE REGIONAL ENERGY MARKET SUPPORT (SEE REMS) PROJECT i
CONTENTS
Executive Summary .......................................................................................................... 1 Context ................................................................................................................................................................. 1 Accomplishments ................................................................................................................................................ 1 Analytical Results ................................................................................................................................................ 2 Report Organization .......................................................................................................................................... 4
List of Tables ...................................................................................................................... 5
List of Figures ..................................................................................................................... 7
Section 1: Highlights ........................................................................................................ 18 1.1 Project Overview ....................................................................................................................................... 18 1.2 Reference Scenario Highlights ................................................................................................................ 21 1.3 Policy Scenario Highlights ........................................................................................................................ 28 1.4 Conclusions and Next Steps ................................................................................................................... 36
Section 2: Reference Scenario Development and Analysis ......................................... 38 2.1 Reference Scenario Development ......................................................................................................... 38
2.1.1 Demand Drivers and Projecting Future Energy Service Demands ..................................... 39 2.1.2 Fuel Price and Availability .............................................................................................................. 41 2.1.3 Characterizing Existing Power Plants ......................................................................................... 42 2.1.4 Fuel Share Evolution ....................................................................................................................... 43 2.1.5 Future Technology Options ......................................................................................................... 43 2.1.6 New Technology Adoption Rates ............................................................................................... 46
2.2 Reference Scenario Regional Results .................................................................................................... 46 2.2.1 Final Energy Consumption ............................................................................................................ 46 2.2.2 Electricity Generation and Imports ............................................................................................ 52 2.2.3 Primary Energy Use ........................................................................................................................ 53 2.2.4 Energy System Costs ...................................................................................................................... 57
Section 3: Scenario Analysis Regional Results .............................................................. 59 3.1 Scenario Definitions .................................................................................................................................. 59
Appendix 1: Individual Country Results ........................................................................ 72
A. Albania ......................................................................................................................... 73 A.1 Highlights ..................................................................................................................................................... 73
A.1.1 Reference Scenario ........................................................................................................................ 73 A.1.2 Policy Scenarios .............................................................................................................................. 75

ii SOUTH EAST EUROPE REGIONAL ENERGY MARKET SUPPORT (SEE REMS) PROJECT
A.2 Energy System Under a Reference Scenario ...................................................................................... 78 A.2.1 Critical Driving Assumptions ....................................................................................................... 78 A.2.2 Energy Service Demand Projections .......................................................................................... 80 A.2.3 Energy Supply and Prices .............................................................................................................. 85 A.2.4 Reference Scenario Outline ......................................................................................................... 87
A.3 Scenario Analysis RESULTS .................................................................................................................... 96 A.3.1 Final Energy Consumption Patterns ........................................................................................... 96 A.3.2 Power Sector Investments and Electricity Generation ......................................................... 97 A.3.3 Energy Supply Picture .................................................................................................................... 99 A.3.4 Costs ............................................................................................................................................... 101
B. Bosnia and Herzegovina ........................................................................................... 102 B.1 Highlights ................................................................................................................................................... 102
B.1.1 Reference Scenario ....................................................................................................................... 102 B.1.2 Policy Scenarios ............................................................................................................................. 104
B.2 Energy System Under a Reference Scenario ..................................................................................... 107 B.2.1 Critical Driving Assumptions ..................................................................................................... 107 B.2.2 Energy Service Demand Projections ........................................................................................ 109 B.2.3 Energy Supply and Prices............................................................................................................. 112 B.2.4 Reference Scenario Highlights ................................................................................................... 113
B.3 Scenario Analysis Highlights .................................................................................................................. 121 B.3.1 Final Energy Consumption Patterns ......................................................................................... 122 B.3.2 Power Sector Investments and Electricity Generation ....................................................... 123 B.3.1 Energy Supply Picture .................................................................................................................. 124 B.3.4 Costs ................................................................................................................................................ 126
C. Bulgaria ...................................................................................................................... 128 C.1 Highlights ................................................................................................................................................... 128
C.1.1 Reference Scenario ...................................................................................................................... 128 C.1.2 Policy Scenarios ............................................................................................................................ 130
C.2 Energy System Under a Reference Scenario .................................................................................... 134 C.2.1 Critical Driving Assumptions .................................................................................................... 134 C.2.2 Energy Service Demand Projections ....................................................................................... 135 C.2.3 Energy Supply and Prices ............................................................................................................ 138 C.2.4 Reference Scenario Highlights................................................................................................... 139
C.3 Scenario Analysis Highlights ................................................................................................................. 148 C.3.1 Final Energy Consumption Patterns ........................................................................................ 149

SOUTH EAST EUROPE REGIONAL ENERGY MARKET SUPPORT (SEE REMS) PROJECT iii
C.3.2 Power Sector Investments and Electricity Generation ....................................................... 150 C.3.3 Energy Supply Picture .................................................................................................................. 152 C.3.4 Costs ............................................................................................................................................... 154
C.4 Country Specific Analysis Highlights .................................................................................................. 156 C.4.1 Electricity generation .................................................................................................................. 156 C.4.2 Energy Supply ................................................................................................................................ 158 C.4.3 Carbon Dioxide Emissions......................................................................................................... 159
D. Croatia ....................................................................................................................... 161 D.1 Highlights .................................................................................................................................................. 161
D.1.1 The Reference Scenario ............................................................................................................. 161 D.1.2 The Policy Scenarios ................................................................................................................... 163
D.2 Assumptions for a Reference Scenario ............................................................................................. 166 D.2.1 Assumptions for the Drivers’ Growth ................................................................................... 166 D.2.2 Energy Service Demand Projections ....................................................................................... 168 D.2.3 Energy Resources and Regional Energy Prices ..................................................................... 172
D.3 Reference Scenario Highlights ............................................................................................................. 173 D.3.1 Final Energy Consumption ......................................................................................................... 173 D.3.2 Electricity Generation Requirements ...................................................................................... 177 D.3.3 Primary Energy Supply ................................................................................................................ 178 D.3.4 Costs ............................................................................................................................................... 180
D.4 Scenario Analysis Highlights ................................................................................................................. 180 D.4.1 Final Energy Consumption ......................................................................................................... 180 D.4.2 Electricity Generation and Power Sector Investments ....................................................... 181 D.4.3 Primary Energy Supply ................................................................................................................ 183 D.4.4 Energy System Costs ................................................................................................................... 184
D.5 Country Specific Analyses .................................................................................................................... 186 D.5.1 Country Issues for Future Analyses I – Renewable Case Scenario ................................. 186 D.5.2. Country Issues for Future Analyses II – Nuclear PP Option Case Scenario ................ 187
D.6 Country Issues for Future Analyses ................................................................................................... 188 E. Macedonia .................................................................................................................. 189
E.1 Highlights.................................................................................................................................................... 189 E.1.1 Reference Scenario ....................................................................................................................... 189 E.1.2 Policy Scenarios ............................................................................................................................. 191
E.2 Energy System Under a Reference Scenario ..................................................................................... 195 E.2.1 Critical Driving Assumptions ..................................................................................................... 195
iv SOUTH EAST EUROPE REGIONAL ENERGY MARKET SUPPORT (SEE REMS) PROJECT
E.2.2 Energy Service Demand Projections ........................................................................................ 196 E.2.3 Energy Supply and Prices ............................................................................................................. 199 E.2.4 Reference Scenario ....................................................................................................................... 201
E.3 Scenario Analysis Results ....................................................................................................................... 210 E.3.1 Final Energy Consumption Patterns ......................................................................................... 210 E.3.2 Power Sector Investments and Electricity Generation ........................................................ 212 E.3.3 Energy Supply Picture ................................................................................................................... 214 E.3.4 Costs ................................................................................................................................................ 216
F. Romania ...................................................................................................................... 218 F.1 Highlights .................................................................................................................................................... 218
F.1.1 The Reference Scenario .............................................................................................................. 218 F.1.2 Policy Scenarios ............................................................................................................................. 221
F.2 Assumptions for a Reference Scenario ............................................................................................... 223 F.2.1 Assumptions for the Drivers’ Growth ..................................................................................... 223 F.2.2 Energy Service Demand Projections ......................................................................................... 225 F.2.3 Energy Resources and Regional Energy Prices ....................................................................... 229
F.3 Reference Scenario Highlights .............................................................................................................. 230 F.3.1 Final Energy Consumption .......................................................................................................... 230 F.3.2 Electricity Generation Requirements ....................................................................................... 234 F.3.3 Primary Energy Supply ................................................................................................................. 235 F.3.4 Costs ................................................................................................................................................ 236
F.4 Scenario Analysis Highlights .................................................................................................................. 237 F.4.1 Final Energy Consumption .......................................................................................................... 237 F.4.2 Electricity Generation and Power Sector Investments ........................................................ 238 F.4.3 Primary Energy Supply ................................................................................................................. 241 F.4.4 Energy System Costs .................................................................................................................... 242
G. Serbia ......................................................................................................................... 244 G.1 Highlights .................................................................................................................................................. 244
G.1.1 Reference Scenario ...................................................................................................................... 244 G.1.2 Policy Scenarios ............................................................................................................................ 246
G.2 Energy System Under a Reference Scenario .................................................................................... 249 G.2.1 Critical Driving Assumptions .................................................................................................... 249 G.2.2 Energy Service Demand Projections ....................................................................................... 251 G.2.3 Energy Supply and Prices ............................................................................................................ 254 G.2.4 Reference Scenario Highlights .................................................................................................. 255

SOUTH EAST EUROPE REGIONAL ENERGY MARKET SUPPORT (SEE REMS) PROJECT v
G.3 Scenario Analysis Highlights ................................................................................................................. 263 G.3.1 Final Energy Consumption Patterns ........................................................................................ 263 G.3.2 Power Sector Investments and Electricity Generation ....................................................... 264 G.3.3 Energy Supply Picture ................................................................................................................. 266 G.3.4 Costs ............................................................................................................................................... 268
H. UNMIK ....................................................................................................................... 270 H.1 Highlights .................................................................................................................................................. 270
H.1.1 Reference Scenario ...................................................................................................................... 270 H.1.2 Policy Scenarios ............................................................................................................................ 272
H.2 Energy System Under a Reference Scenario .................................................................................... 276 H.2.1 Critical Driving Assumptions .................................................................................................... 276 H.2.2 Energy Service Demand Projections ....................................................................................... 277 H.2.3 Energy Supply and Prices ............................................................................................................ 280 H.2.4 Reference Scenario Highlights .................................................................................................. 282
H.3 Scenario Analysis Highlights ................................................................................................................. 290 H.3.1 Final Energy Consumption Patterns ........................................................................................ 290 H.3.2 Power Sector Investments and Electricity Generation ....................................................... 292 H.3.3 Energy Supply Picture.................................................................................................................. 294 H.3.4 Costs ............................................................................................................................................... 296


SOUTH EAST EUROPE REGIONAL ENERGY MARKET SUPPORT (SEE REMS) PROJECT 1
EXECUTIVE SUMMARY
CONTEXT The countries of South East Europe are developing regional approaches to energy cooperation. The Athens Treaty that came into force in July 2006 encourages creating regional electricity and gas markets as steps towards integration into the European Union’s (EU’s) Internal Energy Market. Countries in the region are in varying stages of transition to competitive markets and accession to the European Union. There are several core issues that should be examined as countries transition to liberalized energy markets while simultaneously addressing EU directives and fostering development of globally competitive economies. These issues include: the relationship between economic growth and energy demand, the potential for energy efficiency gains, the increased role for natural gas and renewables, and full integration and harmonization of the regional electricity and natural gas systems.
As is detailed in Section 2, the Reference scenario, continuation of current trends in regional energy use, shows aggregate energy use for the region increasing by almost 60 percent [and electricity use rising by over 80 percent] over the next 27 years. Careful planning and the institution of policies to foster more efficient and cost-effective energy technologies could temper this growth, while providing significant environmental and economic benefits. The goal is to lay the foundation for fostering a better understanding of the possible paths for the evolution of the national energy systems by building analytical capacity within the region to inform energy planners and decision-makers and to use these tools to examine the costs and benefits of more efficient alternatives to the current course of energy policy.
This report summarizes the results to date of the United States Agency for International Development (USAID)-supported Regional Energy Demand Planning (REDP) activities under the South East Europe Regional Energy Market Support (SEE REMS) Project (10/1/2004 – 9/30/2008). The original countries directly involved in implementing the planning activities included Albania, Bulgaria, Bosnia and Herzegovina, Croatia, Macedonia, Romania, Serbia and Montenegro and the United Nations Interim Mission in Kosovo (UNMIK pursuant to the UN SCR 1244). Under REDP, USAID sought to complement the work begun under the Generation Investment Study (GIS) 1
ACCOMPLISHMENTS
of the World Bank by conducting a more detailed analysis of the demand for energy and the competing factors and policies that will shape this demand.
The SEE REMS project supported teams from the energy planning ministries of each country in developing National Energy Planning Models using the MARKAL/TIMES framework2
For each country model, the current energy system was depicted and calibrated using 2003 national energy balance data to produce a baseline “snapshot” of the technology stock in place. Forecasts for economic growth were translated into projected future demands for energy services (e.g., heating buildings, lighting houses, providing high-temperature heat to industry) out to 2027. The technical and economic characterizations of existing and advanced energy supply and end-use technologies were incorporated into the models, and each of the country teams used its knowledge and expert judgment to refine the models’
. These national models provide a framework for exploring policy options and investment strategies, integrating supply-side and demand-side options to promote the cost-effective evolution of the energy systems in each country, and in the region as a whole.
1 Development of Power Generation In the South East Europe Update of Generation Investment Study, , Volume 1: Summary Report, Final
Report, prepared by South East Europe Consultants Ltd. for The World Bank, January 9, 2007. 2 A widely applied full-sector energy systems modeling platform that can analyze energy, economic and environmental issues at the global, national
and municipal levels, over several decades; www.etsap.org.

2 SOUTH EAST EUROPE REGIONAL ENERGY MARKET SUPPORT (SEE REMS) PROJECT
projection of a Reference (or continued current dynamics) scenario for each country. This scenario then served as the comparison point for evaluating the benefits, costs, and technology investments that would result from the implementation of possible future government policies, programs, environmental constraints, and various resource supply options.
As part of this USAID project the regional capacity to perform national energy system modeling and analysis has been created by mentoring the country teams through the process of model development and utilization. As this report demonstrates, the teams now have the capacity to perform meaningful analyses with their models. This capacity is a significant first step towards better informed national and regional policy making decisions based on more robust, locally guided, analyses – the ultimate objective of the REDP. With this foundation, policy makers in the region can now collaborate with the country model teams to perform ever changing analyses of various economic and policy scenarios to evaluate the costs and benefits of a range of mechanisms and select the preferred set of actions to effect desired outcomes. The potential benefits are enormous – in terms of more efficient investment, enhanced energy security, increased environmental protection, and more targeted policies with fewer unanticipated impacts.
The analysis in this report focuses largely on potential benefits to be gained from efficiency improvements and examines both supply-side solutions and introduction of programs and policies to encourage investments in demand-side energy efficiency measures and thereby reduce necessary supply-side costs. The indicative policy analyses indicate the resultant benefits in terms of energy security (less imports) and competitiveness (better energy intensity at acceptable cost).
ANALYTICAL RESULTS This report presents the results of a few indicative policy scenario analyses performed using the newly built models and provides insights into regional and national energy system dynamics by:
• Quantifying the energy supply needed to meet future energy demand;
• Comparing the investments (supply-side and end-use) and fuel expenditures required to implement alternate policies relative to the Reference scenario;
• Identifying the impacts of those policies on technology choices and fuel mix in the different demand sectors; and
• Examining the changes in energy system costs, energy security and environmental impacts.
The analysis explores the potential role of policies aimed at encouraging greater energy efficiency throughout the region using three alternatives to the Reference scenario representing progressively stronger implementation of energy efficiency measures:
• Promoting Energy Efficiency (R90) – accelerated adoption of more energy efficient end-use devices
• Reducing Electricity Consumption (R90E) – a “mandated” 10% reduction in electricity consumption from the Reference levels and
• Reducing Energy Intensity (R90P) – a cost-effective (relative to the Reference scenario) reduction in overall energy system intensity achieved by limiting total energy use (supply and end-use).
The primary results of the analysis are summarized in Table ES-1, and Figures ES-1 and ES-2. Table ES-1 shows the range of cost and energy savings provided by the three scenarios relative to the Reference scenario.

SOUTH EAST EUROPE REGIONAL ENERGY MARKET SUPPORT (SEE REMS) PROJECT 3
Table ES-1. Benefits Arising from Increased Energy Efficiency Improvement Benefit Range (in 2027)
Total discounted energy system cost savings 1.5 - 2% (€3.78 - €6.06 billion) over the planning horizon
Change in undiscounted annual costs
Power plant investment Decrease of .2 – 15% (5 - 455€ million)
Demand-side investment Increase of 14 – 28% (1.59 – 3.16€ billion)
Fuel Expenditure Decrease of 13 – 16% (€3.43/3.36/4.04 billion)
Annual energy savings 9 – 18% (417 – 793 PJ)
Annual electricity savings 6 – 11% (17 - 33GWh)
Reduction of imports 16 – 17% (309 – 343 PJ)
Decrease in energy intensity 9.4 – 18%
Figure ES-1 shows the decrease in regional energy intensity in 2027 achieved through implementation of the energy efficiency policies described above compared to the Reference case. At the same time, the alternate scenarios lower the total energy system cost (including investments in new capacity and demand devices, expenditure on fuel, transmission and distribution infrastructure, etc., to the extent represented in the models) by almost 2% for the Promoting Energy Efficiency scenario (R90) and by 1.2% for the Reducing Electricity Consumption (R90E) scenario. For the Reducing Energy Intensity (R90P) scenario, the total energy system cost approximates that of the Reference scenario, indicating the level of improvement that can be achieved at costs similar to those of the Reference scenario. Figure ES-2 shows that the overall cost of implementing the energy system improvements represented in these alternate scenarios is relatively small because the increased investments made in more efficient end-use technologies are offset by significant reductions in fuel expenditures and modest reductions in the level of new investments in the power sector. Further details of the assumptions, costs, and benefits of these scenarios are provided in subsequent sections of this report.
Figure ES-1: Aggregate Reduction in Regional Energy Intensity in 2027 Relative to the
Reference Case
Figure ES-2: Change in 2027 Annual Expenditures
0%
2%
4%
6%
8%
10%
12%
14%
16%
18%
R90
R90E
R90P
-5000
-4000
-3000
-2000
-1000
0
1000
2000
3000
4000
R90 R90E R90P
2003
€ M
illio
n
Annual Investment in Power Sector
Annual Investment in Demand Devices
Annual Expenditures on Fuel

4 SOUTH EAST EUROPE REGIONAL ENERGY MARKET SUPPORT (SEE REMS) PROJECT
REPORT ORGANIZATION • Section 1 presents the main highlights of the analysis.
• Section 2 summarizes the approach, data and key assumptions used to develop the Reference scenario and presents the aggregate regional results for the 8 national models. Examination of the Reference scenario provides insights into the current dynamics of the region’s national energy systems and lays the foundation for examining the critical resource, technology and end-use demand issues facing the region over the next 25 years.
• Section 3 presents a regional analysis of the alternate scenarios as compared to the Reference scenario, analyzing the aggregate picture arising from promoting energy efficiency in the region in terms of energy and cost savings, investment requirements, and technology changes.
• Appendices 1 through 8 contain the individual country results developed by the national experts and the USAID consultants. Each Section of Appendix 1 provides additional country level details for the Reference and three alternate scenarios, as well as other selected country scenarios.

SOUTH EAST EUROPE REGIONAL ENERGY MARKET SUPPORT (SEE REMS) PROJECT 5
LIST OF TABLES
Table ES-1. Benefits Arising from Increased Energy Efficiency ............................................................................... 3 Table 1-1: SEE-REDP Participating Institutions ......................................................................................................... 19 Table 1-2: Efficiency Promotion Scenarios Examined ............................................................................................. 28 Table 1-3. Benefits Arising from Increased Energy Efficiency ............................................................................... 36 Table 2-1: Key Demand Drivers .................................................................................................................................. 39 Table 2-2: SEE-REDP Example Power Plant Characteristics ................................................................................. 45 Table 2-3: Share of Final Energy in 2027, ordered by % of Total for the Region ............................................ 50 Table 3-1: Efficiency Improvement Scenarios Examined ........................................................................................ 59 Table A-1: Sector Fuel Price “Mark-Ups” (M2003€/PJ) ......................................................................................... 85
Table A-2: Upper Limits on Domestic Resource Supply (PJ)................................................................................ 87 Table A-3: Energy Intensity (PJ/GDP) ....................................................................................................................... 101 Table B-1: Demand Elasticities ................................................................................................................................... 111 Table B-2: Growth Rate of Agricultural Production ............................................................................................. 112 Table B-3: Sector Fuel Price “Mark-Ups” (M2003€/PJ) ........................................................................................ 113
Table B-4: Upper limits on Domestic Resource Supply (PJ) ............................................................................... 113 Table B-5: Energy Intensity (PJ/GDP) ........................................................................................................................ 126 Table C-1: Demand Elasticities ................................................................................................................................... 137 Table C-2: Sector Fuel Price “Mark-Ups” (M2003€/PJ) ....................................................................................... 138
Table C-3: Upper Limits on Domestic Resource Supply (PJ) ............................................................................. 139 Table C-4: Percentage Change from R0 .................................................................................................................. 154 Table D-1: Demand Elasticities .................................................................................................................................. 171 Table D-2: Upper Limits on Domestic Resource .................................................................................................. 172 Table D-3: Sector Fuel Distribution Cost (M2003€/PJ) ....................................................................................... 173 Table D-4: Energy Intensity (PJ/GDP) ....................................................................................................................... 184 Table D-5: New Potential for Renewables in the Electricity Sector (GW) .................................................... 186 Table E-1: Sector Fuel Price “Mark-ups” (M2003€/PJ) ......................................................................................... 200
Table E-2: Upper Limits on Domestic Resource Supply (PJ) .............................................................................. 201 Table E-3: Energy Intensity (PJ/GDP) ........................................................................................................................ 216 Table F-6: Demand Elasticities .................................................................................................................................... 228 Table F-7: Upper Limits on Domestic Resource ................................................................................................... 229 Table F-8: Sector Fuel Distribution Cost (M2003€/PJ) ........................................................................................ 229

6 SOUTH EAST EUROPE REGIONAL ENERGY MARKET SUPPORT (SEE REMS) PROJECT
Table F-9: Energy Intensity (PJ/GDP) ........................................................................................................................ 241 Table G-1: Demand Elasticities................................................................................................................................... 253 Table G-2: Sector Fuel Price “Mark-Ups” (M2003€/PJ) ....................................................................................... 254
Table G-3: Upper Limits on Domestic Resource Supply (PJ) ............................................................................. 255 Table G-4: Energy Intensity (PJ/GDP) ....................................................................................................................... 268 Table H-1: Demand Elasticities ................................................................................................................................... 279 Table H-2: Sector Fuel Price “Mark-Ups” (M2003€/PJ) ....................................................................................... 281
Table H-3: Upper Limits on Domestic Resource Supply (PJ) ............................................................................. 282 Table H-4: Percentage Change from R0 .................................................................................................................. 296

SOUTH EAST EUROPE REGIONAL ENERGY MARKET SUPPORT (SEE REMS) PROJECT 7
LIST OF FIGURES
Figure ES-1: Aggregate Reduction in Regional Energy Intensity in 2027 Relative to the Reference Case ... 3 Figure ES-2: Change in 2027 Annual Expenditures .................................................................................................... 3 Figure 1-1: SEE-REDP Organizational Framework .................................................................................................. 18 Figure 1-2: Aggregate Final Energy Consumption by Fuel Type for the Region ............................................... 23 Figure 1-3: Aggregate Final Energy Consumption by Sector for the Region ..................................................... 24 Figure 1-4: Share of Cumulative Final Energy Consumption by Country .......................................................... 24 Figure 1-5: Aggregate Electricity Generation by Fuel Type for the Region ....................................................... 25 Figure 1-6: Electricity Generation for the Region .................................................................................................... 25 Figure 1-7: Aggregate Primary Energy Use for the Region .................................................................................... 26 Figure 1-8: Composition of Energy Supply by Country in 2003 ........................................................................... 27 Figure 1-9: Total Discounted Energy System Cost for the Region ..................................................................... 27 Figure 1-10: Aggregate Annual Energy System Expenditure for the Region ..................................................... 28 Figure 1-11: Aggregate Savings in Total Final Energy Demand by Sector for the Region .............................. 29 Figure 1-12: Aggregate Savings in Total Final Energy Demand by Country....................................................... 30 Figure 1-13: Aggregate Saving in Total Electricity Consumption for the Region ............................................. 30 Figure 1-14: Aggregate Electricity Generation by Fuel Type for the Region .................................................... 31 Figure 1-15: 2027 Electricity Generation Mix by Fuel Type for the Region ...................................................... 31 Figure 1-16: Aggregate Total Primary Energy Supply for the Region .................................................................. 32 Figure 1-17: Reduction in Energy Intensity by Country ......................................................................................... 32 Figure 1-18: Level of Import for the Region ............................................................................................................. 33 Figure 1-19: Drop in Imports’ Share of Total Primary Energy by Country ....................................................... 33 Figure 1-20: Aggregate Total Discounted System Cost for the Region ............................................................. 34 Figure 1-21: Annual Expenditure on the Energy System for the Region ............................................................ 35 Figure 1-22: Change in 2027 Annual Expenditures ................................................................................................. 35 Figure 2-1: Evolution of the Demand for Energy Services by Sector .................................................................. 41 Figure 2-2: NEEDS Import Energy Price Assumptions ........................................................................................... 42 Figure 2-3: Final Energy Demand by Sector .............................................................................................................. 47 Figure 2-4: 2003/2027 Share of Final Energy Demand by Sub-sector ................................................................. 48 Figure 2-5: Final Energy Demand by Fuel Type ........................................................................................................ 51 Figure 2-6: Final Energy Demand by Country ........................................................................................................... 51 Figure 2-7: Electricity Generation by Fuel Form by Country ............................................................................... 52

8 SOUTH EAST EUROPE REGIONAL ENERGY MARKET SUPPORT (SEE REMS) PROJECT
Figure 2-8: Fuel Input to Power Generation ............................................................................................................. 52 Figure 2-9: Electric Generation (plus Imports) by Country .................................................................................. 53 Figure 2-10: Percent 2003 Energy Supply Share by Fuel Type .............................................................................. 54 Figure 2-11: Percent 2003 Energy Supply Share by Country ................................................................................ 54 Figure 2-12: Composition of Energy Supply by Country in 2003 ........................................................................ 55 Figure 2-13: Regional Primary Energy Supply ............................................................................................................ 56 Figure 2-14: Primary Energy Supply by Country ...................................................................................................... 57 Figure 2-15: Annual Investment and Operating Costs (excluding fuel) .............................................................. 57 Figure 2-16: Annual Energy System Costs ................................................................................................................. 58 Figure 3-1: Final Energy Saving by Subsector for the Region ................................................................................ 61 Figure 3-2: Final Energy Savings from “EE” Policy by Demand Sector for the Region .................................... 62 Figure 3-3: Total Electricity Saving from “EE” Policy for the Region .................................................................. 62 Figure 3-4: Electricity Generation by Fuel Type for the Region ........................................................................... 63 Figure 3-5: 2027 Electricity Generation Mix by Fuel Type for the Region ........................................................ 64 Figure 3-6: New Power Plant Capacity Additions for the Region ....................................................................... 65 Figure 3-7: Power Sector Investment Requirements by Fuel Type for the Region ......................................... 65 Figure 3-8: Total Primary Energy Supply for the Region ........................................................................................ 66 Figure 3-9: 2027 Primary Energy Supply Mix for the Region ................................................................................ 67 Figure 3-10: Aggregate Reduction in Regional Energy Intensity in 2027 Relative to the Reference Case . 67 Figure 3-11: Level of Import for the Region ............................................................................................................. 68 Figure 3-12: Reduction of Imports by Fuel for the Region .................................................................................... 68 Figure 3-13: Aggregate Total Discounted System Cost for the Region ............................................................. 69 Figure 3-14: Annual Expenditure on the Energy System for the Region ............................................................ 70 Figure 3-15: Change in 2027 Annual Expenditures ................................................................................................. 70 Figure 3-16: Reduction in CO2 Emissions .................................................................................................................. 71 Figure A-1: Percent of Final Energy Consumption by Fuel Type ......................................................................... 73 Figure A-2: Percent of Final Energy Consumption by Sector ............................................................................... 74 Figure A-3: Percent Electricity Generation by Fuel Type ...................................................................................... 74 Figure A-4: Percent of Total Energy Supply .............................................................................................................. 75 Figure A-5: 2027 Total Energy Supply ........................................................................................................................ 76 Figure A-6: 2027 Electricity Generation Mix by Fuel .............................................................................................. 76 Figure A-7: 2027 Final Energy Consumption ............................................................................................................ 77 Figure A-8: Aggregate Total Discounted System Cost ........................................................................................... 78 Figure A-9: Change in 2027 Annual Expenditures ................................................................................................... 78

SOUTH EAST EUROPE REGIONAL ENERGY MARKET SUPPORT (SEE REMS) PROJECT 9
Figure A-10: Trend of Population and its Growth Rate ......................................................................................... 79 Figure A-11: Trend of Households and Number of Persons per Household ................................................... 79 Figure A-12: Projection of Total GDP and its Growth Rate ................................................................................ 80 Figure A-13: Sectoral Contributions to GDP ........................................................................................................... 80 Figure A-14: Projection of Energy Service Demand from Each Sector (Useful Energy)................................. 81 Figure A-15: Composition of Residential Dwellings over Time ........................................................................... 82 Figure A-16: Residential Demand for Energy Services (Useful Energy) .............................................................. 82 Figure A-17: Commercial Demand for Energy Services (Useful Energy) ........................................................... 83 Figure A-18: Present Contribution of Industrial Sub-Sectors to GDP (MEURO - 2003) .............................. 84 Figure A-19: Projections of the Industrial GDP (€2003 million) in 2027 ........................................................... 84 Figure A-20: Industrial Demand for Energy Services (Useful Energy) ................................................................. 85 Figure A-21: Energy Prices Based on the EU NEEDS Project............................................................................... 86 Figure A-22: Final Energy Consumption by Sector .................................................................................................. 88 Figure A-23: Final Energy Consumption by Sector (Share) ................................................................................... 88 Figure A-24: Final Energy Consumption by Fuel ...................................................................................................... 89 Figure A-25: Final Energy Consumption – Residential ............................................................................................ 90 Figure A-26: Final Energy Consumption – Commercial ......................................................................................... 90 Figure A-27: Final Energy Consumption – Industry ................................................................................................. 91 Figure A-28: Final Energy Consumption – Agriculture ........................................................................................... 92 Figure A-29: Electricity Demand: MARKAL vs. the National Strategy of Energy (GWh) .............................. 93 Figure A-30: Electricity Generation by Fuel .............................................................................................................. 93 Figure A-31: Share of the Electricity Generation by Fuel ...................................................................................... 94 Figure A-32: Energy Supply by Type............................................................................................................................ 95 Figure A-33: Energy Supply by Type (Shares) ........................................................................................................... 95 Figure A-34: Final Energy Consumption by Fuel ...................................................................................................... 96 Figure A-35: Savings in Final Energy by Sector ......................................................................................................... 97 Figure A-36: Electricity Generation by Fuel .............................................................................................................. 98 Figure A-37: Savings in Electricity Generation .......................................................................................................... 98 Figure A-38: Investments in New (and Refurbished) Power Plants .................................................................... 99 Figure A-39: Supply of Energy ..................................................................................................................................... 100 Figure A-40: Imports Share of Total Supply ............................................................................................................ 100 Figure A-41: Annual Energy System Expenditures ................................................................................................. 101 Figure B-1: Percent of Final Energy Consumption by Fuel Type ........................................................................ 102 Figure B-2: Percent of Final Energy Consumption by Sector .............................................................................. 103

10 SOUTH EAST EUROPE REGIONAL ENERGY MARKET SUPPORT (SEE REMS) PROJECT
Figure B-3: Percent Electricity Generation by Fuel Type ..................................................................................... 103 Figure B-4: Percent of Total Energy Supply ............................................................................................................. 104 Figure B-5: Final Energy Consumption ..................................................................................................................... 105 Figure B-6: 2027 Electricity Generation Mix by Fuel Type .................................................................................. 105 Figure B-7: Total Energy Supply ................................................................................................................................. 106 Figure B-8: Aggregate Total Discounted System Cost ......................................................................................... 107 Figure B-9: Change in 2027 Annual Expenditures.................................................................................................. 107 Figure B-10: Trend of Population and its Growth Rate ....................................................................................... 108 Figure B-11: Trend of Households and Number of Persons per Household ................................................. 108 Figure B-12: GDP and GDP Growth Rate ............................................................................................................... 109 Figure B-13: Projection of Energy Service Demand for each Sector ................................................................ 109 Figure B-14: Composition of Residential Dwellings over Time.......................................................................... 110 Figure B-15: Residential Demand for Energy Services (Useful Energy) ............................................................ 110 Figure B-16: Commercial Demand for Energy Services (Useful Energy) ......................................................... 111 Figure B-17: Industrial Demand for Energy Services (Useful Energy) ............................................................... 112 Figure B-18: Final Energy Consumption by Fuel ..................................................................................................... 114 Figure B-19: Final Energy Consumption by Sector ................................................................................................ 114 Figure B-20: Final Energy Consumption – Residential .......................................................................................... 115 Figure B-21: Final Energy Consumption – Commercial ....................................................................................... 116 Figure B-22: Final Energy Consumption – Industry ............................................................................................... 116 Figure B-23: Final Energy Consumption – Agriculture ......................................................................................... 117 Figure B-24: Electricity Generation by Fuel ............................................................................................................. 118 Figure B-25: Share of the Electricity Generation by Fuel ..................................................................................... 118 Figure B-26: Net Power Generation Comparison [Thousand GWh] .............................................................. 119 Figure B-27: Energy Supply by Type .......................................................................................................................... 120 Figure B-28: Energy Supply by Type (Shares) .......................................................................................................... 120 Figure B-29: Final Energy Consumption by Fuel ..................................................................................................... 122 Figure B-30: Savings in Final Energy by Sector ........................................................................................................ 122 Figure B-31: Electricity Generation by Fuel ............................................................................................................. 123 Figure B-32: Savings in Electricity Generation ........................................................................................................ 123 Figure B-33: Investments in New (and Refurbished) Power Plants ................................................................... 124 Figure B-34: Supply of Energy ..................................................................................................................................... 125 Figure B-35: Total Imports .......................................................................................................................................... 125 Figure B-36: Total Discounted Energy System ....................................................................................................... 126

SOUTH EAST EUROPE REGIONAL ENERGY MARKET SUPPORT (SEE REMS) PROJECT 11
Figure B-37: Annual Energy System Expenditures ................................................................................................. 127 Figure C-1: End-Use Fuel Consumption .................................................................................................................. 128 Figure C-2: Energy Consumption by Sector ........................................................................................................... 129 Figure C-3: Electricity Generation ............................................................................................................................. 129 Figure C-4: Primary Energy Use ................................................................................................................................. 130 Figure C-5: End-Use Fuel Consumption in 2027 ................................................................................................... 131 Figure C-6: Electric Generation by Power Plant Type in 2027 .......................................................................... 131 Figure C-7: Primary Energy Use in 2027 .................................................................................................................. 132 Figure C-8: Total Discounted System Cost ............................................................................................................ 133 Figure C-9: Change in 2027 Expenditures Relative to Reference ...................................................................... 133 Figure C-10: Trend of Population and its Growth Rate ....................................................................................... 134 Figure C-11: Trend of Households and Number of Persons per Household ................................................. 134 Figure C-12: Forecast of Total GDP and its Growth Rate .................................................................................. 135 Figure C-13: Forecast of Energy Service Demand from each Sector ............................................................... 135 Figure C-14: Composition of Residential Dwellings over Time ......................................................................... 136 Figure C-15: Residential Demand for Energy Services (Useful Energy) ........................................................... 136 Figure C-16: Commercial Demand for Energy Services (Useful Energy) ......................................................... 137 Figure C-17: Industrial Demand for Energy Services (Useful Energy) .............................................................. 138 Figure C-18: Final Energy Consumption by Sector Share .................................................................................... 140 Figure C-19: Final Energy Consumption by Fuel .................................................................................................... 141 Figure C-20: Final Energy Consumption - Residential .......................................................................................... 142 Figure C-21: Final Energy Consumption - Commercial ........................................................................................ 143 Figure C-22: Final Energy Consumption - Industry ............................................................................................... 143 Figure C-23: Final Energy Consumption - Agriculture ......................................................................................... 144 Figure C-24: Forecast of Electricity Demand .......................................................................................................... 145 Figure C-25: Electricity Generation by Fuel ............................................................................................................ 146 Figure C-26: Share of the Electricity Generation by Fuel .................................................................................... 146 Figure C-27: Energy Supply by Type ......................................................................................................................... 147 Figure C-28: Energy Supply by Type (Shares) ......................................................................................................... 147 Figure C-29: Final Energy Consumption by Fuel .................................................................................................... 149 Figure C-30: Savings in Final Energy by Sector ....................................................................................................... 150 Figure C-31: Electricity Generation by Fuel ............................................................................................................ 151 Figure C-32: Savings in Electricity Generation ....................................................................................................... 151 Figure C-33: Investments in New (and Refurbished) Power Plants .................................................................. 152

12 SOUTH EAST EUROPE REGIONAL ENERGY MARKET SUPPORT (SEE REMS) PROJECT
Figure C-34: Supply of Energy .................................................................................................................................... 153 Figure C-35: Total Imports .......................................................................................................................................... 154 Figure C-36: Total Discounted Energy System Cost ............................................................................................ 155 Figure C-37: Annual Energy System Expenditures ................................................................................................. 155 Figure C-38: Electricity Generation by Fuels .......................................................................................................... 156 Figure C-39: R0 2009 Electricity Generation by Fuels ......................................................................................... 157 Figure C-40: R0 2027 Electricity Generation by Fuels ......................................................................................... 157 Figure C-41: R0R 2009 Electricity Generation by Fuels ....................................................................................... 158 Figure C-42: R0R 2027 Electricity Generation by Fuels ....................................................................................... 158 Figure C-43: Primary Energy Supply .......................................................................................................................... 159 Figure C-44: CO2 Emissions ........................................................................................................................................ 160 Figure D-1: Fuel Shares in Final Energy Consumption .......................................................................................... 161 Figure D-2: Sector Shares in Final Energy Consumption ..................................................................................... 161 Figure D-3: Share in Electricity Generation ............................................................................................................ 162 Figure D-4: Share in Primary Energy Supply ............................................................................................................ 163 Figure D-5: Final Energy Consumption in 2027...................................................................................................... 164 Figure D-6: Electricity Generation Mix by Fuel Type in 2027 ............................................................................ 164 Figure D-7: Primary Energy Supply in 2027 ............................................................................................................. 165 Figure D-8: Total Discounted System Cost ............................................................................................................ 166 Figure D-9: Trend of Population and its Growth Rate ......................................................................................... 167 Figure D-10: Trend of Households and Number of Persons per Household ................................................ 167 Figure D-11: Projection of Total GDP and its Growth Rate .............................................................................. 168 Figure D-12: Energy Services Demand Projection ................................................................................................. 169 Figure D-13: Shares of Types of Residential Dwellings Over Time .................................................................. 169 Figure D-14: Residential Energy Service Demand (Useful Energy) .................................................................... 170 Figure D-15: Commercial Energy Service Demand (Useful Energy) ................................................................. 171 Figure D-16: Industrial Energy Service Demand (Useful Energy) ....................................................................... 172 Figure D-17: Final Energy Consumption by Sector ............................................................................................... 174 Figure D-18: Final Energy Consumption by Fuel .................................................................................................... 174 Figure D-19: Residential Final Energy Consumption ............................................................................................. 175 Figure D-20: Commercial Final Energy Consumption .......................................................................................... 175 Figure D-21: Industrial Final Energy Consumption ................................................................................................ 176 Figure D-22: Agriculture Final Energy Consumption ............................................................................................ 177 Figure D-23: Electricity Generation by Fuel ............................................................................................................ 178

SOUTH EAST EUROPE REGIONAL ENERGY MARKET SUPPORT (SEE REMS) PROJECT 13
Figure D-24: Fuel Shares in Electricity Generation ............................................................................................... 178 Figure D-25: Primary Energy Supply by Fuel ........................................................................................................... 179 Figure D-26: Fuel Shares in the Primary Energy Supply ....................................................................................... 179 Figure D-27: Final Energy Consumption by Fuel .................................................................................................... 181 Figure D-28: Savings in Final Energy by Sector ....................................................................................................... 181 Figure D-29: Electricity Generation by Fuel ............................................................................................................ 182 Figure D-30: Investment in Power Plants by Fuel Type ....................................................................................... 182 Figure D-31: Savings in Electricity Consumption ................................................................................................... 183 Figure D-32: Primary Supply of Energy..................................................................................................................... 183 Figure D-33: Change in Imports ................................................................................................................................. 184 Figure D-34: Total Discounted Energy System Cost ............................................................................................ 185 Figure D-35: Changes in 2027 Expenditure Compared to Reference scenario ............................................. 185 Figure D-36: Electricity Generation by Fuel ............................................................................................................ 187 Figure E-1: 2006/2027 Percent of Final Energy Consumption by Fuel Type ................................................... 189 Figure E-2: 2006/2027 Percent of Final Energy Consumption by Sector ......................................................... 190 Figure E-3: 2006/2027 Percent Electricity Generation by Fuel Type ................................................................ 190 Figure E-4: 2006/2027 Percent of Total Energy Supply ........................................................................................ 191 Figure E-5: 2027 Final Energy Consumption ........................................................................................................... 192 Figure E-6: 2027 Electricity Generation Mix by Fuel............................................................................................. 192 Figure E-7: 2027 Total Energy Supply ....................................................................................................................... 193 Figure E-8: Aggregate Total Discounted System Cost ......................................................................................... 194 Figure E-9: Change in 2027 Annual Expenditures .................................................................................................. 194 Figure E-10: Trend of Population and its Growth Rate........................................................................................ 195 Figure E-11: Trend of Households and Number of Persons per Household .................................................. 195 Figure E-12: Projection of Total GDP and its Growth Rate ............................................................................... 196 Figure E-13: Projection of Energy Service Demand from each Sector (Useful) ............................................. 196 Figure E-14: Composition of Residential Dwellings over Time .......................................................................... 197 Figure E-15: Residential Demand for Energy Services (Useful Energy) ............................................................ 197 Figure E-16: Commercial Demand for Energy Services (Useful Energy) .......................................................... 198 Figure E-17: Contribution of Industry Sub-Sectors to Total GDP .................................................................... 198 Figure E-18: Industrial Demand for Energy Services (Useful Energy) ............................................................... 199 Figure E-19: Energy Prices Based on the EU NEEDS Project ............................................................................. 200 Figure E-20: Final Energy Consumption by Sector ................................................................................................ 202 Figure E-21: Final Energy Consumption by Sector (Share) .................................................................................. 202

14 SOUTH EAST EUROPE REGIONAL ENERGY MARKET SUPPORT (SEE REMS) PROJECT
Figure E-22: Final Energy Consumption by Fuel ..................................................................................................... 203 Figure E-23: Final Energy Consumption - Residential ........................................................................................... 204 Figure E-24: Final Energy Consumption - Commercial......................................................................................... 205 Figure E-25: Final Energy Consumption - Industry ................................................................................................ 206 Figure E-26: Final Energy Consumption - Agriculture .......................................................................................... 207 Figure E-27: Electricity Generation by Fuel ............................................................................................................. 208 Figure E-28: Share of the Electricity Generation by Fuel ..................................................................................... 208 Figure E-29: Energy Supply by Type .......................................................................................................................... 209 Figure E-30: Energy Supply by Type (Shares) .......................................................................................................... 209 Figure E-31: Final Energy Consumption by Fuel ..................................................................................................... 211 Figure E-32: Savings in Final Energy by Sector ........................................................................................................ 212 Figure E-33: Electricity Generation by Fuel ............................................................................................................. 212 Figure E-34: Savings in Electricity Generation ........................................................................................................ 213 Figure E-35: Investments in New (and Refurbished) Power Plants ................................................................... 214 Figure E-36: Supply of Energy ..................................................................................................................................... 215 Figure E-37: Imports Share of Total Supply ............................................................................................................. 216 Figure E-38: Annual Energy System Expenditures.................................................................................................. 217 Figure F-37: Fuel Shares in Final Energy Consumption ......................................................................................... 218 Figure F-38: Sector Shares in Final Energy Consumption .................................................................................... 219 Figure F-39: Share in Electricity Generation ........................................................................................................... 220 Figure F-40: Share in Primary Energy Supply ........................................................................................................... 220 Figure F-41: Final Energy Consumption in 2027..................................................................................................... 221 Figure F-42: Electricity Generation Mix by Fuel Type in 2027 ........................................................................... 222 Figure F-43: Primary Energy Supply in 2027 ............................................................................................................ 222 Figure F-44: Total Discounted System Cost ........................................................................................................... 223 Figure F-45: Trend of Population and its Growth Rate ........................................................................................ 224 Figure F-46: Trend of Households and Number of Persons per Household .................................................. 224 Figure F-47: Projection of Total GDP and its Growth Rate ............................................................................... 225 Figure F-48: Energy Services Demand Projection .................................................................................................. 225 Figure F-49: Shares of Types of Residential Dwellings ......................................................................................... 226 Figure F-50: Residential Energy Service Demand ................................................................................................... 227 Figure F-51: Commercial Energy Service Demand ................................................................................................ 227 Figure F-52: Industrial Energy Service Demand ...................................................................................................... 228 Figure F-53: Final Energy Consumption by Sector................................................................................................. 230
SOUTH EAST EUROPE REGIONAL ENERGY MARKET SUPPORT (SEE REMS) PROJECT 15
Figure F-54: Final Energy Consumption by Fuel ..................................................................................................... 231 Figure F-55: Residential Final Energy Consumption .............................................................................................. 232 Figure F-56: Commercial Final Energy Consumption ........................................................................................... 232 Figure F-57: Industrial Final Energy Consumption ................................................................................................. 233 Figure F-58: Agriculture Final Energy Consumption ............................................................................................. 233 Figure F-59: Electricity Generation by Fuel ............................................................................................................. 234 Figure F-60: Fuel Shares in Electricity Generation ................................................................................................. 235 Figure F-61: Primary Energy Supply by Fuel ............................................................................................................ 236 Figure F-62: Fuel Shares in the Primary Energy Supply ......................................................................................... 236 Figure F-63: Final Energy Consumption by Fuel ..................................................................................................... 238 Figure F-64: Savings in Final Energy by Sector ........................................................................................................ 238 Figure F-65: Electricity Generation by Fuel ............................................................................................................. 239 Figure F-66: Savings in Electricity Consumption .................................................................................................... 240 Figure F-67: Investment in Power Plants by Fuel Type ......................................................................................... 240 Figure F-68: Primary Supply of Energy ...................................................................................................................... 241 Figure F-69: Change in Imports .................................................................................................................................. 242 Figure F-70: Total Discounted Energy System Cost ............................................................................................. 242 Figure F-71: Changes in 2027 Expenditure Compared to Reference Scenario .............................................. 243 Figure G-1: Percent of Final Energy Consumption by Fuel Type ....................................................................... 244 Figure G-2: Percent of Final Energy Consumption by Sector ............................................................................. 245 Figure G-3: Percent Electricity Generation by Fuel Type .................................................................................... 245 Figure G-4: Percent of Total Energy Supply ............................................................................................................ 246 Figure G-5: Final Energy Consumption ..................................................................................................................... 247 Figure G-6: 2027 Electricity Generation Mix by Fuel Type ................................................................................. 247 Figure G-7: Total Energy Supply................................................................................................................................. 248 Figure G-8: Aggregate Total Discounted System Cost ........................................................................................ 249 Figure G-9: Change in 2027 Annual Expenditures ................................................................................................. 249 Figure G-10: Trend of Population and its Growth Rate ...................................................................................... 250 Figure G-11: Trend of Households and Number of Persons per Household................................................. 250 Figure G-12: Projection of Total GDP and its Growth Rate .............................................................................. 251 Figure G-13: Projection of Energy Service Demand for each Sector................................................................ 251 Figure G-14: Composition of Residential Dwellings over Time ......................................................................... 252 Figure G-15: Residential Demand for Energy Services (Useful Energy) ........................................................... 252 Figure G-16: Commercial Demand for Energy Services (Useful Energy) ......................................................... 253

16 SOUTH EAST EUROPE REGIONAL ENERGY MARKET SUPPORT (SEE REMS) PROJECT
Figure G-17: Industrial Demand for Energy Services (Useful Energy) .............................................................. 254 Figure G-18: Final Energy Consumption by Fuel .................................................................................................... 256 Figure G-19: Final Energy Consumption by Sector ............................................................................................... 256 Figure G-20: Final Energy Consumption – Residential ......................................................................................... 257 Figure G-21: Final Energy Consumption – Commercial ....................................................................................... 258 Figure G-22: Final Energy Consumption – Industry .............................................................................................. 258 Figure G-23: Final Energy Consumption – Agriculture ........................................................................................ 259 Figure G-24: Electricity Generation by Fuel ............................................................................................................ 260 Figure G-25: Share of the Electricity Generation by Fuel .................................................................................... 260 Figure G-26: Net Power Generation Comparison ................................................................................................ 261 Figure G-27: Energy Supply by Type ......................................................................................................................... 262 Figure G-28: Energy Supply by Type (Shares) ......................................................................................................... 262 Figure G-29: Final Energy Consumption by Fuel .................................................................................................... 264 Figure G-30: Savings in Final Energy by Sector ....................................................................................................... 264 Figure G-31: Electricity Generation by Fuel ............................................................................................................ 265 Figure G-32: Savings in Electricity Generation ....................................................................................................... 265 Figure G-33: Investments in New (and Refurbished) Power Plants .................................................................. 266 Figure G-34: Supply of Energy .................................................................................................................................... 267 Figure G-35: Total Imports ......................................................................................................................................... 267 Figure G-36: Total Discounted Energy System ...................................................................................................... 268 Figure G-37: Annual Energy System Expenditures ................................................................................................ 269 Figure H-1: End-Use Fuel Consumption .................................................................................................................. 270 Figure H-2: Energy Consumption .............................................................................................................................. 271 Figure H-3: Electricity Generation ............................................................................................................................. 271 Figure H-4: Primary Energy Supply ............................................................................................................................ 272 Figure H-5: End-Use Fuel Consumption 2027 ........................................................................................................ 273 Figure H-6: Electric Generation by Power Plant Type 2027 ............................................................................... 273 Figure H-7: Primary Energy Use in 2027 .................................................................................................................. 274 Figure H-8: Aggregated Total Discounted System Cost ...................................................................................... 275 Figure H-9: Change in 2027 Expenditures Relative to Reference ...................................................................... 275 Figure H-10: Trend of Population and its Growth Rate ...................................................................................... 276 Figure H-11: Trend of Households and Number of Persons per Household ................................................. 276 Figure H-12: Forecast of Total GDP and its Growth Rate ................................................................................. 277 Figure H-13: Forecast of Energy Service Demand from each Sector ............................................................... 277

SOUTH EAST EUROPE REGIONAL ENERGY MARKET SUPPORT (SEE REMS) PROJECT 17
Figure H-14: Composition of Residential Dwellings over Time ......................................................................... 278 Figure H-15: Residential Demand for Energy Services (Useful Energy) ........................................................... 278 Figure H-16: Commercial Demand for Energy Services (Useful Energy) ......................................................... 279 Figure H-17: Industrial Demand for Energy Services (Useful Energy) .............................................................. 280 Figure H-18: Energy Prices Based on the EU NEEDS Project ............................................................................ 281 Figure H-19: Final Energy Consumption by Sector (Share) ................................................................................. 282 Figure H-20: Final Energy Consumption by Fuel .................................................................................................... 283 Figure H-21: Final Energy Consumption - Residential .......................................................................................... 284 Figure H-22: Final Energy Consumption - Commercial ....................................................................................... 285 Figure H-23: Final Energy Consumption - Industry ............................................................................................... 286 Figure H-24: Final Energy Consumption - Agriculture ......................................................................................... 287 Figure H-25: Electricity Generation by Fuel ............................................................................................................ 288 Figure H-26: Share of the Electricity Generation by Fuel .................................................................................... 288 Figure H-27: Energy Supply by Type ......................................................................................................................... 289 Figure H-28: Energy Supply by Type (Shares) ......................................................................................................... 289 Figure H-29: Final Energy Consumption by Fuel .................................................................................................... 291 Figure H-30: Final Energy Consumption by Sector ............................................................................................... 291 Figure H-31: Savings in Final Energy by Sector ....................................................................................................... 292 Figure H-32: Electricity Generation by Fuel ............................................................................................................ 293 Figure H-33: Savings in Electricity Generation ....................................................................................................... 293 Figure H-34: Investments in New (and Refurbished) Power Plants .................................................................. 294 Figure H-35: Supply of Energy .................................................................................................................................... 295 Figure H-36: Total Imports ......................................................................................................................................... 295 Figure H-37: Total Discounted Energy System ...................................................................................................... 296 Figure H-38: Annual Energy System Expenditures ................................................................................................ 297

18 SOUTH EAST EUROPE REGIONAL ENERGY MARKET SUPPORT (SEE REMS) PROJECT
SECTION 1: HIGHLIGHTS
1.1 PROJECT OVERVIEW Background. This report summarizes the results of the USAID-supported Regional Energy Demand Planning (REDP) activities under the South East Europe Regional Energy Market Support (SEE REMS) Project (10/1/2004 – 9/30/2008). The REDP activities were initiated as one component of the multi-faceted SEE REMS project to accelerate regional energy development and cooperation in South East Europe. The Athens Memoranda of Understanding of November 2002 and December 2003 provided the basis for the countries’ collaborative efforts to create integrated regional electricity and gas markets for eventual incorporation into the EU Internal Energy Market. This effort culminated in the signing of the Treaty to establish the Energy Community (signatories included the EU, Albania, Bulgaria, Bosnia and Herzegovina, Croatia, the former Yugoslav Republic of Macedonia, Romania, Serbia and Montenegro and the United Nations Interim Mission in Kosovo (UNMIK). Under REDP, USAID extended the work begun under the Generation Investment Study (GIS) of the World Bank, by conducting more detailed demand analysis and forecasting. The goals of this undertaking were to forge a better understanding of the possible paths for the evolution of the individual countries’ energy systems by building analytical capacity within the region to better inform decision-making.
Approach. A Steering Committee (SC) of national policy makers was established by the Permanent High Level Group (PHLG) to guide and oversee the activities of the REDP. The Steering Committee, in turn, nominated representatives for the Technical Working Group (TWG) from 8 countries tasked to identify and collect the data necessary to depict the current energy system in each country. The project organizational structure and the key local institutions comprising the SC and TWG are presented in Figure 1-1 and Table 1-1. Under the direction of a team of international modeling experts from International Resources Group (IRG), the TWG members have incorporated their national energy system information into a robust energy planning framework for each country built upon the MARKAL/TIMES3
Figure 1-1: SEE-REDP Organizational Framework
modeling platform.
Permanent High Level Group
Steering Committee Donors, IFIs, etc.
Project Coordinator USAID
Technical Working Group IRG Ltd.
3 MARKAL/TIMES is a modeling framework developed under the auspice of the International Energy Agency’s Energy Technology Systems Analysis
Programme (IEA-ETSAP, www.etsap.org) and widely used around the world for integrated energy system planning.
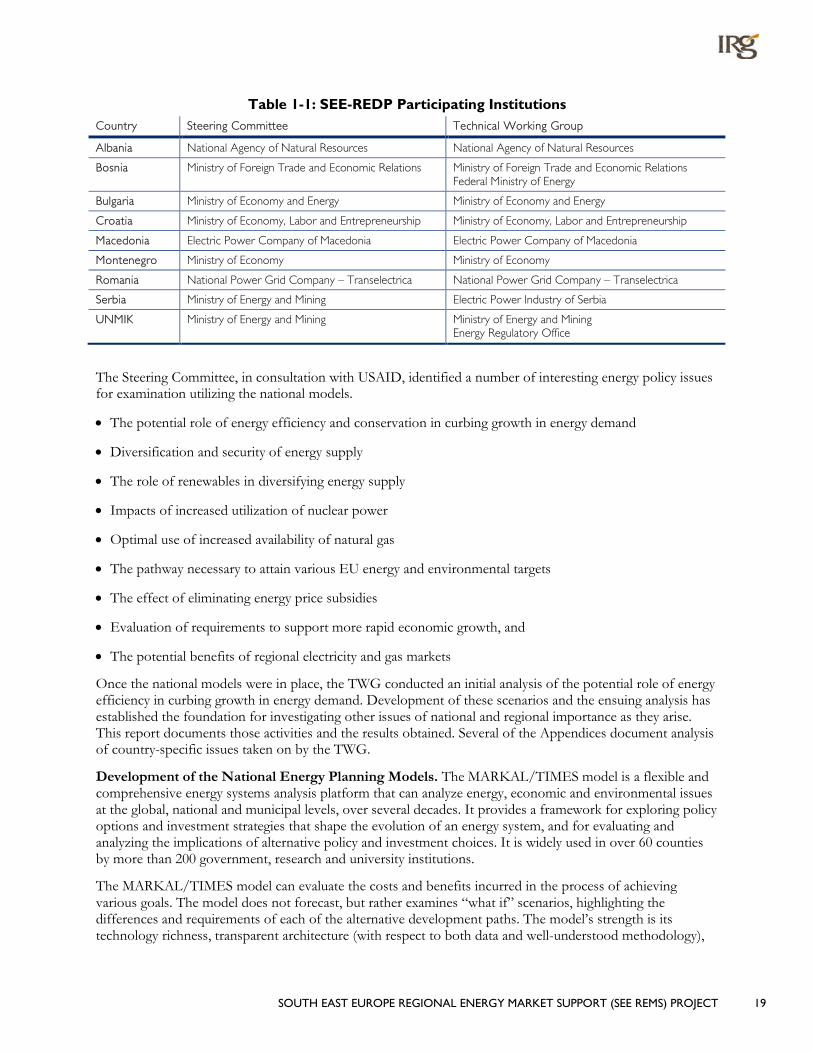
SOUTH EAST EUROPE REGIONAL ENERGY MARKET SUPPORT (SEE REMS) PROJECT 19
Table 1-1: SEE-REDP Participating Institutions Country Steering Committee Technical Working Group
Albania National Agency of Natural Resources National Agency of Natural Resources
Bosnia Ministry of Foreign Trade and Economic Relations Ministry of Foreign Trade and Economic Relations Federal Ministry of Energy
Bulgaria Ministry of Economy and Energy Ministry of Economy and Energy
Croatia Ministry of Economy, Labor and Entrepreneurship Ministry of Economy, Labor and Entrepreneurship
Macedonia Electric Power Company of Macedonia Electric Power Company of Macedonia
Montenegro Ministry of Economy Ministry of Economy
Romania National Power Grid Company – Transelectrica National Power Grid Company – Transelectrica
Serbia Ministry of Energy and Mining Electric Power Industry of Serbia
UNMIK Ministry of Energy and Mining Ministry of Energy and Mining Energy Regulatory Office
The Steering Committee, in consultation with USAID, identified a number of interesting energy policy issues for examination utilizing the national models.
• The potential role of energy efficiency and conservation in curbing growth in energy demand
• Diversification and security of energy supply
• The role of renewables in diversifying energy supply
• Impacts of increased utilization of nuclear power
• Optimal use of increased availability of natural gas
• The pathway necessary to attain various EU energy and environmental targets
• The effect of eliminating energy price subsidies
• Evaluation of requirements to support more rapid economic growth, and
• The potential benefits of regional electricity and gas markets
Once the national models were in place, the TWG conducted an initial analysis of the potential role of energy efficiency in curbing growth in energy demand. Development of these scenarios and the ensuing analysis has established the foundation for investigating other issues of national and regional importance as they arise. This report documents those activities and the results obtained. Several of the Appendices document analysis of country-specific issues taken on by the TWG.
Development of the National Energy Planning Models. The MARKAL/TIMES model is a flexible and comprehensive energy systems analysis platform that can analyze energy, economic and environmental issues at the global, national and municipal levels, over several decades. It provides a framework for exploring policy options and investment strategies that shape the evolution of an energy system, and for evaluating and analyzing the implications of alternative policy and investment choices. It is widely used in over 60 counties by more than 200 government, research and university institutions.
The MARKAL/TIMES model can evaluate the costs and benefits incurred in the process of achieving various goals. The model does not forecast, but rather examines “what if” scenarios, highlighting the differences and requirements of each of the alternative development paths. The model’s strength is its technology richness, transparent architecture (with respect to both data and well-understood methodology),

20 SOUTH EAST EUROPE REGIONAL ENERGY MARKET SUPPORT (SEE REMS) PROJECT
and usability owing to robust analyst support systems. It is a full-sector model, meaning that it encompasses not just power generation but also resource supply options, upstream fuel production and all forms of energy consumption in all demand sectors of an economy. The model accepts agriculture, commercial, industrial, residential, and transportation demands for energy services for the next several decades, and determines where the sources of energy will originate (whether domestic or imported), which technologies transform primary energy into final energy (e.g., power plants), and what end-use devices will then meet the demands for energy services. The components are tied together by means of a Reference Energy System (RES) which establishes the network of energy flows and technology options encompassing the area of study. The characteristics of each technology (resource supply, process, conversion and end-use) include the investment cost, operating and maintenance costs, service life, efficiency, availability and emissions.
For each of the SEE-REDP countries, the current energy system was depicted and economic forecasts were translated into future demands for energy services (e.g., heating buildings, lighting houses, providing high-temperature heat to industry). The TWG, mentored by IRG modeling experts provided by USAID, developed technical and economic characterizations of advanced supply and end-use technologies and incorporated these characterizations into the models. Each of the TWG members then refined the key assumptions based on their knowledge and expert judgment of the future energy system. Collectively, these inputs form the basis of the Reference scenario for each country. This scenario then serves as the reference point for investigating the evolution of the energy system under alternative conditions resulting from changes in government policy, environmental constraints, or various resource supply options.
Capacity Building. A primary objective of this USAID project has been the development of regional capacity to perform national energy system modeling and analysis. Therefore a large part of the effort over the initial two years was dedicated to mentoring the TWG through model development and utilization. The TWG’s capacity is demonstrated by their achievement of the following milestones:
• Establishment of a 2003 energy balance, adapted to the model needs;
• Decomposition of the initial energy balance to determine the appropriate depiction of resources (including imports), conversion technologies, end-use devices and energy service demands, which formed the underlying Reference Energy System (RES) for each country;
• Calibration of the models’ results for the base year (2003), including depiction of the capacity and performance of existing assets;
• Development of the 2003 to 2027 Reference scenario, and
• Preparation and analysis of alternate scenarios.
Over the course of this 30-month effort, the TWG members have not only achieved these milestones but also demonstrated their individual and collective capacity to perform meaningful analyses with their models. The TWG’s capacity to utilize the national models to run and interpret the results of various future scenarios constitutes a strong first step towards better informed national policy making based on robust analyses – the ultimate objective of the REDP.
Report Objectives. The objective of this report - The Analysis of Future Energy Demand Trends – A Clear Case for Energy Efficiency in the South East Europe Regional Energy Market - is to demonstrate the new planning capabilities established in the region by presenting the results of a few indicative policy scenario analyses performed by the TWG. The report examines scenarios for a range of energy efficiency possibilities for regional and national energy system dynamics by:
• Quantifying the future demand for energy to meet basic energy services;
• Illustrating the investments required to implement various policies;

SOUTH EAST EUROPE REGIONAL ENERGY MARKET SUPPORT (SEE REMS) PROJECT 21
• Identifying the impacts of those policies on technology choices and fuel mix; and
• Examining the benefits relative to energy system costs and energy security.
This report demonstrates the growing skills of the country experts in working with their models. This section summarizes the aggregate Reference case results from the 8 national models, and presents highlights of the indicative Policy scenario results.
Indicative Policy Analyses. The following three policy scenarios were selected for presentation because they best demonstrate how the country energy systems might respond to a set of efficiency-promoting policies or programs. The selected policy scenarios were designed to model increasingly stringent efficiency targets as well as alternative economic mechanisms to provide insight in the costs and benefits of each approach.
• Promoting Energy Efficiency - accelerating the adoption of more energy efficient end-use devices through better consumer information, improved standards, market incentives, and other similar approaches.
• Reducing Electricity Consumption – achieving a 10% reduction in electricity consumption below Reference case levels by establishing regional, sectoral or other electricity use targets and implementing market-based mechanisms to facilitate meeting the targets.
• Reducing Energy Intensity4
The types of policies and programs that can achieve these goals (e.g., efficiency standards for appliances, information campaigns) are examined and evaluated in terms of the impacts on energy security, electricity generation and investment requirements and consumption patterns.
– achieving overall energy system intensity improvements within the same lifetime energy system cost as in the Reference case, most likely through a combination of the above measures.
The current models are not complete since the transport sector characterization includes only electricity demand, thus understating the overall level of energy demand – particularly oil. That is not a concern for this analysis since the focus is on energy efficiency in buildings and industry. A more complete representation of the transport sector would provide a fuller picture of the region’s future energy system and could be readily added.
In addition, under the current framework each country is modeled separately. Therefore, the models have no internal framework to depict trade of electricity, natural gas and other energy sources. As a result, the regional results are an aggregation of the individual country results, rather than a full regionalized perspective. The lack of a regionally integrated model also prevents full analysis of supply diversification options or electricity trade at this time. Thus these results will tend to be more costly than might otherwise be the case if cooperative regional approaches were taken as common challenges. However, the foundation is laid and the models could be integrated into a comprehensive regional framework with modest additional effort.
1.2 REFERENCE SCENARIO HIGHLIGHTS The Reference scenario describes how the energy systems will evolve absent any major changes in system direction [e.g., energy efficiency improvements, energy diversity]. A full description of the data development, model calibration and Reference scenario development process as well as a fuller description of the regional Reference scenario results are provided in Section 2.
4 Energy intensity being measured by (total primary energy consumption / GDP) and thus reflecting the amount of energy needed to drive the
economy.

22 SOUTH EAST EUROPE REGIONAL ENERGY MARKET SUPPORT (SEE REMS) PROJECT
The Reference scenario serves as the comparison point for the analysis of scenarios designed to model specific policies, programs and future energy system options. Each country Reference scenario has been established by:
• developing demand service drivers (e.g., GDP, population) and associating them with each of the sectors to establish an initial projection of future useful energy services (e.g., space conditioning, cooking);
• adopting forecasts of energy supply prices from the EU New Energy Externalities Development for Sustainability (NEEDS)5
• establishing an appropriate set of future power, coupled heat and power, and heating plants (centralized and decentralized) as well as demand devices based upon IEA/ETSAP technology characterizations, adapted to the SEE situation, and
project trends, adapted for each country by its TWG representative;
• establishing mechanisms for “guiding” model choices in situations where there are limitations on system evolution that inhibit the selection of ideal economic choices.
Future Energy Service Demands. In the MARKAL/TIMES modeling framework, a distinction is made between the demand for energy services (or useful energy) and the end-use consumption of energy (or final energy). The demands for useful energy services (e.g., petajoules of heating and cooling, lumens of light, etc.) is the key input driving the models, which then calculate the resulting consumption of final energy (electricity, gas, coal, etc), and the host of resources and technologies that are utilized to deliver that energy as primary outputs of the model.
The starting point for developing the national projections for future energy service demands is establishing the useful energy demand in the base year. This is done by decomposition of the national energy balances, apportioning the initial year final energy consumption to the various end uses and using the performance characteristics of the existing technology stock to compute the useful energy provided. Once the initial year’s useful energy demand is established, sector appropriate drivers and elasticities are applied to shape the evolution of the demand for energy services in response to the projected economic and demographic circumstances.
The main drivers used in the SEE-REDP MARKAL model are:
• GDP and GDP per capita growth;
• population and number of household growth; and
• industrial production growth, with a distinction between energy intensive sectors (ferrous and non ferrous metals, chemicals, and other energy–intensive industries), and other industries and services, where available.
Fuel Price and Availability. Another key input to the models is the cost and availability of the domestic and imported energy resources available to the energy system. For the imported fuels, world energy price projections are used to compute their price evolution (see Figure 2-2). For domestic mined or extracted resources, price trends were established that track the imported fuel prices, except where local conditions dictate otherwise (e.g., cheaper mined coal). Fuel price trajectories were taken from the EU NEEDS project and adapted for the SEE situation. The price trajectories are based upon $60/barrel oil, which could be considered conservative today, and will understate the benefits of energy efficiency.
Limits on the availability of domestic resources is either a function of current extraction capability and proven reserves (e.g., for coal mining) or estimated potential (e.g., for hydro, wind, solar, biomass). For imported
5 http://www.needs-project.org/rs2a.asp.
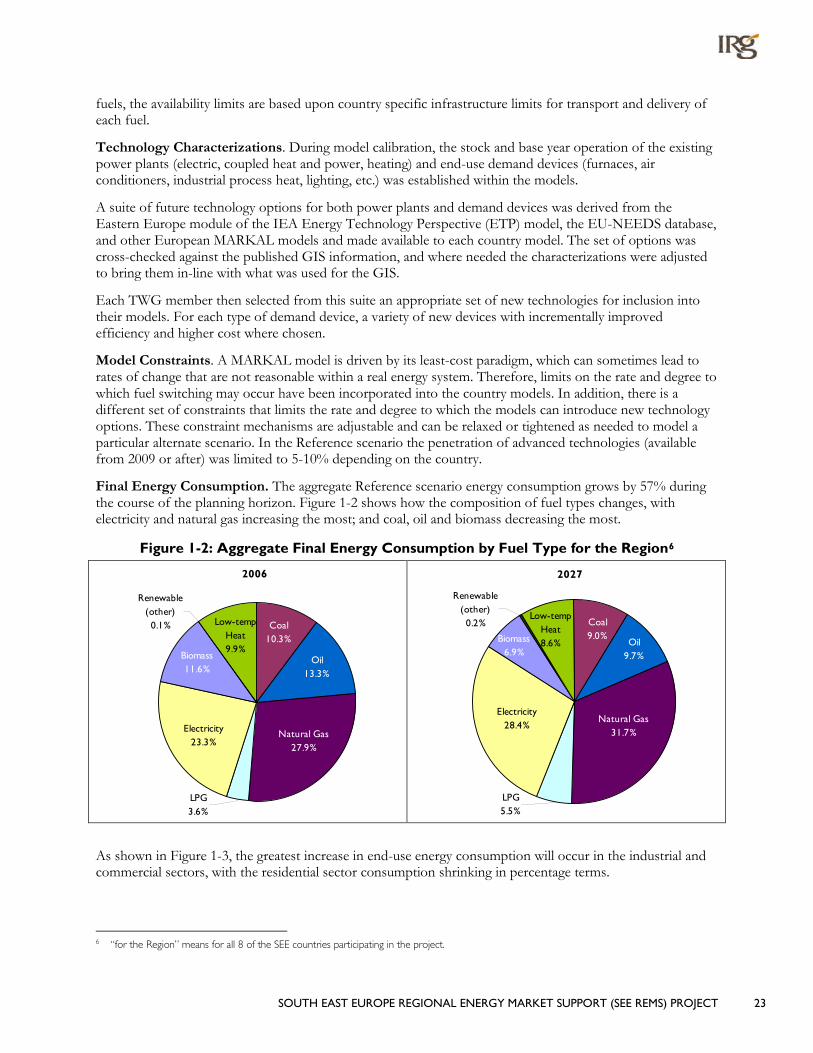
SOUTH EAST EUROPE REGIONAL ENERGY MARKET SUPPORT (SEE REMS) PROJECT 23
fuels, the availability limits are based upon country specific infrastructure limits for transport and delivery of each fuel.
Technology Characterizations. During model calibration, the stock and base year operation of the existing power plants (electric, coupled heat and power, heating) and end-use demand devices (furnaces, air conditioners, industrial process heat, lighting, etc.) was established within the models.
A suite of future technology options for both power plants and demand devices was derived from the Eastern Europe module of the IEA Energy Technology Perspective (ETP) model, the EU-NEEDS database, and other European MARKAL models and made available to each country model. The set of options was cross-checked against the published GIS information, and where needed the characterizations were adjusted to bring them in-line with what was used for the GIS.
Each TWG member then selected from this suite an appropriate set of new technologies for inclusion into their models. For each type of demand device, a variety of new devices with incrementally improved efficiency and higher cost where chosen.
Model Constraints. A MARKAL model is driven by its least-cost paradigm, which can sometimes lead to rates of change that are not reasonable within a real energy system. Therefore, limits on the rate and degree to which fuel switching may occur have been incorporated into the country models. In addition, there is a different set of constraints that limits the rate and degree to which the models can introduce new technology options. These constraint mechanisms are adjustable and can be relaxed or tightened as needed to model a particular alternate scenario. In the Reference scenario the penetration of advanced technologies (available from 2009 or after) was limited to 5-10% depending on the country.
Final Energy Consumption. The aggregate Reference scenario energy consumption grows by 57% during the course of the planning horizon. Figure 1-2 shows how the composition of fuel types changes, with electricity and natural gas increasing the most; and coal, oil and biomass decreasing the most.
Figure 1-2: Aggregate Final Energy Consumption by Fuel Type for the Region6
2006
LPG3.6%
Renewable (other)0.1% Low-temp
Heat9.9%
Biomass11.6%
Electricity23.3%
Natural Gas27.9%
Coal10.3%
Oil13.3%
2027
Biomass6.9%
LPG5.5%
Electricity28.4%
Natural Gas31.7%
Coal9.0%
Oil9.7%
Renewable (other)0.2%
Low-temp Heat8.6%
As shown in Figure 1-3, the greatest increase in end-use energy consumption will occur in the industrial and commercial sectors, with the residential sector consumption shrinking in percentage terms.
6 “for the Region” means for all 8 of the SEE countries participating in the project.
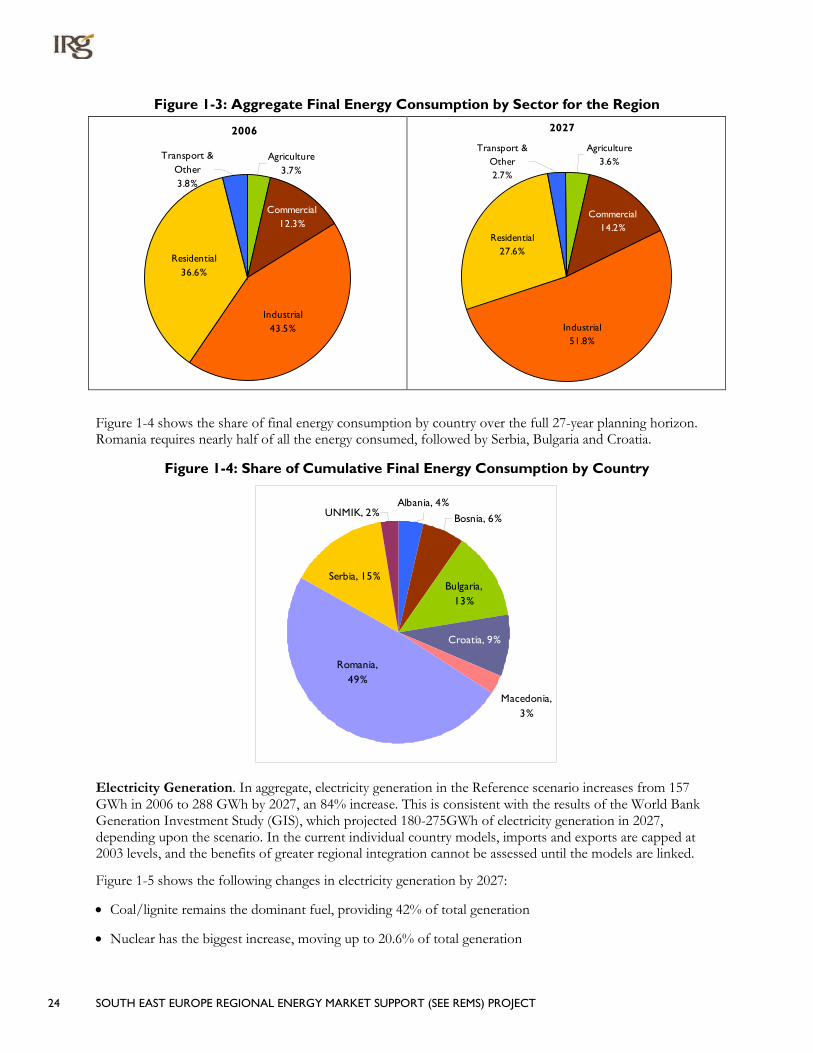
24 SOUTH EAST EUROPE REGIONAL ENERGY MARKET SUPPORT (SEE REMS) PROJECT
Figure 1-3: Aggregate Final Energy Consumption by Sector for the Region
2006
Agriculture3.7%
Transport & Other3.8%
Commercial12.3%
Industrial43.5%
Residential36.6%
2027
Agriculture3.6%
Transport & Other2.7%
Residential27.6%
Commercial14.2%
Industrial51.8%
Figure 1-4 shows the share of final energy consumption by country over the full 27-year planning horizon. Romania requires nearly half of all the energy consumed, followed by Serbia, Bulgaria and Croatia.
Figure 1-4: Share of Cumulative Final Energy Consumption by Country
Macedonia, 3%
UNMIK, 2%Albania, 4%
Bosnia, 6%
Serbia, 15%
Romania, 49%
Bulgaria, 13%
Croatia, 9%
Electricity Generation. In aggregate, electricity generation in the Reference scenario increases from 157 GWh in 2006 to 288 GWh by 2027, an 84% increase. This is consistent with the results of the World Bank Generation Investment Study (GIS), which projected 180-275GWh of electricity generation in 2027, depending upon the scenario. In the current individual country models, imports and exports are capped at 2003 levels, and the benefits of greater regional integration cannot be assessed until the models are linked.
Figure 1-5 shows the following changes in electricity generation by 2027:
• Coal/lignite remains the dominant fuel, providing 42% of total generation
• Nuclear has the biggest increase, moving up to 20.6% of total generation

SOUTH EAST EUROPE REGIONAL ENERGY MARKET SUPPORT (SEE REMS) PROJECT 25
• Hydro and gas-fired plants drop to 21.9% and 6.7% respectively, and
• Renewables and other plants move from nearly 0% to 5%, comprised of biomass, combined heat and power and wind.
Figure 1-6 shows the country contribution to electricity generation over the model planning horizon. Romania, Serbia and Bulgaria remain the three largest contributors. Several countries show growth rates of over 90%, including UNMIK (+300%), Serbia, Bosnia & Herzegovina, Albania, and Romania.
Figure 1-5: Aggregate Electricity Generation by Fuel Type for the Region
2006
Oil-fired power plants2.8%
Gas-fired power plants
8.1%
Hydroelectric power plants
28.1%
Nuclear power plants15.1%
Coal-fired power plants
45.9%
Renewable and Other power
plants0%
2027Renewable and Other power
plants5.0%
Oil-fired power plants3.7%
Gas-fired power plants6.7%
Hydroelectric power plants
21.9%
Coal-fired power plants42.1%
Nuclear power plants20.6%
Figure 1-6: Electricity Generation for the Region
0
50
100
150
200
250
300
350
2003
2006
2009
2012
2015
2018
2021
2024
2027
Gig
awat
t H
our
s
Albania Bosnia Bulgaria Croatia Macedonia Romania Serbia UNMIK

26 SOUTH EAST EUROPE REGIONAL ENERGY MARKET SUPPORT (SEE REMS) PROJECT
Primary Energy Supply. The total domestic and imported energy required to meet the demand for energy services in the Reference scenario increases by 39% in 2027 over the entire region. Figure 1-7 shows the composition of primary energy use in the Reference scenario, which indicates that:
• Nuclear energy’s contribution increases the most, from 8.9% to 14%;
• The roles of coal, oil, and biomass drop modestly; and
• Natural gas use holds fairly steady, with a slight increase in LPG use.
Figure 1-8 shows the base-year (2003) primary energy composition in the eight countries and illustrates the diversity of the energy systems in the region.
Figure 1-7: Aggregate Primary Energy Use for the Region
2006
Hydroelectric5%
Electricity Imports
1%
Other Renew0%
Biomass8%
LPG1%
Nuclear9%
Natural Gas27%
Oil13%
Coal36%
2027
Biomass6%
Electricity Imports
1%Hydroelectric
5%
LPG2%
Other Renew1%
Nuclear14%
Natural Gas27%
Oil11%
Coal33%

SOUTH EAST EUROPE REGIONAL ENERGY MARKET SUPPORT (SEE REMS) PROJECT 27
Figure 1-8: Composition of Energy Supply by Country in 2003
0%
20%
40%
60%
80%
100%
Alba
nia
Bosn
ia
Bulga
ria
Cro
atia
Mac
edon
ia
Rom
ania
Serb
ia
UN
MIK
Nuclear Coal Oil Natural Gas LPG
Hydroelectric Electricity Imports Biomass Other Renew
Energy System Costs. The total energy system cost encompasses all costs associated with the energy system, including expenditures on fuel, investments in new power plants and demand devices, and technology operation costs (other than fuel) over the 27 years of the planning horizon. As shown in Figure 1-9, the eight countries fall into three clusters based upon the size of their energy system: (i) Romania, (ii) Bulgaria, Croatia and Serbia, and (iii) Albania, Bosnia and Herzegovina, Macedonia and UNMIK.
Figure 1-9: Total Discounted Energy System Cost for the Region
0
20
40
60
80
100
120
Alb
ania
Bosn
ia
Bulg
aria
Cro
atia
Mac
edon
ia
Rom
ania
Serb
ia
UN
MIK
2003
€ B
illio
n
Figure 1-10 shows that the total energy system cost reaches nearly €40 billion per year in 2027. Fuel expenditures increase to €25 billion per year by 2027, 80% higher than 2006, and dominate the annual energy

28 SOUTH EAST EUROPE REGIONAL ENERGY MARKET SUPPORT (SEE REMS) PROJECT
system cost. Annualized investments in technology reach almost €15 billion in 2027, with power plants comprising €3 billion and investment in demand devices requiring almost €12 billion, nearly four times the capital needed for power plants.
Figure 1-10: Aggregate Annual Energy System Expenditure for the Region
0
5
10
15
20
25
30
35
4020
06
2009
2012
2015
2018
2021
2024
2027
2003
€ B
illio
n
Annual Inv Power Sector Annual Inv Demand Expenditure on Fuel
1.3 POLICY SCENARIO HIGHLIGHTS A particularly robust dialog is underway in South East Europe regarding the role of energy efficiency in shaping the evolution of the energy systems in the region. The analysis presented in this report examines the trade-off between focusing primarily on supply-side solutions versus introduction of programs and policies to encourage investments in demand-side energy efficiency measures and thereby reduce necessary supply-side costs. The indicative policy analyses examine how investment strategies need to change -- as compared with the Reference scenario -- in order to promote increased energy security and economic growth, and indicate the resultant benefits in terms of energy security (less imports) and competitiveness (better energy intensity at acceptable cost).
Table 1-2 lists the three indicative policy scenarios that were examined and gives the short scenario name that is used in many of the following figures. In general, the three scenarios represent progressively more demanding changes in the energy system, as their relative results illustrate.
Table 1-2: Efficiency Promotion Scenarios Examined Scenario Description
R0: Reference (BAU) Scenario The presumed evolution of the energy system, where the current situation continues.
R90: Promoting Energy Efficiency Increase access to energy efficient demand technologies.
R90E: Reducing Electricity Consumption Impose a requirement of a 10% reduction -- from the Reference case – in electricity consumption.
R90P: Reducing Energy Intensity Reduce overall energy intensity by forcing reductions in total energy consumption to the lowest level possible at the same energy system cost as the Reference case.
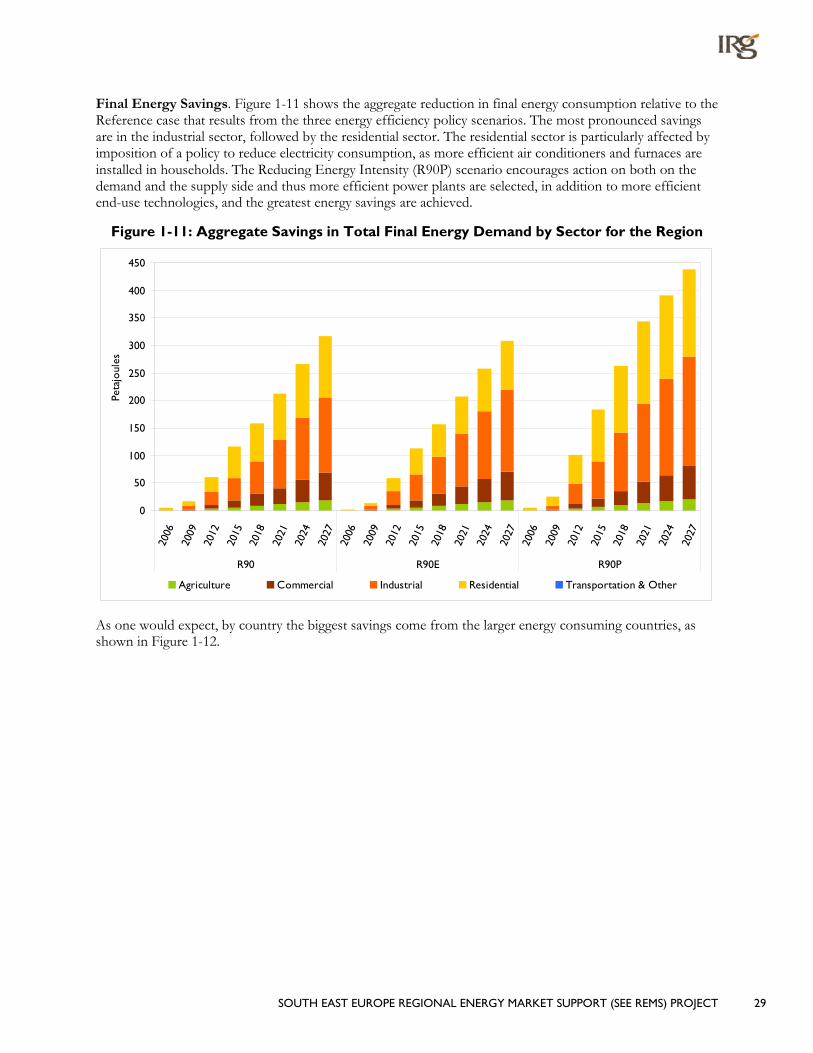
SOUTH EAST EUROPE REGIONAL ENERGY MARKET SUPPORT (SEE REMS) PROJECT 29
Final Energy Savings. Figure 1-11 shows the aggregate reduction in final energy consumption relative to the Reference case that results from the three energy efficiency policy scenarios. The most pronounced savings are in the industrial sector, followed by the residential sector. The residential sector is particularly affected by imposition of a policy to reduce electricity consumption, as more efficient air conditioners and furnaces are installed in households. The Reducing Energy Intensity (R90P) scenario encourages action on both on the demand and the supply side and thus more efficient power plants are selected, in addition to more efficient end-use technologies, and the greatest energy savings are achieved.
Figure 1-11: Aggregate Savings in Total Final Energy Demand by Sector for the Region
0
50
100
150
200
250
300
350
400
450
2006
2009
2012
2015
2018
2021
2024
2027
2006
2009
2012
2015
2018
2021
2024
2027
2006
2009
2012
2015
2018
2021
2024
2027
R90 R90E R90P
Peta
joul
es
Agriculture Commercial Industrial Residential Transportation & Other
As one would expect, by country the biggest savings come from the larger energy consuming countries, as shown in Figure 1-12.

30 SOUTH EAST EUROPE REGIONAL ENERGY MARKET SUPPORT (SEE REMS) PROJECT
Figure 1-12: Aggregate Savings in Total Final Energy Demand by Country
0
50
100
150
200
250
300
350
400
450
2006
2009
2012
2015
2018
2021
2024
2027
2006
2009
2012
2015
2018
2021
2024
2027
2006
2009
2012
2015
2018
2021
2024
2027
R90 R90E R90P
Peta
joul
es
Albania Bosnia Bulgaria Croatia Macedonia Romania Serbia UNMIK
Figure 1-13 shows the aggregate saving in electricity consumption from the three scenarios. More electricity is saved in the R90P scenario, as the model looks to both the supply side and the demand side for the most cost-effective means to reduce the energy intensity of the system.
Figure 1-13: Aggregate Saving in Total Electricity Consumption for the Region
0
5000
10000
15000
20000
25000
30000
2006
2009
2012
2015
2018
2021
2024
2027
2006
2009
2012
2015
2018
2021
2024
2027
2006
2009
2012
2015
2018
2021
2024
2027
R90 R90E R90P
Gig
awat
t H
our
s
Electricity generation. The electricity generation mix shows an increased share coming from nuclear at the expense of coal-fired power plants. Promoting more efficient demand devices results in a 6% reduction in electricity use in 2027, while the forced 10% reduction in electricity use results in further reductions in coal-
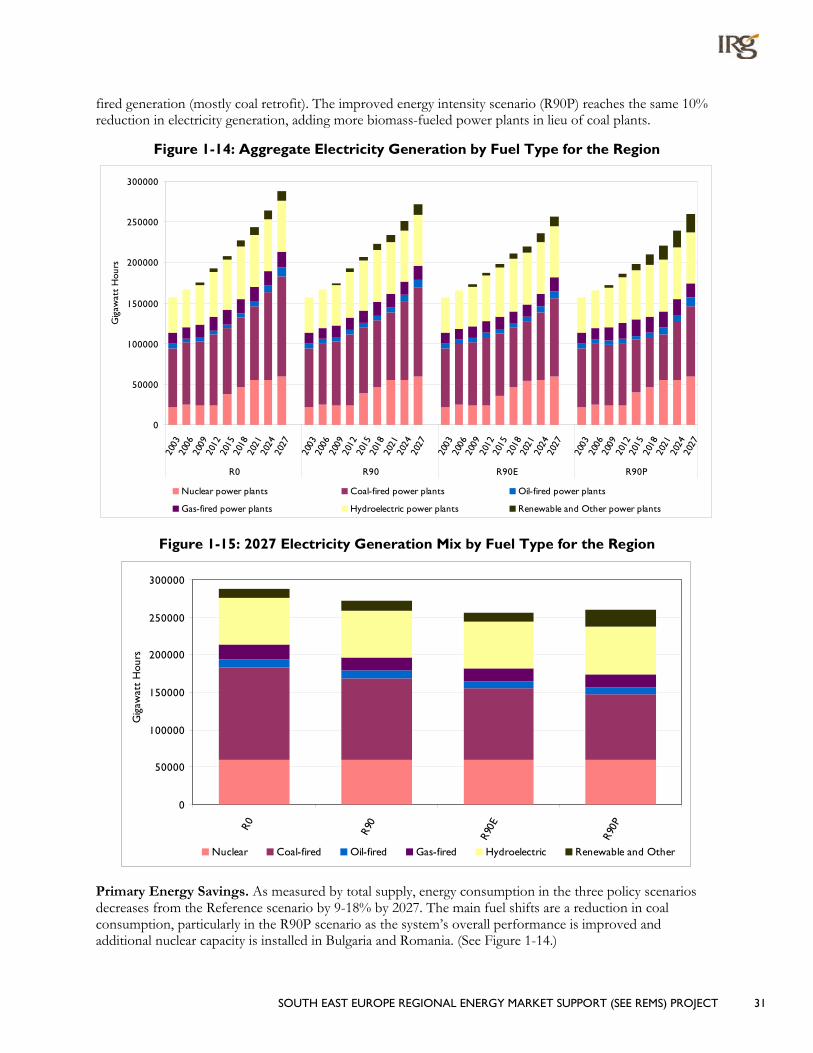
SOUTH EAST EUROPE REGIONAL ENERGY MARKET SUPPORT (SEE REMS) PROJECT 31
fired generation (mostly coal retrofit). The improved energy intensity scenario (R90P) reaches the same 10% reduction in electricity generation, adding more biomass-fueled power plants in lieu of coal plants.
Figure 1-14: Aggregate Electricity Generation by Fuel Type for the Region
0
50000
100000
150000
200000
250000
300000
2003
2006
2009
2012
2015
2018
2021
2024
2027
2003
2006
2009
2012
2015
2018
2021
2024
2027
2003
2006
2009
2012
2015
2018
2021
2024
2027
2003
2006
2009
2012
2015
2018
2021
2024
2027
R0 R90 R90E R90P
Gig
awat
t H
ours
Nuclear power plants Coal-fired power plants Oil-fired power plants
Gas-fired power plants Hydroelectric power plants Renewable and Other power plants
Figure 1-15: 2027 Electricity Generation Mix by Fuel Type for the Region
0
50000
100000
150000
200000
250000
300000
R0 R90
R90E
R90P
Gig
awat
t H
ours
Nuclear Coal-fired Oil-fired Gas-fired Hydroelectric Renewable and Other
Primary Energy Savings. As measured by total supply, energy consumption in the three policy scenarios decreases from the Reference scenario by 9-18% by 2027. The main fuel shifts are a reduction in coal consumption, particularly in the R90P scenario as the system’s overall performance is improved and additional nuclear capacity is installed in Bulgaria and Romania. (See Figure 1-14.)

32 SOUTH EAST EUROPE REGIONAL ENERGY MARKET SUPPORT (SEE REMS) PROJECT
Figure 1-16: Aggregate Total Primary Energy Supply for the Region
0
500
1000
1500
2000
2500
3000
3500
4000
4500
5000
2003
2006
2009
2012
2015
2018
2021
2024
2027
2003
2006
2009
2012
2015
2018
2021
2024
2027
2003
2006
2009
2012
2015
2018
2021
2024
2027
2003
2006
2009
2012
2015
2018
2021
2024
2027
R0 R90 R90E R90P
Peta
joul
es
Nuclear Coal Oil Natural Gas LPGHydroelectric Electricity Imports Biomass Other Renew
In the R90P scenario, the total level of improvement in energy intensity for the overall energy system is examined. As noted previously, by 2027 a 16% improvement for the region is possible at approximately the same total system cost as the Reference case. The range of that improvement by country is shown in Figure 1-17.
Figure 1-17: Reduction in Energy Intensity by Country
0%
5%
10%
15%
20%
25%
30%
35%
Alb
ania
Bosn
ia
Bulg
aria
Cro
atia
Mac
edon
ia
Rom
ania
Serb
ia
UN
MIK
Energy security. A reduction of imports by more than 16% in 2027 across the three scenarios provides an indication that as consumption growth is tamed imports will tend to drop before domestic sources, improving overall energy security. As can be seen in Section 3, the majority of the drop in overall imports

SOUTH EAST EUROPE REGIONAL ENERGY MARKET SUPPORT (SEE REMS) PROJECT 33
comes primarily from reduced imports of natural gas (into Croatia and Romania) and reduced levels of coal and oil coming into the other countries.
Figure 1-18: Level of Import for the Region
800
1,000
1,200
1,400
1,600
1,800
2,00020
03
2006
2009
2012
2015
2018
2021
2024
2027
Peta
joul
es
R0 R90 R90E R90P
And as shown in Figure 1-19, in 2027 the drop in the share of total primary energy that comes from imports ranges from 6% in Macedonia to over 30% in Bosnia.
Figure 1-19: Drop in Imports’ Share of Total Primary Energy by Country
0%
5%
10%
15%
20%
25%
30%
35%
R90
R90E
R90P
Albania Bosnia Bulgaria Croatia Macedonia Romania Serbia UNMIK
Cost Savings. Substantial savings in overall energy system costs can be realized by promoting energy efficiency. The R90 scenario results in an overall energy system cost savings of €6.06 billion (1.9%) over the 27-year planning horizon, while the R90E scenario saves €3.78 billion (1.2%). In principle, the amount society saves in the R90/R90E scenarios can be earmarked for information campaigns, rebates, or subsidies and other policies to effectuate such changes. R90P has about the same system cost by definition, since the

34 SOUTH EAST EUROPE REGIONAL ENERGY MARKET SUPPORT (SEE REMS) PROJECT
targeted level of energy consumption reduction in each country was pushed until the system cost approached that of the Reference scenario to determine the maximum “affordable” improvement in the energy system that can be achieved.
Figure 1-20: Aggregate Total Discounted System Cost for the Region
307
308
309
310
311
312
313
314
315
316
317
318
R0 R90
R90E
R90P
2003
€ B
illio
n
Relative to the Reference case, the three scenarios show the following changes in costs.
• Annualized investment in power plants decreases 8-15% (€246 - 455 million) in the R90 and R90E scenarios, but is about the same for R90P.
• Annualized investments for new demand devices increase significantly 14%, 22%, 28% (€1.59, €2.56, €3.16 billion annually by 2027) to achieve the policy goals represented by each scenario. The bulk of the more efficient investments is focused on commercial cooling and lighting, residential heating, and in the chemical and iron and steel industries.
• Fuel expenditures decrease significantly around 15% (€3.43, €3.36, €4.04 billion per year by 2027) in all three scenarios as the more efficient devices require less fuel. As is reflected by the decrease in overall system cost these savings more than offset the increased expenditures on new, more efficient devices.
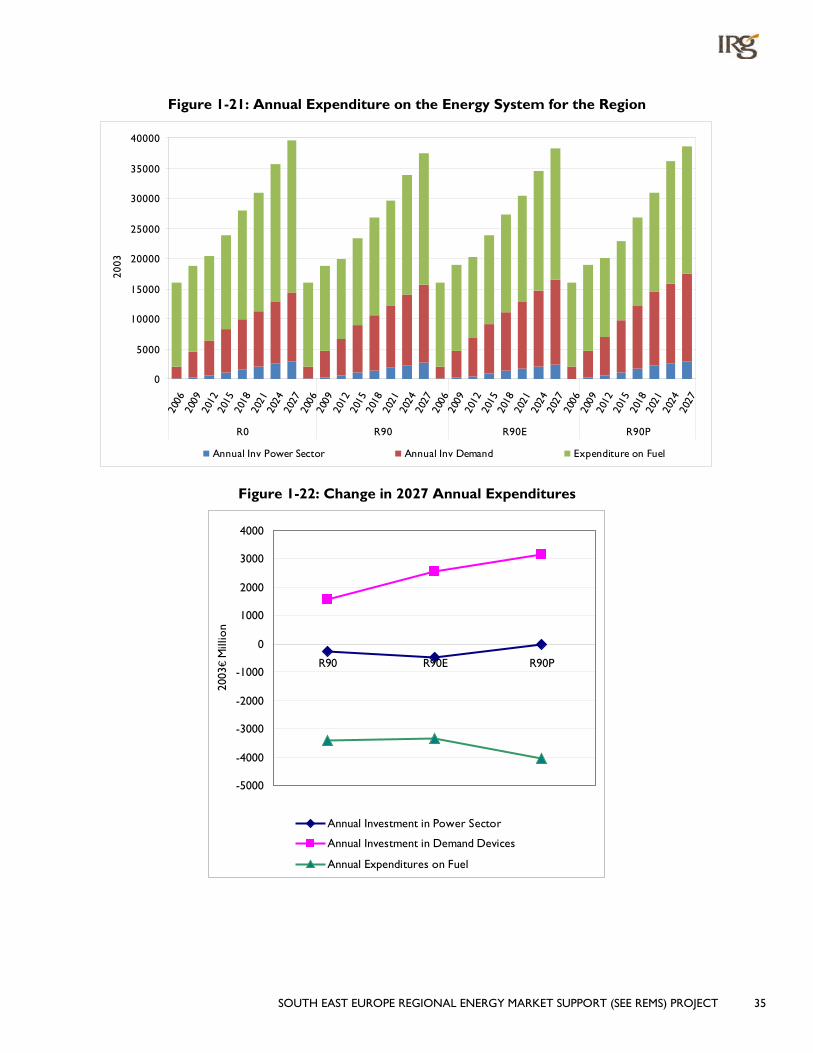
SOUTH EAST EUROPE REGIONAL ENERGY MARKET SUPPORT (SEE REMS) PROJECT 35
Figure 1-21: Annual Expenditure on the Energy System for the Region
0
5000
10000
15000
20000
25000
30000
35000
40000
2006
2009
2012
2015
2018
2021
2024
2027
2006
2009
2012
2015
2018
2021
2024
2027
2006
2009
2012
2015
2018
2021
2024
2027
2006
2009
2012
2015
2018
2021
2024
2027
R0 R90 R90E R90P
2003
Annual Inv Power Sector Annual Inv Demand Expenditure on Fuel
Figure 1-22: Change in 2027 Annual Expenditures
-5000
-4000
-3000
-2000
-1000
0
1000
2000
3000
4000
R90 R90E R90P
2003
€ M
illio
n
Annual Investment in Power Sector
Annual Investment in Demand Devices
Annual Expenditures on Fuel
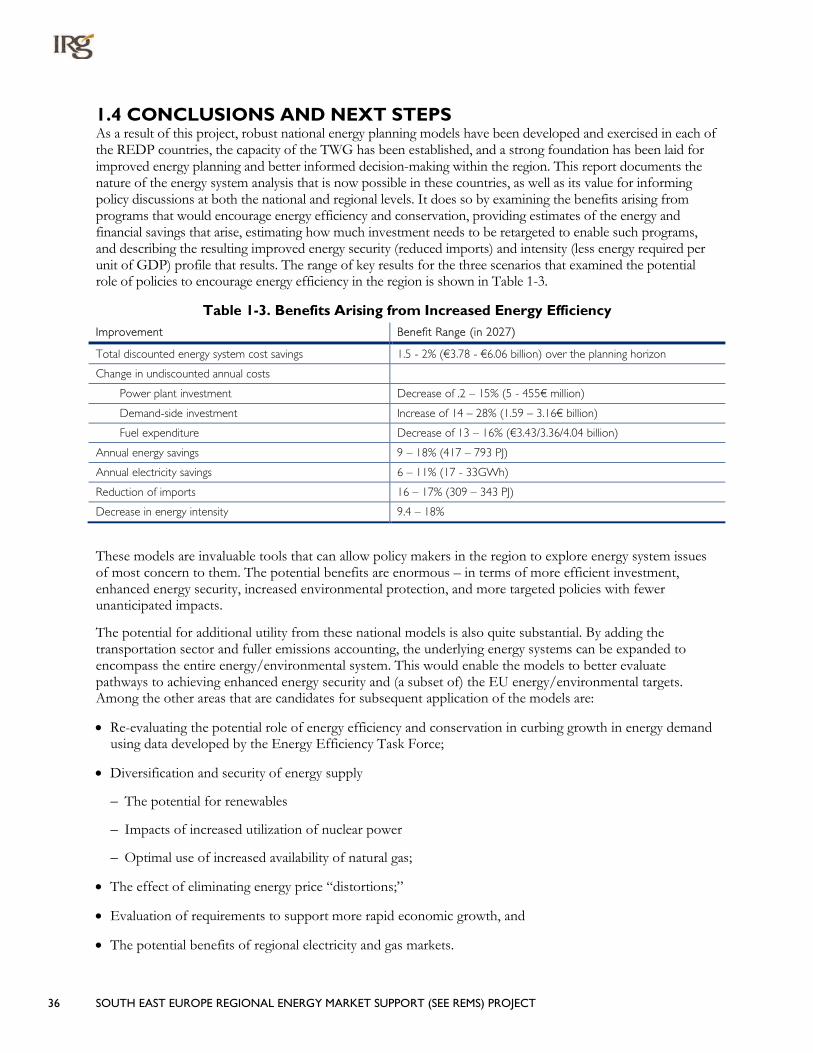
36 SOUTH EAST EUROPE REGIONAL ENERGY MARKET SUPPORT (SEE REMS) PROJECT
1.4 CONCLUSIONS AND NEXT STEPS As a result of this project, robust national energy planning models have been developed and exercised in each of the REDP countries, the capacity of the TWG has been established, and a strong foundation has been laid for improved energy planning and better informed decision-making within the region. This report documents the nature of the energy system analysis that is now possible in these countries, as well as its value for informing policy discussions at both the national and regional levels. It does so by examining the benefits arising from programs that would encourage energy efficiency and conservation, providing estimates of the energy and financial savings that arise, estimating how much investment needs to be retargeted to enable such programs, and describing the resulting improved energy security (reduced imports) and intensity (less energy required per unit of GDP) profile that results. The range of key results for the three scenarios that examined the potential role of policies to encourage energy efficiency in the region is shown in Table 1-3.
Table 1-3. Benefits Arising from Increased Energy Efficiency Improvement Benefit Range (in 2027)
Total discounted energy system cost savings 1.5 - 2% (€3.78 - €6.06 billion) over the planning horizon
Change in undiscounted annual costs
Power plant investment Decrease of .2 – 15% (5 - 455€ million)
Demand-side investment Increase of 14 – 28% (1.59 – 3.16€ billion)
Fuel expenditure Decrease of 13 – 16% (€3.43/3.36/4.04 billion)
Annual energy savings 9 – 18% (417 – 793 PJ)
Annual electricity savings 6 – 11% (17 - 33GWh)
Reduction of imports 16 – 17% (309 – 343 PJ)
Decrease in energy intensity 9.4 – 18%
These models are invaluable tools that can allow policy makers in the region to explore energy system issues of most concern to them. The potential benefits are enormous – in terms of more efficient investment, enhanced energy security, increased environmental protection, and more targeted policies with fewer unanticipated impacts.
The potential for additional utility from these national models is also quite substantial. By adding the transportation sector and fuller emissions accounting, the underlying energy systems can be expanded to encompass the entire energy/environmental system. This would enable the models to better evaluate pathways to achieving enhanced energy security and (a subset of) the EU energy/environmental targets. Among the other areas that are candidates for subsequent application of the models are:
• Re-evaluating the potential role of energy efficiency and conservation in curbing growth in energy demand using data developed by the Energy Efficiency Task Force;
• Diversification and security of energy supply
– The potential for renewables
– Impacts of increased utilization of nuclear power
– Optimal use of increased availability of natural gas;
• The effect of eliminating energy price “distortions;”
• Evaluation of requirements to support more rapid economic growth, and
• The potential benefits of regional electricity and gas markets.

SOUTH EAST EUROPE REGIONAL ENERGY MARKET SUPPORT (SEE REMS) PROJECT 37
As noted earlier, a limitation of the current framework is that each country is modeled separately; there is no endogenous trade of electricity or gas depicted. But these 8 country models can be combined into an integrated regional planning framework, providing a regional perspective while retaining national autonomy and specific details for each country. Furthermore, consideration should be given to promoting closer coordination with other ongoing undertakings in the region (e.g., Energy Community’s Efficiency Task Force, South East European Co-operative Initiative (SECI)7
At the same time, the Ministries and Energy Community Secretariat must commit to sustaining and expanding the models, and plan to fully integrate the capacity now available to them into their national planning processes. This entails an ongoing commitment to keeping the model current, continually defining the issues that the model is to address, and providing the time/staff needed to enable each country’s team to efficiently and effectively apply this tool.
), as well as any subsequent Generation Investment or Regional Gas assessments that may be undertaken, to further improve the ability to assess the pressing energy and environmental issues in the region. In addition, national models for other countries in the region – not currently in the REDP – can be added to the integrated regional model framework to expand its scope and value.
7 “SECI attempts to emphasize and coordinate region-wide planning, identify needed follow-up and missing links, provide for better involvement of
the private sector in regional economic and environmental efforts, help to create a regional climate that encourages the transfer of know-how and greater investment in the private sector, and assist in harmonizing trade laws and policies.”(www.secinet.info)
38 SOUTH EAST EUROPE REGIONAL ENERGY MARKET SUPPORT (SEE REMS) PROJECT
SECTION 2: REFERENCE SCENARIO DEVELOPMENT AND ANALYSIS
The most important aspects of modeling a country’s energy system in MARKAL/TIMES are discussed in general terms in the following section, which is followed by an aggregate assessment of the region’s energy perspective according to the Reference scenarios. Details of the specific input data and Reference scenario analysis for each country are provided in Appendix 1, Section B.
2.1 REFERENCE SCENARIO DEVELOPMENT A crucial step for any modeling analysis is the establishment of a baseline or Reference scenario that depicts a plausible evolution of the energy system taking into consideration currently known and planned aspects of the energy economy. This Reference scenario then serves as the comparison point for the subsequent analysis of policy options and alternative scenarios. This Section summarizes the process used by each country’s TWG representative to develop his/her Reference scenario and presents an aggregate assessment of the regional Reference scenario results. The Phase II5 report provides details of the development of each country’s MARKAL model and describes the process of calibrating the models to the base year data for each country.
The Reference scenario for each country has been established by:
• Establishing a consistent 2003 energy balance for the country, adapted to the model needs;
• Fully describing the current power sector, at the plant type (and sometimes individual plant) level, and developing a good estimate of the starting stock of demand devices based upon the decomposition of the energy balance by sector and fuel type;
• Developing demand service drivers (e.g., GDP, population) and associating them with each of the sectors to establish an initial projection of future useful energy services (e.g., space conditioning, cooking, motor drives in the chemical industry, etc.);
• Adopting forecasts of energy supply prices from the EU New Energy Externalities Development for Sustainability (NEEDS) project trends, adapted for each country situation by its TWG member;
• Establishing a relevant set of future power plants, coupled heat and power, and heating plants (centralized and decentralized) as well as demand devices based upon IEA/ETSAP technology characterizations, adapted to the SEE situation; and
• Establishing mechanisms for “guiding” model choices in situations where there are limitations on system evolution that inhibit the selection of ideal economic choices.
Embedded within the development of the Reference scenario are assumptions regarding how much the energy system will remain similar to its current configuration without intervention. Because MARKAL models identify the least-cost configuration of the energy system over time, it is necessary to restrict aspects of model choice to better reflect what each TWG member sees as the most likely evolution of his/her energy system.
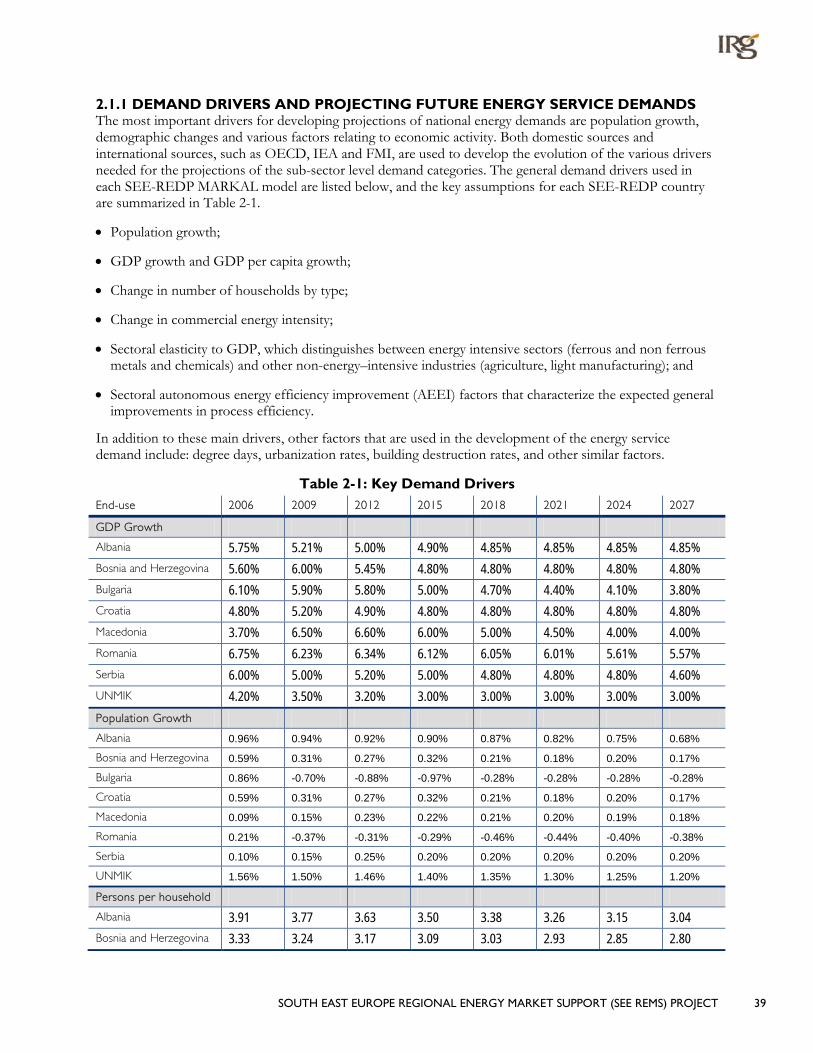
SOUTH EAST EUROPE REGIONAL ENERGY MARKET SUPPORT (SEE REMS) PROJECT 39
2.1.1 DEMAND DRIVERS AND PROJECTING FUTURE ENERGY SERVICE DEMANDS The most important drivers for developing projections of national energy demands are population growth, demographic changes and various factors relating to economic activity. Both domestic sources and international sources, such as OECD, IEA and FMI, are used to develop the evolution of the various drivers needed for the projections of the sub-sector level demand categories. The general demand drivers used in each SEE-REDP MARKAL model are listed below, and the key assumptions for each SEE-REDP country are summarized in Table 2-1.
• Population growth;
• GDP growth and GDP per capita growth;
• Change in number of households by type;
• Change in commercial energy intensity;
• Sectoral elasticity to GDP, which distinguishes between energy intensive sectors (ferrous and non ferrous metals and chemicals) and other non-energy–intensive industries (agriculture, light manufacturing); and
• Sectoral autonomous energy efficiency improvement (AEEI) factors that characterize the expected general improvements in process efficiency.
In addition to these main drivers, other factors that are used in the development of the energy service demand include: degree days, urbanization rates, building destruction rates, and other similar factors.
Table 2-1: Key Demand Drivers End-use 2006 2009 2012 2015 2018 2021 2024 2027
GDP Growth
Albania 5.75% 5.21% 5.00% 4.90% 4.85% 4.85% 4.85% 4.85%
Bosnia and Herzegovina 5.60% 6.00% 5.45% 4.80% 4.80% 4.80% 4.80% 4.80%
Bulgaria 6.10% 5.90% 5.80% 5.00% 4.70% 4.40% 4.10% 3.80%
Croatia 4.80% 5.20% 4.90% 4.80% 4.80% 4.80% 4.80% 4.80%
Macedonia 3.70% 6.50% 6.60% 6.00% 5.00% 4.50% 4.00% 4.00%
Romania 6.75% 6.23% 6.34% 6.12% 6.05% 6.01% 5.61% 5.57%
Serbia 6.00% 5.00% 5.20% 5.00% 4.80% 4.80% 4.80% 4.60%
UNMIK 4.20% 3.50% 3.20% 3.00% 3.00% 3.00% 3.00% 3.00%
Population Growth
Albania 0.96% 0.94% 0.92% 0.90% 0.87% 0.82% 0.75% 0.68%
Bosnia and Herzegovina 0.59% 0.31% 0.27% 0.32% 0.21% 0.18% 0.20% 0.17%
Bulgaria 0.86% -0.70% -0.88% -0.97% -0.28% -0.28% -0.28% -0.28%
Croatia 0.59% 0.31% 0.27% 0.32% 0.21% 0.18% 0.20% 0.17%
Macedonia 0.09% 0.15% 0.23% 0.22% 0.21% 0.20% 0.19% 0.18%
Romania 0.21% -0.37% -0.31% -0.29% -0.46% -0.44% -0.40% -0.38%
Serbia 0.10% 0.15% 0.25% 0.20% 0.20% 0.20% 0.20% 0.20%
UNMIK 1.56% 1.50% 1.46% 1.40% 1.35% 1.30% 1.25% 1.20%
Persons per household
Albania 3.91 3.77 3.63 3.50 3.38 3.26 3.15 3.04
Bosnia and Herzegovina 3.33 3.24 3.17 3.09 3.03 2.93 2.85 2.80

40 SOUTH EAST EUROPE REGIONAL ENERGY MARKET SUPPORT (SEE REMS) PROJECT
End-use 2006 2009 2012 2015 2018 2021 2024 2027
Bulgaria 2.62 2.58 2.55 2.52 2.52 2.51 2.51 2.50
Croatia 2.57 2.51 2.45 2.40 2.32 2.26 2.22 2.20
Macedonia 2.92 2.85 2.78 2.73 2.64 2.57 2.52 2.50 Romania 2.98 2.93 2.88 2.84 2.79 2.75 2.71 2.67
Serbia 2.87 2.81 2.74 2.68 2.59 2.53 2.48 2.46
UNMIK 5.13 4.85 4.59 4.35 4.13 3.93 3.74 3.56
Demand is grouped into Agriculture, Commercial, Industry, Residential and Electricity for Transportation. Then within each sector the individual sub-sector demands are broken out (e.g., heating and cooling, cooking, lighting); a complete set of demand sub-sectors is presented in Table 2-3 (order by percentage of 2027 demand). For industry, since detailed process operation is not generally available, three generic types of industrial energy service type (high-temperature heat, low-temperature heat, and mechanical drive) are characterized for each sub-sector (e.g., iron and steel, chemicals, paper).
The base year (first model period) energy service demands for each calibrated model are calculated from the base year final energy consumption in each sub-sector according to the performance characteristics (efficiency and availability) of the existing technology stock. For each fuel type and end-use device combination, the useful energy demand is the product of the final energy consumed and the device efficiency. The total demand in each sub-sector corresponds to sum of the demands from all fuel-type and end-use devices serving that demand in the base year.
To establish the future year demands in each sub-sector, the appropriate demand drivers are applied to shape the evolution of the demand growth according to the expected economic and demographic circumstances. Application of the appropriate demand drivers is different in each sub-sector, as some demands are driven by GDP while others are determined by population changes.
In addition to the more tangible demand drivers, the demand projection process used GDP elasticities at the sub-sector level. The elasticity-to-GDP relationship reflects the changing pattern of energy service demand in relation to economic growth, such as changes in consumption patterns due to suppressed demand or saturation in a demand over time. They are applied to the drivers to modify the projected demand for energy service for each category. Note that these elasticities do not include consideration of energy efficiency improvements arising from technology choice, since MARKAL will evaluate and introduce more efficient technologies when they are available and cost effective. However, the elasticity-driven growth of many of the demands is moderated by an autonomous energy efficiency improvement (AEEI) factor that represents non-device efficiency improvements, such as process changes in industry and improved building management for commercial space heating and cooling.
Unfortunately, estimates of elasticities and AEEI at the sub-sector level are not readily available. The approach that was used for SEE-REDP is based upon the rigorous work done at Energy Institute Hrvoje Požar (EIHP) for the Croatian National Energy Strategy (NES). As part of preparing the Croatian NES, extensive data development was done by means of surveys and other sampling techniques to derive the kind of detailed description of the expected evolution of the demand sectors required for the MAED [Model for Analysis of Energy Demand] model, which was then used to project future useful energy demand requirements in Croatia. Such detailed information is not readily available for the other SEE-REDP countries. These economies share similarities but, particularly in the industrial sector, have differences. Therefore, the industrial AEEIs used were those from EIHP according to the energy service type (.015, .010, .005), while the elasticities for the other countries were derived by the TWG from the Croatian values, adjusting for their own data and energy system situations, considering factors including relative end-use saturation and industry growth projections. There is a fairly wide variation between the countries for the three industrial energy service types of .6-1.3, .6-1.25, .7-1.2, with the higher elasticities tending to be found in the countries where
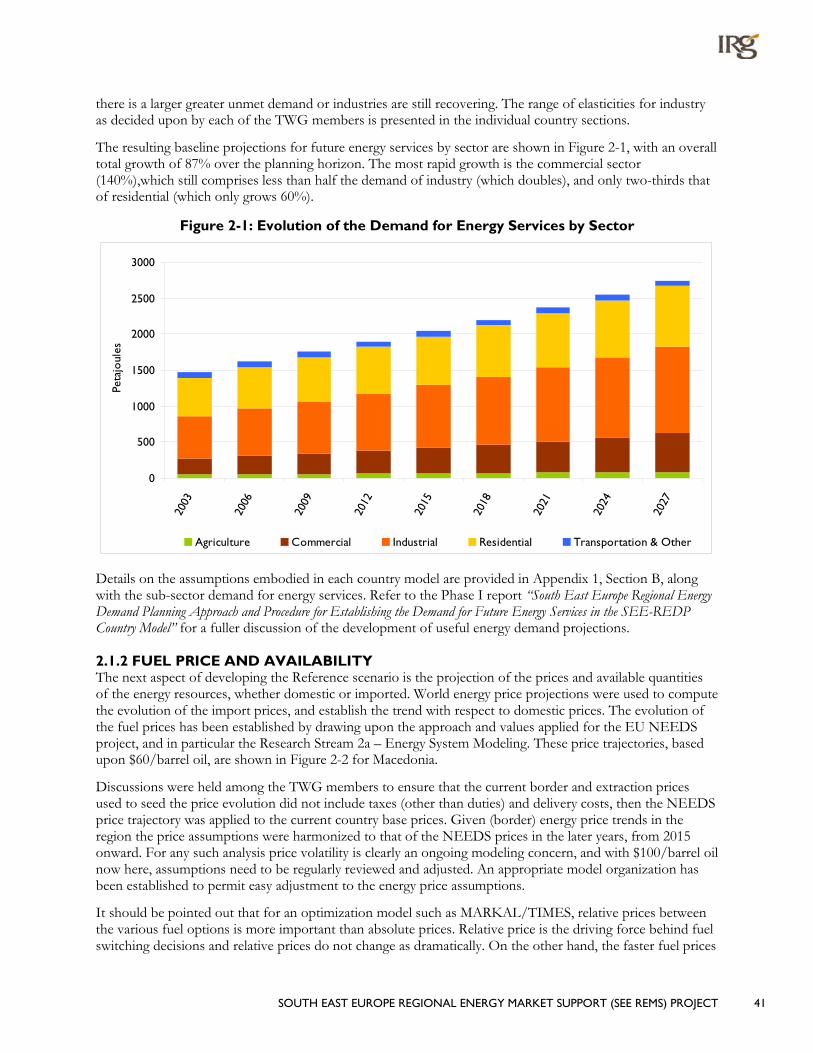
SOUTH EAST EUROPE REGIONAL ENERGY MARKET SUPPORT (SEE REMS) PROJECT 41
there is a larger greater unmet demand or industries are still recovering. The range of elasticities for industry as decided upon by each of the TWG members is presented in the individual country sections.
The resulting baseline projections for future energy services by sector are shown in Figure 2-1, with an overall total growth of 87% over the planning horizon. The most rapid growth is the commercial sector (140%),which still comprises less than half the demand of industry (which doubles), and only two-thirds that of residential (which only grows 60%).
Figure 2-1: Evolution of the Demand for Energy Services by Sector
0
500
1000
1500
2000
2500
3000
2003
2006
2009
2012
2015
2018
2021
2024
2027
Peta
joul
es
Agriculture Commercial Industrial Residential Transportation & Other
Details on the assumptions embodied in each country model are provided in Appendix 1, Section B, along with the sub-sector demand for energy services. Refer to the Phase I report “South East Europe Regional Energy Demand Planning Approach and Procedure for Establishing the Demand for Future Energy Services in the SEE-REDP Country Model” for a fuller discussion of the development of useful energy demand projections.
2.1.2 FUEL PRICE AND AVAILABILITY The next aspect of developing the Reference scenario is the projection of the prices and available quantities of the energy resources, whether domestic or imported. World energy price projections were used to compute the evolution of the import prices, and establish the trend with respect to domestic prices. The evolution of the fuel prices has been established by drawing upon the approach and values applied for the EU NEEDS project, and in particular the Research Stream 2a – Energy System Modeling. These price trajectories, based upon $60/barrel oil, are shown in Figure 2-2 for Macedonia.
Discussions were held among the TWG members to ensure that the current border and extraction prices used to seed the price evolution did not include taxes (other than duties) and delivery costs, then the NEEDS price trajectory was applied to the current country base prices. Given (border) energy price trends in the region the price assumptions were harmonized to that of the NEEDS prices in the later years, from 2015 onward. For any such analysis price volatility is clearly an ongoing modeling concern, and with $100/barrel oil now here, assumptions need to be regularly reviewed and adjusted. An appropriate model organization has been established to permit easy adjustment to the energy price assumptions.
It should be pointed out that for an optimization model such as MARKAL/TIMES, relative prices between the various fuel options is more important than absolute prices. Relative price is the driving force behind fuel switching decisions and relative prices do not change as dramatically. On the other hand, the faster fuel prices
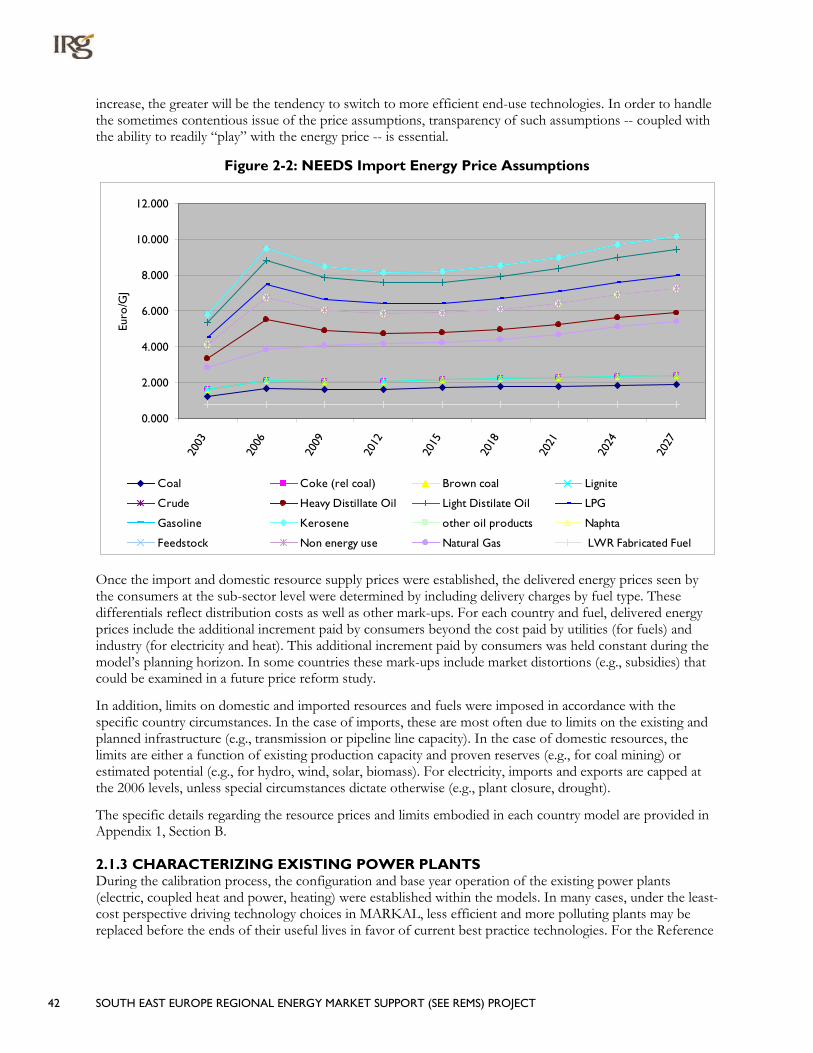
42 SOUTH EAST EUROPE REGIONAL ENERGY MARKET SUPPORT (SEE REMS) PROJECT
increase, the greater will be the tendency to switch to more efficient end-use technologies. In order to handle the sometimes contentious issue of the price assumptions, transparency of such assumptions -- coupled with the ability to readily “play” with the energy price -- is essential.
Figure 2-2: NEEDS Import Energy Price Assumptions
0.000
2.000
4.000
6.000
8.000
10.000
12.00020
03
2006
2009
2012
2015
2018
2021
2024
2027
Euro
/GJ
Coal Coke (rel coal) Brown coal Lignite
Crude Heavy Distillate Oil Light Distilate Oil LPG
Gasoline Kerosene other oil products Naphta
Feedstock Non energy use Natural Gas LWR Fabricated Fuel
Once the import and domestic resource supply prices were established, the delivered energy prices seen by the consumers at the sub-sector level were determined by including delivery charges by fuel type. These differentials reflect distribution costs as well as other mark-ups. For each country and fuel, delivered energy prices include the additional increment paid by consumers beyond the cost paid by utilities (for fuels) and industry (for electricity and heat). This additional increment paid by consumers was held constant during the model’s planning horizon. In some countries these mark-ups include market distortions (e.g., subsidies) that could be examined in a future price reform study.
In addition, limits on domestic and imported resources and fuels were imposed in accordance with the specific country circumstances. In the case of imports, these are most often due to limits on the existing and planned infrastructure (e.g., transmission or pipeline line capacity). In the case of domestic resources, the limits are either a function of existing production capacity and proven reserves (e.g., for coal mining) or estimated potential (e.g., for hydro, wind, solar, biomass). For electricity, imports and exports are capped at the 2006 levels, unless special circumstances dictate otherwise (e.g., plant closure, drought).
The specific details regarding the resource prices and limits embodied in each country model are provided in Appendix 1, Section B.
2.1.3 CHARACTERIZING EXISTING POWER PLANTS During the calibration process, the configuration and base year operation of the existing power plants (electric, coupled heat and power, heating) were established within the models. In many cases, under the least-cost perspective driving technology choices in MARKAL, less efficient and more polluting plants may be replaced before the ends of their useful lives in favor of current best practice technologies. For the Reference

SOUTH EAST EUROPE REGIONAL ENERGY MARKET SUPPORT (SEE REMS) PROJECT 43
scenario each TWG member determined the minimum level of output that they would expect from these plants, barring alternative policies.
It should be noted that for the alternate scenario analyses discussed in this report these minimum operating settings were not adjusted, which in some cases limited the ability of the system to respond as fully as it might have. This is one aspect of the models that will need to be revisited in preparation for the EU targets or accelerated renewables analyses, with appropriate review and loosening of these constraints to allow the possibility of earlier increases in investments in cleaner and more efficient power plants.
2.1.4 FUEL SHARE EVOLUTION As already mentioned, a MARKAL model is driven by the mandate to find the least-cost configuration of the energy system over time. But this paradigm can lead to rates of change that are not necessarily reasonable within a real energy system. An important technique employed to guide the evolution of the energy system within more realistic limits is to constrain the rate and degree to which fuel switching may occur. For power plants this basically means controlling the suite of existing power plants and the number of new plant types expected to be available. However, for demand devices, a more robust approach must be employed owing to the large number of alternative technologies involved.
The approach developed uses a series of sub-sector final energy fuel share consumption constraints. These are seeded with the current shares based upon the initial calibration of the energy balance. Each of these shares was reviewed by the TWG and an expectation of whether a given fuel’s share might shrink or grow beyond current levels was determined. This is obviously a subjective decision, but when examined by sub-sector and fuel type, reasonable choices can be made. For example, it is not likely that the amount of coal used for residential heating will grow, or that pizza places will give up all of their wood ovens. In general, these fuel share constraints give increasing freedom to the model over time, where the values at the end of the horizon are mostly driven by aspects the model cannot taken into account (e.g. it is not cost efficient to put CFL lamps where the need for light is minimal). Thus, inexpensive fuels are usually capped above their current levels and more expensive ones forced to take a minimum share - usually lower than they have today. The model will then have the flexibility it needs to respond to changing futures within reasonable constraints.
2.1.5 FUTURE TECHNOLOGY OPTIONS Another key aspect of a comprehensive energy planning framework such as MARKAL/TIMES is the suite of future technology options made available to the model. For the SEE-REDP models a series of power plant and demand device characterizations were developed. These technology characterizations were derived from the Eastern Europe module of the IEA Energy Technology Perspective (ETP) model, the EU-NEEDS database, and other European MARKAL models, with aspects adjusted to reflect SEE circumstances. They were then cross-checked against the published GIS information, and the characterizations were adjusted to bring them in-line with what was used for the GIS.
To enable a consistent set of technology characterizations of the power sector, a New Power Sector Technology dataset was developed in an Excel workbook. To include a certain type of power, couple-heat, heating plant in their database, the TWG member simply activates those options of interest, ignoring the others. The characterization of some of the main power plant types is presented in Table 2-2.
For demand devices a more extensive set of options is required. The REDP approach established the list of current practice technologies generally available today from the data sources mentioned above. The assumed efficiencies of the stock of technologies already deployed were “normalized” to be 5-10% below the current devices generally found in the region. In a similar manner to that just described for power plants, the TWG member selects which new demand device options are to be available in each sector of his/her national model. For each new class of demand device selected, a series of improving versions of that technology are created, unless the analyst indicates otherwise. These improved technologies, with up to 30% improved performance at up to 2.5 times the current cost, are made available in their country model.

44 SOUTH EAST EUROPE REGIONAL ENERGY MARKET SUPPORT (SEE REMS) PROJECT
There is one other aspect of the demand device characterization that each TWG member had to consider. The cost of the more advanced devices may have a premium applied to it, sometimes referred to as a “hurdle rate.” This mark-up reflects the fact that people in the region may have other more pressing expenses that come first (e.g., food, clothes), there may be a lack of knowledge about the benefits of a more efficient (and usually thereby more expensive initial cost) device, and lack of supply chain, and other complication inhibiting the uptake of the new devices. Depending upon the country, the TWG introduced 0-25% “hurdle rate” premiums compared with western European prices. This is an aspect of the models that may be worth revisiting in preparation for the EU targets or accelerated renewables analyses.

SOUTH EAST EUROPE REGIONAL ENERGY MARKET SUPPORT (SEE REMS) PROJECT 45
Table 2-2: SEE-REDP Example Power Plant Characteristics
Plant Type Lifetime Year Available Efficiency* Ratio of Heat
to Electricity Investment Cost (Euro/kW)
Fixed O&M (Euro/kW-Yr)
Variable O&M (Euro/kWh)
Availability Factor **
Coupled Heat & Power
Biomass Decentralized 30 2006 0.22 4.61 1850 37.0 1.80 0.8 Hard Coal Centralized 30 2006 0.39 2.58 1350 27.0 0.80 0.8 Lignite-HFO Centralized 30 2006 0.29 3.11 1400 28.0 1.32 0.8 Natural Gas Centralized 30 2006 0.41 2.44 650 13.0 0.77 0.8 Heavy Fuel Centralized 30 2006 0.40 2.50 600 12.0 0.77 0.8 Heavy Fuel Decentralized 30 2006 0.22 4.49 600 12.0 0.77 0.8
Power Plants
Hard Coal Steam 40 2006 0.39 900 18.0 1.10 0.8 Lignite-HFO Centralized 40 2006 0.28 1000 25.0 1.20 0.8 Natural Gas Combined Cycle Centralized 25 2009 0.50 500 20.0 1.40 0.8 New nuclear 30 2012 0.33 1700 50.0 1.10 0.8 Large hydro new 50 2012 1.00 1200 10.0 0.40 0.4 Small hydro new 30 2006 1.00 800 5.0 0.20 0.3 Biomass Decentralized 30 2006 0.37 1700 43.0 1.90 0.8 Geothermal dry steam Decentralized 30 2006 1.00 1200 50.0 1.50 0.8 Solar PV Centralized 30 2006 1.00 4200 12.6 0.00 0.1545 Solar PV Decentralized 30 2006 1.00 3300 10.0 0.00 0.1545 Wind Farms 30 2012 1.00 1001 30.0 0.00 0.307
Heating Plants
Biomass Decentralized 30 2006 0.780 8 0.156 1.52 0.8 Brown Coal Decentralized 30 2006 0.780 8 0.156 0.88 0.8 Lignite Decentralized 30 2006 0.780 8 0.156 0.96 0.8 Distillate Centralized 30 2006 0.850 7 0.130 0.56 0.8 Natural Gas Centralized 30 2006 0.85 5.85 0.117 0.56 0.8 Natural Gas Decentralized 30 2006 0.78 5.85 0.117 0.56 0.8 Geothermal Decentralized 30 2006 1.00 10 0.200 1.200 0.8 Heavy Fuel Centralized 30 2006 0.85 6.5 0.130 0.56 0.8
* For Coupled Heat & Power, Efficiency equals Electric Output / Total Thermal Input ** For solar and wind technologies, availability factors are calculated for each season and for day versus night

46 SOUTH EAST EUROPE REGIONAL ENERGY MARKET SUPPORT (SEE REMS) PROJECT
2.1.6 NEW TECHNOLOGY ADOPTION RATES As with fuel switching, MARKAL models can also introduce new technology options at a rate that is too fast for emerging market technologies or is not realistic compared to the ability of the industry to ramp-up. Therefore, a mechanism is used to manage the rate of adoption for these new technologies. For power plants, this growth limitation can be done on a technology-specific basis, just as was done for fuel switching. The approach for the new demand devices is more complex given the very wide range of possible improved technologies.
The mechanism devised to control the adoption rate of new technologies proceeds from the premise that today there are few widely-available advanced technologies (those with 10% or better performance characteristics compared to what is generally available today), and at most 5% of individuals may be able/interested/willing to purchase the more capital intensive advanced devices. For the Reference scenario it was assumed that there would only be access to existing better technologies with no more than 10% of the demand in 2027 being met with improved technologies. Then, as part of the efficiency analysis a series of runs was conducted, permitting up to 90% of the 2027 demand to be met by the advanced technologies.
Two options were analyzed under this project – (i) very few advanced devices available and (ii) 90% available. It would be worthwhile to review these constraints and perhaps adjust them individually in preparation for the EU targets analysis.
Also, note that in the cases discussed in this report, some countries saw a rapid move to existing advanced technologies, at the expense of the existing stock, and thus chose to limit the lower level to which these existing technologies are permitted to disappear. Again, these assumptions were not removed for the purposes of the current analysis, but may be examined prior to the EU targets analysis or accelerated renewables analyses.
2.2 REFERENCE SCENARIO REGIONAL RESULTS This section of the report presents the Reference scenario results from an aggregate regional perspective to provide the context within which the alternative scenario analysis is to be viewed.
2.2.1 FINAL ENERGY CONSUMPTION Aggregated final energy consumption in the Reference scenario is shown in Figure 2-3 for each demand sector (Agriculture, Commercial, Residential, Industrial, and a simplified electricity-based Transportation with Other).
In the Reference scenario, energy consumption for the region increases steadily, with a 52% overall growth over the 27 year planning horizon (the model spanning from 2002-2028 in 3-year increments). The most significant growth occurs in the industrial and commercial sectors (90% and 88%, respectively) followed by the agricultural sector (50%). The residential sector, although the second largest sector overall, grows relatively slowly (15%) and the limited transportation sector remains essentially constant.

SOUTH EAST EUROPE REGIONAL ENERGY MARKET SUPPORT (SEE REMS) PROJECT 47
Figure 2-3: Final Energy Demand by Sector
0
500
1000
1500
2000
2500
3000
3500
2003
2006
2009
2012
2015
2018
2021
2024
2027
Peta
joul
es
Agriculture Commercial Industrial Residential Transport & Other
The figures and table below show the shifting nature of the demand composition by sub-sector, and by country. The pie charts shown in Figure 2-48
8 See Table 2-3 for the definition of the individual sub-sector IDs, the figure has COTH with CFOD+CPLI+CREF and ROTH with RDRY+RDSH
folded in.
indicate that from the overall regional perspective, the biggest changes are the increasing requirements for industrial and commercial purposes. And while there is an overall drop in the residential heating and water share it remains the single largest source of energy consumption.

48 SOUTH EAST EUROPE REGIONAL ENERGY MARKET SUPPORT (SEE REMS) PROJECT
Figure 2-4: 2003/2027 Share of Final Energy Demand by Sub-sector9
2003
AGR, 3.8%
CC, 0.6%
CH+W, 8.0%
IP, 1.7%
IR, 0.8%
RC, 0.1%
ROTH, 0.8%
RREF, 1.3%
TRN, 4.3%
CL, 1.8%
COTH, 1.5%
RLIT, 1.5%
IF, 3.8%
IM, 6.2%
RFOD, 3.1% IO, 8.4%
II, 10.4%
IC, 11.3%RH+W, 30.8%
2027
IF, 5.7%
IP, 2.0%
IR, 0.8%
RC, 0.8%
RFOD, 2.3%
AGR, 3.6%CC, 1.4%
CH+W, 9.3%CL, 1.5%
COTH, 2.1%
RREF, 1.1%
TRN, 2.7%
RLIT, 0.8%
ROTH, 1.9%
IO, 12.1%
IM, 7.4%
II, 9.1%
IC, 14.7%
RH+W, 20.6%
9 The smaller sectors have been combined in the figures such that COTH includes COTH+CFOD+CPLI+CREF and ROTH includes
ROTH+RDSH+RDRY.

SOUTH EAST EUROPE REGIONAL ENERGY MARKET SUPPORT (SEE REMS) PROJECT 49
Table 2-3 is sorted with the largest consumers up top, and highlights the fact that the top 8 demands account for 63.8% of the total, and thus are key targets for efficiency improvement and conservations options, as discussed in the Scenario Analysis section. But the table also serves to document great variations between the countries of the region, with the exception of the consistent important role played by space heating demand.
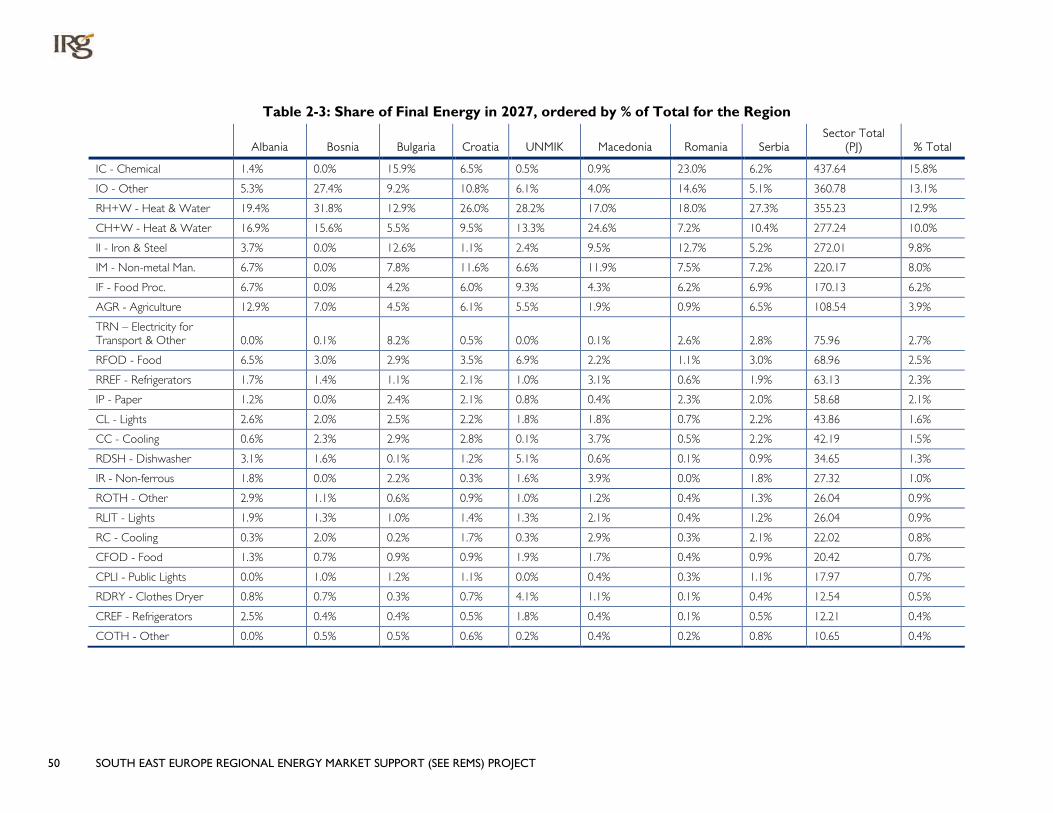
50 SOUTH EAST EUROPE REGIONAL ENERGY MARKET SUPPORT (SEE REMS) PROJECT
Table 2-3: Share of Final Energy in 2027, ordered by % of Total for the Region
Albania Bosnia Bulgaria Croatia UNMIK Macedonia Romania Serbia Sector Total
(PJ) % Total
IC - Chemical 1.4% 0.0% 15.9% 6.5% 0.5% 0.9% 23.0% 6.2% 437.64 15.8%
IO - Other 5.3% 27.4% 9.2% 10.8% 6.1% 4.0% 14.6% 5.1% 360.78 13.1%
RH+W - Heat & Water 19.4% 31.8% 12.9% 26.0% 28.2% 17.0% 18.0% 27.3% 355.23 12.9%
CH+W - Heat & Water 16.9% 15.6% 5.5% 9.5% 13.3% 24.6% 7.2% 10.4% 277.24 10.0%
II - Iron & Steel 3.7% 0.0% 12.6% 1.1% 2.4% 9.5% 12.7% 5.2% 272.01 9.8%
IM - Non-metal Man. 6.7% 0.0% 7.8% 11.6% 6.6% 11.9% 7.5% 7.2% 220.17 8.0%
IF - Food Proc. 6.7% 0.0% 4.2% 6.0% 9.3% 4.3% 6.2% 6.9% 170.13 6.2%
AGR - Agriculture 12.9% 7.0% 4.5% 6.1% 5.5% 1.9% 0.9% 6.5% 108.54 3.9%
TRN – Electricity for Transport & Other 0.0% 0.1% 8.2% 0.5% 0.0% 0.1% 2.6% 2.8% 75.96 2.7%
RFOD - Food 6.5% 3.0% 2.9% 3.5% 6.9% 2.2% 1.1% 3.0% 68.96 2.5%
RREF - Refrigerators 1.7% 1.4% 1.1% 2.1% 1.0% 3.1% 0.6% 1.9% 63.13 2.3%
IP - Paper 1.2% 0.0% 2.4% 2.1% 0.8% 0.4% 2.3% 2.0% 58.68 2.1%
CL - Lights 2.6% 2.0% 2.5% 2.2% 1.8% 1.8% 0.7% 2.2% 43.86 1.6%
CC - Cooling 0.6% 2.3% 2.9% 2.8% 0.1% 3.7% 0.5% 2.2% 42.19 1.5%
RDSH - Dishwasher 3.1% 1.6% 0.1% 1.2% 5.1% 0.6% 0.1% 0.9% 34.65 1.3%
IR - Non-ferrous 1.8% 0.0% 2.2% 0.3% 1.6% 3.9% 0.0% 1.8% 27.32 1.0%
ROTH - Other 2.9% 1.1% 0.6% 0.9% 1.0% 1.2% 0.4% 1.3% 26.04 0.9%
RLIT - Lights 1.9% 1.3% 1.0% 1.4% 1.3% 2.1% 0.4% 1.2% 26.04 0.9%
RC - Cooling 0.3% 2.0% 0.2% 1.7% 0.3% 2.9% 0.3% 2.1% 22.02 0.8%
CFOD - Food 1.3% 0.7% 0.9% 0.9% 1.9% 1.7% 0.4% 0.9% 20.42 0.7%
CPLI - Public Lights 0.0% 1.0% 1.2% 1.1% 0.0% 0.4% 0.3% 1.1% 17.97 0.7%
RDRY - Clothes Dryer 0.8% 0.7% 0.3% 0.7% 4.1% 1.1% 0.1% 0.4% 12.54 0.5%
CREF - Refrigerators 2.5% 0.4% 0.4% 0.5% 1.8% 0.4% 0.1% 0.5% 12.21 0.4%
COTH - Other 0.0% 0.5% 0.5% 0.6% 0.2% 0.4% 0.2% 0.8% 10.65 0.4%

SOUTH EAST EUROPE REGIONAL ENERGY MARKET SUPPORT (SEE REMS) PROJECT 51
Figure 2-5 shows aggregated final energy demand by fuel type, and Figure 2-6 shows the evolution of the total demand for each country, which is dominated by Romania, followed by Serbia, Bulgaria and Croatia. Overall demand for energy grows by 57.6%. The most significant growth occurs in electricity and natural gas, which increase by 94% and 85% over the 27 year planning horizon. Coal consumption grows by 42%. While LPG grows by over 180%, it still represents only 6% of energy consumption by 2027.
Figure 2-5: Final Energy Demand by Fuel Type
0
500
1000
1500
2000
2500
3000
3500
2003
2006
2009
2012
2015
2018
2021
2024
2027
Peta
joul
es
Coal Oil Natural Gas LPG
Electricity Biomass Renewable (other) Low-temp Heat
Figure 2-6: Final Energy Demand by Country
0
500
1000
1500
2000
2500
3000
3500
2003
2006
2009
2012
2015
2018
2021
2024
2027
Peta
joul
es
Albania Bosnia Bulgaria Croatia Macedonia Romania Serbia UNMIK

52 SOUTH EAST EUROPE REGIONAL ENERGY MARKET SUPPORT (SEE REMS) PROJECT
2.2.2 ELECTRICITY GENERATION AND IMPORTS Coal/lignite is currently the dominant fuel used for power generation within the region, providing almost half of the power generated within the region (Figures 2-7 and 2-8).
Figure 2-7: Electricity Generation by Fuel Form by Country
0%
10%
20%
30%
40%
50%
60%
70%
80%
90%
100%
Albania
Bosn
ia
Bulga
ria
Croati
a
Maced
onia
Roman
ia
Serb
ia
UNMIK
Nuclear Coal-fired Oil-fired Gas-fired Hydroelectric Imports Renewable and Other
Figure 2-8: Fuel Input to Power Generation
050
100150200250300350400450500550600650700750800850900950
100010501100
2003
2006
2009
2012
2015
2018
2021
2024
2027
Peta
joul
es
Nuclear power plants Coal-fired power plants Oil-fired power plantsGas-fired power plants Hydroelectric power plants Renewable and Other power plants
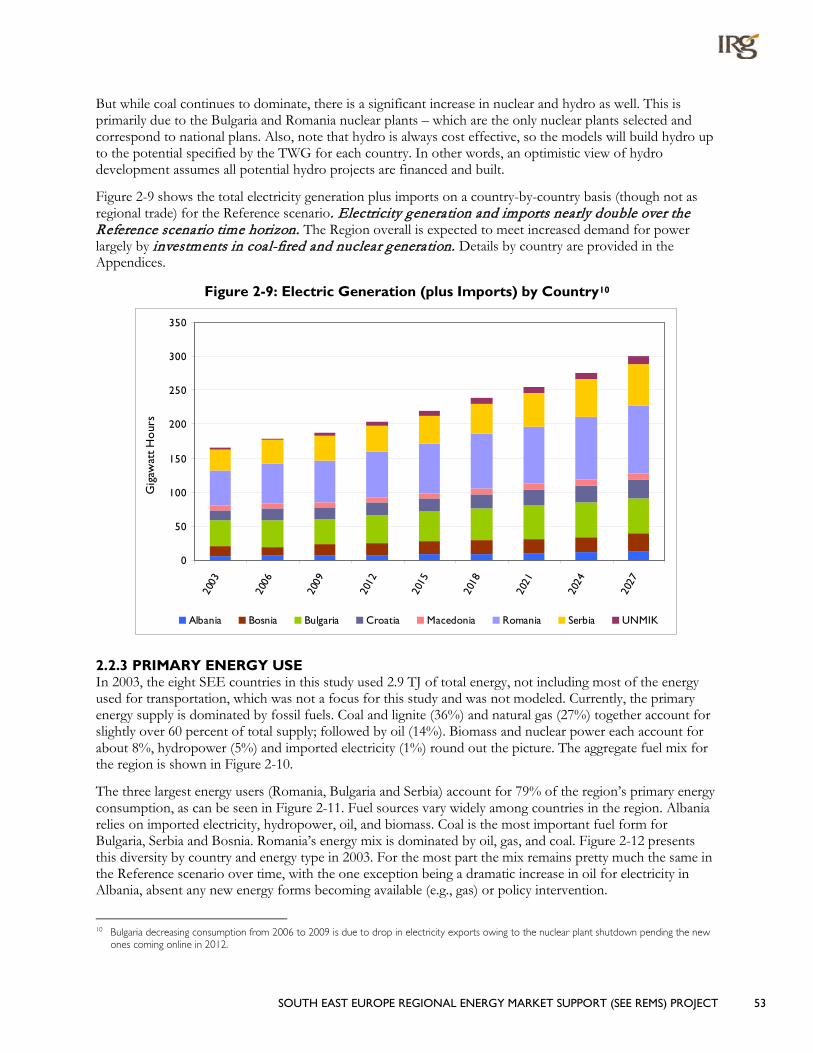
SOUTH EAST EUROPE REGIONAL ENERGY MARKET SUPPORT (SEE REMS) PROJECT 53
But while coal continues to dominate, there is a significant increase in nuclear and hydro as well. This is primarily due to the Bulgaria and Romania nuclear plants – which are the only nuclear plants selected and correspond to national plans. Also, note that hydro is always cost effective, so the models will build hydro up to the potential specified by the TWG for each country. In other words, an optimistic view of hydro development assumes all potential hydro projects are financed and built.
Figure 2-9 shows the total electricity generation plus imports on a country-by-country basis (though not as regional trade) for the Reference scenario. Electricity generation and imports nearly double over the Reference scenario time horizon. The Region overall is expected to meet increased demand for power largely by investments in coal-fired and nuclear generation. Details by country are provided in the Appendices.
Figure 2-9: Electric Generation (plus Imports) by Country10
0
50
100
150
200
250
300
350
2003
2006
2009
2012
2015
2018
2021
2024
2027
Gig
awat
t H
our
s
Albania Bosnia Bulgaria Croatia Macedonia Romania Serbia UNMIK
2.2.3 PRIMARY ENERGY USE In 2003, the eight SEE countries in this study used 2.9 TJ of total energy, not including most of the energy used for transportation, which was not a focus for this study and was not modeled. Currently, the primary energy supply is dominated by fossil fuels. Coal and lignite (36%) and natural gas (27%) together account for slightly over 60 percent of total supply; followed by oil (14%). Biomass and nuclear power each account for about 8%, hydropower (5%) and imported electricity (1%) round out the picture. The aggregate fuel mix for the region is shown in Figure 2-10.
The three largest energy users (Romania, Bulgaria and Serbia) account for 79% of the region’s primary energy consumption, as can be seen in Figure 2-11. Fuel sources vary widely among countries in the region. Albania relies on imported electricity, hydropower, oil, and biomass. Coal is the most important fuel form for Bulgaria, Serbia and Bosnia. Romania’s energy mix is dominated by oil, gas, and coal. Figure 2-12 presents this diversity by country and energy type in 2003. For the most part the mix remains pretty much the same in the Reference scenario over time, with the one exception being a dramatic increase in oil for electricity in Albania, absent any new energy forms becoming available (e.g., gas) or policy intervention.
10 Bulgaria decreasing consumption from 2006 to 2009 is due to drop in electricity exports owing to the nuclear plant shutdown pending the new
ones coming online in 2012.

54 SOUTH EAST EUROPE REGIONAL ENERGY MARKET SUPPORT (SEE REMS) PROJECT
Figure 2-10: Percent 2003 Energy Supply Share by Fuel Type
Biomass8%
Nuclear8%
Coal35%
Oil15%
Natural Gas27%
LPG1%
Hydroelectric5%
Electricity Imports
1%
Figure 2-11: Percent 2003 Energy Supply Share by Country
Bosnia6%
Albania2%
UNMIK2%
Macedonia3%
Serbia15%
Bulgaria20%
Croatia8%Romania
44%

SOUTH EAST EUROPE REGIONAL ENERGY MARKET SUPPORT (SEE REMS) PROJECT 55
Figure 2-12: Composition of Energy Supply by Country in 2003
0%
20%
40%
60%
80%
100%
Alba
nia
Bosn
ia
Bulga
ria
Cro
atia
Mac
edon
ia
Rom
ania
Serb
ia
UN
MIK
Nuclear Coal Oil Natural Gas LPG
Hydroelectric Electricity Imports Biomass Other Renew
The Reference scenario evolution of the aggregated energy supply for the region by fuel type is shown in Figure 2-13. The two most immediate observations are the increasing dominance of coal as the marginal energy resource because of its relative cost and in the absence of major policy initiatives, and the total growth in energy consumption. In the Reference scenario, the region’s energy use increases by over 50 percent across the planning horizon. Most of this increase is provided by coal, with increasing contributions from natural gas and nuclear.

56 SOUTH EAST EUROPE REGIONAL ENERGY MARKET SUPPORT (SEE REMS) PROJECT
Figure 2-13: Regional Primary Energy Supply
0
500
1000
1500
2000
2500
3000
3500
4000
4500
5000
2003
2006
2009
2012
2015
2018
2021
2024
2027
Peta
joul
es
Nuclear Coal Oil Natural Gas LPG Hydroelectric Electricity Imports Biomass Other Renew
Figure 2-14 shows energy supply by country over the planning horizon in the Reference scenario. While Romania, Bulgaria and Serbia continue to dominate, rapid growth in the other countries in the region makes them more of a factor over time. [Note that for Bulgaria the decreasing energy use from 2006 to 2009 is due to the planned shutdown of an existing nuclear power plant, and the increase in 2012 is due to the pending start-up of a new nuclear plant.]
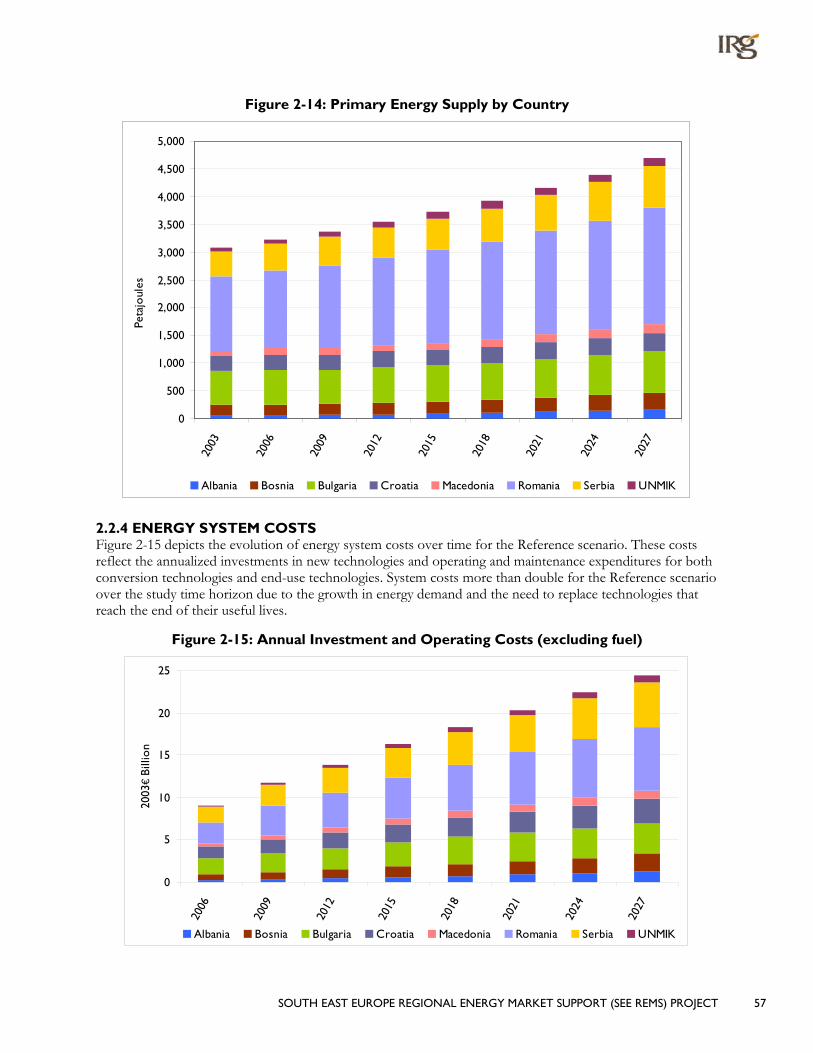
SOUTH EAST EUROPE REGIONAL ENERGY MARKET SUPPORT (SEE REMS) PROJECT 57
Figure 2-14: Primary Energy Supply by Country
0
500
1,000
1,500
2,000
2,500
3,000
3,500
4,000
4,500
5,000
2003
2006
2009
2012
2015
2018
2021
2024
2027
Peta
joul
es
Albania Bosnia Bulgaria Croatia Macedonia Romania Serbia UNMIK
2.2.4 ENERGY SYSTEM COSTS Figure 2-15 depicts the evolution of energy system costs over time for the Reference scenario. These costs reflect the annualized investments in new technologies and operating and maintenance expenditures for both conversion technologies and end-use technologies. System costs more than double for the Reference scenario over the study time horizon due to the growth in energy demand and the need to replace technologies that reach the end of their useful lives.
Figure 2-15: Annual Investment and Operating Costs (excluding fuel)
0
5
10
15
20
25
2006
2009
2012
2015
2018
2021
2024
2027
2003
€ B
illio
n
Albania Bosnia Bulgaria Croatia Macedonia Romania Serbia UNMIK
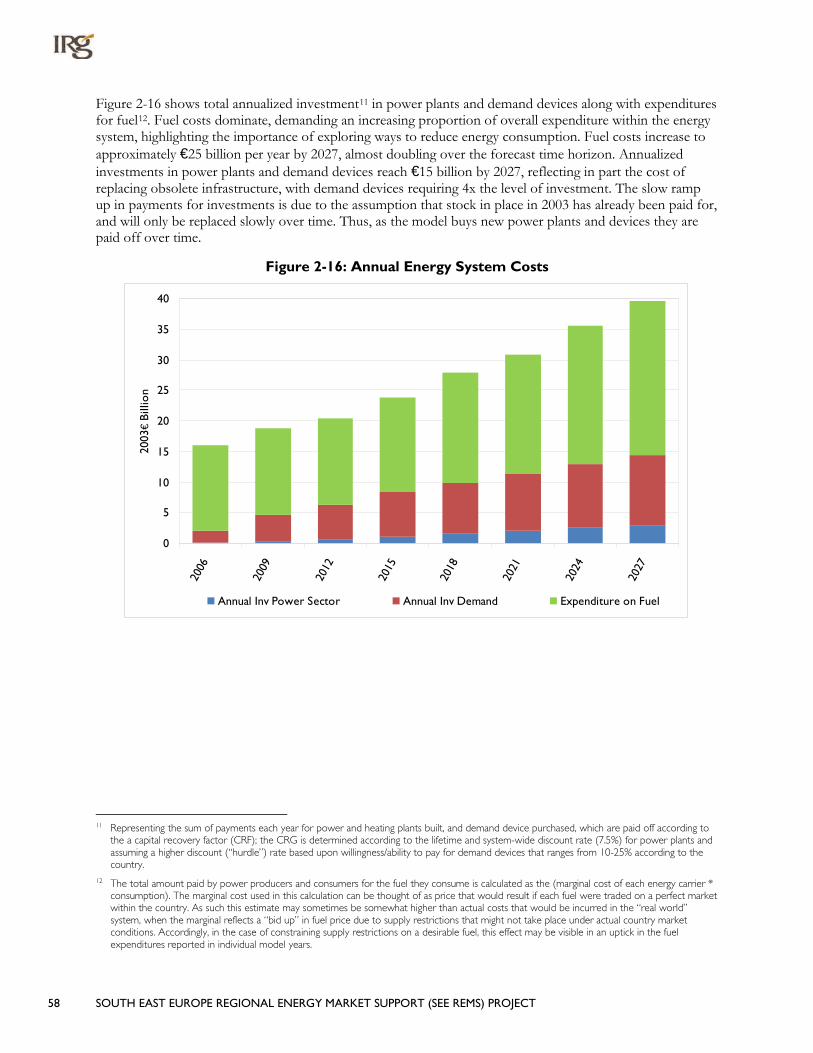
58 SOUTH EAST EUROPE REGIONAL ENERGY MARKET SUPPORT (SEE REMS) PROJECT
Figure 2-16 shows total annualized investment11 in power plants and demand devices along with expenditures for fuel12
Figure 2-16: Annual Energy System Costs
. Fuel costs dominate, demanding an increasing proportion of overall expenditure within the energy system, highlighting the importance of exploring ways to reduce energy consumption. Fuel costs increase to approximately €25 billion per year by 2027, almost doubling over the forecast time horizon. Annualized investments in power plants and demand devices reach €15 billion by 2027, reflecting in part the cost of replacing obsolete infrastructure, with demand devices requiring 4x the level of investment. The slow ramp up in payments for investments is due to the assumption that stock in place in 2003 has already been paid for, and will only be replaced slowly over time. Thus, as the model buys new power plants and devices they are paid off over time.
0
5
10
15
20
25
30
35
40
2006
2009
2012
2015
2018
2021
2024
2027
2003
€ B
illio
n
Annual Inv Power Sector Annual Inv Demand Expenditure on Fuel
11 Representing the sum of payments each year for power and heating plants built, and demand device purchased, which are paid off according to
the a capital recovery factor (CRF); the CRG is determined according to the lifetime and system-wide discount rate (7.5%) for power plants and assuming a higher discount (“hurdle”) rate based upon willingness/ability to pay for demand devices that ranges from 10-25% according to the country.
12 The total amount paid by power producers and consumers for the fuel they consume is calculated as the (marginal cost of each energy carrier * consumption). The marginal cost used in this calculation can be thought of as price that would result if each fuel were traded on a perfect market within the country. As such this estimate may sometimes be somewhat higher than actual costs that would be incurred in the “real world” system, when the marginal reflects a “bid up” in fuel price due to supply restrictions that might not take place under actual country market conditions. Accordingly, in the case of constraining supply restrictions on a desirable fuel, this effect may be visible in an uptick in the fuel expenditures reported in individual model years.
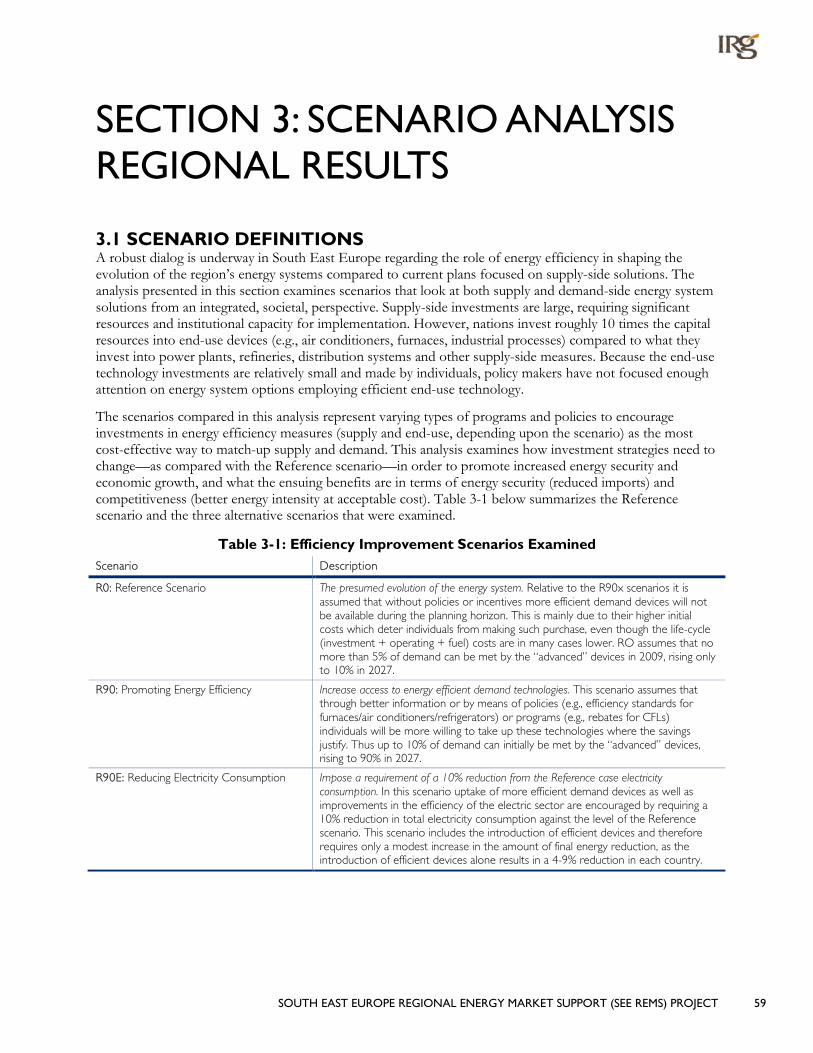
SOUTH EAST EUROPE REGIONAL ENERGY MARKET SUPPORT (SEE REMS) PROJECT 59
SECTION 3: SCENARIO ANALYSIS REGIONAL RESULTS
3.1 SCENARIO DEFINITIONS A robust dialog is underway in South East Europe regarding the role of energy efficiency in shaping the evolution of the region’s energy systems compared to current plans focused on supply-side solutions. The analysis presented in this section examines scenarios that look at both supply and demand-side energy system solutions from an integrated, societal, perspective. Supply-side investments are large, requiring significant resources and institutional capacity for implementation. However, nations invest roughly 10 times the capital resources into end-use devices (e.g., air conditioners, furnaces, industrial processes) compared to what they invest into power plants, refineries, distribution systems and other supply-side measures. Because the end-use technology investments are relatively small and made by individuals, policy makers have not focused enough attention on energy system options employing efficient end-use technology.
The scenarios compared in this analysis represent varying types of programs and policies to encourage investments in energy efficiency measures (supply and end-use, depending upon the scenario) as the most cost-effective way to match-up supply and demand. This analysis examines how investment strategies need to change—as compared with the Reference scenario—in order to promote increased energy security and economic growth, and what the ensuing benefits are in terms of energy security (reduced imports) and competitiveness (better energy intensity at acceptable cost). Table 3-1 below summarizes the Reference scenario and the three alternative scenarios that were examined.
Table 3-1: Efficiency Improvement Scenarios Examined Scenario Description
R0: Reference Scenario The presumed evolution of the energy system. Relative to the R90x scenarios it is assumed that without policies or incentives more efficient demand devices will not be available during the planning horizon. This is mainly due to their higher initial costs which deter individuals from making such purchase, even though the life-cycle (investment + operating + fuel) costs are in many cases lower. RO assumes that no more than 5% of demand can be met by the “advanced” devices in 2009, rising only to 10% in 2027.
R90: Promoting Energy Efficiency Increase access to energy efficient demand technologies. This scenario assumes that through better information or by means of policies (e.g., efficiency standards for furnaces/air conditioners/refrigerators) or programs (e.g., rebates for CFLs) individuals will be more willing to take up these technologies where the savings justify. Thus up to 10% of demand can initially be met by the “advanced” devices, rising to 90% in 2027.
R90E: Reducing Electricity Consumption Impose a requirement of a 10% reduction from the Reference case electricity consumption. In this scenario uptake of more efficient demand devices as well as improvements in the efficiency of the electric sector are encouraged by requiring a 10% reduction in total electricity consumption against the level of the Reference scenario. This scenario includes the introduction of efficient devices and therefore requires only a modest increase in the amount of final energy reduction, as the introduction of efficient devices alone results in a 4-9% reduction in each country.

60 SOUTH EAST EUROPE REGIONAL ENERGY MARKET SUPPORT (SEE REMS) PROJECT
Scenario Description
R90P: Improving Energy Intensity Improve overall energy intensity (total consumption/GDP). This scenario requires reductions in energy consumption until the energy system cost again approaches that of the Reference scenario. This scenario encourages additional uptake of more efficient power and heating plants, as well as demand devices, resulting in less energy required per unit of productivity. Thus, the intent of this scenario is to determine the level of energy efficiency in both supply and demand that can be achieved at the same lifecycle energy system costs as the Reference scenario.
In general, the three alternate scenarios represent progressively more demanding changes in the energy system, as their relative results illustrate. The results will be presented in terms of:
• Primary Energy Savings (and Increased Energy Security)
• Electricity Generation Mix and Reduction Levels
• Savings in the Consumption of Final Energy
• Cost Implications
This section examines the regional implications of these alternative scenarios; with detailed implications for individual countries highlighted in the Appendix 1. [There are also environmental benefits arising from reduced CO2 emission as well as pollutants that can be examined, though only the implications for CO2 levels are examined.]
Savings in Final Energy Consumption is most pronounced in the industrial and residential sectors, followed by the commercial sector, as shown in Figure 3-1. As noted in the Reference scenario, in 2003 residential and commercial heating and hot water amount to 39% of total demand, while industry consumes 42.5%. Over the time horizon the percentage of demand for heating plummets to 30% while industrial demand grows to over 50%. Furthermore, by 2027 the top 8 sub-sectors account for 63.8% of total final energy demand. Consequently, these sectors are expected to account for 87-90% of the savings as more efficient technologies become available and are utilized. As a result of their energy savings potential, these sectors are the primary targets for energy saving investments.

SOUTH EAST EUROPE REGIONAL ENERGY MARKET SUPPORT (SEE REMS) PROJECT 61
Figure 3-1: Final Energy Saving by Subsector for the Region
0
50
100
150
200
250
300
350
400
450
2003
2006
2009
2012
2015
2018
2021
2024
2027
2003
2006
2009
2012
2015
2018
2021
2024
2027
2003
2006
2009
2012
2015
2018
2021
2024
2027
R90 R90E R90P
Peta
joul
es
AGR CC CFOD CH+W CL COTH CPLI CREF IC IF II IM
IO IP IR RC RDRY RDSH RFOD RH+W RLIT ROTH RREF TRN
The residential sector is affected particularly by policies to reduce overall energy consumption, with more efficient air conditioners and furnaces being installed in the R90P scenario. In the R90E scenario electric heating is reduced by 31%. Since the R90P scenario encourages even more action on the supply side, providing incentives to develop more efficient power plants, it achieves the greatest overall energy saving. As can be seen in the subsequent figure, 50% more electricity is saved in the R90P scenario compared to R90 alone, as the model seeks to reduce the energy intensity of the system.

62 SOUTH EAST EUROPE REGIONAL ENERGY MARKET SUPPORT (SEE REMS) PROJECT
Figure 3-2: Final Energy Savings from “EE” Policy by Demand Sector for the Region
0
50
100
150
200
250
300
350
400
450
2006
2009
2012
2015
2018
2021
2024
2027
2006
2009
2012
2015
2018
2021
2024
2027
2006
2009
2012
2015
2018
2021
2024
2027
R90 R90E R90P
Peta
joul
es
Agriculture Commercial Industrial Residential Transportation & Other
Figure 3-3: Total Electricity Saving from “EE” Policy for the Region
0
5000
10000
15000
20000
25000
30000
2003
2006
2009
2012
2015
2018
2021
2024
2027
2003
2006
2009
2012
2015
2018
2021
2024
2027
2003
2006
2009
2012
2015
2018
2021
2024
2027
R90 R90E R90P
Gig
awat
t H
our
s
The Electricity Generation mix shows an increased share coming from nuclear at the expense of coal-fired power plants. Promoting more efficient demand devices results in a 6% reduction in electricity use in 2027, while the forced 10% reduction in electricity use results in further reductions in coal-fired generation (mostly

SOUTH EAST EUROPE REGIONAL ENERGY MARKET SUPPORT (SEE REMS) PROJECT 63
coal retrofits). The improved energy intensity scenario (R90P) reaches the same 10% reduction in electricity generation, adding more biomass-fueled power plants in lieu of coal plants. However it should be noted that coal makes a comeback in all scenarios in the last two years of the planning horizon owing to improved coal plants becoming available; a total of 3.5GW of new capacity being added in Romania and Serbia. In particular, in 2024 there will be critical problems in the power sector in these two countries, as well as Croatia and Macedonia, as existing capacity is forced to retire if actions are not taken before then to insure adequate capacity. However, with increased efficiency the pressure on the power sector is mitigated somewhat, and the changes that will result from reductions in total demand are depicted in Figure 3-4, below.
Figure 3-4: Electricity Generation by Fuel Type for the Region
0
50000
100000
150000
200000
250000
300000
2003
2006
2009
2012
2015
2018
2021
2024
2027
2003
2006
2009
2012
2015
2018
2021
2024
2027
2003
2006
2009
2012
2015
2018
2021
2024
2027
2003
2006
2009
2012
2015
2018
2021
2024
2027
R0 R90 R90E R90P
Gig
awat
t H
ours
Nuclear power plants Coal-fired power plants Oil-fired power plants
Gas-fired power plants Hydroelectric power plants Renewable and Other power plants
Figure 3-5 shows the change in composition of the regional generation mix in 2027. Again, the drop in coal generation stands out. However there is also an uptick in renewables in the limited consumption scenario (R90P), as wind generation grows in Bulgaria, Romania and Serbia, and additional biomass plants are constructed in several countries. It should be noted however that at this stage of the analysis each country model is currently run in isolation. Therefore electricity imports and exports are “capped” at their current levels, unless the TWG saw a specific reason to include more imports into the scenarios. This analytical shortcoming can be addressed by linking the models to include regional electricity and gas trade between the countries, and outside the region.

64 SOUTH EAST EUROPE REGIONAL ENERGY MARKET SUPPORT (SEE REMS) PROJECT
Figure 3-5: 2027 Electricity Generation Mix by Fuel Type for the Region
0
50000
100000
150000
200000
250000
300000
R0 R90
R90E
R90P
Gig
awat
t H
our
s
Nuclear Coal-fired Oil-fired Gas-fired Hydroelectric Renewable and Other
The timing for major new power plant investments is shown in Figure 3-7. Demand will be higher for electric generating plants rather than coupled heat and power (CHP) and heating plants. Some of the new plants are already under construction and therefore reflected in the system expansion plans (e.g., a coal plant in UNMIK in 2012, and nuclear plants in Bulgaria and Romania in 2012, 2015, and 2018).The forecast reduction in total electricity consumption resulting from energy system efficiency improvements leads to a corresponding reduction in the investment requirements for new power plants13
13 Note that improvements in the transmission and distribution systems were not explicitly considered, though in some countries improved
collection rates were considered.
. For example, in the Reference scenario there is a call for substantial additional lignite-fired capacity in Serbia in the last four periods (1GW per period) as a result of rapid demand growth in the industrial sector (see Appendix 1, Section G for additional discussion). The demand for these plants, however, is cut in half when efficient technologies are deployed. Nevertheless if the demand for electricity is to be reduced by energy efficiency, energy efficiency policies must be enacted now to avoid the extremely high levels of electricity demand forecast for 10 years down the road.
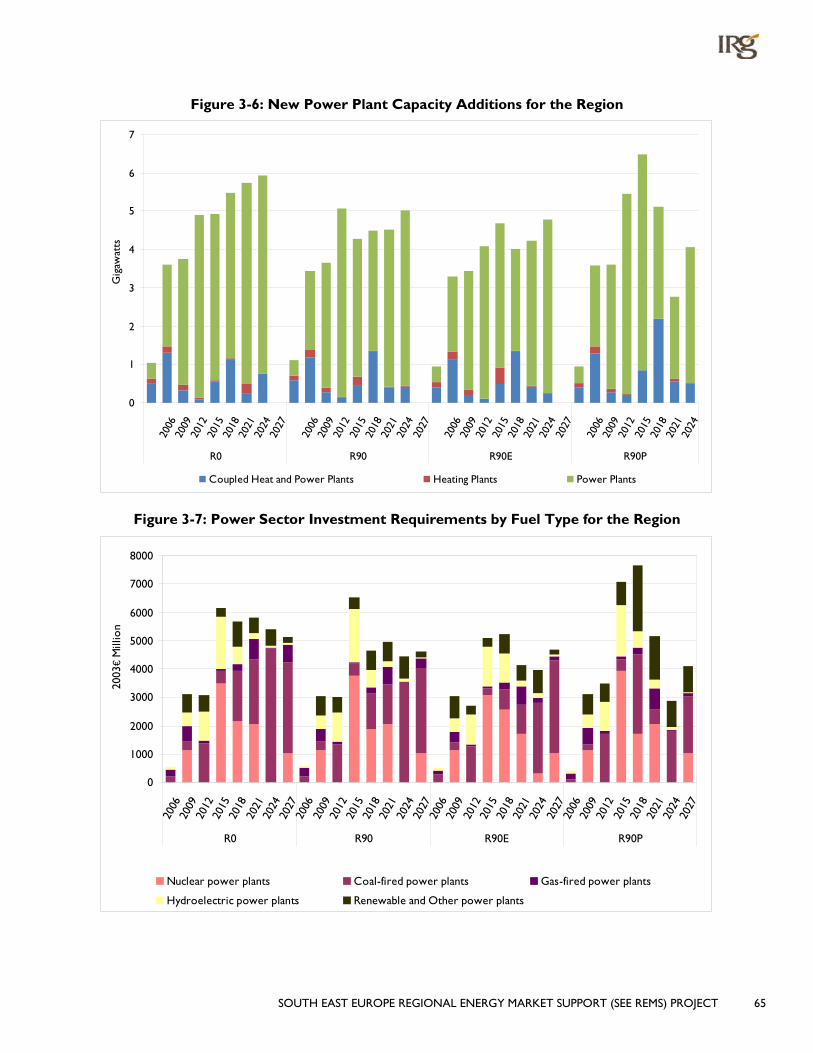
SOUTH EAST EUROPE REGIONAL ENERGY MARKET SUPPORT (SEE REMS) PROJECT 65
Figure 3-6: New Power Plant Capacity Additions for the Region
0
1
2
3
4
5
6
7
2006
2009
2012
2015
2018
2021
2024
2027
2006
2009
2012
2015
2018
2021
2024
2027
2006
2009
2012
2015
2018
2021
2024
2027
2006
2009
2012
2015
2018
2021
2024
R0 R90 R90E R90P
Gig
awat
ts
Coupled Heat and Power Plants Heating Plants Power Plants
Figure 3-7: Power Sector Investment Requirements by Fuel Type for the Region
0
1000
2000
3000
4000
5000
6000
7000
8000
2006
2009
2012
2015
2018
2021
2024
2027
2006
2009
2012
2015
2018
2021
2024
2027
2006
2009
2012
2015
2018
2021
2024
2027
2006
2009
2012
2015
2018
2021
2024
2027
R0 R90 R90E R90P
2003
€ M
illio
n
Nuclear power plants Coal-fired power plants Gas-fired power plants
Hydroelectric power plants Renewable and Other power plants

66 SOUTH EAST EUROPE REGIONAL ENERGY MARKET SUPPORT (SEE REMS) PROJECT
Primary Energy Savings, as measured by total supply for the 8 countries, decreases by 9%, 11%, and 18% respectively by 2027 compared with the Reference scenario, with a corresponding decrease in energy intensity. The main fuel shifts are a reduction in coal consumption, particularly in the R90P scenario, with the commissioning of additional nuclear capacity planned in Bulgaria and Romania. (See Figure 3-8.) The reduction in coal/lignite consumption results from retiring of older coal-fired generation plants as electricity demand falls owing to efficiency improvements in the overall system. Natural gas for industrial use nearly doubles owing to the significant growth projected for this sector. In general, the growing need for energy by the industrial sector shapes many of the countries’ energy profiles. Thus, while energy requirements for the power sector increase some 53%, 49%, 38, and 30%, industrial needs (including electricity) increase by 90%, 73%, 72%, and 65% over the planning horizon for each of the scenarios.
Figure 3-8: Total Primary Energy Supply for the Region
0
500
1000
1500
2000
2500
3000
3500
4000
4500
5000
2003
2006
2009
2012
2015
2018
2021
2024
2027
2003
2006
2009
2012
2015
2018
2021
2024
2027
2003
2006
2009
2012
2015
2018
2021
2024
2027
2003
2006
2009
2012
2015
2018
2021
2024
2027
R0 R90 R90E R90P
Peta
joul
es
Nuclear Coal Oil Natural Gas LPGHydroelectric Electricity Imports Biomass Other Renew
Figure 3-9 depicts the composition of the region’s energy supply in 2027 (and the dramatic reduction in total energy demand arising from the fall in coal, oil and gas consumption.) Figure 3-9 also shows some growth of renewable technologies (geothermal and wind) as pressure builds to improve overall efficiency, particularly in the R90P scenario.
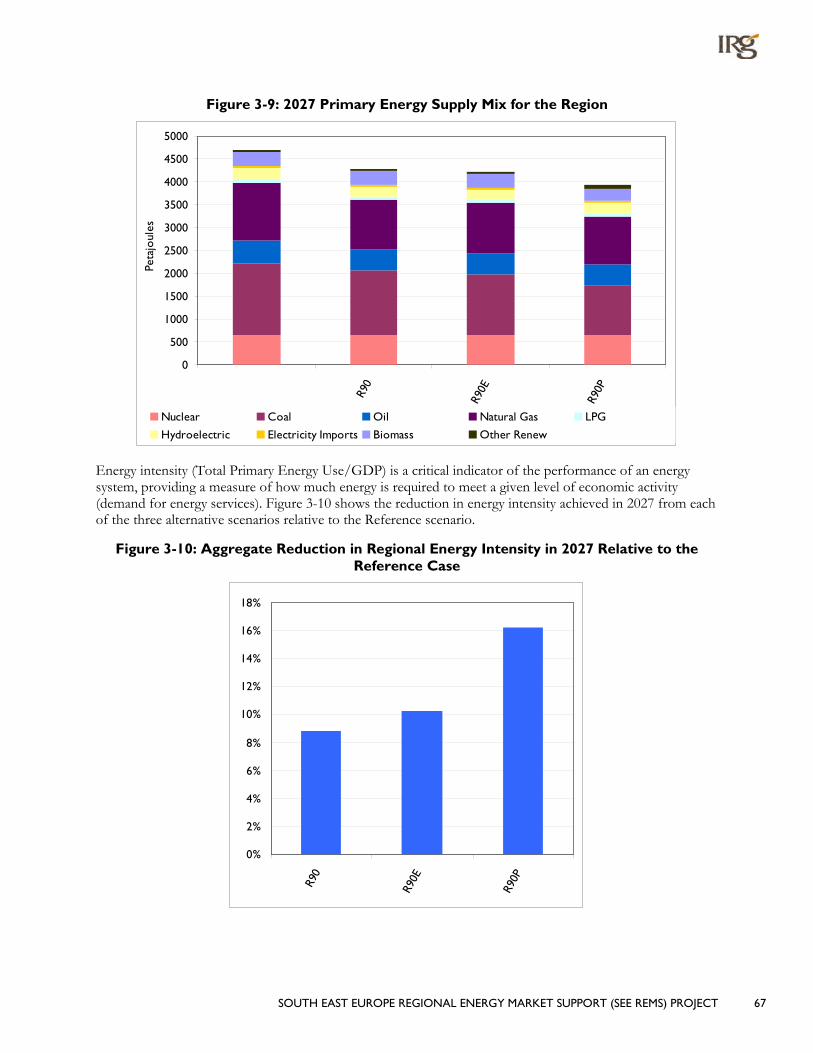
SOUTH EAST EUROPE REGIONAL ENERGY MARKET SUPPORT (SEE REMS) PROJECT 67
Figure 3-9: 2027 Primary Energy Supply Mix for the Region
0
500
1000
1500
2000
2500
3000
3500
4000
4500
5000
R90
R90E
R90P
Peta
joul
es
Nuclear Coal Oil Natural Gas LPG
Hydroelectric Electricity Imports Biomass Other Renew
Energy intensity (Total Primary Energy Use/GDP) is a critical indicator of the performance of an energy system, providing a measure of how much energy is required to meet a given level of economic activity (demand for energy services). Figure 3-10 shows the reduction in energy intensity achieved in 2027 from each of the three alternative scenarios relative to the Reference scenario.
Figure 3-10: Aggregate Reduction in Regional Energy Intensity in 2027 Relative to the Reference Case
0%
2%
4%
6%
8%
10%
12%
14%
16%
18%
R90
R90E
R90P

68 SOUTH EAST EUROPE REGIONAL ENERGY MARKET SUPPORT (SEE REMS) PROJECT
Energy security is enhanced through a more than 16% reduction in total energy imports by 2027 in all three scenarios. Coal imports fall the most as they become less financially attractive as the overall efficiency of the energy system improves. Total imports are shown in Figure 3-11, with the reduction by fuel type shown in Figure 3-12. The reduction in coal use is accompanied by falling natural gas imports owing to plummeting demand (15/17% respectively) in the industrial/commercial sectors. There is also a small drop in gas-fired electricity generation as the electricity systems become more efficient, requiring less electricity.
Figure 3-11: Level of Import for the Region
800
1,000
1,200
1,400
1,600
1,800
2,000
2003
2006
2009
2012
2015
2018
2021
2024
2027
Peta
joul
es
R0 R90 R90E R90P
Figure 3-12: Reduction of Imports by Fuel for the Region
-50
0
50
100
150
200
250
300
350
400
2006
2009
2012
2015
2018
2021
2024
2027
2003
2006
2009
2012
2015
2018
2021
2024
2027
2003
2006
2009
2012
2015
2018
2021
2024
2027
R90E R90E
Peta
joul
es
Nuclear Coal Oil Natural Gas LPG Electricity Biomass

SOUTH EAST EUROPE REGIONAL ENERGY MARKET SUPPORT (SEE REMS) PROJECT 69
The analysis of the Cost Implications concludes that substantial savings are realized in both the R90 and R90E scenarios. The R90 scenario results in an overall energy system cost savings of €6.06 billion over the 27-year planning horizon, while the R90E scenario saves €3.78 billion. The R90 scenario shows the most savings because it aims at an overall cost efficiency to reach the target. In the R90E case, a further reduction in final energy use must be achieved and to do so this the system must utilize more expensive end-use options such as natural gas instead of heat pumps. Note that the amount society saves in the R90/R90E scenarios can be earmarked for information campaigns, rebates, or subsidies. By definition, the R90P scenario has about the same energy system cost, since the level of energy consumption in each country was reduced until the system cost approached that of the Reference scenario. In terms of primary energy savings under the R90P scenario, a reduction in overall energy intensity of over 16% compared with the Reference scenario is achieved, while not exceeding the costs associated with simply continuing with current trends.
Figure 3-13: Aggregate Total Discounted System Cost for the Region
307
308
309
310
311
312
313
314
315
316
317
318
R0 R90
R90E
R90P
2003
€ B
illio
n
Figure 3-14 shows the breakdown in annual expenditures for each scenario relative to the Reference case according to the annualized investment in power plants, the annualized investments in new end-use devices, and the annual fuel expenditures. Figure 3-15 shows the change in these annual costs in 2027 relative to the Reference case.
• Annualized investment in power plants decreases 8% to 15%, effecting savings of €246 - 455 million in the R90 and R90E scenarios; while in the R90P it is about the same as the Reference scenario.
• Annualized investments for new demand devices increase significantly from 14% to 22% and up to 28% (€1.59, €2.56, €3.16 billion annually) in the R90/R90E/R90P respectively to achieve the improved efficiency goals. The bulk of the more efficient investments are focused on commercial cooling and lighting, the chemical and iron and steel industries, and residential heating.
• Fuel expenditures decrease significantly by 14%, 13%, and16% (€3.43/€3.36/€4.04 billion per year) in all three scenarios as the more efficient devices require less fuel relative. These reductions in overall system cost more than offset the increased expenditures on new, more efficient devices.
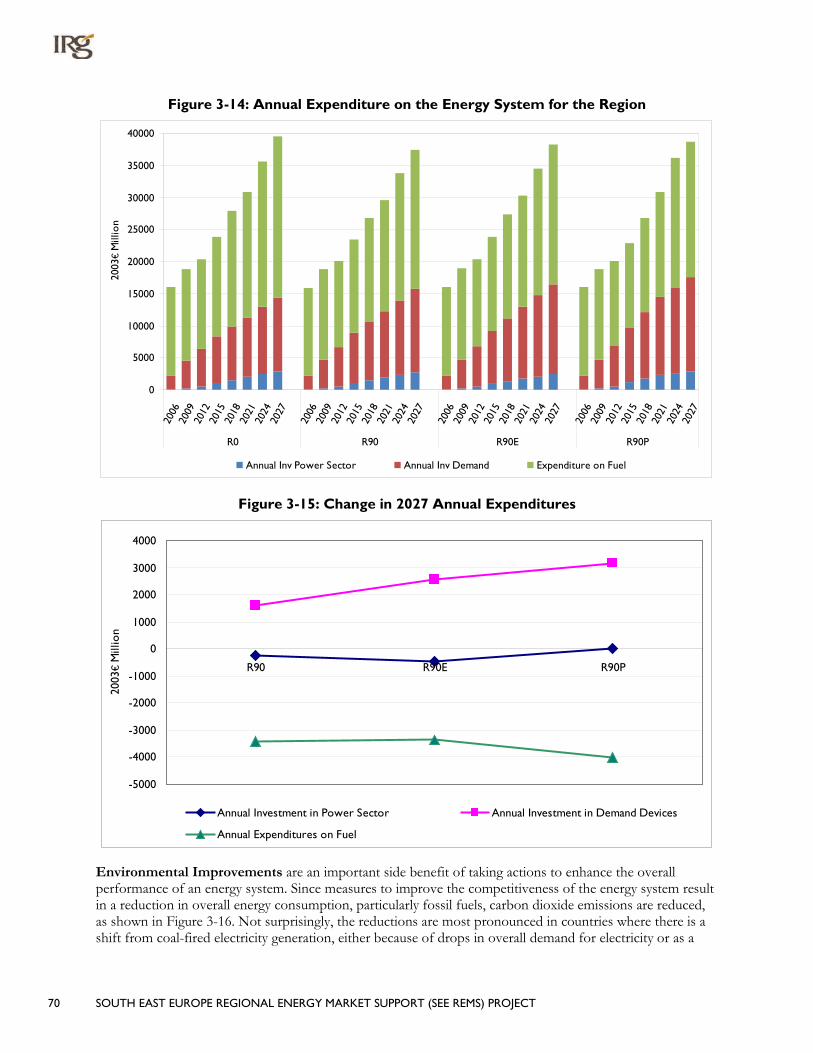
70 SOUTH EAST EUROPE REGIONAL ENERGY MARKET SUPPORT (SEE REMS) PROJECT
Figure 3-14: Annual Expenditure on the Energy System for the Region
0
5000
10000
15000
20000
25000
30000
35000
40000
2006
2009
2012
2015
2018
2021
2024
2027
2006
2009
2012
2015
2018
2021
2024
2027
2006
2009
2012
2015
2018
2021
2024
2027
2006
2009
2012
2015
2018
2021
2024
2027
R0 R90 R90E R90P
2003
€ M
illio
n
Annual Inv Power Sector Annual Inv Demand Expenditure on Fuel
Figure 3-15: Change in 2027 Annual Expenditures
-5000
-4000
-3000
-2000
-1000
0
1000
2000
3000
4000
R90 R90E R90P
2003
€ M
illio
n
Annual Investment in Power Sector Annual Investment in Demand Devices
Annual Expenditures on Fuel
Environmental Improvements are an important side benefit of taking actions to enhance the overall performance of an energy system. Since measures to improve the competitiveness of the energy system result in a reduction in overall energy consumption, particularly fossil fuels, carbon dioxide emissions are reduced, as shown in Figure 3-16. Not surprisingly, the reductions are most pronounced in countries where there is a shift from coal-fired electricity generation, either because of drops in overall demand for electricity or as a
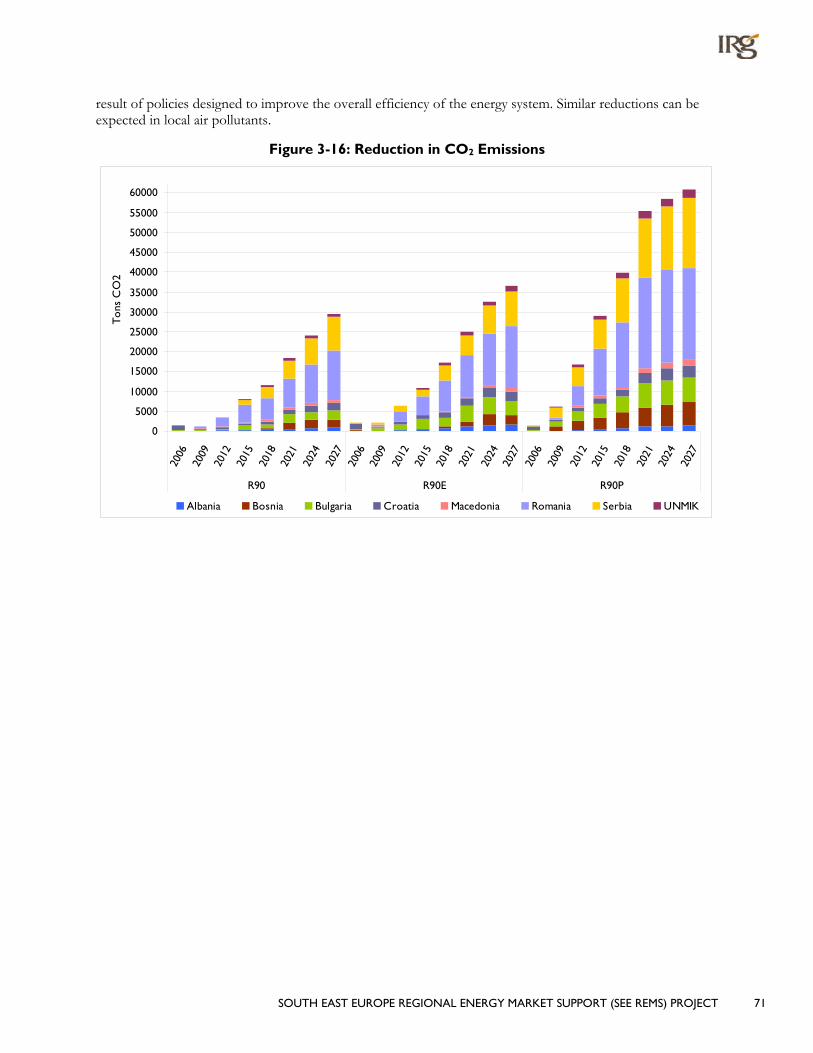
SOUTH EAST EUROPE REGIONAL ENERGY MARKET SUPPORT (SEE REMS) PROJECT 71
result of policies designed to improve the overall efficiency of the energy system. Similar reductions can be expected in local air pollutants.
Figure 3-16: Reduction in CO2 Emissions
0
5000
10000
15000
20000
25000
30000
35000
40000
45000
50000
55000
60000
2006
2009
2012
2015
2018
2021
2024
2027
2006
2009
2012
2015
2018
2021
2024
2027
2006
2009
2012
2015
2018
2021
2024
2027
R90 R90E R90P
To
ns C
O2
Albania Bosnia Bulgaria Croatia Macedonia Romania Serbia UNMIK
72 SOUTH EAST EUROPE REGIONAL ENERGY MARKET SUPPORT (SEE REMS) PROJECT
APPENDIX 1: INDIVIDUAL COUNTRY RESULTS
After significant time and effort by the TWG representatives country models are complete enough to conduct scenario analyses that examine key energy issues and policies that can shape the evolution of their energy systems. This Appendix presents the details of each country’s Reference (current situation) scenario and the results of the analyses performed. Each team established their Reference scenario and ran their models for the three scenarios discussed in previously and summarized below.
Scenario Description
R0: Reference Scenario The presumed evolution of the energy system.
R90: Promoting Energy Efficiency Increase access to energy efficient demand technologies.
R90E: Reducing Electricity Consumption Impose a requirement of a 10% reduction -- from Reference scenario – in electricity consumption.
R90P: Reducing Energy Intensity Reduction of the overall energy intensity by forcing reductions in total energy consumption to the level possible at the same energy system cost as the Reference scenario.
In addition, the TWG was encouraged to conduct one or two additional scenario assessments to examine issues of particular interest to their system (e.g., increased renewables, the possible role of nuclear).
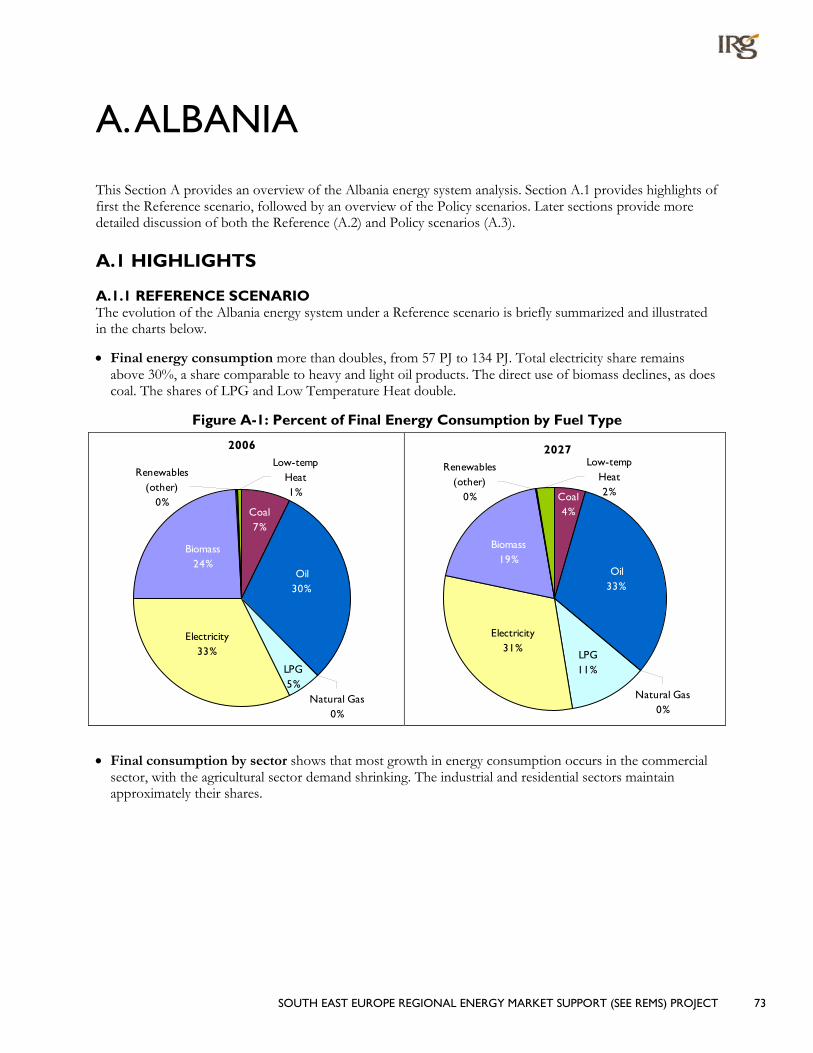
SOUTH EAST EUROPE REGIONAL ENERGY MARKET SUPPORT (SEE REMS) PROJECT 73
A. ALBANIA
This Section A provides an overview of the Albania energy system analysis. Section A.1 provides highlights of first the Reference scenario, followed by an overview of the Policy scenarios. Later sections provide more detailed discussion of both the Reference (A.2) and Policy scenarios (A.3).
A.1 HIGHLIGHTS
A.1.1 REFERENCE SCENARIO The evolution of the Albania energy system under a Reference scenario is briefly summarized and illustrated in the charts below.
• Final energy consumption more than doubles, from 57 PJ to 134 PJ. Total electricity share remains above 30%, a share comparable to heavy and light oil products. The direct use of biomass declines, as does coal. The shares of LPG and Low Temperature Heat double.
Figure A-1: Percent of Final Energy Consumption by Fuel Type
2006
Renewables (other)
0%
Natural Gas0%
LPG5%
Coal7%
Electricity33%
Oil30%
Biomass24%
Low-temp Heat1%
2027
Natural Gas0%
Low-temp Heat2%
Renewables (other)
0% Coal4%
Biomass19%
Electricity31%
LPG11%
Oil33%
• Final consumption by sector shows that most growth in energy consumption occurs in the commercial sector, with the agricultural sector demand shrinking. The industrial and residential sectors maintain approximately their shares.

74 SOUTH EAST EUROPE REGIONAL ENERGY MARKET SUPPORT (SEE REMS) PROJECT
Figure A-2: Percent of Final Energy Consumption by Sector
2006
Agriculture19%
Residential37%
Industrial26%
Commercial18%
2027
Agriculture13%
Residential38%
Industrial26%
Commercial23%
• Electric Generation increases from 6.8 to 12.8 TWh by 2027, a 190% increase. By 2027,
– 53% is produced by traditional hydro;
– 44% is generated by oil fired power plants; and
– 3% is produced by new renewables power plants (which includes SHPPs and Wind PPs).
Figure A-3: Percent Electricity Generation by Fuel Type
2006
Import29%
Hydro70%
Oil-fired1%
Gas-fired0%
Other renew.
0%
2027
Import0%
Gas-fired0%
Hydro53%
Oil-fired44%
Other renew.
3%
• Energy Supply increases by 155% from 2006 to 2027, from 64 PJ to 156 PJ.
– Oil products provide most of the increase; and
– Coal and biomass each increase by a couple of PJ.

SOUTH EAST EUROPE REGIONAL ENERGY MARKET SUPPORT (SEE REMS) PROJECT 75
Figure A-4: Percent of Total Energy Supply
2006
Natural Gas0%
LPG4%
Coal7%
Biomass22%
Oil29%
Electricity38%
2027
Natural Gas0%
Coal4%
LPG10%
Biomass16%
Electricity16%
Oil54%
• Fuel expenditures increase to €1300 million per year by 2027, almost three times higher than 2006, and dominate the energy system cost.
• Annualized investments in power plants and demand devices reach almost €1 billion in 2027, with investment in demand devices absorbing 3 times the investment in power plants.
A.1.2 POLICY SCENARIOS Providing increased access to energy efficient demand technologies (scenario R90), and further promoting their uptake by means of policies aimed at reducing electricity consumption (-10% by 2027, scenario R90E) or reducing energy intensity (total consumption / GDP, -10% by 2027, scenario R90P) result in various changes to the evolution of the energy system. In general, the three scenarios represent progressively more demanding changes in the energy system, as their relative results illustrate.
• Final energy consumption is reduced by 8% when new, more efficient technologies are promoted and 10/11% with additional uptake policies. In 2027 the use of oil products decreases by nearly 20%, biomass by 10%, and other fuels remain virtually constant.
• Electricity generation shows less change. Promoting more efficient demand devices only results in 2% reduction in electricity use, while the forced reduction case results in a decrease in oil-fired generation.
• Energy imports in 2027 reduce their weight over Total Primary Energy Supply (TPES) from 63% in the Reference scenario to 58% in the more constrained scenario, resulting in improved energy security.
• Primary energy use in the country decreases by 7/12/10% by 2027, with a corresponding improvement in energy intensity, where the main fuel shift is a reduction in oil consumption, particularly in the R90E scenario.

76 SOUTH EAST EUROPE REGIONAL ENERGY MARKET SUPPORT (SEE REMS) PROJECT
Figure A-5: 2027 Total Energy Supply
0
20
40
60
80
100
120
140
160
180
R0 R90
R90E
R90P
Peta
joul
es
Coal Oil Natural Gas LPG Electricity Biomass
Figure A-6: 2027 Electricity Generation Mix by Fuel
0
2
4
6
8
10
12
14
R0 R90
R90E
R90P
Ter
awat
t H
our
s
Oil-fired Gas-fired Hydro Import Other renew.
• Making more efficient technologies available, in particular to the final users (R90 scenario), results in an overall energy system cost savings of almost €170 million over the 27 year modeling horizon. Further compression of electric or total energy consumption are possible, but to a lower degree and at relatively high additional costs (almost €300 million in the R90E scenario and €140 million in the R90P scenario).

SOUTH EAST EUROPE REGIONAL ENERGY MARKET SUPPORT (SEE REMS) PROJECT 77
• Relative to the Reference case, the three scenario runs show the following changes in costs:
– Annualized investment in power plants remains almost constant across scenarios, because the system achieves higher efficiency by using more electric demand devices in substitution for oil fired devices.
– In 2027 annualized investments for new demand devices increase by around 10% when new, more efficient technologies are promoted (equivalent to about €100 million annually in the E90 scenario) and three times as much when additional uptake policies are adopted to achieve the policy goals (scenario E90E).
– Annual fuel expenditures decrease by equivalent amounts of about €130 and €240 million per year by 2027 in the same scenarios, since the more efficient devices require less fuel. These savings offset, or partially offset, the increased expenditures on new, more efficient devices.
Figure A-7: 2027 Final Energy Consumption
0
20
40
60
80
100
120
140
160
R0 R90
R90E
R90P
Peta
joul
es
Coal Oil Natural Gas LPG Electricity Biomass Renewables (other) Low-temp Heat

78 SOUTH EAST EUROPE REGIONAL ENERGY MARKET SUPPORT (SEE REMS) PROJECT
Figure A-8: Aggregate Total Discounted System Cost
11650
11700
11750
11800
11850
11900
11950
12000
12050
12100
R0 R90
R90E
R90P
2003
M E
uro
Figure A-9: Change in 2027 Annual Expenditures
-300
-200
-100
0
100
200
300
400
R90 R90E R90P
2003
Annual Inv Power Sector Annual Inv Demand Expenditure on Fuel
A.2 ENERGY SYSTEM UNDER A REFERENCE SCENARIO
A.2.1 CRITICAL DRIVING ASSUMPTIONS The relationship between the country’s demographic projections, domestic and sectoral economic development, and energy demand is based on the National Strategy for the Economic and Social Development. It is assumed that the population continues to grow through the modeling period; the growth rate decreases, first slowly till 2018, then more consistently [see Figure A-10]. The number of household is assumed to increase steadily and the household size decreases [see Figure A-11]. Falling population growth rates and declines in household sizes are consistent with global trends for developing economies.

SOUTH EAST EUROPE REGIONAL ENERGY MARKET SUPPORT (SEE REMS) PROJECT 79
Figure A-10: Trend of Population and its Growth Rate
0.0
0.5
1.0
1.5
2.0
2.5
3.0
3.5
4.0
4.5
2003
2006
2009
2012
2015
2018
2021
2024
2027
Mill
ion
0.0%
0.2%
0.4%
0.6%
0.8%
1.0%
1.2%
Perc
ent
Population Population growth
Figure A-11: Trend of Households and Number of Persons per Household
0
200
400
600
800
1000
1200
1400
2003
2006
2009
2012
2015
2018
2021
2024
2027
Tho
usan
d H
ous
eho
lds
0.0
0.5
1.0
1.5
2.0
2.5
3.0
3.5
4.0
4.5
Pers
ons
per
hou
seho
ld
Total number of households Persons per household
The GDP growth rate is projected to remain almost 5 percent per year across the Reference scenario time horizon. Agriculture continues to provide the main contribution to total GDP, although the expected rapid growth of the service sector will lead to an equivalent contribution by the end of the forecast period. Industry’s contribution also increases at a rapid pace, although from a smaller base.

80 SOUTH EAST EUROPE REGIONAL ENERGY MARKET SUPPORT (SEE REMS) PROJECT
Figure A-12: Projection of Total GDP and its Growth Rate
0.0
1.0
2.0
3.0
4.0
5.0
6.0
7.0
8.0
9.0
10.0
2003
2006
2009
2012
2015
2018
2021
2024
2027
2003
€ B
illio
n
4.4%
4.6%
4.8%
5.0%
5.2%
5.4%
5.6%
5.8%
6.0%
Perc
ent
GDP GDP growth
Figure A-13: Sectoral Contributions to GDP
A.2.2 ENERGY SERVICE DEMAND PROJECTIONS As discussed in Section 2, the requirements of the future energy system are driven primarily by the demand for energy services over time. These are derived by establishing the relationship between the fundamental drivers, and their relationship via elasticities to the individual demands. Contrary to most other countries, the elasticities adopted for Albania are greater than 1.0. In fact, after some years of transition, from which the economy is recovering only in the most recent years, per capita energy consumption in Albania is two to three times lower than all other countries in the region. In fact, presently part of the energy demand expressed by the country cannot be met by the supply; according to domestic sources, the unmet demand for electricity is estimated at about 20%, equivalent to more than one TWh. Elasticities and other input parameters have been further adjusted and fine-tuned in order to match MARKAL results with the National Strategy of Energy and other studies carried out by different donors.
The aggregate view of the demand composition is shown in Figure A-14, and each sector is discussed briefly in the sections that follow.

SOUTH EAST EUROPE REGIONAL ENERGY MARKET SUPPORT (SEE REMS) PROJECT 81
• Agricultural sector grows in absolute value, but it is reduced in relative value;
• Commercial sector increases from 18% to 22%;
• Industrial sector increases in absolute value, but remains almost constant in relative value; and
• Residential sector increases in absolute value and shows a very slight increase in relative values from 25% to 38%.
Figure A-14: Projection of Energy Service Demand from Each Sector (Useful Energy)
0
20
40
60
80
100
120
140
2003
2006
2009
2012
2015
2018
2021
2024
2027
Peta
joul
es
Agriculture Commercial Industrial Residential
A.2.2.1 RESIDENTIAL SECTOR The main driving factors for calculation of energy demand in the residential sector are growth in the number of households [see Figure A-11] and the evolution of residential sector from apartments towards more urban single family dwellings [see Figure A-15].

82 SOUTH EAST EUROPE REGIONAL ENERGY MARKET SUPPORT (SEE REMS) PROJECT
Figure A-15: Composition of Residential Dwellings over Time
0%10%20%30%40%50%60%70%80%90%
100%
2003
2006
2009
2012
2015
2018
2021
2024
2027
Apartments - Urban Single House - Urban - CentralSingle House - Urban - Local Single House - Rural - Local
Figure A-16: Residential Demand for Energy Services (Useful Energy)
0
10
20
30
40
50
60
2003
2006
2009
2012
2015
2018
2021
2024
2027
Peta
joul
es
Space Heating Water Heating Space Cooling Cooking LightningOther Electricity Dish Washing Fridges & Freezers Cloth Washing Cloth Drying
The residential sector is most significant throughout the modeling horizon. Figure A-16 shows how demand in the residential sector is expected to rapidly increase. Since the Reference scenario assumes that measures to increase efficiency are not pursued, energy demand in the residential sector in the year 2027 is expected to be three times higher than that of 2003. Observing that, on average, only one-third of the living space is heated, much less is cooled, and the per capita consumption of warm water is much lower than EU standards, the projections are consistent with very low starting levels, expected GDP growth and increased living standards.
A.2.2.2 COMMERCIAL SECTOR The commercial stock, like residential, presently is not heated and cooled properly; the supply of other energy services is insufficient as well. Based on various energy surveys conducted by ex-National Agency of Energy, actually only 30% of commercial stock is heated and cooled, and only for part of the year. The demand for energy services is projected to 2027 assuming that over time the entire stock is fully served. Under this assumption, the useful energy demand for the commercial building stock almost quadruples as compared the Reference scenario over the time horizon.

SOUTH EAST EUROPE REGIONAL ENERGY MARKET SUPPORT (SEE REMS) PROJECT 83
Figure A-17: Commercial Demand for Energy Services (Useful Energy)
0
5
10
15
20
25
30
35
2003
2006
2009
2012
2015
2018
2021
2024
2027
Peta
joul
es
Space Heating Hot Water Space cooling CookingLightning Other Electricity Public Lighting Fridges and Freezers
A.2.2.3 INDUSTRIAL SECTOR The industrial sector is represented in the model by seven sub-sectors: Chemical industry; Iron and steel industry; Food industry; Non-ferrous metals industry; Non-metallic minerals industry; Other manufacturing industry; and Pulp and paper industry. The driving factor in projecting energy demand of the industrial sector is the estimated contribution to GDP from the various industries, as reflected in Figure A-18, and the relationship between future GDP growth and the sector’s growth.
The statistics of the last 10-15 years show a considerable decline of the importance of heavy industry. However, several industrial and commercial products, such as ferrochromium, bricks, tiles, lime production, meat and milk by-products, and leather are playing an important role in the economy. From the standpoint of useful energy use, industry continues to have very high energy intensities for each production unit. While the share of useful energy demand in industry remains at about one-fourth, industrial demand increases substantially across the time horizon. According to the Reference scenario, energy demand for industry is projected to nearly triple by 2027 compared to 2003. Figure A-19 indicates that food and non-metallic minerals sectors are projected to remain the most important energy consumers, demanding about one fourth of the industrial energy each.

84 SOUTH EAST EUROPE REGIONAL ENERGY MARKET SUPPORT (SEE REMS) PROJECT
Figure A-18: Present Contribution of Industrial Sub-Sectors to GDP (MEURO - 2003)
Figure A-19: Projections of the Industrial GDP (€2003 million) in 2027
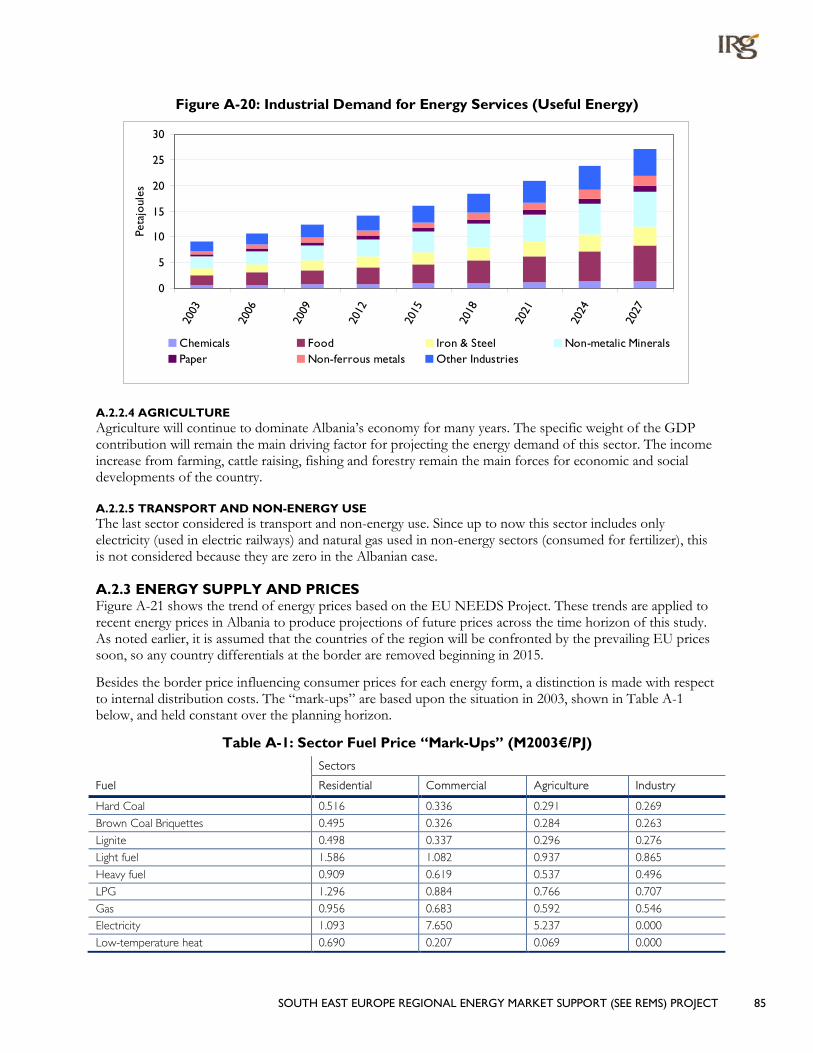
SOUTH EAST EUROPE REGIONAL ENERGY MARKET SUPPORT (SEE REMS) PROJECT 85
Figure A-20: Industrial Demand for Energy Services (Useful Energy)
0
5
10
15
20
25
30
2003
2006
2009
2012
2015
2018
2021
2024
2027
Peta
joul
es
Chemicals Food Iron & Steel Non-metalic MineralsPaper Non-ferrous metals Other Industries
A.2.2.4 AGRICULTURE Agriculture will continue to dominate Albania’s economy for many years. The specific weight of the GDP contribution will remain the main driving factor for projecting the energy demand of this sector. The income increase from farming, cattle raising, fishing and forestry remain the main forces for economic and social developments of the country.
A.2.2.5 TRANSPORT AND NON-ENERGY USE The last sector considered is transport and non-energy use. Since up to now this sector includes only electricity (used in electric railways) and natural gas used in non-energy sectors (consumed for fertilizer), this is not considered because they are zero in the Albanian case.
A.2.3 ENERGY SUPPLY AND PRICES Figure A-21 shows the trend of energy prices based on the EU NEEDS Project. These trends are applied to recent energy prices in Albania to produce projections of future prices across the time horizon of this study. As noted earlier, it is assumed that the countries of the region will be confronted by the prevailing EU prices soon, so any country differentials at the border are removed beginning in 2015.
Besides the border price influencing consumer prices for each energy form, a distinction is made with respect to internal distribution costs. The “mark-ups” are based upon the situation in 2003, shown in Table A-1 below, and held constant over the planning horizon.
Table A-1: Sector Fuel Price “Mark-Ups” (M2003€/PJ)
Fuel
Sectors
Residential Commercial Agriculture Industry
Hard Coal 0.516 0.336 0.291 0.269 Brown Coal Briquettes 0.495 0.326 0.284 0.263 Lignite 0.498 0.337 0.296 0.276 Light fuel 1.586 1.082 0.937 0.865 Heavy fuel 0.909 0.619 0.537 0.496 LPG 1.296 0.884 0.766 0.707 Gas 0.956 0.683 0.592 0.546 Electricity 1.093 7.650 5.237 0.000 Low-temperature heat 0.690 0.207 0.069 0.000

86 SOUTH EAST EUROPE REGIONAL ENERGY MARKET SUPPORT (SEE REMS) PROJECT
Figure A-21: Energy Prices Based on the EU NEEDS Project
0.000
20.000
40.000
60.000
80.000
100.000
120.000
2003 2006 2009 2012 2015 2018 2021 2024 2027
Euro
/GJ
LWR Fabricated FuelNatural GasNon energy useFeedstockNaphtaother oil productsKeroseneGasolineLPGLight Distilate OilHeavy Distillate OilCrudeLignite
Biomass can be classified in four major categories in Albania: woods or wood residues from various wood processing industries; vegetation residues (stems, seeds etc.) which are not used in other economic sectors after completion of their production cycle; energetic plants (woods) cultivated to be burned as biomass, and animal residues (bones, skins, manure), which are not used in other economic sectors. Data on forest resources are based on inventories done every 10 years by the Forestry Directorate subordinated to the Ministry of Agriculture. Total forecasted biomass resources are calculated of 25 PJ/year. In all scenarios contribution of biomass is internal production and a limit for biomass is imposed in the model (see Table A-1).
Coal is one of Albania’s largest energy sources and is spread in four main basins, but most of the mines have been closed for ten years. The remaining coal industry is currently faced with various problems relating to lack of financial resources means for updating the outdated technology, mineral transportation and competition from imported coal. In general, domestic coal basins have coal with low net calorific value and the thin mineral layer causes a higher cost per energy unit than imported coal. Coal contribution in the Albanian energy market has declined due to the following reasons:
• Coal extraction technology is very old;
• Domestic resources are lignite with low calorific values, high sulfur content, humidity and ashes;
• Indigenous coal is extracted from 200m depth, with a thin layer of 70–100cm; and
• Extraction and enrichment costs are very high.
In all scenarios, coal’s contribution is largely imported coal and there is no limit imposed on imported coal.
Oil reserves in Albania, despite predomination of old technologies for oil exploitation, remain relatively high and could be extracted by applying enhanced oil recovery.
The domestic gas production capacities are in their minimal limits, due to diminishing reserves and decline of the initial pressure in oil resources; accordingly gas production is limited to a level of 0.05 PJ/year. European gas networks are planned for the future, such that based upon possible import routes imported natural gas may reach 9.74 PJ/year.

SOUTH EAST EUROPE REGIONAL ENERGY MARKET SUPPORT (SEE REMS) PROJECT 87
Albania has substantial hydropower potential, of which only 35% is currently being exploited. Installed hydropower capacity as of 2007 is 1446 MW. Average output from hydropower is 4162 GWh. The model assumption limits up to 400 MW new HPPs and also 180 MW new SHPPs.
There are no geothermal resources which can be used for power production, but there may be small sources that can be drawn on for local heating needs.
Table A-2: Upper Limits on Domestic Resource Supply (PJ) (PJ) 2003 - 2027 2003-2006 2009-2027
Import of Electricity 10.35 12.00 15.00
Production of Natural Gas 0.03 0.04 0.05
Import of Natural Gas 9.74 9.74 9.74
Production of Biomass 10.70 9.91 10.95
Production of Lignite Coal 1.14 1.07 1.16
Production of LPG 0.00 0.00 0.00
Production of Heavy Fuel Oil 2.40 2.64 2.85
Production of Distillate 2.03 2.30 2.57
Production of Gasoline 0.08 0.10 0.11
Big Hydro utilization limits (MW) 1450/old+400/new 1450/old+0/new 1450/old+400/new
Small and Medium Hydro utilization limits (MW) 14/old+180/new 1450/old+0/new 1450/old+180/new
Centralized Wind Energy utilization limits (MW) 0/old+0/new 0/old+0/new 0/old+100/new
Decentralized Wind Energy utilization limits (MW) 0/old+0/new 0/old+0/new 0/old+150/new
A.2.4 REFERENCE SCENARIO OUTLINE The previous sections provided insight into the basic assumptions that shape the expected demand for energy services. But it is left up to the model to develop a depiction of the energy system under business-as-usual conditions to determine the future demand for final energy (e.g., electricity, heat, natural gas), the power sector generation mix, and the assortment of technologies that are deployed over the planning horizon. This least-cost configuration of the energy system, within the limits of the constraints imposed (e.g., resource limits, rates of fuel switching, availability of advanced efficient devices), serves as the Reference scenario against which the alternate scenario analysis is compared. In this section the Reference scenario is described.
A.2.4.1 FINAL ENERGY CONSUMPTION Final energy consumption increases time consistent with the GDP growth and a path towards approaching EU standards. Final energy consumption in each sector of the country increases [see Figures A-22-23].

88 SOUTH EAST EUROPE REGIONAL ENERGY MARKET SUPPORT (SEE REMS) PROJECT
Figure A-22: Final Energy Consumption by Sector
0
20
40
60
80
100
120
140
160
2003
2006
2009
2012
2015
2018
2021
2024
2027
Peta
joul
es
Agriculture Commercial Industrial Residential
Figure A-23: Final Energy Consumption by Sector (Share)
0%
20%
40%
60%
80%
100%
2003
2006
2009
2012
2015
2018
2021
2024
2027
Agriculture Commercial Industrial Residential

SOUTH EAST EUROPE REGIONAL ENERGY MARKET SUPPORT (SEE REMS) PROJECT 89
Figure A-24: Final Energy Consumption by Fuel
0
20
40
60
80
100
120
140
160
2003
2006
2009
2012
2015
2018
2021
2024
2027
Peta
joul
es
Coal Oil Natural Gas LPGElectricity Biomass Renewables (other) Low-temp Heat
The residential sector consumes the largest amount of energy currently and over the time horizon. The commercial sector is expected to grow faster than the other sectors and increase its share from 17% in 2003 to 23% in 2027. The industrial sector is expected to maintain its share of about one-fourth. The agriculture sector’s share is expected to diminish from 20% to 13%. Figure A-24 depicts share of final energy consumption by sector.
In terms of fuels, electricity continues to dominate with a growth of 130% and the share remains above 30%; in absolute terms the increase is 23 PJ (about 6.4 TWh). The direct use of oil products increases even more to reach 58 PJ, a share of 43% in 2027. The use of biomass remains important. The direct use of coal is low, only 5 PJ in 2027. Low temperature heat, which is now negligible, is expected to reach 3 PJ in 2027.
A.2.4.1.1 Residential Sector Final energy consumption of the residential sector is expected to almost triple and reach 51 PJ in 2027 [see Figure A-25].
In absolute terms electricity consumption is expected to double, although its share could decline from 63% to 44%. The largest growth is expected in the use of oil products, mainly LPG, to reach one-fourth of the market. Electricity and oil products are increasingly used owing to the relative efficiency of demand devices currently on the market. Cheap biomass maintains its share. Low temperature heat and solar energy appear on the market in the Reference scenario, but with very low shares, with absolute values not exceeding 1 PJ in 2027.
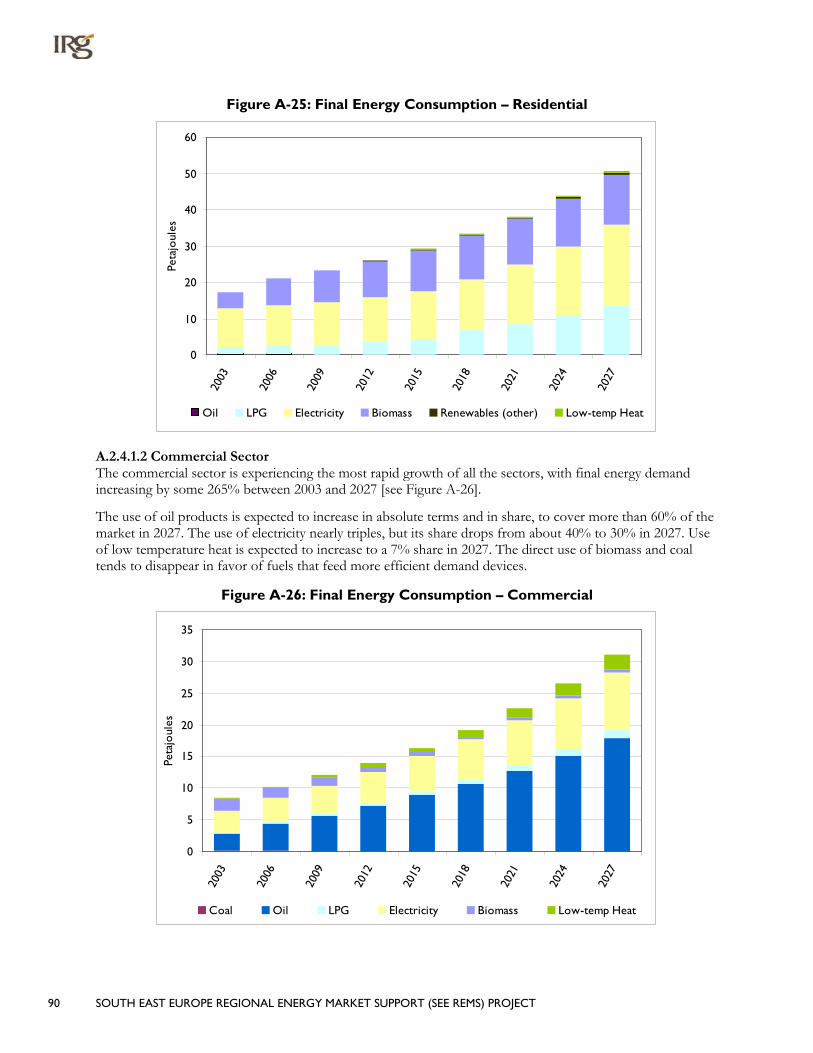
90 SOUTH EAST EUROPE REGIONAL ENERGY MARKET SUPPORT (SEE REMS) PROJECT
Figure A-25: Final Energy Consumption – Residential
0
10
20
30
40
50
60
2003
2006
2009
2012
2015
2018
2021
2024
2027
Peta
joul
es
Oil LPG Electricity Biomass Renewables (other) Low-temp Heat
A.2.4.1.2 Commercial Sector The commercial sector is experiencing the most rapid growth of all the sectors, with final energy demand increasing by some 265% between 2003 and 2027 [see Figure A-26].
The use of oil products is expected to increase in absolute terms and in share, to cover more than 60% of the market in 2027. The use of electricity nearly triples, but its share drops from about 40% to 30% in 2027. Use of low temperature heat is expected to increase to a 7% share in 2027. The direct use of biomass and coal tends to disappear in favor of fuels that feed more efficient demand devices.
Figure A-26: Final Energy Consumption – Commercial
0
5
10
15
20
25
30
35
2003
2006
2009
2012
2015
2018
2021
2024
2027
Peta
joul
es
Coal Oil LPG Electricity Biomass Low-temp Heat

SOUTH EAST EUROPE REGIONAL ENERGY MARKET SUPPORT (SEE REMS) PROJECT 91
A.2.4.1.3 Industrial Sector In the Reference scenario energy demand for industry is projected to increase 170% by 2027. The evolution of the fuel mix for industry is shown in Figure A-27.
The use of oil products remains predominant in absolute and relative terms, reaching 35% of the fuel demand in 2027. The same happens to electricity, which is expected to reach a 27% share, due among others to the increased automation. Coal’s share is reduced from 29% to 16% in 2027, and the share of fuelwood does not increase: both giving way to more efficient fuels and devices.
Figure A-27: Final Energy Consumption – Industry
0
5
10
15
20
25
30
35
40
2003
2006
2009
2012
2015
2018
2021
2024
2027
Peta
joul
es
Coal Oil Electricity Biomass Low-temp Heat
A.2.4.1.4 Agriculture Sector Figure A-28 shows the evolution of the principal fuels used in the agricultural sector for the Reference scenario. Diesel consumption is increases considerably and maintain a 75% share, in order to support agricultural production growth while alleviating manual labor and supporting mechanization. It is interesting to see that new efficient technologies replace outdated technologies even in Reference scenario.
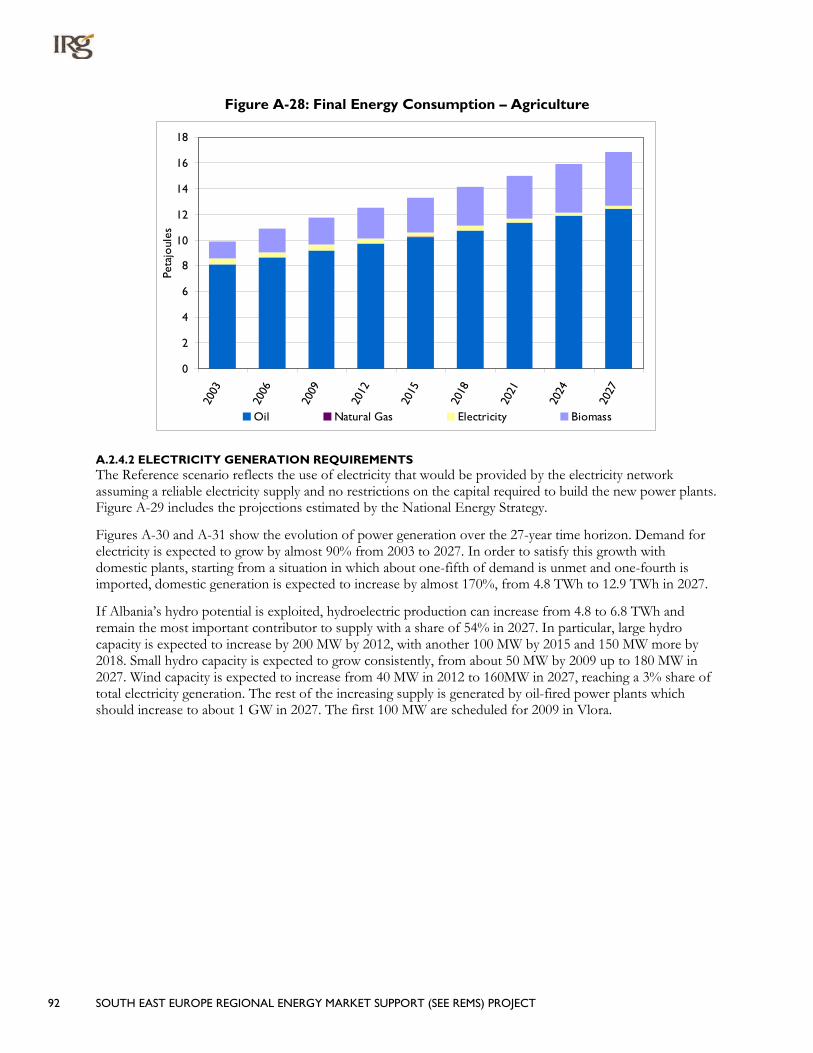
92 SOUTH EAST EUROPE REGIONAL ENERGY MARKET SUPPORT (SEE REMS) PROJECT
Figure A-28: Final Energy Consumption – Agriculture
0
2
4
6
8
10
12
14
16
18
2003
2006
2009
2012
2015
2018
2021
2024
2027
Peta
joul
es
Oil Natural Gas Electricity Biomass
A.2.4.2 ELECTRICITY GENERATION REQUIREMENTS The Reference scenario reflects the use of electricity that would be provided by the electricity network assuming a reliable electricity supply and no restrictions on the capital required to build the new power plants. Figure A-29 includes the projections estimated by the National Energy Strategy.
Figures A-30 and A-31 show the evolution of power generation over the 27-year time horizon. Demand for electricity is expected to grow by almost 90% from 2003 to 2027. In order to satisfy this growth with domestic plants, starting from a situation in which about one-fifth of demand is unmet and one-fourth is imported, domestic generation is expected to increase by almost 170%, from 4.8 TWh to 12.9 TWh in 2027.
If Albania’s hydro potential is exploited, hydroelectric production can increase from 4.8 to 6.8 TWh and remain the most important contributor to supply with a share of 54% in 2027. In particular, large hydro capacity is expected to increase by 200 MW by 2012, with another 100 MW by 2015 and 150 MW more by 2018. Small hydro capacity is expected to grow consistently, from about 50 MW by 2009 up to 180 MW in 2027. Wind capacity is expected to increase from 40 MW in 2012 to 160MW in 2027, reaching a 3% share of total electricity generation. The rest of the increasing supply is generated by oil-fired power plants which should increase to about 1 GW in 2027. The first 100 MW are scheduled for 2009 in Vlora.
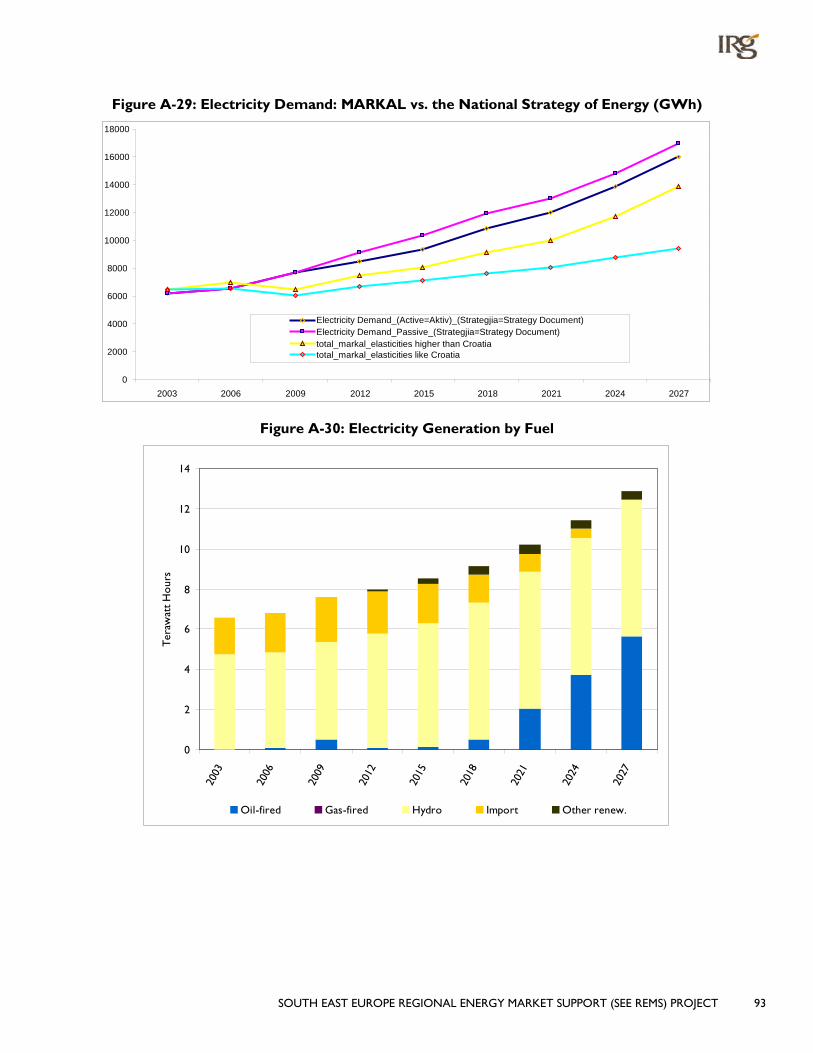
SOUTH EAST EUROPE REGIONAL ENERGY MARKET SUPPORT (SEE REMS) PROJECT 93
Figure A-29: Electricity Demand: MARKAL vs. the National Strategy of Energy (GWh)
0
2000
4000
6000
8000
10000
12000
14000
16000
18000
2003 2006 2009 2012 2015 2018 2021 2024 2027
Electricity Demand_(Active=Aktiv)_(Strategjia=Strategy Document)Electricity Demand_Passive_(Strategjia=Strategy Document)total_markal_elasticities higher than Croatiatotal_markal_elasticities like Croatia
Figure A-30: Electricity Generation by Fuel
0
2
4
6
8
10
12
14
2003
2006
2009
2012
2015
2018
2021
2024
2027
Ter
awat
t H
our
s
Oil-fired Gas-fired Hydro Import Other renew.
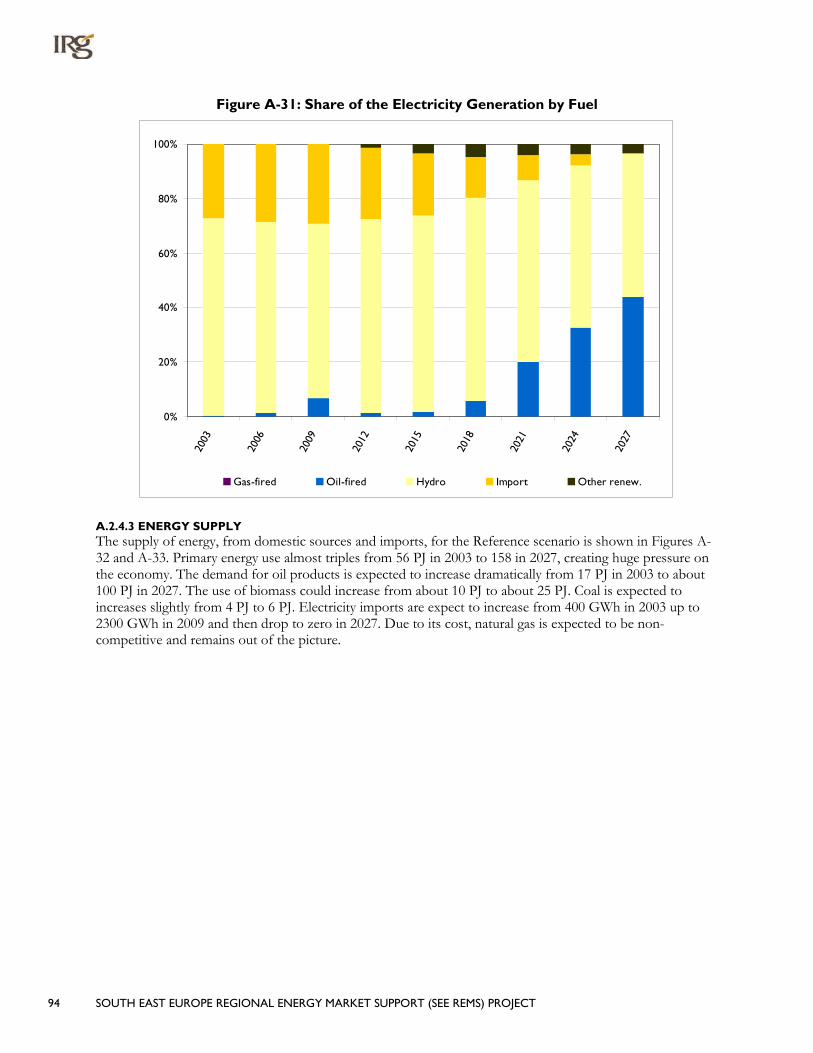
94 SOUTH EAST EUROPE REGIONAL ENERGY MARKET SUPPORT (SEE REMS) PROJECT
Figure A-31: Share of the Electricity Generation by Fuel
0%
20%
40%
60%
80%
100%
2003
2006
2009
2012
2015
2018
2021
2024
2027
Gas-fired Oil-fired Hydro Import Other renew.
A.2.4.3 ENERGY SUPPLY The supply of energy, from domestic sources and imports, for the Reference scenario is shown in Figures A-32 and A-33. Primary energy use almost triples from 56 PJ in 2003 to 158 in 2027, creating huge pressure on the economy. The demand for oil products is expected to increase dramatically from 17 PJ in 2003 to about 100 PJ in 2027. The use of biomass could increase from about 10 PJ to about 25 PJ. Coal is expected to increases slightly from 4 PJ to 6 PJ. Electricity imports are expect to increase from 400 GWh in 2003 up to 2300 GWh in 2009 and then drop to zero in 2027. Due to its cost, natural gas is expected to be non-competitive and remains out of the picture.
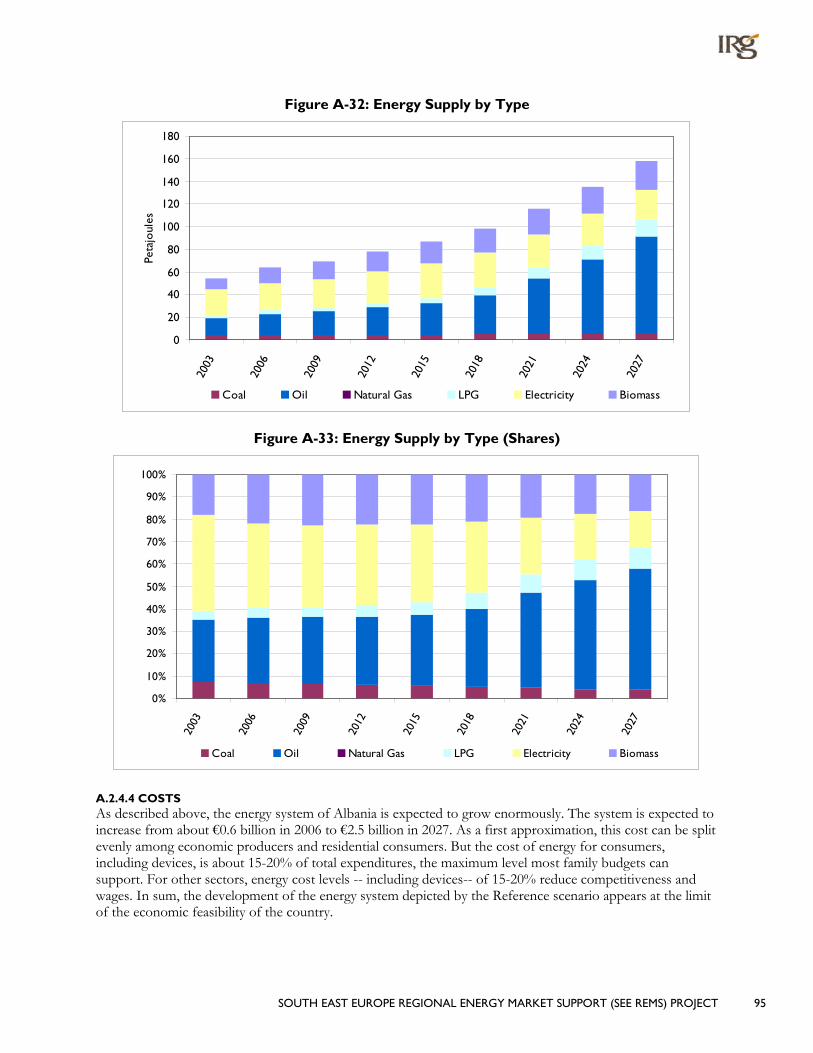
SOUTH EAST EUROPE REGIONAL ENERGY MARKET SUPPORT (SEE REMS) PROJECT 95
Figure A-32: Energy Supply by Type
0
20
40
60
80
100
120
140
160
180
2003
2006
2009
2012
2015
2018
2021
2024
2027
Peta
joul
es
Coal Oil Natural Gas LPG Electricity Biomass
Figure A-33: Energy Supply by Type (Shares)
0%
10%
20%
30%
40%
50%
60%
70%
80%
90%
100%
2003
2006
2009
2012
2015
2018
2021
2024
2027
Coal Oil Natural Gas LPG Electricity Biomass
A.2.4.4 COSTS As described above, the energy system of Albania is expected to grow enormously. The system is expected to increase from about €0.6 billion in 2006 to €2.5 billion in 2027. As a first approximation, this cost can be split evenly among economic producers and residential consumers. But the cost of energy for consumers, including devices, is about 15-20% of total expenditures, the maximum level most family budgets can support. For other sectors, energy cost levels -- including devices-- of 15-20% reduce competitiveness and wages. In sum, the development of the energy system depicted by the Reference scenario appears at the limit of the economic feasibility of the country.

96 SOUTH EAST EUROPE REGIONAL ENERGY MARKET SUPPORT (SEE REMS) PROJECT
Over the course of the planning horizon there is a constant trade-off between investments – in the power sector and demand devices – and fuel expenditure. This trade-off usually takes the form of spending more to purchase more efficient demand technologies versus making large investments in the power sector and spending less on fuels. The development of the electric sector requires annualized investments increasing from €37 million in 2012 to €190 million in 2027. Annualized investments in demand devices grow from €200 million in 2009 to more than €750 million in 2027. Expenditures on fuel grow from €450 million in 2009 to less than €1000 million in 2024.
A.3 SCENARIO ANALYSIS RESULTS Providing increased access to energy efficient demand technologies (scenario R90), and further promoting their uptake by means of policies aimed at reducing electricity consumption (-10% by 2027, scenario R90E) or decreasing energy intensity (total consumption / GDP, -10% by 2027, scenario R90P) results in various positive changes to the evolution of the energy system. The information below reflects the R90/R90E/R90P results, respectively. In general, the three scenarios represent progressively more demanding changes in the energy system, as their relative results illustrate And the results illustrate the merits of promoting increased energy efficiency through policies and programs aimed at improving the overall performance of the energy system.
A.3.1 FINAL ENERGY CONSUMPTION PATTERNS Final energy consumption decreases as the energy system becomes more efficient. The main reason for this drop is largely due to availability of more energy efficient technologies that replace inefficient technologies. Figure A-34 illustrates how the fuel mix changes due to the introduction of the new technologies. The use of oil products decreases considerably; other energy sources don’t change significantly.
Figure A-34: Final Energy Consumption by Fuel
0
20
40
60
80
100
120
140
2003
2006
2009
2012
2015
2018
2021
2024
2027
2003
2006
2009
2012
2015
2018
2021
2024
2027
2003
2006
2009
2012
2015
2018
2021
2024
2027
2003
2006
2009
2012
2015
2018
2021
2024
2027
R0 R90 R90E R90P
Peta
joul
es
Agriculture Commercial Industrial Residential Transportation & Other
Figure A-35 depicts the savings in Final Energy Consumption when satisfying the same sectoral demand for energy services. The rapidly growing commercial sector accounts for a large portion of the implementation of more energy efficient demand devices and energy consumption reductions in the out years, demonstrating the

SOUTH EAST EUROPE REGIONAL ENERGY MARKET SUPPORT (SEE REMS) PROJECT 97
potential benefits of policies aimed at encouraging efficiency improvements. The residential sector reductions in energy consumption are considerable if policies to encourage deployment of more efficient technologies are enacted. In both civil sectors large groups of new technologies, if available, are competitive at the projected energy prices, as can be seen in the R90 scenario. Efficiency improvements in the industrial sector achieve lower savings. Reducing the availability of electricity or the total energy supply by 10% (the R90E/R90P scenarios respectively) brings increased savings in all sectors excluding agriculture. This shift to reduced energy consumption can only happen if there are strong national energy conservation programs (such as building shell requirements, appliance standards) in place that provide sufficient incentives or requirements that participants invest in more efficient demand devices and change consumption behaviors.
Figure A-35: Savings in Final Energy by Sector
0
2
4
6
8
10
12
14
16
2003
2006
2009
2012
2015
2018
2021
2024
2027
2003
2006
2009
2012
2015
2018
2021
2024
2027
2003
2006
2009
2012
2015
2018
2021
2024
2027
R90 R90E R90P
Peta
joul
es
Agriculture Commercial Industrial Residential
A.3.2 POWER SECTOR INVESTMENTS AND ELECTRICITY GENERATION As has already been discussed, electricity is key to the development of the Albanian economy. Through the deployment of new, more efficient technologies, electricity generation requirements can be reduced by 1.7% by 2027 and 2.5% if the primary supply has to be reduced by 10% [see Figure A-36]. Electricity consumption drops far less than other energy carriers because electricity fueled devices are most efficient and are often less expensive to purchase.

98 SOUTH EAST EUROPE REGIONAL ENERGY MARKET SUPPORT (SEE REMS) PROJECT
Figure A-36: Electricity Generation by Fuel
0
2
4
6
8
10
12
14
2003
2006
2009
2012
2015
2018
2021
2024
2027
2003
2006
2009
2012
2015
2018
2021
2024
2027
2003
2006
2009
2012
2015
2018
2021
2024
2027
2003
2006
2009
2012
2015
2018
2021
2024
2027
R0 R90 R90E R90P
Ter
awat
t H
our
s
Oil-fired Gas-fired Hydro Import Other renew.
With the availability of more efficient demand devices it is technically feasible to achieve electricity savings of nearly 10% [see Figure A-37], with only a modest increase of .3% of the total system cost over the Reference scenario.
Figure A-37: Savings in Electricity Generation
0
200
400
600
800
1000
1200
2003
2006
2009
2012
2015
2018
2021
2024
2027
2003
2006
2009
2012
2015
2018
2021
2024
2027
2003
2006
2009
2012
2015
2018
2021
2024
2027
R90 R90E R90P
Gig
awat
t H
our
s
Albania is endowed with considerable hydro resources; exploitation of hydro can increase hydroelectric production by nearly 2000 GWh by 2027 in all scenarios. Demand reduction attributable to policies to
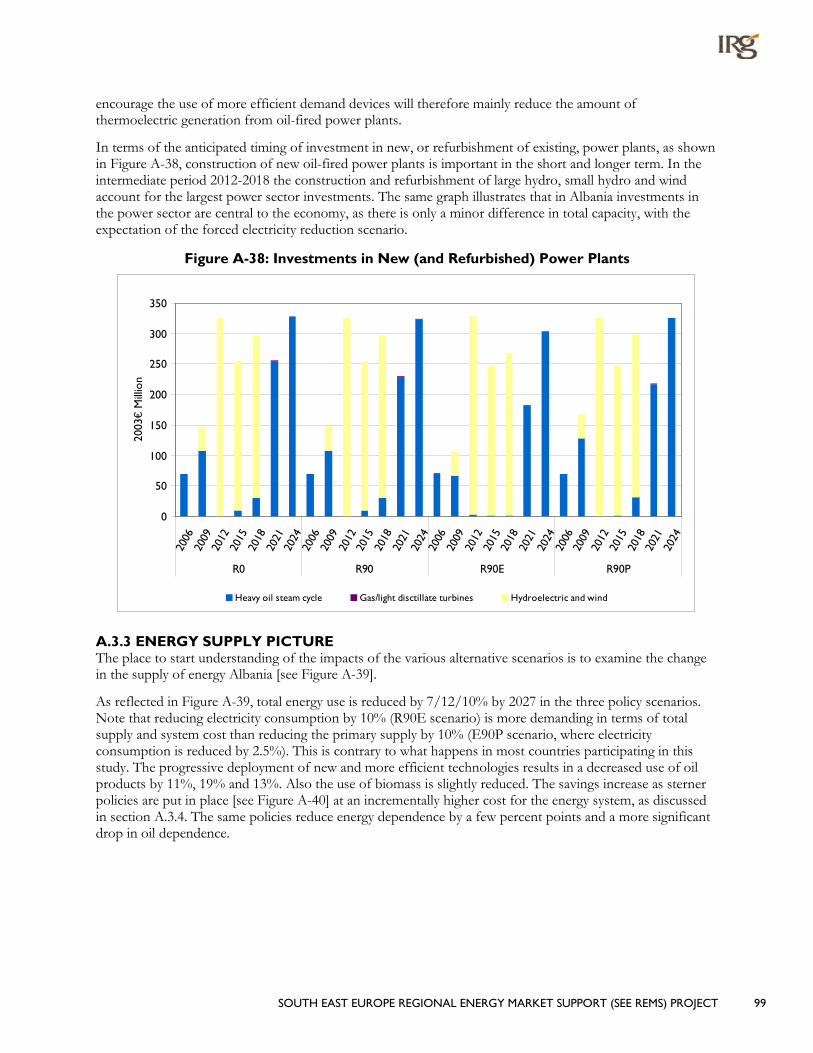
SOUTH EAST EUROPE REGIONAL ENERGY MARKET SUPPORT (SEE REMS) PROJECT 99
encourage the use of more efficient demand devices will therefore mainly reduce the amount of thermoelectric generation from oil-fired power plants.
In terms of the anticipated timing of investment in new, or refurbishment of existing, power plants, as shown in Figure A-38, construction of new oil-fired power plants is important in the short and longer term. In the intermediate period 2012-2018 the construction and refurbishment of large hydro, small hydro and wind account for the largest power sector investments. The same graph illustrates that in Albania investments in the power sector are central to the economy, as there is only a minor difference in total capacity, with the expectation of the forced electricity reduction scenario.
Figure A-38: Investments in New (and Refurbished) Power Plants
0
50
100
150
200
250
300
350
2006
2009
2012
2015
2018
2021
2024
2006
2009
2012
2015
2018
2021
2024
2006
2009
2012
2015
2018
2021
2024
2006
2009
2012
2015
2018
2021
2024
R0 R90 R90E R90P
2003
€ M
illio
n
Heavy oil steam cycle Gas/light disctillate turbines Hydroelectric and wind
A.3.3 ENERGY SUPPLY PICTURE The place to start understanding of the impacts of the various alternative scenarios is to examine the change in the supply of energy Albania [see Figure A-39].
As reflected in Figure A-39, total energy use is reduced by 7/12/10% by 2027 in the three policy scenarios. Note that reducing electricity consumption by 10% (R90E scenario) is more demanding in terms of total supply and system cost than reducing the primary supply by 10% (E90P scenario, where electricity consumption is reduced by 2.5%). This is contrary to what happens in most countries participating in this study. The progressive deployment of new and more efficient technologies results in a decreased use of oil products by 11%, 19% and 13%. Also the use of biomass is slightly reduced. The savings increase as sterner policies are put in place [see Figure A-40] at an incrementally higher cost for the energy system, as discussed in section A.3.4. The same policies reduce energy dependence by a few percent points and a more significant drop in oil dependence.

100 SOUTH EAST EUROPE REGIONAL ENERGY MARKET SUPPORT (SEE REMS) PROJECT
Figure A-39: Supply of Energy
0
20
40
60
80
100
120
140
160
180
2003
2006
2009
2012
2015
2018
2021
2024
2027
2003
2006
2009
2012
2015
2018
2021
2024
2027
2003
2006
2009
2012
2015
2018
2021
2024
2027
2003
2006
2009
2012
2015
2018
2021
2024
2027
R0 R90 R90E R90P
Peta
joul
es
Coal Oil Natural Gas LPG Electricity Biomass
Figure A-40: Imports Share of Total Supply
0%
10%
20%
30%
40%
50%
60%
70%
2003
2006
2009
2012
2015
2018
2021
2024
2027
R0 R90 R90E R90P
An important measure of the competitiveness of an economy is its overall energy intensity, or the amount of energy delivered (consumed) per unit of GDP. Table A-3 below shows the improvement in the energy intensity of the Albanian energy system for the three policy scenarios. In the case of the R90 and R90P scenarios, the overall cost of the energy system also falls, where the R90E shows that a 12.1% improvement can be achieved, with the overall cost of the energy system exceeding by 1.0% that of the less efficient Reference scenario by promoting energy efficiency and setting a policy to lower total consumption of energy.

SOUTH EAST EUROPE REGIONAL ENERGY MARKET SUPPORT (SEE REMS) PROJECT 101
Table A-3: Energy Intensity (PJ/GDP) 2027 percentage change from R0
R90 7.18%
R90E 12.06%
R90P 9.76%
A.3.4 COSTS As mentioned in the highlights (paragraph A.1.2, Figure A-8), the system costs reflect the degree of the energy efficiency and conservation programs introduced through the policy scenarios. For example, the R90 scenario which allows increased access to more energy efficient technologies has the lowest overall cost of all the scenarios over the planning horizon. Enacting policy aimed at explicitly reducing electricity consumption comes at a higher cost, owing to the more expensive demand devices that must be purchased to meet the more stringent limit.
Figure A-41 depicts the scenarios’ Annual Energy System Expenditure. Total expenditures vary slightly for the four scenarios, with more significant variation in the distribution of expenditures from fuel to demand devices. This can also be interpreted as growth in economic activities (i.e., doing more for less) for the increased investment in demand technologies as the reallocation of expenditures from fuel can subsidize deployment of high efficiency and renewable technologies.
Figure A-41: Annual Energy System Expenditures
0
250
500
750
1000
1250
1500
1750
2000
2250
2500
2006
2009
2012
2015
2018
2021
2024
2027
2006
2009
2012
2015
2018
2021
2024
2027
2006
2009
2012
2015
2018
2021
2024
2027
2006
2009
2012
2015
2018
2021
2024
2027
R0 R90 R90E R90P
2003
€ M
illio
n
Annual Inv Power Sector Annual Inv Demand Expenditure on Fuel
Increasing the annual investments of the enterprises in more efficient production technologies, and the annual expenditures of families in more energy efficient intermediate goods, by an average €50 million per annum, reduces the total annual expenditures for fuels by an average €100 million per annum. Therefore information campaigns and other deployment policies worth up to €50 million have a positive payback for the country. In the most constraining scenario (E90E), the further deployment of more efficient technologies has a general positive economic effect for the country – through economic multipliers – only if domestic enterprises contribute to their construction.

102 SOUTH EAST EUROPE REGIONAL ENERGY MARKET SUPPORT (SEE REMS) PROJECT
B. BOSNIA AND HERZEGOVINA
This Section provides an overview of the BiH energy system analysis. Section B.1 provides highlights of first the Reference scenario, followed by an overview of the Policy scenarios. Later sections provide more detailed discussion of both the Reference (B.2) and Policy scenarios (B.3).
B.1 HIGHLIGHTS
B.1.1 REFERENCE SCENARIO The evolution of the BiH energy system under a Reference scenario is briefly summarized and illustrated in the charts below.
• End-use fuel consumption shows that electricity and LPG are fuels of growing importance in the mix. Electricity consumption increases from 30.6% to 38.2% of the total, and LPG becomes 10.1% of the mix by 2027. The shares of natural gas, coal, oil, and low-temperature heat stay roughly constant, with oil consumption growing more rapidly and increasing its share to 17.9%. Biomass use drops by 21%, and its share is cut roughly in half.
Figure B-1: Percent of Final Energy Consumption by Fuel Type
2006
Renewables (other)0.1%
Natural Gas5.7%
Coal10.8%
Oil15.0%Biomass
34.2%
Electricity31%
Low-temp2.6%
LPG1%
2027
Natural Gas3.7%
Biomass17.5%
LPG10.1%
Low-temp3.0%
Renewables (other)0.0%
Coal9.6%
Oil17.9%
Electricity38%
• End-use consumption by sector shows that commercial and industrial are the fastest growing sectors, with residential and agricultural consumption growing more slowly.

SOUTH EAST EUROPE REGIONAL ENERGY MARKET SUPPORT (SEE REMS) PROJECT 103
Figure B-2: Percent of Final Energy Consumption by Sector
2006
Agriculture8.8%
Commercial15.8%
Industrial21.9%
Residential53.3%
Transport & Other
0%
2027
Agriculture7.0%
Residential42.9%
Industrial27.4%
Commercial22.6%
Transport & Other
0%
• Electric Generation more than doubles, from 42 PJ to 87 PJ by 2027 [note that exports are capped at 2003 levels]. Coal-fired and hydro generation grow at roughly similar rates, although the expansion of hydro capacity occurs earlier in the model horizon, so that by 2027 the supply mix is roughly the same as in 2006. (By 2027, 20% of the generation listed as coal-fired is brown coal/biomass cofiring, with biomass making up less than 20% of the fuel mix.) Renewables, mostly wind and a small amount of biomass-fired CHP, make up 3% of the mix in 2027.
Figure B-3: Percent Electricity Generation by Fuel Type
2006Renewable and Other power
plants0.0%
Hydroelectric power plants
49.4%
Coal-fired power plants
50.6%
2027Renewable and Other power
plants3.3%
Coal-fired power plants49.5%
Hydroelectric power plants
47.1%
• Energy Supply in the country increases by 50.7% by 2027
– Coal, a combination of domestic brown coal and lignite for power production, maintains its share, growing at approximately the same rate as total supply;
– Natural gas use remains roughly constant, as no new imports are assumed in the Reference scenario;
– LPG consumption grows rapidly, reaching 7% of total supply;
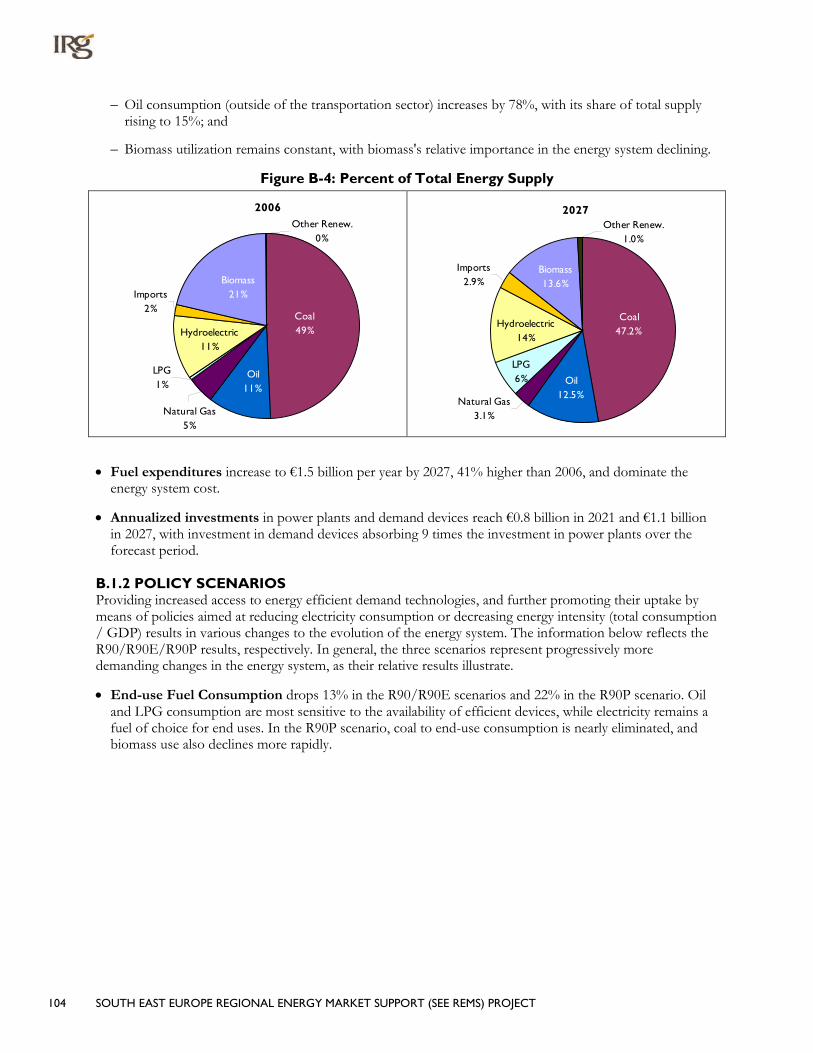
104 SOUTH EAST EUROPE REGIONAL ENERGY MARKET SUPPORT (SEE REMS) PROJECT
– Oil consumption (outside of the transportation sector) increases by 78%, with its share of total supply rising to 15%; and
– Biomass utilization remains constant, with biomass's relative importance in the energy system declining.
Figure B-4: Percent of Total Energy Supply
2006
Oil11%
Coal49%
Biomass21%
Natural Gas5%
Imports2%
Hydroelectric11%
Other Renew.0%
LPG1%
2027
Oil12.5%
Coal47.2%
LPG6%
Other Renew.1.0%
Hydroelectric14%
Imports2.9%
Natural Gas3.1%
Biomass13.6%
• Fuel expenditures increase to €1.5 billion per year by 2027, 41% higher than 2006, and dominate the energy system cost.
• Annualized investments in power plants and demand devices reach €0.8 billion in 2021 and €1.1 billion in 2027, with investment in demand devices absorbing 9 times the investment in power plants over the forecast period.
B.1.2 POLICY SCENARIOS Providing increased access to energy efficient demand technologies, and further promoting their uptake by means of policies aimed at reducing electricity consumption or decreasing energy intensity (total consumption / GDP) results in various changes to the evolution of the energy system. The information below reflects the R90/R90E/R90P results, respectively. In general, the three scenarios represent progressively more demanding changes in the energy system, as their relative results illustrate.
• End-use Fuel Consumption drops 13% in the R90/R90E scenarios and 22% in the R90P scenario. Oil and LPG consumption are most sensitive to the availability of efficient devices, while electricity remains a fuel of choice for end uses. In the R90P scenario, coal to end-use consumption is nearly eliminated, and biomass use also declines more rapidly.

SOUTH EAST EUROPE REGIONAL ENERGY MARKET SUPPORT (SEE REMS) PROJECT 105
Figure B-5: Final Energy Consumption
0
20
40
60
80
100
120
140
160
180
200
2003
2006
2009
2012
2015
2018
2021
2024
2027
Peta
joul
es
Coal Oil Natural Gas LPG
Electricity Biomass Renewables (other) Low-temp Heat
• Electricity generation from coal-fired plants drops 5/20/14% in the three scenarios. In the R90P scenarios, there is a shift from brown coal and biomass fired generation to lignite-fired CHP, and from older, less efficient plants to new ones.
Figure B-6: 2027 Electricity Generation Mix by Fuel Type
0
10
20
30
40
50
60
70
80
90
100
2003
2006
2009
2012
2015
2018
2021
2024
2027
Peta
joul
es
Coal-fired power plants Hydroelectric power plants
Renewable and Other power plants
• Primary energy use in the country decreases by 10/11/30% by 2027, with a corresponding improvement in energy intensity. In the R90 scenario, the primary reductions come from LPG and oil, as the system
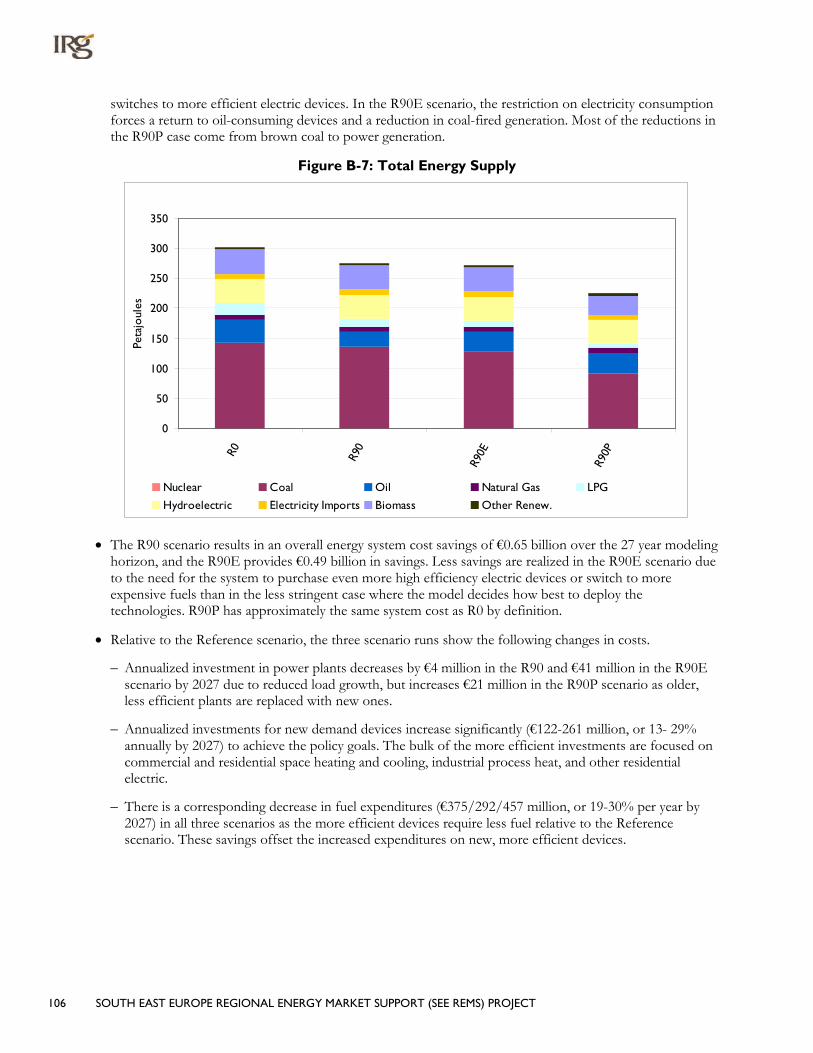
106 SOUTH EAST EUROPE REGIONAL ENERGY MARKET SUPPORT (SEE REMS) PROJECT
switches to more efficient electric devices. In the R90E scenario, the restriction on electricity consumption forces a return to oil-consuming devices and a reduction in coal-fired generation. Most of the reductions in the R90P case come from brown coal to power generation.
Figure B-7: Total Energy Supply
0
50
100
150
200
250
300
350R0 R90
R90E
R90P
Peta
joul
es
Nuclear Coal Oil Natural Gas LPG
Hydroelectric Electricity Imports Biomass Other Renew.
• The R90 scenario results in an overall energy system cost savings of €0.65 billion over the 27 year modeling horizon, and the R90E provides €0.49 billion in savings. Less savings are realized in the R90E scenario due to the need for the system to purchase even more high efficiency electric devices or switch to more expensive fuels than in the less stringent case where the model decides how best to deploy the technologies. R90P has approximately the same system cost as R0 by definition.
• Relative to the Reference scenario, the three scenario runs show the following changes in costs.
– Annualized investment in power plants decreases by €4 million in the R90 and €41 million in the R90E scenario by 2027 due to reduced load growth, but increases €21 million in the R90P scenario as older, less efficient plants are replaced with new ones.
– Annualized investments for new demand devices increase significantly (€122-261 million, or 13- 29% annually by 2027) to achieve the policy goals. The bulk of the more efficient investments are focused on commercial and residential space heating and cooling, industrial process heat, and other residential electric.
– There is a corresponding decrease in fuel expenditures (€375/292/457 million, or 19-30% per year by 2027) in all three scenarios as the more efficient devices require less fuel relative to the Reference scenario. These savings offset the increased expenditures on new, more efficient devices.
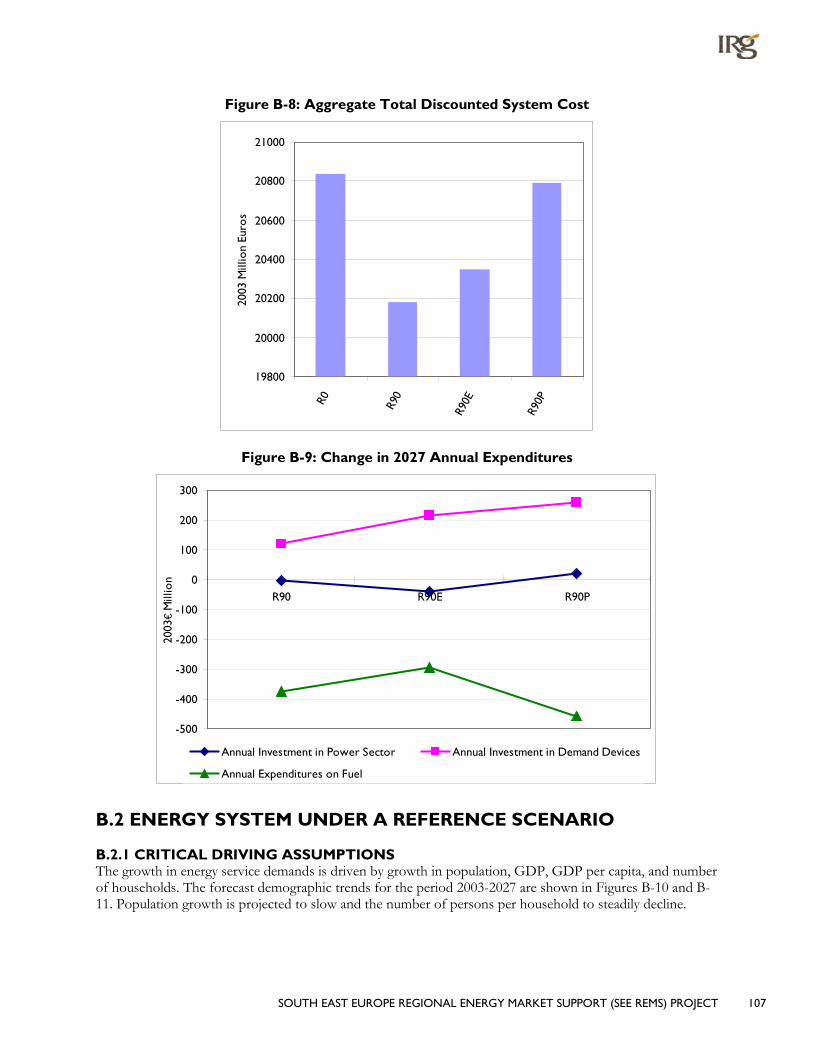
SOUTH EAST EUROPE REGIONAL ENERGY MARKET SUPPORT (SEE REMS) PROJECT 107
Figure B-8: Aggregate Total Discounted System Cost
19800
20000
20200
20400
20600
20800
21000
R0 R90
R90E
R90P
2003
Mill
ion
Euro
s
Figure B-9: Change in 2027 Annual Expenditures
-500
-400
-300
-200
-100
0
100
200
300
R90 R90E R90P
2003
€ M
illio
n
Annual Investment in Power Sector Annual Investment in Demand Devices
Annual Expenditures on Fuel
B.2 ENERGY SYSTEM UNDER A REFERENCE SCENARIO
B.2.1 CRITICAL DRIVING ASSUMPTIONS The growth in energy service demands is driven by growth in population, GDP, GDP per capita, and number of households. The forecast demographic trends for the period 2003-2027 are shown in Figures B-10 and B-11. Population growth is projected to slow and the number of persons per household to steadily decline.
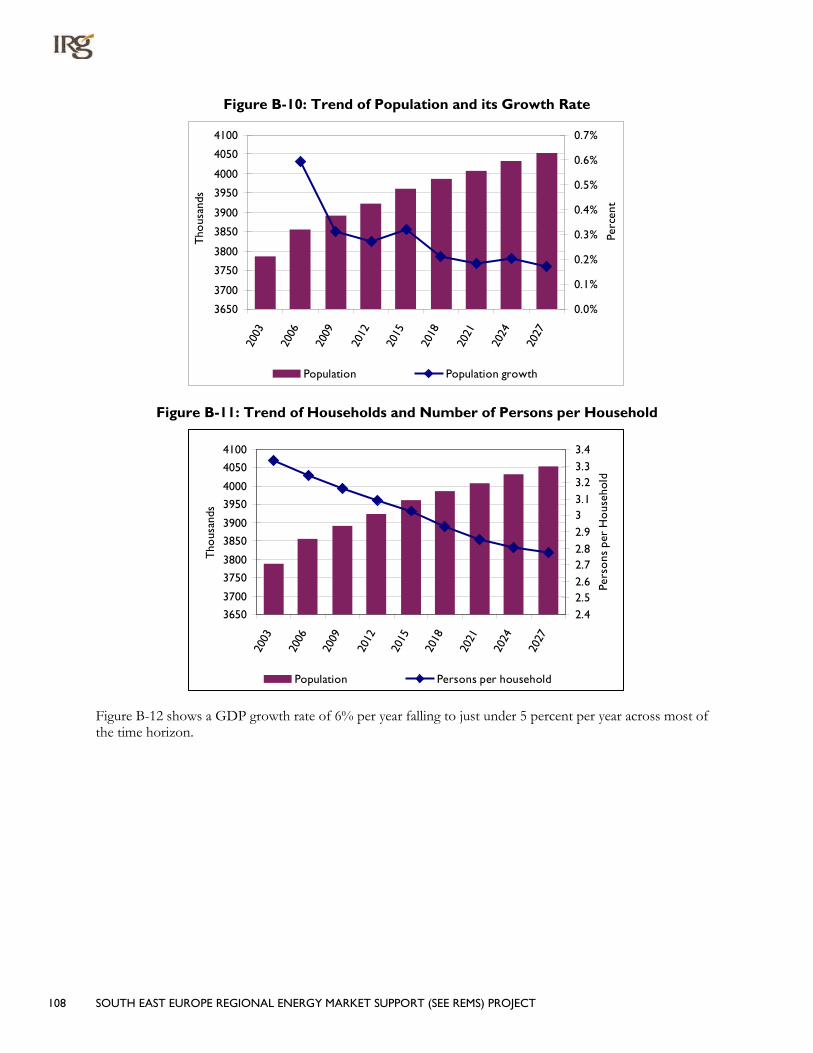
108 SOUTH EAST EUROPE REGIONAL ENERGY MARKET SUPPORT (SEE REMS) PROJECT
Figure B-10: Trend of Population and its Growth Rate
3650
3700
3750
3800
3850
3900
3950
4000
4050
4100
2003
2006
2009
2012
2015
2018
2021
2024
2027
Tho
usan
ds
0.0%
0.1%
0.2%
0.3%
0.4%
0.5%
0.6%
0.7%
Perc
ent
Population Population growth
Figure B-11: Trend of Households and Number of Persons per Household
3650
3700
3750
3800
3850
3900
3950
4000
4050
4100
2003
2006
2009
2012
2015
2018
2021
2024
2027
Tho
usan
ds
2.42.52.62.72.82.933.13.23.33.4
Pers
ons
per
Ho
useh
old
Population Persons per household
Figure B-12 shows a GDP growth rate of 6% per year falling to just under 5 percent per year across most of the time horizon.

SOUTH EAST EUROPE REGIONAL ENERGY MARKET SUPPORT (SEE REMS) PROJECT 109
Figure B-12: GDP and GDP Growth Rate
0
5,000
10,000
15,000
20,000
25,000
2003
2006
2009
2012
2015
2018
2021
2024
2027
Mill
ion
2003
Eur
os
0%
1%
2%
3%
4%
5%
6%
7%
Perc
ent
GDP GDP growth
B.2.2 ENERGY SERVICE DEMAND PROJECTIONS As discussed in Section 2, the demand for energy services over time serves as the primary driver for the requirements of the future energy system. These are derived by establishing the relationship between the fundamental drivers (discussed in the previous section) and their relationship via elasticities to the individual demands. The aggregate view of the demand composition is shown in Figure B-13, and each sector is discussed briefly in the sections that follow. The fastest growing sector is the commercial sector, where demand more than triples, followed by the industrial sector.
Figure B-13: Projection of Energy Service Demand for each Sector
0
20
40
60
80
100
120
140
160
180
200
2003
2006
2009
2012
2015
2018
2021
2024
2027
Peta
joul
es
Agriculture Commercial Industrial Residential Transport/Non-energy
B.2.2.1 RESIDENTIAL SECTOR The main driving factors for calculation of energy demand in the residential sector are growth in the number of households [see Figure B-11] and the evolution of residential living from rural to urban single family dwellings with centralized heating systems, as shown in Figure B-14.

110 SOUTH EAST EUROPE REGIONAL ENERGY MARKET SUPPORT (SEE REMS) PROJECT
Figure B-14: Composition of Residential Dwellings over Time
0%10%20%
30%40%50%60%70%
80%90%
100%
2003
2006
2009
2012
2015
2018
2021
2024
2027
Apartments - Urban Single House - Urban - CentralSingle House - Urban - Local Single House - Rural - Local
Figure B-15 shows projected service demands in the residential sector, which increase 72% overall. Space heating remains the largest demand, although its growth rate is one of the slowest. By 2027, demands with minimal 2003 penetration, such as cooling and dishwashing, have grown to become a substantial portion of total demand. Other rapidly growing demands are lighting, clothes drying, and other.
Figure B-15: Residential Demand for Energy Services (Useful Energy)
0
10
20
30
40
50
60
70
80
90
2003
2006
2009
2012
2015
2018
2021
2024
2027
Peta
joul
es
Space Heating Water Heating Space Cooling Cooking LightingOther Electricity Dish Washing Fridges & Freezers Clothes Washing Clothes Drying
B.2.2.2 COMMERCIAL SECTOR Figure B-16 shows projected service demands in the commercial sector, which increase 3.3 times overall. By 2027, space heating is still the largest demand in this sector, at nearly 40%, but space cooling and lighting have grown to comprise significant portions of the total sectoral demand.
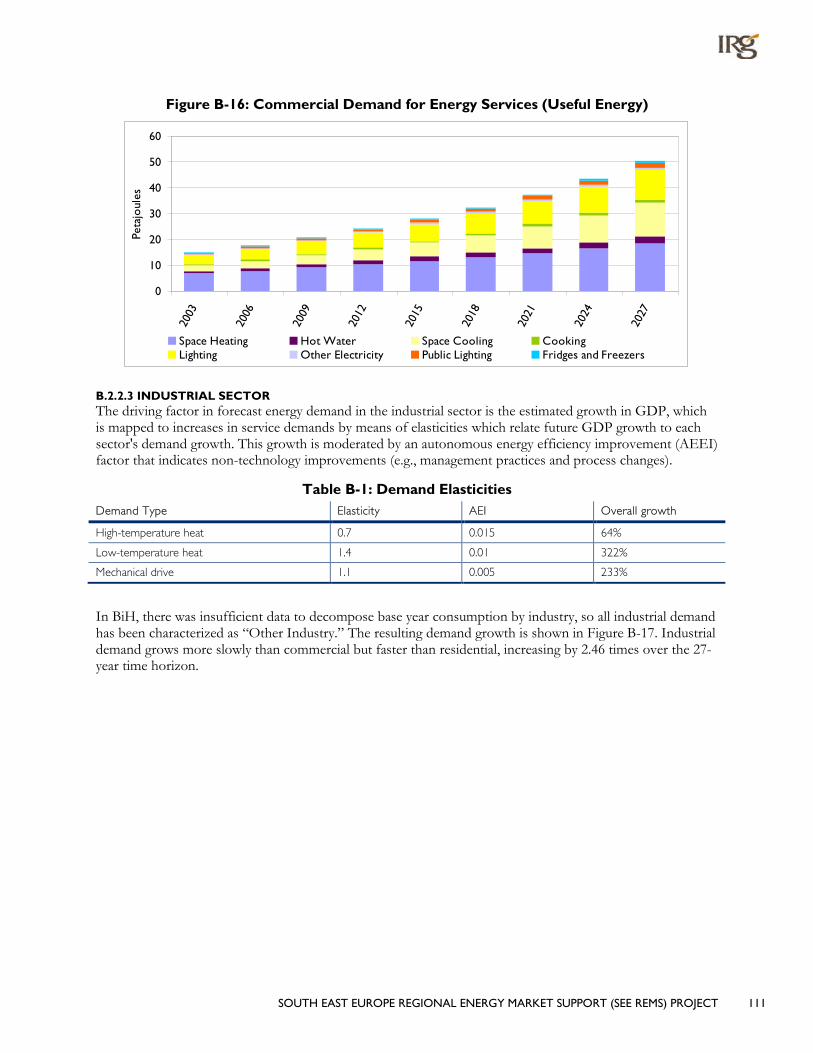
SOUTH EAST EUROPE REGIONAL ENERGY MARKET SUPPORT (SEE REMS) PROJECT 111
Figure B-16: Commercial Demand for Energy Services (Useful Energy)
0
10
20
30
40
50
60
2003
2006
2009
2012
2015
2018
2021
2024
2027
Peta
joul
es
Space Heating Hot Water Space Cooling CookingLighting Other Electricity Public Lighting Fridges and Freezers
B.2.2.3 INDUSTRIAL SECTOR The driving factor in forecast energy demand in the industrial sector is the estimated growth in GDP, which is mapped to increases in service demands by means of elasticities which relate future GDP growth to each sector's demand growth. This growth is moderated by an autonomous energy efficiency improvement (AEEI) factor that indicates non-technology improvements (e.g., management practices and process changes).
Table B-1: Demand Elasticities Demand Type Elasticity AEI Overall growth
High-temperature heat 0.7 0.015 64%
Low-temperature heat 1.4 0.01 322%
Mechanical drive 1.1 0.005 233%
In BiH, there was insufficient data to decompose base year consumption by industry, so all industrial demand has been characterized as “Other Industry.” The resulting demand growth is shown in Figure B-17. Industrial demand grows more slowly than commercial but faster than residential, increasing by 2.46 times over the 27-year time horizon.
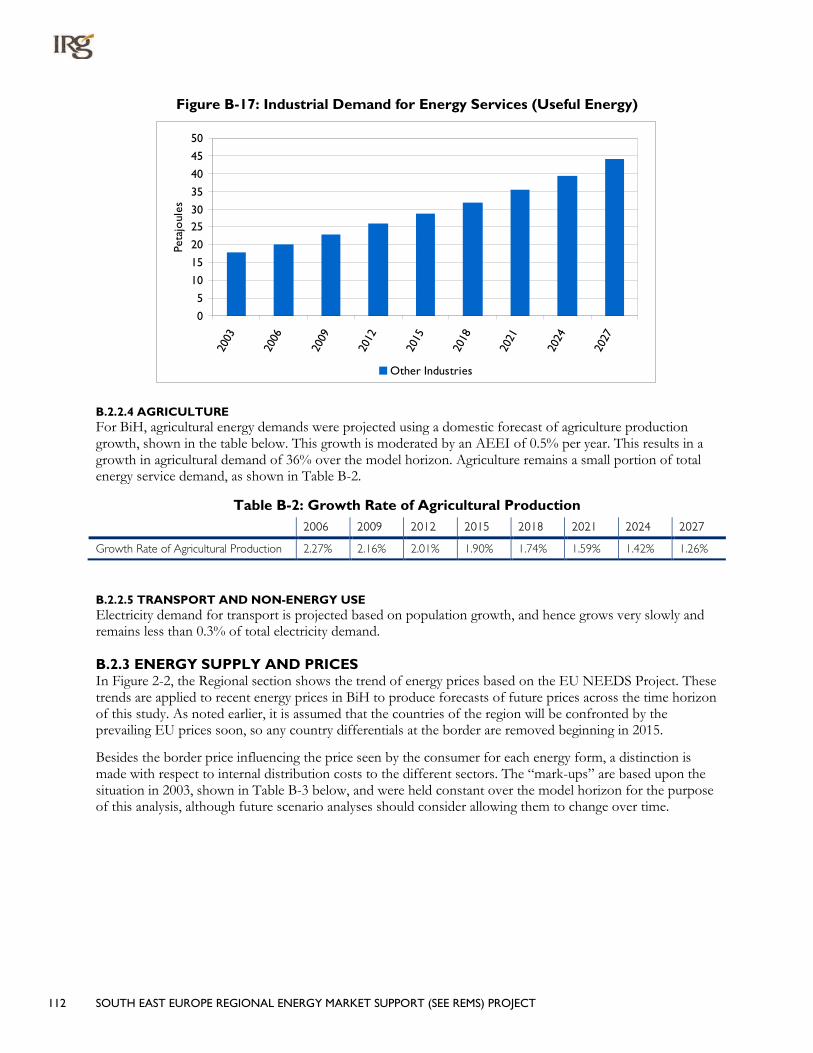
112 SOUTH EAST EUROPE REGIONAL ENERGY MARKET SUPPORT (SEE REMS) PROJECT
Figure B-17: Industrial Demand for Energy Services (Useful Energy)
0
5
10
15
20
2530
35
40
45
50
2003
2006
2009
2012
2015
2018
2021
2024
2027
Peta
joul
es
Other Industries
B.2.2.4 AGRICULTURE For BiH, agricultural energy demands were projected using a domestic forecast of agriculture production growth, shown in the table below. This growth is moderated by an AEEI of 0.5% per year. This results in a growth in agricultural demand of 36% over the model horizon. Agriculture remains a small portion of total energy service demand, as shown in Table B-2.
Table B-2: Growth Rate of Agricultural Production 2006 2009 2012 2015 2018 2021 2024 2027
Growth Rate of Agricultural Production 2.27% 2.16% 2.01% 1.90% 1.74% 1.59% 1.42% 1.26%
B.2.2.5 TRANSPORT AND NON-ENERGY USE Electricity demand for transport is projected based on population growth, and hence grows very slowly and remains less than 0.3% of total electricity demand.
B.2.3 ENERGY SUPPLY AND PRICES In Figure 2-2, the Regional section shows the trend of energy prices based on the EU NEEDS Project. These trends are applied to recent energy prices in BiH to produce forecasts of future prices across the time horizon of this study. As noted earlier, it is assumed that the countries of the region will be confronted by the prevailing EU prices soon, so any country differentials at the border are removed beginning in 2015.
Besides the border price influencing the price seen by the consumer for each energy form, a distinction is made with respect to internal distribution costs to the different sectors. The “mark-ups” are based upon the situation in 2003, shown in Table B-3 below, and were held constant over the model horizon for the purpose of this analysis, although future scenario analyses should consider allowing them to change over time.

SOUTH EAST EUROPE REGIONAL ENERGY MARKET SUPPORT (SEE REMS) PROJECT 113
Table B-3: Sector Fuel Price “Mark-Ups” (M2003€/PJ)
Fuel
Sectors
Residential Commercial Agriculture Industry
Lignite 1.75 1.75 1.75 1.25
Light fuel 5.43 5.43 5.43 5.43
Heavy fuel 6.18
LPG 7.87 7.87 7.87 7.87
Gas 1.74 4.09 1.74 3.94
Electricity 1.44 12.44 1.44 0.01
Low-temperature heat 0.01 0.01 0.01 0.01
Domestic resource supply increases only slightly, with domestic coal production allowed to increase slightly over the modeling horizon, as reported in Table B-4. Most imports that occur currently are assumed to be unlimited in the future, with the exception of electricity, which is capped at its 2003 level, and natural gas imports, which are limited to 20% above 2003 levels.
Table B-4: Upper limits on Domestic Resource Supply (PJ) Domestic Supply 2003 - 2027
Biomass 40.95
Brown Coal 70.29-91.38
Coke 0.00
Hard Coal 0.00
Lignite Coal 41.69-54.2
Natural Gas 0.00
Distillate 0.81
Gasoline 0.38
Heavy Fuel Oil 0.00
Kerosene 0.00
LPG 0.00
B.2.4 REFERENCE SCENARIO HIGHLIGHTS The previous sections provided insight into the basic assumptions that shape the expected demand for energy services. But it is left up to the model to develop a depiction of the energy system under business-as-usual conditions to determine how to serve those demands by determining the future demand for final energy (e.g., electricity, heat, natural gas), the power sector generation mix, and the assortment of technologies that are deployed over the planning horizon. This least-cost configuration of the energy system, within the limits of the constraints imposed (e.g., resource limits, rates of fuel switching, availability of advanced efficient devices), serves as the Reference scenario against which the alternate scenario analysis is compared. In this section the Reference scenario results are described.
B.2.4.1 FINAL ENERGY CONSUMPTION In the Reference scenario there is a rapidly growing demand for electricity, which more than doubles. Oil consumption also doubles, coal to end-uses (primarily industry) grows 80%, and LPG consumption grows to 19 PJ. Natural gas and low-temperature heat stay relatively constant, and biomass use slowly declines.

114 SOUTH EAST EUROPE REGIONAL ENERGY MARKET SUPPORT (SEE REMS) PROJECT
Figure B-18: Final Energy Consumption by Fuel
0
20
40
60
80
100
120
140
160
180
200
2003
2006
2009
2012
2015
2018
2021
2024
2027
Peta
joul
es
Coal Oil Natural Gas LPG
Electricity Biomass Renewables (other) Low-temp Heat
Figure B-19 shows end-use consumption by sector. Commercial sector consumption grows the fastest, but remains the smallest of the three major sectors. Residential consumption grows the slowest, declining to less than half of total consumption by 2027. Total final energy consumption grows by 72% over the forecast period.
Figure B-19: Final Energy Consumption by Sector
0
20
40
60
80
100
120
140
160
180
200
2003
2006
2009
2012
2015
2018
2021
2024
2027
Peta
joul
es
Agriculture Commercial Industrial Residential Transport & Other
More detail is provided on the composition of final energy delivered to each sector in the sections that follow.
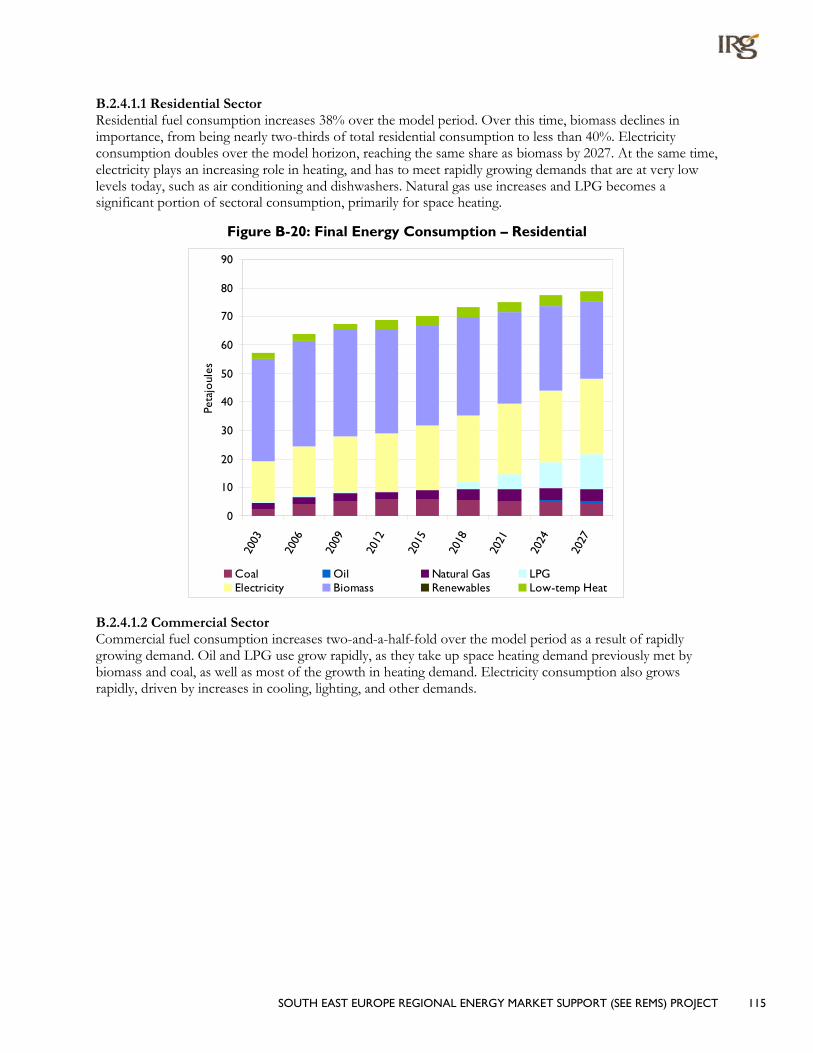
SOUTH EAST EUROPE REGIONAL ENERGY MARKET SUPPORT (SEE REMS) PROJECT 115
B.2.4.1.1 Residential Sector Residential fuel consumption increases 38% over the model period. Over this time, biomass declines in importance, from being nearly two-thirds of total residential consumption to less than 40%. Electricity consumption doubles over the model horizon, reaching the same share as biomass by 2027. At the same time, electricity plays an increasing role in heating, and has to meet rapidly growing demands that are at very low levels today, such as air conditioning and dishwashers. Natural gas use increases and LPG becomes a significant portion of sectoral consumption, primarily for space heating.
Figure B-20: Final Energy Consumption – Residential
0
10
20
30
40
50
60
70
80
9020
03
2006
2009
2012
2015
2018
2021
2024
2027
Peta
joul
es
Coal Oil Natural Gas LPGElectricity Biomass Renewables Low-temp Heat
B.2.4.1.2 Commercial Sector Commercial fuel consumption increases two-and-a-half-fold over the model period as a result of rapidly growing demand. Oil and LPG use grow rapidly, as they take up space heating demand previously met by biomass and coal, as well as most of the growth in heating demand. Electricity consumption also grows rapidly, driven by increases in cooling, lighting, and other demands.

116 SOUTH EAST EUROPE REGIONAL ENERGY MARKET SUPPORT (SEE REMS) PROJECT
Figure B-21: Final Energy Consumption – Commercial
0
5
10
15
20
25
30
35
40
45
2003
2006
2009
2012
2015
2018
2021
2024
2027
Peta
joul
es
Coal Oil Natural Gas LPG Electricity Biomass Low-temp Heat
B.2.4.1.3 Industrial Sector Total industrial fuel consumption grows 113% by 2027 from 2003. The evolution of the fuel mix for industry is shown in Figure B-22. Electricity consumption more than doubles primarily to power machine drives. Coal and later biomass take up most of the increase in process heat demand.
Figure B-22: Final Energy Consumption – Industry
0
10
20
30
40
50
60
2003
2006
2009
2012
2015
2018
2021
2024
2027
Peta
joul
es
Coal Oil Natural Gas LPG Electricity Biomass Low-temp Heat
B.2.4.1.4 Agriculture Sector Figure B-23 shows the evolution of the principal fuels used in the agricultural sector for the Reference scenario. The primary growth in this sector is diesel for powering tractors and other equipment.

SOUTH EAST EUROPE REGIONAL ENERGY MARKET SUPPORT (SEE REMS) PROJECT 117
Figure B-23: Final Energy Consumption – Agriculture
0
2
4
6
8
10
12
14
2003
2006
2009
2012
2015
2018
2021
2024
2027
Peta
joul
es
Coal Oil Natural Gas LPG
Electricity Biomass Renewables Low-temp Heat
B.2.4.2 ELECTRICITY GENERATION REQUIREMENTS Figures B-24 and B-25 show the evolution of power generation over time for the Reference scenario. Total electricity generation roughly doubles, from 39 PJ to 87 PJ by 2027. The power mix shifts toward hydro in the first half of the modeling period, as existing stock continues to be repaired and new investments are made in both small and large hydro capacity. In the second half of the model period the mix shifts back toward coal, as existing plants are used more intensively and new investments are made in lignite-fired and biomass/brown coal co-fired capacity. A small amount of wind capacity also comes on-line in the second half of the model horizon.

118 SOUTH EAST EUROPE REGIONAL ENERGY MARKET SUPPORT (SEE REMS) PROJECT
Figure B-24: Electricity Generation by Fuel
0
10
20
30
40
50
60
70
80
90
100
2003
2006
2009
2012
2015
2018
2021
2024
2027
Peta
joul
es
Coal-fired power plants Hydroelectric power plants
Renewable and Other power plants
Figure B-25: Share of the Electricity Generation by Fuel
0%
10%
20%
30%
40%
50%
60%
70%
80%
90%
100%
2003
2006
2009
2012
2015
2018
2021
2024
2027
Coal-fired power plants Hydroelectric power plants
Renewable and Other power plants
Figure B-26 compares the Reference scenario power generation evolution over time to the GIS Case 2 and 3 forecasts. All of the GIS forecasts for BiH have lower GDP growth than the projection we have used. GIS Case 3 (the high growth case) uses a 4.5% growth rate through most of the horizon. The International Monetary Fund gives 2006 actual growth rate as 6.0% and projects 6.5% for 2008. Based on these values, we use a value of 6.0% in 2009 declining to 4.8% for the second half of the model period (see Figure B-27).
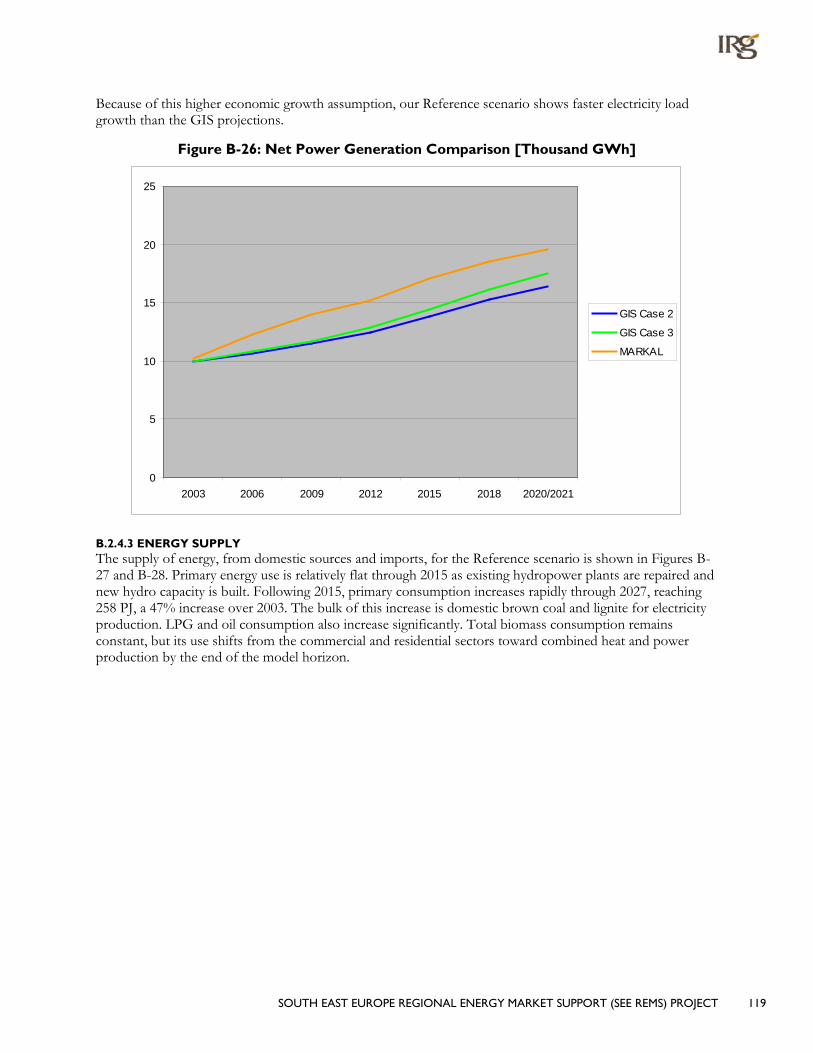
SOUTH EAST EUROPE REGIONAL ENERGY MARKET SUPPORT (SEE REMS) PROJECT 119
Because of this higher economic growth assumption, our Reference scenario shows faster electricity load growth than the GIS projections.
Figure B-26: Net Power Generation Comparison [Thousand GWh]
0
5
10
15
20
25
2003 2006 2009 2012 2015 2018 2020/2021
GIS Case 2
GIS Case 3
MARKAL
B.2.4.3 ENERGY SUPPLY The supply of energy, from domestic sources and imports, for the Reference scenario is shown in Figures B-27 and B-28. Primary energy use is relatively flat through 2015 as existing hydropower plants are repaired and new hydro capacity is built. Following 2015, primary consumption increases rapidly through 2027, reaching 258 PJ, a 47% increase over 2003. The bulk of this increase is domestic brown coal and lignite for electricity production. LPG and oil consumption also increase significantly. Total biomass consumption remains constant, but its use shifts from the commercial and residential sectors toward combined heat and power production by the end of the model horizon.

120 SOUTH EAST EUROPE REGIONAL ENERGY MARKET SUPPORT (SEE REMS) PROJECT
Figure B-27: Energy Supply by Type
0
50
100
150
200
250
300
350
2003
2006
2009
2012
2015
2018
2021
2024
2027
Peta
joul
es
Nuclear Coal Oil Natural Gas LPG
Hydroelectric Imports Biomass Renewables
Figure B-28: Energy Supply by Type (Shares)
0%
10%
20%
30%
40%
50%
60%
70%
80%
90%
100%
2003
2006
2009
2012
2015
2018
2021
2024
2027
Nuclear Coal Oil Natural Gas LPG
Hydroelectric Imports Biomass Renewables
B.2.4.4 COSTS Over the course of the model horizon there is a constant trade-off between capital investments in power sector and demand devices and expenditures on fuel. This trade-off usually takes the form of spending more to purchase more efficient demand technologies versus making large investments in the power sector and spending more on fuels. In the Reference scenario
• Fuel expenditures increase to €1.5 billion per year by 2027, 41% higher than 2006; and

SOUTH EAST EUROPE REGIONAL ENERGY MARKET SUPPORT (SEE REMS) PROJECT 121
• Annualized investments in power plants and demand devices reach €0.8 billion in 2021 and €1.1 billion in 2027, with investment in demand devices absorbing 9.1 times the investment in power plants over the model period.
B.3 SCENARIO ANALYSIS HIGHLIGHTS Providing increased access to energy efficient demand technologies, and further promoting their uptake by means of policies aimed at reducing electricity consumption or decreasing energy intensity (total consumption / GDP) results in various changes to the evolution of the energy system. This section describes the results of the R90/R90E/R90P scenarios, respectively. In general, the three scenarios represent progressively more demanding changes in the energy system, as their relative results illustrate. However, the R90 scenario allows the model to make whatever efficiency investments it finds cost effective, much of which comes in non-electric fuels, whereas the R90E scenario forces a reduction in electricity, which pushes consumption of non-electric fuels back up toward Reference scenario levels. Although total primary and final consumption levels are nearly equal in these two scenarios, the fuel mix is different. The R90P scenario achieves a 25% reduction in primary energy plus electricity from imports and renewables by 2021 at the same discounted system cost as the Reference scenario.
• End-use Fuel Consumption drops 13% in the R90/R90E scenarios and 22% in the R90P scenario. Oil and LPG consumption are most sensitive to the availability of efficient devices, while electricity remains a fuel of choice for end uses. In the R90P scenario, coal to end-use consumption is nearly eliminated, and biomass use also declines more rapidly.
• Electricity generation from coal-fired plants drops 5/20/14% in the three scenarios. In the R90P scenario, there is a shift from brown coal and biomass fired generation to lignite-fired CHP, and from older, less efficient plants to new ones.
• Primary energy use decreases by 10/11/30% by 2027, with a corresponding improvement in energy intensity. In the R90 scenario, the primary reductions come from LPG and oil, as the system switches to more efficient electric devices. In the R90E scenario, the restriction on electricity consumption forces a return to oil-consuming devices and a reduction in coal-fired generation. Most of the additional reductions in the R90P case come from reducing the consumption of brown coal in power generation.
• The R90 scenario results in an overall energy system cost savings of €0.65 billion over the 27-year modeling horizon, and the R90E €0.49 billion. R90P has approximately the same system cost as R0 by definition.
– Annualized investment in power plants decreases by €4 million in the R90 and €41 million in the R90E scenario by 2027 due to the reduced load growth, but increases €21 million in the R90P scenario as older, less efficient plants are replaced with new ones.
– Annualized investments for new demand devices increase significantly (€122-261 million, or 13- 29% annually by 2027) to achieve the policy goals. The bulk of the more efficient investments are focused on commercial and residential space heating and cooling, industrial process heat, and other residential electric.
– There is a corresponding decrease in fuel expenditures (€375/292/457 million, or 19-30% per year by 2027) in all three scenarios as the more efficient devices require less fuel relative to the Reference scenario. These savings offset the increased expenditures on new, more efficient devices.
So the analysis conducted here serves to illustrate the merits of promoting increased energy efficiency through policies and programs aimed at improving the overall performance of the energy system.
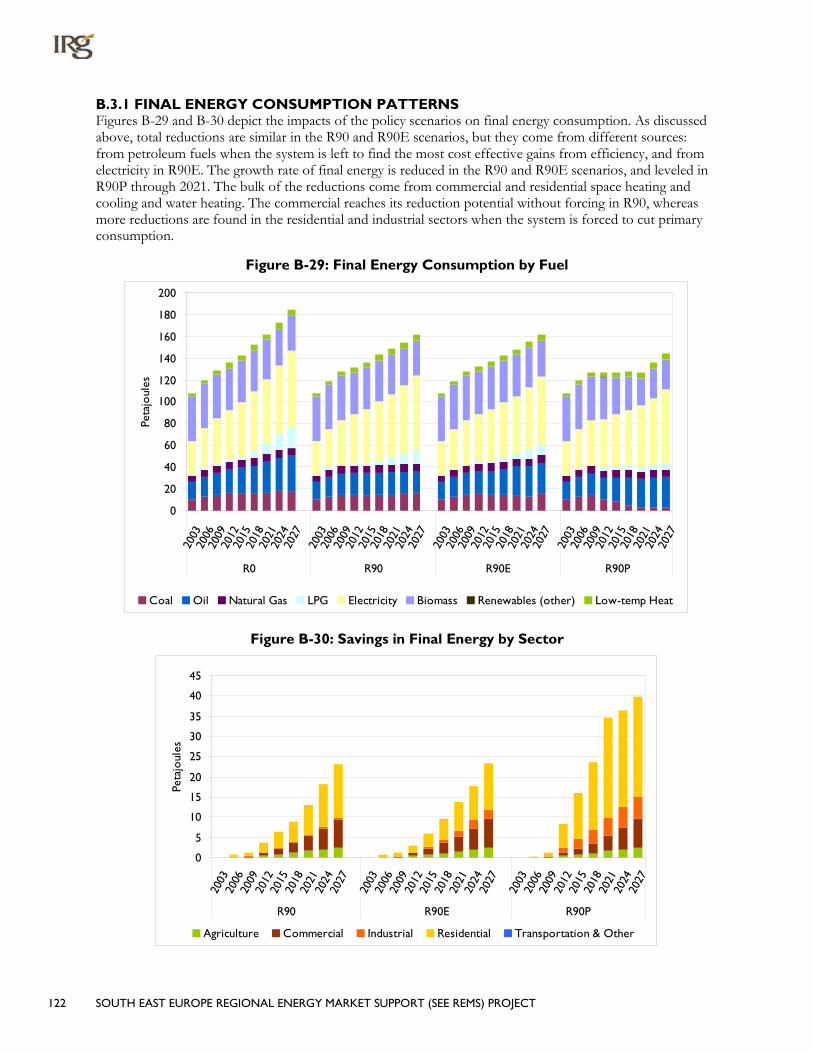
122 SOUTH EAST EUROPE REGIONAL ENERGY MARKET SUPPORT (SEE REMS) PROJECT
B.3.1 FINAL ENERGY CONSUMPTION PATTERNS Figures B-29 and B-30 depict the impacts of the policy scenarios on final energy consumption. As discussed above, total reductions are similar in the R90 and R90E scenarios, but they come from different sources: from petroleum fuels when the system is left to find the most cost effective gains from efficiency, and from electricity in R90E. The growth rate of final energy is reduced in the R90 and R90E scenarios, and leveled in R90P through 2021. The bulk of the reductions come from commercial and residential space heating and cooling and water heating. The commercial reaches its reduction potential without forcing in R90, whereas more reductions are found in the residential and industrial sectors when the system is forced to cut primary consumption.
Figure B-29: Final Energy Consumption by Fuel
0
20
40
60
80
100
120
140
160
180
200
2003
2006
2009
2012
2015
2018
2021
2024
2027
2003
2006
2009
2012
2015
2018
2021
2024
2027
2003
2006
2009
2012
2015
2018
2021
2024
2027
2003
2006
2009
2012
2015
2018
2021
2024
2027
R0 R90 R90E R90P
Peta
joul
es
Coal Oil Natural Gas LPG Electricity Biomass Renewables (other) Low-temp Heat
Figure B-30: Savings in Final Energy by Sector
0
5
10
15
20
25
30
35
40
45
2003
2006
2009
2012
2015
2018
2021
2024
2027
2003
2006
2009
2012
2015
2018
2021
2024
2027
2003
2006
2009
2012
2015
2018
2021
2024
2027
R90 R90E R90P
Peta
joul
es
Agriculture Commercial Industrial Residential Transportation & Other
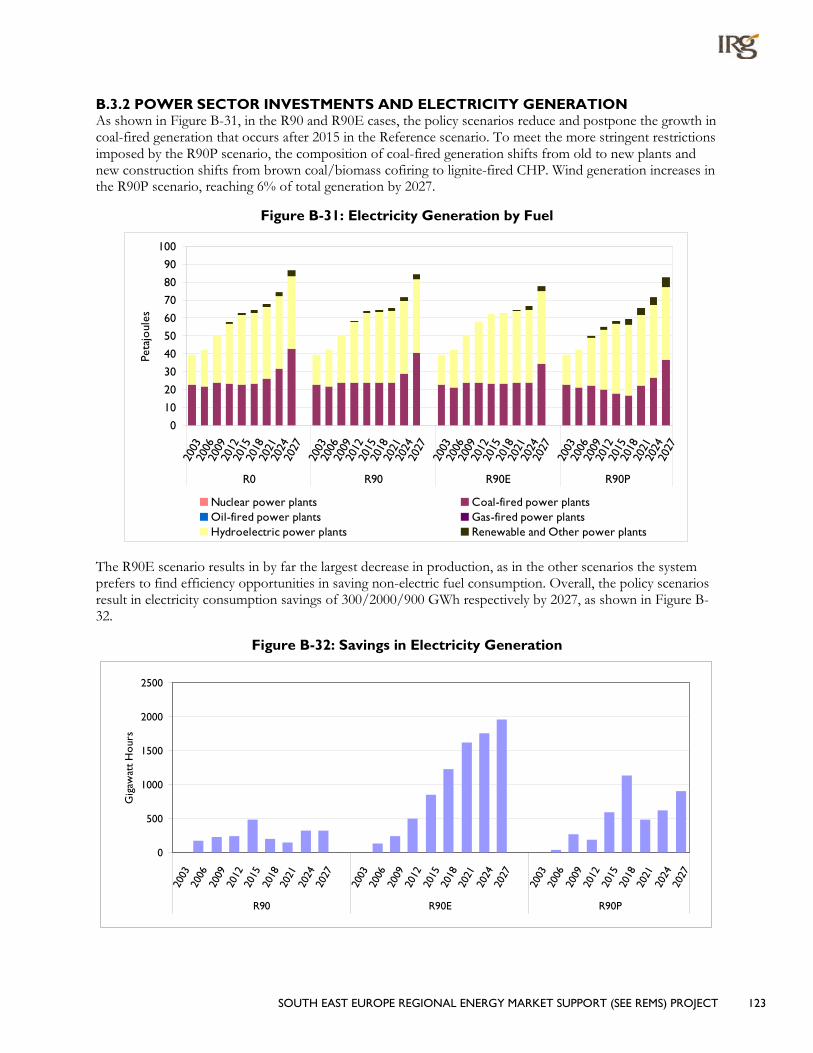
SOUTH EAST EUROPE REGIONAL ENERGY MARKET SUPPORT (SEE REMS) PROJECT 123
B.3.2 POWER SECTOR INVESTMENTS AND ELECTRICITY GENERATION As shown in Figure B-31, in the R90 and R90E cases, the policy scenarios reduce and postpone the growth in coal-fired generation that occurs after 2015 in the Reference scenario. To meet the more stringent restrictions imposed by the R90P scenario, the composition of coal-fired generation shifts from old to new plants and new construction shifts from brown coal/biomass cofiring to lignite-fired CHP. Wind generation increases in the R90P scenario, reaching 6% of total generation by 2027.
Figure B-31: Electricity Generation by Fuel
0
10
20
30
40
50
60
70
80
90
100
2003
2006
2009
2012
2015
2018
2021
2024
2027
2003
2006
2009
2012
2015
2018
2021
2024
2027
2003
2006
2009
2012
2015
2018
2021
2024
2027
2003
2006
2009
2012
2015
2018
2021
2024
2027
R0 R90 R90E R90P
Peta
joul
es
Nuclear power plants Coal-fired power plantsOil-fired power plants Gas-fired power plantsHydroelectric power plants Renewable and Other power plants
The R90E scenario results in by far the largest decrease in production, as in the other scenarios the system prefers to find efficiency opportunities in saving non-electric fuel consumption. Overall, the policy scenarios result in electricity consumption savings of 300/2000/900 GWh respectively by 2027, as shown in Figure B-32.
Figure B-32: Savings in Electricity Generation
0
500
1000
1500
2000
2500
2003
2006
2009
2012
2015
2018
2021
2024
2027
2003
2006
2009
2012
2015
2018
2021
2024
2027
2003
2006
2009
2012
2015
2018
2021
2024
2027
R90 R90E R90P
Gig
awat
t H
our
s

124 SOUTH EAST EUROPE REGIONAL ENERGY MARKET SUPPORT (SEE REMS) PROJECT
Figure B-33 shows the impact of the analysis policies on the timing and magnitude of capital investments in the power sector. The R90 and R90E policies greatly moderate and postpone the need for investments in new generation capacity. In R90, this amounts to a 2% reduction in total annualized power sector investment over the model horizon, and 24% in the R90E scenario. The R90P requires a 12% increase in power sector investment, as new and more efficient plants are built. There is also increased and earlier expenditure on wind plants.
Figure B-33: Investments in New (and Refurbished) Power Plants
0
100
200
300
400
500
600
700
800
900
2006
2009
2012
2015
2018
2021
2024
2027
2006
2009
2012
2015
2018
2021
2024
2027
2006
2009
2012
2015
2018
2021
2024
2027
2006
2009
2012
2015
2018
2021
2024
2027
R0 R90 R90E R90P
Mill
ion
Euro
s
Nuclear power plants Coal-fired power plantsOil-fired power plants Gas-fired power plantsHydroelectric power plants Renewable and Other power plants
B.3.1 ENERGY SUPPLY PICTURE Figure B-34 shows primary energy consumption plus electricity imports under the Reference and Policy scenarios. The R90 and R90E scenarios substantially moderate the growth in primary energy. In R90, this is due to increased efficiency, particularly in residential and commercial space heating and cooling and water heating, and a switch in residential heating from oil and LPG-fueled devices to more efficient electric heat pumps. The R90E scenario reverses some of this fuel switching and concentrates efficiency investments in electric devices.
The R90P scenario, which imposes a much more severe constraint on the system, reverses growth in primary energy through 2021. After that, the policy imposed allows growth in primary energy to continue, but it only reaches 2003 levels by 2027. In addition to increased end-use efficiency, the reduction is achieved by building newer, more efficient power plants, and replacing brown coal/biomass cofired generation with lignite-fired CHP. There is also a shift away from coal use for process heat in industry and an increase in wind generation.

SOUTH EAST EUROPE REGIONAL ENERGY MARKET SUPPORT (SEE REMS) PROJECT 125
Figure B-34: Supply of Energy
0
50
100
150
200
250
300
350
2003
2006
2009
2012
2015
2018
2021
2024
2027
2003
2006
2009
2012
2015
2018
2021
2024
2027
2003
2006
2009
2012
2015
2018
2021
2024
2027
2003
2006
2009
2012
2015
2018
2021
2024
2027
R0 R90 R90E R90P
Peta
joul
es
Nuclear Coal Oil Natural Gas LPG
Hydroelectric Electricity Imports Biomass Other Renew.
In the Reference scenario, consumption of imported fuel doubles from 2003 to 2027 from 34 to 73 PJ. Most of this increase comes from distillate, heavy fuel oil, and LPG. The policy scenarios moderate this growth in imports, reducing 2027 import levels by 28/21/22% respectively.
Figure B-35: Total Imports
0
10
20
30
40
50
60
70
80
2003 2006 2009 2012 2015 2018 2021 2024 2027
Peta
joul
es
R0 R90 R90E R90P
An important measure of the competitiveness of an economy is its overall energy intensity, or the amount of energy delivered (consumed) per unit of GDP. Table B-5 shows the improvement in the energy intensity of the BiH energy system for the three policy scenarios. In the case of the R90 and R90E scenarios the overall cost of the energy system also falls, where the R90P shows that a 30% improvement can be achieved with the

126 SOUTH EAST EUROPE REGIONAL ENERGY MARKET SUPPORT (SEE REMS) PROJECT
overall cost of the energy system not exceeding that of the less efficient Reference scenario by promoting energy efficiency and renewable energy.
Table B-5: Energy Intensity (PJ/GDP) 2027 percentage change from R0
R90 10.11%
R90E 11.43%
R90P 30.02%
B.3.4 COSTS Figure B-36 depicts the total discounted system cost of all four scenarios. The system costs reflect closely the degree of energy efficiency and conservation programs introduced through the policy scenarios. For example, the R90 scenario, which allows increased access to more energy efficient technologies, is the least cost scenario over the model horizon. The total discounted system cost drops by 2.7% from the Reference scenario. When the system is forced to use the efficiency potential to reduce electricity load growth by10%, the total discounted system cost shows a reduced improvement of 2.0% from the Reference scenario. The policy goal of reduced energy intensity scenario, R90P, results in almost the same total discounted system cost as Reference scenario, but at much lower levels of energy intensity and energy imports.
Figure B-36: Total Discounted Energy System
19800
20000
20200
20400
20600
20800
21000
R0 R90
R90E
R90P
2003
Mill
ion
Euro
s
Figure B-37 depicts the Annual Energy System Expenditures for the policy scenarios. The total expenditures for the four scenarios are broadly similar, but show significant differences in distribution between components and in growth rate over time. The R90 scenario shows shower growth, reaching 90% of the total expenditure level with 25% lower expenditure on fuel, partially offset by increased investment in the more efficient end-use devices. The R90E and R90P scenarios show a similar, but less pronounced pattern of shifts in the timing and distribution of expenditures.

SOUTH EAST EUROPE REGIONAL ENERGY MARKET SUPPORT (SEE REMS) PROJECT 127
Figure B-37: Annual Energy System Expenditures
0
500
1000
1500
2000
2500
3000
2006
2009
2012
2015
2018
2021
2024
2027
2006
2009
2012
2015
2018
2021
2024
2027
2006
2009
2012
2015
2018
2021
2024
2027
2006
2009
2012
2015
2018
2021
2024
2027
R0 R90 R90E R90P
2003
Mill
ion
Euro
s
Annual Inv Power Sector Annual Inv Demand Expenditure on Fuel

128 SOUTH EAST EUROPE REGIONAL ENERGY MARKET SUPPORT (SEE REMS) PROJECT
C. BULGARIA
This Section C provides an overview of the Bulgaria energy system analysis. Section C.1 provides highlights of first the Reference scenario, followed by an overview of the Policy scenarios. Later sections provide more detailed discussion of both the Reference (C.2) and Policy scenarios (C.3).
C.1 HIGHLIGHTS
C.1.1 REFERENCE SCENARIO The evolution of the Bulgaria energy system under a Reference scenario is briefly summarized and illustrated in the charts below.
• Final energy consumption shows that total electricity share grows to 37% in 2027 (from 30% initially), owing to the addition of two new nuclear power plants, and the share of gas moves to 29% (from 18.7%), with shrinking shares of coal, oil and biomass.
Figure C-1: End-Use Fuel Consumption
2006
LPG1%
Renewables0%
Biomass8%
Coal15%
Oil15%
Natural Gas19%
Low-temp Heat12%
Electricity30%
2027
LPG4%
Biomass3%
Natural Gas29%
Low-temp Heat13%
Renewables2% Coal
6% Oil6%
Electricity37%
• Final energy consumption by sector shows that most growth in energy consumption occurs in the commercial and industrial sectors, with the residential sector demand shrinking both in absolute and percentage terms.

SOUTH EAST EUROPE REGIONAL ENERGY MARKET SUPPORT (SEE REMS) PROJECT 129
Figure C-2: Energy Consumption by Sector
2006
Transportation& Other
6%
Agriculture4%
Industrial49%
Residential30%
Commercial11%
2027
Residential20%
Commercial14%
Industrial54%
Agriculture4%
Transportation & Other
8%
• Electric Generation increases from 135 PJ (37,500 GWh) to 183 PJ (50,833 GWh) by 2027, a 35% increase. [Note that exports are capped at 2003 levels.] By 2027,
– 55% of electric generation is provided by nuclear power plants;
– 28% is from coal-fired power plants;
– 6% is contributed by new non-hydro renewables (biomass, geothermal and a small amount of wind); and
– contributions from hydro and gas-fired generation remain fairly stable near their 2003 levels.
Figure C-3: Electricity Generation
2006
Renewable and Other power
plants0.0%
Gas-fired power plants
8.1%
Oil-fired power plants0.0%
Coal-fired power plants
31.6%
Nuclear power plants52.5%
Hydroelectric power plants
7.8%
2027Renewable and Other power
plants6.0%
Gas-fired power plants4.0%
Oil-fired power plants0.0%
Coal-fired power plants27.7%
Nuclear power plants55.2%
Hydroelectric power plants
7.2%
• Primary Energy Supply in the country increases by 16% by 2027
– Nuclear energy provides the bulk of the additional energy requirements, increasing from 37.7% to 42%;

130 SOUTH EAST EUROPE REGIONAL ENERGY MARKET SUPPORT (SEE REMS) PROJECT
– coal usage drops from 31.4% to 25%;
– biomass use doubles to 8% of total supply;
– natural gas use holds fairly steady; and
– oil consumption (outside of the transportation sector) drops by 50%.
Figure C-4: Primary Energy Use
2006Electricity Imports0.4%
LPG0.4%
Biomass4.2%
Natural Gas17.3%
Oil8.6%
Coal31.4%
Nuclear37.7%
2027
Electricity Imports
1%Biomass
8%LPG2%
Natural Gas18%
Oil4%
Coal25%
Nuclear42%
• Fuel expenditures increase to €1.98 billion per year by 2027, 26.5% higher than 2006, and dominate the energy system cost.
• Annualized investments in power plants and demand devices reach €1.588 billion in 2021 and €1.73 billion in 2027, with investment in demand devices absorbing 2.5 times the investment in power plants.
C.1.2 POLICY SCENARIOS Providing increased access to energy efficient demand technologies, and further promoting their uptake by means of policies aimed at reducing electricity consumption or improving energy intensity (total consumption / GDP) result in various changes to the evolution of the energy system. The information below reflects the R90/R90E/R90P results, respectively. In general, the three scenarios represent progressively more demanding changes in the energy system, as their relative results illustrate.
• End-use Fuel Consumption shows the most change in natural gas consumption, i.e., a reduction of 10% due to the improved efficiency of end-use devices introduced by three scenarios. Electricity also drops by 10% as expected in both scenarios (R90E and R90P) to 117 PJ compared to R90 scenario at 130 PJ.

SOUTH EAST EUROPE REGIONAL ENERGY MARKET SUPPORT (SEE REMS) PROJECT 131
Figure C-5: End-Use Fuel Consumption in 2027
0.0
50.0
100.0
150.0
200.0
250.0
300.0
350.0
400.0
R0 R90
R90E
R90P
Peta
joul
es
Coal Oil Natural Gas LPG Electricity Biomass Others LTH
• Electricity generation shows less change owing to the substantial availability of nuclear power. Promoting more efficient demand devices only results in 4% reduction in electricity use, while the forced 10% reduction in electricity use results in a decrease in coal-fired generation (mostly coal retrofit). The improved energy intensity scenario (R90P) adds more biomass fueled power plants in place of coal plants.
Figure C-6: Electric Generation by Power Plant Type in 2027
0
20
40
60
80
100
120
140
160
180
200
R0 R90
R90E
R90P
Peta
joul
es
Nuclear Coal-fired Oil-fired Gas-fired Hydroelectric Renewable and Other
• Primary energy use in the country decreases by 5/8/13% by 2027, with a corresponding improvement in energy intensity, where the main fuel shift is a reduction in coal consumption, particularly in the R90P scenario.
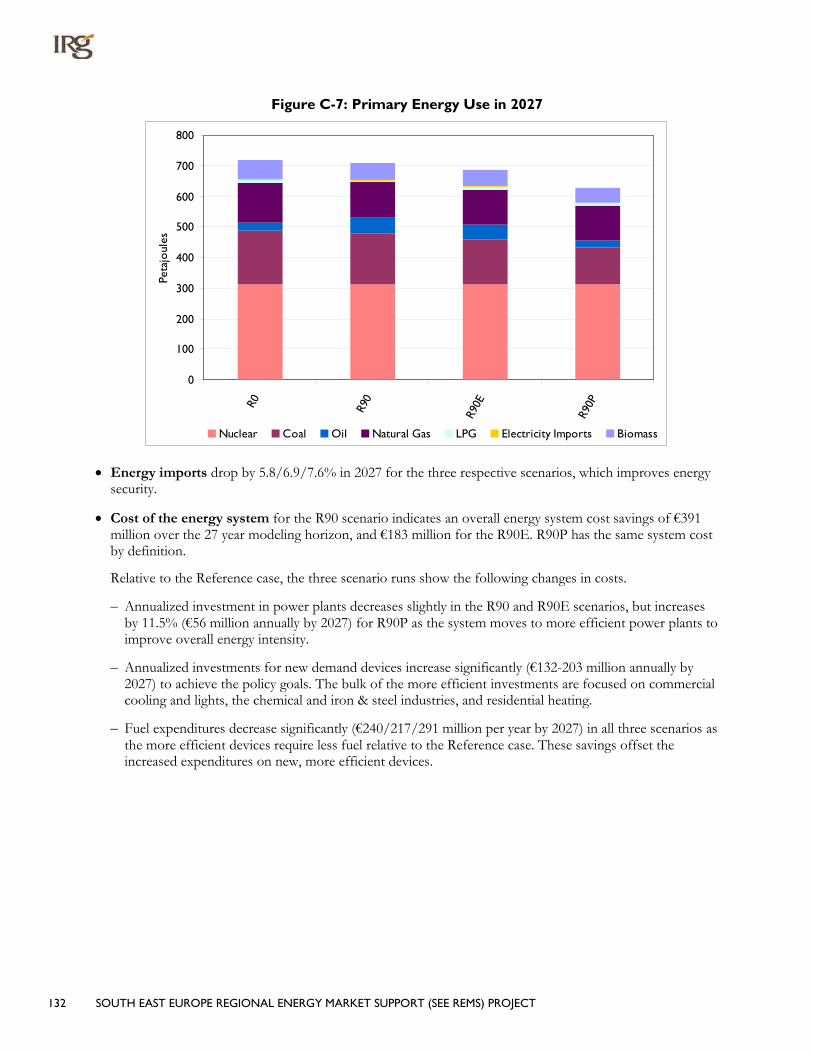
132 SOUTH EAST EUROPE REGIONAL ENERGY MARKET SUPPORT (SEE REMS) PROJECT
Figure C-7: Primary Energy Use in 2027
0
100
200
300
400
500
600
700
800
R0 R90
R90E
R90P
Peta
joul
es
Nuclear Coal Oil Natural Gas LPG Electricity Imports Biomass
• Energy imports drop by 5.8/6.9/7.6% in 2027 for the three respective scenarios, which improves energy security.
• Cost of the energy system for the R90 scenario indicates an overall energy system cost savings of €391 million over the 27 year modeling horizon, and €183 million for the R90E. R90P has the same system cost by definition.
Relative to the Reference case, the three scenario runs show the following changes in costs.
– Annualized investment in power plants decreases slightly in the R90 and R90E scenarios, but increases by 11.5% (€56 million annually by 2027) for R90P as the system moves to more efficient power plants to improve overall energy intensity.
– Annualized investments for new demand devices increase significantly (€132-203 million annually by 2027) to achieve the policy goals. The bulk of the more efficient investments are focused on commercial cooling and lights, the chemical and iron & steel industries, and residential heating.
– Fuel expenditures decrease significantly (€240/217/291 million per year by 2027) in all three scenarios as the more efficient devices require less fuel relative to the Reference case. These savings offset the increased expenditures on new, more efficient devices.
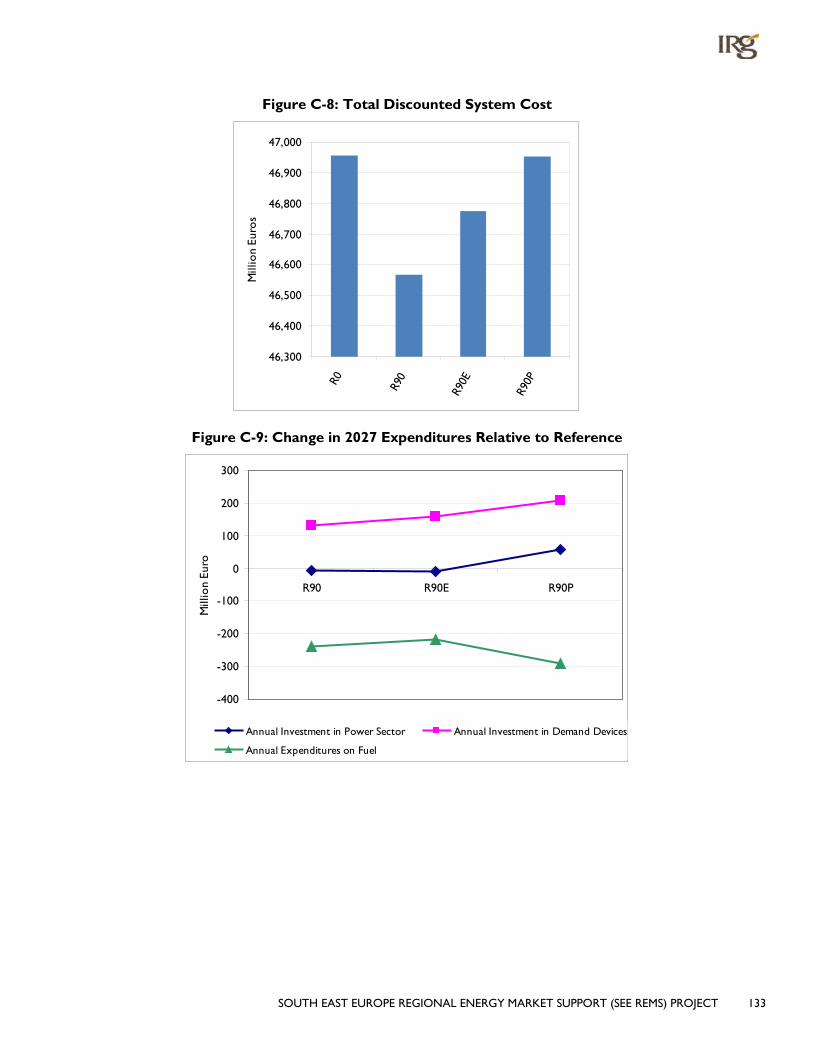
SOUTH EAST EUROPE REGIONAL ENERGY MARKET SUPPORT (SEE REMS) PROJECT 133
Figure C-8: Total Discounted System Cost
46,300
46,400
46,500
46,600
46,700
46,800
46,900
47,000
R0 R90
R90E
R90P
Mill
ion
Euro
s
Figure C-9: Change in 2027 Expenditures Relative to Reference
-400
-300
-200
-100
0
100
200
300
R90 R90E R90P
Mill
ion
Euro
Annual Investment in Power Sector Annual Investment in Demand Devices
Annual Expenditures on Fuel

134 SOUTH EAST EUROPE REGIONAL ENERGY MARKET SUPPORT (SEE REMS) PROJECT
C.2 ENERGY SYSTEM UNDER A REFERENCE SCENARIO
C.2.1 CRITICAL DRIVING ASSUMPTIONS
Figure C-10: Trend of Population and its Growth Rate
6200
6400
6600
6800
7000
7200
7400
7600
7800
800020
03
2006
2009
2012
2015
2018
2021
2024
2027
Tho
usan
ds
-1.2%
-1.0%
-0.8%
-0.6%
-0.4%
-0.2%
0.0%
Perc
ent
Population Population growth
Figure C-11: Trend of Households and Number of Persons per Household
6200
6400
6600
6800
7000
7200
7400
7600
7800
8000
2003
2006
2009
2012
2015
2018
2021
2024
2027
Tho
usan
ds
2.40
2.45
2.50
2.55
2.60
2.65
2.70
Pers
ons
per
Ho
useh
old
Population Persons per household
The forecast demographic trends for Bulgaria for the period 2003-2027 (falling population growth rates and declines in household sizes) are shown in Figures C-10 and C-11.
Figure C-12 shows a robust GDP growth rate of 6% per year falling to just under 4% by 2027.
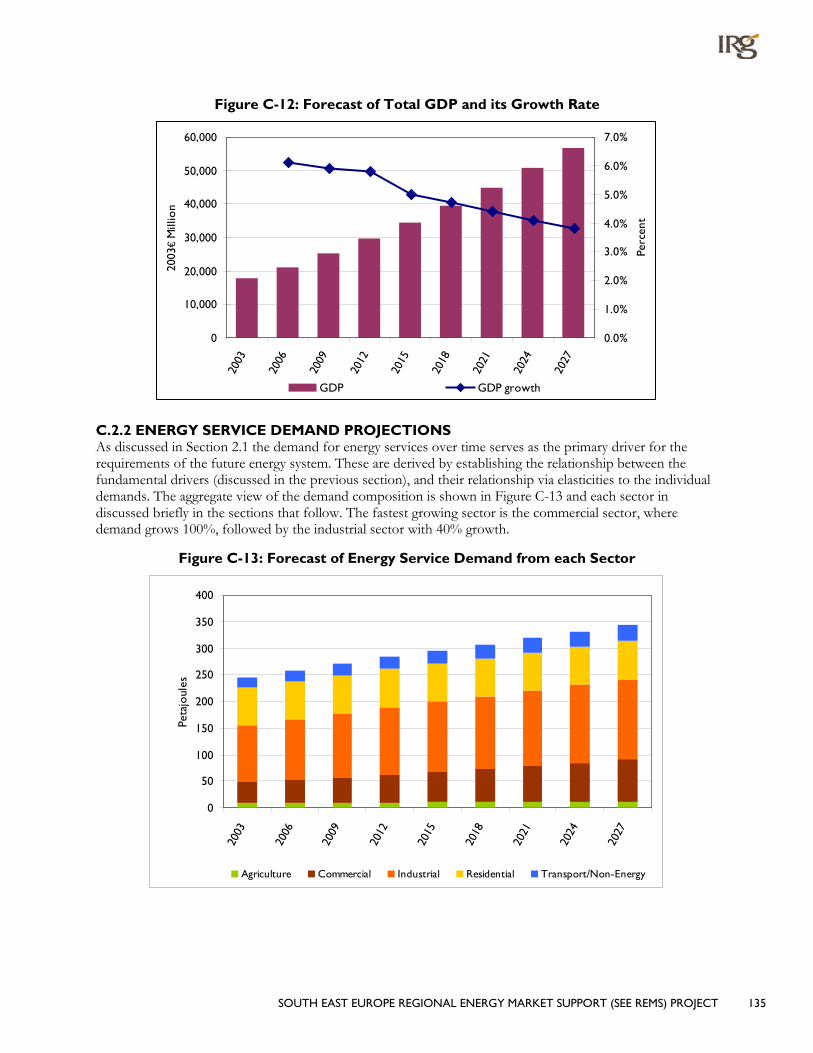
SOUTH EAST EUROPE REGIONAL ENERGY MARKET SUPPORT (SEE REMS) PROJECT 135
Figure C-12: Forecast of Total GDP and its Growth Rate
0
10,000
20,000
30,000
40,000
50,000
60,000
2003
2006
2009
2012
2015
2018
2021
2024
2027
2003
€ M
illio
n
0.0%
1.0%
2.0%
3.0%
4.0%
5.0%
6.0%
7.0%
Perc
ent
GDP GDP growth
C.2.2 ENERGY SERVICE DEMAND PROJECTIONS As discussed in Section 2.1 the demand for energy services over time serves as the primary driver for the requirements of the future energy system. These are derived by establishing the relationship between the fundamental drivers (discussed in the previous section), and their relationship via elasticities to the individual demands. The aggregate view of the demand composition is shown in Figure C-13 and each sector in discussed briefly in the sections that follow. The fastest growing sector is the commercial sector, where demand grows 100%, followed by the industrial sector with 40% growth.
Figure C-13: Forecast of Energy Service Demand from each Sector
0
50
100
150
200
250
300
350
400
2003
2006
2009
2012
2015
2018
2021
2024
2027
Peta
joul
es
Agriculture Commercial Industrial Residential Transport/Non-Energy

136 SOUTH EAST EUROPE REGIONAL ENERGY MARKET SUPPORT (SEE REMS) PROJECT
C.2.2.1 RESIDENTIAL SECTOR The main driving factors for calculation of energy demand in the residential sector are reduction in the number of households [see Figure C-10] and the evolution of residential living away from rural and towards more single family central urban dwellings, as shown in Figure C-14.
Figure C-14: Composition of Residential Dwellings over Time
0%
10%20%
30%
40%50%
60%
70%
80%90%
100%20
03
2006
2009
2012
2015
2018
2021
2024
2027
Apartments - Urban Single House - Urban - CentralSingle House - Urban - Local Single House - Rural - Local
The residential sector is second in importance with respect to energy today, though the commercial sector is expected to surpass it near the end of the study horizon. Figure C-15 shows how consumption in the residential sector is expected to decrease, mainly due to migration from rural housing to more efficient urban central dwellings.
Figure C-15: Residential Demand for Energy Services (Useful Energy)
0.00
5.00
10.00
15.00
20.00
25.00
2003
2006
2009
2012
2015
2018
2021
2024
2027
Peta
joul
es
Lightning Other Electricity Dish WashingFridges & Freezers Clothes Washing Clothes Drying
C.2.2.2 COMMERCIAL SECTOR The commercial building stock is forecast to almost double across the Reference scenario time horizon, driven by evolution toward a service economy and higher standards of living.

SOUTH EAST EUROPE REGIONAL ENERGY MARKET SUPPORT (SEE REMS) PROJECT 137
In the Reference scenario, energy demand in the service sector will be 2 times higher in the year 2027 than in 2003, as reflected in Figure C-16. The major source of this growth is a fourfold increase in space cooling demand, with increases on the order of 50% for the other energy services.
Figure C-16: Commercial Demand for Energy Services (Useful Energy)
0
10
20
30
40
50
60
70
80
9020
03
2006
2009
2012
2015
2018
2021
2024
2027
Peta
joul
es
Heating Hot Water Cooling CookingLightning Other Electricity Public Lighting Fridges & Freezers
C.2.2.3 INDUSTRIAL SECTOR The driving factor in forecast energy demand in the industrial sector is the estimated contribution to GDP, which is mapped to increase in service demands in the various sectors by means of elasticities which relate future GDP growth to each sector’s demand growth. This growth is moderated by an autonomous energy efficiency improvement (AEEI) factor as noted in Table C-1 that indicates non-technology improvements (e.g., management practices and process changes).
Table C-1: Demand Elasticities Demand Type Elasticity AEI Overall growth
High-temperature heat 0.50 0.015 27%
Low-temperature heat 0.60 0.010 60%
Mechanical drive 0.60 0.005 80%
The resulting demand growth is shown in Figure C-17. Chemical and Other are the fastest growing industrial demands, Iron and Steel, Paper, and Non-metallic Minerals are the other growing industrial demands. Overall industrial demand grows more slowly than the commercial sector, increasing 40% over the forecast horizon.

138 SOUTH EAST EUROPE REGIONAL ENERGY MARKET SUPPORT (SEE REMS) PROJECT
Figure C-17: Industrial Demand for Energy Services (Useful Energy)
0
20
40
60
80
100
120
140
160
2003
2006
2009
2012
2015
2018
2021
2024
2027
Peta
joul
es
Chemical Food Iron Steel Non-metallic Paper Non-ferrous Other
C.2.2.4 AGRICULTURE As in industry, agricultural energy demands are projected by means of an elasticity relating demand growth to GDP growth. For Bulgaria, an elasticity of 0.60 was used, resulting in a 80% growth of energy service demand. Agriculture remains a small portion of total energy service demand, as shown in Figure C-17, above.
C.2.2.5 TRANSPORT AND NON-ENERGY USE Electricity demand for transport is projected based on population growth, and hence decreases by 9% over the forecast period. However, non-energy demand for gas (consumed for fertilizer) increases by 50% by 2027.
C.2.3 ENERGY SUPPLY AND PRICES Figure 2-2 in the Regional section shows the trend of energy prices based on the EU NEEDS Project. These trends are applied to recent energy prices in Bulgaria to produce forecasts of future prices across the time horizon of this study. As noted earlier, it is assumed that the countries of the region will be confronted by the prevailing EU prices soon, so any country differentials at the border are removed beginning in 2015.
Besides the border price influencing the price seen by the consumer for each energy form, a distinction is made with respect to internal distribution costs to the different sectors. The “mark-ups” is based upon the situation in 2003, shown in Table C-2 below, and held constant over the planning horizon.
Table C-2: Sector Fuel Price “Mark-Ups” (M2003€/PJ)
Fuel
Sectors
Residential Commercial Agriculture Industry
Hard Coal 1.490 1.490 1.490 0.000 Brown Coal Briquettes 3.149 3.149 3.149 -1.125 Lignite 0.000 Light fuel 13.575 13.575 13.575 Heavy fuel 5.216 5.216 5.216 -0.158 LPG Gas 2.738 2.131 2.738 0.107 Electricity 2.024 1.012 2.024 Low-temperature heat 0.000 0.219 0.000 0.437
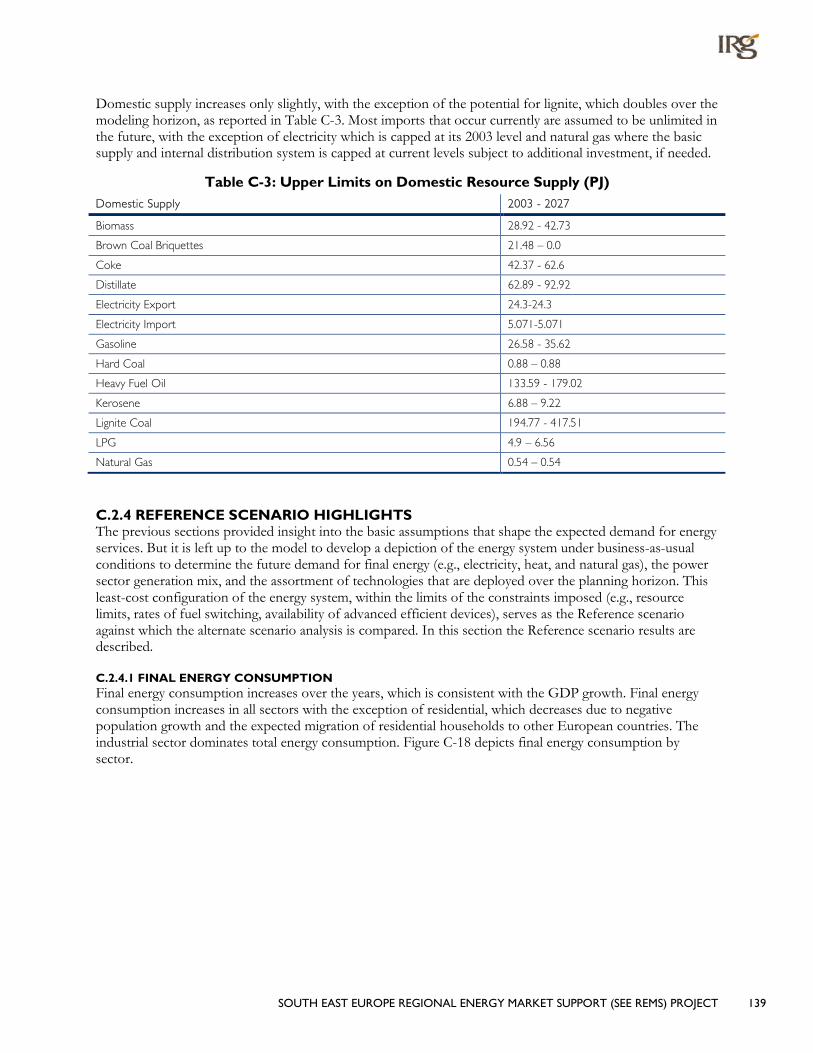
SOUTH EAST EUROPE REGIONAL ENERGY MARKET SUPPORT (SEE REMS) PROJECT 139
Domestic supply increases only slightly, with the exception of the potential for lignite, which doubles over the modeling horizon, as reported in Table C-3. Most imports that occur currently are assumed to be unlimited in the future, with the exception of electricity which is capped at its 2003 level and natural gas where the basic supply and internal distribution system is capped at current levels subject to additional investment, if needed.
Table C-3: Upper Limits on Domestic Resource Supply (PJ) Domestic Supply 2003 - 2027
Biomass 28.92 - 42.73
Brown Coal Briquettes 21.48 – 0.0
Coke 42.37 - 62.6
Distillate 62.89 - 92.92
Electricity Export 24.3-24.3
Electricity Import 5.071-5.071
Gasoline 26.58 - 35.62
Hard Coal 0.88 – 0.88
Heavy Fuel Oil 133.59 - 179.02
Kerosene 6.88 – 9.22
Lignite Coal 194.77 - 417.51
LPG 4.9 – 6.56
Natural Gas 0.54 – 0.54
C.2.4 REFERENCE SCENARIO HIGHLIGHTS The previous sections provided insight into the basic assumptions that shape the expected demand for energy services. But it is left up to the model to develop a depiction of the energy system under business-as-usual conditions to determine the future demand for final energy (e.g., electricity, heat, and natural gas), the power sector generation mix, and the assortment of technologies that are deployed over the planning horizon. This least-cost configuration of the energy system, within the limits of the constraints imposed (e.g., resource limits, rates of fuel switching, availability of advanced efficient devices), serves as the Reference scenario against which the alternate scenario analysis is compared. In this section the Reference scenario results are described.
C.2.4.1 FINAL ENERGY CONSUMPTION Final energy consumption increases over the years, which is consistent with the GDP growth. Final energy consumption increases in all sectors with the exception of residential, which decreases due to negative population growth and the expected migration of residential households to other European countries. The industrial sector dominates total energy consumption. Figure C-18 depicts final energy consumption by sector.
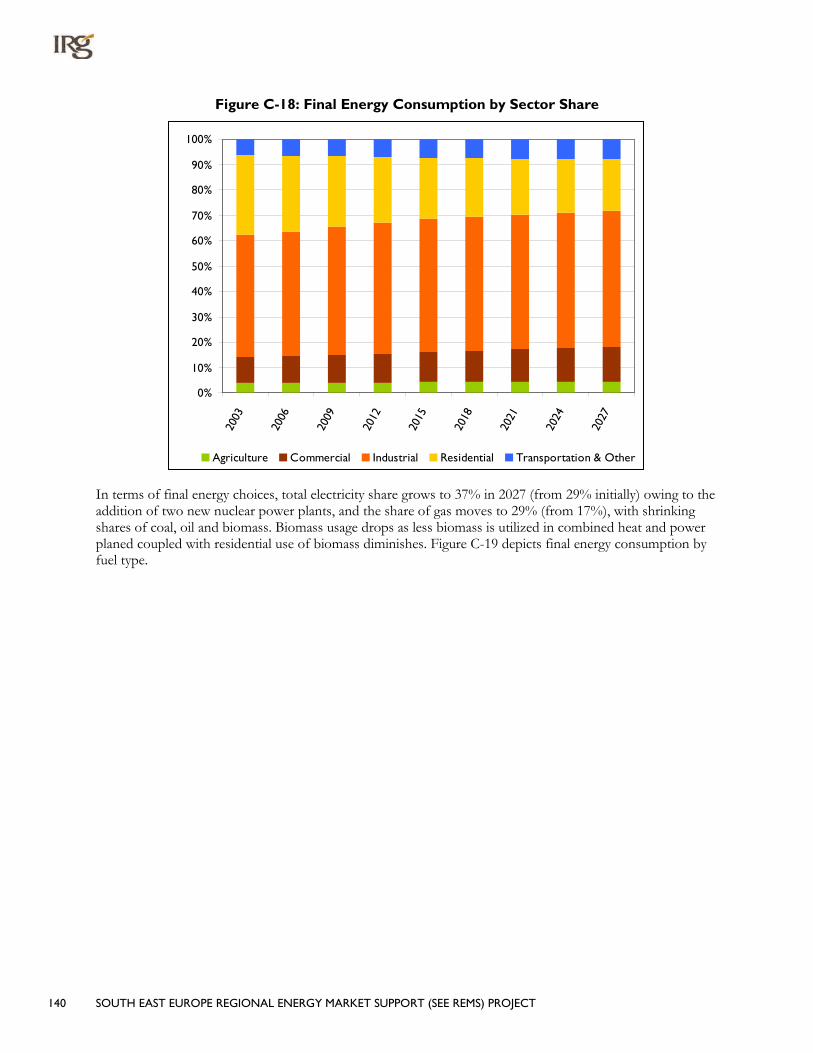
140 SOUTH EAST EUROPE REGIONAL ENERGY MARKET SUPPORT (SEE REMS) PROJECT
Figure C-18: Final Energy Consumption by Sector Share
0%
10%
20%
30%
40%
50%
60%
70%
80%
90%
100%
2003
2006
2009
2012
2015
2018
2021
2024
2027
Agriculture Commercial Industrial Residential Transportation & Other
In terms of final energy choices, total electricity share grows to 37% in 2027 (from 29% initially) owing to the addition of two new nuclear power plants, and the share of gas moves to 29% (from 17%), with shrinking shares of coal, oil and biomass. Biomass usage drops as less biomass is utilized in combined heat and power planed coupled with residential use of biomass diminishes. Figure C-19 depicts final energy consumption by fuel type.

SOUTH EAST EUROPE REGIONAL ENERGY MARKET SUPPORT (SEE REMS) PROJECT 141
Figure C-19: Final Energy Consumption by Fuel
0
50
100
150
200
250
300
350
400
2003
2006
2009
2012
2015
2018
2021
2024
2027
Peta
joul
es
Coal Oil Natural Gas LPG Electricity Biomass Renewables (other) Low-temperature Heat
More detail is provided on the composition of final energy delivered to each sector in the sections that follow.
C.2.4.1.1 Residential Sector As already noted, the demand for energy in the residential sector is expected to drop as much as 25% owing to the decrease in population, and improved building shell associated with the changing stock of housing. In terms of fuel choice, there is a transition from coal and fuelwood to electricity for space heating. In addition, the sector experiences an increase in the penetration of electric appliances and rapid acceptance of air conditioning. LPG growth is second to that of electricity, while the district heating system remains steady. As a result electricity in the residential sector grows slightly to 40%, with a peak of 46% when the new nuclear plants first come online. During the lean nuclear years and in the out years LPG picks up the remaining increase in rural heating and urban hot water demands. Figure C-20 depicts final energy consumption in the residential sector.

142 SOUTH EAST EUROPE REGIONAL ENERGY MARKET SUPPORT (SEE REMS) PROJECT
Figure C-20: Final Energy Consumption - Residential
0
20
40
60
80
100
120
2003
2006
2009
2012
2015
2018
2021
2024
2027
Peta
joul
es
Coal Oil Natural Gas LPG Electricity Biomass Renewables (other) Low-temperature Heat
C.2.4.1.2 Commercial Sector The commercial sector is experiencing the most rapid growth of all the sectors, with final energy demand increasing by some 54%. As noted earlier, a substantial part of this is due to commercial air conditioning demand rising in earnest beginning 2012 (to a total of 75% by 2027), thereby dramatically increasing demand for electricity within the sector. Natural gas also makes an increasingly important contribution to meeting the heating and hot water demand, moving from 4% to 15% of total final energy to the sector. Due to availability and use of natural gas, oil consumption drops to zero by 2027. Figure C-21 depicts final energy consumption by the commercial sector.

SOUTH EAST EUROPE REGIONAL ENERGY MARKET SUPPORT (SEE REMS) PROJECT 143
Figure C-21: Final Energy Consumption - Commercial
0
10
20
30
40
50
2003
2006
2009
2012
2015
2018
2021
2024
2027
Peta
joul
es
Coal Oil Natural Gas LPG Electricity Biomass Low-temperature Heat
C.2.4.1.3 Industrial Sector In the Reference scenario energy demand for industry will increase 31% by 2027. The evolution of the fuel mix for industry is shown in Figure C-22. As was the case in the commercial sector, the low electricity prices and gas distribution capacity have the industrial sector increasingly turning to these fuels, displacing oil and coal consumption. Interestingly there is also an uptake in biomass in the industrial sector to provide high-temperature heat to the food and chemical industries.
Figure C-22: Final Energy Consumption - Industry
0
50
100
150
200
2003
2006
2009
2012
2015
2018
2021
2024
2027
Peta
joul
es
Coal Oil Natural Gas LPG Electricity Biomass Low-temperature Heat

144 SOUTH EAST EUROPE REGIONAL ENERGY MARKET SUPPORT (SEE REMS) PROJECT
C.2.4.1.4 Agriculture Sector Figure C-23 shows the evolution of the principal fuels used in the agricultural sector for the Reference scenario. Diesel consumption is foreseen to increase considerably in the future to support agricultural production growth and replace manual labor. There is also some potential for geothermal to be used for heating greenhouses.
Figure C-23: Final Energy Consumption - Agriculture
0
2
4
6
8
10
12
14
16
18
2003
2006
2009
2012
2015
2018
2021
2024
2027
Peta
joul
es
Coal Oil Natural Gas LPG Electricity Biomass Renewables (other) Low-temperature Heat
C.2.4.2 ELECTRICITY GENERATION REQUIREMENTS Figure C-24 depicts Forecast of Electricity Demand according to MARKAL and the National Electricity Company (NEC) Projection Plan (GWh).
The actual values for 2003 for final electricity consumption are used and the projections start from a common value of 25 104 GWh. Unfortunately, data are not available for the period after 2021 and the projection from the NEC end at that date.
The difference between the MARKAL projection and the National Electricity Company (NEC) is due to the fact that the NEC is a trading company and its main goal is to increase its trade and revenues each year; thus additional exports of electricity are planned.
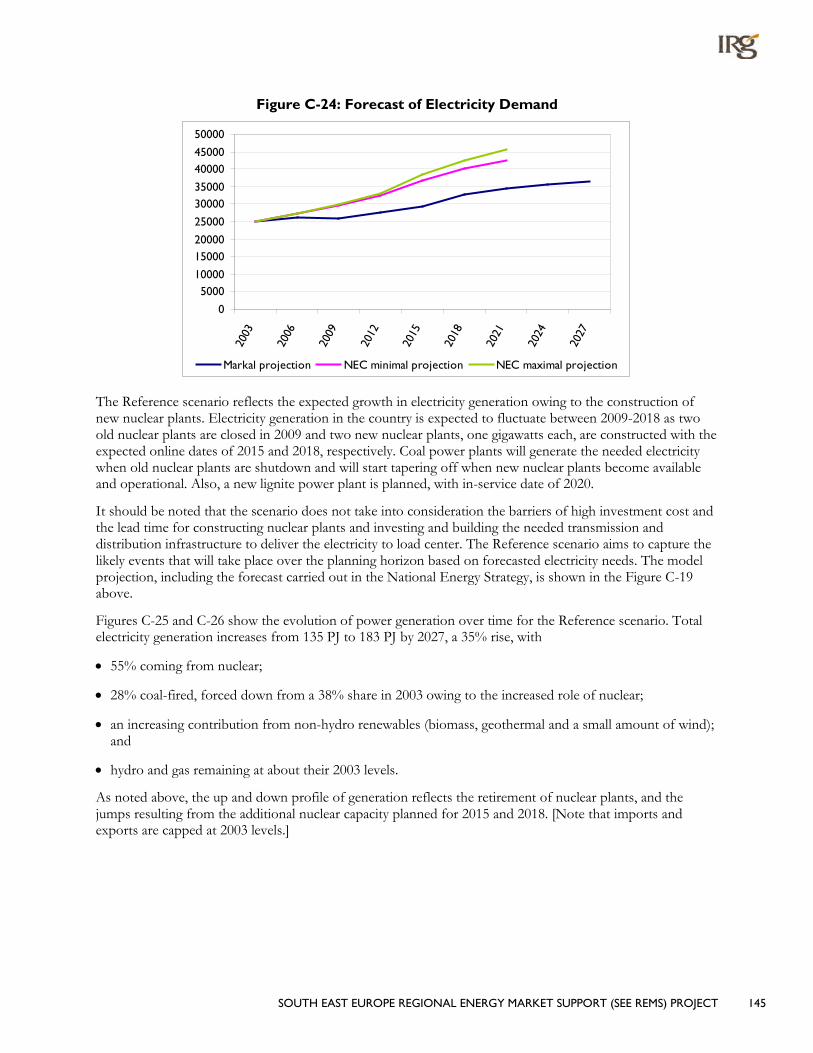
SOUTH EAST EUROPE REGIONAL ENERGY MARKET SUPPORT (SEE REMS) PROJECT 145
Figure C-24: Forecast of Electricity Demand
0
500010000
1500020000
25000
3000035000
4000045000
50000
2003
2006
2009
2012
2015
2018
2021
2024
2027
Markal projection NEC minimal projection NEC maximal projection
The Reference scenario reflects the expected growth in electricity generation owing to the construction of new nuclear plants. Electricity generation in the country is expected to fluctuate between 2009-2018 as two old nuclear plants are closed in 2009 and two new nuclear plants, one gigawatts each, are constructed with the expected online dates of 2015 and 2018, respectively. Coal power plants will generate the needed electricity when old nuclear plants are shutdown and will start tapering off when new nuclear plants become available and operational. Also, a new lignite power plant is planned, with in-service date of 2020.
It should be noted that the scenario does not take into consideration the barriers of high investment cost and the lead time for constructing nuclear plants and investing and building the needed transmission and distribution infrastructure to deliver the electricity to load center. The Reference scenario aims to capture the likely events that will take place over the planning horizon based on forecasted electricity needs. The model projection, including the forecast carried out in the National Energy Strategy, is shown in the Figure C-19 above.
Figures C-25 and C-26 show the evolution of power generation over time for the Reference scenario. Total electricity generation increases from 135 PJ to 183 PJ by 2027, a 35% rise, with
• 55% coming from nuclear;
• 28% coal-fired, forced down from a 38% share in 2003 owing to the increased role of nuclear;
• an increasing contribution from non-hydro renewables (biomass, geothermal and a small amount of wind); and
• hydro and gas remaining at about their 2003 levels.
As noted above, the up and down profile of generation reflects the retirement of nuclear plants, and the jumps resulting from the additional nuclear capacity planned for 2015 and 2018. [Note that imports and exports are capped at 2003 levels.]

146 SOUTH EAST EUROPE REGIONAL ENERGY MARKET SUPPORT (SEE REMS) PROJECT
Figure C-25: Electricity Generation by Fuel
0
10000
20000
30000
40000
50000
60000
2003
2006
2009
2012
2015
2018
2021
2024
2027
Gig
awat
t H
our
s
Nuclear power plants Coal-fired power plantsGas-fired power plants Hydroelectric power plantsRenewable and Other power plants
Figure C-26: Share of the Electricity Generation by Fuel
0%
10%
20%
30%
40%
50%
60%
70%
80%
90%
100%
2003
2006
2009
2012
2015
2018
2021
2024
2027
Nuclear power plants Coal-fired power plantsGas-fired power plants Hydroelectric power plantsRenewable and Other power plants
C.2.4.3 ENERGY SUPPLY The supply of energy, from domestic sources and imports, for the Reference scenario is shown in Figures C-27 and C-28. The primary energy supply increases slightly over the planning period with the exception of 2009, when the nuclear units are shutdown. The supplies of coal and nuclear energy are highly dependent on each other. When nuclear power production decreases, the baseload coal power plants increase production.

SOUTH EAST EUROPE REGIONAL ENERGY MARKET SUPPORT (SEE REMS) PROJECT 147
Primary energy use in the country increases by 17% by 2027, with
• nuclear providing the bulk of the additional energy requirements, increasing from 38% to 43%;
• coal dropping from 31% down to 25%;
• biomass supply doubling;
• natural gas holding pretty much steady; and
• oil consumption (outside of the transportation sector) dropping by 50%.
Figure C-27: Energy Supply by Type
0
100
200
300
400
500
600
700
800
2003
2006
2009
2012
2015
2018
2021
2024
2027
Peta
joul
es
Nuclear Coal Oil Natural Gas LPG Electricity Imports Biomass
Figure C-28: Energy Supply by Type (Shares)
0%
10%
20%
30%
40%
50%
60%
70%
80%
90%
100%
2003
2006
2009
2012
2015
2018
2021
2024
2027
Nuclear Coal Oil Natural Gas LPG Electricity Imports Biomass

148 SOUTH EAST EUROPE REGIONAL ENERGY MARKET SUPPORT (SEE REMS) PROJECT
C.2.4.4 COSTS Over the course of the planning horizon there is a constant trade-off between investments in the power sector and demand devices and expenditure on fuel. This trade-off usually takes the form of spending more to purchase more efficient demand technologies versus making large investments in the power sector and spending more on fuels. In the Reference scenario
• Fuel expenditures increase slightly during the planning horizon following the trend in production;
• Annualized power plant investments increase due to the fact that two nuclear power plants, one GW each, are planned to be constructed in years 2015 and 2018; and
• Annualized investments in power plants and demand devices reach €1.588 billion in 2021 and €1.73 billion in 2027, with investment in efficient demand devices increasing 4 times over the planning horizon.
C.3 SCENARIO ANALYSIS HIGHLIGHTS Providing increased access to energy efficient demand technologies, and further promoting their uptake by means of policies aimed at reducing electricity consumption or improving energy intensity (total consumption / GDP) results in various changes to the evolution of the energy system. The information below thus reflects results of the R90/R90E/R90P scenarios, respectively. In general, the three scenarios represent progressively more demanding changes in the energy system, as their relative results illustrate.
• Primary energy use in the country decrease by 5/8/13% by 2027, with a corresponding improvement in energy intensity, where the main fuel shift is a reduction in coal consumption, particularly in the R90P scenario.
• Imports drop by 5.8/6.9/7.6% by 2027, improving energy security.
• Owing to the substantial availability of nuclear power, improved demand devices only result in a 4% reduction in the demand for electricity on their own. This increases t to a 10% reduction when improvement in overall energy intensity is imposed on the system.
– Two major nuclear power plants come online when available in 2015 and 2018.
– Less coal retrofit is called for in the R90E/P scenarios when further energy efficiency is encouraged.
– Some biomass fueled power plants built in the Reference scenario are not required in the later periods.
• The R90 scenario results in an overall savings of €391 million over the 27-year modeling horizon, and €183 million in the R90E scenario.
– Fuel expenditure decreases by €240/217/291 million per year by 2027, or 12.1/10.9/14.7% below the Reference.
– Annualized investments in power plants drop only slightly in the R90/R90E scenarios, but increase by 11.5% (€56 million annually in 2027) as the system moves to more efficient power plants under the pressure to improve overall energy intensity.
– At the same time, annual investments for new demand devices need to rise by 10.6/12.9/16.7%, (€132-203 million annually in 2027).
So the analysis conducted here serves to illustrate the merits of promoting increased energy efficiency through policies and programs aimed at improving the overall performance of the energy system.

SOUTH EAST EUROPE REGIONAL ENERGY MARKET SUPPORT (SEE REMS) PROJECT 149
C.3.1 FINAL ENERGY CONSUMPTION PATTERNS Final energy consumption decreases as was the case for energy supply. The main reason for this drop is the fact that more energy efficient technologies are made available to replace the inefficient technologies. The Residential sector is the most dominant beneficiary of utilizing more energy efficient technologies, as shown in Figure C-29. Final energy consumption for the Residential sector drops dramatically between the Reference scenario and other scenarios but more importantly with the R90P scenario, Enhanced Energy Efficiency.
Figure C-29: Final Energy Consumption by Fuel
0
50
100
150
200
250
300
350
400
2003
2006
2009
2012
2015
2018
2021
2024
2027
2003
2006
2009
2012
2015
2018
2021
2024
2027
2003
2006
2009
2012
2015
2018
2021
2024
2027
2003
2006
2009
2012
2015
2018
2021
2024
2027
R0 R90 R90E R90P
Peta
joul
es
Coal Oil Natural Gas LPG Electricity Biomass Renewables (other) Low-temperature Heat
Figure C-30 depicts the savings in Final Energy Consumption by Sector. As noted above, the Residential sector is the major player in utilizing more energy efficient demand devices, thus reducing energy consumption in the out years. The Industrial sector is the second major player in reducing energy consumption by investing in more energy efficient demand devices. This shift in reduced energy consumption could only happen if strong national energy conservation programs are in place that provide enough incentives.

150 SOUTH EAST EUROPE REGIONAL ENERGY MARKET SUPPORT (SEE REMS) PROJECT
Figure C-30: Savings in Final Energy by Sector
0
5
10
15
20
25
30
35
40
2003
2006
2009
2012
2015
2018
2021
2024
2027
2003
2006
2009
2012
2015
2018
2021
2024
2027
2003
2006
2009
2012
2015
2018
2021
2024
2027
R90 R90E R90P
Peta
joul
es
Agriculture Commercial Industrial Residential Transportation & Other
C.3.2 POWER SECTOR INVESTMENTS AND ELECTRICITY GENERATION As has already been discussed, the Bulgarian power sector is dominated by generation of electricity from nuclear plants, trading off against lignite fired plants. As can be seen in Figure C-31 this situation is most obvious in the 2009-2012 period where the coal must step-in to offset the loss of nuclear generating capacity, then reversed in 2015 and 2018 as new nuclear plants come online. And owing to this base of nuclear power the Bulgaria energy system has a lot of inertia (or a lack of incentive) to take measures that impact electricity consumption. Thus, the introduction of energy efficient technologies only reduces electricity consumption by 4.4%, requiring the introduction of policy to achieve more substantial reductions. As shown in Figure C-31 these measures can more than double this savings, while keeping the cost of the energy system below the Reference level. But it must be noted that export markets are not factored into the model decision-making, where efficiency might be of more interest so as to increase the amount of electricity available for export.
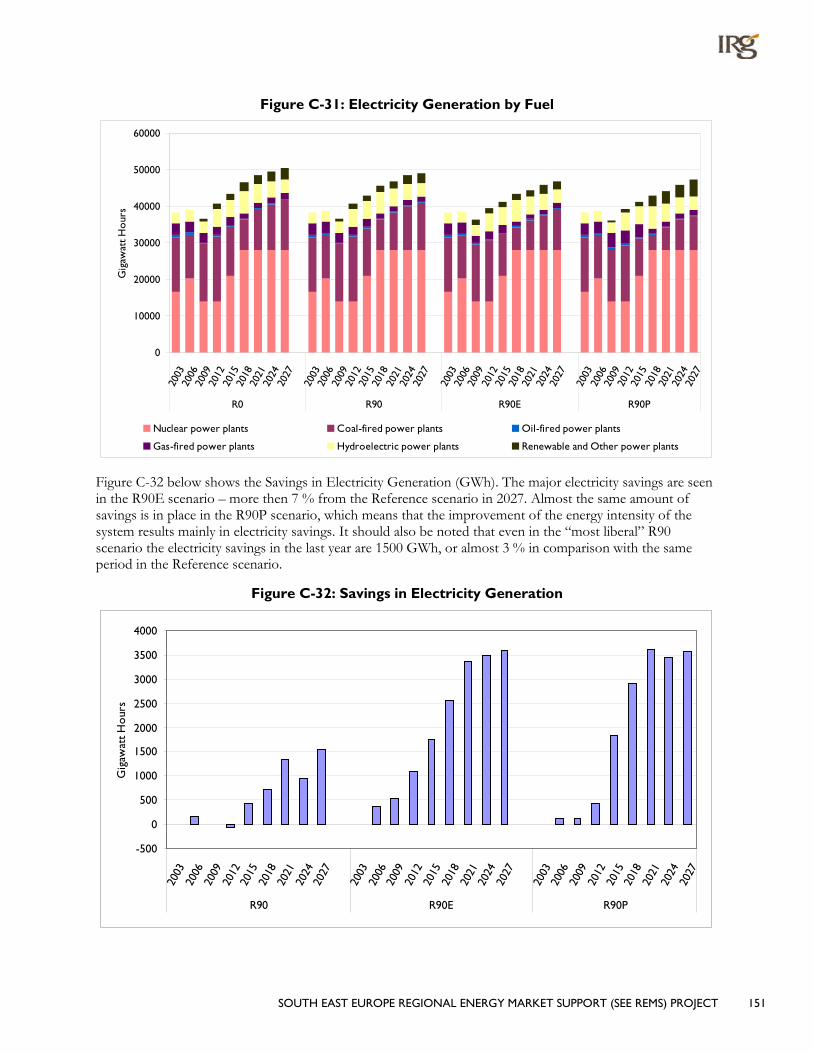
SOUTH EAST EUROPE REGIONAL ENERGY MARKET SUPPORT (SEE REMS) PROJECT 151
Figure C-31: Electricity Generation by Fuel
0
10000
20000
30000
40000
50000
60000
2003
2006
2009
2012
2015
2018
2021
2024
2027
2003
2006
2009
2012
2015
2018
2021
2024
2027
2003
2006
2009
2012
2015
2018
2021
2024
2027
2003
2006
2009
2012
2015
2018
2021
2024
2027
R0 R90 R90E R90P
Gig
awat
t H
our
s
Nuclear power plants Coal-fired power plants Oil-fired power plants
Gas-fired power plants Hydroelectric power plants Renewable and Other power plants
Figure C-32 below shows the Savings in Electricity Generation (GWh). The major electricity savings are seen in the R90E scenario – more then 7 % from the Reference scenario in 2027. Almost the same amount of savings is in place in the R90P scenario, which means that the improvement of the energy intensity of the system results mainly in electricity savings. It should also be noted that even in the “most liberal” R90 scenario the electricity savings in the last year are 1500 GWh, or almost 3 % in comparison with the same period in the Reference scenario.
Figure C-32: Savings in Electricity Generation
-500
0
500
1000
1500
2000
2500
3000
3500
4000
2003
2006
2009
2012
2015
2018
2021
2024
2027
2003
2006
2009
2012
2015
2018
2021
2024
2027
2003
2006
2009
2012
2015
2018
2021
2024
2027
R90 R90E R90P
Gig
awat
t H
our
s

152 SOUTH EAST EUROPE REGIONAL ENERGY MARKET SUPPORT (SEE REMS) PROJECT
In terms of the foreseen timing for the investment in new, or refurbishment of existing, power plants, as shown in Figure C-33 the new nuclear plants dominate the power sector landscape. Even when unavailable they impact the energy system by forcing the need to build a 600MW lignite power plant and retrofit another 300MW, or increase imports.
Figure C-33: Investments in New (and Refurbished) Power Plants
0
500
1000
1500
2000
2500
3000
1 2 3 4 5 6 7 8 9 10 11 12 13 14 15 16 17 18 19 20 21 22 23 24 25 26 27 28 29 30 31 32 33 34 35
R0 R90 R90E R90P
2003
€ M
illio
n
Nuclear power plants Coal-fired power plants Gas-fired power plants
Hydroelectric power plants Renewable and Other power plants
C.3.3 ENERGY SUPPLY PICTURE The place to start understanding of the impacts of the various alternative scenarios is to examine the change in the supply of energy to the country. As can be seen in Figure C-34 there is a direct correlation between the additional nuclear capacity and the need for coal. There is also a tendency to reduce oil and biomass as the system seeks to become more and more efficient. One can also observe an overall drop in total energy consumed, the savings increasing as sterner policies are put in place at an incrementally higher cost for the energy system, as discussed in section C.3.4.
Note the pressure on the energy system in 2009-2012, where there is a noticeable shift in the nuclear/coal trade-off pattern. The “bump” in coal consumption is due to the closing of a nuclear plant, thus resulting in a need for increased electricity generation from coal (lignite) during that period.
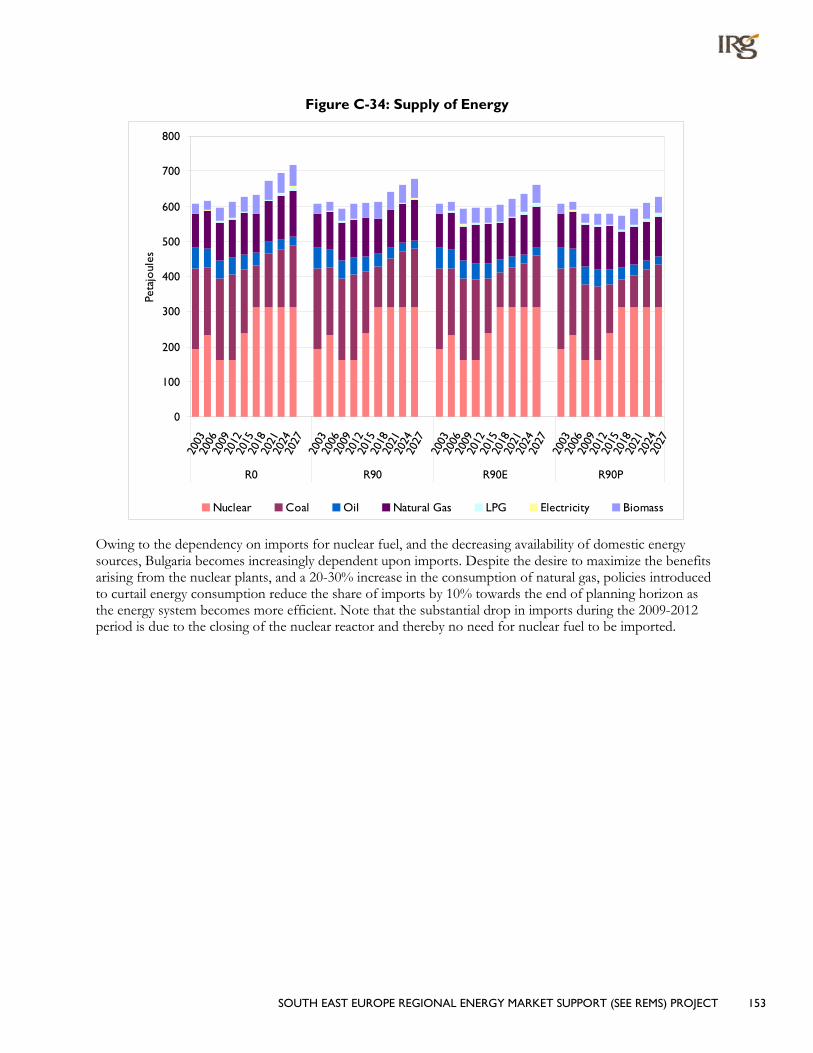
SOUTH EAST EUROPE REGIONAL ENERGY MARKET SUPPORT (SEE REMS) PROJECT 153
Figure C-34: Supply of Energy
0
100
200
300
400
500
600
700
800
2003
2006
2009
2012
2015
2018
2021
2024
2027
2003
2006
2009
2012
2015
2018
2021
2024
2027
2003
2006
2009
2012
2015
2018
2021
2024
2027
2003
2006
2009
2012
2015
2018
2021
2024
2027
R0 R90 R90E R90P
Peta
joul
es
Nuclear Coal Oil Natural Gas LPG Electricity Biomass
Owing to the dependency on imports for nuclear fuel, and the decreasing availability of domestic energy sources, Bulgaria becomes increasingly dependent upon imports. Despite the desire to maximize the benefits arising from the nuclear plants, and a 20-30% increase in the consumption of natural gas, policies introduced to curtail energy consumption reduce the share of imports by 10% towards the end of planning horizon as the energy system becomes more efficient. Note that the substantial drop in imports during the 2009-2012 period is due to the closing of the nuclear reactor and thereby no need for nuclear fuel to be imported.

154 SOUTH EAST EUROPE REGIONAL ENERGY MARKET SUPPORT (SEE REMS) PROJECT
Figure C-35: Total Imports
300
350
400
450
500
550
2003
2006
2009
2012
2015
2018
2021
2024
2027
Peta
joul
es
R0 R90 R90E R90P
An important measure of the competitiveness of an economy is its overall energy intensity, or the amount of energy delivered (consumed) per unit of GDP. The table below shows the improvement in the energy intensity of the Bulgarian energy system for the three policy scenarios. In the case of the R90 and R90E scenarios the overall cost of the energy system also falls. The R90P shows that a 12.64% improvement can be achieved with the overall cost of the energy system not exceeding that of the less efficient Reference scenario but promoting energy efficiency and setting a policy to lower total consumption of energy.
Table C-4: Percentage Change from R0 2027 percentage change from R0
R90 5.38%
R90E 7.88%
R90P 12.64%
C.3.4 COSTS Figure C-36 depicts the total discounted system cost of all four scenarios. System costs reflect closely the degree of the intensity of energy efficiency and conservation programs introduced through the policy scenarios. The R90 scenario which allows increased access to more energy efficient technologies is the least cost scenario over the planning horizon. The total discounted system cost drops by 1.2% from the Reference scenario. When the 10% energy conservation policy is introduced, scenario R90E, the total discounted system cost still shows improvement as compared to the Reference scenario but not as much as R90 scenario. The policy goal of Improve Energy Intensity, Scenario R90P, results in nearly the same total discounted system cost as the Reference scenario, but with an 8% improvement in the country’s energy intensity.

SOUTH EAST EUROPE REGIONAL ENERGY MARKET SUPPORT (SEE REMS) PROJECT 155
Figure C-36: Total Discounted Energy System Cost
46,300
46,400
46,500
46,600
46,700
46,800
46,900
47,000
R0 R90
R90E
R90P
Mill
ion
Euro
s
Figure C-37 depicts the scenarios’ Annual Energy System Expenditures. The total expenditures for all four scenarios are the same but re-distributed from fuel expenditures to more investments in demand devices. This is expected since the policy scenarios’ goals were to reduce fuel consumptions and increase energy efficiency through the introduction of more advanced and efficient demand technologies. This result can also be interpreted as growth in the economic activities (i.e., doing more for less) at the expense of fuel savings for the increased investment in demand technologies.
Figure C-37: Annual Energy System Expenditures
0
500
1000
1500
2000
2500
3000
3500
4000
2006
2009
2012
2015
2018
2021
2024
2027
2006
2009
2012
2015
2018
2021
2024
2027
2006
2009
2012
2015
2018
2021
2024
2027
2006
2009
2012
2015
2018
2021
2024
2027
R0 R90 R90E R90P
2003
€ M
illio
n
Annual Inv Power Sector Annual Inv Demand Expenditure on Fuel
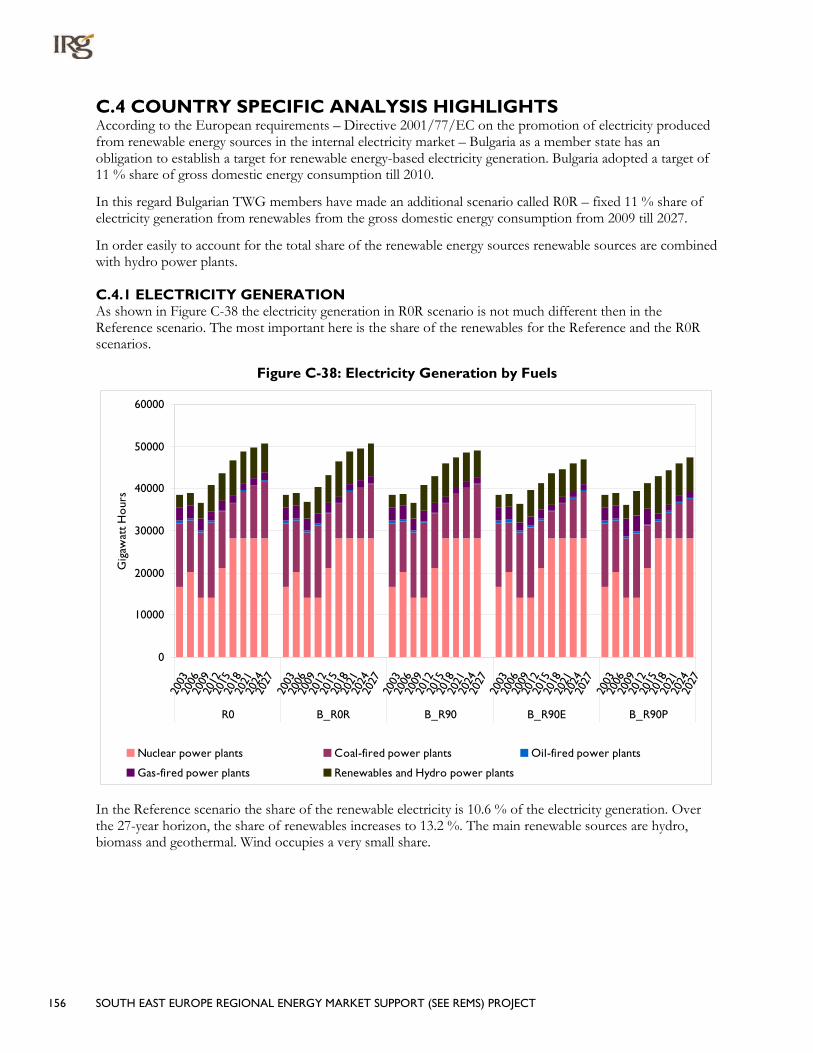
156 SOUTH EAST EUROPE REGIONAL ENERGY MARKET SUPPORT (SEE REMS) PROJECT
C.4 COUNTRY SPECIFIC ANALYSIS HIGHLIGHTS According to the European requirements – Directive 2001/77/EC on the promotion of electricity produced from renewable energy sources in the internal electricity market – Bulgaria as a member state has an obligation to establish a target for renewable energy-based electricity generation. Bulgaria adopted a target of 11 % share of gross domestic energy consumption till 2010.
In this regard Bulgarian TWG members have made an additional scenario called R0R – fixed 11 % share of electricity generation from renewables from the gross domestic energy consumption from 2009 till 2027.
In order easily to account for the total share of the renewable energy sources renewable sources are combined with hydro power plants.
C.4.1 ELECTRICITY GENERATION As shown in Figure C-38 the electricity generation in R0R scenario is not much different then in the Reference scenario. The most important here is the share of the renewables for the Reference and the R0R scenarios.
Figure C-38: Electricity Generation by Fuels
0
10000
20000
30000
40000
50000
60000
2003
2006
2009
2012
2015
2018
2021
2024
2027
2003
2006
2009
2012
2015
2018
2021
2024
2027
2003
2006
2009
2012
2015
2018
2021
2024
2027
2003
2006
2009
2012
2015
2018
2021
2024
2027
2003
2006
2009
2012
2015
2018
2021
2024
2027
R0 B_R0R B_R90 B_R90E B_R90P
Gig
awat
t H
our
s
Nuclear power plants Coal-fired power plants Oil-fired power plants
Gas-fired power plants Renewables and Hydro power plants
In the Reference scenario the share of the renewable electricity is 10.6 % of the electricity generation. Over the 27-year horizon, the share of renewables increases to 13.2 %. The main renewable sources are hydro, biomass and geothermal. Wind occupies a very small share.

SOUTH EAST EUROPE REGIONAL ENERGY MARKET SUPPORT (SEE REMS) PROJECT 157
Figure C-39: R0 2009 Electricity Generation by Fuels
Coal-fired power plants
43%
Nuclear power plants
38%
Oil-fired power plants
1%
Gas-fired power plants
7% Renewables and Hydro
power plants11%
Figure C-40: R0 2027 Electricity Generation by Fuels
Nuclear power plants
55%
Oil-fired power plants
1%
Gas-fired power plants
4%Renewables and Hydro
power plants13%
Coal-fired power plants
27%
When comparing the R0 and R0R scenarios, the increase in renewables is apparent, particularly in the last year when the share reaches 15.4 %. The main source is hydro energy followed by biomass and geothermal energy. Wind electricity is growing very fast especially in the last years. Solar production absent, owing to the high costs.
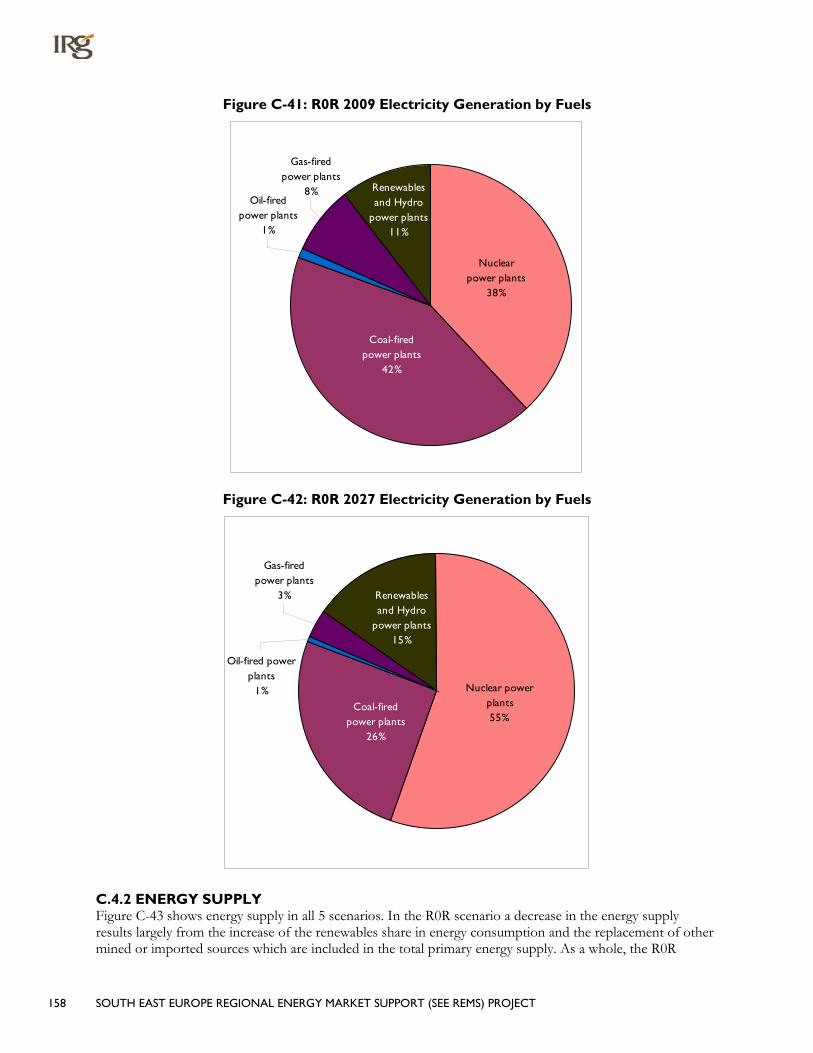
158 SOUTH EAST EUROPE REGIONAL ENERGY MARKET SUPPORT (SEE REMS) PROJECT
Figure C-41: R0R 2009 Electricity Generation by Fuels
Coal-fired power plants
42%
Nuclear power plants
38%
Renewables and Hydro
power plants11%
Gas-fired power plants
8%Oil-fired
power plants1%
Figure C-42: R0R 2027 Electricity Generation by Fuels
Nuclear power plants55%
Coal-fired power plants
26%
Oil-fired power plants
1%
Gas-fired power plants
3% Renewables and Hydro
power plants15%
C.4.2 ENERGY SUPPLY Figure C-43 shows energy supply in all 5 scenarios. In the R0R scenario a decrease in the energy supply results largely from the increase of the renewables share in energy consumption and the replacement of other mined or imported sources which are included in the total primary energy supply. As a whole, the R0R

SOUTH EAST EUROPE REGIONAL ENERGY MARKET SUPPORT (SEE REMS) PROJECT 159
scenario is more energy intensive in comparison with all other sensitivity runs. This is because of the starting point used there –access to more efficient technologies is still limited to 10 %.
Figure C-43: Primary Energy Supply
0
100
200
300
400
500
600
700
800
2003
2006
2009
2012
2015
2018
2021
2024
2027
2003
2006
2009
2012
2015
2018
2021
2024
2027
2003
2006
2009
2012
2015
2018
2021
2024
2027
2003
2006
2009
2012
2015
2018
2021
2024
2027
2003
2006
2009
2012
2015
2018
2021
2024
2027
R0 R0R R90 R90E R90P
Peta
joul
es
Nuclear Coal Oil Natural Gas LPG Electricity Biomass
C.4.3 CARBON DIOXIDE EMISSIONS Figure C-44 shows how the different measures contribute to reduction of carbon emissions. The big reduction in 2015 and 2018 is a result of the replacement of lignite power plant units with the new nuclear units. After 2020 a new lignite unit is expected so the emissions increase again.
The increased share of renewable energy sources in R0R, results in a small reduction in CO2 emissions. The R90 scenario with increased access to improved demand technologies shows better results. The energy efficiency scenarios – R90E and R90P –achieve the biggest contribution to the climate change mitigation – around 30 % in comparison with the 2003 values.
The main conclusion to be made is that the best way to reduce greenhouse gasses is by improving energy intensity, especially when this does not require an increase in system costs.

160 SOUTH EAST EUROPE REGIONAL ENERGY MARKET SUPPORT (SEE REMS) PROJECT
Figure C-44: CO2 Emissions
0
5000
10000
15000
20000
25000
30000
35000
2003
2006
2009
2012
2015
2018
2021
2024
2027
2003
2006
2009
2012
2015
2018
2021
2024
2027
2003
2006
2009
2012
2015
2018
2021
2024
2027
2003
2006
2009
2012
2015
2018
2021
2024
2027
2003
2006
2009
2012
2015
2018
2021
2024
2027
B_R0 B_R0R B_R90 B_R90E B_R90P
Tho
usan
d T
ons

SOUTH EAST EUROPE REGIONAL ENERGY MARKET SUPPORT (SEE REMS) PROJECT 161
D. CROATIA
D.1 HIGHLIGHTS
D.1.1 THE REFERENCE SCENARIO The evolution of the Croatian energy system under a Reference scenario is briefly summarized and illustrated in the charts below.
• Final energy consumption increases by 30%, from 189PJ in 2006 to 247PJ in 2027; electricity and gas, which are already dominant in 2006, remain thus in 2007.
Figure D-1: Fuel Shares in Final Energy Consumption
2006
LPG2%
Coal3%
Low-temp Heat12%
Renewable (other)
0%
Biomass7%
Electricity25% Natural Gas
31%
Oil20%
2027
Renewable (other)
0%
Coal5%
Low-temp Heat15%
Biomass4%
Electricity31%
LPG2%
Natural Gas31%
Oil12%
• Final consumption by sector shows mainly an increase in the share of the industrial sector and the commercial sector, at the expense of the residential sector.
Figure D-2: Sector Shares in Final Energy Consumption
2006
Transport & other6.4%
Agriculture5.5%
Residential43.2%
Commercial14.9%
Industrial30.0%
2027Transport &
other0.4%
Agriculture5.8%
Residential40.4%
Industrial36.8%
Commercial16.6%

162 SOUTH EAST EUROPE REGIONAL ENERGY MARKET SUPPORT (SEE REMS) PROJECT
• Electric Generation, driven by the growth in final demand, increases from 49 PJ in 2006 to 78PJ by 2027, a 57% increase14
– The share of coal generation increases, as coal-fired production quadruples.
.
– Natural gas production increases more slowly.
– Oil-fired plants maintain existing production, but no new plants are built.
– Hydro electric power plants have a decreasing share because very little additional potential beyond existing plants is assumed to exist.
Figure D-3: Share in Electricity Generation
2006
Nuclear power plants0%
Renewable and Other power
plants0%
Coal-fired power plants
16%
Gas-fired power plants
24%
Oil-fired power plants20%
Hydroelectric power plants
40%
2027
Nuclear power plants0%
Renewable and Other power
plants0%
Oil-fired power plants13%
Gas-fired power plants29%
Coal-fired power plants30%
Hydroelectric power plants
28%
• Primary Energy Supply in the country increases by 35% by 2027 or 1.1% per year, reflecting a GDP energy intensity decrease of more than 3% a year; with relatively stable shares for the different fuels:
– natural gas remains the principal fuel with a share around 45%, and
– oil and coal are the two main other fuel and there is slight shift away from oil to coal.
14 The exports and imports of electricity are capped to their 2006 level.
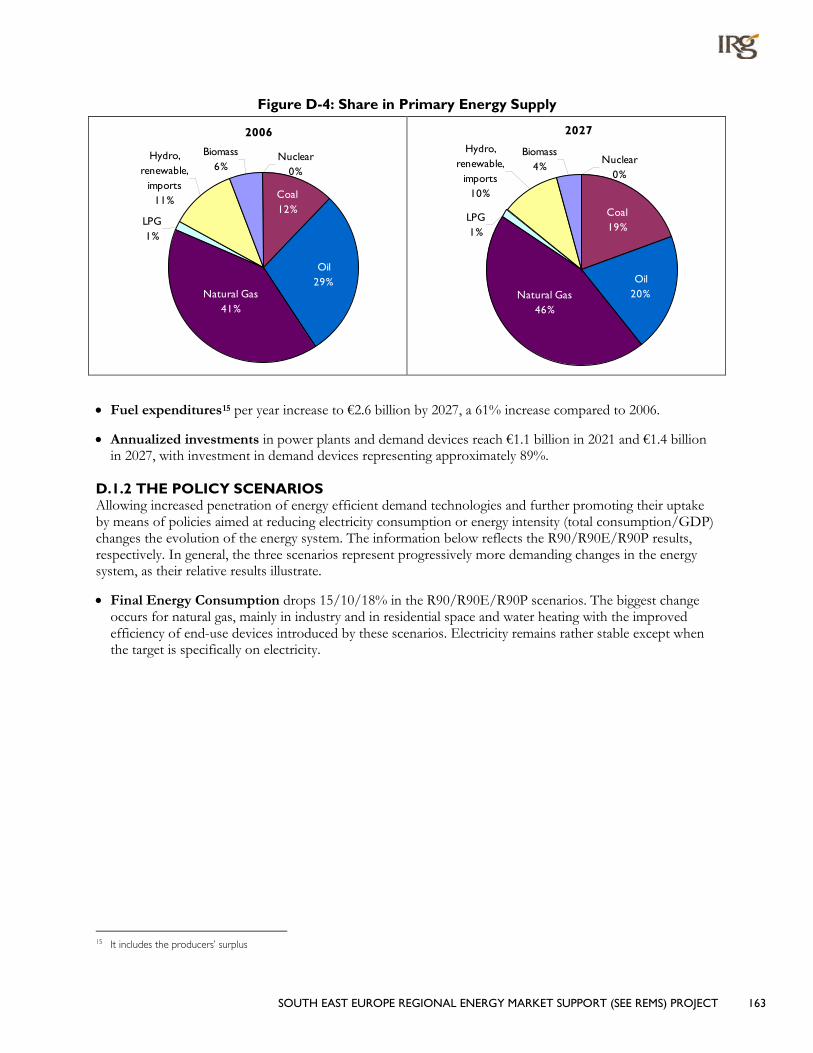
SOUTH EAST EUROPE REGIONAL ENERGY MARKET SUPPORT (SEE REMS) PROJECT 163
Figure D-4: Share in Primary Energy Supply
2006
Biomass6%
Nuclear0%
Hydro, renewable,
imports11%
LPG1%
Natural Gas41%
Coal12%
Oil29%
2027
Biomass4%
Nuclear0%
Hydro, renewable,
imports10%
LPG1%
Coal19%
Natural Gas46%
Oil20%
• Fuel expenditures15
• Annualized investments in power plants and demand devices reach €1.1 billion in 2021 and €1.4 billion in 2027, with investment in demand devices representing approximately 89%.
per year increase to €2.6 billion by 2027, a 61% increase compared to 2006.
D.1.2 THE POLICY SCENARIOS Allowing increased penetration of energy efficient demand technologies and further promoting their uptake by means of policies aimed at reducing electricity consumption or energy intensity (total consumption/GDP) changes the evolution of the energy system. The information below reflects the R90/R90E/R90P results, respectively. In general, the three scenarios represent progressively more demanding changes in the energy system, as their relative results illustrate.
• Final Energy Consumption drops 15/10/18% in the R90/R90E/R90P scenarios. The biggest change occurs for natural gas, mainly in industry and in residential space and water heating with the improved efficiency of end-use devices introduced by these scenarios. Electricity remains rather stable except when the target is specifically on electricity.
15 It includes the producers’ surplus
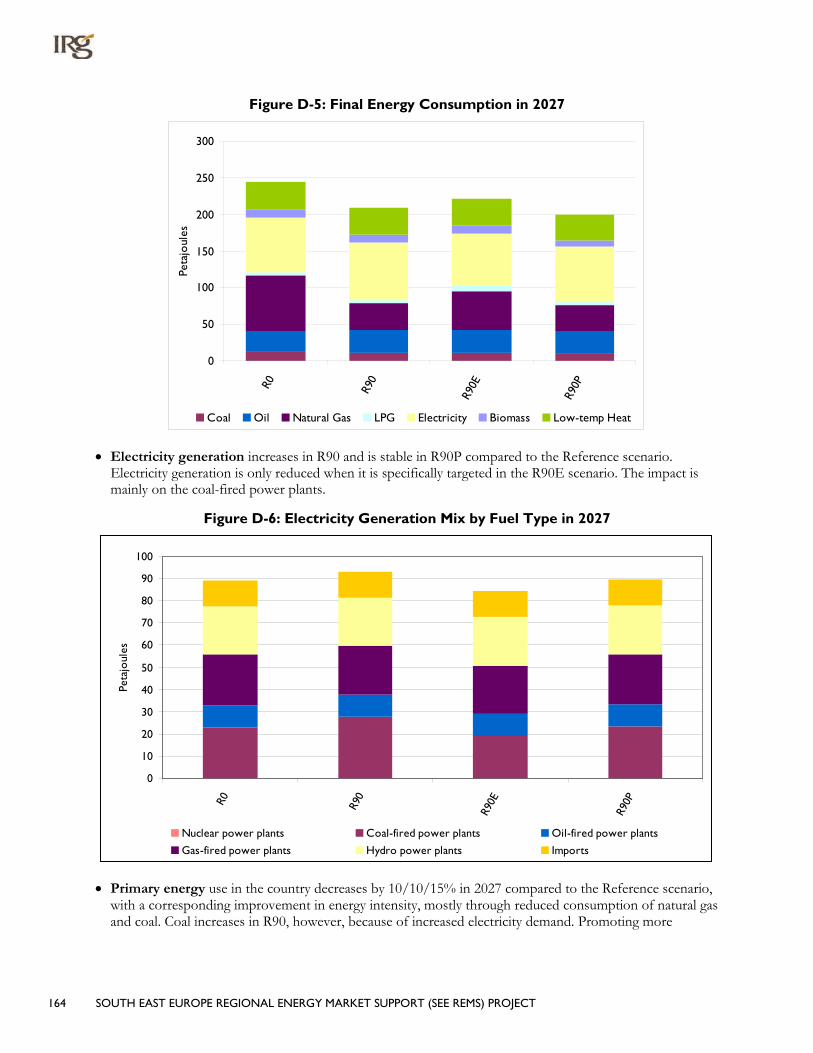
164 SOUTH EAST EUROPE REGIONAL ENERGY MARKET SUPPORT (SEE REMS) PROJECT
Figure D-5: Final Energy Consumption in 2027
0
50
100
150
200
250
300
R0 R90
R90E
R90P
Peta
joul
es
Coal Oil Natural Gas LPG Electricity Biomass Low-temp Heat
• Electricity generation increases in R90 and is stable in R90P compared to the Reference scenario. Electricity generation is only reduced when it is specifically targeted in the R90E scenario. The impact is mainly on the coal-fired power plants.
Figure D-6: Electricity Generation Mix by Fuel Type in 2027
0
10
20
30
40
50
60
70
80
90
100
R0 R90
R90E
R90P
Peta
joul
es
Nuclear power plants Coal-fired power plants Oil-fired power plants
Gas-fired power plants Hydro power plants Imports
• Primary energy use in the country decreases by 10/10/15% in 2027 compared to the Reference scenario, with a corresponding improvement in energy intensity, mostly through reduced consumption of natural gas and coal. Coal increases in R90, however, because of increased electricity demand. Promoting more

SOUTH EAST EUROPE REGIONAL ENERGY MARKET SUPPORT (SEE REMS) PROJECT 165
efficient electricity use (R90E) does not improve the overall efficiency of the energy system beyond that of the R90 scenario.
Figure D-7: Primary Energy Supply in 2027
0
50
100
150
200
250
300
350
R0 R90
R90E
R90P
Peta
joul
es
Coal Oil Natural Gas LPG Electricity Biomass
• The scenarios result in a reduction of the total discounted system cost compared to the Reference scenario. It is more pronounced in the R90 scenario where more efficient technologies are made available without any additional constraint. This is explained by the rather conservative assumption in the Reference scenario that capital constraints and consequent high discount rates in the end-use sector limit adoption of advanced devices. Allowing a gradual penetration of the more efficient technologies (R90) can reduce the total system cost by 2.1%, representing 1.5% of GDP in annualized terms. This shows the importance of promotion of these technologies. Imposing a further improvement in electric or the overall efficiency will increase the cost of the energy system compared to R9016
16 R90P does not reach the total system cost of R0, because it led to super high marginals, and thus this was deemed the highest economically
feasible reduction achievable.
. It is more costly, per unit of primary energy saved, to target only electricity consumption.

166 SOUTH EAST EUROPE REGIONAL ENERGY MARKET SUPPORT (SEE REMS) PROJECT
Figure D-8: Total Discounted System Cost
41800
42000
42200
42400
42600
42800
43000
43200
43400
43600
R0 R90
R90E
R90P
2003
€ M
illio
ns
• Imposing more energy efficiency not only reduces the total system cost but also induces a shift between investment and fuel cost.
D.2 ASSUMPTIONS FOR A REFERENCE SCENARIO
D.2.1 ASSUMPTIONS FOR THE DRIVERS’ GROWTH As explained in Section 2 , population growth and GDP evolution are the main determinants of the demand for energy services over time and thus for the evolution of the energy system. For the construction of the Reference scenario for Croatia, population growth, the trend in household size and GDP growth are based on national sources. Population and GDP growth are shown in the figures below.

SOUTH EAST EUROPE REGIONAL ENERGY MARKET SUPPORT (SEE REMS) PROJECT 167
Figure D-9: Trend of Population and its Growth Rate
4300
4350
4400
4450
4500
4550
4600
4650
4700
4750
4800
4850
2003
2006
2009
2012
2015
2018
2021
2024
2027
Tho
usan
ds
0.00%
0.10%
0.20%
0.30%
0.40%
0.50%
0.60%
0.70%
Perc
ent
Population Population growth
Figure D-10: Trend of Households and Number of Persons per Household
4300
4350
4400
4450
4500
4550
4600
4650
4700
4750
4800
4850
2003
2006
2009
2012
2015
2018
2021
2024
2027
Tho
usan
ds
1.9
2
2.1
2.2
2.3
2.4
2.5
2.6
2.7
Pers
ons
per
Ho
useh
old
Population Number of persons per household
The expected demographic trend for the period 2003-2027 (falling population growth rate and decline in household size, from 2.6 to 2.2 persons per household) is consistent with the trend observed throughout the EU.
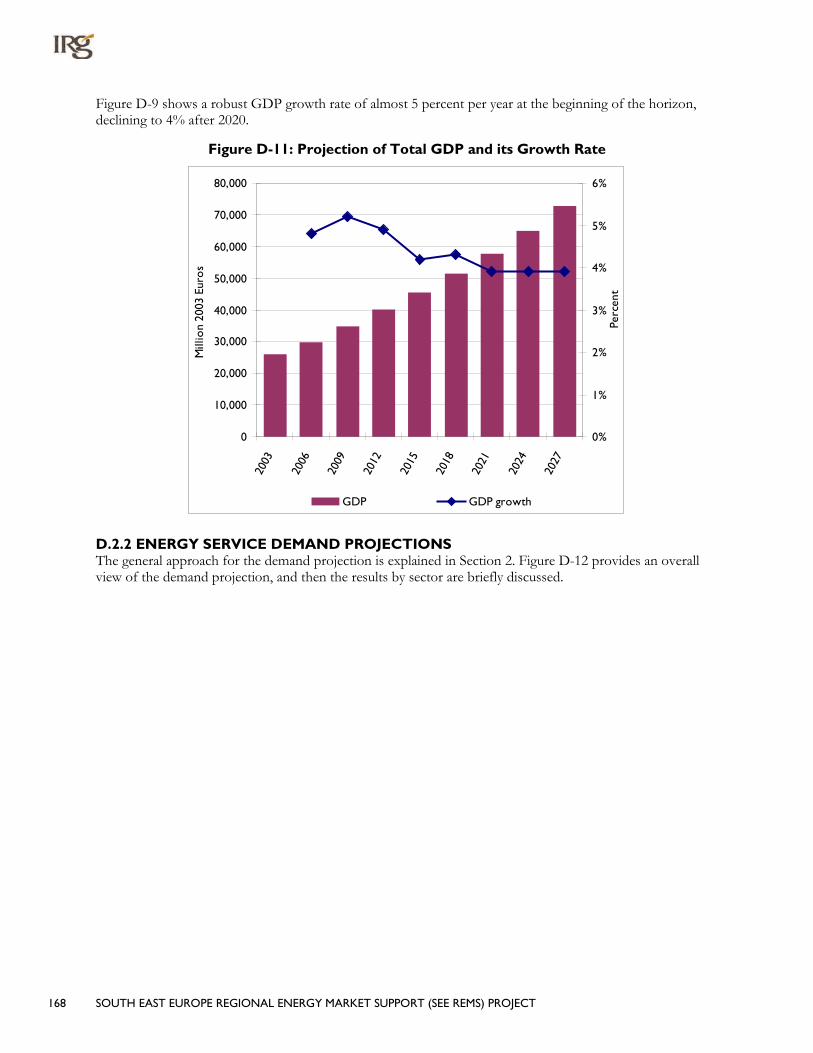
168 SOUTH EAST EUROPE REGIONAL ENERGY MARKET SUPPORT (SEE REMS) PROJECT
Figure D-9 shows a robust GDP growth rate of almost 5 percent per year at the beginning of the horizon, declining to 4% after 2020.
Figure D-11: Projection of Total GDP and its Growth Rate
0
10,000
20,000
30,000
40,000
50,000
60,000
70,000
80,000
2003
2006
2009
2012
2015
2018
2021
2024
2027
Mill
ion
2003
Eur
os
0%
1%
2%
3%
4%
5%
6%
Perc
ent
GDP GDP growth
D.2.2 ENERGY SERVICE DEMAND PROJECTIONS The general approach for the demand projection is explained in Section 2. Figure D-12 provides an overall view of the demand projection, and then the results by sector are briefly discussed.
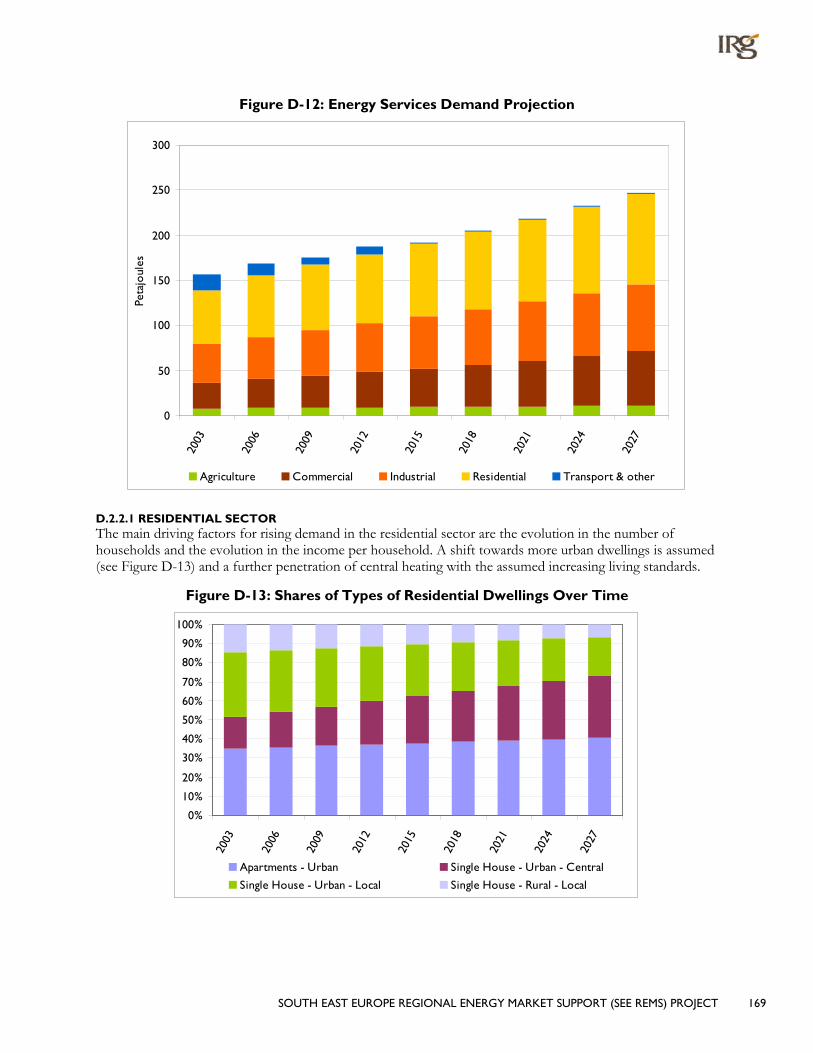
SOUTH EAST EUROPE REGIONAL ENERGY MARKET SUPPORT (SEE REMS) PROJECT 169
Figure D-12: Energy Services Demand Projection
0
50
100
150
200
250
300
2003
2006
2009
2012
2015
2018
2021
2024
2027
Peta
joul
es
Agriculture Commercial Industrial Residential Transport & other
D.2.2.1 RESIDENTIAL SECTOR The main driving factors for rising demand in the residential sector are the evolution in the number of households and the evolution in the income per household. A shift towards more urban dwellings is assumed (see Figure D-13) and a further penetration of central heating with the assumed increasing living standards.
Figure D-13: Shares of Types of Residential Dwellings Over Time
0%
10%
20%
30%
40%
50%
60%
70%
80%
90%
100%
2003
2006
2009
2012
2015
2018
2021
2024
2027
Apartments - Urban Single House - Urban - Central
Single House - Urban - Local Single House - Rural - Local

170 SOUTH EAST EUROPE REGIONAL ENERGY MARKET SUPPORT (SEE REMS) PROJECT
Total energy service demand increases 2% per year, from 63PJ in 2003 to 100PJ in 2027. The main growth is expected in demand for cooling, hot water and other electricity. Space heating demand is stable over the horizon and remains the predominant component of residential energy demand.
Figure D-14: Residential Energy Service Demand (Useful Energy)
0
20
40
60
80
100
12020
03
2006
2009
2012
2015
2018
2021
2024
2027
Peta
joul
es
Space Heating Water Heating Space Cooling Cooking Lighting Other electricity
D.2.2.2 COMMERCIAL SECTOR Though growth of the commercial sector follows GDP growth, demand for energy service does not directly track this trend because autonomous improved efficiency and the assumed decoupling of energy demand and commercial activity. Space heating remains the most important category but space cooling is the fastest growing segment of commercial demand. Total demand grows 3% per year from 30PJ in 2003 to 60PJ in 2027.

SOUTH EAST EUROPE REGIONAL ENERGY MARKET SUPPORT (SEE REMS) PROJECT 171
Figure D-15: Commercial Energy Service Demand (Useful Energy)
0
10
20
30
40
50
60
70
2003 2006 2009 2012 2015 2018 2021 2024 2027
Peta
joul
es
Space Heating Hot Water Space Cooling Cooking
Lighting Other electric Public Lighting
D.2.2.3 INDUSTRIAL SECTOR The driving factor for energy service demand in the industrial sector is the sector’s expected contribution to GDP. It is assumed that over the time horizon studied there is a shift towards less energy intensive industries and an autonomous efficiency improvement of around 1% per year.
Table D-1: Demand Elasticities Demand Type Elasticity AEI Overall growth
High-temperature heat 0.6 0.015 34%
Low-temperature heat 0.8 0.010 92%
Mechanical drive 1.0 0.005 151%
Over the period, demand grows 2.3% per year, from 43PJ to 74PJ. The growth among industry segments is shown in Figure D-16.

172 SOUTH EAST EUROPE REGIONAL ENERGY MARKET SUPPORT (SEE REMS) PROJECT
Figure D-16: Industrial Energy Service Demand (Useful Energy)
0
10
20
30
40
50
60
70
80
2003
2006
2009
2012
2015
2018
2021
2024
2027
Peta
joul
es
Chemicals Food Iron & Steel Non-metalic Minerals Paper Other Industries Non-ferrous metals
D.2.2.4 AGRICULTURE Agriculture’s contribution to GDP decreases in percentage terms over time. Owing to improved efficiency of the sector, the rate of growth of energy service demand is only 1.3% per year.
D.2.2.5 ELECTRICITY FOR TRANSPORT AND NON-ENERGY USE OF NATURAL GAS Electricity use for transport is assumed to follow GDP growth with an elasticity of 0.5, while the production of fertilizer based on natural gas is assumed to stop in 2012.
D.2.3 ENERGY RESOURCES AND REGIONAL ENERGY PRICES Croatia has domestic biomass and natural gas and some potential for wind and hydro. As shown in Table D-2, the supply of biomass and gas is assumed to remain close to the 2003 level. The potential hydro capacity is also only 10% higher than the existing capacity of 2.07GW and wind potential was estimated at 2.75GW. No limit on imports (except for electricity (capped to the 2003 level) is imposed.
Table D-2: Upper Limits on Domestic Resource 2003 - 2027
Annual Supply
Biomass 15 -16 PJ
Natural gas 77 – 82 PJ
Capacity
Hydro 2.31 GW
Wind 2.75 GW
The projected evolution of the energy prices is taken from the EU NEEDS project, as explained in Section 2. The evolution is then applied to the recent border energy prices in Croatia. The prices of domestic resources are assumed to follow the same evolution. These border prices are then adjusted by sector for the distribution

SOUTH EAST EUROPE REGIONAL ENERGY MARKET SUPPORT (SEE REMS) PROJECT 173
cost. The distribution costs are based on the situation prevailing in 2003 and held constant over the planning horizon.
Table D-3: Sector Fuel Distribution Cost (M2003€/PJ)
Fuel
Sectors
Residential Commercial Agriculture Industry
Hard Coal 0.267 0.267 0.267 0.267
Brown Coal 0.430 0.430 0.430 0.430
Lignite 0.430 0.430 0.430 0.430
Light fuel 0.000 0.000 0.000 0.000
Heavy fuel 0.000 0.000 0.000 0.000
LPG 0.000 0.000 0.000 0.000
Gas 2.773 2.835 2.773 2.742
Electricity 4.889 5.581 4.889 0.000
LTH 0.000 0.000 0.000 0.000
D.3 REFERENCE SCENARIO HIGHLIGHTS In the previous section the basic assumptions regarding GDP and population growth and the derived demand for energy services were briefly described. They serve as inputs to the model. The model then determines, under the conditions imposed in the Reference scenario, the future demand for final energy (e.g. electricity, heat, natural gas), the power sector generation mix and the assortment of technologies that are deployed over the planning horizon. This least-cost configuration of the energy system, within the limits of the constraints imposed (e.g., resource limits, rates of fuel switching, availability of advanced efficient devices), serves as the reference against which the alternate scenario analysis is compared. In this section the Reference scenario results are described in some more detail.
D.3.1 FINAL ENERGY CONSUMPTION Final energy consumption increases 1.2% per year (excluding non-energy use), with the highest growth rate in the industrial sector (1.9%). This evolution is clearly linked to the projections of energy service demand and their link to GDP growth. Industrial demand and to a lesser extent commercial demand follow GDP growth, though with a decoupling factor reflecting the elasticities and autonomous energy efficiency improvement assumptions in the demand projections. Residential consumption remains the largest single sector, but it grows more slowly than the others.
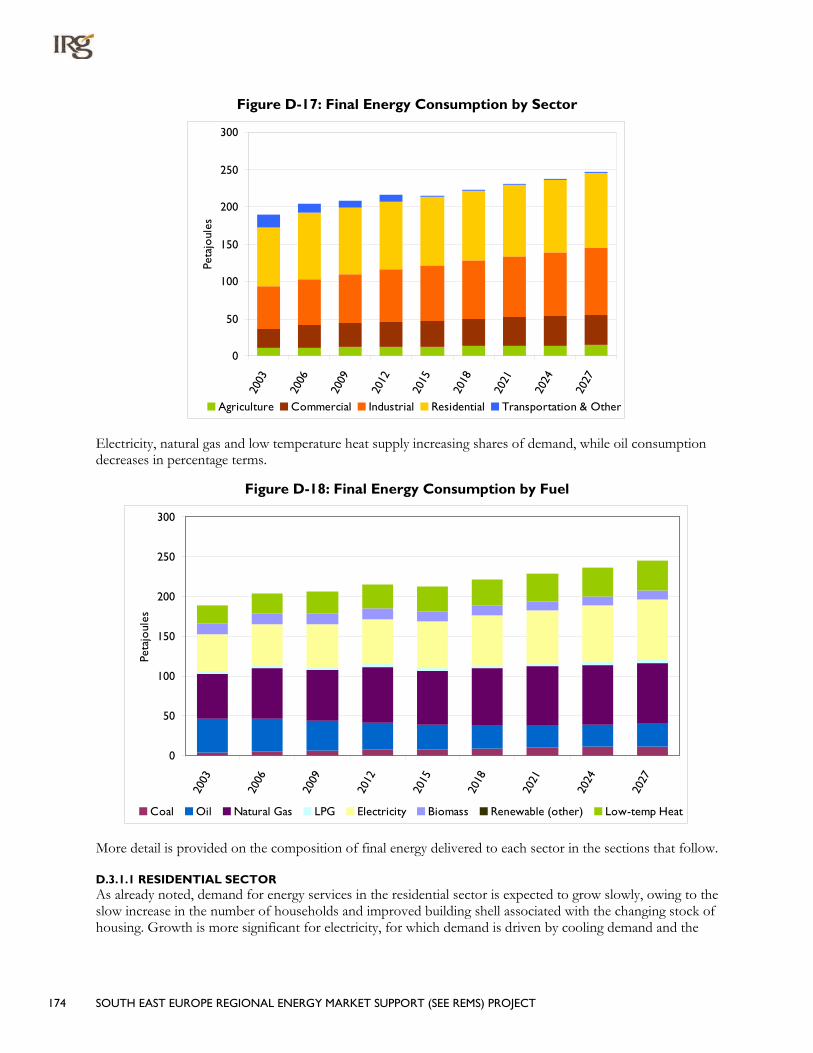
174 SOUTH EAST EUROPE REGIONAL ENERGY MARKET SUPPORT (SEE REMS) PROJECT
Figure D-17: Final Energy Consumption by Sector
0
50
100
150
200
250
300
2003
2006
2009
2012
2015
2018
2021
2024
2027
Peta
joul
es
Agriculture Commercial Industrial Residential Transportation & Other
Electricity, natural gas and low temperature heat supply increasing shares of demand, while oil consumption decreases in percentage terms.
Figure D-18: Final Energy Consumption by Fuel
0
50
100
150
200
250
300
2003
2006
2009
2012
2015
2018
2021
2024
2027
Peta
joul
es
Coal Oil Natural Gas LPG Electricity Biomass Renewable (other) Low-temp Heat
More detail is provided on the composition of final energy delivered to each sector in the sections that follow.
D.3.1.1 RESIDENTIAL SECTOR As already noted, demand for energy services in the residential sector is expected to grow slowly, owing to the slow increase in the number of households and improved building shell associated with the changing stock of housing. Growth is more significant for electricity, for which demand is driven by cooling demand and the

SOUTH EAST EUROPE REGIONAL ENERGY MARKET SUPPORT (SEE REMS) PROJECT 175
rising demand for lighting and appliances. Gas and, to a lesser extent, district heating replace oil, because of their cost efficiencies.17
Figure D-19: Residential Final Energy Consumption
0
20
40
60
80
100
120
2003
2006
2009
2012
2015
2018
2021
2024
2027
Peta
joul
es
Coal Oil Natural Gas LPG Electricity Biomass Low-temp Heat
D.3.1.2 COMMERCIAL SECTOR Commercial final energy demand increases by 1.4% per year. This increase is mostly satisfied by natural gas for meeting heating and hot water demand. Electricity demand growth is driven by the cooling demand.
Figure D-20: Commercial Final Energy Consumption
0
10
20
30
40
50
2003
2006
2009
2012
2015
2018
2021
2024
2027
Peta
joul
es
Coal Oil Natural Gas LPG Electricity Biomass Low-temp Heat
17 The increase in 2006 is due to heating degree days correction, 2003 being a warmer than average winter.
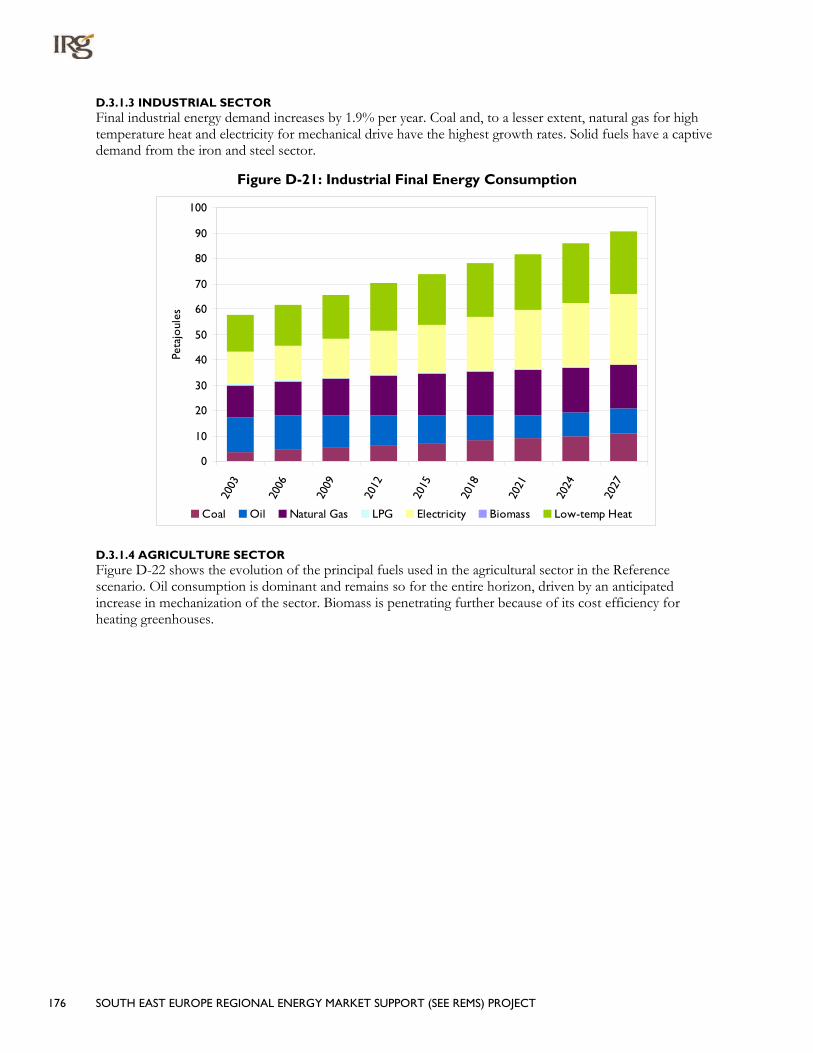
176 SOUTH EAST EUROPE REGIONAL ENERGY MARKET SUPPORT (SEE REMS) PROJECT
D.3.1.3 INDUSTRIAL SECTOR Final industrial energy demand increases by 1.9% per year. Coal and, to a lesser extent, natural gas for high temperature heat and electricity for mechanical drive have the highest growth rates. Solid fuels have a captive demand from the iron and steel sector.
Figure D-21: Industrial Final Energy Consumption
0
10
20
30
40
50
60
70
80
90
10020
03
2006
2009
2012
2015
2018
2021
2024
2027
Peta
joul
es
Coal Oil Natural Gas LPG Electricity Biomass Low-temp Heat
D.3.1.4 AGRICULTURE SECTOR Figure D-22 shows the evolution of the principal fuels used in the agricultural sector in the Reference scenario. Oil consumption is dominant and remains so for the entire horizon, driven by an anticipated increase in mechanization of the sector. Biomass is penetrating further because of its cost efficiency for heating greenhouses.

SOUTH EAST EUROPE REGIONAL ENERGY MARKET SUPPORT (SEE REMS) PROJECT 177
Figure D-22: Agriculture Final Energy Consumption
0
2
4
6
8
10
12
14
16
2003
2006
2009
2012
2015
2018
2021
2024
2027
Peta
joul
es
Coal Oil Natural Gas LPG
Electricity Biomass Renewables (other) Low-temp Heat
D.3.2 ELECTRICITY GENERATION REQUIREMENTS The evolution of electricity generation in the Reference scenario reflects the increase in electricity demand from all sectors, an average of 2.2% per year. This increased demand is satisfied by an increase in coal and gas power plants, as can be seen in Figure D-23 and Figure D-24:
• Additional gas power plants are brought on line at the beginning of the horizon for the most part to fill the new capacity needed when existing coal plants are gradually retired;
• Coal plants penetrate after 2015, when the price of coal relative to gas becomes more competitive and when the more efficient coal power plants are becoming available18
• Hydro potential is fully utilized from 2010 onwards.
; and
18 The Croatian TWG considered that only the IGCC plant could be installed.
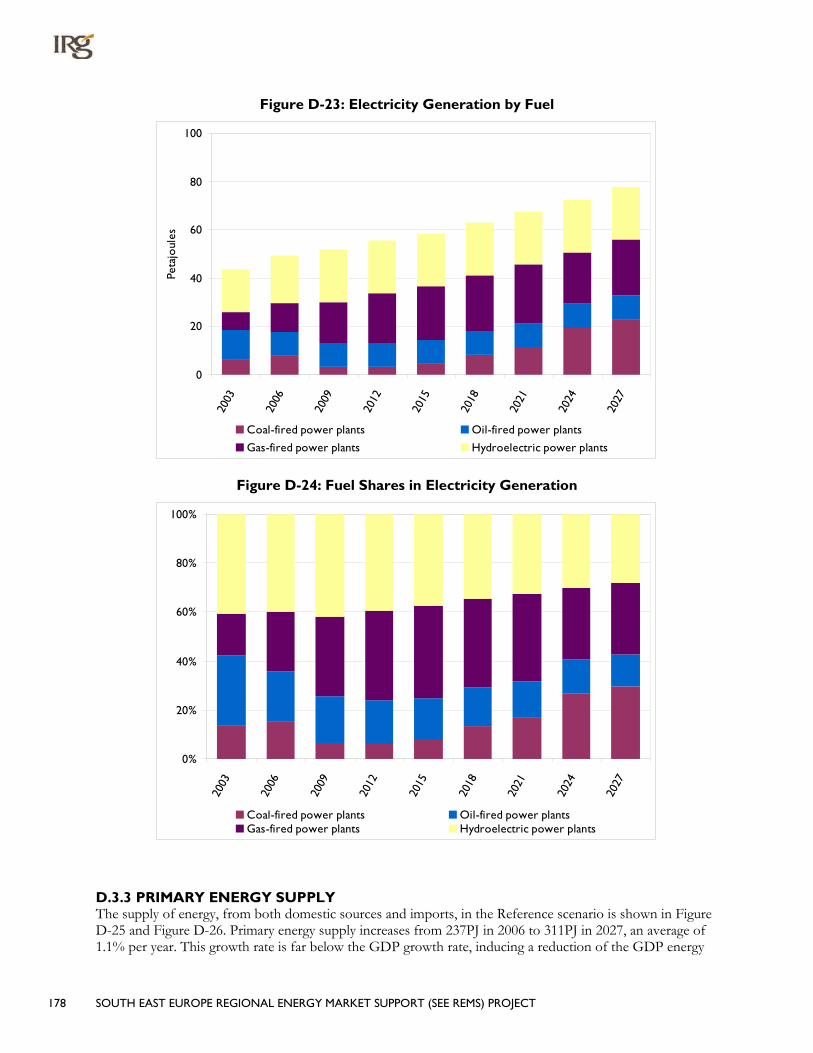
178 SOUTH EAST EUROPE REGIONAL ENERGY MARKET SUPPORT (SEE REMS) PROJECT
Figure D-23: Electricity Generation by Fuel
0
20
40
60
80
100
2003
2006
2009
2012
2015
2018
2021
2024
2027
Peta
joul
es
Coal-fired power plants Oil-fired power plants
Gas-fired power plants Hydroelectric power plants
Figure D-24: Fuel Shares in Electricity Generation
0%
20%
40%
60%
80%
100%
2003
2006
2009
2012
2015
2018
2021
2024
2027
Coal-fired power plants Oil-fired power plantsGas-fired power plants Hydroelectric power plants
D.3.3 PRIMARY ENERGY SUPPLY The supply of energy, from both domestic sources and imports, in the Reference scenario is shown in Figure D-25 and Figure D-26. Primary energy supply increases from 237PJ in 2006 to 311PJ in 2027, an average of 1.1% per year. This growth rate is far below the GDP growth rate, inducing a reduction of the GDP energy
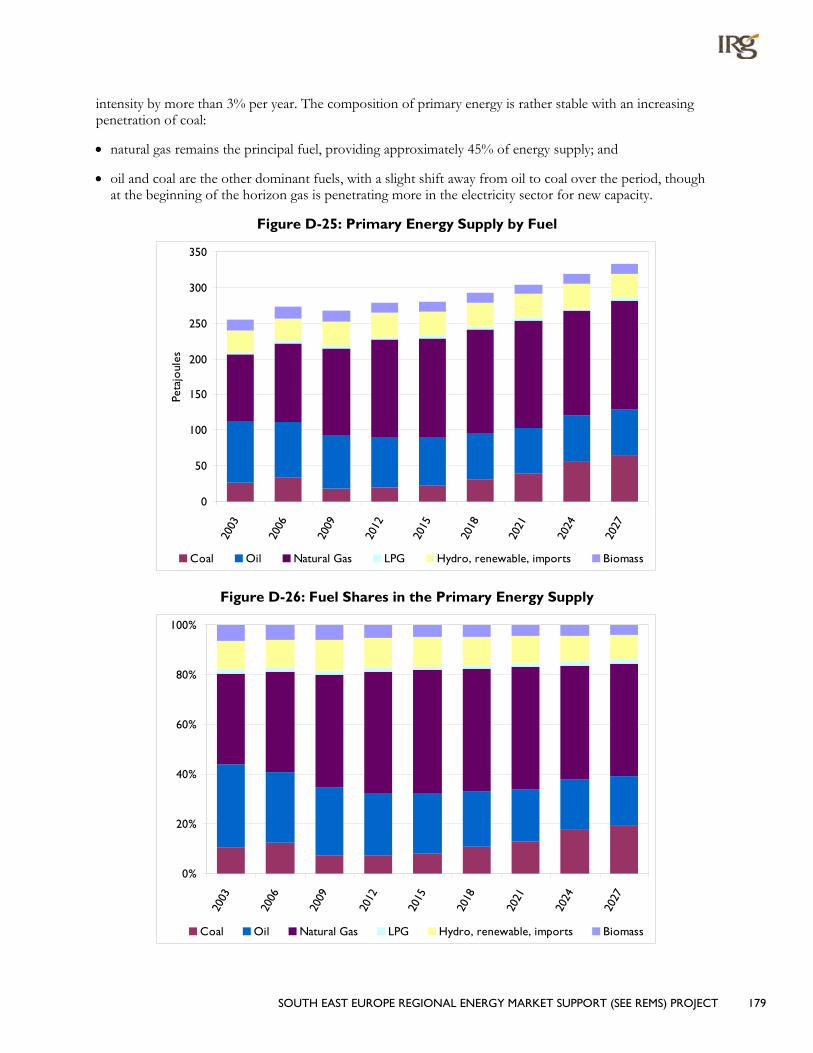
SOUTH EAST EUROPE REGIONAL ENERGY MARKET SUPPORT (SEE REMS) PROJECT 179
intensity by more than 3% per year. The composition of primary energy is rather stable with an increasing penetration of coal:
• natural gas remains the principal fuel, providing approximately 45% of energy supply; and
• oil and coal are the other dominant fuels, with a slight shift away from oil to coal over the period, though at the beginning of the horizon gas is penetrating more in the electricity sector for new capacity.
Figure D-25: Primary Energy Supply by Fuel
0
50
100
150
200
250
300
350
2003
2006
2009
2012
2015
2018
2021
2024
2027
Peta
joul
es
Coal Oil Natural Gas LPG Hydro, renewable, imports Biomass
Figure D-26: Fuel Shares in the Primary Energy Supply
0%
20%
40%
60%
80%
100%
2003
2006
2009
2012
2015
2018
2021
2024
2027
Coal Oil Natural Gas LPG Hydro, renewable, imports Biomass

180 SOUTH EAST EUROPE REGIONAL ENERGY MARKET SUPPORT (SEE REMS) PROJECT
D.3.4 COSTS Over the course of the planning horizon there is a constant trade-off between investments in the power sector and demand devices and expenditure on fuel. In the Reference scenario, with the increasing fuel prices over the time horizon, this trade-off takes the form of spending more on investment in more efficient demand technologies and power plant versus spending more on fuels.
• Fuel expenditures increase by 43% over projection period from €1.862 billion to €2.660 billion
• Annualized power plant investments increase due the fact that new HPP are to be constructed and CPP recovery will be achieved
• Annualized investments in demand devices reach €1.036 billion in year 2021 and €1.251 billion in year 2027. Investments in efficient demand devices increase 4 times more over planning period from the Reference scenario.
D.4 SCENARIO ANALYSIS HIGHLIGHTS Providing increased access to energy efficient demand technologies, and further promoting their uptake by means of policies aimed at reducing electricity consumption or improving energy intensity (total consumption/GDP) causes various changes in the evolution of the energy system. In general, the three scenarios, R90/R90E/R90P, represent progressively more demanding changes in the energy system, starting from 2012 onwards.
• Primary energy supply decreases by 10/9/15% by 2027, with a corresponding improvement in energy intensity, where the main fuel shift is a reduction in coal and natural gas consumption.
• Imports drop by around 21% by 2027 in R90 and R90E and nearly 30% in R90P, improving energy security.
• Final energy consumption drops by 10/9/15% by 2027, mostly natural gas, except in R90E where the gas decrease is partly replaced by electricity decrease
• Electricity generation decreases only in R90E by 7%, it is stable in R90P and increases in R90, with coal power plants supplying the additional power to meet demand
• The total energy system cost is reduced by €924 million over the 27-year modeling horizon in the R90, by €614 million in the R90E and by €441 million in the R90P. There is a shift towards expenditure in investment in more efficient demand devices away from fuel expenditure.
D.4.1 FINAL ENERGY CONSUMPTION Final energy consumption decreases in the three scenarios compared to the reference, by 15/10/18% in R90/R90E/R90P in 2027. These reductions are obtained by adopting more efficient technologies and by substituting fuels. Insulation is also penetrating when high efficiency improvements are required. Substitution occurs mainly in the demand categories where such possibilities are the greatest, such as heating and hot water in the residential and commercial sectors and high temperature heat in industry.
In Croatia, the major substitution is in the residential sector where electricity used in heat pumps replaces natural gas for heating and hot water. The efficiency gain from the advanced technologies makes the adoption of heat pumps cost-efficient except in the scenario where electricity is explicitly targeted. It must also be mentioned that electric appliances and lighting technologies available at the beginning of the horizon are already relatively efficient compared to the other technologies. For the other demand categories, there is no significant shift in the composition of consumption.

SOUTH EAST EUROPE REGIONAL ENERGY MARKET SUPPORT (SEE REMS) PROJECT 181
Figure D-27: Final Energy Consumption by Fuel
0
50
100
150
200
250
300
2003
2006
2009
2012
2015
2018
2021
2024
2027
2003
2006
2009
2012
2015
2018
2021
2024
2027
2003
2006
2009
2012
2015
2018
2021
2024
2027
2003
2006
2009
2012
2015
2018
2021
2024
2027
R0 R90 R90E R90P
Peta
joul
es
Coal Oil Natural Gas LPG Electricity Biomass Renewables (other) Low-temp Heat
Figure D-28 shows clearly the major role of the residential sector in the reduction of the final energy consumption.
Figure D-28: Savings in Final Energy by Sector
0
5
10
15
20
25
30
35
40
45
50
2003
2006
2009
2012
2015
2018
2021
2024
2027
2003
2006
2009
2012
2015
2018
2021
2024
2027
2003
2006
2009
2012
2015
2018
2021
2024
2027
R90 R90E R90P
Peta
joul
es
Agriculture Commercial Industrial Residential Transportation & Other
D.4.2 ELECTRICITY GENERATION AND POWER SECTOR INVESTMENTS Total electricity generation decreases only when the efficiency improvement target focuses on electricity (R90E). In the other scenarios, electricity generation increases (R90) or remains stable (R90P) compared to the Reference scenario.

182 SOUTH EAST EUROPE REGIONAL ENERGY MARKET SUPPORT (SEE REMS) PROJECT
Figure D-29: Electricity Generation by Fuel
0102030405060708090
100
2003
2006
2009
2012
2015
2018
2021
2024
2027
2003
2006
2009
2012
2015
2018
2021
2024
2027
2003
2006
2009
2012
2015
2018
2021
2024
2027
2003
2006
2009
2012
2015
2018
2021
2024
2027
R0 R90 R90E R90P
Peta
joul
es
Nuclear power plants Coal-fired power plants Oil-fired power plantsGas-fired power plants Hydroelectric power plants ImportsRenewable & Other power plants
This is also reflected in the investment pattern, as shown in Figure D-30. The penetration of more advanced technologies (R90) is rather favorable to electricity in Croatia through the penetration of more advanced heat pumps in the residential sector for heating and cooling. When further constraints are imposed, investment in power generation is either decreased (R90E) or delayed in time (R90P).
Figure D-30: Investment in Power Plants by Fuel Type
0.0
0.1
0.2
0.3
0.4
0.5
0.6
0.7
0.8
0.9
2006
2009
2012
2015
2018
2021
2024
2027
2006
2009
2012
2015
2018
2021
2024
2027
2006
2009
2012
2015
2018
2021
2024
2027
2006
2009
2012
2015
2018
2021
2024
2027
R0 R90 R90E R90P
Gig
awat
ts
Nuclear power plants Coal-fired power plants Oil-fired power plants
Gas-fired power plants Hydroelectric power plants Renewable & Other power plants
This is reflected in Figure D-31 which demonstrates the (negative and positive) electricity savings in each scenario.

SOUTH EAST EUROPE REGIONAL ENERGY MARKET SUPPORT (SEE REMS) PROJECT 183
Figure D-31: Savings in Electricity Consumption
-1250
-1000
-750
-500
-250
0
250
500
750
1000
1250
2003
2006
2009
2012
2015
2018
2021
2024
2027
2003
2006
2009
2012
2015
2018
2021
2024
2027
2003
2006
2009
2012
2015
2018
2021
2024
2027
R90 R90E R90P
Gig
awat
t H
our
s
D.4.3 PRIMARY ENERGY SUPPLY Because of the greater efficiency imposed on the energy system, the total primary energy supply decreases in the three scenarios compared to the Reference scenario by 10, 9 and 15% respectively. The reduction is primarily in the supply of gas and, to a lesser extent, coal. The supply of other fuels remains constant. This evolution is mainly driven by improved energy efficiency; more details are given in the sections below.
Figure D-32: Primary Supply of Energy
0
50
100
150
200
250
300
350
2003
2006
2009
2012
2015
2018
2021
2024
2027
2003
2006
2009
2012
2015
2018
2021
2024
2027
2003
2006
2009
2012
2015
2018
2021
2024
2027
2003
2006
2009
2012
2015
2018
2021
2024
2027
R0 R90 R90E R90P
Peta
joul
es
Nuclear Coal Oil Natural Gas LPG Electricity Biomass

184 SOUTH EAST EUROPE REGIONAL ENERGY MARKET SUPPORT (SEE REMS) PROJECT
Efficiency gains are also reflected in the overall energy intensity of the economy, measured by the primary energy per unit of GDP, as shown in Table D-4.
Table D-4: Energy Intensity (PJ/GDP) % change from R0 in 2027
R90 10.46%
R90E 9.58%
R90P 14.98%
Improving the efficiency of the energy system decreases imports by 21-29%, thereby contributing to improved energy security.
Figure D-33: Change in Imports
0
20
40
60
80
100
120
140
160
Pet
ajou
les
R0
R90
R90E
R90P
D.4.4 ENERGY SYSTEM COSTS Figure D-34 depicts the total discounted system cost for the four scenarios. The scenarios induce a reduction of the total system cost compared to R0. This reduction can be explained by the rather conservative assumption in the Reference scenario regarding the availability of more efficient technologies: it is assumed that capital constraints and consequent high discount rates in the end-use sector limit adoption of advanced devices. Allowing a gradual penetration of the more efficient technologies, as in R90, can reduce the total system cost by 2.1%, representing in annualized terms 1.5% of the 2003GDP. This shows the importance of the promotion of these technologies. Imposing a further improvement of the electric or the overall efficiency will increase the cost of the energy system compared to R90. Targeting only electricity is more costly, per unit of primary energy saved, than imposing an overall efficiency target.
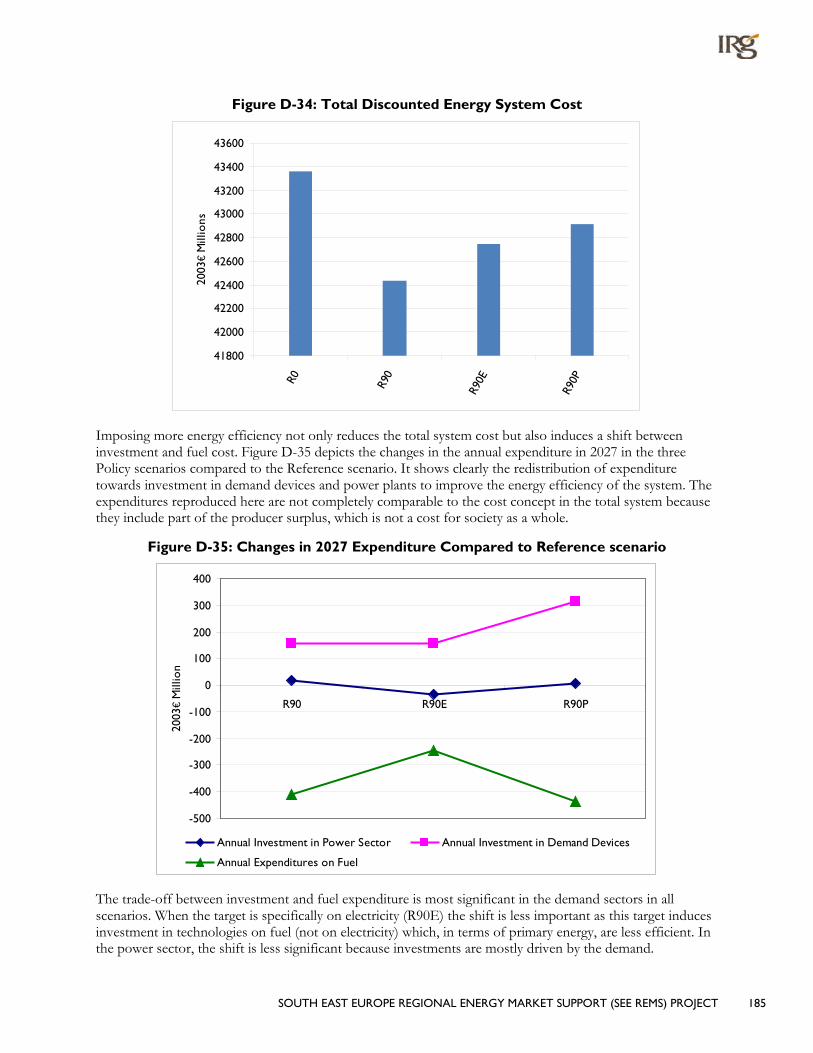
SOUTH EAST EUROPE REGIONAL ENERGY MARKET SUPPORT (SEE REMS) PROJECT 185
Figure D-34: Total Discounted Energy System Cost
41800
42000
42200
42400
42600
42800
43000
43200
43400
43600
R0 R90
R90E
R90P
2003
€ M
illio
ns
Imposing more energy efficiency not only reduces the total system cost but also induces a shift between investment and fuel cost. Figure D-35 depicts the changes in the annual expenditure in 2027 in the three Policy scenarios compared to the Reference scenario. It shows clearly the redistribution of expenditure towards investment in demand devices and power plants to improve the energy efficiency of the system. The expenditures reproduced here are not completely comparable to the cost concept in the total system because they include part of the producer surplus, which is not a cost for society as a whole.
Figure D-35: Changes in 2027 Expenditure Compared to Reference scenario
-500
-400
-300
-200
-100
0
100
200
300
400
R90 R90E R90P
2003
€ M
illio
n
Annual Investment in Power Sector Annual Investment in Demand Devices
Annual Expenditures on Fuel
The trade-off between investment and fuel expenditure is most significant in the demand sectors in all scenarios. When the target is specifically on electricity (R90E) the shift is less important as this target induces investment in technologies on fuel (not on electricity) which, in terms of primary energy, are less efficient. In the power sector, the shift is less significant because investments are mostly driven by the demand.

186 SOUTH EAST EUROPE REGIONAL ENERGY MARKET SUPPORT (SEE REMS) PROJECT
D.5 COUNTRY SPECIFIC ANALYSES Croatian TWG member prepared two country specific analyses. One is a renewable energy sources scenario, called RES, which increases the potential of renewables for electricity production. The second scenario, called NUC, allows the building of a nuclear power plant.
D.5.1 COUNTRY ISSUES FOR FUTURE ANALYSES I – RENEWABLE CASE SCENARIO Croatia as a candidate country for European Union accession and as an Annex 1 country of Kyoto protocol has an obligation to lower its CO2 emission level by 5% in the period 2008 – 2012 compared to 1990. Also there is the EU Directive 2001/77/EC on the promotion of electricity produced from renewable energy sources. The Croatian TWG member has therefore examined a scenario called RES with additional potential for renewable energy sources. The potential for hydro was increased by 29%, wind potential by 44%, and biomass, solar and geothermal were allowed to penetrate in the electricity sector. The potentials are given in Table D-5.
Table D-5: New Potential for Renewables in the Electricity Sector (GW)
Cogen.Biomass.Elec+Heat.Decen.06 0.645
Large hydro new 0.485
Small hydro new 0.261
Power plant, wind medium farms.06.decentralised 2.250
Power plant, biomass, medium size.06.decentralised 0.645
Power plant, geothermal dry steam.06.decentralised 0.143
Power plant, solar PV, centralised.06. 0.020
Power plant, solar PV, decentralised.06. 0.005
Power plant, wind large farms.06.centralised 1.500
Heating Plant.Biomass.Heat.Decen.06. 0.004
Heating Plant.Geothermal.Heat.Decen.06. 0.018
The main impact is on the electricity sector. Hydro and wind replace coal power plants and import of electricity19
19 A full regional model with electricity trade would be more appropriate for a proper evaluation of the impact on electricity imports. Here it just
indicate that the assumed price for electricity import is higher than the domestic price of electricity in the RES90 scenario.
. While the new potential for hydro is already fully used by 2015, the penetration of wind is more gradual, reaching its full potential only by 2027. Biomass, geothermal or solar PV are not cost efficient and do not penetrate.

SOUTH EAST EUROPE REGIONAL ENERGY MARKET SUPPORT (SEE REMS) PROJECT 187
Figure D-36: Electricity Generation by Fuel
0
10
20
30
40
50
60
70
80
90
100
2003
2006
2009
2012
2015
2018
2021
2024
2027
2003
2006
2009
2012
2015
2018
2021
2024
2027
R90 R90RES
Peta
joul
es
Coal-fired power plants Oil-fired power plants Gas-fired power plantsHydroelectric power plants Imports Renewable & Other power plants
The impact on final energy is negligible, as the price of electricity hardly changes. The total discounted system cost decreases by 1.2 billions Euro (-2.5%) mainly because of reduced imports. It has also an important impact on energy security. The share of imports reaches 41% in 2027 in R90, while it decreases to 23% in the RES scenario.
D.5.2. COUNTRY ISSUES FOR FUTURE ANALYSES II – NUCLEAR PP OPTION CASE SCENARIO For Croatia, the impact of allowing nuclear has been examined. It was implemented in the R90 scenario which allows a gradual penetration of more efficient technologies. Starting from 2015, nuclear power plants can be installed up to 1.4GW.
Allowing nuclear slightly decreases the total system cost and has the main impact on electricity generation:
• Total system cost decreases by 160millions EURO or 0.4%, with a shift towards investment cost;
• Nuclear substitutes for coal power plants;
• Final electricity consumption slightly increases, replacing natural gas, as heat pump penetrate more rapidly in the residential sector because of the lower price of electricity; and
• Electricity imports drop nearly to 0, however import dependency increases with the import of uranium: from 41% in R90 in 2027 to 50% in NUC.
This result can be expected as the cost differential between nuclear and coal technology is rather small and it is this cost differential which is the determinant in a scenario like R90 where no explicit target is given e.g., the environment.

188 SOUTH EAST EUROPE REGIONAL ENERGY MARKET SUPPORT (SEE REMS) PROJECT
D.6 COUNTRY ISSUES FOR FUTURE ANALYSES With a solid national MARKAL model, a number of energy system issues need to be examined using the Croatia model, including:
• Regional Integrated energy model (electricity and natural gas);
• Analysis of prices, both internal and international;
• Renewables;
• Natural gas penetration, and
• EU targets.
As part of undertaking further studies, the current data in the model should be reviewed and improved as better data become available.
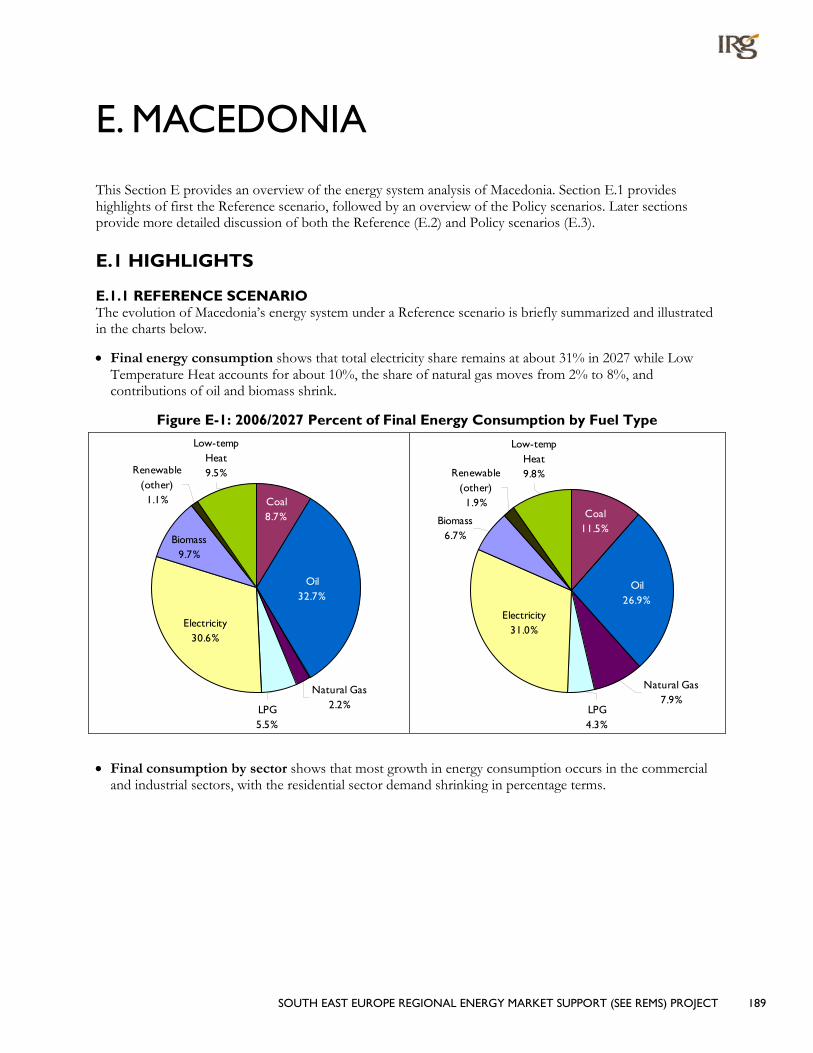
SOUTH EAST EUROPE REGIONAL ENERGY MARKET SUPPORT (SEE REMS) PROJECT 189
E. MACEDONIA
This Section E provides an overview of the energy system analysis of Macedonia. Section E.1 provides highlights of first the Reference scenario, followed by an overview of the Policy scenarios. Later sections provide more detailed discussion of both the Reference (E.2) and Policy scenarios (E.3).
E.1 HIGHLIGHTS
E.1.1 REFERENCE SCENARIO The evolution of Macedonia’s energy system under a Reference scenario is briefly summarized and illustrated in the charts below.
• Final energy consumption shows that total electricity share remains at about 31% in 2027 while Low Temperature Heat accounts for about 10%, the share of natural gas moves from 2% to 8%, and contributions of oil and biomass shrink.
Figure E-1: 2006/2027 Percent of Final Energy Consumption by Fuel Type
Renewable (other)1.1% Coal
8.7%
Oil32.7%
Electricity30.6%
LPG5.5%
Natural Gas2.2%
Low-tempHeat9.5%
Biomass9.7%
LPG4.3%
Electricity31.0%
Biomass6.7%
Natural Gas7.9%
Coal11.5%
Oil26.9%
Renewable (other)1.9%
Low-tempHeat9.8%
• Final consumption by sector shows that most growth in energy consumption occurs in the commercial and industrial sectors, with the residential sector demand shrinking in percentage terms.

190 SOUTH EAST EUROPE REGIONAL ENERGY MARKET SUPPORT (SEE REMS) PROJECT
Figure E-2: 2006/2027 Percent of Final Energy Consumption by Sector
Residential33%
Agriculture2.3%
Commercial31%
Industrial34%
Industrial35%
Commercial33%
Residential30%
Agriculture2%
• Electric Generation increases from 6.2 to 9.7 TWh by 2027, a 57% increase. By 2027,
– 50% is from coal-fired power plants;
– 33% is produced by traditional hydro;
– 10% is contributed by oil fired power plants;
– 6% is contributed by new gas fired power plants; and
– Only 1% is generated by new renewable sources.
Figure E-3: 2006/2027 Percent Electricity Generation by Fuel Type
Gas-fired power plants
0%
Hydro-electric power plants19%
Oil-fired power plants14%
Imports13%
Coal-fired power plants54%
Coal-fired power plants50%
Renewable1%
Hydro-electric power plants33%
Gas-fired power plants
6%Oil-fired power plants10%
• Energy Supply in the country increases by 45% by 2027, from 104 to about 151 PJ.
– Coal provides two-thirds of the increase;
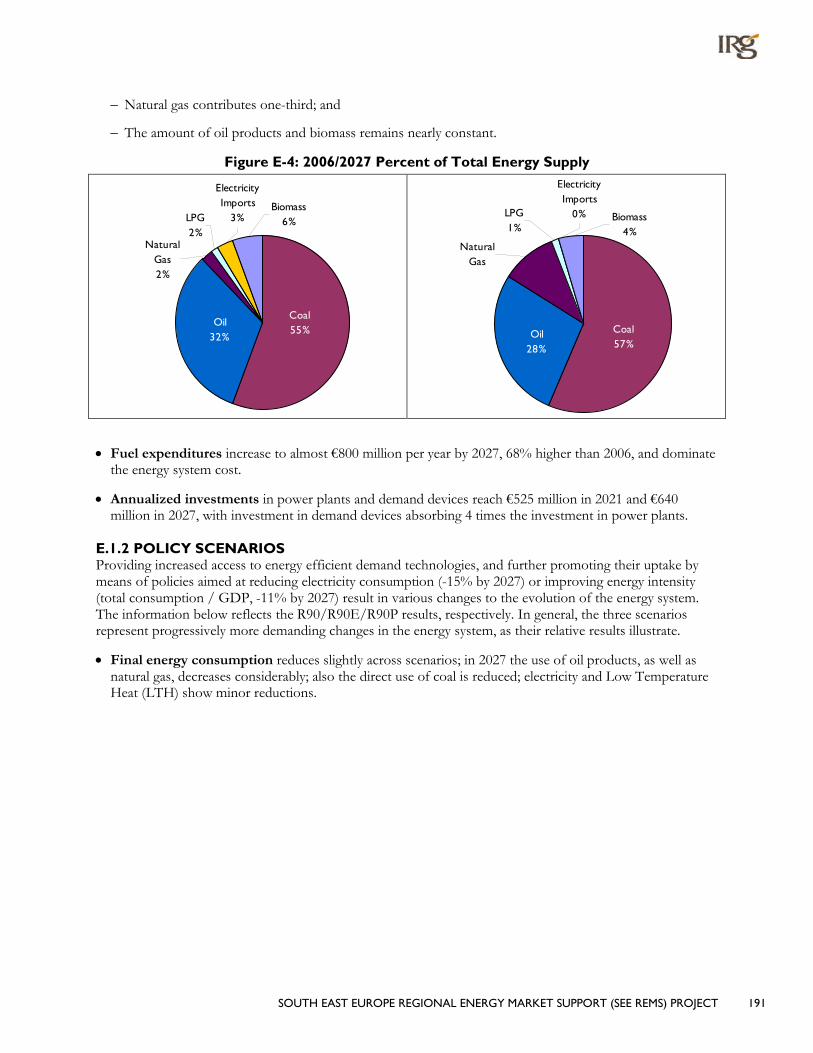
SOUTH EAST EUROPE REGIONAL ENERGY MARKET SUPPORT (SEE REMS) PROJECT 191
– Natural gas contributes one-third; and
– The amount of oil products and biomass remains nearly constant.
Figure E-4: 2006/2027 Percent of Total Energy Supply
Oil32%
Coal55%
Natural Gas2%
Biomass6%LPG
2%
Electricity Imports
3%
Biomass4%
Coal57%
Oil28%
LPG1%
Natural Gas
Electricity Imports
0%
• Fuel expenditures increase to almost €800 million per year by 2027, 68% higher than 2006, and dominate the energy system cost.
• Annualized investments in power plants and demand devices reach €525 million in 2021 and €640 million in 2027, with investment in demand devices absorbing 4 times the investment in power plants.
E.1.2 POLICY SCENARIOS Providing increased access to energy efficient demand technologies, and further promoting their uptake by means of policies aimed at reducing electricity consumption (-15% by 2027) or improving energy intensity (total consumption / GDP, -11% by 2027) result in various changes to the evolution of the energy system. The information below reflects the R90/R90E/R90P results, respectively. In general, the three scenarios represent progressively more demanding changes in the energy system, as their relative results illustrate.
• Final energy consumption reduces slightly across scenarios; in 2027 the use of oil products, as well as natural gas, decreases considerably; also the direct use of coal is reduced; electricity and Low Temperature Heat (LTH) show minor reductions.
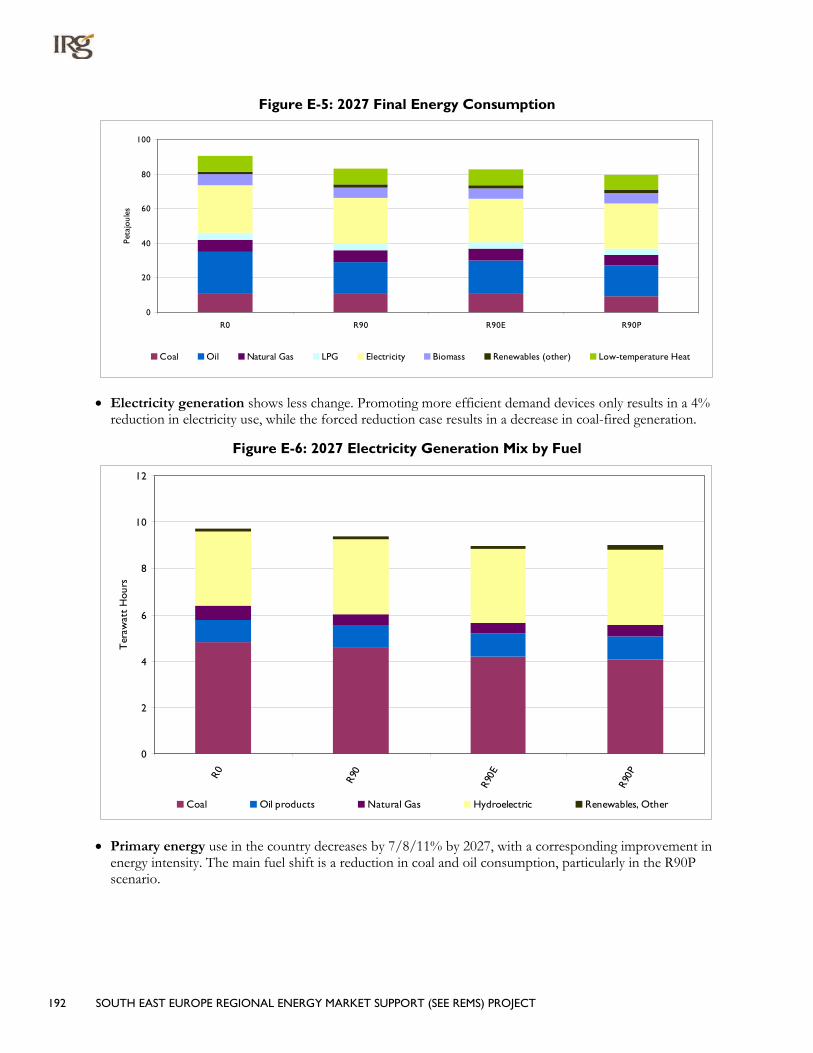
192 SOUTH EAST EUROPE REGIONAL ENERGY MARKET SUPPORT (SEE REMS) PROJECT
Figure E-5: 2027 Final Energy Consumption
0
20
40
60
80
100
R0 R90 R90E R90P
Peta
joul
es
Coal Oil Natural Gas LPG Electricity Biomass Renewables (other) Low-temperature Heat
• Electricity generation shows less change. Promoting more efficient demand devices only results in a 4% reduction in electricity use, while the forced reduction case results in a decrease in coal-fired generation.
Figure E-6: 2027 Electricity Generation Mix by Fuel
0
2
4
6
8
10
12
R0 R90
R90E
R90P
Ter
awat
t H
ours
Coal Oil products Natural Gas Hydroelectric Renewables, Other
• Primary energy use in the country decreases by 7/8/11% by 2027, with a corresponding improvement in energy intensity. The main fuel shift is a reduction in coal and oil consumption, particularly in the R90P scenario.

SOUTH EAST EUROPE REGIONAL ENERGY MARKET SUPPORT (SEE REMS) PROJECT 193
Figure E-7: 2027 Total Energy Supply
0
20
40
60
80
100
120
140
160
R0 R90
R90E
R90P
Peta
joul
es
Coal Oil Natural Gas LPG Electricity Biomass
• Energy imports in 2027 provide a reduced share of Total Primary Energy Supply (TPES) from 31% in the Reference scenario to 26% in the more constrained scenario, thus enhancing energy security.
• Costs of the Energy System. Making available more efficient technologies, in particular to the final users (R90 scenario), results in an overall energy system cost savings of about €200 million over the 27-year modeling horizon. Further compression of the electric or total energy consumption is possible, but to a lower degree and at relatively high extra costs (about €100 million in the R90E scenario and €200 million in the R90P scenario).
• Relative to the Reference case, the three scenario runs show the following changes in costs.
– Annualized investment in power plants decreases by nearly 20% in the R90 and R90P scenarios and by nearly 30% (€32 million annually by 2027) for R90E as the system moves to more efficient power plants and improves overall energy intensity.
– Annualized investments for new demand devices increase significantly by 11/15/17% in the three scenarios (€60-90 million annually by 2027) to achieve the policy goals.
– Fuel expenditures decrease significantly (€138/165/227 million per year by 2027) in all three scenarios as the more efficient devices require less fuel relative to the Reference case. These savings offset the increased expenditures on new, more efficient devices.

194 SOUTH EAST EUROPE REGIONAL ENERGY MARKET SUPPORT (SEE REMS) PROJECT
Figure E-8: Aggregate Total Discounted System Cost
11.0
11.1
11.2
11.3
11.4
11.5
11.6
11.7
11.8
11.9
12.0
R0 R90
R90E
R90P
2003
€ B
illio
n
Figure E-9: Change in 2027 Annual Expenditures
-250
-200
-150
-100
-50
0
50
100
150
R90 R90E R90P2003
€ M
illio
n
Annual Inv Power Sector Annual Inv Demand Expenditure on Fuel

SOUTH EAST EUROPE REGIONAL ENERGY MARKET SUPPORT (SEE REMS) PROJECT 195
E.2 ENERGY SYSTEM UNDER A REFERENCE SCENARIO
E.2.1 CRITICAL DRIVING ASSUMPTIONS
Figure E-10: Trend of Population and its Growth Rate
2040
2060
2080
2100
2120
2140
2160
2180
220020
03
2006
2009
2012
2015
2018
2021
2024
2027
Tho
usan
ds
0.00%
0.05%
0.10%
0.15%
0.20%
0.25%
Perc
ent
Population Population growth
Figure E-11: Trend of Households and Number of Persons per Household
2040
2060
2080
2100
2120
2140
2160
2180
2200
2003
2006
2009
2012
2015
2018
2021
2024
2027
Tho
usan
ds
2.2
2.3
2.4
2.5
2.6
2.7
2.8
2.9
3
3.1
Pers
ons
per
Ho
useh
old
Population Persons per household
It is assumed that the population continues to grow through the modeling period; the growth rate first increases till 2012, than it stabilizes and decreases slightly [see Figure E-10]. The number of household should increase steadily and the household size decreases [see Figure E-11]. Both projections are consistent with global trends for developing economies.
The GDP growth rate is projected to remain at almost 9 percent per year across the time horizon after 2012.
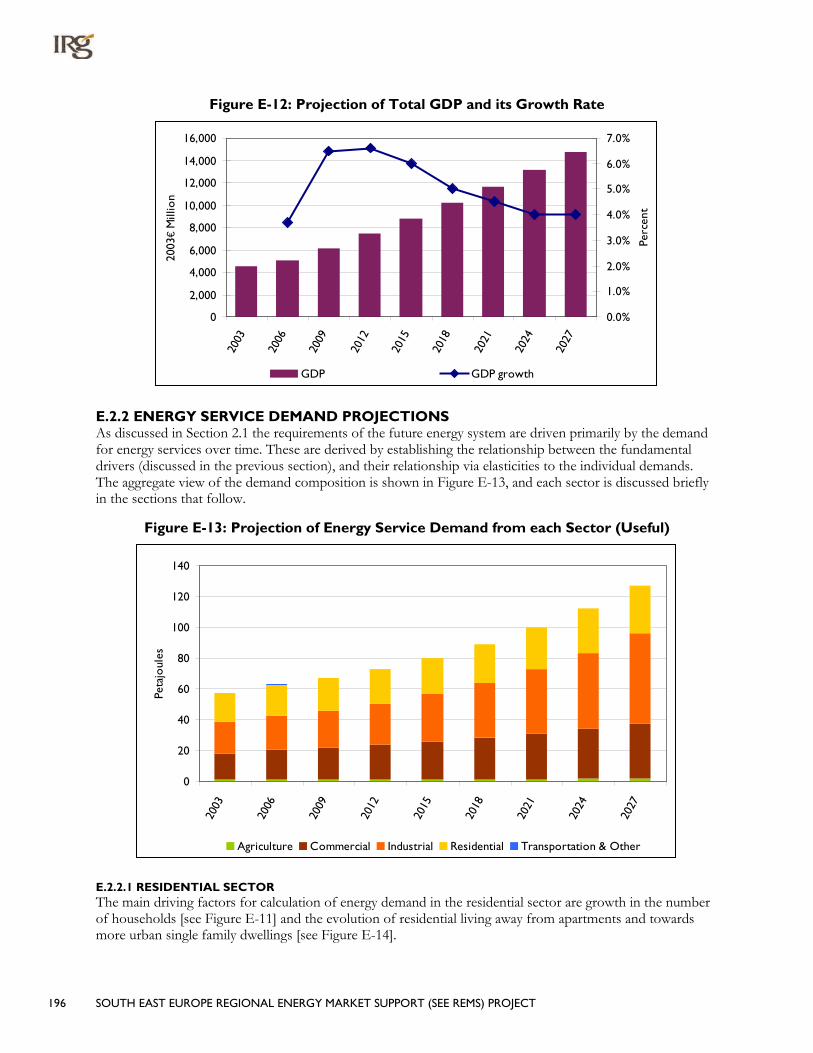
196 SOUTH EAST EUROPE REGIONAL ENERGY MARKET SUPPORT (SEE REMS) PROJECT
Figure E-12: Projection of Total GDP and its Growth Rate
0
2,000
4,000
6,000
8,000
10,000
12,000
14,000
16,000
2003
2006
2009
2012
2015
2018
2021
2024
2027
2003
€ M
illio
n
0.0%
1.0%
2.0%
3.0%
4.0%
5.0%
6.0%
7.0%
Perc
ent
GDP GDP growth
E.2.2 ENERGY SERVICE DEMAND PROJECTIONS As discussed in Section 2.1 the requirements of the future energy system are driven primarily by the demand for energy services over time. These are derived by establishing the relationship between the fundamental drivers (discussed in the previous section), and their relationship via elasticities to the individual demands. The aggregate view of the demand composition is shown in Figure E-13, and each sector is discussed briefly in the sections that follow.
Figure E-13: Projection of Energy Service Demand from each Sector (Useful)
0
20
40
60
80
100
120
140
2003
2006
2009
2012
2015
2018
2021
2024
2027
Peta
joul
es
Agriculture Commercial Industrial Residential Transportation & Other
E.2.2.1 RESIDENTIAL SECTOR The main driving factors for calculation of energy demand in the residential sector are growth in the number of households [see Figure E-11] and the evolution of residential living away from apartments and towards more urban single family dwellings [see Figure E-14].
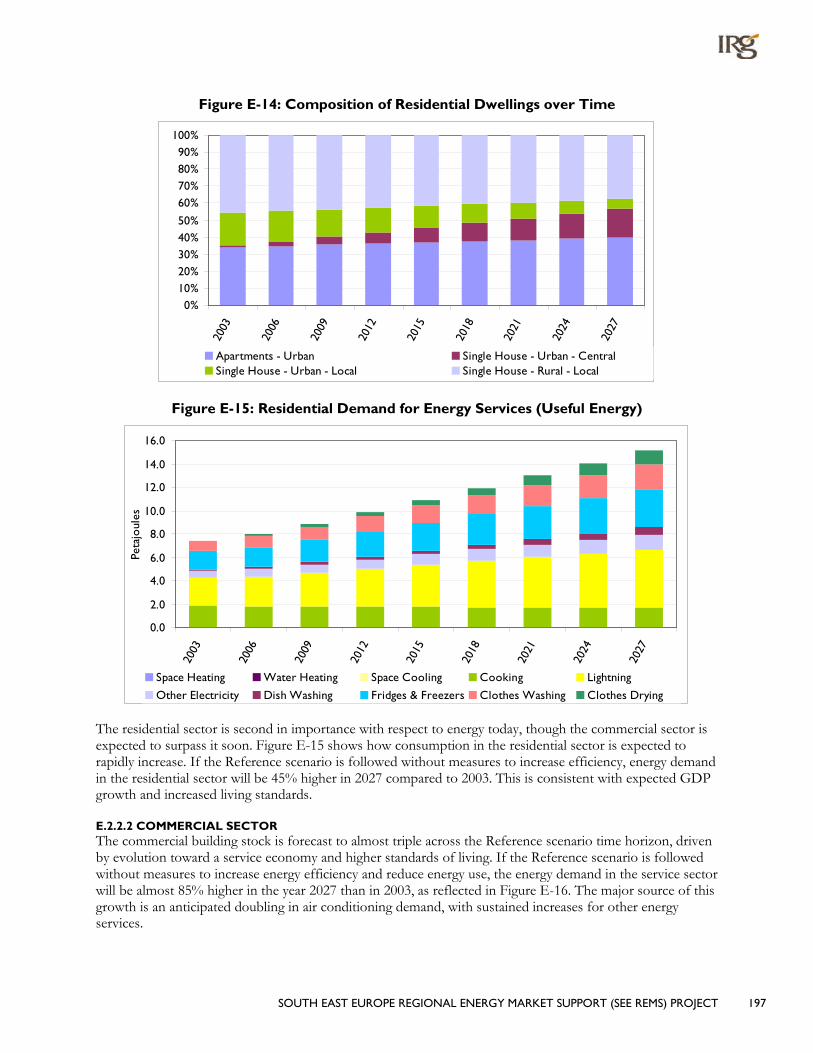
SOUTH EAST EUROPE REGIONAL ENERGY MARKET SUPPORT (SEE REMS) PROJECT 197
Figure E-14: Composition of Residential Dwellings over Time
0%10%20%30%40%50%
60%70%80%90%
100%
2003
2006
2009
2012
2015
2018
2021
2024
2027
Apartments - Urban Single House - Urban - CentralSingle House - Urban - Local Single House - Rural - Local
Figure E-15: Residential Demand for Energy Services (Useful Energy)
0.0
2.0
4.0
6.0
8.0
10.0
12.0
14.0
16.0
2003
2006
2009
2012
2015
2018
2021
2024
2027
Peta
joul
es
Space Heating Water Heating Space Cooling Cooking Lightning
Other Electricity Dish Washing Fridges & Freezers Clothes Washing Clothes Drying
The residential sector is second in importance with respect to energy today, though the commercial sector is expected to surpass it soon. Figure E-15 shows how consumption in the residential sector is expected to rapidly increase. If the Reference scenario is followed without measures to increase efficiency, energy demand in the residential sector will be 45% higher in 2027 compared to 2003. This is consistent with expected GDP growth and increased living standards.
E.2.2.2 COMMERCIAL SECTOR The commercial building stock is forecast to almost triple across the Reference scenario time horizon, driven by evolution toward a service economy and higher standards of living. If the Reference scenario is followed without measures to increase energy efficiency and reduce energy use, the energy demand in the service sector will be almost 85% higher in the year 2027 than in 2003, as reflected in Figure E-16. The major source of this growth is an anticipated doubling in air conditioning demand, with sustained increases for other energy services.

198 SOUTH EAST EUROPE REGIONAL ENERGY MARKET SUPPORT (SEE REMS) PROJECT
Figure E-16: Commercial Demand for Energy Services (Useful Energy)
0.00
5.00
10.00
15.00
20.00
25.00
30.00
35.00
2003
2006
2009
2012
2015
2018
2021
2024
2027
Peta
joul
es
Space Heating Hot Water Space cooling CookingLightning Other Electricity Public Lighting Fridges and Freezers
E.2.2.3 INDUSTRIAL SECTOR The driving factor in forecast energy demand in the industrial sector is the estimated contribution to GDP from the various industries, as reflected in Figure E-17, and the relationship between future GDP growth and the sector’s growth.
While the growth rate of industry’s contribution declines, industrial demand increases substantially across the Reference scenario time horizon. Figure E-18 indicates that while energy use in most of the industrial sectors is quite low, food production drives overall use in the sector.
Figure E-17: Contribution of Industry Sub-Sectors to Total GDP
0
100
200
300
400
500
600
Chem
ical
Iron
and s
teel
Food
Non-fe
rrous
met
als
Non-m
etall
ic m
inera
ls
Oth
er m
anufa
cturin
g
Pulp
and
pape
r
2003
MEu
ro

SOUTH EAST EUROPE REGIONAL ENERGY MARKET SUPPORT (SEE REMS) PROJECT 199
Figure E-18: Industrial Demand for Energy Services (Useful Energy)
0.0
5.0
10.0
15.0
20.0
25.0
30.0
2003
2006
2009
2012
2015
2018
2021
2024
2027
Peta
joul
es
Chemicals Food Iron & Steel Non-metalic Minerals Paper Non-ferrous metals Other Industries
The statistics of last 10-15 years show a considerable decline of the importance of heavy industry. However, it should be noted that many industrial and commercial products [ferrochromium, bricks, tiles, lime production, meat and milk by-products, and leather] play an important role in the Macedonian economy. From the standpoint of energy use, industry continues to have high energy intensities for each production unit.
E.2.2.4 AGRICULTURE For many years Macedonia will remain a country where the agriculture dominates. The specific weight of the GDP contribution will remain the main driving factor for forecasting energy demand from this sector. The income increase from plant production, livestock, fishing and forestry holds the greatest potential for the economic and social development of the country.
E.2.2.5 TRANSPORT AND NON-ENERGY USE The last sector considered is transport and non-energy use. Since this sector currently includes only electricity (used in electric railways) and natural gas used in non-energy sectors (consumed for fertilizer), this is not considered because they are zero in the Macedonian case.
E.2.3 ENERGY SUPPLY AND PRICES Figure E-19 shows the trend of energy prices based on the EU NEEDS Project. These trends are applied to recent energy prices in Macedonia to produce forecasts of future prices across the time horizon of this study. As noted earlier, it is assumed that the countries of the region will be confronted by the prevailing EU prices soon, so any country differentials at the border are removed beginning in 2015.
Besides the border price influencing consumer prices for each energy form, a distinction is made with respect to internal distribution costs to the different sectors. The “mark-ups” are based upon the situation in 2003, shown in Table E-1 below, and held constant over the planning horizon.

200 SOUTH EAST EUROPE REGIONAL ENERGY MARKET SUPPORT (SEE REMS) PROJECT
Table E-1: Sector Fuel Price “Mark-ups” (M2003€/PJ)
Fuel
Sectors
Residential Commercial Agriculture Industry
Hard Coal 0.975 0.488 0.488 0.390
Brown Coal Briquettes 0.800 0.400 0.400 0.320
Lignite 0.800 0.400 0.400 0.320
Light fuel 3.000 1.500 1.500 1.200
Heavy fuel 1.990 0.995 0.995 0.796
LPG 2.550 1.275 1.275 1.020
Gas 1.667 0.834 0.834 0.667
Electricity 5.148 5.148 5.148 0
Low-temperature heat 0.375 0.094 0.094 0
Figure E-19: Energy Prices Based on the EU NEEDS Project
0.000
2.000
4.000
6.000
8.000
10.000
12.000
2003
2006
2009
2012
2015
2018
2021
2024
2027
Euro
/GJ
Coal Coke (rel coal) Brown coal Lignite
Crude Heavy Distillate Oil Light Distilate Oil LPG
Gasoline Kerosene other oil products Naphta
Feedstock Non energy use Natural Gas LWR Fabricated Fuel
Domestic supply increases only slightly, with the exception of the potential for lignite, as reported in Table E-2. Most imports that occur in 2003 are assumed to be unlimited in the future, with the exception of electricity, which is capped at almost 1.4 TWh (5 PJ), and natural gas, where the present import level of 3.2 PJ is increased by almost 60 PJ after 2012 when new infrastructure is to be completed.
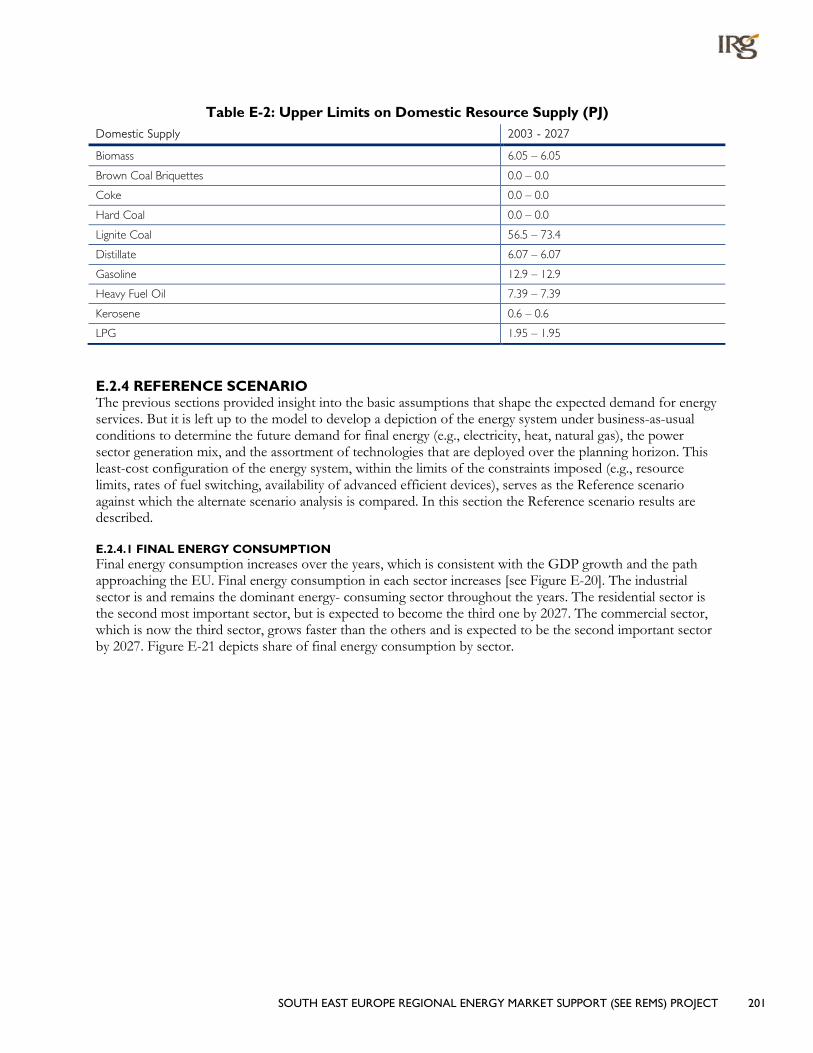
SOUTH EAST EUROPE REGIONAL ENERGY MARKET SUPPORT (SEE REMS) PROJECT 201
Table E-2: Upper Limits on Domestic Resource Supply (PJ) Domestic Supply 2003 - 2027
Biomass 6.05 – 6.05
Brown Coal Briquettes 0.0 – 0.0
Coke 0.0 – 0.0
Hard Coal 0.0 – 0.0
Lignite Coal 56.5 – 73.4
Distillate 6.07 – 6.07
Gasoline 12.9 – 12.9
Heavy Fuel Oil 7.39 – 7.39
Kerosene 0.6 – 0.6
LPG 1.95 – 1.95
E.2.4 REFERENCE SCENARIO The previous sections provided insight into the basic assumptions that shape the expected demand for energy services. But it is left up to the model to develop a depiction of the energy system under business-as-usual conditions to determine the future demand for final energy (e.g., electricity, heat, natural gas), the power sector generation mix, and the assortment of technologies that are deployed over the planning horizon. This least-cost configuration of the energy system, within the limits of the constraints imposed (e.g., resource limits, rates of fuel switching, availability of advanced efficient devices), serves as the Reference scenario against which the alternate scenario analysis is compared. In this section the Reference scenario results are described.
E.2.4.1 FINAL ENERGY CONSUMPTION Final energy consumption increases over the years, which is consistent with the GDP growth and the path approaching the EU. Final energy consumption in each sector increases [see Figure E-20]. The industrial sector is and remains the dominant energy- consuming sector throughout the years. The residential sector is the second most important sector, but is expected to become the third one by 2027. The commercial sector, which is now the third sector, grows faster than the others and is expected to be the second important sector by 2027. Figure E-21 depicts share of final energy consumption by sector.

202 SOUTH EAST EUROPE REGIONAL ENERGY MARKET SUPPORT (SEE REMS) PROJECT
Figure E-20: Final Energy Consumption by Sector
0
20
40
60
80
100
2003
2006
2009
2012
2015
2018
2021
2024
2027
Peta
joul
es
Agriculture Commercial Industrial Residential Transportation & Other
Figure E-21: Final Energy Consumption by Sector (Share)
0%
20%
40%
60%
80%
100%
2003
2009
2015
2021
2027
Agriculture Commercial Industrial Residential Transportation & Other

SOUTH EAST EUROPE REGIONAL ENERGY MARKET SUPPORT (SEE REMS) PROJECT 203
Figure E-22: Final Energy Consumption by Fuel
0
20
40
60
80
100
2003
2009
2015
2021
2027
Peta
joul
es
Coal Oil Natural Gas LPGElectricity Biomass Renewables (other) Low-temperature Heat
In terms of final energy consumption by fuel, the absolute amount of natural gas increases as soon as the new pipeline comes into operation. Oil provides a huge amount of final energy consumption because it is used for space and water heating in the civil sectors and partly in agriculture. While the use of oil products does not increase significantly, electricity does and remains the most important final energy carrier; it is used in most demand sectors: space and water heating, cooling and cooking in the civil sectors and for metallic, non metallic minerals, paper and food industrial sectors. The direct use of low temperature heat increases slightly in space and water heating of the civil sectors and to a lower extent in industry, such as non-metallic, paper and food.
In terms of percent share, electricity and low temperature heat maintain their shares of about 30% and 10%, natural gas grows from less than 3% to almost 8%, oil drops from 34% to 26%, and renewable energies increase, but remain below 2%.
More detail is provided on the composition of final energy delivered to each sector in the sections that follow.
E.2.4.1.1 Residential Sector Residential demand for final energy is expected to increase by 34% from 2003 to 2027 in the Reference scenario [see Figure E-23].

204 SOUTH EAST EUROPE REGIONAL ENERGY MARKET SUPPORT (SEE REMS) PROJECT
Figure E-23: Final Energy Consumption - Residential
0
5
10
15
20
25
30
2003
2009
2015
2021
2027
Peta
joul
es
Coal Oil Natural Gas LPG Electricity Biomass Renewables (other) Low-temperature Heat
The increase is mostly covered by electricity, with some contribution from oil products and renewables. Electricity is used for cooling, cooking, lighting, washing machines, clothes drying and space heating. Biomass is used mainly for space heating in the rural areas and somewhat in urban areas; it is partly used for water heating in rural areas and only marginally for cooking. Coal is used in very small amounts, for space heating in some urban areas. LPG is used for cooking. Low temperature heat is used for space and water heating in apartments. Light oil is used for space heating in apartments, single and local urban, marginally also for water heating. New renewable sources contribute little in the Reference scenario.
E.2.4.1.2 Commercial Sector The commercial sector is experiencing the most rapid growth of all the sectors, with final energy demand increasing by some 75% between 2003 and 2027 [see Figure E-24]. The amount of electricity more than doubles in order to satisfy the increasing demand for cooling and other forced uses such as space and water heating, cooking and lighting. Oil products remain the most important energy source in the commercial sector, providing space heating and warm water.
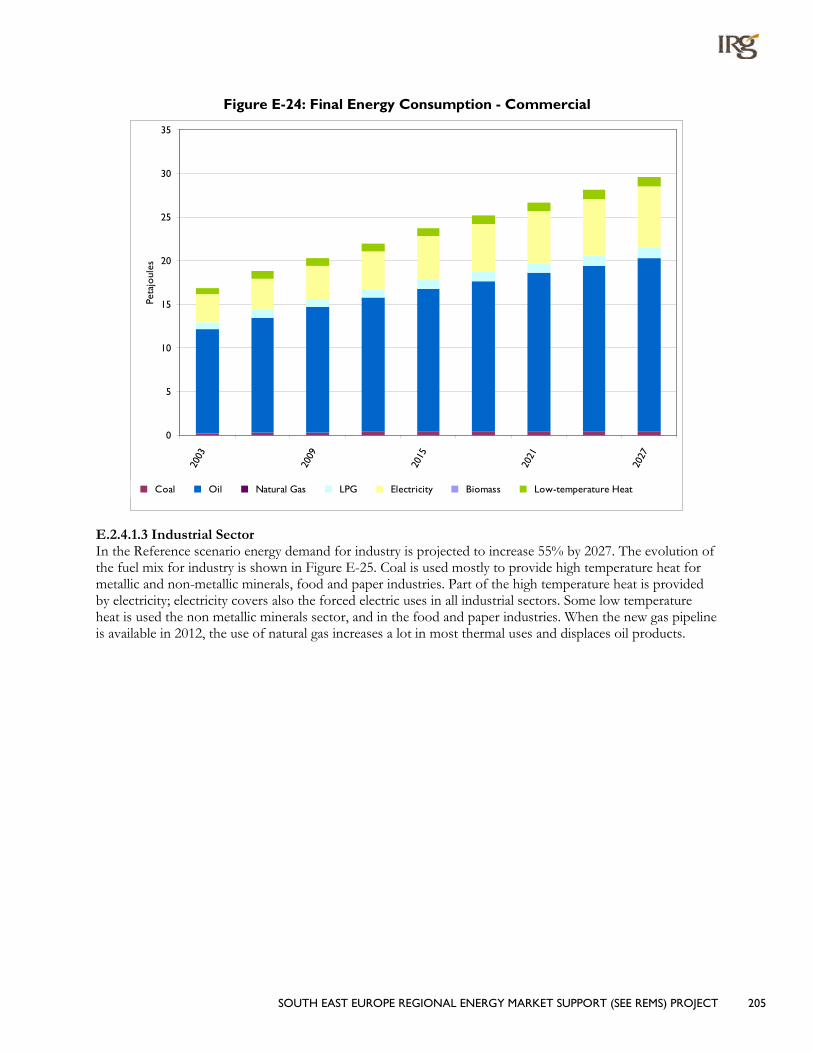
SOUTH EAST EUROPE REGIONAL ENERGY MARKET SUPPORT (SEE REMS) PROJECT 205
Figure E-24: Final Energy Consumption - Commercial
0
5
10
15
20
25
30
35
2003
2009
2015
2021
2027
Peta
joul
es
Coal Oil Natural Gas LPG Electricity Biomass Low-temperature Heat
E.2.4.1.3 Industrial Sector In the Reference scenario energy demand for industry is projected to increase 55% by 2027. The evolution of the fuel mix for industry is shown in Figure E-25. Coal is used mostly to provide high temperature heat for metallic and non-metallic minerals, food and paper industries. Part of the high temperature heat is provided by electricity; electricity covers also the forced electric uses in all industrial sectors. Some low temperature heat is used the non metallic minerals sector, and in the food and paper industries. When the new gas pipeline is available in 2012, the use of natural gas increases a lot in most thermal uses and displaces oil products.

206 SOUTH EAST EUROPE REGIONAL ENERGY MARKET SUPPORT (SEE REMS) PROJECT
Figure E-25: Final Energy Consumption - Industry
0
5
10
15
20
25
30
35
2003
2009
2015
2021
2027
Peta
joul
es
Coal Oil Natural Gas LPG Electricity Biomass Low-temperature Heat
E.2.4.1.4 Agriculture Sector Figure E-26 shows the evolution of the principal fuels used in the agricultural sector for the Reference scenario. Diesel consumption is expected to increase considerably, to support agricultural production growth and reduce manual labor.
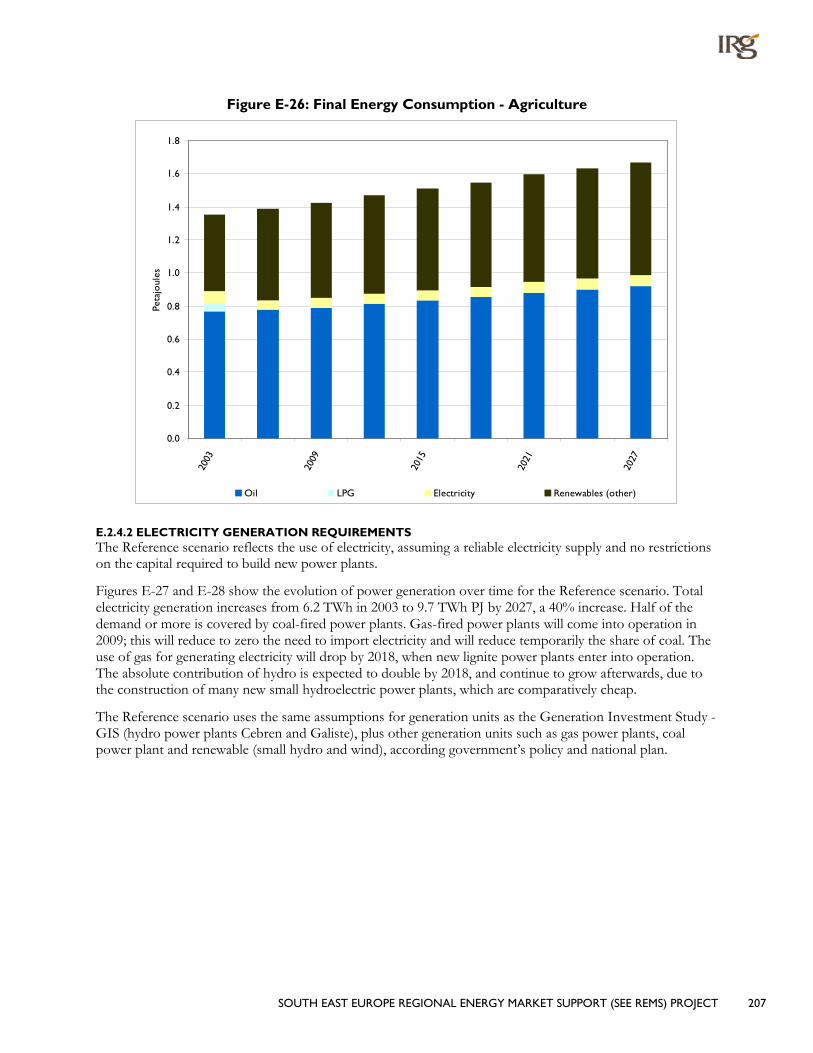
SOUTH EAST EUROPE REGIONAL ENERGY MARKET SUPPORT (SEE REMS) PROJECT 207
Figure E-26: Final Energy Consumption - Agriculture
0.0
0.2
0.4
0.6
0.8
1.0
1.2
1.4
1.6
1.8
2003
2009
2015
2021
2027
Peta
joul
es
Oil LPG Electricity Renewables (other)
E.2.4.2 ELECTRICITY GENERATION REQUIREMENTS The Reference scenario reflects the use of electricity, assuming a reliable electricity supply and no restrictions on the capital required to build new power plants.
Figures E-27 and E-28 show the evolution of power generation over time for the Reference scenario. Total electricity generation increases from 6.2 TWh in 2003 to 9.7 TWh PJ by 2027, a 40% increase. Half of the demand or more is covered by coal-fired power plants. Gas-fired power plants will come into operation in 2009; this will reduce to zero the need to import electricity and will reduce temporarily the share of coal. The use of gas for generating electricity will drop by 2018, when new lignite power plants enter into operation. The absolute contribution of hydro is expected to double by 2018, and continue to grow afterwards, due to the construction of many new small hydroelectric power plants, which are comparatively cheap.
The Reference scenario uses the same assumptions for generation units as the Generation Investment Study - GIS (hydro power plants Cebren and Galiste), plus other generation units such as gas power plants, coal power plant and renewable (small hydro and wind), according government’s policy and national plan.

208 SOUTH EAST EUROPE REGIONAL ENERGY MARKET SUPPORT (SEE REMS) PROJECT
Figure E-27: Electricity Generation by Fuel
0
2
4
6
8
10
12
2003
2009
2015
2021
2027
Ter
awat
t H
ours
Coal Oil-fired Natural Gas Hydroelectric Import-Export Renewables
Figure E-28: Share of the Electricity Generation by Fuel
0%
20%
40%
60%
80%
100%
2003
2009
2015
2021
2027
Coal Oil-fired Natural Gas Hydroelectric Import-Export Renewables
E.2.4.3 ENERGY SUPPLY The supply of energy, from domestic sources and imports, for the Reference scenario is shown in Figures E-29 and E-30. Primary energy use in the country increases by 40% by 2027, with
• Coal providing the bulk of the supply, which is understandable because it is domestic, abundant and cheap; this is particularly true after the construction of two new lignite fired power plants in Bitola and Oslomej in 2018;
• Oil remaining the second energy source, and providing fuel for power plants and heating systems;

SOUTH EAST EUROPE REGIONAL ENERGY MARKET SUPPORT (SEE REMS) PROJECT 209
• natural gas increasing gradually to 10% share in 2027, due to the new gas power plant coming into operation in 2009, the new gas pipeline available in 2012 and the increased share of natural gas distributed to final users after the new lignite power plants come into operation in 2018;
• electricity imports dropping to zero from 2009, as soon as the new gas-fired power plant comes into operation; and
• biomass remaining constant and supplying the residential sector.
Figure E-29: Energy Supply by Type
0
20
40
60
80
100
120
140
160
2003
2006
2009
2012
2015
2018
2021
2024
2027
Peta
joul
es
Nuclear Coal Oil Natural Gas LPG Electricity Biomass
Figure E-30: Energy Supply by Type (Shares)
0%
20%
40%
60%
80%
100%
2003
2009
2015
2021
2027
Coal Oil Natural Gas LPG Electricity Biomass

210 SOUTH EAST EUROPE REGIONAL ENERGY MARKET SUPPORT (SEE REMS) PROJECT
E.2.4.4 COSTS Over the course of the planning horizon there is a constant trade-off between investments – in the power sector and demand devices – and expenditure on fuel. This trade-off usually takes the form of spending more to purchase more efficient demand technologies versus making large investments in the power sector and spending less on fuels. Since the demand for electricity grows steadily, investments in power plants increase considerably: in 2009 to build a new gas power plant and related infrastructures, in the following periods to build many small hydro plants and some wind generators, in 2018 to build two new lignite power plants. In the Reference scenario this is reflected by an increase in annualized investment in power plants to about €40 million in 2012, €70 million in 2018 and €100 million in 2024. Annualized investments in demand devices grow from almost €300 million in 2012 to more than €500 million in 2027. Fuel expenditures grow more slowly, from more than €600 million in 2012 to less than €800 million in 2027.
E.3 SCENARIO ANALYSIS RESULTS Providing increased access to energy efficient demand technologies (scenario R90), and further promoting their uptake by means of policies aimed at reducing electricity consumption (-15% in 2027, scenario R90E) or improving energy intensity (total consumption / GDP, -11% in 2027, scenario R90P) results in various changes to the evolution of the energy system. The information below thus reflects results of the R90/R90E/R90P scenarios, respectively. In general, the three scenarios represent progressively more demanding changes in the energy system, as their relative results illustrate.
The analysis conducted here thus serves to illustrate the merits of promoting increased energy efficiency through policies and programs aimed at improving the overall performance of the energy system.
E.3.1 FINAL ENERGY CONSUMPTION PATTERNS Final energy consumption decreases as was the case for the energy supply discussed above. The main reason for this drop is that more energy efficient technologies are made available to replace the inefficient technologies. Figure E-31 illustrates how the fuel mix changes as a result of introducing the new technologies.
Coal as a final fuel for energy consumption decreases slightly, due to the use of more efficient technologies for producing high temperature heat in the iron & steel and non metallic minerals industries. Electricity does not change much, with a small reduction due to the use of more efficient central cooling systems in the commercial sector and partly in residential single houses. The use of low temperature heat in the civil sector decreases slightly due to some thermal insulation in new houses and retrofit of existing homes. The direct use of oil products for final consumption decreases considerably due to the deployment of more efficient technologies in the commercial and residential sectors.
Final energy consumption drops slightly across scenarios; in 2027 the use of oil products and natural gas decreases considerably; the direct use of coal also decreases; electricity and Low Temperature Heat (LTH) show minor reductions. The use of gas drops by 15% in R90P scenario, mostly in industrial sector.

SOUTH EAST EUROPE REGIONAL ENERGY MARKET SUPPORT (SEE REMS) PROJECT 211
Figure E-31: Final Energy Consumption by Fuel
0
10
20
30
40
50
60
70
80
90
100
2003
2006
2009
2012
2015
2018
2021
2024
2027
2003
2006
2009
2012
2015
2018
2021
2024
2027
2003
2006
2009
2012
2015
2018
2021
2024
2027
2003
2006
2009
2012
2015
2018
2021
2024
2027
R0 R90 R90E R90P
Peta
joul
es
Coal Oil Natural Gas LPG
Electricity Biomass Renewables (other) Low-temperature Heat
Figure E-32 depicts the savings in Final Energy Consumption by Sector. As noted above, the residential sector is the major player in utilizing more energy efficient demand devices, thus reducing energy consumption in the out years. The rapidly growing commercial sector consumes considerably less energy if more efficient technologies are deployed. The deployment of similar technologies in the residential sector reduces further the amount of final energy needed to satisfy the same demand for energy services. In both civil sectors the new technologies, if available, are competitive at the projected energy prices. Reducing the availability of electricity by 15% does not bring higher reductions.
Efficiency improvements in the industrial sector are not competitive at the given prices. They will be implemented only at higher price levels, or equivalently if their deployment is subsidized. This shift in reduced energy consumption could only happen if there are strong national energy conservation programs in place that provide enough incentives for the participants to invest in more efficient demand devices and change consumption behaviors.

212 SOUTH EAST EUROPE REGIONAL ENERGY MARKET SUPPORT (SEE REMS) PROJECT
Figure E-32: Savings in Final Energy by Sector
0
2
4
6
8
10
12
14
2003
2006
2009
2012
2015
2018
2021
2024
2027
2003
2006
2009
2012
2015
2018
2021
2024
2027
2003
2006
2009
2012
2015
2018
2021
2024
2027
R90 R90E R90P
Peta
joul
es
Agriculture Commercial Industrial Residential Transportation & Other
E.3.2 POWER SECTOR INVESTMENTS AND ELECTRICITY GENERATION Electricity is so important for the development of Macedonia’s economy that deployment of new, more efficient technologies reduces electricity demand by 3.6% by 2027 and twice as much if additional control policies are introduced (scenario R90E) [see Figure E-33]. Macedonia is endowed with considerable hydro resources; their exploitation is expected increase hydroelectric production by 2027 2.5 times in all scenarios. The demand reduction due to the use of more efficient demand devices is expected to reduce the amount of thermoelectric generation, mainly of coal fired power plants.
Figure E-33: Electricity Generation by Fuel
0
2
4
6
8
10
12
2003
2006
2009
2012
2015
2018
2021
2024
2027
2003
2006
2009
2012
2015
2018
2021
2024
2027
2003
2006
2009
2012
2015
2018
2021
2024
2027
2003
2006
2009
2012
2015
2018
2021
2024
2027
R0 R90 R90E R90P
Ter
awat
t H
our
s
Coal Oil-fired Natural Gas Hydroelectric Import-Export Renewables
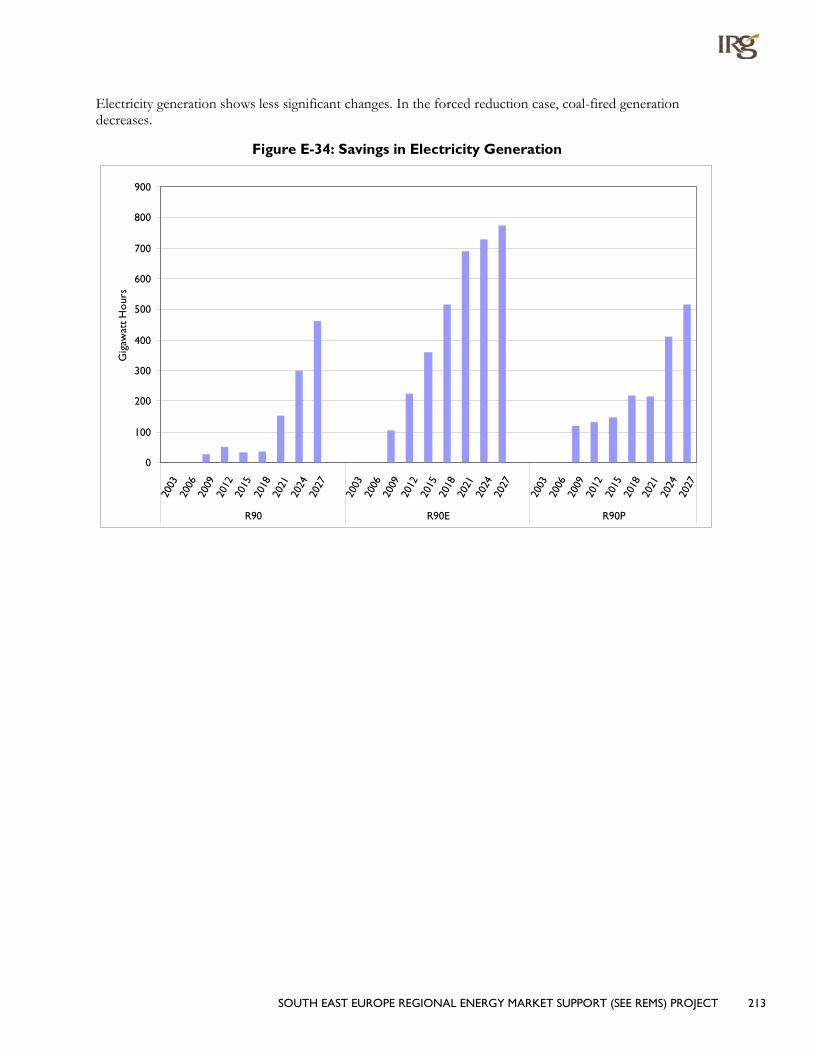
SOUTH EAST EUROPE REGIONAL ENERGY MARKET SUPPORT (SEE REMS) PROJECT 213
Electricity generation shows less significant changes. In the forced reduction case, coal-fired generation decreases.
Figure E-34: Savings in Electricity Generation
0
100
200
300
400
500
600
700
800
900
2003
2006
2009
2012
2015
2018
2021
2024
2027
2003
2006
2009
2012
2015
2018
2021
2024
2027
2003
2006
2009
2012
2015
2018
2021
2024
2027
R90 R90E R90P
Gig
awat
t H
our
s

214 SOUTH EAST EUROPE REGIONAL ENERGY MARKET SUPPORT (SEE REMS) PROJECT
In terms of the anticipated timing of investment in new, or refurbishment of existing, power plants, as shown in Figure E-35 the construction of the new gas fired power plant in 2009 dominates the power sector landscape. The investment costs for new power plants in the high efficiency scenarios are lower because the substitution of existing appliances with new high efficiency demand devices reduces demand for electricity and the need for construction of additional plants. In R90E and R90P investments in 2018 and 2021 are higher than in the Reference scenarios, in order to improve the average efficiency of the generating system.
Figure E-35: Investments in New (and Refurbished) Power Plants
0
50
100
150
200
250
300
2006
2009
2012
2015
2018
2021
2024
2027
2006
2009
2012
2015
2018
2021
2024
2027
2006
2009
2012
2015
2018
2021
2024
2027
2006
2009
2012
2015
2018
2021
2024
2027
R0 R90 R90E R90P
2003
M€
Nuclear power plants Coal Oil-fired Natural Gas Hydroelectric Renewable
E.3.3 ENERGY SUPPLY PICTURE The place to start understanding of the impacts of the various alternative scenarios is to examine the change in the supply of energy to the country [see Figure E-36].
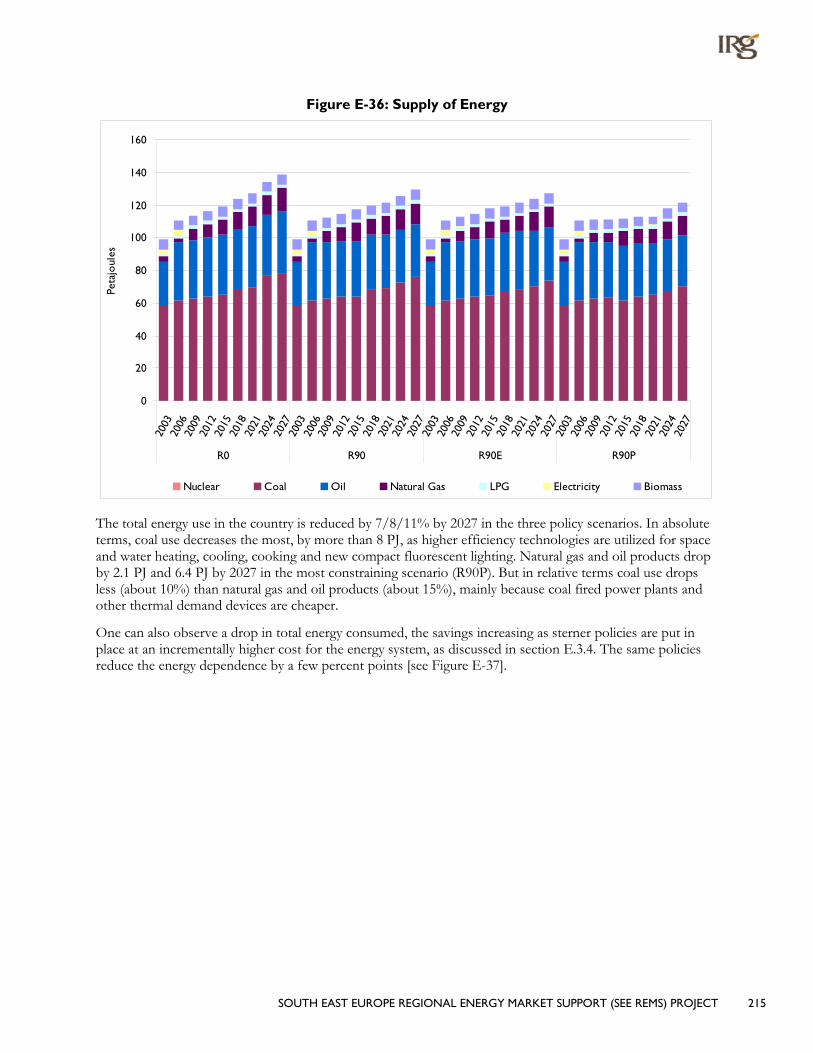
SOUTH EAST EUROPE REGIONAL ENERGY MARKET SUPPORT (SEE REMS) PROJECT 215
Figure E-36: Supply of Energy
0
20
40
60
80
100
120
140
160
2003
2006
2009
2012
2015
2018
2021
2024
2027
2003
2006
2009
2012
2015
2018
2021
2024
2027
2003
2006
2009
2012
2015
2018
2021
2024
2027
2003
2006
2009
2012
2015
2018
2021
2024
2027
R0 R90 R90E R90P
Peta
joul
es
Nuclear Coal Oil Natural Gas LPG Electricity Biomass
The total energy use in the country is reduced by 7/8/11% by 2027 in the three policy scenarios. In absolute terms, coal use decreases the most, by more than 8 PJ, as higher efficiency technologies are utilized for space and water heating, cooling, cooking and new compact fluorescent lighting. Natural gas and oil products drop by 2.1 PJ and 6.4 PJ by 2027 in the most constraining scenario (R90P). But in relative terms coal use drops less (about 10%) than natural gas and oil products (about 15%), mainly because coal fired power plants and other thermal demand devices are cheaper.
One can also observe a drop in total energy consumed, the savings increasing as sterner policies are put in place at an incrementally higher cost for the energy system, as discussed in section E.3.4. The same policies reduce the energy dependence by a few percent points [see Figure E-37].

216 SOUTH EAST EUROPE REGIONAL ENERGY MARKET SUPPORT (SEE REMS) PROJECT
Figure E-37: Imports Share of Total Supply
0%
5%
10%
15%
20%
25%
30%
35%
40%
2003
2006
2009
2012
2015
2018
2021
2024
2027
R0 R90 R90E R90P
An important measure of the competitiveness of an economy is its overall energy intensity, or the amount of energy delivered (consumed) per unit of GDP. The table below shows the improvement in the energy intensity of Macedonia’s energy system for the three policy scenarios. In the case of the R90 and R90E scenarios the overall cost of the energy system also falls, where the R90P shows that a 12.2% improvement can be achieved by promoting energy efficiency and setting a policy to lower total consumption of energy, without exceeding the overall cost of the energy system of Reference scenario.
Table E-3: Energy Intensity (PJ/GDP) 2027 percentage change from R0
R90 6.70%
R90E 8.19%
R90P 12.21%
E.3.4 COSTS As mentioned in the highlights (paragraph E.1.2, Figure E-8) the system costs reflect closely the degree of the intensity of energy efficiency and conservation programs introduced through the policy scenarios. For example, the R90 scenario, which allows increased access to more energy efficient technologies, is the least cost scenario over the planning horizon.
Figure E-38 depicts the scenarios’ Annual Energy System Expenditure. The total expenditures for all four scenarios are slightly different but re-distributed from fuel expenditures to more investments in demand devices. This is expected since the policy scenarios’ goals were to reduce fuel consumptions and increase energy efficiency through the introduction of more advanced and efficient demand technologies. This result can also be interpreted as growth in the economic activities (i.e., doing more for less) for the increased investment in demand technologies. In other words the reduction of fuel expenditures between the Reference and Policy scenarios can be used to subsidize the deployment of high efficiency and renewable technologies.

SOUTH EAST EUROPE REGIONAL ENERGY MARKET SUPPORT (SEE REMS) PROJECT 217
Figure E-38: Annual Energy System Expenditures
0
200
400
600
800
1000
1200
1400
1600
2006
2009
2012
2015
2018
2021
2024
2027
2006
2009
2012
2015
2018
2021
2024
2027
2006
2009
2012
2015
2018
2021
2024
2027
2006
2009
2012
2015
2018
2021
2024
2027
R0 R90 R90E R90P
2003
M€
Annual Inv Power Sector Annual Inv Demand Expenditure on Fuel
In the R90P scenario annual investments in demand devices increase much more than in the R0 and R90 scenarios because the most advanced technologies for lighting, cooking, washing, cooling and heating are used in the residential and commercial sectors, although they are not competitive at the energy prices level assumed. This reduces demand for electricity, annual investment in power plants and the purchase of fuels.
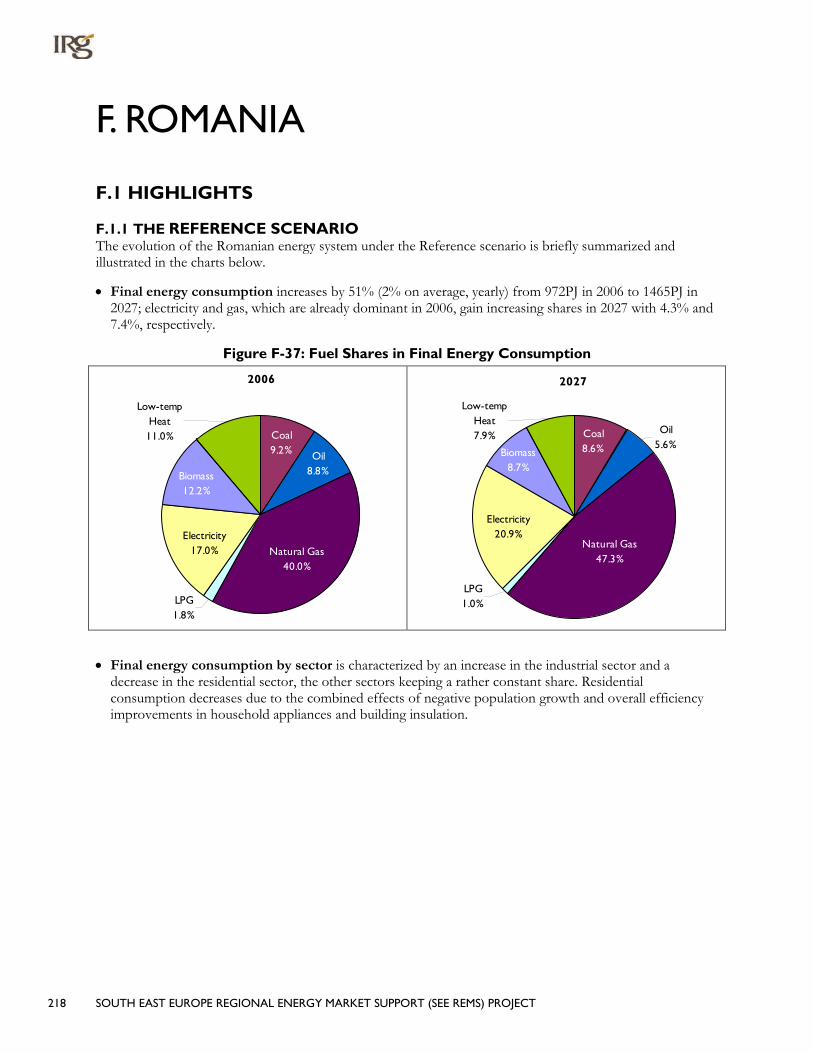
218 SOUTH EAST EUROPE REGIONAL ENERGY MARKET SUPPORT (SEE REMS) PROJECT
F. ROMANIA
F.1 HIGHLIGHTS
F.1.1 THE REFERENCE SCENARIO The evolution of the Romanian energy system under the Reference scenario is briefly summarized and illustrated in the charts below.
• Final energy consumption increases by 51% (2% on average, yearly) from 972PJ in 2006 to 1465PJ in 2027; electricity and gas, which are already dominant in 2006, gain increasing shares in 2027 with 4.3% and 7.4%, respectively.
Figure F-37: Fuel Shares in Final Energy Consumption
2006
Low-temp Heat11.0%
LPG1.8%
Biomass12.2%
Coal9.2% Oil
8.8%
Electricity17.0% Natural Gas
40.0%
2027
LPG1.0%
Biomass8.7%
Electricity20.9%
Natural Gas47.3%
Coal8.6%
Oil5.6%
Low-temp Heat7.9%
• Final energy consumption by sector is characterized by an increase in the industrial sector and a decrease in the residential sector, the other sectors keeping a rather constant share. Residential consumption decreases due to the combined effects of negative population growth and overall efficiency improvements in household appliances and building insulation.

SOUTH EAST EUROPE REGIONAL ENERGY MARKET SUPPORT (SEE REMS) PROJECT 219
Figure F-38: Sector Shares in Final Energy Consumption
2006
Commercial8.5%
Agriculture1.1%
Transport & other3.4%
Residential34.5%
Industrial52.5%
2027Agriculture
0.9%Commercial
9.3%
Transport & other2.6%
Residential20.9%
Industrial66.3%
• Electric Generation, driven by the growth in final demand, increases from 210PJ in 2006 to 358PJ by 2027, a 71% increase20
– Lignite/coal-fired power plants are still dominant but with a decreasing share
, corresponding to an average growth rate of 2.6% per year. As in Figure F-2,
– Nuclear sees its share gradually increase from 9% in 2006 to 15% in 2009 and to 25% in 2015 and 32% by 2027, following the further development of the nuclear program, in line with the commissioning of the second nuclear unit in 2007 and the Governmental plans for two more units by 2015.
– Hydro electricity increases in absolute figures, with about 1 GW of new small hydro power plants by 2027, but provides a decreasing share of the generation mix.
20 The imports of electricity are neglected for the whole 2006-2027 period , while yearly exports are capped to 14.4PJ (4 TWh) till 2018, then
dropped to 0

220 SOUTH EAST EUROPE REGIONAL ENERGY MARKET SUPPORT (SEE REMS) PROJECT
Figure F-39: Share in Electricity Generation
2006
Oil-fired power plants
3%
Nuclear power plants9%
Renewable and Other power
plants0%
Gas-fired power plants
15%
Hydroelectric power plants
29%
Coal-fired power plants
44%
2027
Oil-fired power plants
0%
Renewable and Other power
plants7%
Gas-fired power plants10%
Coal-fired power plants33%
Nuclear power plants32%
Hydroelectric power plants
18%
• Primary Energy Supply increases by 49% by 2027 or 1.9% per year, reflecting a GDP energy intensity decrease of about 3.4% a year.
– Natural gas remains the principal fuel with a stable share around 40%.
– Nuclear has the highest increase, increasing from 4% to 16% of electricity supply.
Figure F-40: Share in Primary Energy Supply
2006
Biomass9%
Nuclear4%
LPG1%
Hydro & other
Renewables, Electricity imports
4%
Natural Gas42%
Coal29%
Oil11%
2027Hydro & other Renewables, Electricity imports
4%
LPG1%
Biomass7%
Nuclear16%
Natural Gas42%
Oil7%
Coal23%
• Fuel expenditures21
21 It includes the producers’ surplus
increase to €13 billion per year by 2027, doubling compared to 2006.

SOUTH EAST EUROPE REGIONAL ENERGY MARKET SUPPORT (SEE REMS) PROJECT 221
• Annualized investments in power plants and demand devices reach €3.8 billion in 2021 and €4.8 billion in 2027, with investment in demand devices representing approximately 80%.
F.1.2 POLICY SCENARIOS Allowing increased penetration of energy efficient demand technologies and further promoting their uptake by means of policies aimed at reducing electricity consumption or energy intensity (total consumption/GDP) results in various changes to the evolution of the energy system. The information below reflects the R90/R90E/R90P results, respectively. In general, the three scenarios represent progressively more demanding changes in the energy system, as their relative results illustrate.
• Final Energy Consumption drops 11% in the R90/R90E scenarios and 15% in the R90P scenario. The biggest change occurs in natural gas, with the improved efficiency of end-use devices introduced by these scenarios. Electricity remains rather stable except when the target is specifically on electricity. Biomass consumption also decreases when improved efficiency is imposed in R90P.
Figure F-41: Final Energy Consumption in 2027
0
200
400
600
800
1000
1200
1400
1600
R0 R90
R90E
R90P
Peta
joul
es
Coal Oil Natural Gas LPG Electricity Biomass Low-temperature Heat
• Electricity generation drops by 3/10/6% respectively in the three scenarios, mainly by decreasing the generation from lignite power plants.
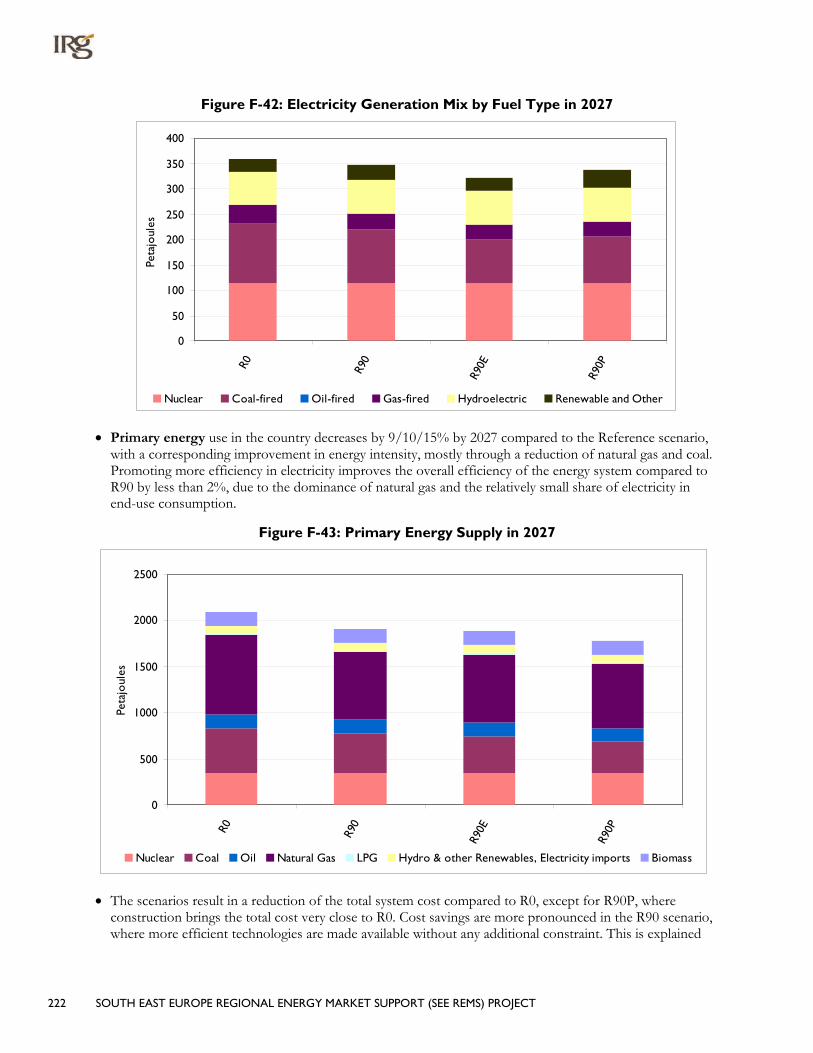
222 SOUTH EAST EUROPE REGIONAL ENERGY MARKET SUPPORT (SEE REMS) PROJECT
Figure F-42: Electricity Generation Mix by Fuel Type in 2027
0
50
100
150
200
250
300
350
400
R0 R90
R90E
R90P
Peta
joul
es
Nuclear Coal-fired Oil-fired Gas-fired Hydroelectric Renewable and Other
• Primary energy use in the country decreases by 9/10/15% by 2027 compared to the Reference scenario, with a corresponding improvement in energy intensity, mostly through a reduction of natural gas and coal. Promoting more efficiency in electricity improves the overall efficiency of the energy system compared to R90 by less than 2%, due to the dominance of natural gas and the relatively small share of electricity in end-use consumption.
Figure F-43: Primary Energy Supply in 2027
0
500
1000
1500
2000
2500
R0 R90
R90E
R90P
Peta
joul
es
Nuclear Coal Oil Natural Gas LPG Hydro & other Renewables, Electricity imports Biomass
• The scenarios result in a reduction of the total system cost compared to R0, except for R90P, where construction brings the total cost very close to R0. Cost savings are more pronounced in the R90 scenario, where more efficient technologies are made available without any additional constraint. This is explained
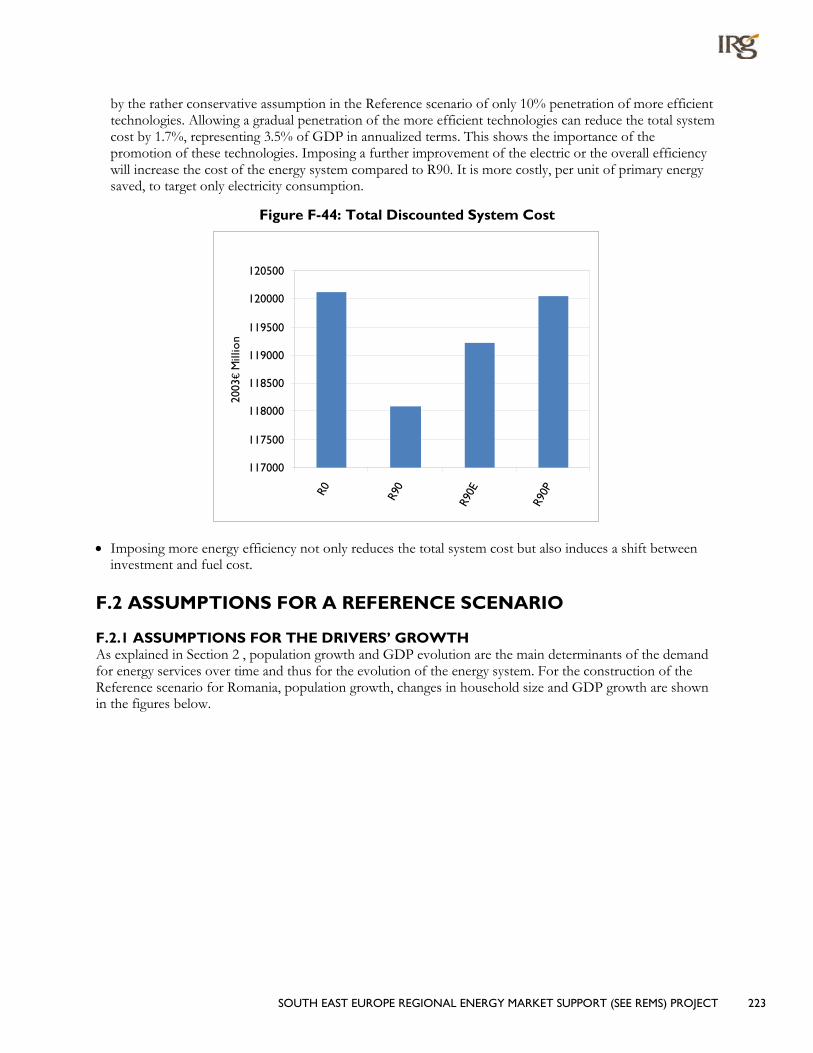
SOUTH EAST EUROPE REGIONAL ENERGY MARKET SUPPORT (SEE REMS) PROJECT 223
by the rather conservative assumption in the Reference scenario of only 10% penetration of more efficient technologies. Allowing a gradual penetration of the more efficient technologies can reduce the total system cost by 1.7%, representing 3.5% of GDP in annualized terms. This shows the importance of the promotion of these technologies. Imposing a further improvement of the electric or the overall efficiency will increase the cost of the energy system compared to R90. It is more costly, per unit of primary energy saved, to target only electricity consumption.
Figure F-44: Total Discounted System Cost
117000
117500
118000
118500
119000
119500
120000
120500
R0 R90
R90E
R90P
2003
€ M
illio
n
• Imposing more energy efficiency not only reduces the total system cost but also induces a shift between investment and fuel cost.
F.2 ASSUMPTIONS FOR A REFERENCE SCENARIO
F.2.1 ASSUMPTIONS FOR THE DRIVERS’ GROWTH As explained in Section 2 , population growth and GDP evolution are the main determinants of the demand for energy services over time and thus for the evolution of the energy system. For the construction of the Reference scenario for Romania, population growth, changes in household size and GDP growth are shown in the figures below.

224 SOUTH EAST EUROPE REGIONAL ENERGY MARKET SUPPORT (SEE REMS) PROJECT
Figure F-45: Trend of Population and its Growth Rate
19000
19500
20000
20500
21000
21500
22000
2003
2006
2009
2012
2015
2018
2021
2024
2027
Tho
usan
ds
-0.50%
-0.45%
-0.40%
-0.35%
-0.30%
-0.25%
-0.20%
-0.15%
-0.10%
-0.05%
0.00%
Perc
ent
Population Population growth
Figure F-46: Trend of Households and Number of Persons per Household
19000
19500
20000
20500
21000
21500
22000
2003
2006
2009
2012
2015
2018
2021
2024
2027
Tho
usan
ds
2.4
2.5
2.6
2.7
2.8
2.9
3.0
3.1
Pers
ons
per
Ho
useh
old
Population Persons per household
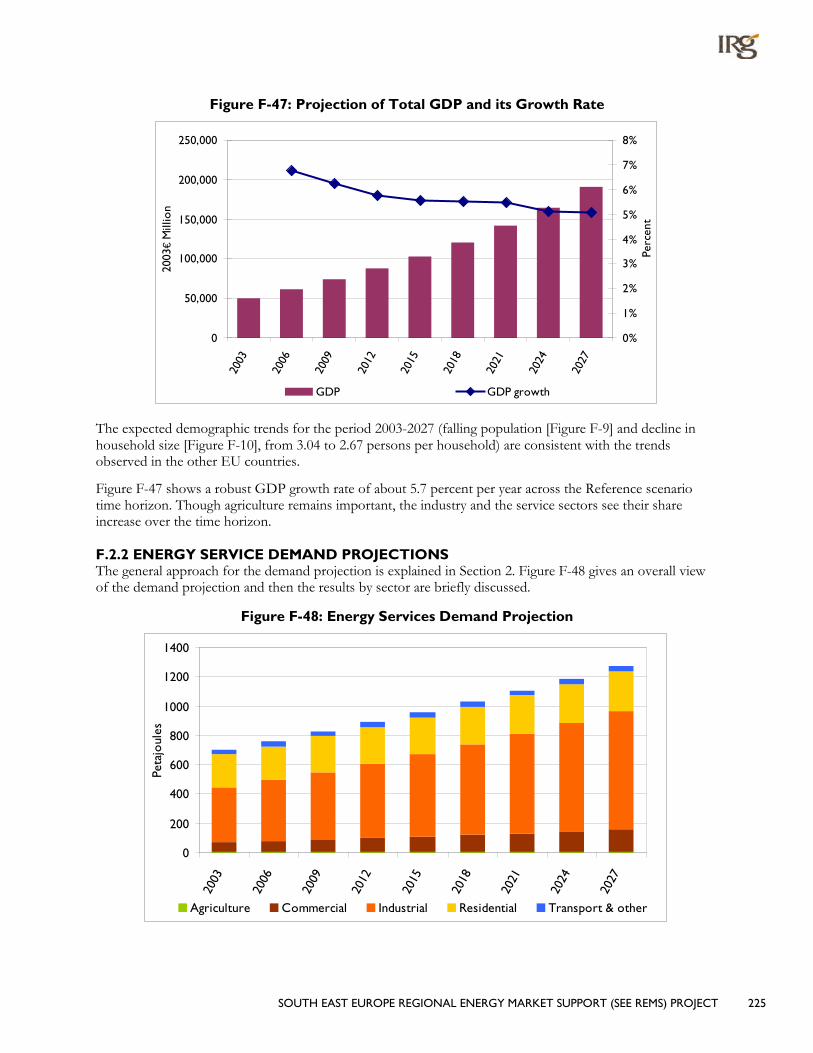
SOUTH EAST EUROPE REGIONAL ENERGY MARKET SUPPORT (SEE REMS) PROJECT 225
Figure F-47: Projection of Total GDP and its Growth Rate
0
50,000
100,000
150,000
200,000
250,000
2003
2006
2009
2012
2015
2018
2021
2024
2027
2003
€ M
illio
n
0%
1%
2%
3%
4%
5%
6%
7%
8%
Perc
ent
GDP GDP growth
The expected demographic trends for the period 2003-2027 (falling population [Figure F-9] and decline in household size [Figure F-10], from 3.04 to 2.67 persons per household) are consistent with the trends observed in the other EU countries.
Figure F-47 shows a robust GDP growth rate of about 5.7 percent per year across the Reference scenario time horizon. Though agriculture remains important, the industry and the service sectors see their share increase over the time horizon.
F.2.2 ENERGY SERVICE DEMAND PROJECTIONS The general approach for the demand projection is explained in Section 2. Figure F-48 gives an overall view of the demand projection and then the results by sector are briefly discussed.
Figure F-48: Energy Services Demand Projection
0
200
400
600
800
1000
1200
1400
2003
2006
2009
2012
2015
2018
2021
2024
2027
Peta
joul
es
Agriculture Commercial Industrial Residential Transport & other

226 SOUTH EAST EUROPE REGIONAL ENERGY MARKET SUPPORT (SEE REMS) PROJECT
F.2.2.1 RESIDENTIAL SECTOR The main driving factors for energy demand in the residential sector are the evolution in the number of households and the evolution in the income per household, reflected in improved living standards.
It is assumed that there will be only a small shift from rural towards urban dwellings (see Figure F-49) and a further penetration of central heating with the assumed improved living standards.
Figure F-49: Shares of Types of Residential Dwellings
0%10%20%30%40%50%60%70%80%90%
100%
2003
2006
2009
2012
2015
2018
2021
2024
2027
Apartments - Urban Single House - Urban - CentralSingle House - Urban - Local Single House - Rural - Local
The number of single family urban dwellings with central heating will increase by 3.6% per year on average, thus comprising 4% of the building stock in 2003 and 9% in 2027. At the same time, apartments comprise a consistent share at the 2003 level. In the 27-year period demand for household appliances and utilization of air-conditioning, in an incipient stage in the base year, are also anticipated to grow.
Consequently, the total energy service demand increases 0.8% per year, from 226PJ in 2003 to 271PJ in 2027. The main growth is expected in demand for cooling, hot water and other electricity. The space heating demand is stable over the horizon, because of demographic changes and more efficient urban central dwellings. Space heating remains however the most important category.
Mention should be made that in 2003 almost all the dwellings in urban areas (99.5%) were already connected to the electricity network and 71.5% to the natural gas network, while in the rural area the respective shares were 96.5%.and 7.5% respectively.

SOUTH EAST EUROPE REGIONAL ENERGY MARKET SUPPORT (SEE REMS) PROJECT 227
Figure F-50: Residential Energy Service Demand
0
50
100
150
200
250
300
2003
2006
2009
2012
2015
2018
2021
2024
2027
Peta
joul
es
Space Heating Water Heating Space Cooling Cooking Lighting Other electricity
F.2.2.2 COMMERCIAL SECTOR Though growth of the commercial sector follows GDP growth, demand for energy service does not directly track this trend because of autonomous energy efficiency improvement and the assumed decoupling of energy demand and activity for that sector. Space heating remains the most important category but space cooling is the fastest growing segment of commercial. Total demand grows 3.3% per year from 69PJ in 2003 to 152PJ in 2027.
Figure F-51: Commercial Energy Service Demand
0
20
40
60
80
100
120
140
160
2003
2006
2009
2012
2015
2018
2021
2024
2027
Peta
joul
es
Space Heating Hot Water Space Cooling CookingLighting Other electric Public Lighting
F.2.2.3 INDUSTRIAL SECTOR The driving factor for energy service demand in the industrial sector is its estimated contribution to GDP.
It is assumed that over the time horizon studied there is a shift towards less energy intensive industries. Moreover, because of the present overall inefficiency of Romanian industry, an autonomous improvement of around 2% per year in the energy efficiency is assumed.
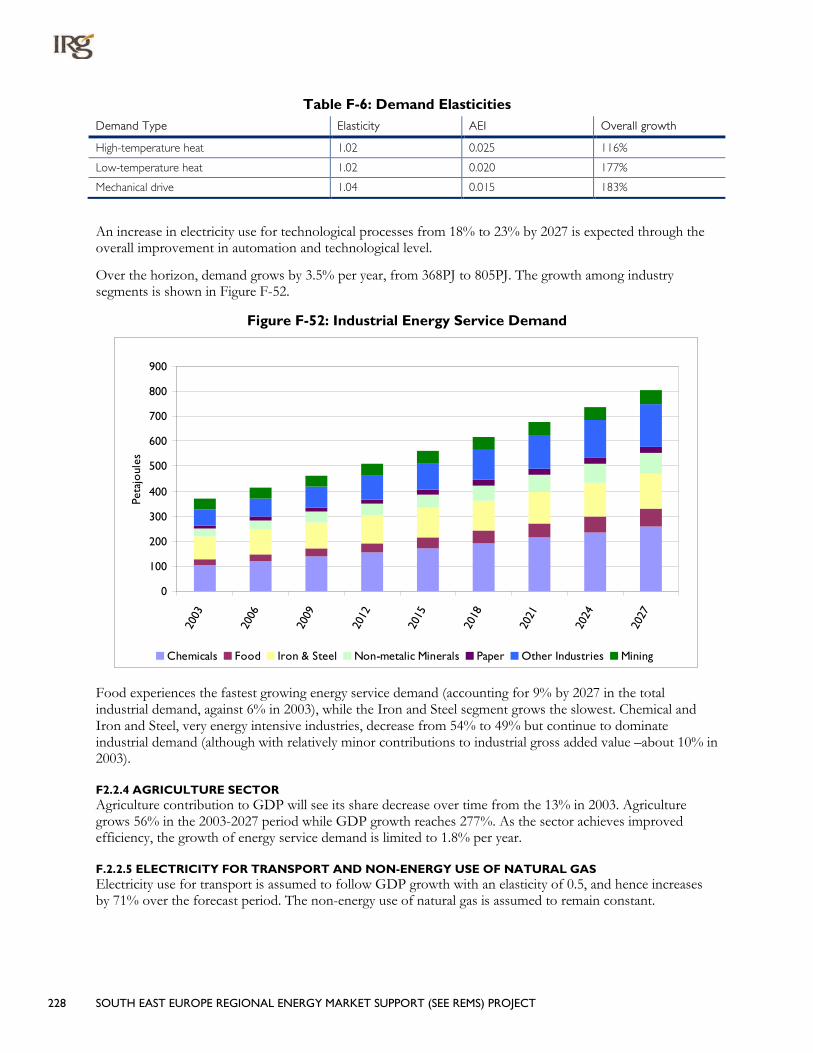
228 SOUTH EAST EUROPE REGIONAL ENERGY MARKET SUPPORT (SEE REMS) PROJECT
Table F-6: Demand Elasticities Demand Type Elasticity AEI Overall growth
High-temperature heat 1.02 0.025 116%
Low-temperature heat 1.02 0.020 177%
Mechanical drive 1.04 0.015 183%
An increase in electricity use for technological processes from 18% to 23% by 2027 is expected through the overall improvement in automation and technological level.
Over the horizon, demand grows by 3.5% per year, from 368PJ to 805PJ. The growth among industry segments is shown in Figure F-52.
Figure F-52: Industrial Energy Service Demand
0
100
200
300
400
500
600
700
800
900
2003
2006
2009
2012
2015
2018
2021
2024
2027
Peta
joul
es
Chemicals Food Iron & Steel Non-metalic Minerals Paper Other Industries Mining
Food experiences the fastest growing energy service demand (accounting for 9% by 2027 in the total industrial demand, against 6% in 2003), while the Iron and Steel segment grows the slowest. Chemical and Iron and Steel, very energy intensive industries, decrease from 54% to 49% but continue to dominate industrial demand (although with relatively minor contributions to industrial gross added value –about 10% in 2003).
F2.2.4 AGRICULTURE SECTOR Agriculture contribution to GDP will see its share decrease over time from the 13% in 2003. Agriculture grows 56% in the 2003-2027 period while GDP growth reaches 277%. As the sector achieves improved efficiency, the growth of energy service demand is limited to 1.8% per year.
F.2.2.5 ELECTRICITY FOR TRANSPORT AND NON-ENERGY USE OF NATURAL GAS Electricity use for transport is assumed to follow GDP growth with an elasticity of 0.5, and hence increases by 71% over the forecast period. The non-energy use of natural gas is assumed to remain constant.

SOUTH EAST EUROPE REGIONAL ENERGY MARKET SUPPORT (SEE REMS) PROJECT 229
F.2.3 ENERGY RESOURCES AND REGIONAL ENERGY PRICES Romania has energy resources, mostly lignite and natural gas. Uranium and crude oil are also present, but in more limited amounts.
Internal production of primary energy decreased during the last decade, but a tendency towards stabilization has been registered in the last years. A rather conservative annual depletion path has been adopted for the 2003-2027 period, with extraction assumed to remain at the 2003 level or slightly lower (natural gas). Within this limit, priority is given to domestic resources over imports, by assuming that domestic prices are slightly lower than import prices. Although the theoretical energy potential of the Romanian renewable energy sources has a higher value, a conservative penetration of renewables is assumed in the forecast period, i.e. 2 GW for wind energy and 1.6 GW for new hydro. It is important to note that already 6.215 GW of hydro power plants are installed, so the additional potential capacity is limited and represents only small hydro plants.
Table F-7: Upper Limits on Domestic Resource 2003 - 2027
Annual Supply
Biomass 150 PJ
Hard coal 51 PJ
Lignite 265 PJ
Natural gas 350 – 270 PJ
Uranium 200 PJ
Capacity
Hydro 7200 GW
Wind 2 GW
There are no limits imposed on fuel imports but the net imports of electricity are capped at zero, beginning in 2006.
The continuation of the nuclear program is assumed, with the addition of five more units of 700 MW possible. The model determines where to install these plants, except for the nuclear plant installed in 2007.
Table F-8: Sector Fuel Distribution Cost (M2003€/PJ)
Fuel
Sectors
Residential Commercial Agriculture Industry
Hard Coal 0.093
Brown Coal 0.387 0.387 0.387 0.387
Lignite 0.387 0.387 0.387 0.387
Light fuel 6.089 5.136 5.136 4.660
Heavy fuel -0.339 -0.339 -0.339 -0.339
LPG 1.890 1.355 1.355 1.035
Gas 0.316 0.316 0.316 0.303
Electricity 1.473 1.473 1.473 0.000
LTH 0.000 0.000 0.000 0.000
The projected evolution of energy prices is taken from the EU NEEDS project, as explained in Section 2. The evolution is then applied to recent border energy prices in Romania. These border prices are then
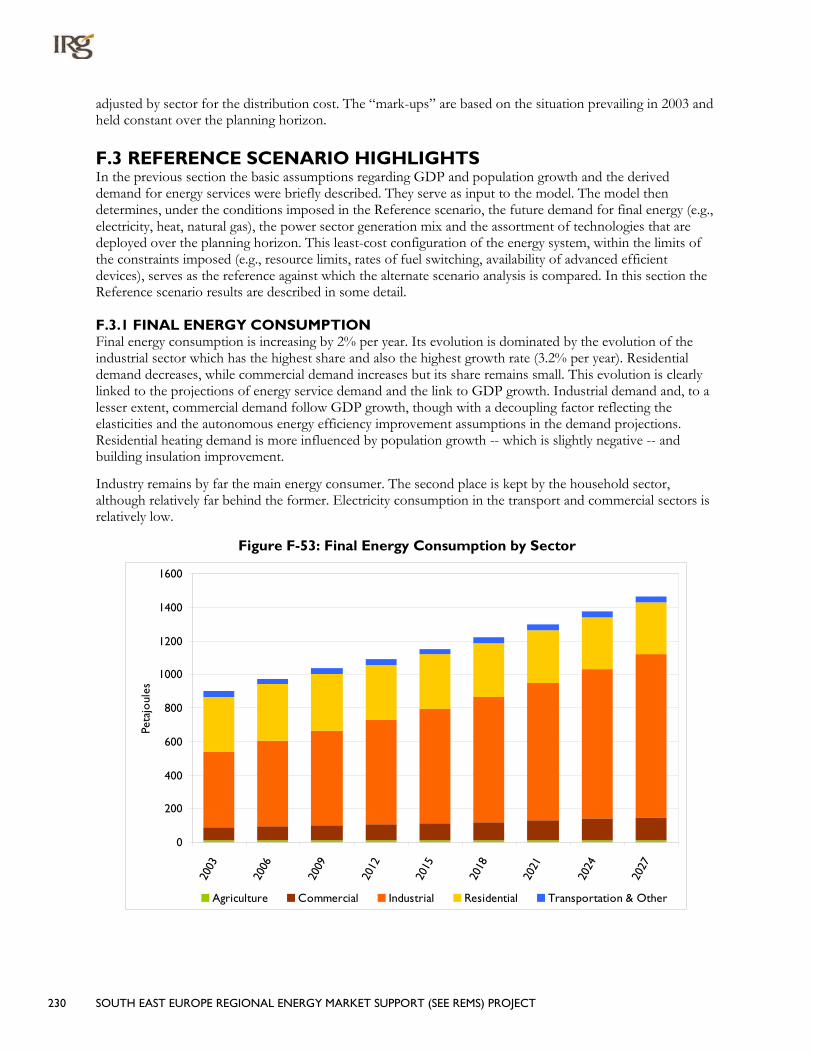
230 SOUTH EAST EUROPE REGIONAL ENERGY MARKET SUPPORT (SEE REMS) PROJECT
adjusted by sector for the distribution cost. The “mark-ups” are based on the situation prevailing in 2003 and held constant over the planning horizon.
F.3 REFERENCE SCENARIO HIGHLIGHTS In the previous section the basic assumptions regarding GDP and population growth and the derived demand for energy services were briefly described. They serve as input to the model. The model then determines, under the conditions imposed in the Reference scenario, the future demand for final energy (e.g., electricity, heat, natural gas), the power sector generation mix and the assortment of technologies that are deployed over the planning horizon. This least-cost configuration of the energy system, within the limits of the constraints imposed (e.g., resource limits, rates of fuel switching, availability of advanced efficient devices), serves as the reference against which the alternate scenario analysis is compared. In this section the Reference scenario results are described in some detail.
F.3.1 FINAL ENERGY CONSUMPTION Final energy consumption is increasing by 2% per year. Its evolution is dominated by the evolution of the industrial sector which has the highest share and also the highest growth rate (3.2% per year). Residential demand decreases, while commercial demand increases but its share remains small. This evolution is clearly linked to the projections of energy service demand and the link to GDP growth. Industrial demand and, to a lesser extent, commercial demand follow GDP growth, though with a decoupling factor reflecting the elasticities and the autonomous energy efficiency improvement assumptions in the demand projections. Residential heating demand is more influenced by population growth -- which is slightly negative -- and building insulation improvement.
Industry remains by far the main energy consumer. The second place is kept by the household sector, although relatively far behind the former. Electricity consumption in the transport and commercial sectors is relatively low.
Figure F-53: Final Energy Consumption by Sector
0
200
400
600
800
1000
1200
1400
1600
2003
2006
2009
2012
2015
2018
2021
2024
2027
Peta
joul
es
Agriculture Commercial Industrial Residential Transportation & Other

SOUTH EAST EUROPE REGIONAL ENERGY MARKET SUPPORT (SEE REMS) PROJECT 231
Figure F-54: Final Energy Consumption by Fuel
0
200
400
600
800
1000
1200
1400
1600
2003
2006
2009
2012
2015
2018
2021
2024
2027
Peta
joul
es
Coal Oil Natural Gas LPG Electricity Biomass Renewable (other) Low-temperature Heat
Electricity and gas see their share increase, while the other fuels decrease. More detail is provided on the composition of final energy delivered to each sector in the sections that follow.
F.3.3.1 RESIDENTIAL SECTOR As already noted the demand for energy services in the residential sector is expected to slightly drop owing to the decrease in population and improved building shell associated with the changing stock of housing. This results in a drop in final demand for all fuels except for electricity. There are nearly no shifts in the composition of fuel consumption for heating, except that coal use in stoves in local urban houses is replacing biomass, LPG and gas (mainly because of the price differential). District heating, natural gas and biomass in the rural areas are dominant and keep their relative position.
Electricity demand is driven by cooling demand, which increases over the period, and by demand for the other uses, such as lighting and appliances. As a result, residential electricity consumption increases with a yearly average of 0.9 %.

232 SOUTH EAST EUROPE REGIONAL ENERGY MARKET SUPPORT (SEE REMS) PROJECT
Figure F-55: Residential Final Energy Consumption
0
50
100
150
200
250
300
350
400
2003
2006
2009
2012
2015
2018
2021
2024
2027
Peta
joul
es
Coal Oil Natural Gas LPG Electricity Biomass Low-temperature Heat
F.3.3.2 COMMERCIAL SECTOR Final energy demand in the commercial sector increases by 2.4% per year. This increase is mostly satisfied by natural gas for heating and hot water, (whose share in commercial thermal uses increases from 59% in 2003 to almost 96% in 2027, natural gas replacing the other heating fuels). Electricity demand growth is driven by cooling demand. The penetration of electricity in thermal uses decreases to1.1% in 2027, from 3.7% in 2003.
Figure F-56: Commercial Final Energy Consumption
0
20
40
60
80
100
120
140
2003
2006
2009
2012
2015
2018
2021
2024
2027
Peta
joul
es
Coal Oil Natural Gas LPG Electricity Biomass Low-temperature Heat

SOUTH EAST EUROPE REGIONAL ENERGY MARKET SUPPORT (SEE REMS) PROJECT 233
F.3.3.3 INDUSTRIAL SECTOR Final energy demand by industry increases by 3.4% per year. Natural gas for high temperature heat and electricity for mechanical drive exhibit the highest growth rate. Solid fuels have a captive demand from the iron and steel sector.
Figure F-57: Industrial Final Energy Consumption
0
100
200
300
400
500
600
700
800
900
100020
03
2006
2009
2012
2015
2018
2021
2024
2027
Peta
joul
es
Coal Oil Natural Gas LPG Electricity Biomass Low-temperature Heat
F.3.3.4 AGRICULTURE SECTOR Figure D-58 shows the evolution of the principal fuels used in the agricultural sector in the Reference scenario. Oil consumption is dominant and remains so for the entire horizon, driven by increased mechanization of the sector.
Figure F-58: Agriculture Final Energy Consumption
0
2
4
6
8
10
12
14
16
2003
2006
2009
2012
2015
2018
2021
2024
2027
Peta
joul
es
Coal Oil Natural Gas LPG Electricity Biomass Renewables (other) Low-temperature Heat

234 SOUTH EAST EUROPE REGIONAL ENERGY MARKET SUPPORT (SEE REMS) PROJECT
F.3.2 ELECTRICITY GENERATION REQUIREMENTS The evolution of electricity generation in the Reference scenario reflects the average of 3.3% per year increase in electricity demand from all sectors
Nearly 12.5 GW of new installed capacity is required to meet increased demand in the 2006-2027 and replace existing units that are retired.
This increased demand is satisfied mainly by an increase in nuclear (by 3.8 GW), hydro (1 GW) and wind (2 GW) capacity, as can be seen in Figure F-59 and Figure F-60.
• Apart from the 0.7 GW nuclear unit already in service in 2007, and the two more units of 1.3 GW to be commissioned by 2015, according to the national expansion plans under consideration, 1.8 GW are installed in two stages, in 2021 and 2027. Consequently, the variation in coal generation reflects the nuclear capacity additions over the period.
• Existing lignite power plants are partly upgraded around 2012 to extend their useful life and partly replaced by new units after 2015, to benefit from the availability of cheap domestic lignite resources.
• Existing hard coal-fired plants are not upgraded but replaced by new units after 2020, to an extent of 1 GW.
• Existing gas and oil fired power plants are closed by 2015 because they are too expensive compared to the other options.
Figure F-59: Electricity Generation by Fuel
0
50
100
150
200
250
300
350
400
2003
2006
2009
2012
2015
2018
2021
2024
2027
Peta
joul
es
Nuclear power plants Coal-fired power plants Gas-fired power plants
Hydroelectric power plants Renewable & other power plants
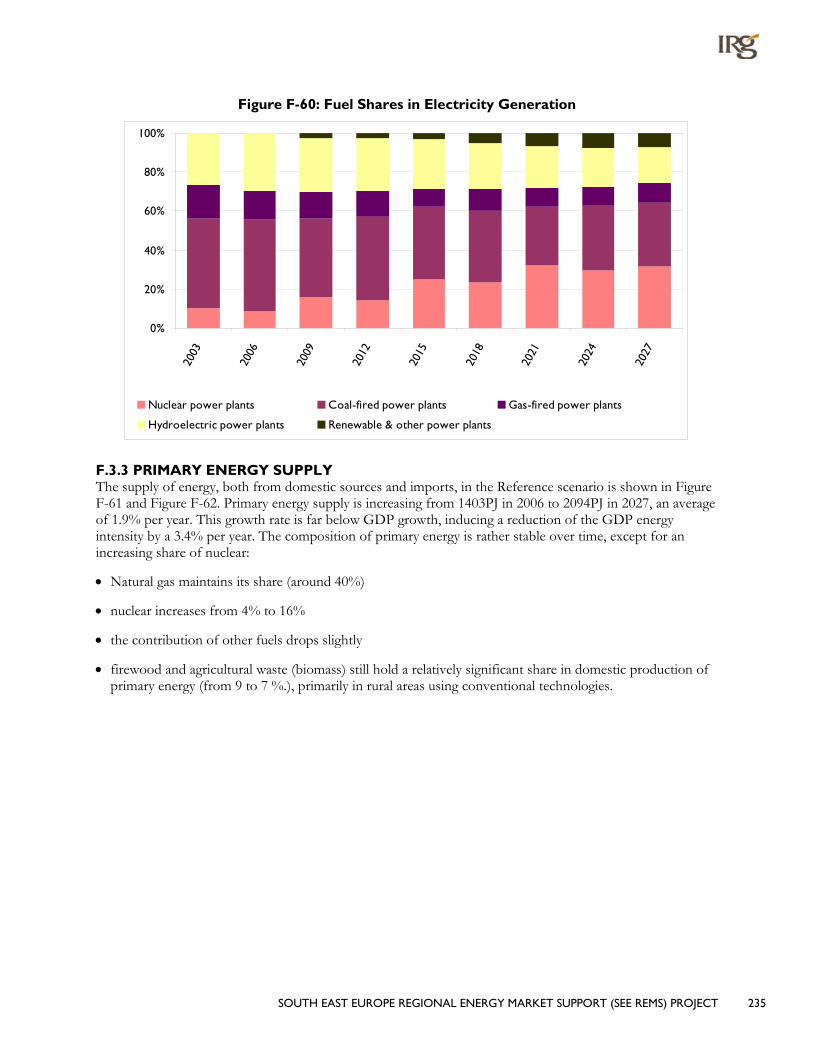
SOUTH EAST EUROPE REGIONAL ENERGY MARKET SUPPORT (SEE REMS) PROJECT 235
Figure F-60: Fuel Shares in Electricity Generation
0%
20%
40%
60%
80%
100%
2003
2006
2009
2012
2015
2018
2021
2024
2027
Nuclear power plants Coal-fired power plants Gas-fired power plants
Hydroelectric power plants Renewable & other power plants
F.3.3 PRIMARY ENERGY SUPPLY The supply of energy, both from domestic sources and imports, in the Reference scenario is shown in Figure F-61 and Figure F-62. Primary energy supply is increasing from 1403PJ in 2006 to 2094PJ in 2027, an average of 1.9% per year. This growth rate is far below GDP growth, inducing a reduction of the GDP energy intensity by a 3.4% per year. The composition of primary energy is rather stable over time, except for an increasing share of nuclear:
• Natural gas maintains its share (around 40%)
• nuclear increases from 4% to 16%
• the contribution of other fuels drops slightly
• firewood and agricultural waste (biomass) still hold a relatively significant share in domestic production of primary energy (from 9 to 7 %.), primarily in rural areas using conventional technologies.

236 SOUTH EAST EUROPE REGIONAL ENERGY MARKET SUPPORT (SEE REMS) PROJECT
Figure F-61: Primary Energy Supply by Fuel
0
500
1000
1500
2000
2500
2003
2006
2009
2012
2015
2018
2021
2024
2027
Peta
joul
es
Nuclear Coal Oil Natural Gas LPG Hydro, renewable, imports Biomass
Figure F-62: Fuel Shares in the Primary Energy Supply
0%
20%
40%
60%
80%
100%
2003
2006
2009
2012
2015
2018
2021
2024
2027
Nuclear Coal Oil Natural Gas LPG Hydro, renewable, imports Biomass
F.3.4 COSTS Over the course of the planning horizon there is a constant trade-off between investments in the power sector and demand devices and expenditure on fuel. In the Reference scenario, with the increasing fuel prices over the time horizon, this trade-off takes the form of spending more on investment in more efficient demand technologies and power plants versus spending more on fuels.
The energy system cost is dominated by fuel expenditures that increase to €13 billion per year by 2027, doubling compared to 2006.

SOUTH EAST EUROPE REGIONAL ENERGY MARKET SUPPORT (SEE REMS) PROJECT 237
Annualized investments in power plants and demand devices reach €3.8 billion in 2021 and €4.8 billion in 2027, with investment in efficient demand devices representing approximately 80%.
Annualized investments in the power sector are impacted most by the timing of commissioning of the new 13 GW, which are required to meet increasing demand and replace existing units which are retired.
F.4 SCENARIO ANALYSIS HIGHLIGHTS Providing increased access to energy efficient demand technologies, and further promoting their uptake by means of policies aimed at reducing electricity consumption or improving energy intensity (total consumption/GDP) causes various changes to the evolution of the energy system. In general, the three scenarios, R90/R90E/R90P, represent progressively more demanding changes in the energy system, beginning in 2012:
• Primary energy supply decreases by 9/11/16% by 2027, with a corresponding improvement in energy intensity, where the main fuel shift is a reduction in coal/lignite and natural gas consumption, particularly in the R90P scenario.
• Imports drop by around 20% by 2027 in all three scenarios, improving energy security.
• Final energy consumption drops by 10/10/15% by 2027, comprised of more coal, natural gas and biomass and less electricity, except in R90E.
• Electricity generation decreases by 4/10/6% by 2027, mostly from coal/lignite and gas power plants.
• The total energy system cost is reduced by €2023 million over the 27-year modeling horizon in the R90 and by €892 million in the R90E. There is a shift towards investment in more efficient demand devices and away from fuel expenditure.
F.4.1 FINAL ENERGY CONSUMPTION Final energy consumption decreases in the three scenarios compared to the reference, by 11/11/15% in R90/R90E/R90P in 2027. These reductions are obtained by adopting more efficient technologies and by shifting away from less efficient fuels such as biomass and coal. Insulation is also penetrating when high efficiency improvements are required. Substitution between fuels occurs mainly in the demand categories where such possibilities are the greatest, such as heating and hot water in the residential and commercial sectors, and high temperature heat in the industry.
The increased efficiency achieved in the energy system results in a decrease in natural gas use by 15%/13%/18% by2027; overall, however, natural gas’s share in final consumption is stable at 45.5%.
The reduction is less pronounced for electricity except in the scenario where electricity is explicitly targeted, because the technologies consuming electricity and available at the beginning of the horizon are already relatively efficient compared to the other technologies and because of efficiency gains in electricity generation.

238 SOUTH EAST EUROPE REGIONAL ENERGY MARKET SUPPORT (SEE REMS) PROJECT
Figure F-63: Final Energy Consumption by Fuel
0
200
400
600
800
1000
1200
1400
1600
2003
2006
2009
2012
2015
2018
2021
2024
2027
2003
2006
2009
2012
2015
2018
2021
2024
2027
2003
2006
2009
2012
2015
2018
2021
2024
2027
2003
2006
2009
2012
2015
2018
2021
2024
2027
R0 R90 R90E R90P
Peta
joul
es
Coal Oil Natural Gas LPG Electricity Biomass Low-temperature Heat
Imposing efficiency targets has the largest impact in the residential sector in percentage terms, but the industrial sector remains the major contribution to energy saving, as can be seen in Figure F-64.
Figure F-64: Savings in Final Energy by Sector
0
50
100
150
200
250
2003
2006
2009
2012
2015
2018
2021
2024
2027
2003
2006
2009
2012
2015
2018
2021
2024
2027
2003
2006
2009
2012
2015
2018
2021
2024
2027
R90 R90E R90P
Peta
joul
es
Agriculture Commercial Industrial Residential Transport & other
F.4.2 ELECTRICITY GENERATION AND POWER SECTOR INVESTMENTS Total electricity generation decreases by 4% (R90) and 6% (R90P) by 2027. When the target is on electricity consumption only, the decrease attains the 10% specified in the policy. The major changes are after 2018-2020 when the impact of the constraints becomes more significant and investment is reduced compared to the Reference.
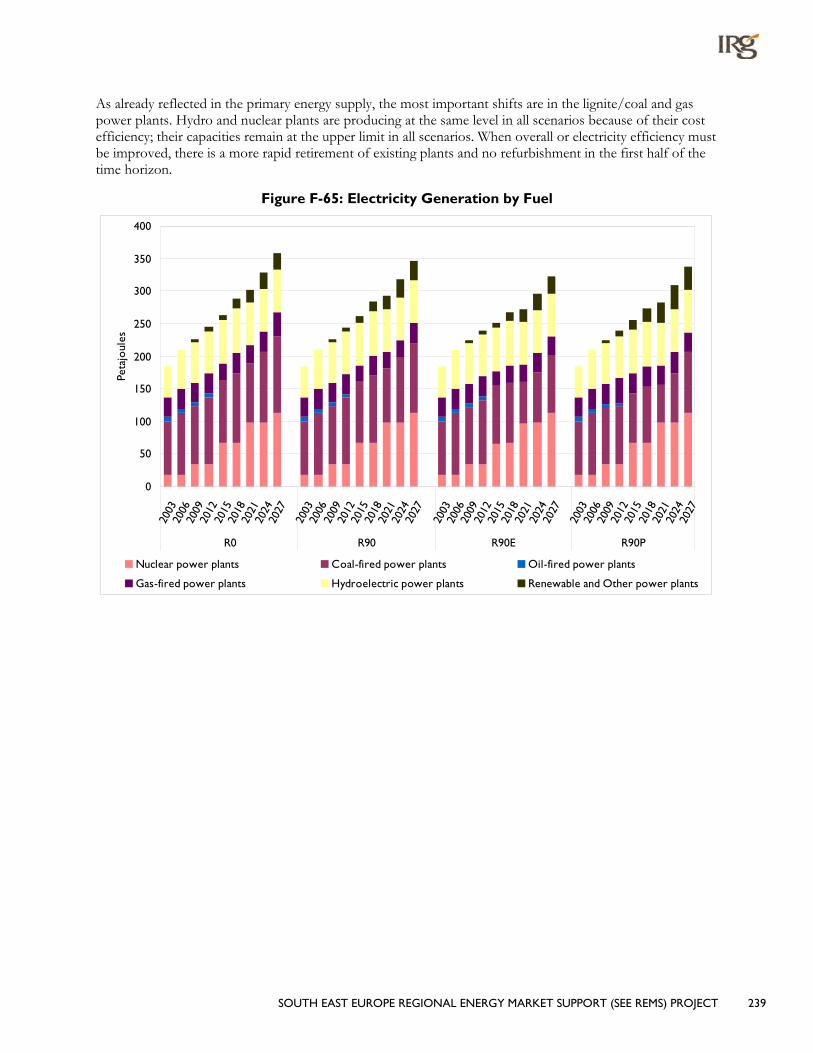
SOUTH EAST EUROPE REGIONAL ENERGY MARKET SUPPORT (SEE REMS) PROJECT 239
As already reflected in the primary energy supply, the most important shifts are in the lignite/coal and gas power plants. Hydro and nuclear plants are producing at the same level in all scenarios because of their cost efficiency; their capacities remain at the upper limit in all scenarios. When overall or electricity efficiency must be improved, there is a more rapid retirement of existing plants and no refurbishment in the first half of the time horizon.
Figure F-65: Electricity Generation by Fuel
0
50
100
150
200
250
300
350
400
2003
2006
2009
2012
2015
2018
2021
2024
2027
2003
2006
2009
2012
2015
2018
2021
2024
2027
2003
2006
2009
2012
2015
2018
2021
2024
2027
2003
2006
2009
2012
2015
2018
2021
2024
2027
R0 R90 R90E R90P
Peta
joul
es
Nuclear power plants Coal-fired power plants Oil-fired power plants
Gas-fired power plants Hydroelectric power plants Renewable and Other power plants

240 SOUTH EAST EUROPE REGIONAL ENERGY MARKET SUPPORT (SEE REMS) PROJECT
Figure F-66: Savings in Electricity Consumption
-1000
0
1000
2000
3000
4000
5000
6000
7000
8000
9000
10000
2003
2006
2009
2012
2015
2018
2021
2024
2027
2003
2006
2009
2012
2015
2018
2021
2024
2027
2003
2006
2009
2012
2015
2018
2021
2024
2027
R90 R90E R90P
Gig
awat
t H
our
s
The investment pattern in the different scenarios reflects this evolution, as shown in Figure F-67. While total investment decreases with efficiency constraints, the composition is rather stable with minor shifts between periods. In the most stringent case (R90P), no refurbishments are undertaken and investment in the less efficient lignite power plants is drastically reduced and partly replaced by IGCC plant. Investment is made earlier, in 2018, because of its overall cost efficiency compared to a lignite plant to be used for only a short number of periods. Combined cycle units based on natural gas are also installed in 2021.
Figure F-67: Investment in Power Plants by Fuel Type
0.000
0.500
1.000
1.500
2.000
2.500
2006
2009
2012
2015
2018
2021
2024
2027
2006
2009
2012
2015
2018
2021
2024
2027
2006
2009
2012
2015
2018
2021
2024
2027
2006
2009
2012
2015
2018
2021
2024
2027
R0 R90 R90E R90P
Gig
awat
ts
Nuclear power plants Coal-fired power plants Gas-fired power plants Hydroelectric power plants

SOUTH EAST EUROPE REGIONAL ENERGY MARKET SUPPORT (SEE REMS) PROJECT 241
F.4.3 PRIMARY ENERGY SUPPLY Because of the greater efficiency imposed on the energy system, the total primary energy supply decreases by 9%/11%/16% respectively by 2027. The reduction is primarily in natural gas imports. The available domestic resources are used to their upper limits; with a decrease in lignite production only, especially after 2018 in the R90P scenario, when the power sector faces a higher pressure on efficiency. By 2015 hard coal imports dropped, in both the R90 and R90E scenarios. In the R90P scenario hard coal imports which cease in 2012 are then required after the installation of IGCC plant. Supply of the other fuels remains constant.
Figure F-68: Primary Supply of Energy
0
200
400
600
800
1000
1200
1400
1600
1800
2000
2003
2006
2009
2012
2015
2018
2021
2024
2027
2003
2006
2009
2012
2015
2018
2021
2024
2027
2003
2006
2009
2012
2015
2018
2021
2024
2027
2003
2006
2009
2012
2015
2018
2021
2024
2027
R0 R90 R90E R90P
Peta
joul
es
Nuclear Coal Oil Natural Gas LPG Hydro & other Renewables, Electricity imports Biomass
The efficiency gain is also reflected in the overall energy intensity of the economy, measured by the primary energy per unit of GDP, as can be seen in Table F-9.
Table F-9: Energy Intensity (PJ/GDP) % change from R0 in 2027
R90 9.30%
R90E 10.62%
R90P 15.81%
Improving the efficiency of the energy system as in R90 and R90E decreases imports by 21-24%. When a further efficiency improvement is imposed (R90P), the impact on the share of imports is negligible because the efficiency gain is partly obtained by decreasing sharply the supply of domestic lignite to the electricity sector.
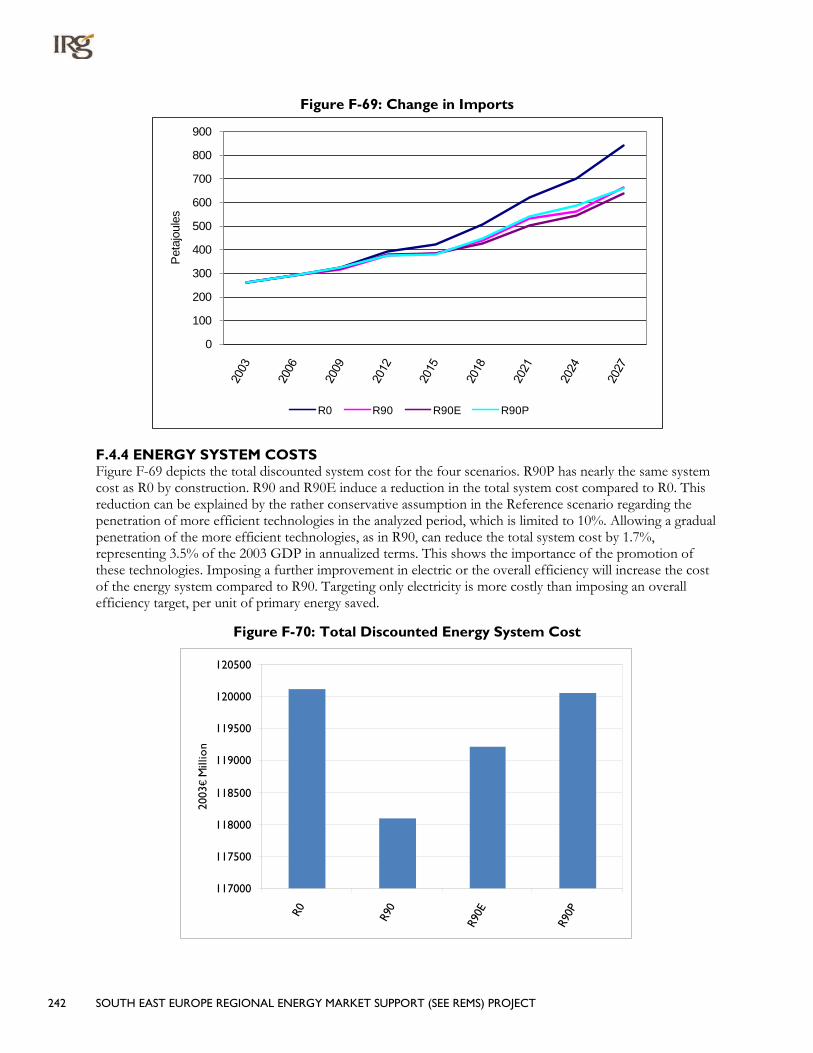
242 SOUTH EAST EUROPE REGIONAL ENERGY MARKET SUPPORT (SEE REMS) PROJECT
Figure F-69: Change in Imports
0
100
200
300
400
500
600
700
800
900
Pet
ajou
les
R0 R90 R90E R90P
F.4.4 ENERGY SYSTEM COSTS Figure F-69 depicts the total discounted system cost for the four scenarios. R90P has nearly the same system cost as R0 by construction. R90 and R90E induce a reduction in the total system cost compared to R0. This reduction can be explained by the rather conservative assumption in the Reference scenario regarding the penetration of more efficient technologies in the analyzed period, which is limited to 10%. Allowing a gradual penetration of the more efficient technologies, as in R90, can reduce the total system cost by 1.7%, representing 3.5% of the 2003 GDP in annualized terms. This shows the importance of the promotion of these technologies. Imposing a further improvement in electric or the overall efficiency will increase the cost of the energy system compared to R90. Targeting only electricity is more costly than imposing an overall efficiency target, per unit of primary energy saved.
Figure F-70: Total Discounted Energy System Cost
117000
117500
118000
118500
119000
119500
120000
120500
R0 R90
R90E
R90P
2003
€ M
illio
n

SOUTH EAST EUROPE REGIONAL ENERGY MARKET SUPPORT (SEE REMS) PROJECT 243
Imposing more energy efficiency not only reduces the total system cost but induces also a shift between investment and fuel cost. Figure F-71 depicts the changes in the annual expenditure in 2027 in the three scenarios compared to the Reference scenario. It shows clearly the redistribution of expenditures toward investment in demand devices and power plants to improve the energy efficiency of the system. The expenditures reproduced here are not completely comparable to the cost concept in the total system because they include part of the producer surplus, which is not a cost for society as a whole.
Figure F-71: Changes in 2027 Expenditure Compared to Reference Scenario
-3000
-2500
-2000
-1500
-1000
-500
0
500
1000
1500
2000
R90 R90E R90P
2003
€ M
illio
n
Annual Investment in Power Sector Annual Investment in Demand Devices
Annual Expenditures on Fuel
The trade-off between investment and fuel expenditure is most significant in the demand sectors in all scenarios, where more efficient technologies are adopted when available or when a target is imposed. In the power sector, the shift is less significant because the investments are mostly driven by the demand.
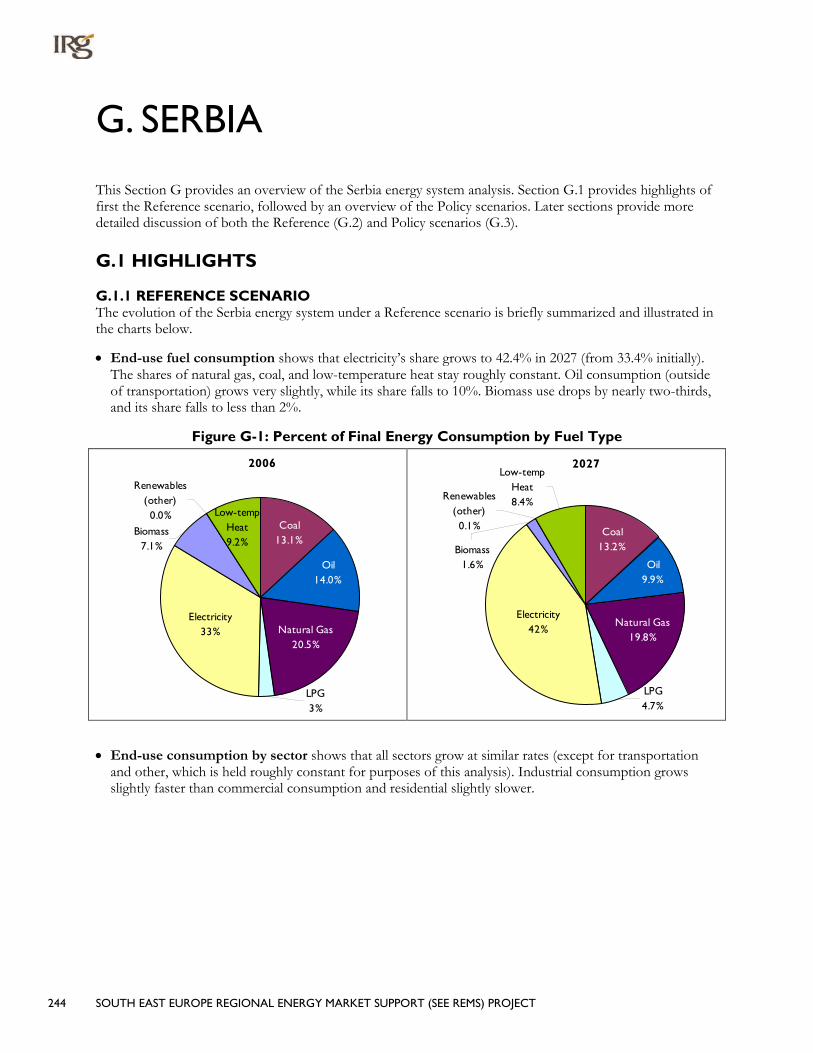
244 SOUTH EAST EUROPE REGIONAL ENERGY MARKET SUPPORT (SEE REMS) PROJECT
G. SERBIA
This Section G provides an overview of the Serbia energy system analysis. Section G.1 provides highlights of first the Reference scenario, followed by an overview of the Policy scenarios. Later sections provide more detailed discussion of both the Reference (G.2) and Policy scenarios (G.3).
G.1 HIGHLIGHTS
G.1.1 REFERENCE SCENARIO The evolution of the Serbia energy system under a Reference scenario is briefly summarized and illustrated in the charts below.
• End-use fuel consumption shows that electricity’s share grows to 42.4% in 2027 (from 33.4% initially). The shares of natural gas, coal, and low-temperature heat stay roughly constant. Oil consumption (outside of transportation) grows very slightly, while its share falls to 10%. Biomass use drops by nearly two-thirds, and its share falls to less than 2%.
Figure G-1: Percent of Final Energy Consumption by Fuel Type
2006
Renewables (other)0.0%
Biomass7.1%
Natural Gas20.5%
Coal13.1%
Oil14.0%
LPG3%
Electricity33%
Low-temp Heat9.2%
2027Low-temp
Heat8.4%Renewables
(other)0.1%
Electricity42%
Oil9.9%
Coal13.2%
Natural Gas19.8%
LPG4.7%
Biomass1.6%
• End-use consumption by sector shows that all sectors grow at similar rates (except for transportation and other, which is held roughly constant for purposes of this analysis). Industrial consumption grows slightly faster than commercial consumption and residential slightly slower.

SOUTH EAST EUROPE REGIONAL ENERGY MARKET SUPPORT (SEE REMS) PROJECT 245
Figure G-2: Percent of Final Energy Consumption by Sector
2006
Agriculture6%
Residential40%
Industrial32%
Commercial18%
Transport & Other
4%
2027
Agriculture6.5%
Residential38.2%
Industrial34.5%
Commercial18.0%
Transport & Other
3%
• Electric Generation increases from 113 PJ to 208 PJ by 2027, an 85% increase. [Note that exports are capped at 2003 levels.] Most of the growth is in coal-fired production. By 2027,
– 73.3% is from coal-fired power plants;
– 24.3% is from hydro, and
– less than 3% is contributed by gas and oil-fired plants and new non-hydro renewables (biomass and a small amount of wind).
Figure G-3: Percent Electricity Generation by Fuel Type
2006Renewable and Other power
plants0%
Oil-fired power plants
1%
Gas-fired power plants
1%
Hydroelectric power plants
32%
Coal-fired power plants66%
2027Renewable and Other power
plants1%
Gas-fired power plants
0%
Oil-fired power plants
1%
Hydroelectric power plants
24%
Coal-fired power plants74%
• Energy Supply in the country increases by 55.8% by 2027
– Coal, primarily domestic lignite for power production, provides the bulk of the additional energy requirements, increasing from 61.2% to 67%;
– natural gas use increases 37%, but its share drops from 17.2% to 15%;

246 SOUTH EAST EUROPE REGIONAL ENERGY MARKET SUPPORT (SEE REMS) PROJECT
– LPG consumption triples, reaching 3% of total supply;
– oil consumption (outside of the transportation sector) increases by 24%; and
– biomass use drops slightly, and its share falls to 3%.
Figure G-4: Percent of Total Energy Supply
2006
Electricity Imports3.1%
Biomass4.5% Nuclear
0.0%LPG1.7%
Natural Gas17.2%
Coal61.2%Oil
12.3%
2027
Biomass3%
LPG3%
Electricity Imports
2%Nuclear
0%
Natural Gas15%
Oil10%
Coal67%
• Fuel expenditures increase to €3.6 billion per year by 2027, 67% higher than 2006, and dominate the energy system cost.
• Annualized investments in power plants and demand devices reach €2.4 billion in 2021 and €3.2 billion in 2027, with investment in demand devices absorbing 7.4 times the investment in power plants over the forecast period.
G.1.2 POLICY SCENARIOS Providing increased access to energy efficient demand technologies, and further promoting their uptake by means of policies aimed at reducing electricity consumption or improving energy intensity (total consumption / GDP) results in various changes to the evolution of the energy system. The information below reflects the R90/R90E/R90P results, respectively. In general, the three scenarios represent progressively more demanding changes in the energy system, as their relative results illustrate. In the Serbian case, the R90 and R90E results are quite similar, as simply providing increased access to efficient devices reduces electricity consumption by nearly 10%.
• End-use Fuel Consumption drops 11% in the R90/R90E scenarios and 15% in the R90P scenario. Electricity consumption shows the most change, dropping 15/16/21% due to the improved efficiency of end-use devices introduced by these scenarios. Oil consumption drops 18% in all three scenarios, and natural gas use drops 7%. Coal to end uses drops 12% in the R90P scenario. Usage of LPG fluctuates from scenario to scenario.

SOUTH EAST EUROPE REGIONAL ENERGY MARKET SUPPORT (SEE REMS) PROJECT 247
Figure G-5: Final Energy Consumption
0.0
50.0
100.0
150.0
200.0
250.0
300.0
350.0
400.0
450.0
500.0
R0 R90
R90E
R90P
Peta
joul
es
Coal Oil Natural Gas LPG Electricity Biomass Others LTH
• Energy imports drop by 10.2/9.3/12.2% in 2027 for the three respective scenarios, which improves energy security.
• Electricity generation from lignite-fired plants drops 20.9/21.8/45.9% in the three scenarios. The drop in the R90 and R90E scenarios comes almost entirely from increased end-use efficiency, particularly in the commercial and residential sectors. About 60% of the further drop in the R90P scenario is made up of new wind generation.
Figure G-6: 2027 Electricity Generation Mix by Fuel Type
0
10000
20000
30000
40000
50000
60000
70000
R0 R90
R90E
R90P
Peta
joul
es
Nuclear Coal-fired Oil-fired Gas-fired Hydroelectric Renewable and Other
• Primary energy use in the country decreases by 15/15/29% by 2027, with a corresponding improvement in energy intensity, with the bulk of the reductions coming from lignite to the power sector.

248 SOUTH EAST EUROPE REGIONAL ENERGY MARKET SUPPORT (SEE REMS) PROJECT
Figure G-7: Total Energy Supply
0
100
200
300
400
500
600
700
800
R0 R90
R90E
R90P
Peta
joul
es
Nuclear Coal Oil Natural Gas LPG Electricity Imports Biomass
• The R90 scenario results in an overall energy system cost savings of €1.49 billion over the 27-year modeling horizon, and the R90E €1.39 billion, due to the need to turn to even more expensive electric devices and fuels. R90P has the same system cost as R0 by definition.
• Relative to the Reference scenario, the three scenario runs show the following changes in costs.
– Annualized investment in power plants decreases by 30% in the R90 and R90E scenarios due to the reduced load growth, but only 14% in the R90P case as increased investments in wind generation are made.
– Annualized investments in new demand devices increase significantly (€350-573 million, or 13- 22% annually by 2027) to achieve the policy goals. The bulk of the more efficient investments are focused on commercial cooling and lighting, industrial process heat and machine drive, and residential heating, water heating, and other electric.
– There is a corresponding decrease in fuel expenditures (€594/578/736 million, or 16-21% per year by 2027) in all three scenarios as the more efficient devices require less fuel relative to the Reference scenario. These savings offset the increased expenditures on new, more efficient devices.
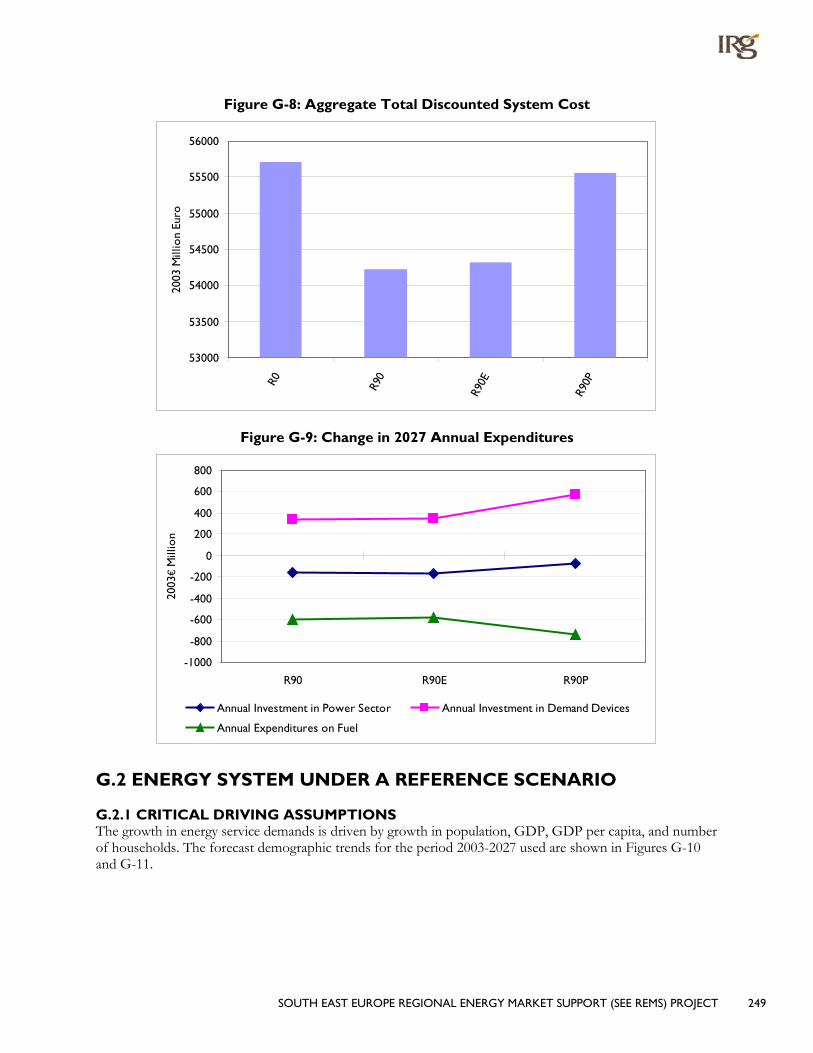
SOUTH EAST EUROPE REGIONAL ENERGY MARKET SUPPORT (SEE REMS) PROJECT 249
Figure G-8: Aggregate Total Discounted System Cost
53000
53500
54000
54500
55000
55500
56000
R0 R90
R90E
R90P
2003
Mill
ion
Euro
Figure G-9: Change in 2027 Annual Expenditures
-1000
-800
-600
-400
-200
0
200
400
600
800
R90 R90E R90P
2003
€ M
illio
n
Annual Investment in Power Sector Annual Investment in Demand Devices
Annual Expenditures on Fuel
G.2 ENERGY SYSTEM UNDER A REFERENCE SCENARIO
G.2.1 CRITICAL DRIVING ASSUMPTIONS The growth in energy service demands is driven by growth in population, GDP, GDP per capita, and number of households. The forecast demographic trends for the period 2003-2027 used are shown in Figures G-10 and G-11.
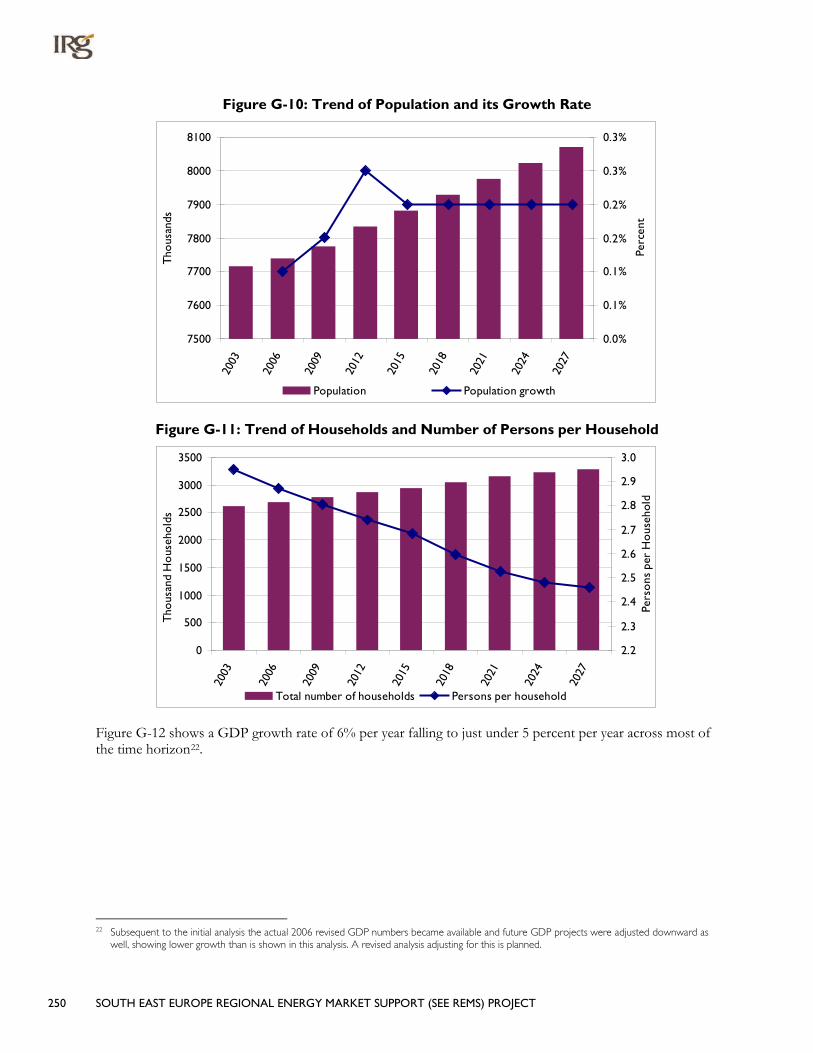
250 SOUTH EAST EUROPE REGIONAL ENERGY MARKET SUPPORT (SEE REMS) PROJECT
Figure G-10: Trend of Population and its Growth Rate
7500
7600
7700
7800
7900
8000
8100
2003
2006
2009
2012
2015
2018
2021
2024
2027
Tho
usan
ds
0.0%
0.1%
0.1%
0.2%
0.2%
0.3%
0.3%
Perc
ent
Population Population growth
Figure G-11: Trend of Households and Number of Persons per Household
0
500
1000
1500
2000
2500
3000
3500
2003
2006
2009
2012
2015
2018
2021
2024
2027
Tho
usan
d H
ous
eho
lds
2.2
2.3
2.4
2.5
2.6
2.7
2.8
2.9
3.0
Pers
ons
per
Ho
useh
old
Total number of households Persons per household
Figure G-12 shows a GDP growth rate of 6% per year falling to just under 5 percent per year across most of the time horizon22
22 Subsequent to the initial analysis the actual 2006 revised GDP numbers became available and future GDP projects were adjusted downward as
well, showing lower growth than is shown in this analysis. A revised analysis adjusting for this is planned.
.

SOUTH EAST EUROPE REGIONAL ENERGY MARKET SUPPORT (SEE REMS) PROJECT 251
Figure G-12: Projection of Total GDP and its Growth Rate
0
10,000
20,000
30,000
40,000
50,000
60,000
2003
2006
2009
2012
2015
2018
2021
2024
2027
2003
Mill
ion
Euro
s
0%
1%
2%
3%
4%
5%
6%
7%
Perc
ent
GDP GDP growth
G.2.2 ENERGY SERVICE DEMAND PROJECTIONS As discussed in Section 2 the demand for energy services over time serves as the primary driver for the requirements of the future energy system. These are derived by establishing the relationship between the fundamental drivers (discussed in the previous section), and their relationship via elasticities to the individual demands. The aggregate view of the demand composition is shown in Figure G-13, and each sector is discussed briefly in the sections that follow. The fastest growing sector is the commercial sector, where demand grows 164%, followed by the residential sector, with a 132% increase.
Figure G-13: Projection of Energy Service Demand for each Sector
0
50
100
150
200
250
300
350
400
450
500
2003
2006
2009
2012
2015
2018
2021
2024
2027
Peta
joul
es
Agriculture Commercial Industrial Residential Transport/Non-energy
G.2.2.1 RESIDENTIAL SECTOR The main driving factors for calculation of energy demand in the residential sector are growth in the number of households [see Figure G-11] and the evolution of residential living away from rural toward urban single family dwellings with centralized heating systems, as shown in Figure G-14.

252 SOUTH EAST EUROPE REGIONAL ENERGY MARKET SUPPORT (SEE REMS) PROJECT
Figure G-15 shows projected service demands in the residential sector, which increase 2.32 times overall. The fastest growing demand is space cooling, which grows from virtually nothing to nearly one-sixth of the total demand. Other rapidly growing demands are lighting and water heating, which both triple over the forecast horizon.
Figure G-14: Composition of Residential Dwellings over Time
0%
10%20%
30%40%
50%
60%70%
80%90%
100%20
03
2006
2009
2012
2015
2018
2021
2024
2027
Apartments - Urban Single House - Urban - CentralSingle House - Urban - Local Single House - Rural - Local
Figure G-15: Residential Demand for Energy Services (Useful Energy)
0
10
20
30
40
50
60
2003
2006
2009
2012
2015
2018
2021
2024
2027
Peta
joul
es
Space Heating Water Heating Space Cooling Cooking LightningOther Electricity Dish Washing Fridges & Freezers Clothes Washing Clothes Drying
G.2.2.2 COMMERCIAL SECTOR Figure G-16 shows projected service demands in the commercial sector, which increase 2.64 times overall. The largest demands by 2027 are lighting, which triples over the forecast; space heating, which grows more slowly; and space cooling, which grows by 3.8 times.

SOUTH EAST EUROPE REGIONAL ENERGY MARKET SUPPORT (SEE REMS) PROJECT 253
Figure G-16: Commercial Demand for Energy Services (Useful Energy)
0
20
40
60
80
100
120
140
2003
2006
2009
2012
2015
2018
2021
2024
2027
Peta
joul
es
Space Heating Hot Water Space Cooling Cooking
Lightning Other Electricity Public Lighting Fridges and Freezers
G.2.2.3 INDUSTRIAL SECTOR The driving factor in forecast energy demand in the industrial sector is the estimated growth in GDP, which is mapped to increases in service demands by means of elasticities which relate future GDP growth to each sector’s demand growth. This growth is moderated by an autonomous energy efficiency improvement (AEEI) factor for non-technology improvements (e.g., management practices and process changes).
Table G-1: Demand Elasticities Demand Type Elasticity AEI Overall growth
High-temperature heat 0.6-.7 0.015 44-62%
Low-temperature heat 1.2-1.4 0.01 190%
Mechanical drive 0.9-1.1 0.005 158-190%
The resulting demand growth is shown in Figure G-17. Paper and Other are the fastest growing industrial demands, Iron and Steel and Non-metallic minerals are the slowest. Overall industrial demand grows more slowly than commercial and residential, increasing 89% over the forecast horizon.

254 SOUTH EAST EUROPE REGIONAL ENERGY MARKET SUPPORT (SEE REMS) PROJECT
Figure G-17: Industrial Demand for Energy Services (Useful Energy)
0
5
10
15
20
25
30
35
2003
2006
2009
2012
2015
2018
2021
2024
2027
Peta
joul
es
Space Heating Hot Water Space cooling CookingLightning Other Electricity Public Lighting Fridges and Freezers
G.2.2.4 AGRICULTURE As in industry, agricultural energy demands are projected by means of an elasticity relating demand growth to GDP growth. For Serbia, an elasticity of 0.66 was used, resulting in a doubling of energy service demand over the forecast period. It remains a small portion of total energy service demand.
G.2.2.5 TRANSPORT AND NON-ENERGY USE Electricity demand for transport is projected based on population growth, and hence grows very slowly and remains less than 1% of total electricity demand. Natural gas use in non-energy sectors (consumed for fertilizer) has been held constant for this analysis.
G.2.3 ENERGY SUPPLY AND PRICES Figure 2.2 in the Regional section shows the trend of energy prices based on the EU NEEDS Project. These trends are applied to recent energy prices in Serbia to produce forecasts of future prices across the time horizon of this study. As noted earlier, it is assumed that the countries of the region will be confronted by the prevailing EU prices soon, so any country differentials at the border are removed beginning in 2015.
Besides the border price influencing the price seen by the consumer for each energy form, a distinction is made with respect to internal distribution costs to the different sectors. The “mark-ups” are based upon the situation in 2003, shown in Table G-2 below, and held constant over the planning horizon.
Table G-2: Sector Fuel Price “Mark-Ups” (M2003€/PJ)
Fuel
Sectors
Residential Commercial Agriculture Industry
Hard Coal 0.000 0.000 0.000 0.000
Brown Coal Briquettes 0.903 0.903 0.903 0.002
Lignite 3.506 3.506 3.506 2.580
Light fuel 12.580 12.580 12.580 8.995
Heavy fuel 9.118 9.118 9.118 6.628
LPG 3.395 3.395 3.395 1.811
Gas 1.358 1.358 1.358 0.387
Electricity 2.296 1.700 1.700 0.000

SOUTH EAST EUROPE REGIONAL ENERGY MARKET SUPPORT (SEE REMS) PROJECT 255
Fuel
Sectors
Residential Commercial Agriculture Industry
Low-temperature heat 0.000 0.000 0.000 0.000
Domestic supply increases only slightly, with the exception of the potential for lignite, which is permitted to double over the modeling horizon, as reported in Table G-3. Most imports that occur currently are assumed to be unlimited in the future, with the exception of electricity, which is capped at its 2003 level, and natural gas, whose import is limited by a supply pipeline with capacity of 112 PJ. In addition, the internal distribution system for natural gas to the commercial and residential sectors is limited to grow at 10% and 5% per year, subject to additional investment, if needed. These limits are binding in the Reference scenario.
Table G-3: Upper Limits on Domestic Resource Supply (PJ) Domestic Supply 2003 - 2027
Biomass 20.36
Brown Coal 6.47
Coke 0.00
Hard Coal 1.36
Lignite Coal 250-536
Natural Gas 13.71
Distillate 18.21
Gasoline 0.65
Heavy Fuel Oil 33.67
Kerosene 0.00
LPG 0.77
G.2.4 REFERENCE SCENARIO HIGHLIGHTS The previous sections provided insight into the basic assumptions that shape the expected demand for energy services. But it is left up to the model to develop a depiction of the energy system under business-as-usual conditions to determine how to serve those demands by determining the future demand for final energy (e.g., electricity, heat, natural gas), the power sector generation mix, and the assortment of technologies that are deployed over the planning horizon. This least-cost configuration of the energy system, within the limits of the constraints imposed (e.g., resource limits, rates of fuel switching, availability of advanced efficient devices), serves as the Reference scenario against which the alternate scenario analysis is compared. In this section the Reference scenario results are described.
G.2.4.1 FINAL ENERGY CONSUMPTION There is rapidly growing demand for electricity in the Reference scenario, and electricity consumption more than doubles over the planning horizon. LPG serves as a gap-filling fuel in the middle of the forecast period, increasing rapidly before the major expansion in power generation capacity and then declining slightly. Consumption of other fuels grows more slowly, and final consumption of biomass drops to nearly zero. Low-temperature heat consumption increases slightly, primarily in the industrial sector.

256 SOUTH EAST EUROPE REGIONAL ENERGY MARKET SUPPORT (SEE REMS) PROJECT
Figure G-18: Final Energy Consumption by Fuel
0.0
50.0
100.0
150.0
200.0
250.0
300.0
350.0
400.0
450.0
500.0
R0 R90
R90E
R90P
Peta
joul
es
Coal Oil Natural Gas LPG Electricity Biomass Others LTH
As shown in Figure G-19, consumption grows rapidly in the three major sectors, with industrial growing slightly faster and residential slightly slower. Total final energy consumption grows by 70% over the forecast period.
Figure G-19: Final Energy Consumption by Sector
0
50
100
150
200
250
300
350
400
450
500
2003
2006
2009
2012
2015
2018
2021
2024
2027
Peta
joul
es
Agriculture Commercial Industrial Residential Transport & Other
More detail is provided on the composition of final energy delivered to each sector in the sections that follow.
G.2.4.1.1 Residential Sector Residential fuel consumption increases 70% over the model period. Electricity consumption grows slowly in the first half of the forecast, but then increases by 60% after 2015, driven by large increases in use for air conditioning, dishwashing, clothes drying, and other demands that are minimal at the start of the forecast. There is a steady increase in natural gas use for urban space heating, and a rapid increase in LPG use in the

SOUTH EAST EUROPE REGIONAL ENERGY MARKET SUPPORT (SEE REMS) PROJECT 257
first half of the forecast as natural gas distribution infrastructure is being built out. Coal and low-temperature heat use remain relatively constant, and biomass use for heating steadily declines. (The jump in consumption visible between 2003 and 2006 results from calibration for 2003’s unusually warm heating season.)
Figure G-20: Final Energy Consumption – Residential
0
20
40
60
80
100
120
140
160
180
2003
2006
2009
2012
2015
2018
2021
2024
2027
Peta
joul
es
Coal Oil Natural Gas LPG Electricity Biomass Renewables Low-temp Heat
G.2.4.1.2 Commercial Sector Consumption patterns in the commercial sector parallel those in the residential sector: rapidly increasing electricity use for space cooling, lighting, and other demands, steadily increasing natural gas use, and LPG filling mid-period gaps while natural gas distribution is slowly expanding. Electricity, oil, coal and low-temperature heat all remain significant space heating fuels, while biomass use is eliminated by 2018.

258 SOUTH EAST EUROPE REGIONAL ENERGY MARKET SUPPORT (SEE REMS) PROJECT
Figure G-21: Final Energy Consumption – Commercial
0
10
20
30
40
50
60
70
80
90
2003
2006
2009
2012
2015
2018
2021
2024
2027
Peta
joul
es
Coal Oil Natural Gas LPG Electricity Biomass Low-temp Heat
G.2.4.1.3 Industrial Sector Total industrial fuel consumption grows 80% by 2027. The evolution of the fuel mix for industry is shown in Figure G-22. Electricity consumption more than doubles, primarily to power machine drives in the food, chemicals, and other industries. Coal use also increases rapidly, and coal and natural gas become the predominant fuels for high temperature process heat. The use of low-temperature heat from CHP plants also increases. Driven by high prices, oil use declines. A small amount of biomass is taken up in the food and paper industries at the end of the model horizon.
Figure G-22: Final Energy Consumption – Industry
0
20
40
60
80
100
120
140
160
180
2003
2006
2009
2012
2015
2018
2021
2024
2027
Peta
joul
es
Coal Oil Natural Gas LPG Electricity Biomass Low-temp Heat
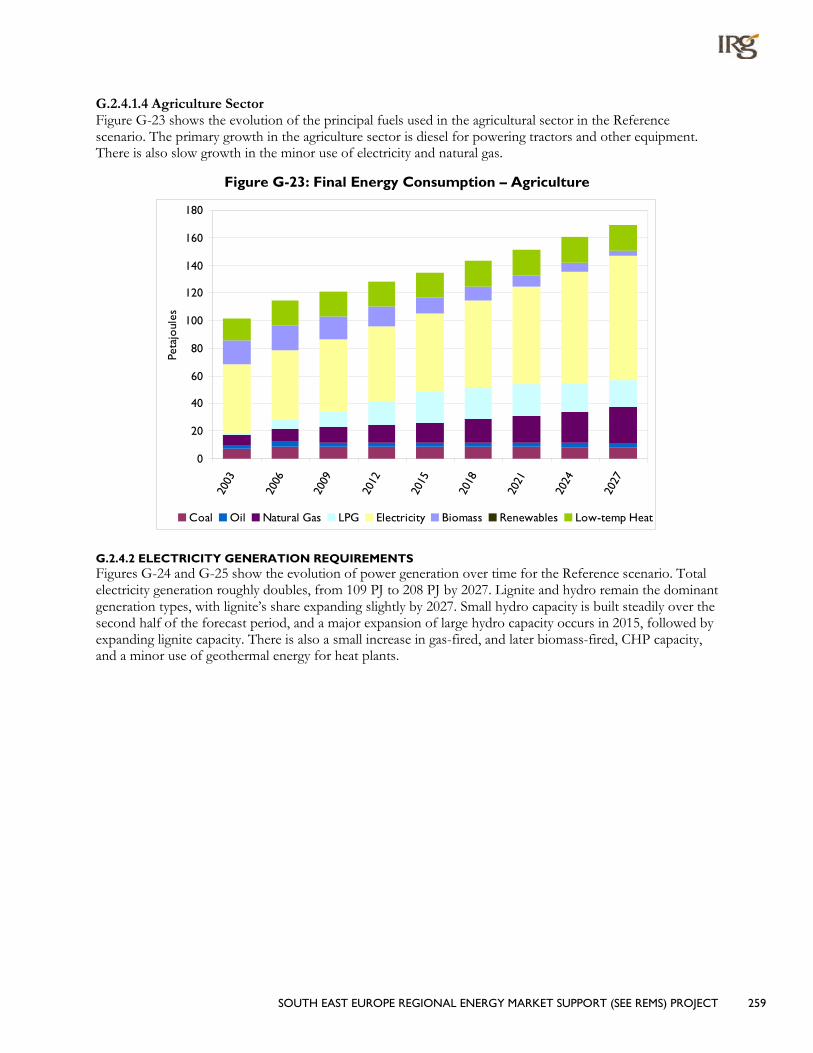
SOUTH EAST EUROPE REGIONAL ENERGY MARKET SUPPORT (SEE REMS) PROJECT 259
G.2.4.1.4 Agriculture Sector Figure G-23 shows the evolution of the principal fuels used in the agricultural sector in the Reference scenario. The primary growth in the agriculture sector is diesel for powering tractors and other equipment. There is also slow growth in the minor use of electricity and natural gas.
Figure G-23: Final Energy Consumption – Agriculture
0
20
40
60
80
100
120
140
160
18020
03
2006
2009
2012
2015
2018
2021
2024
2027
Peta
joul
es
Coal Oil Natural Gas LPG Electricity Biomass Renewables Low-temp Heat
G.2.4.2 ELECTRICITY GENERATION REQUIREMENTS Figures G-24 and G-25 show the evolution of power generation over time for the Reference scenario. Total electricity generation roughly doubles, from 109 PJ to 208 PJ by 2027. Lignite and hydro remain the dominant generation types, with lignite’s share expanding slightly by 2027. Small hydro capacity is built steadily over the second half of the forecast period, and a major expansion of large hydro capacity occurs in 2015, followed by expanding lignite capacity. There is also a small increase in gas-fired, and later biomass-fired, CHP capacity, and a minor use of geothermal energy for heat plants.

260 SOUTH EAST EUROPE REGIONAL ENERGY MARKET SUPPORT (SEE REMS) PROJECT
Figure G-24: Electricity Generation by Fuel
0
10000
20000
30000
40000
50000
60000
2003
2006
2009
2012
2015
2018
2021
2024
2027
Peta
joul
es
Nuclear power plants Coal-fired power plantsOil-fired power plants Gas-fired power plantsHydroelectric power plants Renewable and Other power plants
Figure G-25: Share of the Electricity Generation by Fuel
0%
10%
20%
30%
40%
50%
60%
70%
80%
90%
100%
2003
2006
2009
2012
2015
2018
2021
2024
2027
Nuclear power plants Coal-fired power plantsGas-fired power plants Hydroelectric power plantsRenewable and Other power plants
Figure G-26 below compares the Reference scenario power generation evolution over time to the GIS Case 2 and 3 forecasts. The MARKAL forecast roughly tracks the GIS Case 3 forecast, which uses s similar GDP forecast, through 2015. After this, the MARKAL Reference scenario growth accelerates, driven by slightly higher GDP and population growth projections, rapidly increasing cooling and other residential demands, and fuel switching from higher cost and/or supply constrained fuels.
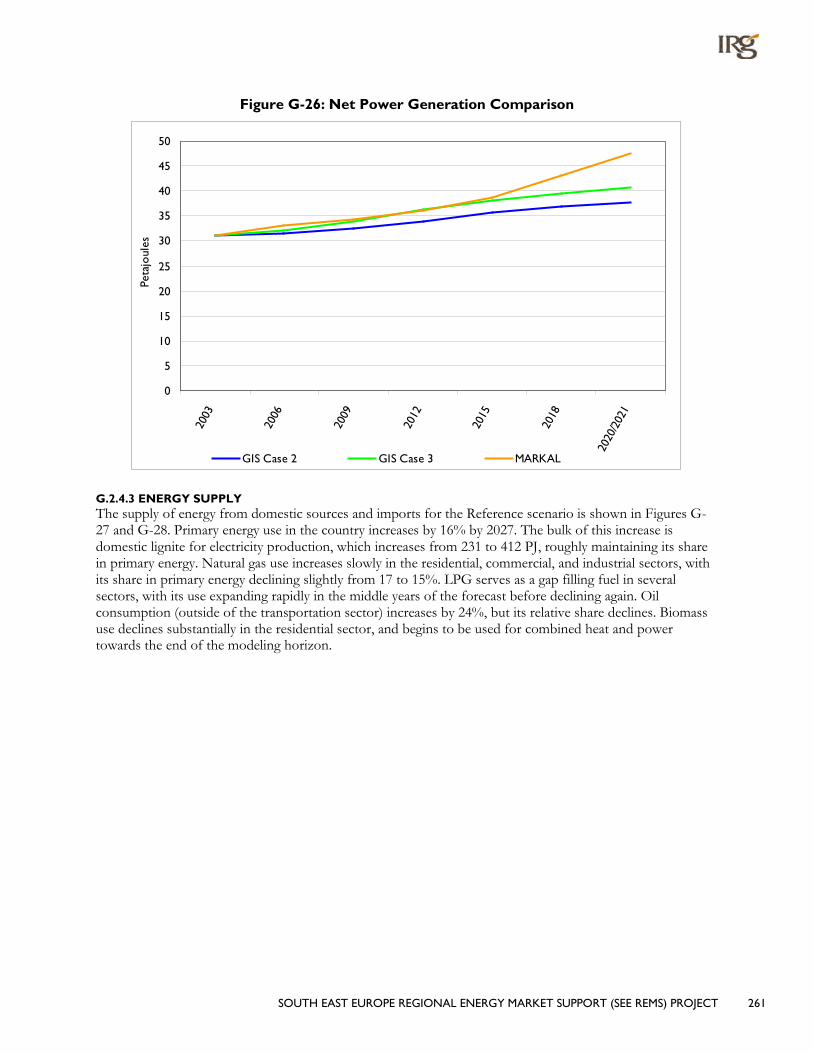
SOUTH EAST EUROPE REGIONAL ENERGY MARKET SUPPORT (SEE REMS) PROJECT 261
Figure G-26: Net Power Generation Comparison
0
5
10
15
20
25
30
35
40
45
50
2003
2006
2009
2012
2015
2018
2020
/202
1
Peta
joul
es
GIS Case 2 GIS Case 3 MARKAL
G.2.4.3 ENERGY SUPPLY The supply of energy from domestic sources and imports for the Reference scenario is shown in Figures G-27 and G-28. Primary energy use in the country increases by 16% by 2027. The bulk of this increase is domestic lignite for electricity production, which increases from 231 to 412 PJ, roughly maintaining its share in primary energy. Natural gas use increases slowly in the residential, commercial, and industrial sectors, with its share in primary energy declining slightly from 17 to 15%. LPG serves as a gap filling fuel in several sectors, with its use expanding rapidly in the middle years of the forecast before declining again. Oil consumption (outside of the transportation sector) increases by 24%, but its relative share declines. Biomass use declines substantially in the residential sector, and begins to be used for combined heat and power towards the end of the modeling horizon.

262 SOUTH EAST EUROPE REGIONAL ENERGY MARKET SUPPORT (SEE REMS) PROJECT
Figure G-27: Energy Supply by Type
0
100
200
300
400
500
600
700
800
2003
2006
2009
2012
2015
2018
2021
2024
2027
Peta
joul
es
Nuclear Coal Oil Natural Gas LPG Electricity Imports Biomass
Figure G-28: Energy Supply by Type (Shares)
0%
10%
20%
30%
40%
50%
60%
70%
80%
90%
100%
2003
2006
2009
2012
2015
2018
2021
2024
2027
Nuclear Coal Oil Natural Gas LPG Electricity Imports Biomass
G.2.4.4 COSTS Over the course of the model horizon there is a constant trade-off between capital investments in power sector and demand devices and expenditures on fuel. This trade-off usually takes the form of spending more to purchase more efficient demand technologies versus making large investments in the power sector and spending more on fuels. In the Reference scenario
• Fuel expenditures increase to €3.6 billion per year by 2027, 67% higher than 2006; and
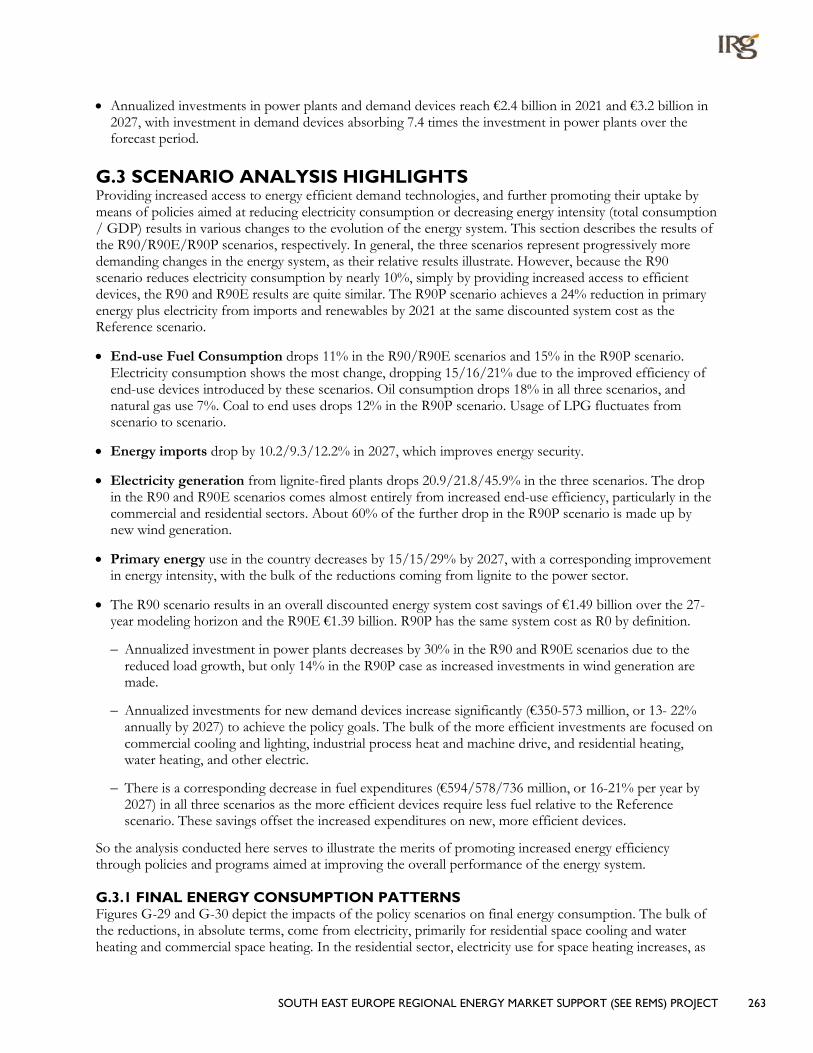
SOUTH EAST EUROPE REGIONAL ENERGY MARKET SUPPORT (SEE REMS) PROJECT 263
• Annualized investments in power plants and demand devices reach €2.4 billion in 2021 and €3.2 billion in 2027, with investment in demand devices absorbing 7.4 times the investment in power plants over the forecast period.
G.3 SCENARIO ANALYSIS HIGHLIGHTS Providing increased access to energy efficient demand technologies, and further promoting their uptake by means of policies aimed at reducing electricity consumption or decreasing energy intensity (total consumption / GDP) results in various changes to the evolution of the energy system. This section describes the results of the R90/R90E/R90P scenarios, respectively. In general, the three scenarios represent progressively more demanding changes in the energy system, as their relative results illustrate. However, because the R90 scenario reduces electricity consumption by nearly 10%, simply by providing increased access to efficient devices, the R90 and R90E results are quite similar. The R90P scenario achieves a 24% reduction in primary energy plus electricity from imports and renewables by 2021 at the same discounted system cost as the Reference scenario.
• End-use Fuel Consumption drops 11% in the R90/R90E scenarios and 15% in the R90P scenario. Electricity consumption shows the most change, dropping 15/16/21% due to the improved efficiency of end-use devices introduced by these scenarios. Oil consumption drops 18% in all three scenarios, and natural gas use 7%. Coal to end uses drops 12% in the R90P scenario. Usage of LPG fluctuates from scenario to scenario.
• Energy imports drop by 10.2/9.3/12.2% in 2027, which improves energy security.
• Electricity generation from lignite-fired plants drops 20.9/21.8/45.9% in the three scenarios. The drop in the R90 and R90E scenarios comes almost entirely from increased end-use efficiency, particularly in the commercial and residential sectors. About 60% of the further drop in the R90P scenario is made up by new wind generation.
• Primary energy use in the country decreases by 15/15/29% by 2027, with a corresponding improvement in energy intensity, with the bulk of the reductions coming from lignite to the power sector.
• The R90 scenario results in an overall discounted energy system cost savings of €1.49 billion over the 27-year modeling horizon and the R90E €1.39 billion. R90P has the same system cost as R0 by definition.
– Annualized investment in power plants decreases by 30% in the R90 and R90E scenarios due to the reduced load growth, but only 14% in the R90P case as increased investments in wind generation are made.
– Annualized investments for new demand devices increase significantly (€350-573 million, or 13- 22% annually by 2027) to achieve the policy goals. The bulk of the more efficient investments are focused on commercial cooling and lighting, industrial process heat and machine drive, and residential heating, water heating, and other electric.
– There is a corresponding decrease in fuel expenditures (€594/578/736 million, or 16-21% per year by 2027) in all three scenarios as the more efficient devices require less fuel relative to the Reference scenario. These savings offset the increased expenditures on new, more efficient devices.
So the analysis conducted here serves to illustrate the merits of promoting increased energy efficiency through policies and programs aimed at improving the overall performance of the energy system.
G.3.1 FINAL ENERGY CONSUMPTION PATTERNS Figures G-29 and G-30 depict the impacts of the policy scenarios on final energy consumption. The bulk of the reductions, in absolute terms, come from electricity, primarily for residential space cooling and water heating and commercial space heating. In the residential sector, electricity use for space heating increases, as

264 SOUTH EAST EUROPE REGIONAL ENERGY MARKET SUPPORT (SEE REMS) PROJECT
electric heat pumps replace less efficient devices using other fuels. There are smaller reductions to all fuels in the industrial sector, as all industries take up efficient devices for process heat and machine drive demands.
Figure G-29: Final Energy Consumption by Fuel
0
50
100
150
200
250
300
350
400
450
50020
0320
0620
0920
1220
1520
1820
2120
2420
2720
0320
0620
0920
1220
1520
1820
2120
2420
2720
0320
0620
0920
1220
1520
1820
2120
2420
2720
0320
0620
0920
1220
1520
1820
2120
2420
27
R0 R90 R90E R90P
Peta
joul
es
Coal Oil Natural Gas LPG Electricity Biomass Renewables Low-temp Heat
Figure G-30: Savings in Final Energy by Sector
0
10
20
30
40
50
60
70
2003
2006
2009
2012
2015
2018
2021
2024
2027
2003
2006
2009
2012
2015
2018
2021
2024
2027
2003
2006
2009
2012
2015
2018
2021
2024
2027
R90 R90E R90P
Peta
joul
es
Agriculture Commercial Industrial Residential Transportation & Other
G.3.2 POWER SECTOR INVESTMENTS AND ELECTRICITY GENERATION As has already been discussed, the Serbian power sector is dominated by lignite and hydro plants. In the Reference scenario, hydro capacity increases substantially by 2015, and lignite capacity grows rapidly
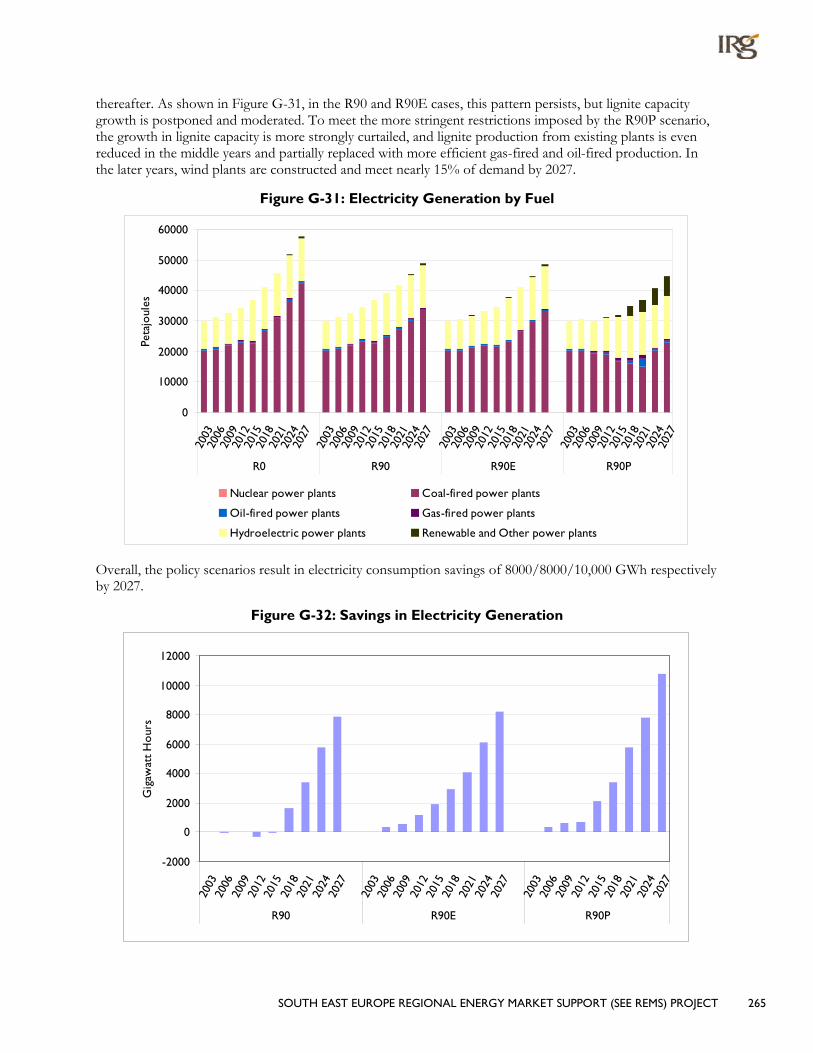
SOUTH EAST EUROPE REGIONAL ENERGY MARKET SUPPORT (SEE REMS) PROJECT 265
thereafter. As shown in Figure G-31, in the R90 and R90E cases, this pattern persists, but lignite capacity growth is postponed and moderated. To meet the more stringent restrictions imposed by the R90P scenario, the growth in lignite capacity is more strongly curtailed, and lignite production from existing plants is even reduced in the middle years and partially replaced with more efficient gas-fired and oil-fired production. In the later years, wind plants are constructed and meet nearly 15% of demand by 2027.
Figure G-31: Electricity Generation by Fuel
0
10000
20000
30000
40000
50000
60000
2003
2006
2009
2012
2015
2018
2021
2024
2027
2003
2006
2009
2012
2015
2018
2021
2024
2027
2003
2006
2009
2012
2015
2018
2021
2024
2027
2003
2006
2009
2012
2015
2018
2021
2024
2027
R0 R90 R90E R90P
Peta
joul
es
Nuclear power plants Coal-fired power plants
Oil-fired power plants Gas-fired power plants
Hydroelectric power plants Renewable and Other power plants
Overall, the policy scenarios result in electricity consumption savings of 8000/8000/10,000 GWh respectively by 2027.
Figure G-32: Savings in Electricity Generation
-2000
0
2000
4000
6000
8000
10000
12000
2003
2006
2009
2012
2015
2018
2021
2024
2027
2003
2006
2009
2012
2015
2018
2021
2024
2027
2003
2006
2009
2012
2015
2018
2021
2024
2027
R90 R90E R90P
Gig
awat
t H
our
s
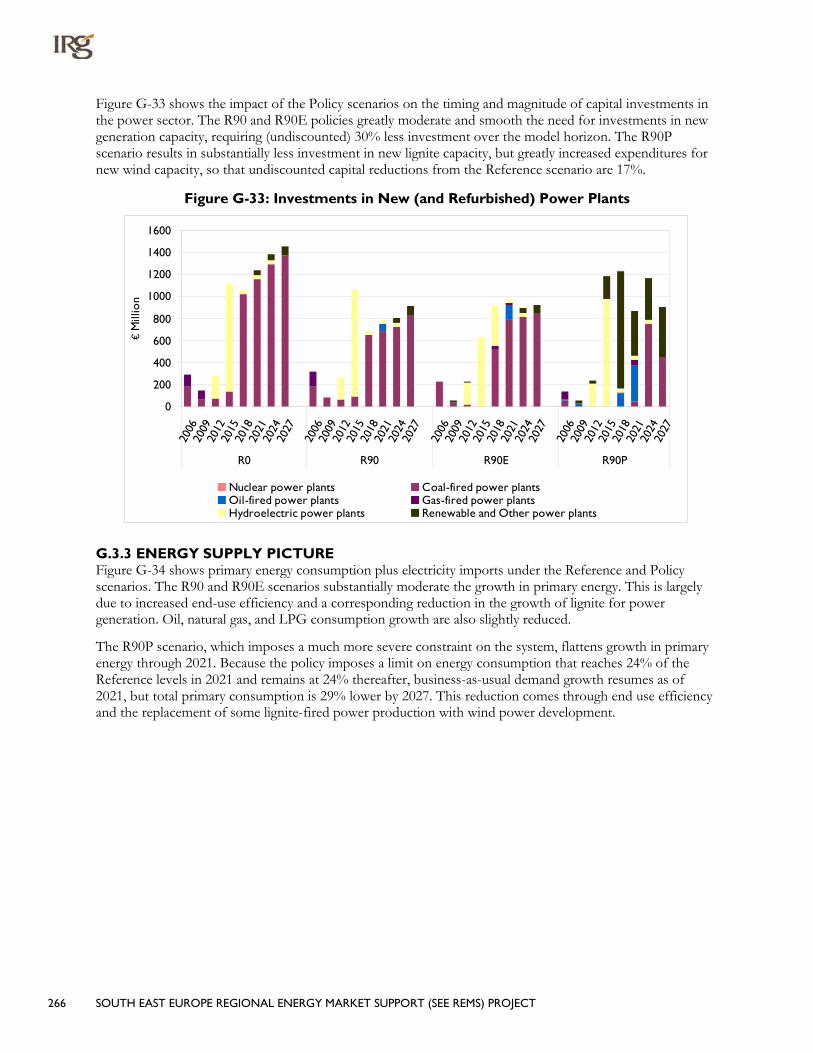
266 SOUTH EAST EUROPE REGIONAL ENERGY MARKET SUPPORT (SEE REMS) PROJECT
Figure G-33 shows the impact of the Policy scenarios on the timing and magnitude of capital investments in the power sector. The R90 and R90E policies greatly moderate and smooth the need for investments in new generation capacity, requiring (undiscounted) 30% less investment over the model horizon. The R90P scenario results in substantially less investment in new lignite capacity, but greatly increased expenditures for new wind capacity, so that undiscounted capital reductions from the Reference scenario are 17%.
Figure G-33: Investments in New (and Refurbished) Power Plants
0
200
400
600
800
1000
1200
1400
1600
2006
2009
2012
2015
2018
2021
2024
2027
2006
2009
2012
2015
2018
2021
2024
2027
2006
2009
2012
2015
2018
2021
2024
2027
2006
2009
2012
2015
2018
2021
2024
2027
R0 R90 R90E R90P
€ M
illio
n
Nuclear power plants Coal-fired power plantsOil-fired power plants Gas-fired power plantsHydroelectric power plants Renewable and Other power plants
G.3.3 ENERGY SUPPLY PICTURE Figure G-34 shows primary energy consumption plus electricity imports under the Reference and Policy scenarios. The R90 and R90E scenarios substantially moderate the growth in primary energy. This is largely due to increased end-use efficiency and a corresponding reduction in the growth of lignite for power generation. Oil, natural gas, and LPG consumption growth are also slightly reduced.
The R90P scenario, which imposes a much more severe constraint on the system, flattens growth in primary energy through 2021. Because the policy imposes a limit on energy consumption that reaches 24% of the Reference levels in 2021 and remains at 24% thereafter, business-as-usual demand growth resumes as of 2021, but total primary consumption is 29% lower by 2027. This reduction comes through end use efficiency and the replacement of some lignite-fired power production with wind power development.
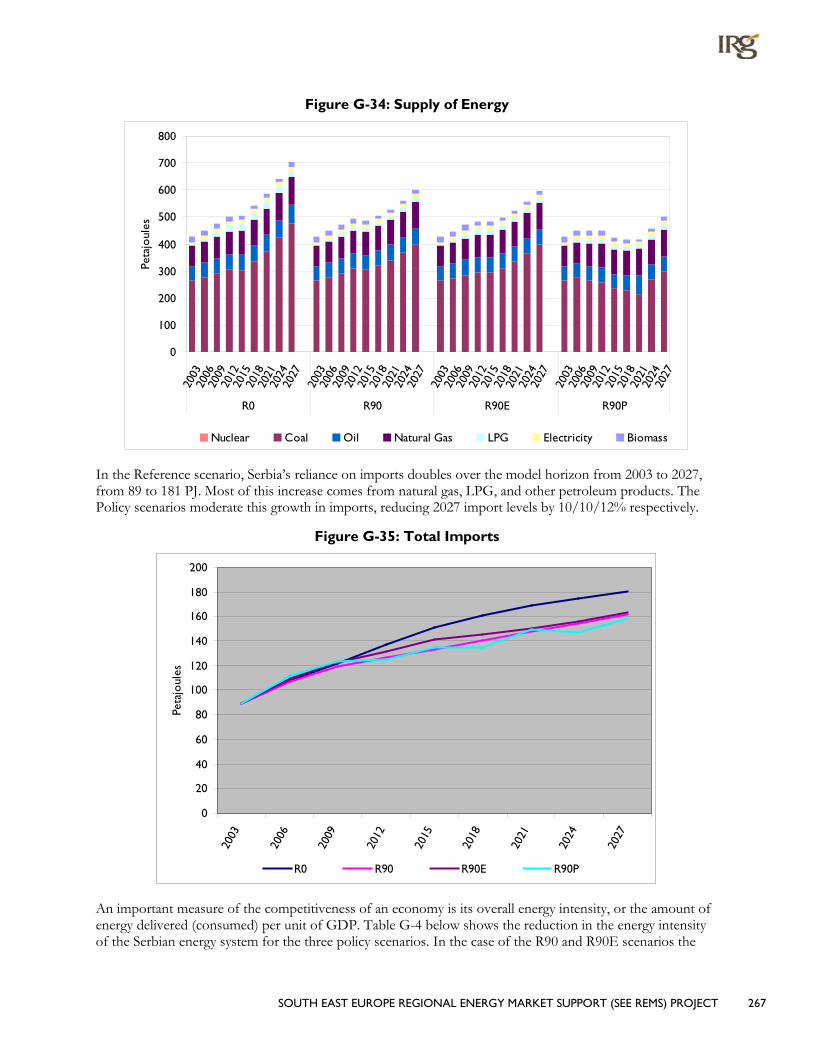
SOUTH EAST EUROPE REGIONAL ENERGY MARKET SUPPORT (SEE REMS) PROJECT 267
Figure G-34: Supply of Energy
0
100
200
300
400
500
600
700
800
2003
2006
2009
2012
2015
2018
2021
2024
2027
2003
2006
2009
2012
2015
2018
2021
2024
2027
2003
2006
2009
2012
2015
2018
2021
2024
2027
2003
2006
2009
2012
2015
2018
2021
2024
2027
R0 R90 R90E R90P
Peta
joul
es
Nuclear Coal Oil Natural Gas LPG Electricity Biomass
In the Reference scenario, Serbia’s reliance on imports doubles over the model horizon from 2003 to 2027, from 89 to 181 PJ. Most of this increase comes from natural gas, LPG, and other petroleum products. The Policy scenarios moderate this growth in imports, reducing 2027 import levels by 10/10/12% respectively.
Figure G-35: Total Imports
0
20
40
60
80
100
120
140
160
180
200
2003
2006
2009
2012
2015
2018
2021
2024
2027
Peta
joul
es
R0 R90 R90E R90P
An important measure of the competitiveness of an economy is its overall energy intensity, or the amount of energy delivered (consumed) per unit of GDP. Table G-4 below shows the reduction in the energy intensity of the Serbian energy system for the three policy scenarios. In the case of the R90 and R90E scenarios the

268 SOUTH EAST EUROPE REGIONAL ENERGY MARKET SUPPORT (SEE REMS) PROJECT
overall cost of the energy system also falls, where the R90P shows that a 29% improvement can be achieved without exceeding the overall cost of the energy system of the Reference scenario, by promoting energy efficiency and renewable energy.
Table G-4: Energy Intensity (PJ/GDP) 2027 percentage change from R0
R90 14.60%
R90E 14.87%
R90P 28.86%
G.3.4 COSTS Figure G-36 depicts the total discounted system cost of all four scenarios. The figure shows that the system costs reflect closely the degree of the intensity of energy efficiency and conservation programs introduced through the policy scenarios. For example, the R90 scenario, which allows increased access to more energy efficient technologies, is the least cost scenario over the planning horizon. The total discounted system cost drops by 2.7% from the Reference scenario. When the 10% energy conservation policy is introduced, scenario R90E, the total discounted system cost shows a slightly reduced improvement of 2.6% from the Reference scenario. The policy goal of reducing energy intensity, Scenario R90P, results in almost the same total discounted system cost as Reference scenario, but at much lower levels of energy intensity, energy imports, and investment in the power sector.
Figure G-36: Total Discounted Energy System
53000
53500
54000
54500
55000
55500
56000
R0 R90
R90E
R90P
2003
Mill
ion
Euro
Figure G-37 depicts the Annual Energy System Expenditures for the Policy scenarios. The total expenditures for the four scenarios are broadly similar, but show significant differences in distribution between components and in growth rate over time. The R90 and R90E scenarios, benefiting from increased end-use efficiency, show slower growth, lower total levels, and a shift to lower power sector investment and fuel expenditures that are partially offset by increased investment in the more efficient end-use devices. The R90P scenario shows equal or greater reductions in fuel expenditures, but in order to meet the constraint it must make larger and earlier investments in more efficient end-use devices and in renewable and more efficient gas and oil-fired power generation capacity.

SOUTH EAST EUROPE REGIONAL ENERGY MARKET SUPPORT (SEE REMS) PROJECT 269
Figure G-37: Annual Energy System Expenditures
0
1000
2000
3000
4000
5000
6000
7000
8000
2006
2009
2012
2015
2018
2021
2024
2027
2006
2009
2012
2015
2018
2021
2024
2027
2006
2009
2012
2015
2018
2021
2024
2027
2006
2009
2012
2015
2018
2021
2024
2027
R0 R90 R90E R90P
2003
€ M
illio
n
Annual Inv Power Sector Annual Inv Demand Expenditure on Fuel

270 SOUTH EAST EUROPE REGIONAL ENERGY MARKET SUPPORT (SEE REMS) PROJECT
H. UNMIK
This Section H provides an overview of the UNMIK energy system analysis. Section H.1 provides highlights of first the Reference scenario, followed by an overview of the Policy scenarios. Later sections provide more detailed discussion of both the Reference (H.2) and Policy scenarios (H.3).
H.1 HIGHLIGHTS
H.1.1 REFERENCE SCENARIO The evolution of the UNMIK energy system under the Reference scenario is briefly summarized and illustrated in the charts below.
• End-use fuel consumption shows that total electricity grows to 14% in 2027 (from 22% to 37%) owing to the addition of new coal power plants, and the share of oil drops by 1% ( from 25% to 24%), with biomass shrinking by 11% (from 17% in 2006 to 6% in 2027). Low temperature heat increases by 5%, while coal’s share decreases by 8% from 2006 to 2027.
Figure H-1: End-Use Fuel Consumption
2006
Renewables0%
Low-temp Heat1%
LPG1%
Natural Gas0%
Biomass17%
Electricity22%
Oil25%
Coal34%
2027
Renewables0%
Biomass6%
Low-temp Heat6%
LPG0%
Natural Gas0%
Electricity37%
Oil24%
Coal27%
• End-use consumption by sector shows that most energy growth occurs in the residential and commercial sectors. However, industrial consumption declines by 7%.
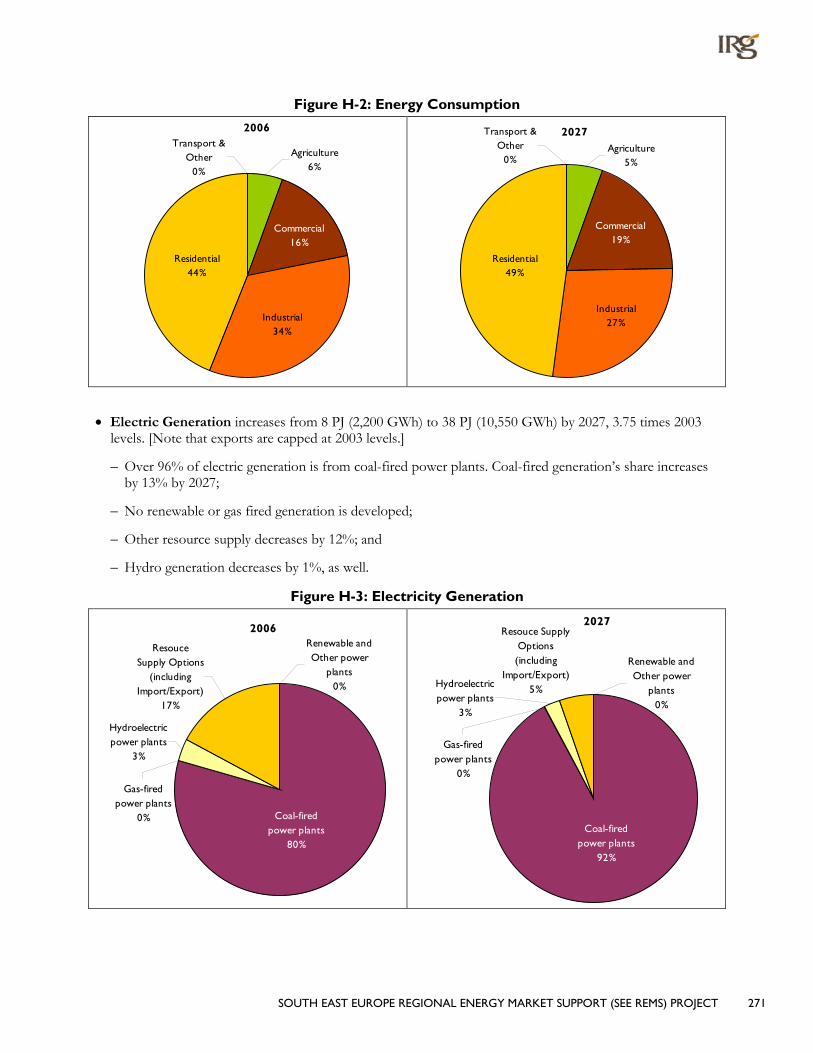
SOUTH EAST EUROPE REGIONAL ENERGY MARKET SUPPORT (SEE REMS) PROJECT 271
Figure H-2: Energy Consumption
2006
Agriculture6%
Residential44%
Commercial16%
Industrial34%
Transport & Other
0%
2027Agriculture
5%
Commercial19%
Industrial27%
Residential49%
Transport & Other
0%
• Electric Generation increases from 8 PJ (2,200 GWh) to 38 PJ (10,550 GWh) by 2027, 3.75 times 2003 levels. [Note that exports are capped at 2003 levels.]
– Over 96% of electric generation is from coal-fired power plants. Coal-fired generation’s share increases by 13% by 2027;
– No renewable or gas fired generation is developed;
– Other resource supply decreases by 12%; and
– Hydro generation decreases by 1%, as well.
Figure H-3: Electricity Generation
2006
Coal-fired power plants
80%
Gas-fired power plants
0%
Resouce Supply Options
(including Import/Export)
17%
Hydroelectric power plants
3%
Renewable and Other power
plants0%
2027
Coal-fired power plants
92%
Renewable and Other power
plants0%
Hydroelectric power plants
3%
Resouce Supply Options (including
Import/Export)5%
Gas-fired power plants
0%
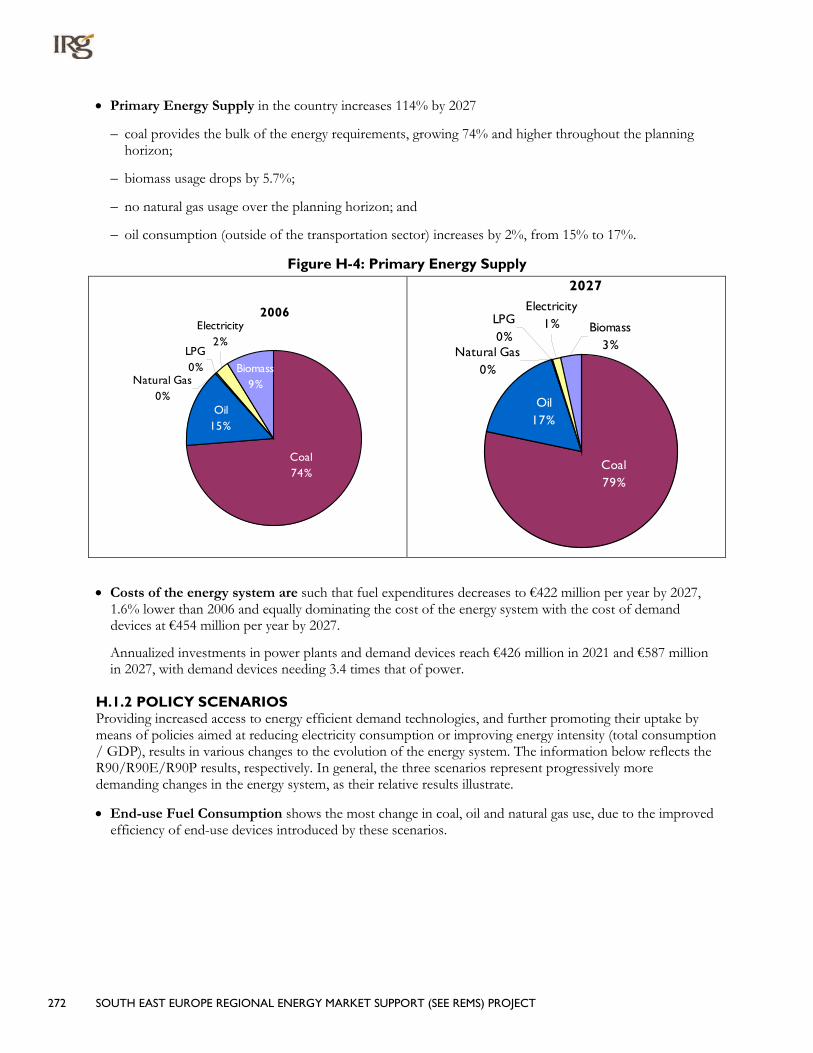
272 SOUTH EAST EUROPE REGIONAL ENERGY MARKET SUPPORT (SEE REMS) PROJECT
• Primary Energy Supply in the country increases 114% by 2027
– coal provides the bulk of the energy requirements, growing 74% and higher throughout the planning horizon;
– biomass usage drops by 5.7%;
– no natural gas usage over the planning horizon; and
– oil consumption (outside of the transportation sector) increases by 2%, from 15% to 17%.
Figure H-4: Primary Energy Supply
2006
Coal74%
Oil15%
LPG0%
Electricity2%
Biomass9%Natural Gas
0%
2027
Oil17%
Coal79%
Biomass3%
Electricity1%LPG
0%Natural Gas
0%
• Costs of the energy system are such that fuel expenditures decreases to €422 million per year by 2027, 1.6% lower than 2006 and equally dominating the cost of the energy system with the cost of demand devices at €454 million per year by 2027.
Annualized investments in power plants and demand devices reach €426 million in 2021 and €587 million in 2027, with demand devices needing 3.4 times that of power.
H.1.2 POLICY SCENARIOS Providing increased access to energy efficient demand technologies, and further promoting their uptake by means of policies aimed at reducing electricity consumption or improving energy intensity (total consumption / GDP), results in various changes to the evolution of the energy system. The information below reflects the R90/R90E/R90P results, respectively. In general, the three scenarios represent progressively more demanding changes in the energy system, as their relative results illustrate.
• End-use Fuel Consumption shows the most change in coal, oil and natural gas use, due to the improved efficiency of end-use devices introduced by these scenarios.
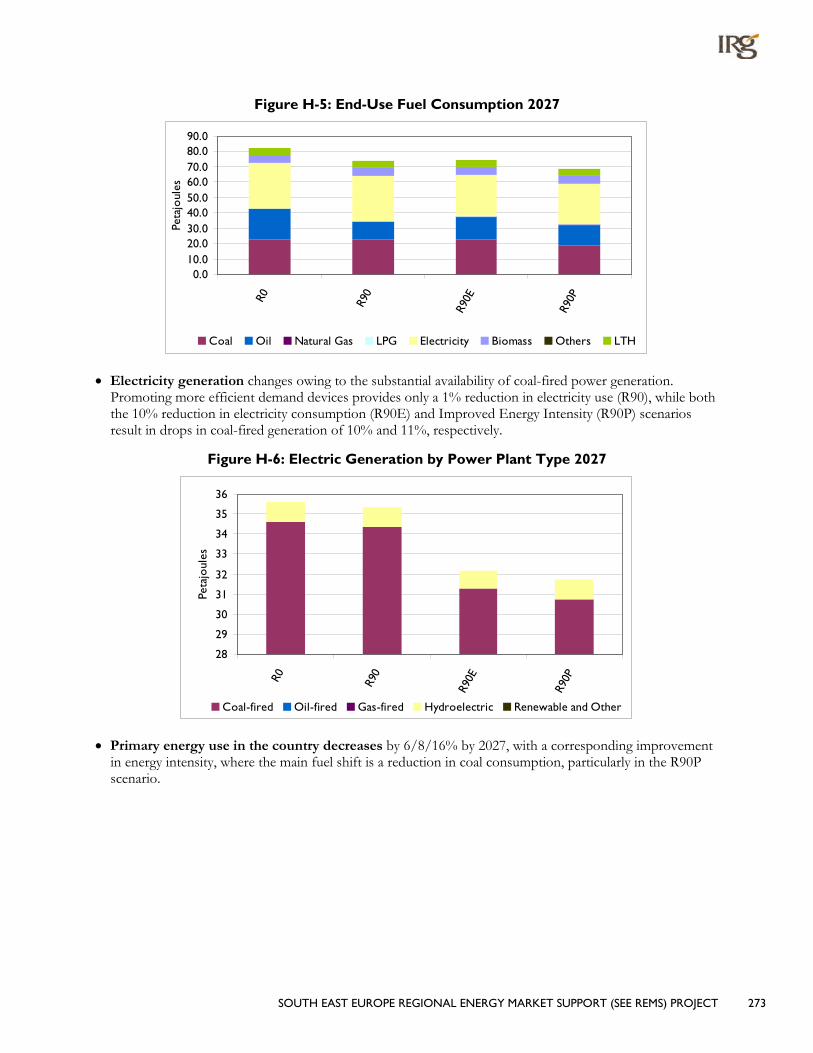
SOUTH EAST EUROPE REGIONAL ENERGY MARKET SUPPORT (SEE REMS) PROJECT 273
Figure H-5: End-Use Fuel Consumption 2027
0.010.020.030.040.050.060.070.080.090.0
R0 R90
R90E
R90P
Peta
joul
es
Coal Oil Natural Gas LPG Electricity Biomass Others LTH
• Electricity generation changes owing to the substantial availability of coal-fired power generation. Promoting more efficient demand devices provides only a 1% reduction in electricity use (R90), while both the 10% reduction in electricity consumption (R90E) and Improved Energy Intensity (R90P) scenarios result in drops in coal-fired generation of 10% and 11%, respectively.
Figure H-6: Electric Generation by Power Plant Type 2027
28
29
30
31
32
33
34
35
36
R0 R90
R90E
R90P
Peta
joul
es
Coal-fired Oil-fired Gas-fired Hydroelectric Renewable and Other
• Primary energy use in the country decreases by 6/8/16% by 2027, with a corresponding improvement in energy intensity, where the main fuel shift is a reduction in coal consumption, particularly in the R90P scenario.

274 SOUTH EAST EUROPE REGIONAL ENERGY MARKET SUPPORT (SEE REMS) PROJECT
Figure H-7: Primary Energy Use in 2027
0
20
40
60
80
100
120
140
160
R0 R90
R90E
R90P
Peta
joul
es
Nuclear Coal Oil Natural Gas LPG Electricity Imports Biomass
• Energy Imports drop by 30/21/28% in 2027 for the three respective scenarios, owing to a decrease in oil imports. This improves energy security.
• Costs of the Energy System. The R90 scenario results in an overall savings of €188 million over the 27-year modeling horizon and the R90E €155 million. R90P has the same system cost by definition but still provides €35 million in savings over the 27-year planning horizon. Relative to the Reference case, the three scenario runs show the following changes:
– Annualized investments in power plants decrease by 14% (€16 million annually by 2027) in the R90E scenario, but increase by 3.5% (€4 million annually by 2027) in the R90P scenario as the system moves towards more efficient power plants under the future mandates to improve overall energy intensity.
– Annualized investments in new demand devices increase significantly between 9-18% (€39-81million annually by 2027) to achieve the policy goals.
– Fuel expenditures decrease significantly (€96/62/89 million per year by 2027) in all three scenarios as the more efficient devices require less fuel relative to the Reference case. These savings offset the increased expenditures on new, more efficient devices
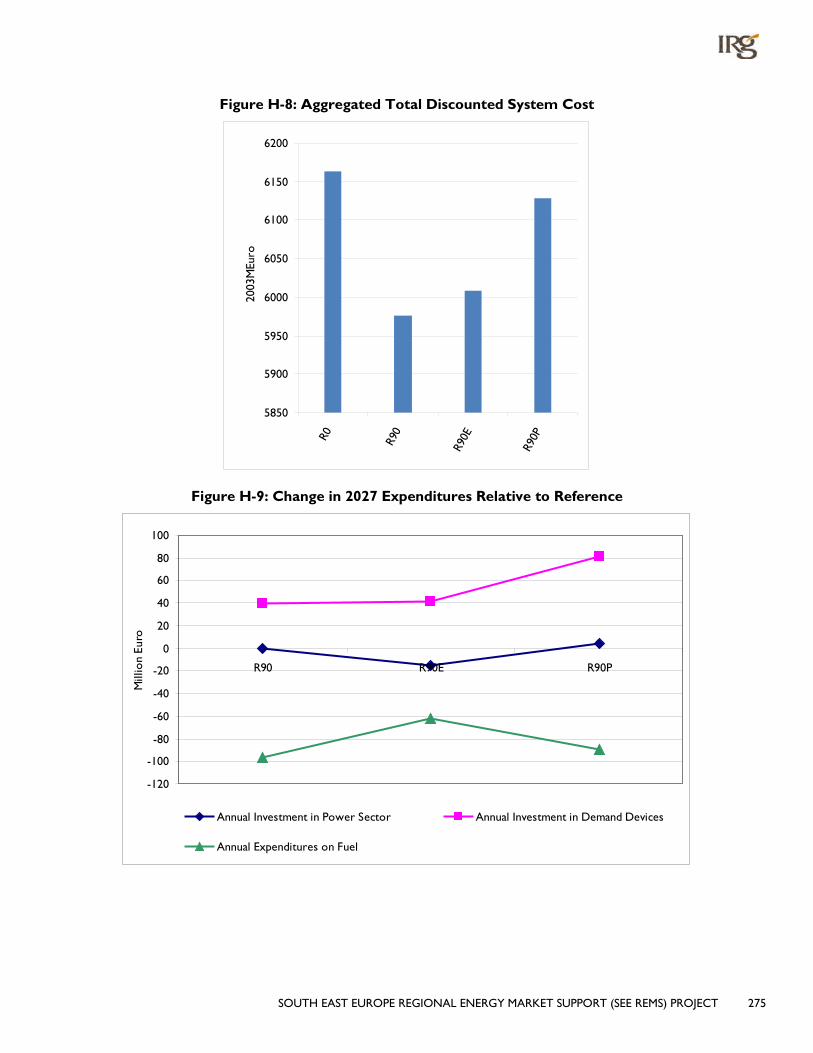
SOUTH EAST EUROPE REGIONAL ENERGY MARKET SUPPORT (SEE REMS) PROJECT 275
Figure H-8: Aggregated Total Discounted System Cost
5850
5900
5950
6000
6050
6100
6150
6200
R0 R90
R90E
R90P
2003
MEu
ro
Figure H-9: Change in 2027 Expenditures Relative to Reference
-120
-100
-80
-60
-40
-20
0
20
40
60
80
100
R90 R90E R90P
Mill
ion
Euro
Annual Investment in Power Sector Annual Investment in Demand Devices
Annual Expenditures on Fuel
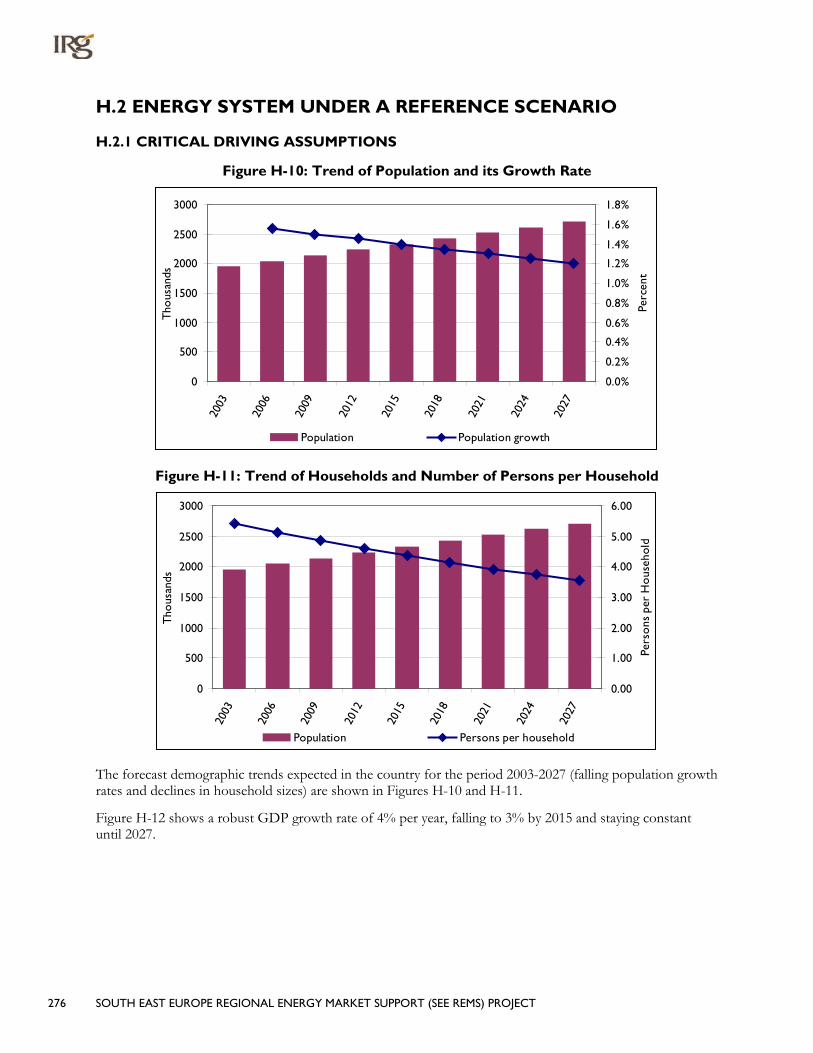
276 SOUTH EAST EUROPE REGIONAL ENERGY MARKET SUPPORT (SEE REMS) PROJECT
H.2 ENERGY SYSTEM UNDER A REFERENCE SCENARIO
H.2.1 CRITICAL DRIVING ASSUMPTIONS
Figure H-10: Trend of Population and its Growth Rate
0
500
1000
1500
2000
2500
300020
03
2006
2009
2012
2015
2018
2021
2024
2027
Tho
usan
ds
0.0%
0.2%
0.4%
0.6%
0.8%
1.0%
1.2%
1.4%
1.6%
1.8%
Perc
ent
Population Population growth
Figure H-11: Trend of Households and Number of Persons per Household
0
500
1000
1500
2000
2500
3000
2003
2006
2009
2012
2015
2018
2021
2024
2027
Tho
usan
ds
0.00
1.00
2.00
3.00
4.00
5.00
6.00
Pers
ons
per
Ho
useh
old
Population Persons per household
The forecast demographic trends expected in the country for the period 2003-2027 (falling population growth rates and declines in household sizes) are shown in Figures H-10 and H-11.
Figure H-12 shows a robust GDP growth rate of 4% per year, falling to 3% by 2015 and staying constant until 2027.

SOUTH EAST EUROPE REGIONAL ENERGY MARKET SUPPORT (SEE REMS) PROJECT 277
Figure H-12: Forecast of Total GDP and its Growth Rate
0
500
1,000
1,500
2,000
2,500
3,000
3,500
4,000
4,500
5,000
2003
2006
2009
2012
2015
2018
2021
2024
2027
2003
€ M
illio
n
0.0%
0.5%
1.0%
1.5%
2.0%
2.5%
3.0%
3.5%
4.0%
4.5%
Perc
ent
GDP GDP growth
H.2.2 ENERGY SERVICE DEMAND PROJECTIONS As discussed in Section 2.1 the demand for energy services over time serves as the primary driver for the requirements of the future energy system. These are derived by establishing the relationship between the fundamental drivers (discussed in the previous section), and their relationship via elasticities to the individual demands. The aggregate view of the demand composition is shown in Figure H-13 and each sector is discussed briefly in the sections that follow.
Figure H-13: Forecast of Energy Service Demand from each Sector
0
10
20
30
40
50
60
70
80
2003
2006
2009
2012
2015
2018
2021
2024
2027
Peta
joul
es
Agriculture Commercial Industrial Residential Transportation
H.2.2.1 RESIDENTIAL SECTOR The main driving factors for calculation of energy demand in the residential sector are growth in the number of households [see Figure H-11] and the evolution of residential living away from apartments and rural towards more urban central single family dwellings, as shown in Figure H-14.

278 SOUTH EAST EUROPE REGIONAL ENERGY MARKET SUPPORT (SEE REMS) PROJECT
The residential sector is first in importance in energy use in UNMIK. Figure H-15 shows how consumption in the residential sector is expected to rapidly increase for space heating. If the Reference scenario is followed, i.e. no measures to increase efficiency, energy demand in the residential sector will be 2.45 times higher in the year 2027 compared to year 2003. This is consistent with expected GDP growth and increased living standards.
Figure H-14: Composition of Residential Dwellings over Time
0%
10%
20%30%
40%
50%
60%
70%80%
90%
100%20
03
2006
2009
2012
2015
2018
2021
2024
2027
Apartments - Urban Single House - Urban - CentralSingle House - Urban - Local Single House - Rural - Local
Figure H-15: Residential Demand for Energy Services (Useful Energy)
0
5
10
15
20
25
30
35
40
2003
2006
2009
2012
2015
2018
2021
2024
2027
Peta
joul
es
Heating Hot Water Cooling Cooking LightingOther Electricity Dish Washing Fridges & Freezers Clothes Washing Clothes Drying
H.2.2.2 COMMERCIAL SECTOR The commercial building stock is forecast to almost triple across the Reference scenario time horizon (see Figure H-16), driven by evolution toward a service economy and higher standards of living.
If the Reference scenario is followed, energy demand in the service sector will be 2.7 times higher in the year 2027 than in 2003.

SOUTH EAST EUROPE REGIONAL ENERGY MARKET SUPPORT (SEE REMS) PROJECT 279
Figure H-16: Commercial Demand for Energy Services (Useful Energy)
0.00
2.00
4.00
6.00
8.00
10.00
12.00
14.00
16.00
2003
2006
2009
2012
2015
2018
2021
2024
2027
Peta
joul
es
Heating Existing Hot Water Existing Cooling Existing CookingLighting Other Electricity Public Lighting Fridges and Freezers
H.2.2.3 INDUSTRIAL SECTOR The driving factor in forecast energy demand in the industrial sector is the estimated contribution to GDP, which is mapped to increase in service demands in the various sectors by means of elasticities which relate future GDP growth to each sector’s demand growth. This growth is moderated by an autonomous energy efficiency improvement (AEEI) factor as noted in Table H-1.
Table H-1: Demand Elasticities Demand Type Elasticity AEI Overall growth
High-temperature heat 1.1-1.3 0.015 34-51%
Low-temperature heat 1.1-1.4 0.010 62-81%
Mechanical drive 1.1-1.2 0.005 385-414%
The resulting demand growth is shown in Figure H-17. Food, Non-metallic, and Other are the fastest growing industrial demands. Overall industrial demand more than doubles over the forecast horizon.

280 SOUTH EAST EUROPE REGIONAL ENERGY MARKET SUPPORT (SEE REMS) PROJECT
Figure H-17: Industrial Demand for Energy Services (Useful Energy)
0.00
2.00
4.00
6.00
8.00
10.00
12.00
14.00
16.00
18.00
2003
2006
2009
2012
2015
2018
2021
2024
2027
Peta
joul
es
Chemical Food Iron-Steel Non-metallic Other Paper Non-ferrous
H.2.2.4 AGRICULTURE As in industry, agricultural energy demands are projected by means of an elasticity relating demand growth to GDP growth. For UNMIK, an elasticity of 0.60 was used, resulting in a 52% growth of energy service demand over the forecast period. It remains a small portion of total energy service demand, as shown in Figure H-17, above.
H.2.2.5 TRANSPORT AND NON-ENERGY USE The last sector considered under the RES is transport and non-energy use. Since this sector currently includes only electricity (used in electric railways) and natural gas used in non-energy sectors (consumed for fertilizer), this is not considered, since demand is zero for transport in the UNMIK case.
H.2.3 ENERGY SUPPLY AND PRICES In Figure 2.2, the Regional section shows the trend of energy prices based on the EU NEEDS Project. These trends are applied to recent energy prices in UNMIK to produce forecasts of future prices across the time horizon of this study. As noted earlier, it is assumed that the countries of the region will be confronted by the prevailing EU prices soon, so any country differentials at the border are removed beginning in 2015.

SOUTH EAST EUROPE REGIONAL ENERGY MARKET SUPPORT (SEE REMS) PROJECT 281
Besides the border price influencing consumer prices, a distinction is made with respect to internal distribution costs to the different sectors. The “mark-ups” are based upon the situation in 2003, shown in Table H-2 below, and held constant over the planning horizon.
Table H-2: Sector Fuel Price “Mark-Ups” (M2003€/PJ)
Fuel
Sectors
Residential Commercial Agriculture Industry
Hard Coal - - - 0.079
Brown Coal Briquettes - - - -
Lignite 0.131 0.088 0.131 0.044
Light fuel 0.100 0.100 0.100 0.100
Heavy fuel 0.100 0.100 0.100 0.100
LPG 0.100 0.100 0.100 0.100
Gas 0.100 0.100 0.100 0.100
Electricity 3.022 4.028 3.022 0.250
Low-temperature heat 0.392 0.196 0.392 0.000
Figure H-18: Energy Prices Based on the EU NEEDS Project
0
2
4
6
8
10
12
14
16
2003 2006 2009 2012 2015 2018 2021 2024 2027
2003
Eur
o pe
r GJ
Gasoline
Kerosene
Distillate
LPG
Natural Gas
Heavy Fuel Oil
Brown Coal
Lignite Coal
Uranium
Hard Coal
Biomass
Domestic supply of resources does not change, with the exception of the potential for lignite, which almost triples over the modeling horizon, as reported in Table H-3. Most imports that occur currently are assumed to be unlimited in the future, with the exception of electricity which is capped at its 2003 level and natural gas where the basic supply and internal distribution system are capped at current levels subject to additional investment, if needed.
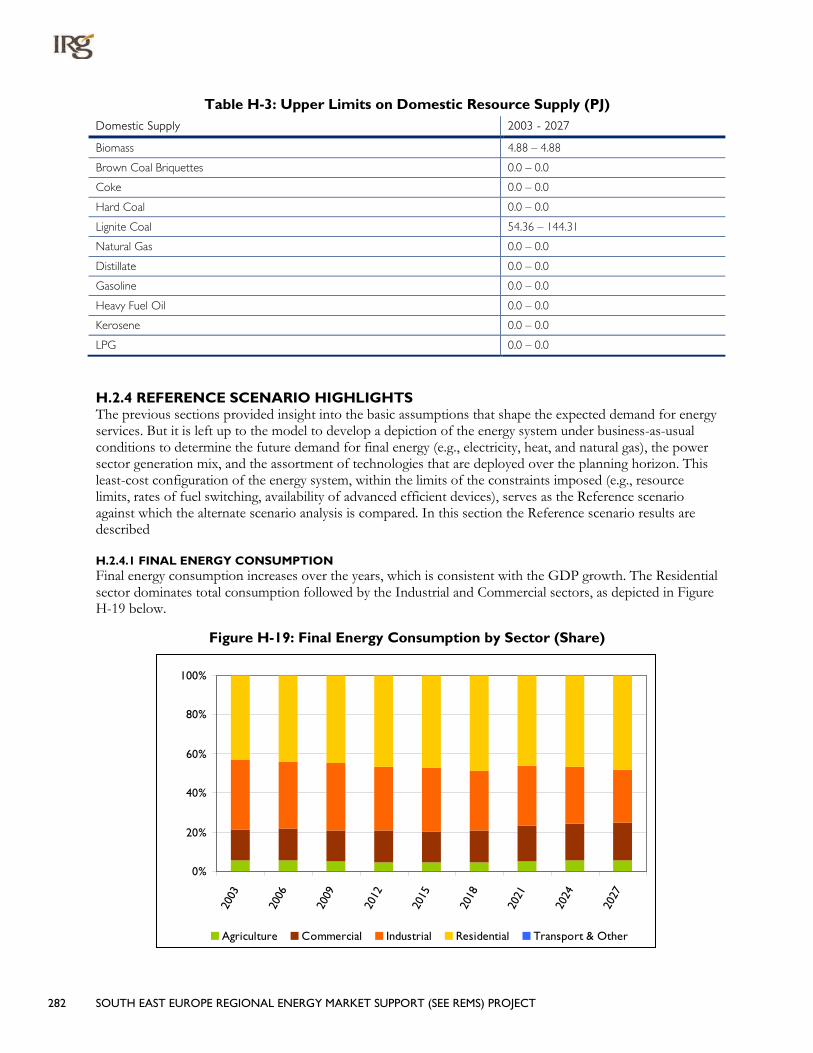
282 SOUTH EAST EUROPE REGIONAL ENERGY MARKET SUPPORT (SEE REMS) PROJECT
Table H-3: Upper Limits on Domestic Resource Supply (PJ) Domestic Supply 2003 - 2027
Biomass 4.88 – 4.88
Brown Coal Briquettes 0.0 – 0.0
Coke 0.0 – 0.0
Hard Coal 0.0 – 0.0
Lignite Coal 54.36 – 144.31
Natural Gas 0.0 – 0.0
Distillate 0.0 – 0.0
Gasoline 0.0 – 0.0
Heavy Fuel Oil 0.0 – 0.0
Kerosene 0.0 – 0.0
LPG 0.0 – 0.0
H.2.4 REFERENCE SCENARIO HIGHLIGHTS The previous sections provided insight into the basic assumptions that shape the expected demand for energy services. But it is left up to the model to develop a depiction of the energy system under business-as-usual conditions to determine the future demand for final energy (e.g., electricity, heat, and natural gas), the power sector generation mix, and the assortment of technologies that are deployed over the planning horizon. This least-cost configuration of the energy system, within the limits of the constraints imposed (e.g., resource limits, rates of fuel switching, availability of advanced efficient devices), serves as the Reference scenario against which the alternate scenario analysis is compared. In this section the Reference scenario results are described
H.2.4.1 FINAL ENERGY CONSUMPTION Final energy consumption increases over the years, which is consistent with the GDP growth. The Residential sector dominates total consumption followed by the Industrial and Commercial sectors, as depicted in Figure H-19 below.
Figure H-19: Final Energy Consumption by Sector (Share)
0%
20%
40%
60%
80%
100%
2003
2006
2009
2012
2015
2018
2021
2024
2027
Agriculture Commercial Industrial Residential Transport & Other

SOUTH EAST EUROPE REGIONAL ENERGY MARKET SUPPORT (SEE REMS) PROJECT 283
In terms of final energy choices, electricity’s share grows to 37% in 2027 (from 22% initially) owing to the addition of new lignite power plants, and the share of low-temperature heat moves to 6% (from 1%), with the shares of oil and LPG shrinking modestly. Biomass’s share drops to 6% in 2027 (from 17% in 2006).
Figure H-20: Final Energy Consumption by Fuel
0
10
20
30
40
50
60
70
80
90
2003
2006
2009
2012
2015
2018
2021
2024
2027
Peta
joul
es
Coal Oil Natural Gas LPG Electricity Biomass Renewables (other) Low-temperature Heat
More detail is provided on the composition of final energy delivered to each sector in the sections that follow.
H.2.4.1.1 Residential Sector As already noted, the demand for energy in the residential sector is expected to rise owing to the increase in population. In terms of fuel choice, there is an increasing demand owing to increased penetration of electric appliances, and rapid acceptance of air conditioning. Residential oil growth is second to that of electricity, while biomass remains steady. Figure H-21 depicts final energy consumption in the residential sector.
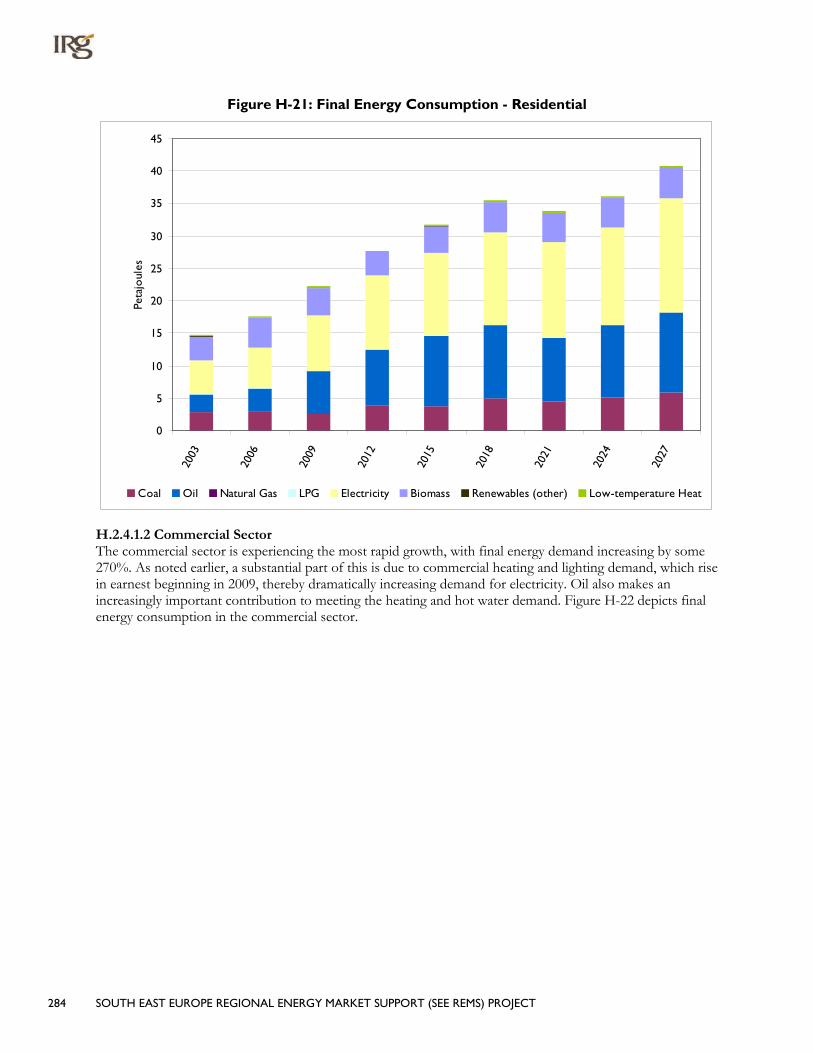
284 SOUTH EAST EUROPE REGIONAL ENERGY MARKET SUPPORT (SEE REMS) PROJECT
Figure H-21: Final Energy Consumption - Residential
0
5
10
15
20
25
30
35
40
45
2003
2006
2009
2012
2015
2018
2021
2024
2027
Peta
joul
es
Coal Oil Natural Gas LPG Electricity Biomass Renewables (other) Low-temperature Heat
H.2.4.1.2 Commercial Sector The commercial sector is experiencing the most rapid growth, with final energy demand increasing by some 270%. As noted earlier, a substantial part of this is due to commercial heating and lighting demand, which rise in earnest beginning in 2009, thereby dramatically increasing demand for electricity. Oil also makes an increasingly important contribution to meeting the heating and hot water demand. Figure H-22 depicts final energy consumption in the commercial sector.
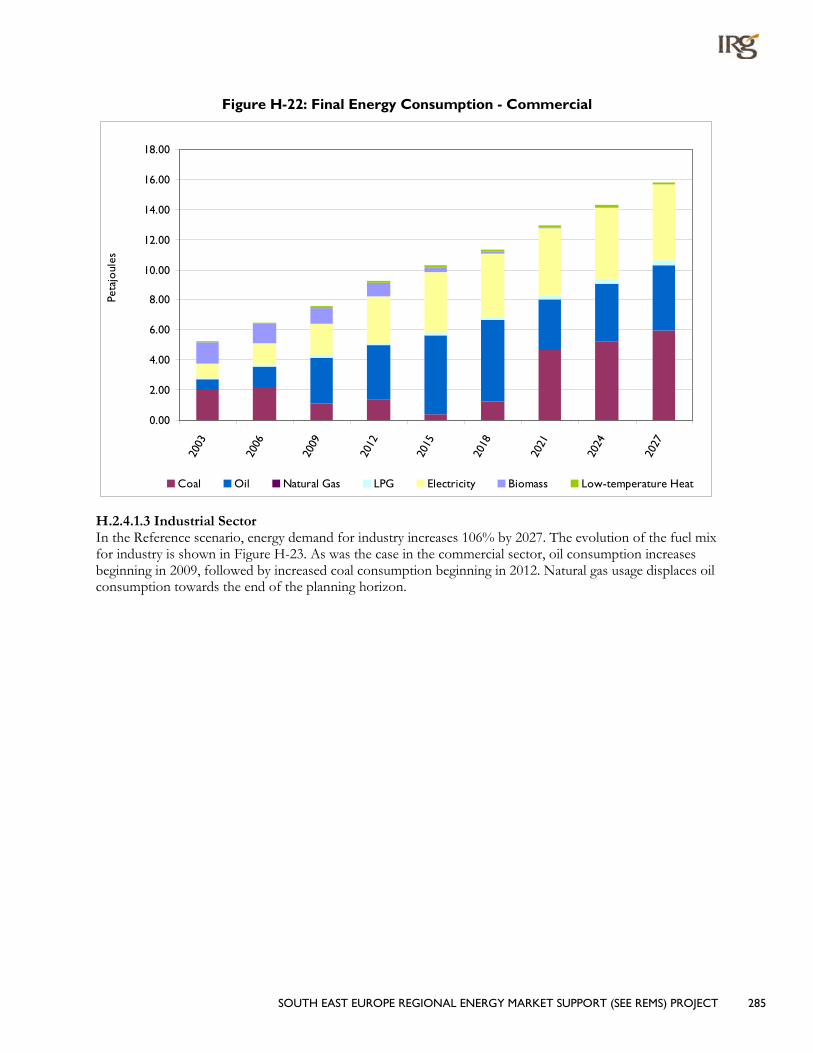
SOUTH EAST EUROPE REGIONAL ENERGY MARKET SUPPORT (SEE REMS) PROJECT 285
Figure H-22: Final Energy Consumption - Commercial
0.00
2.00
4.00
6.00
8.00
10.00
12.00
14.00
16.00
18.00
2003
2006
2009
2012
2015
2018
2021
2024
2027
Peta
joul
es
Coal Oil Natural Gas LPG Electricity Biomass Low-temperature Heat
H.2.4.1.3 Industrial Sector In the Reference scenario, energy demand for industry increases 106% by 2027. The evolution of the fuel mix for industry is shown in Figure H-23. As was the case in the commercial sector, oil consumption increases beginning in 2009, followed by increased coal consumption beginning in 2012. Natural gas usage displaces oil consumption towards the end of the planning horizon.

286 SOUTH EAST EUROPE REGIONAL ENERGY MARKET SUPPORT (SEE REMS) PROJECT
Figure H-23: Final Energy Consumption - Industry
0.00
10.00
20.00
30.00
40.00
50.00
60.00
70.00
80.00
90.00
100.00
2003
2006
2009
2012
2015
2018
2021
2024
2027
Peta
joul
es
Coal Oil Natural Gas LPG Electricity Biomass Low-temperature Heat
H.2.4.1.4 Agriculture Sector Figure H-24 shows the evolution of the principal fuels used in the agricultural sector for the Reference scenario. Diesel oil consumption is foreseen to increase considerably in the future to support agricultural production growth and reduce manual labor by UNMIK farmers. There is also growth for coal use for heating.
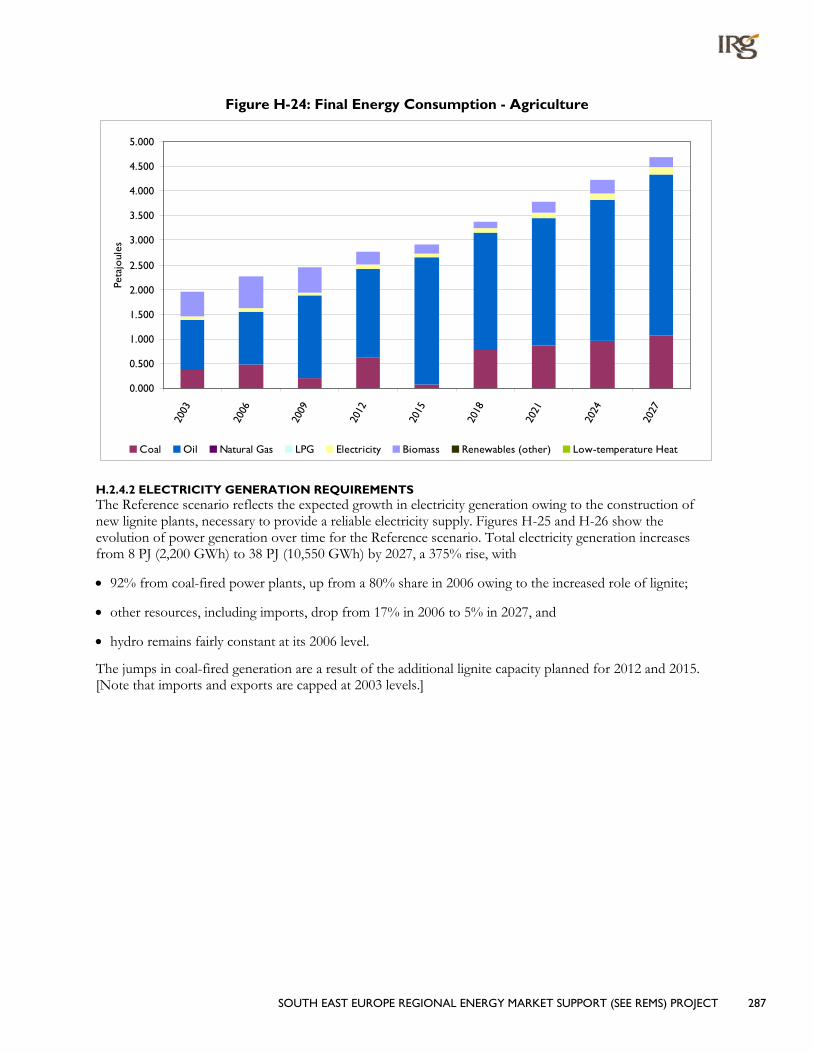
SOUTH EAST EUROPE REGIONAL ENERGY MARKET SUPPORT (SEE REMS) PROJECT 287
Figure H-24: Final Energy Consumption - Agriculture
0.000
0.500
1.000
1.500
2.000
2.500
3.000
3.500
4.000
4.500
5.000
2003
2006
2009
2012
2015
2018
2021
2024
2027
Peta
joul
es
Coal Oil Natural Gas LPG Electricity Biomass Renewables (other) Low-temperature Heat
H.2.4.2 ELECTRICITY GENERATION REQUIREMENTS The Reference scenario reflects the expected growth in electricity generation owing to the construction of new lignite plants, necessary to provide a reliable electricity supply. Figures H-25 and H-26 show the evolution of power generation over time for the Reference scenario. Total electricity generation increases from 8 PJ (2,200 GWh) to 38 PJ (10,550 GWh) by 2027, a 375% rise, with
• 92% from coal-fired power plants, up from a 80% share in 2006 owing to the increased role of lignite;
• other resources, including imports, drop from 17% in 2006 to 5% in 2027, and
• hydro remains fairly constant at its 2006 level.
The jumps in coal-fired generation are a result of the additional lignite capacity planned for 2012 and 2015. [Note that imports and exports are capped at 2003 levels.]

288 SOUTH EAST EUROPE REGIONAL ENERGY MARKET SUPPORT (SEE REMS) PROJECT
Figure H-25: Electricity Generation by Fuel
0.00
5.0010.00
15.00
20.0025.00
30.00
35.0040.00
45.00
2003
2006
2009
2012
2015
2018
2021
2024
2027
Peta
joul
es
Coal-fired power plants Gas-fired power plantsHydroelectric power plants Imports
Renewable and Other power plants
Figure H-26: Share of the Electricity Generation by Fuel
0%10%20%30%40%50%60%70%80%90%
100%
2003
2006
2009
2012
2015
2018
2021
2024
2027
Coal-fired power plants Gas-fired power plants
Hydroelectric power plants Imports
Renewable and Other power plants
H.2.4.3 ENERGY SUPPLY The supply of energy, from domestic sources and imports, for the Reference scenario is shown in Figures H-27 and H-28. Primary energy use in the country increases by 95% by 2027, with
• Coal-fired generation providing the bulk of the additional energy requirements, increasing to 78%;
• biomass utilization drops from 9% in 2006 to 3% in 2027;
• no natural gas or LPG usage; and
• oil consumption (outside of the transportation sector) increases by 2%, from 15% to 17%.

SOUTH EAST EUROPE REGIONAL ENERGY MARKET SUPPORT (SEE REMS) PROJECT 289
Figure H-27: Energy Supply by Type
0.00
20.00
40.00
60.00
80.00
100.00
120.00
140.00
160.00
2003
2006
2009
2012
2015
2018
2021
2024
2027
Peta
joul
es
Coal Oil Natural Gas LPG Electricity Biomass
Figure H-28: Energy Supply by Type (Shares)
0%
10%
20%
30%
40%
50%
60%
70%
80%
90%
100%
2003
2006
2009
2012
2015
2018
2021
2024
2027
Coal Oil Natural Gas LPG Electricity Biomass
H.2.4.4 COSTS Over the course of the planning horizon there is a constant trade-off between investments in the power sector and demand devices and expenditure on fuel. This trade-off usually takes the form of spending more to purchase more efficient demand technologies versus making large investments in the power sector and spending more on fuels. In the Reference scenario,
• Fuel expenditures decrease to €422 per year by 2027, 1.6% lower than 2003 and dominating the cost of the energy system. In 2006, there is an anomaly in fuel expenditures, a sharp increase in the marginal cost of lignite due to limitation in supply.
290 SOUTH EAST EUROPE REGIONAL ENERGY MARKET SUPPORT (SEE REMS) PROJECT
• Annualized investments in power plants and demand devices reach €426 million in 2021 and €587 million in 2027, with investment in demand devices 3.4 times that of power plants.
H.3 SCENARIO ANALYSIS HIGHLIGHTS Providing increased access to energy efficient demand technologies, and further promoting their uptake by means of policies aimed at reducing electricity consumption or improving energy intensity (total consumption / GDP) results in various changes to the evolution of the energy system. The information below thus reflects results of the R90/R90E/R90P scenarios, respectively. In general, the three scenarios represent progressively more demanding changes in the energy system, as their relative results illustrate.
• Primary energy use in the country decreases by 6/8/16% by 2027, with a corresponding improvement in energy intensity, where the main fuel shift is a reduction in coal consumption, particularly in the R90P scenario.
• Imports drop by 30/21/28% by 2027, improving energy security.
• Owing to the substantial availability of coal-fired generation, electricity consumption using the improved demand devices results in only a 1% reduction in electricity demand in R90. This does move to a 10% reduction when improvement in overall energy intensity is imposed on the system.
– New lignite power plants become available in 2009 and 2012.
– Both the 10% reduction in electricity consumption (R90E) and Improved Energy Intensity (R90P) scenarios result in a reduction in coal-fired generation by 10% and 11%, respectively.
• The R90 scenario results in an overall savings of €188 million over the 27-year modeling horizon; R90E savings total €155 million.
– Fuel expenditures decrease by €96/62/89 million per year by 2027 for R90/R90E/R90P, respectively, or 24/16/23% below the Reference scenario.
– Annualized investments in power plants stay the same for R90, drop slightly in the R90E scenario, and increase by 3.5% (€4 million annually in 2027) as the system moves to more efficient energy system under the pressure to improve overall energy intensity.
– At the same time, annual investments for new demand devices need to rise by 8/9/18% (€38-81 million annually in 2027).
So the analysis conducted here serves to illustrate the merits of promoting increased energy efficiency through policies and programs aimed at improving the overall performance of the energy system.
H.3.1 FINAL ENERGY CONSUMPTION PATTERNS Final energy consumption decreases, largely due to the availability of energy efficient technologies to replace the inefficient technologies. The reduction in coal consumption is the most dominant beneficiary of utilizing more energy efficient technologies, as shown in Figure H-29. Final energy consumption for electricity also drops between the Reference scenario and other scenarios, most significantly in the R90P scenario.

SOUTH EAST EUROPE REGIONAL ENERGY MARKET SUPPORT (SEE REMS) PROJECT 291
Figure H-29: Final Energy Consumption by Fuel
01020
30405060
708090
2003
2006
2009
2012
2015
2018
2021
2024
2027
2003
2006
2009
2012
2015
2018
2021
2024
2027
2003
2006
2009
2012
2015
2018
2021
2024
2027
2003
2006
2009
2012
2015
2018
2021
2024
2027
R0 R90 R90E R90P
Peta
joul
es
Coal Oil Natural Gas LPG
Electricity Biomass Renewables (other) Low-temperature Heat
Figure H-30 depicts the Final Energy Consumption by Sector. As noted above, the Residential sector is the major player in utilizing more energy efficient demand devices, thus reducing energy consumption in the out years. The Industrial sector, followed by the Commercial sector, follow in significance in reducing energy consumption by investing in more energy efficient demand devices. This shift in reduced energy consumption can only happen if strong national energy conservation programs are in place that provide enough incentives for the participants to invest in more efficient demand devices and change consumption behaviors.
Figure H-30: Final Energy Consumption by Sector
0
10
20
30
40
50
60
70
80
90
2003
2006
2009
2012
2015
2018
2021
2024
2027
2003
2006
2009
2012
2015
2018
2021
2024
2027
2003
2006
2009
2012
2015
2018
2021
2024
2027
2003
2006
2009
2012
2015
2018
2021
2024
2027
R0 R90 R90E R90P
Peta
joul
es
Agriculture Commercial Industrial Residential Transportation & Other
Figure H-31 depicts the savings in Final Energy Consumption by Sector. The Industrial sector benefits most from savings in final energy consumption, followed by the Residential sector. Again, this shift in energy savings can only happen with more investment in efficient demand devices and strong national energy conservation programs in place.

292 SOUTH EAST EUROPE REGIONAL ENERGY MARKET SUPPORT (SEE REMS) PROJECT
Figure H-31: Savings in Final Energy by Sector
-2
0
2
4
6
8
10
12
14
16
2003
2006
2009
2012
2015
2018
2021
2024
2027
2003
2006
2009
2012
2015
2018
2021
2024
2027
2003
2006
2009
2012
2015
2018
2021
2024
2027
R90 R90E R90P
Peta
joul
es
Agriculture Commercial Industrial Residential Transportation & Other
H.3.2 POWER SECTOR INVESTMENTS AND ELECTRICITY GENERATION As has already been discussed, the UNMIK power sector is dominated by generation of electricity from coal plants. As can be seen in Figure H-32, this situation is most obvious in the 2009-2012 period, when new coal plants become operational. Owing to this base of coal-fired electricity generation the UNMIK energy system is characterized by inertia, or a lack of incentive to take measures that impact electricity consumption. Thus, the introduction of energy efficient technologies only reduces electricity consumption by 1.5%, requiring the introduction of policy measures to achieve more substantial reductions. As shown in Figure H-33 these measures can greatly improve the savings while keeping the cost of the energy system below the Reference level. But it must be noted that export markets, which might provide additional incentive to improve efficiency as a means to increase the amount of electricity available for export, are not factored into the model decision-making.
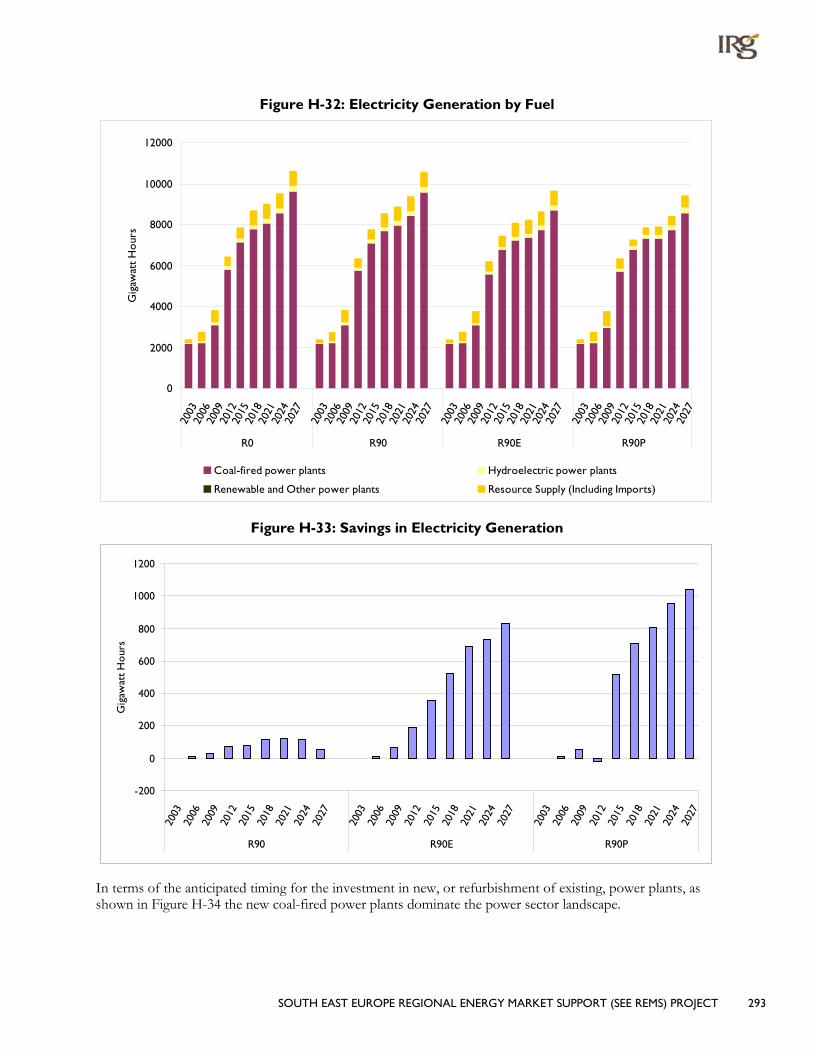
SOUTH EAST EUROPE REGIONAL ENERGY MARKET SUPPORT (SEE REMS) PROJECT 293
Figure H-32: Electricity Generation by Fuel
0
2000
4000
6000
8000
10000
12000
2003
2006
2009
2012
2015
2018
2021
2024
2027
2003
2006
2009
2012
2015
2018
2021
2024
2027
2003
2006
2009
2012
2015
2018
2021
2024
2027
2003
2006
2009
2012
2015
2018
2021
2024
2027
R0 R90 R90E R90P
Gig
awat
t H
our
s
Coal-fired power plants Hydroelectric power plants
Renewable and Other power plants Resource Supply (Including Imports)
Figure H-33: Savings in Electricity Generation
-200
0
200
400
600
800
1000
1200
2003
2006
2009
2012
2015
2018
2021
2024
2027
2003
2006
2009
2012
2015
2018
2021
2024
2027
2003
2006
2009
2012
2015
2018
2021
2024
2027
R90 R90E R90P
Gig
awat
t H
our
s
In terms of the anticipated timing for the investment in new, or refurbishment of existing, power plants, as shown in Figure H-34 the new coal-fired power plants dominate the power sector landscape.

294 SOUTH EAST EUROPE REGIONAL ENERGY MARKET SUPPORT (SEE REMS) PROJECT
Figure H-34: Investments in New (and Refurbished) Power Plants
0
100
200
300
400
500
600
700
2006
2009
2012
2015
2018
2021
2024
2027
2006
2009
2012
2015
2018
2021
2024
2027
2006
2009
2012
2015
2018
2021
2024
2027
2006
2009
2012
2015
2018
2021
2024
2027
R0 R90 R90E R90P
2003
€ M
illio
n
Coal-fired power plants Oil-fired power plants
Gas-fired power plants Hydroelectric power plants
H.3.3 ENERGY SUPPLY PICTURE The place to start understanding of the impacts of the various alternative scenarios is to examine the change in the supply of energy to the country. As can be seen in Figure H-35 there is a direct correlation between the additional coal-fired power plant capacity and the need for coal. Across all scenarios there is also a tendency to increase oil consumption (outside the transportation sector) as the country’s population and economy grows. One can also observe an overall drop in total energy consumed, the savings increasing as sterner policies are put in place at an incrementally higher cost for the energy system, as discussed in section H.3.4.
Note the pressure on the energy system in 2009-2012, where there is a noticeable shift in the use of coal. The “bump” in coal consumption is due to availability of new lignite power plant for increased electricity generation from coal (lignite).

SOUTH EAST EUROPE REGIONAL ENERGY MARKET SUPPORT (SEE REMS) PROJECT 295
Figure H-35: Supply of Energy
0.00
20.00
40.00
60.00
80.00
100.00
120.00
140.00
160.00
2003
2006
2009
2012
2015
2018
2021
2024
2027
2003
2006
2009
2012
2015
2018
2021
2024
2027
2003
2006
2009
2012
2015
2018
2021
2024
2027
2003
2006
2009
2012
2015
2018
2021
2024
2027
R0 R90 R90E R90P
Peta
joul
es
Nuclear Coal Oil Natural Gas LPG Electricity Biomass
Owing to the availability of coal, and the in-service date of new power plants, UNMIK becomes increasingly less dependant on imports. Note the substantial drop in imports beginning in 2009 when the new lignite plant becomes available (see Figure H-36). Imports drop by 30/21/28% (R90/R90E/R90P) compared to Reference import level.
Figure H-36: Total Imports
0
5
10
15
20
25
30
2003
2006
2009
2012
2015
2018
2021
2024
2027
Peta
joul
es
R0 R90 R90E R90P

296 SOUTH EAST EUROPE REGIONAL ENERGY MARKET SUPPORT (SEE REMS) PROJECT
An important measure of the competitiveness of an economy is its overall energy intensity, or the amount of energy delivered (consumed) per unit of GDP. The table below shows the improvement in the energy intensity of the UNMIK energy system for the three policy scenarios. In the case of the R90 and R90E scenarios the overall cost of the energy system also falls. R90P shows that a 16.1% improvement can be achieved without exceeding the overall cost of the energy system used in the Reference scenario by promoting energy efficiency and setting a policy to lower total consumption of energy.
Table H-4: Percentage Change from R0 2027 Percentage Change from R0
R0 0.00%
R90 5.98%
R90E 8.19%
R90P 16.10%
H.3.4 COSTS Figure H-37 depicts the total discounted system cost of all four scenarios. As can be noted from the figure, the system costs closely track the degree of the intensity of energy efficiency and conservation programs introduced through the policy scenarios. For example, R90 scenario which allows increased access to more energy efficient technologies is the least cost scenario over the planning horizon. The total discounted system cost drops by 3.0% from the Reference scenario. When the 10% energy conservation policy is introduced, scenario R90E, the total discounted system cost still shows 2.5% cost improvement from Reference scenario but not as much as R90 scenario. The policy goal of Improve Energy Intensity, Scenario R90P, results in almost the same amount of total discounted system costs as the Reference scenario. As was noted in section H.3.1 above, this is achieved with a 16% improvement in the country’s energy intensity.
Figure H-37: Total Discounted Energy System
5850
5900
5950
6000
6050
6100
6150
6200
R0 R90
R90E
R90P
2003
MEu
ro
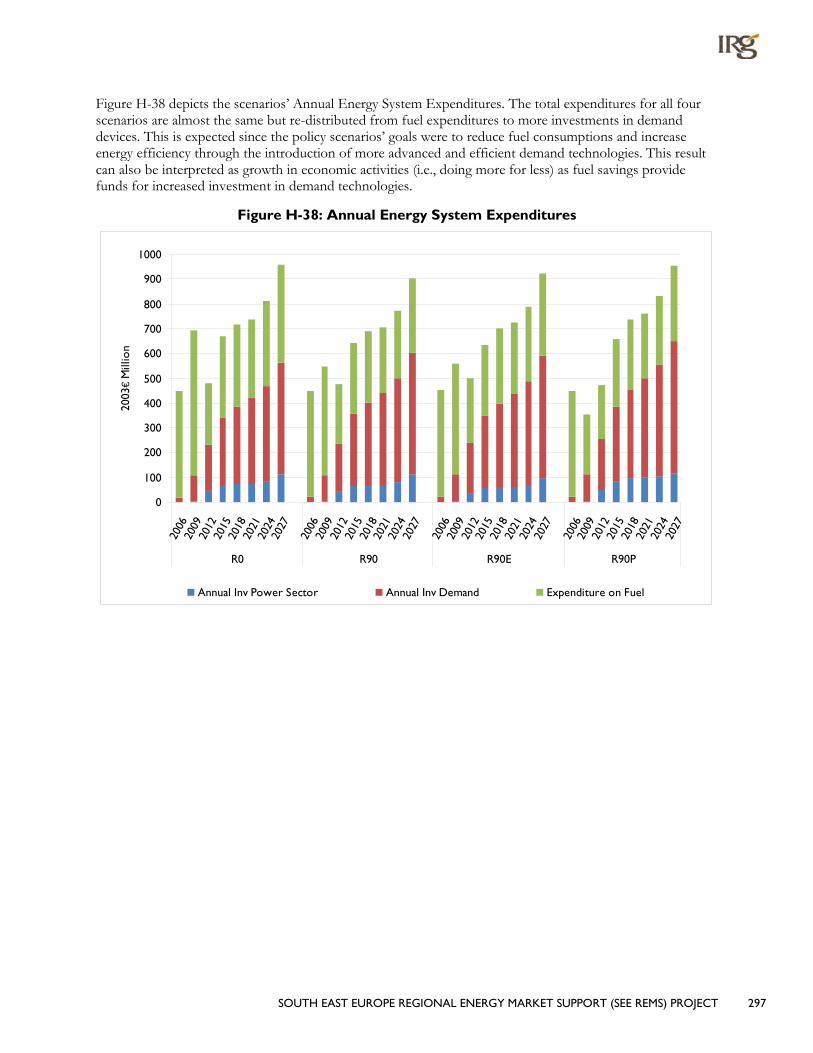
SOUTH EAST EUROPE REGIONAL ENERGY MARKET SUPPORT (SEE REMS) PROJECT 297
Figure H-38 depicts the scenarios’ Annual Energy System Expenditures. The total expenditures for all four scenarios are almost the same but re-distributed from fuel expenditures to more investments in demand devices. This is expected since the policy scenarios’ goals were to reduce fuel consumptions and increase energy efficiency through the introduction of more advanced and efficient demand technologies. This result can also be interpreted as growth in economic activities (i.e., doing more for less) as fuel savings provide funds for increased investment in demand technologies.
Figure H-38: Annual Energy System Expenditures
0
100
200
300
400
500
600
700
800
900
1000
2006
2009
2012
2015
2018
2021
2024
2027
2006
2009
2012
2015
2018
2021
2024
2027
2006
2009
2012
2015
2018
2021
2024
2027
2006
2009
2012
2015
2018
2021
2024
2027
R0 R90 R90E R90P
2003
€ M
illio
n
Annual Inv Power Sector Annual Inv Demand Expenditure on Fuel