final report - north dakota
TRANSCRIPT

NORTH DAKOTA GAME AND FISH DEPARTMENT
Final Report
Marsh Bird Distribution in Relation to Landscape Composition in North Dakota
Project T-9-R
May 1, 2005 – June 30, 2008
Terry Steinwand Director
Submitted by Michael G. McKenna
Chief, Conservation and Communications Division
September 2008

Influence of Landscape Features on Wetland Use and Distribution of Marsh Birds in North Dakota Final Project Report Mark H. Sherfy and Michael J. Anteau
U.S. Department of the Interior U.S. Geological Survey Northern Prairie Wildlife Research Center 8711 37th Street SE Jamestown, ND 58401 19 September 2008

2
Table of Contents 1. Introduction................................................................................................................................................... 3 2. Objectives ...................................................................................................................................................... 5 3. Methods ......................................................................................................................................................... 6
A. Distribution of Study Sites...................................................................................................................... 6 B. Study Site Selection ................................................................................................................................ 7 C. Target Species ......................................................................................................................................... 8 D. Wetland Surveys...................................................................................................................................... 9 E. Aerial Photography ................................................................................................................................ 10
4. Data Analysis .............................................................................................................................................. 11 A. Field Data Preparation.......................................................................................................................... 11 B. Spatial Data Preparation...................................................................................................................... 11 C. Analytical Procedures .......................................................................................................................... 12
1. Wetland Models (Objectives 1 and 3) ............................................................................................. 13 2. Landscape Models (Objective 2) ..................................................................................................... 14 3. Distribution (Objective 4)................................................................................................................... 16
5. Results.......................................................................................................................................................... 16 A. Sites Surveyed ....................................................................................................................................... 16 B. Wetland Models..................................................................................................................................... 17 C. Landscape Models ................................................................................................................................ 21 D. Distribution.............................................................................................................................................. 23
7. Literature Cited ........................................................................................................................................... 23

3
1. Introduction
The North Dakota landscape is characterized by high wetland basin density with
pronounced inter-annual variation in abundance and distribution of wetland habitats. The
dynamic nature of water conditions on this landscape results in high use of available wetland
habitats by breeding birds. The value of prairie wetlands as breeding habitat for waterfowl is
well documented, and the region is recognized as the core breeding area for many North
American duck species. Prairie wetlands are used as breeding sites by numerous other species of
marsh birds, including rails, grebes, phalaropes, and bitterns. Despite the abundance of non-
waterfowl species known to breed in prairie wetlands, relatively little is known about factors that
influence use of wetlands in North Dakota by these species as related to landscape attributes.
Many human-induced changes have dramatically altered the character of this landscape,
including extensive wetland drainage and conversion of wetlands and native prairies to cropland.
These changes have had serious consequences for wildlife that rely on prairie wetland and
upland habitats. Initiatives such as the Conservation Reserve Program (CRP) have partially
mitigated for habitat losses by providing incentives for wetland restoration and establishment of
permanent grass cover on private lands. Benefits of CRP and other grassland conservation
efforts for waterfowl and grassland songbirds have been documented, but the extent to which
these programs influence wetland use by marsh-breeding birds is largely unknown. Because
several marsh species nest in upland sites, the demonstrated benefits of grassland conservation
programs for waterfowl and songbirds should extend to these species as well. However, form of
the relationship between grassland cover and marsh bird wetland use is largely unknown. To the
extent that these programs are factors in use of wetlands by marsh birds, they could be used as
management tools to enhance populations of marsh-breeding species of concern.

4
A few studies have demonstrated that landscape characteristics can influence wetland use
by marsh-breeding birds (Naugle et al. 2000, Fairbairn and Dinsmore 2001, Johnson et al. 2003).
However, these studies have focused primarily on visually estimated wetland habitat
characteristics (Fairbairn and Dinsmore 2001, Johnson et al. 2003) and landscape metrics
estimated from coarse-resolution satellite imagery (Naugle et al. 2002, Johnson et al. 2003).
Niemuth and Solberg (2003) demonstrated that density and distribution of 6 waterbird species in
North Dakota, as indexed by the Breeding Bird Survey, was strongly correlated with wetland
abundance. However, secretive or rare waterbird species (e.g. yellow rail) are detected
infrequently on BBS routes, requiring an additional source of data to model their responses to
landscape conditions. Although these studies are useful in predicting relationships between bird
abundance and landscape variables, none provides models describing relationships between
marsh bird wetland use and landscape metrics in North Dakota.
The North Dakota Game and Fish Department developed a draft list of Bird Species of
Concern to focus its efforts in developing its statewide Comprehensive Wildlife Conservation
Strategy (Hagen et al. 2005). This list includes many species that breed in prairie marshes and
adjacent uplands, including American bittern, black tern, pied-billed grebe, Virginia rail,
Wilson’s phalarope, and yellow rail. Additionally, the Northern Prairie and Parkland Waterbird
Conservation Plan (Beyersbergen et al. 2004) and the Northern Plains/Prairie Potholes Regional
Shorebird Conservation Plan identify several species of marsh and shore birds that are known to
breed in North Dakota and that are of moderate to high regional conservation priority.
Collectively, these species represent a suite of taxa for which the Game and Fish Department
desires additional information on distribution and wetland use, and which are of management
concern within both the state and the prairie/parkland region. Previous studies have provided

5
some distributional data on these species, which can be compiled to reveal broad patterns in their
distribution in North Dakota. For example, preliminary GAP data indicate probable and known
locations of each species in 635-km2 hexagons (Figure 1). These data have descriptive value and
may be useful for modeling responses of marsh birds to landscape composition on a coarse scale.
However, GAP’s representation of distributional patterns includes multiple studies conducted
over several years with varying objectives, methods, and study areas. In contrast, this study is
designed to obtain concurrent data on marsh bird wetland use and landscape composition at a
scale that is meaningful in a habitat management context, while furthering knowledge of
distributional patterns for these species.
2. Objectives
This study was designed to evaluate use of wetlands by a suite of non-game marsh-
breeding birds in North Dakota, and relate use of wetlands to habitat characteristics within the
surveyed wetlands as well as wetland and upland habitat characteristics in the surrounding
landscape. The study’s specific objectives are to:
1) Relate presence/absence and abundance of marsh birds in North Dakota to habitat
characteristics of surveyed wetlands, including percent coverage by emergent vegetation,
percentage of the wetland basin containing water, and wetland type.
2) Relate presence/absence and abundance of marsh birds in North Dakota to cropland
area, grassland area, acreage of CRP, land protection status, and other upland habitat
variables in the adjacent landscape;
3) Relate presence/absence and abundance of marsh birds in North Dakota to wetland
acreage, percent of wetland basins holding water, and other wetland habitat variables in
the adjacent landscape; and,

6
4) Provide baseline data on distribution of marsh birds in eastern and northern North
Dakota.
3. Methods
A. Distribution of Study Sites
We initially designed this study for the portion of North Dakota lying east and north of
the Missouri River. This area encompasses the Prairie Pothole Region (PPR), which holds an
extremely high abundance of wetlands, and it can be divided into 3 ecoregions (Missouri Coteau,
Drift Prairie, and Red River Valley; Figure 2). We initially excluded the Northwestern Great
Plains (North Dakota west of the Missouri River) because wetland abundance is relatively low in
this area, and use of the region by marsh birds was not expected to be as high as in the PPR.
However, surveys of wetlands west of the Missouri River in South Dakota have revealed land-
use influences on abundance of marsh birds (May et al. 2002). Consequently, we expanded our
sampling to include the Northwestern Great Plains in 2006. We collected data in the 3 PPR
ecoregions during 2004-2006 and in the Northwestern Great Plains in 2006-2007.
We conducted our sampling on 4-square-mile (2-mile x 2-mile) sites, with new sites
being selected each year. Our goal was to distribute sampling effort among ecoregions in
approximate proportion to their area, and within ecoregions equally among 4 landcover strata
(high vs. low grassland acreage and high vs. low wetland acreage; Naugle et al. 2000). We
sought a minimum of 4 sites per landcover stratum in each ecoregion, and estimated that
sampling 96 sites per year would be achievable. Proportional areas of the PPR ecoregions are
approximately 1:2:3 (Red River Valley, Missouri Coteau, and Drift Prairie, respectively). Thus,
we selected 16 sites in the Red River Valley, 32 in the Missouri Coteau, and 48 in the Drift
Prairie. We excluded the Turtle Mountains region of north-central North Dakota because it has

7
substantially different terrain and vegetation from other parts of North Dakota. We also avoided
U.S. Fish and Wildlife Service 4-square-mile waterfowl breeding pair survey areas so that
potential conflicts with private land access were minimized. We selected 48 sites/year for the
Northwestern Great Plains when this ecoregion was added in 2006. Each year we selected 10-20
additional sites, distributed equally among the ecoregions being sampled, in case favorable
weather conditions allowed additional data collection.
B. Study Site Selection
We consulted with the U.S. Fish and Wildlife Service’s Habitat and Population
Evaluation Team (HAPET) regarding distribution of cover types in North Dakota. They
developed a 16-mi2 grid covering the state, and assigned each cell to 1 of the 4 strata. Grassland
cover estimates were derived from a 2001 HAPET landcover map, and wetland acreage
estimates from National Wetland Inventory (NWI) data. Median values of grassland acreage and
wetland acreage were derived within each ecoregion, and cell classification was based on
whether the cell’s value of each was above or below the median. This stratification generated a
sample of study sites that was representative of upland and wetland habitat types throughout
North Dakota.
Each field season, we randomly selected approximately 200 sections in each ecoregion,
and assigned them random sequential numbers. We worked from the beginning of the list,
including sections for sampling until the ecoregion’s quota had been met for each stratum. We
then examined each selected section’s position within the 16-mi2 landcover grid cell, and
randomly selected 1 of the possible 4-mi2 sites it encompassed. We excluded sections and 4-mi2
sites that overlapped sites sampled in previous years.

8
We used publicly available data (plat books and/or county tax records) to determine
ownership for each parcel of land in the selected sites. During late winter, we sent a written
access request to each landowner. We retained only those lands for which we obtained written
access permission in the final sample. We used NWI data to map wetland basins within the
accessible lands, and randomly selected 6 basins (2 temporary, 2 seasonal, and 2 semipermanent)
for bird surveys.
C. Target Species
We established a suite of 16 focal species, including marsh and shore birds identified as
being of high conservation priority by the North Dakota Game & Fish Department (Hagen et al.
2005), most of which are also ranked as high priorities in regional waterbird (NAWCP 2003) or
shorebird plans (Beyersbergen et al. 2004) (Table 1). We included sora due to its secretive
nature and a lack of information on factors influencing its wetland use in North Dakota, although
it is not identified as a species of concern in the state or region. We also included 4 species of
prairie-nesting shorebirds (Wilson’s phalarope, marbled godwit, willet, and American avocet).
Although these species are predominantly upland nesters, they roost and forage in prairie
wetlands and were likely to be encountered during marsh surveys. The study was designed with
regard to collecting data on the 16 target species, but also presented opportunities to collect data
on other species. For example, several other species of conservation interest to the North Dakota
Game & Fish Department were also encountered in the surveyed wetlands. We trained
technicians in identification of all birds likely to be encountered, and recorded data for these
species as well. We included in our analyses 6 additional North Dakota species of conservation
priority (upland sandpiper, grasshopper sparrow, lark bunting, northern pintail, redhead, and

9
bobolink), and 6 commonly occurring species likely to be of management interest (American
coot, lesser scaup, common snipe, killdeer, common yellowthroat, and marsh wren).
D. Wetland Surveys
The focal species can be grouped according to the most likely means of detection:
secretive species that are most likely to be detected during auditory surveys (bitterns and rails),
and species that are most likely to be detected visually (grebes, pelican, black tern, and the 4
wading birds). We adapted procedures from Naugle et al. (2000), Fairbairn and Dinsmore
(2001), and Conway (2003), including components that targeted the visual and auditory species
separately. First, we selected a vantage point that provided good visibility and minimized
disturbance of birds. From that point, we conducted a visual and call-playback survey. The
survey started with 5 minutes of silence, during which we recorded all species seen or heard.
This was followed by 5 1-minute intervals, each including a 30-second call broadcast (least
bittern, yellow rail, sora, Virginia rail, and American bittern; Johnson and Dinsmore 1986)
followed by a 30-second silent period (c.f. Naugle et al. 1999, 2000, Conway 2003). We did not
conduct call-playback surveys for wetlands containing no suitable habitat for secretive species
(e.g., cropped wetlands with no vegetation). For wetlands bordered by an emergent vegetation
zone, we conducted a fixed-area survey by walking a 100-m segment through the vegetation and
recording all species seen or heard within the segment.
We conducted wetland surveys from mid-May to mid-July, restricting surveys to dawn
(0.5 h before – 2.0 h after sunrise) and dusk (2.0 h before – 0.5 h after sunset) to maximize
detection probability for secretive species (Conway 2003). We completed data collection on all
wetlands within a site before moving to the next site. We started by visiting each of the
randomly selected wetlands, conducting surveys on each regardless of whether the basin

10
contained water. If any of these basins were dry, we attempted to identify additional wetlands of
the same class so that a minimum of 6 wetlands containing water were surveyed at each site.
This was not feasible in all cases when water conditions were especially poor. In situations
where access was limited (e.g., due to lack of landowner permission), we conducted visual
and/or auditory surveys from nearby roads, but did not conduct fixed-area surveys. On some
sites, we conducted surveys on additional wetlands opportunistically encountered after our
sampling goals had been met.
We recorded the pattern wetland of vegetation (Stewart and Kantrud 1971), percent full
of the wetland basin, presence of trees, and dominant management practice (e.g., cropped,
grazed, burned, none) for each wetland basin. We visually estimated percent cover of 10
landcover categories (Grassland, CRP, Hayland, Cropland, Woodland, Shrubland, Wetland,
Right-of-Way, Barren Land, and Odd Area) within a 0.25-mile radius around each wetland, and
also recorded the dominant management practice for this area. We recorded GPS coordinates for
the survey point location and the start and end point of the emergent vegetation transect.
E. Aerial Photography
We used aerial photography to collect landscape composition data for each site. Flights
occurred during mid-May, and were timed to maximize contrast between cropland and grassland.
We conducted 1-3 flights per year to ensure that imagery was obtained for each study site. We
used a large-format (9” x 9”) camera mounted in a Partenavia P-68 Observer (U.S. Fish and
Wildlife Service, Ft. Snelling, MN) that was flown at approximately 10,000 feet MSL. This
altitude provide a scale of approximately 1:15,000, at which a 9” x 9” image captures an entire 2
mile x 2 mile site. We used Kodak 1443 color infrared film, which was developed to color
positive by HAS Images (Dayton, OH).
11
4. Data Analysis
A. Field Data Preparation
To ensure accuracy of data entry, we used double-entry procedures for all field data. We
provided blank database templates to two independent technicians, grouping data sheets into
manageable units (50 – 100 data sheets) for entry. Both technicians entered all of the data, and
we used spreadsheet comparison software (Excel Compare 2.0.3.; Formula Software, Inc.) to
identify discrepancies between pairs of spreadsheets. These discrepancies reflected a data entry
error by one of the technicians. Any cells flagged by this procedure as differing between pairs
were checked against the original data cards. We completed multiple iterations of comparison
and error-checking for each dataset until no additional errors were identified.
B. Spatial Data Preparation
We scanned color-inferred imagery (600 dpi; RGB composite), auto corrected,
sharpened, and saved images in a TIF format. We used ESRI® ArcGIS to geo-reference and
interpret imagery within our 4-square-mile sites. We used field observations and manual image
interpretation to classify imagery at a scale of 1:4,000, using 0.04 ha as a minimum mapping
unit. We classified the entire area of our sites into the following classes: grass (including native
grass cover, CRP, and hay and pasture land); crop; water (visible open water); woodland (trees
and shrubs, including shelterbelts); road; barren (land devoid of vegetation, but not tilled
croplands) and odd areas (e.g., rock piles, farm yards, towns, oil infrastructure, etc.). In the
imagery for Northwestern Great Plains we noticed areas of very high reflectance in the infrared
band, relative to the rest of the image, indicating abundant green vegetation. These areas were
often associated with riparian areas and appeared to be moist soil or wet meadow areas, so we
classified them as unclassified wet areas. Lastly, we calculated the area of all classified

12
polygons and because study sites sometimes varied in actual area, we calculated the percent
cover for each class within study sites.
We also utilized converged basin National Wetland Inventory (NWI) data (Johnson and
Higgins 1997) to generate variables to represent the landscape within our 4-square-mile sites.
However, converged basin NWI data was not available for the entire Northwestern Great Plains
region, so we limited the NWI summaries to regions east of the Missouri River. For each site,
we calculated the sum of the area of wetlands and the percent of the wetlands that were either
seasonal or temporary regimes (landscape percent seasonal and temporary [LST]).
C. Analytical Procedures
In the following models, we used information theoretic multimodel inference (Burnham
and Anderson 2002) to determine the importance of each parameter in explaining the response
variable. However, we only modeled focal species that occurred at least 30 times within the
scope of each analysis (see Tables 2 and 3). We modified a macro by Shaffer (2002) to rank and
weight our candidate models using Akaike’s Information Criterion (AIC), and calculate model
averaged parameter estimates, unconditional standard errors, and 95% confidence limits. We
used 95% confidence limits to evaluate the importance of each parameter. For example, if the
confidence limit did not include zero or another level of a class we viewed that parameter as
important. We report all important differences among levels of class variables in odds ratios (for
logistic regressions) or percent change (for Poisson generalized linear models) and all important
covariate parameter estimates and 95% confidence limits.
We used the data from the visual survey only to determine if several species occurred at
each wetland; however, for species that are more secretive or if detection was generally
improved by the call-play survey we used a combination of the visual survey and the call-play

13
survey (see Tables 4-7). For these species, we only included wetlands where the both the visual
survey and the call-play survey was conducted, and scored the species as present if it was
detected in either survey. However, the call-play surveys were not conducted at all wetlands, so
models that used this data had reduced sample size.
1. Wetland Models (Objectives 1 and 3)
The proportion of the area surrounding a wetland in a various cover class is
compositional, and by definition correlated; however, the strongest correlations generally exist
between grassland and cropland in the North Dakota landscape. To avoid problems associated
with correlation among our explanatory variables we only included 3 of the 7 classifications in
our models (proportions of grass [grassland, CRP, pasture, and hayland], wood [woodland and
shrubland], and wetland).
We examined factors at or in the immediate surrounding area of a wetland that were
important in predicting the probability that a given wetland would be used by one of our focal
species with separate logistic regressions for each species (binomial distribution, logit link
function; PROC GENMOD; SAS Institute 2002). We selected 8 variables of a priori interest
and generated a list of 20 candidate models that would be competed for each species (see Tables
8-11). We also examined factors at the wetland or in the immediate surrounding area that were
important in predicting the species richness at the wetland with a generalized linear model
(Poisson distribution, log link function; PROC GENMOD; SAS Institute 2002).
The following variables were specified as nominal class variables when they occurred in
candidate models: region (R; including: Red River Valley, Drift Prairie, Missouri Coteau, and
Northwestern Great Plains), wetland cover (WC; vegetation cover in the wetland ranging from 1
to 4, with 1 being a closed marsh and 4 being mostly open water), trees (WT; whether the

14
wetland basin contained trees or not), and wetland manipulation (WM; whether the wetland was
unmanipulated, cropped, or other [e.g., burned, hayed, or grazed]). The following variables were
modeled as continuous covariates: percent of the wetland basin full of water (WF; we included a
quadratic term because we believed this variable would not be linearly related to probability of
occurrence for several of our focal species), and percent of the surrounding area in grass (SAG),
woodland (SAW), and other wetlands (SWE).
For species that did not occur or were very rare in a given region (under 3 detections), we
excluded all the data from those regions to ensure that the calculation of parameter estimates and
standard errors would be stable and that all models would converge. The regions included for
modeling and the samples size for each species are included in Table 2. American bittern
occurred infrequently in all regions except the Drift Prairie, so we combined all other regions
into one region, allowing for inference between Drift Prairie and other parts of North Dakota
(Table 2). Lark bunting occurred only in the northwestern Great Plains, so region was removed
from all lark bunting candidate models. Grebes occurred infrequently in wetlands of cover class
1 and 2, so we combined cover classes 1 and 2 as well as 3 and 4 to ensure that models would
converge.
2. Landscape Models (Objective 2)
We conducted separate analyses for northwestern Great Plains region because converged
basin NWI data were not available for this region. However, this approach limited the number of
focal species with adequate numbers of occurrences that we could model in either the
northwestern Great Plains or for the area east of the Missouri River (see Table 3).
We examined large landscape-scale factors that were important in predicting the
probability that a given 4-square-mile site would be used by one of our focal species using
15
separate logistic regressions for each species (binomial distribution, logit link function; PROC
GENMOD; SAS Institute 2002). For these models we specified the number of wetlands within a
site as the trials and the number of detections within a site as the events. We then included the
events over the trials and the response variable, ensuring that the experimental unit of these
analyses was the 4-square-mile site and that the proper error term was calculated. We also
examined large landscape-scale factors that were important in predicting the species richness
within the 4-square-mile site using a generalized linear model (Poisson distribution, log link
function; PROC GENMOD; SAS Institute 2002).
For areas east of the Missouri River we examined 6 variables and examined 20 a priori
candidate models (Tables 12-15). We calculated the percent wetness (LWET) of the 4-square-
mile site by dividing the sum of the water classified from imagery (LWW) by the sum of the
wetland area from converged basin NWI data. However, we also included LWW into candidate
models, but we did not let LWW occur in the same models as LWET because these variables are
partially correlated, rather our approach competed similar a priori candidate models that
contained either LWET or LWW. Similar to our models at the wetland scale, we included the
percent of the landscape that was classified from imagery as grass (LG) and woodland (LWO).
We characterized the class of wetlands within the 4-squre-mile sites by including the percent of
the wetlands that were seasonal or temporary (LST). Lastly, we only included region as a
blocking term, because we examined the region effect in our wetland scale models. We
examined 4 parameters (LWW, LWO, LG, and unclassified wet areas [UCW]) in the
northwestern Great Plains and competed all possible main effect models (16; Table 15).

16
3. Distribution (Objective 4)
We evaluated distribution of each target species by calculating the proportion of wetlands
surveyed at which the species was detected in each site. We mapped these data by species and
examined the maps visually to describe regional trends in distribution.
5. Results
A. Sites Surveyed
Four of our focal species (American white pelican, American avocet, least bittern, and
yellow rail) occurred too infrequently for us to model the factors that influenced their wetland
use. However, we summarized the characteristics of the wetlands where they were observed.
The wetlands where American white pelicans were observed were, on average, 87% ± 8 SE full,
and 93% of the wetlands where they were observed had cover classes of 3 or 4. Ninety-three
percent of the wetlands were treeless, 60% were unmanipulated, and none were cropped.
American avocet were primarily observed in the Drift Prairie (72% of our observations;
Appendix A). The wetlands where American avocet were observed were, on average, 93% ± 8
SE full; 82% of the wetlands where they were observed had cover classes of 3 or 4 and were
treeless. Least bittern also were primarily observed in the Drift Prairie (86% of our observations;
Appendix A). The wetlands where least bittern were observed were, on average, 118% ± 9 SE
full; 86% of the wetlands where they were observed had cover classes of 1 or 2 and were
treeless. Similarly, 86% of least bittern observations were on unmanipulated wetlands and none
were on cropped wetlands. At least 20% of the surrounding landscape was covered by other
wetlands in 71% of the wetlands where least bittern were observed. Yellow rail were primarily
observed in the Drift Prairie (88% of our observations; Appendix A). The wetlands where
yellow rails were observed were, on average, 117% ± 13 SE full; 63% of the wetlands where

17
they were observed had cover classes of 3 and 75% were treeless. Similarly, 63% of least bittern
observations were on unmanipulated wetlands and none were on cropped wetlands.
B. Wetland Models
Black Terns
Black terns were 11.0 and 7.6 times more likely to occur at wetlands in the Drift Prairie
and Missouri Coteau, respectively, than on those in the Red River Valley (Appendix A), they
were at least 3 times more likely to occur at wetlands with cover classes of 2 or 3 than those of
classes 1 or 4, and they were 2.7 times more likely to occur on unmanipulated wetlands than
those that had been cropped. The probability that black terns would occur at a wetland was
positively correlated with the percent of the landscape covered by other wetlands (X = 0.331,
95% CL: 0.194 – 0.469) and the percent of the wetland basin full of water (X = 0.01, 95% CL:
0.003 – 0.018).
Shorebirds
Upland sandpiper, marbled godwit, and Wilson’s phalarope were at least 4.0, 4.3, and 2.4
times, respectively, more likely to occur at wetlands in the northwestern Great Plains than those
of the Drift Prairie or the Missouri Coteau (Appendix A). However, region was not important in
explaining the occurrence of killdeer, willet, and common snipe. Wetland cover class appeared
not to be important in explaining occurrence of shorebird species, except for killdeer which were
3.9, 1.7, and 1.8 times more likely to occur at wetlands with cover class of 4 than those of 1, 2,
and 3, respectively. Killdeer were over 2.1 times more likely to occur at wetlands that were
manipulated by cropping or other manipulations (e.g., haying, grazing, burning) than those that
were unmanipulated. Marbled godwit were over 3.7 times more likely to occur at wetlands that
were cropped than those that were unmanipulated or otherwise manipulated. Wilson’s phalarope

18
were 8.7 times more likely to occur at wetlands without trees than those that had trees within the
basin. The probability that killdeer would occur at a wetland was negatively correlated with the
percent of the landscape covered by woodlands (X = -0.236, 95% CL: -0.375 – -0.096). The
probabilities that common snipe and killdeer would occur at a wetland were positively correlated
with the percent of the landscape covered by other wetlands (X = 0.28, 95% CL: 0.111 – 0.450;
X = 0.199, 95% CL: 0.107 – 0.291; respectively). The probabilities that killdeer and willet
would occur at a wetland were negatively correlated with the percent of the landscape covered
by grass (X = -0.061, 95% CL: -0.119 – -0.003; X = -0.16, 95% CL: -0.292 – -0.028;
respectively). The probability that Wilson’s phalarope would occur at a wetland was positively
correlated with the percent of the wetland basin full of water (X = 0.045, 95% CL: 0.013 –
0.077). The probability that willet would occur at a wetland was positively correlated with the
percent of the wetland basin full of water up to 130%, then it was weakly negatively correlated
thereafter (X = 0.042, 95% CL: 0.022 – 0.061; X2 = -0.0002, 95% CL: -0.0003 – -0.00004).
Ducks and Grebes
Grebes, northern pintails, and redheads occurred too infrequently in the Red River Valley
for this region to be included in our models; the same was true for grebes in the northwestern
Great Plains (Table 2). Redheads were 2.6 times more likely to occur at wetlands in the Drift
Prairie than those of the Missouri Coteau (Appendix A). Redheads were most likely to occur at
wetlands with cover class of 3, these wetlands were 11.2 times more likely to have redheads than
those of cover class 1. Similarly, grebes were 3.9 times more likely to occur at wetlands of cover
class 3 or 4 than those of cover class 1 or 2. Grebes were 8.1 and 5.4 times more likely to occur
at wetlands that were unmanipulated than those that were cropped or otherwise manipulated,
respectively. The probability that redheads occured at a wetland was positively correlated with

19
the percent of the wetland basin full of water (X = 0.023, 95% CL: 0.007 – 0.038). The
probabilities that northern pintails and grebes occured at wetlands were positively correlated with
the percent of the wetland basin full of water up to 110 and 140%, then they were weakly
negatively correlated thereafter (X = 0.08, 95% CL: 0.029 – 0.131, X2 = -0.0004, 95% CL: -
0.0007 – -0.00005; X = 0.104, 95% CL: 0.022 – 0.186; X2 = -0.0004, 95% CL: -0.0007 – -
0.00005; respectively).
Rails, Bitterns, and Coots
American bittern and American coot were 8.2 and at least 2.6 times, respectively, more
likely to occur at wetlands in the Drift Prairie than those of all other regions in North Dakota
(Appendix A). The highest probabilities of occurrence for American coot were in cover classes
of 2 and 3; these wetlands were at least 2.6 and 6.1 times more likely to have American coot than
those of classes 1 and 4, respectively. However, the highest probabilities of occurrence for sora
were wetlands with cover classes 1 and 2; these wetlands were at least 10.8 times more likely to
have sora then those of class 1. Sora were 2.3 times more likely to occur at wetlands that were
unmanipulated than those that had been manipulated through grazing, haying, or burning.
American coot were at least 4.8 times more likely to occur at unmanipulated wetlands than those
that were cropped or otherwise manipulated. The probabilities that American bittern and sora
would occur at a wetland were positively correlated with the percent of the landscape covered by
other wetlands (X = 0.252, 95% CL: 0.059 – 0.446; X = 0.131, 95% CL: 0.021 – 0.242;
respectively). The probabilities that Virginia rail, sora, and American coot occur at a wetland
were positively correlated with the percent of the wetland basin full of water up to 140, 210, and
250%, then they were weakly negatively correlated thereafter (X = 0.044, 95% CL: 0.027 –
0.061, X2 = -0.0001, 95% CL: -0.00023 – -0.00007; X = 0.035, 95% CL: 0.027 – 0.042; X2 = -

20
0.00008, 95% CL: -0.00011 – -0.00006; X = 0.035, 95% CL: 0.023 – 0.048; X2 = -0.00007, 95%
CL: -0.0001 – -0.00004; respectively). The probability that American bittern occured at a
wetland was positively correlated with the percent of the wetland basin full of water (X = 0.017,
95% CL: 0.003 – 0.031).
Passerines
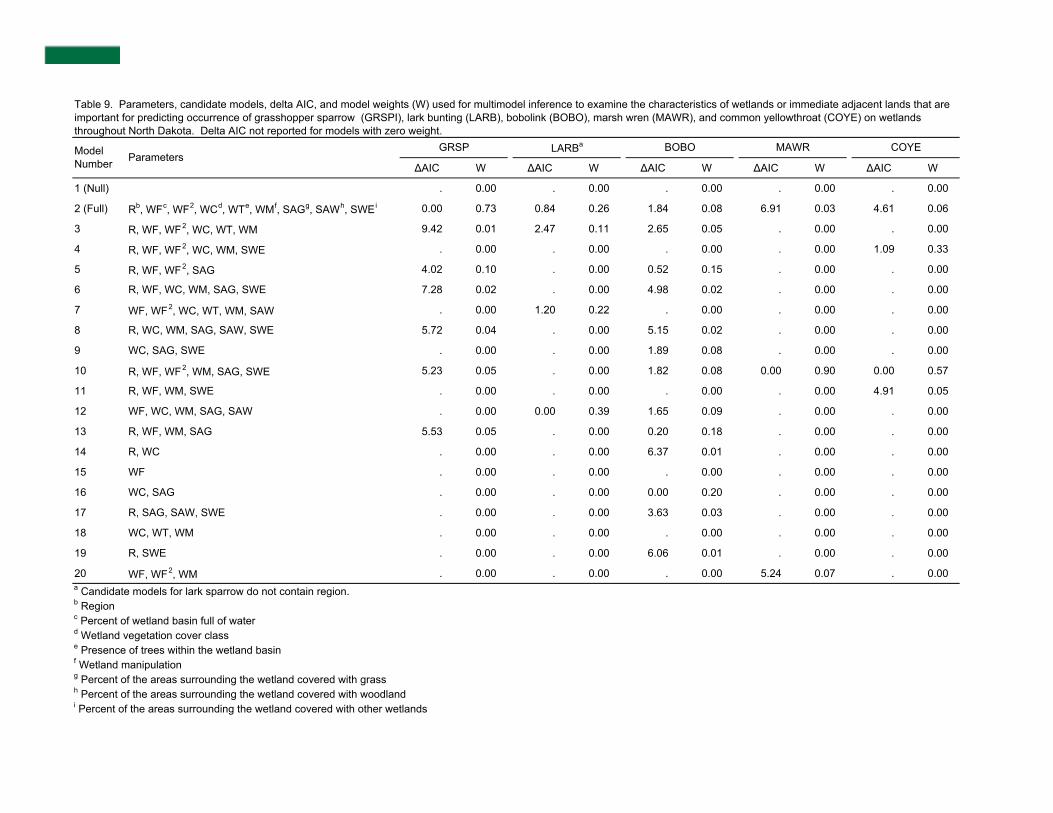
Lark bunting only occurred in the northwestern Great Plains, and grasshopper sparrow
was at least 2.1 times more likely to occur at wetlands of the northwestern Great Plains than any
other region in North Dakota (Appendix A). However, marsh wren did not occur in the
northwestern Great Plans, and common yellowthroat were 2.8 times more likely to occur at
wetlands of the Red River Valley than those of the northwestern Great Plains (Appendix A).
Region appeared unimportant in explaining the probability of occurrence for bobolink (Appendix
A). Marsh wren and common yellowthroat were at least 4.4 and 1.7 times more likely to occur
at wetlands that were unmanipulated than those that were cropped or otherwise manipulated.
However, lark bunting were 2.9 more likely to occur on wetlands that had been manipulated by
burning, haying, or grazing than those that were unmanipulated. The probability that common
yellowthroat would occur at a wetland was positively correlated with the percent of the
landscape covered by other wetlands (X = 0.306, 95% CL: 0.203 – 0.408). The probability that
marsh wren would occur at a wetland was positively correlated with the percent of the wetland
basin full of water up to 180%, then it was weakly negatively correlated thereafter (X = 0.02,
95% CL: 0.011 – 0.03, X2 = -0.00006, 95% CL: -0.0001 – -0.00002). The probability that
grasshopper sparrow would occur at a wetland was negatively correlated with the percent of the
wetland basin full of water (X = -0.009, 95% CL: -0.015 – -0.003). The probabilities that
bobolink, grasshopper sparrow, and marsh wren would occur at a wetland were positively

21
correlated with the percent of the area surrounding the wetland covered in grass (X = 0.106, 95%
CL: 0.013 – 0.200; X = 0.093, 95% CL: 0.007 – 0.180; X = 0.133, 95% CL: 0.031 – 0.234;
respectively).
Species Richness
Species richness at wetlands was 28, 19, and 17% higher in northwestern Great Plains
than that at wetlands of the Red River Valley, Drift Prairie, and Missouri Coteau, respectively
(Appendix A). Species richness at wetlands was highest at wetlands with cover classes of 2, 3,
or 4, and was at least 15% lower on cropped wetland than those that were unmanipulated or
otherwise manipulated. Species richness at wetlands was positively influenced by both the
percent of surrounding area covered by other wetlands (X = 0.069, 95% CL: 0.052 – 0.085) and
the percent of the wetland basin full of water (X = 0.003, 95% CL: 0.002 – 0.004).
C. Landscape Models
Black Terns
The probability of occurrence of black terns, east of the Missouri River, was negatively
correlated with the percent of the wetlands in the landscape that were seasonal or temporary (X =
-0.013, 95% CL: -0.023 – -0.003) and the percent of the landscape covered with woodland (X = -
0.234, 95% CL: -0.457 – -0.012).
Shorebirds
The probability of occurrence of killdeer east of the Missouri River was negatively
correlated with the percent of the landscape covered by grass (X = -0.015, 95% CL: -0.023 – -
0.008) and the percent of the landscape covered with woodland (X = -0.104, 95% CL: -0.196 – -
0.012). However, none of the parameters we included in our models appeared important in
predicting occurrence of killdeer and upland sandpiper in the northwestern Great Plains.

22
Similarly, none of the parameters we included in our models appeared important in predicting
occurrence of upland sandpiper, common snipe, and willet in the area east of the Missouri River.
Ducks and Grebes
We only had an adequate sample of detections to model the redhead occurrence in the
areas east of the Missouri River; however, none of the parameters we included in our models
appeared important.
Rails, Bitterns, and Coots
The probabilities of occurrence of American bittern and Virginia rail, in the area east of
the Missouri River, were negatively and positively correlated, respectively, with the percent of
the landscape covered with woodlands (X = -0.462, 95% CL: -0.875 – -0.049; X = 0.054, 95%
CL: 0.016 – 0.092). However, none of the parameters we included in our models appeared
important for predicting occurrence of sora and American coot in the area east of the Missouri
River.
Passerines
The probabilities of occurrence of common yellowthroat and grasshopper sparrow, in the
area east of the Missouri River, were negatively correlated with the percent of the wetlands that
were seasonal or temporary (X = -0.013, 95% CL: -0.021 – -0.006; X = -0.015, 95% CL: -0.027
– -0.003); however, none of the parameters we included in our models appeared important for
predicting occurrence of grasshopper sparrow in northwestern Great Plains. The probabilities of
occurrence of lark bunting and bobolink in the northwestern Great Plains were negatively and
positively correlated, respectively, with the percent of the landscape covered with woodlands (X
= -0.194, 95% CL: -0.346 – -0.041; X = 0.053, 95% CL: 0.003 – 0.103); lark bunting were also
negatively correlated with percent cover of unclassified wet areas (X = -0.203, 95% CL: -0.324 –

23
-0.082). However, none of the parameters we included in our models appeared important for
bobolink and marsh wren in the area east of the Missouri River.
Species Richness
The percent of the wetlands on the landscape that were either seasonal or temporary had a
weak negative correlation with species richness in the area east of the Missouri River (X = -
0.002, 95% CL: -0.004 – -0.0008). The amount of the landscape covered with water had a weak
negative correlation with species richness in the northwestern Great Plains (X = -0.029, 95% CL:
-0.052 – -0.006).
D. Distribution
Of the 23 species analyzed, 14 occurred in the Red River Valley, 22 occurred in the Drift
Prairie (all but lark bunting), 20 in the Missouri Coteau (all but lark bunting, least bittern, and
yellow rail), and 18 in the Northwestern Great Plains (all but American avocet, black tern,
grebes, least bittern, and marsh wren) (Appendix A).
7. Literature Cited
Beyersbergen, G. W., N. D. Niemuth, and M. R. Norton. 2004. Northern Prairie and Parkland
Waterbird Conservation Plan. Prairie Pothole Joint Venture, Denver, Colorado. 183 pp.
http://www.waterbirdconservation.org/northern_prairie_parklands.html.
Burnham K. P., and D. R. Anderson. 2002. Model selection and multimodel inference: a
practical information-theoretic approach. Springer, New York.
Conway, C. J. 2003. Standardized North American marsh bird monitoring protocols. U.S.
Geological Survey, Arizona Cooperative Fish and Wildlife Research Unit, Tucson, AZ.
Fairbairn, S. E., and J. J. Dinsmore. 2001. Local and landscape-level influences on wetland bird
communities of the Prairie Pothole Region of Iowa, USA. Wetlands 21:41-47.

24
Hagen, S. K., P. T. Isakson, and S. R. Dyke. 2005. North Dakota Comprehensive Wildlife
Conservation Strategy. North Dakota Game and Fish Department, Bismarck, ND. 454 pp.
http://www.gf.nd.gov/conservation/cwcs.html.
Higgins, K. F., D. E. Naugle, and K. J. Forman. 2002. A case study of changing land use
practices in the Northern Great Plains, U.S.A.: an uncertain future for waterbird
conservation. Wetlands 25:42-50.
Johnson, D. H. 2001. Habitat fragmentation effects on birds in grasslands and wetlands: a
critique of our knowledge. Great Plains Research 11:211-31.
Johnson, D. H., and M. D. Schwartz. 1993. The Conservation Reserve Program: habitat for
grassland birds. Great Plains Research 3:273-295.
Johnson, D. H., J. A. Shaffer, and L. D. Igl. 2003. Birds on the interface: how wetland birds
depend on grasslands. Presentation at the 17th Annual Meeting of the Society for
Conservation Biology, Duluth, Minnesota.
Johnson, R. R., and J. J. Dinsmore. 1986. Habitat use by breeding Virginia rails and soras.
Journal of Wildlife Management 50:387-392.
Johnson, R. R., and K. F. Higgins. 1997. Wetland resources of eastern South Dakota. South
Dakota State University, Brookings, South Dakota, USA.
http://www.npwrc.usgs.gov/resource/wetlands/sdwet/sdwet.htm
May, S. M., D. E. Naugle, and K. F. Higgins. 2002. Effects of land use on nongame wetland
birds in western South Dakota stock ponds, U.S.A. Wetlands 25:51-55.
Naugle, D. E., K. F. Higgins, S. M. Nusser, and W. C. Johnson. 1999. Scale-dependent habitat
use in three species of prairie wetland birds. Landscape Ecology 14:267-276.

25
Naugle, D. E., R. R. Johnson, M. E. Estey, and K. F. Higgins. 2000. A landscape approach to
conserving wetland bird habitat in the Prairie Pothole Region of eastern South Dakota.
Wetlands 20:588-604.
NAWCP. 2003. Prairie and Parkland Waterbird Conservation Plan (Draft). U.S. Fish and
Wildlife Service, Bismarck, ND. 47pp + app.
Niemuth, N. A., and J. W. Solberg. 2003. Response of waterbirds to number of wetlands in the
Prairie Pothole Region of North Dakota, U.S.A. Waterbirds 26:233-238.
Reynolds, R. E., T. L. Shaffer, R. W. Renner, W. E. Newton, and B. D. J. Batt. 2001. Impact of
the Conservation Reserve Program on duck recruitment on the U.S. Prairie Pothole Region.
Journal of Wildlife Management 65:765-780.
SAS Institute. 2002. SAS/STAT User’s Guide, Version 9. SAS Institute, Cary, NC, USA.
Shaffer, T. L. 2004. A unified approach to analyzing nest success. Auk 121:526-540.
Stewart, R. E., and H. A. Kantrud. 1971. Classification of natural ponds and lakes in the
glaciated prairie region. U.S. Fish and Wildlife Service Resource Publication 92.
Stewart, R. E. 1975. Breeding birds of North Dakota. Tri-College Center for Environmental
Studies. Fargo, ND.

26
Figure 1. Distribution of target marsh bird species in 635 km2 hexagons in North Dakota. Gray (green) hexagons represent probable locations, and black (red) hexagons contain at least 1 location record for the species. Data source: North Dakota GAP Analysis Project.

27
Figure 2. Ecoregions of North Dakota sampled for presence of marsh birds.

28
Figure 3. Distribution of 4-square-mile sites at which wetland bird surveys were conducted during 2004-2007 in North Dakota.

29
Table 1. Focal marsh and shore bird species of North Dakota identified as conservation priorities in state and regional conservation plans.
Species Focal Species
ND Conservation
Priority1
Regional Conservation Vulnerability2
Regional Priority Score3
Pied-billed Grebe Yes N/A Low Risk N/A Horned Grebe Yes I High Concern N/A Eared Grebe Yes N/A Moderate Concern N/A Western Grebe Yes N/A High Concern N/A American White Pelican Yes I Moderate Concern N/A American Bittern Yes I High Concern N/A Least Bittern Yes N/A Moderate Concern N/A Sora Yes N/A Low Risk N/A Yellow Rail Yes I High Concern N/A King Rail Yes N/A High Concern N/A Virginia Rail Yes N/A Moderate Concern N/A Black Tern Yes I High Concern N/A Wilson's Phalarope Yes I N/A 4 (Species of Concern) Marbled Godwit Yes I N/A 4 (Species of Concern) Willet Yes I N/A 3 American Avocet Yes II N/A 4 (Species of Concern) Upland Sandpiper No I N/A N/A Grasshopper Sparrow No I N/A N/A Lark Bunting No I N/A N/A Northern Pintail No II N/A N/A Redhead No II N/A N/A Bobolink No II N/A N/A American Coot No N/A N/A N/A Common Yellowthroat No N/A N/A N/A Common Snipe No N/A N/A N/A Killdeer No N/A N/A N/A Marsh Wren No N/A N/A N/A
1 Priority species of the North Dakota Game & Fish Department’s Comprehensive Wildlife Conservation Strategy (Hagen et al. 2005).
2 Regional ranking in the Prairie & Parkland Regional Waterbird Conservation Plan (NAWCP 2003).
3 Regional priority in the Northern Plains/Prairie Potholes Regional Shorebird Conservation Plan (Beyersbergen et al. 2005).

30
Table 2. Survey type, regions, and sample sizes for focal species with adequate occurrences to model the characteristics of wetlands at or immediately surrounding wetlands that influence their wetland use in North Dakota.
Species Survey Regions Modeled Occurrences Wetlands
Surveyed black tern V a RR, DP, MC 100 1858
marbled godwit V DP, MC, NP 31 2183
willet V RR, DP, MC, NP 51 2488
Wilson's phalarope V DP, MC, NP 50 2183
grebe b V DP, MC 33 1553
redhead V DP, MC 45 1553
northern pintail V DP, MC, NP 36 2183
American bittern VCP c DP, OTHER d 47 1842
Virginia rail VCP RR, DP, MC 74 1321
sora VCP RR, DP, MC, NP 250 1842
American coot VCP DP, MC, NP 124 1628
upland sandpiper VCP DP, MC, NP 109 1628
common snipe VCP RR, DP, MC, NP 63 1842
killdeer VCP RR, DP, MC, NP 396 1842
marsh wren VCP RR, DP, MC 102 1321
common yellowthroat VCP RR, DP, MC, NP 209 1842
lark bunting VCP NP 58 521
bobolink VCP RR, DP, MC, NP 116 1842
grasshopper sparrow VCP RR, DP, MC, NP 166 1842 a Visual survey data b Eared and pied-billed grebes c Visual and call-play survey data d RR, MC, and NP combined

31
Table 3. Survey type, regions, and sample sizes for focal species with adequate occurrences to model the characteristics of landscapes that influence their wetland use in North Dakota.
Species Survey Regions Modeled Occurrences Wetlands
Surveyed black tern V a DP, MC 91 1420
willet V DP, MC 38 1420
redhead V DP, MC 42 1420
American bittern VCP d DP, MC 44 1014
sora VCP RR, DP, MC 202 1226
Virginia rail VCP RR, DP, MC 69 1226
American coot VCP DP, MC 102 1014
upland sandpiper VCP RR, DP, MC 36 1226
NP 53 388
common snipe VCP RR, DP, MC 45 1226
killdeer VCP RR, DP, MC 260 1226
NP 82 388
marsh wren VCP RR, DP, MC 93 1226
common yellowthroat VCP RR, DP, MC 154 1226
lark bunting VCP NP 51 388
bobolink VCP RR, DP, MC 63 1226
NP 35 388
grasshopper sparrow VCP RR, DP, MC 75 1226
NP 70 388 a Visual survey data b Eared and pied-billed grebes c RR, MC, and NP combined d Visual and call-play survey data

32
Table 4. Number of wetlands at which all bird species were detected during visual surveys (n=2560) in North Dakota, 2004-2007.
Code Species N(wetlands detected)
AGWT American Green-winged Teal 11 AMAV American Avocet 11 AMBI American Bittern 9 AMCO American Coot 92 AMCR American Crow 17 AMGO American Goldfinch 81 AMKE American Kestrel 2 AMRE American Redstart 2 AMRO American Robin 66 AMWI American Wigeon 29 AMWO American Woodcock 1 ATSP American Tree Sparrow 1 AWPE American White Pelican 15 BAIS Baird's Sparrow 2 BANS Bank Swallow 41 BAOR Baltimore Oriole 3 BARS Barn Swallow 262 BASA Baird's Sandpiper 1 BAWW Black-and-White Warbler 1 BBMA Black-billed Magpie 1 BCNH Black-crowned Night-Heron 19 BEKI Belted Kingfisher 3 BEVI Bell's Vireo 1 BHCO Brown-headed Cowbird 141 BHGR Black-headed Grosbeak 2 BLJA Blue Jay 1 BLTE Black Tern 100 BOBO Bobolink 102 BRBL Brewer's Blackbird 16 BRTH Brown Thrasher 17 BUFF Bufflehead 1 BWTE Blue-winged Teal 331 CAGO Canada Goose 17 CAGU California Gull 6 CANV Canvasback 21 CCLO Chestnut-collared Longspur 5 CCSP Clay-colored Sparrow 48 CEDW Cedar Waxwing 14 CHSP Chipping Sparrow 5 CHSW Chimney Swift 2 CLSW Cliff Swallow 93 COGR Common Grackle 198 COHA Cooper's Hawk 4 COME Common Merganser 1 CONI Common Nighthawk 39

33
COSN Common Snipe 35 COYE Common Yellowthroat 71 DCCO Double-crested Cormorant 9 DICK Dickcissel 17 DOWO Downy Woodpecker 6 EABL Eastern Bluebird 1 EAGR Eared Grebe 9 EAKI Eastern Kingbird 267 EATO Eastern Towhee 1 EUST European Starling 11 FISP Field Sparrow 12 FOSP Fox Sparrow 2 FOTE Forster's Tern 1 FRGU Franklin's Gull 13 GADW Gadwall 152 GBHE Great Blue Heron 13 GHOW Great Horned Owl 3 GRCA Gray Catbird 21 GREG Great Egret 2 GRSP Grasshopper Sparrow 76 GRYE Greater Yellowlegs 13 HASP Harris's Sparrow 1 HAWO Hairy Woodpecker 3 HESP Henslow's Sparrow 1 HOLA Horned Lark 27 HOME Hooded Merganser 1 HOSP House Sparrow 7 HOWR House Wren 10 HUPA Gray/Hungarian Partridge 3 KILL Killdeer 364 LARB Lark Bunting 46 LASP Lark Sparrow 12 LAZB Lazuli Bunting 4 LBDO Long-billed Dowitcher 5 LCSP Le Conte's Sparrow 17 LEFL Least Flycatcher 8 LESA Least Sandpiper 3 LESC Lesser Scaup 29 LEYE Lesser Yellowlegs 15 LOSH Loggerhead Shrike 5 MAGO Marbled Godwit 31 MALL Mallard 322 MAWR Marsh Wren 50 MERL Merlin 1 MOBL Mountain Bluebird 2 MODO Mourning Dove 241 NOHA Northern Harrier 13 NOPI Northern Pintail 37 NOWA Northern Waterthrush 1 NRWS Northern Rough-winged Swallow 17

34
NSHO Northern Shoveler 100 NSTS Nelson's Sharp-tailed Sparrow 12 OROR Orchard Oriole 8 PBGR Pied-billed Grebe 25 PEFA Peregrine Falcon 1 PIPL Piping Plover 1 PRFA Prairie Falcon 1 RBGR Rose-breasted Grosbeak 1 RBGU Ring-billed Gull 26 REDH Redhead 46 RLHA Rough-legged Hawk 1 RNDU Ring-necked Duck 5 RNGR Red-necked Grebe 1 RODO Rock Dove 4 RPHE Ring-necked Pheasant 65 RTHA Red-tailed Hawk 27 RUDU Ruddy Duck 59 RWBL Red-winged Blackbird 1176 SAPH Say's Phoebe 3 SAVS Savannah Sparrow 121 SBDO Short-billed Dowitcher 7 SEOW Short-eared Owl 1 SESA Semipalmated Sandpiper 3 SEWR Sedge Wren 10 SNEG Snowy Egret 1 SORA Sora 10 SOSA Solitary Sandpiper 4 SOSP Song Sparrow 106 SPSA Spotted Sandpiper 14 SPTO Spotted Towhee 8 STGR Sharp-tailed Grouse 10 SWHA Swainson's Hawk 5 SWSP Swamp Sparrow 17 TRES Tree Swallow 67 TURK Turkey 2 TUVU Turkey Vulture 1 UNK Unknown bird 31 UPSA Upland Sandpiper 68 VESP Vesper Sparrow 11 VIRA Virginia Rail 4 WAVI Warbling Vireo 1 WBNU White-breasted Nuthatch 3 WEBL Western Bluebird 1 WEKI Western Kingbird 59 WEME Western Meadowlark 212 WIFL Willow Flycatcher 4 WILL Willet 51 WIPH Wilson's Phalarope 50 WODU Wood Duck 17 WPWI Whip-poor-will 2

35
WRSA White-rumped Sandpiper 2 YBCH Yellow-breasted Chat 2 YHBL Yellow-headed Blackbird 196 YRWA Yellow-rumped Warbler 1 YSFL Yellow-shafted Flicker 20 YWAR Yellow Warbler 42

36
Table 5. Number of wetlands at which all bird species were detected during call-playback surveys (n=1856) in North Dakota, 2004-2007.
Code Species N(wetlands detected)
AMBI American Bittern 43 AMCO American Coot 58 AMCR American Crow 8 AMGO American Goldfinch 30 AMRO American Robin 31 AMWI American Wigeon 1 ATSP American Tree Sparrow 1 BAIS Baird's Sparrow 2 BARS Barn Swallow 4 BCCH Black-capped Chickadee 1 BCNH Black-crowned Night-Heron 2 BEKI Belted Kingfisher 2 BHCO Brown-headed Cowbird 20 BLJA Blue Jay 1 BLTE Black Tern 4 BOBO Bobolink 51 BRTH Brown Thrasher 3 BWTE Blue-winged Teal 1 CAGO Canada Goose 3 CCSP Clay-colored Sparrow 59 CHSP Chipping Sparrow 1 CLSW Cliff Swallow 1 COGR Common Grackle 11 CONI Common Nighthawk 13 COSN Common Snipe 30 COYE Common Yellowthroat 153 DICK Dickcissel 7 EAKI Eastern Kingbird 25 EATO Eastern Towhee 1 FISP Field Sparrow 38 GADW Gadwall 1 GBHE Great Blue Heron 2 GHOW Great Horned Owl 1 GRCA Gray Catbird 29 GRSP Grasshopper Sparrow 120 HAWO Hairy Woodpecker 1 HOLA Horned Lark 72 HOSP House Sparrow 1 HOWR House Wren 5 HUPA Gray/Hungarian Partridge 3 KILL Killdeer 106 LARB Lark Bunting 29 LASP Lark Sparrow 1 LAZB Lazuli Bunting 1 LCSP Le Conte's Sparrow 6

37
LEBI Least Bittern 7 LEFL Least Flycatcher 2 LESC Lesser Scaup 1 LEYE Lesser Yellowlegs 1 MAGO Marbled Godwit 3 MALL Mallard 17 MAWR Marsh Wren 63 MODO Mourning Dove 75 NOHA Northern Harrier 1 NOPI Northern Pintail 1 NRWS Northern Rough-winged Swallow 3 NSHO Northern Shoveler 1 NSTS Nelson's Sharp-tailed Sparrow 3 OROR Orchard Oriole 2 OVEN Ovenbird 1 PBGR Pied-billed Grebe 7 RBGU Ring-billed Gull 1 REVI Red-eyed Vireo 1 RPHE Ring-necked Pheasant 109 RTHA Red-tailed Hawk 4 RUGR Ruffed Grouse 2 RWBL Red-winged Blackbird 209 SAVS Savannah Sparrow 46 SEWR Sedge Wren 18 SORA Sora 249 SOSP Song Sparrow 70 SPSA Spotted Sandpiper 1 SPTO Spotted Towhee 3 SWHA Swainson's Hawk 1 SWSP Swamp Sparrow 1 TRES Tree Swallow 1 TURK Turkey 2 UNK Unknown bird 4 UPSA Upland Sandpiper 66 VESP Vesper Sparrow 8 VIRA Virginia Rail 74 WBNU White-breasted Nuthatch 1 WEKI Western Kingbird 4 WEME Western Meadowlark 204 WIFL Willow Flycatcher 9 WILL Willet 8 WIPH Wilson's Phalarope 2 YBCH Yellow-breasted Chat 2 YERA Yellow Rail 8 YHBL Yellow-headed Blackbird 46 YSFL Yellow-shafted Flicker 9 YWAR Yellow Warbler 24

38
Table 6. Number of wetlands at which all bird species were detected during transect surveys (n=962) in North Dakota, 2004-2007.
Code Species N(wetlands detected)
AGWT American Green-winged Teal 2 AMAV American Avocet 5 AMBI American Bittern 1 AMCO American Coot 14 AMGO American Goldfinch 7 AMRO American Robin 3 AMWI American Wigeon 3 AWPE American White Pelican 1 BARS Barn Swallow 8 BCNH Black-crowned Night-Heron 4 BHCO Brown-headed Cowbird 4 BLTE Black Tern 6 BOBO Bobolink 4 BRTH Brown Thrasher 4 BWTE Blue-winged Teal 57 CAGO Canada Goose 3 CAGU California Gull 1 CANV Canvasback 2 CCSP Clay-colored Sparrow 6 CLSW Cliff Swallow 1 COGR Common Grackle 4 CONI Common Nighthawk 2 COSN Common Snipe 12 COYE Common Yellowthroat 17 DICK Dickcissel 2 EAKI Eastern Kingbird 7 EUST European Starling 1 FISP Field Sparrow 1 GADW Gadwall 23 GRCA Gray Catbird 1 GRSP Grasshopper Sparrow 5 GRYE Greater Yellowlegs 2 HOLA Horned Lark 4 HOWR House Wren 1 HUPA Gray/Hungarian Partridge 1 KILL Killdeer 33 LARB Lark Bunting 2 LASP Lark Sparrow 2 LAZB Lazuli Bunting 1 LCSP Le Conte's Sparrow 2 LESA Least Sandpiper 1 LEYE Lesser Yellowlegs 1 MAGO Marbled Godwit 2 MALL Mallard 46 MAWR Marsh Wren 30

39
MODO Mourning Dove 14 NADA Notheing found 541 NOHA Northern Harrier 1 NOPI Northern Pintail 6 NSHO Northern Shoveler 6 NSTS Nelson's Sharp-tailed Sparrow 1 OROR Orchard Oriole 1 PBGR Pied-billed Grebe 1 REDH Redhead 3 RPHE Ring-necked Pheasant 8 RUDU Ruddy Duck 1 RWBL Red-winged Blackbird 131 SAVS Savannah Sparrow 9 SBDO Short-billed Dowitcher 1 SEOW Short-eared Owl 1 SEWR Sedge Wren 3 SORA Sora 24 SOSP Song Sparrow 14 SPTO Spotted Towhee 1 STGR Sharp-tailed Grouse 6 SWHA Swainson's Hawk 1 SWSP Swamp Sparrow 2 TRES Tree Swallow 5 UNK Unknown Bird 5 UPSA Upland Sandpiper 10 VESP Vesper Sparrow 1 VIRA Virginia Rail 9 WEKI Western Kingbird 5 WEME Western Meadowlark 10 WIFL Willow Flycatcher 2 WILL Willet 5 WIPH Wilson's Phalarope 11 YERA Yellow Rail 4 YHBL Yellow-headed Blackbird 30 YSFL Yellow-shafted Flicker 2 YWAR Yellow Warbler 6

40
Table 7. Number of wetlands at which all bird species were detected during visual and call-playback surveys combined (n=1856) in North Dakota, 2004-2007.
Code Species N(wetlands detected)
AGWT American Green-winged Teal 10 AMAV American Avocet 8 AMBI American Bittern 47 AMCO American Coot 127 AMCR American Crow 23 AMGO American Goldfinch 97 AMKE American Kestrel 2 AMRE American Redstart 2 AMRO American Robin 88 AMWI American Wigeon 27 AMWO American Woodcock 1 ATSP American Tree Sparrow 2 AWPE American White Pelican 14 BAIS Baird's Sparrow 3 BANS Bank Swallow 38 BAOR Baltimore Oriole 3 BARS Barn Swallow 256 BASA Baird's Sandpiper 1 BAWW Black-and-White Warbler 1 BBMA Black-billed Magpie 1 BCCH Black-capped Chickadee 1 BCNH Black-crowned Night-Heron 19 BEKI Belted Kingfisher 4 BEVI Bell's Vireo 1 BHCO Brown-headed Cowbird 135 BHGR Black-headed Grosbeak 2 BLJA Blue Jay 2 BLTE Black Tern 99 BOBO Bobolink 116 BRBL Brewer's Blackbird 10 BRTH Brown Thrasher 20 BUFF Bufflehead 1 BWTE Blue-winged Teal 300 CAGO Canada Goose 18 CAGU California Gull 5 CANV Canvasback 20 CCLO Chestnut-collared Longspur 5 CCSP Clay-colored Sparrow 88 CEDW Cedar Waxwing 13 CHSP Chipping Sparrow 6 CHSW Chimney Swift 2 CLSW Cliff Swallow 87 COGR Common Grackle 189 COHA Cooper's Hawk 4

41
COME Common Merganser 1 CONI Common Nighthawk 46 COSN Common Snipe 65 COYE Common Yellowthroat 209 DCCO Double-crested Cormorant 8 DICK Dickcissel 20 DOWO Downy Woodpecker 5 EABL Eastern Bluebird 1 EAGR Eared Grebe 9 EAKI Eastern Kingbird 260 EATO Eastern Towhee 2 EUST European Starling 11 FISP Field Sparrow 44 FOSP Fox Sparrow 2 FOTE Forster's Tern 1 FRGU Franklin's Gull 11 GADW Gadwall 139 GBHE Great Blue Heron 15 GHOW Great Horned Owl 4 GRCA Gray Catbird 46 GREG Great Egret 1 GRSP Grasshopper Sparrow 167 GRYE Greater Yellowlegs 12 HASP Harris's Sparrow 1 HAWO Hairy Woodpecker 4 HESP Henslow's Sparrow 1 HOLA Horned Lark 91 HOME Hooded Merganser 1 HOSP House Sparrow 8 HOWR House Wren 12 HUPA Gray/Hungarian Partridge 6 KILL Killdeer 399 LARB Lark Bunting 58 LASP Lark Sparrow 13 LAZB Lazuli Bunting 5 LBDO Long-billed Dowitcher 5 LCSP Le Conte's Sparrow 19 LEBI Least Bittern 7 LEFL Least Flycatcher 8 LESA Least Sandpiper 3 LESC Lesser Scaup 27 LEYE Lesser Yellowlegs 12 LOSH Loggerhead Shrike 5 MAGO Marbled Godwit 28 MALL Mallard 308 MAWR Marsh Wren 102 MERL Merlin 1 MOBL Mountain Bluebird 1 MODO Mourning Dove 278 NOHA Northern Harrier 11

42
NOPI Northern Pintail 36 NOWA Northern Waterthrush 1 NRWS Northern Rough-winged Swallow 20 NSHO Northern Shoveler 92 NSTS Nelson's Sharp-tailed Sparrow 12 OROR Orchard Oriole 10 OVEN Ovenbird 1 PBGR Pied-billed Grebe 30 PEFA Peregrine Falcon 1 PIPL Piping Plover 1 PRFA Prairie Falcon 1 RBGR Rose-breasted Grosbeak 0 RBGU Ring-billed Gull 24 REDH Redhead 46 REVI Red-eyed Vireo 1 RLHA Rough-legged Hawk 1 RNDU Ring-necked Duck 5 RNGR Red-necked Grebe 1 RODO Rock Dove 4 RPHE Ring-necked Pheasant 152 RTHA Red-tailed Hawk 28 RUDU Ruddy Duck 56 RUGR Ruffed Grouse 2 RWBL Red-winged Blackbird 1151 SAPH Say's Phoebe 3 SAVS Savannah Sparrow 112 SBDO Short-billed Dowitcher 7 SEOW Short-eared Owl 1 SESA Semipalmated Sandpiper 3 SEWR Sedge Wren 26 SNEG Snowy Egret 1 SORA Sora 254 SOSA Solitary Sandpiper 4 SOSP Song Sparrow 151 SPSA Spotted Sandpiper 14 SPTO Spotted Towhee 11 STGR Sharp-tailed Grouse 9 SWHA Swainson's Hawk 5 SWSP Swamp Sparrow 18 TRES Tree Swallow 65 TURK Turkey 4 TUVU Turkey Vulture 1 UNK Unknown bird 33 UPSA Upland Sandpiper 114 VESP Vesper Sparrow 18 VIRA Virginia Rail 76 WAVI Warbling Vireo 1 WBNU White-breasted Nuthatch 4 WEBL Western Bluebird 1 WEKI Western Kingbird 56

43
WEME Western Meadowlark 348 WIFL Willow Flycatcher 13 WILL Willet 51 WIPH Wilson's Phalarope 49 WODU Wood Duck 17 WPWI Whip-poor-will 2 WRSA White-rumped Sandpiper 2 YBCH Yellow-breasted Chat 4 YERA Yellow Rail 8 YHBL Yellow-headed Blackbird 215 YRWA Yellow-rumped Warbler 1 YSFL Yellow-shafted Flicker 25 YWAR Yellow Warbler 64

44
Appendix A
Distribution of Focal Species as Detected by Visual and Call-Playback Wetland Surveys in
North Dakota

45 American avocet

46 American bittern

47 American coot

48 American white pelican

49 Black tern

50 Bobolink

51 Common snipe

52 Common yellowthroat

53 Grebes (Pied-billed and Horned)

54 Grasshopper sparrow

55 Killdeer

56
Lark Bunting

57 Least bittern

58 Lesser scaup

59 Marbled godwit

60 Marsh wren

61 Northern pintail

62 Redhead

63 Sora

64 Upland sandpiper

65 Virginia rail

66 Willet

67 Wilson’s phalarope

68 Yellow rail

69 Species richness

ΔAIC W ΔAIC W ΔAIC W ΔAIC W
1 (Null) . 0.00 . 0.00 . 0.00 . 0.00
2 (Full) Ra, WFb, WF2, WCc, WTd, WMe, SAGf, SAWg, SWEh 5.41 0.04 4.61 0.09 2.12 0.15 4.07 0.11
3 R, WF, WF2, WC, WT, WM 8.08 0.01 6.44 0.04 2.82 0.11 5.28 0.06
4 R, WF, WF2, WC, WM, SWE 0.00 0.57 0.00 0.88 3.00 0.10 0.00 0.83
5 R, WF, WF2, SAG 5.74 0.03 . 0.00 4.02 0.06 . 0.00
6 R, WF, WC, WM, SAG, SWE 7.67 0.01 . 0.00 . 0.00 . 0.00
7 WF, WF2, WC, WT, WM, SAW . 0.00 . 0.00 0.00 0.44 . 0.00
8 R, WC, WM, SAG, SAW, SWE . 0.00 . 0.00 . 0.00 . 0.00
9 WC, SAG, SWE . 0.00 . 0.00 . 0.00 . 0.00
10 R, WF, WF2, WM, SAG, SWE 1.52 0.26 . 0.00 5.29 0.03 . 0.00
11 R, WF, WM, SWE 4.53 0.06 . 0.00 . 0.00 . 0.00
12 WF, WC, WM, SAG, SAW . 0.00 . 0.00 . 0.00 . 0.00
13 R, WF, WM, SAG . 0.00 . 0.00 . 0.00 . 0.00
14 R, WC . 0.00 . 0.00 . 0.00 . 0.00
15 WF . 0.00 . 0.00 . 0.00 . 0.00
16 WC, SAG . 0.00 . 0.00 . 0.00 . 0.00
17 R, SAG, SAW, SWE . 0.00 . 0.00 . 0.00 . 0.00
18 WC, WT, WM . 0.00 . 0.00 . 0.00 . 0.00
19 R, SWE 7.18 0.02 . 0.00 . 0.00 . 0.00
20 WF, WF2, WM . 0.00 . 0.00 2.92 0.10 . 0.00
f Percent of the areas surrounding the wetland covered with grassg Percent of the areas surrounding the wetland covered with woodlandh Percent of the areas surrounding the wetland covered with other wetlands
Table 8. Parameters, candidate models, delta AIC, and model weights (W) used for multimodel inference to examine the characteristics of wetlands or immediate adjacent lands that are important for predicting occurrence of American bittern (AMBI), sora (SORA), Virginia rail (VIRA), and American coot (AMCO) on wetlands throughout North Dakota. Delta AIC not reported for models with zero weight.
b Percent of wetland basin full of waterc Wetland vegetation cover classd Presence of trees within the wetland basine Wetland manipulation
a Region
VIRA AMCOModel Number Parameters
AMBI SORA
ΔAIC W ΔAIC W ΔAIC W ΔAIC W ΔAIC W
1 (Null) . 0.00 . 0.00 . 0.00 . 0.00 . 0.00
2 (Full) Rb, WFc, WF2, WCd, WTe, WMf, SAGg, SAWh, SWEi 0.00 0.73 0.84 0.26 1.84 0.08 6.91 0.03 4.61 0.06
3 R, WF, WF2, WC, WT, WM 9.42 0.01 2.47 0.11 2.65 0.05 . 0.00 . 0.00
4 R, WF, WF2, WC, WM, SWE . 0.00 . 0.00 . 0.00 . 0.00 1.09 0.33
5 R, WF, WF2, SAG 4.02 0.10 . 0.00 0.52 0.15 . 0.00 . 0.00
6 R, WF, WC, WM, SAG, SWE 7.28 0.02 . 0.00 4.98 0.02 . 0.00 . 0.00
7 WF, WF2, WC, WT, WM, SAW . 0.00 1.20 0.22 . 0.00 . 0.00 . 0.00
8 R, WC, WM, SAG, SAW, SWE 5.72 0.04 . 0.00 5.15 0.02 . 0.00 . 0.00
9 WC, SAG, SWE . 0.00 . 0.00 1.89 0.08 . 0.00 . 0.00
10 R, WF, WF2, WM, SAG, SWE 5.23 0.05 . 0.00 1.82 0.08 0.00 0.90 0.00 0.57
11 R, WF, WM, SWE . 0.00 . 0.00 . 0.00 . 0.00 4.91 0.05
12 WF, WC, WM, SAG, SAW . 0.00 0.00 0.39 1.65 0.09 . 0.00 . 0.00
13 R, WF, WM, SAG 5.53 0.05 . 0.00 0.20 0.18 . 0.00 . 0.00
14 R, WC . 0.00 . 0.00 6.37 0.01 . 0.00 . 0.00
15 WF . 0.00 . 0.00 . 0.00 . 0.00 . 0.00
16 WC, SAG . 0.00 . 0.00 0.00 0.20 . 0.00 . 0.00
17 R, SAG, SAW, SWE . 0.00 . 0.00 3.63 0.03 . 0.00 . 0.00
18 WC, WT, WM . 0.00 . 0.00 . 0.00 . 0.00 . 0.00
19 R, SWE . 0.00 . 0.00 6.06 0.01 . 0.00 . 0.00
20 WF, WF2, WM . 0.00 . 0.00 . 0.00 5.24 0.07 . 0.00
c Percent of wetland basin full of waterd Wetland vegetation cover classe Presence of trees within the wetland basin
Table 9. Parameters, candidate models, delta AIC, and model weights (W) used for multimodel inference to examine the characteristics of wetlands or immediate adjacent lands that are important for predicting occurrence of grasshopper sparrow (GRSPI), lark bunting (LARB), bobolink (BOBO), marsh wren (MAWR), and common yellowthroat (COYE) on wetlands throughout North Dakota. Delta AIC not reported for models with zero weight.
a Candidate models for lark sparrow do not contain region.
MAWR COYE
i Percent of the areas surrounding the wetland covered with other wetlands
GRSP LARBa BOBOModel Number Parameters
f Wetland manipulationg Percent of the areas surrounding the wetland covered with grassh Percent of the areas surrounding the wetland covered with woodland
b Region

ΔAIC W ΔAIC W ΔAIC W ΔAIC W ΔAIC W
1 (Null) . 0.00 . 0.00 . 0.00 . 0.00 . 0.00
2 (Full) Ra, WFb, WF2, WCc, WTd, WMe, SAGf, SAWg, SWEh 0.00 0.78 4.85 0.07 4.68 0.04 7.84 0.01 2.54 0.13
3 R, WF, WF2, WC, WT, WM . 0.00 . 0.00 1.28 0.22 6.63 0.02 0.39 0.38
4 R, WF, WF2, WC, WM, SWE 2.50 0.22 0.00 0.74 0.00 0.42 6.23 0.02 0.00 0.46
5 R, WF, WF2, SAG . 0.00 . 0.00 . 0.00 0.87 0.27 . 0.00
6 R, WF, WC, WM, SAG, SWE . 0.00 2.69 0.19 . 0.00 . 0.00 6.71 0.02
7 WF, WF2, WC, WT, WM, SAW . 0.00 . 0.00 0.65 0.30 1.04 0.25 6.25 0.02
8 R, WC, WM, SAG, SAW, SWE . 0.00 . 0.00 . 0.00 . 0.00 . 0.00
9 WC, SAG, SWE . 0.00 . 0.00 . 0.00 . 0.00 . 0.00
10 R, WF, WF2, WM, SAG, SWE . 0.00 . 0.00 . 0.00 5.85 0.02 . 0.00
11 R, WF, WM, SWE . 0.00 . 0.00 . 0.00 . 0.00 . 0.00
12 WF, WC, WM, SAG, SAW . 0.00 . 0.00 . 0.00 . 0.00 . 0.00
13 R, WF, WM, SAG . 0.00 . 0.00 . 0.00 . 0.00 . 0.00
14 R, WC . 0.00 . 0.00 . 0.00 . 0.00 . 0.00
15 WF . 0.00 . 0.00 . 0.00 . 0.00 . 0.00
16 WC, SAG . 0.00 . 0.00 . 0.00 . 0.00 . 0.00
17 R, SAG, SAW, SWE . 0.00 . 0.00 . 0.00 . 0.00 . 0.00
18 WC, WT, WM . 0.00 . 0.00 . 0.00 . 0.00 . 0.00
19 R, SWE . 0.00 . 0.00 . 0.00 . 0.00 . 0.00
20 WF, WF2, WM . 0.00 . 0.00 8.23 0.01 0.00 0.42 . 0.00
c Wetland vegetation cover classd Presence of trees within the wetland basin
Table 10. Parameters, candidate models, delta AIC, and model weights (W) used for multimodel inference to examine the characteristics of wetlands or immediate adjacent lands that are important for predicting species richness (RICH) and occurrence of black tern (BLTE), grebes (pied-billed grebe and eared grebe combined; GREB), northern pintail (NOPI), and redhead (REDH) on wetlands throughout North Dakota. Delta AIC not reported for models with zero weight.
RICH BLTE
a Region
h Percent of the areas surrounding the wetland covered with other wetlands
NOPI REDHGREBModel Number Parameters
e Wetland manipulationf Percent of the areas surrounding the wetland covered with grassg Percent of the areas surrounding the wetland covered with woodland
b Percent of wetland basin full of water

ΔAIC W ΔAIC W ΔAIC W ΔAIC W ΔAIC W ΔAIC W
1 (Null) . 0.00 . 0.00 . 0.00 . 0.00 . 0.00 . 0.00
2 (Full) Ra, WFb, WF2, WCc, WTd, WMe, SAGf, SAWg, SWEh 3.95 0.04 1.80 0.29 7.67 0.01 4.86 0.07 3.71 0.11 3.68 0.14
3 R, WF, WF2, WC, WT, WM 1.38 0.14 . 0.00 . 0.00 0.00 0.84 7.01 0.02 0.00 0.86
4 R, WF, WF2, WC, WM, SWE 2.76 0.07 . 0.00 6.04 0.02 9.38 0.01 . 0.00 . 0.00
5 R, WF, WF2, SAG 4.96 0.02 . 0.00 . 0.00 10.20 0.01 0.00 0.72 . 0.00
6 R, WF, WC, WM, SAG, SWE 2.79 0.07 . 0.00 8.85 0.00 . 0.00 . 0.00 . 0.00
7 WF, WF2, WC, WT, WM, SAW . 0.00 . 0.00 . 0.00 . 0.00 . 0.00 . 0.00
8 R, WC, WM, SAG, SAW, SWE 3.53 0.05 0.00 0.71 5.74 0.02 7.07 0.02 . 0.00 . 0.00
9 WC, SAG, SWE . 0.00 . 0.00 1.87 0.15 . 0.00 . 0.00 . 0.00
10 R, WF, WF2, WM, SAG, SWE 6.69 0.01 . 0.00 6.40 0.02 6.41 0.03 3.25 0.14 . 0.00
11 R, WF, WM, SWE 2.77 0.07 . 0.00 4.53 0.04 . 0.00 . 0.00 . 0.00
12 WF, WC, WM, SAG, SAW . 0.00 . 0.00 . 0.00 . 0.00 . 0.00 . 0.00
13 R, WF, WM, SAG 3.74 0.04 . 0.00 . 0.00 10.29 0.00 . 0.00 . 0.00
14 R, WC 0.00 0.29 . 0.00 . 0.00 9.65 0.01 . 0.00 . 0.00
15 WF . 0.00 . 0.00 8.56 0.01 . 0.00 . 0.00 . 0.00
16 WC, SAG . 0.00 . 0.00 . 0.00 . 0.00 . 0.00 . 0.00
17 R, SAG, SAW, SWE 3.84 0.04 . 0.00 0.00 0.37 . 0.00 . 0.00 . 0.00
18 WC, WT, WM . 0.00 . 0.00 . 0.00 . 0.00 . 0.00 . 0.00
19 R, SWE 1.32 0.15 . 0.00 0.11 0.35 . 0.00 . 0.00 . 0.00
20 WF, WF2, WM . 0.00 . 0.00 . 0.00 . 0.00 . 0.00 . 0.00a Regionb Percent of wetland basin full of waterc Wetland vegetation cover class
Table 11. Parameters, candidate models, delta AIC, and model weights (W) used for multimodel inference to examine the characteristics of wetlands or immediate adjacent lands that are important for predicting occurrence of upland sandpiper (UPSA), killdeer (KILL), common snipe (COSN), marbled godwit (MAGO), willet (WILL), and Wilson's phalarope (WIPH) on wetlands throughout North Dakota. Delta AIC not reported for models with zero weight.
WILL WIPHMAGO
g Percent of the areas surrounding the wetland covered with woodland
COSN
h Percent of the areas surrounding the wetland covered with other wetlands
UPSA KILLModel Number Parameters
d Presence of trees within the wetland basine Wetland manipulationf Percent of the areas surrounding the wetland covered with grass

ΔAIC W ΔAIC W ΔAIC W ΔAIC W ΔAIC W ΔAIC W ΔAIC W
1 (Null) . 0.00 . 0.00 . 0.00 . 0.00 . 0.00 . 0.00
2 (FULL1) Ra, LWETb, LSTc, LGd, LWOe 0.70 0.29 1.89 0.19 4.35 0.02 1.99 0.13 3.13 0.05 2.80 0.09 3.82 0.06
3 (FULL2) R, LWWf, LST, LG, LWO 3.07 0.09 1.21 0.26 4.78 0.02 0.00 0.35 3.17 0.05 0.90 0.24 8.80 0.01
4 R, LST, LG, LWO 4.75 0.04 0.00 0.48 3.26 0.04 0.46 0.28 3.43 0.04 0.81 0.25 7.42 0.01
5 LWET, LST, LG, LWO . 0.00 . 0.00 . 0.00 . 0.00 . 0.00 . 0.00 . 0.00
6 LWW, LST, LG, LWO . 0.00 . 0.00 . 0.00 . 0.00 . 0.00 . 0.00 . 0.00
7 LWET, LST, LG . 0.00 . 0.00 . 0.00 . 0.00 . 0.00 . 0.00 . 0.00
8 LWW, LST, LG . 0.00 . 0.00 . 0.00 . 0.00 . 0.00 . 0.00 . 0.00
9 LWET, LG, LWO . 0.00 . 0.00 . 0.00 . 0.00 . 0.00 . 0.00 . 0.00
10 LWW, LG, LWO . 0.00 . 0.00 . 0.00 . 0.00 . 0.00 . 0.00 . 0.00
11 R, LWET, LG 7.61 0.01 . 0.00 0.85 0.13 . 0.00 1.55 0.11 . 0.00 0.89 0.27
12 R, LWW, LG . 0.00 . 0.00 1.37 0.10 5.29 0.02 1.71 0.10 . 0.00 4.92 0.04
13 R, LWET, LST 0.00 0.42 7.83 0.01 0.98 0.12 . 0.00 1.19 0.13 . 0.00 0.00 0.42
14 R, LWW, LST 2.46 0.12 6.75 0.02 1.45 0.09 7.71 0.01 1.42 0.12 6.35 0.02 5.37 0.03
15 R, LST 5.43 0.03 6.66 0.02 0.00 0.19 . 0.00 2.69 0.06 7.23 0.01 4.34 0.05
16 R, LWO . 0.00 7.25 0.01 0.55 0.15 1.04 0.21 0.00 0.24 0.00 0.37 4.09 0.05
17 R, LG . 0.00 . 0.00 0.59 0.14 8.20 0.01 1.79 0.10 8.02 0.01 3.58 0.07
18 LWET . 0.00 . 0.00 . 0.00 . 0.00 . 0.00 . 0.00 . 0.00
19 LWW . 0.00 . 0.00 . 0.00 . 0.00 . 0.00 . 0.00 . 0.00
20 LG . 0.00 . 0.00 . 0.00 . 0.00 . 0.00 . 0.00 . 0.00
e Percent of the landscape covered with woodlandf Percent of the landscape covered with open water
SORA
a Regionb Percent of the area of wetlands that are covered with waterc Percent of the wetlands that are either seasonal or temporaryd Percent of the landscape covered with grass
Model Number Parameters
Table 12. Parameters, candidate models, delta AIC, and model weights (W) used for multimodel inference to examine the characteristics of landscapes that are important for predicting species richness (RICH) and occurrence of black terns (BLTE), redhead (REDU), American bittern (AMBI), sora (SORA), Virginia Rail (VIRA), and American coot (AMCO) at 4-square-mile sites east of the Missouri River in North Dakota. Delta AIC not reported for models with zero weight.
VIRA AMCORICH BLTE REDH AMBI

ΔAIC W ΔAIC W ΔAIC W ΔAIC W
1 (Null) . 0.00 0.00 0.21 6.79 0.01 . 0.00
2 (FULL1) Ra, LWETb, LSTc, LGd, LWOe 0.00 0.41 6.84 0.01 2.21 0.07 5.33 0.02
3 (FULL2) R, LWWf, LST, LG, LWO 1.53 0.19 6.14 0.01 0.55 0.16 5.35 0.02
4 R, LST, LG, LWO 7.02 0.01 5.16 0.02 1.08 0.12 3.40 0.05
5 LWET, LST, LG, LWO 1.66 0.18 5.29 0.01 . 0.00 1.90 0.11
6 LWW, LST, LG, LWO 3.03 0.09 4.84 0.02 6.55 0.01 1.92 0.11
7 LWET, LST, LG . 0.00 4.56 0.02 6.38 0.01 0.00 0.28
8 LWW, LST, LG . 0.00 4.04 0.03 4.71 0.02 0.08 0.27
9 LWET, LG, LWO . 0.00 3.57 0.04 . 0.00 . 0.00
10 LWW, LG, LWO . 0.00 3.00 0.05 . 0.00 . 0.00
11 R, LWET, LG 7.97 0.01 5.24 0.02 2.00 0.08 . 0.00
12 R, LWW, LG 8.94 0.00 4.41 0.02 1.57 0.10 . 0.00
13 R, LWET, LST 4.28 0.05 5.36 0.01 3.19 0.04 4.21 0.03
14 R, LWW, LST 5.56 0.03 4.57 0.02 2.01 0.08 4.48 0.03
15 R, LST 8.97 0.00 3.96 0.03 2.75 0.05 2.48 0.08
16 R, LWO 6.82 0.01 2.91 0.05 7.39 0.01 . 0.00
17 R, LG 8.84 0.00 4.55 0.02 0.00 0.21 . 0.00
18 LWET . 0.00 0.71 0.15 . 0.00 . 0.00
19 LWW . 0.00 0.15 0.19 . 0.00 . 0.00
20 LG . 0.00 1.99 0.08 5.73 0.01 . 0.00
Table 13. Parameters, candidate models, delta AIC, and model weights (W) used for multimodel inference to examine the characteristics of landscapes that are important for predicting occurrence of grasshopper sparrow (GRSP), bobolink (BOBO), marsh wren (MAWR), and common yellowthroat (COYE) at 4-square-mile sites east of the Missouri River in North Dakota. Delta AIC not reported for models with zero weight.
a Regionb Percent of the area of wetlands that are covered with water
GRSP BOBO MAWRModel Number Parameters
c Percent of the wetlands that are either seasonal or temporaryd Percent of the landscape covered with grasse Percent of the landscape covered with woodlandf Percent of the landscape covered with open water
COYE

ΔAIC W ΔAIC W ΔAIC W ΔAIC W
1 (Null) 0.46 0.10 7.61 0.01 . 0.00 4.36 0.04
2 (FULL1) Ra, LWETb, LSTc, LGd, LWOe 3.91 0.02 8.07 0.01 3.72 0.05 4.88 0.03
3 (FULL2) R, LWWf, LST, LG, LWO 3.45 0.02 3.67 0.05 0.11 0.31 4.49 0.04
4 R, LST, LG, LWO 2.44 0.04 8.30 0.01 2.87 0.08 2.89 0.08
5 LWET, LST, LG, LWO 4.58 0.01 4.74 0.03 4.61 0.03 . 0.00
6 LWW, LST, LG, LWO 3.28 0.02 0.00 0.33 1.98 0.12 . 0.00
7 LWET, LST, LG 4.86 0.01 6.70 0.01 . 0.00 . 0.00
8 LWW, LST, LG 4.11 0.02 0.76 0.23 . 0.00 . 0.00
9 LWET, LG, LWO 3.03 0.03 4.61 0.03 2.69 0.08 8.37 0.01
10 LWW, LG, LWO 1.34 0.06 1.61 0.15 0.00 0.32 8.34 0.01
11 R, LWET, LG 1.79 0.05 . 0.00 . 0.00 3.79 0.05
12 R, LWW, LG 0.93 0.08 6.90 0.01 . 0.00 4.38 0.04
13 R, LWET, LST 2.12 0.04 8.46 0.00 . 0.00 3.82 0.05
14 R, LWW, LST 2.45 0.04 4.02 0.04 . 0.00 3.94 0.05
15 R, LST 1.04 0.07 . 0.00 . 0.00 2.06 0.12
16 R, LWO 0.56 0.09 5.84 0.02 . 0.00 0.00 0.34
17 R, LG 0.00 0.12 . 0.00 . 0.00 2.39 0.10
18 LWET 2.43 0.04 . 0.00 . 0.00 6.11 0.02
19 LWW 0.65 0.09 4.59 0.03 . 0.00 6.27 0.01
20 LG 1.67 0.05 6.46 0.01 . 0.00 6.18 0.02
e Percent of the landscape covered with woodlandf Percent of the landscape covered with open water
a Regionb Percent of the area of wetlands that are covered with waterc Percent of the wetlands that are either seasonal or temporaryd Percent of the landscape covered with grass
Table 14. Parameters, candidate models, delta AIC, and model weights (W) used for multimodel inference to examine the characteristics of landscapes that are important for predicting occurrence of willet (WILL), upland sandpiper (UPSA), killdeer (KILL), and common snipe (COSN) at 4-square-mile sites east of the Missouri River in North Dakota. Delta AIC not reported for models with zero weight.
Model Number Parameters
WILL UPSA KILL COSN

ΔAIC W ΔAIC W ΔAIC W ΔAIC W ΔAIC W ΔAIC W ΔAIC W
1 (Null) . 0.00 0.00 0.23 1.89 0.07 . 0.00 0.00 0.16 7.17 0.01 . 0.00
2 (Full) LWWa, UCWb, LGc, LWOd 3.61 0.07 6.61 0.01 4.21 0.02 2.00 0.14 4.93 0.01 1.99 0.13 1.83 0.07
3 UCW, LG, LWO . 0.00 5.48 0.02 4.44 0.02 0.00 0.37 3.78 0.02 8.04 0.01 0.23 0.16
4 LWW, LG, LWO 7.22 0.01 5.11 0.02 2.70 0.05 . 0.00 3.00 0.04 2.09 0.12 4.88 0.02
5 LWW, UCW, LWO 1.99 0.16 4.75 0.02 2.62 0.05 2.11 0.13 4.21 0.02 0.00 0.35 2.07 0.06
6 LWW, UCW, LG 1.61 0.19 4.63 0.02 3.38 0.03 . 0.00 3.10 0.03 7.22 0.01 1.96 0.07
7 LG, LWO . 0.00 3.88 0.03 2.70 0.05 . 0.00 1.81 0.06 6.88 0.01 3.05 0.04
8 LWW, UCW 0.00 0.42 2.77 0.06 1.76 0.08 . 0.00 2.44 0.05 5.22 0.03 1.81 0.07
9 LWW, LWO 5.38 0.03 3.12 0.05 0.85 0.12 . 0.00 2.82 0.04 0.74 0.24 . 0.00
10 UCW, LG . 0.00 3.64 0.04 5.67 0.01 . 0.00 2.15 0.05 . 0.00 0.10 0.17
11 UCW, LWO . 0.00 3.61 0.04 2.75 0.05 0.11 0.35 3.07 0.03 6.21 0.02 0.54 0.13
12 LWW, LG 5.29 0.03 3.12 0.05 1.87 0.07 . 0.00 1.15 0.09 7.34 0.01 5.40 0.01
13 LWW 3.44 0.08 1.13 0.13 0.00 0.19 . 0.00 1.02 0.10 5.86 0.02 . 0.00
14 UCW 8.44 0.01 1.75 0.10 3.86 0.03 . 0.00 1.56 0.07 7.39 0.01 0.00 0.17
15 LG . 0.00 1.99 0.09 3.78 0.03 . 0.00 0.17 0.15 8.50 0.01 3.43 0.03
16 LWO . 0.00 1.89 0.09 0.85 0.12 . 0.00 1.58 0.07 5.62 0.02 . 0.00
d Percent of the landscape covered by woodland
RICH LARB GRSP COYEBOBOModel Number Parameters
UPSA KILL
Table 15. Parameters, candidate models, delta AIC, and model weights (W) used for multimodel inference to examine the characteristics of landscapes that are important for predicting species richness (RICH) and occurrence of upland sandpipers (UPSA), killdeer (kill), lark bunting (LARB), grasshopper sparrow (GRSP), bobolink (BOBO), and common yellowthroat (COYE) at 4-square-mile sites in the northwestern Great Plains of North Dakota. Delta AIC not reported for models with zero weight.
a Percent of the landscape covered with open waterb Percent of the landscape covered with unclassified wet areasc Percent of the landscape covered by grass