final report june 2011 - nutrition portal
TRANSCRIPT
ATHROPOMETRIC AND MORTALITY SURVEY
LARGER KILIFI DISTRICT,
KILIFI COUNTY, COAST PROVINCE,
KENYA
FINAL REPORT
JUNE 2011
Onesmus Muinde
Nutrition Consultant
Survey done by World Vision Kenya with collaboration of Ministry of Health and
ARIDLANDS
1
ACKNOWLEDGMENTS
We would like to acknowledge the following:
� UNICEF for funding the survey report
� World Vision Kenya and Ministry of Health Kilifi for proving transport and logistical support
� Provincial administration in Larger Kilifi district , for their guidance to ensure smooth flow of
the survey,
� Ministries of Medical services and Public Health and ARID lands for their participation in the
survey.
� The local surveyors for their resolute efforts, in contributing towards fulfilment of the
survey objectives,
� Final but not least, appreciation goes to caretakers, local authorities, and community leaders
without whose cooperation and assistance the survey objectives could not have been
realized.
2
Table of content
ACKNOWLEDGMENTS .................................................................................................................. 1
Table of content ................................................................................................................................ 2
List of Tables ..................................................................................................................................... 4
List of Figures .................................................................................................................................... 4
EXECUTIVE SUMMARY ................................................................................................................... 5
2.0 Introduction .............................................................................................................................. 10
3.1 METHODOLOGY..................................................................................................................... 12
3.1 Type of Survey and Sample Size ................................................................................................. 12
3.2 Sample Size Calculation ............................................................................................................. 13
3.3 Data Collection ......................................................................................................................... 13
3.4 Indicators, Guidelines, and Formula’s Used ...................................................................... 14
3.4. 1 Acute Malnutrition ................................................................................................................. 14
3.4.2 Stunting ................................................................................................................................... 15
3.4.3 Underweight ........................................................................................................................... 15
3.4.4 Mortality ................................................................................................................................. 15
3.4.5 IYC Indicators ......................................................................................................................... 16
3.4.5 Health, food security and water and sanitation data ................................................................ 17
3.5 Data quality control assurance ................................................................................................... 17
3.6 Field Work ................................................................................................................................ 18
3.7 Data Analysis ............................................................................................................................. 18
3.8 Challenges faced during survey .................................................................................................. 18
4.0 RESULTS AND DISCUSSION ................................................................................................... 18
4.1 Health and nutrition status ........................................................................................................ 18
4.1.2 Distribution of Acute malnutrition by Z-scores ...................................................................... 19
4.1.3 Distribution of acute malnutrition in percentage of median ..................................................... 20
4.1.4. Distribution of Underweight in Z scores Larger Kilifi June, 2 2011 (WHO reference .......... 21

3
4.1.5 Distribution of stunting in Z scores larger Kilifi June 2011 (WHO reference) ...................... 22
4.1.6 Distribution of Malnutrition according to WHZ, WAZ and HAZ in all Larger Kilifi divisions,
June 2011 ........................................................................................................................................ 22
.. 22
4.1.7 Risk of mortality: children MUAC and mothers/care takers MUAC ........................................ 22
4.1.8 Vaccination coverage and Vitamin A supplementation ............................................................. 23
4.19 Mortality ................................................................................................................................. 24
4.1.10 Breastfeeding and complementary feeding ............................................................................. 24
4.1.11 Child morbidity, de-worming and treatment seeking ............................................................. 25
4.1.12 Mosquito net coverage.......................................................................................................... 25
4.2 Water and Sanitation ................................................................................................................. 26
4.2.1 Water source and use ............................................................................................................ 26
4.2.2 Hand washing practice and Latrine ownership. ........................................................................ 26
4.3 Food security ............................................................................................................................. 26
5.0 DISCUSSION AND RECOMMENDATIONS ............................................................................ 28
5.1 Health and Nutrition ................................................................................................................. 28
5.2 Water and Sanitation ................................................................................................................. 29
5.3 Food Security ............................................................................................................................ 30
6.0 ANNEXES ................................................................................................................................. 31
Annex 1: Assignment of clusters Larger Kilifi, June 2011 ................................................................ 31
Annex 2: Anthropometric and Health survey data form ................................................................ 35

4
Annex 3: Calendar of events ........................................................................................................... 36
Annex 4: Household mortality form ................................................................................................ 37
Annex 5. Infant and young Child feeding questionnaire ................................................................ 38
Annex 6: Water and Sanitation questionnaire .............................................................................. 39
Annex 6: Food security questionnaire ........................................................................................... 40
Annex 7. Plausibility checks .......................................................................................................... 42
List of Tables
Table 1. Distribution of age and sex Larger Kilifi district June 2011 ................................................ 19
Table 2. Weight for height distribution by age Larger Kilifi district in Z-scores (WHO reference) .. 19
Table 3. Weight for height versus Oedema Larger Kilifi district in Z scores (WHO reference) ....... 20
Table 4 Global and Severe Acute Malnutrition in Z score Larger Kilifi October 2010 ..................... 20
Table 5: Distribution of Weight/Height by age in percentage of median (NCHS) ............................. 20
Table 6: Global and Severe Acute Malnutrition in percentage of Medium Larger Kilifi June 2011 ..... 21
Table 7: Prevalence of underweight based on Weight-for age Z scores .......................................... 21
Table 8: Prevalence of stunting by age based on height-for-age Z scores ...................................... 22
Table 9: Child MUAC distribution Larger Kilifi June 2011 ................................................................ 22
Table 10: Measles vaccination coverage Larger Kilifi district June 2011 ............................................ 23
Table 11 Vitamin A coverage ........................................................................................................... 23
Table 12: DPT 3 coverage ............................................................................................................... 23
Table 13: Mortality results ............................................................................................................... 24
Table 14: Disease patterns in the last two weeks before the survey Larger Kilifi June 2011 ............. 25
List of Figures
Figure 1: Distribution by Age and sex Larger Kilifi June 2011 ........................................................... 19
Figure 2: Weight for height distribution Larger Kilifi district June 2011............................................ 20
Figure 3: Distribution of malnutrition in Larger Kilifi, June 2011 ................................................ 22

5
Figure 4: Breast feeding Indicators Larger Kilifi, June 2011 ............................................................... 24
Figure 5: Introduction of complementary foods in larger Kilifi June 2011 ......................................... 24
Figure 6: Treatment of water at household level before use Larger Kilifi district, June 2011 ............ 26
Figure 7: Livestock Kept Larger Kilifi, June 2011 ........................................................................ 26
Figure 8: Meals Consumption Larger Kilifi, June 2011 .................................................................. 27
Figure 9: Household food diversity Larger Kilifi, June 2011 ......................................................... 28
EXECUTIVE SUMMARY
Larger Kilifi District is in Coast province. It lies between 3˚ 16΄ south and 4˚ south, and 39˚ 05΄ east
and 40˚ east. The shoreline is 144 Km from Mtwapa Creek to Mida Creek. The district borders
Taita and Taveta districts to the west, Malindi and Magarini districts to the northwest, Kisauni,
Kilindini and Kinango Districts to the south. The district covers an area of 4,779.2 Km² including the
Arabuko Sokoke forest of 189 Km. The population is estimated to be 831,108 people according to
2009 census.
The District is divided into seven administrative divisions namely Kaloleni, Bahari, Chonyi, Kikambala,
Ganze, Vitengeni and Bamba. Kaloleni and Ganze divisions have since been made into fully fledged
Districts. It has thirty six Locations and one hundred and seven sub locations. Bamba Division is the
largest with an area of 1,743.5 Km² sub divided into five locations and thirteen sub locations
followed by Kaloleni Division with an area of 909 Km² while Chonyi Division is the smallest with
area of 202.2 Km² with four Locations and nine sub locations as indicated in the above table.
Politically the district is divided into three constituencies namely Kaloleni comprising of Kaloleni
Division, Ganze comprising of Ganze, Vitengeni and Bamba Divisions and Bahari comprising of
Bahari, Kikambala and Chonyi Divisions. The district is divided into three local authorities namely
County Council of Kilifi which has twenty six electoral wards, Kilifi Town council with eight electoral
wards and town council of Mariakani with seven electoral wards.
This area has for a long time experienced extreme food shortages as a result of poor rainfall and
increasing food prices. This has led to high malnutrition rates, including acute malnutrition among
children. Over the past four growing seasons (from late 2008), poor rainfall has resulted in crop
failure and a 60-80 percent loss of maize crops in Kilifi. This has affected household food security,
and has contributed to high numbers of children who are currently reported by health facilities in
Kilifi as having moderate and severe acute malnutrition. In the recently conducted Short Rains
Assessments, Kilifi district was classified as borderline food insecure and currently one of the
districts under watch following the La Nina phenomenon. The districts are predominantly agro
pastoralist and marginal mixed livelihood zones and thus highly vulnerable to food insecurity during
the drought seasons.

6
In order to guide programming in these two districts, a nutrition survey is in need. The survey will
provide not only nutrition information, but also those related to water and Sanitation and Hygiene
(WASH), health and food security.
Objectives of the survey
1. Assess the prevalence of acute and chronic malnutrition in children aged 6-59 months. 2. Assess the prevalence of malnutrition in pregnant women and mothers 3. Assess Infant and young feeding practices. 4. Estimate coverage for SFP, OTP, measles and DPT 3 vaccination and vitamin A. 5. Estimate morbidity rates in children 6-59 months 6. Estimate crude and under five mortality rate. 7. Assess Household food security levels/situation
Methodology
Standardized Method for Relief and Transition (SMART) was used for planning, training and data
collection for the nutrition survey. The Survey enumerators were trained for 4 days, standardization
test was done to select the data recorders and pilot was done to make sure that enumerators are
equipped with the necessary skills for data collection.
Using prevalence of 7.5 %, precision of 3 and design effect of 2, a sample size of 592 children was
obtained. In the mortality session, an estimated prevalence of 0.3, a desired precision of 0.3 and a
design effect of 2 resulted in a sample size 2,846 with a recall period of 97 days. A total of 577
households were sampled for the survey and a total of 40 clusters were selected for the survey.
At the second stage, a selection of the households to be visited within each cluster was done. Simple
random method was used to select the households, the village elders gave the list of the households
in a given village, using table of random numbers the households were selected. In cases where the
villages had huge number of households, segmentation was done; the population was subdivided in to
equal segments and one segment was selected using table of random numbers, the household were
then listed, and the required households selected from the list by simple random method.
In each selected household, all children aged 6-59 months were included. If there was more than one
wife (care taker) in the household1, each wife was considered separately regardless of whether they
were cooking together. If there were no children in a household, the house remained a part of the
“sample” that contributed zero children to the nutritional part of the survey. The household was
recorded on the nutritional data sheet as having no eligible children.
1 A household refers to a caretaker and his/her children

7
Nutrition, mortality and vaccination coverage, IYCF and Water and Sanitation results
A total of 598 children were measured all the records were included in the analysis using WHO and
NCHS references.
Anthropometric and Mortality data results
Child Nutrition Status W/H (WHO)- Z scores (598)
Global Acute Malnutrition (GAM) (<-2 z-score and/or oedema)
4.0% [2.8- 5.8]
Severe Acute Malnutrition (SAM) (<-3 z-score and/or oedema)
0.7% [0.3- 1.7]
Child Nutrition status W/H (NCHS)- Z-scores(598)
Global Acute Malnutrition (GAM) (<-2 z-score and/or oedema)
4.2% [3.0- 5.8]
Severe Acute Malnutrition (SAM) (<-3 z-score and/or oedema)
0.5% [0.2- 1.5]
Child Nutrition status W/H (NCHS)- percentage of the
median (598)
Prevalence of global acute malnutrition (<80% and/or oedema)
2.2 % [1.3 - 3.6]
Prevalence of severe acute malnutrition (<70% and/or oedema)
1.7 %[1.0 - 2.9]
Child Nutrition Status H/A (WHO)- Z scores (598)
Prevalence of stunting (<-2 z-score)
48.8% [43.7-53.9]
Prevalence of severe stunting (<-3 z-score)
19.6% [16.4-23.2]
Child Nutrition Status H/A (NCHS)- Z scores (598)
Prevalence of stunting (<-2 z-score)
39.1% [34.3-44.2]
Prevalence of severe stunting (<-3 z-score)
14.2% [11.7-17.1]
Child Nutrition Status W/A (WHO)- Z scores (595)
Prevalence of underweight (<-2 z-score)
21.3% [17.8-25.3]
Prevalence of severe underweight (<-3 z-score)
5.0% [3.4- 7.4]
Child Nutrition Status W/A (NCHS)- Z scores (595)
Prevalence of underweight (<-2 z-score)
27.2% [23.3-31.6]
Prevalence of severe underweight (<-3 z-score)
4.4% [ 2.9- 6.5]
Mortality Crude Death rate/10,000/day 0.38 [0.22-0.66] 0-5 Death rate/10,000/day 0.61[0.18-2.04]
Child MUAC (598) SAM (<115 mm) GAM (<125mm)
0.7% 4.0%

8
2 As per Indicators for assessing infant and young child feeding practices Part 3 Country profiles
At risk ( >125-<134 mm) 6.7%
Maternal nutrition status (lactating and pregnant mothers)
Malnourished < 21.0 cm
4.1%
Vaccination coverage, Vitamin A and Iron supplementation
Measles coverage ≥ 9 months
(563)
Card According to mother
Not Immunized
80.1% 9.9% 9.9%
DPT3 (594)
Card According to mother
Not immunized
86.2%
9.3%
4.5%
Vitamin A coverage (last 6 months) (597)
Received Not received
55.3%
44.7%
Vitamin A coverage (6-11) Last 6 months (71)
Received Not received
80.3%
19.7%
Vitamin A coverage (12-59) Last 6 months (526)
Received Not received
51.9%
48.1%
Mother Iron supplementation (last
pregnancy)
Yes No
Don’t Know
72.8%
23.9%
3.3%
Morbidity for the last 2 weeks
Child Illness in the last 2 weeks
Yes No
57.3% 42.7%
Type of Illness
Fever Cough
Watery Diarrhoea Blood Diarrhoea
Others (vomiting, skin infection, eye problem, wound, stomach ache, ring
worms )
37.0% 35.1% 15.7% 1.7% 10.5%
De-Worming Yes No
Don’t Know
57.2% 41.6% 1.2%
Treatment Sought for diarrhoea
ORS Homemade sugar salt solution Another homemade liquid
Zinc Other drugs
nothing
56.8% 6.2% 2.5% 2.5% 13.6% 18.5%
Child Slept under mosquito net last night
Yes No
71.8% 28.2%
Infant and young child feeding practice2
Given colostrums
0-23 Months (n=269)
75.9%
Exclusive breastfeeding
0-5 Months (=76)
22.4%
9
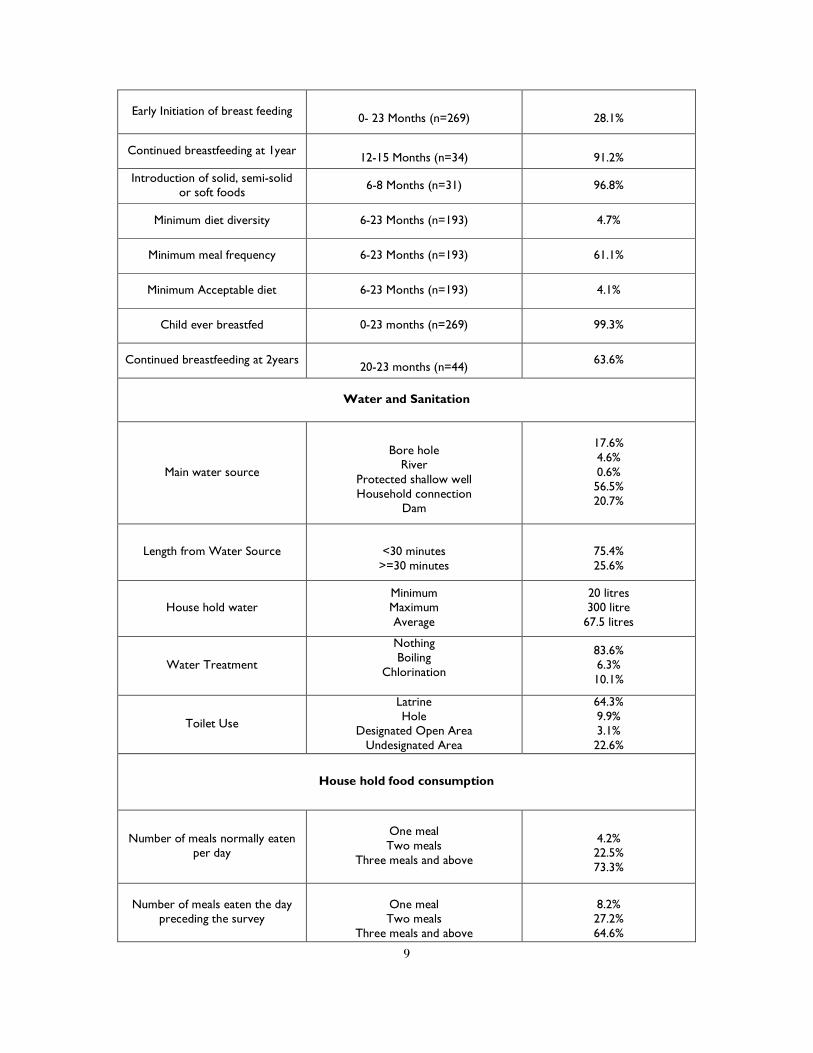
Early Initiation of breast feeding
0- 23 Months (n=269)
28.1%
Continued breastfeeding at 1year
12-15 Months (n=34)
91.2%
Introduction of solid, semi-solid or soft foods
6-8 Months (n=31) 96.8%
Minimum diet diversity 6-23 Months (n=193) 4.7%
Minimum meal frequency 6-23 Months (n=193) 61.1%
Minimum Acceptable diet 6-23 Months (n=193) 4.1%
Child ever breastfed 0-23 months (n=269) 99.3%
Continued breastfeeding at 2years
20-23 months (n=44) 63.6%
Water and Sanitation
Main water source
Bore hole
River Protected shallow well Household connection
Dam
17.6% 4.6% 0.6% 56.5% 20.7%
Length from Water Source
<30 minutes >=30 minutes
75.4% 25.6%
House hold water Minimum Maximum Average
20 litres 300 litre 67.5 litres
Water Treatment
Nothing Boiling
Chlorination
83.6% 6.3% 10.1%
Toilet Use
Latrine Hole
Designated Open Area Undesignated Area
64.3% 9.9% 3.1% 22.6%
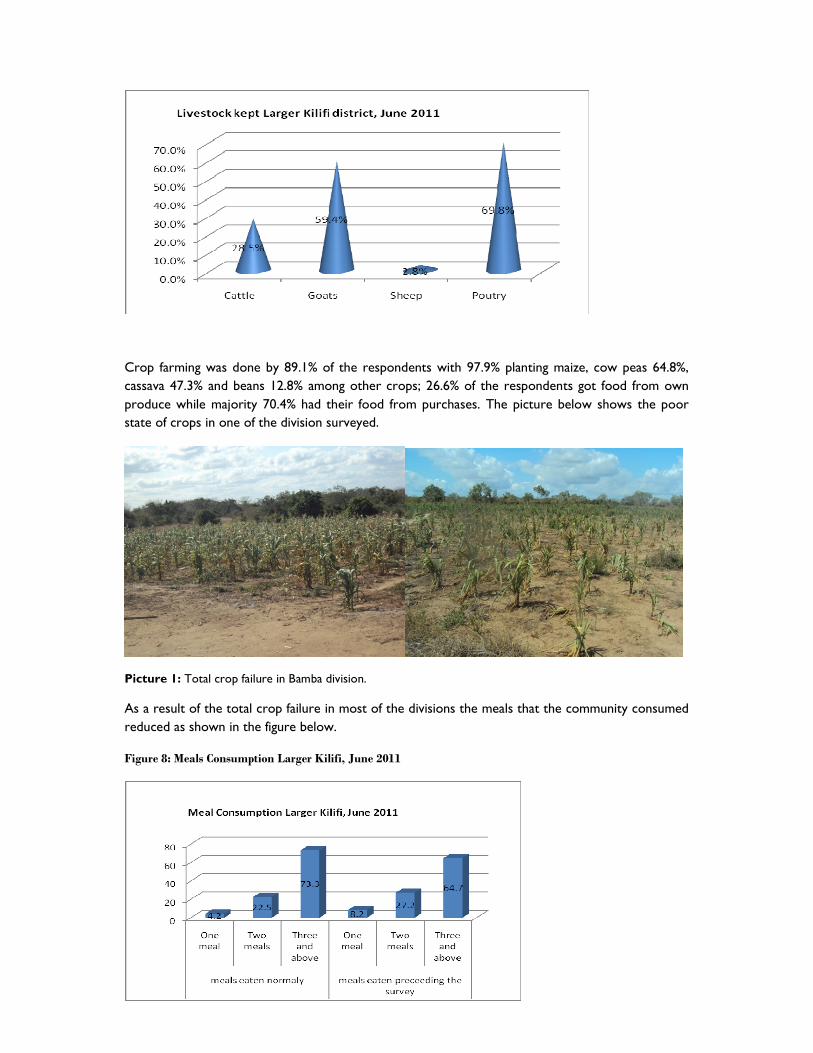
House hold food consumption
Number of meals normally eaten per day
One meal Two meals
Three meals and above
4.2% 22.5% 73.3%
Number of meals eaten the day preceding the survey
One meal Two meals
Three meals and above
8.2% 27.2% 64.6%

10
2.0 Introduction
Larger Kilifi District is in Coast province. It lies between 3˚ 16΄ south and 4˚ south, and 39˚ 05΄ east
and 40˚ east. The shoreline is 144 Km from Mtwapa Creek to Mida Creek. The district borders
Taita and Taveta districts to the west, Malindi and Magarini districts to the northwest, Kisauni,
Kilindini and Kinango Districts to the south. The district covers an area of 4, 779.2 Km² including the
Arabuko Sokoke forest of 189 Km. The population is estimated to be 831,108 people according to
2009 census.
The District is divided into seven administrative divisions namely Kaloleni, Bahari, Chonyi, Kikambala,
Ganze, Vitengeni and Bamba. Kaloleni and Ganze divisions have since been made into fully fledged
Districts. It has thirty six Locations and one hundred and seven sub locations. Bamba Division is the
largest with an area of 1,743.5 Km² sub divided into five locations and thirteen sub locations
followed by Kaloleni Division with an area of 909 Km² while Chonyi Division is the smallest with
area of 202.2 Km² with four Locations and nine sub locations as indicated in the above table.
Politically the district is divided into three constituencies namely Kaloleni comprising of Kaloleni
Division, Ganze comprising of Ganze, Vitengeni and Bamba Divisions and Bahari comprising of
Bahari, Kikambala and Chonyi Divisions. The district is divided into three local authorities namely
County Council of Kilifi which has twenty six electoral wards, Kilifi Town council with eight electoral
wards and town council of Mariakani with seven electoral wards.
Household dietary diversity score Average HDDS
5.1
11
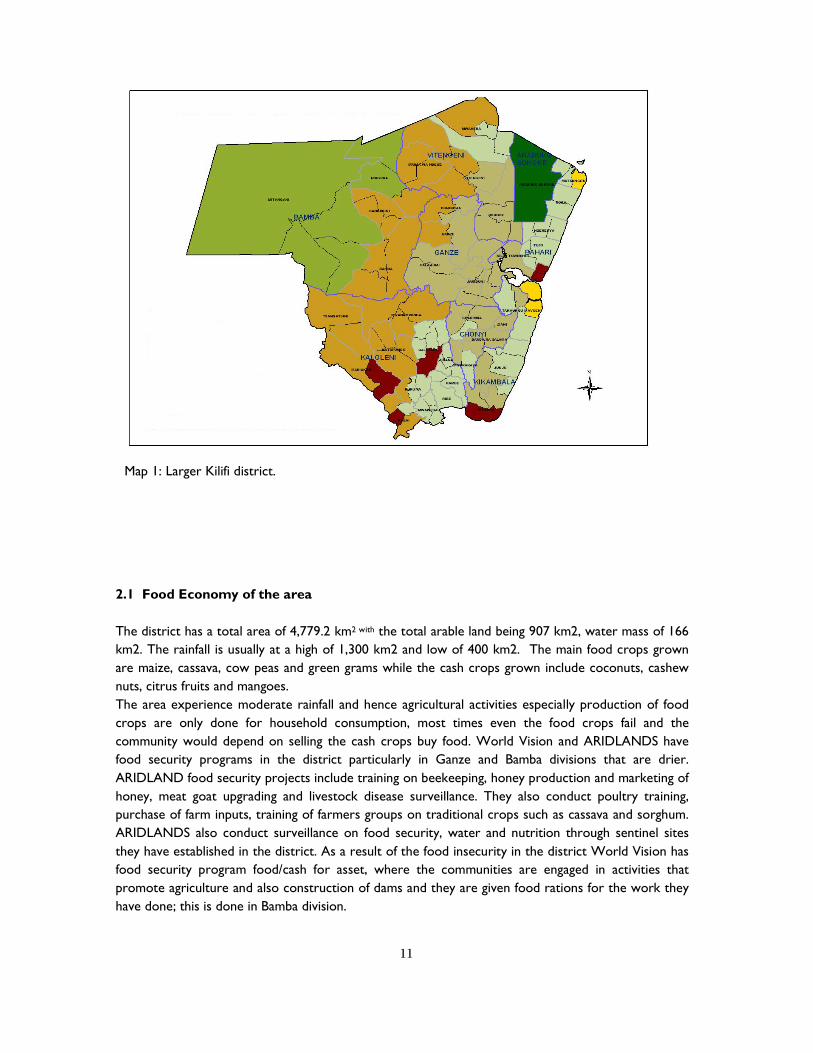
Map 1: Larger Kilifi district.
2.1 Food Economy of the area
The district has a total area of 4,779.2 km2 with the total arable land being 907 km2, water mass of 166
km2. The rainfall is usually at a high of 1,300 km2 and low of 400 km2. The main food crops grown
are maize, cassava, cow peas and green grams while the cash crops grown include coconuts, cashew
nuts, citrus fruits and mangoes.
The area experience moderate rainfall and hence agricultural activities especially production of food
crops are only done for household consumption, most times even the food crops fail and the
community would depend on selling the cash crops buy food. World Vision and ARIDLANDS have
food security programs in the district particularly in Ganze and Bamba divisions that are drier.
ARIDLAND food security projects include training on beekeeping, honey production and marketing of
honey, meat goat upgrading and livestock disease surveillance. They also conduct poultry training,
purchase of farm inputs, training of farmers groups on traditional crops such as cassava and sorghum.
ARIDLANDS also conduct surveillance on food security, water and nutrition through sentinel sites
they have established in the district. As a result of the food insecurity in the district World Vision has
food security program food/cash for asset, where the communities are engaged in activities that
promote agriculture and also construction of dams and they are given food rations for the work they
have done; this is done in Bamba division.
12
2.2 Health and nutrition
The Larger Kilifi district has two DHMT’s in Kaloleni and Kilifi, covering the area. According to kilifi
strategic plan; Kilifi District has total of 73 health facilities distributed across the district. Accessibility
of health services is, however low and 57% of the population live over 5kms to the nearest health
facility. The doctor patient ratio stands at 1:100,000 which in itself a manifestation of staff shortages in
the District. The most prevalent diseases include Malaria, Pneumonia and diseases of the digestive
system.
Nutrition has been taken seriously in the district with programs such as IYCF, IMAM, health
education, mother support groups being implemented in the district with leadership of Ministry of
health in collaboration with other partners. The establishment of community units has already being
done in the area with Kilifi having 10 units while Kaloleni has 18 functional units. As a result of the
food insecurity and cases of malnutrition Kaloleni has one stabilization center, 7 OTP, and 4 SFP while
Kilifi DHMT has one stabilization centre, 17 OTPS and 12 SFP. These nutrition treatment programs
are run by the Ministry of Health with collaboration of World Vision and with Support of UNICEF and
WFP.
3.1 METHODOLOGY
3.1 Type of Survey and Sample Size
A two-stage cluster sampling method was used. The anthropometric surveys target children aged
between 6 and 59 months utilizing SMART methodology, which ensures accuracy and precision of
data collected. Selection of accessible villages was done with the help of village elders. Information
on population figures for was collected thorough the 2009 census results and the village elders a list
of selected villages for the survey are at the annex.
The geographical units and their respective population were then inputted into the ENA for SMART
software November 2008 for planning the survey.
At the first stage, the sample size was determined by inputting necessary information into the ENA
for SMART both anthropometric and mortality surveys. The information included estimated
population sizes, expected prevalence rates of mortality and malnutrition, the desired precision and
the design effect.

13
3.2 Sample Size Calculation
Using prevalence of 7.5%, precision of 3 and design effect of 2, a sample size of 592 children was
obtained. In the mortality session, an estimated prevalence of 0.3, a desired precision of 0.3 and a
design effect of 2 resulted in a sample size 2,846 with a recall period of 97 days.
At the second stage, a selection of the households to be visited within each cluster was done. Simple
random method was used to select the households, the village elders gave the list of the households
in a given village, using table of random numbers the households were selected. In cases where the
villages had huge number of households, segmentation was done; the population was subdivided in to
equal segments and one segment was selected using table of random numbers, the household were
then listed, and the required households selected from the list by simple random method.
In each selected household, all children aged 6-59 months were included. If there was more than one
wife (care taker) in the household3, each wife was considered separately regardless of whether they
were cooking together. If there were no children in a household, the house remained a part of the
“sample” that contributed zero children to the nutritional part of the survey. The household was
recorded on the nutritional data sheet as having no eligible children.
The mortality questionnaire was only administered in households that were included in the
anthropometric questionnaire and numbered correspondingly.
3.3 Data Collection
For each selected child, information was collected during the anthropometric survey. The
information included
→ Age: recorded with the help child health cards/mother and health booklet and a local calendar of events
→ Gender: male or female
→ Weight: children were weighed without clothes, with a SALTER balance of 25kg (precision of 100g).
→ Height: children were measured on a measuring board (precision of 0.1cm). Children less than 87cm were measured lying down, while those greater than or equal to 87cm were measured standing up.
→ Mid-Upper Arm Circumference: MUAC was measured at mid-point of left upper arm for measured children (precision of 0.1cm).
→ Bilateral Oedemas: assessed by the application of normal thumb pressure for at least 3 seconds to both feet.
→ Measles vaccination: assessed by checking for measles vaccination on EPI cards or by asking caretakers.
→ DPT 3: assessed by checking for measles vaccination on EPI cards or by asking caretakers.
3 A household refers to a caretaker and his/her children

14
→ Vitamin A: Asked the mother/caretaker whether the child received Vitamin A in the last 6 months
3.4 Indicators, Guidelines, and Formula’s Used
3.4. 1 Acute Malnutrition
� Weight for Height Index
Acute malnutrition rates are estimated from the weight for height (WFH) index values combined
with the presence of Oedemas. The WFH indices are expressed in both Z-scores and percentage of
the median, according to both NCHS4 and WHO references5. The complete analysis is done with
the WHO reference.
The expression in Z-scores has mainly statistical meaning, and allows inter-study comparison. The
percentage of the median, on the other hand, is used for the identification criteria of acute
malnutrition in nutrition programs.
Guidelines for the results expressed in Z-score:
• Severe malnutrition is defined by WFH < -3 SD and/or existing bilateral Oedemas on the lower limbs Moderate malnutrition is defined by WFH < -2 SD and ≥ -3 SD and no Oedemas.
• Global acute malnutrition is defined by WFH < -2 SD and/or existing bilateral Oedemas.
Guidelines for the results expressed in percentage of median:
• Severe malnutrition is defined by WFH < 70 % and/or existing bilateral Oedemas on the lower limbs
• Moderate malnutrition is defined by WFH < 80 % and ≥ 70 % and no Oedemas.
• Global acute malnutrition is defined by WFH <80% and/or existing bilateral Oedemas
� Children’s Mid-Upper Arm Circumference (MUAC)
The weight for height index is the most appropriate index to quantify wasting in a population in
emergency situations where acute forms of malnutrition are the predominant pattern. However the
mid-upper arm circumference (MUAC) is a useful tool for rapid screening of children at a higher risk
of mortality. MUAC measurements are significant for children with age of one year and above. The
guidelines are as follows:
MUAC < 115 mm Severe malnutrition and high risk of mortality
MUAC ≥ 115 mm and <125 mm Moderate malnutrition and moderate risk of mortality
MUAC ≥ 125 mm and <135 mm At risk of malnutrition
MUAC ≥ 135 mm Good nutritional statuses
4 NCHS: National Center for Health Statistics (1977) NCHS growth curves for children birth-18 years. United States.
Vital Health Statistics. 165, 11-74.
5 WHO reference, 2005

15
3.4.2 Stunting
� Height for Age index
Stunting rates are estimated from the height for age (HFA) index values. The HFA indices are
expressed in Z-scores according to both NCHS and WHO references. The complete analysis is
done with the WHO reference.
Guidelines for the results expressed in Z-score:
• Severe stunting is defined by HFA < -3 SD
• Global stunting is defined by HFA< -2 SD.
3.4.3 Underweight
� Weight for Age index
Underweight rates are estimated from the Weight for age (WFA) index values. The WFA indices are
expressed in Z-scores according to both NCHS and WHO references. The complete analysis is
done with the WHO reference.
Guidelines for the results expressed in Z-score:
• Severe underweight is defined by WFA < -3 SD
• Global underweight is defined by WFA< -2 SD.
3.4.4 Mortality
Mortality data was collected using Standardized Monitoring and Assessment of Relief. The crude
mortality rate (CMR) is determined for the entire population surveyed for a given period. The CMR
is calculated using ENA for SMART.
The formula below is applied:
Crude Mortality Rate (CMR) = 10,000/a*f/ (b+f/2-e/2+d/2-c/2),
Where:
a = Number of recall days (95)
b = Number of current household residents
c = Number of people who joined household
d = Number of people who left household
e = Number of births during recall
f = Number of deaths during recall period

16
The result is expressed per 10,000-people / day. The thresholds are defined as follows6:
Total CMR:
Alert level: 1/10,000 people/day
Emergency level: 2/10,000 people/day
Under five CMR:
Alert level: 2/10,000 people/day
Emergency level: 4/10,000 people/day
3.4.5 IYC Indicators7
1. Early initiation of breastfeeding: Proportion of children born in the last 23 months who were put to the breast within one hour of birth.
Children born in the last 23 months who were put to the breast within one hour of birth
Children born in the last 23 months
2. Exclusive breastfeeding under 6 months: Proportion of infants 0–5 months of age who are fed exclusively with breast milk.
Infants 0–5 months of age who received only breast milk during the previous day
Infants 0–5 months of age
3. Continued breastfeeding at 1 year: Proportion of children 12–15 months of age who are fed breast milk.
Children 12–15 months of age who received breast milk during the previous day
Children 12–15 months of age
4. Introduction of solid, semi-solid or soft foods: Proportion of infants 6–8 months of age who receive solid, semi-solid or soft foods.
Infants 6–8 months of age who received solid, semi-solid or soft foods during the previous day
Infants 6–8 months of age
5. Minimum dietary diversity: Proportion of children 6–23 months of age who receive foods from 4 or more food groups.
6 Health and nutrition information systems among refugees and displaced persons, Workshop report on refugee’s
nutrition, ACC / SCN, Nov 95.
7 WHO, 2010. Indicators for assessing infant and young child feeding practices. Part 3 country
profiles

17
Children 6–23 months of age who received foods from ≥ 4 food groups during the previous day
Children 6–23 months of age
6. Minimum meal frequency: Proportion of breastfed 6–23 months of age, who receive solid, semi-solid, or soft foods (but also including milk feeds for non-breastfed children) the minimum number of times or more.
Breastfed children 6–23 months of age who received solid, semi-solid or soft foods the minimum number of times or more during the previous day
Breastfed children 6–23 months of age
7. Minimum acceptable diet: Proportion of children 6–23 months of age who receive a mini-mum acceptable diet (apart from breast milk).:
Breastfed children 6–23 months of age who had at least the minimum dietary diversity and the minimum meal frequency during the previous day
Breastfed children 6–23 months of age
8. Children ever breastfed: Proportion of children born in the last 24 months who were ever breastfed.
Children born in the last 23 months who were ever breastfed
Children born in the last 24 months
9. Continued breastfeeding at 2 years: Proportion of children 20–23 months of age who are fed breast milk.
Children 20–23 months of age who received breast milk during the previous day
Children 20–23 months of age
3.4.5 Health, food security and water and sanitation data
Health, food security and water and sanitation data were collected from same households the where anthropometry data was collected. The questionnaire was administered to the head of the household and/or to the spouse. The Questionnaires were in English language, surveyors competent in reading English were chosen to administer the questionnaires.
3.5 Data quality control assurance
The use of an anthropometric standardization test for the survey team, thorough enumerator training, close supervision during the actual survey for consistency, completeness and clarity of the questionnaires ensured that data collected was of good quality. Common historical events listed in the seasonal calendar were used to clarify the dates of childbirth in cases where the mother or the caretakers were not certain about the information.

18
3.6 Field Work
The surveys were carried out by six teams, each team comprising five members: 1 team leader, 2
data collectors and 2 measurers. All teams received 4 day intensive training in Kilifi Town prior the
start of the survey. This training provided the theoretical background for team leaders, data
collectors and the measurers. All team members did a pilot survey for one day before actual start of
data collection. This train included the standardization test. All teams were closely supervised during
their field work throughout the whole survey time by the consultant, MOH, ARIDLANDS and WVK
staff.
3.7 Data Analysis
Data processing and analysis for both anthropometric and mortality were carried out using ENA for
SMART November 2008 version using both NCHS and WHO references. Excel was used to carry
out analyses on MUAC, measles immunization coverage, household composition. Health, food
security, water and sanitation data was analysed using SPSS version 16.
3.8 Challenges faced during survey
The survey faced the limitation below.
• Logistical problems- Due to rains the movement of vehicles was really a great challenge as
this resulted to team delays in the field
• Community mobilization of the chiefs and village elders was quite a challenge as the survey
covered a wide area and it was impossible to reach all of them before the start of the
survey.
4.0 RESULTS AND DISCUSSION
This section provides results and discussions from the data collected on nutrition/ anthropometrics,
mortality as well as immediate and underlying causes of malnutrition such as morbidity, water and
sanitation and food security. The topics are discussed in the following sections under the respective
headings and sub-headings. Quantitative results are presented in tables, graphs and charts as
applicable.
4.1 Health and nutrition status
4.1 .1 Distribution by Age and Sex
The distribution of the nutrition survey sample by sex and age group shows that the total boy/girl sex ratio of the survey was within the normal limits (0.8 - 1.2). Similarly, sex ratio within the age groups indicates a normal distribution.

19
Table 1. Distribution of age and sex Larger Kilifi district June 2011
Age group (months)
Boys Girls Total Ratio
no % no % no % Boy: girl 6-17 68 51.1 65 48.9 133 22.2 1.0 18-29 70 50.0 70 50.0 140 23.4 1.0 30-41 78 49.1 81 50.9 159 26.6 1.0 42-53 64 56.1 50 43.9 114 19.1 1.3 54-59 24 46.2 28 53.8 52 8.7 0.9 Total 304 50.8 294 49.2 598 100.0 1.0
Figure 1: Distribution by Age and sex Larger Kilifi June 2011
4.1.2 Distribution of Acute malnutrition by Z-scores
The global acute malnutrition was 4.0% while severe acute malnutrition was 0.7% according to
WHO standards
Table 2. Weight for height distribution by age Larger Kilifi district in Z-scores (WHO reference)
Age
(months
)
Total
no.
Severe wasting (<-3 z-score)
Moderate
wasting
(>= -3 and <-2
z-score )
Normal
(> = -2 z
score)
Oedema
No. % No. % No. % No. %
6-17 133 1 0.8 4 3.0 126 94.7 2 1.5 18-29 140 0 0.0 7 5.0 133 95.0 0 0.0 30-41 159 0 0.0 4 2.5 154 96.9 1 0.6 42-53 114 0 0.0 3 2.6 111 97.4 0 0.0

20
54-59 52 0 0.0 2 3.8 50 96.2 0 0.0 Total 598 1 0.2 20 3.3 574 96.0 3 0.5
A chi-square revealed no significant difference of malnutrition between 6-29 months and 30-59
months age group but the relative risk showed that children aged between 6-29 months .
Table 3. Weight for height versus Oedema Larger Kilifi district in Z scores (WHO reference)
<-3 z-score >=-3 z-score
Oedema present Marasmic kwashiorkor
No. 1(0.2 %)
Kwashiorkor
No. 2(0.3 %)
Oedema absent Marasmic
No. 1 (0.2 %)
Not severely malnourished
No. 594 (99.3 %)
Two children had with bilateral oedema.
Figure 2: Weight for height distribution Larger Kilifi district June 2011
The slight displacement of the sample curve to the left side of the reference curve indicates a few
malnourished children detected in the surveyed population. The mean Z-Scores of the sample was
-0.20 and the Standard Deviation is 0.99(WHO reference). The SD is within the interval 0.80 -1.20,
which shows that the sample is representative of the population.
Table 4 Global and Severe Acute Malnutrition in Z score Larger Kilifi October 2010
NCHS Reference WHO Reference
Global Acute Malnutrition 4.2% [3.0-5.8] 4.0% [2.8-5.8]
Severe Acute Malnutrition 0.5% [0.2-1.5] 0.7[0.3-1.7]
4.1.3 Distribution of acute malnutrition in percentage of median
According to percentage of the Median GAM was 2.2% while SAM was 0.5%
Table 5: Distribution of Weight/Height by age in percentage of median (NCHS)

21
Age
(Months
)
Total
no.
Severe
wasting
(<70%
median)
Moderate wasting
(>=70% and <80%
median)
Normal
(> =80%
median)
Oedema
No. % No. % No. % No
.
%
6-17 133 0 0.0 2 1.5 129 97.0 2 1.5 18-29 140 0 0.0 5 3.6 135 96.4 0 0.0 30-41 159 0 0.0 2 1.3 156 98.1 1 0.6 42-53 114 0 0.0 1 0.9 113 99.1 0 0.0 54-59 52 0 0.0 0 0.0 52 100.0 0 0.0 Total 133 0 0.0 2 1.5 129 97.0 2 1.5
Table 6: Global and Severe Acute Malnutrition in percentage of Medium Larger Kilifi June 2011
NCHS Reference
Global Acute Malnutrition 2.2 [1.3-3.6]
Severe Acute Malnutrition 0.5 [0.2-1.5]
4.1.4. Distribution of Underweight in Z scores Larger Kilifi June, 2 2011 (WHO reference
The global underweight was 21.3% while severe underweight was 5.0%
Table 7: Prevalence of underweight based on Weight-for age Z scores
Age
(months)
Total
no.
Severe underweight (<-3 z-score)
Moderate
underweight
(>= -3 and <-2 z-
score )
Normal
(> = -2 z score)
Oedema
No. % No. % No. % No. %
6-17 131 7 5.3 16 12.2 108 82.4 2 1.5 18-29 140 10 7.1 19 13.6 111 79.3 0 0.0 30-41 158 5 3.2 29 18.4 124 78.5 1 0.6 42-53 114 6 5.3 23 20.2 85 74.6 0 0.0 54-59 52 2 3.8 10 19.2 40 76.9 0 0.0 Total 595 30 5.0 97 16.3 468 78.7 3 0.5

22
4.1.5 Distribution of stunting in Z scores larger Kilifi June 2011 (WHO reference)
The prevalence of stunting was 48.8% while severe stunting was 19.6%
Table 8: Prevalence of stunting by age based on height-for-age Z scores
Age
(months)
Total
no.
Severe stunting
(<-3 z-score) Moderate stunting
(>= -3 and <-2 z-
score )
Normal
(> = -2 z
score)
No. % No. % No. %
6-17 133 23 17.3 23 17.3 87 65.4 18-29 140 30 21.4 47 33.6 63 45.0 30-41 159 30 18.9 61 38.4 68 42.8 42-53 114 29 25.4 26 22.8 59 51.8 54-59 52 5 9.6 18 34.6 29 55.8 Total 598 117 19.6 175 29.3 306 51.2
4.1.6 Distribution of Malnutrition according to WHZ, WAZ and HAZ in all Larger Kilifi divisions, June 2011
An analysis of individual divisions was done that showed Bamba with high chronic malnutrition
compared to the rest of the divisions as shown in figure below
Figure 3: Distribution of malnutrition in Larger Kilifi, June 2011
4.1.7 Risk of mortality: children MUAC and mothers/care takers MUAC
All children measured were included in the MUAC analysis. As shown in the following table, the rates of acute malnutrition according to the MUAC status of the children were 0.7% and 3.3% severe and global malnutrition respectively, 6.7% were at risk of malnutrition. Table 9: Child MUAC distribution Larger Kilifi June 2011
Nutrition status N=598 N %
<115 4 0.7
>=110-<125 20 3.3

23
>125-<134 40 6.7
>=134 534 89.3
4.1.8 Vaccination coverage and Vitamin A supplementation
� Measles Vaccination Coverage Larger Kilifi district June 2011
Table below presents the measles vaccination coverage among the surveyed population. The source of Information on immunization was either the child’s health card or the mother’s recall. A child was considered fully vaccinated if he/she had received the last dose of the EPI programme (from 9 months of age).
Table 10: Measles vaccination coverage Larger Kilifi district June 2011
Population ≥ 9 months= 518 N %
Immunized with Card 188 80.1%
Immunized without card 173 9.9%
Not immunized 154 9.9%
� Vitamin A coverage
Vitamin A coverage was established for the as shown by table below. Caretakers were asked if their child had received a vitamin A supplementation in the six months. The rates of supplementation appeared to be at a very low level.
Table 11 Vitamin A coverage
� DPT 3 Coverage
The children who had received the complete three doses of DPT3 were 86.2% according to card
and 9.3% according to caretaker as shown in table 12 below.
Table 12: DPT 3 coverage
6-11 12-59 6-59
Population =597 N % N % N %
Received 14 80.3% 273 51.9% 330 55.3%
Not received 57 19.7% 253 48.1% 267 44.7%
Population =594 N %
Card 512 86.2%
Mother 55 9.3%
Not immunized 27 4.5%

24
4.19 Mortality
The retrospective death rate was calculated based on the data collected on the 97days recall. The recall date was April 1st. Table 13: Mortality results
Demographic data Larger Kilifi district June 2011 Number of current HH residents 3215 Number of people who joined HH 102 Number of births during recall 61 Number of death during recall 12 Number of 0-5 708 Number of 0-5 who joined HH 22 Number of deaths 0-5 during recall 20 Crude Death rate 0.38[0.22-0.66]
0-5 death rate 0.61[0.18-2.04]
The mortality rates remained below WHO emergency thresholds.
4.1.10 Breastfeeding and complementary feeding
Mothers were asked when they do start breastfeeding their new born baby and when they introduce complementary food. Figure 4: Breast feeding Indicators Larger Kilifi, June 2011
The breastfeeding indicators performed well especially on whether the child was ever breast fed,
continued breastfeeding at 1 year, initiation of breastfeeding and continued breastfeeding at 2 years.
Exclusive breast feeding 0-5 months was 22.4% is poor as children less than 6 months are supposed
to be exclusively breast fed.
Figure 5: Introduction of complementary foods in larger Kilifi June 2011

25
The introduction of complementary foods at 6-8 months was good while meal frequency was
moderate while minimum diet diversity and minimum acceptable diet are extremely low.
4.1.11 Child morbidity, de-worming and treatment seeking
In the survey 57.3% of the children had sickness in the last 2 weeks, out of them 37% had fever while
35.1% had cough as shown in table below.
Table 14: Disease patterns in the last two weeks before the survey Larger Kilifi June 2011
Disease Percentage
Fever 37.0%
Cough 35.1%
Watery Diarrhoea 15.7%
Blood Diarrhoea 1.7%
Others ( vomiting, skin infection, eye problem, stomach-ache, ring worms and wound)
10.5%
Among the mothers who had sick children 85% of them sought different treatment for their sick
children, sought treatment from hospital and other available health facilities. Only 57.2% of the
children were de-wormed in the last six months.
4.1.12 Mosquito net coverage
71.8% of the household reported that they owned mosquito net.

26
4.2 Water and Sanitation
4.2.1 Water source and use
Household connection (56.5%) was the major source of water for the households, while 20.7% had
their water from dams.
Figure 6: Treatment of water at household level before use Larger Kilifi district, June
2011
As shown in the figure above 83.6% did not treat their water at household level, while only 10.1%
and 6.3% did chlorination and boiling respectively.
4.2.2 Hand washing practice and Latrine ownership.
97.3% of the mothers washed their hands before handling food, 56.3% washed their hands after
defecation/visiting toilet. Of those who washed their hands only 48.2% washed their hands with
soap and water. Only 64.3% of the respondents used latrines or holes for defecation while 35.7%
relieved themselves in either a designated or undesignated open area.
4.3 Food security
Food security situation of the region was assessed during the survey. 32.1% had main income from
being employed while 20.1% were daily laborers. Above 80% Household heads were adult men with
majority of them 56.5% had primary level as the highest education level while their spouses 42.2%
and 40.2% had primary education and none respectively.
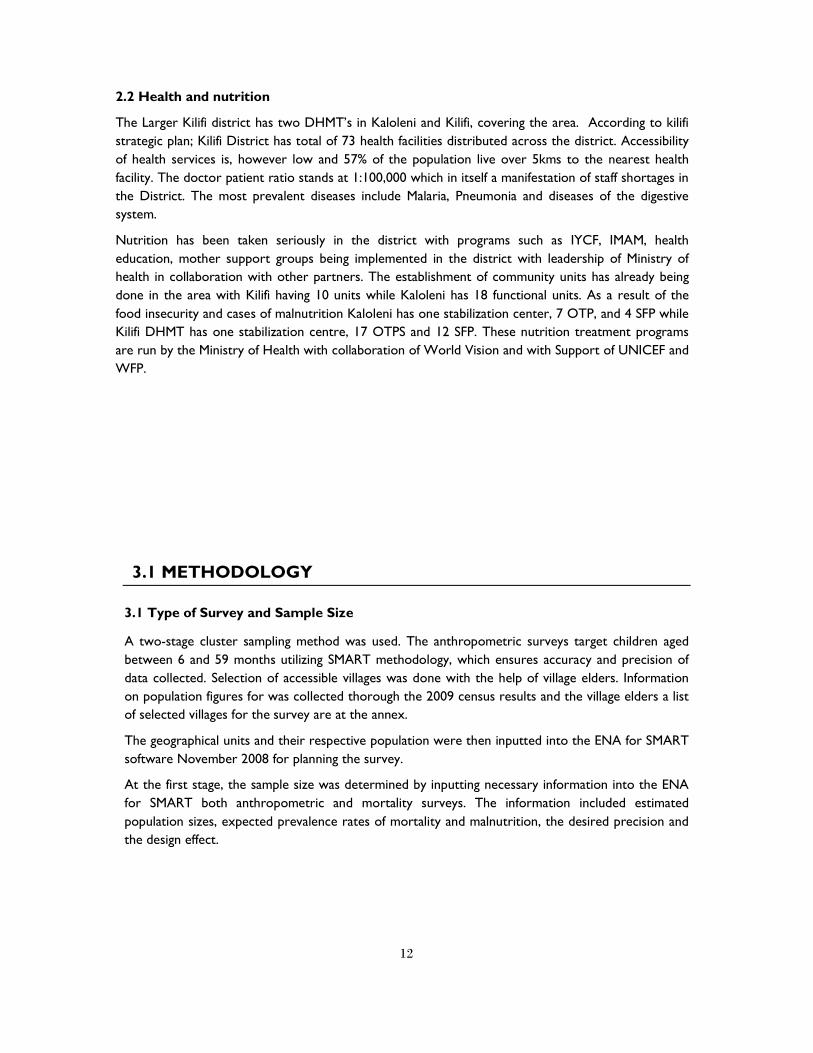
Most of the households (66.3%) kept livestock, majority (69.8%) keeping poultry. Of the household
who kept livestock only 13.8% were milking. The figure below shows the different kind of livestock
that the communities were keeping.
Figure 7: Livestock Kept Larger Kilifi, June 2011
27
Crop farming was done by 89.1% of the respondents with 97.9% planting maize, cow peas 64.8%,
cassava 47.3% and beans 12.8% among other crops; 26.6% of the respondents got food from own
produce while majority 70.4% had their food from purchases. The picture below shows the poor
state of crops in one of the division surveyed.
Picture 1: Total crop failure in Bamba division.
As a result of the total crop failure in most of the divisions the meals that the community consumed
reduced as shown in the figure below.
Figure 8: Meals Consumption Larger Kilifi, June 2011

28
The house hold food diversity was also hampered by the current food scenario with a average score
of 5.1, with most of the people consuming the cereals and vegetables as shown in the figure below.
Figure 9: Household food diversity Larger Kilifi, June 2011
5.0 DISCUSSION AND RECOMMENDATIONS
5.1 Health and Nutrition
GAM when compared to the WHO reference population, were below the WHO emergency threshold of 15%. This survey did not show significant difference between a survey done in July 2009 that had a GAM and SAM of 5.9% and 0.6%

29
respectively. Though the malnutrition detected seems to be quite low; this could easily go up depending on the seasons of the year. The malnutrition rates could have been lower than what was detected during this time of the year. The stunting is quite high in the district with 48.8% of the children being stunted. The stunting could be linked to the poor IYCF practices. The Infant and young child feeding practices (IYCF) in the surveyed area average, 28.1% of the mother’s initiated breastfeeding within the 1st hour of birth, it should be noted that all mothers should initiate breast milk within 1st hour of birth as breast milk is the only food ideal for the children at these age. Exclusive breastfeeding for children less than 5 months was at 22.4% just average and WHO and UNICEF recommend that all children should be exclusively breastfed until they reach 6 months old. Colostrum was only given to 75% of the children the rest of the mothers expressed out the milk denying the children important nutrients that are critical for child development and immunity. The introduction of complementary foods was good as 96.8% of the mothers of children aged 6-8 months introduced complementary foods. Minimum meal frequency was average with only 61.6% having the required meal frequency. Minimum diversity was poor within only 4.7% of the mother managing to give the children at least 4 food groups within the last 24 hours. The minimum acceptable diets; a combination of meal frequency and minimum diet diversity was also poor. After six months, infants need other nutritious foods, in addition to breastfeeding up to two years and beyond, to meet their growth and development needs8. Vaccinations (Measles and DPT 3) were above 80% while vitamin A coverage was just above 50%, the measles and DPT 3 coverage was quite good while the Vitamin A coverage was poor especially children between 12-59. Measles is known to interact particularly with deficiencies of protein−energy and of vitamin A. Children who are vitamin A deficient suffer an increased risk of death and illness, particularly from measles and diarrhoea9. Immunization is an essential part of child’s right to the highest attainable standards of health. Immunization protect against dangerous disease s a child who is not immunized is more likely to become sick, undernourished or could die. This underscores the importance of vaccinations in children growth; poor immunization coverage could lead increased morbidity resulting to malnutrition. Morbidity in the surveyed population showed that 57.3% of the children had sickness in the last two weeks before the survey; fever was the leading with 37.0%, cough (35.1%) and watery diarrhoea (15.7%).
5.2 Water and Sanitation
Portably water accessibility was of concern with only 56.5% had water from boreholes that’s considered safe, while the rest had water from the river. Though they got water from unsafe places over 83.6% of the households did not treat their household water, only 10.1% and 6.2% chlorinated and boiling chlorination. Mothers washed their hands mostly before cooking, before eating and before feeding their children, though it’s a good practice only 48.2% used soap when washing their hands. Only 64.3% of the respondents had latrine. The poor hygienic practices can explain the high incidents of water borne diseases such as vomiting and watery diarrhoea. Many illnesses can be prevented by good hygienic practices: washing hands with soap and water (or a substitute, such as ash and water) after defecating or cleaning a child who has defecated, using clean toilets or latrines, disposing of faeces away from play and living areas and water sources, washing hands before handling
8 UNICEF (2010). Facts for life 4th Edition.
9 Micronutrient Initiative: Vitamin A in child health weeks : A Toolkit for planning, implementing and
monitoring.

30
food, using water from a safe source, disinfecting drinking water if its safety is in question, and keeping food and water clean.
5.3 Food Security
The food security situation in the larger district is worrying. Crop diversity is a major concern as only cereals are grown in the region, this could affect the nutrition status of the populace as other food sources like pulses and vegetables that contribute to well being are not planted. This could be seen with the poor food diversity score for children less than 24 months detected. There is need for the community to be encouraged on food diversity and significant large farming to cater for their food need year all round. The region is agriculturally productive and the community could easily produce enough food for themselves. In order to improve the nutrition status of the surveyed communities, the following is
recommended.
Short term recommendations
1. Need to increase nutrition treatment services (OTP, SFP) in the area to increase coverage and to manage children who are malnourished- MMS/MOPHS, WFF, UNICEF and World Vision.
2. To establish community units where they haven't been established in the district as this will increase case referrals for malnourished children.- MOPHS, World Vision, APHIA.
3. Vitamin A supplementation improvement coverage throughout reaches and if possible campaigns – MOPHS, MMS
4. Conduct IYCF trainings to the Community health workers to improve the IYCF practices. MOPHS, MMS, APHIA
5. Latrine coverage improvement- through hygiene and sanitation – MOPHS 6. Continue with FFA program in areas that have total crop failure especially Bamba and
Ganze divisions. WFP and WVK 7. Device ways of provision of clean water especially in Bamba division where water is scarce-
water tracking. Long term recommendations
1. Establish community units to cover the entire Larger Kilifi district this will enhance a. Quick and timely referrals for malnourished and sick children b. Access to health services c. Vaccination coverage and micro nutrient supplementation. d. Positively towards hygiene and sanitation practices e. Latrine coverage (MOPHS and other Health partners)
2. Introduce and advocate for drought resistance crops in the district. WVK, ARLMP, MOA 3. Establish positive deviance programs in order to have sustainable management of
malnutrition in the district (MOPHS). 4. Provide long lasting solution for water problems in dry divisions like Bamba- boreholes and
Dams (WVK, ARLMP,MOW.

31
6.0 ANNEXES
Annex 1: Assignment of clusters Larger Kilifi, June 2011
Division Location Geographical unit Population size Cluster
BAHARI
TEZO
MTONDIA/MAJAONI 14533
KIBARANI 10163 1
ROKA
ROKA 8391 2
CHUMANI 9067
NGERENYA
NGERENYA 6437
EZAMOYO 3634
ZOWERANI 4575
MATSANGONI
MATSANGONI 5002 3
UYOMBO 5716 4
MKONGANI 5387
TOWNSHIP
HOSPITAL 27017 5, 6, 7
KONJORA 10695 8
SOKONI 8010
MNARANI 7392
KIKAMBALA
MTWAPA
SHIMO LA TEWA 50846
9, 10,
11, 12
KIJIPWA 9668
KANAMAI 15389
KIDUTANI MAWAMBA 9586 13, 14
JUNJU
JUNJU 10557 15
KURUWITU/CHODARI 8739
GONGONI/VIPINGO 12456 16
TAKAUNGU
MAVUENI/MAJAJANI 8005 17, 18
TAKAUNGU 6656
KIRIBA/WANGANI 3895

32
MKOMANI/MKWAJUNI 7427
CHONYI
MWARAKAYA
MWARAKAYA 5024
KIZINGO 9842
ZIANI
ZIANI 9080 19, 20
NGOMBENI 4901
CHASIMBA
CHASIMBA 15313 21, 22
MWAKAMBI 4208
KITSOENI 5250
BANDA RA SALAMA
PINGILIKANI 4611
MWEMBE KATI 5595
VITENGENI
MWAHERA
MWAHERA 3235 23
NDUGUMNANI 1452
KAEMBENI 3909
DZIKUNZE 3302
MWANGEA 2998
VITENGENI
MITSEDZINI 1080
VITENGENI 2266
MADAMANI 7433
SOKOKE
RARE 2704 24
NYARI 4863
MAGOGONI 4667 25
MRIMA WA NDEGE
DULUKIZA 1514
MRIMA WA NDEGE 1537
MILORE 2801
DIDA
BALE 1702
KAHINGONI 967
DIDA 1765
GANZE
GANZE
GANZE/TSANGALAWENI 6477
PETANGUO 3399
PALAKUMI
PALAKUMI 5417
MARIANI/VITSAPUNI 3927
DUNGICHA
MWEZA/MIGODOMANI 1816
DUNGICHA 2280
JARIBUNI
JARIBUNI
MWAPULA 1425
MARERE 2167
CHIVARA 2179
KAUMA
VINAGONI 2587 26
MAGOGONI/MATOLANI 2212
MDANGARANI 1353
VYAMBANI
VYAMBANI 1753
NGAMANI 1938 27
BAMBA BAMBA PAZIANI 4888

33
MWAKWALA 5544
MTSARA WA TSATSU MTSARA WA TSATSU 11562 28
NDIGIRIA
MIRIHINI 2607
MWAMBANI 2520
NDIGIRIA/MAPOTEA 2606
BANDARI
MITSEMERINI 2211
KIDEMU 2005
MIKAMINI 2745
KARIMANI 1183
MITANGANI
MIDOINA 1040
MNAGONI 1122
DANGARANI 2022
GEDE 1605
GOSHI 982 29
MIGUJINI 921
KALOLENI
KALOLENI
KALOLENI VISHAKANI 17734
KINANI/MAKOMBOANI 5439 30
BIRINI/MWAMLEKA 3964
MIKIRIANI 5574
CHALANI/MIHINGONI 6878 31
JIBANA
CHILULU 3258
TSAGWA 3007
KWALE 4719
NYALANI 5453 32
KAMBE
PANGANI/MAERENI 4708
KIKOMANI/MBWAKA 7272
RIBE CHAURINGO 5331
KAYAFUNGO
MBALAMWENI 9790
KINAGONI 3234 33,34
MRIMANI 8680 35
MIYANI 3724
RABAI
RURUMA
JIMBA 4337
MLEJI 9332
MIYUNI 8040
RABAI
BUNI KISISMANI 9924 36
MWELE KISURUTINI 7969
MGUMO /PATSA/MAZERAS 15909 37
KALIANG'OMBE/ JIMBA 9342
MWAWESA
BWAGAMOYO 6349 38
MWAMTSUNGA 4806
MIKAHANI 3866
MARIAKANI MARIAKANI MITANGONI/MARIAKANI 29866 39

34
KAWALA/ KADZONZO 13333 40
MWANAMWINGA
VIRAGONI 7754
KITHENGWANI/MAZIA
CHENDA 9099
KIBWABWANI 4621
TSANGATSINI
TSANGATSINI 6005
MNYENZENI 3607
35
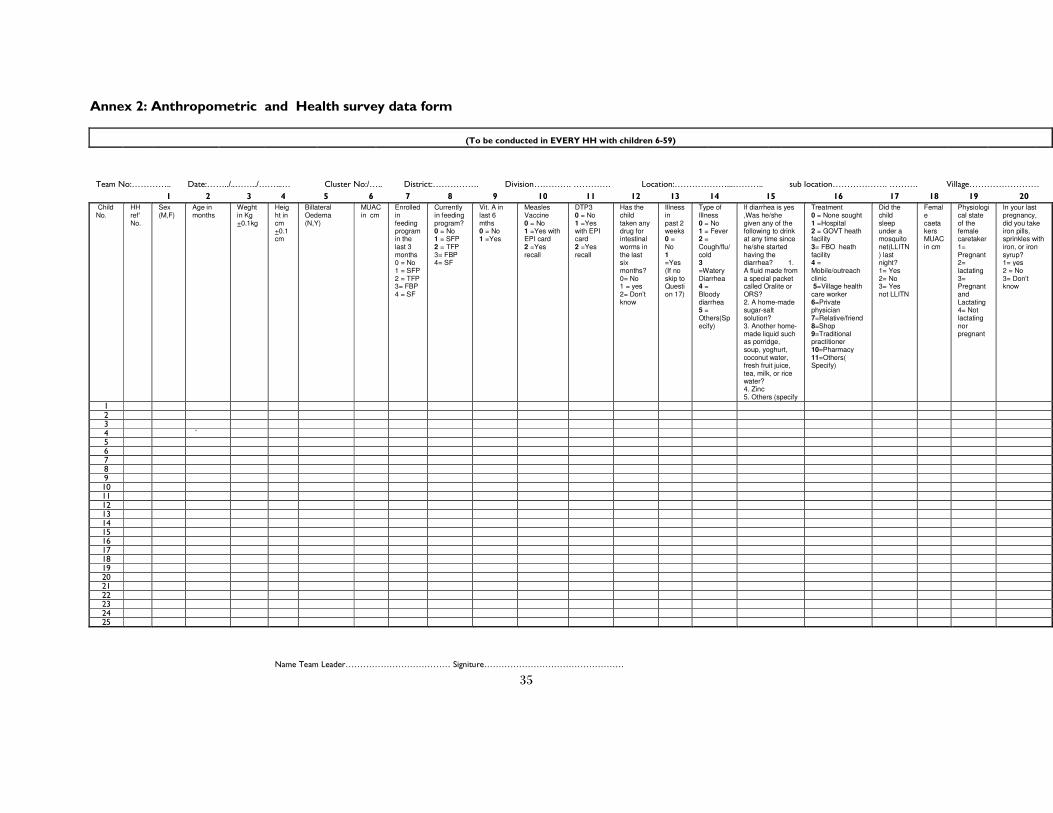
Annex 2: Anthropometric and Health survey data form
(To be conducted in EVERY HH with children 6-59)
Team No:………….. Date:……../..……../……...… Cluster No:/….. District:……………. Division…………. …………. Location:………………...……….. sub location………………. ………. Village……………………
1 2 3 4 5 6 7 8 9 10 11 12 13 14 15 16 17 18 19 20
Child No.
HH ref' No.
Sex (M,F)
Age in months
Weght in Kg +0.1kg
Height in cm +0.1cm
Billateral Oedema (N,Y)
MUAC in cm
Enrolled in feeding program in the last 3 months 0 = No 1 = SFP 2 = TFP 3= FBP 4 = SF
Currently in feeding program? 0 = No 1 = SFP 2 = TFP 3= FBP 4= SF
Vit. A in last 6 mths 0 = No 1 =Yes
Measles Vaccine 0 = No 1 =Yes with EPI card 2 =Yes recall
DTP3 0 = No 1 =Yes with EPI card 2 =Yes recall
Has the child taken any drug for intestinal worms in the last six months? 0= No 1 = yes 2= Don’t know
Illness in past 2 weeks 0 = No 1 =Yes (If no skip to Question 17)
Type of Illness 0 = No 1 = Fever 2 = Cough/flu/cold 3 =Watery Diarrhea 4 = Bloody diarrhea 5 = Others(Specify)
If diarrhea is yes ,Was he/she given any of the following to drink at any time since he/she started having the diarrhea? 1. A fluid made from a special packet called Oralite or ORS? 2. A home-made sugar-salt solution? 3. Another home-made liquid such as porridge, soup, yoghurt, coconut water, fresh fruit juice, tea, milk, or rice water? 4. Zinc 5. Others (specify
Treatment 0 = None sought 1 =Hospital 2 = GOVT heath facility 3= FBO heath facility 4 = Mobile/outreach clinic 5=Village health care worker 6=Private physician 7=Relative/friend 8=Shop 9=Traditional practitioner 10=Pharmacy 11=Others( Specify)
Did the child sleep under a mosquito net(LLITN) last night? 1= Yes 2= No 3= Yes not LLITN
Female caetakers MUAC in cm
Physiological state of the female caretaker 1= Pregnant 2= lactating 3= Pregnant and Lactating 4= Not lactating nor pregnant
In your last pregnancy, did you take iron pills, sprinkles with iron, or iron syrup? 1= yes 2 = No 3= Don’t know
1
2 3 4 ` 5 6 7 8 9 10 11 12 13 14 15 16 17 18 19 20 21 22 23 24 25
Name Team Leader……………………………… Signiture…………………………………………

36
Annex 3: Calendar of events
MONTH Seasons 2006 2007 2008 2009 2010 2011
53 41 29 17 5
post election violence
52 40 28 16 4
formation of coalition government
51 39 27 15 3
50 38 26 14 2
Great Giriama Kaya elder - Simba
w anje died
49 37 25 13 1
48 36 24 12
59 47 35 23 11
58 46 34 22 10
census
referendum on constitution
57 45 33 21 9
56 44 32 20 8
55 43 31 19 7
54 42 30 18 6
Elections , start of post election
violence
preparation of land and start of
short rains start of planting
continuing of planiting and
weeding, national exams,
closing of schools
siku kuu, xmas, roasting of
maize
holiday closing of schools,
weeding, Pasaka (easter)
Heavy rains, opening of schools
second term
opening of schools, mwaka
mpya, hot month
Land preparation
Start of long rains, planting of
crops
opening of schools third term,
harvesting of cowpeas, maize
DECEMBER
(MWEZI WA KUMI NA MBIRI)
NOVEMBER
(MWEZI WA KUMI NA MWENGA)
OCTOBER
(MWEZI WA KUMI)
SEPTEMBER
(MWEZI WA CHENDA)
AUGUST
(MWEZI WA NANE)
JULY
(MWEZI WA FUNGAHE)
MAY
(MWEZI WA TSANO)
w indy, budget
cold month, lots of cold
(kipanya), roasting of maize
closing of school, show
mombasa, lots of weddings
and cultural festivals (mabulu,
nyere za mwezi)
FEBRUARY
(MWEZI WA HIRI)
JANUARY
(MWEZI WA KWANZA)
APRIL
(MWEZI WA WANE)
MARCH
(MWEZI WA HAHU)
JUNE
(MWEZI WA HANDAHU)
dro
ug
ht a
nd
fam
ile

37
Annex 4: Household mortality form
(To be conducted in EVERY HH from the random starting point until a total of 18 HHs are completed)
Team No:…..Date:.../..…/…… Cluster N0:/….. District:…………….Division……….. Location:…………sub location………………. Village………………………
1 2 3 4 5 6 7 8 9
HH ref' No.
TOTAL people in the
HH ( now)
Of the total, how many
are children <5 years
Joined HH Left HH
No. of births since the April
1st
TOTAL No. of dealths in the family since
April 1st
Of these deaths how many were children <5 who died since the April
1st
TOTAL people who have joined HH since the 1st April 2011 and are present now
Of the total, how many are <5s
TOTAL people who have left HH since the Ist April 2011
Of the total, how many are <5s
1
2
3
4
5
6
7
8
9
10
11
12
13
14
15
16
17
18
19
20
21
22
23
24
25
26
Name Team Leader……………………………… Signature…………………………………………
38
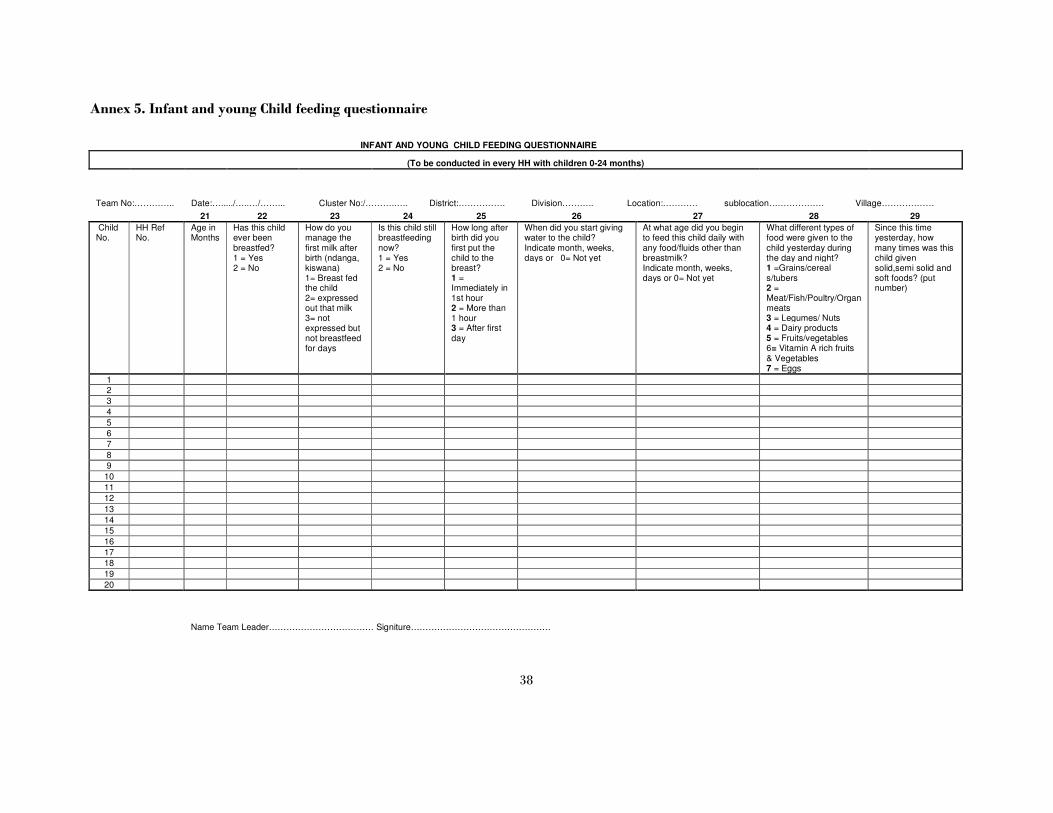
Annex 5. Infant and young Child feeding questionnaire
INFANT AND YOUNG CHILD FEEDING QUESTIONNAIRE
(To be conducted in every HH with children 0-24 months)
Team No:………….. Date:…...../…..…/……... Cluster No:/……….….. District:……………. Division……….. Location:………… sublocation………………. Village………………
21 22 23 24 25 26 27 28 29
Child No.
HH Ref No.
Age in Months
Has this child ever been breastfed? 1 = Yes 2 = No
How do you manage the first milk after birth (ndanga, kiswana) 1= Breast fed the child 2= expressed out that milk 3= not expressed but not breastfeed for days
Is this child still breastfeeding now? 1 = Yes 2 = No
How long after birth did you first put the child to the breast? 1 = Immediately in 1st hour 2 = More than 1 hour 3 = After first day
When did you start giving water to the child? Indicate month, weeks, days or 0= Not yet
At what age did you begin to feed this child daily with any food/fluids other than breastmilk? Indicate month, weeks, days or 0= Not yet
What different types of food were given to the child yesterday during the day and night? 1 =Grains/cereal s/tubers 2 = Meat/Fish/Poultry/Organ meats 3 = Legumes/ Nuts 4 = Dairy products 5 = Fruits/vegetables 6= Vitamin A rich fruits & Vegetables 7 = Eggs
Since this time yesterday, how many times was this child given solid,semi solid and soft foods? (put number)
1 2
3
4
5
6 7
8
9 10
11
12 13
14
15 16
17
18 19
20
Name Team Leader……………………………… Signiture…………………………………………

39
Annex 6: Water and Sanitation questionnaire
(To be conducted in every HH visited for the anthropometric questionnaire)
Team No:…………....Date:…..../…..…/…… Cluster N0:/…… District:…………….Division……….. Location:…………sublocation………………. Village………………………
30 31 32 33 34 35 36 37 HH Ref No.
What is the household's main drinking water source? ---------- 1=Borehole 2= Protected Shallow well 3=HH connection / Stand pipe /Tanker 4=Protected spring 5=Dam / Pond 6= River /Stream 7= Open shallow well 8= rain water roof harvesting 9=other (specify)
How long does it take to collect HH water (including travel to and from and waiting)? -------------- 1 = <30 mins 2 = <1hr 3 = < 2hrs 4 = < 4hrs 5 = >4hrs
How many litres (jerrycans) of water did the HH use yesterday in total (excluding water for clothes washing)? (define how many litres in a jerrycan if the popn all use the same)
What is done to the water before households members drink it? 1. Nothing 2.Boiling 3.Filtering with a cloth 4. Letting it settle 5. Chlorination 6. Tree leaves 7.Others(Specify)
Do you Wash Hands? 1= Yes 2= No
If yes, when do you usually wash your hands ? (more than one if appropriate - do not promt) --------- 1. After defecation/visiting toilet 2. Before handling food 3. After eating 4. Before feeding the child 5. After cleaning children’s bottom. 6. None of the above 7. Others specify
What do you use to wash hands? --------- 1 = water only 2 = water + soap 3 = water + ash 4 = Water and Sand 5=Other (specify)
Where does the household usually go to dispose human waste? (include more than one if necessary)? --------- 1 = Latrine 2 = Hole 3 = Designated open area 4 =
Undesignated open area 5 = Flush Toilet 6= Other (specify)
Name Team Leader……………………………… Signature…………………………………………

40
Annex 6: Food security questionnaire
(To be conducted in every HH visited for the anthropometric questionnaire)
Team No:………….. Date:.../..…/…… Cluster N0:/….. District:……………. Division……….. Location:………… sublocation………………. Village………………………
38 39 40 41 42 43 44 45 46 47 48
HH Ref No.
Who is the head of the household? 1. Adult Male 2. Adult Female 3. Child Male 4. Child Female
Main Occupation of the household head (enter code from list) 1. Livestock herding 2. Own farm labour 3. Employed(salaried) 4. Daily Labour 5. Small business/Petty trade 6. Unemployed 7. Retired 8. Housewife 9. Domestic help 10. Firewood/charcoal 11. Weaving/basketry 12. Fishing 13. Others (specify)
Highest educational status of the household head 1. None 2. Non formal 3. Primary Level 4. Secondary Level 5. Above secondary 6. Youth polytechniques 7. Other (Specify) ____
Highest educational status of the Spouse 1. None 2. Non formal 3. Primary Level 4. Secondary Level 5. Above secondary 6= Youth polytechniques 7. Other (Specify) ____
Does the household currently own livestock? 1. Yes 2. No 3. custodian of someelse cattle (If no skip to question 46)
If yes, which ones do you have? 1. Cattle 2. Goats 3. Sheep 4. Poutry 5. Donkey 6. Camels 7. Pigs 8. Rabbits
Did household milk any animal yesterday? 1. Yes 2. No
If yes what was the total amount milk produced? (ask in cups and convert it into litres)
Is the household currently engaged in crop farming? 1. Yes 2. No
If YES, type of crops have you planated in the current season? 1. Maize 21. Bananas 2. Sorghum 22.Sugarcane 3. Simsim 23. Arrow roots 4. Beans 24. French beans 5. Tomatoes 25. Green grams 6. Onion 26. Rice 7. Pawpaw 27. Cabbage 8. Mango 28. Sunflowers 9. Watermelon 29. capscicm (hoho) 10. Orange 30. Mashrooms 11. Kales/sukuma wiki 31. Others (specify) 12. ground nuts 13. Pumpkins 14. Okra 15. Millet 16. Cowpeas 17. Cassava 18. Sweet potatoes 19. Coconut 20. Pigeon peas
What is the main source of the dominant food item consumed 1=Own production 2= purchases 3=gifts from friends/ family 4= food aid 5= traded or bartered 6=borrowed 7=Gathering /wild 8= Others specify
Name Team Leader……………………………… Signature…………………………………………
41
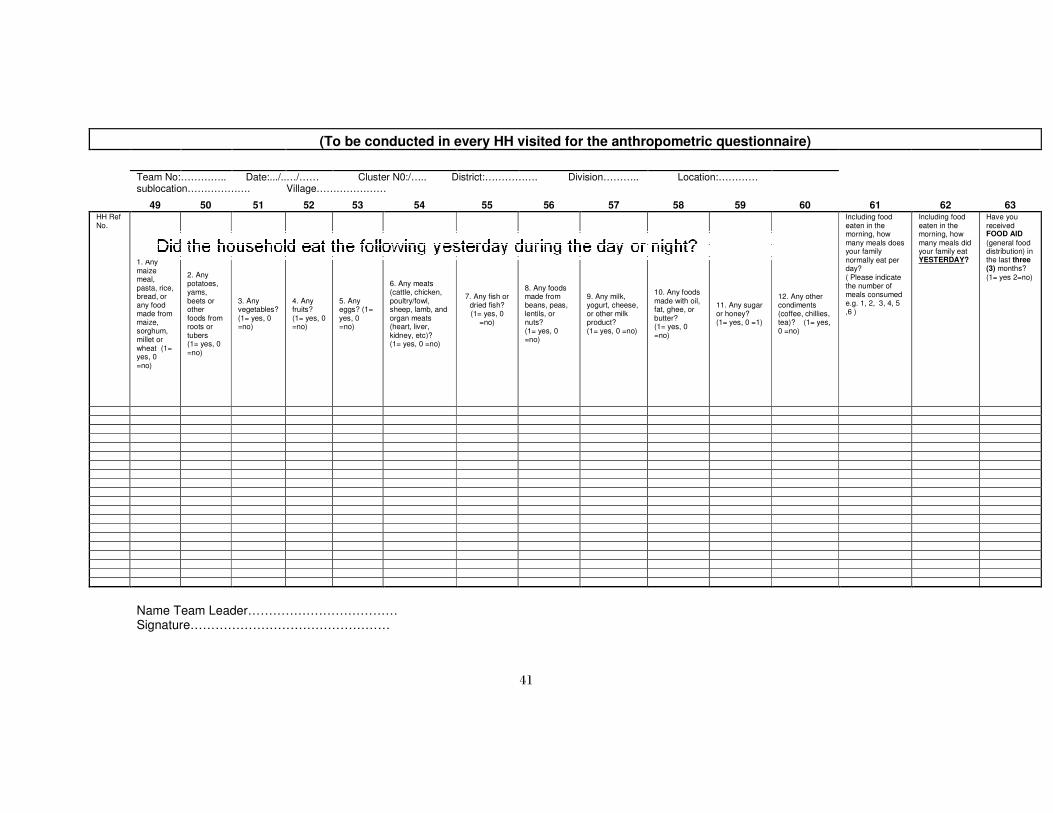
(To be conducted in every HH visited for the anthropometric questionnaire)
Team No:………….. Date:.../..…/…… Cluster N0:/….. District:……………. Division……….. Location:………… sublocation………………. Village…………………
49 50 51 52 53 54 55 56 57 58 59 60 61 62 63 HH Ref No.
1. Any maize meal, pasta, rice, bread, or any food made from maize, sorghum, millet or wheat (1= yes, 0 =no)
2. Any potatoes, yams, beets or other foods from roots or tubers (1= yes, 0 =no)
3. Any vegetables? (1= yes, 0 =no)
4. Any fruits? (1= yes, 0 =no)
5. Any eggs? (1= yes, 0 =no)
6. Any meats (cattle, chicken, poultry/fowl, sheep, lamb, and organ meats (heart, liver, kidney, etc)? (1= yes, 0 =no)
7. Any fish or dried fish? (1= yes, 0
=no)
8. Any foods made from beans, peas, lentils, or nuts? (1= yes, 0 =no)
9. Any milk, yogurt, cheese, or other milk product? (1= yes, 0 =no)
10. Any foods made with oil, fat, ghee, or butter? (1= yes, 0 =no)
11. Any sugar or honey? (1= yes, 0 =1)
12. Any other condiments (coffee, chillies, tea)? (1= yes, 0 =no)
Including food eaten in the morning, how many meals does your family normally eat per day? ( Please indicate the number of meals consumed e.g. 1, 2, 3, 4, 5 ,6 )
Including food eaten in the morning, how many meals did your family eat YESTERDAY?
Have you received FOOD AID
(general food distribution) in the last three (3) months? (1= yes 2=no)
Name Team Leader……………………………… Signature…………………………………………

42
Annex 7. Plausibility checks