final report - international growth centre...final report informality and the tax gap: a case of...
TRANSCRIPT
Final report
Informality and the tax gap: A case of non-farm enterprises in Ghana
Michael DanquahEric Osei-Assibey
August 2016 When citing this paper, please use the title and the following reference number:S-33206-GHA-1

1
Informality and the Tax Gap: A case of Non-Farm Enterprises in Ghana
By
Michael Danquah
Department of Economics, University of Ghana
&
Eric Osei-Assibey
Department of Economics, University of Ghana

i
Table of Contents
LIST OF TABLES ...........................................................................................................................ii
LIST OF FIGURES .........................................................................................................................ii
ABSTRACT .................................................................................................................................... iii
1.0 INTRODUCTION .................................................................................................................... 1
2.0 OVERVIEW OF TAXATION IN GHANA ............................................................................. 2
2.1 Introduction ........................................................................................................................... 2
2.2 Trends in Fiscal Outcomes .................................................................................................... 3
2.3 General Trends in Government Revenue .............................................................................. 4
2.3.1 Direct Taxes and Non-tax revenue ..................................................................................... 6
2.3.2 Indirect Taxes ..................................................................................................................... 6
2.3.3 International Trade Taxes................................................................................................... 7
2.0 LITERATURE REVIEW ......................................................................................................... 8
4.0 METHODOLOGY ................................................................................................................. 14
5.0 RESULTS AND DISCUSSION ............................................................................................. 19
5.1 Descriptive Statistics ........................................................................................................... 19
5.1.1 The Extent of Tax Payment and Tax Gap in Ghana ..................................................... 19
5.1.2 Firm owner’s characteristics and location .................................................................... 21
5.1.3 Firm level characteristics .............................................................................................. 24
5.2 Factors explaining firms’ propensity to pay tax and the tax gap ........................................ 27
Firm owner’s characteristics .................................................................................................. 27
Firm level characteristics ....................................................................................................... 28
6.0 Concluding Remarks ............................................................................................................... 31
7.0 Limitations of the study and recommendation for further research ........................................ 32
REFERENCES ............................................................................................................................. 34
APPENDIX ................................................................................................................................... 37

ii
LIST OF TABLES
Table 2.1 Trends in the composition of Government Revenue, 2002-2014 (% of Total)………...4
Table 2.2: Trends in composition of Direct Taxes-2004-2014 (%)………………………………5
Table 2.3: Trends in the composition of Indirect Taxes-2004-2014 (%)…………………………6
Table 2.4: Trends in the composition of International trade taxes (%)………………………….. 7
Table 4.1: Distribution of non-farm enterprises in GLSS 6 ………………………………..........14
Table 4.2: Quarterly tax payable by specified small scale enterprises….………………… ……15
Table 4.3: Definition of the explanatory variables used in the study……………………………17
Table 5.1: Tax Propensity, potential tax, actual tax and tax gap, by owner’s characteristics,
location and overall
outcome……………………………………………………………………………….................22
Table 5.2: Tax Propensity, potential tax, actual tax and tax gap by firm’s characteristics………25
Table 5.3 Logistic Estimation of Non-Farm Enterprise Propensity to pay Tax in
Ghana………………………………………………………………………………………….....28
Table 5.4: OLS Estimation of Non-Farm Enterprise Tax Gap in Ghana………………………..29
LIST OF FIGURES
Figure1: Trends in government expenditure and revenue (2002-2014)………………………….3
Figure 2: Estimated national amount (in GH¢) and % for potential, actual tax and tax gap…….20
iii
ABSTRACT
Broadening a country’s tax base plays a vital role in domestic revenue generation which in turn
influences economic growth and development. However, in Ghana greater majority of
individuals and businesses within the informal sector do not pay tax. This study attempts to
estimate the tax gap within the informal sector and also investigates determinants of the
propensity to pay tax among non-farm informal enterprises in Ghana. Using the sixth round of
the Ghana Living Standards Survey, the tax gap was estimated by computing the difference
between the potential and the actual annual tax payments. A logistic regression method was used
to ascertain the determinants of the propensity to pay tax whilst an Ordinary Least Square (OLS)
procedure was used to estimate the factors that explain the tax gap.
The study finds that the country’s informal sector has the potential to pay GH¢327,899,384.00 as
taxes. However, the actual tax paid in a year per our estimation is GH¢ 100,093,092.00. Thus the
estimated national tax loss is GH¢ 227, 806,292.00 per annum. Comparing the actual tax paid to
the revenue generated by enterprises within the informal sector indicates that the actual tax paid
represents just about 0.54% of their total revenue in a year.
The results from the econometric estimations of the study show that several firm owner and firm
level characteristics influence the propensity to pay tax as well as the tax gap in the informal
sector of Ghana. With regards to the firm owner’s characteristics, evidence from the study shows
that male firm ownership and having at least primary education qualification significantly
increases the propensity to pay tax and reduces the tax gap as expected. Also in line with
expectations, our estimates show that firm level variables such as firm sales, bank savings, type
of business, urban location as well as experience of the firm significantly increases the
propensity to pay tax and reduce the tax gap. The policy implications emanating from the study
are as follows: Firstly, there is the need to intensify public education, particularly towards
women micro entrepreneurs on their tax responsibilities; secondly, financial inclusion should be
vigorously promoted within the informal sector by government or the Bank of Ghana to make
more enterprises in this sector bankable, as a firm saving in the bank was found to correlate with
its propensity to pay tax.
Key Words: Tax Gap; Tax Propensity; Determinants and Informality
1
1.0 INTRODUCTION
Broadening a country’s tax base plays a vital role in domestic revenue generation which in turn
influences economic growth and development. Taxes are the main source of public revenue and
economic policies are often based on expected tax revenue. In other words, tax policy is a
fundamental component of the economic policies of every country. In order to ensure sustained
growth, it is desirable for every government to generate tax revenue to finance essential
expenditures without recourse to excessive public sector borrowing, which often crowds out
private sector investments. Considering the high tax evasions and avoidance within the informal
sector of many developing countries, widening the tax net to generate more revenue without
resorting to increasing tax rates (which has been found theoretically to depress growth), will be a
catalyst for economic growth. This is because many developing countries like Ghana suffer from
huge financing gaps/constraints that inhibit public sector investment expenditures in productive
sectors of the economy like roads, energy and educational infrastructure among others.
Ghana continues to record high budget deficit partly on account of low tax revenue which is
currently not more than 18 percent of GDP. While low domestic revenue mobilization has been a
major concern to government and development partners because of its crippling effect on
growth, there is an overarching concern that workers and enterprises within the formal sector are
overly being taxed, neglecting the large untapped informal sector. The collection of taxes within
the informal sector has always been a herculean task for governments despite the need to
broaden the tax nets. This is due to the sheer size and the disorganized nature of the sector. The
2010 Population and Housing census estimates that over 86 percent of the Ghanaian labour force
is employed within the private informal sector, which grew by more than 6 percentage points
within a decade. The greater majority of these workers are engaged in nonfarm micro/small
enterprises that are often not well organized or registered with any government agency. The
latest Ghana Living Standard Survey (GLSS 6) estimates that approximately 3.7 million
households, representing 44.3 percent of households in the country, operate non-farm
enterprises. Many economists, policy commentators and government officials, the Ministry of
Finance and Ghana Revenue authority, therefore, believe that the informal sector presents an
enormous opportunity to broaden the tax net and increase tax revenue generation if proper
policies are put in place. However, this assertion remains a conjecture or anecdotal since to date,
2
no empirical study has been carried out to gauge the extent of the tax gap within the informal
sector and the underlying factors. In this study, we use data from the sixth round of the GLSS to
estimate the extent of the tax gap within the informal sector and also investigate the determinants
of the propensity to pay tax as well as the underlying factors explaining the tax gap among non-
farm informal enterprises in Ghana.
The study is therefore relevant in many respects. Firstly, the findings from the study will give an
indication to policy makers about the extent of tax gap within the informal sector. This will help
to gauge the prospects of mobilizing tax revenue within the informal sector. Secondly, the
findings of the study with respect to factors explaining tax gap in the informal sector, will help
policy makers to design a more effective and appropriate policy tool to reduce the tax gap.
Finally, the findings and recommendations of the study would create the necessary awareness
about the nature and dynamics within the informal sector and the need to transform and
gradually formalize it to the greater benefit of all stakeholders in the society.
The remainder of the study is structured as follows: In Section 2, we present an overview of
taxation in Ghana. Sections 3 and 4 provide a discussion of the literature and methodology
respectively. The results are presented in Section 5. Section 6 focuses on the concluding remarks
whilst section 7 discusses the limitations of the study and gives recommendations for further
research.
2.0 OVERVIEW OF TAXATION IN GHANA
2.1 Introduction
Rising fiscal deficit continues to impede the developmental efforts of the Government of Ghana
in recent years. In 2012, Ghana recorded a fiscal deficit to GDP ratio of 11.8 % which is
considered to be the highest in recent times. In view of this challenge, the government set itself
the target of improving fiscal prudence by continuing with policies to enhance revenue
mobilization and the efficiency of public expenditures (ISSER, 2014). The focus of this section
of the study is to provide a descriptive overview of the tax policy measures and performance in
Ghana. Specifically, the section covers areas such as key fiscal indicators, trends in government
revenue, the proportion of households in non-farm enterprises as well as the tax stamp
classification in Ghana.
3
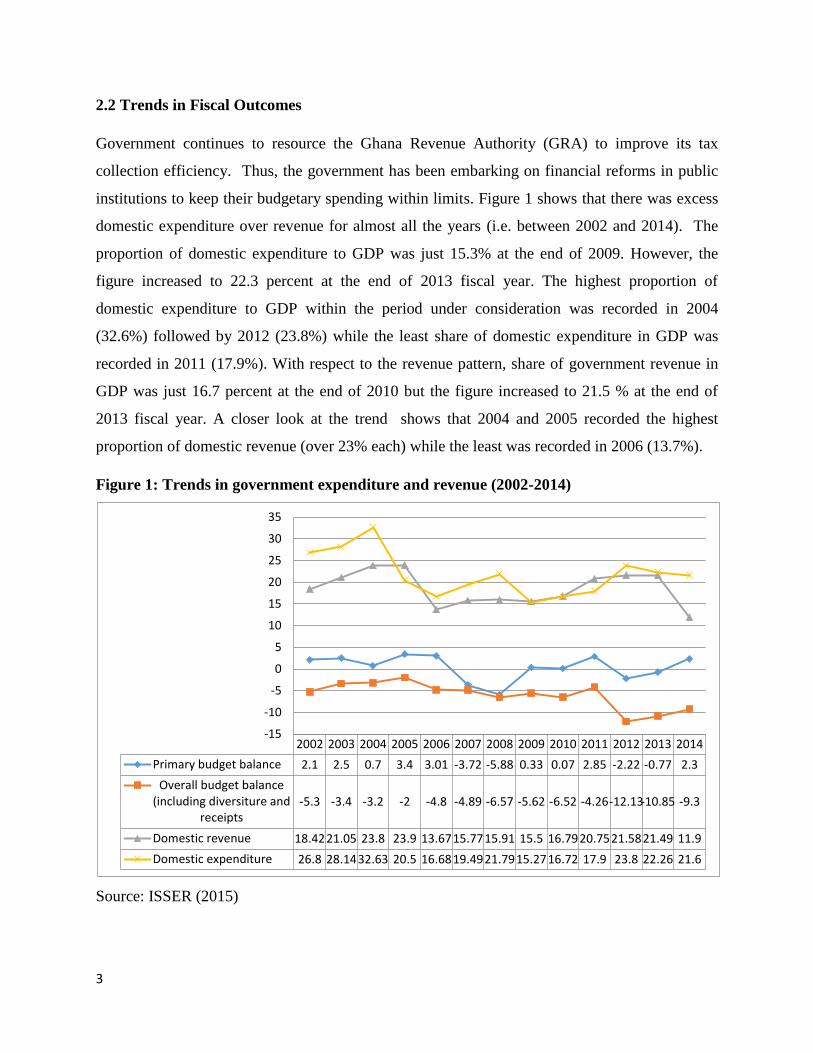
2.2 Trends in Fiscal Outcomes
Government continues to resource the Ghana Revenue Authority (GRA) to improve its tax
collection efficiency. Thus, the government has been embarking on financial reforms in public
institutions to keep their budgetary spending within limits. Figure 1 shows that there was excess
domestic expenditure over revenue for almost all the years (i.e. between 2002 and 2014). The
proportion of domestic expenditure to GDP was just 15.3% at the end of 2009. However, the
figure increased to 22.3 percent at the end of 2013 fiscal year. The highest proportion of
domestic expenditure to GDP within the period under consideration was recorded in 2004
(32.6%) followed by 2012 (23.8%) while the least share of domestic expenditure in GDP was
recorded in 2011 (17.9%). With respect to the revenue pattern, share of government revenue in
GDP was just 16.7 percent at the end of 2010 but the figure increased to 21.5 % at the end of
2013 fiscal year. A closer look at the trend shows that 2004 and 2005 recorded the highest
proportion of domestic revenue (over 23% each) while the least was recorded in 2006 (13.7%).
Figure 1: Trends in government expenditure and revenue (2002-2014)
Source: ISSER (2015)
2002 2003 2004 2005 2006 2007 2008 2009 2010 2011 2012 2013 2014
Primary budget balance 2.1 2.5 0.7 3.4 3.01 -3.72 -5.88 0.33 0.07 2.85 -2.22 -0.77 2.3
Overall budget balance(including diversiture and
receipts-5.3 -3.4 -3.2 -2 -4.8 -4.89 -6.57 -5.62 -6.52 -4.26-12.13-10.85 -9.3
Domestic revenue 18.4221.05 23.8 23.9 13.6715.7715.91 15.5 16.7920.7521.5821.49 11.9
Domestic expenditure 26.8 28.1432.63 20.5 16.6819.4921.7915.2716.72 17.9 23.8 22.26 21.6
-15
-10
-5
0
5
10
15
20
25
30
35

4
2.3 General Trends in Government Revenue
Government revenue in Ghana generally consists of tax and non-tax revenue. The discussion in
this section focuses on providing an insight into the general trend in government revenue over
the past decade. Broadly, government revenue encompasses direct taxes, indirect taxes and
international trade taxes.

5
Table 2.1 Trends in the composition of Government Revenue, 2002-2014 (% of Total)
Source: ISSER (2015)
ITEM 2002 2003 2004 2005 2006 2007 2008 2009 2010 2011 2012 2013 2014
TAX REVENUE 80.2 73.84 71.84 70.71 72.87 66.08 89.53 82.09 81.43 83.72 79.89 76.38 81.05
Direct Taxes 30.95 23.67 22.06 23.22 22.5 20.34 26.1 30.26 31.74 34.57 35.7 33.64 36.49
Indirect Taxes 27.16 31.89 33.32 33.05 33.4 28.28 31.92 28.17 25.78 26.7 22.62 25.8 26.98
Domestic Goods & Serv. 1.6 12.61 15.42 15.55 14.98 10.23 9.26 5.82 4.84 5.19 4.71 3.71 3.13
VAT 25.56 19.27 17.9 17.5 18.42 18.04 22.65 22.36 20.93 20.35 17.91 17.71 19.62
O/w VAT (Domestic) 7.87 5.92 6.03 6.43 7.17 7.29 8.69 8.33 8.39 8.46 6.84 7.12 8.02
VAT (Imports) 17.70 13.35 11.88 11.08 11.25 10.75 13.97 14.03 12.54 11.89 11.07 10.59 11.60
International Trade Taxes 22.09 18.28 16.46 14.44 16.97 12.47 14.98 13.44 14.83 12.98 12.83 16.94 17.58
Imports 18.00 13.70 12.39 12.21 13.06 11.75 14.15 13.15 13.6 12.94 12.17 11.91 12.50
Exports 40.08 4.59 4.07 2.23 3.91 0.73 0.83 0.3 1.22 0.04 0.67 0.53 1.33
Import Exemptions 4.99 9.91 5.61 5 5.43 5.02 4.49 3.75
NON-TAX REVENUE 19.68 20.15 25.09 24.41 22.78 25.86 9.04 15.33 15.86 15.60 18.40 22.77 17.92
Income & Fees 2.79 2.1 4.69 6.51 2.89 7.32 6.55 7.21 7.00 9.42 6.85 9.34 6.37
GRANTS 16.88 18.05 20.39 17.9 19.89 18.54 17.09 19.41 13.97 10.06 7.48 2.34 3.35
DIVESITURE & NPART 0.12 2.44 1.18 0.82 0.02 2.49 21.00 0.00 0.00 0.00 0.00 0.00 0.00
OTHER REVENUE
MEASURES (incl. NHIL)
0.00 3.57 1.89 4.06 4.33 5.57 6.62 8.74 6.8 5.87 5.43 4.39 3.28
GRAND TOTAL 100 100 100 100 100 100 100 100 100 100 100 100 100

6
2.3.1 Direct Taxes and Non-tax revenue
Since the year 2008, the contribution of direct taxes to total government revenue has been rising.
The only exception was in 2013 where the figure fell to 44.04% as compared to the previous
year’s figure of 44.69% (see Table 2.2). In 2014 however, direct tax increased to 45.02% which
was the highest ever reported in recent times as shown in Table 2.2. The main sub-components
of direct taxes are company taxes and Pay As You Earn (P.A.Y.E.). However, company tax on
oil is not a major component of direct tax. It is evident from Tables 2.2 and 2.3 that between
2011 and 2014, direct taxes contributed more to total government revenue as compared to
indirect taxes. This can be explained by the fact that direct taxes are more convenient to the tax
payer and are relatively easy to collect.
Table 2.2: Trends in composition of Direct Taxes-2004-2014 (%)
ITEM 2004 2005 2006 2007 2008 2009 2010 2011 2012 2013 2014
(% of Total Tax
Revenue):
30.71 32.84 30.88 30.78 29.15 36.86 38.98 41.29 44.69 44.04 45.02
P.A.Y.E.
(Personal)
35.71 36.81 43.32 42.7 42.01 45.05 41.35 33.71 39.82 37.57 35.13
Self-Employed 5.35 5.24 4.96 5.52 5.46 4.24 4.08 3.28 2.96 2.88 2.44
Companies 43.79 46.99 41.95 42.52 43.02 38.55 40.25 38.84 42.66 36.75 36.31
Company Taxes
on oil
- - - - - - - - 0.00 6.65 10.14
Others 15.15 10.96 9.78 9.27 9.51 12.16 14.32 24.16 14.57 16.16 15.98
Total 100 100 100 100 100 100 100 100 100 100 100
Source: ISSER (2014& 2015)
2.3.2 Indirect Taxes
Indirect taxes have experienced several fluctuations over the years as depicted in Table 2.3.The
contribution of indirect taxes to total revenue witnessed a marginal decline from 45.19% in 2004
to 44.2% in 2005 but recovered slightly to 45.83% in 2006. The contribution of indirect taxes
however, decreased substantially from 45.83% in 2006 to 28.31% in 2012. By the end of 2014,
indirect taxes accounted for 33.29% which was lower than that of the previous year (33.78%) in

7
2013. VAT constitutes to be a major component of indirect taxes followed by the National
Health Insurance Levy (NHIL). Another component of indirect taxes - excise duties (which is the
main focus of this study) obtained the least share. Excise duties declined from 3.5% in 2013 to
2.23% in 2014.
Table 1.3: Trends in the composition of Indirect Taxes-2004-2014 (%)
ITEM 2004 2005 2006 2007 2008 2009 2010 2011 2012 2013 2014
(% of Total Tax Revenue): 45.19 44.2 45.83 42.79 35.65 34.32 31.66 30.38 28.31 33.78 33.29
VAT 53.73 52.96 55.16 63.81 70.98 79.35 81.21 80.01 79.18 68.63 72.74
VAT (Domestic) 18.08 19.45 21.47 25.8 27.22 29.56 32.55 30.72 30.26 27.6 29.73
VAT (Import) 35.65 33.51 33.68 38.01 43.76 49.79 48.66 49.29 48.92 41.04 43.01
Petroleum Tax 38.65 39.84 38.19 30.85 25.2 17.44 12.87 14.56 15.52 10.86 9.39
Other Indirect Taxes
(Excise)
7.62 7.2 6.65 5.34 3.83 3.22 5.92 5.43 5.3 3.5 2.23
NHIL - - - - - - - - - 13.4 12.17
Communication Service Tax- - - - - - - - - 3.6 3.48
Total 100 100 100 100 100 100 100 100 100 100 100
Source: ISSER (2014& 2015)
2.3.3 International Trade Taxes
International trade tax has increasingly become a key component of government tax revenue
over the years. As shown in Table 2.4, international trade taxes increased from 16.37% in 2009
to 18.21% in 2010. In 2014, international trade taxes obtained 21.69% of total tax revenue which
represents a marginal decrease over the previous year (22.18%) in 2013. The main sub-
components of this tax type are import duty and export duty. Import duty constituted 76.96 % of
total tax revenue from international trade in 2006 and this increased to 97.8% by the close of
2008. At the end of 2014, import duties recorded 71.10% and this compares with 70.31% for the
previous year, 2013. However, export duties and import exemptions are not major sources of
government revenue.

8
Table 2.4: Trends in the composition of International trade taxes (%)
ITEM 2004 2005 2006 2007 2008 2009 2010 2011 2012 2013 2014
(% of Total Tax
Revenue):
22.33 19.31 23.29 18.88 16.73 16.37 18.21 15.51 16.06 22.18 21.69
Imports Duties 75.28 84.57 76.96 94.19 97.8 94.55 91.74 99.67 94.82 70.31 71.10
Exports Duties 24.72 15.42 23.04 5.81 2.20 5.45 8.26 0.33 5.18 3.15 7.57
Import Exemptions - - - - - - - - - 26.54 21.33
Total 100 100 100 100 100 100 100 100 100 100 100
Source: ISSER (2014 & 2015)
2.0 LITERATURE REVIEW
This section reviews literature on tax gap and on empirical evidence of the determinants of tax
avoidance or tax propensity across the developing countries.
Definition of Tax Gap
The tax gap in broad terms is defined as the difference between tax revenues collected and those
that would be theoretically expected to be collected in the absence of any evasion or late
payment. This implies that once a theoretical tax base is established, a tax gap can, in principle,
be calculated1. Tax liability is therefore defined so as to include all tax that is due under either
the letter or the spirit of the law. This implies that the tax gap revenue loss equates to the
shortfall resulting from fraud, error, non-payment and artificial avoidance schemes (Gemmell
and Hasseldine, 2012).
Another approach which is commonly used by authors in identifying the tax gap is by first
defining the ‘hidden economy’ or ‘hidden income’ - income that is earned but is hidden from the
1 In the U.S. the ‘official’ IRS definition is simply the difference between the tax that taxpayers should
pay and what they actually pay on a timely basis. According to the HM Revenue and Customs (HMRC)
in the U.K, the term “tax gap” refers to the difference between tax collected and that, which in HMRC’s
view, should be collected.

9
tax authorities and, usually, official statisticians – and then the hidden income is multiplied by a
suitable tax rate to obtain the tax gap. (Giles, 1999; Cobham, 2005)
Usually, a distinction is made between the gross tax gap and the net tax gap. Thus, the gross tax
gap is the difference between tax liability in any year and the amount of tax that is paid voluntary
and on time whilst the net tax gap is the gross tax gap in any tax year less payments of that year’s
tax liability that come in later through either voluntary late payments or enforcement activities of
the tax authorities. However, payments of interest and penalties associated with late payments or
underreported tax liability are not counted in either the gross or net tax gap measures. The gross
tax gap has three components — non-filing, underreporting of tax owed, and underpayment. The
three components are mutually exclusive and add up to the total tax gap. The non-filing gap is
the tax not paid on time by taxpayers who have a legal requirement to file a tax return, but do not
file on time. The underreporting gap is the tax owed by taxpayers who file returns on time, but
underreport the amount of tax they owe. The underpayment gap is the loss of revenue owed by
taxpayers who file returns on time, but do not pay their reported tax due on time (Toder, 2007;
Mazur and Plumley, 2007).
Khwaja and Iyer (2014) also distinguished between the revenue potential based on economic
fundamentals of countries and that based on what the legal framework prescribes, that is, one
related to the intrinsic economic structure and strength of countries that affect revenue potential
and the other related to tax policy variables. This suggests that there are two sets of revenue
potentials: one can be termed “revenue potential (economic),” and the other “revenue potential
(legal).
Therefore, the difference between the revenue potential (legal) and the actual revenue collected
is the tax gap whereas the difference between the revenue potential (economic) and the actual
revenue collected can be termed the “tax space”. Tax space is thereby the amount of revenue that
a country can afford to collect, given its economic strength, not based on what the parliament has
mandated (Khwaja and Iyer, 2014).
It is also worthy to note that even though the tax gap is usually studied within the context of the
underground economy (informal economy), it is not synonymous with the latter; there might be
10
some overlapping. The underground economy in some respects comprises illegal activities which
are not considered in the estimation of the tax gap (Mazur and Plumley, 2007).
Empirical Estimates and Determinants of Tax Gap
Measuring the tax gap is a challenging task due to the fact that the phenomenon is difficult to
observe and precise data is inadequate. This challenge is further compounded by the lack of the
necessary high-quality data particularly in developing countries (GIZ Sector Programme Public
Finance, Administrative Reform, 2010). Moreover, there is a lack of consensus on the
appropriate methodology for estimating the extent of the informal sector even though in most
countries the existence of the informal sector is incontrovertible (Georgiou, 2007). Thus,
numerous studies have attempted to empirically quantify the size of the informal sector and
consequently the magnitude of the tax gap. The techniques generally employed can be
categorized into macro and micro approaches.
Macro Approaches
The macro approach also known as the top-down approach relies on highly aggregated data to
estimate a country’s informal economy. Therefore, the effective tax rate of the formal sector can
be applied to the estimated informal economy to generate the amount of potential tax that is not
being collected by the tax authorities (Ahmed and Rider, 2008). According to Vuletin (2008), the
macro approaches which are usually used to estimate the size of the informal sector and
consequently the tax gap include: the discrepancy between the national expenditure and income
statistics or national accounts method (MacAfee,1980); Currency demand or currency ratio
method (Cagan, 1958, Gutmann, 1977; Tanzi,1980, 1983), Transactions method (Feige, 1979);
Electricity consumption method (Johnson et al., 1997); Discrepancy between official and actual
labour force or Labour market measures (Contini,1981) and MIMIC (Multiple indicators
multiple causes) (Frey and Weck-Hanneman,1984).
Micro Approaches
Micro approaches otherwise termed as bottom-up approaches or direct approaches to estimating
the shadow economy exploit data on individual tax payers and rely on surveys, questionnaires,
interviews or information retrieved from tax audits. Data from these sources are then used to

11
construct estimates of the shadow economy using microeconomic or micro-econometric methods
(Schneider and Williams, 2013).
Empirical Estimates of Tax Gap
Employing an input-output table (I-O) table, Aguire and Shome (1988) estimate the potential
VAT revenue for the Mexican economy for the period before and after a change in the VAT
structure. The Mexican government first introduced the VAT system in 1980 with a single
general rate of 10 percent with a few exceptions (mainly agriculture); a zero rate applied to
almost exclusively to exports; and a special tax regime for small businesses. However, in 1983
the rates for the VAT were revised upward and thus the standard rate was pegged at 15 percent
while a special rate of 6 percent for agricultural products and medicines was introduced. Also, a
special rate of 20 percent was levied on luxury goods like caviar and cable TV. The findings of
the estimation indicate a tax gap of 45.1 percent and 48.3 percent for 1980 and 1983
respectively.
Also, relying on the Nepalese Household Budget Survey data and input-output (I-O) tables,
Jenkins and Kuo (2000) estimate the sales tax gap for the 1993/94 fiscal year. The results show
that the tax gap was 6 percent, ten percent and 48 percent for alcoholic beverages, tobacco
products and the remaining taxable commodities respectively. The VAT tax gap in Romania was
estimated to be 45.6 percent in 2002. The results were obtained with the aid of the 2002 input-
output (I-O) matrices consisting of 34 economic sectors. Thus, the final consumption in each
sector was reduced by the amount of exemptions and zero-ratings, increased by the volume of
inputs in sectors producing exempted commodities and adjusted for the sales net of inputs
purchased by small businesses with gross receipts less than the registration threshold to obtain
the taxable base. The potential VAT revenue was obtained by multiplying the computed tax base
for each sector by the weighted average VAT rate (Minh, 2007).
Ahmed and Rider (2008) estimate the tax gap for Pakistan with the aid of the 2004/05 Household
Integrated Expenditure Survey, the Labour Force Survey and an 81-sector input-output (I-O)
matrix for the Pakistani economy for the 2004/2005 fiscal year. The study used micro-simulation
models to obtain the potential tax for each federal tax and the results reveal that in the 2004/2005
fiscal year the tax gap was in the region of 45 percent – direct tax gap being approximately 65
12
percent and the indirect tax gap being 35 percent. Similarly, Martin-Vazquez et al (2008)
estimated the individual income tax gap for the Russian Federation to be 45 percent of potential
tax liabilities in 1996 using Household Income Expenditure Survey data from the Russian
Longitudinal Monitoring Survey.
Novysedlák and Palkovičová (2012) present the estimates of the total tax loss and the tax gap for
value added tax for the Slovakian economy using calculations based on both output tables and on
nominal GDP net of the items not subject to VAT. The results demonstrate that the total VAT
loss in 2010 reached €2.3 billion, which represents 3.5% of GDP. From the total VAT loss, the
tax administration was able to capture and identify less than 30%. The remaining 70% represents
the tax gap, i.e., the tax liability which had not yet been identified. Almost half of the tax loss
(1.6% of GDP) was attributable to lower effectiveness of tax collection compared to the EU
average. In other words, if the effectiveness of tax collection were on par with the EU average,
the basic VAT rate could have been 4.7 percentage points lower (14.3% in 2009) to generate the
current level of VAT revenue or, if maintained, it would have increase revenue by 1.6% of GDP
(€1.1 billion).
Harremi (2014) estimates the tax gap for the Balkan region for the 2011 and 2012 fiscal years by
employing the MIMIC estimation procedure. The findings reveal that the informal economy
made up 33% and 32.61% of the GDP of the region in 2011 and 2012 respectively. Also, the tax
gap for the 2011 and 2012 fiscal years were 34.89% and 27.35% respectively. Serbia recorded
the highest tax gap (46%) whilst Greece had the lowest tax gap (17.6%) in the 2011 fiscal year.
In 2012, the tax gap for Serbia was still the highest (44%) whilst Croatia posted the lowest tax
gap (17%).
In Ghana, Asante (2012) attempts to provide estimates of the size of the underground economy
and estimates of tax evasion between 1990 and 2010. By using the Stock-Watson Dynamic
Ordinary Least Squares (DOLS) estimate for currency demand, the paper indicates that on the
average, the underground economy accounts for 48% of the official GDP. Also, the estimated
evaded tax ranges from 4% to about 14% of the official economy.
13
Determinants of Tax Evasion
Some authors have also explored the issue of the determinants of tax evasion and tax
compliance. Applying a combination of factor analysis and regression techniques, Yalama and
Gumus (2013) suggest education and income have negative effects on tax evasion in Turkey.
The impact of gender and age are however not statistically significant. Helhel and Ahmed (2014)
employ a Likert scale technique to evaluate the tax compliance of individual taxpayers in
Yemen. Taking into consideration demographic factors, the responses show that females were
found to be more compliant than males to taxation whereas age in general was not a significant
factor. However, older group was found to be more compliant compared to young.
Akinboade (2014) in an attempt to assess tax registration and filing compliance by medium size
businesses in the Littoral and Central Region of Cameroon shows that business location in
Littoral province (a less rurally populated region than Central Province) is associated with
registration and filing compliance. However, operating in the manufacturing sector is negatively
associated with registration compliance even though it has no effect on filing compliance. Age
and gender of business owner; and awareness of their SME status have no impact on tax
compliance. Moreover, the higher the educational level of the business owner the higher the
probability of being tax registration compliant. However, older businesses are less likely to be
filing compliant.
Annan et al. (2013) employs the currency demand model to investigate the determinants of tax
evasion in Ghana from 1970 to 2010. Using an Auto-Regressive Distributed Lag (ARDL)
technique, the short run model shows that per capita income, the average tax rate, age and
inflation are positive and significantly associated with tax evasion while gender (i.e. the
proportion of the population that is female) shows an inverse and significant relationship with tax
evasion. The error correction term is negative and statistically significant which suggests that 45
per cent of the deviation from equilibrium tax evasion is corrected each year. Moreover, Antwi et
al. (2015) investigates the impact of demographic characteristics on the tax compliance of small
and medium scale enterprises (SMEs) in the Tamale Metropolis in Ghana. Using questionnaires,
the paper reveals that women entrepreneurs are more non-compliant to tax laws and rules than
male entrepreneurs; younger entrepreneurs are less compliant as compared to their older
counterparts and entrepreneurs with higher education tend to have lower non-compliance rate.

14
4.0 METHODOLOGY
Estimation Technique/procedure
This study employs a micro approach to examine the tax situation in the Ghanaian non-
farm/informal sector. The informal sector in this study includes all non-farm businesses or
enterprises that are not registered with the Registrar General. To achieve the objectives of the
study, we first compute the tax gap followed by two separate estimations to explain the firms’
propensity to pay tax as well as the tax gap respectively. Both estimations use the same
explanatory variables (see Table 4.3).
Model 1
The logit regression is employed to explain the firms’ propensity to pay tax. It is specified in
equation (1) as:
Pr( 1) ...........................................................................1PT X
where:
The dependent variable, Pr( 1)PT , takes a value of 1 if the firms pays tax and 0 if otherwise;
is the constant term; is a vector of coefficients to be estimated; X is a vector of explanatory
variables; and is the error or disturbance term.
Model 2:
The OLS regression is also used to explain the (computed) tax gap in the informal sector. It is
specified in equation (2) as:
..............................................................................2TaxGap X
where:
The dependent variable (TaxGap) measures the difference between firms’ potential annual tax
payment and actual annual tax payment (in GH¢); is the constant term; is a vector of
coefficients to be estimated; X is a vector of explanatory variables; and being the error or
disturbance term.
15
Measurement of the tax gap
The dataset used for the study is obtained from the round six of the Ghana Living Standards
Survey (GLSS 6) which was conducted by the Ghana Statistical Service (GSS) in 2012/2013
across all the 10 regions of Ghana. This is a nationally representative survey data and hence,
findings from this study can largely be generalized. The survey collected detailed information on
non-farm activities in the country including data on whether a firm pays tax or not and the actual
tax (in GH¢) paid by firms. Also, the data contains information on demographic characteristics
including gender, education and age. Since the GLSS 6 dataset does not capture the potential tax
payment by firms, we relied on the Internal Revenue (Amendment) Regulations, 2011 which
provides information on the potential tax of firms who make less than GH¢ 90,000 annual sales.
The activities of non-farm enterprises are generally classified into manufacturing, trading and
other activities. In Ghana, nationwide estimates show that more than two-fifths of the households
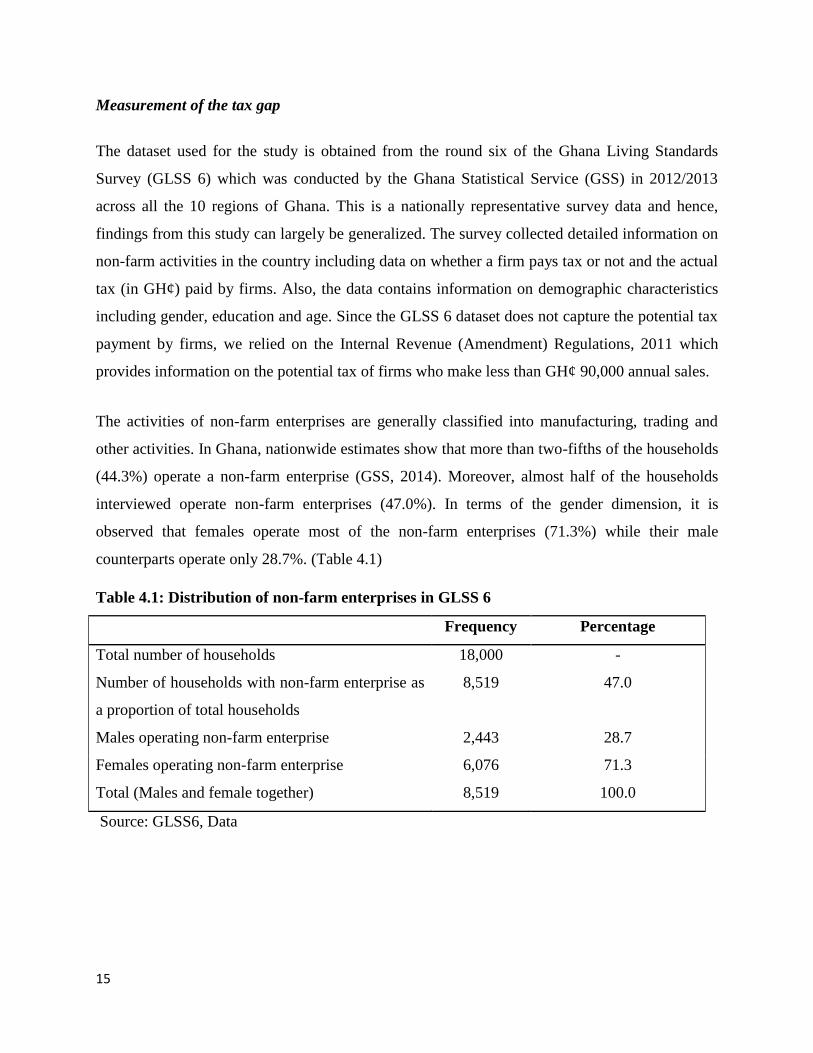
(44.3%) operate a non-farm enterprise (GSS, 2014). Moreover, almost half of the households
interviewed operate non-farm enterprises (47.0%). In terms of the gender dimension, it is
observed that females operate most of the non-farm enterprises (71.3%) while their male
counterparts operate only 28.7%. (Table 4.1)
Table 4.1: Distribution of non-farm enterprises in GLSS 6
Frequency Percentage
Total number of households 18,000 -
Number of households with non-farm enterprise as
a proportion of total households
8,519 47.0
Males operating non-farm enterprise 2,443 28.7
Females operating non-farm enterprise 6,076 71.3
Total (Males and female together) 8,519 100.0
Source: GLSS6, Data
16
Estimating the Potential Tax Payment by Non-farm Enterprises using Tax Stamp in Ghana
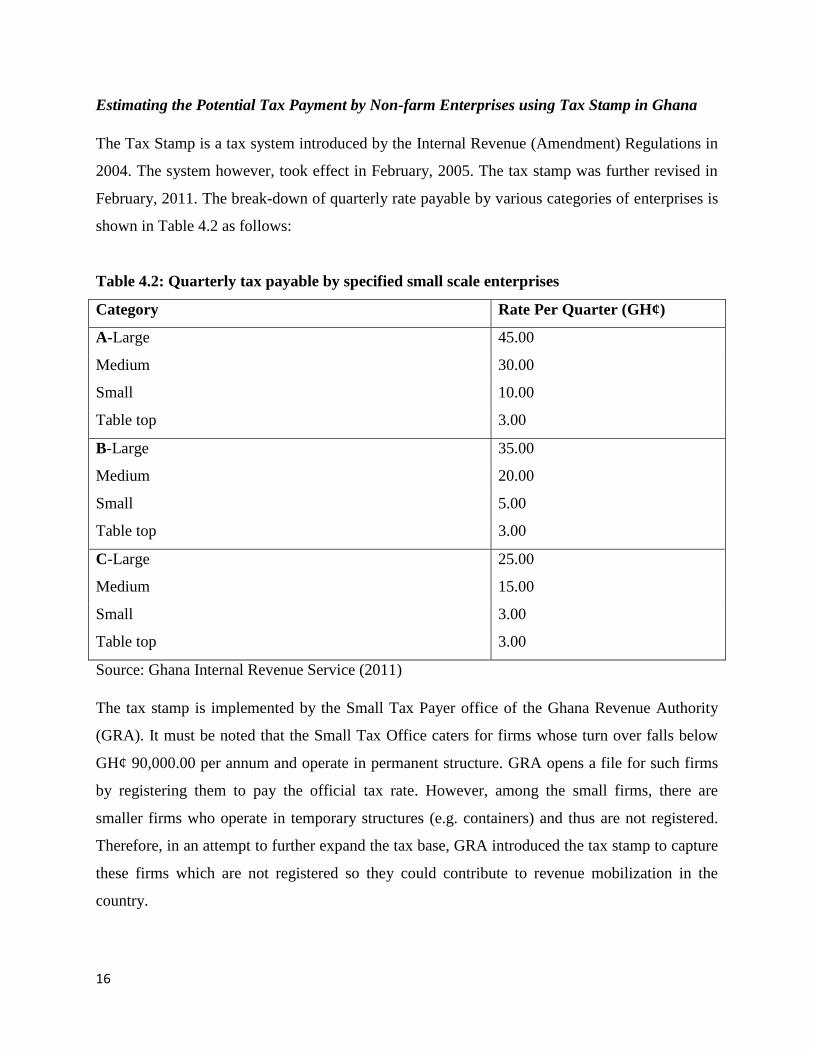
The Tax Stamp is a tax system introduced by the Internal Revenue (Amendment) Regulations in
2004. The system however, took effect in February, 2005. The tax stamp was further revised in
February, 2011. The break-down of quarterly rate payable by various categories of enterprises is
shown in Table 4.2 as follows:
Table 4.2: Quarterly tax payable by specified small scale enterprises
Category Rate Per Quarter (GH¢)
A-Large 45.00
Medium 30.00
Small 10.00
Table top 3.00
B-Large 35.00
Medium 20.00
Small 5.00
Table top 3.00
C-Large 25.00
Medium 15.00
Small 3.00
Table top 3.00
Source: Ghana Internal Revenue Service (2011)
The tax stamp is implemented by the Small Tax Payer office of the Ghana Revenue Authority
(GRA). It must be noted that the Small Tax Office caters for firms whose turn over falls below
GH¢ 90,000.00 per annum and operate in permanent structure. GRA opens a file for such firms
by registering them to pay the official tax rate. However, among the small firms, there are
smaller firms who operate in temporary structures (e.g. containers) and thus are not registered.
Therefore, in an attempt to further expand the tax base, GRA introduced the tax stamp to capture
these firms which are not registered so they could contribute to revenue mobilization in the
country.
17
From Table 4.2, we observe that the tax stamps are assigned differently according to the size of
the enterprise and the category of activities undertaken by the firm. Category A activities
comprises retail traders, susu collectors, drinking and chop bar owners, bakeries, business
centres, estates and accommodation agents, block and terrazzo manufacturers, sand and stone
winners and contractors and licensed diamond and gold winners and buyers; category B
embraces dress makers and tailors, hairdressers, beautician and barbers, artisans and hiring
services, freelance photographers and car washing bays; and category C is made up of butchers,
individual undertakers, corn and other millers, charcoal and firewood vendors, vulcanizers and
alignment operators, shoe and equipment repairs, traditional healers and other businesses
determined by the minister and published in the Gazzete.
However, due to the fact that the definition of the size of the enterprise (that is whether it is
small, medium or large) is not clearly spelt out in the Regulations, the tax officials – based on
experience– subjectively levy the firms. This information regarding how tax officials collect the
tax stamp was relayed to the research team through an interview conducted on 24th August, 2015
at the Small Tax Payer Office at Madina.
As mentioned earlier, the Internal Revenue Regulations classifies firms with turnover below
GH¢90,000 as small-scale enterprises and thus we exclude all firms that fall outside this
threshold in the non -farm enterprise dataset of the GLSS 6 reducing our sample from 8,518 to
7,440 non-farm enterprises. Since the tax officials impose the tax stamps subjectively, we
devised a working definition to help us place the firms into the three main enterprise-size type
(that is small, medium or large) so as to assign the appropriate tax stamps to the firms. Firstly,
we compute the (arithmetic) mean of the firms’ annual sales. Then, the firms that had their
annual sales less than the mean annual sales (that is, GH¢ 4799.707) were classified as small;
firms that had annual sales from the mean (GH¢ 4799.707) up to 175 percent, that is 1.75 times
the mean annual sales (thus, GH¢ 8399.4873) were also classified as medium; and firms that had
annual sales exceeding GH¢ 8399.4873 were defined as large. After defining firms into small,
medium and large, we then apply the tax stamp under each business category (see Table 4.2).
Under category A, an annual tax stamp of GH¢ 40, GH¢ 120 and GH¢ 180 were assigned to
small, medium and large firms respectively. An annual tax stamp of GH¢ 20, GH¢ 80 and GH¢
140 were assigned to small, medium and large firms which are found in category B respectively.
18
For category C, the annual tax stamp of GH¢ 12 and GH¢ 100 were assigned to small and large
firms respectively (this category had no medium firm).
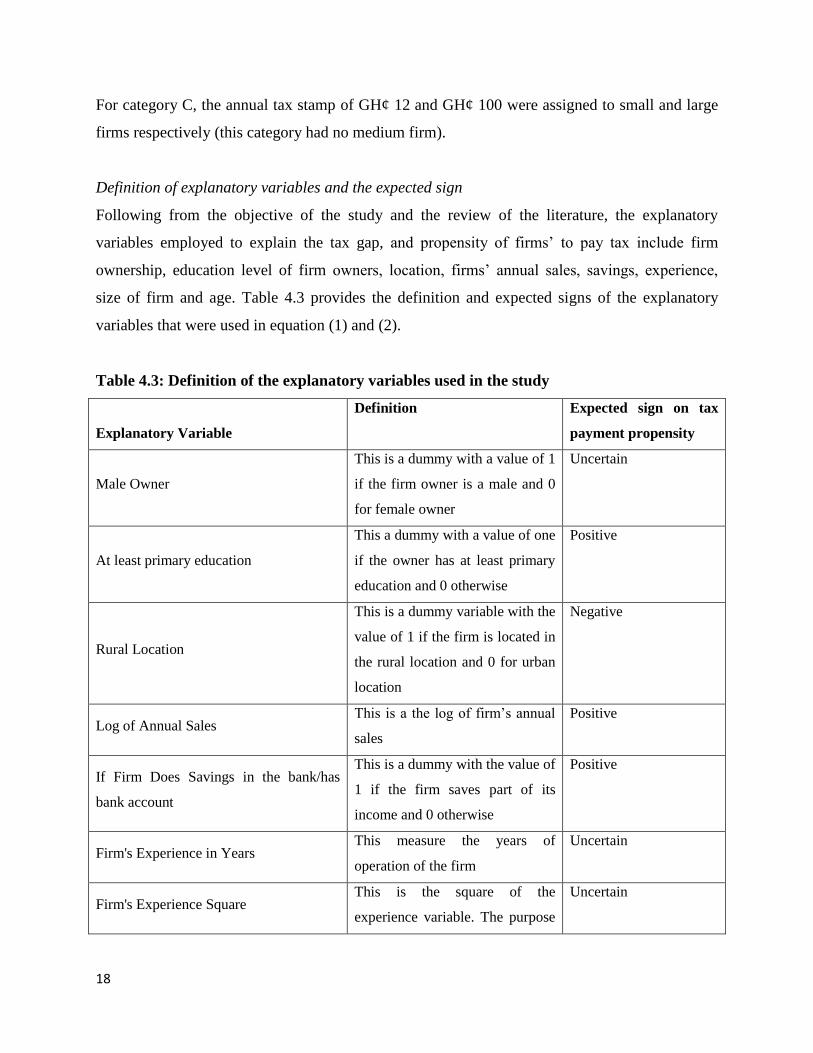
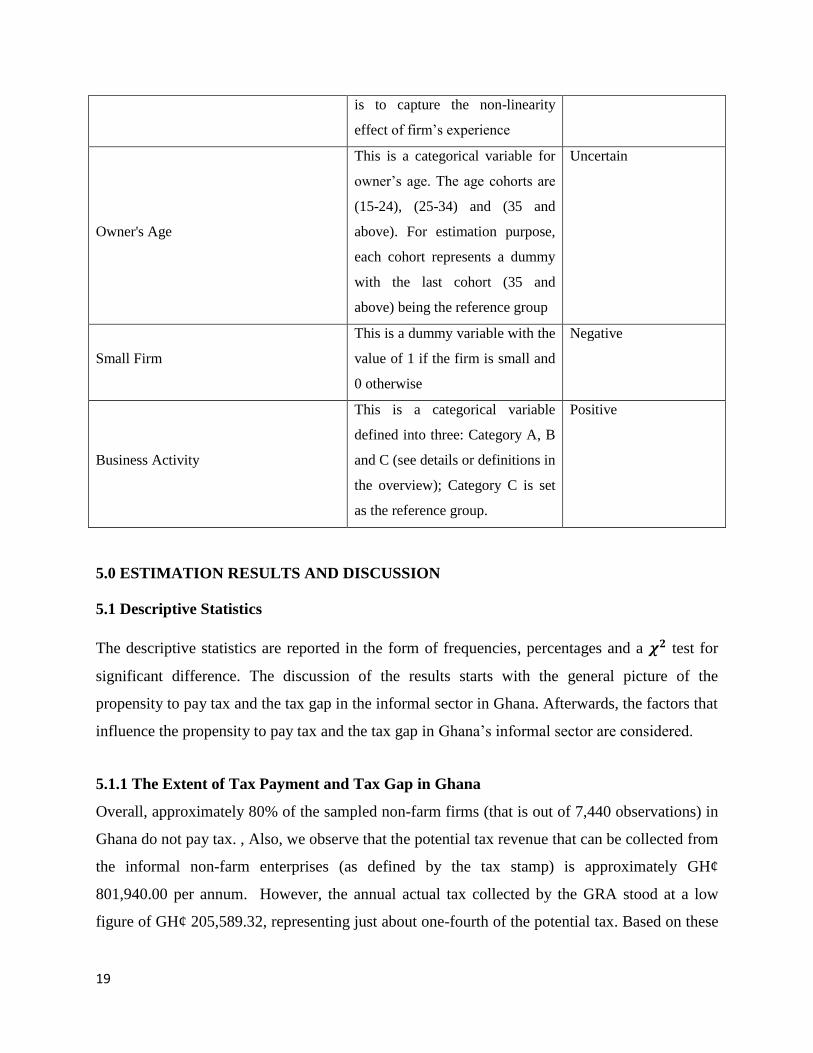
Definition of explanatory variables and the expected sign
Following from the objective of the study and the review of the literature, the explanatory
variables employed to explain the tax gap, and propensity of firms’ to pay tax include firm
ownership, education level of firm owners, location, firms’ annual sales, savings, experience,
size of firm and age. Table 4.3 provides the definition and expected signs of the explanatory
variables that were used in equation (1) and (2).
Table 4.3: Definition of the explanatory variables used in the study
Explanatory Variable
Definition Expected sign on tax
payment propensity
Male Owner
This is a dummy with a value of 1
if the firm owner is a male and 0
for female owner
Uncertain
At least primary education
This a dummy with a value of one
if the owner has at least primary
education and 0 otherwise
Positive
Rural Location
This is a dummy variable with the
value of 1 if the firm is located in
the rural location and 0 for urban
location
Negative
Log of Annual Sales This is a the log of firm’s annual
sales
Positive
If Firm Does Savings in the bank/has
bank account
This is a dummy with the value of
1 if the firm saves part of its
income and 0 otherwise
Positive
Firm's Experience in Years This measure the years of
operation of the firm
Uncertain
Firm's Experience Square This is the square of the
experience variable. The purpose
Uncertain
19
is to capture the non-linearity
effect of firm’s experience
Owner's Age
This is a categorical variable for
owner’s age. The age cohorts are
(15-24), (25-34) and (35 and
above). For estimation purpose,
each cohort represents a dummy
with the last cohort (35 and
above) being the reference group
Uncertain
Small Firm
This is a dummy variable with the
value of 1 if the firm is small and
0 otherwise
Negative
Business Activity
This is a categorical variable
defined into three: Category A, B
and C (see details or definitions in
the overview); Category C is set
as the reference group.
Positive
5.0 ESTIMATION RESULTS AND DISCUSSION
5.1 Descriptive Statistics
The descriptive statistics are reported in the form of frequencies, percentages and a 𝝌𝟐 test for
significant difference. The discussion of the results starts with the general picture of the
propensity to pay tax and the tax gap in the informal sector in Ghana. Afterwards, the factors that
influence the propensity to pay tax and the tax gap in Ghana’s informal sector are considered.
5.1.1 The Extent of Tax Payment and Tax Gap in Ghana
Overall, approximately 80% of the sampled non-farm firms (that is out of 7,440 observations) in
Ghana do not pay tax. , Also, we observe that the potential tax revenue that can be collected from
the informal non-farm enterprises (as defined by the tax stamp) is approximately GH¢
801,940.00 per annum. However, the annual actual tax collected by the GRA stood at a low
figure of GH¢ 205,589.32, representing just about one-fourth of the potential tax. Based on these

20
statistics, the informal sector reports an annual aggregated tax gap or loss of about GH¢
596,350.70, representing almost 75 percent of the potential tax (see Table 5.1).
It must be noted that the actual tax, potential tax and tax gap were estimated using the sample of
7440 firms and thus to scale up these estimates to the national level, we apply the sampling
weight used in the GLSS 6 data collection.2 Based on this computation, we arrive at a national
potential and actual taxes of GH¢ 327,899,384.00 and GH¢ 100,093,092.00 respectively,
resulting in an estimated national tax gap or loss of approximately GH¢ 227, 806,292.00 (see
Figure 2). Further, we applied the weight to the annual sales of sampled non-farm firms and
found the estimated national sales revenue to be GH¢ 18,454,384,546.00. Therefore, the
national potential tax, actual tax and tax gap represent about 1.78, 0.54 and 1.23 percent of the
national sales figure respectively. In terms of Ghana’s GDP (using the 2013 GDP figure of GH¢
87,155,400,000 from the budget), the national potential tax, actual tax and tax gap represent
0.38, 0.11 and 0.26 percent respectively. The implications from these results are that there
appears to be almost an insignificant proportion of sales revenue (0.54 %) from the informal
sector that is realized as tax revenue. This compares with 5% to 25% for Pay As You Earn
(PAYE) income tax received by government and also with the rate paid for corporate tax (25%).
In addition, the tax revenue from self-employment activities for 2013 (GH¢ 181,562,205) as
reported by the Ministry of Finance (MOF) is above our estimated national tax revenue (GH¢
100,093,092.00) obtained from the non-farm enterprise survey data. The reason for this
discrepancy can be ascribed to the fact that: (i) the ‘self-employed’ as defined by MOF also
encompasses those in the formal sector; (ii) our sample is only limited to firms that make less
than GH¢ 90, 0000 annual sales, as defined by the Regulations, whereas the self-employment tax
figure reported by the MOF does not consider annual sales of the firms. This observation lends
credence to the challenges of computing the tax gap alluded to by Georgiou (2007).
The rest of the discussion examines the extent of tax payment as well as tax gap vis-à-vis the
underlying factors namely gender, education and location.
2The command used in generating the national tax figures in STATA was: tabstat variable [aw=weight], stat(sum)
format (% 15.0fc), where the variable in this case represents either the sample potential tax or actual tax figures

21
Figure 2: Estimated national amount (in GH¢) and % for potential, actual tax and tax gap
Source: Authors’ own computation from GLSS 6, 2012/2013
5.1.2 Firm owner’s characteristics and location
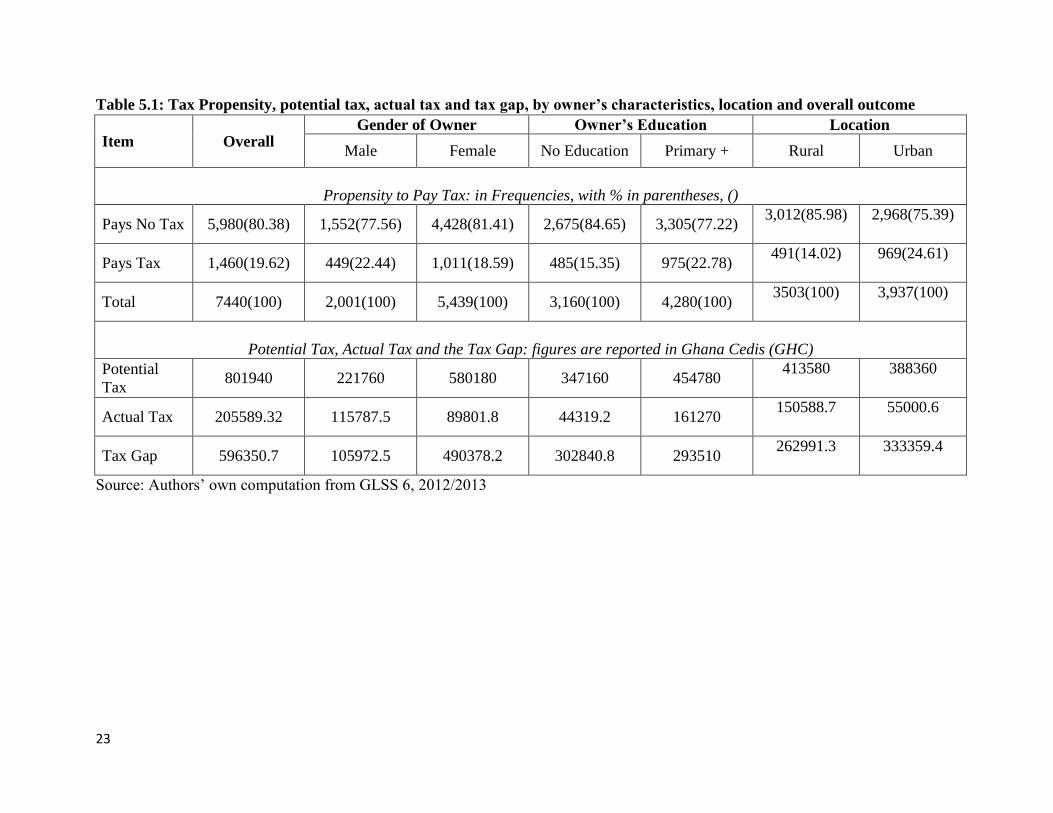
Gender
Being a male or female owner of an enterprise is relevant in the understanding or analysis of the
tax structure in the informal sector. Significantly, higher proportions of females (81.4%) do not
pay tax as compared to male colleague owners (77.6%). Similarly, female owners are associated
with a higher tax gap (GH¢490,370.20) than their male counterparts (GH¢105,972.50). This
indicates that the tax loss among female owned firms is over 4 times that of male owned
businesses in the economy (see Table 5.1). This result may be explained by the fact that more
females operate non-farm enterprises (71.3%) as compared to their male counterparts (28.7%)
(see Table 4.1).
Education
In analyzing the propensity to pay tax and the tax gap within the informal sector, it is imperative
to consider the educational level of the firm owner. The result, as expected, indicates a strong
influence of education on tax propensity (Table 5.1). Thus, a significant proportion of firm
Estimated NationalPotential Tax
Estimated NationalActual Tax
Estimated NationalTax Gap
% of GDP 0.38 0.11 0.26
% Revenue from small firms 1.78 0.54 1.23
Amount 327,899,384 100,093,092 227,806,292
0.38
0.11
0.26
0
50,000,000
100,000,000
150,000,000
200,000,000
250,000,000
300,000,000
350,000,000
0
0.2
0.4
0.6
0.8
1
1.2
1.4
1.6
1.8
2P
erc
en
t, %
G
H
¢
)

22
owners who have no education do not pay tax (84.7%) as compared to those with at least primary
education (77.2%). The same observation is made with regards to the tax gap: firm owners
without education have a higher tax gap (GH¢302,840.80) than those with at least primary
education (GH¢293,509.90). Education, as a human capital variable, has the chance of
improving individuals understanding on the importance and contribution of tax payment to
government revenue and hence, economic development in general.
Firm Location
Table 5.1 paints a picture of the influence of location on propensity to pay tax and on tax gap.
Among the rural non-farm enterprises, the result show that as low as 14% of them pay tax,
representing a little over half of the proportion of urban firms that pay tax (24.6%). It is therefore
not surprising to also find that non-farm economic activities in the rural economies account for
higher tax gap or loss (GH¢333,359.4) than the urban economies (GH¢262,991.3).
Comparatively, the urban economies are in general equipped with formalized tax administration
system-in terms of logistics, skilled labour force, among others and thereby these factors may
explain the relatively high revenues loss in the rural location.
23
Table 5.1: Tax Propensity, potential tax, actual tax and tax gap, by owner’s characteristics, location and overall outcome
Item Overall Gender of Owner Owner’s Education Location
Male Female No Education Primary + Rural Urban
Propensity to Pay Tax: in Frequencies, with % in parentheses, ()
Pays No Tax 5,980(80.38) 1,552(77.56) 4,428(81.41) 2,675(84.65) 3,305(77.22) 3,012(85.98) 2,968(75.39)
Pays Tax 1,460(19.62) 449(22.44) 1,011(18.59) 485(15.35) 975(22.78) 491(14.02) 969(24.61)
Total 7440(100) 2,001(100) 5,439(100) 3,160(100) 4,280(100) 3503(100) 3,937(100)
Potential Tax, Actual Tax and the Tax Gap: figures are reported in Ghana Cedis (GHC)
Potential
Tax 801940 221760 580180 347160 454780
413580 388360
Actual Tax 205589.32 115787.5 89801.8 44319.2 161270 150588.7 55000.6
Tax Gap 596350.7 105972.5 490378.2 302840.8 293510 262991.3 333359.4
Source: Authors’ own computation from GLSS 6, 2012/2013
24
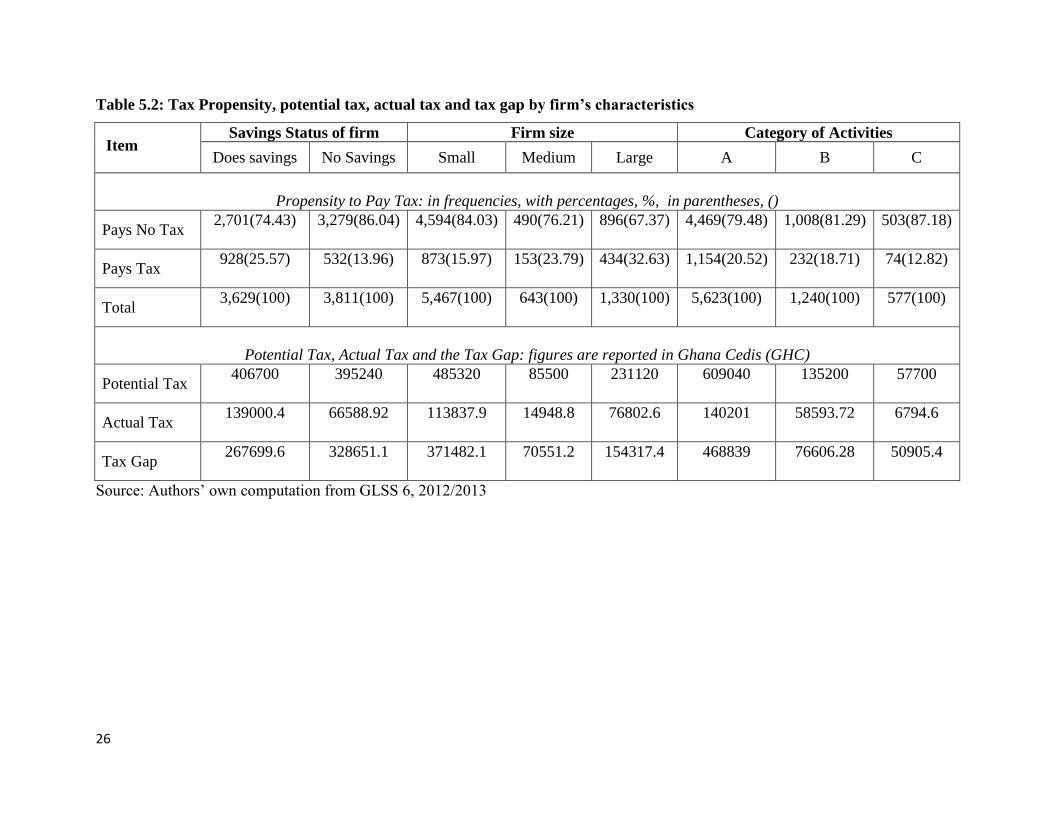
5.1.3 Firm level characteristics
Firm’s bank savings
The savings status of firms cannot be ignored in the discussion of the propensity to pay tax as
well as the tax gap (see Tables 5.2). The data suggests a strong relationship between tax
payment and firm’s saving, as expected. Thus, it is found that higher proportion of firms that do
not make savings are also more likely not to pay tax (86.1%) whereas 74.4% of firms that make
savings are likely to pay tax. Considering the incidence of tax gap among the saving status of
firms, firms that make no savings record a higher tax gap (GH¢328,651.10) as compared to firms
that make savings (GH¢267,699.60).
To some extent, these significance results may be explained by the fact that firm’s savings and
tax payment records may both act as “collateral” as these informal firms attempt to access loans
particularly from microfinance institutions (where a larger number of these informal firms seek
financial assistance).
Firm size
The role of firm size is well acknowledged by our results. The findings show that the size of the
firm appears to increase with propensity to pay tax (Table 5.2). In other words, a significant
proportion of large firms pay tax (32.6%), followed by medium firms (23.8%), with small-sized
firms accounting for the least tax payment (16.0%). It is therefore not very surprising that the tax
gap associated small firms is at least 5 times and twice that of medium and large firms
respectively. The magnitude of tax loss attributable to small firms may not be unexpected since
these firms are “too micro” in their economic activities to be identified or perhaps to be “forced”
to be tax compliant or pay the projected or potential tax stipulated by Ghana Revenue Authority.
Another plausible explanation to this substantial tax loss could be the fact that these small firms
account for as much as 73.5% of the total non-farm enterprises in the country.
Business Activity
The results in Table 5.2 show that the propensity to pay tax significantly varies among the type
of business activity. A much higher fraction of firms under category A is found to pay tax
(20.5%) followed by category B (18.7%) and C (12.8%) respectively. In Ghana, the low
propensity to pay tax among category C activities such as charcoal and firewood vendors, shoe
25
and equipment repairs, and traditional healers is in line with general expectation since these
economic activities are mostly “very informal” and are less likely to be located by tax officers.
In terms of the tax gap, the result from the data reveals that categories A and B which comprise
of relatively “less informal” activities such as retail traders, drinking and chop bar owners,
business centres, estates and accommodation agents, licensed diamond and gold winners and
buyers, dress makers and tailors, hairdressers, beautician and barbers, artisans car washing bays
are found to be characterized by relatively higher tax gap than category C.
26
Table 5.2: Tax Propensity, potential tax, actual tax and tax gap by firm’s characteristics
Item
Savings Status of firm Firm size Category of Activities
Does savings No Savings Small Medium Large A B C
Propensity to Pay Tax: in frequencies, with percentages, %, in parentheses, ()
Pays No Tax 2,701(74.43) 3,279(86.04) 4,594(84.03) 490(76.21) 896(67.37) 4,469(79.48) 1,008(81.29) 503(87.18)
Pays Tax 928(25.57) 532(13.96) 873(15.97) 153(23.79) 434(32.63) 1,154(20.52) 232(18.71) 74(12.82)
Total 3,629(100) 3,811(100) 5,467(100) 643(100) 1,330(100) 5,623(100) 1,240(100) 577(100)
Potential Tax, Actual Tax and the Tax Gap: figures are reported in Ghana Cedis (GHC)
Potential Tax 406700 395240 485320 85500 231120 609040 135200 57700
Actual Tax 139000.4 66588.92 113837.9 14948.8 76802.6 140201 58593.72 6794.6
Tax Gap 267699.6 328651.1 371482.1 70551.2 154317.4 468839 76606.28 50905.4
Source: Authors’ own computation from GLSS 6, 2012/2013
27
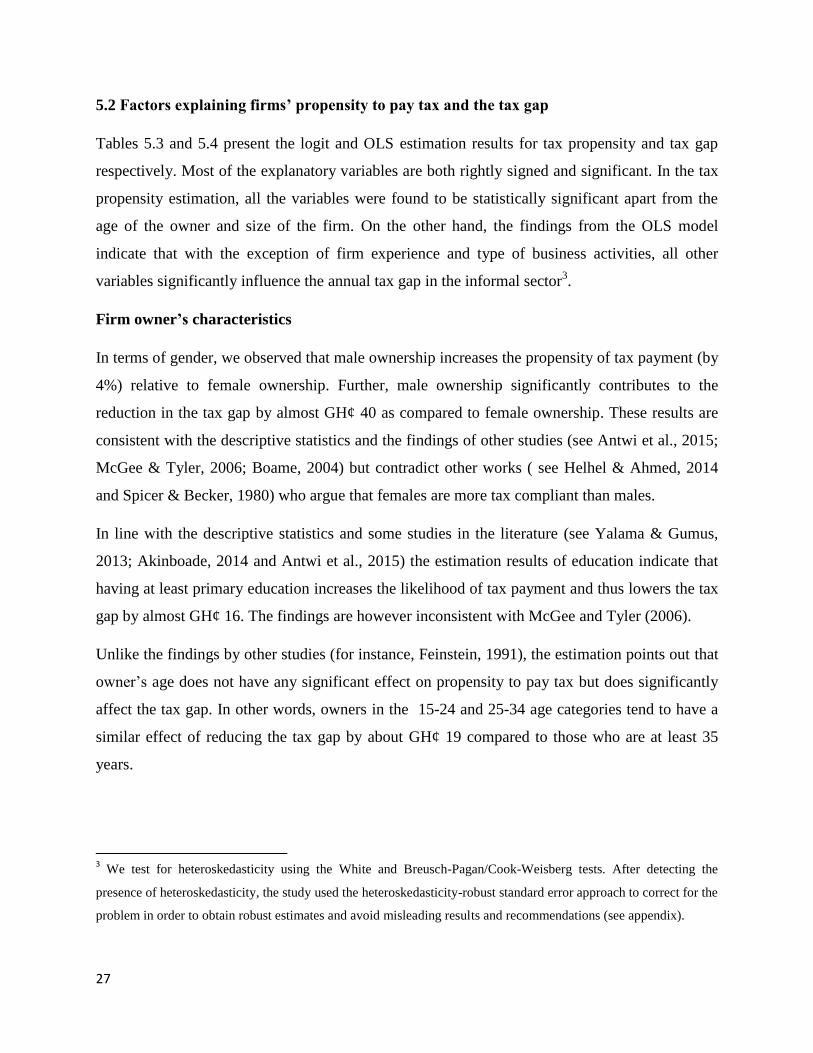
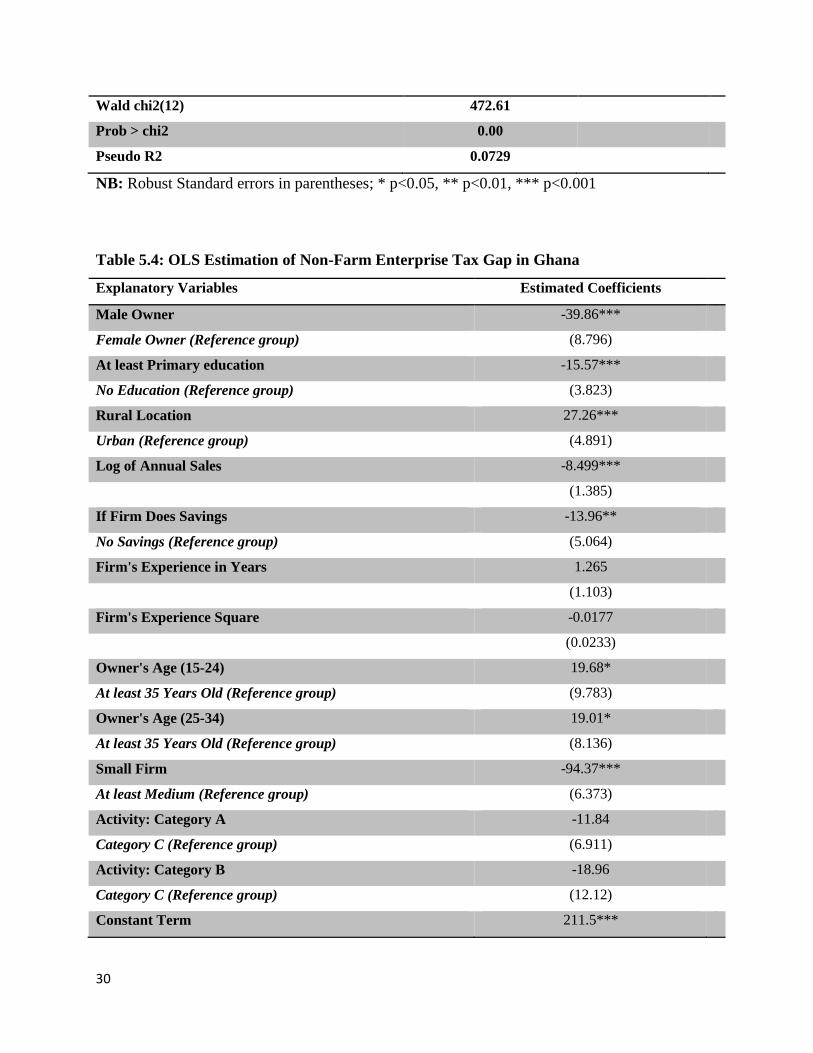
5.2 Factors explaining firms’ propensity to pay tax and the tax gap
Tables 5.3 and 5.4 present the logit and OLS estimation results for tax propensity and tax gap
respectively. Most of the explanatory variables are both rightly signed and significant. In the tax
propensity estimation, all the variables were found to be statistically significant apart from the
age of the owner and size of the firm. On the other hand, the findings from the OLS model
indicate that with the exception of firm experience and type of business activities, all other
variables significantly influence the annual tax gap in the informal sector3.
Firm owner’s characteristics
In terms of gender, we observed that male ownership increases the propensity of tax payment (by
4%) relative to female ownership. Further, male ownership significantly contributes to the
reduction in the tax gap by almost GH¢ 40 as compared to female ownership. These results are
consistent with the descriptive statistics and the findings of other studies (see Antwi et al., 2015;
McGee & Tyler, 2006; Boame, 2004) but contradict other works ( see Helhel & Ahmed, 2014
and Spicer & Becker, 1980) who argue that females are more tax compliant than males.
In line with the descriptive statistics and some studies in the literature (see Yalama & Gumus,
2013; Akinboade, 2014 and Antwi et al., 2015) the estimation results of education indicate that
having at least primary education increases the likelihood of tax payment and thus lowers the tax
gap by almost GH¢ 16. The findings are however inconsistent with McGee and Tyler (2006).
Unlike the findings by other studies (for instance, Feinstein, 1991), the estimation points out that
owner’s age does not have any significant effect on propensity to pay tax but does significantly
affect the tax gap. In other words, owners in the 15-24 and 25-34 age categories tend to have a
similar effect of reducing the tax gap by about GH¢ 19 compared to those who are at least 35
years.
3 We test for heteroskedasticity using the White and Breusch-Pagan/Cook-Weisberg tests. After detecting the
presence of heteroskedasticity, the study used the heteroskedasticity-robust standard error approach to correct for the
problem in order to obtain robust estimates and avoid misleading results and recommendations (see appendix).
28
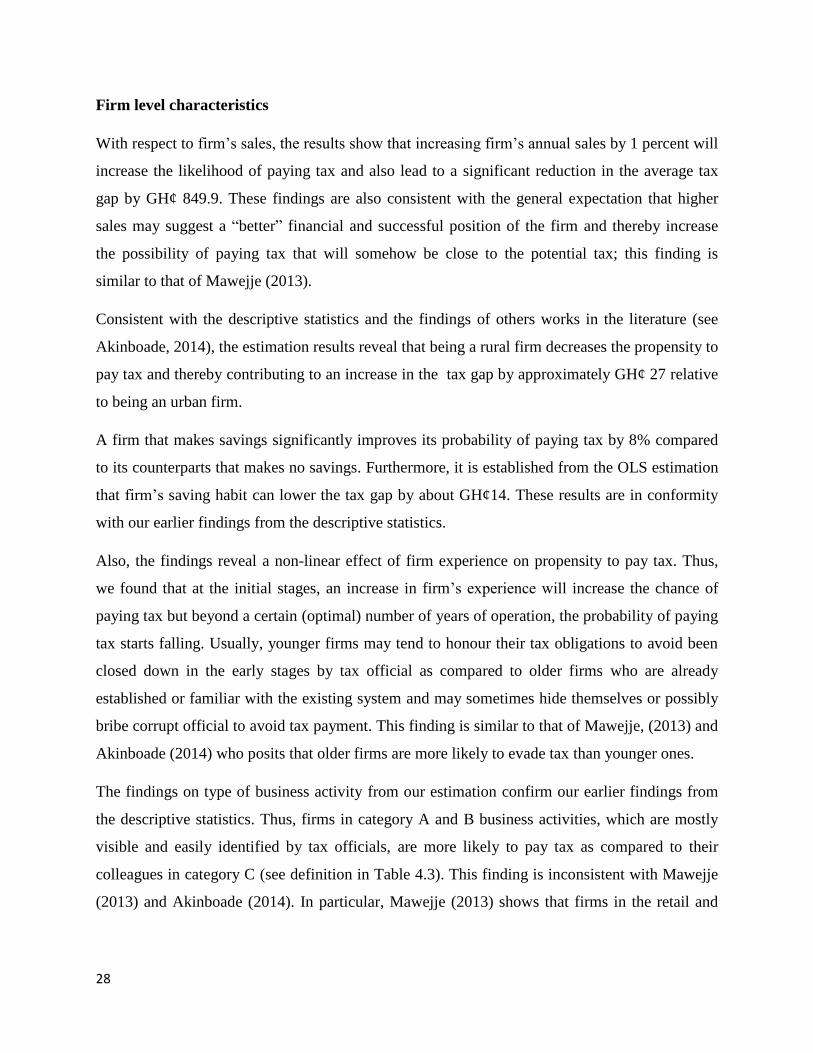
Firm level characteristics
With respect to firm’s sales, the results show that increasing firm’s annual sales by 1 percent will
increase the likelihood of paying tax and also lead to a significant reduction in the average tax
gap by GH¢ 849.9. These findings are also consistent with the general expectation that higher
sales may suggest a “better” financial and successful position of the firm and thereby increase
the possibility of paying tax that will somehow be close to the potential tax; this finding is
similar to that of Mawejje (2013).
Consistent with the descriptive statistics and the findings of others works in the literature (see
Akinboade, 2014), the estimation results reveal that being a rural firm decreases the propensity to
pay tax and thereby contributing to an increase in the tax gap by approximately GH¢ 27 relative
to being an urban firm.
A firm that makes savings significantly improves its probability of paying tax by 8% compared
to its counterparts that makes no savings. Furthermore, it is established from the OLS estimation
that firm’s saving habit can lower the tax gap by about GH¢14. These results are in conformity
with our earlier findings from the descriptive statistics.
Also, the findings reveal a non-linear effect of firm experience on propensity to pay tax. Thus,
we found that at the initial stages, an increase in firm’s experience will increase the chance of
paying tax but beyond a certain (optimal) number of years of operation, the probability of paying
tax starts falling. Usually, younger firms may tend to honour their tax obligations to avoid been
closed down in the early stages by tax official as compared to older firms who are already
established or familiar with the existing system and may sometimes hide themselves or possibly
bribe corrupt official to avoid tax payment. This finding is similar to that of Mawejje, (2013) and
Akinboade (2014) who posits that older firms are more likely to evade tax than younger ones.
The findings on type of business activity from our estimation confirm our earlier findings from
the descriptive statistics. Thus, firms in category A and B business activities, which are mostly
visible and easily identified by tax officials, are more likely to pay tax as compared to their
colleagues in category C (see definition in Table 4.3). This finding is inconsistent with Mawejje
(2013) and Akinboade (2014). In particular, Mawejje (2013) shows that firms in the retail and

29
wholesale sectors (which are mostly under category A and B in our study) tend to be associated
with more tax evasion.
Table 5.3 Logistic Estimation of Non-Farm Enterprise Propensity to pay Tax in Ghana
Explanatory Variables Estimated Coefficients Marginal Effects
Male Owner 0.274*** 0.0409
Female Owner (Reference group) (0.0778)
At least Primary education 0.349*** 0.0492
No Education (Reference group) (0.0671)
Rural Location -0.452*** -0.0643
Urban (Reference group) (0.0645)
Log of Annual Sales 0.140*** 0.0201
(0.0154)
If Firm Does Savings 0.605*** 0.0874
No Savings (Reference group) (0.0622)
Firm's Experience in Years 0.0413*** 0.0059
(0.0103)
Firm's Experience Square -0.000696* -0.0001
(0.000293)
Owner's Age (15-24) -0.218 -0.0294
At least 35 Years Old (Reference group) (0.138)
Owner's Age (25-34) -0.00452 -0.0006
At least 35 Years Old (Reference group) (0.074)
Small Firm 0.0343 0.0049
At least Medium (Reference group) (0.0896)
Activity: Category A 0.405** 0.0542
Category C (Reference group) (0.138)
Activity: Category B 0.306* 0.0468
Category C (Reference group) (0.15)
Constant Term -3.378***
(0.222)
Number of observations 7,440
30
Wald chi2(12) 472.61
Prob > chi2 0.00
Pseudo R2 0.0729
NB: Robust Standard errors in parentheses; * p<0.05, ** p<0.01, *** p<0.001
Table 5.4: OLS Estimation of Non-Farm Enterprise Tax Gap in Ghana
Explanatory Variables Estimated Coefficients
Male Owner -39.86***
Female Owner (Reference group) (8.796)
At least Primary education -15.57***
No Education (Reference group) (3.823)
Rural Location 27.26***
Urban (Reference group) (4.891)
Log of Annual Sales -8.499***
(1.385)
If Firm Does Savings -13.96**
No Savings (Reference group) (5.064)
Firm's Experience in Years 1.265
(1.103)
Firm's Experience Square -0.0177
(0.0233)
Owner's Age (15-24) 19.68*
At least 35 Years Old (Reference group) (9.783)
Owner's Age (25-34) 19.01*
At least 35 Years Old (Reference group) (8.136)
Small Firm -94.37***
At least Medium (Reference group) (6.373)
Activity: Category A -11.84
Category C (Reference group) (6.911)
Activity: Category B -18.96
Category C (Reference group) (12.12)
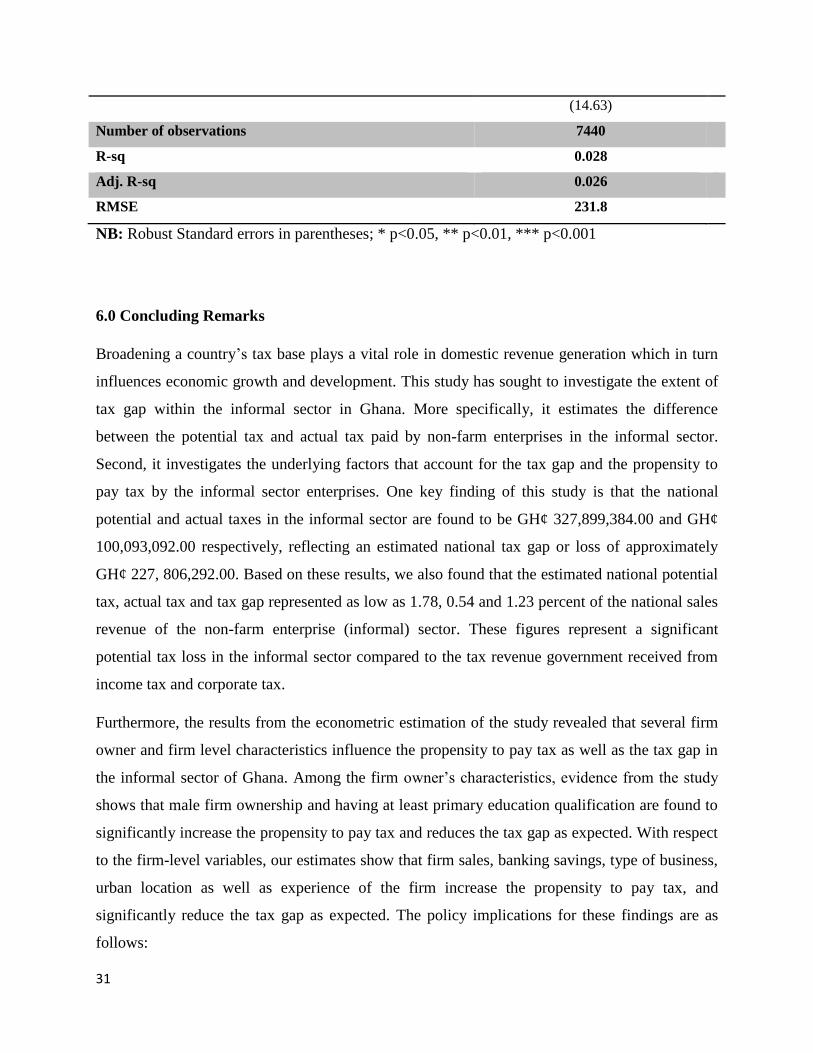
Constant Term 211.5***
31
(14.63)
Number of observations 7440
R-sq 0.028
Adj. R-sq 0.026
RMSE 231.8
NB: Robust Standard errors in parentheses; * p<0.05, ** p<0.01, *** p<0.001
6.0 Concluding Remarks
Broadening a country’s tax base plays a vital role in domestic revenue generation which in turn
influences economic growth and development. This study has sought to investigate the extent of
tax gap within the informal sector in Ghana. More specifically, it estimates the difference
between the potential tax and actual tax paid by non-farm enterprises in the informal sector.
Second, it investigates the underlying factors that account for the tax gap and the propensity to
pay tax by the informal sector enterprises. One key finding of this study is that the national
potential and actual taxes in the informal sector are found to be GH¢ 327,899,384.00 and GH¢
100,093,092.00 respectively, reflecting an estimated national tax gap or loss of approximately
GH¢ 227, 806,292.00. Based on these results, we also found that the estimated national potential
tax, actual tax and tax gap represented as low as 1.78, 0.54 and 1.23 percent of the national sales
revenue of the non-farm enterprise (informal) sector. These figures represent a significant
potential tax loss in the informal sector compared to the tax revenue government received from
income tax and corporate tax.
Furthermore, the results from the econometric estimation of the study revealed that several firm
owner and firm level characteristics influence the propensity to pay tax as well as the tax gap in
the informal sector of Ghana. Among the firm owner’s characteristics, evidence from the study
shows that male firm ownership and having at least primary education qualification are found to
significantly increase the propensity to pay tax and reduces the tax gap as expected. With respect
to the firm-level variables, our estimates show that firm sales, banking savings, type of business,
urban location as well as experience of the firm increase the propensity to pay tax, and
significantly reduce the tax gap as expected. The policy implications for these findings are as
follows:
32
The tax officials subjectively impose the tax stamps due to the fact that the definition of
the enterprise-size (that is whether large, medium or small) are not clearly spelt out in the
Regulations. This may lead to an under or over estimation of the actual tax payment.
Therefore, it is essential for the GRA to devise a standard measure of assessing the size
of firms in the informal sector which the Small Tax-Payer Offices across Ghana can use.
It is recommended that the Ghana Revenue Authority (GRA) should intensify public
education, particularly among women micro entrepreneurs on their tax responsibilities
using different and suitable educational platforms.
Financial inclusion should be vigorously promoted within the informal sector by Government
or the Bank of Ghana to make more entrepreneurs in the informal sector bankable as saving
in the bank was found to correlate with propensity to pay tax.
Firms located in the rural areas are less likely to pay tax and thus, accounts for higher tax
gap. As a way of motivation, Government of Ghana should strengthen the extension of
infrastructure and social facilities such as roads, hospitals and electricity to the rural areas for
rural residents to experience the benefits of taxation as a tool for their own economic
development.
It is observed from this study that business activities in category C-which is made up of
butchers, individual undertakers, corn and other millers, charcoal and firewood vendors,
vulcanizers and alignment operators, shoe and equipment repairs and traditional healers- are
less likely to pay tax. Therefore, the Ghana Revenue Authorities must focus on designing
appropriate policies that would reduce the extent of tax loss to this category.
There is the need to motivate and equip staff in the small tax offices and rural areas in order
to effectively reach out, identify and collect taxes from firms in the informal sector
7.0 Limitations of the study and recommendation for further research
A few weaknesses noted from this study are as follows:
This study has focused on just estimating the extent of tax gap in the informal sector of Ghana. A
potential area of extension to this study is to investigate the cost of collecting the tax stamp. This
will help us to know whether the tax stamp is the best way to go or there is the need to devise
other means of collecting tax within the informal sector e.g. through the use of mobile money
33
services to ensure cost effectiveness. One of the principles of taxation is that a good tax system
should minimize the administrative cost of collection relative to the yield. Thus, a potential
research area which can emerge out of this study is to measure the efficiency of taxation in the
informal sector and ascertain the most effective method of mobilizing tax revenue from the
informal sector.
This study also used only secondary data in the analysis hence the inability to study other
thematic areas of interest such as cost of tax collection as noted above. Therefore, in the future,
we can improve upon the study by undertaking large-scale primary survey at the enterprise level.
Finally, this study has focused just on one component of indirect tax which is the excise tax and
thus self–employment tax. In the future, the study can be extended to other components of
indirect tax such as communication tax and the VAT.

34
REFERENCES
Aguire, C.S., and Shome, P., “The Mexican Value Added Tax (VAT): The Methodology for
Calculating the Base” National Tax Journal 41 (4): 543
Ahmed, R.A., and Rider, M, (2008), “Pakistan’s Tax Gap: Estimates by Tax Calculation and
Methodology”, International Studies Program Working Paper No.11.
Akinaboade, O., (2014), “Regulation, SMEs' Growth and Performance in Cameroon's Central
and Littoral Provinces' Manufacturing and Retail Sectors”, African Development Review, Vol.
26, Issue 4, p. 597-609.
Alm, J., and Borders, K, (2014), “Estimating the “Tax Gap” at the State Level: The Case of
Georgia’s Personal Income Tax”, Public Budgeting & Finance, Vol. 34, Issue 4, pp. 61-79
Annan, B., Bekoe, W., and Nketiah-Amponsah, E, (2012), “Determinants of Tax Evasion in
Ghana: 1970-2010”, International Journal of Economic Sciences and Applied Research 6 (3):
97-121
Antwi, S.K., Inusah, A.M., and Hamza, K., (2015) “The Effect of Demographic Characteristics
of Small and Medium Entrepreneurs on Tax Compliance in the Tamale Metropolis, Ghana”,
International Journal of Economics, Commerce and Management Vol. III, Issue 3
Asante, S., (2012), “Estimating the Underground Economy and Tax Evasion in Ghana”,
Available at: http://ssrn.com/abstract=2013176
Cagan, P. (1958), “The demand for currency relative to total money supply”, National Bureau of
Economic Research Occasional Paper 62,
Cobham, A., (2005), “Tax evasion, tax avoidance, and development finance”, Queen Elisabeth
House Working Paper No. 129.
Contini, B., (1981), “Labour Market Segmentation and the Development of the Parallel
Economy— the Italian Experience,” Oxford Econ. Papers, 33:4, pp. 401–12.
Feige, E. L., (1979), “How Big is the Irregular Economy?” Challenge, November-December, 5-
13.
Feinstein, J. (1991), “An econometric analysis of income tax evasion and its detection” Rand
Journal of Economics 22 (1), 14-35.
Frey, B. S., and Weck-Hannemann, H., (1984), “The Hidden Economy as an ‘Unobserved’
Gemmell, N., and Hasseldine, J., (2012), “The Tax Gap: A Methodological Review”, Victoria
Business School Working Paper 09
Georgiou, G.M., (2007), “Measuring the size of the informal economy: A critical review”
Central Bank of Cyprus Working Paper No.1
Giles, D.E.A., (1999), “Modelling the Hidden Economy and the Tax-Gap in New Zealand”,
Empirical Economics, Vol.24, Issue 4

35
GIZ Sector Programme Public Finance, Administrative Reform (2010), “Addressing tax evasion
and tax avoidance in developing countries”, Deutsche Gesellschaft fur Internationale
Zusammenarbeit (GIZ) GmbH
GSS, (2013). Ghana Statistical Service. Ghana Living Standards Survey-Report of the Sixth
Round.
Gutmann, P.T., (1997), “The Subterranean Economy”, Financial Analysts Journal(November-
December): 64-66 and 69
Harremi, M., (2014), “A simple analysis of the tax gap Balkan region”, Mediterranean Journal
of Social Sciences, Vol.5, No.19
Helhel, Y., and Ahmed, Y., (2014), “Factors affecting Tax Attitudes and Tax Compliance: A
Survey Study in Yemen” European Journal of Business and Management, Vol.6, No. 22.
ISSER, (2014). The State of the Ghanaian Economy in 2013. Institute of Social, Statistical and
Economic Research. Sundel Printing Services.
ISSER, (2015). The State of the Ghanaian Economy in 2014. Institute of Social, Statistical and
Economic Research. Sundel Printing Services.
Jenkins, G.P., and Kuo, C-Y, (2000), “A VAT revenue simulation for tax reform in developing
countries”, World Development 28 (4): 763-774.
Johnson, S., Kaufmann, D., and Shleifer, A., (199) “The Unofficial Economy in Transition,”
Brookings Papers Econ. Act., 0:2, pp. 159–221.
Keen, M and S. Smith (2007) “VAT fraud and evasion: What do we know, and what can be
done?”, IMF Working Paper 07/31, International Monetary Fund: Washington DC.
Khwaja, M.S., and Iyer, I, (2014), “Revenue Potential, Tax Space, and Tax Gap: A Comparative
Analysis” World Bank Policy Research Working Paper 6868
MacAfee, K., (1980), “A Glimpse of the hidden economy in the national accounts”, Economic
Trends, 136, pp. 81-87
Martin-Vazquez, J., Rider, M., and Wallace, S, (2008), “Tax Reforms in Russian”, Edward
Elgar Publications: Amsterdam NL.
Mawejje, J., (2013), “Tax Evasion, Informality and the Business Environment in Uganda”
Economic Policy Research Centre Research Series No. 113
Mazur, M. J., and Plumley, A.H., (2007), ‘‘Understanding the Tax Gap’’, A Presentation to
National Tax Association Spring Meeting, Washington, DC.
McGee, R.W., and Tyler, M., (2006), “Tax Evasion and Ethics: A Demographic Study of 33
Countries”, Available at SSRN 940505.
Minh, T.L., (2007), “Estimating the VAT tax base: method and application”, Tax Notes
International
36
Novysedlák, V., and Palkovičová, J, (2012), “The estimate of the value added tax revenue loss”,
Economic Analysis 25. Bratislava: Institute for financial policy.
Reckon (2009), “Study to quantify and analyse the VAT gap in the EU-25 Member States”, A
study commissioned by the European Commission, Directorate-General for Taxation and
Customs Union.
Schneider, F. and Williams, C.C., (2013), “The Shadow Economy”, Institute of Economic
Affairs, London.
Spicer, M. W., and Becker, L.A., (1980), “Fiscal Inequity and Tax Evasion: An Experimental
Approach.” National Tax Journal, June, 33(2): 171–75.
Tanzi, V. (1980), “The Underground Economy in the United States: Estimates and Implications”,
Banca Nazionale del Lavoro Quarterly Review, 135, 427-53.
Tanzi, V., (1983), “The Underground Economy in the United States: Annual Estimates, 1930–
1980,” IMF Staff Papers, 30:2, pp. 283–305.
Toder, E., (2007), “What is the Tax Gap”, A Report prepared for the American Bar Association
Conference on the Tax Gap.
Variable,” Europ. Econ. Rev., 26:1–2, pp. 33–53.
Vuletin, G., (2008), “Measuring the Informal Economy in Latin America and the Caribbean”,
IMF Working Paper WP/08/102.
Yalama, G.O., and Gumus, E., (2013), “Determinants of Tax Evasion Behaviour: Empirical
Evidence from Survey Data”, International Business and Management Vol. 6, No. 2, 2013, pp.
15-23.
www.mofeb.gov.gh/
www.gra.gov/gh/

37
APPENDIX
Tests for Heteroskedasticity
White's test for heteroskedasticity
Ho: homoskedasticity against Ha: unrestricted heteroskedasticity
chi2(78) = 183.75
Prob > chi2 = 0.0000
Breusch-Pagan / Cook-Weisberg test for heteroskedasticity
Ho: Constant variance
Variables: fitted values of tax gap
chi2(1) = 3987.30
Prob > chi2 = 0.0000
Designed by soapbox.co.uk
The International Growth Centre (IGC) aims to promote sustainable growth in developing countries by providing demand-led policy advice based on frontier research.
Find out more about our work on our website www.theigc.org
For media or communications enquiries, please contact [email protected]
Subscribe to our newsletter and topic updates www.theigc.org/newsletter
Follow us on Twitter @the_igc
Contact us International Growth Centre, London School of Economic and Political Science, Houghton Street, London WC2A 2AE