final report - fws.gov
TRANSCRIPT

CONFIDENTIAL
FINAL REPORT
Seabird Mortality Resulting from the M/V New Carissa Oil Spill Incident
February and March 1999
Phase 1
Phase 2
Key
Grounding site
No effort0 birds found/km
>1.6 birds found/km1.11-1.6 birds found/km0.71-1.1 birds found/km0.41-0.7 birds found/km0.21-0.4 birds found/km0.01-0.2 birds found/km
Prepared for:
U. S. Fish and Wildlife Service Oregon Fish and Wildlife Office
By:
R. Glenn Ford, Gina K. Himes Boor, and Jennifer Caylor Ward
R.G. FORD CONSULTING COMPANY 2735 N.E. Weidler Street Portland, Oregon 97232
May 14, 2001

CONFIDENTIAL
TABLE OF CONTENTS
INTRODUCTION..........................................................................................................................1
PURPOSE.......................................................................................................................................1
DATA COLLECTED DURING SPILL RESPONSE ................................................................1
OFFSHORE BIRD SURVEYS...................................................................................................... 1 Boat Surveys .................................................................................................................. 2 Aerial Survey Methods .................................................................................................. 2 Aerial Survey Results..................................................................................................... 2 Discussion of Birds at Risk ............................................................................................ 6
BEACH SURVEYS .................................................................................................................... 6 Methods.......................................................................................................................... 6 Search Results ................................................................................................................ 8
SHOREBIRD POPULATION SURVEYS...................................................................................... 11 Methods........................................................................................................................ 12 Results .......................................................................................................................... 12
RATES DERIVED FROM FIELD STUDIES ..........................................................................15
SCAVENGING STUDY ............................................................................................................ 15 Study Methods ............................................................................................................. 16 Study Results................................................................................................................ 18 Discussion .................................................................................................................... 22
SEARCHER EFFICIENCY STUDY ............................................................................................ 22
BACKGROUND BIRD MORTALITY RATES.............................................................................. 23 Long-term Data from one Oregon Beach..................................................................... 23 Ambient Monitoring Study .......................................................................................... 25
ANALYSIS AND MODELING..................................................................................................25
SIMULATION OF BIRD CARCASS AND OIL TRAJECTORIES..................................................... 25 Trajectory Model.......................................................................................................... 26 Model Results .............................................................................................................. 27
ESTIMATION OF BIRD MORTALITY ....................................................................................... 33 Model Description........................................................................................................ 33 Estimating the Natural Deposition Rate....................................................................... 35 Model Parameters ........................................................................................................ 36
ESTIMATION OF SUB-LETHAL EFFECTS ................................................................................ 37 Methods........................................................................................................................ 37 Results .......................................................................................................................... 39 Discussion .................................................................................................................... 40
MODEL RESULTS – ESTIMATED DIRECT SEABIRD MORTALITY............................42
LITERATURE CITED ...............................................................................................................45
i

CONFIDENTIAL
APPENDICES
Appendix A. Hours of search effort per day per search segment during the spill
response beach surveys. ................................................................................... A-1 Appendix B. Modes of transportation used during the spill response beach
surveys. .............................................................................................................B-1 Appendix C. Search segment names and equivalent alpha-numeric codes used
during the spill response. ..................................................................................C-1
ii

CONFIDENTIAL
TABLES
Table 1a. Summary of offshore aerial seabird survey, 19 February 1999. .................................... 3
Table 1b. Summary of offshore aerial seabird survey, 20 February 1999. .................................... 4
Table 1c. Summary of offshore aerial seabird survey, 7 March 1999. .......................................... 5
Table 2. Dead birds found during Phase 1 and 2 of the M/V New Carissa oil spill search effort. Numbers include birds recovered live which later died. ......................... 9
Table 3. Gull and shorebird species observed during the USFWS survey, 14 February 1999............................................................................................................... 13
Table 4. CCR shorebird and gull population survey results for the Coos Bay spill area (from Bastendorff Beach within Cape Arago segment, north to Berry Creek Coastal). ............................................................................................................. 13
Table 5. CCR shorebird and gull population survey results for the Waldport spill area (Horse Creek Coastal to Newport). .............................................................................. 14
Table 6. Percent difference in the USFWS population estimates as compared to the between CCR survey estimates. ................................................................................... 15
Table 7. Estimated gull and shorebird population size ranges based on the CCR and USFWS surveys. .......................................................................................................... 15
Table 8. Tally of carcass species used in the carcass persistence study..................................... 17
Table 9. Scavenging trends for different sized carcasses. .......................................................... 19
Table 10. Numbers of carcasses missing due to various factors. ................................................. 19
Table 11. Mean number of times a carcass changed state............................................................ 19
Table 12. Mean number of days a carcass persisted. ................................................................... 20
Table 13. Shorebird and gull population estimate for each search segment group, based on the CCR and USFWS surveys....................................................................... 39
Table 14. Oiling rates for shorebirds through time as observed by spill response beach surveyors. ..................................................................................................................... 40
Table 15. Oiling rates for gulls through time as observed by spill response beach surveyors. ..................................................................................................................... 41
Table 16. Estimated number of shorebirds and gulls oiled during the M/V New Carissa oil spill. ......................................................................................................................... 41
Table 17. Estimates of total mortality for birds by size class....................................................... 43
Table 18. Estimates of total mortality for selected species. ......................................................... 43
iii

CONFIDENTIAL
FIGURES
Figure 1a. Aerial survey transect lines for the 19 February 1999 seabird survey. .....................3 Figure 1b. Aerial survey transect lines for the 20 February 1999 seabird survey. .....................4 Figure 1c. Aerial survey transect lines for the 7 March 1999 seabird survey. ...........................5 Figure 2. Oregon coastline with generalized search segments and segment names.................7 Figure 3. The average number of dead birds found per kilometer of searched
beach over time. ......................................................................................................10 Figure 4. The average number of dead birds found per kilometer of searched
beach for each segment. ..........................................................................................10 Figure 5. The number of birds found per kilometer plotted through space and
time. .........................................................................................................................11 Figure 6. Scavenging rates for both Coos Bay and Waldport sites. .......................................21 Figure 7. The number of dead beached birds recorded by Loeffel in his beach
survey area, plotted by month and year...................................................................24 Figure 8. Trajectory analysis of oil released after the tow line was attached to the
ship, 26 February to 2 March. .................................................................................28 Figure 9. Trajectory analysis of oil released during the first attempted tow, 2-3
March.......................................................................................................................29 Figure 10. Trajectory analysis of oil released as the ship was blown back ashore
after breaking tow, 3 March. ...................................................................................30 Figure 11. Trajectory analysis of oil released during the final tow out to the
scuttling site, 8-11 March. .......................................................................................31 Figure 12. Total live and dead birds found over time throughout the spill event.....................32
iv

CONFIDENTIAL
INTRODUCTION
The freighter M/V New Carissa ran aground north of the entrance to Coos Bay, Oregon on 4 February 1999 while the crew was trying to wait out a storm. A total of approximately 400,000 gallons of fuel oil was estimated to be on board the M/V New Carissa when she ran aground. An estimated 27,000 to 140,000 gallons was reported released during the entire spill event. Oil was observed leaking from the ship by 8 February. During efforts to burn the remaining oil on the ship between 10 and 15 February the ship broke in half and exposed two more of the ship’s holds to the sea. Efforts to refloat the vessel began 26 February when a tow line was attached to the bow section. Oil was again observed coming from the hull of the M/V New Carissa on the afternoon of 26 February. After three more days of periodic tugging, the bow was freed from all sandbars and towed seaward on the morning of 2 March. However, extreme winds caused the towline to break on the evening of 2 March and the bow was pushed coastward, beaching again on 3 March near Waldport, Oregon where it continued leaking oil. Oil released throughout the entire episode moved landward, affecting the coastline north and south of both beaching locations. Impacts to birds occurred throughout both phases of the spill, peaking after the second grounding. Birds and other oiled wildlife were observed from just south of the Columbia River to Cape Arago.
PURPOSE
Birds impacted by the M/V New Carissa oil spill met with one of three potential fates: they were either injured and/or killed then subsequently recovered by beach searchers, died but were not recovered, or were oiled but survived through the spill response period. Detailed records were kept in morgue and rehabilitation databases regarding the number of dead and injured birds collected during the spill. The number of unrecovered birds and the total number of birds experiencing sub-lethal impacts, however, is not known. The purpose of this report is to use data gathered during both the spill response period and in separate field studies to estimate these unknowns to arrive at an estimate of the total number of birds adversely impacted by the M/V New Carissa oil spill. In addition to the morgue and rehabilitation records, data sources included: offshore surveys conducted during the spill, spill response beach surveys for live and dead birds, shorebird population and oiling surveys conducted during the spill, a study of carcass detection rates by searchers, a carcass scavenging study conducted on the Oregon coast following the spill, and historical data on background bird mortality rates.
DATA COLLECTED DURING SPILL RESPONSE
OFFSHORE BIRD SURVEYS During February and March, surveys of bird abundance and distribution were conducted in order to characterize the water birds at risk from spilled oil. Aerial surveys were conducted of the nearshore and offshore areas along most of the Oregon coast, and small boat surveys were also conducted offshore of the wreck sites.
1
CONFIDENTIAL
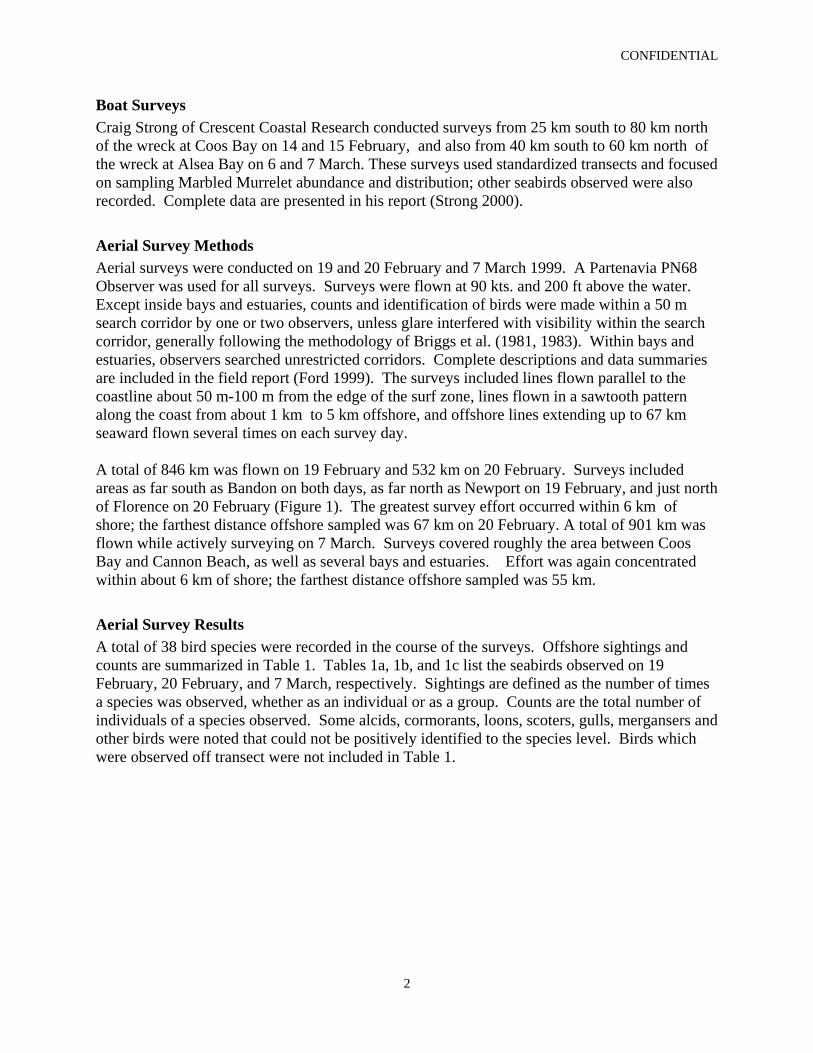
Boat Surveys Craig Strong of Crescent Coastal Research conducted surveys from 25 km south to 80 km north of the wreck at Coos Bay on 14 and 15 February, and also from 40 km south to 60 km north of the wreck at Alsea Bay on 6 and 7 March. These surveys used standardized transects and focused on sampling Marbled Murrelet abundance and distribution; other seabirds observed were also recorded. Complete data are presented in his report (Strong 2000).
Aerial Survey Methods Aerial surveys were conducted on 19 and 20 February and 7 March 1999. A Partenavia PN68 Observer was used for all surveys. Surveys were flown at 90 kts. and 200 ft above the water. Except inside bays and estuaries, counts and identification of birds were made within a 50 m search corridor by one or two observers, unless glare interfered with visibility within the search corridor, generally following the methodology of Briggs et al. (1981, 1983). Within bays and estuaries, observers searched unrestricted corridors. Complete descriptions and data summaries are included in the field report (Ford 1999). The surveys included lines flown parallel to the coastline about 50 m-100 m from the edge of the surf zone, lines flown in a sawtooth pattern along the coast from about 1 km to 5 km offshore, and offshore lines extending up to 67 km seaward flown several times on each survey day. A total of 846 km was flown on 19 February and 532 km on 20 February. Surveys included areas as far south as Bandon on both days, as far north as Newport on 19 February, and just north of Florence on 20 February (Figure 1). The greatest survey effort occurred within 6 km of shore; the farthest distance offshore sampled was 67 km on 20 February. A total of 901 km was flown while actively surveying on 7 March. Surveys covered roughly the area between Coos Bay and Cannon Beach, as well as several bays and estuaries. Effort was again concentrated within about 6 km of shore; the farthest distance offshore sampled was 55 km.
Aerial Survey Results A total of 38 bird species were recorded in the course of the surveys. Offshore sightings and counts are summarized in Table 1. Tables 1a, 1b, and 1c list the seabirds observed on 19 February, 20 February, and 7 March, respectively. Sightings are defined as the number of times a species was observed, whether as an individual or as a group. Counts are the total number of individuals of a species observed. Some alcids, cormorants, loons, scoters, gulls, mergansers and other birds were noted that could not be positively identified to the species level. Birds which were observed off transect were not included in Table 1.
2

CONFIDENTIAL
Table 1a. Summary of offshore aerial seabird survey, 19 February 1999.
Bird Sightings Count Common Murre 13 18 Cassin's Auklet 20 34 Rhinoceros Auklet 5 13 Tufted Puffin 0 0 Ancient Murrelet 2 3 Marbled Murrelet 21 28 Unidentified Alcid 0 0 All Alcids 61 96 Brandt's Cormorant 9 15 Pelagic Cormorant 0 0 Unidentified Cormorant 16 25 All Cormorants 25 40 Common Loon 0 0 Red-throated Loon 30 54 Unidentified Loon 8 9 All Loons 38 63 Western Grebe 31 40 Black Scoter 0 0 Surf Scoter 275 9,771 White-winged Scoter 38 349 Unidentified Scoter 8 48 All Scoters 321 10,168 Unidentified Phalarope 1 2 Western Gull 32 45 Western x Glaucous-winged Gull 0 0
California Gull 30 40 Heerman's Gull 0 0 Herring Gull 1 8 Glaucous-winged Gull 1 1 Mew Gull 0 0 Ring-billed Gull 1 1 Unidentified Gull 12 16 All Gulls 77 111 Black-legged Kittiwake 18 27 Black-footed Albatross 2 2 Laysan Albatross 0 0 Northern Fulmar 11 13 Murphy's Petrel 0 0 Short-tailed Shearwater 0 0 Unidentified Species 0 0
ALL BIRDS 585 10,562
Figure 1a. Aerial survey transect lines for the 19 February 1999 seabird survey.
3

CONFIDENTIAL
Table 1b. Summary of offshore aerial seabird survey, 20 February 1999.
Bird Sightings Count Common Murre 4 42 Cassin's Auklet 3 6 Rhinoceros Auklet 2 6 Tufted Puffin 1 3 Ancient Murrelet 0 0 Marbled Murrelet 2 4 Unidentified Alcid 0 0 All Alcids 12 61 Brandt's Cormorant 0 0 Pelagic Cormorant 0 0 Unidentified Cormorant 0 0 All Cormorants 0 0 Common Loon 0 0 Red-throated Loon 7 7 Unidentified Loon 0 0 All Loons 7 7 Western Grebe 0 0 Black Scoter 1 15 Surf Scoter 30 1,925 White-winged Scoter 16 220 Unidentified Scoter 1 15 All Scoters 48 2,175 Unidentified Phalarope 0 0 Western Gull 13 13 Western x Glaucous-winged Gull 2 2
California Gull 10 12 Heerman's Gull 0 0 Herring Gull 0 0 Glaucous-winged Gull 2 2 Mew Gull 0 0 Ring-billed Gull 0 0 Unidentified Gull 0 0 All Gulls 27 29 Black-legged Kittiwake 12 13 Black-footed Albatross 0 0 Laysan Albatross 0 0 Northern Fulmar 0 0 Murphy's Petrel 1 2 Short-tailed Shearwater 0 0 Unidentified Species 0 0
ALL BIRDS 107 2,287
Figure 1b. Aerial survey transect lines for the 20
February 1999 seabird survey.
4

CONFIDENTIAL
Table 1c. Summary of offshore aerial
seabird survey, 7 March 1999.
Figure 1c. Aerial survey transect lines for the 7 March 1999 seabird survey.
Bird Sightings Count Common Murre 37 94 Cassin's Auklet 6 6 Rhinoceros Auklet 0 0 Tufted Puffin 0 0 Ancient Murrelet 0 0 Marbled Murrelet 12 14 Unidentified Alcid 0 0 All Alcids 55 114 Brandt's Cormorant 1 1 Pelagic Cormorant 4 7 Unidentified Cormorant 13 23 All Cormorants 18 31 Common Loon 5 5 Red-throated Loon 16 17 Unidentified Loon 11 12 All Loons 32 34 Western Grebe 5 8 Black Scoter 0 0 Surf Scoter 51 1,042 White-winged Scoter 27 304 Unidentified Scoter 126 2,806 All Scoters 204 4,152 Unidentified Phalarope 0 0 Western Gull 52 149 Western x Glaucous-winged Gull 1 1
California Gull 14 19 Heerman's Gull 1 1 Herring Gull 0 0 Glaucous-winged Gull 9 13 Mew Gull 18 47 Ring-billed Gull 0 0 Unidentified Gull 46 660 All Gulls 141 890 Black-legged Kittiwake 12 61 Black-footed Albatross 0 0 Laysan Albatross 1 1 Northern Fulmar 0 0 Murphy's Petrel 0 0 Short-tailed Shearwater 0 0 Unidentified Species 18 39
ALL BIRDS 486 5,330
5

CONFIDENTIAL
Discussion of Birds at Risk Alcids, including murres, auklets, murrelets, and puffins, are frequent casualties of oil spills. Common Murres were most abundant in the offshore area north of the Siletz River, where aerial surveys revealed average densities on the water of 14 per km2. Aerial observers recorded the largest concentrations 45 miles offshore from Tillamook Bay, while boat crews noted a flock of 7,500 near Yaquina Head in March. Rhinoceros Auklets, Cassin's Auklets, and Tufted Puffins were also seen by aerial survey crews, particularly in the southern area. The presence of Marbled Murrelets in the nearshore and coastal regions, particularly in the south, was documented by both aerial and boat surveys. During aerial surveys, Marbled Murrelet sightings ranged from 4 to 28 individuals per day. Because Marbled Murrelets are small and dark-bodied, it is likely that some of the murrelets that were actually within the aerial search corridor were not enumerated. Scoters, forming long linear aggregations just seaward of the surf zone, were by far the most abundant birds. Large flocks were noted by both aerial observers and boat survey crews. The linear nature of the scoter distribution results in very large numbers of scoters being counted as the survey aircraft flies up the coastline, but these numbers cannot be directly compared to species with a more two dimensional distribution. Other seabirds were present in lower numbers. While scoters dominated the nearshore and coastal areas, loons, grebes, and cormorants were also widely distributed in these areas. Gulls were distributed along the coast and also occurred in areas farther offshore. The offshore mix consisted largely of Common Murres, auklets (particularly Cassin’s Auklets), gulls (especially Black-legged Kittiwakes ), and Procellarids (mostly Northern Fulmars).
BEACH SURVEYS Beach surveys and searches carried out during the spill response period were an important source of data. Together with the morgue and rehabilitation databases, searcher reports provided data on search effort, timing and location of beached bird recoveries, and observations of unrecovered oiled wildlife.
Methods Regular beach searches for both dead and live birds were conducted beginning on 9 February 1999 (although some intermittent searching was done prior to this), and continuing through March and sporadically into April. Beach searches continued in a few isolated areas of the coast into and throughout the summer months but data from these surveys were not included in this analysis. In an effort to standardize search effort during the spill response, the Oregon coast was divided into discrete search segments which were alpha-numerically coded. For clarity, the alpha-numeric codes were converted to geographic names for this analysis (Figure 2) (see also Appendix C). Segments were searched based on oil movement predictions from the National Oceanic and Atmospheric Administration (NOAA), Shoreline Cleanup Assessment Team (SCAT) reports, and the availability of beach surveyors. As with the spill itself the search effort consisted of two phases, prior to (Phase 1) and subsequent to (Phase 2) the towing effort and regrounding of the bow section at Waldport. During Phase 1 the search effort focused around the
6

CONFIDENTIAL
Coos Bay grounding site extending north to Horse Creek Coastal and south to Cape Arago. Phase 2 began on 26 February when efforts to free the bow section of the M/V New Carissa from its sandbars at Coos Bay were initiated in order to tow it to sea. All of Phase 2, including this stationary tugging, the attempted tow out to sea, the regrounding at Waldport, and the final tow and scuttling, affected almost the entire Oregon coast from Cape Arago north to the Silver Point search segment. The extent of the beach searches increased with time as oiled wildlife were reported on more northerly beaches. Beach searches reached a peak on 18 March when the greatest portion of Oregon Coast was searched (see Appendix A). After 22 March, search effort was primarily concentrated on those beach segments just north and south of the Waldport beaching site from Salmon River Coastal south to Horse Creek Coastal. Over 100 different searchers from over 20 different state and federal agencies, non-government agencies, and private companies participated in the spill response beach surveys. Searchers surveyed beach segments on foot, ATV, truck, or in some cases on bicycle. Appendix B contains a summary chart of the mode of transportation utilized in each search segment per day. In addition to live and dead birds observed, searchers recorded the number of live birds with visible oiling, the beach segment searched, the mode of transportation, the estimated percentage of
*Note: To eliminate inconsistencies, search segment names were generalized from several overlapping naming systems used during the spill response. See Appendix C for the equivalent spill response alpha-numeric search segment names.
Figure 2. The Oregon coastline divided into search segments used during spill response beach surveys.
7

CONFIDENTIAL
the segment covered by their search, and the length of time spent searching. Stranded dead birds were removed from the beach, transferred to a collection center, and subsequently catalogued and stored. Live captured birds were taken to rehabilitation facilities where they were cleaned and released when possible, or euthanized and taken to collection centers. Records were kept by both beach searchers and collection and rehabilitation center personnel regarding collected and captured birds.
Search Results Beach searches occurred on 19 days during the period from 4 February to 25 February (Phase 1) for a total of approximately 562 hours. Phase 2 included about 1,874 hours of search effort on 33 days between 26 February and 31 March. Although several more birds were found and recorded in morgue records in April, no search effort was recorded for this period. During the entire event 1,285 individual birds of 51 species were collected; 1,140 of these were dead or died after capture and 145 were alive and released back into the wild. Table 2 shows the total number of dead birds found in each species group for the entire spill period and for each phase. Of the total, 130 birds were found in Phase 1 and 1,010 birds were found during Phase 2. These totals do not include the 182 dead birds collected in the 3 northern-most search segments used during the spill (Slusher Lake, Gearhart, and Tillamook Head). Samples of oiled feathers from birds collected in these three search segments were analyzed and found not to be consistent with M/V New Carissa oil. All birds collected within these segments were excluded from the analyses conducted for this report.
8

CONFIDENTIAL
Table 2. Dead birds found during Phase 1 and 2 of the M/V New Carissa oil spill search effort. Numbers include birds recovered live which later died.
Species Phase 1 Phase 2 TotalAlcid, unk. spp. 11 11 Auklet, Cassin's 5 31 36 Auklet, Parakeet 3 3 Auklet, Rhinoceros 6 153 159 Auklet, unk. spp. 1 1 Bufflehead 1 3 4 Coot, American 2 2 Cormorant, Brandt's 2 82 84 Cormorant, Double-crested 1 1 Cormorant, Pelagic 2 2 Cormorant, unk. spp. 4 3 7 Crow, American 1 1 Duck, unk. spp. 3 3 Duck, Wood 1 1 Flicker, Northern 1 1 Fulmar, Northern 21 88 109 Grebe, Clark's 1 2 3 Grebe, Eared 2 2 Grebe, Horned 3 5 8 Grebe, Red-necked 3 3 Grebe, unk. spp. 2 4 6 Grebe, Western 23 41 64 Gull, Bonaparte's 1 1 Gull, Glaucous-winged 7 7 Gull, GW*WE (hybrid) 1 8 9 Gull, Herring 1 2 3 Gull, Mew 2 2 Gull, unk. spp. 6 15 21 Gull, Western 6 33 39 Hawk, Red-tailed 1 1 Jay, Steller's 1 1 Kittiwake, Black-legged 2 65 67
Species (cont.) Phase 1 Phase 2 TotalKittiwake, Red-legged 1 1 Loon, Common 12 46 58 Loon, Pacific 2 9 11 Loon, Red-throated 9 9 Loon, unk. spp. 2 2 Mallard 1 1 Murre, Common 9 74 83 Murre, unk. spp. 1 1 Murrelet, Ancient 4 4 Murrelet, Marbled 1 25 26 Owl, Barred 1 1 Plover, Snowy 1 1 Puffin, Horned 1 19 20 Puffin, unk. spp. 1 1 Puffin, Tufted 1 1 Sanderling 1 1 2 Scaup, Greater 1 1 Scoter, Black 5 5 Scoter, Surf 5 126 131 Scoter, White-winged 2 39 41 Scoter, unk. spp. 2 11 13 Shearwater, Short-tailed 1 2 3 Shearwater, Sooty 3 3 Shearwater, Wedge-tailed 1 1 Shorebird, unk. spp. 1 1 Sparrow, Fox 1 1 Storm-petrel, Fork-tailed 9 9 Storm-petrel, Leach's 5 5 Surfbird 1 1 Thrush, Varied 2 2 Unknown bird 5 34 39
Totals 130 1,010 1,140 We multiplied the length of each beach segment by the percent surveyed, as estimated by each searcher, to obtain an approximation of the total distance surveyed in each segment. By this method, an estimated 1,253.7 km of beach was searched in Phase 1 and 3,231.3 km in Phase 2 (4,485 km total). Figure 3 illustrates how the beaching rate varied through time as the spill progressed. Figure 4 shows beaching rates as they varied in the different beach segments along the Oregon coastline.
9

CONFIDENTIAL
0.00
0.10
0.20
0.30
0.40
0.50
0.60
0.70
0.802/
4/99
2/11
/99
2/18
/99
2/25
/99
3/4/
99
3/11
/99
3/18
/99
3/25
/99
4/1/
99
4/8/
99
4/15
/99
4/22
/99
Dead Birds per Kilometer
Phase 1 Phase 2
Wal
dpor
t Gro
undi
ng
Coo
s B
ay G
roun
ding
Figure 3. The average number of dead birds found per kilometer of searched beach over time.
0.00
0.20
0.40
0.60
0.80
1.00
1.20
Silv
er P
oint
Neh
alem
Bay
Nor
th
Tilla
moo
k B
ay C
oast
al
Net
arts
Bay
Coa
stal
San
d La
ke C
oast
al
Nes
tucc
a B
ay S
outh
Sal
mon
Riv
er C
oast
al
Sile
tz B
ay C
oast
al
Otte
r Roc
k
Yaq
uina
Hea
d
Yaq
uina
Bay
Als
ea B
ay C
oast
al
Wal
dpor
t Coa
stal
Yac
hats
Riv
er C
oast
al
Hec
eta
Hea
d
Ber
ry C
reek
Coa
stal
Woa
hink
Lak
e C
oast
al
Thre
emile
Cre
ek C
oast
al
Um
pqua
Est
uary
Tenm
ile C
reek
Coa
stal
Hor
sfal
l Bea
ch
Coo
s N
orth
Spi
t
Cap
e A
rago
Dead Birds per Kilometer
Wal
dpor
t Gro
undi
ng S
ite
Coo
s Ba
y G
roun
ding
Site
Figure 4. The average number of dead birds found per kilometer of searched beach for each search segment.
10

CONFIDENTIAL
Figure 5 combines these same data from Figures 3 and 4 to display the bird mortality rate for each beach segment over time. The resulting display suggests that the impacts of Phase 1 and Phase 2 can be readily distinguished, with Phase 2 showing much higher bird mortality than Phase 1. Although much of the analysis of oil and tarballs done prior to this report concentrated on the first grounding of the M/V New Carissa, the patterns of bird mortality as illustrated in Figure 5 clearly indicate that birds were more impacted subsequent to the attempted tow (March 2) and second grounding (March 3), than they were in Phase 1.
4-Fe
b
6-Fe
b
8-Fe
b
10-F
eb
12-F
eb
14-F
eb
16-F
eb
18-F
eb
20-F
eb
22-F
eb
24-F
eb
26-F
eb
28-F
eb
2-M
ar
4-M
ar
6-M
ar
8-M
ar
10-M
ar
12-M
ar
14-M
ar
16-M
ar
18-M
ar
20-M
ar
22-M
ar
24-M
ar
26-M
ar
28-M
ar
30-M
ar
1-A
pr
S ilver Point
Cape Falcon
Nehalem Bay South
Oceanside
Cape Lookout
Nestucca Bay North
Cascade Head
Siletz Bay North
Depoe Bay Coastal
Beverly Beach
Newport
Thiel Creek Coastal
A lsea Bay
Yachats Coastal
Rock Creek Coastal
Horse Creek Coastal
S iuslaw River Coastal
S iltcoos River Coastal
Umpqua River Coastal
Umpqua South Spit
Hauser
New Carissa
Coos Estuary
Phase 1
Phase 2
Key
Grounding s ite
No effort0 birds found/km
>1.6 birds found/km1.11-1.6 birds found/km0.71-1.1 birds found/km0.41-0.7 birds found/km0.21-0.4 birds found/km0.01-0.2 birds found/km
Figure 5. The number of birds found per kilometer, plotted through space and time.
SHOREBIRD POPULATION SURVEYS Although dead shorebirds are infrequently found on beaches during an oil spill, large numbers are often observed with oil-streaked plumage. While oiled shorebirds may recover in time, it is likely that some do not and that others are reproductively impaired. It is therefore important to obtain an estimate of the numbers of shorebirds that may be subject to the effects of the spilled oil. Two shorebird population censuses were conducted during the spill. The first survey was conducted by USFWS personnel on 14 February 1999 and included most beach segments that had been affected by the spill to that point. As the spill progressed and more of the coastline became impacted, concerns over the limited geographic extent of this first survey and the
11

CONFIDENTIAL
potential change in shorebird species composition over the extended period of the spill resulted in a second survey being conducted on 8 March 1999. Crescent Coastal Research (CCR) was contracted to complete this second systematic survey of the entire spill-affected area.
Methods Carrie Phillips and Dave Pitkin of the USFWS conducted the first shorebird survey. Their survey included the coastline from Hauser to Berry Creek Coastal, excluding Woahink Lake Coastal and Siuslaw River Coastal search segments. Two unpublished memos by Phillips and Pitkin detail the methodology and results of each of their respective portions of the survey (Phillips 1999, Pitkin 1999). Phillips surveyed the southern portion of the survey area from Threemile Creek Coastal to Hauser. Search segments were surveyed from north to south using a 4WD vehicle. Phillips’ study area was surveyed continuously except for 3 temporal gaps where high tide and topography required exiting the beach to circumvent water features. Phillips recorded the total number of shorebirds observed, the number that were scanned for oil, and the number with detectable oiling. Shorebirds flying from north to south (i.e. from the direction of previously surveyed areas) were not counted, to reduce the possibility of double counting. Snowy Plovers, which were being monitored by other USFWS personnel, were counted by Phillips but not scanned for oil. Pitkin’s portion of the 14 February survey was conducted from south to north using an ATV, starting at Siltcoos River Coastal and proceeding on to Horse Creek Coastal and Berry Creek Coastal. Pitkin recorded the total number of birds observed and the number of oiled shorebirds; gulls and other bird species were not scanned for oil. Snowy plovers were counted and scanned for oil in this portion of the USFWS survey. Gulls were not identified to the species level by either Pitkin or Phillips. Deborah Jaques of CCR completed a report (Jaques 1999) detailing the methodologies and results of the CCR survey, which are summarized here. The CCR surveys were conducted by four teams of biologists over a two-day period. The southern portion of the spill area near Coos Bay was surveyed on 8 March 1999 and included all coastal areas from Bastendorff Beach (within the Cape Arago search segment) north to Berry Creek (Berry Creek Coastal). The Waldport spill area was surveyed on 10 March north from Berry Creek (Horse Creek Coastal) to Yaquina Head. Most surveys were done using 4WD vehicles or ATV. In areas inaccessible to vehicles, surveyors walked or used spotting scopes to survey the segment. Only birds observed on the beach or within the intertidal zone were counted for purposes of population estimates (i.e. birds swimming in the surf zone or flying over the water were not counted). Snowy Plovers were not included in the CCR surveys.
Results Phillips and Pitkin observed a total of 3,946 shorebirds and 107 gulls from Hauser to Berry Creek Coastal on 14 February 1999. Sanderlings made up 99.3% of the shorebird species observed. A Willet, five Black-bellied Plovers, a Semipalmated Plover, and twenty-one Western Snowy Plovers made up the remaining 0.7% of species’ observations. Table 3 details the numbers of species observed by Phillips and Pitkin in the eight beach segments covered by her survey.
12
CONFIDENTIAL
Table 3. Gull and shorebird species observed during the USFWS survey, 14 February 1999.
Species
Ten
mile
Cre
ek
Coa
stal
&
Hau
ser
Um
pqua
Sou
th
Spit
Um
pqua
Riv
er
Coa
stal
Thr
eem
ile C
reek
C
oast
al
Siltc
oos R
iver
C
oast
al
Hor
se C
reek
C
oast
al &
Ber
ry
Cre
ek C
oast
al
T
OT
AL
Sanderling 164 77 782 894 963 1,038 3,918 Black-bellied Plover 5 5 Semipalmated Plover 1 1 Western Snowy Plover 8 13 21 Willet 1 1 Total Shorebirds 164 85 782 896 968 1,051 3,946
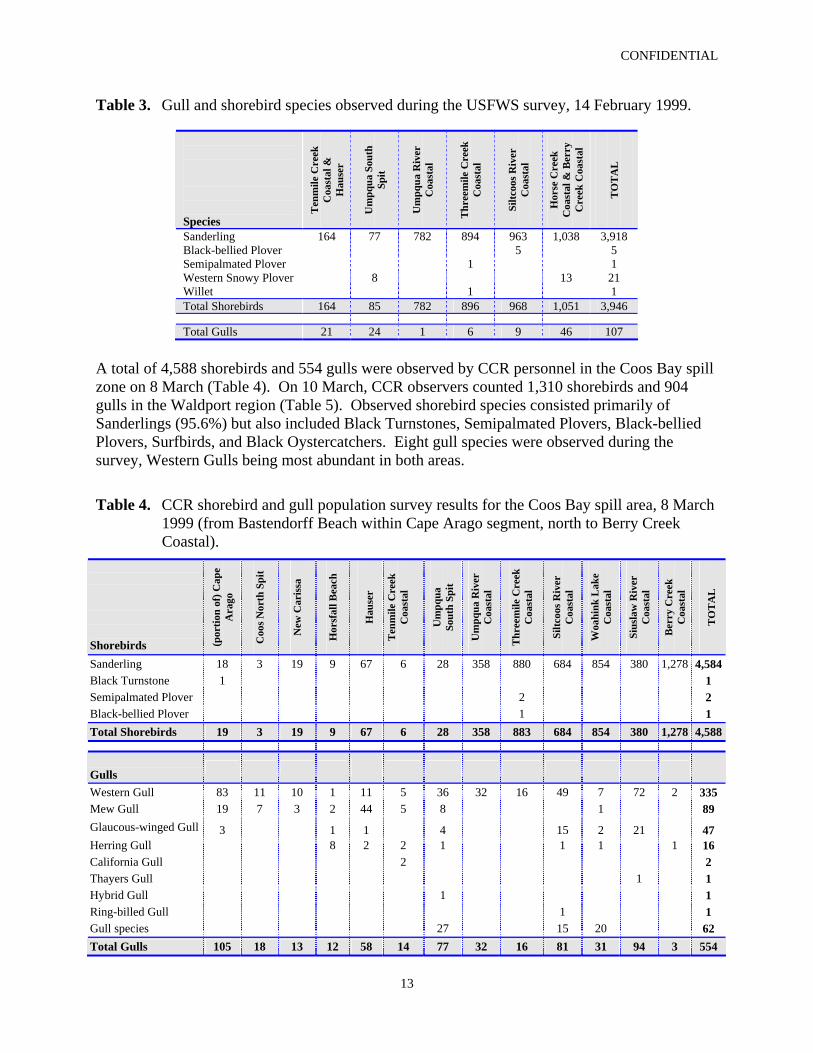
Total Gulls 21 24 1 6 9 46 107 A total of 4,588 shorebirds and 554 gulls were observed by CCR personnel in the Coos Bay spill zone on 8 March (Table 4). On 10 March, CCR observers counted 1,310 shorebirds and 904 gulls in the Waldport region (Table 5). Observed shorebird species consisted primarily of Sanderlings (95.6%) but also included Black Turnstones, Semipalmated Plovers, Black-bellied Plovers, Surfbirds, and Black Oystercatchers. Eight gull species were observed during the survey, Western Gulls being most abundant in both areas.
Table 4. CCR shorebird and gull population survey results for the Coos Bay spill area, 8 March 1999 (from Bastendorff Beach within Cape Arago segment, north to Berry Creek Coastal).
Shorebirds (p
ortio
n of
) Cap
e A
rago
Coo
s Nor
th S
pit
New
Car
issa
Hor
sfal
l Bea
ch
Hau
ser
Ten
mile
Cre
ek
Coa
stal
Um
pqua
So
uth
Spit
Um
pqua
Riv
er
Coa
stal
Thr
eem
ile C
reek
C
oast
al
Siltc
oos R
iver
C
oast
al
Woa
hink
Lak
e C
oast
al
Sius
law
Riv
er
Coa
stal
Ber
ry C
reek
C
oast
al
TO
TA
L
Sanderling 18 3 19 9 67 6 28 358 880 684 854 380 1,278 4,584Black Turnstone 1 1 Semipalmated Plover 2 2 Black-bellied Plover 1 1 Total Shorebirds 19 3 19 9 67 6 28 358 883 684 854 380 1,278 4,588
Gulls
Western Gull 83 11 10 1 11 5 36 32 16 49 7 72 2 335 Mew Gull 19 7 3 2 44 5 8 1 89 Glaucous-winged Gull 3 1 1 4 15 2 21 47 Herring Gull 8 2 2 1 1 1 1 16 California Gull 2 2 Thayers Gull 1 1 Hybrid Gull 1 1 Ring-billed Gull 1 1 Gull species 27 15 20 62 Total Gulls 105 18 13 12 58 14 77 32 16 81 31 94 3 554
13

CONFIDENTIAL
As with the USFWS survey, Sanderlings were much more abundant in the northern half of the Coos Bay survey area, with a density of 69.4 birds/km between the Umpqua and Siuslaw rivers (from Umpqua River Coastal to Woahink Lake Coastal). Fewer than 4 birds/km were observed south of the Umpqua River. Sanderlings in the Waldport survey region were most abundant within the Waldport Coastal and southern half of the Alsea Bay Coastal search segments.
Table 5. CCR shorebird and gull population survey results for the Waldport spill area, 10 March 1999 (Horse Creek Coastal to Newport).
Shorebirds
Hor
se C
reek
C
oast
al
Hec
eta
Hea
d
Roc
k C
reek
C
oast
al
Yac
hats
Riv
er
Coa
stal
Yac
hats
C
oast
al
Wal
dpor
t C
oast
al
Als
ea B
ay
Coa
stal
Thi
el C
reek
C
oast
al
New
port
TO
TA
L
Sanderling 178 268 481 125 1,052 Black Turnstone 11 6 33 40 46 2 138 Surfbird 0 56 28 11 95 Black Oystercatcher 2 2 6 10 2 3 25 Total Shorebirds 2 191 12 43 98 268 558 138 0 1,310
Gulls
Western Gull 59 3 147 110 27 203 17 566 Mew Gull 10 10 20 Glaucous-winged Gull 2 18 17 5 18 7 67 Herring Gull 8 3 11 Thayer's Gull 1 1 Hybrid Gull 1 1 2 Gull species 32 98 107 237 Total Gulls 61 3 32 263 137 32 240 29 107 904
In the area of overlap between the USFWS and CCR surveys, Hauser to Berry Creek Coastal, the USFWS shorebird counts were higher than the CCR counts in most segments. Gull observations, on the other hand, were lower in the USFWS survey when compared with the CCR survey. Table 6 shows the percent difference in estimated shorebird and gull populations for the search segments in which both USFWS and CCR conducted surveys, and gives the total average percent difference between the two surveys. Because of the relatively large discrepancy in population estimates in addition to the long period of time over which the M/V New Carissa oil spill took place, both population surveys were used to get a range for the estimated shorebird and gull population sizes present during the spill. CCR’s estimates define the lower limit of the shorebird population range and the upper limit of the gull population estimate. While the USFWS counts define the upper shorebird population estimate in the overlapping survey area, their survey did not cover search segments in the Waldport area or some areas to the south. To achieve an upper limit for the shorebird population estimate and a lower limit for the gull population estimate which applies to the entire spill affected area, we used the total shorebird and gull counts from the CCR survey multiplied by the average percent difference between the CCR and USFWS surveys (Table 7).
14

CONFIDENTIAL
Table 6. Percent difference in the USFWS population estimates as compared to the CCR survey estimates.
Hauser & Tenmile Creek
Coastal
Umpqua South Spit
Umpqua River Coastal
Threemile Creek Coastal
Siltcoos River
Coastal
Horse Creek Coastal & Berry Creek Coastal
Average Percent
Difference
Shorebirds 236% 275% 218% 101% 142% 82% 176%
Gulls 29% 31% 3% 38% 11% 72% 31%
Table 7. Estimated gull and shorebird population size ranges based on the CCR and USFWS surveys.
Shorebirds
CCR’s Population Estimate
Multiplier
Alternative Pop. Estimate (based on USFWS survey)
Population Estimate Range
Total Coos Bay Area 4,588 1.76 8,075 4,588 – 8,075 Total Waldport Area 1,310 1.76 2,306 1,310 – 2,306 Gulls Total Coos Bay Area 554 0.31 172 172 –554 Total Waldport Area 904 0.31 280 280 - 904
RATES DERIVED FROM FIELD STUDIES
Bird carcasses recovered from beaches during a spill event do not represent a complete count of the birds killed by the spilled oil. Some birds are removed by scavengers before beach search crews arrive, and some birds are missed by search teams. On the other hand, some carcasses that are found represent natural mortality unrelated to the spill. In an effort to derive rates for these processes we conducted several field studies and analyzed field data collected by others.
SCAVENGING STUDY During the M/V New Carissa, carcasses of seabirds and shorebirds that died of either natural or oil-induced causes were deposited along the shoreline where a proportion of them were recovered by human searchers. However, data from several studies indicate that carcasses may be rapidly removed from the surface of the beach by mammalian or avian scavengers, human interference, or burial. The rate of carcass removal strongly affects the number of dead and injured seabirds recovered during an oil spill, and is therefore important in estimating the total number of seabirds killed or injured by the spill.
15

CONFIDENTIAL
Carcass persistence appears to be variable and is probably determined by a combination of shoreline structure, habitat, weather conditions, human use, and predator populations. It is therefore difficult to assign an “average” or “typical” value to persistence rate. For example, a literature survey by Burger and Fry (1993) found carcass persistence rates for seabirds varying from 45% to 84% per day (see also: Van Pelt 1993; Burger 1991; Page et al 1990; Piatt et al. 1990; Ford et al 1991a; Ford et al 1991b; Humphries 1989; Dale 1989). In an effort to acquire a more accurate estimate for the beaches involved in the M/V New Carissa spill a scavenging study was conducted. This study was designed to provide estimates of carcass removal rates that are specific to the shorelines in the vicinities of Coos Bay, Reedsport, and Waldport, Oregon.
Study Methods On 27 and 28 March 2000, bird carcasses were placed along four beach segments within the area where birds were recovered during the spill. These sites were located as follows:
Coos Bay A: Hauser – beach north and south of Hauser access point Coos Bay B: Sparrow Park – beach north and south of Sparrow Park access point Waldport A: Colorado St. – beach north of Colorado St. Access point Waldport B: Driftwood – beach north of Driftwood State Wayside
Carcasses were placed along the wrack line (just above high tide). Occasionally high tide came nearly to the base of adjacent bluffs. When this occurred, carcasses were placed as close to the base of the bluff as possible or were even elevated if a sandy bench or mound of beach grass was present. In no case was a carcass placed on top of a bluff or dune. Carcasses were spaced by selecting a random number between 0 and 200 and then placing a carcass that number of meters from the last carcass, yielding a mean spacing of about 100 m between birds. Positions were marked by placing a numbered wooden block beneath each carcass and by placing a surveyor flag at an elevated position directly inland from the carcass. Carcass positions were also recorded with GPS equipment. If the randomized position fell on an unusable stretch of shoreline, the carcass was placed in the first position possible. The carcasses used for this study were retrieved from Washington and Oregon beaches by personnel monitoring seabird mortality. Carcasses were identified as small, medium, or large-bodied. Large-bodied carcasses were those weighing greater than 1 lb and included adult Common Murres, assorted gulls, one Northern Fulmar and one American Coot. Medium-bodied carcasses weighed between 8 oz and 1 lb. Juvenile Common Murres and a single adult Rhinoceros Auklet made up this size class. Small-bodied carcasses weighed less than 8 oz and included Common Murre chicks, Cassin’s Auklets, and an Ancient Murrelet. Midway through the study an intact carcass of a Fork-Tailed Storm Petrel was found washed up on the beach. This was classified as a small-bodied carcass and was placed on one of the transects to replace another small-bodied carcass which had been taken by the tide. Table 8 gives the number of carcasses of each species used in the study.
16

CONFIDENTIAL
Table 8. Tally of carcass species used in the carcass persistence study.
Species Number
Large-bodied carcasses: American Coot 1
Common Murre (adult) 25 Franklin’s Gull 1
Glaucous-winged Gull 1 Northern Fulmar 1 Ring-billed Gull 1
Unidentified Gull 3 Western Gull 1
Subtotal: 34
Medium-bodied carcasses: Common Murre (juvenile) 38
Rhinoceros Auklet 1 Subtotal: 39
Small-bodied carcasses: Ancient Murrelet 1
Cassin’s Auklet 4 Common Murre (chick) 22 Fork-tailed Storm Petrel 1
Subtotal: 28
Total carcasses: 101
Fifty carcasses (25 per transect) were placed along the seashore at the Waldport sites on 27 March 2000. Fifty additional carcasses (25 per transect) were placed at the Coos Bay sites on 28 March 2000. Species, age class, and position were recorded for each carcass that was placed in the field. Following the placement of the carcasses, each shoreline segment was checked once daily by 1-3 observers. At the Waldport sites and Coos Bay A site, observers used an ATV to travel from one carcass placement location to another, approaching on foot to determine extent of scavenging. At the Coos Bay B site, observers worked entirely on foot. When carcasses were removed or partially scavenged, the time, scavenging code, presence of the wooden block, and data related to the condition of the carcass or associated scavenger signs were recorded. Scavenging codes were defined as follows:
1 – Unscavenged: The carcass was entirely undisturbed 2 – Disturbed: The carcass had been moved, but was still visible from its original
location (marked by the wooden block) and had not been scavenged. 3 – Partially scavenged: Less than 50% of the carcass was removed. This level
was generally applied when small holes had been opened in the body or when a body part or two was missing (such as the eyes or head).
17

CONFIDENTIAL
4 – Heavily scavenged: 50% or more of the carcass was removed. Generally this meant that the body cavity had been opened and the internal organs and breast muscle had been removed.
5 – Removed: All edible parts of the carcass were removed. The carcass was identifiable only by remaining feathers, bones, or hide.
6 – No trace: There was no trace of the carcass or any part of it.
Personnel continued to check shoreline segments for six consecutive days.
Study Results Scavenging occurred along all segments within the first 24 hours of carcass placement. Strong winds during most of the study made identification of possible scavengers difficult since blowing sand obscured many tracks. Observations of avian scavengers were limited since the wind was often so strong that few birds were able to fly seaward of the dunes. However, from sightings or tracks that were available, we believe the predominant avian scavengers were Common Ravens, American Crows, Turkey Vultures, Bald Eagles, and gulls. One carcass on the Coos Bay B transect was observed being scavenged by a Turkey Vulture before all the carcasses along that transect had been placed. American Crow tracks were numerous along the Waldport transects. Probably due to strong winds and blowing sand, we did not observe tracks from mammalian scavengers, although raccoon, skunks, foxes, opossum, weasel, and mink are reported to be common in the area (Kritz, BLM, pers. comm.). Larger mammals such as coyotes and bear also occur within the area but in much lower numbers. Domestic dogs were present at the Waldport sites and Coos Bay B site. Dogs were observed sniffing and investigating study carcasses. It is possible that dogs may have moved some of the carcasses, but dogs were never observed actually scavenging the carcasses and it is unknown whether they did so. Carcasses generally met one of two fates, either episodic dismemberment and removal, or complete disappearance. Sixty percent of the carcasses, mainly large and medium-bodied carcasses, were scavenged in a gradual and characteristic way (Table 9). Entrails and/or pectoral muscles were generally the first body parts to be consumed. Scavengers accessed these parts either by tearing open the abdomen, or occasionally opening holes in the back. After the pectoral muscles and the contents of the thoracic and abdominal cavities were removed, generally skin, bones, and feathers were all that remained. In some instances the flesh around the neck was consumed or the eyes were devoured. Two small-bodied carcasses had the heads entirely removed. In a few cases, scattered body parts were all that remained of a carcass. After 24 hours, a Northern Fulmar carcass placed on the Coos Bay A transect was reduced to a leg bone and a wing.
18

CONFIDENTIAL
Table 9. Scavenging trends for different sized carcasses.
Body Size
Gradually Scavenged
Disappeared
Untouched
Large 65% 32% 3% Medium 74% 26% 0% Small 33% 63% 4% Total 60% 38% 2%
The second scavenging trend involved 38% of the carcasses and was more prominent among small-bodied carcasses (Table 9). In this process the carcass would experience little or no scavenging and then would disappear entirely. If the carcass was gone but the wooden block remained, it was assumed that the carcass had been taken by a scavenger. If the wooden block was missing as well, the observers tried to determine whether the carcass had been buried (by humans or the wind) or washed out by the tide. Table 10 summarizes the fates of missing carcasses. Carcasses which were washed out or whose fates were undetermined were not included in the remaining analyses.
Table 10. Numbers of carcasses missing due to various factors.
Body Size Scavenging Washout Burial Undetermined Total Large 4 1 3 3 11 Medium 4 2 2 2 10 Small 10 6 2 0 18 Total 18 9 7 5 39
The number of times a carcass changed state may provide an index of the relative importance of mammalian versus avian scavenging (Table 11). For example, the change from intact to disturbed or from heavily scavenged to removed would each count as one state change. A carcass that changed gradually from intact to disturbed to partially scavenged to heavily scavenged to removed would receive a maximum score of 4 state changes. A carcass that went abruptly from intact to total removal would receive a minimum value of 1 state change. Carcasses that were never disturbed were excluded from this analysis. Changes of state were most gradual at Coos Bay B and most abrupt at Coos Bay A.
Table 11. Mean number of times a carcass changed state.
Body Size Coos Bay A Coos Bay B Waldport A Waldport B Large 1.40 1.57 1.67 1.50 Medium 1.50 1.50 1.67 1.75 Small 1.00 1.60 1.50 1.30 Mean Total 1.37 1.62 1.59 1.54
19

CONFIDENTIAL
The persistence time of carcasses was calculated as the number of days between placement and complete removal. Since a carcass could have disappeared at any time between when it was last checked and when it was found to be missing, the persistence time in the interval prior to removal was estimated to be 0.50 days. If a carcass was still present at the end of the study, the persistence time was counted as 6.00 days. Mean persistence times for all carcasses varied from 3.87 days at Coos Bay B to 5.82 days at Waldport B (Table 12).
Table 12. Mean number of days a carcass persisted.
Body Size Coos Bay A Coos Bay B Waldport A Waldport B Large 5.10 5.07 5.50 5.94 Medium 5.44 4.35 5.17 6.00 Small 2.33 3.67 3.37 5.42 Total 4.37 3.87 4.48 5.82
Small-bodied carcasses disappeared more rapidly than large or medium-bodied carcasses. The mean persistence of small-bodied carcasses ranged from 2.33 days at Coos Bay A to 5.42 days at Waldport B. Overall, medium-bodied carcasses disappeared slightly more rapidly than large-bodied carcasses, however this wasn’t consistent from site to site. Medium-bodied carcasses disappeared more slowly than large-bodied carcasses at Coos Bay A and Waldport B. The mean persistence of medium-bodied carcasses ranged from 4.35 at Coos Bay B to 6.00 at Waldport B. The mean persistence of large-bodied carcasses ranged from 5.07 at Coos Bay B to 5.94 at Waldport B. The rate of carcass removal was greatest initially, tapering off with time (Figure 6) as the more palatable and accessible carcasses were scavenged and the remaining carcasses deteriorated and/or were obscured by blowing sand. Small-bodied carcasses disappeared more rapidly and spent less time in heavily scavenged states than large and medium-bodied carcasses. Large and medium-bodied carcasses exhibited similar scavenging patterns, tending to remain on the beach after reaching a heavily scavenged state, whereas small-bodied carcasses were more likely to be removed entirely. We tested the following hypotheses relating to the rate at which scavenging took place:
Hypothesis 1: The rate of carcass removal is independent of site. Hypothesis 2: The rate of carcass removal is independent of the length of time
the carcass has been on the beach. Hypothesis 3: The rate of removal of small-bodied carcasses and large-bodied
carcasses is the same.
20

CONFIDENTIAL
Hypothesis 1: We used a Chi square test to determine whether or not the number of carcasses removed by a given day of the study was independent of site. We compared the number of carcasses removed by Day 6 with the number of carcasses present on Day 6, taking all four sites into consideration simultaneously. The rate of carcass removal was not significantly related to site (P = 0.111). Therefore, Hypothesis 1 cannot be rejected. We interpret this to mean that all four sites were similar in terms of the rate of carcass removal throughout the course of the study.
Figure 6. Scavenging rates for both Coos Bay and Waldport sites. The width of each band represents the percent of carcasses in each state over time.
Entire Study Area - Medium-bodied Carcasses
0%
25%
50%
75%
100%
Day0 Day1 Day2 Day3 Day4 Day5 Day6
Day of Study
Perc
enta
ge
removed
heavily scavengedpartially scavenged
unscavenged
Entire Study Area - Small-bodied Carcasses
0%
25%
50%
75%
100%
Day0 Day1 Day2 Day3 Day4 Day5 Day6
Day of Study
Perc
enta
ge removed
heavily scavengedpartially scavenged
unscavenged
Entire Study Area - Large-bodied Carcasses
0%
25%
50%
75%
100%
Day0 Day1 Day2 Day3 Day4 Day5 Day6
Day of Study
Perc
enta
ge
removed
heavily scavengedpartially scavenged
unscavenged
Entire Study Area - All Carcasses
0%
25%
50%
75%
100%
Day0 Day1 Day2 Day3 Day4 Day5 Day6
Day of Study
Perc
enta
ge
removed
heavily scavenged
partially scavenged
unscavenged
Hypothesis 2: Given that the number of carcasses removed by a given day was independent of site, we used linear regression to determine whether the daily rate of carcass removal was independent of day, or the length of time the carcass had been on the beach. The proportion of carcasses removed on a given day is significantly correlated with the number of days since the beginning of the study (t= 2.099, P < 0.05). The form of the relationship is negative, indicating that the probability that a carcass will disappear entirely decreases with the age of the carcass. Based on this test, we reject the hypothesis that the rate of carcass removal is independent of the length of time that a carcass has been on the beach. Hypothesis 3: We used a z-test to determine if there was a significant difference between the removal rate of small-bodied carcasses, and large and medium-bodied carcasses. We compared the number of large and medium-bodied carcasses removed by Day 6 with the number of small-bodied carcasses removed by that day. The
21
CONFIDENTIAL
proportion of large and medium-bodied carcasses removed by Day 6 differed significantly from the proportion of small-bodied carcasses removed by Day 6 (z = 2.116, P < 0.05). We therefore reject the hypothesis that the rate of removal of small-bodied carcasses and large and medium-bodied carcasses is the same.
Discussion Body size is an important factor in determining the rate at which carcasses are removed from the beach. Small-bodied carcasses were removed at more than twice the rate that large and medium-bodied were removed. The age of the carcass may be another factor in the rate; the removal rate decreases with time indicating that older carcasses are removed at a lower rate than fresh ones. Human use of the Waldport sites and the Coos Bay B site was regular and at times heavy. We recorded numerous instances of human interference with the study. Carcasses at the Waldport sites were regularly buried, and even re-buried by human means. Flags marking carcass locations were often moved or removed by human visitors. In addition to human disturbance, some carcasses were buried by strong wind (25-30 knots) that prevailed throughout most of the study. Most carcasses were buried to some degree every day after 28 March, when the winds began. In some cases only a few feathers were visible. In other instances we staked tall sticks into the sand right at the location of the carcasses to help relocate them. Some carcasses were found further and further southward of the location where they were originally placed, probably blown by the wind. The removal rate of carcasses from the beach is related to the density and composition of the scavenging fauna. Heavy wind reduced our ability to identify avian scavenger tracks near the carcasses. American Crows, Common Ravens, Turkey Vultures, and gulls were all observed in varying numbers at all study sites on all days. However, as the wind increased, birds seemed less willing to fly seaward of the bluffs where winds were the heaviest. The high winds also obscured any non-avian tracks, leaving no record of mammalian scavengers. For the purposes of this study, we deliberately placed carcasses above the high tide line to avoid wash out of carcasses. During the M/V New Carissa incident, many carcasses were probably refloated and washed out on the next descending tide. Some portion of these were probably beached again further along the coast, but some undoubtedly sank before being re-beached.
SEARCHER EFFICIENCY STUDY Because response personnel often fail to detect beach cast birds when searching the shoreline, we correct for the probability that a carcass will be missed one or more times during a beach search. Data for estimating the efficiency of searchers in locating carcasses was derived from a study carried out as part of an assessment of the impacts of the 1997 M/V Kure oil spill. Because this assessment is ongoing, full details of the study cannot be included here, but a brief synopsis of the methodology follows. Bird carcasses were placed randomly along several different types of beaches in the Humboldt Bay area during March of 1999. Response personnel that had worked on bird recovery during the M/V Kure spill in California then searched these beaches using several different methods of transportation, including on ATV and on foot, and we recorded
22

CONFIDENTIAL
whether or not they were successful in locating each carcass. The searcher efficiency rates (number of carcasses found divided by the number of carcasses present) used for the M/V New Carissa analysis were based on 98 trials by searchers on ATV's on sandy beaches. These beaches included a representative sampling of bluff backed beaches, dune backed beaches, and wrack-laden beaches. Whether or not the proportion of beaches of various types during the M/V New Carissa incident were the same as the proportions sampled in the M/V Kure study is difficult to determine. There was no systematic recording of beach structure during the M/V New Carissa incident that would allow us to make such a comparison. Our subjective impression, based on our own experience and on conversations with spill response personnel familiar with both the Oregon Coast and with the Humboldt Bay area, is that the two areas are generally comparable. The M/V Kure study provides the only relevant searcher efficiency data for situations of this type.
BACKGROUND BIRD MORTALITY RATES Given the amount of oil involved, the M/V New Carissa event was unusual in terms of the length of coastline affected and the duration of the impacts. Seabird mortality from the M/V New Carissa took place against a background of natural mortality, and it is possible that many of the beached birds that were recovered were not killed by oil from the M/V New Carissa. We do not consider obvious evidence of oiling on a carcass to be a reliable method for determining which birds were or were not killed by oil. Oil can be present externally or internally in small quantities and may be very difficult to detect. In some cases, the oil that killed a bird can wash off before it is recovered, or the fouled feathers may be torn off by scavengers. We therefore determined to use estimates of natural carcass beaching rates as a method for separating natural mortality from oil induced mortality. We examined three different data sets as possible sources of estimates of natural carcass deposition rates: (1) data collected by Bob Loeffel from 1978 to 1998, (2) data collected by response personnel during the M/V New Carissa event, and (3) data collected near Coos Bay by Dan Varoujean in 1999 under contract to Polaris Applied Sciences.
Long-term Data from one Oregon Beach Robert Loeffel, a retired biologist formerly with the Oregon Department of Fish and Wildlife, systematically recorded dead beached bird data from a regularly-visited section of Oregon beach beginning in December 1978. The 7.4 km section of beach is located approximately 3.5 km south of Newport and covers the 2.8 km of beach between Henderson Creek and Thiel Creek and 4.6 km south of the Thiel Creek to Beaver Creek. The beach was surveyed at a jogging pace from 1978 until 1984, from which point the surveys were carried out at a walking pace. Surveys were conducted every 6 to 8 days, but the interval ranged from 1 to 11 days. The surveys were conducted along the upper wrack line which was found to contain the majority of beached birds. Birds observed on other parts of the beach were recorded but were not necessarily sought out. Date, section of beach surveyed, weather condition, and bird species were consistently recorded for most surveys, and the age of the bird (adult, juvenile, chick), condition of carcass, and oiling or entanglement were noted intermittently.
23

CONFIDENTIAL
Loeffel’s data were analyzed in an attempt to determine a baseline beached bird deposition rate from which deposition rates for the entire M/V New Carissa spill area could be extrapolated. The hope was that results from the spill response beach surveys could be compared with Loeffel’s data to discern how many of the dead birds found during the M/V New Carissa incident were attributable to background bird mortality, and thus how many could be attributed to the oil spill. Differences between Loeffel’s surveys and the spill response surveys, primarily in terms of the frequency of surveys, however, made direct comparison between the data sets difficult. The beached bird deposition rate is calculated as the number of birds deposited within a given length of beach over a given length of time. Typically the deposition rate is calculated per day or 24 hour period. Because the interval between Loeffel’s surveys was variable and usually more than one day apart, a beached bird deposition rate comparable to that recorded during the M/V New Carissa incident could not be derived. Several observations can be made from Loeffel’s extensive data, however. A comparison of monthly beached bird levels across all years, showed that despite annual variation, February and March bird mortality levels were consistently some of the lowest of the year (Figure 7). Mortality levels appear to peak along that section of Oregon coast in late summer and early fall (July to October), and remain low throughout the latter half of winter and into spring (January to June). The implication is that, in general, natural bird mortality rates are relatively low during the time when spill response beach surveys were being conducted. 1998
1995
1992
1989
1986
1983
1980
Janu
ary
Febr
uary
Mar
ch
Apr
il
May
June July
Aug
ust
Sep
tem
ber
Oct
ober
Nov
embe
r
Dec
embe
r
0
200
400
600
800
1000
1200
1400
Figure 7. The number of dead beached birds recorded by Loeffel in his beach survey area, plotted by month and year.
An analysis was also done on the level of bird mortality in relation to the weather patterns recorded during Loeffel’s surveys. The weather condition (mostly as
24

CONFIDENTIAL
indicated by wind direction and speed) was recorded as 1 of 11 possible scenarios: light winds, calm, east, northwest, northwest light, southwest storm, southwest blow, southwest, southwest light, west and mixed winds. The number of beached birds observed by Loeffel during storm or heavy wind events (southwest storm and southwest blow) during February and March were compared to non-storm events (all remaining weather categories) to ascertain whether bird mortality increased as a result of storm events. While some elevation in bird beaching was detectable during periods of southwest storms or southwest blows, the difference was not substantial enough to account for the significant increases in bird mortality seen following the storm event which blew the bow section of the M/V New Carissa ashore at Waldport. The dead bird beaching rate (number of birds found per recorded instance of a given weather condition) was 3.5 for all non-storm weather conditions combined as compared to 5.0 for southwest storm and 5.6 for southwest blow, a 30-40% increase.
Ambient Monitoring Study Records of beach searches made by Dan Varoujean during the period November 1999 to March 2000 were made available to us for this analysis. These data were typically collected over runs of several days followed by longer intervals of time. In such cases, it was difficult to determine how many of the carcasses recovered on the first day of the sequence had been deposited within the previous 24 hours, and was difficult to compare to searches made during the M/V New Carissa event when beaches were generally searched every day to two days. To make these data more comparable to data collected during the event, we used data only for the second and subsequent consecutive days on a given beach segment. In this manner, we calculated the background beaching rate to be approximately 0.1 birds per day per km surveyed.
ANALYSIS AND MODELING
We carried out two modeling analyses in order to determine the extent of the mortality to seabirds that resulted from oil released by the M/V New Carissa. We simulated the range of possible trajectories of bird carcasses and spilled oil that could have resulted from outflow from the M/V New Carissa in order to help determine whether or not the recorded carcass beachings were likely to have been caused by M/V New Carissa oil. Second, we estimated the likelihood that a beached bird would have been recorded by searchers or whether it would have been missed, and whether or not it would have been a fatality resulting from the oil spill or from natural causes.
SIMULATION OF BIRD CARCASS AND OIL TRAJECTORIES
The oil spill trajectory resulting from the initial grounding of the M/V New Carissa (Phase 1) was modeled by Applied Science Associates (ASA) (French 1999). Our assessment of bird mortality, however, indicates that the majority of beached birds were found after the towing and regrounding of the ship (refer to Figure 5). Given this inconsistency between the apparent peak in oil releases as assumed during the spill versus the peak in bird mortality, we carried out a trajectory analysis for Phase 2 of the spill.
25

CONFIDENTIAL
Trajectory Model The dominant factors controlling the movement of either flotsam such as dead birds or of a surface oil slick are current and wind speed. In general, material on the ocean surface will move with the surface current plus some fraction of the wind speed. The wind based component of movement is not necessarily directly in the downwind direction. Observations of the drift patterns of dead or moribund sea birds and of oil slicks suggest that the two are transported in similar ways. Typically, dead or dying seabirds arrive on shore at about the same time and in about the same locations as does the associated oil (Ford et al. 1991a, 1996). The principal exception to this pattern may occur when seabirds are oiled but are still mobile and come ashore of their own volition. Large pieces of flotsam, such as the bow section of the M/V New Carissa, tend to behave in a very different manner than oil or dead seabirds. Irregular objects projecting well above the water line are more strongly affected by wind than are objects lying close to the sea surface. Because of their irregular shapes, such objects are likely to experience unpredictable deflections from the downwind direction ranging from 0 to 60 degrees (G. Watabayashi, NOAA, pers. comm.). For hindcasting the trajectories of seabirds affected by oil from the M/V New Carissa, we used a version of OSRISK, an oil-spill simulation model that has been used for a variety of applications on the Pacific Coast (Bonnell et al. 1996, Ford et al. 1987, 1994). Since offshore oceanographic conditions during the spill are not known precisely, we used a range of input parameters that reflect our uncertainty in these processes. Our purpose was to determine whether the extent to which the pattern of bird deposition on shore could be explained using a reasonable range of model inputs. Winds: Wind velocity and direction were based on data downloaded from NOAA buoys 46029 located off the Columbia River and 46050 located off Yaquina Bay. Because the track of the towed bow section extended far seaward of these buoys, there was a roughly three hour lag between when the gale struck the tug Sea Victory and when it began to register on buoy 46050. To compensate for this effect, we used the wind records from the Coast Guard's log to create a simulated buoy at the maximum seaward extent of the tow. The simulated buoy used wind records from buoy 46050 that were three hours earlier and winds 1.3 times greater than were recorded by the actual buoy . The simulated buoy was used only for an 8 hour period subsequent to the time when the M/V New Carissa bow section broke tow. Wind speeds and directions for any given position were calculated as the inverse square distance weighted average from adjacent buoys. Currents: Real time oil spill trajectory simulations were made by NOAA, and a hind-cast was later made by ASA. These simulations extended only from the initial grounding to the time when the bow section was towed out to sea. In both sets of simulations, it was noted that the surface currents were uncertain, apparently including a general northward flowing component and a southward flowing component near the mouth of Coos Bay. Northward flowing currents of 0.0, 0.5, and 1.0 m/s were used in these simulations.
26

CONFIDENTIAL
Wind Drift Factor: The percentage of wind speed imparted to drifting oil or bird carcasses is generally considered to be between 2.0% and 4.0% of wind speed. Oil spill trajectory models typically use values of 3.0% or 3.5%. Both NOAA and ASA found that a value of 3.0 provided the best fit when modeling the trajectories of outflow from the M/V New Carissa while beached at Coos Bay, and we therefore used this value. In modeling the track of the bow section of the M/V New Carissa, we used values ranging from 8 % to 10% of wind speed. Wind Deflection: Empirical evidence suggests that the direction of movement imparted to surface drifting material is a variable function of wind speed. We used the algorithm described by Samuels et al. (1982) to simulate this effect. Using this algorithm, deflection angles range from 0 to 27 degrees (clockwise rotation in the northern hemisphere), decreasing with increasing wind speed. Drifting ships may have much higher deflection angles, varying from 0 to 60 degrees. We used values from 20 to 25 degrees to model the track of the bow section.
Model Results We first modeled the path of the returning bow section in order to generate a consistent description of the time and location where oil could potentially have been released as the bow section was pushed coastward. The grounding site at Waldport was well south of where the hulk would have come ashore if it was moving directly downwind, implying that there was a significant clockwise deflection from the downwind direction. Since the returning hulk must have been moving at 8-10 kts, currents were probably not a major factor in determining its trajectory. We were able to fit the time and location of the regrounding by assuming a wind drift factor of 8% and a deflection angle of 25 degrees. The strength of the northward flowing surface current could not be determined with any precision, and both the NOAA and ASA trajectory models were run with a range of values between 0.0 and 1.0 m/s. ASA also found that a southward flowing current in the vicinity of Coos Bay was necessary in order to explain the intrusion of oil into the bay. It is likely that the strength of the current was variable over the times and locations affected by the spill, and we correspondingly ran the model with a range of different current velocities. We modeled the trajectories of oil and seabird carcasses originating from the following sources:
♦ From the Coos Bay grounding site after the towline was attached, but before the tow began (Figure 8).
♦ From the outward bound leg of the first towing attempt (Figure 9). ♦ From the inward bound leg of the first towing attempt (Figure 10). ♦ From the outward bound leg of the second and final tow to the scuttling site (Figure 11).
Figures 8-11 show trajectories based on oil being released at approximate 12 hour intervals with the different colors representing the same release times but with the current speed varied. Each dot along the trajectory represents the passage of 24 hours. Trajectory model results were compared with the observed pattern of beachings of birds to determine the extent to which the
27

CONFIDENTIAL
Figure 8. Trajectory analysis of oil released after the tow line was attached to the ship, 26 February to 2 March. Dead and injured birds are assumed to exhibit similar drift characteristics as surface slicks.
28

CONFIDENTIAL
Figure 9. Trajectory analysis of oil released during the first attempted tow, between 2-3 March. Dead and injured birds are assumed to exhibit similar drift characteristics as surface slicks.
29

CONFIDENTIAL
Figure 10. Trajectory analysis of oil released as the ship was blown back ashore after breaking tow, on 3 March. Dead and injured birds are assumed to exhibit similar drift characteristics as surface slicks.
30

CONFIDENTIAL
31
Figure 11. Trajectory analysis of oil released during the final tow out to the scuttling site, 8-11 March. Dead and injured birds are assumed to exhibit similar drift characteristics as surface slicks.

CONFIDENTIAL
actual beachings could be explained by trajectory modeling. The pattern of deposition is shown in Figures 3-5, in which the carcass deposition rate is expressed as a function of time and location. During the first part of the spill at Coos Bay, the deposition rate was relatively low and limited mostly to the vicinity of the M/V New Carissa and northward toward the Umpqua River. This pattern is consistent with the trajectory models of both NOAA and ASA and we did not attempt to model trajectories during this period. Following the attempted tow and subsequent regrounding of the bow section on March 2 and 3, the deposition rate increased by a factor of more than ten and remained elevated for several weeks in the Newport area. Carcass deposition that began immediately following the attempted tow included the coastline from the regrounding at Waldport south to the original grounding site at Coos Bay. The pattern of deposition can be explained by assuming that oil leaked from the bow section after the towline was attached at Coos Bay and during the outbound and inbound legs of the tow. Deposition between Coos Bay and Waldport cannot be explained by oil that was released prior to the attachment of the towline at Coos Bay which would have beached near the original grounding site at an earlier time. Deposition from Coos Bay to Waldport probably resulted from outflow
0
20
40
60
80
100
2/4/
99
2/8/
99
2/12
/99
2/16
/99
2/20
/99
2/24
/99
2/28
/99
3/4/
99
3/8/
99
3/12
/99
3/16
/99
3/20
/99
3/24
/99
3/28
/99
4/1/
99
4/5/
99
4/9/
99
4/13
/99
4/17
/99
4/21
/99
4/25
/99
Date
Sum
of B
irds
Dead Birds
Live Birds
Figure 12. Total live and dead birds found over time throughout the spill event. The upper line represents the sum of both live and dead birds.
32

CONFIDENTIAL
during the preparation for the tow and during the outbound leg. Deposition north of Waldport probably resulted from outflow at several times and locations, including just prior to the tow at Coos Bay, the outbound and inbound legs of the first tow from Coos Bay, and the first part of the final tow from Waldport. Outflow from the second tow would have reached the Nestucca Bay and Cascade Head areas by March 11 or 12. Elevated rates of carcass deposition in the vicinity of Newport continued throughout the second half of March, and this cannot easily be explained by the trajectory analysis. Similarly, there appears to be a region of elevated deposition south of Newport which moved southward toward the Siuslaw River during the latter half of March (see Figure 5). These regions were impacted earlier in the spill, and may reflect lingering effects in the form of injured birds that required several weeks to die or the effects of stranded oil that refloated. Figure 12 shows the numbers of live and dead birds through the course of the event. The lack of live birds after about 10 March suggests that the birds collected near and south of Newport may have been at sea for some time before beaching.
ESTIMATION OF BIRD MORTALITY
Model Description Estimates of the likelihood that a beached carcass would persist long enough to be recovered by searchers were made using a modification of the model developed by Ford et al. (1987). The model takes into account carcass persistence rates, searcher efficiency, and the schedule and extent of beach searches. Consider a segment of beach which was searched on Day a and again on Day b. Let C be the number of carcasses recovered on that beach on Day b. The carcasses recovered on Day b can be separated into two categories, those which were deposited prior to Day a but not recovered, and those that were deposited on or subsequent to Day a (for convenience we assume that the search takes place at the beginning of a given day). If the number of carcasses deposited from Day 1 to Day a-1 but not recovered on Day a is denoted as O, and the number of carcasses deposited from Day a to Day b-1 is denoted as N, then:
1) C = N + O
and 2) N = C - O
The purpose of the model is to compute N, the number of new carcasses deposited over the interval between two searches. By calculating N for each interval between searches, starting with the first interval, an estimate of the total number of carcasses deposited on a given segment of beach can be built up. On each day that a carcass is present on a beach segment, it has the potential to be located and removed by searchers. If L is the likelihood that a carcass will be found and removed during a
33

CONFIDENTIAL
search of the entire segment, and Ek is the proportion of the beach searched on Day k, then the likelihood that a carcass will persist on the beach from Day k to Day k+1 is:
3) ( 1 – L ) • Ek + ( 1 - Ek ) If Rk is the likelihood that a carcass will persist from Day k to Day b-1 (next time segment is searched), then:
4) Rk = Rk+1 • ( 1 - L ) • Ek + ( 1 - Ek ) The values of R for all k from 1 to b can be computed iteratively by successively calculating Rk. Assuming that it is not removed by scavengers, the probability that a carcass will be found on Day b is the product of the probability that it was not found prior to Day b and the probability that it was found on Day b. The probability of finding a carcass on Day b depends on how much of the beach was actually searched and the probability that it would be found if searchers passed by it. Let Pk be the probability that a carcass deposited on Day k will be found on a search on Day b. Then:
5) Pk = Eb • L • Rb-1 Studies in which different searchers repeatedly attempted to locate the same set of carcasses distributed randomly along a beach show that individual carcasses vary in terms of the likelihood that they will be found. For example, a large carcass deposited in the middle of a narrow sandy beach with small amounts of wrack would probably be located by any searcher along that stretch of beach. Alternatively, a small carcass deposited in heavy wrack on a wide beach might be missed repeatedly. We therefore divide all carcasses into different categories based on the likelihood that they will be found. Equation 5 thus becomes more complex since it must be calculated for carcasses with a range of different values of L. Let there be m different "findability" categories, where Fj is the proportion of carcasses falling into Category j, and Lj is the probability that a passing searcher will find a carcass in Category j, and Rb-1 is computed separately for each findability category. Then equation 5 becomes: m
6) Pk = Eb • Σ Fj • Lj • Rj,b-1 j =1
Let Sk be the likelihood that a carcass will not be scavenged from the time of its deposition on Day k to the time of search on Day b. Let Dk be the number of carcasses that were deposited on Day k. If it is assumed that the processes of scavenging and search are independent, then O, the number of carcasses recovered on Day b that were deposited prior to the previous search on Day a, can be estimated as follows: a-1
7) O = Σ Pk • Sk • Dk k =1
34

CONFIDENTIAL
Similarly, N, the number of carcasses recovered on Day b that were deposited after the previous search on Day a would be: b-1
8) N = Σ Pk • Sk • Dk k =a
If we assume that carcasses are deposited at a constant rate over the interval a to b-1, then the number of carcasses deposited on Day k, Dk, can be estimated as: b-1
9) Dk = N / Σ Pk • Sk k =a
Since O is known and C is known, N can be substituted from equation 2, yielding: b-1
10) Dk = ( C – O ) / Σ Pk • Sk k =a
This procedure was repeated for each beach segment for all days on which searches were made, providing an overall estimate of the total number of carcasses deposited on a given beach segment. In cases where the time or location of recovery was not recorded, we used an average correction factor to estimate how many birds each carcass represented. The average correction factor was estimated as the number of carcasses deposited at known times and locations and the sum of D for all days and coastal segments. Three empirical parameters used in these computations are: 1) the proportion of birds in findability class j ( Fj ), 2) the probability of location during a single search of a carcass in findability class j (Lj), and 3) the probability that a beached carcass would be removed by scavengers by Day k (Sk). Data on the probability of location were collected under contract to the State of California and are used by their permission. Data on scavenging rates were measured in Oregon as part of the scavenging study described in this report. Since the likelihood that a carcass would be located by searchers or removed by scavengers is dependent on body size, separate calculations were carried out for large- and small-bodied birds. Small-bodied birds were defined as sparrow- or robin-sized species, and include murrelets and Cassin's Auklets.
Estimating the Natural Deposition Rate Seabirds dying of natural causes are regularly beached along the Oregon coast. Because the M/V New Carissa affected the entire coast of Oregon to varying degrees for almost two months, it is likely that many of the birds that were recovered died of natural causes. Our first approach to estimating the natural deposition rate was to examine data collected during the actual incident. Figure 5 shows the distribution of deposition rates (number of birds recovered per km of beach) as a function of both space and time. The signature of the spill is distinct in the immediate
35

CONFIDENTIAL
vicinity of Coos Bay prior to the first towing, along the coast from Coos Bay to Newport immediately following the tow, and in the Newport area through much of March. These events rise out of a background of relatively low but non-zero deposition (the dark blue and purple regions of the plot). This background area includes the coast from about the South Spit of the Umpqua River to Horse Creek, between about 13 and 28 February and between 12 and 21 March. This area was north of the trajectory simulations for the Coos Bay phase of the spill, and south of the northward moving trajectories for the Waldport portion of the spill. A similar level of deposition can be seen north of Beverly Beach and south of Alsea Bay after the effects of the first tow had dissipated. The isopleth separating the dark blue and dark green regions of the plot is at 0.2 birds per km, and appears to provide a reasonable approximation of the base level of deposition. Data collected by Dan Varoujean during 1999-2000 north of Coos Bay also provide a method of estimating the background deposition rate. When the number of days between searches are corrected so that the first day of a series of beach searches (which would include birds deposited over an extended time period) is excluded, the deposition rate is about 0.1 birds per km of beach. This corresponds to the isopleth forming the boundary between the dark purple and dark blue regions in Figure 5. We use the values of 0.1 and 0.2 as the range for possible values of the natural deposition rate, with a best estimate of 0.15 birds per km. The beached bird model takes this factor into account by subtracting the product of the natural deposition rate and the segment length from the number of carcasses recovered in that segment before estimating the number of birds that were actually beached.
Model Parameters Estimation of the number of birds that were beached but not recovered were based on the following parameter values: ♦ Number of birds recovered (C) on a given day in a given coastal segment. These data were
taken from morgue records and bird rehabilitation records. Because bays were largely unaffected by the spill and because these areas were mostly unsearched, the few birds found in bays were not included in the analysis.
♦ Proportion of a given segment searched (E) on a given day. These data were compiled from
records of search effort recorded by searchers on field forms. Effort from bay search segments were not included in these records.
♦ The probability (Sk) that a beached carcass would be removed by scavengers by Day k. Data
on scavenging rates were measured in Oregon as part of the scavenging study described in this report. For large-bodied birds (larger than robin-sized), Sk was estimated to be 0.97, 0.90, 0.86, 0.86, 0.79, and 0.76 for k=1,2,3,4,5,6. For all k>6, 0.76 was used. For small-bodied birds, the equivalent rate was estimated to be 0.64, 0.64, 0.55, 0.55, 0.50, and 0.50 for k=1,2,3,4,5,6. For all k>6, 0.50 was used.
♦ Classes of "findability", the probability that a searcher would locate a carcass while searching
a beach (Lj). These categories were based on sets of trials where 4 different trained searchers
36

CONFIDENTIAL
passed a carcass. Categories are therefore 0%, 25%, 50%, 75%, and 100% corresponding to a carcass being found by 0, 1, 2, 3, or 4 of the searchers.
♦ The proportion of birds (Fj) falling into a given findability category. Data on the probability
of location were collected on beaches in Humboldt County under contract to the State of California. For large-bodied birds, Fj was estimated to be 0.27, 0.24, 0.15, 0.21, 0.12 for j=1,2,3,4,5. The equivalent proportions for small-bodied birds were 0.60, 0.30, 0.10, 0.00, and 0.00.
♦ The background level of carcass deposition occurring during the spill event that was caused
by factors other than oiling from the M/V New Carissa. We used deposition rates from the M/V New Carissa response from areas and times where deposition appeared to be independent of the M/V New Carissa spill, and from data collected in the Coos Bay area by Dan Varoujean in 1999 and 2000. Our best estimate of the rate was 0.15 birds per km searched, with a range of 0.10 to 0.20.
ESTIMATION OF SUB-LETHAL EFFECTS While a large portion of birds oiled in the M/V New Carissa oil spill can be accounted for by examining morgue and rehabilitation center records, many birds along the shoreline were observed with oil on them but were not captured, and therefore cannot be extrapolated using the above model. Following coastal or marine oil spills, it is common to observe large numbers of birds that roost on shore, primarily gulls and shorebirds, with visible oiling. Usually only a small fraction of these birds are captured or recovered dead. Some of these oiled birds probably die where they cannot be located, while others survive but experience deleterious effects as a result of being oiled. This section provides estimates of the numbers of birds that were oiled during the M/V New Carissa spill but that were not subsequently recovered.
Methods The number of oiled but unrecovered birds was estimated as the product of the oiling rate and the estimated population size. No historical data were available for the Oregon coast that provide estimates of gull or shorebird populations during the time of year in which the M/V New Carissa oil spill took place. As a result, the population estimates derived from the USFWS and Crescent Coastal Research (CCR) surveys conducted during the spill response are the best available for February and March shorebird and gull populations. A continuous census such as those carried out by CCR and USFWS will provide a reasonable estimate of the population present in the spill area and the number of birds oiled given the following assumptions:
a) shorebird and gull distribution along the Oregon coastline is independent of beach surveyors, and
b) the total population size remains relatively constant from day to day.
37

CONFIDENTIAL
Of the two surveys, CCR’s covered a larger portion of the Oregon coast. Their surveys covered the outer Oregon coast from Newport to Bastendorff Beach, excluding the bays. The remainder of the Cape Arago search segment south of Bastendorff Beach was also excluded from this survey. Although dead and live oiled birds were found south of Bastendorff Beach and north of Newport during the spill response surveys, the numbers of birds found in these areas was relatively small in relation to birds found in other search segments. In addition, the diversity of beach habitat made it difficult to extrapolate population estimates to these southern and northern search areas. These areas excluded from the CCR survey were therefore excluded from the analysis of sub-lethal effects, although a small but unknown number of birds was certainly affected in these areas. The oiling rate was derived from data gathered during the course of the spill and was calculated as the number of birds showing detectable oiling divided by the total number of birds observed. Oiling rates tend to vary over the course of a spill, usually peaking shortly after the beginning of the spill. The point at which the maximum percentage of birds are observed with visible oiling, i.e. the peak oiling rate, is assumed to be the most appropriate rate to use in calculating the total number of birds affected by oiling throughout the spill because oiled birds often leave the immediate vicinity, die, or preen much of the visible oil from their feathers. In the M/V New Carissa oil spill the overall oiling rate peaked twice, once in Phase 1 and again in Phase 2. Due to the large geographic area affected by the spill the oiling rate varied not only by date but also by species and by search segment. During the course of the two population surveys, USFWS and CCR surveyors both examined a subset of the observed birds for oiling. However, the timing of CCR’s surveys did not correspond to either period of peak oiling and would therefore underestimate the total number of birds oiled during the spill. The USFWS survey conducted by Pitkin and Phillips also included a census of oiled birds. Their survey was conducted closer to the time of peak oiling but, based on data from regular beach searcher, the oiling rate peaked several days prior to their survey. The data collected during the spill response beach surveys included both a count of birds and a count of the number of birds with visible oiling. Because these data were collected throughout both phases of the spill, they were used to calculate estimated oiling rates. The spill response observers sometimes noted that only a portion of a group of observed birds could be scanned for oiling. However, because this was not done on a consistent basis, the entire number observed was used in calculating the proportion oiled. As a result, the estimates derived from these oiling rates will also tend to underestimate the total number of birds injured by the M/V New Carissa oil. Only shorebird and gull observations were used for the sub-lethal impact analysis. Although other bird species were observed in small numbers, very few were visibly oiled. Because peak oiling rates varied substantially along different portions of the Oregon coast, total bird observations and total oiled bird observations were tallied for each search segment, then 3 to 4 adjacent search segments were grouped together to get an overall oiling rate for that portion of the coast. Observations were also tallied over one-week or partial-week periods beginning with Week 1 of the spill, from 4 to 6 February; Week 2 covered 7 to 13 February, and so on. Due to
38

CONFIDENTIAL
the regrounding event, Week 5 was split into pre- and post-grounding periods, with pre-grounding including 28 February to 2 March, and post-grounding covering 3 to 6 March.
Results Based on the USFWS and CCR shoreline surveys, approximately 5,898 – 10,381 shorebirds and 452 - 1,458 gulls were estimated to occur in the area between from Newport to Bastendorff Beach (Table 13). Sanderlings account for about 97% of the shorebirds observed. Table 11 shows the estimated number of shorebirds and gulls within each of the groups of search segment that were used for determining oiling rates.
Table 13. Shorebird and gull population estimate for each search segment group, based on the CCR and USFWS surveys.
Northern Southern Total Total Bordering Segment
toBordering Segment Shorebirds* Gulls^
Silver Point to Tillamook Bay Coastal N/A N/A
Oceanside to Sand Lake Coastal N/A N/A
Nestucca Bay North to Salmon River Coastal N/A N/A
Siletz Bay North to Depoe Bay N/A N/A
Newport to Newport 0 33 – 107 Thiel Creek Coastal to Yachats Coastal 1,062 – 1,869 136 – 438
Yachats River Coastal to Heceta Head 246 – 433 92 – 298 Horse Creek Coastal to Siuslaw River Coastal 1,660 – 2,922 49 – 158
Woahink to Threemile Coastal 2,421 – 4,261 40 – 128 Umpqua River Coastal to Hauser 459 – 808 56 – 181
Horsfall Beach to Bastendorff Beach 50 – 88 46 – 148 Totals 5,898 – 10,381 452 – 1,458
* Shorebird species include Semipalmated Plovers, Black-bellied Plovers, Western Snowy Plovers, Willets, Black Turnstones, Surfirds, Black Oystercatchers, and Sanderlings.
^ Gull species include Western, Mew, Glaucous-winged, Herring, Thayer’s, hybrid, and unknown. The oiling rate as derived from spill response beach surveys varied over space and time and between species groups. Tables 14 and 15 show the peak oiling rates (as calculated over week or partial week periods) for each group of search segments for shorebirds and gulls respectively. In general, the further away a group of search segments is from the original grounding sites the longer lapse in time before the oiling rate peaks, i.e. oil and visibly oiled birds will occur close to the original spill site shortly after oil is released but over time will occur further north and south of the site. The highest shorebird oiling rate occurred in Week 2 in the group of search segments containing and surrounding the original spill site, from Horsfall Beach to Cape Arago, with a rate of 35.3% of observed shorebirds being visibly oiled. The rate declined in this area and in more northerly search segments until the regrounding at Waldport occurred in the latter half of Week 5 when the oiling rate again peaked at 23.5% in the segments surrounding the beaching site, Thiel Creek Coastal to Yachats Coastal. The peak oiling rate for gulls followed a slightly different pattern. Probably because of their greater mobility, oiling on gulls did not reach its first peak
39
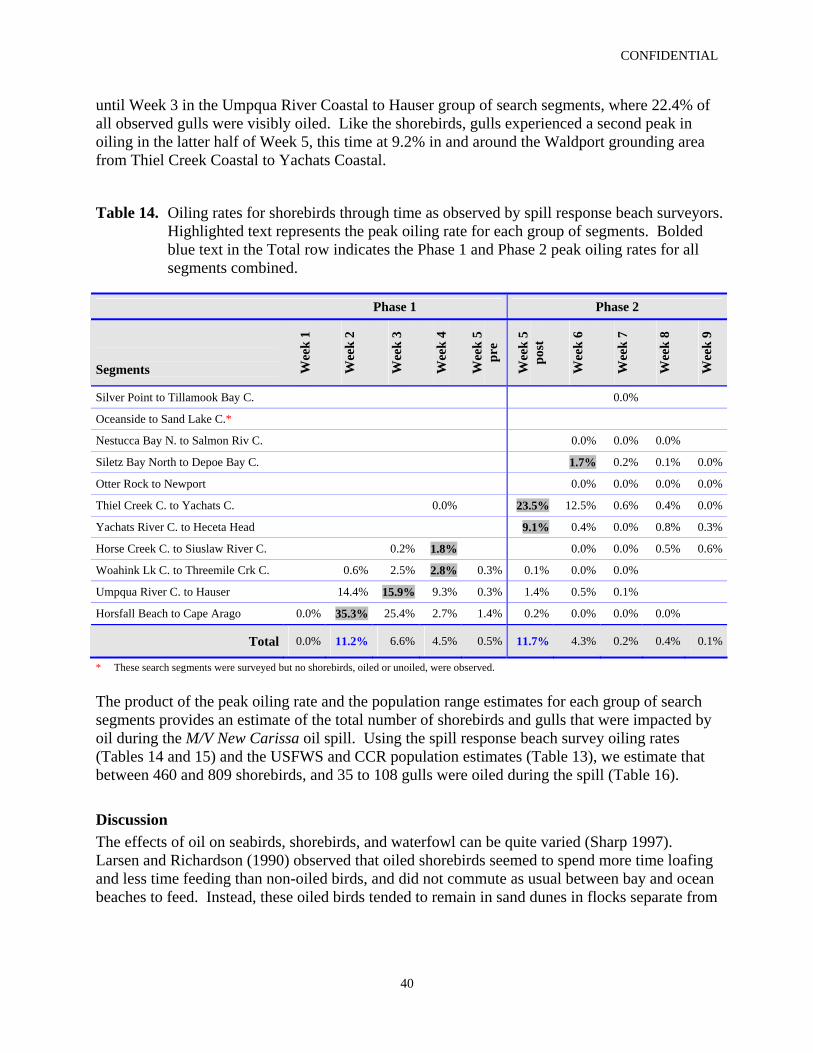
CONFIDENTIAL
until Week 3 in the Umpqua River Coastal to Hauser group of search segments, where 22.4% of all observed gulls were visibly oiled. Like the shorebirds, gulls experienced a second peak in oiling in the latter half of Week 5, this time at 9.2% in and around the Waldport grounding area from Thiel Creek Coastal to Yachats Coastal.
Table 14. Oiling rates for shorebirds through time as observed by spill response beach surveyors. Highlighted text represents the peak oiling rate for each group of segments. Bolded blue text in the Total row indicates the Phase 1 and Phase 2 peak oiling rates for all segments combined.
Phase 1 Phase 2 Segments W
eek
1
Wee
k 2
Wee
k 3
Wee
k 4
Wee
k 5
pre
Wee
k 5
post
Wee
k 6
Wee
k 7
Wee
k 8
Wee
k 9
Silver Point to Tillamook Bay C. 0.0%
Oceanside to Sand Lake C.*
Nestucca Bay N. to Salmon Riv C. 0.0% 0.0% 0.0%
Siletz Bay North to Depoe Bay C. 1.7% 0.2% 0.1% 0.0%
Otter Rock to Newport 0.0% 0.0% 0.0% 0.0%
Thiel Creek C. to Yachats C. 0.0% 23.5% 12.5% 0.6% 0.4% 0.0%
Yachats River C. to Heceta Head 9.1% 0.4% 0.0% 0.8% 0.3%
Horse Creek C. to Siuslaw River C. 0.2% 1.8% 0.0% 0.0% 0.5% 0.6%
Woahink Lk C. to Threemile Crk C. 0.6% 2.5% 2.8% 0.3% 0.1% 0.0% 0.0%
Umpqua River C. to Hauser 14.4% 15.9% 9.3% 0.3% 1.4% 0.5% 0.1%
Horsfall Beach to Cape Arago 0.0% 35.3% 25.4% 2.7% 1.4% 0.2% 0.0% 0.0% 0.0%
Total 0.0% 11.2% 6.6% 4.5% 0.5% 11.7% 4.3% 0.2% 0.4% 0.1%
* These search segments were surveyed but no shorebirds, oiled or unoiled, were observed. The product of the peak oiling rate and the population range estimates for each group of search segments provides an estimate of the total number of shorebirds and gulls that were impacted by oil during the M/V New Carissa oil spill. Using the spill response beach survey oiling rates (Tables 14 and 15) and the USFWS and CCR population estimates (Table 13), we estimate that between 460 and 809 shorebirds, and 35 to 108 gulls were oiled during the spill (Table 16).
Discussion The effects of oil on seabirds, shorebirds, and waterfowl can be quite varied (Sharp 1997). Larsen and Richardson (1990) observed that oiled shorebirds seemed to spend more time loafing and less time feeding than non-oiled birds, and did not commute as usual between bay and ocean beaches to feed. Instead, these oiled birds tended to remain in sand dunes in flocks separate from
40
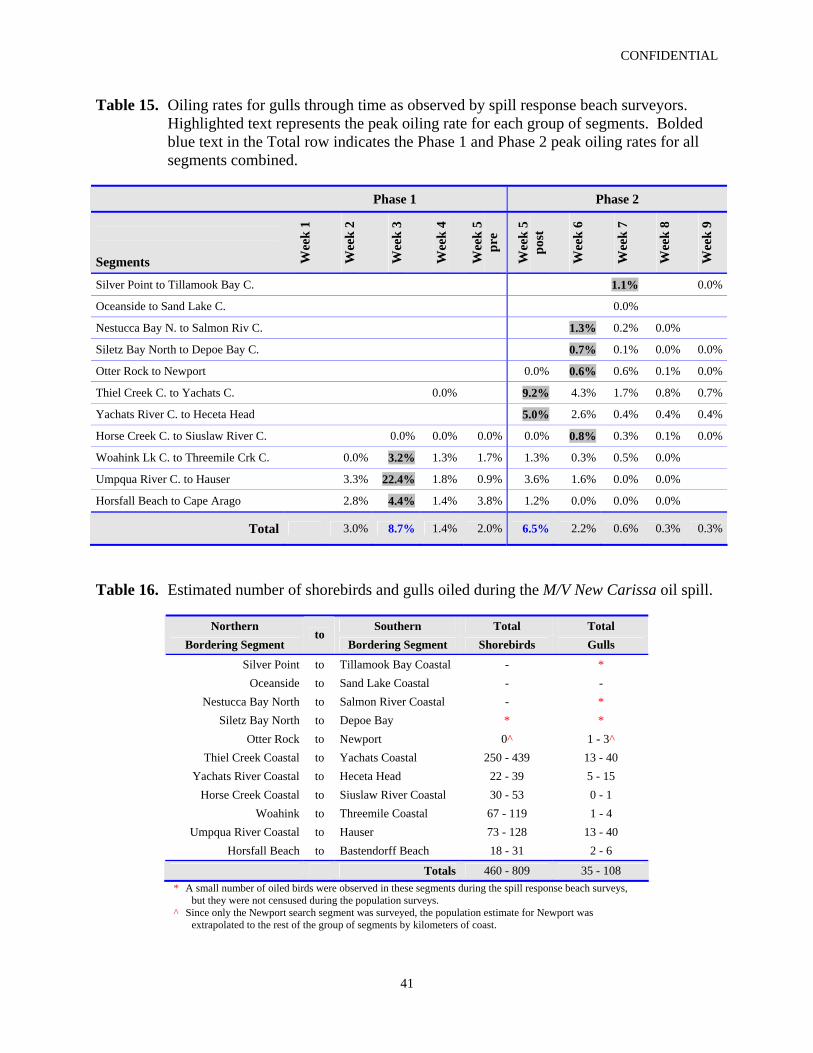
CONFIDENTIAL
Table 15. Oiling rates for gulls through time as observed by spill response beach surveyors. Highlighted text represents the peak oiling rate for each group of segments. Bolded blue text in the Total row indicates the Phase 1 and Phase 2 peak oiling rates for all segments combined.
Phase 1 Phase 2 Segments W
eek
1
Wee
k 2
Wee
k 3
Wee
k 4
Wee
k 5
pre
Wee
k 5
post
Wee
k 6
Wee
k 7
Wee
k 8
Wee
k 9
Silver Point to Tillamook Bay C. 1.1% 0.0%
Oceanside to Sand Lake C. 0.0%
Nestucca Bay N. to Salmon Riv C. 1.3% 0.2% 0.0%
Siletz Bay North to Depoe Bay C. 0.7% 0.1% 0.0% 0.0%
Otter Rock to Newport 0.0% 0.6% 0.6% 0.1% 0.0%
Thiel Creek C. to Yachats C. 0.0% 9.2% 4.3% 1.7% 0.8% 0.7%
Yachats River C. to Heceta Head 5.0% 2.6% 0.4% 0.4% 0.4%
Horse Creek C. to Siuslaw River C. 0.0% 0.0% 0.0% 0.0% 0.8% 0.3% 0.1% 0.0%
Woahink Lk C. to Threemile Crk C. 0.0% 3.2% 1.3% 1.7% 1.3% 0.3% 0.5% 0.0%
Umpqua River C. to Hauser 3.3% 22.4% 1.8% 0.9% 3.6% 1.6% 0.0% 0.0%
Horsfall Beach to Cape Arago 2.8% 4.4% 1.4% 3.8% 1.2% 0.0% 0.0% 0.0%
Total 3.0% 8.7% 1.4% 2.0% 6.5% 2.2% 0.6% 0.3% 0.3%
Table 16. Estimated number of shorebirds and gulls oiled during the M/V New Carissa oil spill.
Northern Southern Total Total Bordering Segment
to Bordering Segment Shorebirds Gulls
Silver Point to Tillamook Bay Coastal - * Oceanside to Sand Lake Coastal - -
Nestucca Bay North to Salmon River Coastal - * Siletz Bay North to Depoe Bay * *
Otter Rock to Newport 0^ 1 - 3^ Thiel Creek Coastal to Yachats Coastal 250 - 439 13 - 40
Yachats River Coastal to Heceta Head 22 - 39 5 - 15 Horse Creek Coastal to Siuslaw River Coastal 30 - 53 0 - 1
Woahink to Threemile Coastal 67 - 119 1 - 4 Umpqua River Coastal to Hauser 73 - 128 13 - 40
Horsfall Beach to Bastendorff Beach 18 - 31 2 - 6
Totals 460 - 809 35 - 108 * A small number of oiled birds were observed in these segments during the spill response beach surveys,
but they were not censused during the population surveys. ^ Since only the Newport search segment was surveyed, the population estimate for Newport was
extrapolated to the rest of the group of segments by kilometers of coast.
41

CONFIDENTIAL
actively foraging birds. Chapman (1981) found that oiled Sanderlings and Willets spent more time in "comfort" movements and resting and less time feeding than non-oiled individuals. Burger (1997) found the foraging rates of oiled Sanderlings and Semipalmated Plovers were inversely correlated with extent of oiling. For the most heavily oiled birds (>30%), there was a three-fold reduction in time spent feeding, and an eight-fold reduction in the number of pecks per minute. Even birds that survive the immediate effects of an oil spill may succumb at a later time. Sharp (1996) used band return data to analyze the survivorship of Common Murres that had been cleaned and released. He found that the survival rate per 20-day period was reduced to 12.6% with a life expectancy of 9.6 days. It is therefore likely that birds affected by oil from the M/V New Carissa continued to die for months subsequent to the spill. Reproductive success of birds may also be compromised as a result of exposure to oil. Most research has found that reproductive effects attributable to oiling involved birds or eggs that were oiled just prior to breeding, and effects were generally observed only in that breeding season. Black Turnstone clutch size on the Yukon-Kuskokwim Delta was lower in 1989 (3.3), the year of the Exxon Valdez spill, than in four pre-spill years (3.8) (Sharp 1997). Similarly, Anderson et al. (1996) found that oiled rehabilitated Brown Pelicans oiled in spills in 1990 and 1991, failed to breed for two years afterward.
MODEL RESULTS – ESTIMATED DIRECT SEABIRD MORTALITY
The beached bird model was used to estimate total mortality resulting from oil released by the M/V New Carissa. For all large-bodied birds (essentially all recovered birds except Marbled Murrelets and Cassin's Auklets) that were recovered dead or subsequently died, we estimate that the ratio of beached birds to recovered birds is 2.75:1. Given a total of 993 large-bodied birds that were recovered, this implies that 2,728 were actually beached. Assuming a base deposition rate of 0.15 birds per kilometer of shoreline searched, about 1,547 large birds (56.7% of the total beached) were killed by oil from the M/V New Carissa (Table 17). Because small-bodied birds are much more likely to be removed by scavengers and are less likely to be located by searchers, the estimated ratio of beached birds to recovered birds is much higher for small species, 14.3:1. Since 88 small-bodied birds were recovered, this would imply that about 1,257 small-bodied birds were actually beached. Because small-bodied birds are seldom recovered, it is very difficult to estimate their natural deposition rate. Assuming that small- and large-bodied birds have the same relationship between the number of birds killed by oil and the number dying of natural causes, then the ratio of birds killed by M/V New Carissa oil to total birds beached would be about the same for the two size classes. Assuming that 56.7% of the small birds were also killed by oil, then about 713 beached small-bodied birds can be attributed to the impacts of the M/V New Carissa (Table 17). Although most of the Oregon coast was searched multiple times during the course of the spill response, a few coastal sections received little or no search effort. These sections were Silver Point, Cape Falcon, Cape Lookout, Sand Lake, and Nestucca Bay South. We used the number of birds estimated to have been deposited to the north and to the south of these unsearched
42

CONFIDENTIAL
segments to compute average deposition rates. These average rates were then multiplied by the lengths of the unsearched segments to get an estimate of the numbers of birds that were beached in that area. This calculation adds an estimated 23 large-bodied birds and 10 small-bodied birds to the corrected total, of which 13 and 6 (i.e. 56.7%) respectively would be attributed to the effects of M/V New Carissa oil.
Table 17. Estimates of total mortality for birds by size class.
Size Class Recovered Corrected Total
M/V New Carissa
Large 993 2,728 1,547 Small 88 1,257 713 Unknown 51 140 79 Land Birds 8 0 0 Unsearched 0 33 19 Total 1,140 4,158 2,358
Estimates of total mortality can be made on a species by species basis, but it is not possible to break down the base deposition rate to this level of detail. We therefore assume that the same proportion, 56.7% of all recoveries of dead or dying seabirds, are attributable to the effects of M/V New Carissa oil, and that the remainder represent natural levels of mortality. Table 18 provides mortality estimates for 13 selected species.
Table 18. Estimates of total mortality for selected species.
Species Recovered Corrected Total
M/V New Carissa
Common Murre 83 236 134 Marbled Murrelet 26 565 262 Cassin’s Auklet 36 480 272 Rhinoceros Auklet 159 443 251 Horned Puffin 20 103 58 Western Grebe 64 144 82 Surf Scoter 131 375 213 White-winged Scoter 41 181 103 Unidentified Scoter 13 39 22 Western Gull 39 114 65 Black-legged Kittiwake 67 206 117 Brandt’s Cormorant 84 280 159 Northern Fulmar 109 313 178
43

CONFIDENTIAL
Although the extrapolations of the recoveries of small-bodied birds in most coastal segments are similar, in at least one instance the estimated correction is much higher. Because the Cape Arago segment received relatively little search effort, the one Marbled Murrelet carcass found there was estimated to represent a total of 120 that were actually deposited there. While this is a reasonable estimate given the level of search effort, it is a large correction factor based on one bird. To correct for this, we assumed that the carcass recovery rate in the Cape Arago search segment was the same as the rate for Marbled Murrelets in other areas, and that the correction factor is also the same. This means that the Marbled Murrelet found in Cape Arago represented 17.8 Murrelets actually beached. Using the overall recovery rate may result in an underestimation of Marbled Murrelet mortality within the Cape Arago segment because that area was searched less frequently than other areas. The estimates in Table 18 entail at least one important source of uncertainty. The base rate of naturally occurring carcass deposition cannot be determined with precision, and this rate is clearly an important model parameter. Although we consider 0.15 birds per km of beach a reasonable estimate of the natural deposition rate during the incident, values anywhere from 0.10 to 0.20 would seem defensible. We ran the model with these high and low values of the base deposition rate. These alternative values resulted in changes in the estimate of bird mortality attributable to M/V New Carissa oil of about 10% in either direction.
44

CONFIDENTIAL
LITERATURE CITED
Anderson, D.W., F. Gress, and D.M. Fry. 1996. Survival and dispersal of oiled Brown Pelicans after rehabilitation and release. Marine Pollution Bulletin 32:711-718. Bonnell, M.L., R.G. Ford, and A.J. Brody. 1996. Assessing the threat of oil spills to southern sea otters. Endangered Species Update. Vol 13(12): 38-42. Briggs, K.T., W.B. Tyler, D.B. Lewis, and K.F. Dettman. 1983. Seabirds of central and northern California, 1980-1983: Status, abundance, and distribution. Investigator's final report, prepared by the Univ. of Calif., Santa Cruz, for the Mineral Management Service, Pacific OCS Region. OCS study MMS 84-0043. Briggs, K.T., E.W. Chu, D.B. Lewis, W.B. Tyler, R.L. Pitman, and G.L. Hunt. 1981. Distribution, numbers, and seasonal status of seabirds of the southern California bight. Part III of investigator's reports, Summary of marine mammal and seabird surveys of the southern California bight area, 1975-1978. Final report prepared by the Univ. of Calif., Santa Cruz, for the Bureau of Land Management, U.S. Dept. of the Interior. National Technical Information Service #PB-81-248-197, Springfield, VA. Burger, A.E. and D.M. Fry. 1993. Effects of oil pollution on seabirds in the northeast Pacific in K. Vermeer, K.T. Briggs, K.H. Morgan, D. Siegel-Causey (eds.). 1993. The status, ecology, and conservation of marine birds of the north Pacific. Can. Wildl. Serv. Apec. Publ., Ottawa. Burger, A.E. 1991. Experiments to improve the assessment of mortality in oiled seabirds. Unpublished report. Environmental Protection Service. Environment Canada, Vancouver, B.C. Burger, J. 1997. Effects of oiling on feeding behavior of Sanderlings and Semipalmated plovers in New Jersey. Condor 99:290298. Chapman, B.R. 1981. Effects of the Ixtoc I spill on Texas shorebird populations. Proc. 1981 oil Spill Conf., Amer. Petroleum Inst. 461-465. 742 pp. Dale, A. 1989. A preliminary report on the effects of location, beach substrate, and carcass weight on the persistence of beached bird carcasses. Unpublished report Marine Birds 440, Bamfield Marine Station, Bamfield, B.C. Ford, R.G. 1999. M/V New Carissa oil spill aerial surveys of marine birds and mammals. R.G. Ford Consulting Company, Portland, OR. 11p. Ford, R.G., M.L. Bonnell, D.H. Varoujean, G.W. Page, H.R. Carter, B.E. Sharp, D. Heinemann, and J.L. Casey. 1996. Total direct mortality of seabirds from the Exxon Valdez oil spill. Pp. 684-711 in Rice, S.D., R.B. Spies, D.A. Wolfe, and B.A. Wright, eds. Exxon Valdez Oil Spill Symposium proceedings. Am. Fisheries Soc. Symp. 18.
45

CONFIDENTIAL
Ford, R.G., J.L. Casey, D.B. Hewitt, D.H. Varoujean, D.R. Warrick, and W.A. Williams. 1991a. Seabird mortality resulting from the Nestucca oil spill incident, winter 1988-89. Report for Washington Department of Wildlife. Ecological Consulting Inc., Portland, OR. Ford, R.G., M.L. Bonnell, D.H. Varoujean, G.W. Page, B.E. Sharp, D. Heinemann, and J.L. Casey. 1991b. Assessment of direct seabird mortality in Prince William Sound and the Western Gulf of Alaska resulting from the Exxon Valdez oil spill. Ecological Consulting Inc., Portland, OR. Ford, R.G., R.J. Sobey, P.L. Shrestha, C.M. Saviz, G.T. Orlob, and I.P. King. 1994. San Francisco Bay and Delta oil spill fate studies, Part II: Oil spill simulation. Proceedings of the 1993 ASCE National Hydraulic Engineering Conference, San Francisco, CA. Ford, R.G., G.W. Page, and H.R. Carter. 1987. Estimating mortality of seabirds from oil spills. Proceedings of the 1987 Oil Spill Conference, Washington, D.C. American Petroleum Institute. French, D. 1999. Preassessment NRDA analysis: preliminary modeling of the fates and effects of oil released from the M/V New Carissa in February-March 1999. Prepared for Industrial Economics, Inc. NOAA Damage Assessment Center. 17 pp. + appencices. Humphries, C.A. 1989. Scavenging rates of light and dark beached birds on rock and sand substrates. Unpublished report Marine Birds 440, Bamfield Marine Station, Bamfield, B.C. Jaques, D. 1999. M/V New Carissa oil spill incident Coos Bay and Waldport Oregon Shorebird survey results. Final report to Gallagher Marine systems, Inc. 6 pp. + tables and figures. Kritz, K. 2000. BLM. Personal communication regarding terrestrial mammal presence along the Oregon coastline near Coos Bay and Waldport. Larsen, E.M. and S.A. Richardson. 1990. Some effects of a major oil spill on wintering shorebirds at Gray's Harbor, Washington. Northwestern Naturalist 71:51-56. Monnat, J.Y. and Y. Guermeur. 1979. L’Amoco Cadiz at les Oiseaux. Societe pour L’Etude et la protection de la Nature en Bretagne. Ministere de L’Environnement et du Cadre de Vie. Brest. 239 pp. Page, G.W., H.R. Carter, and R.G. Ford. 1990. Numbers of seabirds killed or debilitated in the 1986 Apex Houston oil spill in Central California. Stud. Avian. Biol. 14:164-174. Phillips, C. 1999. Unpublished memo To: New Carissa spill wildlife data file, Regarding: wildlife census, February 14, 1999, Dated: February 19, 1999. 2pp. Piatt, J.F., C.J. Lensink, W. Butler, M. Kendziorek, and D.R. Nysewander. 1990. Immediate impact of the Exxon Valdez oil spill on marine birds. Auk 107:387-397.
46

CONFIDENTIAL
Pitkin, D. 1999. New Carissa Incident, Wildlife Resource Monitoring Survey, Tahkenitch Creek north to Baker Creek 14 February 1999. Unpublished field report. 2pp. Polaris Applied Sciences, Inc. 1999. Response to the M/V New Carissa oil spill: Fate and persistence of spilled oil. Polaris Applied Sciences, Inc. Bainbridge Island, WA. Samuels, W.B., N.E. Huang, and D.E. Amstutz. 1982. An oilspill trajectory analysis model with a variable wind deflection angle. Ocean Engineering. Sharp, B.E. 1996. Post-release survival of oiled, cleaned seabirds in North America. Ibis, Vol. 138 No. 2, pp. 222-228. Sharp, B.E. 1997. Cape Mohican oil spill: Effects on shorebirds. Draft Report to Ecological Consulting, Inc. Portland, OR. Strong, C. 2000. Distribution of Marbled Murrelets and other seabirds in the vicinity of the New Carissa shipwreck based on near-shore vessel surveys in February and March, 1999. Crescent Coastal Research. 13 p. Van Pelt, T. 1993. 1993 Common Murre Die-Off Investigation (Cont’d): Persistence Rate of Murre Corpses. Unpublished report, Alaska Fish and Wildlife reserach Center, U.S. Fish and Wildlife Service. Watabayashi, G. 2000. NOAA. Personal communication regarding application of wind deflection angles to drifting ships. Williams, T. 1997. Silent Scourge. Audubon magazine 99(1):28-35.
47

CONFIDENTIAL
APPENDIX A
Hours of Search Effort per Day per Search Segment During the Spill Response Beach Surveys
A-1
CONFIDENTIAL
APPENDIX B
Modes of Transportation Used During the Spill Response Beach Surveys
B-1
CONFIDENTIAL
APPENDIX C
Search Segment Names and Equivalent Alpha-numeric Codes Used During the Spill Response
C-1