final report for the principal rural industries research
TRANSCRIPT

PRINCIPAL
INVESTIGATORS
Mr K A Day
Dr G M McKeon
Mr J O Carter
Brian Pastures Research Station QDPI GAYNDAH Q 4625
Climate Impacts & Applications DNR 80 Meiers Rd. INDOOROOPILLY Q 4068
PROJECT No.
DAQ 124A
FEBRUARY 1997
Final Report
for the
Rural Industries Research and
Development Corporation
DAQ-124A
EVALUATING THE RISKS OF PASTURE
AND LAND DEGRADATION IN NATIVE
PASTURES IN QUEENSLAND
Principal Investigators:-
K A Day G M McKeon and J O Carter with contribution from Eric Anderson, Ian Beale, Bill Burrows, Ken Brook, Richard Clark, Jeff Clewett, Deryk Cooksley, Tim Danaher, Neil Flood, Peter Gillard, Peter Johnston, John McIvor, David Orr, Col Paull, Mark Philp, Ross Rebgetz, Joe Scanlan, Wal Scattini and Mark Silburn.

Evaluating The Risk of Pasture and Land Degradation in Native Pastures in Queensland
DEDICATION
This project is dedicated to the memory of the late Gordon Allen, the late Graeme Lee,
and the continuing health of retired grass scientists; Bill Bisset, Joe Ebersohn, Dick Roe and Wal Scattini whose vision for the importance of quadrat cutting
made this project possible.
ACKNOWLEDGMENTS
As acknowledged in the text we wish to thank the many people who have contributed to the vision and support of the project.
The project would not have been possible without the personal support of Eric
Anderson, Ken Brook, Bill Burrows, David Gramshaw, John Leslie, Jim Miller, John Mott, Greg Robbins, Dick Schoorl, Barry Walker and Barry White.
We gratefully acknowledge the vital contribution of all those who have sweated
in many paddocks, over many years, to cut grass and auger soil.
“Go GUNSYNpD!”
We are extremely grateful to Glenda Beard for the preparation of the manuscript under the most difficult of conditions.
Preface

Evaluating The Risk of Pasture and Land Degradation in Native Pastures in Queensland
TABLE OF CONTENTS
SUMMARY ............................................................................................................................................................i
1. DEFINITION OF LAND AND PASTURE DEGRADATION ..............................................................................................i 2. PASTURE GROWTH DATA......................................................................................................................................ii 3. PASTURE GROWTH MODEL ...................................................................................................................................ii 4. MODEL BOUNDARIES ..........................................................................................................................................iii 5. MODELLING OF GRAZING EFFECTS ......................................................................................................................iii 6. ANALYSIS OF SAFE STOCKING RATES FROM GRAZIERS ........................................................................................iv 7. OPERATIONAL SPATIAL MODEL OF RISKS OF DEGRADATION FOR QUEENSLAND ..................................................iv 8. APPLICATION TO OTHER STATES ..........................................................................................................................v 9. CONCLUSION ......................................................................................................................................................vi
SECTION 1 - REVIEW: A NEED TO CALCULATE RISKS OF PASTURE DEGRADATION .............1
1.0 INTRODUCTION ............................................................................................................................................1 1.1 PASTURE DETERIORATION AND DEGRADATION................................................................................1 1.2 THE NEED FOR PERENNIAL GRASS SPECIES.........................................................................................3 1.3 WHAT ARE THE PRESSURES THAT LEAD TO DEGRADATION? ........................................................4 1.4 THE NEED TO FORECAST RISKS OF DEGRADATION...........................................................................7 1.5 PREDICTING ACCEPTABLE RESOURCE USE..........................................................................................8 1.6 A SYSTEMS APPROACH TO CALCULATING RISKS OF DEGRADATION ........................................12 1.7 CONCLUSION...............................................................................................................................................13
SECTION 2 - A MODEL OF NATIVE PASTURE GROWTH.....................................................................14
2.0 INTRODUCTION ..........................................................................................................................................14 Key features of native pastures ........................................................................................................................14 Model specifications.........................................................................................................................................16 Classification of pasture communities .............................................................................................................16
2.2 BRIEF MODEL DESCRIPTION ...................................................................................................................19 2.3 DATA SOURCES AND FIELD METHODOLOGY ....................................................................................21
Field methodology for measuring model parameters and pasture growth ......................................................23 1. Minimum soil water (permanent wilting point)............................................................................................24 2. Maximum soil water (field capacity)............................................................................................................24 3. Relationship between cover and yield. .........................................................................................................24 4. Relationship between model green cover and available soil-water. ............................................................25 5. Relationship between height of pasture and yield........................................................................................25 6. Temperature response..................................................................................................................................26 7. Effect of frost ................................................................................................................................................26 8. Relationship between potential regrowth and grass basal cover.................................................................26 9. Transpiration-use- efficiency .......................................................................................................................27 10. Soil-water content at which above-ground growth stops...........................................................................27 11. Nitrogen uptake..........................................................................................................................................27 12. Detachment rates .......................................................................................................................................28 Summary...........................................................................................................................................................28
2.4 MODEL CALIBRATION AND ANALYSIS OF NATIVE PASTURE PRODUCTION.............................29 Model calibration.............................................................................................................................................29 Sources of variation in warm season pasture growth rate...............................................................................32 Analysis of model errors ..................................................................................................................................35
2.5 MODEL VALIDATION ................................................................................................................................36 Case study 1: Black speargrass, forest blue grass and kangaroo grass at Gayndah .....................................37 Case study two - Black speargrass defoliation trial 1963-1970 (Scattini 1981) .............................................39 Simulation of year-to-year variation in growth ...............................................................................................41
2.6 SUMMARY: EVALUATION OF THE MODEL ON NON-GRAZED PASTURE .....................................42 2.7 ANALYSIS OF GROWTH PARAMETERS.................................................................................................42
Transpiration-use-efficiency (TUE) .................................................................................................................45 Potential nitrogen uptake.................................................................................................................................45 Sward potential regrowth rate .........................................................................................................................48
Table of Contents i

Evaluating The Risk of Pasture and Land Degradation in Native Pastures in Queensland
Soil Properties..................................................................................................................................................48 Photosynthetic Pathway ...................................................................................................................................50
2.8 EFFECT OF PREVIOUS GRAZING ON PLANT GROWTH PARAMETERS ..........................................50
SECTION 3 - MODELLING GRAZED PASTURES .....................................................................................53
3.1 INTRODUCTION ..........................................................................................................................................53 3.2 DATA SOURCES FOR GRAZED PASTURES............................................................................................53 3.3 CATTLE GRAZING TRIALS IN EASTERN QUEENSLAND ...................................................................56 3.4 SHEEP GRAZING TRIALS IN WESTERN QUEENSLAND......................................................................58 3.5 SUMMARY OF GRAZING TRIAL EFFECTS ............................................................................................79
Derivation of model parameters ......................................................................................................................79 Detachment processes......................................................................................................................................81 Trampling and effects of utilisation on consumption .......................................................................................82
3.6 APPLICATION TO CALCULATING RISKS OF DEGRADATION ..........................................................83 Perennial grass basal cover and pasture yield ................................................................................................83 Mechanism for loss of perennial grasses .........................................................................................................88 Pasture yield and soil loss................................................................................................................................89 Effect of utilisation on animal production, management and the pasture resource ........................................90
SECTION 4 - CALCULATING SAFE STOCKING RATES ........................................................................96
4.1 INTRODUCTION ..........................................................................................................................................96 4.2 CASE STUDIES.............................................................................................................................................97
Case study 1: Central Queensland: local best practice data (K A Day)..........................................................98 Case study 2: South-east Queensland: benchmark property data (K A Day et al.) .........................................98 Case study 3: South-west Queensland: benchmark property and consensus data (Johnston et al. 1996) ......99 Case study 4: Northern speargrass: regional survey (Scanlan et al. 1994) ....................................................99 Summary of the four case studies...................................................................................................................100
4.3 INTERPRETATION OF A LOW (15-25%) SAFE UTILISATION ..........................................................101 Animal intake and pasture growth .................................................................................................................101 The difference between ‘potential’ and ‘actual’ utilisation. ..........................................................................102 What does ‘safe’ mean to graziers? ...............................................................................................................103 Constant versus variable stocking rate ..........................................................................................................103 What are the visual indicators of 15-25% utilisation?...................................................................................104
4.4 FUTURE DEVELOPMENTS ......................................................................................................................105 Use of grazier knowledge of safe stocking rates ............................................................................................105 Use of ABS animal numbers to estimate safe stocking rates..........................................................................106
4.5 CONCLUSION.............................................................................................................................................107
SECTION 5 - AN OPERATIONAL MODEL FOR QUEENSLAND..........................................................108
5.1 INTRODUCTION ........................................................................................................................................108 5.2 INPUTS TO THE SPATIAL MODEL.........................................................................................................108
1. Rainfall and climate: Daily meteorological surfaces available for Australia .........................................109 2. Soil databases and soil water parameters..................................................................................................112 3. Local government boundaries and land use maps.....................................................................................112 4. ABS stock densities and total grazing pressure .........................................................................................113 5. Native pasture community maps ................................................................................................................113 6. Tree Density ...............................................................................................................................................113
5.3 VALIDATION OF THE SPATIAL MODEL ..............................................................................................114 Validation against NOAA imagery.................................................................................................................114 Field validation using visual assessment .......................................................................................................116 Validation against exclosure data..................................................................................................................118
5.4 DEGRADATION ALERT PRODUCTS......................................................................................................119 Pasture growth...............................................................................................................................................120 Actual utilisation relative to safe utilisation ..................................................................................................124
5.5 CONCLUSION.............................................................................................................................................128
SECTION 6 - LITERATURE CITED ............................................................................................................129
Table of Contents ii

Evaluating The Risk of Pasture and Land Degradation in Native Pastures in Queensland
ATTACHED APPENDICES
APPENDIX 1 - PAPERS FROM DAQ-124A
APPENDIX 2 - GRASP: GRASS PRODUCTION MODEL
APPENDIX 3 - SWIFTSYND METHODOLOGY
APPENDIX 4 - REVIEW OF PASTURE GROWTH DATA IN QUEENSLAND
Table of Contents iii

Evaluating The Risk of Pasture and Land Degradation in Native Pastures in Queensland
SUMMARY
The objective of the project was to develop an approach to quantify the risks of land
and pasture degradation. This objective was achieved by developing an operational
model of the condition of native pastures in Queensland.
The studies presented in this report have taken us a step toward answering Dr. Joe
Ebersohn’s challenge as paraphrased by Greg McKeon during a presentation at the
8th Australian Rangelands Conference in Katherine, 1994:
“Unless we can calculate that x number of stock on y pasture with z rainfall will
produce α liveweight, β soil erosion and γ change in grass basal cover, then we don’t
have a pasture science.”
To meet the project’s objectives , the following approach was taken:
1. Definition of land and pasture degradation
A review of literature and previous modelling studies suggested that changes in
pasture composition (pasture degradation) were determined by pasture utilisation
(pasture eaten ÷ pasture grown).
Land degradation (soil loss) was determined by surface cover which was highly
correlated with standing pasture dry matter (also termed ‘presentation yield’).
Standing pasture dry matter is the net result of the addition of pasture growth, losses
by animal consumption (pasture eaten by domestic, feral and native fauna) and losses
by natural detachment. Stocking rate affects the processes of pasture growth, animal
consumption and detachment.
Thus, quantification of the interaction of stock numbers (stocking rate) and pasture
growth was the major goal of the project. ‘Risk’ can be defined as the chance of
exceeding an acceptable level of pasture utilisation and that level can be derived from
graziers and grazing trials.
Summary i

Evaluating The Risk of Pasture and Land Degradation in Native Pastures in Queensland
2. Pasture growth data
To develop a model of pasture growth for the 46 pasture communities in Queensland
(Tothill and Gillies 1992), most available data from exclosure and defoliation trials
were collated including pasture yields, nutrient concentrations, and soil water
measurements. Field studies were carried out during the project in pasture
communities not previously studied. The collation of data was only possible through
generous co-operation of officers in many institutions (QDPI, DNR, CSIRO, NTDPI,
NSW Ag, University of Queensland, Qld National Parks and Wildlife Service), and
included data from projects funded by other agencies (MRC, WRRDC, LWRRDC).
3. Pasture growth model
An existing soil water-pasture growth model GRASP was modified and parameterised
for each site/species combination. Model parameters included plant available water
capacity (PAWC), transpiration-use-efficiency and potential nitrogen uptake.
For 162 site x year combinations of pasture growth measurements, rainfall accounted
for 42% of variation in peak autumn yield; a simple growth index (Fitzpatrick and
Nix 1970), 45%; simulated evapo-transpiration 60%. The calibrated model accounted
for 78% of variation in peak yield. For all available data (i.e. 179 site x year
combinations), the calibrated model simulated soil water accurately, and the average
absolute error for over 700 field measurements in soil water (mm) was similar to
measurement variation. For soil layer 0-10cm, average error was 3mm; for layer
10-50cm, 8mm; for layer 50cm to bottom, 8mm; and for the whole soil profile up to
100cm depth, 18mm
The analysis of the 179 site x year combinations showed that the model could be
parameterised for a wide range of pasture communities, including variation in soils
and tree density, and hence, could be applied to the whole of Queensland and some
other regions in northern Australia. Changes in species composition were analysed
for one site only and, from this one study, future model development in this very
complex area of ecology has been planned.
Summary ii

Evaluating The Risk of Pasture and Land Degradation in Native Pastures in Queensland
4. Model boundaries
Model deficiencies were documented but their solution will require further field work
and major model development. Most of the model errors occur under conditions of
above-average rainfall when nutrient limitations and/or phenological development are
the major processes affecting plant growth. Given that the major processes involved
in pasture and land degradation occur in below-average conditions, these model
deficiencies are not regarded as the major limitation to the accurate simulation of
degradation risks.
Previously developed models of run-off and soil loss were included in GRASP. Both
sub-models are site specific, but nevertheless, provide, at least, indices or relative
measures of the impact of management options such as stocking rate, pasture burning
and tree/shrub control. Thus, the overall model includes sub-models of pasture
growth, decomposition, nutrient uptake, changes in grass basal cover, effects of
surface cover on both run-off and soil loss. The model simulates a pasture sward.
However, in reality, the sward is made up of a number of species with different
responses to environmental variables. Thus, the model does not include the effect of
phenological development of individual species. As yet insufficient information is
available for flowering patterns of individual species to be included in the model.
5. Modelling of grazing effects
The calculation of pasture utilisation and standing pasture dry matter require
modelling the effect of grazing on growth, trampling and detachment. Historical and
current grazing trials representing the major pasture communities (black speargrass,
mulga, Mitchell grass) were analysed using the model. The objective was to examine
how model parameters change with grazing utilisation. As expected, the pasture
communities differed in the parameters that were sensitive to grazing. The most
sensitive parameters for each pasture community were:- grass basal cover in mulga
lands; detachment rates in Mitchell grass; soil water range, nutrient uptake and
root/shoot partitioning in the black speargrass zone.
Summary iii

Evaluating The Risk of Pasture and Land Degradation in Native Pastures in Queensland
6. Analysis of safe stocking rates from graziers
The results of grazing trials are likely to be specific to site characteristics, species and
climatic conditions. Graziers have experience over a wider range of land types and
climatic conditions than studied in grazing trials. Four major studies (mulga lands,
southern black speargrass zone and central black speargrass zone and northern black
speargrass zone) have been carried out in collaboration with this project to provide
grazier estimates of ‘safe’ stocking rates for individual properties or land types.
Pasture growth was estimated using the pasture growth model above. All three
studies indicated that safe utilisation rates were in the range 15-25% of average
annual pasture growth. Grazing trials and simulation studies indicate that, at these
utilisation rates, the risk of degradation in below average rainfall years is minimised.
However grazing trial data showed that, in general, short-term animal production (per
hectare) increased with higher utilisation rates (Figure 3.16). Australian Bureau of
Statistics (ABS) data suggest that utilisation can be much higher than a conservative
“safe” utilisation of 15% over much of Queensland, e.g. 1993/94 (Figure 5.11).
7. Operational spatial model of risks of degradation for Queensland
The operational model calculates pasture growth, pasture utilisation and pasture yield
for each of 70 000 5 km x 5 km pixels in Queensland. For each pixel, pasture and
soil attributes are estimated: pasture community, principal soil profile, and tree
density. Tables of model parameters have been developed, initially based on pasture
exclosure data (described above).
Climate inputs were from splined surfaces derived from real-time data supplied by the
Bureau of Meteorology (BoM). Stock numbers were collected by ABS and reported
on a Local Government Area (LGA) basis. In the operational model these are
redistributed within the LGA based on the relative estimates of pasture growth for
each pixel.
The spatial model was re-parameterised by J. O. Carter using a data bank of pasture
yields estimated from over 220 000 ground-truth observations taken from a moving
vehicle. Calibrated transpiration-use-efficiencies were similar to that derived from
Summary iv

Evaluating The Risk of Pasture and Land Degradation in Native Pastures in Queensland
exclosure data. Green cover estimated from the NOAA satellite as a Normalised
Difference Vegetation Index (NDVI) was used as an independent validation.
Comparisons over time for individual pixels showed correlations from 0.2 to 0.8
across Queensland.
Simulations of pasture yield were also compared with reports on a LGA basis by
stock inspectors (QDPI Natural Disaster Section). The spatial model compared well
with drought declared areas in Queensland, thus, providing a successful independent
validation of the model. Detailed examination at a half LGA-area resolution
suggested the following problems and needs:
1) the real-time rainfall reporting network is not fully operational and has limited
coverage in some regions;
2) interpolation of rainfall does not account for rain-shadow areas;
3) independent estimates of domestic and native animal numbers are required;
4) more accurate mapping of spinifex lands is needed; and
5) better models of landscapes with fragmented tree communities are required to
simulate the non-linear effect of tree density on pasture growth.
8. Application to other states
The model has been parameterised for pasture communities in the Northern Territory
and is likely to be applicable to northern WA. However, application to southern
states has not yet been attempted although contacts have been established. This area
of research has been reported in the LWRRDC project QPI20 National Drought Alert
Strategic Information System.
Summary v

Evaluating The Risk of Pasture and Land Degradation in Native Pastures in Queensland
9. Conclusion
The results of the project showed that:
1) historical and current pasture data can be used with models to simulate grazing
lands in near real-time;
2) spatial models of production can be developed and validated with existing
spatial data and monitoring systems;
3) data from graziers indicate that safe utilisation rates are 15-25% of average
pasture growth;
4) relative risks of land and pasture can be quantified from simulations using
actual numbers compared to safe stocking rates; and
5) case studies using the pasture growth model and models of grazing feedback
on pasture and land degradation to evaluate the economic consequences of
stocking rate strategies have been used in other projects (e.g. DroughtPlan:
McKeon et al. 1996, Stafford Smith et al. 1996).
Summary vi

Evaluating The Risk of Pasture and Land Degradation in Native Pastures in Queensland
SECTION 1 - REVIEW: A NEED TO CALCULATE RISKS OF
PASTURE DEGRADATION
1.0 INTRODUCTION
In this section we review:
1) the basis for concern with the condition of Queensland’s grazing lands; 2) the reasons for preferring perennial grass species as resource indicators of good
condition;
3) the causes of increased grazing pressure on the pasture resource;
4) the need for an operational forecast system of degradation alerts;
5) the methods for predicting acceptable resource use, i.e. safe stocking rate; and
6) the need for a quantitative approach to resource use.
1.1 PASTURE DETERIORATION AND DEGRADATION
The recent review on the condition of grazing lands in northern Australia (Tothill and
Gillies 1992) concludes “there is widespread deterioration in most pasture
communities in Queensland; this is indicated by undesirable changes in pasture
composition and soil surface characteristics such as cover and organic matter
content”. Deterioration was thought to be related to increased grazing pressure
resulting from below-average rainfall in the 1980s following substantial build up of
livestock numbers in the 1970s, and improved husbandry practices allowing stock to
better survive stress periods.
To ensure long term use of these lands, high priority was given to ‘establishing
guidelines for safe stocking strategies’. A major issue is the determination of a ‘long-
term safe stocking rate’, that is, a stocking rate which ‘will maintain the pasture
resource in a desirable and productive condition’. Safe stocking strategies should also
address the problems of decade-to-decade variation in rainfall (Willcocks and Young
1991), the varying sensitivities of pasture communities to inevitable periods of
overgrazing, varying resilience of pasture species after such stresses, the possible
Section 1 - Review: A need to calculate risks of pasture degradation 1

Evaluating The Risk of Pasture and Land Degradation in Native Pastures in Queensland
options of strategic spelling to maintain desired pasture composition (Tothill and
Gillies 1992), and the high likelihood of climate change (McKeon et al. 1993).
The Macquarie dictionary defines ‘degrade’ as ‘to reduce from a higher to a low rank,
degree, etc.’. Thus, in applying the definition to grazing lands, it is necessary to
recognise that some subjective judgement is required to rank the pasture resource in
states of degradation. Tothill and Gillies (1992) distinguished between three states of
pasture condition i.e.‘pristine’, ‘deteriorating’ and ‘degraded’. ‘Deteriorating’
condition was considered as ‘readily reversible through improved property
management and following a return to years of average or above-average rainfall’;
‘degraded’ was a state ‘where the system can only be brought back to an acceptable
steady state with difficulty’.
Most importantly Tothill and Gillies (1992) made the point that there will always be
periods of deterioration due to climatic variability and that differences in resilience
between pasture communities result in variation in the stability of grazing lands.
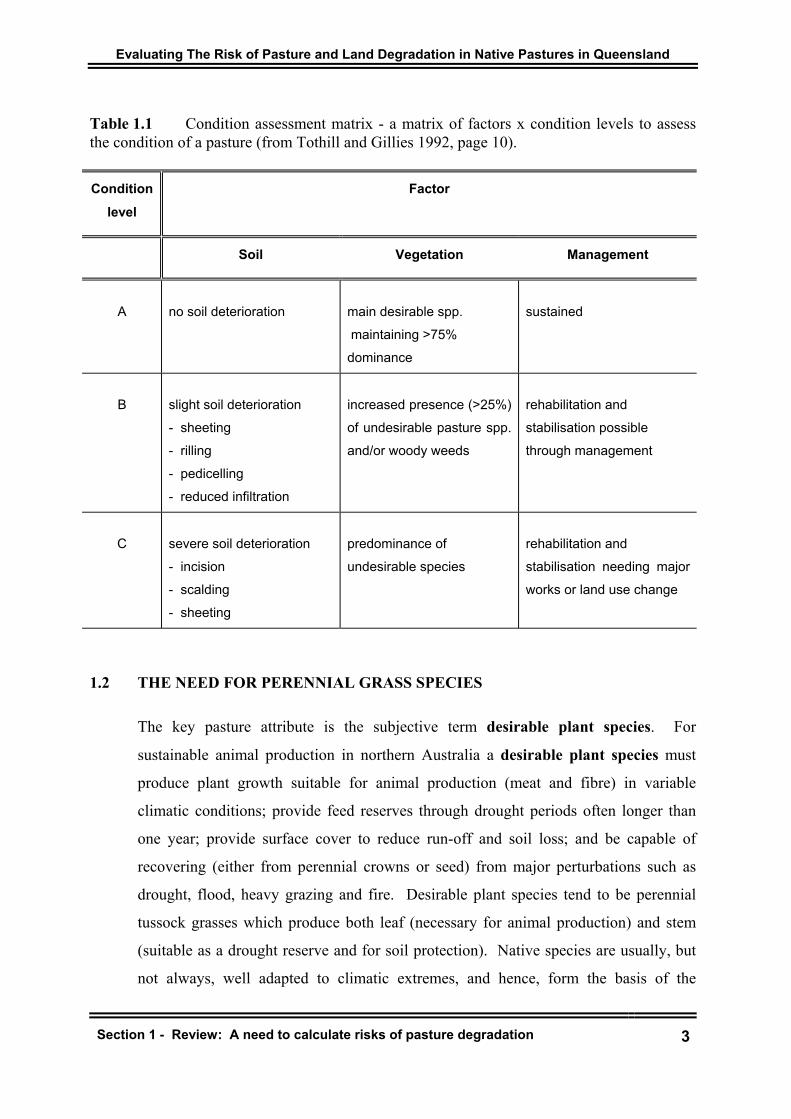
Tothill and Gillies (1992) asked groups of experts in pasture agronomy, animal
production and soil conservation to estimate, for their local area, the percent of land in
each of the current condition levels (Table 1.1).
Section 1 - Review: A need to calculate risks of pasture degradation 2
Evaluating The Risk of Pasture and Land Degradation in Native Pastures in Queensland
Table 1.1 Condition assessment matrix - a matrix of factors x condition levels to assess the condition of a pasture (from Tothill and Gillies 1992, page 10).
Condition level
Factor
Soil Vegetation Management
A
no soil deterioration
main desirable spp.
maintaining >75%
dominance
sustained
B
slight soil deterioration
- sheeting
- rilling
- pedicelling
- reduced infiltration
increased presence (>25%)
of undesirable pasture spp.
and/or woody weeds
rehabilitation and
stabilisation possible
through management
C
severe soil deterioration
- incision
- scalding
- sheeting
predominance of
undesirable species
rehabilitation and
stabilisation needing major
works or land use change
1.2 THE NEED FOR PERENNIAL GRASS SPECIES
The key pasture attribute is the subjective term desirable plant species. For
sustainable animal production in northern Australia a desirable plant species must
produce plant growth suitable for animal production (meat and fibre) in variable
climatic conditions; provide feed reserves through drought periods often longer than
one year; provide surface cover to reduce run-off and soil loss; and be capable of
recovering (either from perennial crowns or seed) from major perturbations such as
drought, flood, heavy grazing and fire. Desirable plant species tend to be perennial
tussock grasses which produce both leaf (necessary for animal production) and stem
(suitable as a drought reserve and for soil protection). Native species are usually, but
not always, well adapted to climatic extremes, and hence, form the basis of the
Section 1 - Review: A need to calculate risks of pasture degradation 3

Evaluating The Risk of Pasture and Land Degradation in Native Pastures in Queensland
‘desirable species’ list. Introduced perennial grasses such as buffel grass and green
panic have these desirable attributes and are often able to out-compete native species
where some disturbance has occurred, e.g., tree clearing in brigalow and gidgee lands.
Several species of perennial tussock grasses can meet the above requirements, and
hence, changes in composition between these species due to pasture management
(stocking rate, fire and tree control) does not necessarily result in degradation. For
example, in south-east Queensland, the change from kangaroo grass (Themeda
triandra) to black speargrass (Heteropogon contortus) in the 1880s is not regarded has
having a major effect on beef cattle production (Tothill and Gillies 1992) but is
considered to have contributed to the loss of the sheep industry in this region due to
the injury caused by black speargrass awns to sheep (Shaw 1957).
The two objectives of firstly sustaining the resource in the long-term (100-1 000 years)
and, secondly, maximising short-term (1-5 years) animal production are in conflict.
Animal production is likely to be maximised by species which are leafy and have high
concentration of nutrients (low dry matter production per unit of soil nutrient uptake)
and a long growing season, i.e. species that are less restricted by low temperature
especially in spring and autumn. On the other hand, the attributes of providing drought
reserve, fuel for pasture burning and soil protection are likely to be increased by
species which maximise dry matter production when growing conditions are suitable,
i.e. when high temperatures and summer rainfall coincide, by maximising the use of
limiting soil nutrients (i.e. able to achieve a high C:N ratio during growth).
Thus, fundamental to the definition of degradation is the concept of a ‘desirable’
species which allows a compromise between short-term and long-term goals. The
major attributes are those which result in long-term resource use and necessarily
involve foregoing short-term opportunities for animal production. Many perennial
tussock grasses meet these requirements.
1.3 WHAT ARE THE PRESSURES THAT LEAD TO DEGRADATION?
Section 1 - Review: A need to calculate risks of pasture degradation 4
There are several pressures that lead to the loss of desirable perennial grasses.
Because the desired species are suitable for animal production they, by definition, will
Evaluating The Risk of Pasture and Land Degradation in Native Pastures in Queensland
be grazed in preference to other undesirable species. Such differential grazing creates
a vacant niche of unused light, water and nutrients, thus, providing an opportunity for
undesirable species (grasses or shrubs) to grow and out-compete desired species.
Continued grazing can lead to the complete utilisation of desired species.
Repeated defoliation of desired tussock species, which have a large proportion of dry
matter above ground, leads to reduced root density, and as a result lower nutrient and
water uptake, reduced leaf area and lower growth rates. (Howden 1988, Wandera
1993, McIvor et al. 1995a, Ash and McIvor 1995).
Where dry matter production is reduced more than nutrient uptake, nutrient
concentration actually increases. The tussock structure of plants allows high levels of
intake to occur even at low pasture yields allowing near complete defoliation of
swards. For example, Ash et al. (1982) measured liveweight gains (0.5-1.0 kg/day) at
low pasture yield (300 - 500 kg/ha) after burning black speargrass.
In some cases the undesired species, which occupy the vacant niche, continue to
provide dry matter and nutrient concentrations suitable for short-term seasonal
production. Degradation is only apparent during droughts when no feed reserve is
present. In time, reduced surface cover may lead to increased soil erosion. Woody
weeds may increase due to lack of fire (eucalypts in black speargrass) or lack of
competition with perennial grass species (turkey bush in mulga lands). Thus, in these
cases, there are no short-term feedbacks which would allow graziers to detect
degradation through reduced animal production or profit.
Perennial grasses reduce the effects of drought through carry-over feed grown in
previous years and through the capability of perennial tussocks to respond to rainfall
amounts too small for the germination and growth of annual species. However,
improvements in animal transport, management, breeds and husbandry have provided
alternative drought protection to that once provided solely by the desired perennials.
However, whilst droughts are no longer as devastating in terms of animal deaths, these
improved practices may result in increased grazing pressure in drought and drought
breaking conditions, because animals can be retained longer.
Section 1 - Review: A need to calculate risks of pasture degradation 5

Evaluating The Risk of Pasture and Land Degradation in Native Pastures in Queensland
In fact, economic trends and fluctuations have resulted in pressure to increase stock
numbers to compensate for declining profitability (Anon. 1995a).
“Australian agricultural industries are not profitable! Average returns to capital (for
the Queensland beef industry) over the last three years have been 0.3% (91/92), - 0.1%
(92/93) and 1.2% (93/94). The average Australian farm business ‘profit’ in 1993-94
was negative $4290. For 1994-95, ABARE estimates it will be negative $13000.
Sixty-seven percent of Australian farms have a negative business ‘profit’. Average
farm debt as at June 1994 was $140260. Table 1.2 shows that farm debt has risen
faster in the beef industry than in wool and broadacre enterprises. In eight years from
1985-1993 beef herd productivity rose about 17% and exports by a massive 72% to
802 kilotonnes. In the same period the average dressed weight price of export cattle
fell by 18% in real terms (Anon., 1994).”
Table 1.2 Farm debt in Queensland (Anon, 1994).
Beef
$
Wool
$
Broadacre
$
1989/90
1990/91
1991/92
1992/93
1993/94
99 000
120 000
159 000
185 000
206 000
173 000
210 200
212 000
275 000
204 000
125 000
134 000
170 000
179 000
181 000
Section 1 - Review: A need to calculate risks of pasture degradation 6

Evaluating The Risk of Pasture and Land Degradation in Native Pastures in Queensland
Thus, the major forces leading to degradation are:
1) the removal of climatic constraints on grazing pressure through better drought
management;
2) financial pressure to increase stocking rate; and
3) the lack of direct short-term feedbacks on animal production to provide
warning to graziers.
1.4 THE NEED TO FORECAST RISKS OF DEGRADATION
If the cycle of ‘degradation → concern → goods seasons → apathy’ is to be
broken then there is a need to provide an alert before degradation occurs rather
than after the event. Thus, this project represents a pro-active approach to land and
pasture degradation in Queensland, by -
1) examining the causes of degradation;
2) quantifying the processes in simulation models using data from both research
and grazier knowledge;
3) developing a computer/extension system to run models in near real-time
(monthly) to provide alerts; and
4) planning links with grazier information systems.
Even in highly variable environments a proportion of graziers seek to run relatively
stable enterprises by maintaining a breeding nucleus. Hence, inevitable periods of low
rainfall result in heavy utilisation as feed demand exceeds pasture supply. Without
benchmarks to compare with, it is difficult to determine whether the observed
overgrazing during these periods is acceptable. Thus, a major component of a forecast
system providing alerts is a comparison of current condition with what should be
occurring if best practice was adopted. Fundamental to the concept of an alert is the
concept of an acceptable land use or more specifically a safe stocking rate.
Section 1 - Review: A need to calculate risks of pasture degradation 7

Evaluating The Risk of Pasture and Land Degradation in Native Pastures in Queensland
1.5 PREDICTING ACCEPTABLE RESOURCE USE
The review of Tothill and Gillies (1992) highlights the major need for a rational
approach to estimating safe stocking rates. Public institutions, e.g. Queensland
Department of Primary Industries (QDPI) and Department of Natural Resources
(DNR) have some charter (e.g. implementation of Ecologically Sustainable
Development [ESD] Policy) to contribute to these estimates. However, the potential
role of science is not clear given the personal and financial sensitivity of the issue of
stocking rates for individual graziers and consultants.
The simulation modelling approach used in this report is one of many alternative
approaches to solving the stocking rate problem (practical experience, local consensus
data, common sense, grazing trials, state-and-transition models, market forces). We
review these alternative approaches based on ease of method, capability of
extrapolation and adaptation to climate change (Table 1.3).
The major issues in comparing approaches are: participation of graziers, clarity of
method, extrapolation to other properties, capacity to adapt to climate change,
advantages and disadvantages in application. The “safe level of utilisation” approach
attempts to overcome the major disadvantages of the other approaches, i.e. the
difficulty of extrapolating to different resource units and climates. We have adopted
this approach mainly because of the bias of our training. However, we suggest that
simulation modelling is most likely to provide a quantitative understanding of the
interaction and feedbacks in the grazing system, and hence, answer the question
‘Why?’ as well as ‘How?’. Simulation also provides a way of evaluating decade-to-
decade variation in rainfall and the impact of tactical stocking rate decisions.
Section 1 - Review: A need to calculate risks of pasture degradation 8

Evaluating The Risk of Pasture and Land Degradation in Native Pastures in Queensland
Table 1.3 Approaches to estimating a long term safe stocking rate. Approach Long term practical experience
Method For an individual property or paddock accurate long term records (30-100 years) of stocking rate in combination with observations of pasture and land condition can be used to determine, in retrospect, safe long term stocking rates. The process is well understood and ‘owned’ by the grazier.
Extrapolation Extrapolation is limited to the same climate, land and pasture resources.
Climate Change Extrapolation is limited to climatic conditions within the long term experience.
Advantages The safe stocking rate has been derived from the experience of generations of graziers specifically for individual properties. Accurate extrapolation can be made to similar situations.
Disadvantages The approach requires long-term records, and has to account for property development, e.g., tree clearing, fencing, water improvement. It depends on the judgement of a desired state of the resource. Errors in estimating stocking rate due to short-term favourable conditions, e.g. 1970s, may cause irreversible resource damage, or in the case of unfavourable conditions, e.g. 1960s, may result in lost economic opportunities especially if climatic change occurs.
Approach Local consensus data (LCD)
Method For given pasture communities in a region, grazier groups determine long term safe stocking rates by sharing experience and knowledge.
Extrapolation Where individual properties and paddocks have different combinations of resources, long-term safe stocking rates will need adjustment.
Climate Change The LCD estimates may be specific to climatic condition, e.g. 1970s compared to 1980s. Re-assessment for changing climatic conditions will be required.
Advantages This approach has the direct involvement of graziers sharing experience and knowledge, addresses the specific issues of a given region and provides well documented expert opinion.
Disadvantages Because of variation in tree/shrub density and range of stocking rates for cleared and uncleared land, application to individual properties or paddocks may have some difficulty.
Section 1 - Review: A need to calculate risks of pasture degradation 9

Evaluating The Risk of Pasture and Land Degradation in Native Pastures in Queensland
Table 1.3 continued
Approach Common sense tactical management.
Method Individual graziers have developed a set of flexible “rules” to adjust stock numbers based on: seasonal conditions (past, current and expected), standing feed; pasture composition; markets; and perceived carrying capacity.
Extrapolation If the rules can be captured explicitly, e.g. by interviews, then they can be implemented by other graziers.
Climate Change Where the rules contain key indicators, e.g. feed supply, then adaptation to climate change should be successful. However, where species indicators are used then climate and management effects can be confounded.
Advantages Flexible principles and rules derived directly from grazier experience.
Disadvantages The principles may be too intuitive to be formulated into logical rules or the rules may be specific to certain climate conditions.
Approach State-and-transition models
Method The possible states of the pasture system are defined for the specified stocking rate and fire management.
Extrapolation This approach is restricted to the same climate-soil-plant system. Nevertheless, the biological and physical principles of the transition from state-to-state have wide power in extrapolation.
Climate Change The principles provide a useful way to adapt to climate change as long as major climate-related shifts in plants do not occur , e.g. invasion of black speargrass into Mitchell grasslands in the 1950s.
Advantages This approach is soundly based on a mechanistic understanding of the reasons for adopting both a stocking rate and pasture management strategy to achieve a desired vegetation state.
Disadvantages Because of spatial variability in resources and climate, it may be difficult to develop quantitative advice for individual properties.
Section 1 - Review: A need to calculate risks of pasture degradation 10

Evaluating The Risk of Pasture and Land Degradation in Native Pastures in Queensland
Table 1.3 continued
Approach Market forces and economic surveys.
Method The market already, to some extent, determines the value of grazing land based on an expected return. Estimating carrying capacity as a function of pasture and land condition would allow the effects of overgrazing to be translated into $ terms. When supported by regional economic surveys, which cover a range of stocking rates used by graziers, the regional effects of loss of pasture condition can be quantified in $ terms.
Extrapolation Limited to region and specific pasture communities.
Climate Change Adaptation would require constant re-assessment and relies on a range of existing management practices to assess best stocking rate.
Advantages This approach quantifies the effects of stocking rate in $ terms allowing accurate comparison of stocking rate options in a region.
Disadvantages A definitive comparison relies on some properties being over stocked, and hence, some regional risk of degradation. The financial comparison is likely to be confounded by variability in land and pasture resources in that the demand for land may override the effect of condition.
Approach Safe level of utilisation.
Method Pasture growth (summer or annual) is estimated as a function of soil, climate, tree/shrub density, species, and pasture condition. Safe levels of utilisation (amount eaten as a proportion of amount grown) are determined from grazing trials and/or grazier experience. Long term safe stocking rates can then be calculated for individual properties.
Extrapolation Utilisation rates are more likely to be accurately extrapolated than actual stocking rates. Thus, a wide range of resources can be covered.
Climate Change Where the effects of climate change and CO2 on pasture growth can be estimated, new safe stocking rates can be calculated.
Advantages This method incorporates the intuitively sound principle of adjusting stock numbers to match the feed available. Different approaches can be compared in terms of simple variables such as pasture growth and pasture eaten providing greater capability for handling resource and climatic variability. Graziers can assess their own properties and the concept can be applied at a range of scales, e.g. plants, patches, paddocks, properties or regions.
Disadvantages This method involves system concepts which may not be accepted by industry. Safe utilisation rates are unknown for many communities. Errors in describing the land and pasture resource will lead to errors in the calculation with financial and legal consequences. There are no visual indicators and a calculation is required.
Section 1 - Review: A need to calculate risks of pasture degradation 11

Evaluating The Risk of Pasture and Land Degradation in Native Pastures in Queensland
1.6 A SYSTEMS APPROACH TO CALCULATING RISKS OF DEGRADATION
In this section we present a systems analysis approach for calculating safe stocking rates. Pasture growth is the major source of energy and nutrients required for animal growth.
Pasture growth is a function not only of plant density but also the individual species
response to light, temperature, humidity, soil moisture, nutrients and CO2. Soils vary
in nutrient supply, available water range and infiltration characteristics. Trees and
shrubs can either compete with or stimulate pasture production. They can also supply
browse and seeds for grazing. The removal of pasture by grazing can have a
deleterious effect on the density (basal area) of desirable pasture species resulting in
changes in pasture composition and soil attributes. The ratio of removal by grazing to
the amount grown is often termed ‘utilisation’. ‘Utilisation’ provides an index of the
grazing pressure on the soil/plant system and sets some conceptual bounds on how
much can be eaten by domestic and feral stock, macropods and insects (i.e. between 0
and 100). This concept of utilisation allows the different approaches and different
pasture communities to be compared with a common basis, i.e. % eaten per amount
grown.
This concept of utilisation is fundamentally different to the year-to-year adjustment of
stock numbers based on the expected ‘utilisation’ of observed standing pasture yield
over a future time period (6-12 months). The latter concept is more appropriate to
regions where there is a relatively high probability of little or no pasture growth for a
year (one in four years in western Queensland). In such environments the concept of a
long-term ‘safe’ stocking rate may be insufficient and more emphasis is likely to be
needed on tactical (e.g. year-to-year) decisions to reduce pasture deterioration.
For the two major processes of land and pasture degradation in Queensland (Williams
1989), namely soil erosion and change in species composition to undesirable species,
the risk of degradation can be calculated from utilisation and % plant cover of the
surface soil.
Section 1 - Review: A need to calculate risks of pasture degradation 12

Evaluating The Risk of Pasture and Land Degradation in Native Pastures in Queensland
Recent research at one location showed that damage to pastures (perennial grasses)
occurred when utilisation exceeded 30% during ‘dry’ (e.g., < decile three rainfall)
growing seasons (McKeon et al. 1990). Furthermore, the risk of soil erosion is
greatest when surface cover was less than 30%, or pasture yield was less than 1 000
kg/ha of pasture dry matter (Gardener et al. 1990).
Computer models have been developed to simulate soil water, pasture growth and
plant cover. Pasture growth can be calculated on a regional basis with the inputs of
soil maps, pasture species, tree density and real-time climate data. When combined
with ABS animal numbers and estimates of the density of other pasture consumers
(macropods, locusts and feral animals) pasture utilisation and cover can be calculated.
Forecasts of pasture growth and utilisation can be made using the seasonal rainfall
forecasts provided by the Bureau of Meteorology (BoM). These forecasts are based on
the behaviour of the El Niño Southern Oscillation. An operational system would be
readily adapted to use climatic forecasts of General Circulation Models (GCMs) using
inputs of observed sea surface temperatures.
1.7 CONCLUSION
Previous reviews of pasture condition and causes of degradation in Queensland
highlighted the need to calculate safe stocking rates or pasture utilisation. The systems
analysis approach adopted here requires simulation of pasture growth as described in
the Section 2.
Section 1 - Review: A need to calculate risks of pasture degradation 13

Evaluating The Risk of Pasture and Land Degradation in Native Pastures in Queensland
SECTION 2 - A MODEL OF NATIVE PASTURE GROWTH
2.0 INTRODUCTION
In this section we -
1) review the features of native pastures in Queensland to determine the
specifications for modelling pasture growth;
2) briefly describe the simulation model GRASP;
3) describe the field methodology used to collect data for model calibration;
4) evaluate model performance for more than 150 site x year data sets;
5) report independent model validation and likely sources of error; and
6) report application of growth parameters from exclosure to grazing treatments.
Key features of native pastures
Definitive reviews of the structure and function of grasslands in northern Australia
have been conducted in the last 25 years (Moore 1970, Mott et al. 1985, Tothill et al.
1985). From these reviews a systems view of the grasslands has been developed in
this project (Anon. 1995a), and has been presented in Appendix 1.
Native pastures in Queensland have the following important features:
1) native pastures grow in environments of high solar radiation, high
temperatures and high evaporative demand. Rainfall occurs mainly in the
warm growing season (peaking from January to March). However,
evaporative demand is high (5-15mm per day), and hence, soil moisture
deficits are frequent;
2) year-to-year variation in rainfall is the major source of climatic variability
affecting plant growth and, in eastern Queensland, this variability is associated
with phases of El Niño/Southern Oscillation (Clewett et al. 1991);
Section 2 - A Model of Native Pasture Growth 14
Evaluating The Risk of Pasture and Land Degradation in Native Pastures in Queensland
3) native pasture swards are often made up of many species which have different
responses to major environmental and management variables, e.g. drought,
frost, day length, fire, grazing and variable tree density;
4) native pastures occur across the widest range of soil types differing in many
soil attributes, and landscape position;
5) soils are low in nutrients and may have low infiltration;
6) tree/shrub density varies in space and time. The woody component acts as
both a competitor for water, nutrients and light and a possible stimulator by
concentrating nutrients and/or providing shade;
7) the ecophysiology and autoecology of individual species has not been studied
in detail (Mott et al. 1985), in contrast to introduced species (e.g. Stylosanthes
spp.); and
8) nutrient cycling (carbon, nitrogen phosphorus) involves complex processes
(e.g. Metherell et al. 1993) which are yet to be quantified for many pastures,
especially the effects of management such as grazing, fire and tree clearing.
This background of high variability in all dimensions and lack of basic physiological
knowledge contrasts with crop modelling in the tropics which has concentrated on a
relatively few species (sorghum, wheat, sunflower, maize and peanuts) with detailed
physiological knowledge of varietal differences (e.g. Hammer and Muchow 1994).
Crop models show the potential capability of physiologically sound plant growth
models which are calibrated to field data. For example, in an independent test,
Hammer and Muchow (1994) were able to simulate 94% of the variation in sorghum
biomass at five sites across northern Australia.
Section 2 - A Model of Native Pasture Growth 15

Evaluating The Risk of Pasture and Land Degradation in Native Pastures in Queensland
Model specifications
A model of native pastures must:
1) be capable of being parameterised for each pasture community in Queensland,
(major parameters include available soil water range, potential nutrient uptake,
water-use efficiency, potential regrowth after burning or mowing);
2) be capable of being calibrated with existing agronomic data (above-ground
sward yields, presentation yields in grazing trials, grass basal cover);
3) include responses to dominating environmental and managerial variables; and
4) provide the basis for future development to improve accuracy of simulation
and application to the grazing industries.
Preliminary analyses indicated that the two key model outputs were calculation of
pasture growth in years of below-average rainfall, when risks of overgrazing are
greatest, and calculation of average or median pasture growth which determine
long-term carrying capacity. Simulation of pasture growth in years of above-average
rainfall is likely to be more important for modelling animal production and
demonstrating the loss of potential production due to the effects of previous
degradation.
In this study we have concentrated on, as a first priority, modelling native pasture
growth in years of below-average rainfall when degradation processes are most likely
to occur.
Classification of pasture communities
Various classifications of pasture communities of Queensland have been made. Given that our objective is to calculate plant growth from climatic inputs, and animal consumption from known stocking rates then it is necessary to evaluate alternative resource descriptions (Table 2.1).
Section 2 - A Model of Native Pasture Growth 16

Tab
le 2
.1
Des
crip
tion
of n
orth
ern
Aus
tralia
pas
ture
and
pro
duct
ion
units
.
Sour
ce
Reg
iona
l Uni
t C
arry
ing
Cap
acity
A
nim
al P
rodu
ctio
n So
ils
Past
ures
R
esou
rce
Stat
us
Aust
ralia
n Bu
reau
of
Stat
istic
s (A
BS.)
Loca
l Gov
ernm
ent
Area
(114
in Q
ld)
Anim
al n
umbe
rs fo
r ca
ttle
and
shee
p Br
andi
ng, l
ambi
ng,
turn
-off
num
bers
, w
ool
Non
e Ar
eas
of p
astu
re
impr
ovem
ent a
nd
crop
s
Non
e
Wes
ton
et a
l (19
81)
35 p
astu
re
com
mun
ities
in Q
ld
Estim
ated
bee
f eq
uiva
lent
s N
one
Six
text
ure
clas
ses
base
d on
Atla
s of
Au
stra
lian
soils
(N
orth
cote
et a
l. 19
60-6
8)
Cur
rent
and
pot
entia
l la
nd u
se b
y so
il ty
pe
Past
ure
cond
ition
as
sess
ed
Wes
ton
(198
8)
14 p
astu
re
com
mun
ities
ag
greg
ated
from
W
esto
n et
al.
(198
1)
Estim
ated
bee
f eq
uiva
lent
s Li
vew
eigh
t gai
n fo
r ca
ttle
estim
ated
by
K H
owar
d
Text
ure
clas
ses
abov
e C
urre
nt a
nd p
oten
tial
land
use
est
imat
ed
Past
ure
cond
ition
as
abov
e
Toth
ill an
d G
illies
(1
992)
15
0 lo
cal p
astu
re
units
(46
in Q
ld)
base
d on
Wes
ton
et
al. (
1981
)
Estim
ated
bee
f eq
uiva
lent
s N
one
Atla
s of
Aus
tralia
n so
ils (N
orth
cote
et a
l. 19
60-6
8)
Impr
ovem
ent
pote
ntia
l est
imat
ed
high
, med
ium
, low
Land
and
pas
ture
co
nditi
on a
sses
sed
O’R
ourk
e et
al.
(199
2)
14 re
gion
s (1
2 in
Qld
) Su
rvey
of b
eef
prod
ucer
s pr
ovid
ed
prop
erty
sto
ckin
g ra
tes
Live
wei
ght e
stim
ated
fro
m a
ge o
f tur
n-of
f, br
andi
ng ra
te a
lso
surv
eyed
% p
hosp
horu
s w
ith
phos
phor
us
defic
ienc
y fo
r eac
h re
gion
Prop
erty
de
velo
pmen
t cle
arin
g an
d im
prov
ed
past
ures
item
ised
Wee
ds in
dica
ted
but
not s
oil e
rosi
on ri
sk
Broo
k et
al.
1992
5
km x
5 k
m p
ixel
s w
ith c
limat
e su
rface
s an
d sa
tellit
e da
ta fo
r ea
ch o
ne k
m2 p
ixel
Estim
ated
from
ABS
an
d re
lativ
e pr
oduc
tivity
of
past
ure
com
mun
ities
Non
e as
yet
At
las
of A
ustra
lian
soils
(Nor
thco
te e
t al.
1960
-68)
Tree
bas
al a
rea
and
crop
ping
from
sa
tellit
e tim
e se
ries
(ND
VI)
Non
e as
yet
LWR
RD
C N
atio
nal
Dro
ught
Ale
rt. B
rook
(1
996)
5 km
x 5
km
pix
els
spat
ial m
odel
and
ag
greg
ated
to
O’R
ourk
e et
al.
(199
2) re
gion
s
Shee
p an
d ca
ttle
num
bers
., m
acro
pods
and
goa
ts
Sim
ulat
ed p
rodu
ctio
n lin
king
gra
zing
tria
ls,
ABS
and
prod
ucer
da
ta
Phos
phor
us m
ap
from
Car
ter a
nd
Aher
n (Q
DPI
)
As in
Bro
ok e
t al.
(199
2)
Non
e as
yet

Evaluating The Risk of Pasture and Land Degradation in Native Pastures in Queensland
Each classification has a particular advantage, e.g. Local Government Areas (LGAs)
provide best estimates of animal numbers; Weston et al. (1981) provide best resource
description and condition survey; Tothill and Gillies (1992) provide the most recent
condition survey; and O’Rourke et al. (1992) surveyed beef producers animal
management and nutrition. The classification of Tothill and Gillies (1992) was used
as the resource base description because of the detailed condition survey and likely
continuing commitment to future surveys on status of the pasture resource.
Tothill and Gillies (1992) classified Queensland’s native pastures into 46 pasture
communities. In each community different grass species dominate particular
condition states (A sustainably grazed, B deteriorating and C degraded). Eighty
major grass species (not including ecotypes) are listed. Some species are grouped by
genus, e.g. Aristida spp., because of the difficulties of distinguishing between
individual species in the field.
The above review highlights the complexity of modelling native pasture growth. To
overcome this complexity we developed:
1) a generic model of native pasture growth (Appendix 2).
2) implemented a field methodology to measure model parameters (Appendix 3);
and
3) co-ordinated a network of collaborating scientists (Appendix 4) who shared
the common goal of understanding native growth and who were prepared to
contribute both data and intellect to model development through a project
known as GUNSYNpD: Grass Under Nutritional Stability: Yield Nitrogen
and phenological Development).
These three developments occurred in parallel during the project but are described as
separate stages in this report.
Section 2 - A Model of Native Pasture Growth 18

Evaluating The Risk of Pasture and Land Degradation in Native Pastures in Queensland
2.2 BRIEF MODEL DESCRIPTION
Possible approaches to modelling native pastures have been reviewed by McKeon
et al. (1990). From this review, an approach based on simulating soil water balance
and linking simulated transpiration to plant growth was adopted (McKeon et al.
1982). For native pastures in south-east Queensland this approach proved superior
when compared to alternatives (Day et al. 1993, Appendix 1).
The GRASP model is empirical (and unabashedly so!) in that it links known empirical
relationships between plant growth and water use (Rose et al. 1972, McCown et al.
1974, Tanner and Sinclair 1983) with known empirical relationships between plant
growth and growth indices (Fitzpatrick and Nix 1970, Williams and Gardener 1984).
A detailed description is provided in Appendix 2.
The model includes a daily simulation of soil-water balance with four soil layers
(surface 10cm, 10-50cm, 50cm to grass rooting depth, grass rooting depth to tree
rooting depth). The daily soil-water balance model uses inputs of rainfall and Class A
pan evaporation to calculate run-off, soil evaporation, transpiration (from grass and
trees) and through-drainage.
The model simulates the processes of above-ground growth, senescence, animal
consumption, detachment and decomposition. Dry matter pools of green leaf and
stem, dead leaf and stem, and surface litter are included. The model does not
simulate the dry matter pools of roots nor seeds. The model does not include the
processes of translocation between above-ground biomass and roots, possible re-
greening of previously senescenced material, nor tree canopy growth and senescence.
In the following analysis we discuss the likely deficiencies in our approach.
Transpiration is calculated from simulated daily green cover and available soil-water.
Daily plant growth is calculated from a transpiration-use-efficiency (kg/ha/mm of
transpiration) multiplied by transpiration. Transpiration-use-efficiency is inversely
Section 2 - A Model of Native Pasture Growth 19

Evaluating The Risk of Pasture and Land Degradation in Native Pastures in Queensland
proportional to daytime vapour pressure deficit which is calculated from screen
measurements and adjusted for height of pasture.
Upper limits to daily growth rate are calculated from temperature, nitrogen, radiation
interception and available soil water. Lower limits to growth are calculated from a
growth index (Fitzpatrick and Nix 1970), nitrogen, available soil water, plant density
and a potential regrowth rate.
The senescence or death of green material is calculated as a function of soil-water and
frost. Detachment, the process of standing material becoming surface litter, is a
function of time, rainfall and trampling due to animals.
Litter decomposition is a function of soil-water (0-10cm) and average daily
temperature.
Animal intake from green and dead pools is calculated as a function of stocking rate,
liveweight and type of animal. Consumption by native fauna and feral animals can be
explicitly included but consumption by termites and other insects (e.g. grasshoppers)
is calculated as part of the natural detachment and decomposition processes.
The model does not include phenological development of individual species because
the production of a whole pasture sward, comprising many species and ecotypes, is
being simulated.
Nutrient cycles of nitrogen and phosphorous are not simulated. As yet there is
insufficient knowledge on processes (e.g. fixation, translocation) and pools (e.g.
microbial biomass) to parameterise these pools and processes for each pasture
community.
We will examine later the consequences of these model boundaries and limitations
(Section 2.5). In all cases further model development to overcome these limitations is
occurring.
Section 2 - A Model of Native Pasture Growth 20

Evaluating The Risk of Pasture and Land Degradation in Native Pastures in Queensland
2.3 DATA SOURCES AND FIELD METHODOLOGY
The most common and simplest measurement of pasture biomass is above-ground
standing dry matter, which represents the net result of the addition of pasture growth
and the losses of detachment, trampling and animal consumption. Where growth and
detachment are occurring simultaneously it is not possible to find unique relationships
between these ‘opposing’ processes from measurements of pasture yield alone. For
example, high growth rates and high detachment rates may provide as good an
explanation of a measured presentation yields as do low rates of growth and
detachment.
Thus, pasture yields measured in grazing trials, where the processes are of equal but
opposite sign, are not suitable for establishing relationships between environmental
variables and growth rates. However, where there is little carry over of material from
previous seasons due to burning, mowing or observed rapid decay (e.g. in tropical wet
seasons) then growth rates can be estimated from accumulating above-ground pasture
biomass.
The exclusion of grazing reduces the uncertainty regarding estimates of animal
consumption and trampling. However, exclosure may change sward structure (e.g.
from prostrate to upright in black speargrass) and change partitioning between roots
and shoots. Burning and mowing are major interventions which may disrupt nutrient
cycling (e.g. through removal of litter and previous year’s material) and translocation
within the plant. Hydrologic impacts include possibly increased run-off due to low
cover following burning or mowing depending on duration of low cover (McIvor et
al. 1995b).
Alternatively, defoliation may stimulate new growth since the presence of old tillers
may reduce growth through shading, respiratory load or some form of apical
dormancy (e.g. Scanlan 1980). Excluding grazing and regular burning or mowing can
also result in substantial changes in botanical composition.
Section 2 - A Model of Native Pasture Growth 21

Evaluating The Risk of Pasture and Land Degradation in Native Pastures in Queensland
Given the complexity of pasture communities (46) and species (>80) we have adopted
the approach of using exclosures despite the above reservations. Exclosures with a
defined burning or mowing were used to estimate growth rates and parameterise the
growth model. Where available, we have also used grazing trial data if animal
consumption could be calculated and annual burning occurred (Section 3).
From exclosure studies in Queensland, soil-water, % green cover, pasture yield and N
concentration data were collated from 47 localities (Figure 2.1), 89 exclosures and
179 site x year combinations. From these data a soil-water-balance/pasture-growth
model (GRASP) was developed and parameterised.
Figure 2.1 Location of native pasture exclosure data available for model parameterisation in Queensland
Section 2 - A Model of Native Pasture Growth 22

Evaluating The Risk of Pasture and Land Degradation in Native Pastures in Queensland
Field methodology for measuring model parameters and pasture growth
The model structure described above defines parameters that need to be quantified for
accurate simulation. Figure 2.2 shows a typical seasonal pattern of soil water, green
cover, pasture yield and N uptake measured every three weeks in an exclosure. The
estimation of key parameters required to simulate the soil-water balance and pasture
yield is described as well as the minimum field measurements for model calibration.
Figure 2.2 A typical seasonal pattern of plant growth, green cover, and N uptake as measured using GUNSYNpD methodology and simulated by the model GRASP. The example is for a black speargrass sward at Brian Pastures near Gayndah, south-eastern Queensland, for 1986/7 (data from D.M. Orr and G.M. McKeon).
Section 2 - A Model of Native Pasture Growth 23
Evaluating The Risk of Pasture and Land Degradation in Native Pastures in Queensland
1. Minimum soil water (permanent wilting point). Periods of high evaporative demand (potential evapo-transpiration of 5-15mm/day)
are common during the summer growing season, and hence, minimum soil water
contents can be measured either opportunistically or as part of a regular (e.g. three
weekly) sampling procedure. Varying soil evaporation rates due to cracking or high
temperature gradients may contribute to errors in estimates derived from single
seasons.
2. Maximum soil water (field capacity).
Soil moisture sampling after periods of high rainfall (50-100mm) provides estimates
of maximum soil water (field capacity). Access to sites is not often possible until
several days after such events. We have found that the daily water balance model
accurately estimates evapo-transpiration when green cover in high (>30%) and soil
moisture is high, and hence, maximum soil water can be determined from selected
high soil moisture measurements and estimates of evapo-transpiration since rainfall.
The alternative of direct field determination using infiltration rings and water cartage
is not feasible unless dedicated staff and water are available. For sites where
measurements of the drained upper limit of soil water were made values are usually
lower than estimated by ‘back calculating’ with the model (Figure 2.3). This possible
source of error remains an area for further research although sensitivity studies with
the model suggest that other factors have greater effects on pasture production.
3. Relationship between cover and yield.
Observations of percentage green cover are related to green yield (Figure 3.2,
Appendix 2). The model parameter, yield at 50% green cover, varies with species,
grazing history and water stress. Percentage green cover can be reproducibly
estimated after a few hours training or measured directly from photographs. Similar
relationships between projected cover and total standing dry matter are used in the
calculation of run-off.
Section 2 - A Model of Native Pasture Growth 24
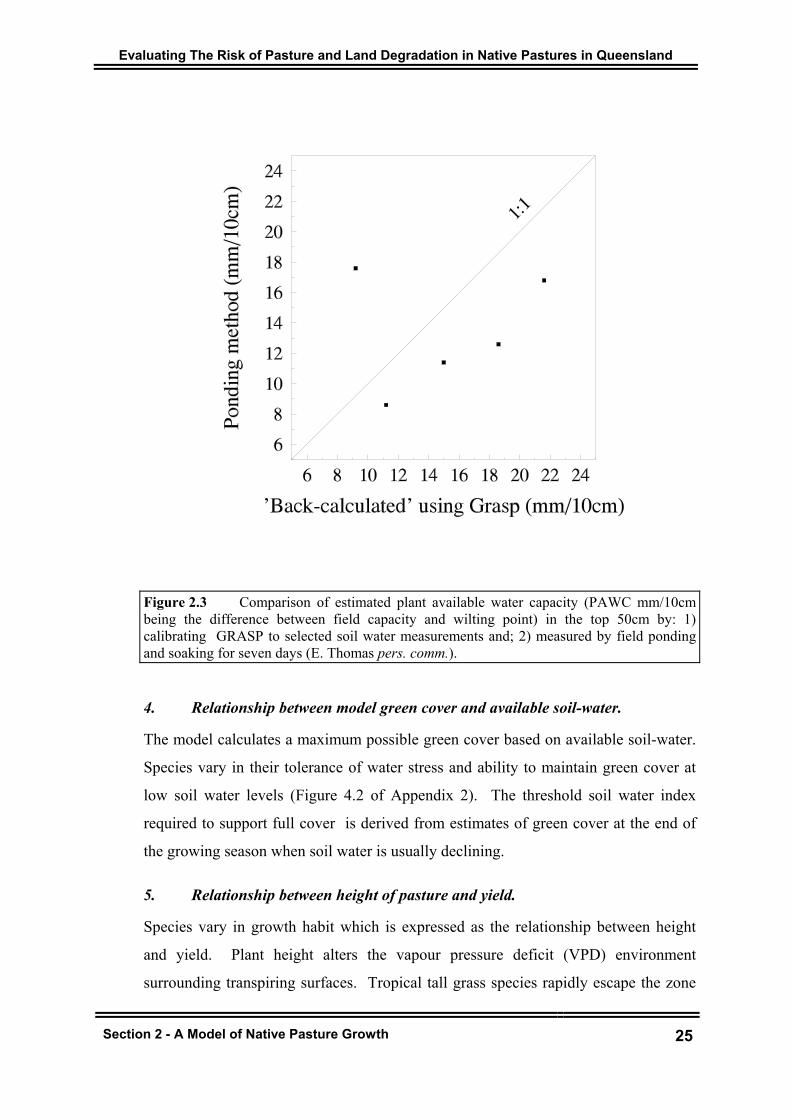
Evaluating The Risk of Pasture and Land Degradation in Native Pastures in Queensland
Section 2 - A Model of Native Pasture Growth 25
Figure 2.3 Comparison of estimated plant available water capacity (PAWC mm/10cm being the difference between field capacity and wilting point) in the top 50cm by: 1) calibrating GRASP to selected soil water measurements and; 2) measured by field ponding and soaking for seven days (E. Thomas pers. comm.).
4. Relationship between model green cover and available soil-water.
The model calculates a maximum possible green cover based on available soil-water.
Species vary in their tolerance of water stress and ability to maintain green cover at
low soil water levels (Figure 4.2 of Appendix 2). The threshold soil water index
required to support full cover is derived from estimates of green cover at the end of
the growing season when soil water is usually declining.
5. Relationship between height of pasture and yield.
Species vary in growth habit which is expressed as the relationship between height
and yield. Plant height alters the vapour pressure deficit (VPD) environment
surrounding transpiring surfaces. Tropical tall grass species rapidly escape the zone

Evaluating The Risk of Pasture and Land Degradation in Native Pastures in Queensland
of high VPD near the soil surface. In contrast stoloniferous species remain in the
surface zone, and hence, may be less efficient in water use.
6. Temperature response
General relationships between temperature and potential growth for C4 and C3 species
are used. Since the growth of the sward is being modelled, general relationships have
been preferred even though individual species have specific relationships between
temperature and growth. We have found that the equations of McCown et al. (1981)
for C4 species and Fitzpatrick and Nix (1970) for C3 species are adequate general
relationships.
7. Effect of frost
Observations of death of green material associated with frosts allow relationships with
screen minimum temperatures to be developed. Species differ in sensitivity to frost,
especially C4 compared to C3 species. However, parameterisation from field data
using nearest available screen minimum temperatures will also include landscape and
microclimate effects. In most cases one general relationship has been used. More
accurate parameterisation will require daily minimum temperatures which more
accurately describe the pasture observation site.
8. Relationship between potential regrowth and grass basal cover
The initial pasture growth rate measured for 3-6 weeks after burning, mowing or
heavy grazing is simulated as a function of:
1) plant density (i.e. measured as % grass basal cover);
2) a model parameter, potential regrowth rate; and
3) environmental variables expressed as a growth index (after Fitzpatrick and
Nix 1970, Appendix 2).
The model parameter, potential regrowth, is calculated by model calibration with
yield measurements in the first 3-6 weeks of growth. Further model development will
be required to account for variation in N availability, and possible translocation of
nitrogen and carbohydrates to shoots from roots and crowns.
Section 2 - A Model of Native Pasture Growth 26

Evaluating The Risk of Pasture and Land Degradation in Native Pastures in Queensland
9. Transpiration-use- efficiency
The model parameter, transpiration-use-efficiency (TUE), standardised at a near
coastal day-time VPD of 20hPa, is derived by calibration with all observed yield
measurements throughout the growing season. The parameter varies with species and
fertility. Whilst a general response to VPD is used based on Tanner and Sinclair
(1983), further model development will examine the possibility of different
relationships between VPD and TUE for different species.
10. Soil-water content at which above-ground growth stops
Yield and soil-water observations from many sites confirm that no increase in above-
ground yield occurs when soil-water declines below a particular value. For perennial
pastures this generally occurs when the ratio of actual transpiration to potential
transpiration is less than 0.4. Values derived from model calibration with data from
heavily grazed pastures suggest higher thresholds up to 1.0 which occurs at
approximately 40% available soil water (Figure 2.6 of Appendix 2). This increased
sensitivity to soil-water deficit with grazing may indicate reduced root activity.
In the case of annuals (e.g. forbs in central Australia) growth continued to the lowest
observed soil water either indicating no threshold on growth or that lowest observed
soil water represented the limited capability of annual species to extract soil water in
contrast to perennials.
11. Nitrogen uptake
Nitrogen uptake is assumed to be related directly to transpiration flow. Maximum
possible uptake of N represents the annual capacity of the soil-plant system to
mineralise and recycle nitrogen. The experimental methodology involving burning or
mowing to remove previous season’s material, prevents any N mineralisation from
litter or carry-over material, and hence, model parameters may underestimate N
availability. Alternatively, burning and mowing may cause rapid root death providing
a source of readily mineralised material. Filet (1990) found no difference between N
uptake in burnt and unburnt pastures.
Section 2 - A Model of Native Pasture Growth 27

Evaluating The Risk of Pasture and Land Degradation in Native Pastures in Queensland
Initial N yield is likely to reflect the above effects as well as environmental (surface
moisture and temperature) effects on mineralisation during the winter/spring season.
Insufficient data (e.g. soil nitrate measurements) are available to model these
processes for all sites at present.
12. Detachment rates
Detachment rates are calculated from changes in pasture yield and estimated pasture
growth. Since exclosures have been initially burnt or mown, the detachment rates
represent that of ungrazed material which is less than one year old, and hence, may
not be directly applicable to grazing and older material (see Section 3). Detachment
rates after peak yield in autumn were approximately 0.002 kg/kg per day (i.e. 30-40%
in six months). Forbs detached at a much faster rate (0.010 kg/kg per day) than
perennial grasses.
Some sites showed evidence of rapid decline in yield immediately following seed
production although it is not possible to quantify this accurately because of the low
frequency of sampling and high spatial and temporal variability in flowering typical
of native pasture plots.
The model has been designed to simulate different rates of detachment for leaf and
stem. However, insufficient data are available to parameterise all communities at
present.
Summary
Field data collection allows estimates of most parameters to be made before running
the model. Thus, model calibration concentrates on the main growth parameters
potential regrowth rate and transpiration-use-efficiency.
Section 2 - A Model of Native Pasture Growth 28

Evaluating The Risk of Pasture and Land Degradation in Native Pastures in Queensland
2.4 MODEL CALIBRATION AND ANALYSIS OF NATIVE PASTURE
PRODUCTION
Model calibration
The manual calibration procedure was necessarily iterative and subjective using both
accumulating experience in the possible range of parameters and subjective
judgement about data quality and consistency. Table 2.2 summarises the model’s fit
to all available data and measured variables (soil water, yield, green cover and N
uptake). Appendix 4 presents simulated and observed variables for the 94 exclosures
in Queensland.
Each site varied in quality of climate input. We would expect variation in some
parameters to be reduced with standard climate. We have now (February 1997)
generated uniform climate data for all sites (as described in Section 5) and the
analyses presented in this section will be repeated with this new, standard climate
data.
For most exclosures there were two to three years data. The calibration procedure
aimed to provide one set of parameters which represented the best fit to all data
measured at that exclosure. Thus, the high correlations presented in Table 2.2 show
that the model provides a reasonably consistent interpretation of the processes
affecting plant growth rather than just the capacity to fit ‘n’ values with ‘n’
parameters.
Section 2 - A Model of Native Pasture Growth 29

Tab
le 2
.2
Com
paris
on o
f si
mul
ated
and
obs
erve
d pa
stur
e an
d so
il va
riabl
es f
or a
ll 17
9 si
te x
yea
r co
mbi
natio
ns o
f pa
stur
e ex
clos
ure
data
(O
ne s
ite/y
ear
was
acc
iden
tally
om
itted
in a
naly
sing
sta
ndin
g dr
y m
atte
r).
Reg
ress
ion
is f
or x
= o
bser
ved,
y =
si
mul
ated
. M
ean
erro
r is c
alcu
late
d as
the
aver
age
of th
e ab
solu
te v
alue
of o
bser
ved
less
sim
ulat
ed.
V
AR
IAB
LE
MEA
N
OB
SER
VED
M
EAN
SI
MU
LATE
D
NU
MB
ER O
F O
BS.
C
OR
REL
ATI
ON
(r
) SL
OPE
IN
TER
CEP
T M
EAN
ER
RO
R
Tot
al S
oilw
ater
(mm
) 15
9 15
5 72
8 0.
975
0.94
1 5.
6 15
.2
Stan
ding
Dry
Mat
ter
(kg/
ha)
1698
17
54
993
0.91
1 0.
949
143
357
% g
reen
cov
er
33
32
715
0.65
7 0.
669
10
14
N u
ptak
e kg
/ha
12
11
719
0.77
0 0.
625
4 4
% N
in d
ry m
atte
r 0.
84
0.83
70
4 0.
619
0.71
8 0.
2 0.
29
Stan
ding
dry
mat
ter
(log
tran
sfor
m)
7.02
7.
0499
30.
907
0.92
50.
50.
29
Stan
ding
dry
mat
ter
at e
nd
of a
utum
n (k
g/ha
) 24
76
2542
178
0.90
30.
934
230
445

Evaluating The Risk of Pasture and Land Degradation in Native Pastures in Queensland
Comparison with all measurements across all sites and in all seasons showed high
correlations with soil water and low absolute errors similar to sampling variation
(Table 2.2). Average absolute errors in simulated soil water by layer were 3 mm for
the 0-10 cm layer, and 9 mm for both the 10-50 cm layer and bottom layer (50 cm to
limit of grass roots). Overall the average error in total soil water was only 15mm
suggesting that the processes of flow between layers could be better modelled. The
lowest correlations were with observed green cover and N uptake and percent N in
dry matter (Table 2.2). The lower correlation in the green cover are to be expected as
most cases the values were visually estimated and, as yet, not all data has been
corrected for operator bias. In the case of N uptake, models of N decline after peak
yield have not yet been parameterised for each site, and hence, a substantial
improvement is expected.
For 89 site x year combinations, yields were available for both autumn and the
following winter/spring. In most cases, 80% of maximum observed yield had
occurred by the end of autumn, confirming that there are many limitations to growth
after this time (water, temperature, nutrients and phenological maturity). Thus, warm
season growth (spring to autumn) is the major determinant of feed availability for
year-round grazing (Figure 2.4).
The model simulated the above limitations to growth well and, when winter
detachment rates were included, simulated yields follow the seasonal pattern closely
(Table 2.2). The calibrated model accounted for 86% of the variation in the end of
autumn yield (Table 2.2, Figure 2.5) with an average error of 445 kg/ha or 18% of
mean yield for 178 site x year combinations.
Section 2 - A Model of Native Pasture Growth 31

Evaluating The Risk of Pasture and Land Degradation in Native Pastures in Queensland
Section 2 - A Model of Native Pasture Growth 32
Summer peak yield (kg/ha)
0 2000 4000 6000 8000 10000
Win
ter
peak
yie
ld (
kg/h
a)
0
2000
4000
6000
8000
10000
1:1
Figure 2.4 Comparison of peak yield measured in autumn with subsequent maximum yield occurring in winter/spring for the 89 native pasture exclosures in Queensland where measurements were available in both seasons.
Sources of variation in warm season pasture growth rate
From 179 site x year combinations available, a subset of 162 sites x year
combinations was selected to analyse sources of variation in warm season pasture
growth. Sites were rejected which:
1) did not have a similar measurement period (>100 days and < 1 year);
2) were not within a range of nitrogen uptake expected for native pastures
(Autumn N yield <35 kg/ha); and
3) had significant carry-over dry matter from the previous season.

Evaluating The Risk of Pasture and Land Degradation in Native Pastures in Queensland
Observed yield end of autumn (kg/ha)
0 2000 4000 6000 8000 10000
Sim
ulat
ed y
ield
(kg
/ha)
0
2000
4000
6000
8000
10000
1:1
Figure 2.5 Comparison between observed yield at the end of autumn and simulated yield from the model GRASP. The model was parameterised as described in the text with parameters calibrated using all pasture data (993 points). The autumn yields represent a subset of these data, and hence, are not independent of calibration procedure.
The basis for rejecting sites from this analysis could be refined in future studies, in
particular, to include only sites where parameters are well defined from field studies
(e.g. potential N uptake may not be attained in a dry year). This should serve to
reduce variability in some parameters. Four site/years were accidently omitted from
the analysis and these and more recently measured sites (since 1995) together with
sites from other states could be included in future studies.
Section 2 - A Model of Native Pasture Growth 33

Evaluating The Risk of Pasture and Land Degradation in Native Pastures in Queensland
Table 2.3 and Figure 2.6 show the correlation between measured pasture growth rate
(from spring to autumn) and various environmental variables. Soil variables (%
organic carbon, or available water range expressed as mm/10cm) accounted for only
8-19% of variation in measured pasture growth. Similarly, biological/soil variables
such as grass basal cover and potential N uptake accounted for a small proportion of
variation (8-10%). The major source of variation was rainfall (40%) with simulated
climatic indices accounting for higher proportions: simulated growth index, 46%, and
simulated evapo-transpiration, 60%. Simulated growth with the subjectively
calibrated model accounted for 80% of the variation in measured pasture growth
% Soil organic carbon (0-10cm)0 0.5 1 1.5 2 2.5 3
Gro
wth
rate
(kg/
ha/d
ay)
0
10
20
30
40
Available water range (mm/10cm)5 10 15 20 25 30 35 40
Gro
wth
rate
(kg/
ha/d
ay)
0
10
20
30
40
Rainfall (mm/day)0 1 2 3 4 5 6 7
Gro
wth
rate
(kg/
ha/d
ay)
0
10
20
30
40
Growth index0 0.2 0.4 0.6 0.8 1
Gro
wth
rate
(kg/
ha/d
ay)
0
10
20
30
40
Intercepted radiation (MJ/sqm/day)0 2 4 6 8 10 12 14
Gro
wth
rate
(kg/
ha/d
ay)
0
10
20
30
40
Evapo-transpiration (mm/ha/day)0 1 2 3 4 5
Gro
wth
rate
(kg/
ha/d
ay)
0
10
20
30
40
Figure 2.6 The relationship between measured pasture growth rate (from burning/mowing in spring to end of autumn) for 89 native pasture exclosures in Queensland (162 site x year combinations) and (1) % organic carbon 0-10cm; (2) soil available water range, mm/10cm for 0-50cm layer; (3) rainfall; (4) growth index (after Fitzpatrick and Nix 1970); (5) simulated radiation interception; and (6) simulated evapo-transpiration.
Section 2 - A Model of Native Pasture Growth 34
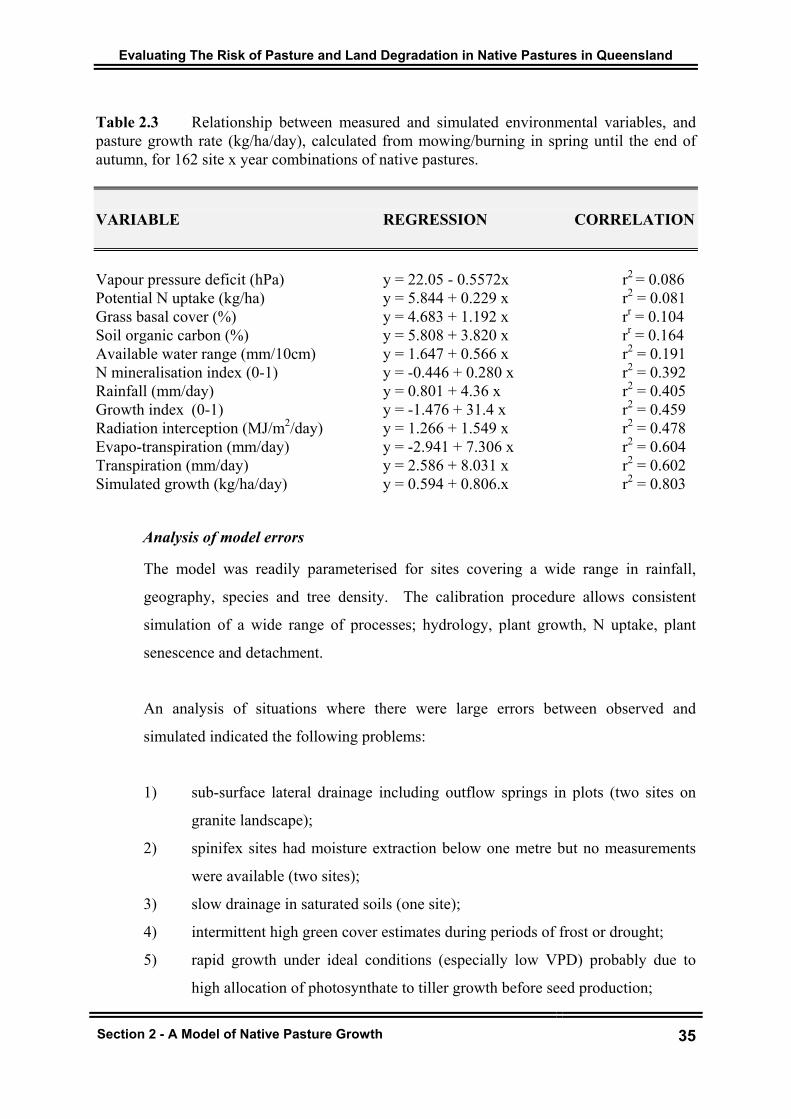
Evaluating The Risk of Pasture and Land Degradation in Native Pastures in Queensland
Table 2.3 Relationship between measured and simulated environmental variables, and pasture growth rate (kg/ha/day), calculated from mowing/burning in spring until the end of autumn, for 162 site x year combinations of native pastures. VARIABLE REGRESSION CORRELATION Vapour pressure deficit (hPa) y = 22.05 - 0.5572x r2 = 0.086 Potential N uptake (kg/ha) y = 5.844 + 0.229 x r2 = 0.081 Grass basal cover (%) y = 4.683 + 1.192 x rr = 0.104 Soil organic carbon (%) y = 5.808 + 3.820 x rr = 0.164 Available water range (mm/10cm) y = 1.647 + 0.566 x r2 = 0.191 N mineralisation index (0-1) y = -0.446 + 0.280 x r2 = 0.392 Rainfall (mm/day) y = 0.801 + 4.36 x r2 = 0.405 Growth index (0-1) y = -1.476 + 31.4 x r2 = 0.459 Radiation interception (MJ/m2/day) y = 1.266 + 1.549 x r2 = 0.478 Evapo-transpiration (mm/day) y = -2.941 + 7.306 x r2 = 0.604 Transpiration (mm/day) y = 2.586 + 8.031 x r2 = 0.602 Simulated growth (kg/ha/day) y = 0.594 + 0.806.x r2 = 0.803
Analysis of model errors
The model was readily parameterised for sites covering a wide range in rainfall,
geography, species and tree density. The calibration procedure allows consistent
simulation of a wide range of processes; hydrology, plant growth, N uptake, plant
senescence and detachment.
An analysis of situations where there were large errors between observed and
simulated indicated the following problems:
1) sub-surface lateral drainage including outflow springs in plots (two sites on
granite landscape);
2) spinifex sites had moisture extraction below one metre but no measurements
were available (two sites);
3) slow drainage in saturated soils (one site);
4) intermittent high green cover estimates during periods of frost or drought;
5) rapid growth under ideal conditions (especially low VPD) probably due to
high allocation of photosynthate to tiller growth before seed production;
Section 2 - A Model of Native Pasture Growth 35

Evaluating The Risk of Pasture and Land Degradation in Native Pastures in Queensland
6) low growth compared to model prediction under ‘ideal’ growth conditions
possibly due to phenological maturity or limitations imposed by previous heat
stress on tiller bud number (Brian Pastures in 1993/94);
7) rapid initial growth following drought conditions, probably due to high
nitrogen availability and seedling establishment (Indian couch site);
8) rapid senescence and detachment of early flowering grass (Queensland blue
grass and Indian couch) during growing season; and
9) possible re-greening of stem tissue due to winter rainfall and mild
temperatures (Mitchell grass site at Biddenham).
Modification of the generic model to account for these individual site, year or species
effects has not be attempted. Most errors occurred under conditions of above average
rainfall, and hence, are likely to have less impact on simulation of drought effects
2.5 MODEL VALIDATION
The major objective in developing the model GRASP and field methodology was to
design a model which could simulate year-to-year variation in pasture growth with a
constant set of parameters which were derived from field measurements.
Only a limited number of sets of exclosure data are available which have more than
five years of observations. Most of the 179 combinations of sites and years included
only two to three years at one site. A major problem was that exclusion of grazing
changed botanical composition. Section 3 deals with model evaluation for grazing
trials run over five to ten years.
Section 2 - A Model of Native Pasture Growth 36
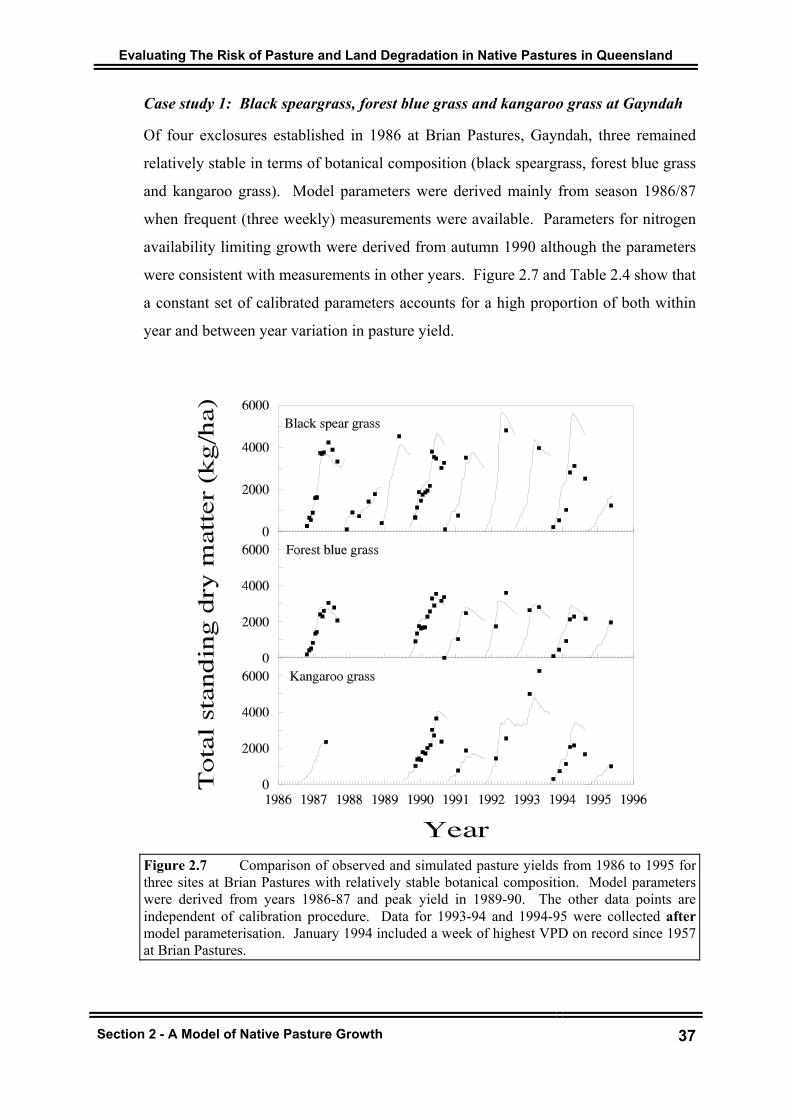
Evaluating The Risk of Pasture and Land Degradation in Native Pastures in Queensland
Case study 1: Black speargrass, forest blue grass and kangaroo grass at Gayndah
Of four exclosures established in 1986 at Brian Pastures, Gayndah, three remained
relatively stable in terms of botanical composition (black speargrass, forest blue grass
and kangaroo grass). Model parameters were derived mainly from season 1986/87
when frequent (three weekly) measurements were available. Parameters for nitrogen
availability limiting growth were derived from autumn 1990 although the parameters
were consistent with measurements in other years. Figure 2.7 and Table 2.4 show that
a constant set of calibrated parameters accounts for a high proportion of both within
year and between year variation in pasture yield.
Figure 2.7 Comparison of observed and simulated pasture yields from 1986 to 1995 for three sites at Brian Pastures with relatively stable botanical composition. Model parameters were derived from years 1986-87 and peak yield in 1989-90. The other data points are independent of calibration procedure. Data for 1993-94 and 1994-95 were collected after model parameterisation. January 1994 included a week of highest VPD on record since 1957 at Brian Pastures.
Section 2 - A Model of Native Pasture Growth 37

Tab
le 2
.4
Com
paris
on o
f obs
erve
d an
d si
mul
ated
pas
ture
yie
lds f
or fi
ve si
tes w
ith o
ver f
ive
year
s dat
a at
Bria
n Pa
stur
es, G
aynd
ah.
SI
TE
M
EA
N
OB
SER
VE
D
ME
AN
SI
MU
LA
TE
D
NO
. OF
OB
S C
OR
RE
LA
TIO
N
(r)
SLO
PE
INT
ER
CE
PT
ME
AN
E
RR
OR
R
AN
GE
O
BSE
RV
ED
R
AN
GE
SI
MU
LA
TE
D
Bla
ck sp
earg
rass
mow
n th
ree
wee
kly
1964
-70
700
778
320.
892
1.35
-166
253
155-
1475
136-
2040
Bla
ck sp
earg
rass
mow
n si
x w
eekl
y
1964
-70
976
959
200.
973
1.15
-160
170
209-
2214
177-
2446
Bla
ck sp
earg
rass
burn
t ann
ually
1986
-95
2018
22
9647
0.90
81.
0125
445
620
0-47
9910
5-55
30
Fore
st b
lue
gras
s
burn
t ann
ually
1986
-95
1957
20
8738
0.93
60.
8346
430
893
-360
216
9-33
30
Kan
garo
o gr
ass
burn
t ann
ually
1986
-95
2068
21
7226
0.84
90.
7562
445
729
7-62
781
174-
4422
1
Past
ure
was
not
bur
nt in
199
2, a
nd h
ence
, 6 2
78 k
g/ha
is th
e ac
cum
ulat
ion
of tw
o ye
ars o
f gro
wth
(Fig
ure
2.7)
.

Evaluating The Risk of Pasture and Land Degradation in Native Pastures in Queensland
Case study two - Black speargrass defoliation trial 1963-1970 (Scattini 1981)
Plots of black speargrass and other species were mown every three or six weeks each
summer from 1963 to 1970 (Scattini 1981). Yields after mowing were measured or
estimated and, in the simulation, the model’s starting yield was reset at each mowing
to these values. The good agreement between observed and simulated (Figures 2.8
and 2.9) for both cutting regimes indicates that the model simulates yield over a wide
range in seasonal rainfall and defoliation intensities.
Figure 2.8 Time series comparison of observed and simulated pasture yields for black speargrass defoliation trial (Scattini 1981). Swards were mown either three weekly or six weekly during the growing season.
Of particular importance is the successful independent validation of the model at the
three sites in 1994/95 (black speargrass, forest blue grass and kangaroo grass). These
sites had relatively constant botanical composition for the period 1986-1995, and
Section 2 - A Model of Native Pasture Growth 39

Evaluating The Risk of Pasture and Land Degradation in Native Pastures in Queensland
model parameters, especially those related to drought, were derived in the 1986/87
season. However, observed production at other sites (Ladies Mile and Lena) was
over-estimated by 50%. These sites had substantial changes in botanical composition
after exclosure. The over-estimates of growth in 1994/95 suggests that parameters for
potential regrowth rate and transpiration-use-efficiency were too high. This may
result from either increased growth rate due to invading species using resources of
nitrogen and water not used by existing species, or over-estimation of growth
parameters during calibration for the favourable season of 1989/90. During this
season rapid tiller elongation occurred in autumn (Figure 2.7) and may have
contributed to over-estimation of growth parameters.
Figure 2.9 Comparison of observed and simulated pasture yields for black speargrass defoliation trial (Scattini 1981). Swards were mown either three weekly or 6six weekly during the growing season.
Section 2 - A Model of Native Pasture Growth 40

Evaluating The Risk of Pasture and Land Degradation in Native Pastures in Queensland
Simulation of year-to-year variation in growth
The exclosure data set used in model development also allows some assessment of the ability
of the model to simulate year-to-year variation. For those sites where there were
measurements in several years the model was compared for first year (Figure 2.10a) and
subsequent years (Figure 2.10b). Model calibration was strongly weighted to the use of first
year data including every 3-6 weekly harvests. Not surprisingly a high proportion of peak
yield variation (r2 =0 92) was explained. Data from subsequent years were used sparingly in
calibration although in some cases, parameters such as critical %N and soil water attributes
have been more correctly derived from these years. In these subsequent years, the model
performed well under low growth conditions with most of the errors being associated with
high growth conditions (Figure 2.10b). The success of the model in these subsequent years
(r2 =0 72) provides only a partial validation since we emphasise that these data are not
completely independent of the calibration procedure. The errors under high growth
conditions suggest that a better model will be required of leaf/stem partitioning, and hence, a
variable critical % N for sward growth.
Figure 2.10a (left) & Figure 2.10b (right) Simulation of observed year-to-year variation in peak autumn yield in exclosures for the first (Figure 2.10a) and subsequent (Figure2.10b) years of measurement.
Section 2 - A Model of Native Pasture Growth 41

Evaluating The Risk of Pasture and Land Degradation in Native Pastures in Queensland
2.6 SUMMARY: EVALUATION OF THE MODEL ON NON-GRAZED PASTURE
In evaluating the model’s capability we have found:
1) the model was readily parameterised from data measured at each site;
2) there were no simple soil measurements which could be used to predict
parameters accurately indicating strong species x soil interactions;
3) the major sources of variation in calibrated transpiration-use-efficiency were
species suggesting variation in root/shoot partitioning;
4) the model accurately represented the major effect of tree competition for
water. Future improvement should also include competition for nutrients
(Table 3.7, Scanlan and McKeon 1993);
5) constant model parameters were relatively successful in simulating pasture
yield in below average seasons for sites with stable pasture composition;
6) care has to be taken when parameterising the growth model using data from
the ‘grand phase’ of plant growth, i.e. rapid tiller elongation just prior to seed
production. It is likely that this period involves a major change to root/shoot
partitioning of growth and growth parameters. Transpiration-use-efficiency
derived from these periods is likely to over-estimate growth at other times;
and
7) as yet we have not developed a simple approach to modelling the variety of
phenological responses that occur in a sward. In swards which are
monospecific due to management, e.g. regularly burnt black speargrass, the
phenological development of individual species has a much larger impact on
pasture growth and has proved a major source of error in modelling.
2.7 ANALYSIS OF GROWTH PARAMETERS
The model was parameterised for all available pasture exclosure data resulting in 84
different parameter sets. The 84 parameter sets described for each site both soil and
plant parameters which were either measured (e.g. minimum soil water) or calibrated
(e.g. transpiration-use-efficiency). The 84 parameter sets were classified by a range
of attributes to examine variation in the major plant growth parameters as follows:
Section 2 - A Model of Native Pasture Growth 42

Evaluating The Risk of Pasture and Land Degradation in Native Pastures in Queensland
1) pasture community either based on Tothill and Gillies (1992) or Weston et al.
(1981);
2) dominant grass species in sward;
3) photosynthetic pathway including C3 and C4 variants, NADP-ME, NAD-ME
and PCK (Hattersley and Watson 1992);
4) growth habit of dominant species (erect, prostrate or clumped);
5) plant size either as % basal cover per kg of yield (<1% per t/ha; 1-2% per t/ha
or > 2% per t/ha), or assessed subjectively as small; medium; or large biomass
per tussock; and
6) plant available water range expressed as mm of available water per 10cm of
depth averaged over top 50 cm (<13mm/10cm, 13 to 17mm/10cm, or
>17mm/10cm).
From one-way Analysis of Variance, the statistical significance of variation between
groups means is shown for each parameter in Table 2.5.
Pasture community and species had a strong effect on all important parameters with
differences between groups being statistically significant (Table 2.5). Photosynthetic
pathway had significant effects on all important parameters except potential regrowth
rate and potential regrowth rate per unit basal area. Although growth habit
(subjectively classified) had significant effects on all important parameters except
potential regrowth rate and potential regrowth rate per unit basal area, more
quantitative measures of growth habit, i.e. tussock size and basal cover per yield had
significant effects on fewer parameters. Measured soil attributes had a significant
effect on only one parameter, viz. the soil water at which growth stops.
The 84 parameter sets provide the opportunity to summarise average plant parameters
for a pasture community or for a species. At this stage it is not possible to determine
which approach (community or species) is best for spatial modelling because, at a
pasture community level, measured differences in growth parameters of species are
averaged, eg. Wandera (1993). Alternatively, species parameters have been derived
from so few sites that soil x species effects are difficult to determined.
Section 2 - A Model of Native Pasture Growth 43

Tab
le 2
.5
Stat
istic
al si
gnifi
canc
e of
diff
eren
t cla
ssifi
catio
n gr
oups
(e.g
. spe
cies
, pas
ture
com
mun
ities
) on
swar
d gr
owth
par
amet
ers.
TU
E (k
g/ha
/mm
T
rans
pira
tion-
use-
ef
ficie
ncy
(kg/
ha/m
m a
t 20
hPa)
Pote
ntia
l N u
ptak
e (k
g N
/ha)
Sw
ard
pote
ntia
l re
grow
th
(kg/
ha/d
ay)
Pote
ntia
l reg
row
th p
er
unit
basa
l cov
er
(kg/
ha/d
ay)
Soil
wat
er in
dex
at
whi
ch g
row
th st
ops
Past
ure
Com
mun
ity:
Wes
ton
et a
l. (1
981)
To
thill
& G
illie
s (19
92)
**
* **
*
**
* **
*
**
* **
*
**
* **
*
**
* **
D
omin
ant S
peci
es
Phot
osyn
thet
ic p
athw
ay
Gro
wth
hab
it Tu
ssoc
k si
ze
Bas
al c
over
/yie
ld
**
**
***
NS
NS
**
***
*** * NS
**
NS
NS
NS
NS
***
NS
NS
NS
NS
***
**
*** * *
Plan
t ava
ilabl
e w
ater
rang
e N
S N
S N
S N
S *
* m
eans
gro
up e
ffec
t is s
igni
fican
t at P
<0.0
5 **
m
eans
gro
up e
ffec
t is s
igni
fican
t at P
<0.0
1 **
* m
eans
gro
up e
ffec
t is s
igni
fican
t at P
<0.0
01
Evaluating The Risk of Pasture and Land Degradation in Native Pastures in Queensland
Transpiration-use-efficiency (TUE)
Table 2.6 shows the comparison between sward TUE averaged either for species or
for pasture communities. There were large differences between communities ranging
from 7 kg/ha/mm for mulga to 20-25 kg/ha/mm for Mitchell grass and brigalow lands.
Species TUE had less variation ranging from 7 to 18.5 kg/ha/mm. Other possible
sources of variability yet to be examined are:
1) soil structural attributes;
2) site variation in humidity;
3) “rare” phenological effects on TUE, e.g. rapid stem elongation during a warm
autumn in 1990 or the effect of the January 1994 heat wave; and
4) the impact of other species in the sward on sward TUE.
The effect of soil fertility on transpiration-use-efficiency is highlighted by the results
for Cenchrus ciliaris (buffel grass) which has low TUE (5 kg/ha/mm) in the Aristida-
Bothriochloa lands and high TUE (26 kg/ha/mm) in the brigalow lands. However, an
analysis of TUE for black speargrass sites did not show any relationship with
measured soil attributes. Furthermore, on the same soil types, both Wandera (1993)
and McIvor et al. (1995) measured species differences on plant growth. Thus, the
resolution of soil and species effects will require further field work and analysis. The
spatial model described later in the chapter uses pasture community as a basis to
estimate TUE for each 5 km x 5 km pixel.
Potential nitrogen uptake
Potential nitrogen uptake (kg N/ha) was estimated for each site although not all sites
had received sufficient rainfall for nutrient limitations to be fully expressed.
Nevertheless, potential N uptakes (Table 2.7) were lower for those species associated
with poor pasture condition, e.g. Aristida spp. and Chrysopogon fallax, supporting the
findings of McIvor et al. (1995). The potential fertility of brigalow lands was twice
that of other grasslands (Table 2.7).
Section 2 - A Model of Native Pasture Growth 45

Tab
le 2
.6
Tran
spira
tion-
use-
effic
ienc
y (T
UE)
of p
astu
re s
peci
es a
nd p
astu
re c
omm
uniti
es.
Tran
spira
tion-
use-
effic
ienc
y w
as c
alib
rate
d fo
r ea
ch si
te a
nd e
xpre
ssed
at a
stan
dard
VPD
(20h
Pa).
SP
EC
IES
NO
. OF
SIT
ES
TE
C
OM
MU
NIT
Y
NO
. OF
SIT
ES
TE
Het
erop
ogon
con
tort
us 1
28
11.4
B
lack
spea
rgra
sscd
5011
.4d
Both
rioc
hloa
bla
dhii
7
12.3
bcd
Aris
tida-
Both
rioc
hloa
11
12.3
cd
Both
rioc
hloa
per
tusa
4
10
.0cd
Chr
ysop
ogan
falla
x 1
4
10.5
cd
Ar
istid
a sp
p.2
4
14.1
abc
Bo
thri
ochl
oa e
war
tiana
4
15
.8ab
c
Dic
anth
ium
seri
ceum
1
4
14.5
Q
ueen
slan
d B
lue
Gra
ss
ab
316
.7bc
C
ench
rus c
iliar
is 3
9
17.0
G
idge
eab
B
rigal
ow
2 5 16
.0
25.4
a As
treb
la sp
p.
6
18
.5a
Mitc
hell
Gra
ss5
19.8
b M
ulga
C3 g
rass
es
5
7.2
d M
ulga
land
s 5
7.2
e a,
b,c,
d,e:
val
ues w
ith sa
me
lette
r are
not
sign
ifica
ntly
diff
eren
t at P
<0.0
5 1 O
ne si
te in
Ari
stid
a-Bo
thri
ochl
oa c
omm
unity
2 T
wo
site
s in
Aris
tida-
Both
rioc
hloa
com
mun
ity
3 Thr
ee si
tes i
n Ar
istid
a-Bo
thri
ochl
oa, f
our i
n B
rigal
ow, t
wo
in g
idge
e

Tab
le 2
.7
Past
ure
grow
th p
aram
eter
s fo
r G
RA
SP d
eriv
ed f
rom
cal
ibra
tion
with
exc
losu
re d
ata
grou
ped
by d
omin
ant
spec
ies
or p
astu
re
com
mun
ity
Spec
ies
Pote
ntia
l N
upt
ake
Swar
d Po
tent
ial R
egro
wth
So
il w
ater
inde
x at
w
hich
gro
wth
stop
s
(kg
N/h
a)
(kg/
ha/d
ay)
(kg/
ha/d
ay p
er %
ba
sal c
over
) (0
-1)
Het
erop
ogon
con
tort
us
21 bc
16b
2.9
c.2
4bc
d Bo
thri
ochl
oa b
ladh
ii 23
bc
14
b2.
4c
.31
abc
Both
rioc
hloa
per
tusa
27
ab
30a
5.8
ab.2
5ab
cd
Chr
ysop
ogan
falla
x 14
cd
7
b2.
0c
.03
e Ar
istid
a sp
p.
13 d
11b
3.2
bc.1
8cd
e Bo
thri
ochl
oa e
war
tiana
19
bcd
17
ab4.
7ac
.20
bcde
D
ican
thum
seri
ceum
19
bcd
11b
2.0
c 0.
35 ab
C
ench
rus c
iliar
is
31 a
30
a6.
4a
.17
de
Astr
ebla
spp.
23
b
21ab
4.2
bc.3
1ab
c M
ulga
C3 g
rass
es
16 cd
8
b3.
2bc
.40
a
C
omm
unity
Po
tent
ial
N u
ptak
e Sw
ard
Pote
ntia
l Reg
row
th
Soil
wat
er in
dex
at
whi
ch g
row
th st
ops
(k
g N
/ha)
(k
g/ha
/day
) (k
g/ha
/day
per
%
basa
l cov
er)
(0-1
)
Bla
ck sp
earg
rass
20
b
15b
2.9
c.2
6sb
c Ar
istid
a-Bo
thri
ochl
oa
21 b
5.
2b
.13
d Q
ueen
slan
d B
lue
Gra
ss
18 b
13
b2.
0c
.40
a B
rigal
ow
43 a
42
a10
.4a
.20
bcd
Mitc
hell
Gra
ss
24 b
21b
4.0
bc.2
9sb
M
ulga
land
s 16
b
8
b3.
2hc
.40
a a,
b,c,
d: v
alue
s with
the
sam
e le
tter a
re n
ot si
gnifi
cant
ly d
iffer
ent a
t P<0
.05
Evaluating The Risk of Pasture and Land Degradation in Native Pastures in Queensland
Sward potential regrowth rate
Sward potential regrowth (kg/ha/day) was calibrated from yield measured early in the
growing season. During this phase, growth is mainly simulated by the equation:
growth = grass basal cover*potential regrowth rate*growth_index.
The combined variable of grass basal cover multiplied by potential regrowth rate is
termed Sward Potential Regrowth (SPR). Species-averaged SPR (Table 2.7) was
significantly (p<0.001) correlated with potential N uptake (PNU); SPG = -10.9 + 1.33
* PNU (n = 10, r2 =0.83). Sward potential regrowths were variable, and hence, only
the main effects of fertility (brigalow lands) and stoloniferous species (Bothriochloa
pertusa) were significant. When potential growth per unit of grass basal cover was
calculated the above differences were also significant (Table 2.7). The two
communities black speargrass and Aristida-Bothriochloa (AB) had similar sward
potential regrowths (15-17 kg/ha/day). However, when expressed per unit of percent
grass basal cover, the AB community had significantly higher potential regrowth
rates suggesting that some compensation for lower grass basal cover occurs by
increasing regrowth per plant.
Soil Properties
Soil properties such as % organic carbon, nitrogen, phosphorus, pH, soil moisture at
15 bars and particle size distribution were measured at each site in 1994. There were
no major correlations (Table 2.8) between measured soil properties and the model
parameters, transpiration-use-efficiency, potential N uptake, and sward potential
regrowth rate suggesting that the interaction between species and soils is a major
source of variation.
Section 2 - A Model of Native Pasture Growth 48

Tab
le 2
.8
Cor
rela
tion
(r)
betw
een
bulk
sur
face
(0-
10cm
) so
il an
alys
es a
nd G
RA
SP p
aram
eter
s. C
orre
latio
ns a
re b
ased
on
94 s
ites
exce
pt
parti
cle
size
ana
lyse
s ba
sed
on 8
2 si
tes
(cor
rela
tions
gre
ater
tha
n 0.
21 a
re s
igni
fican
t at
P<0
.05)
and
Tot
al P
,K &
S b
ased
on
53 s
ites
(cor
rela
tions
> 0
.27
are
sign
ifica
nt a
t P<0
.05)
.
A
naly
sis
M
etho
d T
rans
pira
tion
-use
-eff
icie
ncy
(kg/
ha/m
m) a
t V
PD=
20hP
a
Pote
ntia
l N
upta
ke
(kg/
ha/d
ay)
Swar
d po
tent
ial
regr
owth
(k
g/.h
a/da
y)
Pote
ntia
l re
grow
th p
er
unit
basa
l co
ver
(kg/
ha/d
ay)
Soil
wat
er
inde
x at
w
hich
pla
nt
grow
th st
ops
pH (H
20)
20:1
00, S
oil:H
20
0.57
0.
34
0.45
0.
26
-0.0
7 El
ectri
cal C
ondu
ctiv
ity
20:1
00, S
oil:H
20
0.
580.
460.
310.
270.
05C
hlor
ide
(C1)
ext
ract
able
20
:100
, Soi
l:H20
-0
.03
0.12
-0
.10
-0.1
1 0.
07
Nitr
ate/
Nitr
ogen
(N) e
xt.
20:1
00, S
oil:H
20
0.08
-0
.04
-0.0
3 -0
.07
0.15
Ph
orph
orus
(P) b
icar
b ex
t 1:
100,
Soi
l:0.5
M N
aHC
03 C
olw
ell
0.14
0.
22
0.14
0.
04
0.10
Ph
orph
orus
(P) a
cid
ext.
1:20
0, S
oil:0
.005
M H
2S04
(BSE
S)
0.07
0.
01
0.03
-0
.04
0.02
Po
tass
ium
(K) r
epla
ceab
le
5.20
0, S
oil:0
.05M
HC
1
0.
32
0.36
0.20
0.16
0.14
Sulp
hur (
S) e
xtra
ctab
le
20:1
00, S
oil:0
.01M
CaH
P04
0.
040.
03-0
.22
-0.0
70.
44C
alci
um (C
a) p
H 7
.0
5:10
0, S
oil:1
M N
H4C
I @ p
H 7
.0
0.56
0.
35
0.23
0.
13
0.22
M
agne
sium
(Mg)
pH
7.0
5:
100,
Soi
l:1M
NH
4C1
@ p
H 7
.0
0.20
0.
10
-0.0
9 -0
.18
0.34
So
dium
(Na)
pH
7.0
5:
100,
Soi
l:1M
NH
4C1
@ p
H 7
.0
0.22
0.
08
0.09
-0
.00
0.20
2 Po
tass
ium
(K) p
H 7
.0
5:10
0, S
oil:1
M N
H4C
1 @
pH
7.0
0.
27
0.25
0.
11
0.19
0.
39
ECEC
Ex
chan
geab
le (C
a+M
g+N
a+K
)
0.46
0.28
0.12
0.02
0.29
Org
anic
Car
bon
(OC
) W
alkl
ey &
Bla
ck
0.26
0.
37
0.09
-0
.03
0.30
To
tal N
itrog
en (N
) K
held
ahl d
iges
t 0.
36
0.48
0.
16
0.11
0.
25
Air
dry
moi
stur
e co
nten
t A
ir D
ry M
oist
ure
cont
ent
0.39
0.
27
0.10
0.
01
0.33
PS
A-C
oars
e sa
nd fr
actio
n gr
avim
etric
-0
.15
-0.3
8 -0
.09
-0.0
2 -0
.12
PSA
-Fin
e sa
nd fr
actio
n gr
avim
etric
-0
.26
0.05
-0
.09
-0.0
2 -0
.12
PSA
-Silt
frac
tion
hydr
omet
er
0.06
0.
08
-0.1
6 -0
.24
-0.3
8 PS
A-C
lay
frac
tion
hydr
omet
er0.
360.
390.
150.
110.
36M
oist
ure
Con
t. @
150
0 K
pa
pres
sure
pla
te
0.32
0.
23
0.03
-0
.06
0.37
To
tal p
hosp
horu
s (P)
pr
esse
d po
wde
r, X
RF
0.29
0.
43
0.40
0.
42
0.37
To
tal p
otas
sium
(K)
pres
sed
pow
der,
XR
F -0
.05
-0.0
1 0.
04
-0.0
6 -0
.04
Tota
l sul
phur
(S)
pres
sed
pow
der,
XR
F 0.
48
0.54
0.
31
0.34
0.
15
.

Evaluating The Risk of Pasture and Land Degradation in Native Pastures in Queensland
Photosynthetic Pathway
An alternative approach to examining differences in growth parameters between
species is to consider lumping of physiological types based on alternative
photosynthetic pathways i.e. C3, C4 NADP-ME, C4 NAD-ME and C4 PCK and other
sub categories (Hattersley and Watson 1992).
Whilst such an approach shows statistical differences between groups (Table 2.9) the
representation of type is biased by either a single species (e.g. Astrebla spp. as the
sole representative of NAD-ME on our data set) or soils (C3 and NAD-ME Triodia
type occur on low P soils).
2.8 EFFECT OF PREVIOUS GRAZING ON PLANT GROWTH PARAMETERS
Of major importance for calculating the risks of degradation is the effect of grazing
on plant growth parameters. Excluding grazing allows some of the previous grazing
effects to be immediately reduced. Hence, even the data collected in the first year of
exclosure of previously heavily grazed pastures does not necessarily provide correct
estimates of plant growth parameters to be used in simulating grazed pastures.
Nevertheless, the calibration of the model across years indicated some change in the
following parameters:
soil moisture content at which growth stops. Previously grazed swards were found to
be more sensitive to soil moisture deficit; and
yield-height and yield-cover relationships. Swards of black speargrass were more
prostrate and had higher cover for the same yield compared to swards which had not
been grazed.
Section 2 - A Model of Native Pasture Growth 50

Tab
le 2
.9
Past
ure
grow
th p
aram
eter
s for
GR
ASP
der
ived
from
cal
ibra
tion
with
exc
losu
re d
ata
grou
ped
by p
hoto
synt
hetic
pat
hway
.
Phot
osyn
thet
ic
Path
way
Sp
ecie
s T
rans
pira
tion
-use
-ef
ficie
ncy
(kg/
ha/m
m)
at
VPD
= 20
hPa
Pote
ntia
l N
upta
ke
(kg/
ha)
Swar
d po
tent
ial
regr
owth
(k
g/ha
/day
)
Pote
ntia
l re
grow
th p
er
unit
basa
l co
ver
(kg/
ha/d
ay)
Soil
wat
er
inde
x at
w
hich
pla
nt
grow
th st
ops
C3
Mon
ocha
ther
par
adox
a Th
yrid
olep
is m
itche
llian
a 7.
2 d
16
bc8
3.2
b.4
0a
NA
DP-
ME
Cen
chru
s cili
aris
D
ican
thiu
m sp
p.
Het
erop
ogan
con
tort
us
Both
rioc
hloa
spp.
C
hrys
opog
on fa
llax
Them
eda
tria
ndra
12.6
bc
22
ab17
3.5
b.2
4b
NA
DP-
ME
(Ari
stid
a ty
pe)
Aris
tida
spp.
14
.1 ab
c
13
c11
3.2
b.1
8bc
N
AD
-ME
Astr
ebla
spp.
18
.5 a
23ab
214.
2ab
.31
ab
NA
D-M
E (T
riod
ia ty
pe)
Trio
dia
spp.
7.
0 d
7
c13
4.5
ab.0
1c
PCK
U
roch
loa
spp.
En
neap
ogon
spp.
Pa
nicu
m m
axim
um
Chl
oris
gay
ana
15.5
ab
29a
247.
4a
.25
ab
a,b,
c,d:
val
ues f
ollo
wed
by
the
sam
e le
tter a
re n
ot si
gnifi
cant
ly d
iffer
ent a
t P<0
.05

Evaluating The Risk of Pasture and Land Degradation in Native Pastures in Queensland
Different grazing pressures result in large variation in species composition. Species,
although growing in essentially the same soil/climate environment, have large
differences in flowering time, dry matter production and N uptake. (Ash and McIvor
1995, Wandera 1993). Previously published work indicates a variety of growth
responses to grazing. The most important responses were reduced yield and nutrient
uptake (McIvor et al. 1995a, Wandera 1993), earlier flowering time and a greater
percentage of annuals in the sward. These responses can be simulated by reducing
potential N uptake for grazed swards.
Examination of growth parameters for swards which were nearly monospecific
showed large differences between species regarded as representing degraded
condition, e.g. Aristida spp. and Chrysopogon fallax. For example, Aristida ramosa
at Brian Pastures has high above-ground growth probably due to partitioning of
growth to shoots rather than roots. In contrast, Chrysopogon fallax and Aristida spp.
dominated patches at Narayen had low above-ground production. Thus, different
species attributes can have considerable impact on growth parameters independent of
the ranking of the desirability of the species (Section 1, Wandera 1993), and hence, it
is difficult to generalise on parameters which would represent a given pasture
condition class. However, the methodology and modelling procedure described
above demonstrated that these species attributes can be parameterised and pasture
growth simulated for a given botanical composition.
Section 2 - A Model of Native Pasture Growth 52

Evaluating The Risk of Pasture and Land Degradation in Native Pastures in Queensland
SECTION 3 - MODELLING GRAZED PASTURES
3.1 INTRODUCTION
In this section we describe:
(1) data sources available for modelling grazed pastures;
(2) model development and parameters to model animal consumption, trampling;
natural detachment and decomposition;
(3) parameterisation of the model for eleven native pasture grazing trials;
(4) model development of grass basal cover of desirable perennial grasses; and
(5) calculation of the effect of stocking rate on utilisation rates and animal
production.
3.2 DATA SOURCES FOR GRAZED PASTURES
Assessment of risks of degradation requires simulation of grazed pasture using long
(30-100 years) time series of climatic data. Validation of the model GRASP for time
series of exclosure data (burnt or mown each year) was demonstrated in Section 2.
However, the simulation of grazed pastures requires models of the other dry matter
flow processes: consumption by animals; detachment; trampling; and litter
breakdown. Few of these process have been measured independently, and hence,
pasture yields are the primary source of data.
The potential sources of pasture yield data from grazed pastures include:
1) grazing trials with regular (seasonal/yearly) measurement of pasture yield;
2) remote sensing indices such as NDVI;
3) stock inspector or other governmental reports, e.g. drought declaration
reports;
4) graziers’ diaries and observations; and
5) photographic time-series.
Section 3 - Modelling Grazed Pastures 53
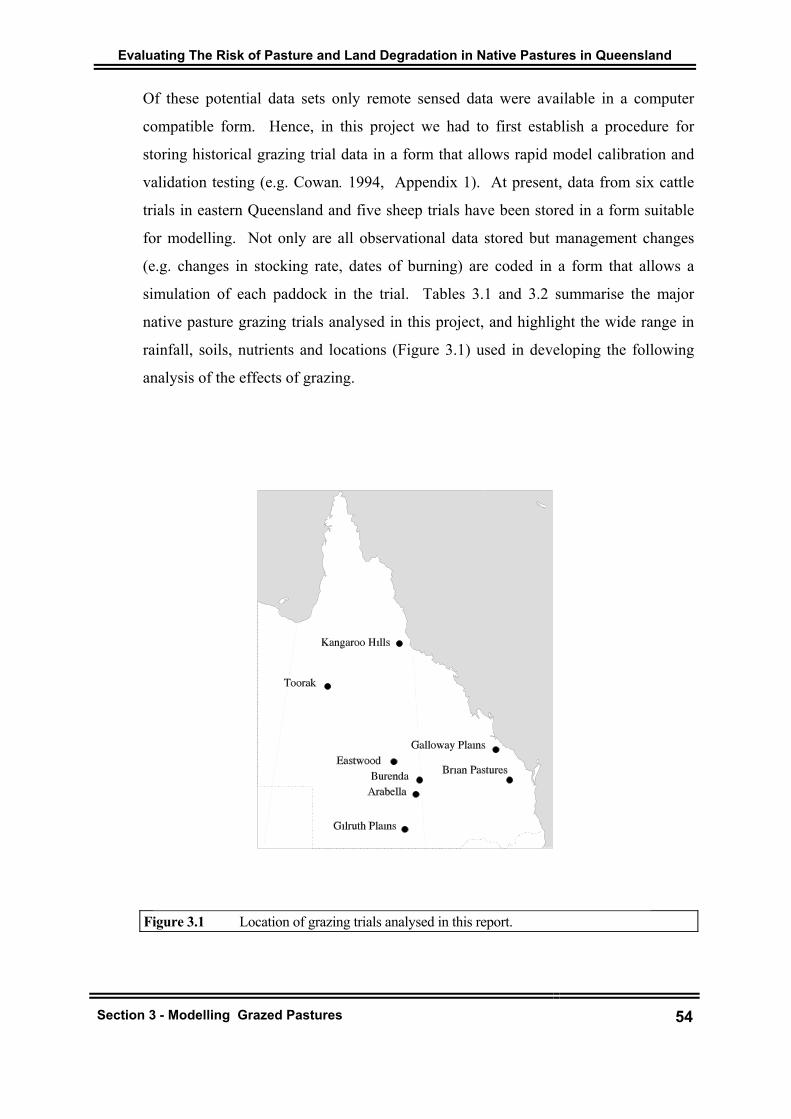
Evaluating The Risk of Pasture and Land Degradation in Native Pastures in Queensland
Section 3 - Modelling Grazed Pastures 54
Of these potential data sets only remote sensed data were available in a computer
compatible form. Hence, in this project we had to first establish a procedure for
storing historical grazing trial data in a form that allows rapid model calibration and
validation testing (e.g. Cowan. 1994, Appendix 1). At present, data from six cattle
trials in eastern Queensland and five sheep trials have been stored in a form suitable
for modelling. Not only are all observational data stored but management changes
(e.g. changes in stocking rate, dates of burning) are coded in a form that allows a
simulation of each paddock in the trial. Tables 3.1 and 3.2 summarise the major
native pasture grazing trials analysed in this project, and highlight the wide range in
rainfall, soils, nutrients and locations (Figure 3.1) used in developing the following
analysis of the effects of grazing.
Figure 3.1 Location of grazing trials analysed in this report.

Evaluating The Risk of Pasture and Land Degradation in Native Pastures in Queensland
Section 3 - Modelling Grazed Pastures 55
Table 3.1 Grazing trials in eastern Queensland simulated with GRASP model.
GRAZING TRIAL
NEAREST TOWN
PASTURE COMMUNITY
YEARS TREATMENTS
Brian Pastures
P55-1
Gayndah southern black speargrass (cleared)
1961-1970 three stocking rates in summer-autumn
Brian Pastures
P55-2
Gayndah southern black speargrass (cleared)
1970-1979 three stocking rates in either summer-autumn or winter-spring
Brian Pastures
P55-3
Gayndah southern black speargrass (cleared)
1980-1984 as above in P55-2 with/or without burning in spring
Ladies Mile Gayndah southern black speargrass (cleared)
1989-1994 five periods of deferring grazing
Galloway Plains
Calliope central black speargrass (cleared)
1988-1995 six stocking rates
Kangaroo Hills Seaview Range (W of Ingham)
northern black speargrass (oversown with Townsville stylo)
1965-1975 two stocking rates with or without clearing and phosphorus
Table 3.2 Grazing trials in western Queensland simulated with GRASP model.
LOCATION NEAREST TOWN
PASTURE COMMUNITY
YEARS TREATMENTS
Toorak Julia Creek Mitchell grass 1985-1995 five levels of utilisation*
Eastwood Blackall buffel grass 1967-1983 three to four constant stocking rates
Burenda Augathella Mitchell grass 1976-1989 five levels of utilisation
Arabella Charleville Mulga pastures 1977-1986 four levels of utilisation
Gilruth Plains Cunnamulla Mitchell grass flood plains
1941-1954 three constant stocking rates
* Utilisation levels were treatments where stocking rate was changed each year at end of growing season to consume a proportion of standing pasture yield over next 12 months. Utilisation levels were constant for each paddock (e.g. 10, 20, 30, 50, 80 % of standing pasture yield.
We are extremely grateful to our colleagues and funding agencies who have allowed
access to the unpublished data from these grazing trials. Such an analysis could only
occur with the generous scientific spirit of those involved in data sharing. As will be
described in Section 4 this ethos of information sharing and interpretation through
models is as relevant to graziers as it is to scientists.
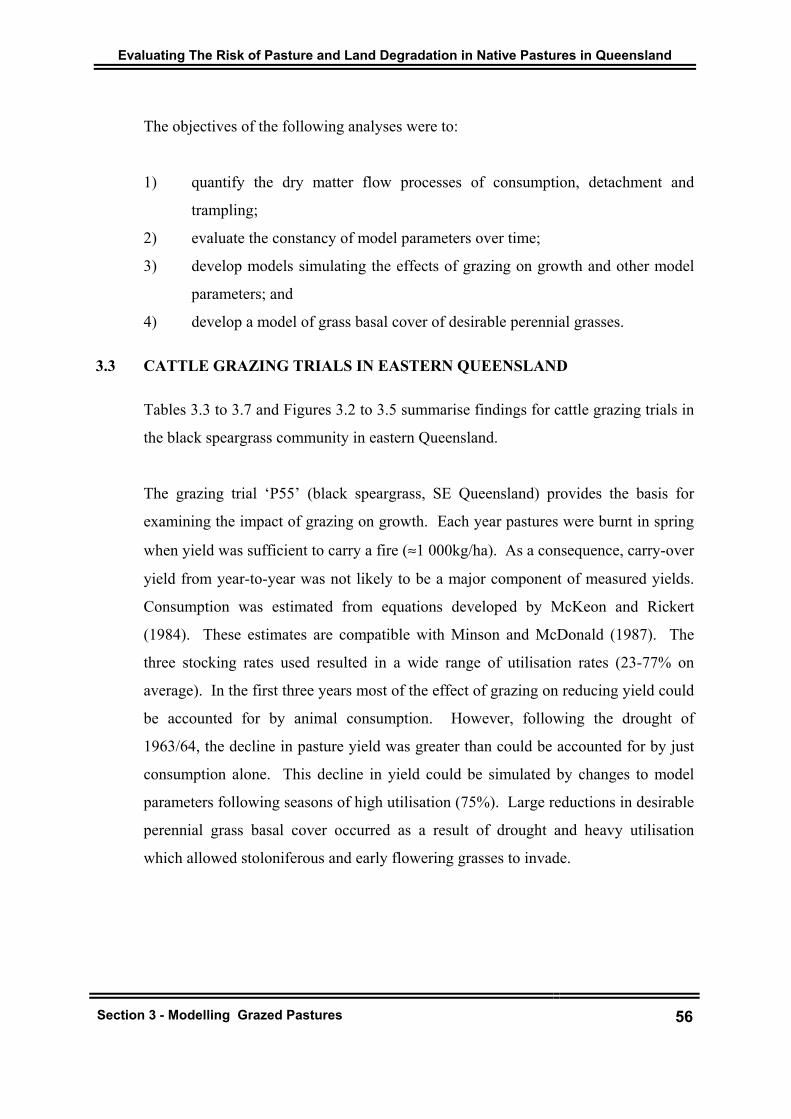
Evaluating The Risk of Pasture and Land Degradation in Native Pastures in Queensland
Section 3 - Modelling Grazed Pastures 56
The objectives of the following analyses were to:
1) quantify the dry matter flow processes of consumption, detachment and
trampling;
2) evaluate the constancy of model parameters over time;
3) develop models simulating the effects of grazing on growth and other model
parameters; and
4) develop a model of grass basal cover of desirable perennial grasses.
3.3 CATTLE GRAZING TRIALS IN EASTERN QUEENSLAND
Tables 3.3 to 3.7 and Figures 3.2 to 3.5 summarise findings for cattle grazing trials in
the black speargrass community in eastern Queensland.
The grazing trial ‘P55’ (black speargrass, SE Queensland) provides the basis for
examining the impact of grazing on growth. Each year pastures were burnt in spring
when yield was sufficient to carry a fire (≈1 000kg/ha). As a consequence, carry-over
yield from year-to-year was not likely to be a major component of measured yields.
Consumption was estimated from equations developed by McKeon and Rickert
(1984). These estimates are compatible with Minson and McDonald (1987). The
three stocking rates used resulted in a wide range of utilisation rates (23-77% on
average). In the first three years most of the effect of grazing on reducing yield could
be accounted for by animal consumption. However, following the drought of
1963/64, the decline in pasture yield was greater than could be accounted for by just
consumption alone. This decline in yield could be simulated by changes to model
parameters following seasons of high utilisation (75%). Large reductions in desirable
perennial grass basal cover occurred as a result of drought and heavy utilisation
which allowed stoloniferous and early flowering grasses to invade.

Evaluating The Risk of Pasture and Land Degradation in Native Pastures in Queensland
Section 3 - Modelling Grazed Pastures 57
The required changes to model parameters indicated that parameters derived from
ungrazed sites would over-estimate yields under grazing. Once these effects were
included a high proportion (86%) of yield variation for season x year x stocking rate
combinations could be accounted for by the model. (Figure 3.2, Table 3.4).
Figure 3.2 Comparison of observed and simulated pasture yield data for Brian Pastures P55 grazing trial phase one (see Table 3.3 for treatments).
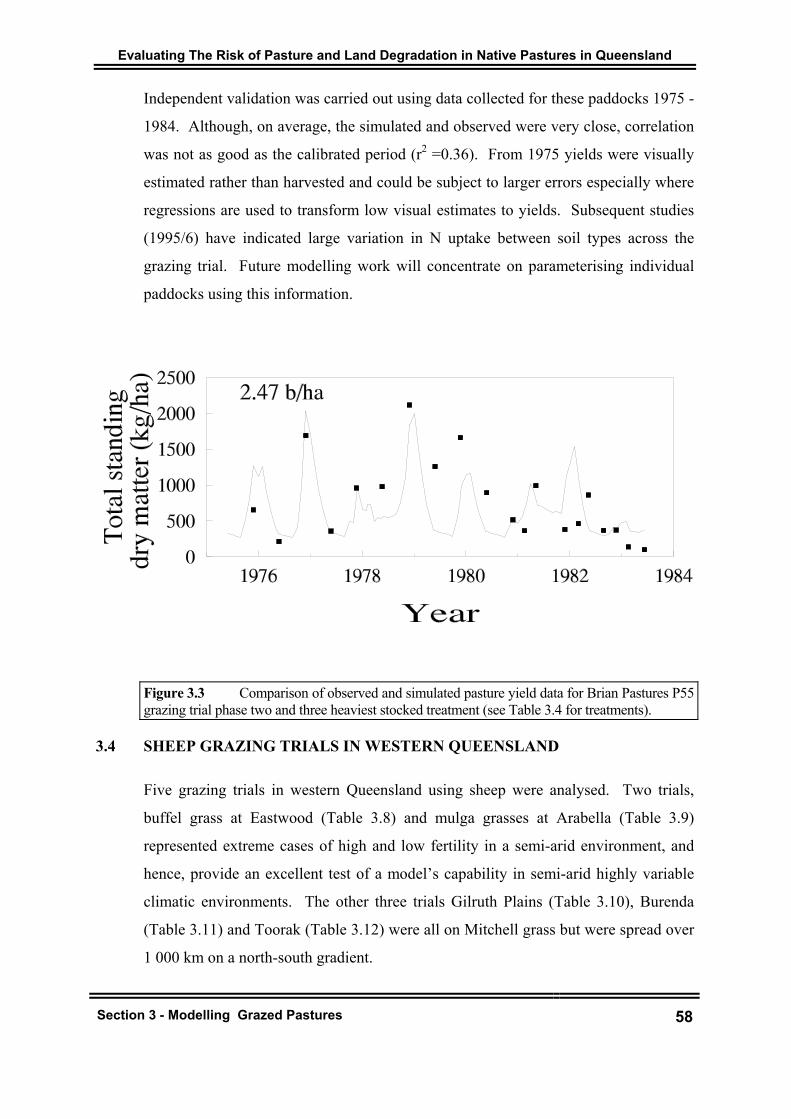
Evaluating The Risk of Pasture and Land Degradation in Native Pastures in Queensland
Section 3 - Modelling Grazed Pastures 58
Independent validation was carried out using data collected for these paddocks 1975 -
1984. Although, on average, the simulated and observed were very close, correlation
was not as good as the calibrated period (r2 =0.36). From 1975 yields were visually
estimated rather than harvested and could be subject to larger errors especially where
regressions are used to transform low visual estimates to yields. Subsequent studies
(1995/6) have indicated large variation in N uptake between soil types across the
grazing trial. Future modelling work will concentrate on parameterising individual
paddocks using this information.
Figure 3.3 Comparison of observed and simulated pasture yield data for Brian Pastures P55 grazing trial phase two and three heaviest stocked treatment (see Table 3.4 for treatments).
3.4 SHEEP GRAZING TRIALS IN WESTERN QUEENSLAND
Five grazing trials in western Queensland using sheep were analysed. Two trials,
buffel grass at Eastwood (Table 3.8) and mulga grasses at Arabella (Table 3.9)
represented extreme cases of high and low fertility in a semi-arid environment, and
hence, provide an excellent test of a model’s capability in semi-arid highly variable
climatic environments. The other three trials Gilruth Plains (Table 3.10), Burenda
(Table 3.11) and Toorak (Table 3.12) were all on Mitchell grass but were spread over
1 000 km on a north-south gradient.

Evaluating The Risk of Pasture and Land Degradation in Native Pastures in Queensland
Table 3.3 Summary of “P55” grazing trial in south-eastern Queensland (1961-69).
Name Brian Pastures “P55” phase 1
Community Southern black speargrass
Location Brian Pastures Research Station, 16 km SE of Gayndah
Period and soil 1961 to 1969, on variable clay soils. Site had been cleared of eucalypt regrowth
Desirable Perennial Grass Species
Heteropogon contortus, Bothriochloa bladhii, Dicanthium sericeum
Principal Investigator
W J Scattini et al.
Grazing Treatments
Three stocking rates (0.74, 1.24, 2.47 per ha) of weaner steers during summer (December to May). Pastures were burnt when possible.
Main Findings • Large decline in basal area of desired perennial grass species occurred at the high stocking rate and during drought (soil water index <0.3), e.g. 1968/69.
• Pasture composition shifted to stoloniferous grasses and early flowering species.
Modelling Findings • Growth parameters were derived from one GUNSYNpD exclosure in a treatment which had been annually burnt since 1980 and grazed only in winter and spring since 1970. Growth parameters were derived from 1986/87 season and simulated initial years (1961-1965) reasonably well. The following changes were required to model other years.
• Heavy utilisation resulted in more leaf and less stem, and hence, higher % N would be required for growth to occur. However, there was no measured decline in potential N uptake from 1962-1967 (Scattini 1973). Further measurements were not taken after 1967.
• Heavy utilisation resulted in lower root density, and hence, increased sensitivity to water stress and reduced available water range.
• More prostrate sward structure occurs under heavy grazing. Hence, there is a higher VPD where the plants are actually
Section 3 - Modelling Grazed Pastures 59

Evaluating The Risk of Pasture and Land Degradation in Native Pastures in Queensland
growing, and hence, lower water use efficiency.
Section 3 - Modelling Grazed Pastures 60
Evaluating The Risk of Pasture and Land Degradation in Native Pastures in Queensland
Table 3.4 Summary of “P55” grazing trial (1970-84) in south-eastern Queensland
Name Brian Pastures “P55” phases two and 3
Community Southern black speargrass
Location Brian Pastures Research Station, 16 km SE of Gayndah
Period and soil 1970 to 1984 on variable clay soils
Desirable Perennial Grass Species
Heteropogon contortus, Bothriochloa bladhii, Dicanthium sericeum
Principal Investigator
D.G. Cooksley, C. Paton et al.
Grazing Treatments
Previous treatments (Table 3.4) were either continued, i.e. summer-autumn grazing at three stocking rates or grazed only in winter spring at three stocking rates. In 1980 treatments were split again (either burnt or not burnt) resulting in 12 treatments in all.
Main Findings Winter/spring grazing allowed desirable perennial grasses to return
Modelling Findings • GUNSYNpD parameters derived in 1986 - 1995 underestimated maximum N availability or critical %N, and hence, pasture yield in high rainfall years (1970s) was under predicted.
• growth in the drought year 1982/83 was simulated well - an independent test of the model.
• pasture under heavy grazing was reasonably well simulated using parameters derived in phase one - an independent test of the model.
• subsequent field work (1995/6) has shown wide variation in N availability between soil types, and hence, paddocks (K.A. Day).
Section 3 - Modelling Grazed Pastures 61

Evaluating The Risk of Pasture and Land Degradation in Native Pastures in Queensland
Section 3 - Modelling Grazed Pastures 62
Figure 3.4 Comparison of observed and simulated pasture yield data for Brian Pastures P55 grazing trial phases two and three: winter/spring grazed and burnt when possible after 1980 (see Table 3.4 for treatments).

Evaluating The Risk of Pasture and Land Degradation in Native Pastures in Queensland
Section 3 - Modelling Grazed Pastures 63
Table 3.5 Summary of Ladies Mile grazing trial in south-east Queensland (Orr et al. 1997 a,b).
Name Ladies Mile Grazing Strategies Trial
Community Southern black speargrass
Location Brian Pastures Research Station, 16 km SE of Gayndah
Period and soil 1989-1994 on duplex and fertile alluvial soils
Desirable Perennial Grass Species
Heteropogon contortus, Bothriochloa bladhii
Principal Investigator
D M Orr, C Paton et al.
Grazing Treatments
Previously degraded pastures with a high content of Aristida spp. were burnt annually and grazed with variable deferment of start of grazing following burning. The two treatments simulated were: (1) no rest after burning and stocked at 0.67 weaner/steers per ha; and (2) six months rest after burning before stocking
Main Findings • Burning and deferred grazing resulted in a return to a high proportion of desirable perennial grass species
Modelling Findings • Growth parameters were available from two sites adjacent to the trial but the exclosure caused pasture composition to change to desirable perennial grasses and growth parameters derived from the exclosure over-estimated pasture growth under grazing
• Sensitivity test with the model showed that grazing effects could be best represented by increased sensitivity to drought (as found in P55 phase 1) and reduced N uptake (as found by Ash and McIvor 1995). This model analysis supports the previous findings from the analysis of P55.

Evaluating The Risk of Pasture and Land Degradation in Native Pastures in Queensland
Section 3 - Modelling Grazed Pastures 64
Figure 3.5 Comparison of observed and simulated pasture yield data for Brian Pastures Ladies Mile grazing strategies trial (see above legend and Table 3.5 for treatments).

Evaluating The Risk of Pasture and Land Degradation in Native Pastures in Queensland
Section 3 - Modelling Grazed Pastures 65
Table 3.6 Summary of Galloway Plains grazing trial in central Queensland (1988-1994).
Name Galloway Plains (west replicate)
Community Central black speargrass
Location Galloway Plains, 25 km west of Calliope, Central Queensland
Period and soil 1988 - 1994, alluvial clay
Desirable Perennial Grass Species
Heteropogon contortus, Bothriochloa bladhii
Principal Investigator
W.H. Burrows, E Anderson, R. Clem, D.M. Orr, M. Salloway et al.
Grazing Treatments
Five constant stocking rates and a sixth ungrazed (control) treatment were simulated. Other treatments were not simulated. Fire treatments were introduced later but not included in the simulation study for this project. Stocking rates ranged from 0.125 yearling steers per ha to 0.5 yearling per ha.
Main Findings • Pasture composition did not change with increasing stocking rate.
• Soil loss increased with stocking rate.
Modelling Findings • The GUNSYNpD site had relatively low growth parameters to some extent reflecting the previous grazing history of the site.
• Grazing effects on yield were able to be solely accounted for by consumption.
• A higher proportion of the variation in yield could be accounted for by relating potential N uptake to seasonal rainfall suggesting that N mineralisation was enhanced by warm and wet conditions. However, no measurements of N yield had been made. Alternative hypotheses based on variable critical %N are yet to be explored.

Evaluating The Risk of Pasture and Land Degradation in Native Pastures in Queensland
Section 3 - Modelling Grazed Pastures 66
Figure 3.6 Comparison of observed and simulated pasture yield data for Galloway Plains grazing trial: western replicate (see Table 3.6 for treatments).

Evaluating The Risk of Pasture and Land Degradation in Native Pastures in Queensland
Section 3 - Modelling Grazed Pastures 67
Table 3.7 Summary of Kangaroo Hills grazing trial in northern Queensland (1965-1976).
Name Kangaroo Hills
Community Northern black speargrass
Location Kangaroo Hills, 100 km west of Ingham on Seaview Range
Period and soil 1965 - 1976
Desirable Perennial Grass Species
Themeda triandra, Heteropogon contortus
Principal Investigator
P. Gillard and R. Rebgetz
Grazing Treatments
Two stocking rates (0.21 and 0.42 steers per ha); with and without trees; with and without phosphorus. All treatments were oversown with Townsville stylo.
Main Findings • Removal of trees increased dry matter yields, little effect of stocking rates or phosphorus
Modelling Findings • A GUNSYNpD site was not available so the model was calibrated using data from one season following burning (1975).
• Trees were assumed to compete for nutrients by reducing maximum N uptake as indicated by N yield in above-average rainfall years (1968). With these changes the model adequately accounted for the effects of stocking rate and trees on pasture yield.
• Constant parameters explained yields in below-average rainfall but not yields in the high rainfall year 1974 suggesting a range of hypotheses: reduced detachment due to stem accumulation; or greater availability of nitrogen due to more favourable mineralisation conditions or increase in legume component; or changes in critical %N for growth. Measurements of nitrogen concentration and uptake were available only for one year.
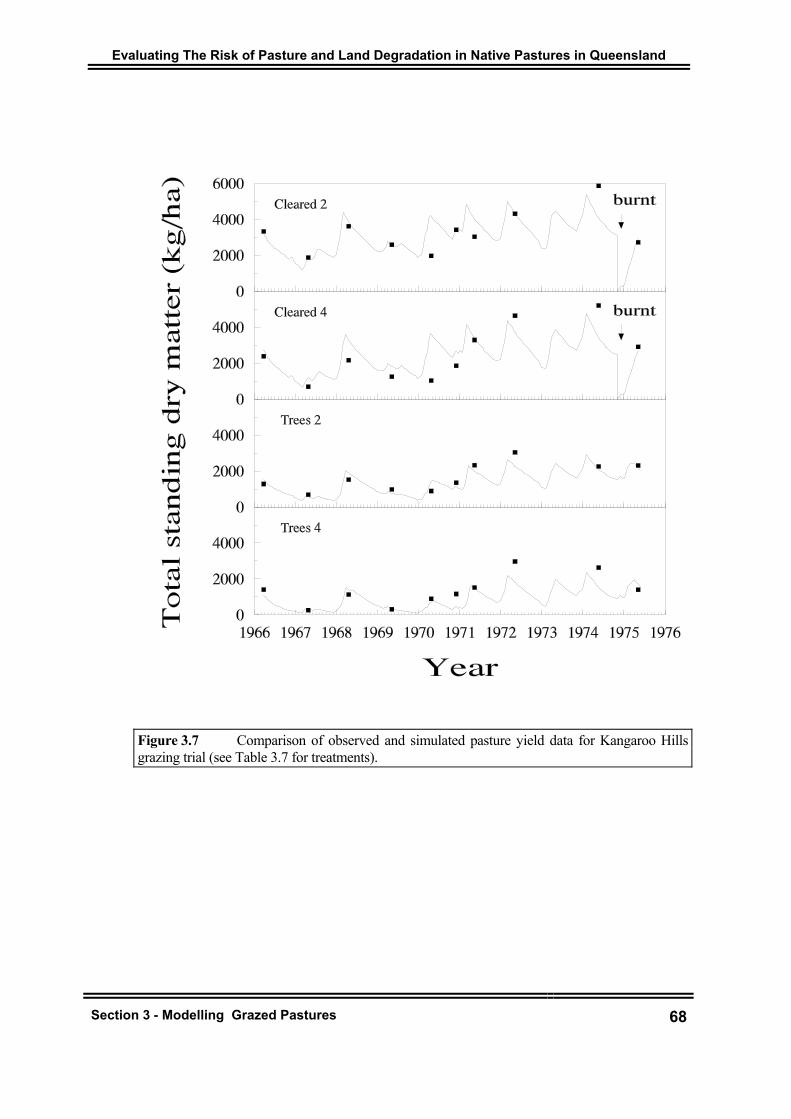
Evaluating The Risk of Pasture and Land Degradation in Native Pastures in Queensland
Section 3 - Modelling Grazed Pastures 68
Figure 3.7 Comparison of observed and simulated pasture yield data for Kangaroo Hills grazing trial (see Table 3.7 for treatments).

Evaluating The Risk of Pasture and Land Degradation in Native Pastures in Queensland
Section 3 - Modelling Grazed Pastures 69
Table 3.9 Summary of Eastwood grazing trial in western Queensland
Name Eastwood Buffel grass trial
Community Buffel grass on cleared gidgee
Location Eastwood Station, 40 km south of Blackall
Period and soil 1967-1974, on clay soil. The gidgee woodland was pulled and burned in 1961.
Desirable Perennial Grass Species
Cenchrus ciliaris (buffel grass)
Principal Investigators
the late G.R. Lee, G. Payne, D.M. Orr, et al.
Grazing Treatments
Four rates set stocked sheep (10, 5, 2.5, 1.25 per ha). Sheep in the heavier stocking rate treatment were supplemented.
Main Findings • Buffel grass was very resilient to heavy grazing
• Highest stocking rate was destocked after four years and, in later years, had higher yields and less woody regrowth than other treatments
• There was large variation in grass basal cover between the two paddock replicates when the highest stocking rate treatment collapsed indicating that small topographical effects can have large ecological outcomes
Modelling Findings • Model growth parameters were calibrated for 1967 and showed good consistency across all stocking rates except in 1974 when the high stock treatment had greater yield than simulated. This ‘error’ could be explained by the observed patch grazing that occurred in this high growth year (D.M. Orr pers. comm.).
• Sheep intake parameters were calibrated using observed green yields and these values were used in the other grazing trials.
• Rapid decline in standing pasture yield in 1969 could not be simulated with the existing model. Further model development may be required to incorporate dry matter pools of leaf, stem and seed and independent detachment rates for each pool.

Evaluating The Risk of Pasture and Land Degradation in Native Pastures in Queensland
Section 3 - Modelling Grazed Pastures 70
Figure 3.8 Comparison of observed and simulated pasture yield data for Eastwood buffel grass grazing trial (see Table 3.8 for treatments).
Evaluating The Risk of Pasture and Land Degradation in Native Pastures in Queensland
Section 3 - Modelling Grazed Pastures 71
Table 3.9 Summary of Arabella grazing trial in south-western Queensland (1977-1986).
Name Arabella utilisation trial
Community Soft mulga
Location Arabella, 20 km east of Charleville
Period and soil 1977 - 1986, on soft mulga
Desirable Perennial Grass Species
Monachather paradoxa, Thyridolepis mitchelliana, Digitaria spp.
Principal Investigators
I.F. Beale, D.M. Orr, et al.
Grazing Treatments
Four levels of utilisation by sheep (20, 35, 50, 80%). Stock numbers were adjusted each May. Treatments had different tree densities.
Main Findings • Paddocks were variable in soil texture and tree/shrub density.
• Loss of DPG species occurred at 50% and 80% utilisation after 1980 drought.
• DPG species were replaced by Aristida spp. and bare ground at high utilisation rates.
• 80% treatment had to be destocked for 18 months out of the 7 years.
Modelling Findings • Growth parameters were derived from a site at Charleville (P W Johnston 1986/87).
• Reasonable simulation was achieved without further calibration.
• Basal area was related to growth in previous season or yield at end-of-season suggesting that accounting for animal intake alone was sufficient to simulate grazing effects.
• Although species composition varied from C3 to C4 grasses, adequate simulation was achieved with C3 parameters.
• Future model development would require models of annuals (e.g. forbs)
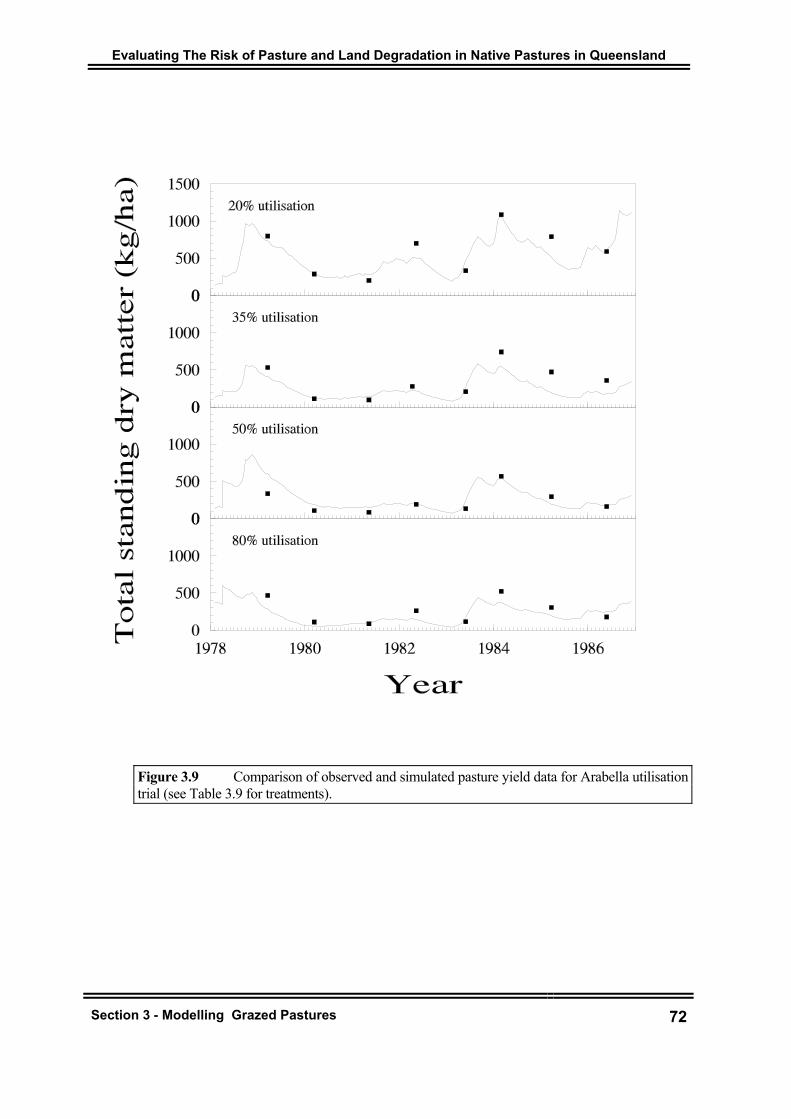
Evaluating The Risk of Pasture and Land Degradation in Native Pastures in Queensland
Section 3 - Modelling Grazed Pastures 72
Figure 3.9 Comparison of observed and simulated pasture yield data for Arabella utilisation trial (see Table 3.9 for treatments).
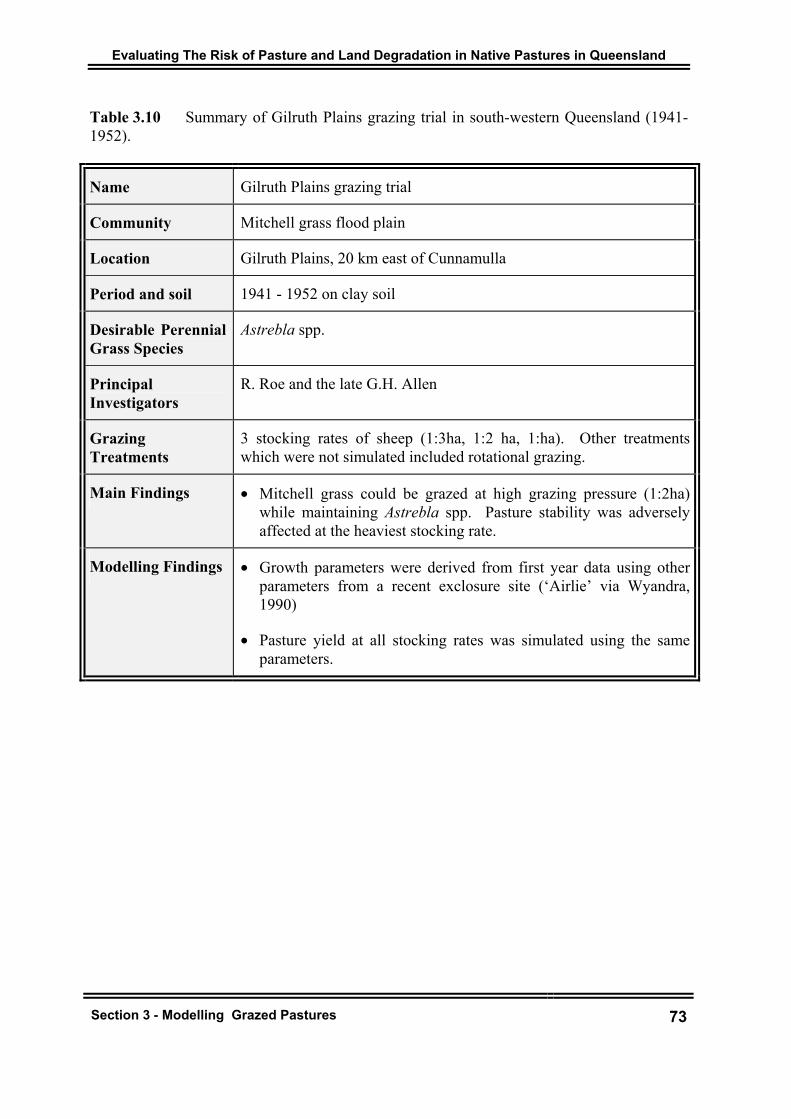
Evaluating The Risk of Pasture and Land Degradation in Native Pastures in Queensland
Section 3 - Modelling Grazed Pastures 73
Table 3.10 Summary of Gilruth Plains grazing trial in south-western Queensland (1941-1952).
Name Gilruth Plains grazing trial
Community Mitchell grass flood plain
Location Gilruth Plains, 20 km east of Cunnamulla
Period and soil 1941 - 1952 on clay soil
Desirable Perennial Grass Species
Astrebla spp.
Principal Investigators
R. Roe and the late G.H. Allen
Grazing Treatments
3 stocking rates of sheep (1:3ha, 1:2 ha, 1:ha). Other treatments which were not simulated included rotational grazing.
Main Findings • Mitchell grass could be grazed at high grazing pressure (1:2ha) while maintaining Astrebla spp. Pasture stability was adversely affected at the heaviest stocking rate.
Modelling Findings • Growth parameters were derived from first year data using other parameters from a recent exclosure site (‘Airlie’ via Wyandra, 1990)
• Pasture yield at all stocking rates was simulated using the same parameters.

Evaluating The Risk of Pasture and Land Degradation in Native Pastures in Queensland
Section 3 - Modelling Grazed Pastures 74
Figure 3.10 Comparison of observed and simulated pasture yield data for Gilruth Plains grazing trial (see Table 3.10 for treatments).

Evaluating The Risk of Pasture and Land Degradation in Native Pastures in Queensland
Section 3 - Modelling Grazed Pastures 75
Table 3.11 Summary of Burenda grazing trial in south-western Queensland (1975-1989).
Name Burenda utilisation trial
Community Southern Mitchell grass
Location Burenda, 100 km NE of Charleville
Period and soil 1975 - 1989, on cracking clay
Desirable Perennial Grass Species
Astrebla spp.
Principal Investigators
I.F. Beale, D.M. Orr, et al.
Grazing Treatments
Five levels of utilisation by sheep (10, 20, 30, 50, 80%). Stock were changed in May with stocking rates chosen to eat a proportion of existing pasture yield.
Main Findings • A large decline in DPG species occurred at 80% utilisation leading to destocking of this treatment
• High year-to-year variation in yields was probably associated with changes in species composition
Modelling Findings • Biddenham GUNSYNpD sites were used to estimate growth parameters.
• High detachment rates in summer were required to simulate observed pasture yields.
• These rates were consistent with those observed for forbs and seed heads.
• Yields could be adequately simulated by assuming that the perennial grass component was replaced by a rapidly growing and detaching annual component.

Evaluating The Risk of Pasture and Land Degradation in Native Pastures in Queensland
Section 3 - Modelling Grazed Pastures 76
Figure 3.11 Comparison of observed and simulated pasture yield data for Burenda utilisation trial (see Table 3.11 for treatments).

Evaluating The Risk of Pasture and Land Degradation in Native Pastures in Queensland
Section 3 - Modelling Grazed Pastures 77
Table 3.12 Summary of Toorak grazing trial in western Queensland (1984-1993 period).
Name Toorak utilisation trial
Community Northern Mitchell grass
Location Toorak Research Station, 50 km south of Julia Creek
Period and soil 1984 - 1993 on cracking clays
Desirable Perennial Grass Species
Astrebla spp.
Principal Investigators
D.G. Phelps, D.M. Orr, et al.
Grazing Treatments
Five levels of utilisation by sheep (10, 20, 30, 50, 80%). Stock were changed in May/June with stocking rates chosen to eat a proportion of existing pasture yield.
Main Findings • Initially there was no relationship between utilisation level and proportion of Astrebla with year-to-year rainfall variability having a larger effect than grazing treatments in the first four years (1984-88). However, treatment effects were beginning to appear in 1989 and 1990 with the 80% treatment not responding to rainfall as much as the lightly grazed treatments.
Modelling Findings • Simulation with growth parameters derived from the GUNSYNpD site was successful for the initial period until a two year drought reduced perennial grass basal cover to near zero (J.O. Carter and D. Cowan pers. comm. 1986-87).
• The model was not successful in simulating the high pasture yields observed in 1991 in the low utilisation treatments
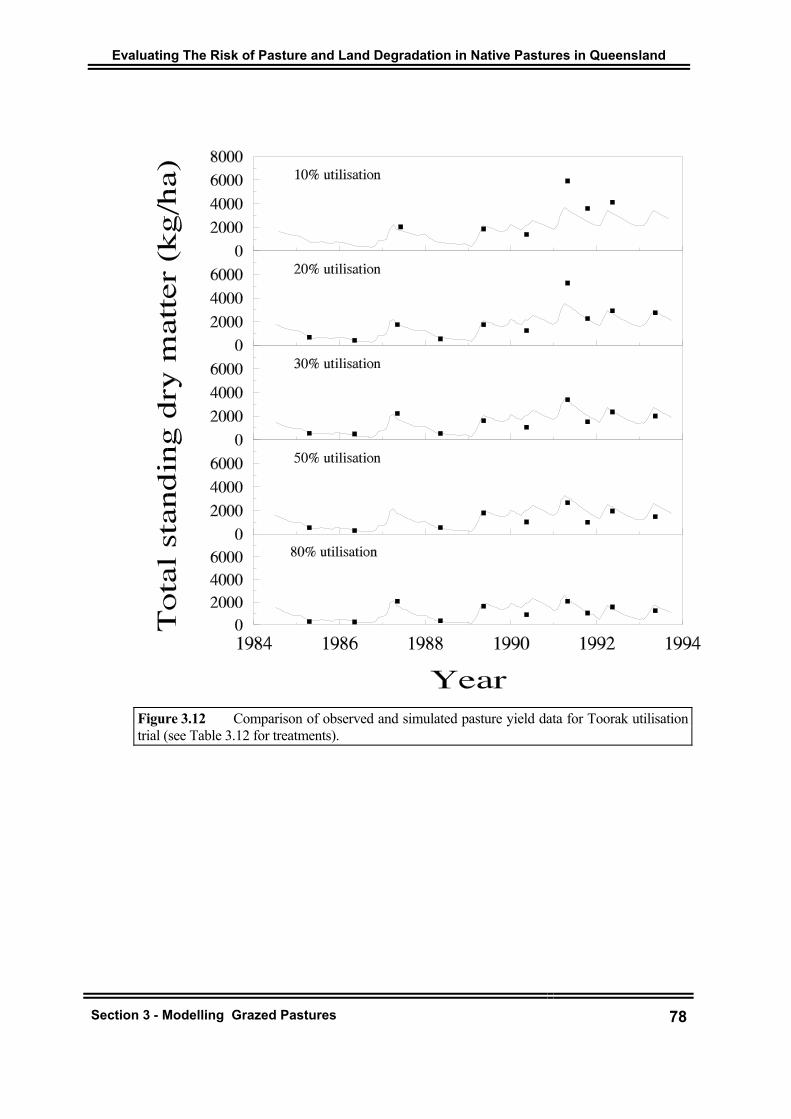
Evaluating The Risk of Pasture and Land Degradation in Native Pastures in Queensland
Section 3 - Modelling Grazed Pastures 78
Figure 3.12 Comparison of observed and simulated pasture yield data for Toorak utilisation trial (see Table 3.12 for treatments).

Evaluating The Risk of Pasture and Land Degradation in Native Pastures in Queensland
3.5 SUMMARY OF GRAZING TRIAL EFFECTS
The analysis of grazing trials was carried out to develop parameters for detachment,
consumption and trampling. When combined with plant growth parameters derived
either from GUNSYNpD or from single years in the grazing trial, a high proportion
of variation in observed pasture yield could be accounted for in most trials (Table
3.13).
Derivation of model parameters
Where model growth parameters were derived from exclosures which had not been
grazed (P55, Ladies Mile), the effects of increasing grazing pressure on pasture yield
were modelled by reducing N uptake and increasing the sensitivity of plant growth to
soil water deficit (e.g. Figures 3.2 and 3.4). For trials where growth parameters were
derived from previously grazed exclosure or lightly grazed paddocks (Galloway
Plains, Kangaroo Hills), the simulated yields over time were highly correlated with
observed data for a range of stocking rates and tree densities and no change in model
parameters was required. Thus, some care has to be taken in choice of site for
derivation of the growth parameters which best represent the grazed situation.
A major problem in the simulation of pasture yield in Mitchell grasslands is the
suppression of new growth by existing tillers on new growth (Scanlan 1980). As a
result growth could be over-estimated by model parameters derived using data from
mown exclosures. These problems of simulating Mitchell grasslands will only be
resolved by a model of botanical composition which allows individual species to be
simulated to account for large differences in species parameters (cover/yield, N use,
detachment rates) (Orr 1986).
Section 3 - Modelling Grazed Pastures 79

Tab
le 3
.13
Com
paris
on o
f sim
ulat
ed a
nd o
bser
ved
past
ure
yiel
ds fo
r gra
zing
tria
ls in
Que
ensl
and.
Reg
ress
ion
slop
e an
d co
nsta
nt a
re fo
r x=o
bser
ved
and
y=si
mul
ated
. M
ean
diff
eren
ce is
ave
rage
abs
olut
e er
ror,
i.e. a
bsol
ute
diff
eren
ce b
etw
een
obse
rved
and
sim
ulat
ed.
TR
IAL
M
EA
N
OB
SER
VE
D
ME
AN
SI
MU
LA
TE
D
NO
. OF
OB
SER
VA
TIO
NS
CO
RR
EL
AT
ION
SL
OPE
C
ON
STA
NT
M
EA
N
DIF
FER
EN
CE
R
AN
GE
IN
OB
SER
VE
D
RA
NG
E IN
SI
MU
LA
TE
D
Toor
ak
19
84-1
993
1555
16
3456
0.86
30.
6958
840
612
5-59
2979
-349
5
East
woo
d
1967
-197
4 19
23
1901
780.
921
0.85
271
476
0-72
8584
-712
3
Bur
enda
1976
-198
8 91
3
93
910
30.
757
0.81
198
327
0-22
7045
-247
8
Ara
bella
1977
-198
6 35
9
39
632
0.84
50.
7711
810
985
-108
510
3-10
46
Gilr
uth
Plai
ns
1941
-195
4 12
87
1409
120
0.88
90.
9321
528
869
-309
370
-327
1
Kan
garo
o H
ills
1965
-197
6 22
14
2251
400.
781
0.69
729
544
267-
5864
335-
4255
Gal
low
ay W
est
1988
-199
4 23
51
2346
580.
859
0.81
449
389
91-4
417
141-
4783
Bria
n Pa
stur
es1
1961
-196
7 10
67
998
360.
949
0.93
119
431
-308
114
-276
1
Bria
n Pa
stur
es2
1975
-198
4 39
03
4041
570.
926
1.02
6369
527
6-89
2858
-870
1
Bria
n Pa
stur
es3
1975
-198
4 76
8
73
840
0.61
00.
4836
939
614
-276
330
3-20
44
Ladi
es M
ile
1989
-199
4 31
43
3382
120.
799
0.78
919
393
2022
-477
119
45-4
450
1 all
thre
e st
ocki
ng ra
tes
2 ligh
t and
med
ium
stoc
king
rate
(ind
epen
dent
val
idat
ion)
3 he
avy
stoc
king
rate
(ind
epen
dent
val
idat
ion)

Evaluating The Risk of Pasture and Land Degradation in Native Pastures in Queensland
Detachment processes
Detachment processes are not well understood and are difficult to measure unless
growth can be accurately estimated. Field observations suggest a strong seasonal
component since detachment is likely to be faster under good growing conditions and
high intensity rainfall.
The GRASP model includes pools of leaf and stem to allow for future model
development to include variable leaf to stem ratio between species, different leaf and
stem detachment rates, and effects on quality and diet selection. As yet insufficient
data are available to parameterise a leaf/stem model. Similarly, the separate dry
matter pools of forbs and seed heads, which are likely to be transient, are not
simulated in the model but are included as part of the total pasture yield. Thus, at this
stage of model development, parameters describing detachment rates have been
developed for the whole sward:
1) for black speargrass communities in the southern zone, detachment rates were
near zero in the season immediately following burning; and the overall rate of
0.002 kg/kg/day has been derived from pastures which have not been burnt for
>5 years and was consistent with detachment rates in exclosures;
2) in the northern zone (e.g. Kangaroo Hills), a more rapid rate of 0.005
kg/kg/day appeared appropriate and was consistent with other studies, e.g.
McCaskill and McIvor (1993). Similarly, at Galloway higher rates were found
(0.004 kg/kg/day)
3) for buffel grass (Eastwood, western Queensland), different rates for leaf and
stem were assumed based on observations that old stems remained for several
years. Pasture yield data showed periods of rapid decline. This could be due
to sampling variation, translocation of carbohydrates to roots or dispersal of
seed heads;
4) for mulga pastures, losses of dry matter could occur due to unspecified grazing
by kangaroos, termite and grasshoppers. For pasture yields measured in the
grazing trial an average detachment rate of 0.003 kg/kg/day was found. This
Section 3 - Modelling Grazed Pastures 81

Evaluating The Risk of Pasture and Land Degradation in Native Pastures in Queensland
relatively high rate of detachment may reflect the possible role of native fauna
and termites in pasture disappearance; and
5) for Mitchell grasslands high variability was found in detachment rates. When
pastures were dominated by Astrebla spp. detachment rates were low, i.e.
0.002kg/kg/day. However, after the loss of tussocks of Astrebla spp. due to
heavy grazing and/or drought, higher detachment rates (0.010 kg/kg/day) were
found reflecting higher rates of detachment associated with forbs and annual
grasses.
Trampling and effects of utilisation on consumption
For sheep, the buffel grass grazing trial provided the most reliable data to estimate
trampling rates as the growth and detachment parameters appeared consistent across
the 17 years of study (Figure 3.8). Sensitivity studies indicated that a ratio of
trampling to consumption of 1:3 was the best estimate. This value was applied to
other grazing trials by sheep. Similarly for parameterising the effect of increasing
utilisation on reducing individual animal intake, the buffel grass trial provided the
best data with clear stocking rate effects on liveweight change. The parameters
reflected the ability of sheep to graze to appetite at very low pasture availability
(200-300kg/ha).
For cattle, utilisation/intake parameters had been previously determined by McKeon
and Rickert (1984) at Brian Pastures in south-eastern Queensland. No litter was
observed in the pasture one year after a burn (W.J. Scattini pers. comm.) indicating
that trampling rate was low and that natural detachment processes could account for
yield losses.
Section 3 - Modelling Grazed Pastures 82

Evaluating The Risk of Pasture and Land Degradation in Native Pastures in Queensland
3.6 APPLICATION TO CALCULATING RISKS OF DEGRADATION
Grazing trials lasting 5-10 years, although long-term in terms of scientific study are
relatively short-term relative to producer experience. Thus, with the view of
estimating safe stocking rates for long-term (30-100 years) sustainable grazing,
relatively short-term trials may not include sufficient cycles of deterioration and
resilience to reveal the long term effects of a particular stocking rate policy as
discussed in Section 1. Nevertheless, grazing trials provide measurements that allow
the mechanism of degradation to be modelled.
The calculation of risks of degradation requires models of -
1) the relationship between grass basal cover and pasture yield;
2) the relationship between pasture yield and soil loss; and
3) the relationship between utilisation and animal production.
Perennial grass basal cover and pasture yield
For a particular location, relationships have been established between perennial grass
basal cover (including both desirable and undesirable species) and pasture yield in
autumn (Christie 1978), or rainfall over the previous two years (Scattini 1969).
During this project a survey of currrently and previously exclosed sites was
conducted. Plant basal cover was measured on 56 sites where sites were, at the time,
protected from grazing. A relationship was found between pasture yield and grass
basal cover measured at the same time (Figure 3.13 and Table 3.14). Figure 3.13 and
Table 3.14 show a strong link between perennial grass basal cover and previous
pasture growth for the total grass sward, species groups and individual species. The
relationship between yield and basal cover varied between species (Table 3.14).
Section 3 - Modelling Grazed Pastures 83

Evaluating The Risk of Pasture and Land Degradation in Native Pastures in Queensland
Section 3 - Modelling Grazed Pastures 84
Figure 3.13 The relationship between species yield (kg/ha) and basal area as (%) as measured in autumn 1994 in GUNSYNpD exclosures. Species are divided into three groups (1-3) according to Table 3.14 and a remaining group (B) which is buffel (Cenchrus ciliaris).
Species were classified into three groups according to basal cover to yield ratio except
for buffel (Cenchrus ciliaris) which varied in basal cover to yield ratio between sites
(Table 3.14 and Figure 3.13). Species with a high basal cover to yield ratio (group 3)
tended to be small and, in the case of B. pertusa, E. bimaculata and C. fallax,
prostrate species. These species may also be regarded as indicators of poorer
condition pasture (Tothill and Gillies 1992). An exception in all of the above cases is
Themeda triandra, which is a moderate sized tussock grass which declines with heavy
grazing (Shaw 1957). In the case of T. triandra we suspect that this observed high
basal cover to yield ratio could be attributed to a suspected highly competitive root
system and a high root to shoot ratio in T. triandra. A highly competitive root system

Evaluating The Risk of Pasture and Land Degradation in Native Pastures in Queensland
is suspected from field observations in exclosures at Gayndah where distinct rings can
be noted around individual plants forming a zone which is devoid of other grasses
(K.A. Day). Such “zones” are not evident in other species such as H. contortus,
Aristida spp. and B. bladhii which are prevalent in the area.
Table 3.14 Relationship between grass basal cover and pasture yield from exclosures throughout Queensland (April/May1994).
SPECIES BASAL COVER TO LINEAR REGRESSION
GROUPING YIELD RATIO SLOPE INTERCEPT (r2) No.
All swards 0.0013 0.0006 2.63 0.31 56
All species 0.0012 0.0009 0.85 0.50 96
Group 1 0.0007 0.0006 0.48 0.75 16
Group 2 0.0015 0.0014 0.23 0.75 57
Group 3 0.0029 0.0021 0.78 0.56 18
Cenchrus ciliaris 0.0015 0.0006 2.97 0.15 5
Heteropogon contortus 0.0016 0.0016 0.15 0.76 25
Astrebla spp. 0.0012 0.0010 0.36 0.79 14
Bothriochloa bladhii 0.0008 0.0006 0.76 0.80 9
Aristida spp. 0.0014 0.0009 0.62 0.61 8
Monochather paraoxa 0.0020 0.0019 0.07 0.73 6
Themeda triandra 0.0032 0.0033 -0.14 1.00 3
Bothriochloa pertusa 0.0021 0.0023 -0.19 1.00 3
Group 1: Bothriochloa bladhii (9), Chloris Gayana (1), Dichanthium spp.(5), Panicum maximum (1) Group 2: Aristida spp.(8); Astrebla spp.(16); Bothriochloa ewartiana (3), Heteropogon contortus (25),
Monochather paradoxa (6), Triodia sp. (1) Group 3: Bothriochloa decipiens (3), Bothriochloa pertusa (3), Chrysopogon fallax (2), Enneapogon
spp. (2), Eremochloa bimaculata (4), Eragrostis eriopoda (1), Themeda triandra (3)
Species with a low basal cover to yield ratio (group 1) tended to be from more fertile
sites (brigalow soils in the case of C. Gayana and P. maximum (sown grasses) and
black earths and heavy textured soils in the case of B. bladhii and Dichanthium spp.).
The production of a high amount of above ground dry matter per unit basal cover
could be an advantageous trait in competitive conditions resulting from high fertility
and low to moderate disturbance.
Section 3 - Modelling Grazed Pastures 85

Evaluating The Risk of Pasture and Land Degradation in Native Pastures in Queensland
Species basal cover is commonly measured on grazing trials as a key indicator of
pasture condition. Using modelled pasture growth and grass basal cover data from
grazing trials where perennial grasses dominated composition even under heavy
grazing (P55, Galloway Plains, Arabella, Burenda and Eastwood), a general
relationship has been established (Figure 3.14) between average pasture growth
(t/ha/year) over the previous two seasons (GROWTH), pasture yield (kg/ha) at the
end of April (YIELD) and percent grass basal cover (%GBC):
%GBC = (3.576 x - 0.458 GROWTH 2) * (0.83 + 0.25 * YIELD) (n=150, r2=0.66)
Average growth for previous 2 years
0 1000 2000 3000 4000 5000
% G
rass
bas
al c
over
0
5
10
15
Figure 3.14 Relationship between between average growth over the previous two years and perennial grass basal cover (%) for six grazing trials. Data points are labelled according to grazing trial: (1) P55; (2) Galloway Plains; (3) Mulga; (4) Eastwood; (5) Burenda and; (6) Toorak.
Section 3 - Modelling Grazed Pastures 86

Evaluating The Risk of Pasture and Land Degradation in Native Pastures in Queensland
This relationship does not fully account for the over-riding effect of severe drought on
perennial grass basal cover. For each grazing trial, the worst year was selected on the
basis of soil moisture deficit. In such years, for some trials, grass basal cover
(%GBC) was reduced with increased utilisation in the previous season (P55, Arabella,
Burenda) whilst for other trials there was little effect of previous utilisation on %GBC
(Eastwood, Galloway Plains). For all sites and stocking rates, %GBC during drought
was related to total seasonal transpiration (T) from November to April (Figure 3.15).
% GBC = 0.36 + 0.0405 T (n = 40, r2 = 0.86)
Figure 3.15 Relationship between seasonal transpiration during the worst (drought) year
in each of six grazing trials and perennial grass basal cover (%). Data points are for different stocking rate treatments and are labelled according to grazing trial: (1) P55; (2) Galloway Plains; (3) Mulga; (4) Eastwood; (5) Burenda; and (6) Toorak.
Transpiration (mm)
0 50 100 150 200
% G
rass
bas
al c
over
0
2
4
6
8
Section 3 - Modelling Grazed Pastures 87

Evaluating The Risk of Pasture and Land Degradation in Native Pastures in Queensland
Mechanism for loss of perennial grasses
Detailed measurements of plant survival and grass basal cover by D.M. Orr
(Galloway Plains, Arabella, Burenda, Toorak) provide the basis for examining the
effect of utilisation on the survival of desired perennial grass species. These studies
on young cohorts of black speargrass at Galloway Plains showed that mortality of
perennial plants increased rapidly where soil moisture deficit and heavy utilisation
occurred together during the growing season.
Grass basal cover at the Eastwood buffel grass grazing trial on cleared gidgee showed
the least sensitivity to increasing stocking rate. Although in a semi-arid environment,
with similar rainfall to Arabella and Burenda, buffel grass pasture sustained high
utilisation rates from 1967 to 1983 without large changes in perennial grass basal
cover (G.R. Lee, G. Graham and D.M. Orr unpublished data), complete utilisation
with supplemented sheep was necessary to ‘crash’ the pasture. These results support
the conclusion of McIvor et al. (1994) that pastures on low nutrient soils are most at
risk of over-grazing.
Thus, general equations have been developed to calculate %GBC as a function of
grazing and drought, allowing the loss of perennial grasses to be assessed.
Section 3 - Modelling Grazed Pastures 88

Evaluating The Risk of Pasture and Land Degradation in Native Pastures in Queensland
Pasture yield and soil loss
Site specific models of run-off and soil loss has been included in GRASP (e.g.
Scanlan et al. 1996). Run-off has been calculated as a function of soil water deficit,
rainfall intensity and cover (calculated directly from standing pasture yield). GRASP
simulates a litter pool as the net result of gains through trampling and detachment and
loss through decomposition. However, insufficient data were available to
parameterise potential litter decomposition. Litter and standing yield are likely to be
strongly correlated, and hence, it is appropriate to use pasture yield as an estimate of
surface cover for calculating run-off and soil loss (e.g. Scanlan and McIvor 1993,
Scanlan et al. 1996, McIvor et al. 1995b). GRASP also includes the effect of tree
density on surface cover using data from J O Carter. Trees contribute litter whilst
reducing cover from grass production. Hence, the simulation of pasture yield under
grazing allows at least the relative effects of run-off and soil loss to be simulated.
The run-off model was developed in northern Queensland for a site in the Burdekin
catchment (Scanlan et al. 1996). Successful independent validation was carried out in
central Queensland (Springvale, M Silburn). A full report has been presented
elsewhere (Yee Yet 1994).
For the purposes of assessing risks, a general soil loss model (Rose 1985) was
included in GRASP. The model has been parameterised for the Springvale data
(M. Silburn). Soil loss is a direct linear function of slope angle and soil erosivity, and
exponential functions of cover and run-off. It is expected that maps of slope will be
used to indicate areas most at risk, i.e. high slopes. Soil erosivity as yet has not been
mapped although maps of surface soil attributes (e.g. texture) have been prepared and
could be used as inputs once other soil loss data have been analysed (M. Silburn,
LAMSAT project, LWRRDC).
Section 3 - Modelling Grazed Pastures 89

Evaluating The Risk of Pasture and Land Degradation in Native Pastures in Queensland
Effect of utilisation on animal production, management and the pasture resource
The analysis of grazing trials (Figure 3.16, Tables 3.15-3.23) shows higher levels of
animal production per unit area (wool or liveweight gain per ha) can be achieved over
5-10 years at utilisation rates higher than a conservative safe rate of 15-20% (usually
lowest stocking rate in trial). However, the trials also showed that:
1) risk of animal death in drought increased with average utilisation (Toorak
>25% average utilisation; Brian Pastures 55% average utilisation; Gilruth
Plains 24% average utilisation);
2) heavily utilised pastures had to be destocked after loss of perennial species
during droughts (Arabella >40% average utilisation; Burenda >37% average
utilisation); and
3) risk of soil loss increased rapidly with increasing utilisation. For example, at
Galloway Plains soil movement at 50% average utilisation was ten times that
for low utilisation rates (Salloway et al. 1993). Similarly, at Kangaroo Hills
observed run-off was substantially greater in treatments with high utilisation
rates (P. Gillard pers. comm.).
Thus, native pasture grazing trials, although conducted for relatively short periods
(5-10 years), show that heavy utilisation rates (35-50%) cause major problems in
maintaining animal numbers and/or resource productivity.
For the native pasture trials (i.e. excluding the Eastwood buffel grass trial) maximum
production (value per hectare) over the short term (generally 5-20 years) occurred at
an average utilisation of 30-60% (Figure 3.16). To achieve sustainable production
most authors (e.g. Johnston et al. (1996), Orr et al. (1994), Roe and Allen (1993), D.
Cooksley pers. comm.) recommended stocking rates or treatments which resulted in
lower levels of utilisation (15-25%). At these recommended stocking rates, relative
production (Figure 3.16) was 30-65% of maximum production per hectare. Correct
analysis of the effect of stocking rate strategies on production consequences requires
detailed economic analysis (including dynamic flock/herd models and premiums
Section 3 - Modelling Grazed Pastures 90

Evaluating The Risk of Pasture and Land Degradation in Native Pastures in Queensland
received for quality of production), and models of pasture and land degradation.
Preliminary studies have been carried out using some of the above grazing trial
information (e.g. McKeon et al. 1997, Stafford Smith et al. 1997a). However such
studies are yet to include the long term effects of soil loss and woody weed invasion,
and hence, are unable to simulate the long term consequences of different stocking
rate strategies.
Nevertheless, the analysis of relative production (Figure 3.16) highlights the contrast
between levels of pasture utilisation which maximise short term production and those
levels perceived by experienced scientists to be sustainable in the long term.
Figure 3.16 Relationship between pasture utilisation and animal production for sheep and cattle grazing trials on native pasture (i.e. excluding Eastwood trial on buffel grass). Production is relative to the “best” treatment as described in Tables 3.16 to 3.23).
Section 3 - Modelling Grazed Pastures 91

Evaluating The Risk of Pasture and Land Degradation in Native Pastures in Queensland
Table 3.15 Simulation of Eastwood buffel grass stocking rate trial. Treatments had constant stocking rates of sheep with initial Merino weaner ewes. Animal production data are from the late G. R. Lee, G. Payne and D.M. Orr. The effect of continuous stocking rates on sheep and Cenchrus ciliaris (buffel grass) productivity in central-western Queensland (paper in preparation). TREATMENT SIMULATED
GROWTH .(kg/ha/year)
SIMULATEDEATEN
(kg/ha/year)
EATEN / GROWTH
(%)
GREASY FLEECE (kg/ha)
RELATIVE TO “BEST”
TREATMENT (%)
DESTOCKED
0.8 ha/sheep 1890 430 23 30
0.4 ha/sheep 1730 830 55 59
0.2 ha/sheep 1600 1280 80 100
0.1 ha/sheep 15401 1560 >100 2 Destocked August 1970 1 For three years only (1967/8 to 1970/1 0.1 ha/sheep treatment was supplemented to maintain sheep and was destocked after three years. For one year only, 1967-1968, wool per ha was double that which occurred at 0.2 ha/sheep. Table 3.16 Simulation of Burenda Mitchell grass utilisation trial (1976-1983). Stocking rates of sheep were changed each year (May) to eat a constant proportion of pasture yield present in May. Animal production data are from Beale (1985). TREATMENT SIMULATED
GROWTH (kg/ha/year)
SIMULATEDEATEN
(kg/ha/year)
EATEN / GROWTH
(%)
GREASY WOOL (kg/ha) RELATIVE TO
“BEST” TREATMENT
(%)
DESTOCKING
10% 1350 160 12 28 -
20% 1330 260 20 43 -
30% 1270 380 30 61 -
50% 1240 460 37 80 Insufficient pasture to restock after summer 1983
80% 1060 390 36 100 Insufficient pasture to restock after summer 1983
Section 3 - Modelling Grazed Pastures 92
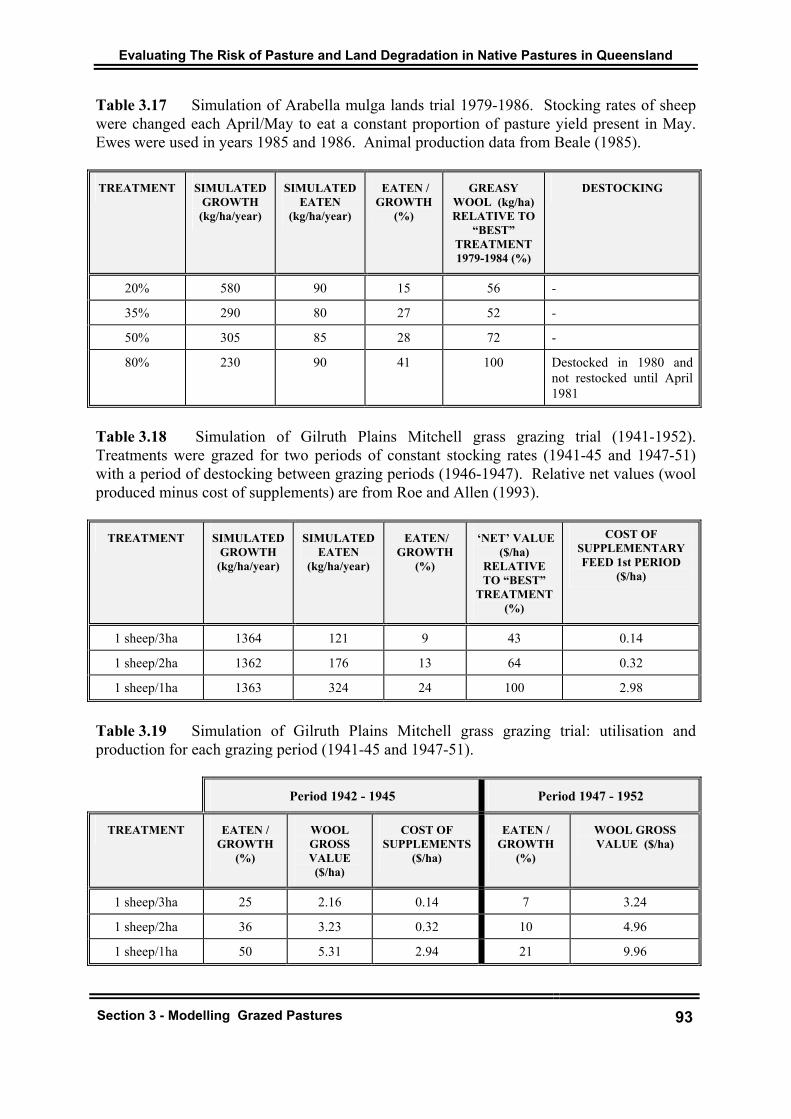
Evaluating The Risk of Pasture and Land Degradation in Native Pastures in Queensland
Table 3.17 Simulation of Arabella mulga lands trial 1979-1986. Stocking rates of sheep were changed each April/May to eat a constant proportion of pasture yield present in May. Ewes were used in years 1985 and 1986. Animal production data from Beale (1985). TREATMENT SIMULATED
GROWTH (kg/ha/year)
SIMULATEDEATEN
(kg/ha/year)
EATEN / GROWTH
(%)
GREASY WOOL (kg/ha) RELATIVE TO
“BEST” TREATMENT 1979-1984 (%)
DESTOCKING
20% 580 90 15 56 -
35% 290 80 27 52 -
50% 305 85 28 72 -
80% 230 90 41 100 Destocked in 1980 and not restocked until April 1981
Table 3.18 Simulation of Gilruth Plains Mitchell grass grazing trial (1941-1952). Treatments were grazed for two periods of constant stocking rates (1941-45 and 1947-51) with a period of destocking between grazing periods (1946-1947). Relative net values (wool produced minus cost of supplements) are from Roe and Allen (1993).
TREATMENT SIMULATEDGROWTH
(kg/ha/year)
SIMULATEDEATEN
(kg/ha/year)
EATEN/ GROWTH
(%)
‘NET’ VALUE ($/ha)
RELATIVE TO “BEST”
TREATMENT (%)
COST OF SUPPLEMENTARY FEED 1st PERIOD
($/ha)
1 sheep/3ha 1364 121 9 43 0.14
1 sheep/2ha 1362 176 13 64 0.32
1 sheep/1ha 1363 324 24 100 2.98
Table 3.19 Simulation of Gilruth Plains Mitchell grass grazing trial: utilisation and production for each grazing period (1941-45 and 1947-51).
Period 1942 - 1945 Period 1947 - 1952
TREATMENT EATEN / GROWTH
(%)
WOOL GROSS VALUE ($/ha)
COST OF SUPPLEMENTS
($/ha)
EATEN / GROWTH
(%)
WOOL GROSS VALUE ($/ha)
1 sheep/3ha 25 2.16 0.14 7 3.24
1 sheep/2ha 36 3.23 0.32 10 4.96
1 sheep/1ha 50 5.31 2.94 21 9.96
Section 3 - Modelling Grazed Pastures 93

Evaluating The Risk of Pasture and Land Degradation in Native Pastures in Queensland
Table 3.20 Simulation of Toorak Mitchell grass grazing trial (1985-1993). Stocking rate of sheep changed each year (May) to eat a constant proportion of pasture yield present in May. Animal production data from Phelps et al. (1994). TREATMENT SIMULATED
GROWTH (kg/ha/year)
SIMULATEDEATEN
(kg/ha/year)
EATEN / GROWTH
(%)
CLEAN WOOL (kg/ha)
RELATIVE TO “BEST”
TREATMENT1985-93 (%)
DESTOCKING OR SUPPLEMENTATION IN
DROUGHTS
0% 1620 0 0 0 -
10% 1600a 170 11 28 5 and 15% “mortalityb” in 1987 and 1988 droughts
20% 1600 290 18 - -
30% 1590 380 24 67 15% “mortality” in 1987 drought
50% 1580 490 31 83 40% “mortality” in 1987 and 1988 drought
80% 1570 640 40 100 60% and 100% “mortalities” in 1987 and 1988 drought
a: Simulated growth under-estimated observed yields in 1991 in this treatment b: Animal liveweights have been measured every three months. During dry periods, sheep weighing less than 30kg liveweight were removed to avoid unnecessary mortalities. These sheep have been treated as deaths in subsequent calculations. Table 3.21 Simulation of “P55” (Brian Pastures) grazing trial (1971-1979). At each stocking rate two paddocks were rotationally grazed with weaner steers for summer-autumn (S-A) and then winter-spring (W-S). Liveweight data is from D. Cooksley (pers. comm.).
TREATMENT SIMULATED GROWTH
(kg/ha/year)
SIMULATED EATEN
(kg/ha/year)
EATEN /GROWTH (%)
LIVEWEIGHT GAIN (kg/ha) RELATIVE
TO “BEST” TREATMENT
0.37 b/ha 3679 549 15 68
0.62 b/ha 3663 910 25 100
1.24 b/ha 2702 1489 55 85
Section 3 - Modelling Grazed Pastures 94

Evaluating The Risk of Pasture and Land Degradation in Native Pastures in Queensland
Table 3.22 Galloway Plains black speargrass stocking rate trial (W. Burrows) 1988-1993. Treatments were grazed at constant stocking rate with 300kg steers. There was a small increase in stocking rate in 1990-1 and 1992-3. Animal production data were supplied by W. Burrows (1994). Milestone report to Meat Research Corporation: Effects of stocking rate, legume augmentation supplements and fire on animal production and stability of native pastures (DAQ080).
TREATMENT GROWTH (kg/ha/year)
EATEN (kg/ha/year)
EATEN / GROWTH
(%)
LIVEWEIGHT GAIN (kg/ ha/ year) RELATIVE TO
“BEST” TREATMENT (%)
1/8 ha 2596 364 14 32
1/5.3 ha 2591 539 21 52
1/4.0 ha 2587 707 27 65
1/2.7 ha 2577 1022 40 85
1/2 ha 2513 1290 51 100
Table 3.23 Kangaroo Hills black speargrass stocking rate, and tree clearing trial (P. Gillard) 1966-1975. Native pasture was cleared or trees not removed, stocked at two rates with weaner steers. All treatments were oversown with Townsville stylo and half of the replicates had phosphorus applied. Data from Gillard (1979).
TREATMENT GROWTH (kg/ha/year)
EATEN (kg/ha/year)
EATEN / GROWTH
(%)
LIVEWEIGHT GAIN (kg/ ha/ year) RELATIVE
TO “BEST” TREATMENT (%)
0.21 b/ha cleared 2970 488 16 57
0.21 b/ha trees 1981 439 22 41
0.42 b/ha cleared 2886 934 32 100
0.42 b/ha trees 1832 762 42 71
Section 3 - Modelling Grazed Pastures 95

Evaluating The Risk of Pasture and Land Degradation in Native Pastures in Queensland
SECTION 4 - CALCULATING SAFE STOCKING RATES
4.1 INTRODUCTION
The analysis of grazing trials reported in Section 3 showed:
1) the short-term (2-10 years) advantage of higher stocking rates on animal
production; and
2) the potential mechanisms for degradation.
In most publications from the grazing trials the principal investigators commented
that although the trial showed increased production (per hectare) with increased
stocking rate, lighter stocking rates were preferable due to a variety of reasons, e.g.
lower variability in production, less impact of drought or dry seasons, reduced need
for buying and selling, less risk of damage to desirable perennial grass composition,
fewer opportunities for weed invasion and soil erosion. The advantages of light
stocking rates are likely to be difficult to quantify from short-term grazing trial results
because of the low frequency of events which can have major impact on pasture
composition and soil loss. Thus, grazing trials have limitations for estimating long-
term (30-100 years) sustainable stocking rates, i.e. ‘safe’ stocking rate. Estimates of
safe stocking rate are better derived from grazier experience which, for an established
grazier, is more likely to cover the range of climatic and economic events that show
the consequences of a chosen grazing regime.
There are likely to be a range of stocking rates used within a region due to
individuality of graziers and their circumstances, e.g. property size, financial history,
duration of land ownership, expertise in trading and drought management. Thus, the
range of stocking rates in a region provides a spatial ‘experiment’ on the
consequences of different stocking rate strategies, although only subjective
judgements can be made.
Section four - Calculating safe stocking rates 96

Evaluating The Risk of Pasture and Land Degradation in Native Pastures in Queensland
Given this wealth of personal and regional experience, it is not surprising that graziers
(either as individuals or as groups) are prepared to nominate safe stocking rates for
their own property or, more generally, for different types of land. The problem with
this approach, as discussed in Section 1, is how to extrapolate across a range of
climates, soils, tree densities and pasture condition.
It was hypothesised, in Section 1, that expressing safe stocking rate as a safe
utilisation rate (pasture consumption ÷ pasture growth) was one approach to compare
and extrapolate across environments. Thus, four sets of grazier data (south west, south
east, central and north eastern Queensland), in conjunction with other projects, have
been examined to estimate safe levels of utilisation.
4.2 CASE STUDIES
For each case study, graziers or grazier groups estimated safe carrying capacity for
land types or whole properties. Intake was calculated from these estimates of
carrying capacity. Because of regional differences, different approaches were used to
estimate pasture growth inititally. The approaches adopted are discussed below.
Intake was estimated by assuming that a beef cattle adult equivalent (AE) consumes
10kg/head of dry matter per day during the growing season (180 days), and 5kg/head
for dormant season; and that a dry sheep equivalent (DSE) consumes
400kg/head/year. Variation in intake from this assumed level is considered in Section
4.3.
Potential utilisation was calculated as intake (above) divided by potential pasture
production, i.e. pasture growth in the absence of grazing. Potential pasture growth
was estimated independently by relating land types with pasture growth derived from
the GUNSYNpD pasture production studies. Land types were either ranked relative
to known GUNSYNpD study sites, or matched to an analogous soils/pasture grouping
of GUNSYNpD sites for which average pasture growth parameters had been
calculated. Extrapolation from GUNSYNpD sites were made either on the basis of a
simple rainfall-use-efficiency or on the basis of actual GRASP pasture growth
parameters such as potential nitrogen uptake and transpiration-use-efficiency.
Section four - Calculating safe stocking rates 97
Evaluating The Risk of Pasture and Land Degradation in Native Pastures in Queensland
Pasture growth was discounted for the effect of trees and pasture condition. One of
the disadvantages of using consensus data from grazier groups is that, in the case of
treed land types, it is difficult to estimate “average” tree density from ground surveys.
For this reason, only safe stocking rates for land types in cleared condition have been
examined with respect to consensus data. Where carrying capacity was estimated for
individual properties DPI officers were able to survey tree density. Pasture condition
was accounted for either by selecting properties in good condition (benchmark
properties) or, where pasture condition was likely to be variable between properties,
i.e. in the case of the regional survey presented (Scanlan et al. 1994), pasture
condition was estimated for each property.
Case study 1: Central Queensland: local best practice data (K A Day)
Grazier groups estimated safe stocking rates for 20 pasture communities in central
Queensland (R. Clark pers. comm.). Stocking rates ranged from 14 to 62 AE/100 ha.
Average pasture growth was calculated using regional rainfall and the GRASP model
with pasture growth and soil parameters derived from a data bank of ungrazed pasture
production trials (GUNSYNpD project). Potential utilisation for the summer growing
season was calculated as described above. Potential utilisation rates ranged from 10-
19% utilisation over the growing (September-May) period. Whether or not such
stocking rates are implemented is debatable.
Case study 2: South-east Queensland: benchmark property data (K A Day et al.)
Four graziers in the Central Burnett region were selected by a local property planning
officer to provide experienced views of safe carrying capacity both for their properties
and the component land types. Safe utilisation was calculated by the methodology
presented above for 40 individual land units representing 18 different land types.
Annual utilisation levels were, on average, 27% calculated both on a land type and
property basis. The range in utilisation was 9-52% across the 40 land units and 23-
29% across the four properties. Twenty-seven percent utilisation of annual growth
translates to 23% utilisation over the growing season (September to May). This study
is reported in full in Stafford Smith et. al. (1997b).
Section four - Calculating safe stocking rates 98

Evaluating The Risk of Pasture and Land Degradation in Native Pastures in Queensland
Case study 3: South-west Queensland: benchmark property and consensus data
(Johnston et al. 1996)
Safe stocking rates (as DSE) for nine land types on four benchmark properties were
nominated by graziers. The properties were regarded as being in good condition
based on surface cover, and lack of erosion and woody weed invasion. Johnston et al.
(1996) measured pasture growth using field methodology described in Appendix 3
and calibrated GRASP to each site. From simulation over 30 years, simple
relationships between rainfall and growth were established for the whole south-
western region allowing estimates to be made for the benchmark properties. Across
the range of communities, average safe utilisation was 15% of annual pasture
production. The major differences were associated either with highly productive and
more resilient land types (e.g. Mitchell grass) or for land types where mulga was
likely to be an important source of browse
Case study 4: Northern speargrass: regional survey (Scanlan et al. 1994)
In Dalrymple shire, northern Queensland, a survey of 45 properties was conducted
(Scanlan et al. 1994) which provided information on both actual stocking rates over
three years of the study (1987-89), and safe carrying capacity estimated by each
grazier). For all pasture communities on each property, estimates of grazing area, tree
basal area, pasture condition, and rainfall were made. Rainfall-use-efficiencies (kg/ha
of pasture per mm of rainfall) were estimated for each community as a function of
fertility, and VPD which was dependent on distance from the coast and type of year.
Pasture growth was calculated for each property and each year. Utilisation was
calculated for summer period (182 days) based on an estimated potential intake of
10kg of dry matter per day for an adult equivalent (AE).
For the 45 properties over the three years of the study (1987 to 1989), pasture
utilisation ranged from 5% to 45% with the majority (85% of property x year
combinations) having between 15 and 30% utilisation over the summer period.
Estimated safe stocking rates ranged from three to 23 AE/100 ha. Eighty percent of
these estimated safe stocking rates were less than 35% utilisation of decile three
pasture growth, i.e. the growth that occurs in at least 70% of years. Despite the wide
range of rainfall, land resource units, pasture condition and tree density, the majority
Section four - Calculating safe stocking rates 99

Evaluating The Risk of Pasture and Land Degradation in Native Pastures in Queensland
(58%) of graziers’ estimates translated into a relatively small range of utilisation
(25%-35% utilisation of decile three production). For the Dalrymple Shire, decile
three pasture growth as simulated using the GRASP model was approximately 50-
65% of average summer growth (McKeon et al. 1994). So, on this basis, 30%
utilisation of decile three pasture growth translates to 17% utilisation in an average
six month growing period. To allow further comparison with the findings of Johnston
et al. (1996), 30% utilisation of decile three pasture growth translates to an average
annual utilisation of 30%.
The change in actual stock numbers from 1987 to 1989 was compared to property
utilisation rates. Properties with greater than 25% utilisation over the summer period
were reducing stock numbers, while those with less than 15% utilisation were
increasing stock numbers. The 1987/88 season was below average in terms of
simulated pasture growth (decile two) and the 1988/89 season was above average (top
30% of years). The two year period, as a whole, was close to median pasture growth
Summary of the four case studies
Across a tenfold range in pasture productivity (500 to 5 000 kg/ha/year) the
nominated safe stocking rates represent approximately 15-25% utilisation of average
pasture growth during the growing period. However, there are some regions where
15-25% utilisation is likely to be too high, although detailed survey data are not
available. For example, Newman (1992) in a survey of 19 properties in the Julia
Creek - Mitchell grass region (north-western Queensland, a region with severe
droughts) found an average stocking rate of 0.51 DSE/ha (range 0.37-0.59 DSE/ha)
for the 1985 to 1990 five year period. Based on an average pasture growth of 1 600
kg/ha/year estimated at Toorak (Section 3) this average stocking rate represents
12.7% utilisation. Low safe utilisation rates have similarly been calculated for
tropical tall grass communities in northern Australia, where the growing season is
short and nutrients such as phosphorus are likely to be major limitations on animal
production (Norman 1963, Winter 1987, McIvor et al. 1994).
Section four - Calculating safe stocking rates 100

Evaluating The Risk of Pasture and Land Degradation in Native Pastures in Queensland
4.3 INTERPRETATION OF A LOW (15-25%) SAFE UTILISATION
For each of the case studies safe levels of utilisation were low, typically 15-25%
utilisation in the growing season. This level of utilisation (15-25%) seems low and
not intuitively obvious given the large areas of bare ground often observed in drought.
We consider here the possible sources of variation and explanation.
Animal intake and pasture growth
The calculation of utilisation requires estimates of components of safe stocking rate
in adult equivalents, animal intake and pasture growth.
Estimates of safe stocking rate derived from local best practice and from benchmark
properties (case studies one and 2) may be more conservative than for land types
because property values include unproductive areas (ridges, areas of high tree
density). Better estimates of this source of variation will require property survey
data. Animal numbers although referred to as adult equivalents or dry sheep
equivalents do not necessarily include other components of the herd and flock (e.g.
weaners, lambs, horses). In estimating intake we have adopted estimates at the upper
end of the range. For sheep we have adopted 400kg/DSE/year and, for cattle,
1800kg/AE/180 days during the pasture growing period and 900kg/AE/180 days in
the period of lower quality forage.
Estimates of pasture growth have been derived from exclosures placed on
representative land types. It is possible that site choice may have resulted in a biased
sampling of the landscape and pasture condition. Sites were readily accessible and
uniform and, unless specifically chosen otherwise, they were representative of good
condition and reasonable soil depth.
Section 5 examines in greater detail how representative of the grazing lands the
exclosures data were. However, the success of using growth parameters derived from
exclosures in the simulation of grazing trials suggests that exclosures are generally
representative of grazed pastures, for the purposes of deriving pasture growth
parameters.
Section four - Calculating safe stocking rates 101

Evaluating The Risk of Pasture and Land Degradation in Native Pastures in Queensland
Section four - Calculating safe stocking rates 102
The difference between ‘potential’ and ‘actual’ utilisation.
Pasture growth estimated from exclosures must be regarded as potential growth. As
discussed in Section 3, grazing reduces growth through different plant and
hydrological processes: reduced light interception; increased run-off; higher nitrogen
requirements; and change in pasture composition to less productive species. We
presented a case study based on a simulation of grazing strategies in the mulga lands.
When the above factors are included in simulation models, simulated pasture growth
declines with increasing stocking rate. A projected 15-20% utilisation of potential
(exclosure growth) represents 20-30% of actual growth (Figure 4.1). Increasing
stocking rate reduces growth to such an extent that a projected utilisation of 25-30%
would result in 50-60% utilisation of actual pasture grown and, as such, low pasture
yields. Thus, in the case of the mulga lands, 15-20% utilisation represents a use of
pasture where there is minimal damage to pasture growth and low run-off.
Figure 4.1: A simulation of pasture growth and animal intake for a sheep grazing trial at Arabella in south-west Queensland shows that actual utilisation ( ) increases exponentially with increased stocking rate. This exponential increase is due to pasture growth being reduced with increased stocking rate. Thus, utilisation calculated on the basis of potential pasture growth ( ) is lower than that simulated on the basis of actual pasture growth.

Evaluating The Risk of Pasture and Land Degradation in Native Pastures in Queensland
Thus, we suggest that the apparently low utilisation derived from grazier estimates of
safe stocking rates can be explained for some pasture communities by the rapidity
with which actual pasture growth declines with increasing stocking rate.
What does ‘safe’ mean to graziers?
Pasture communities are likely to differ in sensitivity to grazing according to
frequency of drought, nutritional limits on animal production, and type of desired
enterprise (breeding, finishing). Grazier-estimated safe stocking rates are likely to
include all these factors and do not necessarily exclude a flexible approach to buying
and selling to take advantage of favourable seasons.
Analysis from the grazing trials in Section 2 showed that the use of lower utilisation
rates substantially reduces the impact of drought on herd/flock management (Beale
1985, Phelps 1994) and the risk of financial losses through reduced need to trade at
inopportune times. Thus, it is likely that the nominated safe utilisation rates reflect a
view of stock management designed to reduce the impact of drought. Where droughts
have been perceived to be less frequent or severe (coastal Queensland and south-
eastern Queensland), then higher safe stocking rates would be expected to be
nominated on an economic basis alone. Given that a low utilisation rate has desired
effects of reduced impact of drought as well as longer term consequences for resource
management, e.g. desired fire frequency, botanical composition and soil cover, it is
difficult to attribute the grazier’s conservative estimates of safe stocking rate to any
one factor.
Constant versus variable stocking rate
The concept of an average safe constant stocking rate is fundamentally different to
varying stocking rate in response to variation in standing pasture yield (e.g. as in the
treatments used in the utilisation trials in western Queensland). The use of flexible
stocking rates to consume a constant proportion (20-30%) of end-of-season yield over
the next six to 12 months, may provide increases in long-term animal production per
ha but is likely to increase variation in income and place more emphasis on
management skills such as livestock trading (Stafford Smith and Foran 1988). In the
case presented for Dalrymple, graziers who were stocking such that 15-20% of the
Section four - Calculating safe stocking rates 103

Evaluating The Risk of Pasture and Land Degradation in Native Pastures in Queensland
pasture growth was eaten, did not change their stocking rate over the two years of
study.
Experimental comparisons between constant and flexible stocking rate strategies are
now being carried out. The current development of seasonal rainfall forecasts using
SOI (Stone and Auliciems 1992) raises the possibility of a third stocking rate strategy
based on consuming a safe proportion (e.g. 20-30%) of future pasture yield. At
present it is not possible to determine which stocking rate strategies are best. For the
purposes of calculating risks we have taken a constant safe utilisation rate of 15%
over the growing season as a baseline to simulate expected run-off, pasture yields,
cover and other hydrological/pasture/animal attributes. However, it is possible that
flexible stocking rate strategies may be better for resource management and
profitability especially in adapting management to climatic variability on a decadal
and generational time scale. The issue is currently being evaluated in the projects
DroughtPlan (Stafford Smith et al. 1997, McKeon et al. 1997)) and RIRDC DAQ
139.
What are the visual indicators of 15-25% utilisation?
The concept of an average safe level of utilisation is a mathematical construction
rather than the result of direct measurement. The calculation requires estimates of
two rates (i.e. animal consumption and pasture growth) while graziers and
agronomists can observe only pools (e.g. presentation yield and animal liveweight),
and hence, the rates of the driving processes are not readily apparent.
It is reasonable to ask what does the result 15-25% average utilisation look like on a
pasture. However, high year-to-year variation in pasture growth (due to climatic
variation), in combination with constant stocking rates, results in large year-to-year
variation in pasture yield and surface cover. For example, simulated yields for a
black speargrass pasture grazed at a constant 15% utilisation ranged from 500 to
3300kg/ha.
Section four - Calculating safe stocking rates 104

Evaluating The Risk of Pasture and Land Degradation in Native Pastures in Queensland
Thus, there is no simple visual indicator of safe average utilisation other than
relative observations such as drought or frequency of burning across a range of
stocking strategies. The assessment of average utilisation from snapshot observations
requires knowledge of previous rainfall and a further calculation of expected pasture
yield. In fact, it is on the basis of such a procedure, that we have developed the
operational spatial model described in the following section (Section 5).
An alternative approach to providing visual pasture indicators of a safe stocking rate
is to determine the expected frequency of important management events, e.g..
frequency of burning, requirements of woody regrowth control, destocking due to
drought, supplementation requirements, presence of indicator species or variability in
animal turn-off. The process of documenting the production and managerial
consequences of using safe stocking rates is only just beginning but it will become the
most important approach for individual graziers to assess directly the relative
consequences of their own stocking policy.
4.4 FUTURE DEVELOPMENTS
The concept of an average safe utilisation rate has been developed here for the
purposes of simulating risks of land and pasture degradation. Other QDPI projects
(e.g. Drought Plan) are testing these concepts in estimating safe stocking rates for
individual properties (e.g. Scanlan et al. 1994, Johnston et al. 1996, Day et al. 1996).
Use of grazier knowledge of safe stocking rates
The use of grazier knowledge in estimating safe stocking rates is the forum for future
developments. Nominated “safe” stocking rates can be extrapolated to other
locations/communities provided pasture growth can be estimated and, thus, safe
utilisation rates calculated. As more knowledge becomes available, sources of
variation in safe levels of utilisation will be examined.
Section four - Calculating safe stocking rates 105

Evaluating The Risk of Pasture and Land Degradation in Native Pastures in Queensland
These projects will provide the basis for examining -
1) the variation between pasture communities and landscape units which are
likely to differ in sensitivity to grazing; and
2) the economic implications of adopting more conservative stocking rates.
From a modelling viewpoint, process models of carbon and nitrogen flow, and plant
competition are yet to be developed which would allow ecophysiological support for
nominated safe stocking rates.
Use of ABS animal numbers to estimate safe stocking rates
An alternative to grazier estimates would be the use of historical animal numbers
reported to the Australian Bureau of Statistics (ABS). Historical periods could be
identified when resource degradation was not apparent, e.g. 1945 - 1965. Following
closer examination of the issues involved we decided not to use historical ABS data
for the following reasons:
1) historical numbers may not reflect true stocking rates due to previously poor
mustering efficiencies;
2) historical changes in tree densities and woody weeds would have had a large
impact on pasture growth but have not been documented;
3) the pasture resource may have been under-used before the introduction of Bos
indicus cattle and use of supplements; and
4) doubts on accuracy of animal numbers have been expressed based on
measured turn-off rates and lack of impact of drought on year-to-year
variation in reported stock numbers.
Although ABS numbers represent the only readily available historical data source,
their interpretation requires analysis of selected individual property data in
conjunction with herd/flock models (the subject of two current (1997) PhD projects,
W Hall and D Mayer QDPI/University of Queensland).
Section four - Calculating safe stocking rates 106
Evaluating The Risk of Pasture and Land Degradation in Native Pastures in Queensland
4.5 CONCLUSION
Analysis of four grazier surveys in three regions indicated that a safe utilisation rate
of 15%-25% of potential (exclosure) growth provides a general and conservative view
of pasture use. The surveys indicate that some graziers are likely to stock above this
level. Grazing trial data and economic analysis suggests that short-term (5-10 years)
financial returns are likely to increase with increasing stocking above 15% utilisation.
However, at such stocking rates the risks of land and pasture degradation, feed
shortages and animal losses are likely to increase. The following section describes
the simulation of these risks.
Section four - Calculating safe stocking rates 107

Evaluating The Risk of Pasture and Land Degradation in Native Pastures in Queensland
SECTION 5 - AN OPERATIONAL MODEL FOR QUEENSLAND
5.1 INTRODUCTION
In this section we describe a spatial model developed for Queensland and prototyped
for other states. We provide examples of how the findings from DAQ124A as
presented in Sections 1 to 4 of this report can be extended through a spatial modelling
framework to assess risks of pasture and land degradation.
The spatial model for Queensland, initiated in this project by RIRDC and QDPI,
became part of a national drought alert system funded by LWRRDC (QPI 20). A full
description of the spatial model including development, validation and use has been
documented in the final report for the LWRRDC project QPI20 (Brook 1996).
Volume 1 of the above final report (Research Summary) is appended (Appendix 1).
The following description complements these reports and highlights the role of the
spatial model in assessing risks of pasture and land degradation. The spatial model
uses a version of GRASP which is essentially the same as reported in Section 2. The
version of GRASP used in the spatial model will be improved from the findings
presented in Sections 2 and 3 of this report.
5.2 INPUTS TO THE SPATIAL MODEL
An operational spatial model of pasture growth and utilisation has been developed
running in near real-time (monthly) with output a few days after the end of each
month. The model is run on a 5 km grid across Queensland (ca. 70 000 5 km x 5 km
pixels). It has also been run for the continent but is not operational or well validated
at this scale.
Section 5 - An Operational Model for Queensland 108

Evaluating The Risk of Pasture and Land Degradation in Native Pastures in Queensland
The main inputs to the operational system are:
1) climate;
2) soil;
3) geographic information such as LGA boundaries;
4) animal numbers;
5) pasture communities; and
6) tree density.
The organisation of this input data in a form suitable for spatial modelling and rapid
visual assessment has been a major achievement of the spatial modelling process.
Maps of tree density, soil attributes, sheep and cattle stocking rates and NDVI, have
not previously been available at the resolution now prepared for the spatial model.
These products have been sought by a diverse range of clients for use in activities
ranging from bushfire control to greenhouse gas inventories.
The development of an operational drought alert model is dependent on the supply of
products from other organisations, e.g. real time climate data from the Bureau of
Meteorology (BoM), animal numbers from Australian Bureau of Statistics (ABS) and
pasture condition maps from the Meat Research Corporation (MRC). Changes in
policy and computing systems by other organisations can seriously limit QDPI’s
capacity to maintain an operational system. These issues are discussed in relation to
climate data in the following section.
1. Rainfall and climate: Daily meteorological surfaces available for Australia
Daily climate data
There are approximately 500 meteorological stations in Australia which keep daily or
hourly climatic records and report to BoM. Daily climate data (temperature, vapour
pressure, evaporation, radiation), as supplied by the Bureau, have been
interpolated to a 0.05 degree grid over the whole of Australia. The interpolation used
a technique developed by Dr Mike Hutchinson at ANU’s Centre for Resource and
Environmental Studies (CRES). This technique is well accepted and accounts for
elevation as well as horizontal position. It also takes account of the long-term climate
Section 5 - An Operational Model for Queensland 109

Evaluating The Risk of Pasture and Land Degradation in Native Pastures in Queensland
variability at each station to assess how representative a particular value is. Thus, at
each pixel there is an estimate of each climate variable: maximum and minimum
temperature, evaporation and vapour pressure, for each day since 1957, (1964 in the
case of evaporation). This represents the earliest daily data available in complete
form from BoM. Daily radiation data have been estimated from daily cloud cover.
Daily rainfall data
In Section 2 we determined that seasonal rainfall accounted for 40% of the variation
in measurement of pasture growth across Queensland. The daily rainfall record for
the whole of Australia is fairly complete from 1889 onwards. Over 6 000 rainfall
stations have been reporting monthly totals from approximately 1910 onwards.
However, there has been a sharp decline in reporting stations in the last 25 years from
a peak of over 8 000 stations in the early 1970s to approximately 5 000 stations
currently. Monthly rainfall totals have been interpolated using Hutchinson’s spline
technique (above). As daily values of rainfall are spatially “noisy”, daily values were
reconstructed by re-distributing the interpolated monthly totals by the daily pattern of
the nearest rainfall stations.
In summary, for each pixel across Australia, we have daily rainfall estimates from
1889 onward, daily estimates of maximum daily temperature, and minimum 9.00 am
vapour pressure and daily solar radiation from 1957 onwards, and daily evaporation
from 1964 onwards. These data provide the opportunity to re-analyse all production
data using standard climatic inputs.
Interpolation of data from the near real-time rainfall network
Rainfall data described in the above section can be up to three months old before
being made available by BoM. However, near real-time monthly rainfall data is
received from BoM’s telegraphic station network and this the only near-real time data
available before ‘paper’ reports, from a wider number of stations, are made available
by BoM. As such this data is critical to an alert system operating in near-real time.
As this rainfall station network is a much smaller sub-set of rainfall data that is
eventually received by BoM, a different technique to that described above was
Section 5 - An Operational Model for Queensland 110

Evaluating The Risk of Pasture and Land Degradation in Native Pastures in Queensland
required to interpolate this rainfall data . A Krigging and rainfall normalisation spline
method has been developed but research on interpolation methods for the near real-
time rainfall network is still continuing. Comparison of model output with reports
from QDPI stock inspectors showed occasional large errors in rainfall interpolation in
rain shadow regions (e.g. Nebo shire) and areas of low station density. Such errors
highlight the need for an accurate high resolution rainfall reporting system.
Preliminary research indicates that Geostationary Meterological Satellite (GMS) data
can probably address some of these problems.
Operation of BoM’s real-time agrometeorological system
Near real-time climate data is supplied by BoM via the Internet. Rainfall data from
the telegraphic network, temperature and humidity data are supplied from a smaller
number of climate stations, and radiation estimates are provided from a solar
insolation model on a point only basis.
The continuing operation of the spatial model in near real-time is dependent on
accurate real-time data. Many problems exist with the operation of BoM’s near-real
time system: missing data; inconsistent totals; inconsistent lists of rainfall stations
between Melbourne H.Q. and each state; and intermittent data availability. Lack of
quality real-time data can present a major problem in the operation of the drought
alert model. Initial problems are being resolved with many meetings between QDPI
and various representatives from both the Brisbane and Melbourne offices of BoM.
The matter has also been raised at the Standing Committee’s Agrometeorology forum
by QDPI. A joint project Specific Information for Land Owners (QNR3) with the
BoM, QDNR, QDPI and others is now funded by RIRDC (1997).
Section 5 - An Operational Model for Queensland 111

Evaluating The Risk of Pasture and Land Degradation in Native Pastures in Queensland
2. Soil databases and soil water parameters
The Atlas of Australian Soils (Northcote et al. 1960-68) was procured as an ARC-
INFO coverage. Various unlabelled polygons have been corrected and the coverage
has been rasterised into the spatial model format.
While large amounts of effort have been expended in mapping soil boundaries at
various resolutions and describing soils in a taxonomic sense, very little information
is available on parameters to ‘attach’ to the mapped soil polygons. Considerable
development has been required to derive estimates of soil depth, plant available water
holding capacity, infiltration, erosivity, bulk density, and nutritional parameters such
as pH, phosphorus, nitrogen and organic carbon.
J.O. Carter, has analysed a database of soil profile morphology covering 24 000
samples. Mean soil water capacity for all principal profile forms has been derived
from the texture and structure descriptions. Comparison with 0.33 and 15 bar water
contents in QDPI’s soil chemistry database still remains to be completed. Other
scientists in QDPI are developing predictive equations that relate plant available
water to 15 bar measurements (M. Littleboy pers. comm., K.A. Day unpublished
GUNSYNpD data).
As yet no map of slope or soil erosivity is available to allow simulations of soil
erosion in absolute terms. Nevertheless, approaches to predict these parameters from
digital elevation models and soil variables is being explored (M. Littleboy pers.
comm.).
3. Local government boundaries and land use maps
QDPI has rasterised the national maps of local government boundaries, national
parks, ungrazed lands and military training lands. In Queensland cultivated areas
have been mapped from Landsat TM for the wheat modelling component of the
LWRRDC project QPI20, and cane lands has also been completed. In other states,
cultivated land has been mapped from National Oceanographic and Atmospheric
Administration’s (NOAA) images.
Section 5 - An Operational Model for Queensland 112

Evaluating The Risk of Pasture and Land Degradation in Native Pastures in Queensland
4. ABS stock densities and total grazing pressure
QDPI has Australian Bureau of Statistics (ABS) animal number information available
from 1952. From 1987 onwards, a spatial raster of animal numbers has been
developed for each year. The ABS data have been apportioned across the shire pixels
according to pasture type, tree cover and indices of potential pasture productivity.
The ABS have intimated that they are considering reducing the coverage and
frequency of producer surveys. QDPI have had a number of discussions with the
ABS during 1993-95 about the drought alert project and future environmental uses of
animal number information. The annual update of accurate animal numbers is
fundamental to the operation of the degradation alert system. However, changes in
scope of the census (based on estimated value of agricultural operations) and
exclusion of herd and flock composition items from the annual census are likely to
increase the difficulty of accurately calculating pasture utilisation.
The grazing pressure of uncontrolled grazers (feral animals and native fauna) is a
major issue in calculating the risk of degradation. Graziers in western Queensland
report major impacts due to the presence of uncontrolled grazers. J.O. Carter has
produced prototype density maps in a spatial mode. Some reparameterisation of
pasture losses (e.g. detachment rates) will be necessary once these data sets are
available.
5. Native pasture community maps
QDPI has incorporated Tothill and Gillies’ (1992) classification of pasture types in
Queensland. A lookup table of various pasture parameters derived from
parameterising GRASP on GUNSYNpD datasets has been produced for each pasture
class. The lookup table is being modified as a result of work with the field validation
data produced by this project. However, data on land and pasture condition status
(i.e. A,B or C) are not yet available from MRC.
6. Tree Density
Danaher et al. (1992) developed relationships between tree basal area and remote
sensing attributes, e.g. mean and variance of NOAA NDVI images. Within a 5 km x
Section 5 - An Operational Model for Queensland 113

Evaluating The Risk of Pasture and Land Degradation in Native Pastures in Queensland
5 km pixel, trees are unlikely to be uniformly distributed. Given the non-linear
relationship between tree density and pasture growth, large errors in modelling
pasture growth are possible. For each pixel, a synthetic tree basal area was calculated
to overcome the non-linear effects of tree density and still allow simulation at a pixel
resolution. Field surveys during 1995 examined alternative approaches to calculating
the effect of trees. Tree density for the state is currently (1997) being remapped at
high (30 m x 30 m) resolution using Landsat Thematic Mapper data as part of the
Queensland Government funded project State Land Use and Trees Study (SLATS).
5.3 VALIDATION OF THE SPATIAL MODEL
Validation against NOAA imagery
NDVI data for Queensland (89 images, 1988-1994) were averaged from 1 km x 1 km
pixels to 5 km x 5 km pixels and registered to the spatial modelling grid. The NDVI
data were, at the time of the following analysis (1995), radiometrically uncorrected
but had improved cloud masking. All images were corrected for sensor drift and
speckle lines were removed. The analysis screened out very low cover situations
where soils are the main source of reflectance.
Satellite data were analysed in two ways to best reflect spatial and temporal
variability. Firstly, a spatial correlation map was produced in which the output image
pixels contained a Pearson r value. This was carried out on a pixel by pixel basis
giving a maximum of 89 paired data points for each pixel. Maps containing slope,
intercept and the number of observations were also produced. The second analysis
was, for each date, to calculate the correlation across Queensland. This provided 89
correlations between entire NDVI images and simulated NDVI since 1988 (Figure
5.1). The correlations were of a similar magnitude to the correlation between NDVI
and direct field measurement of the green cover, and similar or better than those
obtained by Coughenour (1992) for a similar scheme in Kenya.
Section 5 - An Operational Model for Queensland 114

Evaluating The Risk of Pasture and Land Degradation in Native Pastures in Queensland
Section 5 - An Operational Model for Queensland 115
Figure 5.1: Temporal correlation between 89 image pairs for NOAA satellite NDVI and model derived NDVI
Future improvements may include:
1) better cloud masking (especially for those areas having soils with a high
reflectance in the visible band);
2) correction of reflectance for adsorption by ozone;
3) correction for sensor geometry i.e. sun - target - sensor angles;
4) correction for water vapour and aerosols;
5) use of soil adjusted NDVI to achieve better results at low cover levels;
6) inclusion of a dynamic rather than static tree canopy model, where tree foliage
projected cover responds dynamically to available soil moisture and air
temperature, thereby, improving water balance and the “synthetic” (model
derived) NDVI; and
7) use of a subset of satellite data to calibrate certain model parameters
0 10 20 30 40 50 60 70 80 90 100Time (Noaa image # 1988-1994)
0.20
0.30
0.40
0.50
0.60
0.70
0.80C
orre
latio
n (r
)
Mean r = 0.69 for 89 images
NDVI data < 70 units not included

Evaluating The Risk of Pasture and Land Degradation in Native Pastures in Queensland
Field validation using visual assessment
As part of the LWRRDC project QP120, two officers were employed to carry out
field data collection (Brook 1996). The process involved visual estimation of pasture
yields from a moving vehicle. These estimates were corrected by 10 calibration
harvests per day. Over 220 000 visual estimates of yield were made. The data were
collected in transit and entered into a notebook computer, automatically time stamped
and geo-referenced by an attached global positioning instrument (GPS). Custom
software, “Trackman”, has been modified specifically for this purpose. The team
have also collected a large number of tree basal area measurements for validation of
the tree map. This map was derived by syntheses of 1 km x 1 km resolution imagery
from the NOAA satellite.
Software has been written to calibrate yield measurements; average data to 5 km x 5
km pixels in the modelling grid; and compare the data with the model output.
Spatial model parameters were calibrated for each pasture community (Table 5.1).
The calibrated model explained a high proportion (r2=0.77) of the variation between
shires (Table 5.2) which had at least nine pixels of field observations.
Table 5.1 Predicted and field estimated yield (kg/ha) for various pasture communities as at 20 April 1994 (where observations cover more than nine pixels).
Pasture community Observed Predicted No. pixels
Black speargrass 1670 1799 133
Channel pastures 646 419 41
Brigalow pastures 1388 1008 39
Queensland bluegrass 1671 2113 10
Mitchell grass (ashy downs) 329 319 30
Spinifex on sand dunes 1565 1625 28
Mulga on residuals 624 652 48
Mitchell grass (northern) 1114 1052 83
Blady grass (southern) 1477 1400 12
Section 5 - An Operational Model for Queensland 116
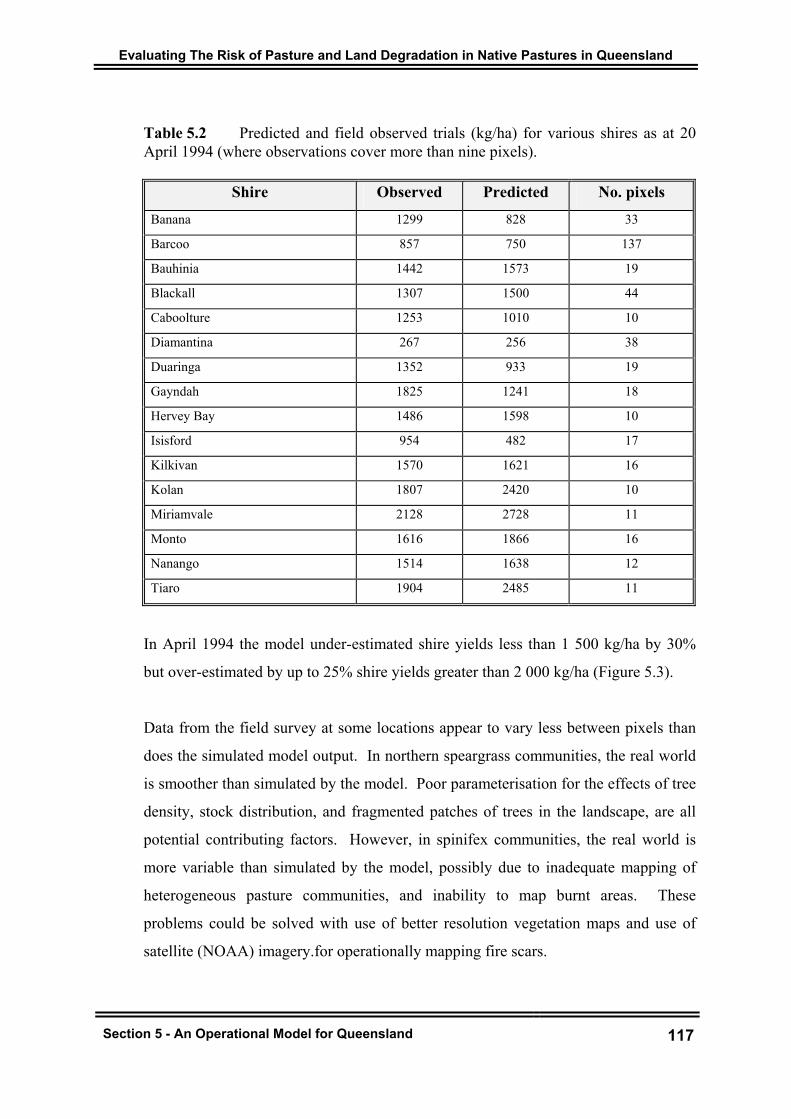
Evaluating The Risk of Pasture and Land Degradation in Native Pastures in Queensland
Table 5.2 Predicted and field observed trials (kg/ha) for various shires as at 20 April 1994 (where observations cover more than nine pixels).
Shire Observed Predicted No. pixels
Banana 1299 828 33
Barcoo 857 750 137
Bauhinia 1442 1573 19
Blackall 1307 1500 44
Caboolture 1253 1010 10
Diamantina 267 256 38
Duaringa 1352 933 19
Gayndah 1825 1241 18
Hervey Bay 1486 1598 10
Isisford 954 482 17
Kilkivan 1570 1621 16
Kolan 1807 2420 10
Miriamvale 2128 2728 11
Monto 1616 1866 16
Nanango 1514 1638 12
Tiaro 1904 2485 11
In April 1994 the model under-estimated shire yields less than 1 500 kg/ha by 30%
but over-estimated by up to 25% shire yields greater than 2 000 kg/ha (Figure 5.3).
Data from the field survey at some locations appear to vary less between pixels than
does the simulated model output. In northern speargrass communities, the real world
is smoother than simulated by the model. Poor parameterisation for the effects of tree
density, stock distribution, and fragmented patches of trees in the landscape, are all
potential contributing factors. However, in spinifex communities, the real world is
more variable than simulated by the model, possibly due to inadequate mapping of
heterogeneous pasture communities, and inability to map burnt areas. These
problems could be solved with use of better resolution vegetation maps and use of
satellite (NOAA) imagery.for operationally mapping fire scars.
Section 5 - An Operational Model for Queensland 117

Evaluating The Risk of Pasture and Land Degradation in Native Pastures in Queensland
Figure 5.3: Comparison of pasture biomass predicted by the spatial model and observed pasture biomass for Queensland shires.
Validation against exclosure data
The major pasture parameters, transpiration-use-efficiency and detachment rates were
calibrated from the extensive field data described earlier in this section using the first
50 000 observations. High correlation (Figure 5.4) was found between TUE for each
pasture community and TUE derived from the GUNSYNpD data set (Section 2). This
result suggests that the GUNSYNpD data set is representative of the major grasslands
of Queensland. The major outlier was the mulga lands of higher TUE in the extensive
data, This may indicate a build-up of nitrogen due to drought prior to field sampling
and/or, a shift in composition to species with higher transpiration-use-efficiencies
such as forbs and Aristida spp.
Section 5 - An Operational Model for Queensland 118
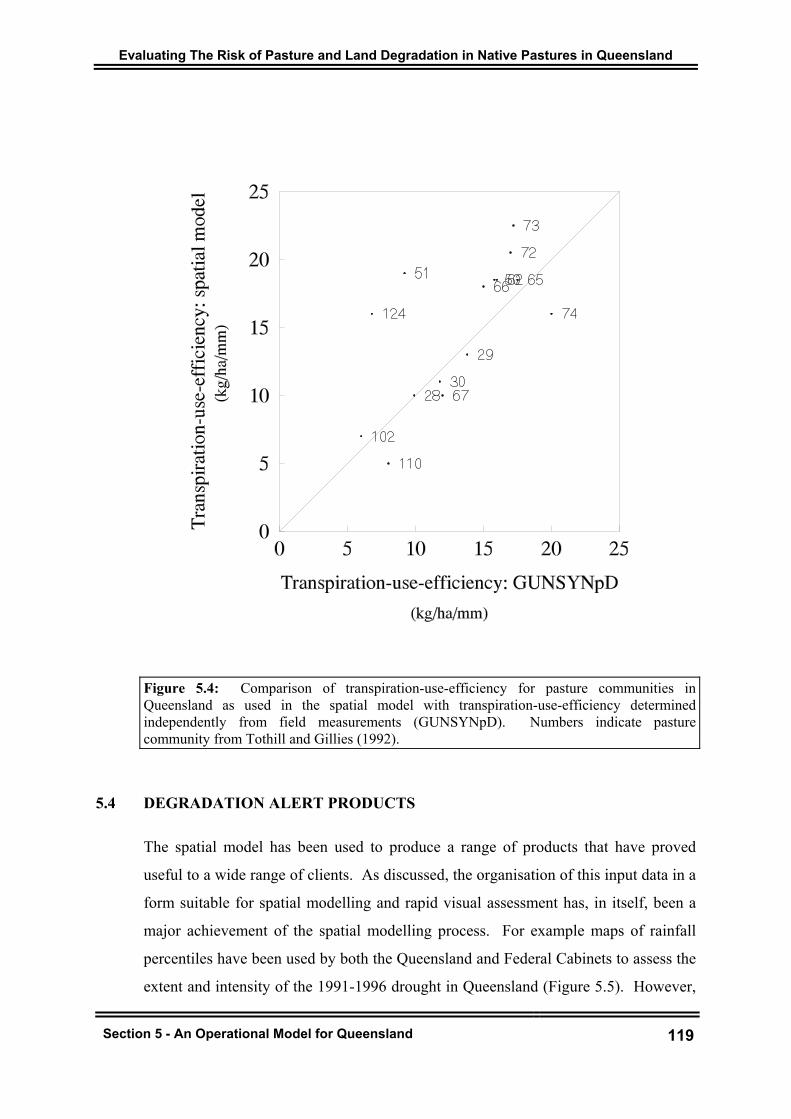
Evaluating The Risk of Pasture and Land Degradation in Native Pastures in Queensland
Section 5 - An Operational Model for Queensland 119
Figure 5.4: Comparison of transpiration-use-efficiency for pasture communities in Queensland as used in the spatial model with transpiration-use-efficiency determined independently from field measurements (GUNSYNpD). Numbers indicate pasture community from Tothill and Gillies (1992).
5.4 DEGRADATION ALERT PRODUCTS
The spatial model has been used to produce a range of products that have proved
useful to a wide range of clients. As discussed, the organisation of this input data in a
form suitable for spatial modelling and rapid visual assessment has, in itself, been a
major achievement of the spatial modelling process. For example maps of rainfall
percentiles have been used by both the Queensland and Federal Cabinets to assess the
extent and intensity of the 1991-1996 drought in Queensland (Figure 5.5). However,

Evaluating The Risk of Pasture and Land Degradation in Native Pastures in Queensland
the primary aim of organising this data was to monitor and forecast, in near real-time,
risks of land and pasture degradation. While most products are still experimental they
are gradually released for use on the “Long Paddock” Internet site (URL:
http://www.dpi.qld.gov.au/longpdk)
Pasture growth
The major output of the spatial model is pasture growth incorporating the effects of
climate, soil, stock, species and trees. When each seasonal map is expressed as a
percentage of average pasture growth (1956-1996), areas of likely feed deficiency and
potential degradation are quickly highlighted (Figure 5.6). These maps were used
during 1996 to assess the intensity of the drought situation in Queensland. Shire
drought declarations (e.g. September 1996, Figure 5.7) correspond well with
calculated percentile pasture growth (Figure 5.6) and less well with percentile rainfall.
(Figure 5.5).
In broad agreement with the extent and intensity of low relative pasture productivity
(Figure 5.6) is the average NDVI for August 1996 ranked relative to the previous 15
Augusts since measurements began in 1981 (Figure 5.8, N. Flood, DNR, Climate
Impacts and Applications). However the meaning of a low relative NDVI for one
location to the next is not well understood. This new methodology requires further
evaluation on a month-to-month and location-to-location basis as anything that effects
green cover will effect the ranking of NDVI (e.g. reduction in tree canopy cover in
response to soil water deficit, variable occurrence of frost).
Preliminary forecasting of future condition has been attempted using the ‘analog year
method’ of the Bureau of Meteorology Climate Outlook Bulletin allowing six
monthly forecasts of feed deficit. However, a better approach based on SOI phase
forecasting (Stone and Auliciems 1992) using up to 10 historical years has been
operationalised.
Section 5 - An Operational Model for Queensland 120

Evaluating The Risk of Pasture and Land Degradation in Native Pastures in Queensland
The legends below describe figures presented on the facing page.
Figure 5.5 Queensland rainfall for the 12 months up to and including August 1996
ranked against previous records for the same period since 1956. Data
is from the Bureau of Meteorology, Melbourne. Contours are subject
to interpolation error. Areas with insufficient data e.g. the far south-
west and north of the state are left blank.
Figure 5.6 Pasture growth expressed on the same basis as rainfall in Figure 5.5 i.e.
for the 12 months up to and including August 1996 ranked against
previous records for the same period since 1956. Pasture growth is
calculated by the pasture model GRASP on a 5 km x 5 km grid using
rainfall presented in Figure 5.5.
Figure 5.7 Drought declared shires and IDP status in Queensland as at September
1, 1996.
Figure 5.8 NDVI calculated from NOAA AVHRR imagery for August 1996
ranked relative to NDVI for previous Augusts since 1981 in
Queensland.
Section 5 - An Operational Model for Queensland 121

Evaluating The Risk of Pasture and Land Degradation in Native Pastures in Queensland
Section 5 - An Operational Model for Queensland 122

Evaluating The Risk of Pasture and Land Degradation in Native Pastures in Queensland
Section 5 - An Operational Model for Queensland 123

Evaluating The Risk of Pasture and Land Degradation in Native Pastures in Queensland
Actual utilisation relative to safe utilisation
The calculation of pasture growth (e.g. Figure 5.6) provides an ability to better
account for climatic impacts. A further step is to account for grazing impacts. This
we have achieved through comparing actual levels of pasture utilisation with safe
levels of utilisation (Section 4). To make such a calculation with the spatial model
involved a number of steps. As detailed in Section 4, the benchmark stocking rate
chosen for sustainable resource management is that which results in 15-25%
utilisation of potential (i.e. exclosure) pasture growth. Potential pasture growth is
simulated as if each pixel was an annually mown exclosure. “Safe” stocking rates are
calculated as a conservative, constant rate which results in 15% utilisation of average
growth since 1986. ‘Safe” stocking rates are used to simulate pasture production, run-
off, soil loss and grass basal cover as a base line of acceptable resource use (Section
1). Figure 5.9 shows the range of utilisation levels across Queensland for the nine
months to June 1994 based on a constant “safe” stocking rate which results in 15%
utilisation of average pasture growth in the longer term (1986-94).
The spatial model is then run with animal numbers using the time series of actual
stock numbers supplied by ABS to calculate utilisation, e.g. June 1994 (Figure 5.10).
For each pasture and resource variable, e.g. cover and run-off, the ratio of actual to
safe allows assessment of the risks of degradation. Given the current lack of maps of
slope and soil erosivity the risks of degradation can only be calculated, at present, in
relative rather than absolute terms. For example, Figure 5.11 shows the areas where
reported ABS stocking rates exceed the calculated safe stocking rate. The
consequences of the stocking rates for run-off, for example, are shown relative to a
safe stocking rate (Figure 5.12). For the example shown in Figure 5.12, in areas
where stocking rates exceeded the calculated “safe” stocking rate, run-off was greater
than that simulated for a “safe” stocking rate, in some areas by up to 100%.
Section 5 - An Operational Model for Queensland 124

Evaluating The Risk of Pasture and Land Degradation in Native Pastures in Queensland
The legends below describe figures presented on the facing page.
Figure 5.9 Utilisation (pasture eaten/ pasture grown) for Queensland for the nine
months to June 1994. Pasture eaten is based on a calculated “safe”
stocking rate as defined in the text.
Figure 5.10 Utilisation (pasture eaten/ pasture grown) for Queensland for the nine
months to June 1994. Pasture eaten is based on shire stock numbers
reported to the Australian Bureau of Statistics.
Figure 5.11 The ratio of ABS shire stock numbers for Queensland for 1993/1994 to
a calculated long-term “safe” stocking rate as defined in the text.
(This figure is the same as that obtained by “dividing” Figure 5.10 by
Figure 5.9)
Figure 5.12 An example of the type of calculation which can be made to assess the
risk of land degradation in Queensland: simulated run-off based on
shire stock numbers reported to the Australian Bureau of Statistics
relative to run-off simulated for a calculated long-term “safe” stocking
rate as defined in the text.
Section 5 - An Operational Model for Queensland 125

Evaluating The Risk of Pasture and Land Degradation in Native Pastures in Queensland
Section 5 - An Operational Model for Queensland 126

Evaluating The Risk of Pasture and Land Degradation in Native Pastures in Queensland
Section 5 - An Operational Model for Queensland 127

Evaluating The Risk of Pasture and Land Degradation in Native Pastures in Queensland
5.5 CONCLUSION
The operation of the spatial model shows that it is possible to model pasture growth
and utilisation at a resolution sufficient to allow new debate of risks of drought and
feed deficit occurring. The calculation of a relative utilisation using grazier estimates
of safe stocking rate provides for the first time a link between expert knowledge,
grazing science, seasonal forecasts and computer power. The benefits of such
calculations will be assessed as drought and degradation alerts become operational in
near real-time. Re-analysis of past events and real-time assessment of current and
forecast conditions will refine and build confidence in these calculations.
Improvements to the spatial model will come from improved spatial inputs, improved
model functions and parameterisation derived from detailed “point” studies.
Section 5 - An Operational Model for Queensland 128

Evaluating The Risk Of Pasture And Land Degradation In Native Pasture In Queensland
SECTION 6 - LITERATURE CITED
Anon. (1994). “Farm surveys report 1994”, ABARE, Canberra.
Anon. (1995a). The forage base: climate, soils and pasture. In “Integrated management for sustainable forage-based livestock systems in the tropics” (Ed. D. Gramshaw) pp.7-25. Tropical Grassland Society of Australia - Occasional Publication No. 6.
Anon. (1995b). Beef industry: constraints and opportunites. In “Integrated management for sustainable forage-based livestock systems in the tropics” (Ed. D. Gramshaw) pp.95-106. Tropical Grassland Society of Australia - Occasional Publication No. 6.
Ash, A.J., Prinsen, J.H., Myles, D.J., and Hendricksen, R.E. (1982). Short-term effects of burning native pasture in spring on herbage and animal production in south-east Queensland. Proceedings of the Australian Society of Animal Production, 14: 377-80.
Ash, A.J. and McIvor, J.G. (1995). Land condition in the tropical tallgrass pasture lands. 2. Effects on herbage quality and nutrient uptake. Rangeland Journal 17: 86-98.
Beale, I. F. (1985). Animal plant interactions in native pastures of western Queensland. Final Report to the AWC, (WRTF. K/2/900C).
Brook, K.D., Carter, J.O., Danaher, T.J., McKeon, G.M., Flood, N.R. and Peacock, A. (1992). SWARD: Statewide analysis of risks of land degradation in Queensland. Agricultural Systems and Information Technology Newsletter. 4: 9-11.
Brook, K.D. (1996). QPI20 Development of a National Drought Alert Strategic Information System. Final Report to LWRRDC.
Burrows, W.H. (1994). Milestone report to Meat Research Corporation: Effects of stocking rate, legume augmentation, supplements and fire on animal production and stability of native pastures (DAQ080).
Christie, E.K. (1978). Herbage condition assessment of an infertile semi arid grassland based on site production potential. Australian Rangeland Journal. 1: 87-94.
Clewett, J.F., Howden, S.M., McKeon, G.M and Rose C.W. (1991). Use of systems analysis and the Southern Oscillation Index to optimise management of grain sorghum production from a farm dam irrigation system. In, “Climatic risk to crop production: Models and management for the semiarid tropics and sub-tropics.” (ed. R.C. Muchow and J.A. Bellamy) pp. 205-32. CAB International, Wallingford.
Coughenour, M.B. (1992). Spatial modelling and landscape characterisation of an African pastoral ecosystem: A prototype model and its potential use for monitoring drought. In: Proceedings of the International Symposium on Ecological Indicators, October 1990, Fort Lauderdale, Florida, pp. 787-810.
Section 6 - Literature Cited 129

Evaluating The Risk of Pasture and Land Degradation in Native Pastures in Queensland
Cowan, D.C. (1994). Databases for Modelling of Rangeland Systems. Proceedings of the 8th
Australian Rangeland Conference, Katherine, p. 177.
Danaher, T., Carter J.O., Brook, K.D., and Dudgeon G. (1992). Broad-scale vegetation mapping using NOAA AVHRR Imagery. Proceedings of the 6th Australasian Remote Sensing Conference, Wellington, New Zealand, Vol. 3 pp. 128-37.
Day, K.A., McKeon, G.M. and Orr, D.M. (1993). Comparison of methods for assessing productivity of native pastures in Queensland. Proceedings of the XVII International Grassland Congress Palmerston North, New Zealand. pp. 784-5.
Day, K.A., Scattini W.J. and Osborne, J.C. (1996). Extending carrying capacity calculations to the Central Burnett region of Queensland. In: DroughtPlan Final Report, LWRRDC (M. Stafford-Smith and J. Clewett in prep.)
Filet, P.G. (1990). The distribution of biomass, nitrogen and phosphorus in grazed Heteropogon contortus pastures. Ph.D. Thesis. University of Queensland.
Fitzpatrick, E.A. and Nix, H.A. (1970). The climatic factor in Australian grassland ecology. In“Australian grasslands” (ed. R.M. Moore). ANU Press, Canberra. pp. 1-26.
Gardener, C.J., McIvor, J.G. and Williams, J. (1990). Dry tropical rangelands: solving one problem and creating another. Proceedings of the Ecological Society of Australia 16: 279-86.
Gillard, P. (1979). Improvement of native pasture with Townsville stylo in the dry tropics of sub-coastal northern Queensland. Australian Journal of Experimental Agriculture and Experimental Husbandry 19: 325-36.
Hammer, G.L. and Muchow, R.C. (1994). Assessing climatic risk to sorghum production in water-limited subtropical environments. I. Development and testing of a simulation model. Field Crops Research 36: 221-34.
Hattersley, P.W. and Watson L. (1992). Diversification of photosynthesis. In: “Grass evolution and domestication” (ed. by G.P. Chapman), pp. 38-116. Cambridge University Press, Cambridge.
Howden, S.M. (1988). Some aspects of the ecology of four tropical grasses with special emphasis on Bothriochloa pertusa. Ph. D. Thesis, Griffith University. 224pp..
Johnston, P.W., McKeon, G.M. and Day, K.A. (1996). Objective ‘safe’ grazing capacities for south-west Queensland Australia: development of a model for individual properties, Rangeland Journal 18: 244-58.
McCaskill, M.R., and McIvor, J.G. (1993). Herbage and animal production from native pastures oversown with Stylosanthes hamata 2. Modelling studies. Australian Journal of Experimental Agriculture 33: 571-79.
McCown, R.L., Gillard, P., and Edye, L.A. (1974). The annual variation in yield of pastures in the seasonally dry tropics of Queensland. Australian Journal of Experimental Agriculture and Animal Husbandry 14: 328-33.
Section 6 - Literature Cited 130

Evaluating The Risk of Pasture and Land Degradation in Native Pastures in Queensland
McCown, R.L., Gillard, P., Winks, L., and Williams, W.T. (1981). The climate potential for
beef cattle production in tropical Australia. 1. Simulating the annual cycle of liveweight change. Agricultural Systems 6: 303-17.
McIvor, J.G., Ash A.J. Mott, J.J., Andrew, M.H. (1994). Ecology of grazed rangelands in northern Australia. Proceedings of the 8th Australian Rangeland Conference, Katherine, pp. 115-24.
McIvor, J.G., Ash, A.J. and Cook, G.D. (1995a). Land condition in the tropical tallgrass pasture lands. 1. Effects on herbage production. Rangeland Journal 17: 69-85.
McIvor, J.G., Williams, J. and Gardener, C.J. (1995b). Pasture management influences runoff and soil loss in the semi-arid tropics. Australian Journal of Experimental Agriculture 35: 55-65.
McKeon, G.M., Brook, K.D., Carter, J.O., Day, K.A., Howden, S.M., Johnston, P.W., Scanlan, J.C. and Scattini, W.J. (1994). Modelling utilisation rates in the black speargrass zone of Queensland. Proceeding of 8th Australian Rangelands Conference, Katherine, pp. 128-32.
McKeon, G.M., Day, K.A., Howden, S.M., Mott, J.J., Orr, D.M., Scattini, W.J. and Weston, E.J., (1990). Management for pastoral production in northern Australia savannas. Journal of Biogeography 17: 355-72.
McKeon, G.M., Howden, S.M., Abel, N.O.J. and King, J.M. (1993). Climate change: adapting tropical and sub-tropical grasslands. Proceedings of the XVII International Grassland Congress Palmerston North, New Zealand. pp. 1181-90.
McKeon, G.M., Rickert, K.G., Ash, A.J., Cooksley, D.G. and Scattini, W.J. (1982). Pasture production model. Proceedings Australian Society of Animal Production 14: 202-4.
McKeon, G.M. and Rickert, K.G. (1984). A computer model of the integration of forage options for beef production. Proceedings Australian Society Animal Production. 15: 15-19.
McKeon, G.M., Stafford Smith, D.M, Ash, A.J., Burrows, W.H., Clewett, J.F., Rebgetz, R., Scanlan, J.C., and Silburn M. (1997). Simulation of grazing strategies for beef production in north-eastern Queensland. DroughtPlan Working Paper No. 8. Queensland Department of Primary Industries, Brisbane.
Metherell, A.K., Harding L.A., Vernon Cole, C., Parton, W.J. (1993). CENTURY Soil organic matter model environment. Technical documentation Agro-ecosystem Version 4.0. Great Plains System Research Unit Technical Report No. 4. USDA-ARS Fort Collins, CO.
Minson, D.J., and McDonald, C.K. (1987). Estimating forage intake from the growth of beef cattle. Tropical Grasslands 21: 116-22.
Moore, R.M. (1970). Australian grasslands. In: “Australian grasslands” (ed. R.M. Moore) pp. 85-100. ANU Press, Canberra
Section 6 - Literature Cited 131
Evaluating The Risk of Pasture and Land Degradation in Native Pastures in Queensland
Mott, J.J., Williams, J., Andrew, M.H., and Gillison, A.N. (1985). Australian savanna
ecosystems. In “Ecology and management of the worlds savannas” (eds. J.C. Tothill and J.J. Mott) pp. 56-82., Australian Academy of Science, Canberra.
Newman, P.A. (1992). Report on terminated project - DAQ37. Profitability of grazing properties on Julia Mitchell Grass Downs (1985/86-1989/90). Queensland Department of Primary Industries RQR92013.
Norman, M.J.T. (1963). The pattern of dry matter and nutrient content changes in native pastures in Katherine, N.T. Australian Journal of Experimental Agriculture and Animal Husbandry 14: 328-33.
Northcote, K.H. and others (1960-68). “Atlas of Australian Soils”, Sheets 1-10 with explanatory booklets. CSIRO and Melbourne University Press, Melbourne.
O’Rourke, P.K., Winks, L., Kelly A.M. (1992). North Australia Beef Producer Survey 1990. Queensland Department of Primary Industries and the Meat Research Corporation, Brisbane.
Orr, D.M. (1986). Factors effecting the vegetation dynamics of Astrebla Grasslands. Ph.D. thesis, University of Queensland, Brisbane.
Orr, D.M., Evenson, C.J., Lehane, J.K., Bowly, P.S., Cowan, D.C. (1993). Dynamics of perennial grasses with sheep grazing in Acacia aneura woodlands in south-west Queensland. Tropical Grasslands 27: 87-93.
Phelps, D.G., Orr D.M., Newman P.A. and Bird A.R. (1994). Grazing nothern Mitchell grasslands to foster susainable wool production (DAQ31) - Final report to AWRAP. Queensland Department of Primary Industries, Longreach.
Roe, R. and Allen G.H. (the late) (1993). Studies on the Mitchell grass association in south-western Queensland. 3. Pasture and wool production under different rates of stocking and continuous or rotational grazing. Rangeland Journal, 15: 302-19.
Rose, C.W., Begg, J.E., Byrne, G.F., Torssell, B.W.R., Goncz, J.H. (1972). A simulation model of growth: field environment relationships for Townsville Stylo (Stylosanthes humilis H.B.) pasture. Agricultural Meteorology, 10: 161-83.
Rose, C.W. (1985). Developments in soil erosion and deposition models Advances in Soil Science, 2: 1-63.
Sallaway, M.M., Waters D., Bridge B., and Wandera F.P. (1993). Variation in hydrological characteristics of the soils associated with grazed patches in granitic landscapes in northern Australia. Proceedings of the XVII International Grassland Congress Palmerston North, New Zealand. pp. 1900-3
Scanlan, J.C. (1980). Effects of spring wildfires on Astrebla (Mitchell grass) grasslands in north-west Queensland under varying levels of growing season rainfall. Australian Rangeland Journal, 2: 162-8.
Section 6 - Literature Cited 132

Evaluating The Risk of Pasture and Land Degradation in Native Pastures in Queensland
Scanlan, J.C. and McIvor, J.G. (1993). Pasture composition influences soil erosion in
Eucalyptus woodlands of northern Queensland. Proceedings of the XVII International Grassland Congress Palmerston North, New Zealand. pp.65-6.
Scanlan, J.C. and McKeon, G.M. (1993). Competitive effects of trees on pasture are a function of rainfall distribution and soil depth. Proceedings of the XVII International Grassland Congress Palmerston North, New Zealand. pp. 2231-2.
Scanlan, J.C., McKeon, G.M., Day, K.A., Mott, J.J. and Hinton, A.W. (1994). Estimating safe carrying capacities of extensive cattle grazing properties within tropical semi-arid woodlands of north-eastern Australia. Rangeland Journal 16: 64-76.
Scanlan, J.C., Pressland, A.J., and Myles, D.J. (1996). Run-off and soil movement on mid-slopes in north-east Queensland grazed woodlands. Rangeland Journal 18: 33-46.
Scattini, W.J. (1969). The effect on productivity of (1) variation in winter/spring stocking rate and conservation of sown pasture and (2) variation in summer/autumn stocking rate of native pasture at Gayndah, S.E. Queensland. M. Agr. Sc. Thesis, University of Queensland.
Scattini, W.J. (1973). A model for beef cattle production from rangeland and sown pasture in south eastern Queensland, Australia. PhD thesis, University of California, Berkley.
Scattini, W.J. (1981). Native pasture response to nitrogen and sulfur under two cutting frequencies on a cracking clay soil in southern Queensland. Australian Journal of Experimental Agriculture and Animal Husbandry 21: 326-33.
Shaw, W.H. (1957). Bunch speargrass dominance in burnt pastures in south eastern Queensland. Australian Journal of Agricultural Research 8: 325-34.
Stafford Smith, D..M., and Foran, B.D. (1988). Strategic decisions in pastoral management. Australian Rangeland Journal. 10: 82-95.
Stafford Smith, D.M., McKeon, G.M., Ash, A.J. and Breen, J. (1997a). Evaluating the use of SOI forecasts in north Queensland using the Herd-Econ/GRASP linked model. DroughtPlan Working Paper No. 9. CSIRO, Alice Springs.
Stafford Smith, D.M., Clewett, J.F., Moore, McKeon, G.M., Clark R. and many Project Participants (1997b). DroughtPlan: Full project report. DroughtPlan Working Paper No. 10. CSIRO, Alice Springs.
Stone, R.C., and Auliciems, A. (1992). SOI phase relationships with rainfall in eastern Australia. International Journal of Climatology., 12: 625-36.
Tanner, C.B. and Sinclair, T.R. (1983). Efficient water use in crop production: research or re-search? In: “Limitation to efficient water use in crop production” (eds. H.M. Taylor, W.R. Jordan and T.R. Sinclair) pp. 1-25. ASA,CSSA,SSSA, Madison, Wisconsin.
Tothill, J.C., Nix, H.A., Stanton, J.P. and Russel M.J. (1985). Land use and productive potentials of Australian savanna lands. In:”Ecology and management of the worlds
Section 6 - Literature Cited 133

Evaluating The Risk of Pasture and Land Degradation in Native Pastures in Queensland
savannas” (eds. J.C. Tothill and J.J. Mott) pp. 125-141. Australian Academy of Science, Canberra.
Tothill, J.C. and Gillies C. (1992). The pasture lands of northern Australia. Their condition, productivity and sustainability. Tropical Grasslands Society of Australia Occasional Publication No. 5, 106pp..
Wandera, P.F. (1993). Patches in a Heteropogon contortus dominated grassland in southeast Queensland - their characteristics, probable causes, implications and potential for rehabilitation. PhD. Thesis University of Queensland, St Lucia.
Weston, E.J., Harbison J., Lesley, J.K. Rosenthal K.M. and Mayer R.J. (1981). Assessment of the agricultural and pastoral potential of Queensland. Agriculture Branch Technical Report No. 27. Queensland Department of Primary Industries, Brisbane.
Weston, E.J. (1988). The Queensland Environment. In:”Native Pastures in Queensland: The resource and their Management” (eds. W.H. Burrows, J.C. Scanlan, and M.T. Rutherford) pp. 21-33. Queensland Department of Primary Industries Information Series QI870323, Queensland Department of Primary Industries, Brisbane.
Willcocks, J.R. and Young P. (1991). Queensland’s Rainfall History. Graphs of Rainfall Averages 1880-1988. Queensland Department of Primary Industries Information Series QI91002, Queensland Department of Primary Industries, Brisbane.
Williams, J.and Gardener C.J. (1984). Environmental constraints to growth and survival of Stylosanthes. In: “The biology and agronomy of Stylosanthes” (eds. H.M. Stace and L.A. Edye) pp. 181-201. Academic Press, Australia.
Williams, J. (1989). Land degradation: Evidence that current Australian farming practice is not sustainable. 16th National Conference of the Australian Farm Management Society. pp. 165-90.
Winter, W.H. (1987). Using fire and supplements to improve cattle production from monsoon tallgrass pastures. Tropical Grasslands. 21: 71-81.
Yee Yet, J.D.S., Silburn, M., Carroll, C., McKeon, G.M. and Willcocks, J.R. (1994). Improved prediction of soil moisture and run-off in pasture models Proceedings of the 8th Australian Rangeland Conference, Katherine, pp. 192-94.
Section 6 - Literature Cited 134