final report for highway idea project...
TRANSCRIPT

Highway IDEA Program
A Shape Memory Polymer Based Self-Healing Sealant for Expansion Joint Final Report for Highway IDEA Project 142 Prepared by: Guoqiang Li Louisiana State University
Baton Rouge, LA April 2012

Innovations Deserving Exploratory Analysis (IDEA) Programs Managed by the Transportation Research Board This IDEA project was funded by the NCHRP IDEA Program. The TRB currently manages the following three IDEA programs: The NCHRP IDEA Program, which focuses on advances in the design, construction, and
maintenance of highway systems, is funded by American Association of State Highway and Transportation Officials (AASHTO) as part of the National Cooperative Highway Research Program (NCHRP).
The Safety IDEA Program currently focuses on innovative approaches for improving railroad safety or performance. The program is currently funded by the Federal Railroad Administration (FRA). The program was previously jointly funded by the Federal Motor Carrier Safety Administration (FMCSA) and the FRA.
The Transit IDEA Program, which supports development and testing of innovative concepts and methods for advancing transit practice, is funded by the Federal Transit Administration (FTA) as part of the Transit Cooperative Research Program (TCRP).
Management of the three IDEA programs is coordinated to promote the development and testing of innovative concepts, methods, and technologies. For information on the IDEA programs, check the IDEA website (www.trb.org/idea). For questions, contact the IDEA programs office by telephone at (202) 334-3310. IDEA Programs Transportation Research Board 500 Fifth Street, NW Washington, DC 20001
The project that is the subject of this contractor-authored report was a part of the Innovations Deserving Exploratory Analysis (IDEA) Programs, which are managed by the Transportation Research Board (TRB) with the approval of the Governing Board of the National Research Council. The members of the oversight committee that monitored the project and reviewed the report were chosen for their special competencies and with regard for appropriate balance. The views expressed in this report are those of the contractor who conducted the investigation documented in this report and do not necessarily reflect those of the Transportation Research Board, the National Research Council, or the sponsors of the IDEA Programs. This document has not been edited by TRB. The Transportation Research Board of the National Academies, the National Research Council, and the organizations that sponsor the IDEA Programs do not endorse products or manufacturers. Trade or manufacturers' names appear herein solely because they are considered essential to the object of the investigation.
A Shape Memory Polymer Based Self-Healing Sealant for Expansion Joint
by
Guoqiang Li
Department of Mechanical Engineering
Louisiana State University
Baton Rouge, LA 70803
NCHRP IDEA142
conducted for
NCHRP IDEA Program
The contents of this report reflect the views of the author/principal investigator who is
responsible for the facts and the accuracy of the data presented herein. The contents do not
necessarily reflect the views or policies of the Transportation Research Board and Louisiana
Department of Transportation Development, or the Louisiana Transportation Research
Center. This report does not constitute a standard, specification, or regulation.
April 2012

NCHRP IDEA PROGRAM COMMITTEE CHAIR SANDRA Q. LARSON IOWA DOT MEMBERS GARY A. FREDERICK New York State DOT GEORGENE GEARY Georgia DOT JOE MAHONEY University of Washington MICHAEL MILES California DOT TOMMY NANTUNG Indiana DOT VALERIE SHUMAN Shuman Consulting Group LLC JAMES SIME Connecticut DOT (Retired) L. DAVID SUITS North American Geosynthetics Society FHWA LIAISON DAVID KUEHN Federal Highway Administration TRB LIAISON RICHARD CUNARD Transportation Research Board COOPERATIVE RESEARCH PROGRAM STAFF CRAWFORD F. JENCKS Deputy Director, Cooperative Research Programs
IDEA PROGRAMS STAFF STEPHEN R. GODWIN Director for Studies and Special Programs JON M. WILLIAMS Program Director, IDEA and Synthesis Studies INAM JAWED Senior Program Officer DEMISHA WILLIAMS Senior Program Assistant EXPERT REVIEW PANEL WALID ALAYWAN, Louisiana Transp. Research Center PAUL FOSSIER, Louisiana Department of Transportation and Development JENNY FU, Louisiana Department of Transportation and Development MIKE RICCA, Louisiana Department of Transportationand Development STEVEN SIBLEY, Louisiana Department of Transportation and Development MICHAEL BOUDREAUX, Louisiana Department of Transportation and Development
iii
ABSTRACT
Failure of expansion joints is a leading cause of damage to bridge superstructures and concrete pavements. Failure of sealant material facilitates decay of the structure beneath it. The objective of this study is to develop a novel shape memory polymer (SMP) based smart sealant to solve a couple of critical problems facing compression-sealed joint: building-up of compressive stress and sealant squeezing out of the channel. By programming SMP in 2-D stress condition (compression in horizontal or traffic direction and tension in vertical direction) and by controlling the transition temperature of the SMP below the highest temperature of the environment to be experienced, the accumulated compressive stress can be significantly released due to the two orders of drop in the stiffness of the SMP at temperature above its transition temperature; consequently, the concrete and the sealant may not be crushed. Simultaneously, the squeezing-out problem may also be eliminated due to shrinkage of the sealant in the vertical direction when the sealant recovers (shape memory effect), which is seemingly against the physics because it contracts when temperature rises. In this study, a two-dimensional programming device was designed and fabricated, and shape fixity and shape recovery ratios of SMP and its syntactic foam were determined. Laboratory-scale performance evaluation of the developed syntactic foam as a smart sealant for bridge deck and concrete pavement joints was conducted, including uniaxial compression, tension and shear tests, cyclic loading tests, water immersion tests, and functional stability tests under ultraviolent radiation. The feasibility of using two-step 1-D programming to replace one-step 2-D programming was established. Shape memory polymer based sealant was fabricated, programmed, and installed in two expansion joints at the Louisiana State University campus in January 2012.

iv

v
ACKNOWLEDGMENTS
This research project was funded by the Transportation Research Board (TRB)/Innovations Deserving Exploratory Analysis (IDEA) and the Louisiana Transportation Research Center (LTRC). The investigator would like to thank TRB and LTRC for sponsoring this project. The investigator would also like to thank Dr. Gefu Ji, Dr. Harper Meng, Dr. Tao Xu, Dr. Zhenyu Ouyang, and Mr. Abe King in the Department of Mechanical Engineering at Louisiana State University (LSU) for their assistance in conducting this research and the Office of Facility Service at LSU for helping in installing two expansion joints at LSU campus. Dr. Inam Jawed at TRB and Dr. Walid Alaywan at LTRC, managers of this project, shared their experience and knowledge with the investigator. My sincere thanks also go to the anonymous reviewers of this report for their in-depth comments and suggestions.

vi
vii
IMPLEMENTATION STATEMENT
This project aims at developing a new smart sealant for small span bridges or concrete
pavements. Because this is an innovative concept, there is no similar study in the open
literature. This study has answered several key questions: (1) The shape memory polymer
(SMP) based sealant can lower the compressive stress significantly in the summer when the
concrete wall expands so that crushing of concrete in the edge would be avoided. (2) This
SMP based sealant can contract in the vertical direction in the summer so that sealant
squeezing-out problem can be solved. (3) It is validated in the lab experiments that the smart
sealant is resilient when subjected to environmental attacks and cyclic loadings. (4) This
sealant can be programmed (or trained) by hybrid two-step 1-D programming. (5) This
sealant can be easily installed in expansion joint.
However, it must be indicated that this study is not ready to be used in practice because
large-scale installation and long-term field-level performance data are not available.

viii
ix
TABLE OF CONTENTS
ABSTRACT ............................................................................................................................. iii
ACKNOWLEDGMENTS .........................................................................................................v
IMPLEMENTATION STATEMENT .................................................................................... vii
TABLE OF CONTENTS ......................................................................................................... ix
LIST OF TABLES ................................................................................................................. xiii
LIST OF FIGURES ...................................................................................................................2
INTRODUCTION .....................................................................................................................6
OBJECTIVE ............................................................................................................................10
SCOPE ………………………………………………………………………………………12
METHODOLOGY ..................................................................................................................14
Literature Survey ........................................................................................................ 14 The Idea ...................................................................................................................... 15 Thermomechanical Characterization of Shape Memory Polymer Based Self-Healing Syntactic Foam Sealant for Expansion Joint .............................................................. 16
Raw materials .................................................................................................. 16 Biaxial specimen fabrication ........................................................................... 17 2-D programming of biaxial specimen ........................................................... 17 XRD examination ........................................................................................... 20
Experimental ............................................................................................................... 20 2-D shape recovery of programmed biaxial specimens .................................. 20 Compression test ............................................................................................. 20 Tension test ..................................................................................................... 22 Shear test ......................................................................................................... 22
Functional Stability under Environmental Attacks ..................................................... 24 Accelerated ultraviolet (UV) ageing ............................................................... 24 Accelerated hydrolytic ageing ........................................................................ 25 Compression test after environmental attacks ................................................ 25 Tension test after environmental attacks ......................................................... 26 Shape recovery test after environmental attacks ............................................. 26
Cyclic Loading Test .................................................................................................... 27 Cyclic loading tests at room temperature ........................................................ 27 Mechanical response under one thermo-mechanical cyclic loading ............... 28 Mechanical response under one-cyclic loading at room temperature ............. 28
Feasibility of Replacing One Step 2-D Programming by Two-Step 1-D Programming..................................................................................................................................... 29
Raw materials .................................................................................................. 29 Syntactic foam fabrication and specimen preparation .................................... 29 Programming................................................................................................... 32 Free shape recovery test .................................................................................. 35
RESULTS AND DISCUSSIONS ............................................................................................36
Thermomechanical Characterization of Shape Memory Polymer Based Self-healing
x
Syntactic Foam Sealant for Expansion Joint .............................................................. 36 Thermo-mechanical properties of biaxial specimens ..................................... 36 Compression test ............................................................................................. 39 Tension test ..................................................................................................... 42 Shear test results ............................................................................................. 43 Summary ......................................................................................................... 43
A Shape Memory Polymer Based Syntactic Foam with Negative Poisson’s Ratio ... 45 XRD analysis .................................................................................................. 45 Compression tests along three orientations..................................................... 46 Poisson’s ratio of the programmed foam under compression along the three orientations ...................................................................................................... 48 Uniaxial tension tests along two orientations ................................................. 50 Poisson’s ratio of the programmed foam under tension along two orientations......................................................................................................................... 51 Summary ......................................................................................................... 53
Effects of Ultraviolet Radiation on Morphology and Thermomechanical Properties of Shape Memory Polymer Based Syntactic Foam ......................................................... 54
Morphology..................................................................................................... 54 Compression test results ................................................................................. 55 Tension test results .......................................................................................... 57 Combined effects of UV and water ................................................................ 58 Recovery stress test ......................................................................................... 61 Summary ......................................................................................................... 62
Cyclic Stress–strain Behavior of Shape Memory Polymer Based Syntactic Foam Programmed by 2-D Stress Condition ........................................................................ 63
2-D programming results ................................................................................ 63 Cyclic stress-strain behavior of the foam ........................................................ 64 Cyclic stress-strain response of the pure SMP ................................................ 67 Energy dissipation under cyclic loading ......................................................... 70 Stress-strain response under one thermo-mechanical cyclic loading ............. 72 Stress-strain response under one-cyclic loading at room temperature ............ 74 Summary ......................................................................................................... 76
Behavior of Thermoset Shape Memory Polymer Based Syntactic Foam Sealant ...... 77 Trained by Hybrid Two-Stage Programming ............................................................. 77
Thermomechanical behavior ........................................................................... 77 Recovery sequence .......................................................................................... 83 Summary ......................................................................................................... 88
FIELD-LEVEL INSTALLATION ..........................................................................................89
Specimen Preparation and Experimental Set-up ......................................................... 89 Raw materials .................................................................................................. 89 Specimen preparation ...................................................................................... 89 Programming process...................................................................................... 90 Thermal and moisture analysis ....................................................................... 93 Dynamic mechanical analysis ......................................................................... 93 DSC analysis ................................................................................................... 95 Thermomechanical test ................................................................................... 96

xi
SMP Joint Installation and Observation ..................................................................... 98 SMP slab installation ...................................................................................... 98 SMP joint observation................................................................................... 100 Raw materials cost………………………………………………………….102 Summary ....................................................................................................... 103
CONCLUSIONS…………………………………………………………………………...104
RECOMMENDATIONS…………………………………………………………………... 106
ACRONYMS, ABBREVIATIONS & SYMBOLS ...............................................................108
REFERENCES ......................................................................................................................110

xii

xiii
LIST OF TABLES
Table 1 Applied transverse compressive stresses and corresponding strain determined per Figure 19 .................................................................................................................... 43
Table 2 Shape fixity and shape recovery ratios in each direction ........................................... 81 Table 3 Protrusion and width data ........................................................................................ 101 Table 4 Moisture and temperature data ................................................................................ 101 Table 5 Raw materials cost of the shape memory polymer slabs…………………………..103

xiv
2
LIST OF FIGURES
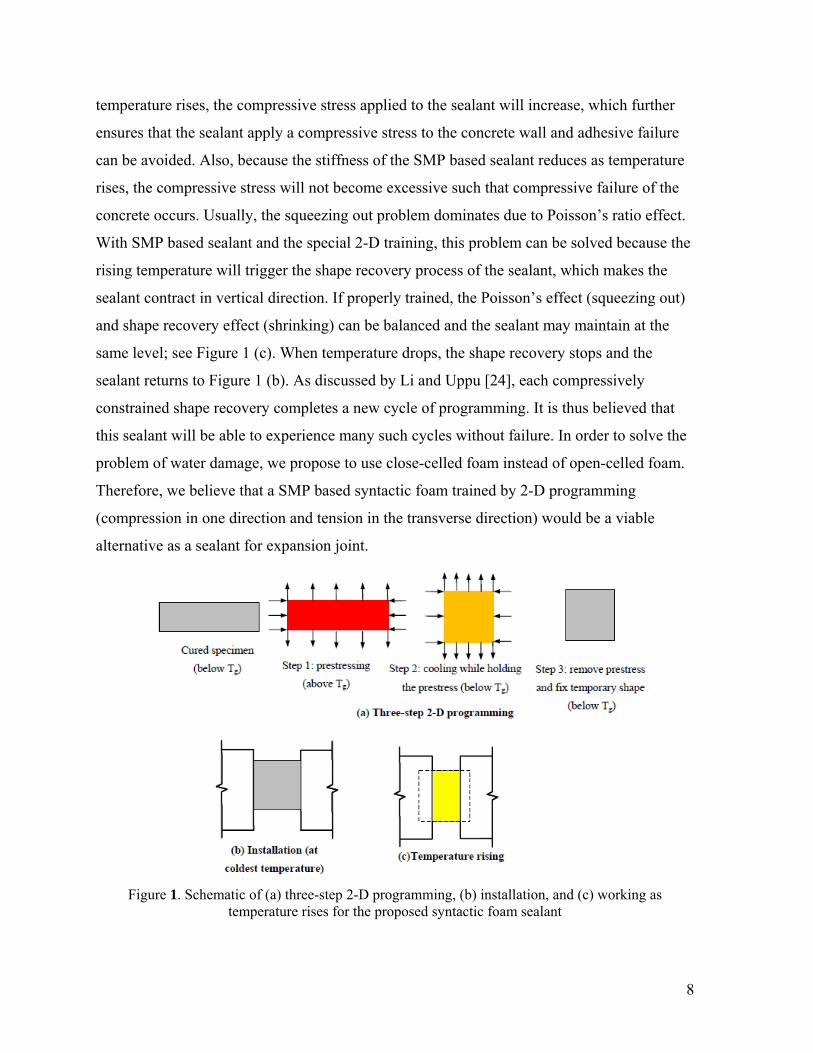
Figure 1 Schematic of (a) three-step 2-D programming, (b) installation, and (c) working as temperature rises for the proposed syntactic foam sealant .......................................... 8
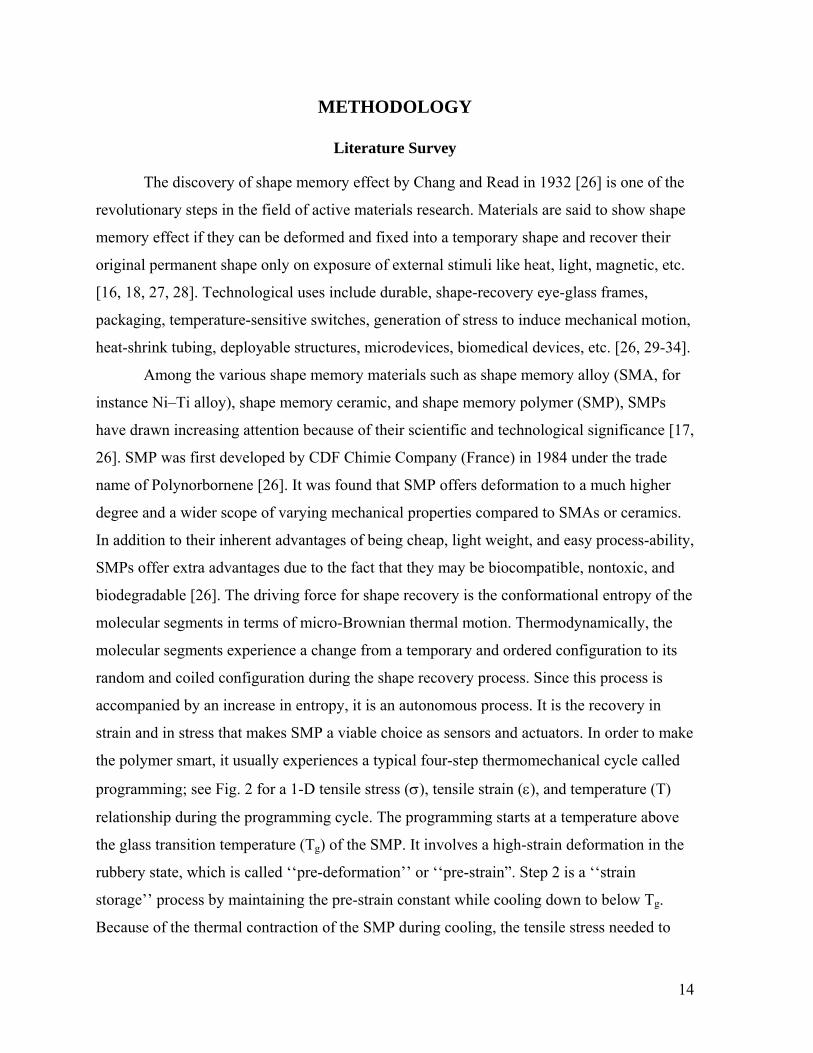
Figure 2 Schematic of four-step strain controlled programming ............................................ 15 Figure 3 Experimental procedure of programming ................................................................ 15 Figure 4 Molecular mechanism of the thermally induced shape-memory effect for a multilock
copolymer .................................................................................................................. 15 Figure 5. Cruciform specimens for 2-D programming (a) a schematic of biaxial specimen
dimensions and (b) von Mises stress distribution in the specimen (there is a piece of square material (red color) at the center of the specimen (about 25.4mm by 25.4mm) that is subjected to a uniform 2-D stress condition) .................................................. 17
Figure 6. (a) Specimen, (b) fixture, and (c) test set-up for 2-D programming of the cruciform foam sealant specimen ............................................................................................... 18
Figure 7. A schematic of the preparation for programmed sealant specimens ....................... 19 Figure 8. Compression test setup ............................................................................................ 21 Figure 9. Tension test set-up ................................................................................................... 22 Figure 10. Shear test set-up ..................................................................................................... 23 Figure 11 MTS machine with furnace and fixture used for fully-confined recovery ............. 27 Figure 12 MTS machine with furnace and fixture used for cyclic tests (The SMP specimen is
shown in the subplot) ................................................................................................ 28 Figure 13. (a) Schematic of the dog-bone specimen, (b) Normal stress distribution in the
longitudinal direction (x), (c) Normal stress distribution in the transverse direction (y), (d) In-plane shear stress distribution (xy). Note the uniform stress distribution in the gage length. Due to symmetry, only half of the specimen is analyzed. ......... 32
Figure 14. Schematic of the entire thermomechanical cycle (two-stage programming and one step free shape recovery) ........................................................................................... 33
Figure 15. Specimens after the two-stage programming ........................................................ 34 Figure 16. Thermomechanical cycle in the tension direction for a specimen of T25C25 ((Step
1 pretension to 25% strain at temperature above Tg, Step 2 cooling down to room temperature while hold the prestrain constant, Step 3 unloading, which completes the first stage of programming. The Poisson’s effect is due to the second programming in the transverse direction by compression. Step 4 free shape recovery.) ................................................................................................................... 36
Figure 17. (a) Horizontal and (b) vertical strain evaluation of the cruciform sealant specimens under various prestress levels during programming and recovery (Steps 1-3 represent programming and Step 4 represents free shape recovery) and (c) horizontal and vertical strain evaluation of the 10th thermomechanical cycle under the prestress level of 300.7kPa. ...................................................................................................... 37
Figure 18. (a) Original and (b) programmed cruciform foam sealant specimen and (c-f) its recovery process under various temperatures ........................................................... 39
Figure 19. Compressive stress–strain responses of the foam sealant specimen under various programming-recovery cycles ................................................................................... 40
Figure 20. Lateral strain evaluation of (a) nonprogrammed and (b) programmed specimens during compression test ............................................................................................. 41
Figure 21. Tensile stress–strain responses of foam sealant specimens under various
3
programming-recovery cycles ................................................................................... 42 Figure 22 Shear stress–strain responses of (a) programmed and (b) nonprogrammed foam
sealant specimens under various transverse compressive stress levels ..................... 43 Figure 23 Failure mode of programmed foam sealant specimen ............................................ 44 Figure 24 XRD patterns for original, programmed, recovered foam, original pure SMP
specimens, and hollow glass microspheres. .............................................................. 46 Figure 25 Compressive stress–strain responses of nonprogrammed and programmed foam
speicmens along various orientations ........................................................................ 46 Figure 26 Graphs of Poisson’s ratio vs. longitudinal strain for (a) nonprogrammed and (b, c
and d) programmed specimens during compression test ........................................... 49 Figure 27 SEM picture of reentrant structure in the programmed foam ................................. 50 Figure 28 Tensile stress–strain responses of nonprogrammed and programmed foam along
various orientations ................................................................................................... 51 Figure 29 Graphs of tensile Poisson’s ratio vs. longitudinal strain for nonprogrammed (a) and
programmed (b and c) foam ...................................................................................... 52 Figure 30 Yellowing changes with duration of exposure to UV ............................................ 54 Figure 31 Surface morphology of programmed (a, b) and original (c, d) foam ((a) and (c)
before and (b) and (d) after exposure to UV for 90days) .......................................... 55 Figure 32 Compression stress-strain response of original and programmed foam before and
after exposed to UV ................................................................................................... 56 Figure 33 Tensile stress-strain response of original and programmed foam exposed to UV . 57 Figure 34 Compressive stress-strain response of original and programmed foams immersed
in water and synchronously exposed to UV .............................................................. 59 Figure 35 Tensile stress-strain response of original and programmed foams immersed in
water and synchronously exposed to UV .................................................................. 59
Figure 36 Programming (Step1: loading→Step2: cooling→Step3: unloading) for the foam and
recovery stress-temperature response (Step4) under fully confined condition for the programmed foams exposed to UV alone and simultaneously immersed in saltwater and rainwater ............................................................................................................. 61
Figure 37 Horizontal and vertical strain evolution during the 2-D programming (step 1:
loading → step 2: cooling → step 3: unloading) ......................................................... 64
Figure 38 (a) Nonprogrammed and (b) programmed cruciform foam specimen ................... 64 Figure 39 Stress–strain response under cyclic loading for (a) nonprogrammed and (b)
programmed foam at room temperature .................................................................... 65 Figure 40 Effects of cyclic loading on characteristic parameters of (a) nonprogrammed and
(b) programmed foams at room temperature ............................................................. 65 Figure 41 SEM pictures of (a) nonprogrammed and (b) programmed foam .......................... 66 Figure 42 Stress–strain response under cyclic loading for (a) nonprogrammed and (b)
programmed pure SMP at room temperature ............................................................ 68 Figure 43 Effects of cyclic loading on characteristic parameters of (a) nonprogrammed and
(b) programmed pure SMP at room temperature ...................................................... 68 Figure 44 A schematic diagram of (a) the programmed specimen and (b) the preparation for
cyclic loading test specimen with cyclic loading along orientation-1(compression direction during programming) ................................................................................. 69
Figure 45 (a) Dissipated energy in each cycle and (b) accumulative dissipated energy of the
4
foam and pure SMP versus the number of loading cycles ........................................ 71 Figure 46 Responses of (a) stress vs. strain, (b) stress and temperature vs. time, and (c) stress
and strain vs. time for one-cyclic loading tests of nonprogrammed and programmed foams under changing temperature ........................................................................... 73
Figure 47 Responses of (a) stress-strain and (b) stress-time and strain-time under one-cyclic loading tests for nonprogrammed and programmed foam at room temperature ....... 75
Figure 48. Thermomechanical cycle in the compression direction for a specimen of T25C25 (the deformation history starts with Poisson’s effect due to first tension programming at temperature above Tg, followed by cooling down to room temperature, then second programming starts: Step 1 compression to 25% additional strain, Step 2 hold the strain for 20 minutes, and Step 3 unloading. After unloading, relaxation (viscoelastic rebound) occurs and after 24 hours, it is stabilized, completing the second programming. Step 4: free shape recovery) ... 77
Figure 49. Entire thermomechancial cycles in both tension direction and compression direction for each group of specimens in terms of stress-strain-time scale (in the figures, letter “T” represents tension, letter “C” stands for compression, and letters “T&C” represent coupled tension and compression, respectively) ........................... 80
Figure 50. Comparison of (a) programmed specimen and (b) recovered specimen (side view) and (c) recovered specimen (isometric view) (the face marked “T” is perpendicular to the tension direction, the face marked “C” is perpendicular to the compression direction, and the face marked “40/25” is the free direction subjected to the Poisson’s effects only) ............................................................................................... 82
Figure 51. Free shape recovery with temperature for three groups of specimens in each direction ..................................................................................................................... 84
Figure 52. Schematic showing the shape memory mechanism involved in the two-stage, biaxial programming and recovery (Note the contribution of the compression programming to the further segmental alignment along the tension direction) ........ 86
Figure 53Schematic of the sealant with a crack to be closed by constrained shape recovery.88 Figure 54 SMP sealant during the curing process. ................................................................. 89 Figure 55 Fabricated SMP joint after curing and demoulding. .............................................. 90 Figure 56 1-D programming test setup. .................................................................................. 90 Figure 57 1D programming of stress-strain curve for (a) 1S-T-38, (b) 1S-T-29……..……. ..91 Figure 58 Two-stage programming test setup: (a) slab in the home-made fixture, (b) fixture
covered by heating blanket ........................................................................................ 92 Figure 59 Tensile stress-strain curve for 2S-T-29 slab during tension programming ............ 92 Figure 60 Compression stress-strain curve for 2S-T-29 slab during cold-compression
programming ............................................................................................................. 93 Figure 61 SMP slab attached with thermal couples. ............................................................... 93 Figure 62 DMA test results of SMP materials (a) 1S-T-38 (b) 1S-T-29 ................................ 94 Figure 63 DSC test result of SMP joints (a) 1S-T-38, (b) 1S-T-29. ....................................... 95 Figure 64 Cold-compression programming (a) 1S-T-38, (b) 1S-T-29. .................................. 97 Figure 65 Free-shape recovery of the SMP slabs (a) 1S-T-38, (b) 1S-T-29. .......................... 98 Figure 66 Schematic of concrete slabs .................................................................................... 98 Figure 67 Schematic of SMP joint installation ....................................................................... 99 Figure 68 Plywood slab was inserted in fresh concrete to create the joint channel ................ 99 Figure 69 SMP slab installation: (a) slab in concrete-concrete channel, (b) slab in concrete-

5
asphalt concrete channel. ......................................................................................... 100 Figure 70 Road test by passing school bus ........................................................................... 100 Figure 71 (a) Surface moisture test and (b) moisture within the SMP slab test. .................. 102 Figure 72 (a) Asphalt sealant after raining, (b) moisture within the asphalt sealant after
raining ...................................................................................................................... 102
6
INTRODUCTION
Expansion joints are weak links in a bridge or concrete pavement system. Expansion
joint failure is a leading cause for structural damage to bridge superstructures and concrete
pavements [1-3]. Various types of sealants have been utilized to seal expansion joints in
small-span bridge decks and concrete pavements. These sealants are typically hot-poured,
cold-poured, or preformed. A comprehensive review of the existing sealants used in concrete
pavements and bridge decks has shown that the failure of these sealants is dominated by
adhesive failure and cohesive failure besides aging [4-11]. The need for a joint sealant that
does not suffer from this weakness becomes obvious.
Recently, a new silicone foam based sealant was developed for field-poured sealant
[12,13]. One advantage of this new material is its high ductility. Since the accommodation of
movement by field-poured sealant is realized through the high ductility of the sealant under
both tension and compression, adhesion to the concrete edge and cohesion in sealant itself
are critical. However, one problem of the normal foam sealant used for compression sealed
joint is the loss of compression over time. It was reported that large sustained compressive
movements force air out of the seal material (gas leakage) [13], which may not recover when
the joint expands, and thus causes compression loss in the compression sealed joint under
cyclic loading. Another problem of foam sealant is the filling of the open cells (void) with
water after long-term service. This problem can accelerate and magnify due to micro-
cracking and damage caused by thermal stress and traffic loading.
Shape memory polymer (SMP) is a new member of the family of shape memory
materials. It has been found that, while most SMPs can be deformed and fixed into a
temporary shape and recover their original permanent shape by heating to above their
transition temperature (glass transition temperature for amorphous SMPs and melting
temperature for crystalline SMPs), shape recovery can also be triggered by light if the SMP
molecules consist of photo sensitive functional groups or by magnetic field if magnetic
particles are dispersed in heat-activating SMP matrix [14-18]. The driving force for heat-
activated shape recovery is the conformational entropy of the molecular segments in terms of
micro-Brownian thermal motion. Thermodynamically, the molecular segments experience a
change from a temporary and ordered configuration to its random and coiled configuration
7
during the shape recovery process. Since this process is accompanied by an increase in
entropy, it is an autonomous process. However, it is noted that, while the motion of the
molecules during the shape recovery process can be described by micro-Brownian thermal
motion, the micro-Brownian thermal motion itself cannot trigger shape recovery. The shape
recovers only when the temperature is above the transition temperature. Therefore, external
heating not only affects the shape recovery rate, but also determines if the shape recovery
occurs or not for heat-activated SMPs.
A recent development in SMPs is the use of confined shape recovery for the purpose
of self-healing structural-length scale damage. Li and John investigated the concept for SMP
based syntactic foam to repeatedly heal impact damage [19]. Later, it has been proved that
SMP based syntactic foam can be used in grid stiffened SMP based syntactic foam cored
sandwich and 3-D woven fabric reinforced SMP based syntactic foam panel for repeatedly
and efficiently heal impact damage [20,21]. Most recently, a biomimetic two-step close-then-
heal self-healing scheme has been proposed by Li and Nettles [22] and Xu and Li [23], and
elucidated by Li and Uppu [24]. This is a scheme by mimicking self-healing of biological
systems such as human skin. This concept has been experimentally validated by Nji and Li
[25], which shows that this system can heal structural-length scale damage repeatedly,
efficiently, timely, molecularly, and almost autonomously (the only human intervention is by
heating the material above its transition temperature).
An important scientific implication is that SMP may be used as sealant in expansion
joints. It is known that an ideal sealant should be able to apply a consistent compressive
stress to the concrete wall so that adhesive failure can be avoided. Also, the sealant needs to
maintain in the groove when the joint narrows due to thermal expansion of the structural
elements. Additionally, the sealant should prevent water from seeping into it and also have
self-healing capabilities so that cohesive failure can be healed. To this end, we propose to use
SMP based syntactic foam as a sealant for expansion joint. First, the foam sealant can be
programmed or trained by a 2-D stress condition: compression in longitudinal (horizontal or
traffic direction) and tension in transverse or vertical direction; see Figure 1 (a) for a three-
step programming process. When the foam sealant is installed at the lowest temperature that
the sealant will experience, the sealant will always apply a compressive stress to the concrete
wall due to thermal expansion and shape recovery; see Figure 1 (b). When the environmental
8
temperature rises, the compressive stress applied to the sealant will increase, which further
ensures that the sealant apply a compressive stress to the concrete wall and adhesive failure
can be avoided. Also, because the stiffness of the SMP based sealant reduces as temperature
rises, the compressive stress will not become excessive such that compressive failure of the
concrete occurs. Usually, the squeezing out problem dominates due to Poisson’s ratio effect.
With SMP based sealant and the special 2-D training, this problem can be solved because the
rising temperature will trigger the shape recovery process of the sealant, which makes the
sealant contract in vertical direction. If properly trained, the Poisson’s effect (squeezing out)
and shape recovery effect (shrinking) can be balanced and the sealant may maintain at the
same level; see Figure 1 (c). When temperature drops, the shape recovery stops and the
sealant returns to Figure 1 (b). As discussed by Li and Uppu [24], each compressively
constrained shape recovery completes a new cycle of programming. It is thus believed that
this sealant will be able to experience many such cycles without failure. In order to solve the
problem of water damage, we propose to use close-celled foam instead of open-celled foam.
Therefore, we believe that a SMP based syntactic foam trained by 2-D programming
(compression in one direction and tension in the transverse direction) would be a viable
alternative as a sealant for expansion joint.
Figure 1. Schematic of (a) three-step 2-D programming, (b) installation, and (c) working as
temperature rises for the proposed syntactic foam sealant

9

10
OBJECTIVE
The objective of this study is to investigate the feasibility of using SMP based
composite as sealant in expansion joints through both lab-scale experiments and field-level
installation.

11

12
SCOPE
The scope of this project focused on lab-scale testing and field-level installation. This
was a systematic experimental study. First, an extensive literature survey was conducted.
Following this, the focus was on the materials selections, thermomechanical characterization,
functional stability, programming method, and manufacturing and installation in concrete
pavement.

13
14
METHODOLOGY
Literature Survey
The discovery of shape memory effect by Chang and Read in 1932 [26] is one of the
revolutionary steps in the field of active materials research. Materials are said to show shape
memory effect if they can be deformed and fixed into a temporary shape and recover their
original permanent shape only on exposure of external stimuli like heat, light, magnetic, etc.
[16, 18, 27, 28]. Technological uses include durable, shape-recovery eye-glass frames,
packaging, temperature-sensitive switches, generation of stress to induce mechanical motion,
heat-shrink tubing, deployable structures, microdevices, biomedical devices, etc. [26, 29-34].
Among the various shape memory materials such as shape memory alloy (SMA, for
instance Ni–Ti alloy), shape memory ceramic, and shape memory polymer (SMP), SMPs
have drawn increasing attention because of their scientific and technological significance [17,
26]. SMP was first developed by CDF Chimie Company (France) in 1984 under the trade
name of Polynorbornene [26]. It was found that SMP offers deformation to a much higher
degree and a wider scope of varying mechanical properties compared to SMAs or ceramics.
In addition to their inherent advantages of being cheap, light weight, and easy process-ability,
SMPs offer extra advantages due to the fact that they may be biocompatible, nontoxic, and
biodegradable [26]. The driving force for shape recovery is the conformational entropy of the
molecular segments in terms of micro-Brownian thermal motion. Thermodynamically, the
molecular segments experience a change from a temporary and ordered configuration to its
random and coiled configuration during the shape recovery process. Since this process is
accompanied by an increase in entropy, it is an autonomous process. It is the recovery in
strain and in stress that makes SMP a viable choice as sensors and actuators. In order to make
the polymer smart, it usually experiences a typical four-step thermomechanical cycle called
programming; see Fig. 2 for a 1-D tensile stress (), tensile strain (), and temperature (T)
relationship during the programming cycle. The programming starts at a temperature above
the glass transition temperature (Tg) of the SMP. It involves a high-strain deformation in the
rubbery state, which is called ‘‘pre-deformation’’ or ‘‘pre-strain”. Step 2 is a ‘‘strain
storage’’ process by maintaining the pre-strain constant while cooling down to below Tg.
Because of the thermal contraction of the SMP during cooling, the tensile stress needed to
15
maintain the pre-deformed shape increases as the temperature drops. The third step is a ‘‘low
temperature unloading’’ process, which is defined as the removal of the stress in the glassy
state. The low temperature unloading process may be accompanied by ‘‘springback”, i.e.,
some pre-strain may be rebounded. In step 4, which involves reheating to its starting
temperature (above Tg) without applying any constraint, sometimes called ‘‘free strain
recovery’’ or ‘‘unconstrained recovery’’, brings the pre-strain back to zero (if the recovery
ratio is 100%).
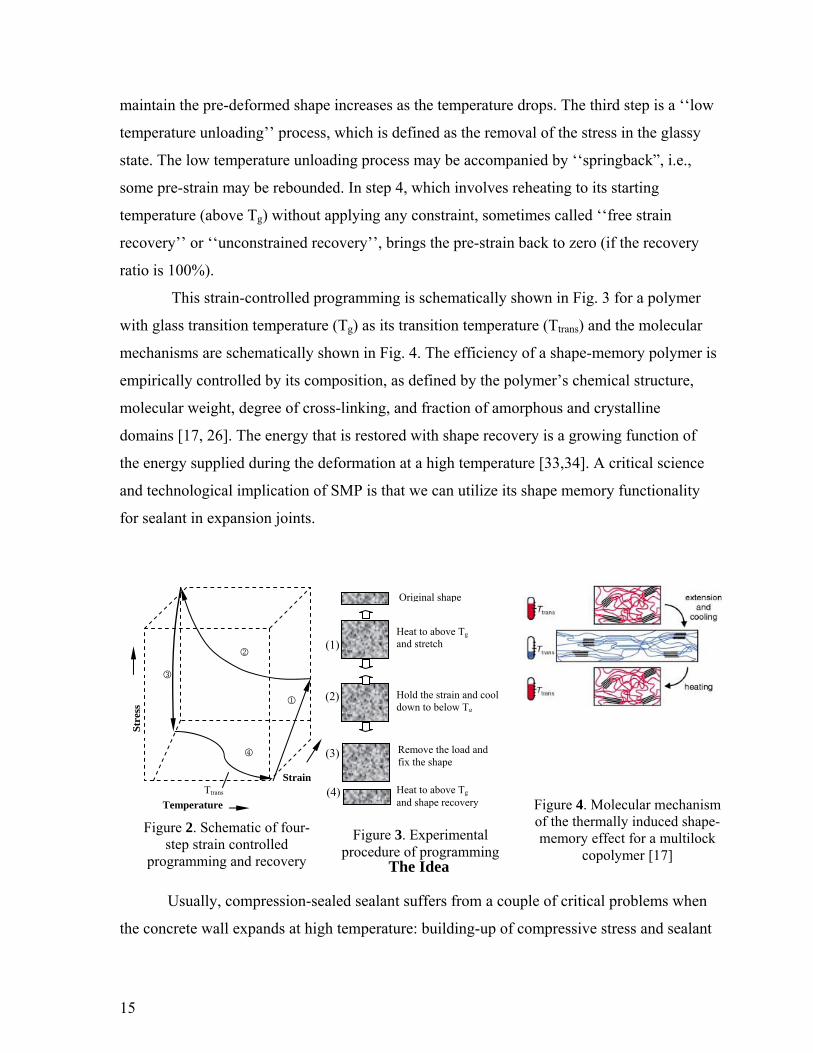
This strain-controlled programming is schematically shown in Fig. 3 for a polymer
with glass transition temperature (Tg) as its transition temperature (Ttrans) and the molecular
mechanisms are schematically shown in Fig. 4. The efficiency of a shape-memory polymer is
empirically controlled by its composition, as defined by the polymer’s chemical structure,
molecular weight, degree of cross-linking, and fraction of amorphous and crystalline
domains [17, 26]. The energy that is restored with shape recovery is a growing function of
the energy supplied during the deformation at a high temperature [33,34]. A critical science
and technological implication of SMP is that we can utilize its shape memory functionality
for sealant in expansion joints.
The Idea
Usually, compression-sealed sealant suffers from a couple of critical problems when
the concrete wall expands at high temperature: building-up of compressive stress and sealant
Figure 2. Schematic of four-step strain controlled
programming and recovery
Str
ess
Temperature
Strain
Ttrans
Hold the strain and cool down to below Tg
Heat to above Tg and stretch
Heat to above Tg and shape recovery
Original shape
(1)
(2)
(3)
(4)
Remove the load and fix the shape
Figure 4. Molecular mechanism of the thermally induced shape-memory effect for a multilock
copolymer [17]
Figure 3. Experimental procedure of programming
16
squeezing out of the channel. By programming SMP based syntactic foam in 2-D stress
condition (compression in horizontal or traffic direction and tension in vertical direction) and
by controlling the transition temperature of the foam below the highest temperature of the
environment to be experienced, the accumulated compressive stress can be significantly
released due to the two orders of drop in the stiffness of the foam at temperature above its
transition temperature; consequently, the concrete and the sealant will not be crushed.
Simultaneously, the squeezing-out problem can also be eliminated due to the shrinkage of the
foam in the vertical direction when the foam recovers (shape memory effect), which is
seemingly against the physics because it contracts when temperature rises. Also, this 2-D
programmed sealant can solve the problem of loss of interfacial contact when temperature
drops. For conventional polymeric sealant, the plastic deformation accumulated at high
temperature cannot be recovered. As a result, the sealant may gradually lose contact with the
concrete wall as temperature drops, leading to leaking and gradual failure of the sealant.
However, with the 2-D programmed smart sealant, the compression programming in the
traffic direction ensures that the plastic deformation recovers at high temperature (sealant
tends to become wider in the traffic direction), maintaining contact with the concrete wall
and minimizing the leaking problem. Based on the above discussion, the special 2-D stress
programmed SMP based syntactic foam has a potential to be used as sealant in expansion
joints. The working principle for the smart sealant is schematically shown in Fig. 1.
Thermomechanical Characterization of Shape Memory Polymer Based Self-healing Syntactic Foam Sealant for Expansion Joint
Raw materials
The syntactic foam consisted of hollow glass microspheres dispersed temperature (Tg)
= 62oC) by CRG Industries under the name of Veriflex®. The hollow glass microspheres
were from Potters Industries (Q-CEL6014: average outer diameter of 85μm, effective density
of 0.14 g/cm3, maximum working pressure of 1.73MPa, and wall thickness of 0.8μm). These
raw materials have been used previously for the smart syntactic foam [21, in a shape memory
polymer matrix. The polymer was a styrene based thermoset SMP (glass transition 22].
17
Biaxial specimen fabrication
The SMP based syntactic foam sealant consisted of hollow glass microspheres and
SMP matrix, which was fabricated by dispersing 40% by volume of microspheres into the
SMP resin [22, 24]. The microspheres were added to the resin while slowly stirring the
mixture to minimize air bubbles in the resin. The microspheres were added in multiple steps
to avoid agglomeration. After dispersion, a hardening agent was added and the mixture was
mixed for 10 min. The mixture was poured into a 229×229×12.7 mm steel mold and placed
in a vacuum chamber at 40kPa for 20 min in order to remove any air pockets introduced
during the mixing process. Based on our previous study [22], the curing cycle was 79oC for
24h, 107oC for 3h, and 121oC for 9h. After curing, the foam panel was de-molded and was
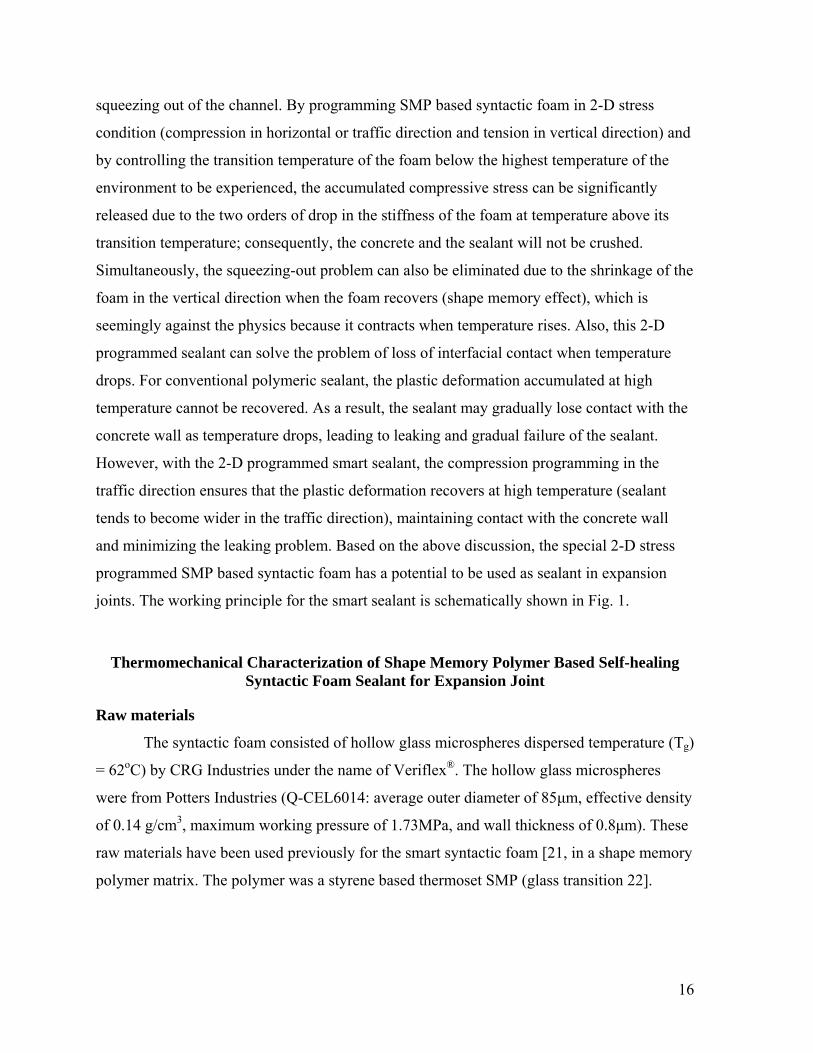
machined into biaxial cruciform specimens for programming and further testing. The
cruciform specimen dimensions were given in Figure 5 (a). With such a dimension, the
central square is roughly under a 2-D stress condition as validated by a finite element
analysis; see Figure 5 (b).
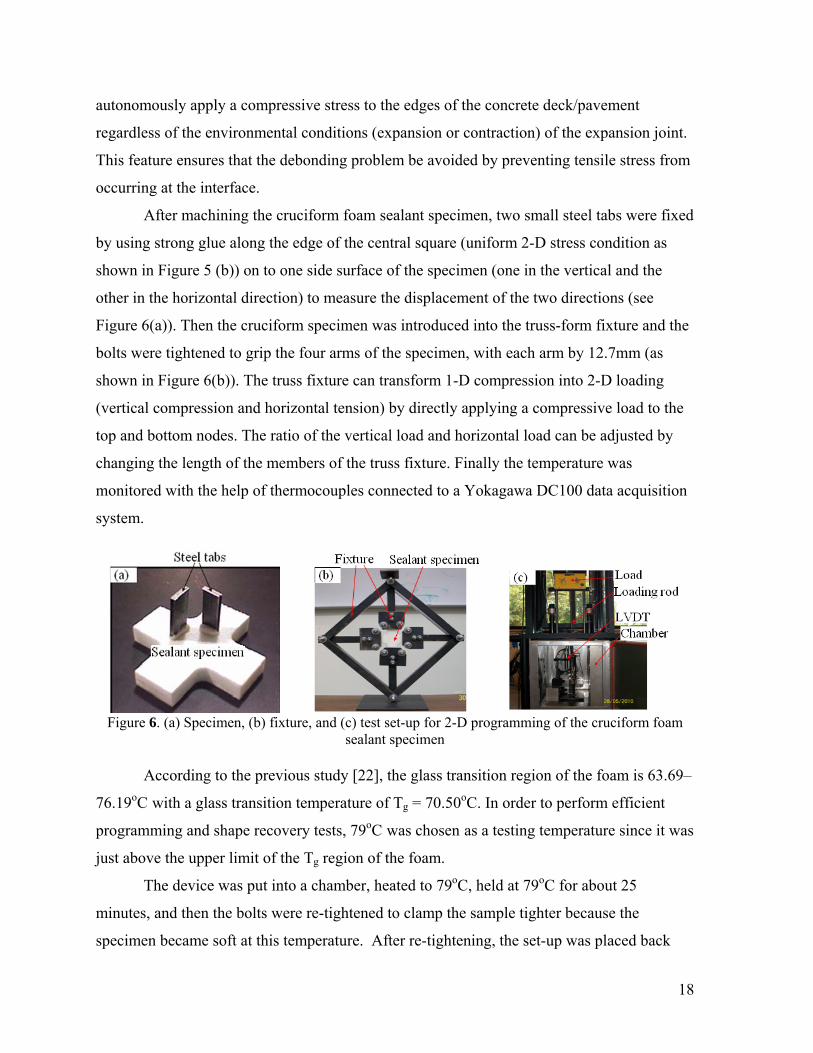
(a) (b) Figure 5. Cruciform specimens for 2-D programming (a) a schematic of biaxial specimen dimensions and (b) von Mises stress distribution in the specimen (there is a piece of square material (red color) at
the center of the specimen (about 25.4mm by 25.4mm) that is subjected to a uniform 2-D stress condition.)
2-D programming of biaxial specimen
In order to make the polymer smart, it usually subjects to a typical three-step
thermomechanical cycle called programming [19]. The energy that is restored with shape
recovery is a growing function of the energy supplied during the deformation at a high
temperature [35]. The SMP based foam sealant can be programmed to consistently and
18
autonomously apply a compressive stress to the edges of the concrete deck/pavement
regardless of the environmental conditions (expansion or contraction) of the expansion joint.
This feature ensures that the debonding problem be avoided by preventing tensile stress from
occurring at the interface.
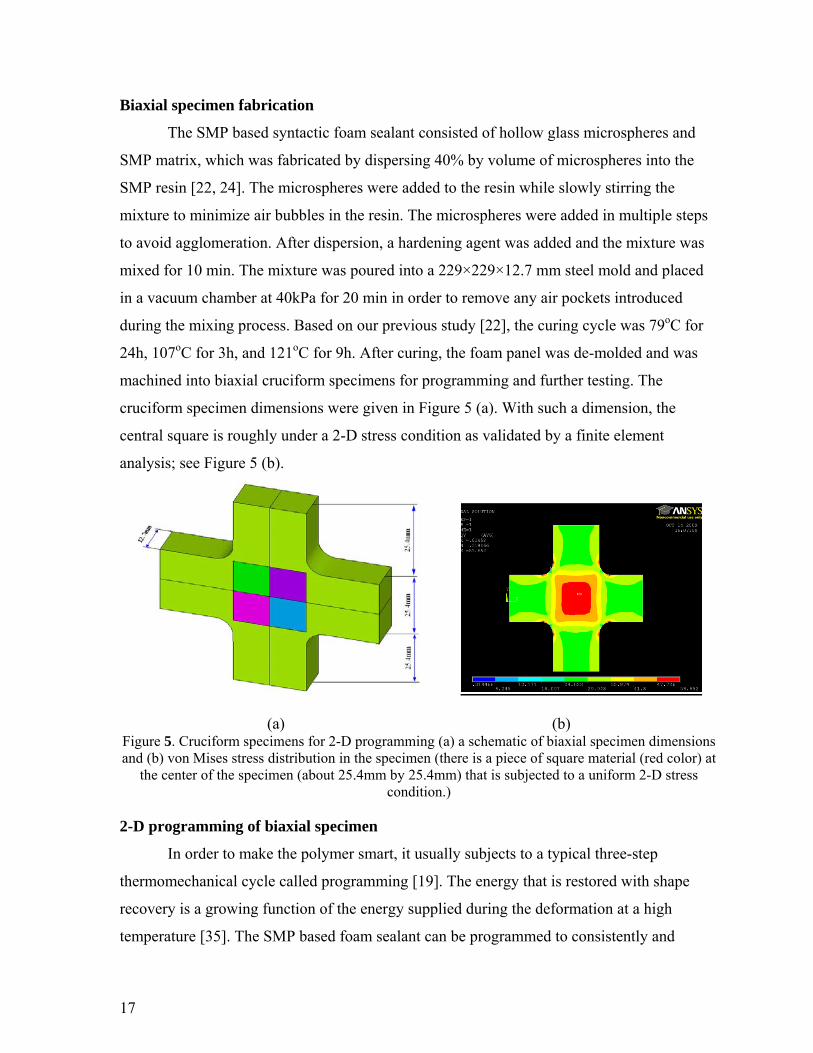
After machining the cruciform foam sealant specimen, two small steel tabs were fixed
by using strong glue along the edge of the central square (uniform 2-D stress condition as
shown in Figure 5 (b)) on to one side surface of the specimen (one in the vertical and the
other in the horizontal direction) to measure the displacement of the two directions (see
Figure 6(a)). Then the cruciform specimen was introduced into the truss-form fixture and the
bolts were tightened to grip the four arms of the specimen, with each arm by 12.7mm (as
shown in Figure 6(b)). The truss fixture can transform 1-D compression into 2-D loading
(vertical compression and horizontal tension) by directly applying a compressive load to the
top and bottom nodes. The ratio of the vertical load and horizontal load can be adjusted by
changing the length of the members of the truss fixture. Finally the temperature was
monitored with the help of thermocouples connected to a Yokagawa DC100 data acquisition
system.
Figure 6. (a) Specimen, (b) fixture, and (c) test set-up for 2-D programming of the cruciform foam sealant specimen
According to the previous study [22], the glass transition region of the foam is 63.69–
76.19oC with a glass transition temperature of Tg = 70.50oC. In order to perform efficient
programming and shape recovery tests, 79oC was chosen as a testing temperature since it was
just above the upper limit of the Tg region of the foam.
The device was put into a chamber, heated to 79oC, held at 79oC for about 25
minutes, and then the bolts were re-tightened to clamp the sample tighter because the
specimen became soft at this temperature. After re-tightening, the set-up was placed back
19
into the chamber and two linear differential transducers (LVDT) were installed in
conjunction with the two pre-attached tabs in the vertical and horizontal directions,
respectively (see Figure 6(c)). Also, the weight-bearing rod was installed on the top node of
the truss fixture and the system was reheated to 79oC for another 20 minutes to equilibrate
the temperature. Immediately afterwards a weight was put on to the rod by hand. This
compressive load led the specimen to compression in the vertical direction and tension in the
horizontal direction. Approximately 20 min were allowed for the deformation to stabilize.
This completed the first step (pre-strain) of the programming. In the next step (cooling), the
heating was first stopped, and the chamber was kept closed and the system was allowed to
naturally cool for 8-10h to room temperature while maintaining the applied load constant.
The LVDTs tracked the deformation of the specimen during this cooling step. Because of
creep and contraction during cooling, the strain was continuously increasing until the
temperature reached room temperature. This completed step 2 of the programming. Then the
specimen was unloaded (step 3). The entire process completed the 3-step 2-D thermo-
mechanical programming or shape fixity of the cruciform foam specimen (see Figure 4(a)).
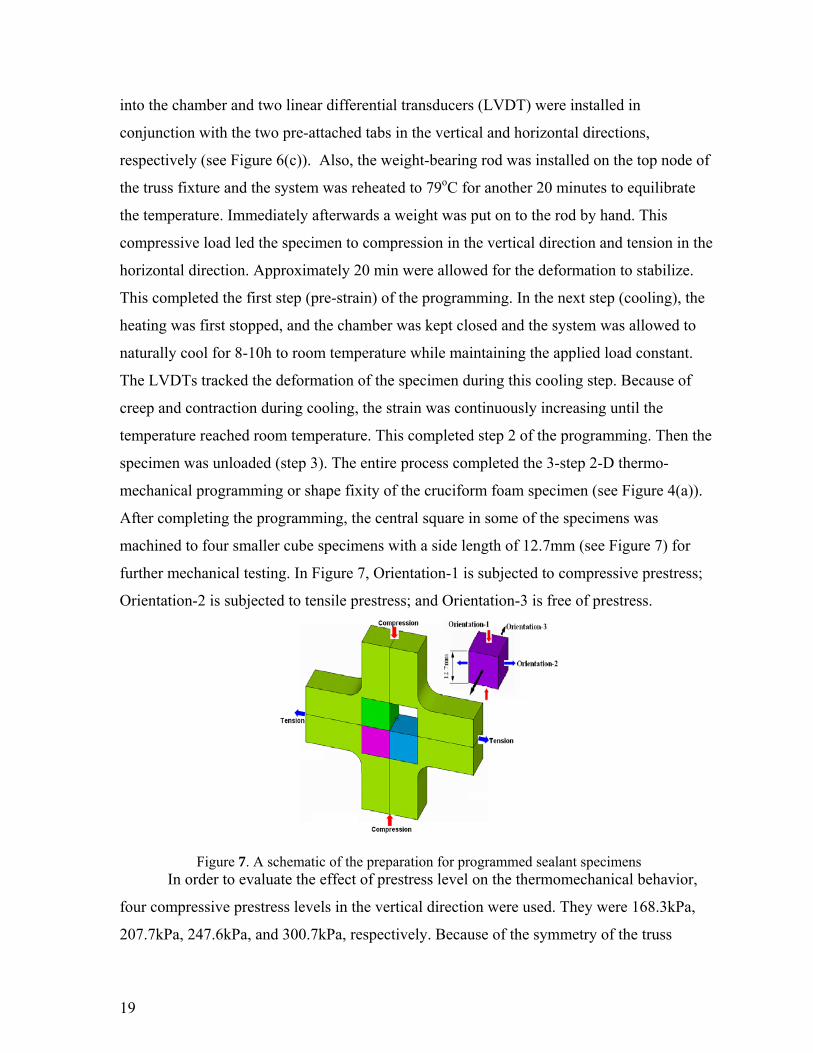
After completing the programming, the central square in some of the specimens was
machined to four smaller cube specimens with a side length of 12.7mm (see Figure 7) for
further mechanical testing. In Figure 7, Orientation-1 is subjected to compressive prestress;
Orientation-2 is subjected to tensile prestress; and Orientation-3 is free of prestress.
Figure 7. A schematic of the preparation for programmed sealant specimens In order to evaluate the effect of prestress level on the thermomechanical behavior,
four compressive prestress levels in the vertical direction were used. They were 168.3kPa,
207.7kPa, 247.6kPa, and 300.7kPa, respectively. Because of the symmetry of the truss
20
fixture and the specimen, the tensile prestress in the horizontal direction was the same as the
corresponding vertical compressive prestress. In addition, some specimens with 300.7kPa
prestress experienced 10 thermomechanical cycles to evaluate the functional stability of the
foam sealant.
XRD examination
An X-ray diffractometer (MiniFlex model, Rigaku Corporation, Japan) with Ni-
filtered Cu-Kα radiation (λ =1.54178Å) was used to investigate the microstructure change of
the original, programmed, and recovered foam specimens, original pure SMP specimens, and
hollow glass microspheres. For all samples, XRD spectra were obtained by scanning over 2θ
angles from 1° to 30° at a scanning speed of 2°/min and step width of 0.5°.
Experimental
2-D shape recovery of programmed biaxial specimens
For some specimens, 2-D free-shape recovery started immediately after the
completion of the programming by using the same heating chamber and LVDT system.
According to our previous study [22], the chamber was heated up quickly from room
temperature to 49oC and allowed to soak for 20 min. Then the heating was continued again at
an average heating rate of 0.3oC/min until 77oC. Soaking for 7 minutes, the heating was
ramped quickly to 79oC and the temperature was held for 30 minutes. It is noted that, while
the heating profile affects the recovery rate, it does not affect the final recovery strain or
recovery stress because the recovery is driven by entropy (depending on temperature only).
Compression test
To evaluate the performance of the smart sealant when the deck/pavement is
experiencing expansion during temperature rising, uniaxial compression tests along the
Orientation-1 were conducted as shown schematically in Figure 7. The maximum movement
that the joint may experience needs to be first established. Assuming the span-length of the
bridge is 10m, the coefficient of thermal expansion (CTE) of concrete is 1010-6/oC, and the
21
maximum temperature rise is 50oC, then the maximum joint movement can be estimated to
be 5mm. Because the specimen width was 12.7mm, this translated to a maximum
compressive strain of 39.4%. Therefore, the purpose was to evaluate if the programmed foam
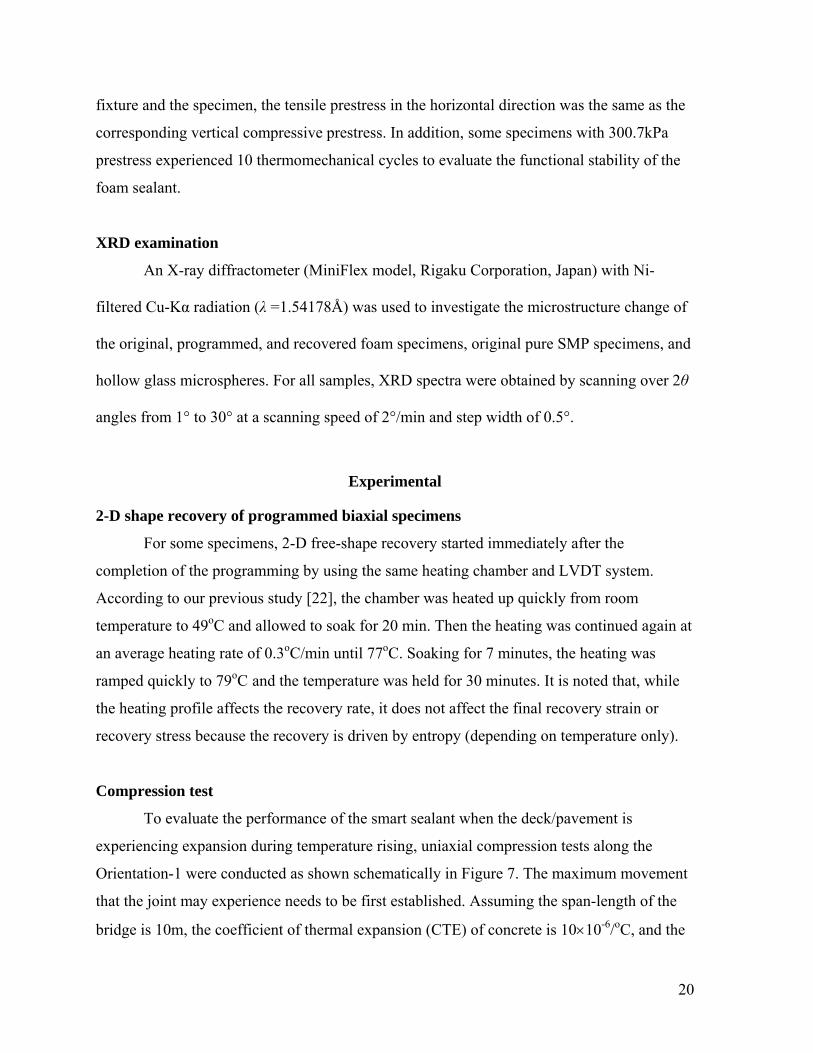
sealant could survive this compressive strain or not. Sandwich specimens formed by
sandwiching the foam sealant in between two concrete blocks along the Orientation-1 were
prepared by using a conventional adhesive for the compression test (as shown in Figure 7 and
Figure 8). The dimensions of the sealant and concrete blocks were both 12.7 mm long,
12.7mm wide and 12.7mm deep.
Figure 8. Compression test setup
However, they cannot create a compressive strain of 39.4% by temperature rise due to
their small size. In order to impose the joint movement in the specimen, a MTS 810 machine
was used to apply this strain (39.4%) on the joint in the specimen. In practice, the
temperature rise occurs slowly. To reflect this slow heating process, the rate of the hydraulic
ram displacement was controlled to simulate the strain occurring due to the temperature rise.
Assuming the temperature rise is uniform and the 5mm joint displacement occurs in 2-hours,
the ram displacement rate during testing would be 6.9410-4mm/s (or 41.64μm/min). The
tests were conducted at room temperature. Three effective specimens were tested for each
group of samples. Two Teflon sheets were interposed between the specimen and loading
platens to reduce friction, leading to free transverse expansion. Each test was stopped when
the compressive strain was 40%, regardless of specimen failure or not.
In order to evaluate the effects of the programming on the strain/deformation of the
smart sealant, the lateral strains of the tension programmed face (along Orientation-2 by
utilizing LVDT-2) and nonprogrammed face (along Orientation-3 by utilizing LVDT-1) were
22
measured during compression test, respectively. And the two LVDT rods were adhered at the
center of the two lateral faces of the specimen by using glue, respectively. The picture of the
compression test is shown in Figure 8.
Tension test
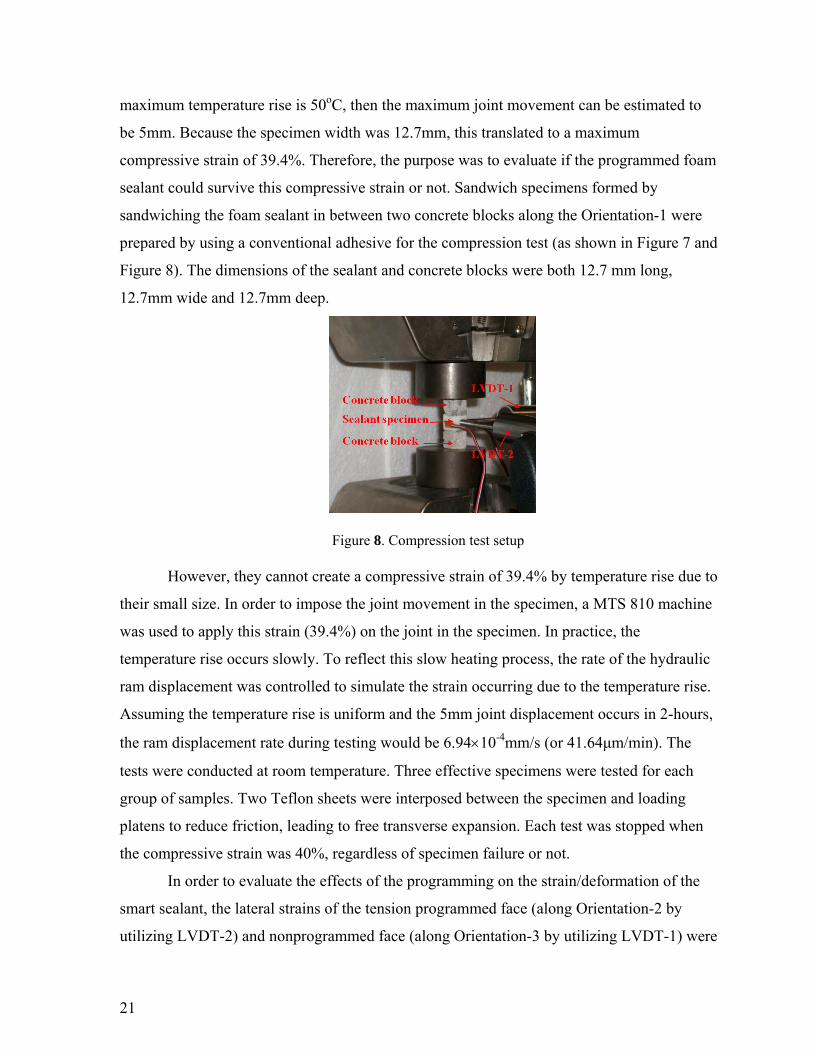
In order to evaluate the tensile performance of the foam sealant when the joint
experiences elongation as temperature drops, tension tests were conducted. The dimensions
of the sealant specimens were the same as the compression test, but the dimensions of the
concrete blocks were 50.8mm long, 12.7mm wide and 12.7mm deep (as shown in Figure 9).
The foam sealant specimens were bonded to the two concrete blocks with a strong epoxy
adhesive. The sandwich specimen was placed in the grips of the MTS 810 machine, using
care to adjust the specimen symmetrically to distribute tension uniformly over the sealant
cross section (see Figure 9). The tests were conducted at room temperature. Three effective
specimens were tested for each group of samples. The same ram displacement rate as the
compression tests was used for tension tests.
Figure 9. Tension test set-up
Shear test
Shear performance of the sealant was investigated by using a double-lap joint
configuration which consisted of three concrete blocks separated by two gaps that were filled
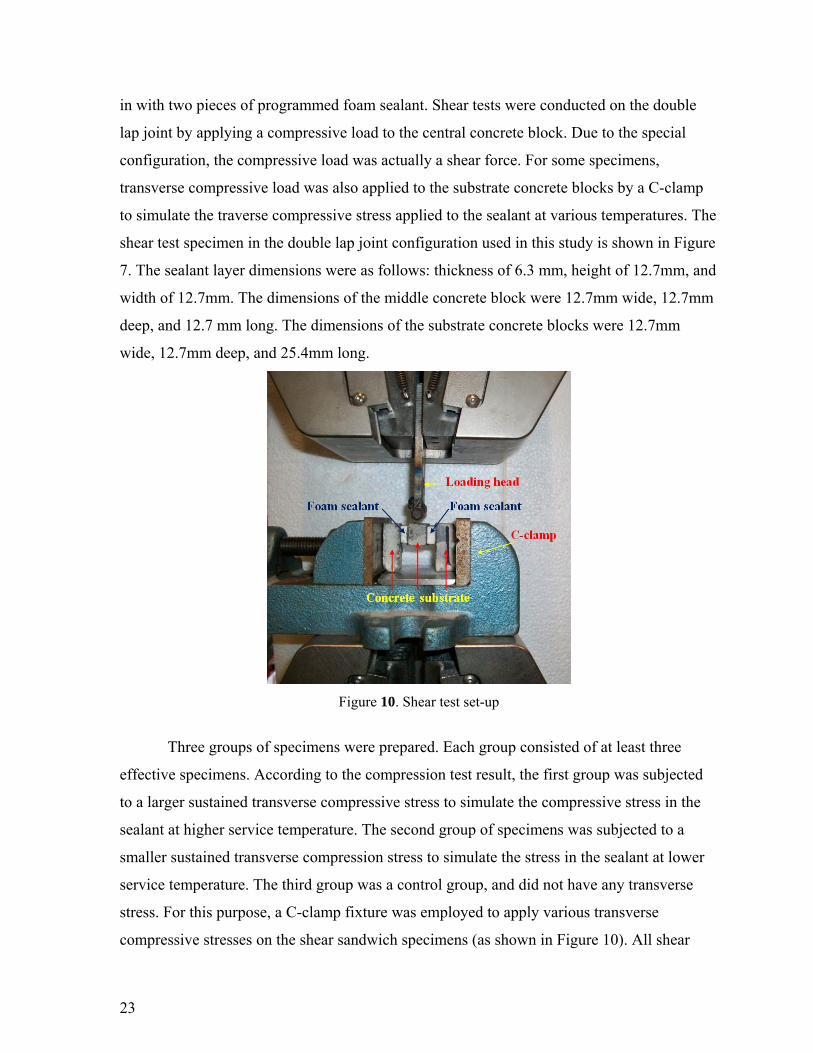
23
in with two pieces of programmed foam sealant. Shear tests were conducted on the double
lap joint by applying a compressive load to the central concrete block. Due to the special
configuration, the compressive load was actually a shear force. For some specimens,
transverse compressive load was also applied to the substrate concrete blocks by a C-clamp
to simulate the traverse compressive stress applied to the sealant at various temperatures. The
shear test specimen in the double lap joint configuration used in this study is shown in Figure
7. The sealant layer dimensions were as follows: thickness of 6.3 mm, height of 12.7mm, and
width of 12.7mm. The dimensions of the middle concrete block were 12.7mm wide, 12.7mm
deep, and 12.7 mm long. The dimensions of the substrate concrete blocks were 12.7mm
wide, 12.7mm deep, and 25.4mm long.
Figure 10. Shear test set-up
Three groups of specimens were prepared. Each group consisted of at least three
effective specimens. According to the compression test result, the first group was subjected
to a larger sustained transverse compressive stress to simulate the compressive stress in the
sealant at higher service temperature. The second group of specimens was subjected to a
smaller sustained transverse compression stress to simulate the stress in the sealant at lower
service temperature. The third group was a control group, and did not have any transverse
stress. For this purpose, a C-clamp fixture was employed to apply various transverse
compressive stresses on the shear sandwich specimens (as shown in Figure 10). All shear
24
tests were conducted at room temperature. To simulate the actual working condition of the
foam sealant in expansion joints, shear tests were conducted along Orientation-2.
From Figure 10, the shear sandwich was placed symmetrically below the movable
loading head. The middle concrete block was pushed downward at 20 mm/min until the
specimen failed. The shear stress (τ) and strain (γ) of the sealant were determined by using
the following relationships:
,
,2
T
A
F
where F − applied load; A − sealant cross-sectional area in contact with each substrate; T −
sealant thickness; and δ − vertical displacement.
Functional Stability under Environmental Attacks
Accelerated ultraviolet (UV) ageing
To investigate the effect of UV ageing on the programmed foam, two groups of the
programmed cube specimens were exposed to UV for compression and shape recovery tests,
respectively. Another group of the programmed cuboid specimens was exposed to UV for
tension test. Each group contains three effective specimens. UV lamp was placed 33cm
above the foam’s top surface for 90 days. Heat effects from the light source were measured.
The temperature on the exposed specimen surface is about 20~23oC higher than that without
UV exposure. Even with the increased temperature, the temperature of the foam is still lower
than its Tg. Therefore, shape recovery is impossible during the ageing process. Then these
prepared samples were used to conduct some tests proposed in this study, such as
compression and tension tests.
Additionally, in order to investigate synergistic effects of UV and moisture on the
degradation and mechanical properties, four additional groups of the programmed cube
specimens were immersed in saturated salt water and rainwater at room temperature for 90
days, respectively. They were prepared for compression and shape recovery test. Meanwhile,
two groups of the programmed cuboid specimens were also immersed in the salt water and
rainwater for tension test, respectively. All these immersed specimens were synchronously
exposed to UV. After this immersion and exposure, mechanical and shape recovery tests
25
were conducted on these aged specimens. Correspondingly, the original foams were also
prepared as control specimens for each group of programmed foams. And the test results
were compared to the performance of control specimens without radiation and immersion to
determine the aging resistance of the SMP foam.
Accelerated hydrolytic ageing
Once the block specimens were prepared, accelerated hydrolytic ageing experiments
were conducted. Four groups of original and programmed foam specimens were immersed in
saturated saltwater and rainwater for further testing, respectively. Each group had three
effective specimens numbered individually. Synthetic sea salt named Instant ocean® was
used to prepare the saturated saltwater. The rainwater was collected in the open air when it
was raining. Specimens were kept in a closed container to minimize the evaporation losses,
maintaining the salt concentration approximately constant in the saltwater.
After the specimens were immersed in the saltwater and rainwater for 90 days,
equilibrium state was reached [15]. The immersed foam specimens were quickly taken out of
the container for moisture absorption testing. Before weighing the specimens, excess surface
water was wiped off and specimens were left in air for about 5 min. The moisture content can
be calculated as follow:
%100'
0
0
w
wwms
where ms−moisture content; w0−mass before immersion; w'−mass after immersion.
Then mechanical tests were conducted on the immersed specimens at room
temperature, including compression, tension, and shape recovery test. As-fabricated foam
specimens, referred as dry specimens, were also tested as controls.
Compression test after environmental attacks
To evaluate the effects of hydrolytic ageing and/or UV exposure on compressive
properties of the programmed foam, compression tests were conducted along the
compression direction during programming. The dimensions of the foam specimen were 12.7
mm long, 12.7mm wide and 12.7mm deep. A MTS 810 machine with a 100KN load cell was
used to apply a compressive strain of 40% onto the foam. The tests were conducted at room
26
temperature at a loading rate of 41.64μm/min. And two Teflon sheets were interposed
between the specimen and loading platens to reduce contact surface friction, leading to free
transverse expansion. Three effective specimens were tested for each environmental
conditioning and control.
Tension test after environmental attacks
In order to estimate the influence of hydrolytic and/or UV ageing on tensile properties
of the foam, tension tests were conducted on the programmed specimens along the
compression direction during programming. The specimen was placed in the grips of the
MTS 810 machine with a 50kN load cell, using care to adjust the specimen symmetrically to
distribute tension uniformly over the foam cross section. The middle 1/3 of the programmed
specimen was tested as the gauge length, and the other two 1/3 lengths at the two ends were
clamped. The tests were conducted at room temperature and the same rate of ram
displacement as the compression test was adopted during tension testing. Again, three
effective specimens were tested for each environmental conditioning and control.
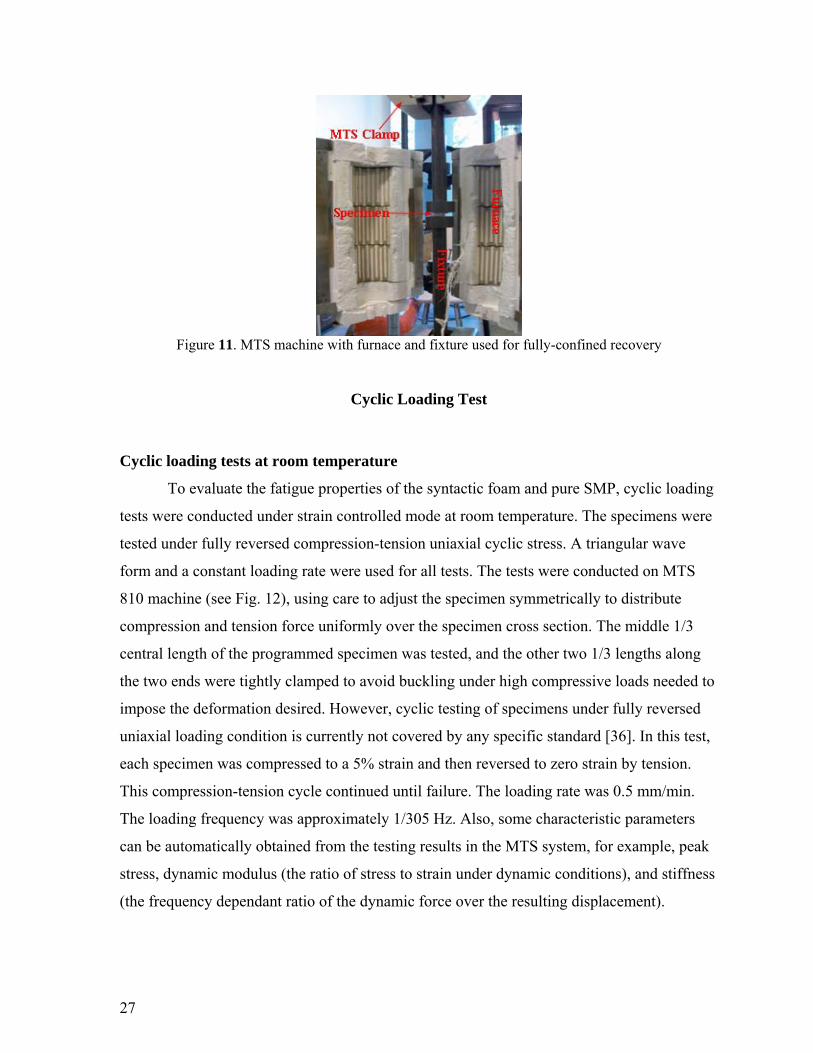
Shape recovery test after environmental attacks
To investigate the effects of hydrolytic and/or UV ageing on the shape memory
functionality of the programmed foam, full confinements were used to test the recovery
stress. Fully confined recovery test was performed using the MTS machine with a
temperature-controlled furnace. After the specimens were conditioned, as described above,
they were placed in the fixture shown in Fig. 11 such that the strain was fixed and the stress
was initially zero. The fixture provided full confinement and the furnace were used to trigger
the shape memory effect by heating the specimen above its Tg. During heating, the sample
attempts to expand against the fixed strain boundary condition, resulting in the generation of
recovery stress. The MTS machine was used to record the resulting recovery stress. Heating
was performed at an average rate of 0.3oC/min from room temperature until 79oC and then
the temperature was maintained constant for approximately 20 min. The MTS machine’s
load cell was used to record the recovered force as a function of time and temperature.
Similarly, three effective specimens were tested for each environmental conditioning and
control.
27
Figure 11. MTS machine with furnace and fixture used for fully-confined recovery
Cyclic Loading Test
Cyclic loading tests at room temperature
To evaluate the fatigue properties of the syntactic foam and pure SMP, cyclic loading
tests were conducted under strain controlled mode at room temperature. The specimens were
tested under fully reversed compression-tension uniaxial cyclic stress. A triangular wave
form and a constant loading rate were used for all tests. The tests were conducted on MTS
810 machine (see Fig. 12), using care to adjust the specimen symmetrically to distribute
compression and tension force uniformly over the specimen cross section. The middle 1/3
central length of the programmed specimen was tested, and the other two 1/3 lengths along
the two ends were tightly clamped to avoid buckling under high compressive loads needed to
impose the deformation desired. However, cyclic testing of specimens under fully reversed
uniaxial loading condition is currently not covered by any specific standard [36]. In this test,
each specimen was compressed to a 5% strain and then reversed to zero strain by tension.
This compression-tension cycle continued until failure. The loading rate was 0.5 mm/min.
The loading frequency was approximately 1/305 Hz. Also, some characteristic parameters
can be automatically obtained from the testing results in the MTS system, for example, peak
stress, dynamic modulus (the ratio of stress to strain under dynamic conditions), and stiffness
(the frequency dependant ratio of the dynamic force over the resulting displacement).
28
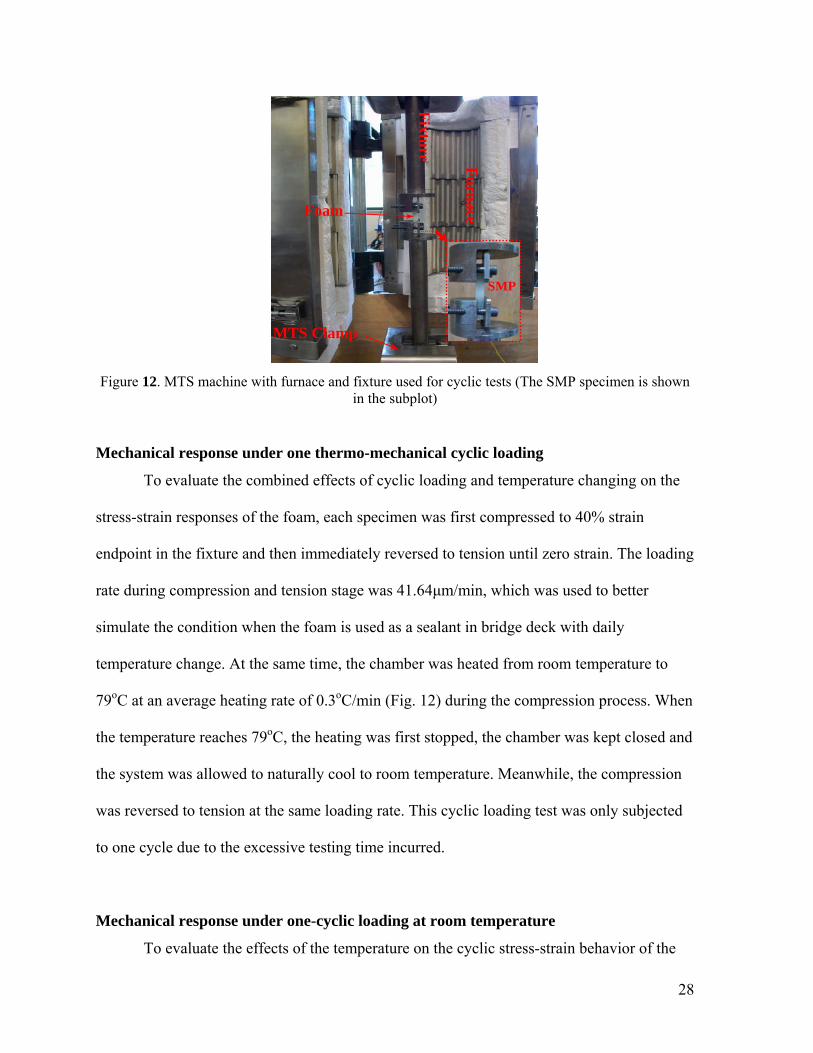
Figure 12. MTS machine with furnace and fixture used for cyclic tests (The SMP specimen is shown in the subplot)
Mechanical response under one thermo-mechanical cyclic loading
To evaluate the combined effects of cyclic loading and temperature changing on the
stress-strain responses of the foam, each specimen was first compressed to 40% strain
endpoint in the fixture and then immediately reversed to tension until zero strain. The loading
rate during compression and tension stage was 41.64μm/min, which was used to better
simulate the condition when the foam is used as a sealant in bridge deck with daily
temperature change. At the same time, the chamber was heated from room temperature to
79oC at an average heating rate of 0.3oC/min (Fig. 12) during the compression process. When
the temperature reaches 79oC, the heating was first stopped, the chamber was kept closed and
the system was allowed to naturally cool to room temperature. Meanwhile, the compression
was reversed to tension at the same loading rate. This cyclic loading test was only subjected
to one cycle due to the excessive testing time incurred.
Mechanical response under one-cyclic loading at room temperature
To evaluate the effects of the temperature on the cyclic stress-strain behavior of the
MTS Clamp
Foam
Fixtu
re Fu
rnace
SMP
29
foam, one-cyclic loading tests at constant room temperature were conducted for
nonprogrammed and programmed foams. The testing setup and loading method were the
same as that of thermo-mechanical test (Fig. 12), but without the furnace. In this case, each
specimen was also first compressed to a 40% strain endpoint and then immediately reversed
to tension until zero strain at a loading rate of 41.64μm/min during both compression and
tension.
Feasibility of Replacing One Step 2-D Programming by Two-Step 1-D Programming
Raw Materials
The syntactic foam sealant consists of hollow glass microspheres dispersed in a shape
memory polymer matrix. The polymer is a styrene based thermoset SMP resin system sold
commercially by CRG Industries under the name Veriflex® (glass transition temperature:
62oC, tensile strength: 23 MPa, density: 920 kg/m3, and elastic modulus: 1.24 GPa at room
temperature.). The glass microballoons were purchased from Potters Industries (Q-CEL6014:
average outer diameter: 85μm, bulk density: 0.08 g/cm3, effective density: 0.14 g/cm3,
maximum working pressure: 1.73MPa, and wall thickness: 0.8μm). No special surface
treatment was conducted. These raw materials have been used previously for the smart
syntactic foam [37, 38].
Syntactic foam fabrication and specimen preparation
The SMP based syntactic foam was fabricated by dispersing 40% by volume of the
hollow glass microspheres into the SMP resin. The microspheres were added to the resin
while slowly stirring the mixture to minimize air bubbles in the resin. The microspheres were
added in multiple steps to avoid agglomeration. After dispersion, a hardening agent was
added and the solution mixed for 10 min.

30
The mixture was then poured into a 229×229×12.7 mm steel mold and placed in a
vacuum chamber at 40kPa for 20 min in order to remove any air pockets introduced during
the mixing process. Based on our previous study [19,22,24], the curing cycle was 79oC for
24h, 107oC for 3h, and 121oC for 9h. After curing, the foam panel was de-molded and was
ready to be machined into required specimens for programming.
Our strategy for preparing test specimens is to first prepare tension specimens for
programming at temperature above Tg, and after programming, the tensile specimens be
machined into compression specimens for second programming at temperatures below Tg.
The reason is that the foam has a maximum tensile strain of about 5% at temperatures below
Tg and cannot be programmed because it fractures without yielding under tension [37]. Also,
if the foam is programmed first at temperature below Tg, the second programming at
temperatures above Tg will lead to recovery of the first programming.
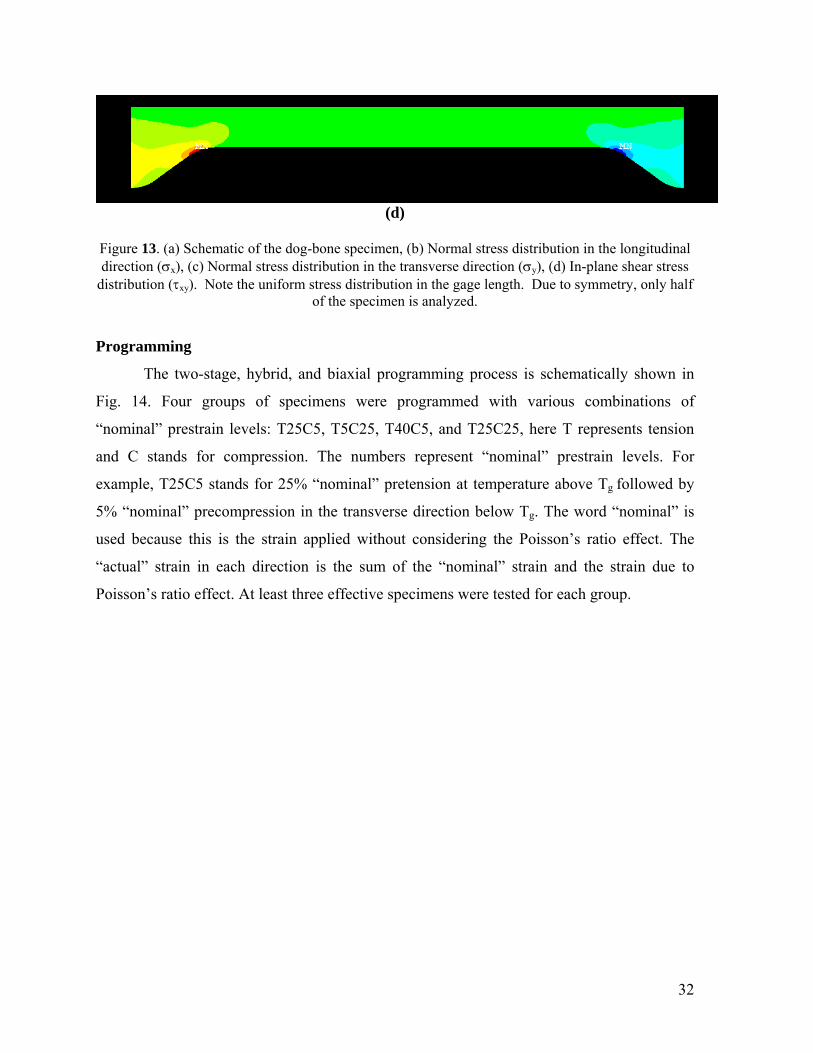
By referencing ASTM D638M-89 standard, dog-bone specimen was used for tension
programming. The only revision was to increase the specimen thickness from 2 mm to 10
mm, in order to avoid buckling in the subsequent compression programming. A finite
element analysis was conducted which validated the uniform tensile stress distribution in the
gage length of the dog-bone specimen; see Fig. 13 (a) – (d). During the FEM analysis, only
half of the specimen was modeled due to symmetry. Because a section with a length of
25mm at each end (Fig. 13 (a)) was gripped during tension programming, the 25mm long
section at each end was not meshed; instead, boundary conditions were applied to simulate
the gripped loading condition. In this study, the left hand boundary was fixed and the right
hand boundary was allowed to move in the x direction (loading direction) only. At the
centerline of the dog bone specimen, symmetry boundary condition was enforced. The
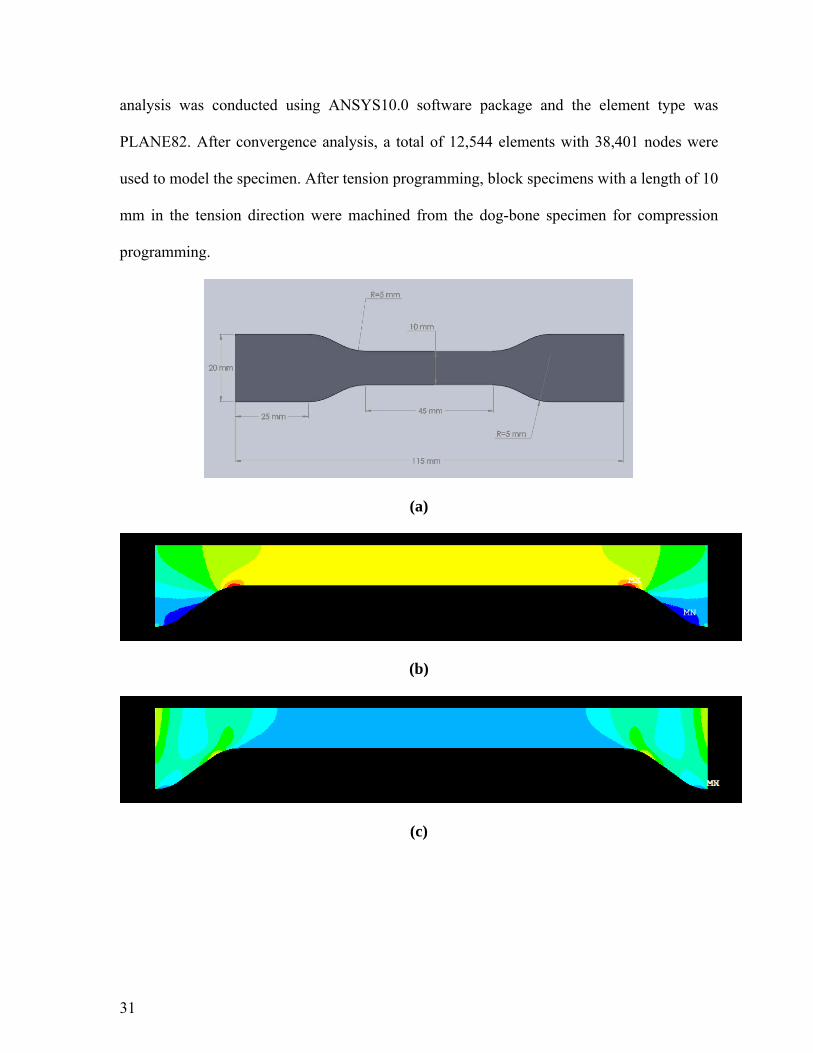
31
analysis was conducted using ANSYS10.0 software package and the element type was
PLANE82. After convergence analysis, a total of 12,544 elements with 38,401 nodes were
used to model the specimen. After tension programming, block specimens with a length of 10
mm in the tension direction were machined from the dog-bone specimen for compression
programming.
(a)
(b)
(c)
32
(d)
Figure 13. (a) Schematic of the dog-bone specimen, (b) Normal stress distribution in the longitudinal direction (x), (c) Normal stress distribution in the transverse direction (y), (d) In-plane shear stress
distribution (xy). Note the uniform stress distribution in the gage length. Due to symmetry, only half of the specimen is analyzed.
Programming
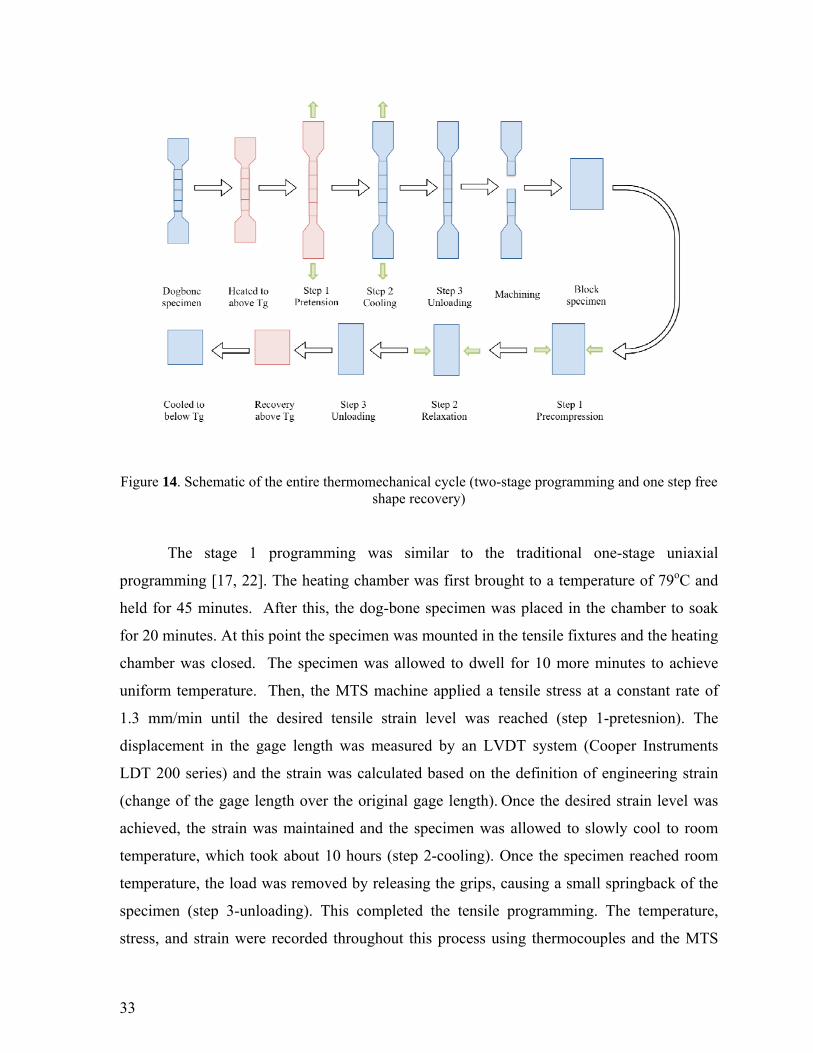
The two-stage, hybrid, and biaxial programming process is schematically shown in
Fig. 14. Four groups of specimens were programmed with various combinations of
“nominal” prestrain levels: T25C5, T5C25, T40C5, and T25C25, here T represents tension
and C stands for compression. The numbers represent “nominal” prestrain levels. For
example, T25C5 stands for 25% “nominal” pretension at temperature above Tg followed by
5% “nominal” precompression in the transverse direction below Tg. The word “nominal” is
used because this is the strain applied without considering the Poisson’s ratio effect. The
“actual” strain in each direction is the sum of the “nominal” strain and the strain due to
Poisson’s ratio effect. At least three effective specimens were tested for each group.
33
Figure 14. Schematic of the entire thermomechanical cycle (two-stage programming and one step free shape recovery)
The stage 1 programming was similar to the traditional one-stage uniaxial
programming [17, 22]. The heating chamber was first brought to a temperature of 79oC and
held for 45 minutes. After this, the dog-bone specimen was placed in the chamber to soak
for 20 minutes. At this point the specimen was mounted in the tensile fixtures and the heating
chamber was closed. The specimen was allowed to dwell for 10 more minutes to achieve
uniform temperature. Then, the MTS machine applied a tensile stress at a constant rate of
1.3 mm/min until the desired tensile strain level was reached (step 1-pretesnion). The
displacement in the gage length was measured by an LVDT system (Cooper Instruments
LDT 200 series) and the strain was calculated based on the definition of engineering strain
(change of the gage length over the original gage length). Once the desired strain level was
achieved, the strain was maintained and the specimen was allowed to slowly cool to room
temperature, which took about 10 hours (step 2-cooling). Once the specimen reached room
temperature, the load was removed by releasing the grips, causing a small springback of the
specimen (step 3-unloading). This completed the tensile programming. The temperature,
stress, and strain were recorded throughout this process using thermocouples and the MTS
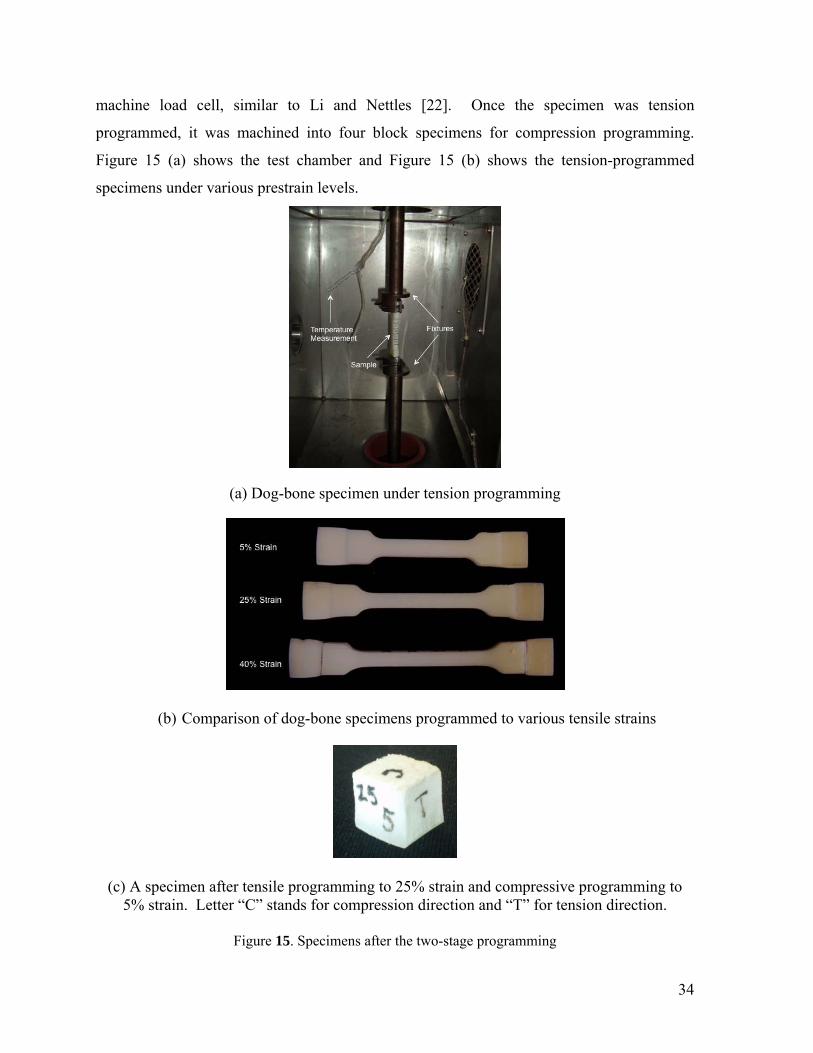
34
machine load cell, similar to Li and Nettles [22]. Once the specimen was tension
programmed, it was machined into four block specimens for compression programming.
Figure 15 (a) shows the test chamber and Figure 15 (b) shows the tension-programmed
specimens under various prestrain levels.
(a) Dog-bone specimen under tension programming
(b) Comparison of dog-bone specimens programmed to various tensile strains
(c) A specimen after tensile programming to 25% strain and compressive programming to 5% strain. Letter “C” stands for compression direction and “T” for tension direction.
Figure 15. Specimens after the two-stage programming
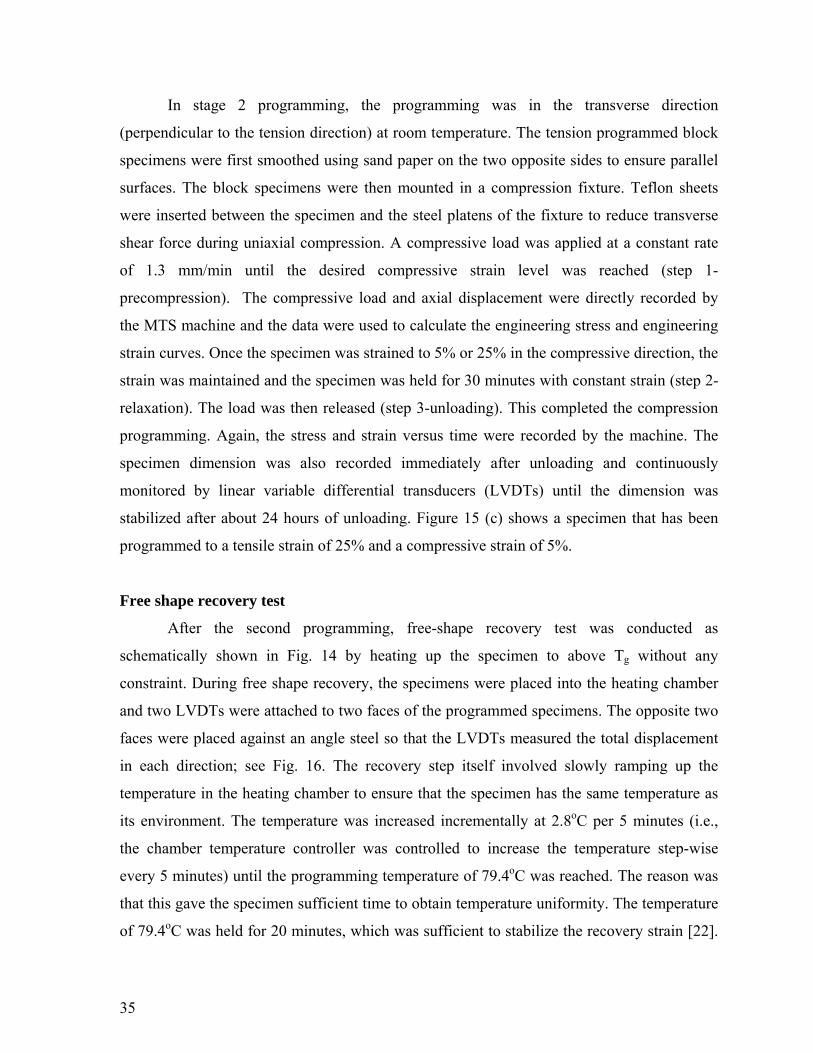
35
In stage 2 programming, the programming was in the transverse direction
(perpendicular to the tension direction) at room temperature. The tension programmed block
specimens were first smoothed using sand paper on the two opposite sides to ensure parallel
surfaces. The block specimens were then mounted in a compression fixture. Teflon sheets
were inserted between the specimen and the steel platens of the fixture to reduce transverse
shear force during uniaxial compression. A compressive load was applied at a constant rate
of 1.3 mm/min until the desired compressive strain level was reached (step 1-
precompression). The compressive load and axial displacement were directly recorded by
the MTS machine and the data were used to calculate the engineering stress and engineering
strain curves. Once the specimen was strained to 5% or 25% in the compressive direction, the
strain was maintained and the specimen was held for 30 minutes with constant strain (step 2-
relaxation). The load was then released (step 3-unloading). This completed the compression
programming. Again, the stress and strain versus time were recorded by the machine. The
specimen dimension was also recorded immediately after unloading and continuously
monitored by linear variable differential transducers (LVDTs) until the dimension was
stabilized after about 24 hours of unloading. Figure 15 (c) shows a specimen that has been
programmed to a tensile strain of 25% and a compressive strain of 5%.
Free shape recovery test
After the second programming, free-shape recovery test was conducted as
schematically shown in Fig. 14 by heating up the specimen to above Tg without any
constraint. During free shape recovery, the specimens were placed into the heating chamber
and two LVDTs were attached to two faces of the programmed specimens. The opposite two
faces were placed against an angle steel so that the LVDTs measured the total displacement
in each direction; see Fig. 16. The recovery step itself involved slowly ramping up the
temperature in the heating chamber to ensure that the specimen has the same temperature as
its environment. The temperature was increased incrementally at 2.8oC per 5 minutes (i.e.,
the chamber temperature controller was controlled to increase the temperature step-wise
every 5 minutes) until the programming temperature of 79.4oC was reached. The reason was
that this gave the specimen sufficient time to obtain temperature uniformity. The temperature
of 79.4oC was held for 20 minutes, which was sufficient to stabilize the recovery strain [22].
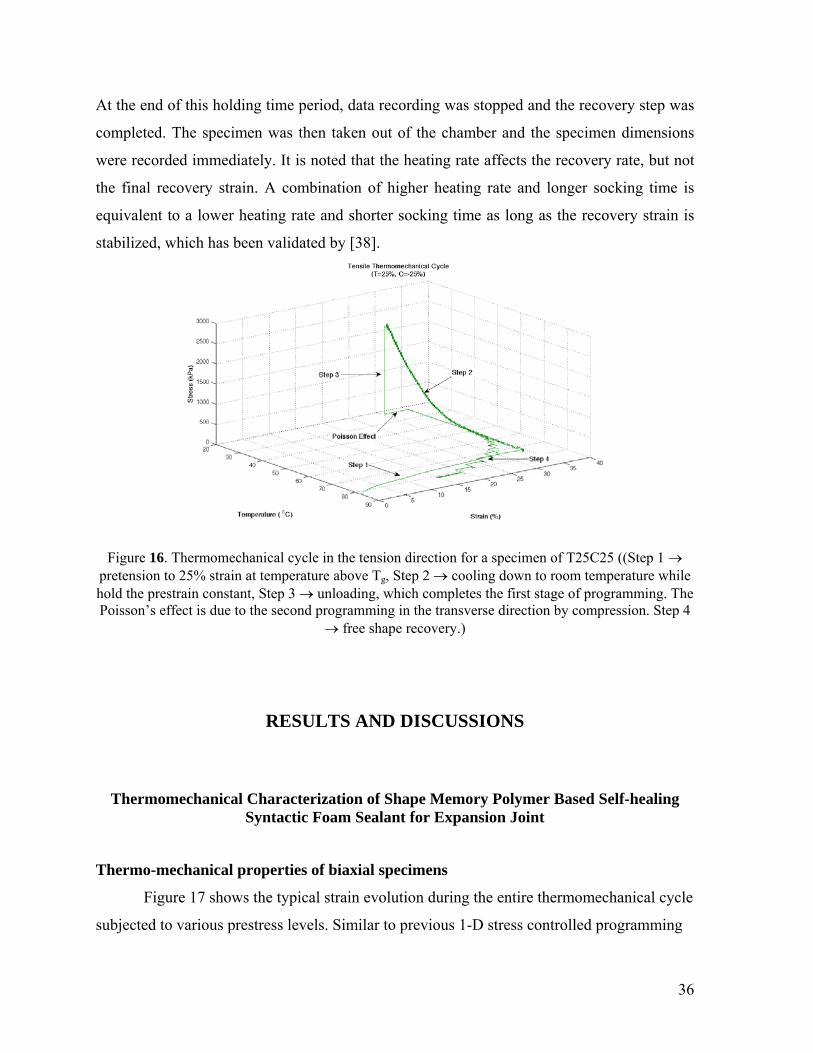
36
At the end of this holding time period, data recording was stopped and the recovery step was
completed. The specimen was then taken out of the chamber and the specimen dimensions
were recorded immediately. It is noted that the heating rate affects the recovery rate, but not
the final recovery strain. A combination of higher heating rate and longer socking time is
equivalent to a lower heating rate and shorter socking time as long as the recovery strain is
stabilized, which has been validated by [38].
Figure 16. Thermomechanical cycle in the tension direction for a specimen of T25C25 ((Step 1 pretension to 25% strain at temperature above Tg, Step 2 cooling down to room temperature while hold the prestrain constant, Step 3 unloading, which completes the first stage of programming. The Poisson’s effect is due to the second programming in the transverse direction by compression. Step 4
free shape recovery.)
RESULTS AND DISCUSSIONS
Thermomechanical Characterization of Shape Memory Polymer Based Self-healing Syntactic Foam Sealant for Expansion Joint
Thermo-mechanical properties of biaxial specimens
Figure 17 shows the typical strain evolution during the entire thermomechanical cycle
subjected to various prestress levels. Similar to previous 1-D stress controlled programming
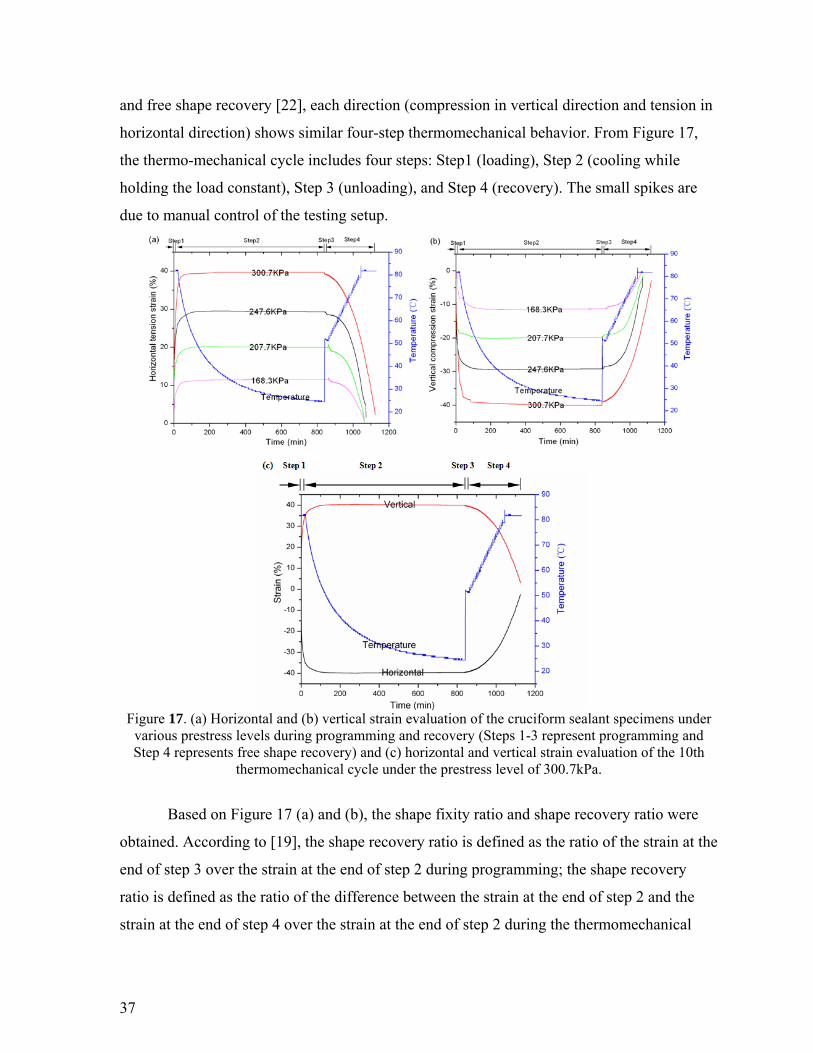
37
and free shape recovery [22], each direction (compression in vertical direction and tension in
horizontal direction) shows similar four-step thermomechanical behavior. From Figure 17,
the thermo-mechanical cycle includes four steps: Step1 (loading), Step 2 (cooling while
holding the load constant), Step 3 (unloading), and Step 4 (recovery). The small spikes are
due to manual control of the testing setup.
Figure 17. (a) Horizontal and (b) vertical strain evaluation of the cruciform sealant specimens under
various prestress levels during programming and recovery (Steps 1-3 represent programming and Step 4 represents free shape recovery) and (c) horizontal and vertical strain evaluation of the 10th
thermomechanical cycle under the prestress level of 300.7kPa.
Based on Figure 17 (a) and (b), the shape fixity ratio and shape recovery ratio were
obtained. According to [19], the shape recovery ratio is defined as the ratio of the strain at the
end of step 3 over the strain at the end of step 2 during programming; the shape recovery
ratio is defined as the ratio of the difference between the strain at the end of step 2 and the
strain at the end of step 4 over the strain at the end of step 2 during the thermomechanical
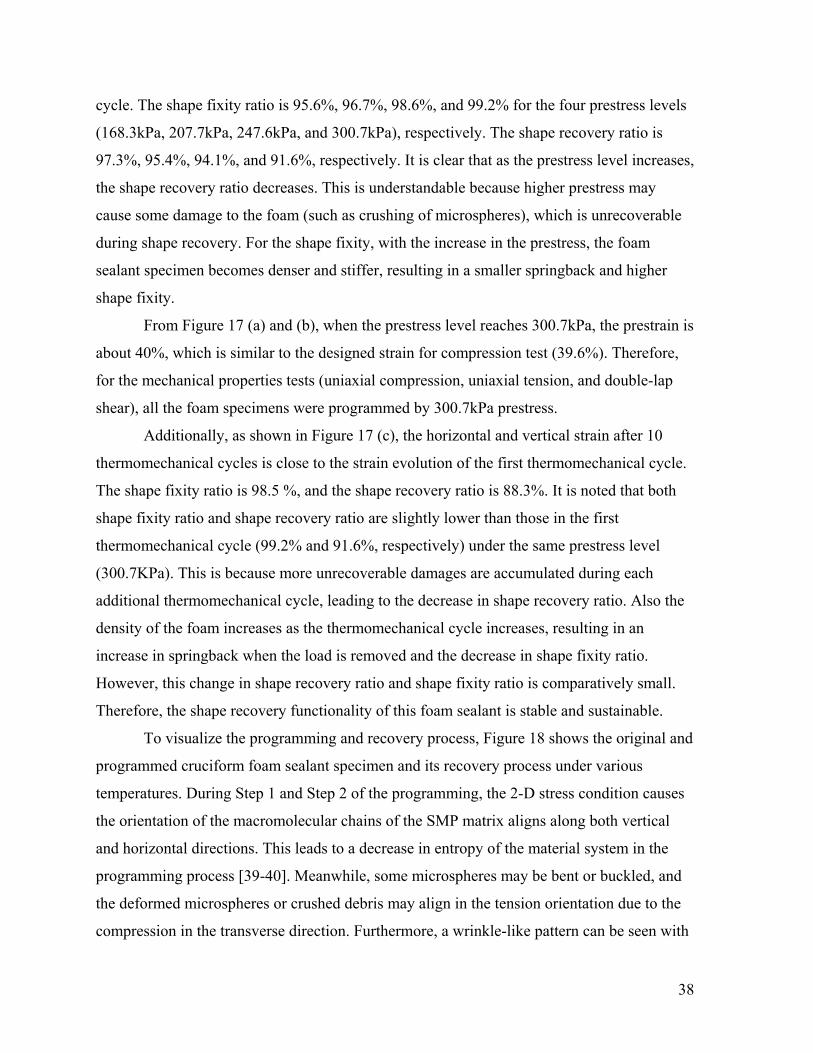
38
cycle. The shape fixity ratio is 95.6%, 96.7%, 98.6%, and 99.2% for the four prestress levels
(168.3kPa, 207.7kPa, 247.6kPa, and 300.7kPa), respectively. The shape recovery ratio is
97.3%, 95.4%, 94.1%, and 91.6%, respectively. It is clear that as the prestress level increases,
the shape recovery ratio decreases. This is understandable because higher prestress may
cause some damage to the foam (such as crushing of microspheres), which is unrecoverable
during shape recovery. For the shape fixity, with the increase in the prestress, the foam
sealant specimen becomes denser and stiffer, resulting in a smaller springback and higher
shape fixity.
From Figure 17 (a) and (b), when the prestress level reaches 300.7kPa, the prestrain is
about 40%, which is similar to the designed strain for compression test (39.6%). Therefore,
for the mechanical properties tests (uniaxial compression, uniaxial tension, and double-lap
shear), all the foam specimens were programmed by 300.7kPa prestress.
Additionally, as shown in Figure 17 (c), the horizontal and vertical strain after 10
thermomechanical cycles is close to the strain evolution of the first thermomechanical cycle.
The shape fixity ratio is 98.5 %, and the shape recovery ratio is 88.3%. It is noted that both
shape fixity ratio and shape recovery ratio are slightly lower than those in the first
thermomechanical cycle (99.2% and 91.6%, respectively) under the same prestress level
(300.7KPa). This is because more unrecoverable damages are accumulated during each
additional thermomechanical cycle, leading to the decrease in shape recovery ratio. Also the
density of the foam increases as the thermomechanical cycle increases, resulting in an
increase in springback when the load is removed and the decrease in shape fixity ratio.
However, this change in shape recovery ratio and shape fixity ratio is comparatively small.
Therefore, the shape recovery functionality of this foam sealant is stable and sustainable.
To visualize the programming and recovery process, Figure 18 shows the original and
programmed cruciform foam sealant specimen and its recovery process under various
temperatures. During Step 1 and Step 2 of the programming, the 2-D stress condition causes
the orientation of the macromolecular chains of the SMP matrix aligns along both vertical
and horizontal directions. This leads to a decrease in entropy of the material system in the
programming process [39-40]. Meanwhile, some microspheres may be bent or buckled, and
the deformed microspheres or crushed debris may align in the tension orientation due to the
compression in the transverse direction. Furthermore, a wrinkle-like pattern can be seen with
39
naked eye on the stretched specimen surface along both directions, as shown in Figure 18 (b).
This reflects the 2-D stress conditions. It is believed that the central square of the cruciform
foam sealant specimen is changed from isotropy to anisotropy. From Figure 18 (c-f), the
recovery rates in horizontal and vertical directions are faster when the temperature is up to
Tg, which is consistent with the strain evolution shown in Figure 17. Additionally, the
recovery process occurs in both directions simultaneously, which is important for the sealant
in expansion joints to expand in the horizontal direction and contract in the vertical direction
without distortion. It is beneficial to achieve the design purpose of smart foam sealant
proposed in this study.
Figure 18. (a) Original and (b) programmed cruciform foam sealant specimen and (c-f) its recovery process under various temperatures
Compression test
Stress–strain responses of the programmed foam sealant (including 0 cycle (original
nonprogrammed foam), 1 and 10 programming-recovery cycles) at room temperature are
shown in Figure 19.
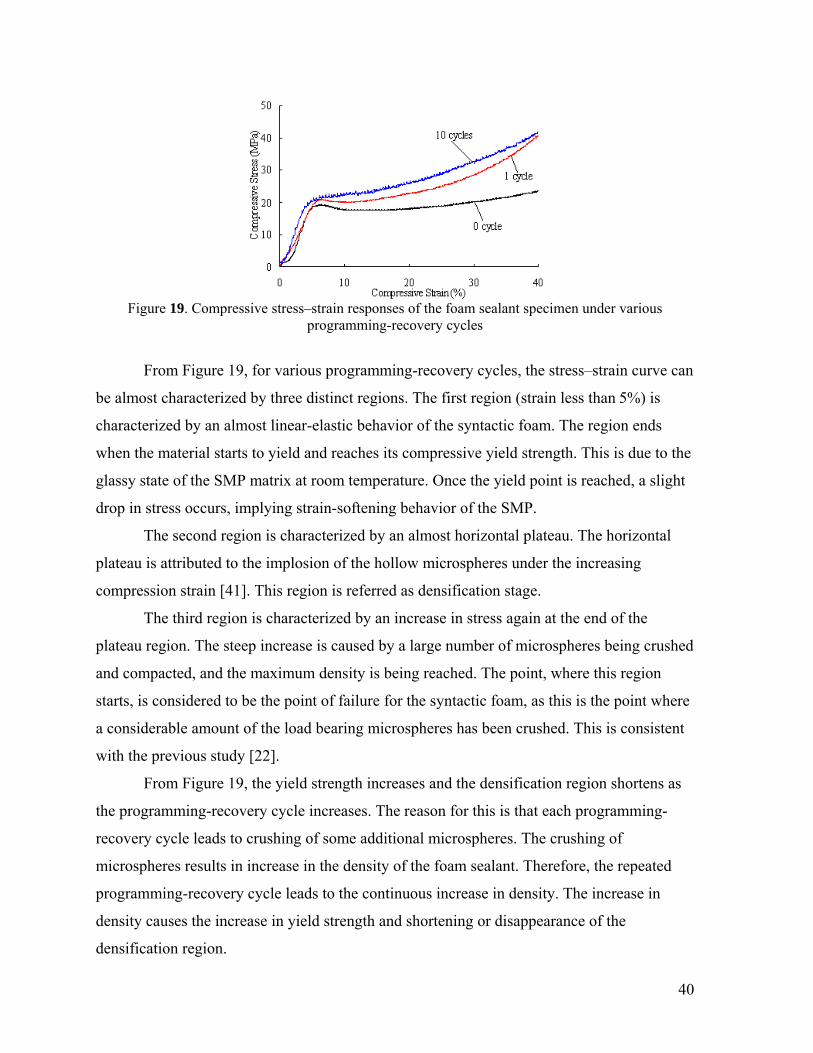
40
Figure 19. Compressive stress–strain responses of the foam sealant specimen under various
programming-recovery cycles
From Figure 19, for various programming-recovery cycles, the stress–strain curve can
be almost characterized by three distinct regions. The first region (strain less than 5%) is
characterized by an almost linear-elastic behavior of the syntactic foam. The region ends
when the material starts to yield and reaches its compressive yield strength. This is due to the
glassy state of the SMP matrix at room temperature. Once the yield point is reached, a slight
drop in stress occurs, implying strain-softening behavior of the SMP.
The second region is characterized by an almost horizontal plateau. The horizontal
plateau is attributed to the implosion of the hollow microspheres under the increasing
compression strain [41]. This region is referred as densification stage.
The third region is characterized by an increase in stress again at the end of the
plateau region. The steep increase is caused by a large number of microspheres being crushed
and compacted, and the maximum density is being reached. The point, where this region
starts, is considered to be the point of failure for the syntactic foam, as this is the point where
a considerable amount of the load bearing microspheres has been crushed. This is consistent
with the previous study [22].
From Figure 19, the yield strength increases and the densification region shortens as
the programming-recovery cycle increases. The reason for this is that each programming-
recovery cycle leads to crushing of some additional microspheres. The crushing of
microspheres results in increase in the density of the foam sealant. Therefore, the repeated
programming-recovery cycle leads to the continuous increase in density. The increase in
density causes the increase in yield strength and shortening or disappearance of the
densification region.
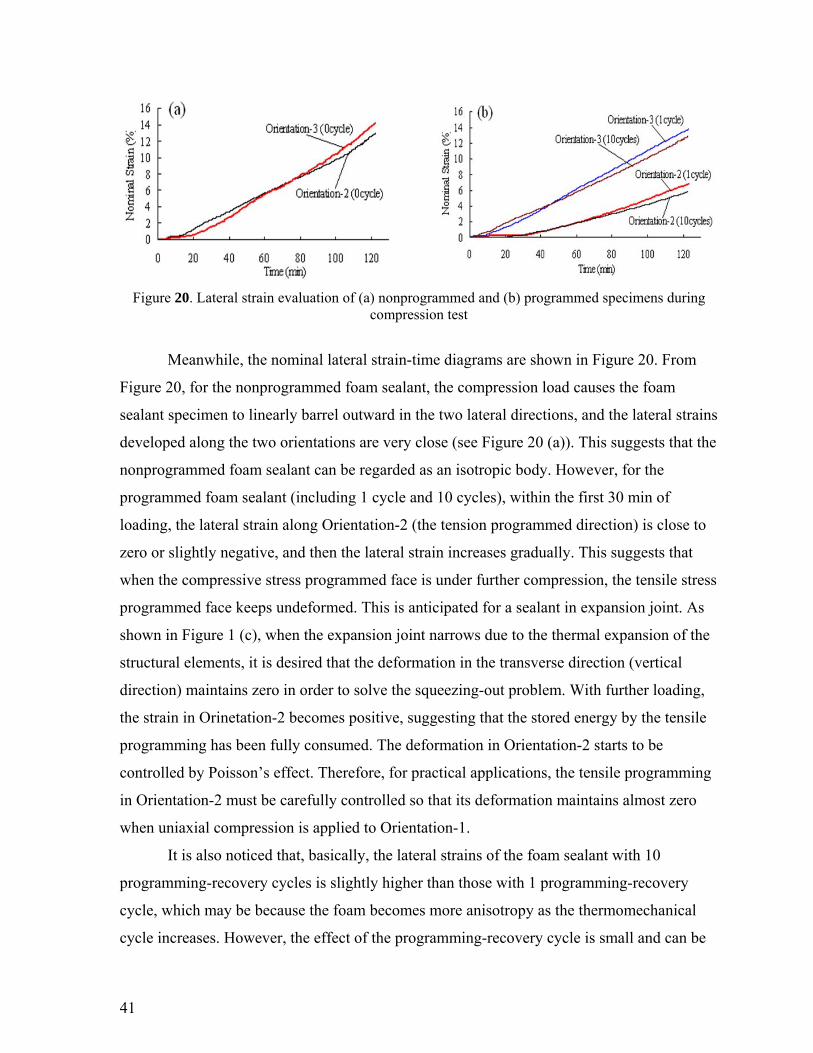
41
Figure 20. Lateral strain evaluation of (a) nonprogrammed and (b) programmed specimens during compression test
Meanwhile, the nominal lateral strain-time diagrams are shown in Figure 20. From
Figure 20, for the nonprogrammed foam sealant, the compression load causes the foam
sealant specimen to linearly barrel outward in the two lateral directions, and the lateral strains
developed along the two orientations are very close (see Figure 20 (a)). This suggests that the
nonprogrammed foam sealant can be regarded as an isotropic body. However, for the
programmed foam sealant (including 1 cycle and 10 cycles), within the first 30 min of
loading, the lateral strain along Orientation-2 (the tension programmed direction) is close to
zero or slightly negative, and then the lateral strain increases gradually. This suggests that
when the compressive stress programmed face is under further compression, the tensile stress
programmed face keeps undeformed. This is anticipated for a sealant in expansion joint. As
shown in Figure 1 (c), when the expansion joint narrows due to the thermal expansion of the
structural elements, it is desired that the deformation in the transverse direction (vertical
direction) maintains zero in order to solve the squeezing-out problem. With further loading,
the strain in Orinetation-2 becomes positive, suggesting that the stored energy by the tensile
programming has been fully consumed. The deformation in Orientation-2 starts to be
controlled by Poisson’s effect. Therefore, for practical applications, the tensile programming
in Orientation-2 must be carefully controlled so that its deformation maintains almost zero
when uniaxial compression is applied to Orientation-1.
It is also noticed that, basically, the lateral strains of the foam sealant with 10
programming-recovery cycles is slightly higher than those with 1 programming-recovery
cycle, which may be because the foam becomes more anisotropy as the thermomechanical
cycle increases. However, the effect of the programming-recovery cycle is small and can be
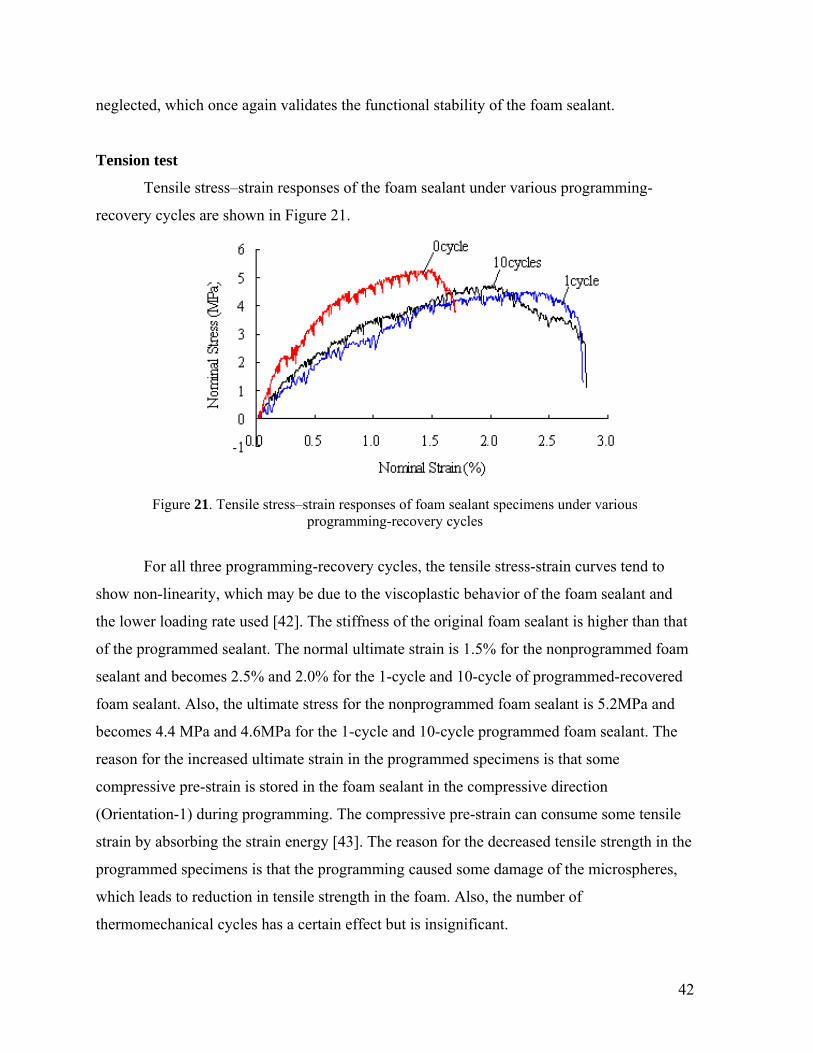
42
neglected, which once again validates the functional stability of the foam sealant.
Tension test
Tensile stress–strain responses of the foam sealant under various programming-
recovery cycles are shown in Figure 21.
Figure 21. Tensile stress–strain responses of foam sealant specimens under various programming-recovery cycles
For all three programming-recovery cycles, the tensile stress-strain curves tend to
show non-linearity, which may be due to the viscoplastic behavior of the foam sealant and
the lower loading rate used [42]. The stiffness of the original foam sealant is higher than that
of the programmed sealant. The normal ultimate strain is 1.5% for the nonprogrammed foam
sealant and becomes 2.5% and 2.0% for the 1-cycle and 10-cycle of programmed-recovered
foam sealant. Also, the ultimate stress for the nonprogrammed foam sealant is 5.2MPa and
becomes 4.4 MPa and 4.6MPa for the 1-cycle and 10-cycle programmed foam sealant. The
reason for the increased ultimate strain in the programmed specimens is that some
compressive pre-strain is stored in the foam sealant in the compressive direction
(Orientation-1) during programming. The compressive pre-strain can consume some tensile
strain by absorbing the strain energy [43]. The reason for the decreased tensile strength in the
programmed specimens is that the programming caused some damage of the microspheres,
which leads to reduction in tensile strength in the foam. Also, the number of
thermomechanical cycles has a certain effect but is insignificant.
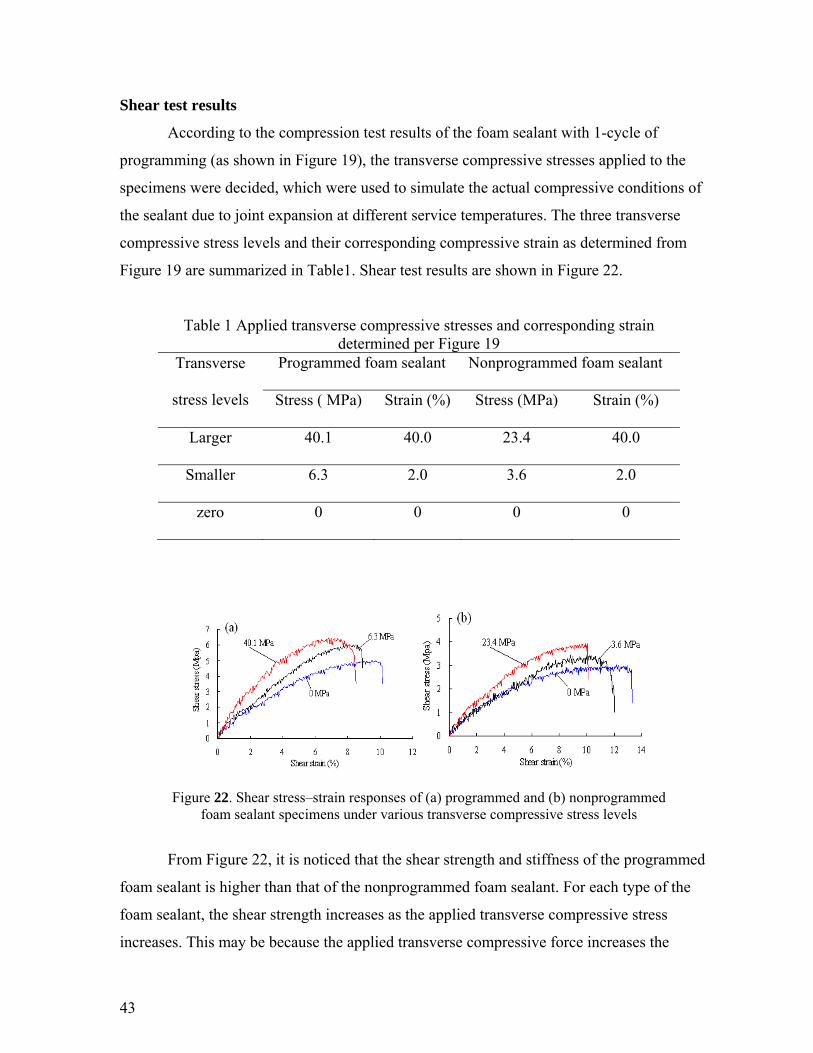
43
Shear test results
According to the compression test results of the foam sealant with 1-cycle of
programming (as shown in Figure 19), the transverse compressive stresses applied to the
specimens were decided, which were used to simulate the actual compressive conditions of
the sealant due to joint expansion at different service temperatures. The three transverse
compressive stress levels and their corresponding compressive strain as determined from
Figure 19 are summarized in Table1. Shear test results are shown in Figure 22.
Table 1 Applied transverse compressive stresses and corresponding strain determined per Figure 19
Transverse
stress levels
Programmed foam sealant Nonprogrammed foam sealant
Stress ( MPa) Strain (%) Stress (MPa) Strain (%)
Larger 40.1 40.0 23.4 40.0
Smaller 6.3 2.0 3.6 2.0
zero 0 0 0 0
Figure 22. Shear stress–strain responses of (a) programmed and (b) nonprogrammed foam sealant specimens under various transverse compressive stress levels
From Figure 22, it is noticed that the shear strength and stiffness of the programmed
foam sealant is higher than that of the nonprogrammed foam sealant. For each type of the
foam sealant, the shear strength increases as the applied transverse compressive stress
increases. This may be because the applied transverse compressive force increases the
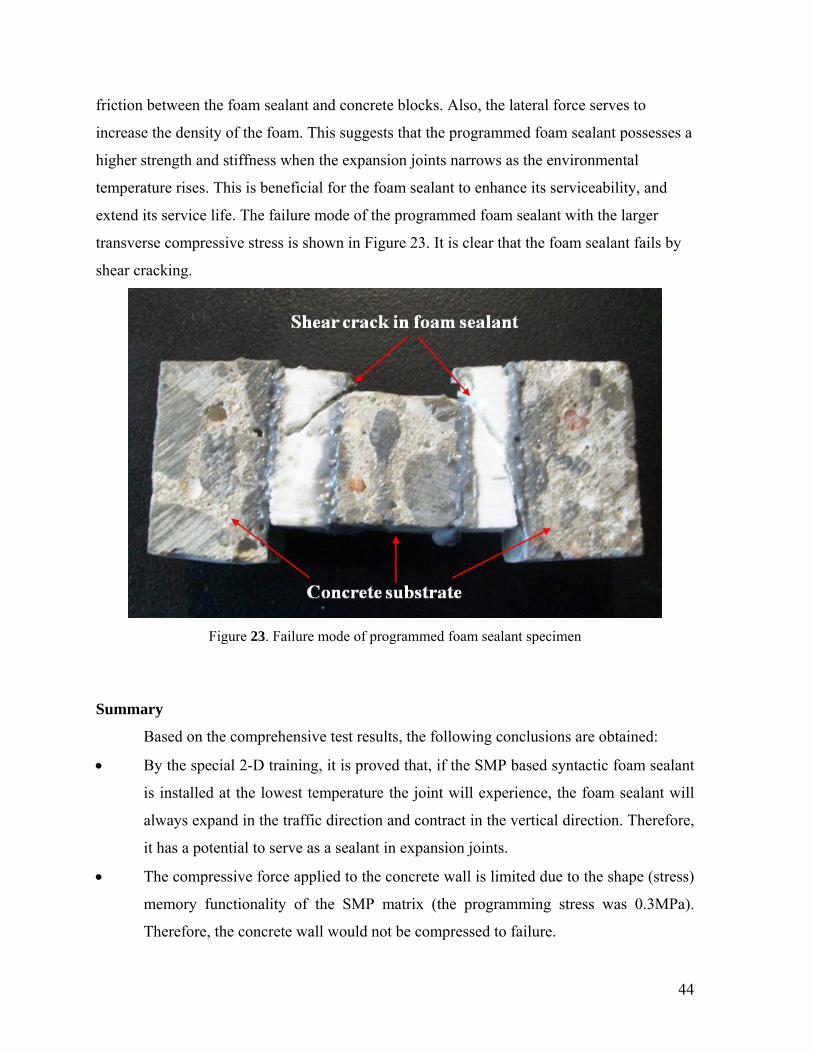
44
friction between the foam sealant and concrete blocks. Also, the lateral force serves to
increase the density of the foam. This suggests that the programmed foam sealant possesses a
higher strength and stiffness when the expansion joints narrows as the environmental
temperature rises. This is beneficial for the foam sealant to enhance its serviceability, and
extend its service life. The failure mode of the programmed foam sealant with the larger
transverse compressive stress is shown in Figure 23. It is clear that the foam sealant fails by
shear cracking.
Figure 23. Failure mode of programmed foam sealant specimen
Summary
Based on the comprehensive test results, the following conclusions are obtained:
By the special 2-D training, it is proved that, if the SMP based syntactic foam sealant
is installed at the lowest temperature the joint will experience, the foam sealant will
always expand in the traffic direction and contract in the vertical direction. Therefore,
it has a potential to serve as a sealant in expansion joints.
The compressive force applied to the concrete wall is limited due to the shape (stress)
memory functionality of the SMP matrix (the programming stress was 0.3MPa).
Therefore, the concrete wall would not be compressed to failure.
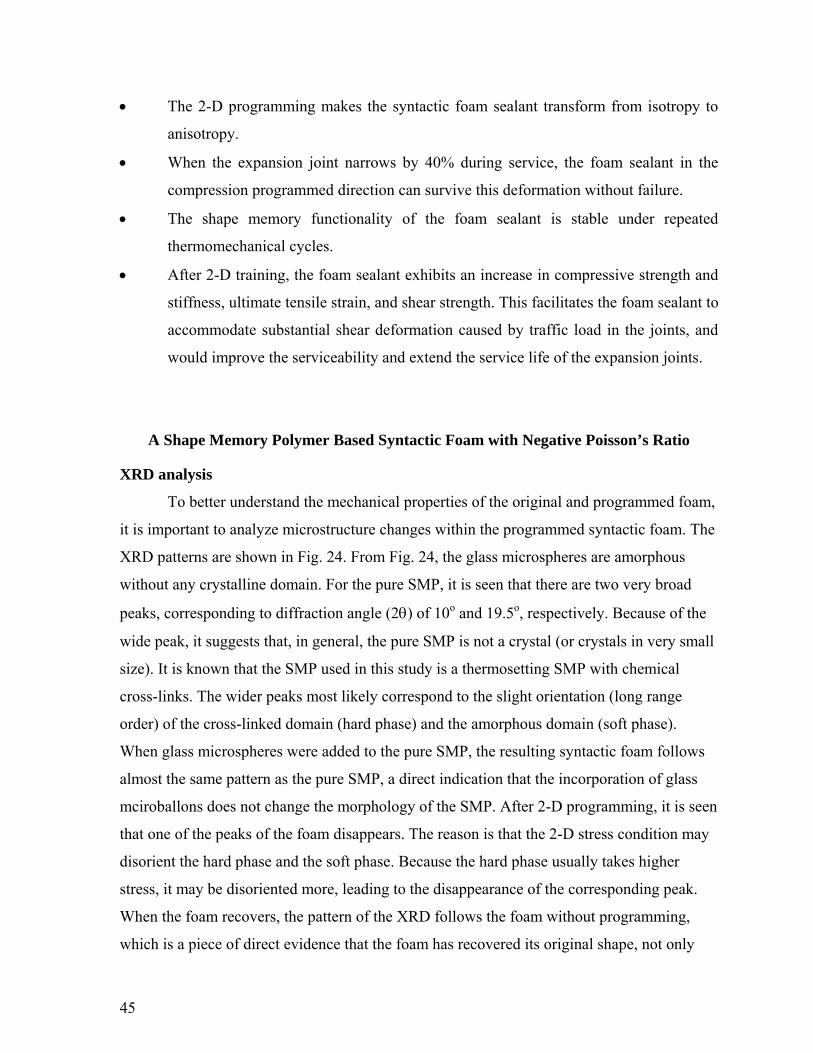
45
The 2-D programming makes the syntactic foam sealant transform from isotropy to
anisotropy.
When the expansion joint narrows by 40% during service, the foam sealant in the
compression programmed direction can survive this deformation without failure.
The shape memory functionality of the foam sealant is stable under repeated
thermomechanical cycles.
After 2-D training, the foam sealant exhibits an increase in compressive strength and
stiffness, ultimate tensile strain, and shear strength. This facilitates the foam sealant to
accommodate substantial shear deformation caused by traffic load in the joints, and
would improve the serviceability and extend the service life of the expansion joints.
A Shape Memory Polymer Based Syntactic Foam with Negative Poisson’s Ratio
XRD analysis
To better understand the mechanical properties of the original and programmed foam,
it is important to analyze microstructure changes within the programmed syntactic foam. The
XRD patterns are shown in Fig. 24. From Fig. 24, the glass microspheres are amorphous
without any crystalline domain. For the pure SMP, it is seen that there are two very broad
peaks, corresponding to diffraction angle (2) of 10o and 19.5o, respectively. Because of the
wide peak, it suggests that, in general, the pure SMP is not a crystal (or crystals in very small
size). It is known that the SMP used in this study is a thermosetting SMP with chemical
cross-links. The wider peaks most likely correspond to the slight orientation (long range
order) of the cross-linked domain (hard phase) and the amorphous domain (soft phase).
When glass microspheres were added to the pure SMP, the resulting syntactic foam follows
almost the same pattern as the pure SMP, a direct indication that the incorporation of glass
mciroballons does not change the morphology of the SMP. After 2-D programming, it is seen
that one of the peaks of the foam disappears. The reason is that the 2-D stress condition may
disorient the hard phase and the soft phase. Because the hard phase usually takes higher
stress, it may be disoriented more, leading to the disappearance of the corresponding peak.
When the foam recovers, the pattern of the XRD follows the foam without programming,
which is a piece of direct evidence that the foam has recovered its original shape, not only
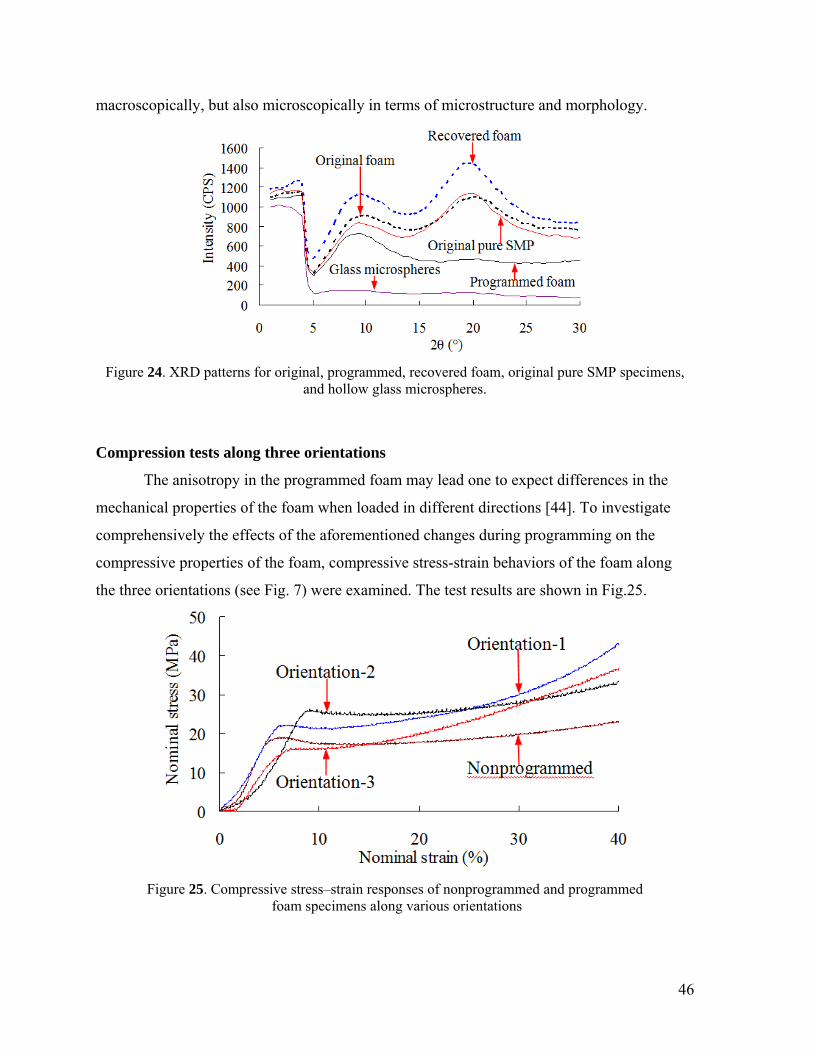
46
macroscopically, but also microscopically in terms of microstructure and morphology.
Figure 24. XRD patterns for original, programmed, recovered foam, original pure SMP specimens, and hollow glass microspheres.
Compression tests along three orientations
The anisotropy in the programmed foam may lead one to expect differences in the
mechanical properties of the foam when loaded in different directions [44]. To investigate
comprehensively the effects of the aforementioned changes during programming on the
compressive properties of the foam, compressive stress-strain behaviors of the foam along
the three orientations (see Fig. 7) were examined. The test results are shown in Fig.25.
Figure 25. Compressive stress–strain responses of nonprogrammed and programmed foam specimens along various orientations
47
From Fig. 25, the shapes of the compressive stress-strain curves of the programmed
foam specimens are different from that obtained from non-programmed specimen. For all the
foam specimens, it is seen that there are three regions in the stress-strain curves. After
experiencing the initial small non-linear portion due to non-perfect contact between the
specimen and the loading platens, the foams behave almost linearly elastic within which
Hooke’s law is obeyed. The slopes of the stress-strain curves in this linear elastic region are
the modulus of elasticity.
After reaching yield point, the curves enter the second region. In this region, glass
microspheres undergo rupturing or crushing. Hence hollow space within the microspheres is
released, which may be occupied by crushed debris and matrix material. These lead to
compaction or densification of the material. Hence the stress is almost constant with the
increase in strain. Damage tolerant characteristics of the syntactic foams are attributed to this
plateau region. However, it can be observed that the plateau regions are different for each
type of the syntactic foams. The original foam possesses a larger plateau region than that of
the programmed foam.
The third region is the solidification region. Solidification begins when the internal
open space is fully occupied by crushed microspheres and surrounding matrix material and
the foam behaves more like a solid. As the solidification increases, the foam becomes stiffer
(strain hardening) so that the load required to compress the specimen increases with further
strain. Eventually, the load reaches a maximum value when the foam is fully damaged.
From Fig. 25, it can be seen that the compressive properties of the programmed foam
depend heavily on the orientation of loading. This may be due to microstructure changes of
the foam in the process of programming. As compared to the nonprogrammed control
specimen, the programmed specimens show increased yield strength in orientations 1 and 2,
and reduced yield strength in orientation 3. This is because, under the 2-D stress condition,
the molecules align more towards orientation 1 and orientation 2. Therefore, the yielding
strength is higher in these two orientations than the non-programmed specimen, which has no
preferred orientation. For orientations 3, the number of aligned molecules has been
significantly reduced, leading to a yielding strength lower than the non-programmed foam
specimen. Therefore, the programmed specimens become anisotropic, or more specifically,
orthotropic.
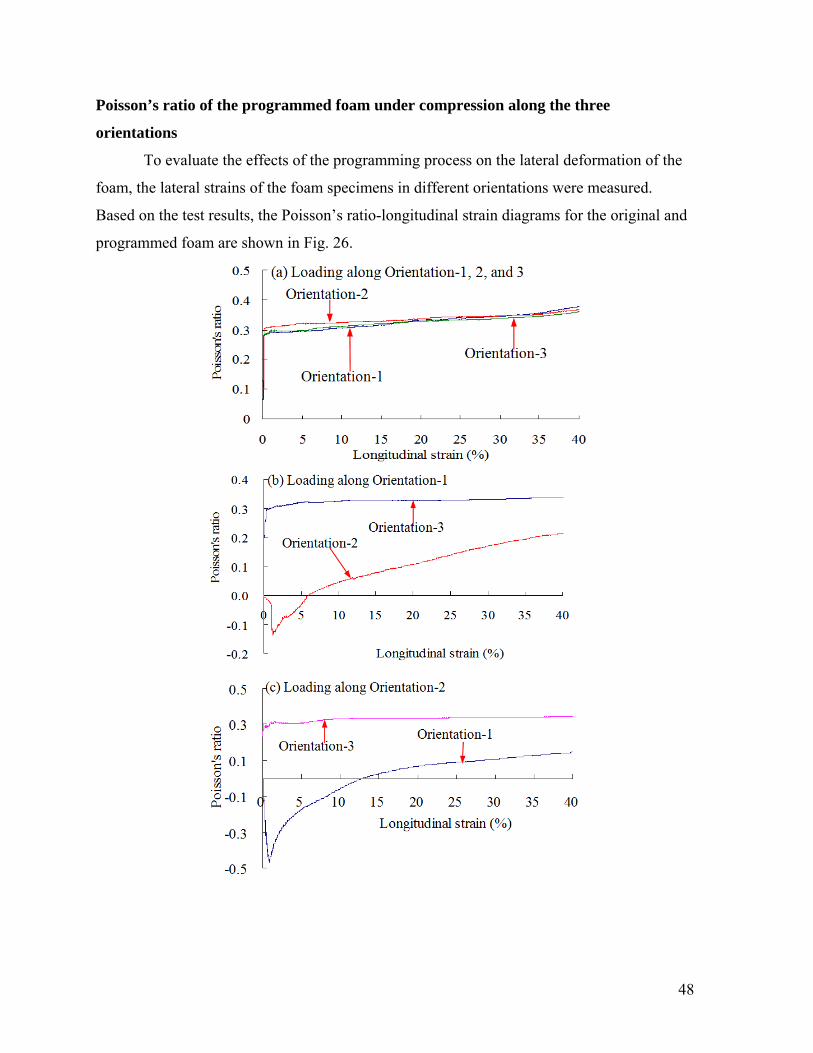
48
Poisson’s ratio of the programmed foam under compression along the three
orientations
To evaluate the effects of the programming process on the lateral deformation of the
foam, the lateral strains of the foam specimens in different orientations were measured.
Based on the test results, the Poisson’s ratio-longitudinal strain diagrams for the original and
programmed foam are shown in Fig. 26.
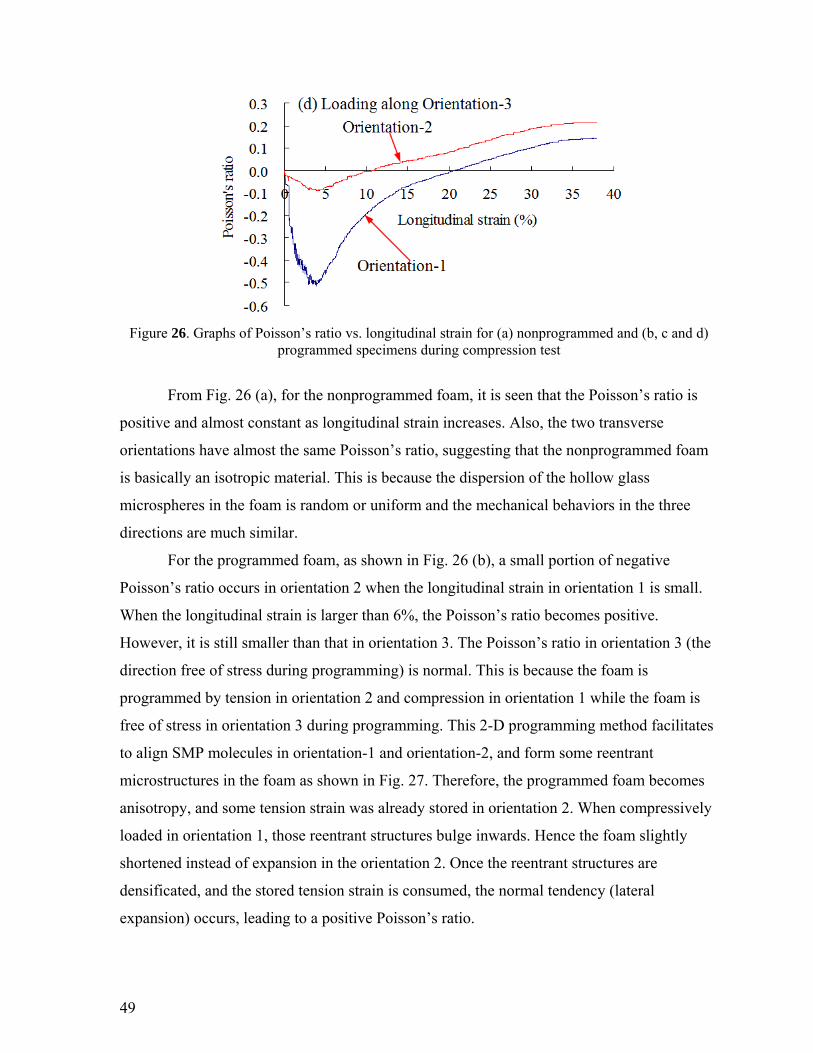
49
Figure 26. Graphs of Poisson’s ratio vs. longitudinal strain for (a) nonprogrammed and (b, c and d) programmed specimens during compression test
From Fig. 26 (a), for the nonprogrammed foam, it is seen that the Poisson’s ratio is
positive and almost constant as longitudinal strain increases. Also, the two transverse
orientations have almost the same Poisson’s ratio, suggesting that the nonprogrammed foam
is basically an isotropic material. This is because the dispersion of the hollow glass
microspheres in the foam is random or uniform and the mechanical behaviors in the three
directions are much similar.
For the programmed foam, as shown in Fig. 26 (b), a small portion of negative
Poisson’s ratio occurs in orientation 2 when the longitudinal strain in orientation 1 is small.
When the longitudinal strain is larger than 6%, the Poisson’s ratio becomes positive.
However, it is still smaller than that in orientation 3. The Poisson’s ratio in orientation 3 (the
direction free of stress during programming) is normal. This is because the foam is
programmed by tension in orientation 2 and compression in orientation 1 while the foam is
free of stress in orientation 3 during programming. This 2-D programming method facilitates
to align SMP molecules in orientation-1 and orientation-2, and form some reentrant
microstructures in the foam as shown in Fig. 27. Therefore, the programmed foam becomes
anisotropy, and some tension strain was already stored in orientation 2. When compressively
loaded in orientation 1, those reentrant structures bulge inwards. Hence the foam slightly
shortened instead of expansion in the orientation 2. Once the reentrant structures are
densificated, and the stored tension strain is consumed, the normal tendency (lateral
expansion) occurs, leading to a positive Poisson’s ratio.
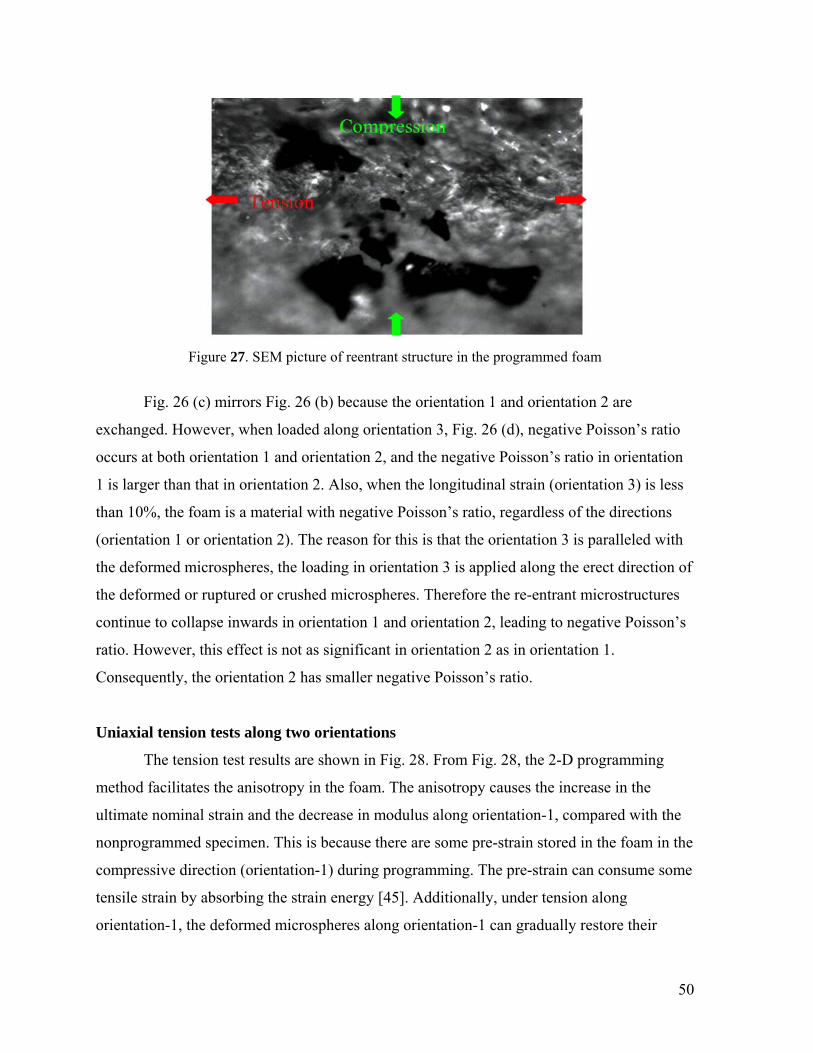
50
Figure 27. SEM picture of reentrant structure in the programmed foam
Fig. 26 (c) mirrors Fig. 26 (b) because the orientation 1 and orientation 2 are
exchanged. However, when loaded along orientation 3, Fig. 26 (d), negative Poisson’s ratio
occurs at both orientation 1 and orientation 2, and the negative Poisson’s ratio in orientation
1 is larger than that in orientation 2. Also, when the longitudinal strain (orientation 3) is less
than 10%, the foam is a material with negative Poisson’s ratio, regardless of the directions
(orientation 1 or orientation 2). The reason for this is that the orientation 3 is paralleled with
the deformed microspheres, the loading in orientation 3 is applied along the erect direction of
the deformed or ruptured or crushed microspheres. Therefore the re-entrant microstructures
continue to collapse inwards in orientation 1 and orientation 2, leading to negative Poisson’s
ratio. However, this effect is not as significant in orientation 2 as in orientation 1.
Consequently, the orientation 2 has smaller negative Poisson’s ratio.
Uniaxial tension tests along two orientations
The tension test results are shown in Fig. 28. From Fig. 28, the 2-D programming
method facilitates the anisotropy in the foam. The anisotropy causes the increase in the
ultimate nominal strain and the decrease in modulus along orientation-1, compared with the
nonprogrammed specimen. This is because there are some pre-strain stored in the foam in the
compressive direction (orientation-1) during programming. The pre-strain can consume some
tensile strain by absorbing the strain energy [45]. Additionally, under tension along
orientation-1, the deformed microspheres along orientation-1 can gradually restore their
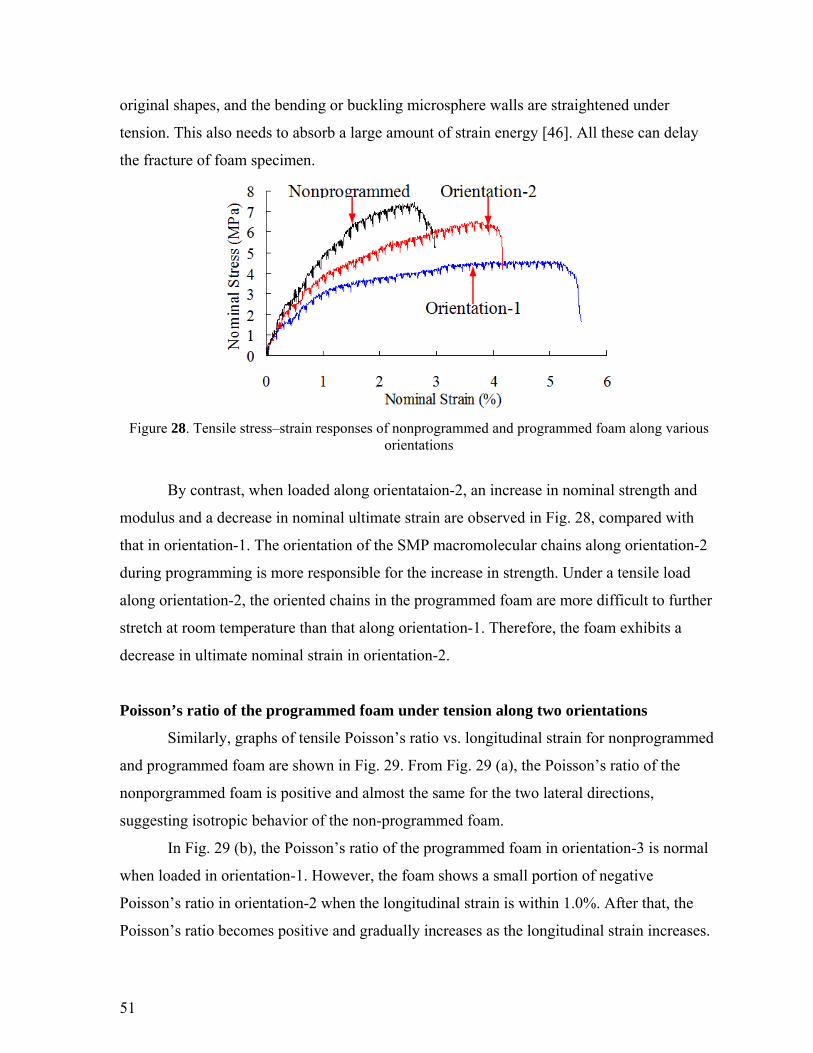
51
original shapes, and the bending or buckling microsphere walls are straightened under
tension. This also needs to absorb a large amount of strain energy [46]. All these can delay
the fracture of foam specimen.
Figure 28. Tensile stress–strain responses of nonprogrammed and programmed foam along various orientations
By contrast, when loaded along orientataion-2, an increase in nominal strength and
modulus and a decrease in nominal ultimate strain are observed in Fig. 28, compared with
that in orientation-1. The orientation of the SMP macromolecular chains along orientation-2
during programming is more responsible for the increase in strength. Under a tensile load
along orientation-2, the oriented chains in the programmed foam are more difficult to further
stretch at room temperature than that along orientation-1. Therefore, the foam exhibits a
decrease in ultimate nominal strain in orientation-2.
Poisson’s ratio of the programmed foam under tension along two orientations
Similarly, graphs of tensile Poisson’s ratio vs. longitudinal strain for nonprogrammed
and programmed foam are shown in Fig. 29. From Fig. 29 (a), the Poisson’s ratio of the
nonporgrammed foam is positive and almost the same for the two lateral directions,
suggesting isotropic behavior of the non-programmed foam.
In Fig. 29 (b), the Poisson’s ratio of the programmed foam in orientation-3 is normal
when loaded in orientation-1. However, the foam shows a small portion of negative
Poisson’s ratio in orientation-2 when the longitudinal strain is within 1.0%. After that, the
Poisson’s ratio becomes positive and gradually increases as the longitudinal strain increases.
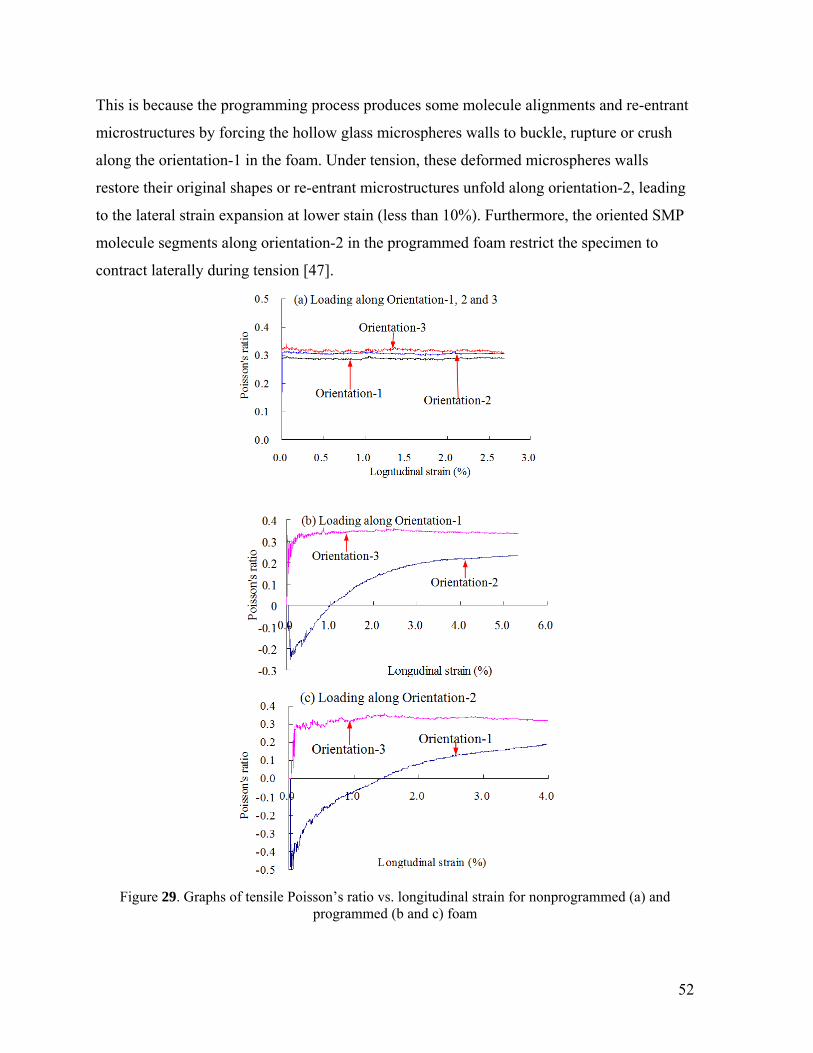
52
This is because the programming process produces some molecule alignments and re-entrant
microstructures by forcing the hollow glass microspheres walls to buckle, rupture or crush
along the orientation-1 in the foam. Under tension, these deformed microspheres walls
restore their original shapes or re-entrant microstructures unfold along orientation-2, leading
to the lateral strain expansion at lower stain (less than 10%). Furthermore, the oriented SMP
molecule segments along orientation-2 in the programmed foam restrict the specimen to
contract laterally during tension [47].
Figure 29. Graphs of tensile Poisson’s ratio vs. longitudinal strain for nonprogrammed (a) and programmed (b and c) foam
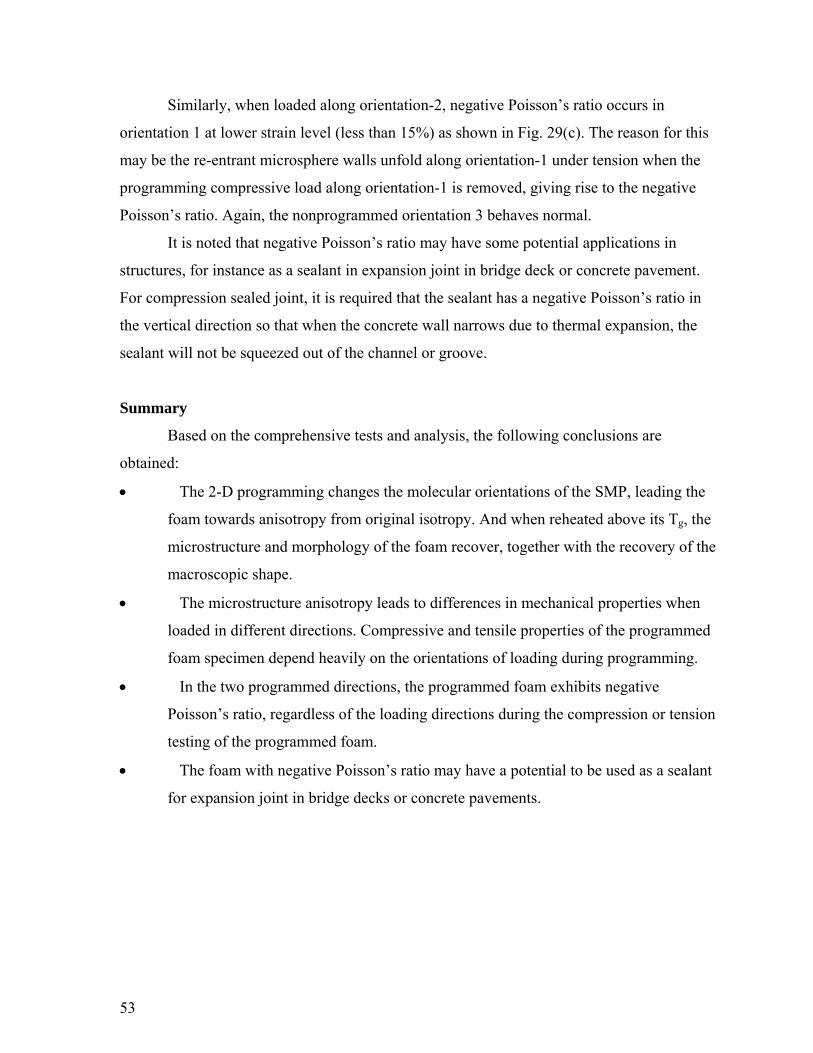
53
Similarly, when loaded along orientation-2, negative Poisson’s ratio occurs in
orientation 1 at lower strain level (less than 15%) as shown in Fig. 29(c). The reason for this
may be the re-entrant microsphere walls unfold along orientation-1 under tension when the
programming compressive load along orientation-1 is removed, giving rise to the negative
Poisson’s ratio. Again, the nonprogrammed orientation 3 behaves normal.
It is noted that negative Poisson’s ratio may have some potential applications in
structures, for instance as a sealant in expansion joint in bridge deck or concrete pavement.
For compression sealed joint, it is required that the sealant has a negative Poisson’s ratio in
the vertical direction so that when the concrete wall narrows due to thermal expansion, the
sealant will not be squeezed out of the channel or groove.
Summary
Based on the comprehensive tests and analysis, the following conclusions are
obtained:
The 2-D programming changes the molecular orientations of the SMP, leading the
foam towards anisotropy from original isotropy. And when reheated above its Tg, the
microstructure and morphology of the foam recover, together with the recovery of the
macroscopic shape.
The microstructure anisotropy leads to differences in mechanical properties when
loaded in different directions. Compressive and tensile properties of the programmed
foam specimen depend heavily on the orientations of loading during programming.
In the two programmed directions, the programmed foam exhibits negative
Poisson’s ratio, regardless of the loading directions during the compression or tension
testing of the programmed foam.
The foam with negative Poisson’s ratio may have a potential to be used as a sealant
for expansion joint in bridge decks or concrete pavements.
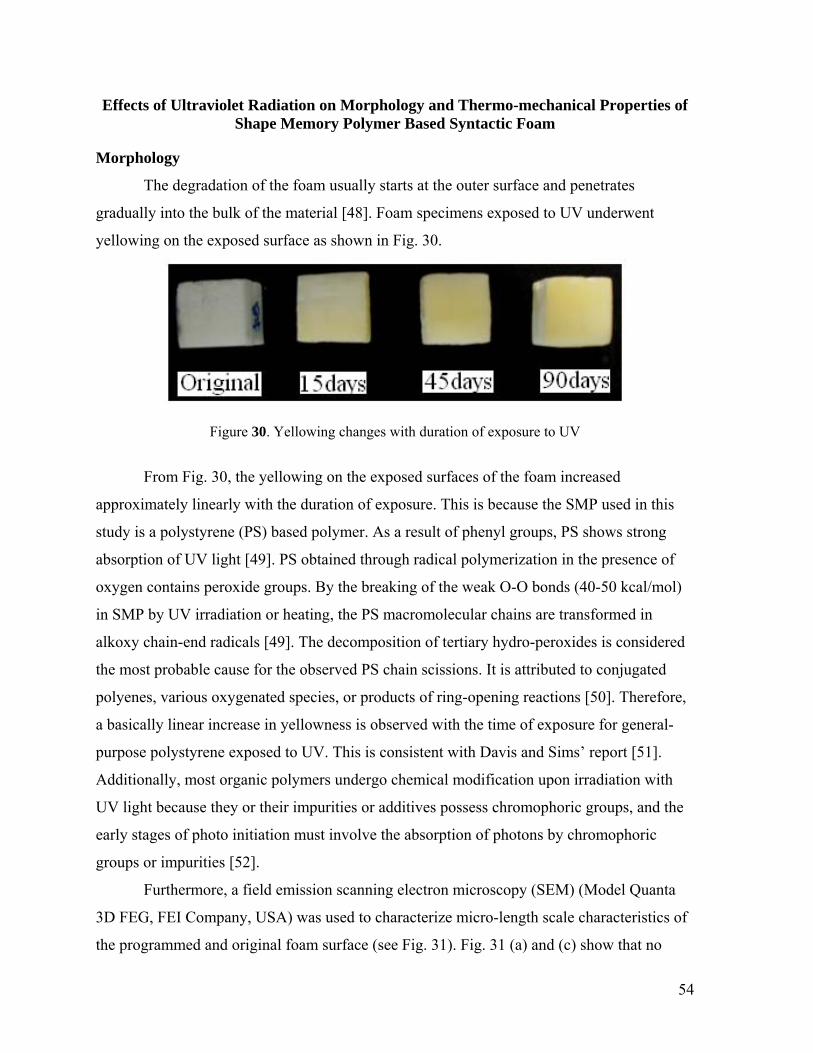
54
Effects of Ultraviolet Radiation on Morphology and Thermo-mechanical Properties of Shape Memory Polymer Based Syntactic Foam
Morphology
The degradation of the foam usually starts at the outer surface and penetrates
gradually into the bulk of the material [48]. Foam specimens exposed to UV underwent
yellowing on the exposed surface as shown in Fig. 30.
Figure 30. Yellowing changes with duration of exposure to UV
From Fig. 30, the yellowing on the exposed surfaces of the foam increased
approximately linearly with the duration of exposure. This is because the SMP used in this
study is a polystyrene (PS) based polymer. As a result of phenyl groups, PS shows strong
absorption of UV light [49]. PS obtained through radical polymerization in the presence of
oxygen contains peroxide groups. By the breaking of the weak O-O bonds (40-50 kcal/mol)
in SMP by UV irradiation or heating, the PS macromolecular chains are transformed in
alkoxy chain-end radicals [49]. The decomposition of tertiary hydro-peroxides is considered
the most probable cause for the observed PS chain scissions. It is attributed to conjugated
polyenes, various oxygenated species, or products of ring-opening reactions [50]. Therefore,
a basically linear increase in yellowness is observed with the time of exposure for general-
purpose polystyrene exposed to UV. This is consistent with Davis and Sims’ report [51].
Additionally, most organic polymers undergo chemical modification upon irradiation with
UV light because they or their impurities or additives possess chromophoric groups, and the
early stages of photo initiation must involve the absorption of photons by chromophoric
groups or impurities [52].
Furthermore, a field emission scanning electron microscopy (SEM) (Model Quanta
3D FEG, FEI Company, USA) was used to characterize micro-length scale characteristics of
the programmed and original foam surface (see Fig. 31). Fig. 31 (a) and (c) show that no
55
cracks are observed on the surface of the programmed and original foam specimen before
exposure to UV. However, from Fig. 31 (b), some inclined cracks with respect to the
compression direction are seen on the surface of the programmed foam after exposure to UV
for 90 days. It is noted that the cracks are not observed on the original foam surface after
exposure to the same UV (Fig. 31(d)). This is because the pre-stress is stored in the
programmed foam specimen along the tension and compression direction during
programming. The stored pre-stress accelerates polymer chain-scission near the surface [53].
Thus, cracks occur on the programmed foam surface.
Figure 31. Surface morphology of programmed (a, b) and original (c, d) foam ((a) and (c) before and (b) and (d) after exposure to UV for 90days)
Compression test results
It is important to evaluate the deterioration of mechanical properties in any
assessment of the material resistance to their working environment. To study effects of UV
on mechanical properties, mechanical tests were conducted. The compression test results are
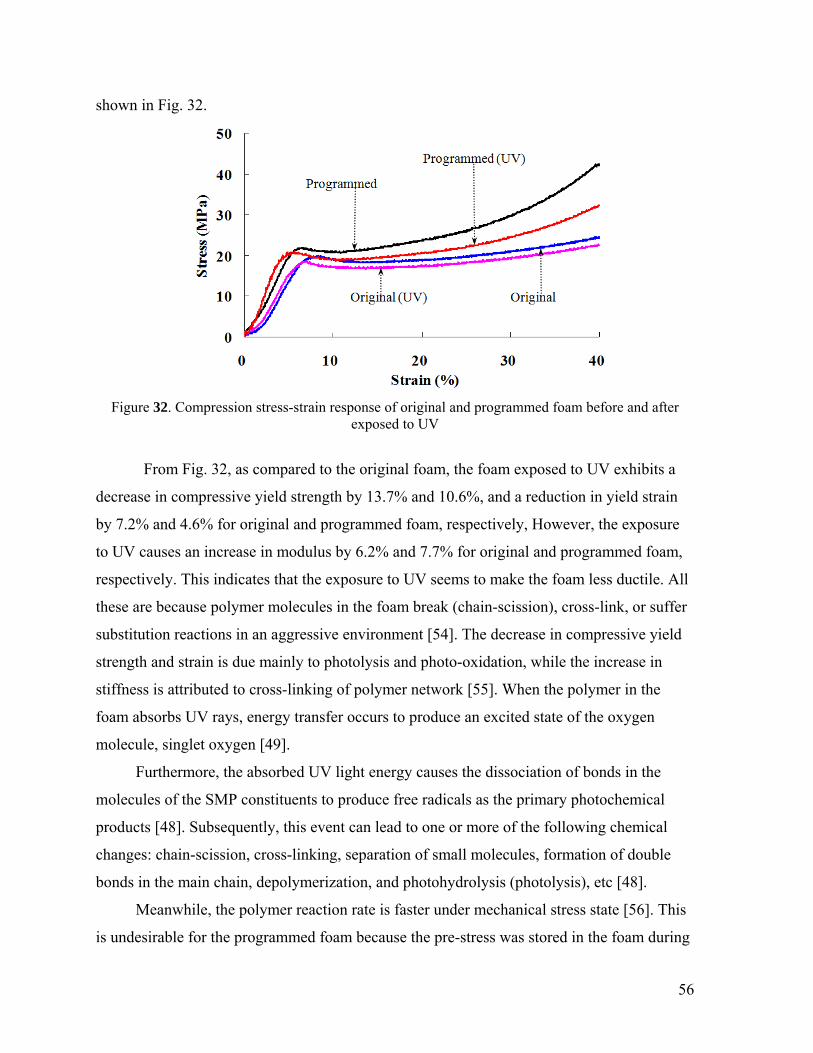
56
shown in Fig. 32.
Figure 32. Compression stress-strain response of original and programmed foam before and after exposed to UV
From Fig. 32, as compared to the original foam, the foam exposed to UV exhibits a
decrease in compressive yield strength by 13.7% and 10.6%, and a reduction in yield strain
by 7.2% and 4.6% for original and programmed foam, respectively, However, the exposure
to UV causes an increase in modulus by 6.2% and 7.7% for original and programmed foam,
respectively. This indicates that the exposure to UV seems to make the foam less ductile. All
these are because polymer molecules in the foam break (chain-scission), cross-link, or suffer
substitution reactions in an aggressive environment [54]. The decrease in compressive yield
strength and strain is due mainly to photolysis and photo-oxidation, while the increase in
stiffness is attributed to cross-linking of polymer network [55]. When the polymer in the
foam absorbs UV rays, energy transfer occurs to produce an excited state of the oxygen
molecule, singlet oxygen [49].
Furthermore, the absorbed UV light energy causes the dissociation of bonds in the
molecules of the SMP constituents to produce free radicals as the primary photochemical
products [48]. Subsequently, this event can lead to one or more of the following chemical
changes: chain-scission, cross-linking, separation of small molecules, formation of double
bonds in the main chain, depolymerization, and photohydrolysis (photolysis), etc [48].
Meanwhile, the polymer reaction rate is faster under mechanical stress state [56]. This
is undesirable for the programmed foam because the pre-stress was stored in the foam during
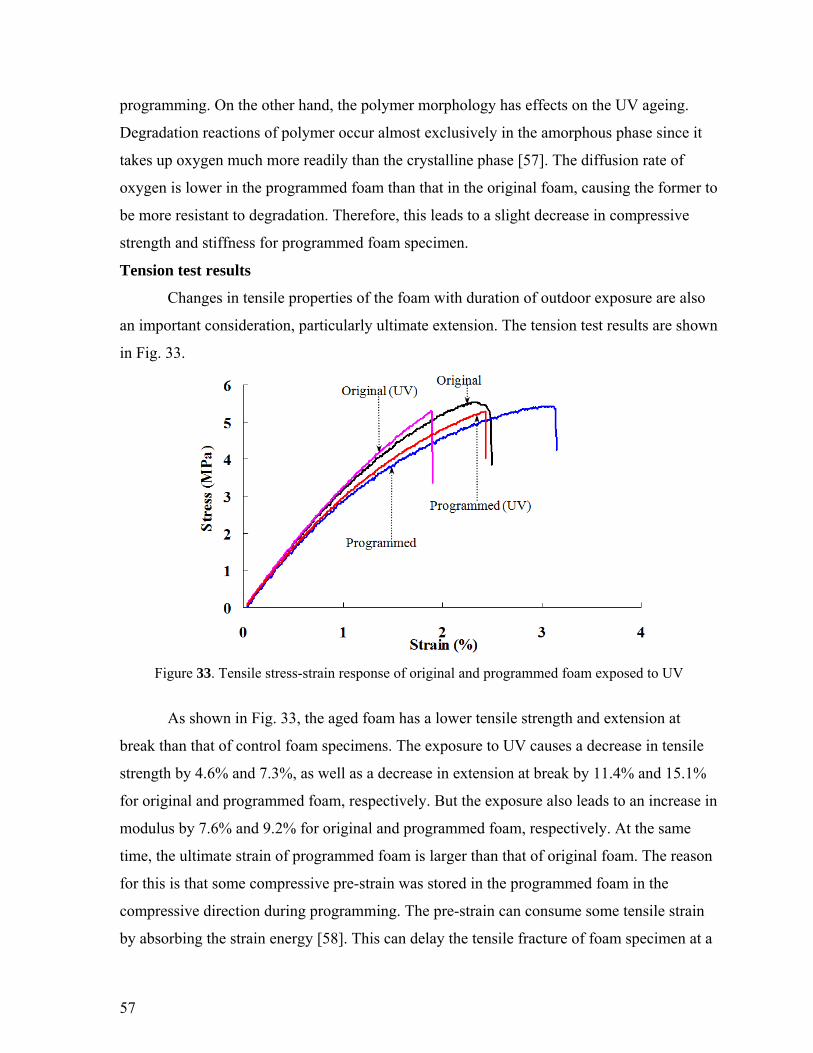
57
programming. On the other hand, the polymer morphology has effects on the UV ageing.
Degradation reactions of polymer occur almost exclusively in the amorphous phase since it
takes up oxygen much more readily than the crystalline phase [57]. The diffusion rate of
oxygen is lower in the programmed foam than that in the original foam, causing the former to
be more resistant to degradation. Therefore, this leads to a slight decrease in compressive
strength and stiffness for programmed foam specimen.
Tension test results
Changes in tensile properties of the foam with duration of outdoor exposure are also
an important consideration, particularly ultimate extension. The tension test results are shown
in Fig. 33.
Figure 33. Tensile stress-strain response of original and programmed foam exposed to UV
As shown in Fig. 33, the aged foam has a lower tensile strength and extension at
break than that of control foam specimens. The exposure to UV causes a decrease in tensile
strength by 4.6% and 7.3%, as well as a decrease in extension at break by 11.4% and 15.1%
for original and programmed foam, respectively. But the exposure also leads to an increase in
modulus by 7.6% and 9.2% for original and programmed foam, respectively. At the same
time, the ultimate strain of programmed foam is larger than that of original foam. The reason
for this is that some compressive pre-strain was stored in the programmed foam in the
compressive direction during programming. The pre-strain can consume some tensile strain
by absorbing the strain energy [58]. This can delay the tensile fracture of foam specimen at a
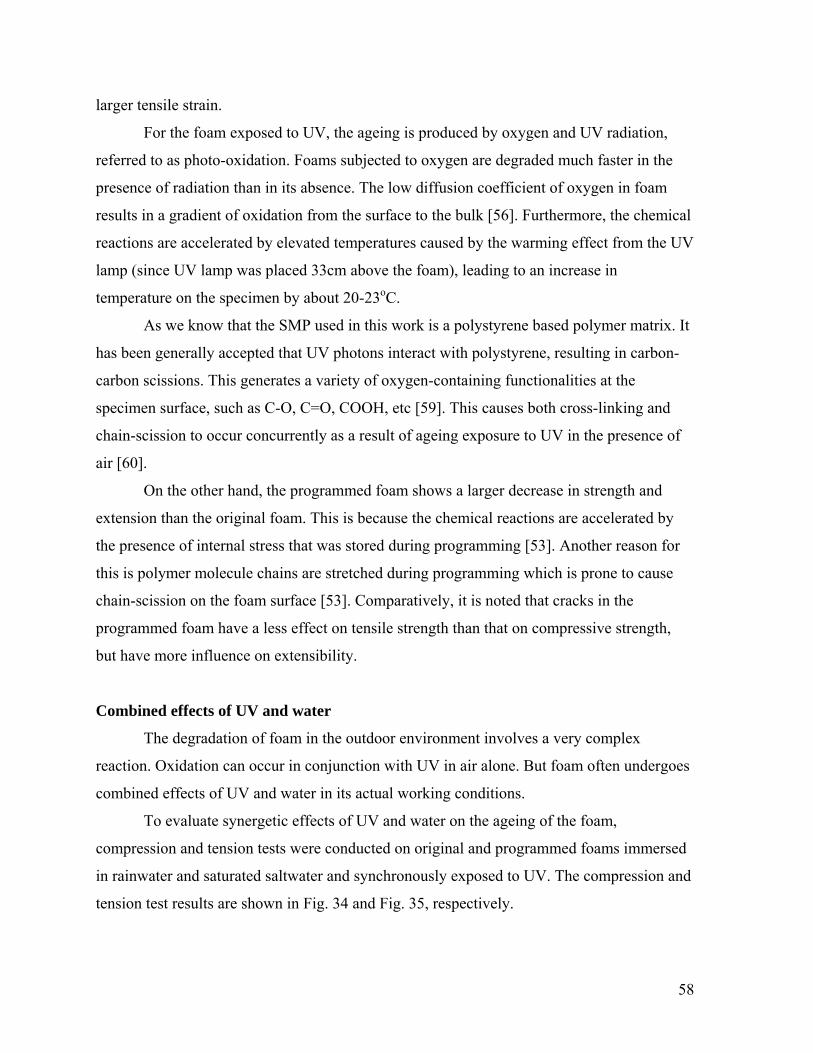
58
larger tensile strain.
For the foam exposed to UV, the ageing is produced by oxygen and UV radiation,
referred to as photo-oxidation. Foams subjected to oxygen are degraded much faster in the
presence of radiation than in its absence. The low diffusion coefficient of oxygen in foam
results in a gradient of oxidation from the surface to the bulk [56]. Furthermore, the chemical
reactions are accelerated by elevated temperatures caused by the warming effect from the UV
lamp (since UV lamp was placed 33cm above the foam), leading to an increase in
temperature on the specimen by about 20-23oC.
As we know that the SMP used in this work is a polystyrene based polymer matrix. It
has been generally accepted that UV photons interact with polystyrene, resulting in carbon-
carbon scissions. This generates a variety of oxygen-containing functionalities at the
specimen surface, such as C-O, C=O, COOH, etc [59]. This causes both cross-linking and
chain-scission to occur concurrently as a result of ageing exposure to UV in the presence of
air [60].
On the other hand, the programmed foam shows a larger decrease in strength and
extension than the original foam. This is because the chemical reactions are accelerated by
the presence of internal stress that was stored during programming [53]. Another reason for
this is polymer molecule chains are stretched during programming which is prone to cause
chain-scission on the foam surface [53]. Comparatively, it is noted that cracks in the
programmed foam have a less effect on tensile strength than that on compressive strength,
but have more influence on extensibility.
Combined effects of UV and water
The degradation of foam in the outdoor environment involves a very complex
reaction. Oxidation can occur in conjunction with UV in air alone. But foam often undergoes
combined effects of UV and water in its actual working conditions.
To evaluate synergetic effects of UV and water on the ageing of the foam,
compression and tension tests were conducted on original and programmed foams immersed
in rainwater and saturated saltwater and synchronously exposed to UV. The compression and
tension test results are shown in Fig. 34 and Fig. 35, respectively.
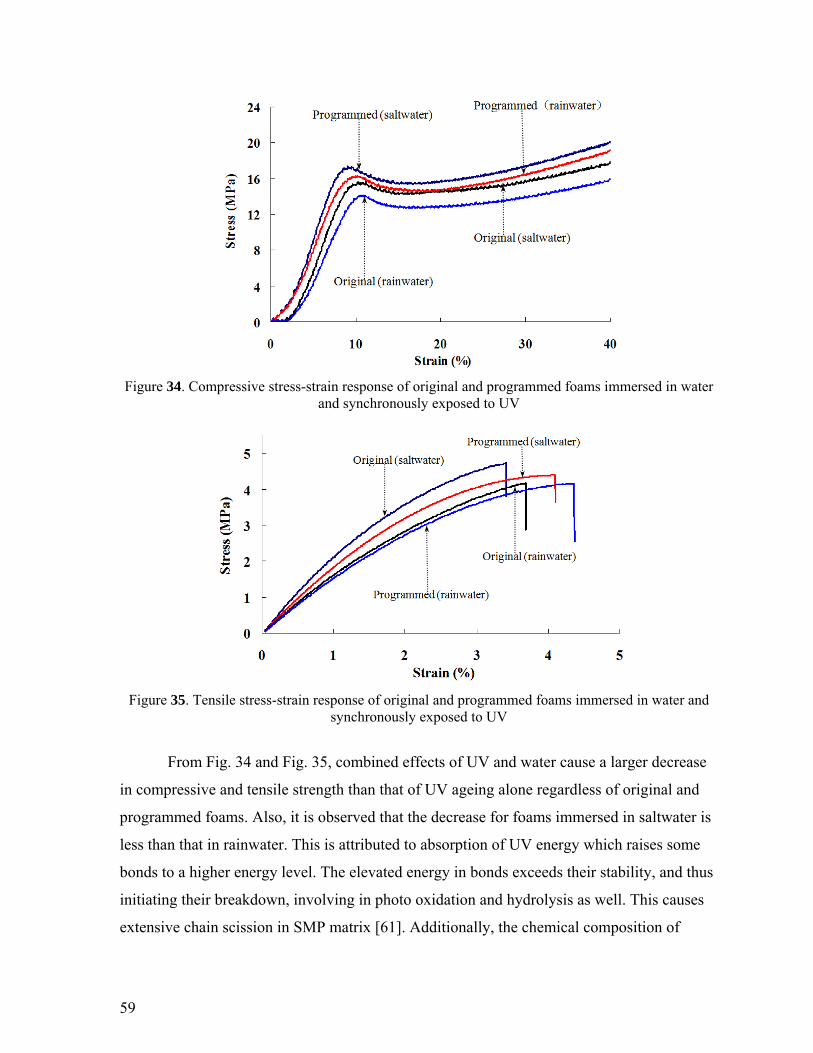
59
Figure 34. Compressive stress-strain response of original and programmed foams immersed in water and synchronously exposed to UV
Figure 35. Tensile stress-strain response of original and programmed foams immersed in water and synchronously exposed to UV
From Fig. 34 and Fig. 35, combined effects of UV and water cause a larger decrease
in compressive and tensile strength than that of UV ageing alone regardless of original and
programmed foams. Also, it is observed that the decrease for foams immersed in saltwater is
less than that in rainwater. This is attributed to absorption of UV energy which raises some
bonds to a higher energy level. The elevated energy in bonds exceeds their stability, and thus
initiating their breakdown, involving in photo oxidation and hydrolysis as well. This causes
extensive chain scission in SMP matrix [61]. Additionally, the chemical composition of
60
saltwater and rainwater includes major inorganic ions (Cl−, SO42−, F−, NH4
+, etc.) and organic
species (CH3COO−, HCOO−, CH2(COO)22−, C2O4
2−, etc.) [62]. The water impingement
causes mechanical erosion, since some polymers undergo hydrolysis reactions and are
swollen by water. This also causes chain scissions, leading to a decrease in strength [61].
Another reason for this is some aggressive ions in water. Those ions not only hydrate the
polymeric matrix but also possibly hydrated the interfaces and the glass material [63]. And
such degradation phenomena occur in immersed syntactic foams at any ageing temperature
[64]. Subsequently, the hydrolytic attack can also cause chain scission in polymer film.
The hydrolytic reaction in foam can occur at room temperature in the absence of UV
light. However, when the immersed foam specimen is exposed to UV, the most common
effects result from the combined action of hydrolysis and photo-degradation. This is because
it combines the photo-physical and photo-chemical effects of UV radiation photons,
oxidative effects of the oxygen, and hydrolytic effects of water [56]. Therefore, the foam in
water might undergo a faster degradation than that in air. This is consistent with the previous
observation [65].
Moreover, polymer based foams are more susceptible to hydrolytic at elevated
temperature owing to the UV lamp. Although water can cool the temperature of foam
specimens, heat effects from the light source cause an temperature increase on the foam
surface by an average of 12.7℃. This accelerates the photo oxidation and hydrolysis in SMP
film around microspheres. Hence, it is seen that synergetic effects of UV and water
dramatically accelerate the deterioration process of foam specimens. All these lead inevitably
to deterioration in strength.
However, Fig. 34 and Fig. 35 also show that the combined effects of UV and water
cause an increase in extensibility compared with that of UV ageing alone. And the increase
for foams immersed in saltwater is less than that in rainwater. This is mainly due to the
hydrolysis of foams in water. When the polymer film around microspheres is immersed in
saltwater and rainwater, ion species in the water have a plasticizing effect on the polymer
first, followed by chemical interaction or physical swelling effects [66]. This indicates that
the water makes polymer softer and more flexible at ambient temperature, known as
plasticizers. As a result, the extensibility of immersed foams increases compared with that of
UV ageing alone.
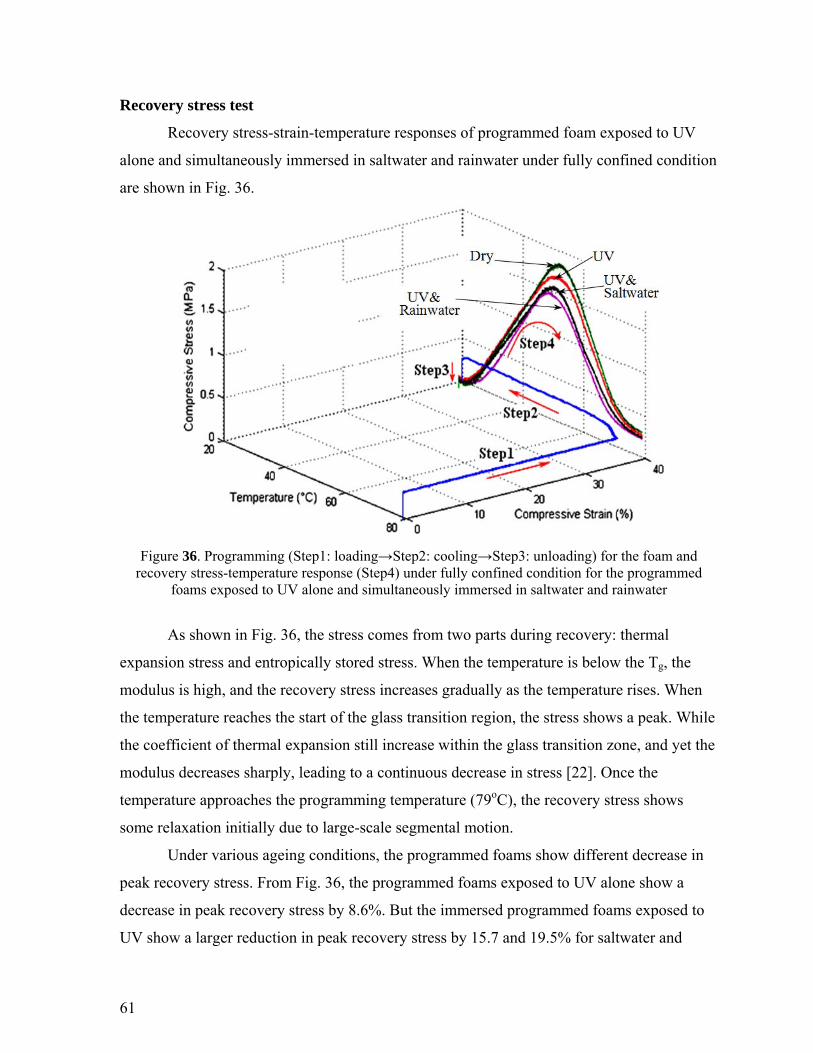
61
Recovery stress test
Recovery stress-strain-temperature responses of programmed foam exposed to UV
alone and simultaneously immersed in saltwater and rainwater under fully confined condition
are shown in Fig. 36.
Figure 36. Programming (Step1: loading→Step2: cooling→Step3: unloading) for the foam and recovery stress-temperature response (Step4) under fully confined condition for the programmed
foams exposed to UV alone and simultaneously immersed in saltwater and rainwater
As shown in Fig. 36, the stress comes from two parts during recovery: thermal
expansion stress and entropically stored stress. When the temperature is below the Tg, the
modulus is high, and the recovery stress increases gradually as the temperature rises. When
the temperature reaches the start of the glass transition region, the stress shows a peak. While
the coefficient of thermal expansion still increase within the glass transition zone, and yet the
modulus decreases sharply, leading to a continuous decrease in stress [22]. Once the
temperature approaches the programming temperature (79oC), the recovery stress shows
some relaxation initially due to large-scale segmental motion.
Under various ageing conditions, the programmed foams show different decrease in
peak recovery stress. From Fig. 36, the programmed foams exposed to UV alone show a
decrease in peak recovery stress by 8.6%. But the immersed programmed foams exposed to
UV show a larger reduction in peak recovery stress by 15.7 and 19.5% for saltwater and
62
rainwater, respectively. Also, the temperature of UV aged programmed foam corresponding
to the peak stress is basically unchanged, while the temperature for specimens immersed in
saltwater and rainwater is lowered by 3.1� and 4.8�, respectively, as compared to the dry
programmed foam. This indicates that the Tg becomes lower after immersion in saltwater and
rainwater at room temperature for 90 days [67]. As shown in Fig. 36, it is observed that the
final average recovery stress of the dry programmed foam is 295.5kPa, which is slightly less
than the programming stress of 300.7kPa. And the final average recovery stresses of
immersed programmed foams are lower than that of the dry programmed foam.
All these are because the absorbed water in the SMP film weakens the hydrogen
bonding between N–H and C=O groups, which lowers the Tg of the foam [67]. Therefore, the
temperature of the immersed foams corresponding to the peak stress is lowered. In addition,
low molecular weight molecules in saltwater and rainwater diffuse into the SMP film which
works as a plasticizer, leading to the irreversible ageing [68]. All these make the foam more
ductile, lowering the immersed foam modulus. Therefore, the peak recovery stress of
hydrolytic foams is lower than that of the dry programmed foam. Meanwhile, UV exposure
of foam in water results in a faster decrease in peak recovery stress than that for exposure in
air. The exposure results in UV absorbance and chain scission of the macromolecules on
foams surface, causing loss in recovery stress.
Summary
Based on the above experiments and analysis, the following conclusions are obtained:
UV exposure results in discoloration on the exposed surface of the foam in air. And
the yellowing increases with duration of exposure. UV exposure results in cracks on
the foam surface along the compression direction.
UV radiation causes a decrease in mechanical strength and ductility, and an increase
in modulus. Cracks in the foam have a less effect on tensile strength than that on
compressive strength, but have a greater influence on ductility.
Combined effects of UV and water lead to a larger decrease in strength and ductility
than that of UV alone. And the decrease for foams immersed in saltwater is less than
that in rainwater. Water immersion also causes a reduction in Tg of the foam.
The peak recovery stress is much higher than the programming stress, facilitating
63
self-healing of the smart foam. The combined environmental attacks induce a larger
decrease in peak and final recovery stress than that of the dry programmed foam.
Although the accelerated ageing of UV or/and water leads to a decrease in strength,
ductility and shape recovery functionality, the decrease listed above do not cause
serious degradation of the engineering properties in the foam. It is concluded that the
foam possesses the shape recovery functionality after 2-D programming and
environmental attacks.
Cyclic Stress–Strain Behavior of Shape Memory Polymer Based Syntactic Foam Programmed by 2-D Stress Condition
2-D programming results
The horizontal and vertical strain evolution for a typical foam specimen during the 2-
D programming is shown in Fig. 37. It is observed that the strain evolution during the 2-D
programming includes three steps: step 1 (loading), step 2 (cooling while holding the load
constant), and step 3 (unloading). The strain evolutions in compression or vertical direction
and tension or horizontal direction are similar due to the symmetry of the truss fixture and the
specimen. The final strains in vertical and horizontal direction are 39.63% and 39.48%,
respectively, and the corresponding shape fixity ratios are 99.1% and 98.7% for the preload
levels in the two directions.
The high shape fixity ratio is understandable because the preload causes the foam
specimen to become denser and stiffer, leading to a smaller spring-back and thus higher
shape fixity at the end of step 3. To visualize the programming results, Fig. 38 shows the
nonprogrammed and programmed cruciform foam specimens.
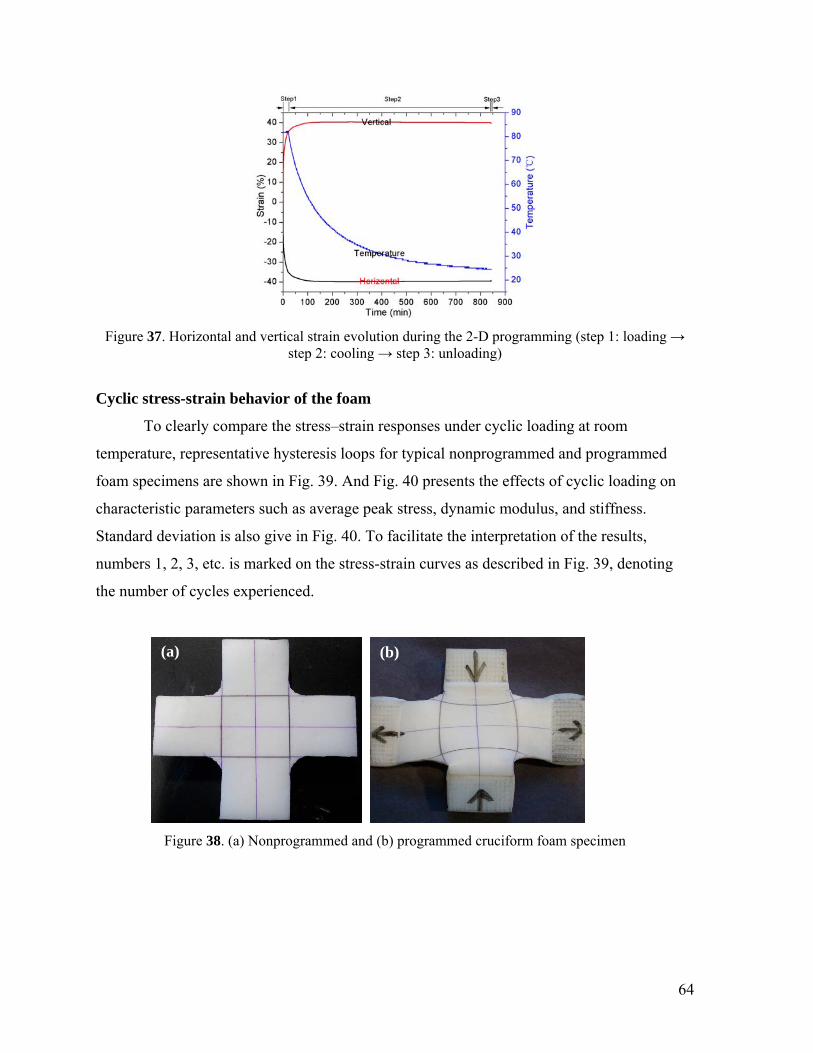
64
Figure 37. Horizontal and vertical strain evolution during the 2-D programming (step 1: loading → step 2: cooling → step 3: unloading)
Cyclic stress-strain behavior of the foam
To clearly compare the stress–strain responses under cyclic loading at room
temperature, representative hysteresis loops for typical nonprogrammed and programmed
foam specimens are shown in Fig. 39. And Fig. 40 presents the effects of cyclic loading on
characteristic parameters such as average peak stress, dynamic modulus, and stiffness.
Standard deviation is also give in Fig. 40. To facilitate the interpretation of the results,
numbers 1, 2, 3, etc. is marked on the stress-strain curves as described in Fig. 39, denoting
the number of cycles experienced.
Figure 38. (a) Nonprogrammed and (b) programmed cruciform foam specimen
(b) (a)
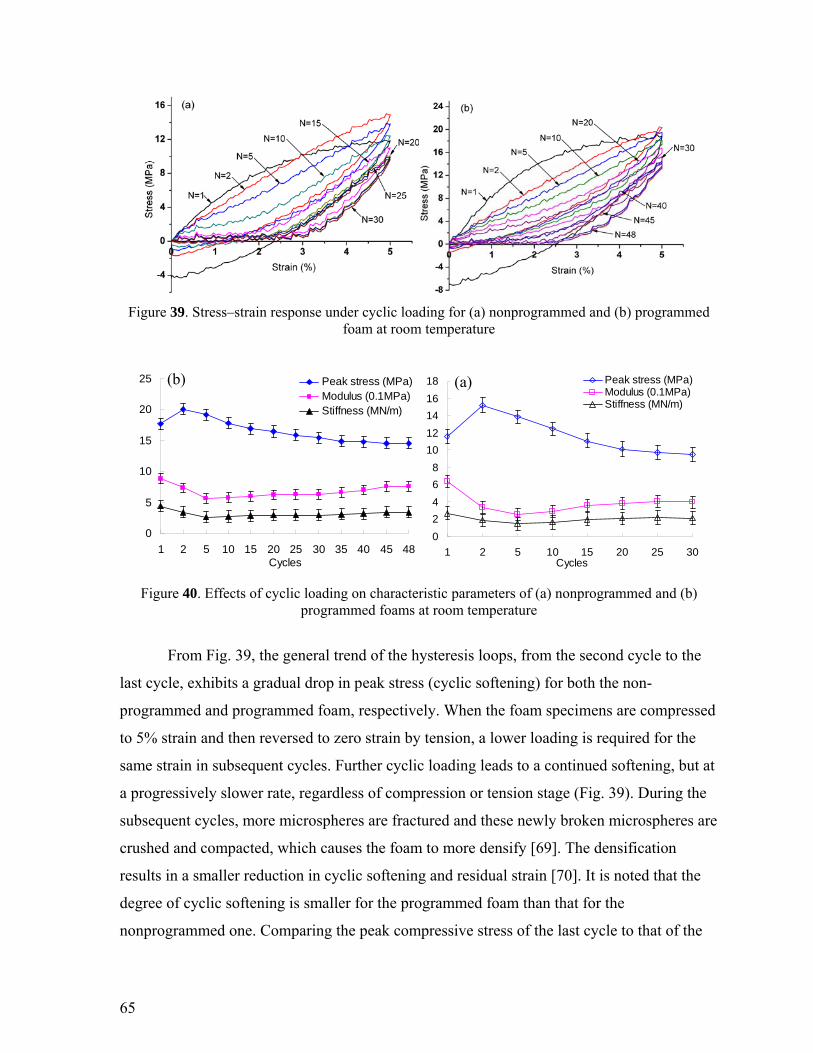
65
Figure 39. Stress–strain response under cyclic loading for (a) nonprogrammed and (b) programmed foam at room temperature
Figure 40. Effects of cyclic loading on characteristic parameters of (a) nonprogrammed and (b) programmed foams at room temperature
From Fig. 39, the general trend of the hysteresis loops, from the second cycle to the
last cycle, exhibits a gradual drop in peak stress (cyclic softening) for both the non-
programmed and programmed foam, respectively. When the foam specimens are compressed
to 5% strain and then reversed to zero strain by tension, a lower loading is required for the
same strain in subsequent cycles. Further cyclic loading leads to a continued softening, but at
a progressively slower rate, regardless of compression or tension stage (Fig. 39). During the
subsequent cycles, more microspheres are fractured and these newly broken microspheres are
crushed and compacted, which causes the foam to more densify [69]. The densification
results in a smaller reduction in cyclic softening and residual strain [70]. It is noted that the
degree of cyclic softening is smaller for the programmed foam than that for the
nonprogrammed one. Comparing the peak compressive stress of the last cycle to that of the
0
2
4
6
8
10
12
14
16
18
1 2 5 10 15 20 25 30Cycles
Peak stress (MPa)Modulus (0.1MPa)Stiffness (MN/m)
(a)
0
5
10
15
20
25
1 2 5 10 15 20 25 30 35 40 45 48Cycles
Peak stress (MPa)Modulus (0.1MPa)Stiffness (MN/m)
(b)
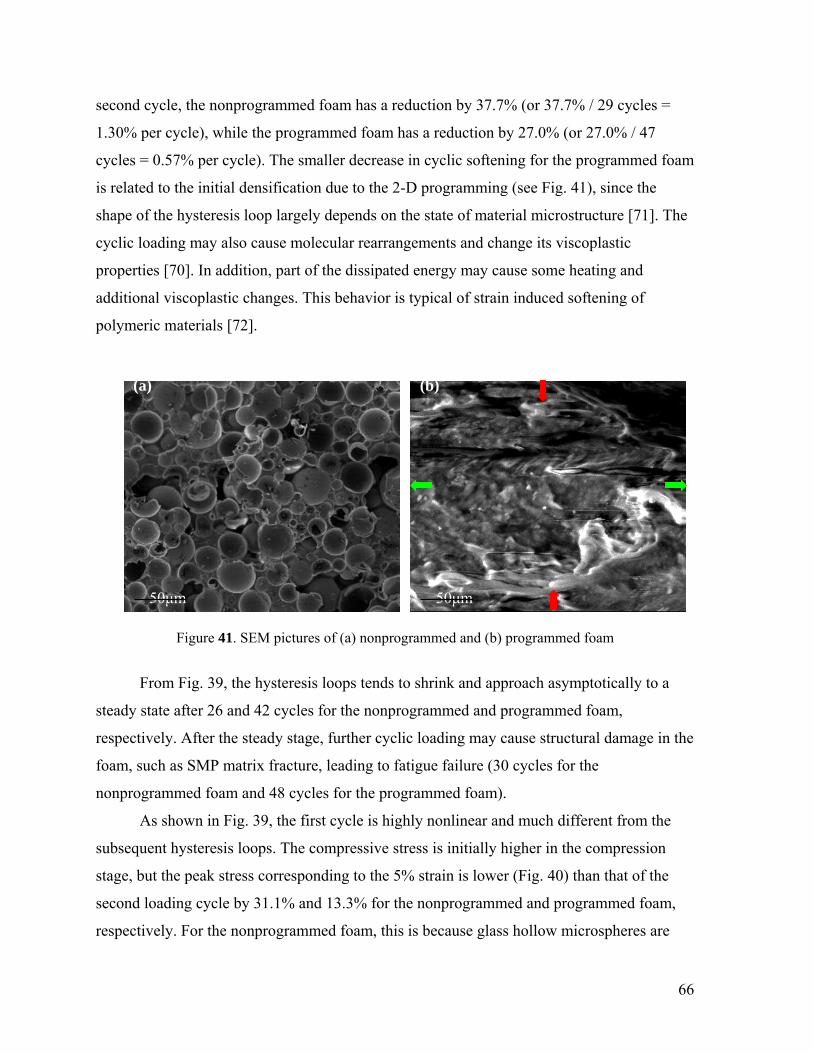
66
second cycle, the nonprogrammed foam has a reduction by 37.7% (or 37.7% / 29 cycles =
1.30% per cycle), while the programmed foam has a reduction by 27.0% (or 27.0% / 47
cycles = 0.57% per cycle). The smaller decrease in cyclic softening for the programmed foam
is related to the initial densification due to the 2-D programming (see Fig. 41), since the
shape of the hysteresis loop largely depends on the state of material microstructure [71]. The
cyclic loading may also cause molecular rearrangements and change its viscoplastic
properties [70]. In addition, part of the dissipated energy may cause some heating and
additional viscoplastic changes. This behavior is typical of strain induced softening of
polymeric materials [72].
Figure 41. SEM pictures of (a) nonprogrammed and (b) programmed foam
From Fig. 39, the hysteresis loops tends to shrink and approach asymptotically to a
steady state after 26 and 42 cycles for the nonprogrammed and programmed foam,
respectively. After the steady stage, further cyclic loading may cause structural damage in the
foam, such as SMP matrix fracture, leading to fatigue failure (30 cycles for the
nonprogrammed foam and 48 cycles for the programmed foam).
As shown in Fig. 39, the first cycle is highly nonlinear and much different from the
subsequent hysteresis loops. The compressive stress is initially higher in the compression
stage, but the peak stress corresponding to the 5% strain is lower (Fig. 40) than that of the
second loading cycle by 31.1% and 13.3% for the nonprogrammed and programmed foam,
respectively. For the nonprogrammed foam, this is because glass hollow microspheres are
50μm
50μm
(a) (b)
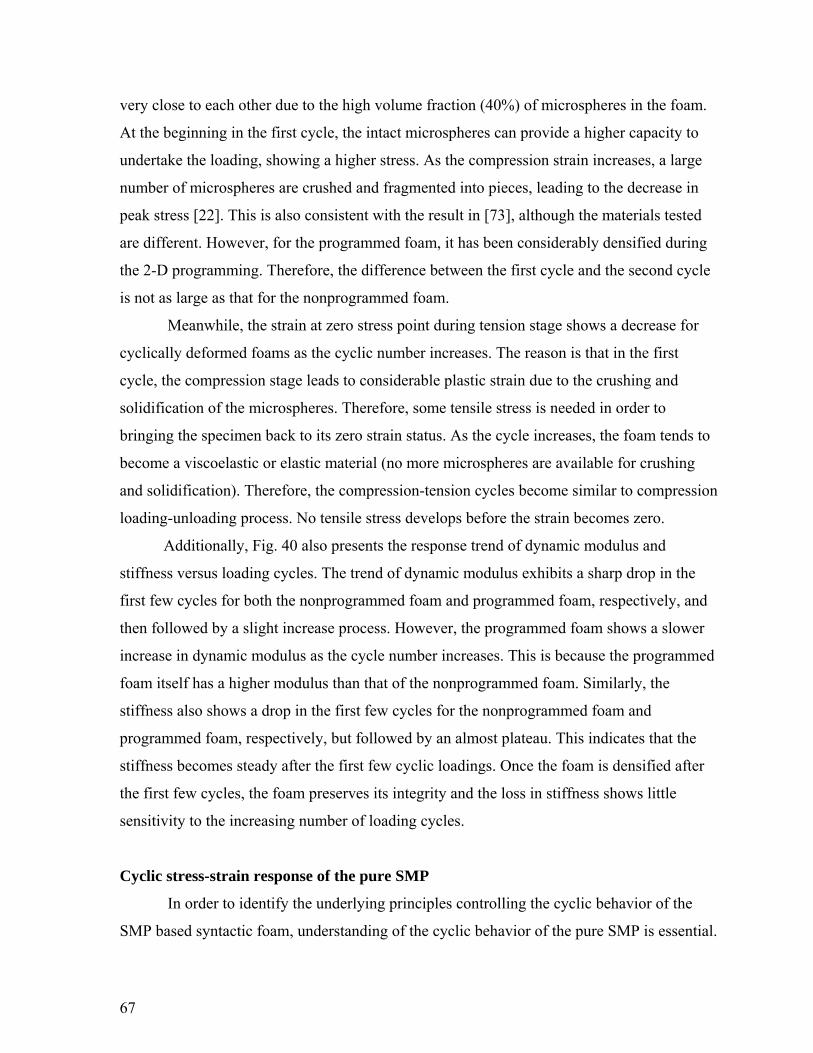
67
very close to each other due to the high volume fraction (40%) of microspheres in the foam.
At the beginning in the first cycle, the intact microspheres can provide a higher capacity to
undertake the loading, showing a higher stress. As the compression strain increases, a large
number of microspheres are crushed and fragmented into pieces, leading to the decrease in
peak stress [22]. This is also consistent with the result in [73], although the materials tested
are different. However, for the programmed foam, it has been considerably densified during
the 2-D programming. Therefore, the difference between the first cycle and the second cycle
is not as large as that for the nonprogrammed foam.
Meanwhile, the strain at zero stress point during tension stage shows a decrease for
cyclically deformed foams as the cyclic number increases. The reason is that in the first
cycle, the compression stage leads to considerable plastic strain due to the crushing and
solidification of the microspheres. Therefore, some tensile stress is needed in order to
bringing the specimen back to its zero strain status. As the cycle increases, the foam tends to
become a viscoelastic or elastic material (no more microspheres are available for crushing
and solidification). Therefore, the compression-tension cycles become similar to compression
loading-unloading process. No tensile stress develops before the strain becomes zero.
Additionally, Fig. 40 also presents the response trend of dynamic modulus and
stiffness versus loading cycles. The trend of dynamic modulus exhibits a sharp drop in the
first few cycles for both the nonprogrammed foam and programmed foam, respectively, and
then followed by a slight increase process. However, the programmed foam shows a slower
increase in dynamic modulus as the cycle number increases. This is because the programmed
foam itself has a higher modulus than that of the nonprogrammed foam. Similarly, the
stiffness also shows a drop in the first few cycles for the nonprogrammed foam and
programmed foam, respectively, but followed by an almost plateau. This indicates that the
stiffness becomes steady after the first few cyclic loadings. Once the foam is densified after
the first few cycles, the foam preserves its integrity and the loss in stiffness shows little
sensitivity to the increasing number of loading cycles.
Cyclic stress-strain response of the pure SMP
In order to identify the underlying principles controlling the cyclic behavior of the
SMP based syntactic foam, understanding of the cyclic behavior of the pure SMP is essential.
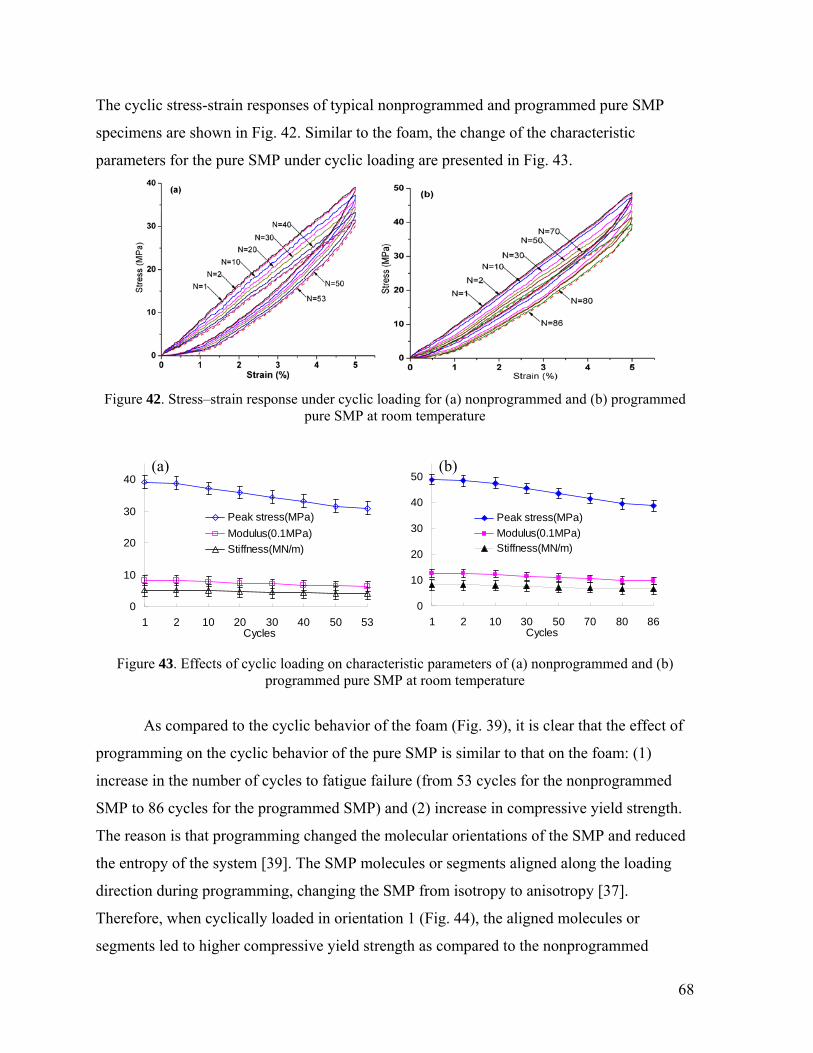
68
The cyclic stress-strain responses of typical nonprogrammed and programmed pure SMP
specimens are shown in Fig. 42. Similar to the foam, the change of the characteristic
parameters for the pure SMP under cyclic loading are presented in Fig. 43.
Figure 42. Stress–strain response under cyclic loading for (a) nonprogrammed and (b) programmed pure SMP at room temperature
Figure 43. Effects of cyclic loading on characteristic parameters of (a) nonprogrammed and (b) programmed pure SMP at room temperature
As compared to the cyclic behavior of the foam (Fig. 39), it is clear that the effect of
programming on the cyclic behavior of the pure SMP is similar to that on the foam: (1)
increase in the number of cycles to fatigue failure (from 53 cycles for the nonprogrammed
SMP to 86 cycles for the programmed SMP) and (2) increase in compressive yield strength.
The reason is that programming changed the molecular orientations of the SMP and reduced
the entropy of the system [39]. The SMP molecules or segments aligned along the loading
direction during programming, changing the SMP from isotropy to anisotropy [37].
Therefore, when cyclically loaded in orientation 1 (Fig. 44), the aligned molecules or
segments led to higher compressive yield strength as compared to the nonprogrammed
0
10
20
30
40
50
1 2 10 30 50 70 80 86Cycles
Peak stress(MPa)
Modulus(0.1MPa)Stiffness(MN/m)
(b)
0
10
20
30
40
1 2 10 20 30 40 50 53Cycles
Peak stress(MPa)
Modulus(0.1MPa)
Stiffness(MN/m)
(a)
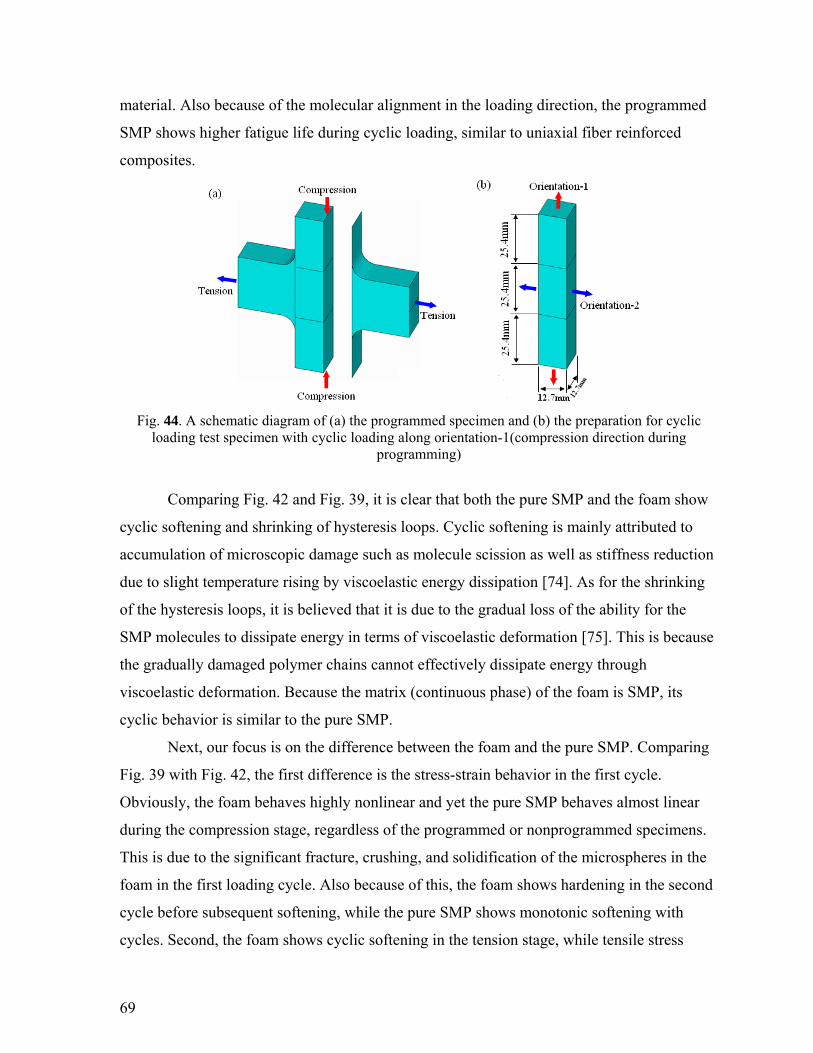
69
material. Also because of the molecular alignment in the loading direction, the programmed
SMP shows higher fatigue life during cyclic loading, similar to uniaxial fiber reinforced
composites.
Fig. 44. A schematic diagram of (a) the programmed specimen and (b) the preparation for cyclic loading test specimen with cyclic loading along orientation-1(compression direction during
programming)
Comparing Fig. 42 and Fig. 39, it is clear that both the pure SMP and the foam show
cyclic softening and shrinking of hysteresis loops. Cyclic softening is mainly attributed to
accumulation of microscopic damage such as molecule scission as well as stiffness reduction
due to slight temperature rising by viscoelastic energy dissipation [74]. As for the shrinking
of the hysteresis loops, it is believed that it is due to the gradual loss of the ability for the
SMP molecules to dissipate energy in terms of viscoelastic deformation [75]. This is because
the gradually damaged polymer chains cannot effectively dissipate energy through
viscoelastic deformation. Because the matrix (continuous phase) of the foam is SMP, its
cyclic behavior is similar to the pure SMP.
Next, our focus is on the difference between the foam and the pure SMP. Comparing
Fig. 39 with Fig. 42, the first difference is the stress-strain behavior in the first cycle.
Obviously, the foam behaves highly nonlinear and yet the pure SMP behaves almost linear
during the compression stage, regardless of the programmed or nonprogrammed specimens.
This is due to the significant fracture, crushing, and solidification of the microspheres in the
foam in the first loading cycle. Also because of this, the foam shows hardening in the second
cycle before subsequent softening, while the pure SMP shows monotonic softening with
cycles. Second, the foam shows cyclic softening in the tension stage, while tensile stress
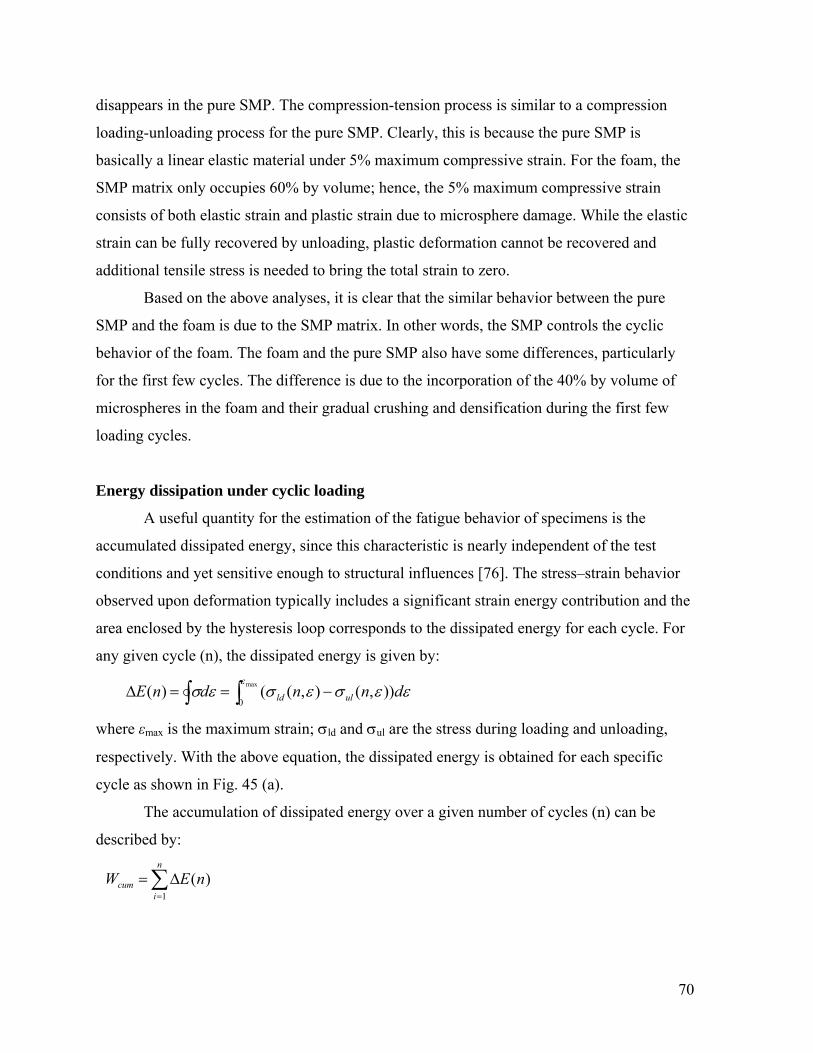
70
disappears in the pure SMP. The compression-tension process is similar to a compression
loading-unloading process for the pure SMP. Clearly, this is because the pure SMP is
basically a linear elastic material under 5% maximum compressive strain. For the foam, the
SMP matrix only occupies 60% by volume; hence, the 5% maximum compressive strain
consists of both elastic strain and plastic strain due to microsphere damage. While the elastic
strain can be fully recovered by unloading, plastic deformation cannot be recovered and
additional tensile stress is needed to bring the total strain to zero.
Based on the above analyses, it is clear that the similar behavior between the pure
SMP and the foam is due to the SMP matrix. In other words, the SMP controls the cyclic
behavior of the foam. The foam and the pure SMP also have some differences, particularly
for the first few cycles. The difference is due to the incorporation of the 40% by volume of
microspheres in the foam and their gradual crushing and densification during the first few
loading cycles.
Energy dissipation under cyclic loading
A useful quantity for the estimation of the fatigue behavior of specimens is the
accumulated dissipated energy, since this characteristic is nearly independent of the test
conditions and yet sensitive enough to structural influences [76]. The stress–strain behavior
observed upon deformation typically includes a significant strain energy contribution and the
area enclosed by the hysteresis loop corresponds to the dissipated energy for each cycle. For
any given cycle (n), the dissipated energy is given by:
max
0)),(),(()(
dnndnE ulld
where εmax is the maximum strain; ld and ul are the stress during loading and unloading,
respectively. With the above equation, the dissipated energy is obtained for each specific
cycle as shown in Fig. 45 (a).
The accumulation of dissipated energy over a given number of cycles (n) can be
described by:
n
icum nEW
1
)(
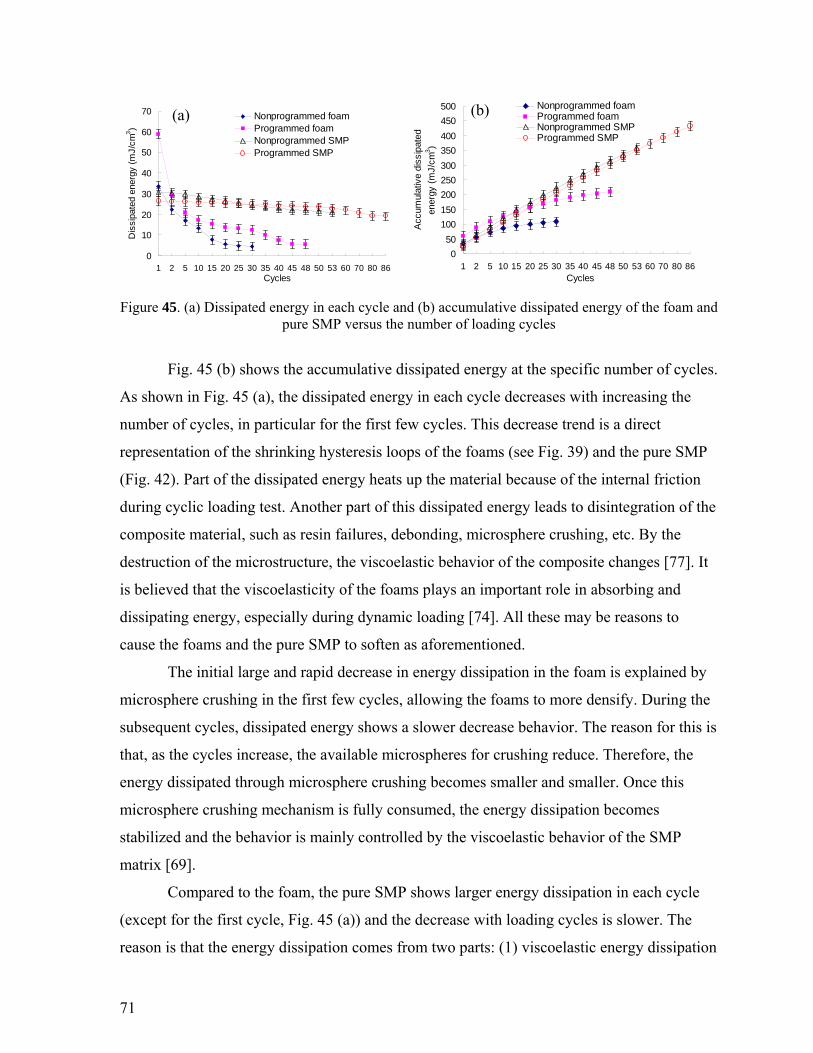
71
Figure 45. (a) Dissipated energy in each cycle and (b) accumulative dissipated energy of the foam and pure SMP versus the number of loading cycles
Fig. 45 (b) shows the accumulative dissipated energy at the specific number of cycles.
As shown in Fig. 45 (a), the dissipated energy in each cycle decreases with increasing the
number of cycles, in particular for the first few cycles. This decrease trend is a direct
representation of the shrinking hysteresis loops of the foams (see Fig. 39) and the pure SMP
(Fig. 42). Part of the dissipated energy heats up the material because of the internal friction
during cyclic loading test. Another part of this dissipated energy leads to disintegration of the
composite material, such as resin failures, debonding, microsphere crushing, etc. By the
destruction of the microstructure, the viscoelastic behavior of the composite changes [77]. It
is believed that the viscoelasticity of the foams plays an important role in absorbing and
dissipating energy, especially during dynamic loading [74]. All these may be reasons to
cause the foams and the pure SMP to soften as aforementioned.
The initial large and rapid decrease in energy dissipation in the foam is explained by
microsphere crushing in the first few cycles, allowing the foams to more densify. During the
subsequent cycles, dissipated energy shows a slower decrease behavior. The reason for this is
that, as the cycles increase, the available microspheres for crushing reduce. Therefore, the
energy dissipated through microsphere crushing becomes smaller and smaller. Once this
microsphere crushing mechanism is fully consumed, the energy dissipation becomes
stabilized and the behavior is mainly controlled by the viscoelastic behavior of the SMP
matrix [69].
Compared to the foam, the pure SMP shows larger energy dissipation in each cycle
(except for the first cycle, Fig. 45 (a)) and the decrease with loading cycles is slower. The
reason is that the energy dissipation comes from two parts: (1) viscoelastic energy dissipation
0
50
100
150
200
250
300
350
400
450
500
1 2 5 10 15 20 25 30 35 40 45 48 50 53 60 70 80 86Cycles
Acc
umul
ativ
e di
ssip
ated
ener
gy (
mJ/
cm3)
Nonprogrammed foamProgrammed foamNonprogrammed SMPProgrammed SMP
(b)
0
10
20
30
40
50
60
70
1 2 5 10 15 20 25 30 35 40 45 48 50 53 60 70 80 86Cycles
Dis
sipa
ted
ener
gy (
mJ/
cm3)
Nonprogrammed foamProgrammed foamNonprogrammed SMPProgrammed SMP
(a)
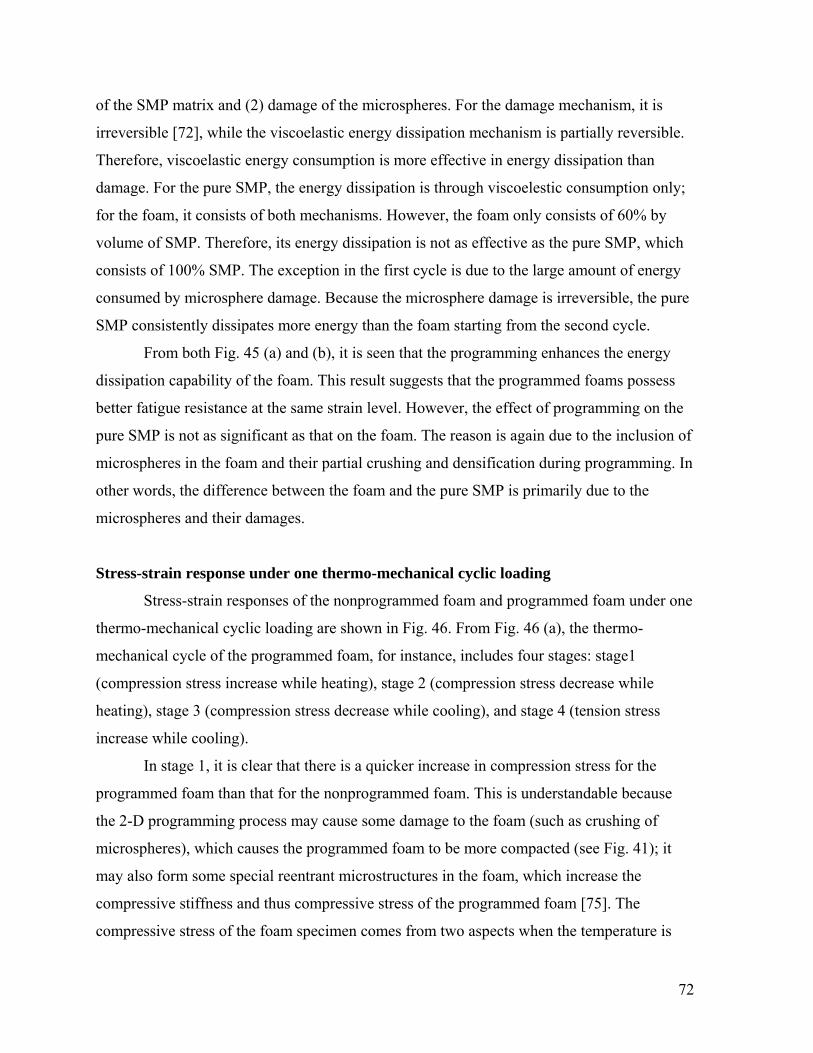
72
of the SMP matrix and (2) damage of the microspheres. For the damage mechanism, it is
irreversible [72], while the viscoelastic energy dissipation mechanism is partially reversible.
Therefore, viscoelastic energy consumption is more effective in energy dissipation than
damage. For the pure SMP, the energy dissipation is through viscoelestic consumption only;
for the foam, it consists of both mechanisms. However, the foam only consists of 60% by
volume of SMP. Therefore, its energy dissipation is not as effective as the pure SMP, which
consists of 100% SMP. The exception in the first cycle is due to the large amount of energy
consumed by microsphere damage. Because the microsphere damage is irreversible, the pure
SMP consistently dissipates more energy than the foam starting from the second cycle.
From both Fig. 45 (a) and (b), it is seen that the programming enhances the energy
dissipation capability of the foam. This result suggests that the programmed foams possess
better fatigue resistance at the same strain level. However, the effect of programming on the
pure SMP is not as significant as that on the foam. The reason is again due to the inclusion of
microspheres in the foam and their partial crushing and densification during programming. In
other words, the difference between the foam and the pure SMP is primarily due to the
microspheres and their damages.
Stress-strain response under one thermo-mechanical cyclic loading
Stress-strain responses of the nonprogrammed foam and programmed foam under one
thermo-mechanical cyclic loading are shown in Fig. 46. From Fig. 46 (a), the thermo-
mechanical cycle of the programmed foam, for instance, includes four stages: stage1
(compression stress increase while heating), stage 2 (compression stress decrease while
heating), stage 3 (compression stress decrease while cooling), and stage 4 (tension stress
increase while cooling).
In stage 1, it is clear that there is a quicker increase in compression stress for the
programmed foam than that for the nonprogrammed foam. This is understandable because
the 2-D programming process may cause some damage to the foam (such as crushing of
microspheres), which causes the programmed foam to be more compacted (see Fig. 41); it
may also form some special reentrant microstructures in the foam, which increase the
compressive stiffness and thus compressive stress of the programmed foam [75]. The
compressive stress of the foam specimen comes from two aspects when the temperature is
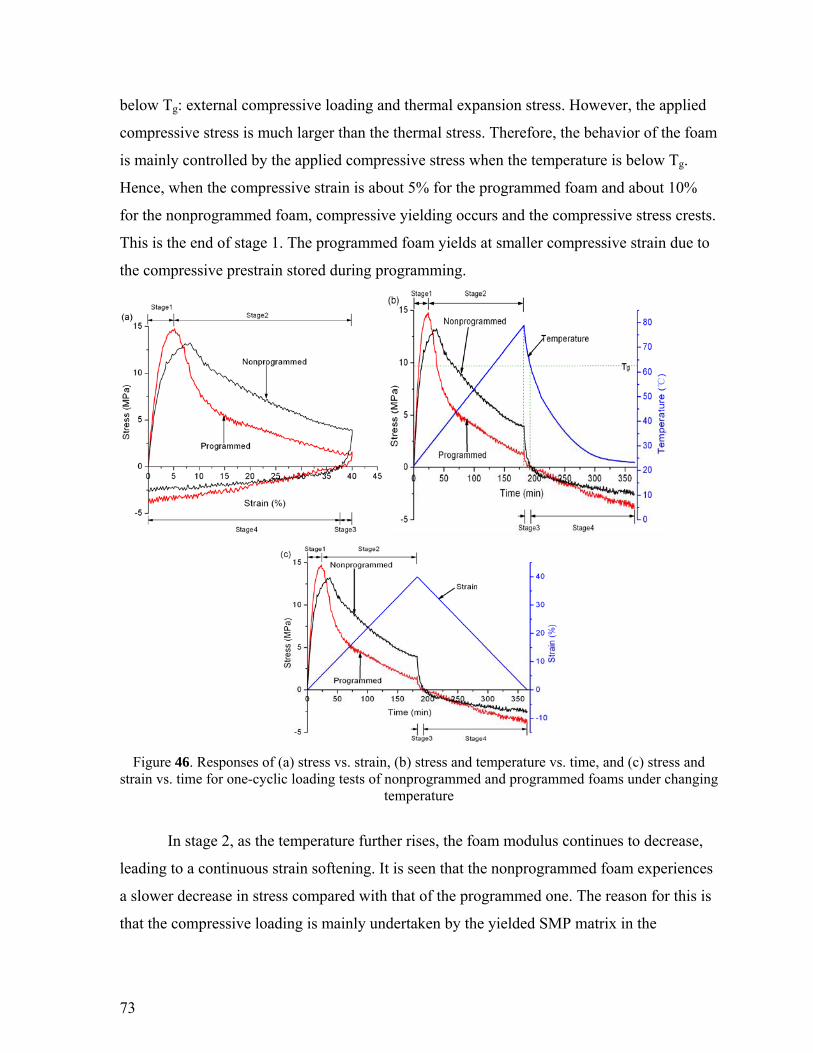
73
below Tg: external compressive loading and thermal expansion stress. However, the applied
compressive stress is much larger than the thermal stress. Therefore, the behavior of the foam
is mainly controlled by the applied compressive stress when the temperature is below Tg.
Hence, when the compressive strain is about 5% for the programmed foam and about 10%
for the nonprogrammed foam, compressive yielding occurs and the compressive stress crests.
This is the end of stage 1. The programmed foam yields at smaller compressive strain due to
the compressive prestrain stored during programming.
Figure 46. Responses of (a) stress vs. strain, (b) stress and temperature vs. time, and (c) stress and strain vs. time for one-cyclic loading tests of nonprogrammed and programmed foams under changing
temperature
In stage 2, as the temperature further rises, the foam modulus continues to decrease,
leading to a continuous strain softening. It is seen that the nonprogrammed foam experiences
a slower decrease in stress compared with that of the programmed one. The reason for this is
that the compressive loading is mainly undertaken by the yielded SMP matrix in the
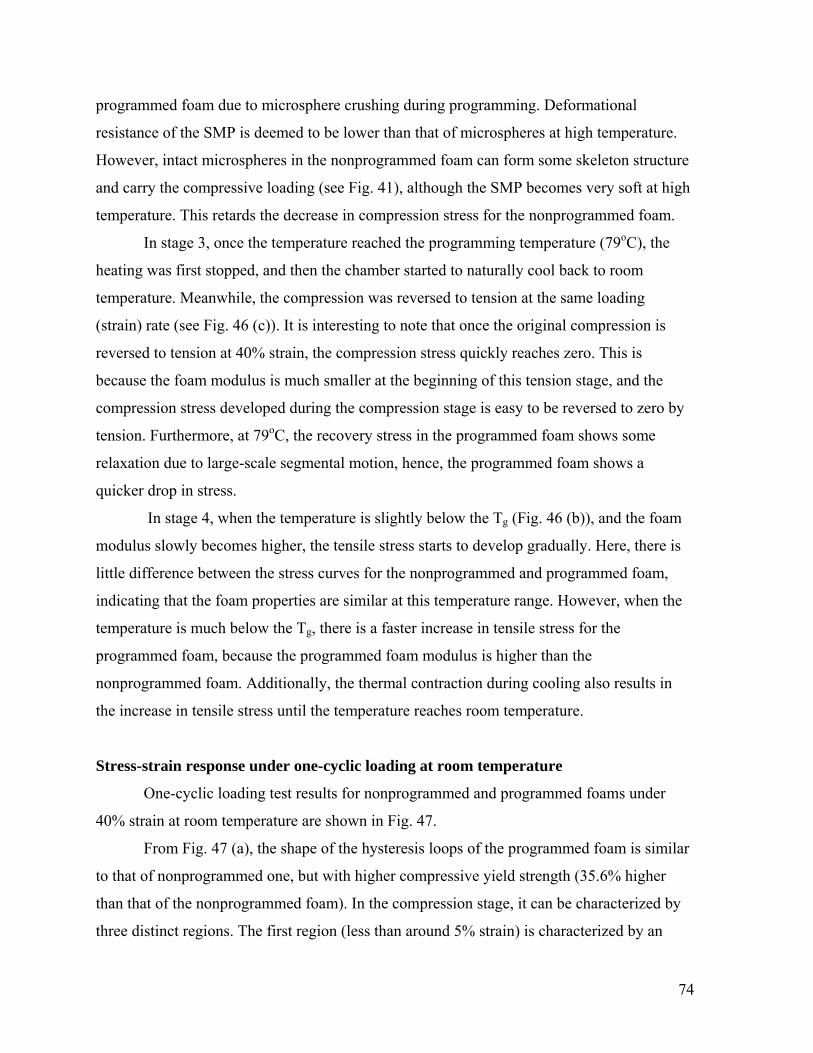
74
programmed foam due to microsphere crushing during programming. Deformational
resistance of the SMP is deemed to be lower than that of microspheres at high temperature.
However, intact microspheres in the nonprogrammed foam can form some skeleton structure
and carry the compressive loading (see Fig. 41), although the SMP becomes very soft at high
temperature. This retards the decrease in compression stress for the nonprogrammed foam.
In stage 3, once the temperature reached the programming temperature (79oC), the
heating was first stopped, and then the chamber started to naturally cool back to room
temperature. Meanwhile, the compression was reversed to tension at the same loading
(strain) rate (see Fig. 46 (c)). It is interesting to note that once the original compression is
reversed to tension at 40% strain, the compression stress quickly reaches zero. This is
because the foam modulus is much smaller at the beginning of this tension stage, and the
compression stress developed during the compression stage is easy to be reversed to zero by
tension. Furthermore, at 79oC, the recovery stress in the programmed foam shows some
relaxation due to large-scale segmental motion, hence, the programmed foam shows a
quicker drop in stress.
In stage 4, when the temperature is slightly below the Tg (Fig. 46 (b)), and the foam
modulus slowly becomes higher, the tensile stress starts to develop gradually. Here, there is
little difference between the stress curves for the nonprogrammed and programmed foam,
indicating that the foam properties are similar at this temperature range. However, when the
temperature is much below the Tg, there is a faster increase in tensile stress for the
programmed foam, because the programmed foam modulus is higher than the
nonprogrammed foam. Additionally, the thermal contraction during cooling also results in
the increase in tensile stress until the temperature reaches room temperature.
Stress-strain response under one-cyclic loading at room temperature
One-cyclic loading test results for nonprogrammed and programmed foams under
40% strain at room temperature are shown in Fig. 47.
From Fig. 47 (a), the shape of the hysteresis loops of the programmed foam is similar
to that of nonprogrammed one, but with higher compressive yield strength (35.6% higher
than that of the nonprogrammed foam). In the compression stage, it can be characterized by
three distinct regions. The first region (less than around 5% strain) is characterized by an
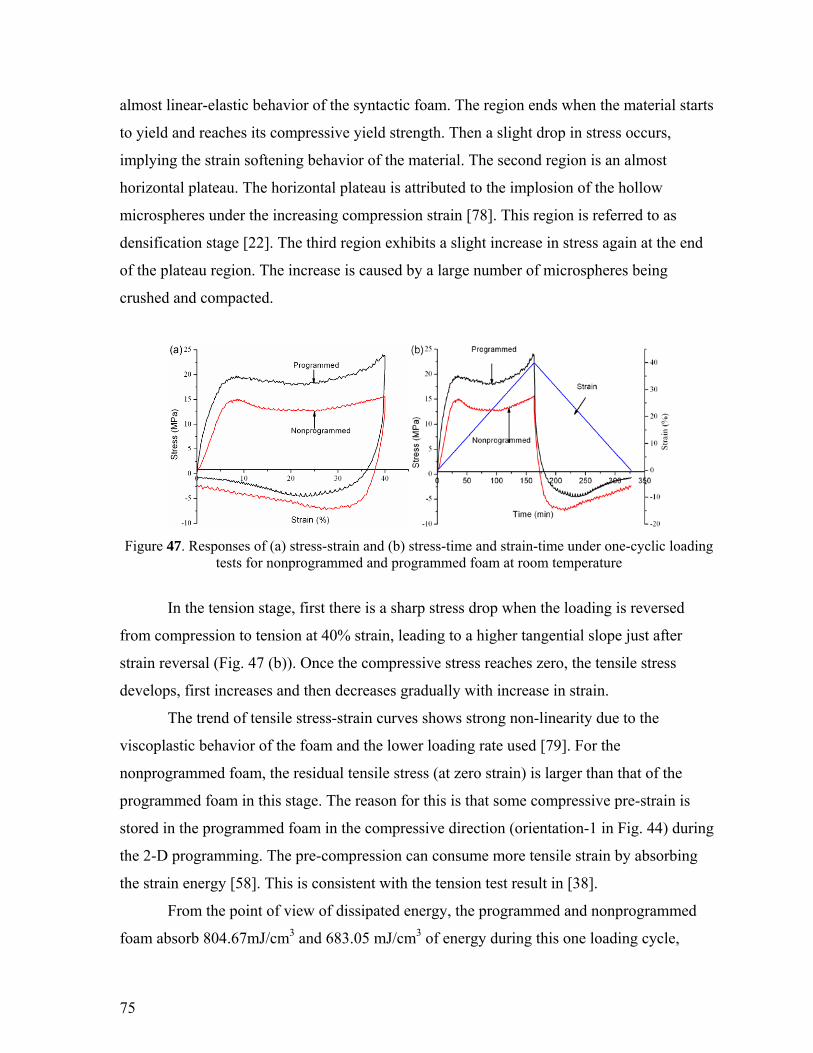
75
almost linear-elastic behavior of the syntactic foam. The region ends when the material starts
to yield and reaches its compressive yield strength. Then a slight drop in stress occurs,
implying the strain softening behavior of the material. The second region is an almost
horizontal plateau. The horizontal plateau is attributed to the implosion of the hollow
microspheres under the increasing compression strain [78]. This region is referred to as
densification stage [22]. The third region exhibits a slight increase in stress again at the end
of the plateau region. The increase is caused by a large number of microspheres being
crushed and compacted.
Figure 47. Responses of (a) stress-strain and (b) stress-time and strain-time under one-cyclic loading tests for nonprogrammed and programmed foam at room temperature
In the tension stage, first there is a sharp stress drop when the loading is reversed
from compression to tension at 40% strain, leading to a higher tangential slope just after
strain reversal (Fig. 47 (b)). Once the compressive stress reaches zero, the tensile stress
develops, first increases and then decreases gradually with increase in strain.
The trend of tensile stress-strain curves shows strong non-linearity due to the
viscoplastic behavior of the foam and the lower loading rate used [79]. For the
nonprogrammed foam, the residual tensile stress (at zero strain) is larger than that of the
programmed foam in this stage. The reason for this is that some compressive pre-strain is
stored in the programmed foam in the compressive direction (orientation-1 in Fig. 44) during
the 2-D programming. The pre-compression can consume more tensile strain by absorbing
the strain energy [58]. This is consistent with the tension test result in [38].
From the point of view of dissipated energy, the programmed and nonprogrammed
foam absorb 804.67mJ/cm3 and 683.05 mJ/cm3 of energy during this one loading cycle,
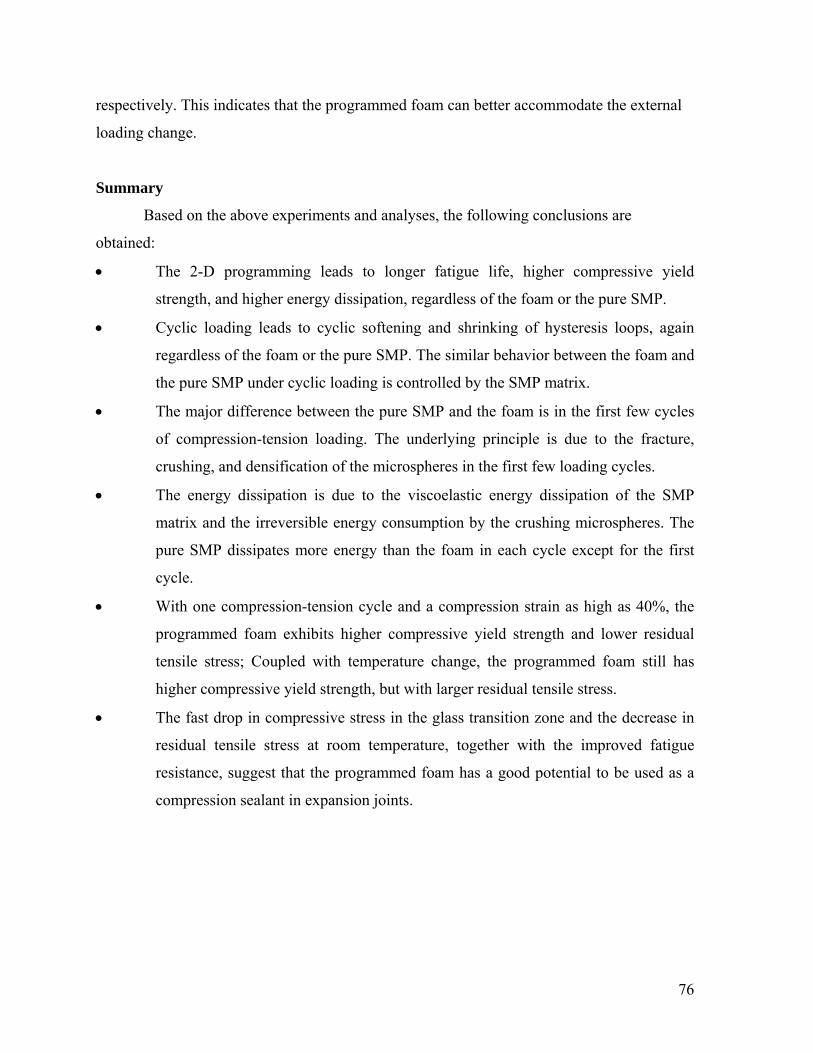
76
respectively. This indicates that the programmed foam can better accommodate the external
loading change.
Summary
Based on the above experiments and analyses, the following conclusions are
obtained:
The 2-D programming leads to longer fatigue life, higher compressive yield
strength, and higher energy dissipation, regardless of the foam or the pure SMP.
Cyclic loading leads to cyclic softening and shrinking of hysteresis loops, again
regardless of the foam or the pure SMP. The similar behavior between the foam and
the pure SMP under cyclic loading is controlled by the SMP matrix.
The major difference between the pure SMP and the foam is in the first few cycles
of compression-tension loading. The underlying principle is due to the fracture,
crushing, and densification of the microspheres in the first few loading cycles.
The energy dissipation is due to the viscoelastic energy dissipation of the SMP
matrix and the irreversible energy consumption by the crushing microspheres. The
pure SMP dissipates more energy than the foam in each cycle except for the first
cycle.
With one compression-tension cycle and a compression strain as high as 40%, the
programmed foam exhibits higher compressive yield strength and lower residual
tensile stress; Coupled with temperature change, the programmed foam still has
higher compressive yield strength, but with larger residual tensile stress.
The fast drop in compressive stress in the glass transition zone and the decrease in
residual tensile stress at room temperature, together with the improved fatigue
resistance, suggest that the programmed foam has a good potential to be used as a
compression sealant in expansion joints.
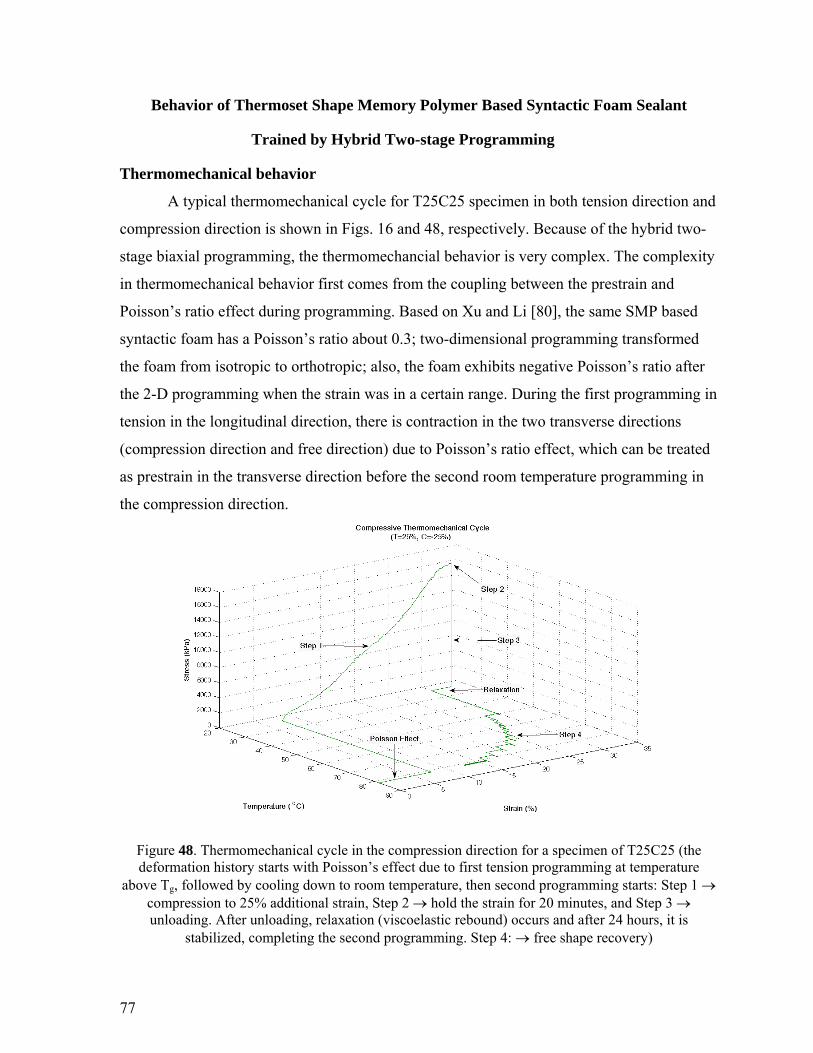
77
Behavior of Thermoset Shape Memory Polymer Based Syntactic Foam Sealant
Trained by Hybrid Two-stage Programming
Thermomechanical behavior
A typical thermomechanical cycle for T25C25 specimen in both tension direction and
compression direction is shown in Figs. 16 and 48, respectively. Because of the hybrid two-
stage biaxial programming, the thermomechancial behavior is very complex. The complexity
in thermomechanical behavior first comes from the coupling between the prestrain and
Poisson’s ratio effect during programming. Based on Xu and Li [80], the same SMP based
syntactic foam has a Poisson’s ratio about 0.3; two-dimensional programming transformed
the foam from isotropic to orthotropic; also, the foam exhibits negative Poisson’s ratio after
the 2-D programming when the strain was in a certain range. During the first programming in
tension in the longitudinal direction, there is contraction in the two transverse directions
(compression direction and free direction) due to Poisson’s ratio effect, which can be treated
as prestrain in the transverse direction before the second room temperature programming in
the compression direction.
Figure 48. Thermomechanical cycle in the compression direction for a specimen of T25C25 (the deformation history starts with Poisson’s effect due to first tension programming at temperature
above Tg, followed by cooling down to room temperature, then second programming starts: Step 1 compression to 25% additional strain, Step 2 hold the strain for 20 minutes, and Step 3 unloading. After unloading, relaxation (viscoelastic rebound) occurs and after 24 hours, it is
stabilized, completing the second programming. Step 4: free shape recovery)
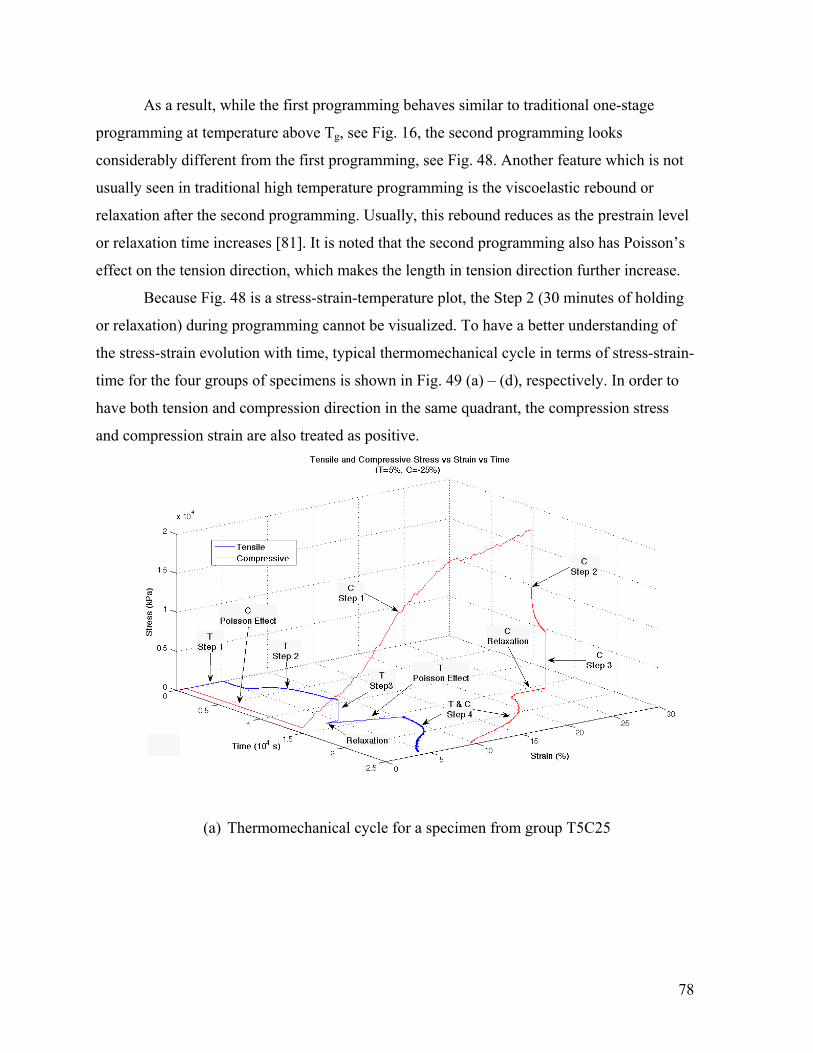
78
As a result, while the first programming behaves similar to traditional one-stage
programming at temperature above Tg, see Fig. 16, the second programming looks
considerably different from the first programming, see Fig. 48. Another feature which is not
usually seen in traditional high temperature programming is the viscoelastic rebound or
relaxation after the second programming. Usually, this rebound reduces as the prestrain level
or relaxation time increases [81]. It is noted that the second programming also has Poisson’s
effect on the tension direction, which makes the length in tension direction further increase.
Because Fig. 48 is a stress-strain-temperature plot, the Step 2 (30 minutes of holding
or relaxation) during programming cannot be visualized. To have a better understanding of
the stress-strain evolution with time, typical thermomechanical cycle in terms of stress-strain-
time for the four groups of specimens is shown in Fig. 49 (a) – (d), respectively. In order to
have both tension and compression direction in the same quadrant, the compression stress
and compression strain are also treated as positive.
(a) Thermomechanical cycle for a specimen from group T5C25
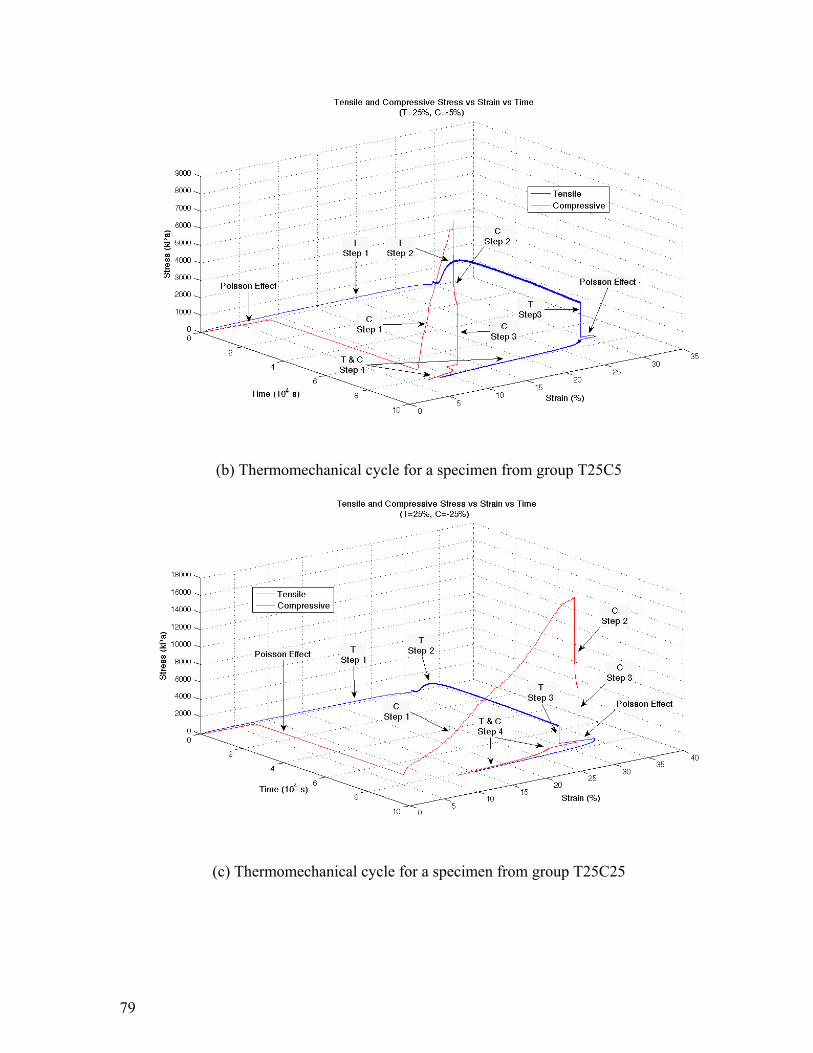
79
(b) Thermomechanical cycle for a specimen from group T25C5
(c) Thermomechanical cycle for a specimen from group T25C25
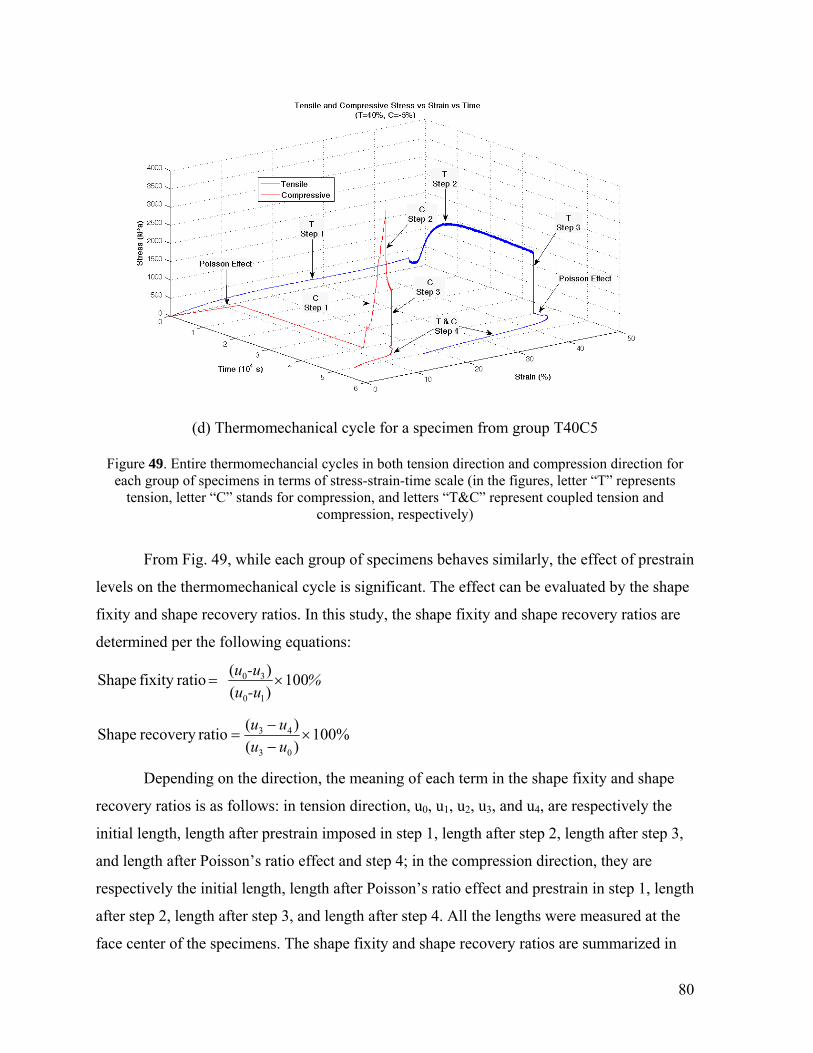
80
(d) Thermomechanical cycle for a specimen from group T40C5
Figure 49. Entire thermomechancial cycles in both tension direction and compression direction for
each group of specimens in terms of stress-strain-time scale (in the figures, letter “T” represents tension, letter “C” stands for compression, and letters “T&C” represent coupled tension and
compression, respectively)
From Fig. 49, while each group of specimens behaves similarly, the effect of prestrain
levels on the thermomechanical cycle is significant. The effect can be evaluated by the shape
fixity and shape recovery ratios. In this study, the shape fixity and shape recovery ratios are
determined per the following equations:
%-uu
-uu 100
)(
)( ratiofixity Shape
10
30
%100)(
)(ratiorecovery Shape
03
43
uu
uu
Depending on the direction, the meaning of each term in the shape fixity and shape
recovery ratios is as follows: in tension direction, u0, u1, u2, u3, and u4, are respectively the
initial length, length after prestrain imposed in step 1, length after step 2, length after step 3,
and length after Poisson’s ratio effect and step 4; in the compression direction, they are
respectively the initial length, length after Poisson’s ratio effect and prestrain in step 1, length
after step 2, length after step 3, and length after step 4. All the lengths were measured at the
face center of the specimens. The shape fixity and shape recovery ratios are summarized in
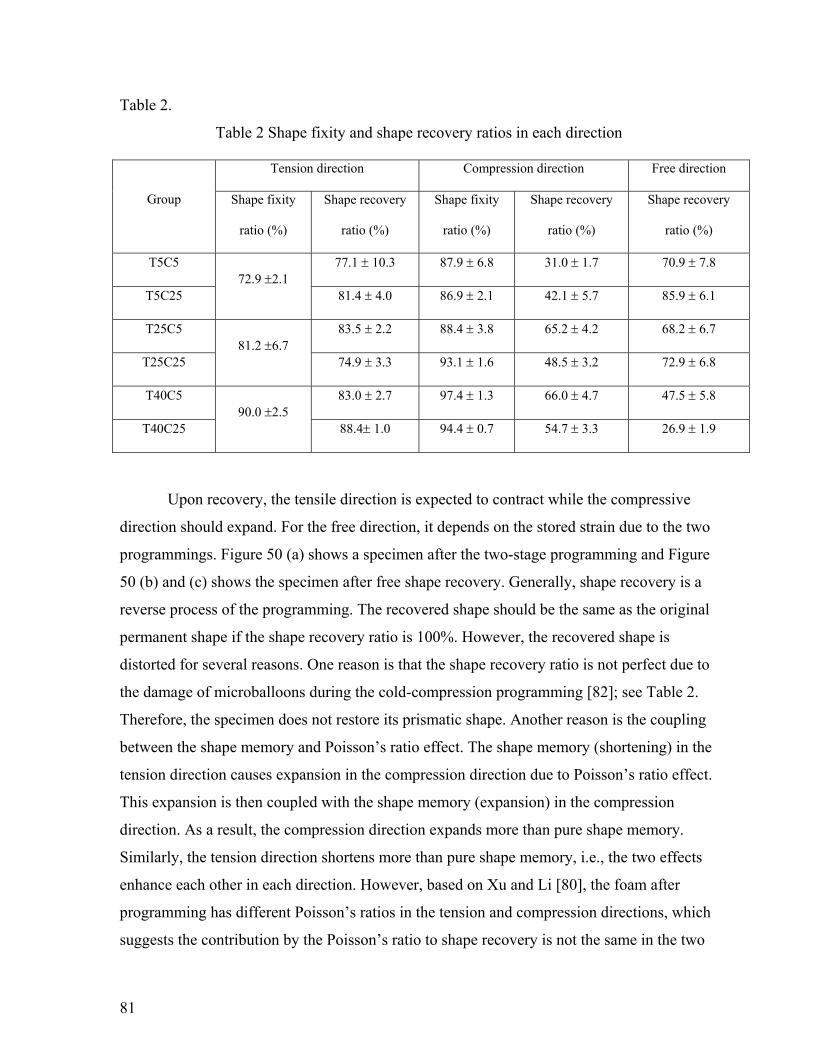
81
Table 2.
Table 2 Shape fixity and shape recovery ratios in each direction
Group
Tension direction Compression direction Free direction
Shape fixity
ratio (%)
Shape recovery
ratio (%)
Shape fixity
ratio (%)
Shape recovery
ratio (%)
Shape recovery
ratio (%)
T5C5 72.9 2.1
77.1 10.3 87.9 6.8 31.0 1.7 70.9 7.8
T5C25 81.4 4.0 86.9 2.1 42.1 5.7 85.9 6.1
T25C5 81.2 6.7
83.5 2.2 88.4 3.8 65.2 4.2 68.2 6.7
T25C25 74.9 3.3 93.1 1.6 48.5 3.2 72.9 6.8
T40C5 90.0 2.5
83.0 2.7 97.4 1.3 66.0 4.7 47.5 5.8
T40C25 88.4 1.0 94.4 0.7 54.7 3.3 26.9 1.9
Upon recovery, the tensile direction is expected to contract while the compressive
direction should expand. For the free direction, it depends on the stored strain due to the two
programmings. Figure 50 (a) shows a specimen after the two-stage programming and Figure
50 (b) and (c) shows the specimen after free shape recovery. Generally, shape recovery is a
reverse process of the programming. The recovered shape should be the same as the original
permanent shape if the shape recovery ratio is 100%. However, the recovered shape is
distorted for several reasons. One reason is that the shape recovery ratio is not perfect due to
the damage of microballoons during the cold-compression programming [82]; see Table 2.
Therefore, the specimen does not restore its prismatic shape. Another reason is the coupling
between the shape memory and Poisson’s ratio effect. The shape memory (shortening) in the
tension direction causes expansion in the compression direction due to Poisson’s ratio effect.
This expansion is then coupled with the shape memory (expansion) in the compression
direction. As a result, the compression direction expands more than pure shape memory.
Similarly, the tension direction shortens more than pure shape memory, i.e., the two effects
enhance each other in each direction. However, based on Xu and Li [80], the foam after
programming has different Poisson’s ratios in the tension and compression directions, which
suggests the contribution by the Poisson’s ratio to shape recovery is not the same in the two
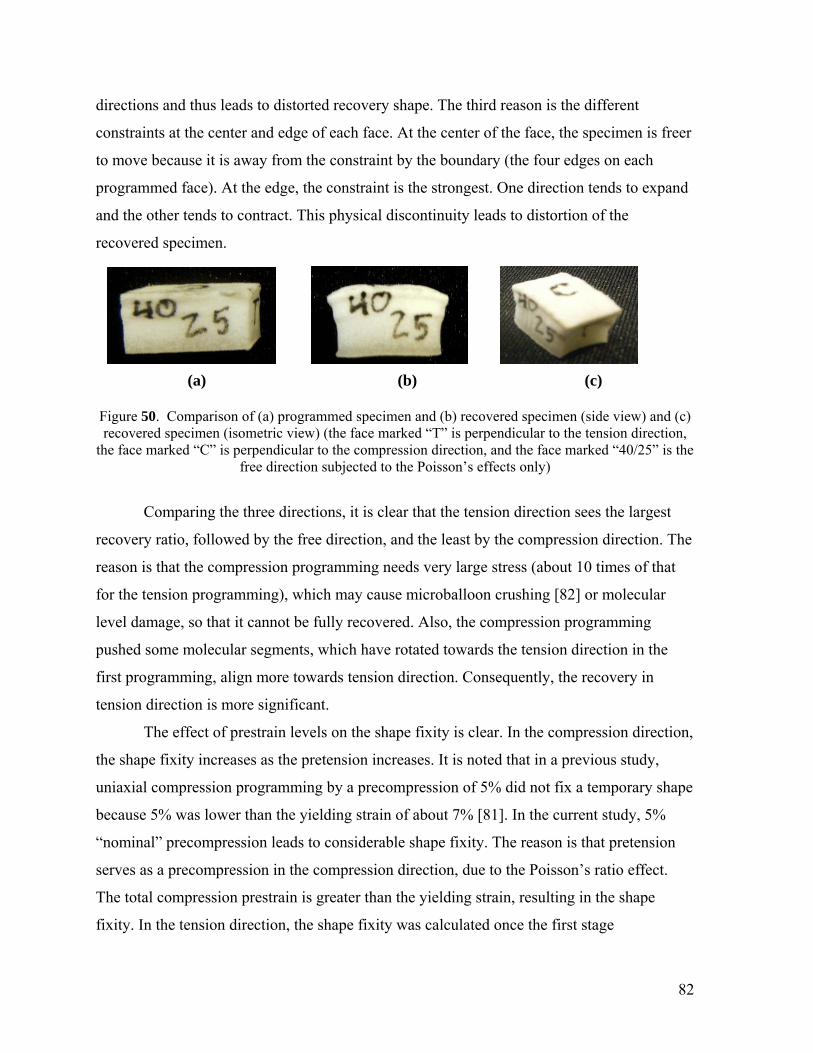
82
directions and thus leads to distorted recovery shape. The third reason is the different
constraints at the center and edge of each face. At the center of the face, the specimen is freer
to move because it is away from the constraint by the boundary (the four edges on each
programmed face). At the edge, the constraint is the strongest. One direction tends to expand
and the other tends to contract. This physical discontinuity leads to distortion of the
recovered specimen.
(a) (b) (c)
Figure 50. Comparison of (a) programmed specimen and (b) recovered specimen (side view) and (c) recovered specimen (isometric view) (the face marked “T” is perpendicular to the tension direction,
the face marked “C” is perpendicular to the compression direction, and the face marked “40/25” is the free direction subjected to the Poisson’s effects only)
Comparing the three directions, it is clear that the tension direction sees the largest
recovery ratio, followed by the free direction, and the least by the compression direction. The
reason is that the compression programming needs very large stress (about 10 times of that
for the tension programming), which may cause microballoon crushing [82] or molecular
level damage, so that it cannot be fully recovered. Also, the compression programming
pushed some molecular segments, which have rotated towards the tension direction in the
first programming, align more towards tension direction. Consequently, the recovery in
tension direction is more significant.
The effect of prestrain levels on the shape fixity is clear. In the compression direction,
the shape fixity increases as the pretension increases. It is noted that in a previous study,
uniaxial compression programming by a precompression of 5% did not fix a temporary shape
because 5% was lower than the yielding strain of about 7% [81]. In the current study, 5%
“nominal” precompression leads to considerable shape fixity. The reason is that pretension
serves as a precompression in the compression direction, due to the Poisson’s ratio effect.
The total compression prestrain is greater than the yielding strain, resulting in the shape
fixity. In the tension direction, the shape fixity was calculated once the first stage
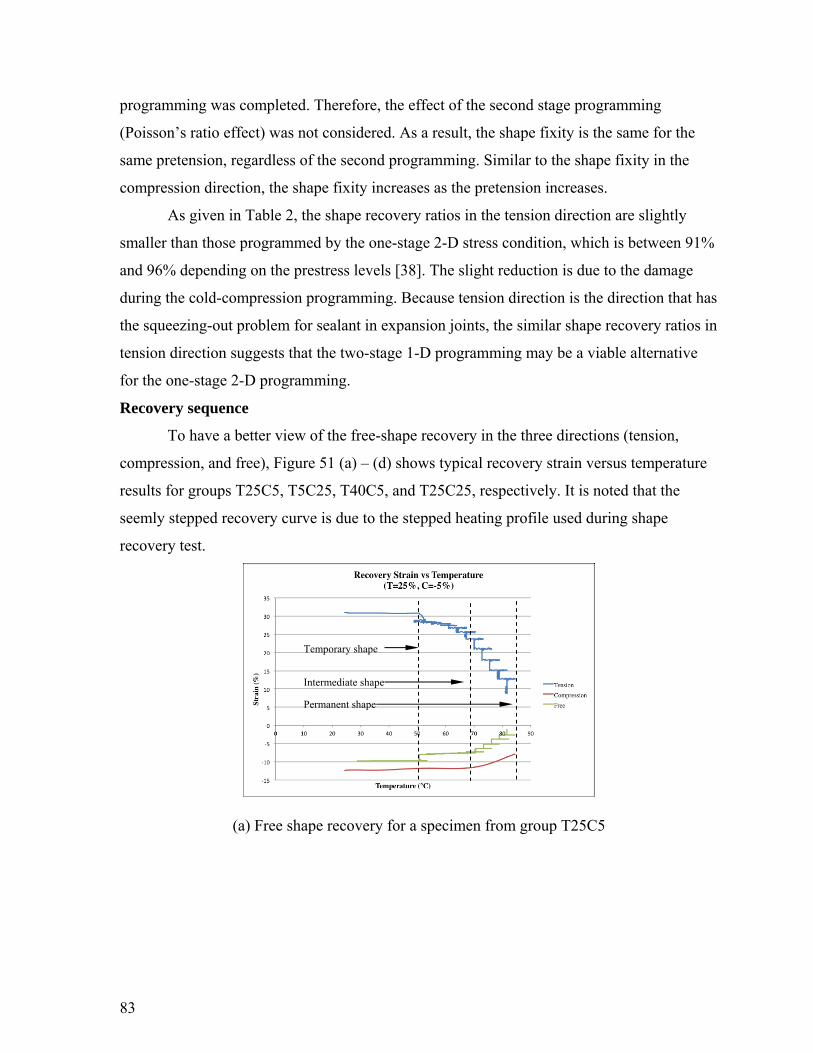
83
programming was completed. Therefore, the effect of the second stage programming
(Poisson’s ratio effect) was not considered. As a result, the shape fixity is the same for the
same pretension, regardless of the second programming. Similar to the shape fixity in the
compression direction, the shape fixity increases as the pretension increases.
As given in Table 2, the shape recovery ratios in the tension direction are slightly
smaller than those programmed by the one-stage 2-D stress condition, which is between 91%
and 96% depending on the prestress levels [38]. The slight reduction is due to the damage
during the cold-compression programming. Because tension direction is the direction that has
the squeezing-out problem for sealant in expansion joints, the similar shape recovery ratios in
tension direction suggests that the two-stage 1-D programming may be a viable alternative
for the one-stage 2-D programming.
Recovery sequence
To have a better view of the free-shape recovery in the three directions (tension,
compression, and free), Figure 51 (a) – (d) shows typical recovery strain versus temperature
results for groups T25C5, T5C25, T40C5, and T25C25, respectively. It is noted that the
seemly stepped recovery curve is due to the stepped heating profile used during shape
recovery test.
(a) Free shape recovery for a specimen from group T25C5
Temporary shape
Intermediate shape
Permanent shape
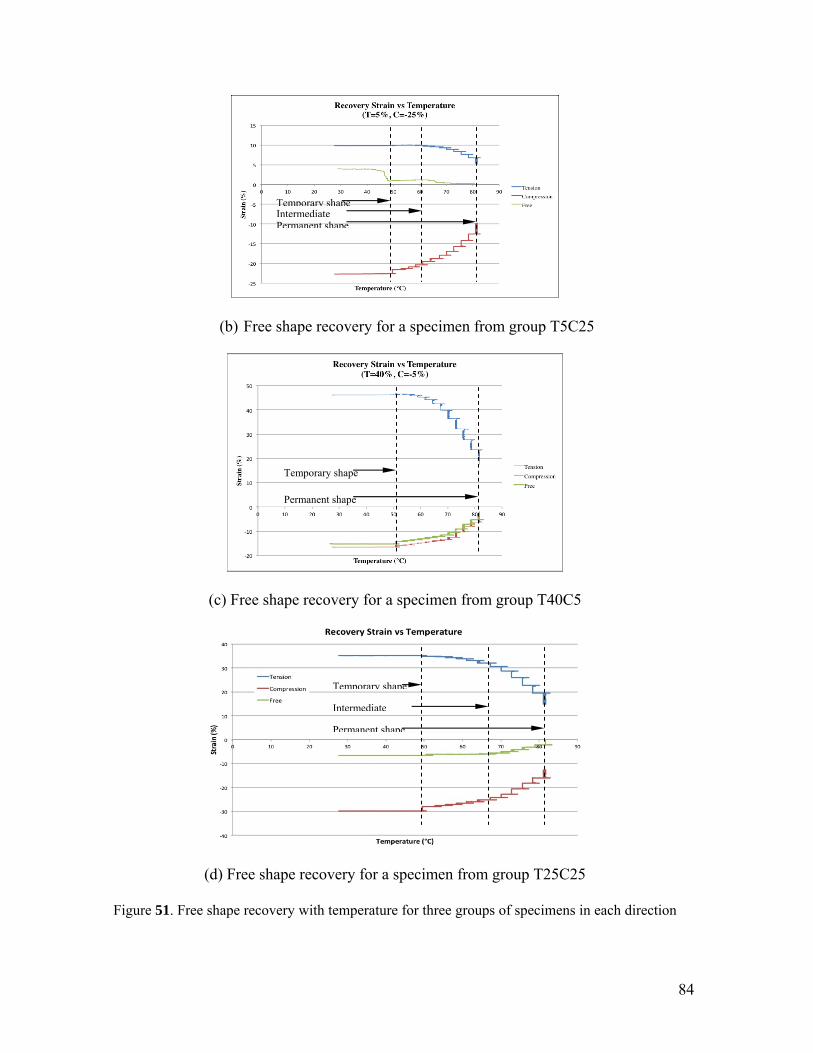
84
(b) Free shape recovery for a specimen from group T5C25
(c) Free shape recovery for a specimen from group T40C5
(d) Free shape recovery for a specimen from group T25C25
Figure 51. Free shape recovery with temperature for three groups of specimens in each direction
Temporary shape
Intermediate
Permanent shape
Temporary shape
Permanent shape
Temporary shapeIntermediatePermanent shape
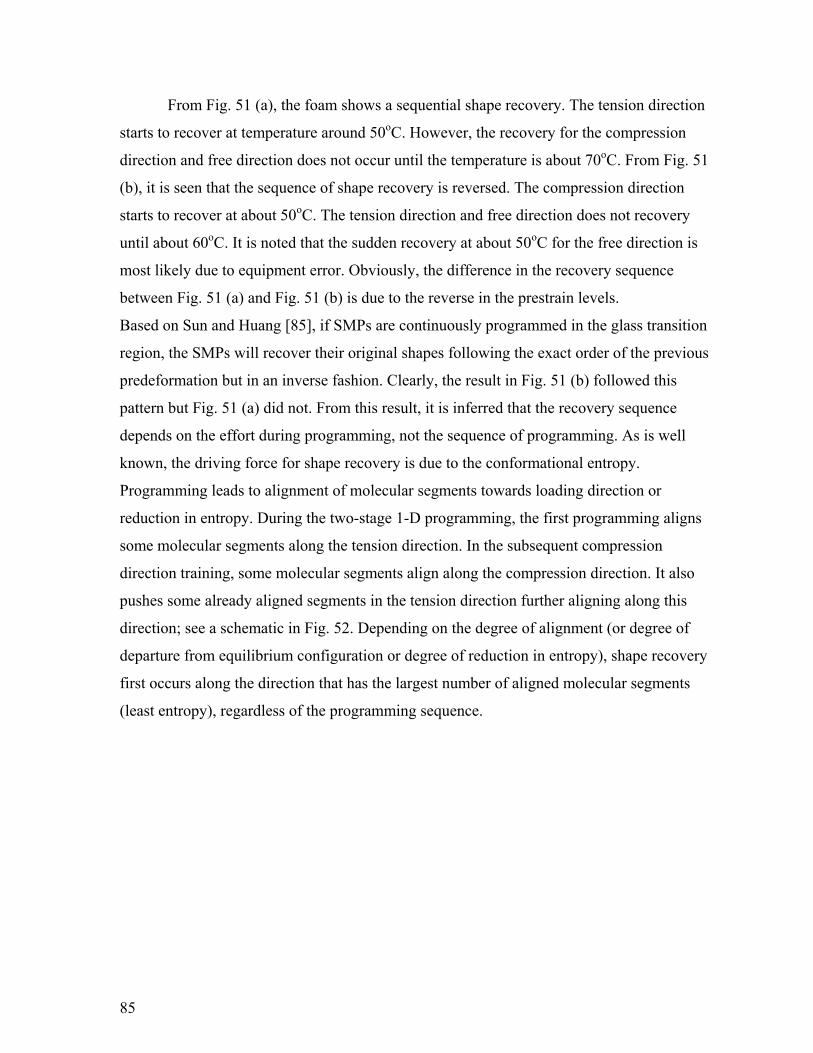
85
From Fig. 51 (a), the foam shows a sequential shape recovery. The tension direction
starts to recover at temperature around 50oC. However, the recovery for the compression
direction and free direction does not occur until the temperature is about 70oC. From Fig. 51
(b), it is seen that the sequence of shape recovery is reversed. The compression direction
starts to recover at about 50oC. The tension direction and free direction does not recovery
until about 60oC. It is noted that the sudden recovery at about 50oC for the free direction is
most likely due to equipment error. Obviously, the difference in the recovery sequence
between Fig. 51 (a) and Fig. 51 (b) is due to the reverse in the prestrain levels.
Based on Sun and Huang [85], if SMPs are continuously programmed in the glass transition
region, the SMPs will recover their original shapes following the exact order of the previous
predeformation but in an inverse fashion. Clearly, the result in Fig. 51 (b) followed this
pattern but Fig. 51 (a) did not. From this result, it is inferred that the recovery sequence
depends on the effort during programming, not the sequence of programming. As is well
known, the driving force for shape recovery is due to the conformational entropy.
Programming leads to alignment of molecular segments towards loading direction or
reduction in entropy. During the two-stage 1-D programming, the first programming aligns
some molecular segments along the tension direction. In the subsequent compression
direction training, some molecular segments align along the compression direction. It also
pushes some already aligned segments in the tension direction further aligning along this
direction; see a schematic in Fig. 52. Depending on the degree of alignment (or degree of
departure from equilibrium configuration or degree of reduction in entropy), shape recovery
first occurs along the direction that has the largest number of aligned molecular segments
(least entropy), regardless of the programming sequence.
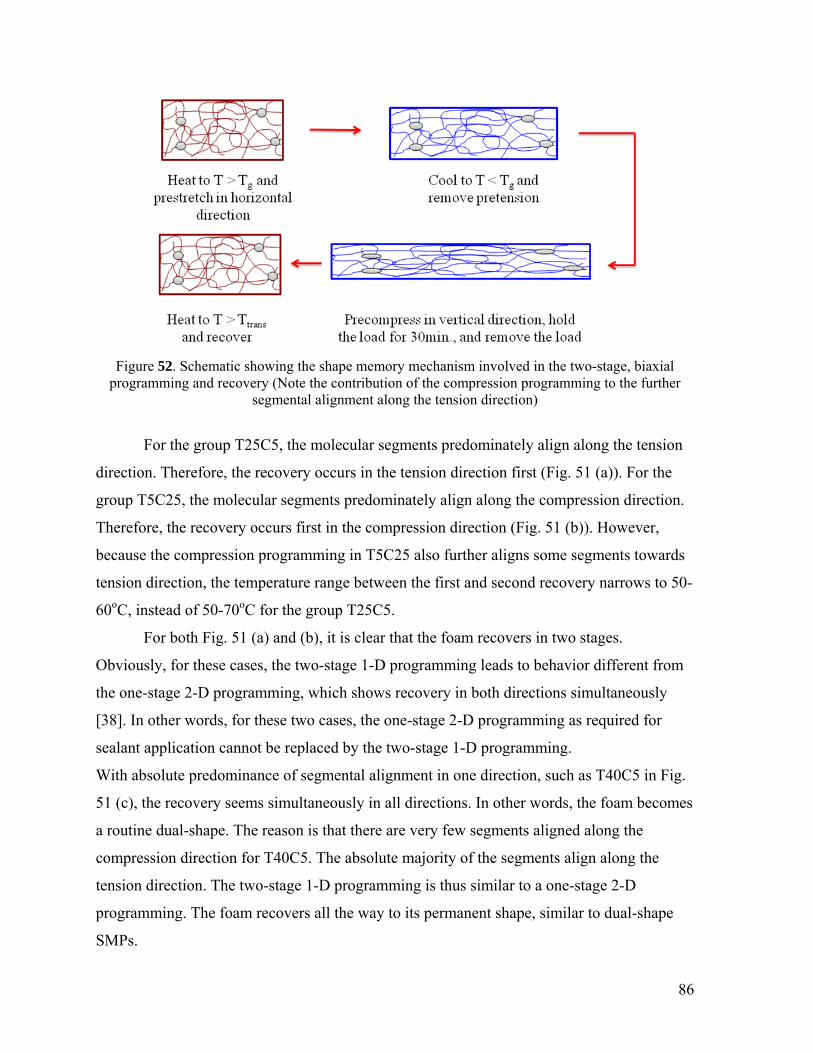
86
Figure 52. Schematic showing the shape memory mechanism involved in the two-stage, biaxial programming and recovery (Note the contribution of the compression programming to the further
segmental alignment along the tension direction)
For the group T25C5, the molecular segments predominately align along the tension
direction. Therefore, the recovery occurs in the tension direction first (Fig. 51 (a)). For the
group T5C25, the molecular segments predominately align along the compression direction.
Therefore, the recovery occurs first in the compression direction (Fig. 51 (b)). However,
because the compression programming in T5C25 also further aligns some segments towards
tension direction, the temperature range between the first and second recovery narrows to 50-
60oC, instead of 50-70oC for the group T25C5.
For both Fig. 51 (a) and (b), it is clear that the foam recovers in two stages.
Obviously, for these cases, the two-stage 1-D programming leads to behavior different from
the one-stage 2-D programming, which shows recovery in both directions simultaneously
[38]. In other words, for these two cases, the one-stage 2-D programming as required for
sealant application cannot be replaced by the two-stage 1-D programming.
With absolute predominance of segmental alignment in one direction, such as T40C5 in Fig.
51 (c), the recovery seems simultaneously in all directions. In other words, the foam becomes
a routine dual-shape. The reason is that there are very few segments aligned along the
compression direction for T40C5. The absolute majority of the segments align along the
tension direction. The two-stage 1-D programming is thus similar to a one-stage 2-D
programming. The foam recovers all the way to its permanent shape, similar to dual-shape
SMPs.
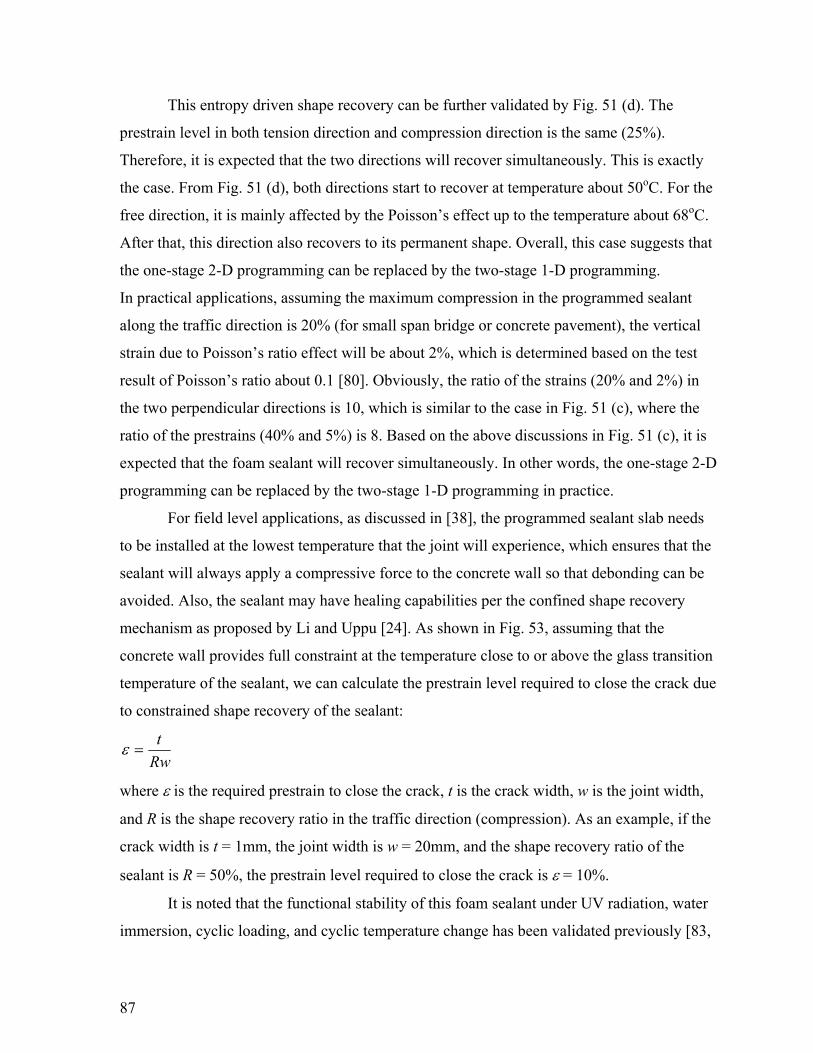
87
This entropy driven shape recovery can be further validated by Fig. 51 (d). The
prestrain level in both tension direction and compression direction is the same (25%).
Therefore, it is expected that the two directions will recover simultaneously. This is exactly
the case. From Fig. 51 (d), both directions start to recover at temperature about 50oC. For the
free direction, it is mainly affected by the Poisson’s effect up to the temperature about 68oC.
After that, this direction also recovers to its permanent shape. Overall, this case suggests that
the one-stage 2-D programming can be replaced by the two-stage 1-D programming.
In practical applications, assuming the maximum compression in the programmed sealant
along the traffic direction is 20% (for small span bridge or concrete pavement), the vertical
strain due to Poisson’s ratio effect will be about 2%, which is determined based on the test
result of Poisson’s ratio about 0.1 [80]. Obviously, the ratio of the strains (20% and 2%) in
the two perpendicular directions is 10, which is similar to the case in Fig. 51 (c), where the
ratio of the prestrains (40% and 5%) is 8. Based on the above discussions in Fig. 51 (c), it is
expected that the foam sealant will recover simultaneously. In other words, the one-stage 2-D
programming can be replaced by the two-stage 1-D programming in practice.
For field level applications, as discussed in [38], the programmed sealant slab needs
to be installed at the lowest temperature that the joint will experience, which ensures that the
sealant will always apply a compressive force to the concrete wall so that debonding can be
avoided. Also, the sealant may have healing capabilities per the confined shape recovery
mechanism as proposed by Li and Uppu [24]. As shown in Fig. 53, assuming that the
concrete wall provides full constraint at the temperature close to or above the glass transition
temperature of the sealant, we can calculate the prestrain level required to close the crack due
to constrained shape recovery of the sealant:
Rw
t
where is the required prestrain to close the crack, t is the crack width, w is the joint width,
and R is the shape recovery ratio in the traffic direction (compression). As an example, if the
crack width is t = 1mm, the joint width is w = 20mm, and the shape recovery ratio of the
sealant is R = 50%, the prestrain level required to close the crack is = 10%.
It is noted that the functional stability of this foam sealant under UV radiation, water
immersion, cyclic loading, and cyclic temperature change has been validated previously [83,
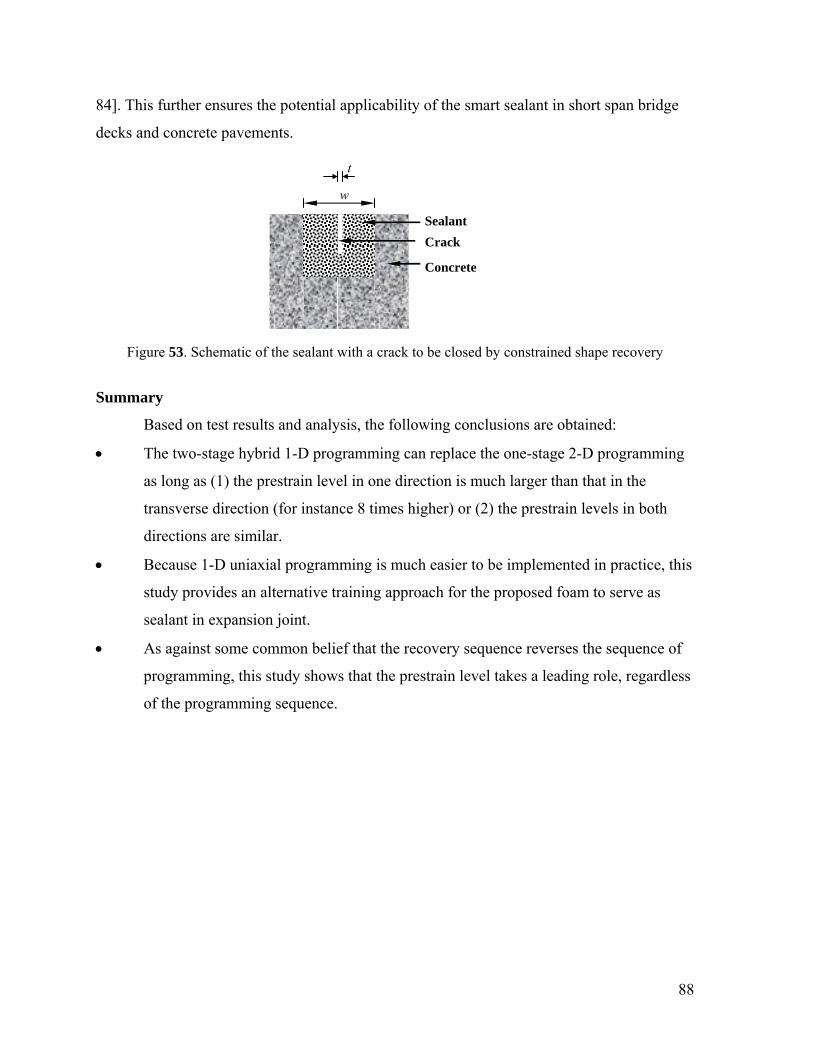
88
84]. This further ensures the potential applicability of the smart sealant in short span bridge
decks and concrete pavements.
Figure 53. Schematic of the sealant with a crack to be closed by constrained shape recovery
Summary
Based on test results and analysis, the following conclusions are obtained:
The two-stage hybrid 1-D programming can replace the one-stage 2-D programming
as long as (1) the prestrain level in one direction is much larger than that in the
transverse direction (for instance 8 times higher) or (2) the prestrain levels in both
directions are similar.
Because 1-D uniaxial programming is much easier to be implemented in practice, this
study provides an alternative training approach for the proposed foam to serve as
sealant in expansion joint.
As against some common belief that the recovery sequence reverses the sequence of
programming, this study shows that the prestrain level takes a leading role, regardless
of the programming sequence.
Sealant
Crack
Concrete
t
w
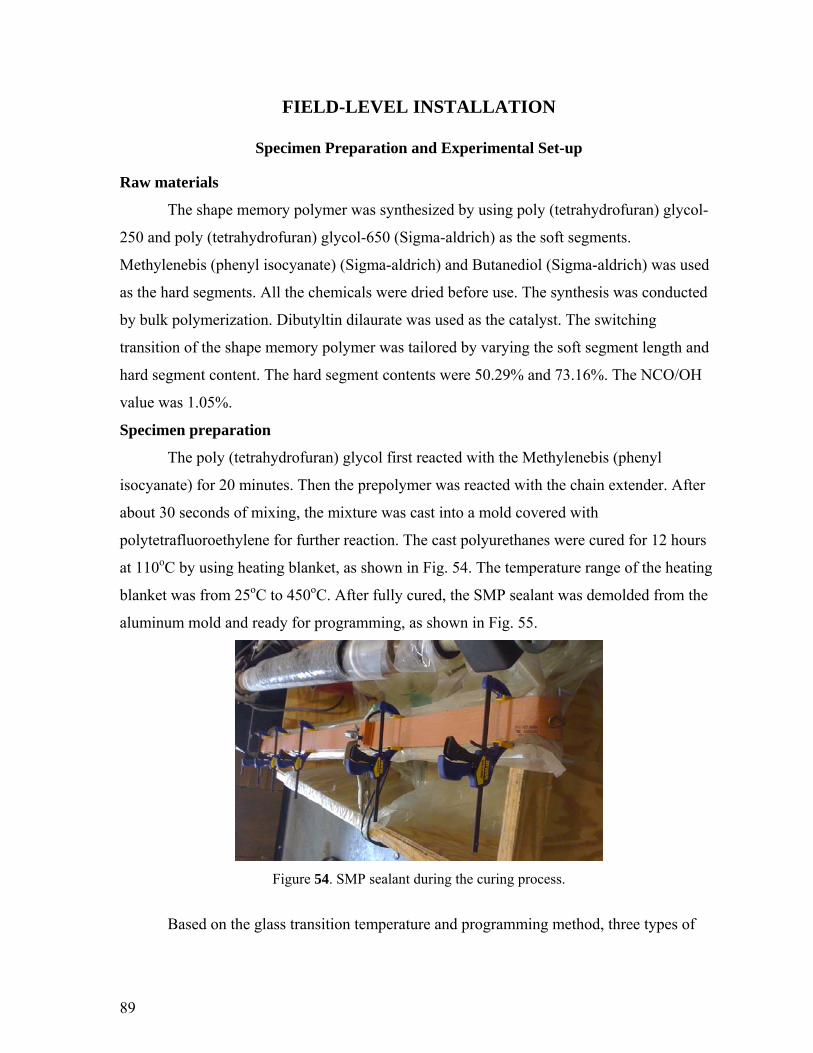
89
FIELD-LEVEL INSTALLATION
Specimen Preparation and Experimental Set-up
Raw materials
The shape memory polymer was synthesized by using poly (tetrahydrofuran) glycol-
250 and poly (tetrahydrofuran) glycol-650 (Sigma-aldrich) as the soft segments.
Methylenebis (phenyl isocyanate) (Sigma-aldrich) and Butanediol (Sigma-aldrich) was used
as the hard segments. All the chemicals were dried before use. The synthesis was conducted
by bulk polymerization. Dibutyltin dilaurate was used as the catalyst. The switching
transition of the shape memory polymer was tailored by varying the soft segment length and
hard segment content. The hard segment contents were 50.29% and 73.16%. The NCO/OH
value was 1.05%.
Specimen preparation
The poly (tetrahydrofuran) glycol first reacted with the Methylenebis (phenyl
isocyanate) for 20 minutes. Then the prepolymer was reacted with the chain extender. After
about 30 seconds of mixing, the mixture was cast into a mold covered with
polytetrafluoroethylene for further reaction. The cast polyurethanes were cured for 12 hours
at 110oC by using heating blanket, as shown in Fig. 54. The temperature range of the heating
blanket was from 25oC to 450oC. After fully cured, the SMP sealant was demolded from the
aluminum mold and ready for programming, as shown in Fig. 55.
Figure 54. SMP sealant during the curing process.
Based on the glass transition temperature and programming method, three types of
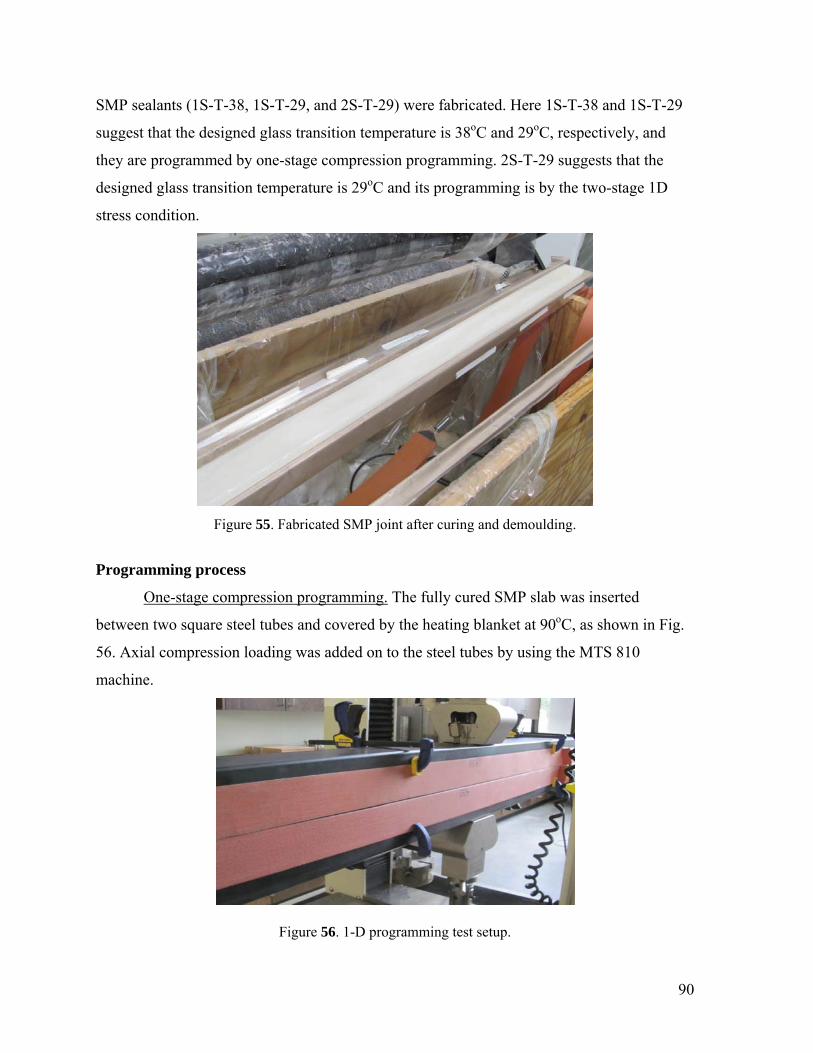
90
SMP sealants (1S-T-38, 1S-T-29, and 2S-T-29) were fabricated. Here 1S-T-38 and 1S-T-29
suggest that the designed glass transition temperature is 38oC and 29oC, respectively, and
they are programmed by one-stage compression programming. 2S-T-29 suggests that the
designed glass transition temperature is 29oC and its programming is by the two-stage 1D
stress condition.
Figure 55. Fabricated SMP joint after curing and demoulding.
Programming process
One-stage compression programming. The fully cured SMP slab was inserted
between two square steel tubes and covered by the heating blanket at 90oC, as shown in Fig.
56. Axial compression loading was added on to the steel tubes by using the MTS 810
machine.
Figure 56. 1-D programming test setup.
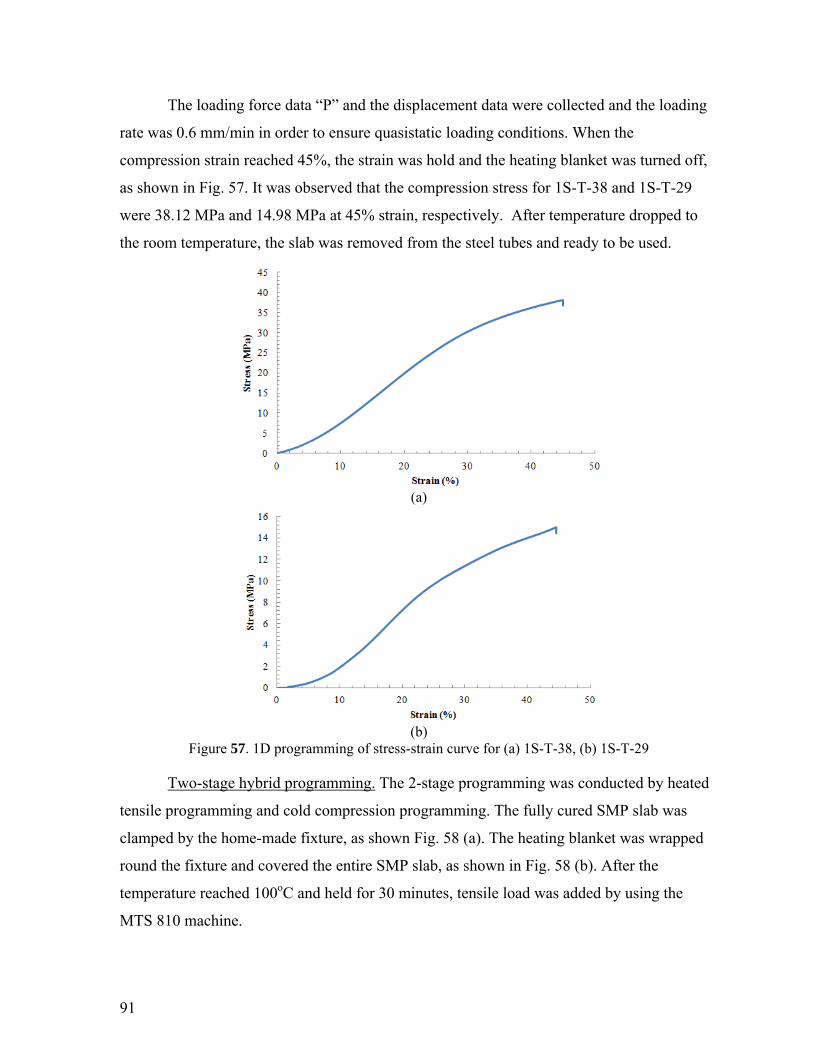
91
The loading force data “P” and the displacement data were collected and the loading
rate was 0.6 mm/min in order to ensure quasistatic loading conditions. When the
compression strain reached 45%, the strain was hold and the heating blanket was turned off,
as shown in Fig. 57. It was observed that the compression stress for 1S-T-38 and 1S-T-29
were 38.12 MPa and 14.98 MPa at 45% strain, respectively. After temperature dropped to
the room temperature, the slab was removed from the steel tubes and ready to be used.
(a)
(b)
Figure 57. 1D programming of stress-strain curve for (a) 1S-T-38, (b) 1S-T-29
Two-stage hybrid programming. The 2-stage programming was conducted by heated
tensile programming and cold compression programming. The fully cured SMP slab was
clamped by the home-made fixture, as shown Fig. 58 (a). The heating blanket was wrapped
round the fixture and covered the entire SMP slab, as shown in Fig. 58 (b). After the
temperature reached 100oC and held for 30 minutes, tensile load was added by using the
MTS 810 machine.
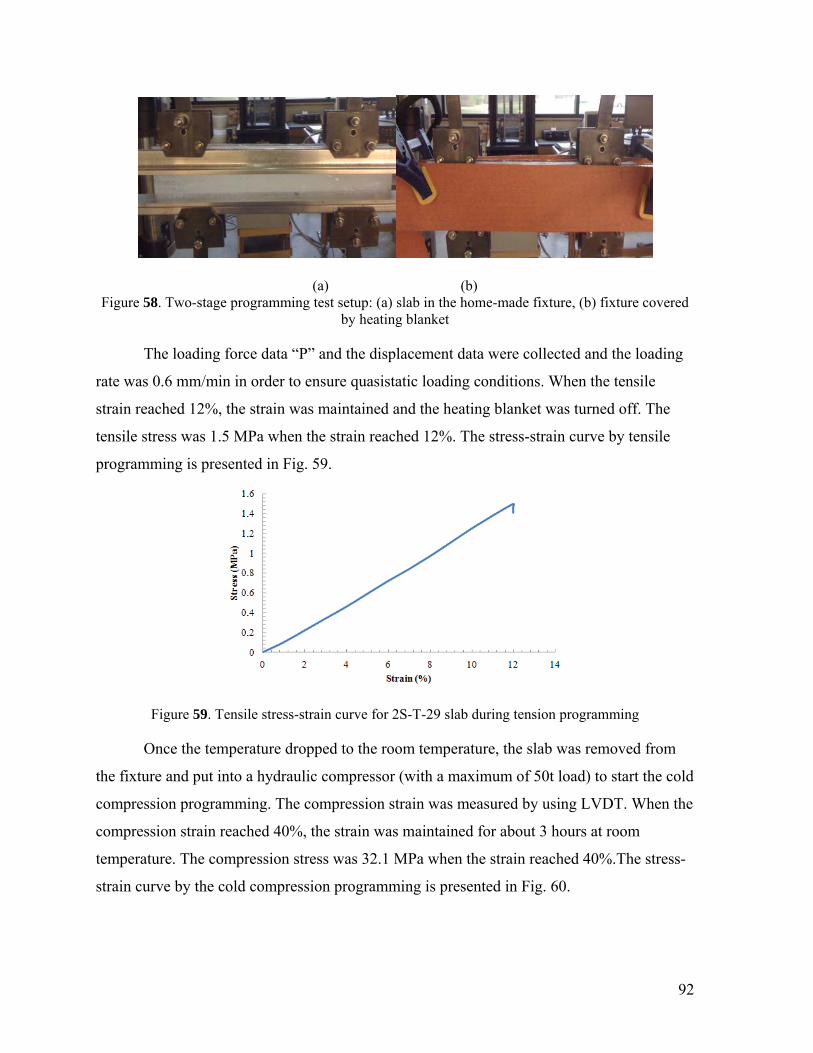
92
(a) (b) Figure 58. Two-stage programming test setup: (a) slab in the home-made fixture, (b) fixture covered
by heating blanket
The loading force data “P” and the displacement data were collected and the loading
rate was 0.6 mm/min in order to ensure quasistatic loading conditions. When the tensile
strain reached 12%, the strain was maintained and the heating blanket was turned off. The
tensile stress was 1.5 MPa when the strain reached 12%. The stress-strain curve by tensile
programming is presented in Fig. 59.
Figure 59. Tensile stress-strain curve for 2S-T-29 slab during tension programming
Once the temperature dropped to the room temperature, the slab was removed from
the fixture and put into a hydraulic compressor (with a maximum of 50t load) to start the cold
compression programming. The compression strain was measured by using LVDT. When the
compression strain reached 40%, the strain was maintained for about 3 hours at room
temperature. The compression stress was 32.1 MPa when the strain reached 40%.The stress-
strain curve by the cold compression programming is presented in Fig. 60.
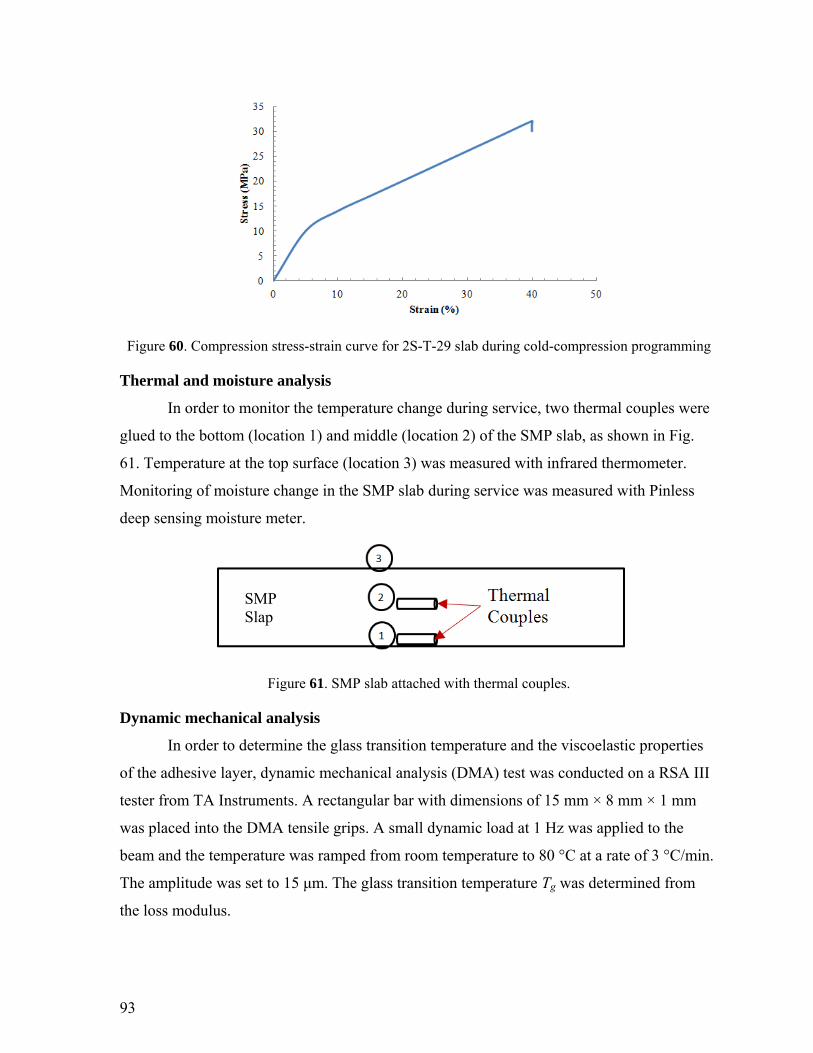
93
Figure 60. Compression stress-strain curve for 2S-T-29 slab during cold-compression programming
Thermal and moisture analysis
In order to monitor the temperature change during service, two thermal couples were
glued to the bottom (location 1) and middle (location 2) of the SMP slab, as shown in Fig.
61. Temperature at the top surface (location 3) was measured with infrared thermometer.
Monitoring of moisture change in the SMP slab during service was measured with Pinless
deep sensing moisture meter.
Figure 61. SMP slab attached with thermal couples.
Dynamic mechanical analysis
In order to determine the glass transition temperature and the viscoelastic properties
of the adhesive layer, dynamic mechanical analysis (DMA) test was conducted on a RSA III
tester from TA Instruments. A rectangular bar with dimensions of 15 mm × 8 mm × 1 mm
was placed into the DMA tensile grips. A small dynamic load at 1 Hz was applied to the
beam and the temperature was ramped from room temperature to 80 °C at a rate of 3 °C/min.
The amplitude was set to 15 μm. The glass transition temperature Tg was determined from
the loss modulus.
SMP Slap
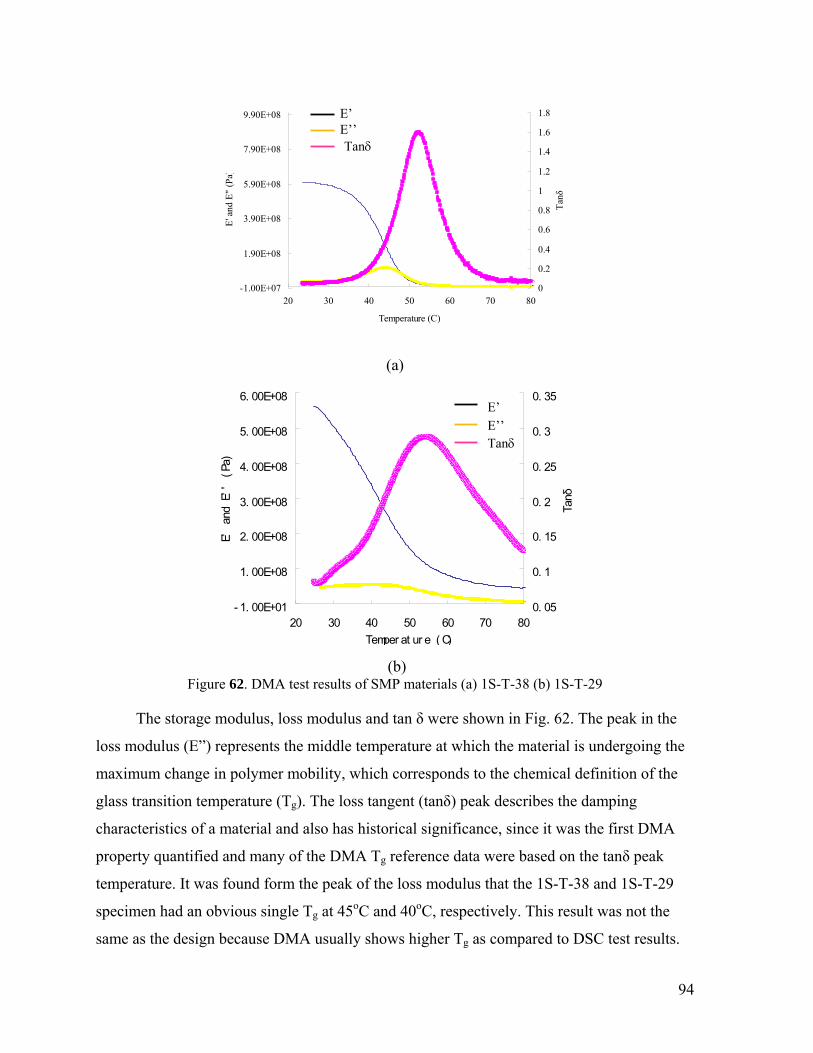
94
-1.00E+07
1.90E+08
3.90E+08
5.90E+08
7.90E+08
9.90E+08
20 30 40 50 60 70 80
Temperature (C)
E' a
nd E
" (P
a)
0
0.2
0.4
0.6
0.8
1
1.2
1.4
1.6
1.8
Tanδ
(a)
- 1. 00E+01
1. 00E+08
2. 00E+08
3. 00E+08
4. 00E+08
5. 00E+08
6. 00E+08
20 30 40 50 60 70 80Temper at ur e ( C)
E' a
nd E
'' (
Pa)
0. 05
0. 1
0. 15
0. 2
0. 25
0. 3
0. 35
Tanδ
(b)
Figure 62. DMA test results of SMP materials (a) 1S-T-38 (b) 1S-T-29
The storage modulus, loss modulus and tan δ were shown in Fig. 62. The peak in the
loss modulus (E”) represents the middle temperature at which the material is undergoing the
maximum change in polymer mobility, which corresponds to the chemical definition of the
glass transition temperature (Tg). The loss tangent (tanδ) peak describes the damping
characteristics of a material and also has historical significance, since it was the first DMA
property quantified and many of the DMA Tg reference data were based on the tanδ peak
temperature. It was found form the peak of the loss modulus that the 1S-T-38 and 1S-T-29
specimen had an obvious single Tg at 45oC and 40oC, respectively. This result was not the
same as the design because DMA usually shows higher Tg as compared to DSC test results.
E’ E’’ Tan
E’’ Tan
E’
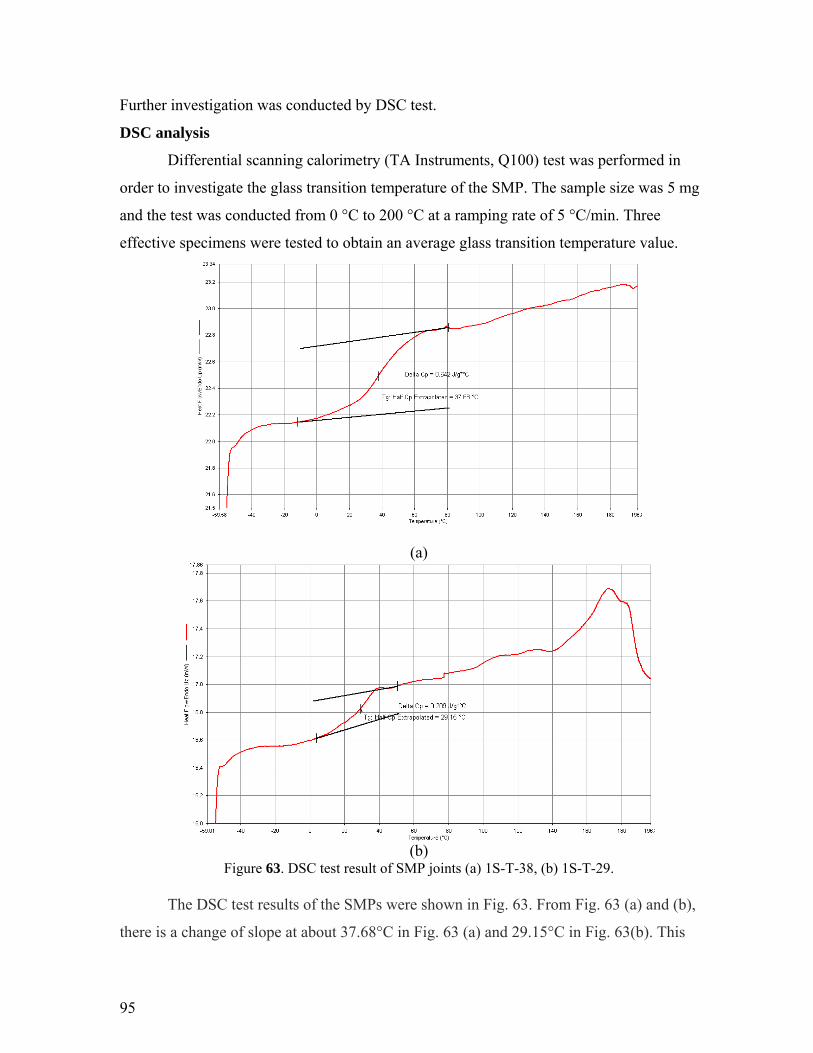
95
Further investigation was conducted by DSC test.
DSC analysis
Differential scanning calorimetry (TA Instruments, Q100) test was performed in
order to investigate the glass transition temperature of the SMP. The sample size was 5 mg
and the test was conducted from 0 °C to 200 °C at a ramping rate of 5 °C/min. Three
effective specimens were tested to obtain an average glass transition temperature value.
(a)
(b)
Figure 63. DSC test result of SMP joints (a) 1S-T-38, (b) 1S-T-29.
The DSC test results of the SMPs were shown in Fig. 63. From Fig. 63 (a) and (b),
there is a change of slope at about 37.68°C in Fig. 63 (a) and 29.15°C in Fig. 63(b). This
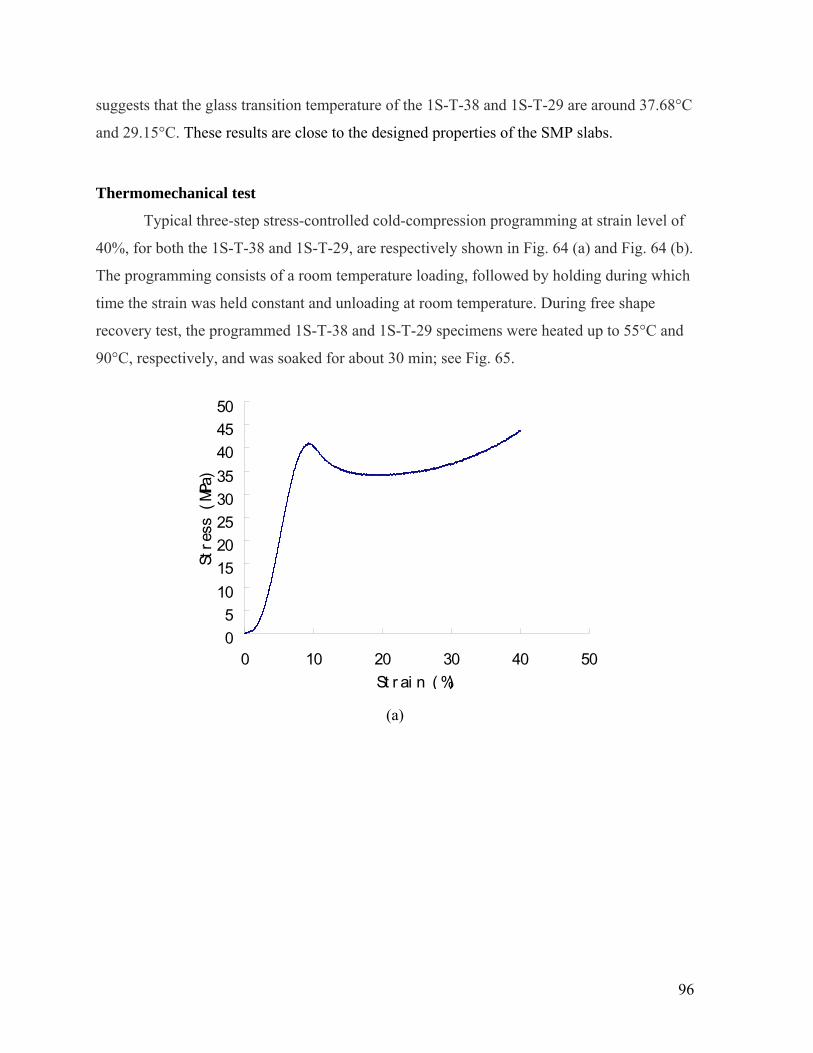
96
suggests that the glass transition temperature of the 1S-T-38 and 1S-T-29 are around 37.68°C
and 29.15°C. These results are close to the designed properties of the SMP slabs.
Thermomechanical test
Typical three-step stress-controlled cold-compression programming at strain level of
40%, for both the 1S-T-38 and 1S-T-29, are respectively shown in Fig. 64 (a) and Fig. 64 (b).
The programming consists of a room temperature loading, followed by holding during which
time the strain was held constant and unloading at room temperature. During free shape
recovery test, the programmed 1S-T-38 and 1S-T-29 specimens were heated up to 55°C and
90°C, respectively, and was soaked for about 30 min; see Fig. 65.
05
101520253035404550
0 10 20 30 40 50St r ai n ( %)
Stre
ss (
MPa)
(a)
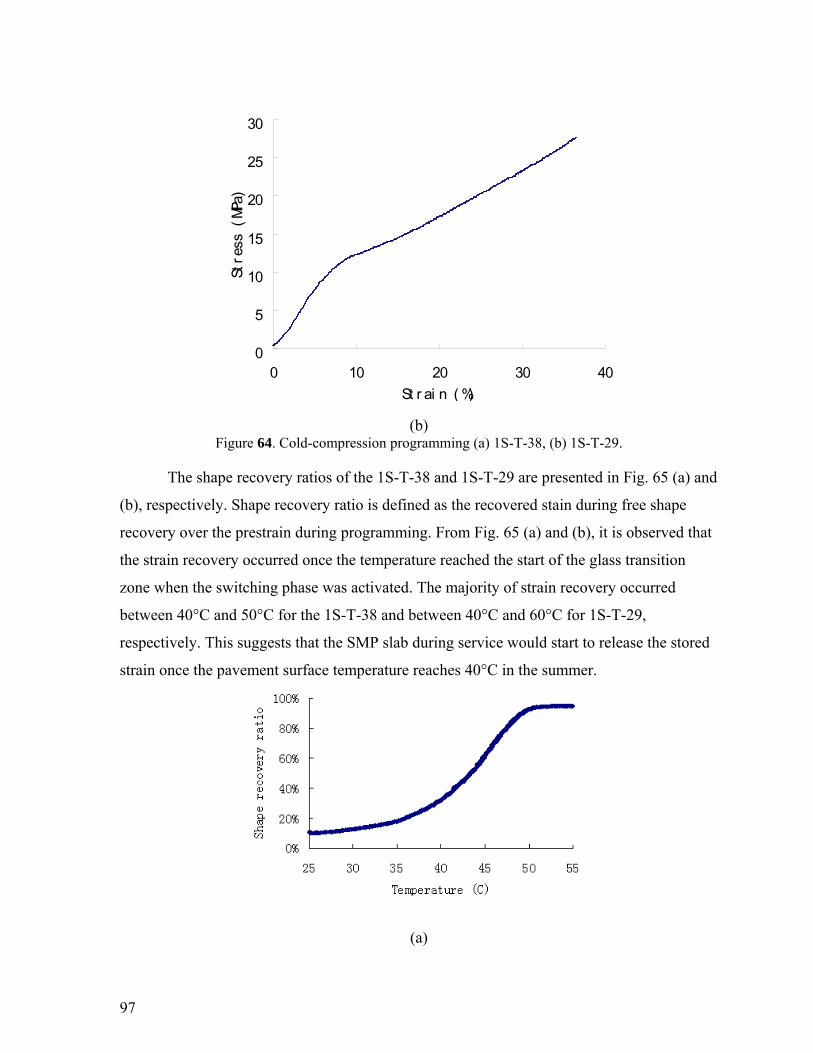
97
0
5
10
15
20
25
30
0 10 20 30 40St r ai n ( %)
Stre
ss (
MPa)
(b)
Figure 64. Cold-compression programming (a) 1S-T-38, (b) 1S-T-29.
The shape recovery ratios of the 1S-T-38 and 1S-T-29 are presented in Fig. 65 (a) and
(b), respectively. Shape recovery ratio is defined as the recovered stain during free shape
recovery over the prestrain during programming. From Fig. 65 (a) and (b), it is observed that
the strain recovery occurred once the temperature reached the start of the glass transition
zone when the switching phase was activated. The majority of strain recovery occurred
between 40°C and 50°C for the 1S-T-38 and between 40°C and 60°C for 1S-T-29,
respectively. This suggests that the SMP slab during service would start to release the stored
strain once the pavement surface temperature reaches 40°C in the summer.
(a)
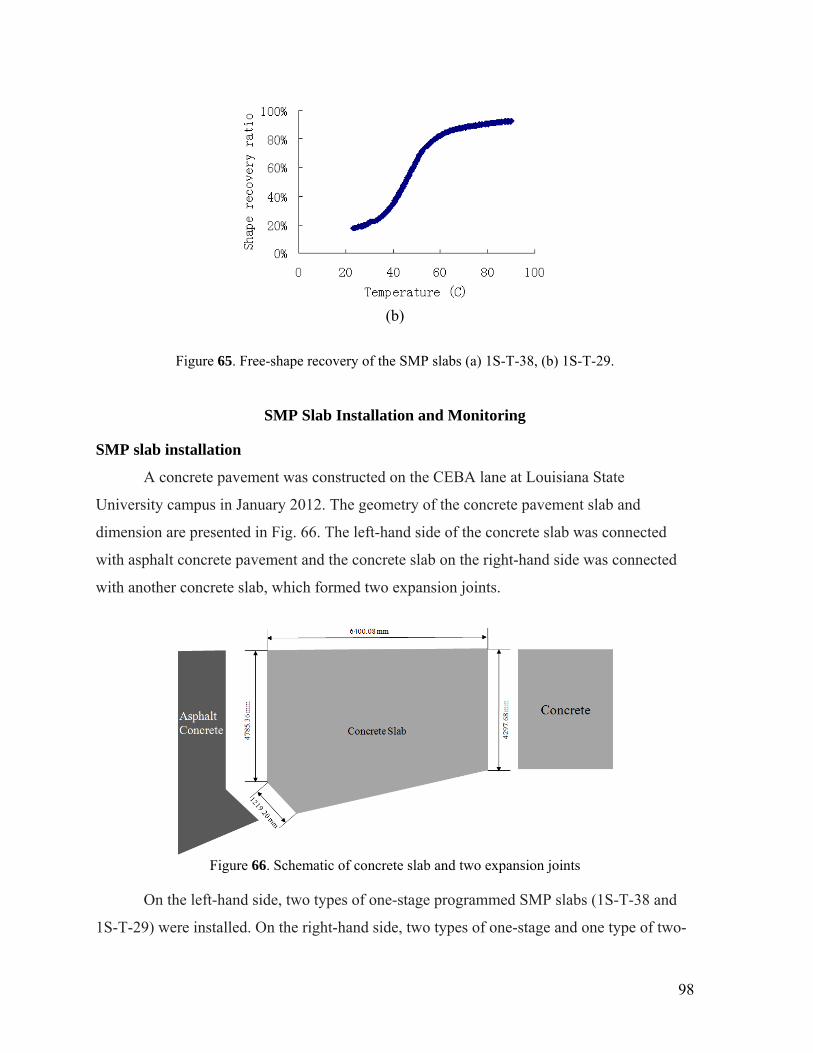
98
(b)
Figure 65. Free-shape recovery of the SMP slabs (a) 1S-T-38, (b) 1S-T-29.
SMP Slab Installation and Monitoring
SMP slab installation
A concrete pavement was constructed on the CEBA lane at Louisiana State
University campus in January 2012. The geometry of the concrete pavement slab and
dimension are presented in Fig. 66. The left-hand side of the concrete slab was connected
with asphalt concrete pavement and the concrete slab on the right-hand side was connected
with another concrete slab, which formed two expansion joints.
Figure 66. Schematic of concrete slab and two expansion joints
On the left-hand side, two types of one-stage programmed SMP slabs (1S-T-38 and
1S-T-29) were installed. On the right-hand side, two types of one-stage and one type of two-
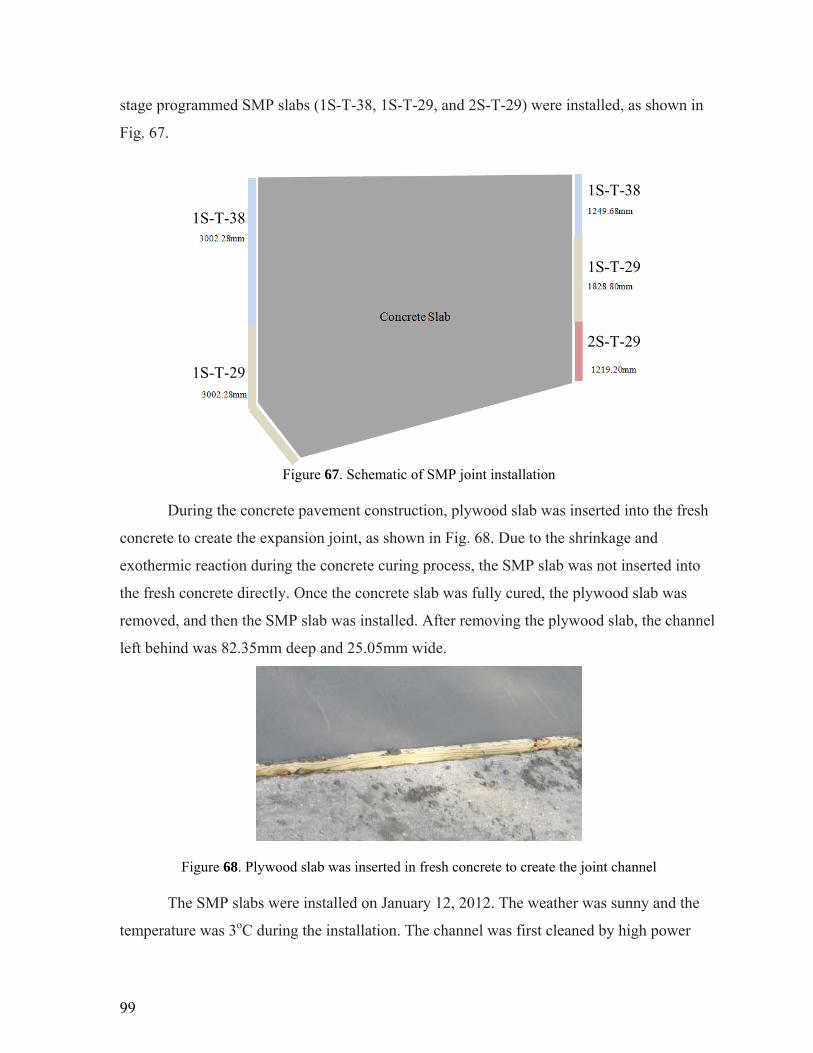
99
stage programmed SMP slabs (1S-T-38, 1S-T-29, and 2S-T-29) were installed, as shown in
Fig. 67.
Figure 67. Schematic of SMP joint installation
During the concrete pavement construction, plywood slab was inserted into the fresh
concrete to create the expansion joint, as shown in Fig. 68. Due to the shrinkage and
exothermic reaction during the concrete curing process, the SMP slab was not inserted into
the fresh concrete directly. Once the concrete slab was fully cured, the plywood slab was
removed, and then the SMP slab was installed. After removing the plywood slab, the channel
left behind was 82.35mm deep and 25.05mm wide.
Figure 68. Plywood slab was inserted in fresh concrete to create the joint channel The SMP slabs were installed on January 12, 2012. The weather was sunny and the
temperature was 3oC during the installation. The channel was first cleaned by high power
1S-T-38
1S-T-29
2S-T-29
1S-T-38
1S-T-29
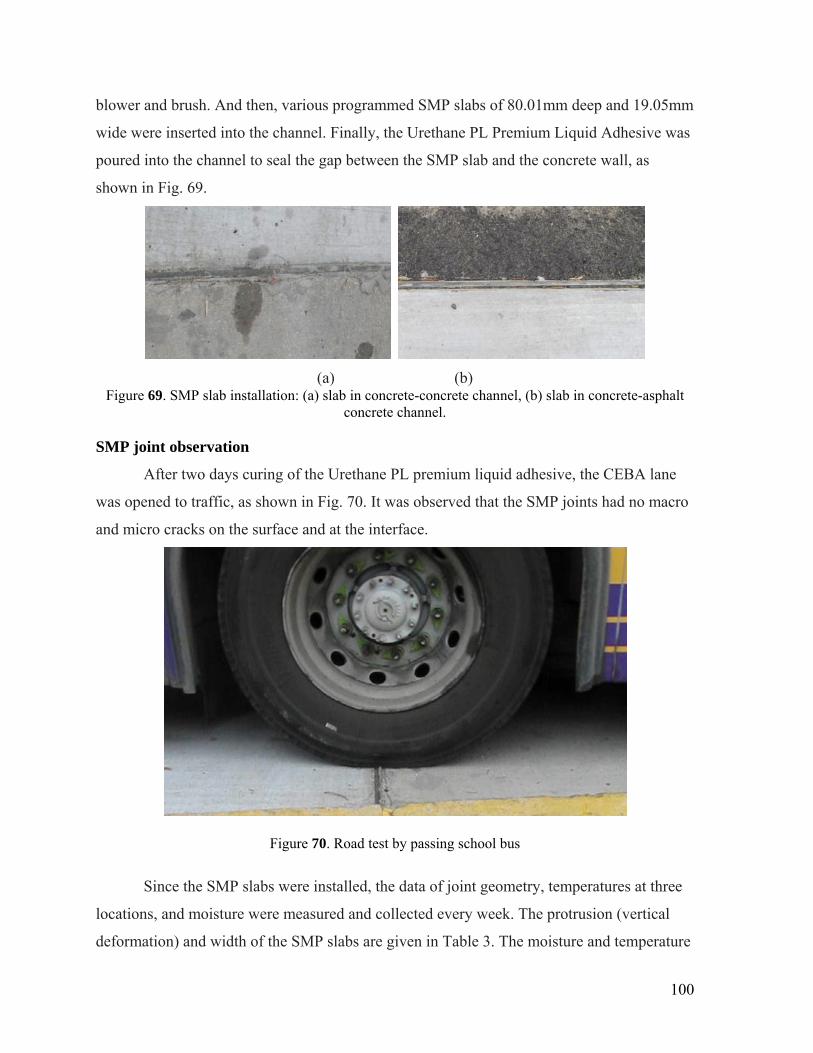
100
blower and brush. And then, various programmed SMP slabs of 80.01mm deep and 19.05mm
wide were inserted into the channel. Finally, the Urethane PL Premium Liquid Adhesive was
poured into the channel to seal the gap between the SMP slab and the concrete wall, as
shown in Fig. 69.
(a) (b) Figure 69. SMP slab installation: (a) slab in concrete-concrete channel, (b) slab in concrete-asphalt
concrete channel.
SMP joint observation
After two days curing of the Urethane PL premium liquid adhesive, the CEBA lane
was opened to traffic, as shown in Fig. 70. It was observed that the SMP joints had no macro
and micro cracks on the surface and at the interface.
Figure 70. Road test by passing school bus
Since the SMP slabs were installed, the data of joint geometry, temperatures at three
locations, and moisture were measured and collected every week. The protrusion (vertical
deformation) and width of the SMP slabs are given in Table 3. The moisture and temperature
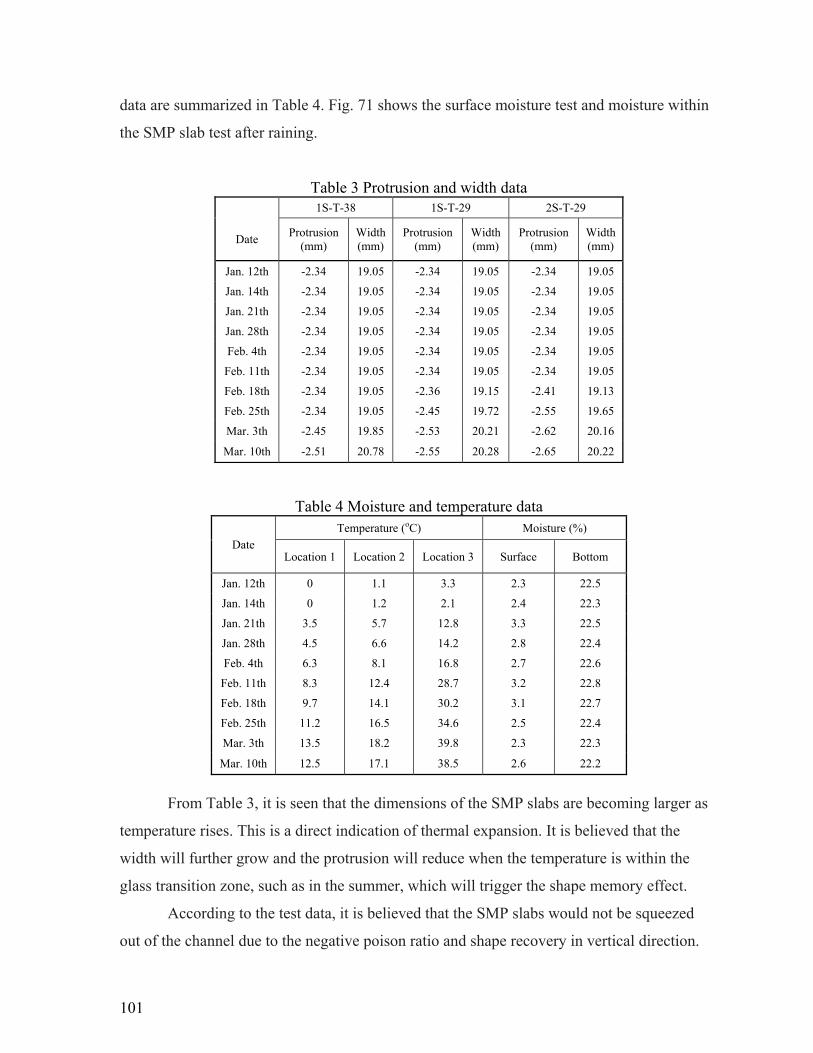
101
data are summarized in Table 4. Fig. 71 shows the surface moisture test and moisture within
the SMP slab test after raining.
Table 3 Protrusion and width data 1S-T-38 1S-T-29 2S-T-29
Date Protrusion
(mm) Width (mm)
Protrusion (mm)
Width (mm)
Protrusion (mm)
Width (mm)
Jan. 12th -2.34 19.05 -2.34 19.05 -2.34 19.05
Jan. 14th -2.34 19.05 -2.34 19.05 -2.34 19.05
Jan. 21th -2.34 19.05 -2.34 19.05 -2.34 19.05
Jan. 28th -2.34 19.05 -2.34 19.05 -2.34 19.05
Feb. 4th -2.34 19.05 -2.34 19.05 -2.34 19.05
Feb. 11th -2.34 19.05 -2.34 19.05 -2.34 19.05
Feb. 18th -2.34 19.05 -2.36 19.15 -2.41 19.13
Feb. 25th -2.34 19.05 -2.45 19.72 -2.55 19.65
Mar. 3th -2.45 19.85 -2.53 20.21 -2.62 20.16
Mar. 10th -2.51 20.78 -2.55 20.28 -2.65 20.22
Table 4 Moisture and temperature data
Date
Temperature (oC) Moisture (%)
Location 1 Location 2 Location 3 Surface Bottom
Jan. 12th 0 1.1 3.3 2.3 22.5
Jan. 14th 0 1.2 2.1 2.4 22.3
Jan. 21th 3.5 5.7 12.8 3.3 22.5
Jan. 28th 4.5 6.6 14.2 2.8 22.4
Feb. 4th 6.3 8.1 16.8 2.7 22.6
Feb. 11th 8.3 12.4 28.7 3.2 22.8
Feb. 18th 9.7 14.1 30.2 3.1 22.7
Feb. 25th 11.2 16.5 34.6 2.5 22.4
Mar. 3th 13.5 18.2 39.8 2.3 22.3
Mar. 10th 12.5 17.1 38.5 2.6 22.2
From Table 3, it is seen that the dimensions of the SMP slabs are becoming larger as
temperature rises. This is a direct indication of thermal expansion. It is believed that the
width will further grow and the protrusion will reduce when the temperature is within the
glass transition zone, such as in the summer, which will trigger the shape memory effect.
According to the test data, it is believed that the SMP slabs would not be squeezed
out of the channel due to the negative poison ratio and shape recovery in vertical direction.
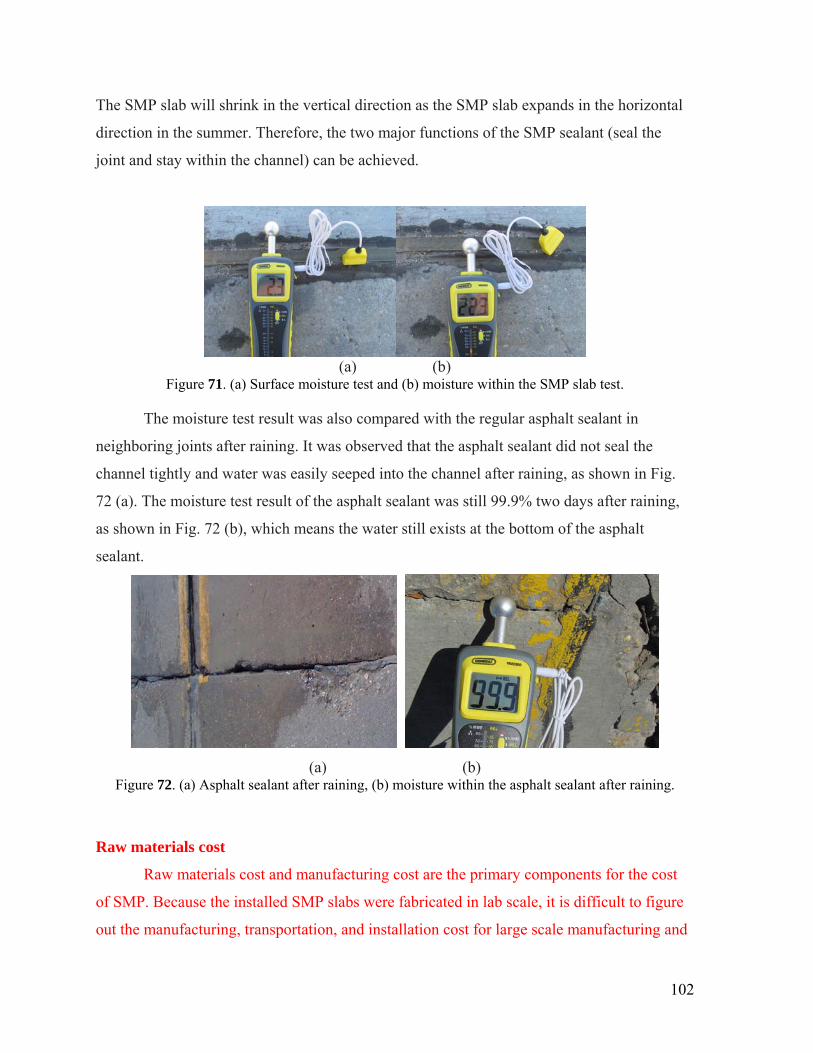
102
The SMP slab will shrink in the vertical direction as the SMP slab expands in the horizontal
direction in the summer. Therefore, the two major functions of the SMP sealant (seal the
joint and stay within the channel) can be achieved.
(a) (b)
Figure 71. (a) Surface moisture test and (b) moisture within the SMP slab test.
The moisture test result was also compared with the regular asphalt sealant in
neighboring joints after raining. It was observed that the asphalt sealant did not seal the
channel tightly and water was easily seeped into the channel after raining, as shown in Fig.
72 (a). The moisture test result of the asphalt sealant was still 99.9% two days after raining,
as shown in Fig. 72 (b), which means the water still exists at the bottom of the asphalt
sealant.
(a) (b) Figure 72. (a) Asphalt sealant after raining, (b) moisture within the asphalt sealant after raining.
Raw materials cost
Raw materials cost and manufacturing cost are the primary components for the cost
of SMP. Because the installed SMP slabs were fabricated in lab scale, it is difficult to figure
out the manufacturing, transportation, and installation cost for large scale manufacturing and
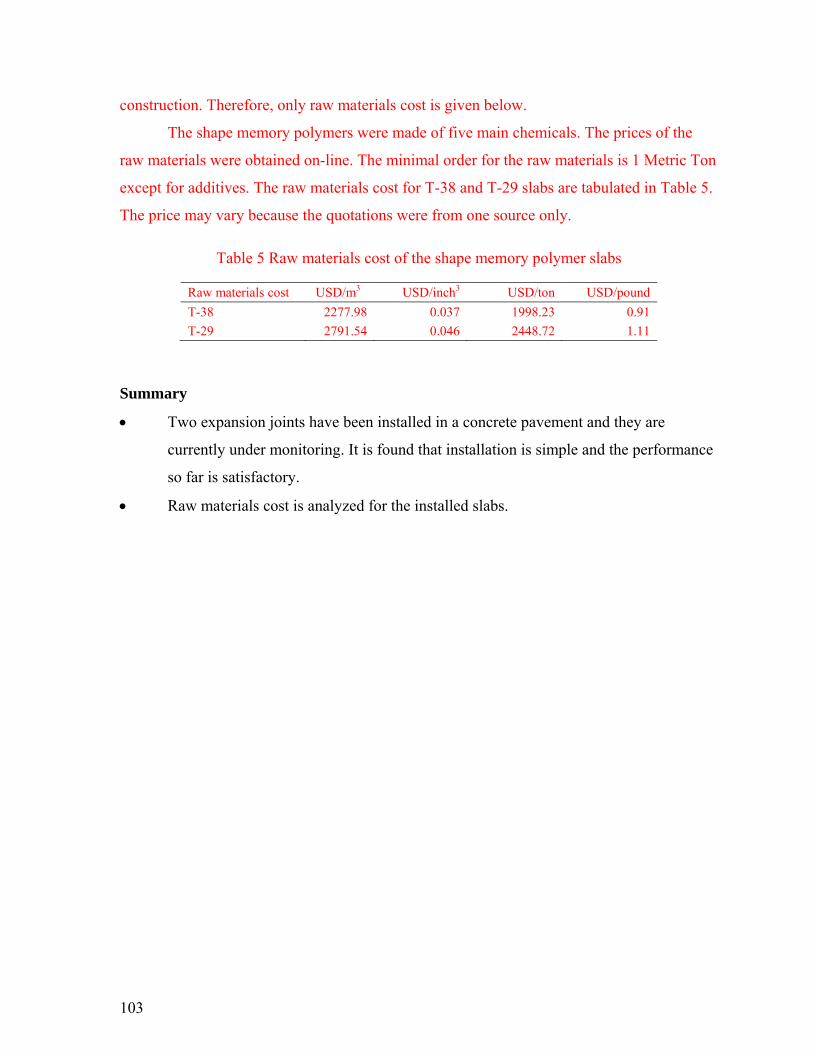
103
construction. Therefore, only raw materials cost is given below.
The shape memory polymers were made of five main chemicals. The prices of the
raw materials were obtained on-line. The minimal order for the raw materials is 1 Metric Ton
except for additives. The raw materials cost for T-38 and T-29 slabs are tabulated in Table 5.
The price may vary because the quotations were from one source only.
Table 5 Raw materials cost of the shape memory polymer slabs
Raw materials cost USD/m3 USD/inch3 USD/ton USD/pound
T-38 2277.98 0.037 1998.23 0.91 T-29 2791.54 0.046 2448.72 1.11
Summary
Two expansion joints have been installed in a concrete pavement and they are
currently under monitoring. It is found that installation is simple and the performance
so far is satisfactory.
Raw materials cost is analyzed for the installed slabs.
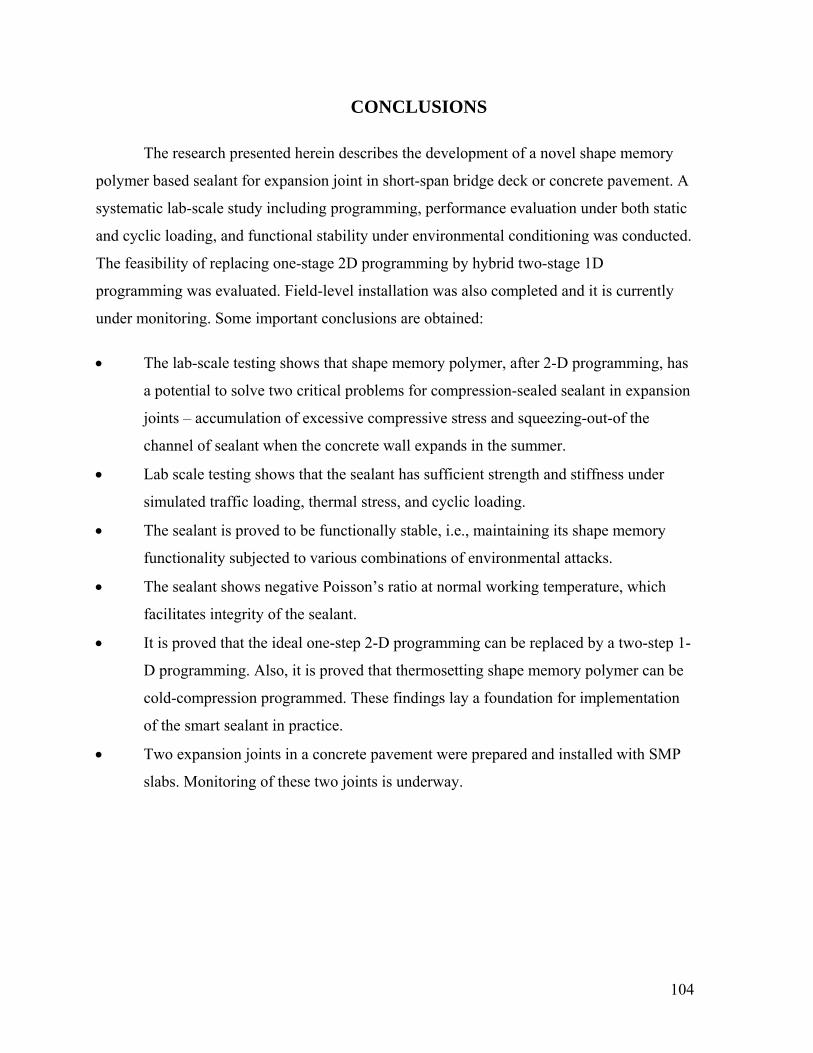
104
CONCLUSIONS
The research presented herein describes the development of a novel shape memory
polymer based sealant for expansion joint in short-span bridge deck or concrete pavement. A
systematic lab-scale study including programming, performance evaluation under both static
and cyclic loading, and functional stability under environmental conditioning was conducted.
The feasibility of replacing one-stage 2D programming by hybrid two-stage 1D
programming was evaluated. Field-level installation was also completed and it is currently
under monitoring. Some important conclusions are obtained:
The lab-scale testing shows that shape memory polymer, after 2-D programming, has
a potential to solve two critical problems for compression-sealed sealant in expansion
joints – accumulation of excessive compressive stress and squeezing-out-of the
channel of sealant when the concrete wall expands in the summer.
Lab scale testing shows that the sealant has sufficient strength and stiffness under
simulated traffic loading, thermal stress, and cyclic loading.
The sealant is proved to be functionally stable, i.e., maintaining its shape memory
functionality subjected to various combinations of environmental attacks.
The sealant shows negative Poisson’s ratio at normal working temperature, which
facilitates integrity of the sealant.
It is proved that the ideal one-step 2-D programming can be replaced by a two-step 1-
D programming. Also, it is proved that thermosetting shape memory polymer can be
cold-compression programmed. These findings lay a foundation for implementation
of the smart sealant in practice.
Two expansion joints in a concrete pavement were prepared and installed with SMP
slabs. Monitoring of these two joints is underway.

105
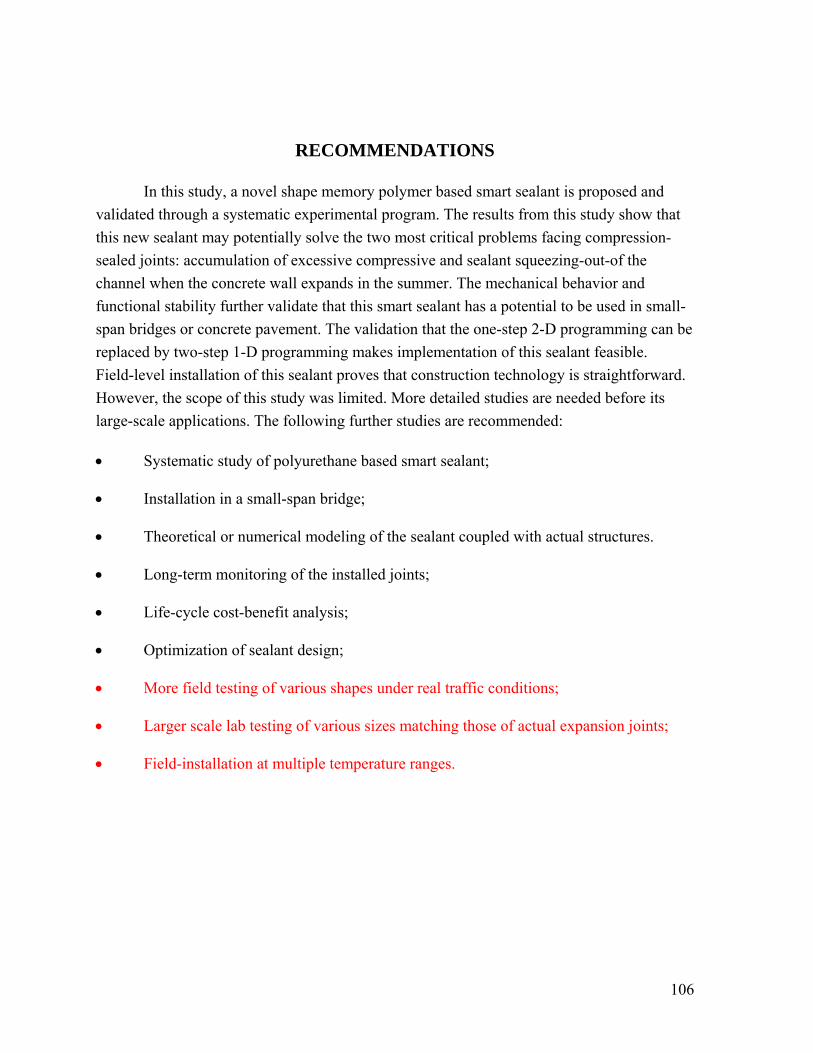
106
RECOMMENDATIONS
In this study, a novel shape memory polymer based smart sealant is proposed and
validated through a systematic experimental program. The results from this study show that
this new sealant may potentially solve the two most critical problems facing compression-
sealed joints: accumulation of excessive compressive and sealant squeezing-out-of the
channel when the concrete wall expands in the summer. The mechanical behavior and
functional stability further validate that this smart sealant has a potential to be used in small-
span bridges or concrete pavement. The validation that the one-step 2-D programming can be
replaced by two-step 1-D programming makes implementation of this sealant feasible.
Field-level installation of this sealant proves that construction technology is straightforward.
However, the scope of this study was limited. More detailed studies are needed before its
large-scale applications. The following further studies are recommended:
Systematic study of polyurethane based smart sealant;
Installation in a small-span bridge;
Theoretical or numerical modeling of the sealant coupled with actual structures.
Long-term monitoring of the installed joints;
Life-cycle cost-benefit analysis;
Optimization of sealant design;
More field testing of various shapes under real traffic conditions;
Larger scale lab testing of various sizes matching those of actual expansion joints;
Field-installation at multiple temperature ranges.

107
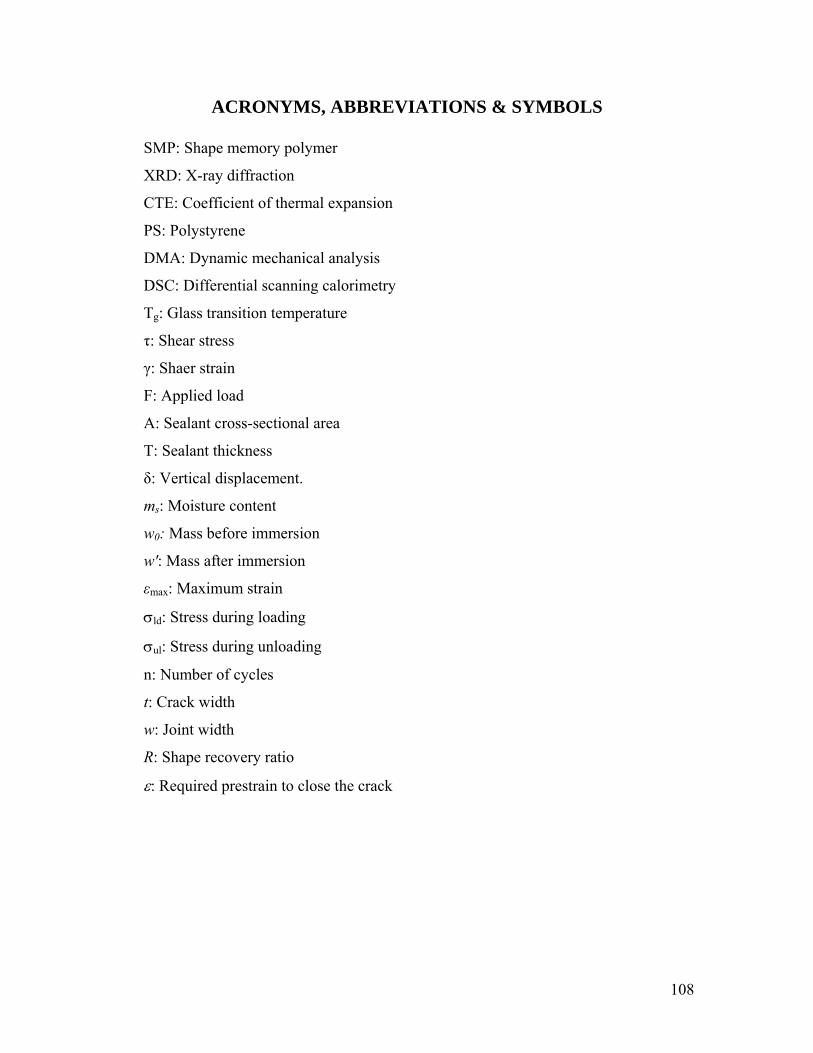
108
ACRONYMS, ABBREVIATIONS & SYMBOLS
SMP: Shape memory polymer
XRD: X-ray diffraction
CTE: Coefficient of thermal expansion
PS: Polystyrene
DMA: Dynamic mechanical analysis
DSC: Differential scanning calorimetry
Tg: Glass transition temperature
τ: Shear stress
γ: Shaer strain
F: Applied load
A: Sealant cross-sectional area
T: Sealant thickness
δ: Vertical displacement.
ms: Moisture content
w0: Mass before immersion
w': Mass after immersion
εmax: Maximum strain
ld: Stress during loading
ul: Stress during unloading
n: Number of cycles
t: Crack width
w: Joint width
R: Shape recovery ratio
: Required prestrain to close the crack

109
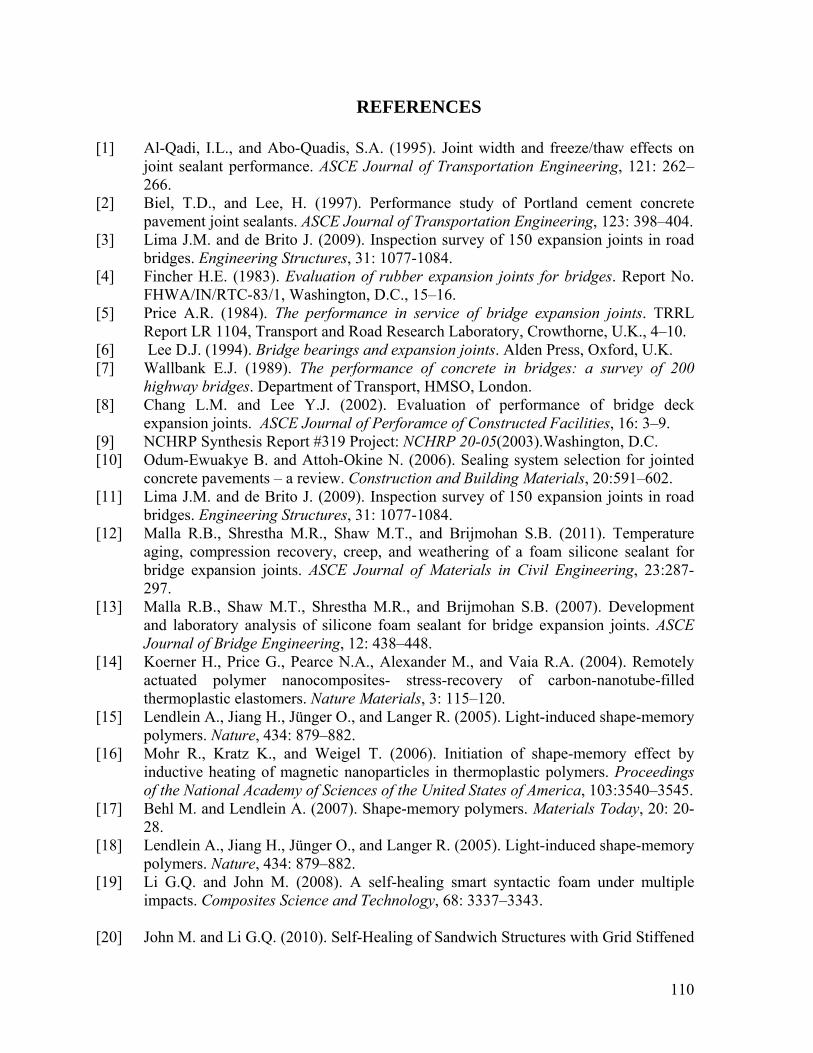
110
REFERENCES
[1] Al-Qadi, I.L., and Abo-Quadis, S.A. (1995). Joint width and freeze/thaw effects on joint sealant performance. ASCE Journal of Transportation Engineering, 121: 262–266.
[2] Biel, T.D., and Lee, H. (1997). Performance study of Portland cement concrete pavement joint sealants. ASCE Journal of Transportation Engineering, 123: 398–404.
[3] Lima J.M. and de Brito J. (2009). Inspection survey of 150 expansion joints in road bridges. Engineering Structures, 31: 1077-1084.
[4] Fincher H.E. (1983). Evaluation of rubber expansion joints for bridges. Report No. FHWA/IN/RTC-83/1, Washington, D.C., 15–16.
[5] Price A.R. (1984). The performance in service of bridge expansion joints. TRRL Report LR 1104, Transport and Road Research Laboratory, Crowthorne, U.K., 4–10.
[6] Lee D.J. (1994). Bridge bearings and expansion joints. Alden Press, Oxford, U.K. [7] Wallbank E.J. (1989). The performance of concrete in bridges: a survey of 200
highway bridges. Department of Transport, HMSO, London. [8] Chang L.M. and Lee Y.J. (2002). Evaluation of performance of bridge deck
expansion joints. ASCE Journal of Perforamce of Constructed Facilities, 16: 3–9. [9] NCHRP Synthesis Report #319 Project: NCHRP 20-05(2003).Washington, D.C. [10] Odum-Ewuakye B. and Attoh-Okine N. (2006). Sealing system selection for jointed
concrete pavements – a review. Construction and Building Materials, 20:591–602. [11] Lima J.M. and de Brito J. (2009). Inspection survey of 150 expansion joints in road
bridges. Engineering Structures, 31: 1077-1084. [12] Malla R.B., Shrestha M.R., Shaw M.T., and Brijmohan S.B. (2011). Temperature
aging, compression recovery, creep, and weathering of a foam silicone sealant for bridge expansion joints. ASCE Journal of Materials in Civil Engineering, 23:287-297.
[13] Malla R.B., Shaw M.T., Shrestha M.R., and Brijmohan S.B. (2007). Development and laboratory analysis of silicone foam sealant for bridge expansion joints. ASCE Journal of Bridge Engineering, 12: 438–448.
[14] Koerner H., Price G., Pearce N.A., Alexander M., and Vaia R.A. (2004). Remotely actuated polymer nanocomposites- stress-recovery of carbon-nanotube-filled thermoplastic elastomers. Nature Materials, 3: 115–120.
[15] Lendlein A., Jiang H., Jünger O., and Langer R. (2005). Light-induced shape-memory polymers. Nature, 434: 879–882.
[16] Mohr R., Kratz K., and Weigel T. (2006). Initiation of shape-memory effect by inductive heating of magnetic nanoparticles in thermoplastic polymers. Proceedings of the National Academy of Sciences of the United States of America, 103:3540–3545.
[17] Behl M. and Lendlein A. (2007). Shape-memory polymers. Materials Today, 20: 20-28.
[18] Lendlein A., Jiang H., Jünger O., and Langer R. (2005). Light-induced shape-memory polymers. Nature, 434: 879–882.
[19] Li G.Q. and John M. (2008). A self-healing smart syntactic foam under multiple impacts. Composites Science and Technology, 68: 3337–3343.
[20] John M. and Li G.Q. (2010). Self-Healing of Sandwich Structures with Grid Stiffened
111
Shape Memory Polymer Syntactic Foam Core. Smart Materials and Structures, 19: paper No. 075013 (12 pages).
[21] Nji J. and Li G.Q. (2010). A self-healing 3D woven fabric reinforced shape memory polymer composite for impact mitigation. Smart Materials and Structures, 19: paper No. 035007 (9 pages).
[22] Li G.Q. and Nettles D. (2010). Thermomechanical characterization of a shape memory polymer based self-repairing syntactic foam. Polymer, 51: 755–762.
[23] Xu W. and Li G.Q. (2010). Constitutive modeling of shape memory polymer based self-healing syntactic foam. International Journal of Solids and Structures, 47: 1306–1316.
[24] Li G.Q. and Uppu N. (2010). Shape memory polymer based self-healing syntactic foam: 3-D confined thermomechanical characterization. Composites Science and Technology, 70: 1419–1427.
[25] Nji J. and Li G.Q. (2010). A biomimic shape memory polymer based self-healing particulate composite. Polymer, 51: 6021-6029.
[26] Ratna D and Karger-Kocsis J. (2008). Recent advances in shape memory polymers and composites: a review. Journal of Materials Science, 43:254–269.
[27] Hickenboth CR, Moore JS, White SR, Sottos NR, Baudry J, and Wilson SR. (2007). Biasing reaction pathways with mechanical force. Nature, 446:423-427.
[28] Koerner H, Price G, Pearce NA, Alexander M, Vaia RA. (2004). Remotely actuated polymer nanocomposites - stress-recovery of carbon-nanotube-filled thermoplastic elastomers. Nature Materials, 3: 115-120.
[29] Tobushi H, Hara H, Yamada E, and Hayashi S. (1996).Thermomechanical properties in a thin film of shape memory polymer of polyurethane series. Smart Materials and Structures, 5: 483–491.
[30] Irie M. Shape memory polymers. Cambridge University Press, Cambridge, UK, (1998).
[31] Monkman GJ. (2000). Advances in shape memory polymer actuation. Mechatronics, 10: 489–498.
[32] Li F, Qi L,Yang J, Xu M, Luo X, and Ma D. (2000). Polyurethane/conducting carbon black composites: structure, electrical conductivity, strain recovery behaviour and their relationships. Journal of Applied Polymer Science, 75: 68–77.
[33] Jeong HM, Ahn BK, and Kim BK. (2001). Miscibility and shape memory effect of thermoplastic polyurethane blends with phenoxy resin. European Polymer Journal, 37: 2245–2252.
[34] Lendlein A and Langer R. (2002). Biodegradable, elastic shape-memory polymers for potential biomedical applications. Science, 296:1673–1676.
[35] Miaudet P., Derré A., and Maugey M. (2007). Shape and temperature memory of nanocomposites with broadened glass transition. Science, 318:1294–1296.
[36] Avanzini A. (2008). Mechanical characterization and finite element modelling of cyclic stress–strain behaviour of ultra high molecular weight polyethylene. Materials & Design, 29: 330–343.
[37] Xu T, Li G. (2011). A Shape Memory Polymer Based Syntactic Foam with Negative Poisson’s Ratio. Materials Science and Engineering A, 528: 6804–6811.
[38] Li G, Xu T. (2011). Thermomechanical characterization of shape memory polymer
112
based self-healing syntactic foam sealant for expansion joint. ASCE Journal of Transportation Engineering, 137: 805-814. [39] Khonakdar, H. A., Jafari, S. H., Rasouli, S., Morshedian, J. and Abedini, H. (2007). Investigation and Modeling of Temperature Dependence Recovery Behavior of Shape-Memory Crosslinked Polyethylene. Macromolecular Theory and Simulations, 16: 43–52. [40] Morshedian, J., Khonakdar, H. A. and Rasouli, S. (2005). Modeling of Shape
Memory Induction and Recovery in Heat-Shrinkable Polymers. Macromolecular Theory and Simulations, 14: 428–434.
[41] Wouterson E. M., Boey F.Y.C., Hu X., and Wong S.C. (2005). Specific properties and fracture toughness of syntactic foam: Effect of foam microstructures. Composite Science and Technology, 65: 1840–1850.
[42] Boyce M.C., Parks D.M., and Argon A.S. (1988). Large inelastic deformation of glassy polymers: Rate dependent constitutive model. Mechanics of Materials, 7: 15–33.
[43] Patankar S.N.and Kranov Y.A. (2010). Hollow glass microsphere HDPE composites for low energy sustainability. Material Science Engineering A, 527: 1361–1366.
[44] Chan N., Evans K.E. (1999). The mechanical properties of conventional and auxetic foams. Part I: Compression and tension. Journal of Cellular Plastics, 35:130–165.
[45] S.N. Patankar, Y.A. Kranov, (2010). Hollow glass microsphere HDPE composites for low energy sustainability. Material Science Engineering A, 527: 1361–1366.
[46] Liu Y., Hu H. (2010). A review on auxetic structures and polymeric materials. Scientific Research and Essays, 5:1052–1063.
[47] Wang M., Zhang L. (1999). Recovery as a Measure of Oriented Crystalline Structure in Poly(ether ester)s Based on Poly(ethylene oxide) and Poly(ethylene terephthalate) Used as Shape Memory Polymers. Journal of Polymer Science Part B, 37:101–112.
[48] Blaga A. (1980). Durability of Building Materials and Compounds, ASTM STP, 691:827–37.
[49] Ranby B. (1993). Basic reactions in the photodegradation of some important polymers. Journal of Macromolecular Science Part A, A30: 583–94.
[50] Gugumus F. (1987). Plastics Additives (2nd Edition), Hanser, Munich, 97–185. [51] Davis A. and Sims D. (1983). Weathering of Polymers. Applied Science Publishers,
Essex, England, 208. [52] Wypych G, Faulkner T. (1999). Weathering of Plastics, Plastics Design Library.
Norwich, NewYork, 1–15. [53] Shychuk AV, Stavychna DY, White J R. (2001). Effect of tensile stress on chain
scission and crosslinking during photo-oxidation of polypropylene. Polymer Degradation and Stability, 72: 279–85.
[54] Grassie N, Scott G. (1988). Polymer Degradatien and Stabilisation. Cambridge University Press, Cambridge.
[55] Torikai A, Murata T, Fueki K. (1984). Radiation-induced degradation of polycarbonate - electron-spin resonance and molecular-weight measurements. Polymer Degradation and Stability, 7: 55–64.
[56] Feldman D. (2002). Polymer Weathering: Photo-Oxidation. Journal of Polymers and the Environment, 10: 163–73.
[57] Komitov P, Kostov G, Stanchev S. (1989). Aging of ldpe - structural-changes.
113
Polymer Degradation and Stability, 24: 303–12. [58] Patankar SN, Kranov YA. (2012). Hollow glass microsphere HDPE composites for
low energy sustainability. Materials Science and Engineering A, 527: 1361–66. [59] Zhang D, Dougal SM, Yeganeh MS. (2000). Effects of UV Irradiation and Plasma
Treatment on a Polystyrene Surface Studied by IR-Visible Sum Frequency Generation Spectroscopy. Langmuir, 16: 4528–32.
[60] Nakatsuka S, Andrady A. (1994). Studies on Enhanced Degradable Plastics. III. The Effect of Weathering of Polyethylene and (Ethylene-Carbon Monoxide) Copolymers on Moisture and Carbon Dioxide Permeability. Journal of Environmental Polymer Degradation, 2: 161–7.
[61] Ghaffar A, Scott GA, Scott G. (1976). The chemical and physical changes occurring during U.V. degradation of high impact polystyrene, European Polymer Journal, 11: 271–5.
[62] Song F, Gao Y. (2009). Chemical characteristics of precipitation at metropolitan Newark in the US East Coast. Atmospheric Environment, 43: 4903–13.
[63] Kochetkov VA, Maksimov RD. (1996). Water absorption and swelling of glass/epoxy syntactic foams. Mechanics, 32: 61–70.
[64] Sauvant-moynot V. Gimenez N, Sautereau H. (2006). Hydrolytic ageing of syntactic foams for thermal insulation in deep water: degradation mechanisms and water uptake model. Journal of Materials Science, 41:4047–54.
[65] Andrady AL, Pecram JE. (1991). Weathering of Polystyrene Foam on Exposure in Air and in Seawater. Journal of Applied Polymer Science, 42:1589–96.
[66] Leng JS, Lv HB, Liu YJ, Du SY. (2008). Comment on “Water-driven programable polyurethane shape memory polymer: Demonstration and mechanism. Applied Physics Letter, 86: paper No. 114105.”. Applied Physics Letter, 92: paper No. 206105.
[67] Huang WM, Yang B. (2005). Water-driven programmable polyurethane shape memory polymer: Demonstration and mechanism. Applied Physics Letter, 86: paper No. 114105.
[68] Behl M, Lendlein A. (2007). Shape-memory polymers. Materials Today, 10: 20–8. [69] Adrien J, Maire E, Gimenez N, Sauvant-Moynot V. (2007). Experimental study of the
compression behaviour of syntactic foams by in situ X-ray tomography. Acta Materila, 55: 1667–1679.
[70] Avanzini A. (2008). Mechanical characterization and finite element modelling of cyclic stress–strain behaviour of ultra high molecular weight polyethylene. Materials & Design, 29: 330–343.
[71] Sivaprasad S, Paul SK, Narasaiah N, Tarafder S. (2010). Experimental investigation on cyclic deformation behaviour of primary heat transport piping materials: Masing analysis of hysteresis loops. Transactions of the Indian Institute of Metals, 63: 559–563.
[72] Shen Y, Golnaraghi F, Plumtree A. (2001). Modelling compressive cyclic stress–strain behaviour of structural foam. International Journal of Fatigue, 23: 491–497.
[73] Kitagawa M, Qui J, Nishida K, Yoneyama T. (1992). Cyclic stress-strain curves at finite strains under high pressures in crystalline polymers. Journal of Materials Science, 27: 1449–1456.
[74] Khonakdar HA, Jafari SH, Rasouli S, Morshedian J, Abedini H. (2007). Investigation
114
and Modeling of Temperature Dependence Recovery Behavior of Shape-Memory Crosslinked Polyethylene. Macromolecular Theory and Simulation, 16: 43–52.
[75] Kanny K, Muhfuz H, Carlsson LA, Thomas T, Jeelani S. (2002). Dynamic mechanical analyses and flexural fatigue of PVC foams. Composite Structures, 58: 175–183.
[76] Bezazi A, Scarpa F. (2007). Mechanical behaviour of conventional and negative Poisson’s ratio thermoplastic polyurethane foams under compressive cyclic loading. International Journal of Fatigue, 29: 922–930.
[77] Bledzki AK, Gassan J, Kurek K. (1997). The Accumulated Dissipated Energy of Composites under Cyclic-dynamic Stress. Experimental Mechanics, 37: 324–327.
[78] Wouterson EM, Boey FYC, Hu X, Wong SC. (2005). Specific properties and fracture toughness of syntactic foam: Effect of foam microstructures. Composites Science and Technology, 65: 1840–1850.
[79] Boyce MC, Parks DM, Argon AS. (1988). Large inelastic deformation of glassy polymers: Rate dependent constitutive model, Mechanics of Materials, 7: 15–33.
[80] Xu T. and Li G. (2011). A shape memory polymer based syntactic foam with negative Poisson’s ratio. Materials Science and Engineering A, 528: 6804-6811.
[81] Li G. and Xu W. (2011). Thermomechanical behavior of thermoset shape memory polymer programmed by cold-compression: testing and constitutive modeling. Journal of the Mechanics and Physics of Solids, 59: 1231–1250.
[82] Xu W. and Li G. (2011). Thermoviscoplastic modeling and testing of shape memory polymer based self-healing syntactic foam programmed at glassy temperature. ASME Journal of Applied Mechanics, 78: paper number 061017 (14 pages).
[83] Xu T. and Li G. (2011). Cyclic stress–strain behavior of shape memory polymer based syntactic foam programmed by 2-D stress condition. Polymer, 52: 4571-4580.
[84] Xu T. and Li G. (2011). Durability of shape memory polymer based syntactic foam under accelerated hydrolytic ageing. Materials Science and Engineering A, 528: 7444-7450.
[85] Sun L. and Huang W.M. (2010). Mechanisms of the multi-shape memory effect and temperature memory effect in shape memory polymer. Soft Matter, 6, 4403–4406.