final report for - element · pdf fileproject name document name 1 cost and performance of ev...
TRANSCRIPT
Project Name Document Name
1
Cost and performance
of EV batteries
Final report
for
The Committee on
Climate Change
21/03/2012
Element Energy Limited
20 Station Road
Cambridge CB1 2JD
Tel: 01223 227764
Fax: 01223 353 475
Cost and performance of EV batteries
Executive summary
Background
Deep decarbonisation of the road transport sector can only be achieved through the
introduction of electrified drivetrains. A key component within an electric vehicle (EV) in
terms of overall cost and performance is the battery.
The Committee on Climate Change commissioned Element Energy, Axeon and Prof. Peter
Bruce of EastChem to investigate the future trajectory of batteries cost and performance.
This report describes the current state of development and cost of batteries, before
mapping the future cost and performance of lithium-ion batteries out to 2030. The
trajectory of battery technology beyond 2030 is investigated through the study of lithium-air
batteries, currently the most promising post lithium-ion battery.
Current lithium-ion batteries: performance
A range of battery chemistries have been deployed in EVs, most notably the use of nickel
metal hydride in the Toyota Prius. However energy density has emerged as the most
important metric in battery design, leading to lithium family chemistries becoming the
dominant chemistry for pure and Plug in Hybrid EV (PHEV) applications.
Currently, cells suitable for transport applications typically have an energy density of 100-
180Wh/kg, are available at a capacity of 40 Ah/cell, and (with careful thermal and
operational management) may achieve 10 years of life in automotive operation.
Automotive cells cost ca. $400/kWh but the actual cost of the battery system is higher due
to the need for electronic and thermal management. The whole battery system including
cells, structural support, thermal management and electronic balance, is called the battery
pack. The cost of a battery pack for a pure EV is approximately $800/kWh, i.e. double the
cost of the cells alone.
Automotive cells represent only a marginal share (<5%) of the rechargeable lithium-ion
cells market. The largest market is consumer electronics, such as batteries for laptops and
phones. Consumer cells are smaller and have less stringent performance specifications
than automotive cells in terms of power, battery life and safety. Small consumer cells cost
under 250$/kWh, but these figures do not translate directly to automotive cells because of
their more stringent requirements and the engineering challenge of manufacturing large
cells.
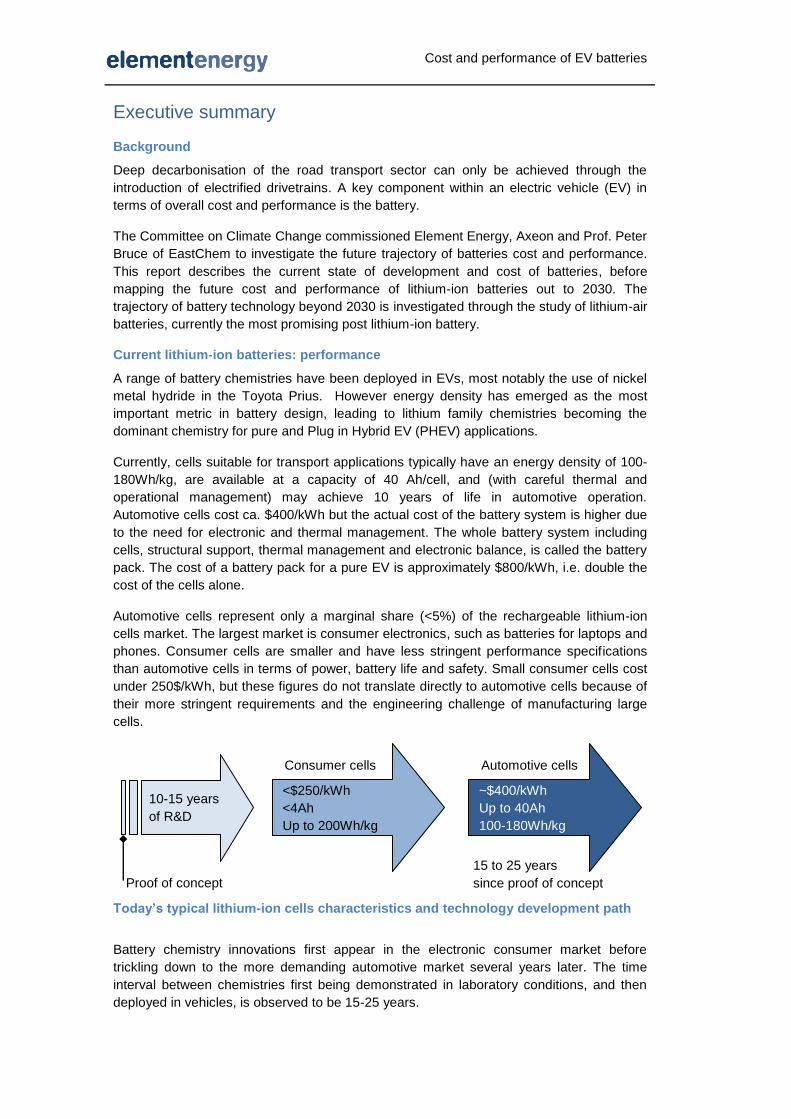
Today’s typical lithium-ion cells characteristics and technology development path
Battery chemistry innovations first appear in the electronic consumer market before
trickling down to the more demanding automotive market several years later. The time
interval between chemistries first being demonstrated in laboratory conditions, and then
deployed in vehicles, is observed to be 15-25 years.
15 to 25 years
since proof of concept
Consumer cells
10-15 years
of R&D
<$250/kWh
<4Ah
Up to 200Wh/kg
Automotive cells
~$400/kWh
Up to 40Ah
100-180Wh/kg
Proof of concept
Cost and performance of EV batteries
This indicates that out to 2020, step-change improvements in performance of automotive
batteries are highly unlikely to occur as there are no “breakthrough” technologies
approaching the consumer market today.
Future lithium-ion batteries: performance
Much of the current R&D is on improving the energy density of cells via new chemistries.
As well as greater vehicle range, increasing energy density has the potential to reduce
costs as a result of less material per kWh and fewer cells to monitor. Two routes are being
pursued to improve energy density: developing electrode materials with higher capacity
(mAh/g); or developing cells using higher voltage chemistry.
Next-generation technologies delivering higher specific energy are likely to be nickel cobalt
manganese and composite cathodes and high capacity anodes (silicon), estimated to be
available in a series vehicle ca. 2020. Higher voltage cathode chemistries are expected to
follow.
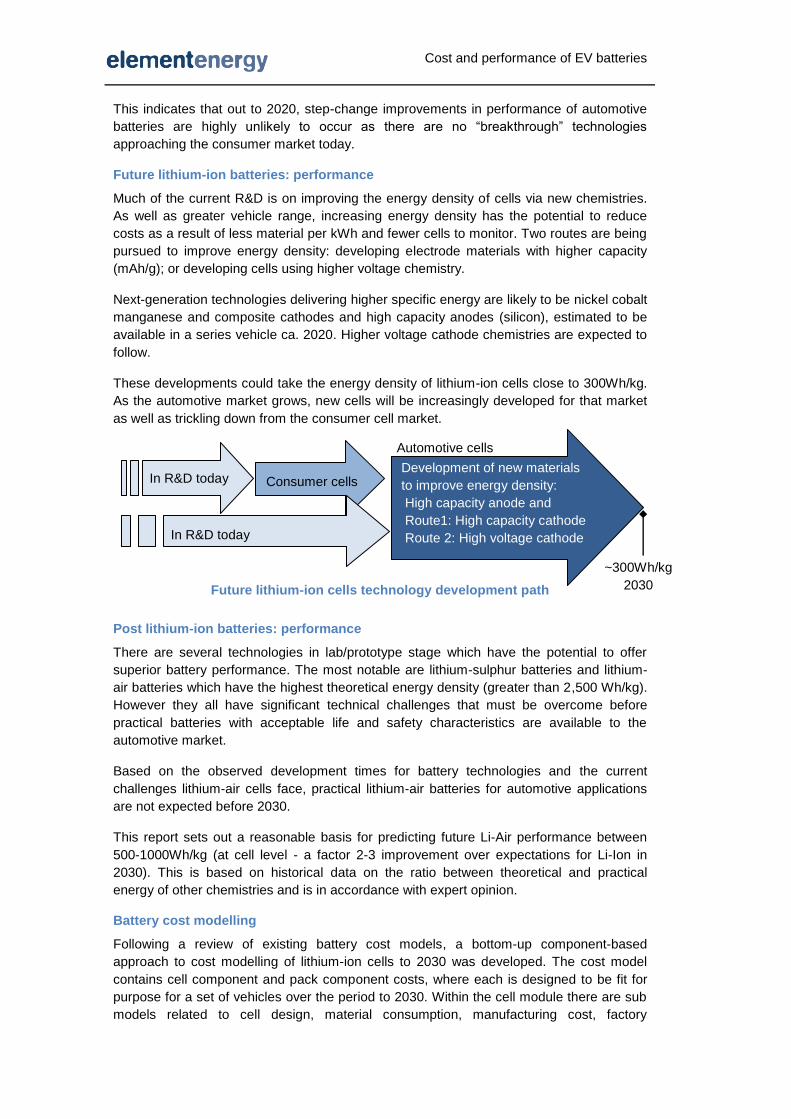
These developments could take the energy density of lithium-ion cells close to 300Wh/kg.
As the automotive market grows, new cells will be increasingly developed for that market
as well as trickling down from the consumer cell market.
Future lithium-ion cells technology development path
Post lithium-ion batteries: performance
There are several technologies in lab/prototype stage which have the potential to offer
superior battery performance. The most notable are lithium-sulphur batteries and lithium-
air batteries which have the highest theoretical energy density (greater than 2,500 Wh/kg).
However they all have significant technical challenges that must be overcome before
practical batteries with acceptable life and safety characteristics are available to the
automotive market.
Based on the observed development times for battery technologies and the current
challenges lithium-air cells face, practical lithium-air batteries for automotive applications
are not expected before 2030.
This report sets out a reasonable basis for predicting future Li-Air performance between
500-1000Wh/kg (at cell level - a factor 2-3 improvement over expectations for Li-Ion in
2030). This is based on historical data on the ratio between theoretical and practical
energy of other chemistries and is in accordance with expert opinion.
Battery cost modelling
Following a review of existing battery cost models, a bottom-up component-based
approach to cost modelling of lithium-ion cells to 2030 was developed. The cost model
contains cell component and pack component costs, where each is designed to be fit for
purpose for a set of vehicles over the period to 2030. Within the cell module there are sub
models related to cell design, material consumption, manufacturing cost, factory
In R&D today
Consumer cells
Automotive cells
Development of new materials
to improve energy density:
High capacity anode and
Route1: High capacity cathode
Route 2: High voltage cathode
In R&D today
~300Wh/kg
2030

Cost and performance of EV batteries
throughput and overheads. The packing cost module represents physical supports,
environmental control, wiring, battery management system and power electronics. Post
2030 cost projections are based on cost estimates of lithium-air batteries.
Two main cost drivers have been identified:
The improvement in material properties delivering higher energy densities
The improvement in material properties is represented through a detailed technology
roadmap of lithium-ion cathode and anode characteristics up to 2030, developed from a
review of current R&D efforts and progress.
The scaling up in production of large cell formats
Cost improvements occur through increased volumes and cell size standardisation. Pack
assembly – a large contributor to the total pack cost – is also expected to benefit from
increased volume and standardization of components.
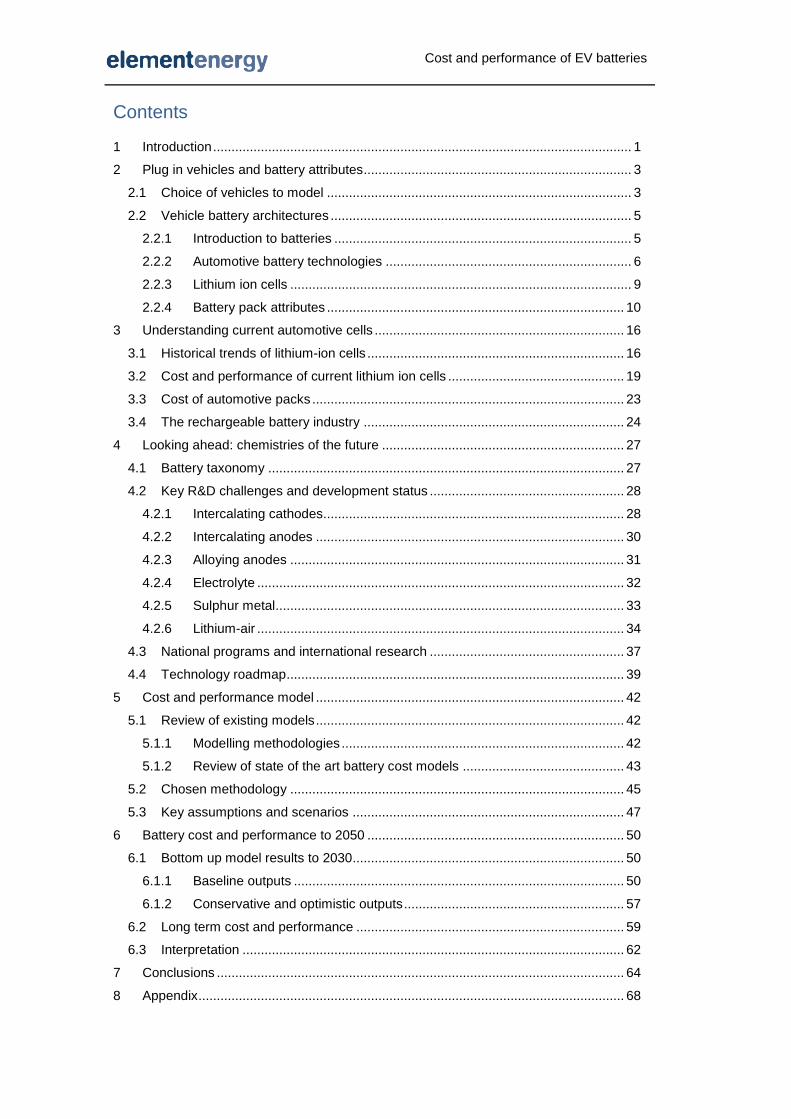
Results
Current costs for a pure EV of ~$800/kWh at pack level translates into a pack cost of
$21,000 for a 2012 medium sized BEV with a range of 150km. In 2030, under a baseline
scenario, this is predicted to drop to $6,400 for a BEV with a range of 250km.
Results for a medium sized pure battery electric car – 30kWh pack
Batteries for PHEVs are more constrained by power density, as the smaller packs have
higher discharge rates during acceleration. It results in a higher cost per kWh for a PHEV
compared to pure battery electric vehicle.
Lithium air batteries (if successfully deployed) can bring cost savings at the cell level.
However this saving is reduced by the increased cost of packing arising from the lower cell
voltage and the requirement for more air management. Our cost modelling suggests that in
the long term, the deployment of Li-air would not be expected to bring a significant cost
reduction on the pack level compared to the advanced lithium-ion batteries expected to be
developed by 2030. However the ca. 50% weight saving which may be expected with Li-air
would have other benefits such as reduced chassis weight and better performance.
Barriers and key challenges
The technology roadmap assumes that lithium-ion chemistries will reach their highest
practicable energy density through the development of high voltage cathodes. There are
significant and fundamental technical challenges to be overcome before these
technologies can be deployed, such as the development of an electrolyte stable at a high
voltage.
The cost benefits brought by high production volume of battery packs are highly
dependent on the uptake of EVs. Looking at the announced new production capacity,
there is a significant risk of over-capacity in the next 5 years if consumers do not take to
the technology; this could stall further investment.
$-
$5,000
$10,000
$15,000
$20,000
$25,000
2011 2020 2030
Tota
l pac
k co
st $
200 kg pack
160 kg pack
300 kg pack
-50% in cost - 30% in mass -70% in cost
- 45% in mass
Cost and performance of EV batteries
Contents
1 Introduction .................................................................................................................. 1
2 Plug in vehicles and battery attributes......................................................................... 3
2.1 Choice of vehicles to model ................................................................................... 3
2.2 Vehicle battery architectures .................................................................................. 5
2.2.1 Introduction to batteries ................................................................................. 5
2.2.2 Automotive battery technologies ................................................................... 6
2.2.3 Lithium ion cells ............................................................................................. 9
2.2.4 Battery pack attributes ................................................................................. 10
3 Understanding current automotive cells .................................................................... 16
3.1 Historical trends of lithium-ion cells ...................................................................... 16
3.2 Cost and performance of current lithium ion cells ................................................ 19
3.3 Cost of automotive packs ..................................................................................... 23
3.4 The rechargeable battery industry ....................................................................... 24
4 Looking ahead: chemistries of the future .................................................................. 27
4.1 Battery taxonomy ................................................................................................. 27
4.2 Key R&D challenges and development status ..................................................... 28
4.2.1 Intercalating cathodes.................................................................................. 28
4.2.2 Intercalating anodes .................................................................................... 30
4.2.3 Alloying anodes ........................................................................................... 31
4.2.4 Electrolyte .................................................................................................... 32
4.2.5 Sulphur metal ............................................................................................... 33
4.2.6 Lithium-air .................................................................................................... 34
4.3 National programs and international research ..................................................... 37
4.4 Technology roadmap ............................................................................................ 39
5 Cost and performance model .................................................................................... 42
5.1 Review of existing models .................................................................................... 42
5.1.1 Modelling methodologies ............................................................................. 42
5.1.2 Review of state of the art battery cost models ............................................ 43
5.2 Chosen methodology ........................................................................................... 45
5.3 Key assumptions and scenarios .......................................................................... 47
6 Battery cost and performance to 2050 ...................................................................... 50
6.1 Bottom up model results to 2030.......................................................................... 50
6.1.1 Baseline outputs .......................................................................................... 50
6.1.2 Conservative and optimistic outputs ............................................................ 57
6.2 Long term cost and performance ......................................................................... 59
6.3 Interpretation ........................................................................................................ 62
7 Conclusions ............................................................................................................... 64
8 Appendix .................................................................................................................... 68
Cost and performance of EV batteries
8.1 Vehicle and pack attributes .................................................................................. 68
8.2 Model diagram ...................................................................................................... 71
8.3 Model inputs and assumptions ............................................................................. 72
8.3.1 Cell design ................................................................................................... 72
8.3.2 Technology roadmap of active materials ..................................................... 74
8.3.3 Cell material costs ....................................................................................... 75
8.3.4 Cell production cost ..................................................................................... 79
8.3.5 Pack assembly ............................................................................................. 81
8.3.6 Other costs ................................................................................................. 83
8.4 Cost sensitivity ..................................................................................................... 84
8.5 Model results to 2030 ........................................................................................... 86
8.5.1 Baseline results ........................................................................................... 86
8.5.2 Conservative scenario results ..................................................................... 90
8.5.3 Optimistic scenario results ........................................................................... 91

Cost and performance of EV batteries
Authors
For comments or queries please contact:
Celine Cluzel
Tel: +44 (0) 330 119 0984
Craig Douglas
Reviewers
Shane Slater, Director, Element Energy
Prof. P. G. Bruce FRS, FRSE, School of Chemistry, University of St Andrews
George Paterson, Director of Sales, Axeon
Dr Valentina Gentili, Electrochemical Engineer, Axeon
Dr Allan Paterson, Senior Electrochemical Engineer, Axeon
Acknowledgements
The authors would like to thank Oxis Energy, and many cell suppliers and cell material
suppliers (who would like to remain anonymous) for sparing some of their time to give
insights on their industry. The authors also thank the Argonne National Laboratory team
and German Aerospace Centre team who have both developed battery cost models and
shared some of their methodology choices.

Cost and performance of EV batteries
Acronyms and terminology
ANL Argonne National Laboratory
Anode The electrode of a cell at which oxidation occurs. By convention this is the
negative electrode and is the electrode that electric current flows into (and
electrons flow out of) at discharge. It is typically carbon based.
BEV Battery Electric Vehicle. A pure battery electric vehicle contains a battery and
an electric motor only. The vehicle is charged by mains electricity. Examples
include the Nissan Leaf and Mitsubishi i-MIEV.
BMS Battery Management System
BOM Bill of materials
CAPEX Capital Expenditure
Cathode The electrode of a cell at which reduction occurs, by convention this is the
positive electrode and is the electrode that electric current flows out of (and
electrons flow into) at discharge.
CCC Committee on Climate Change
CGGC Centre on Globalization, Governance & Competitiveness
DC Direct Current
DECC Department of Energy and Climate Change
DfT Department for Transport
DLR German Aerospace Centre
DOD Depth of discharge
DoE Department of Energy (of United States)
EastChem The Edinburg And St Andrews research school of Chemistry
EE Element Energy
EPRI Electric Power Research Institute
ESW Electrolyte Stability Window
EV Electric Vehicle
FC Fuel Cell
ICE Internal Combustion Engine
IP Intellectual Property
kW Kilowatt (unit of power)
kWh Kilowatt hour (unit of energy, 3.6MJ)
LCO Lithium Cobalt Oxide. Cathode active material
LFP Lithium Iron Phosphate. Cathode active material
LL Layered-layered. Type of cathode active material
LMO Lithium Manganese Oxide. Cathode active material
LMP Lithium Manganese Phosphate. Cathode active material

Cost and performance of EV batteries
Low CVP Low Carbon Vehicle Partnership
LTO Lithium Titanate Oxide. Anode active material
MIT Massachusetts Institute of Technology
MPV Multi Purpose Vehicle
NEDC New European Drive Cycle
NMC Nickel Manganese Cobalt. Cathode active material
OEM Original Equipment Manufacturer
PHEV Plug in hybrid electric vehicle. A PHEV can be charged from mains electricity
and runs in electric mode until the battery is depleted (or high power is
demanded), at which point the ICE takes over. An example of this vehicle is
the Toyota Plug-in Prius.
PIV Plug In Vehicle
R&D Research and Development
REEV Range Extender EV
SEI Solid Electrolyte Interface
SMMT Society of Motor Manufacturers and Traders
SOC State of charge
TCO Total Cost of Ownership
UK United Kingdom
US ABC United States Advanced Battery Consortium
Cost and performance of EV batteries
1
1 Introduction
Background
The Committee on Climate Change (CCC) was established in 2008 to advise the UK
Government on climate change issues, and particularly the setting of carbon budgets and
the scope of those budgets. In its first report published in 2008, the Committee concluded
that the UK should aim to reduce Kyoto greenhouse gas emissions by at least 80% below
the 1990 levels by 2050.
A key consideration for the CCC in recommending the level of carbon budgets is the cost-
effectiveness of the abatement technologies needed to achieve them, relative to DECC’s
carbon prices.
When looking at the road transport sector, the potential for improvement of internal
combustion engines (ICEs) and the potential of biofuels are not enough to achieve deep
levels of decarbonisation of the road transport sector. This can only be achieved through
the introduction of electrified drivetrains. The battery is the key component within an
electric vehicle (EV) which determines its overall capital cost and performance. Therefore,
the task of determining the cost-effectiveness of EVs is predominantly one of identifying
the future trajectory of battery cost and performance.
Objectives of the work
In this context, the CCC appointed Element Energy to develop a model and thereby a
roadmap of battery cost and performance for a selection of EV applications, from now to
2050. This work provides insight on cost reduction drivers as well as barriers. Element
Energy leads a team including Axeon and Professor Peter Bruce, Professor of Chemistry
at the EaStCHEM.
The findings of this work will be used by the CCC in their analysis of the relative cost of
ownership of different types of vehicle over the medium-term (to 2020 and 2030) as well
as supporting their recommendations on the types of vehicle that are most likely to deliver
cost-effective emissions reductions over the longer term (to 2050).
Methodology
The approach taken is a bottom up, component based model of battery cost, which takes
in consideration likely improvements in the current battery technologies, up to 2030.
Longer term costs are estimated based on the best – in terms of prospective energy
density – future battery technology.
Structure of the report
Section 3 introduces the plug-in vehicles chosen to represent the UK market, and gives a
general introduction to batteries and their attributes.
Section 4 presents current automotive batteries in terms of performance and costs. A
short presentation of the historical development of lithium-ion batteries, for applications
other than transport, is used to give an insight on the potential speed of development of
new automotive batteries.
In section 5, prospective battery improvements or new chemistries are presented in terms
of key R&D challenges and development status. This review, along with main national
research programs and insights gathered from historical battery development, is used to
inform the technology roadmap of the model (speed of battery technology improvement).

Cost and performance of EV batteries
2
Section 6 describes the model methodology, which was developed after a review of
existing models, as well as key assumptions, while results are outlined in section 7.
Detailed model input data and supplementary results data have been placed in the
Appendix.
Note on currency: some costs are expressed in US dollars ($) as it is the currency used in
international trade and it allows our results to be compared with results published by other
sources. An exchange rate of £1=$1.5 is used. Future costs are expressed in today’s
prices.
About the authors and reviewers
Element Energy is a consultancy specialising in low carbon energy technologies. Element
Energy has conducted innovative analyses of low carbon road transport, from cost
analysis, recharging infrastructure analysis and consumer preference modelling. Element
Energy has led the collaborative team effort involving Axeon and Professor Peter Bruce.
Axeon is Europe’s largest independent supplier of automotive battery systems, working
with a large number of cell suppliers. Axeon’s primary input to this project has been
helping to develop cost models for battery assembly, provide data on cost and
performance of current batteries as well as provide links with cell manufacturers to ensure
the cell cost and performance models are accurate.
Peter Bruce is Professor of Chemistry at the EaStCHEM (Edinburgh and St. Andrews
Research School of Chemistry). His group is a recognised leader in the electrochemistry
of energy storage devices, with a significant body of research on lithium-based batteries.
Prof. Bruce provided the technical insight to understand the scientific challenges limiting
battery performance.
Cost and performance of EV batteries
3
2 Plug in vehicles and battery attributes
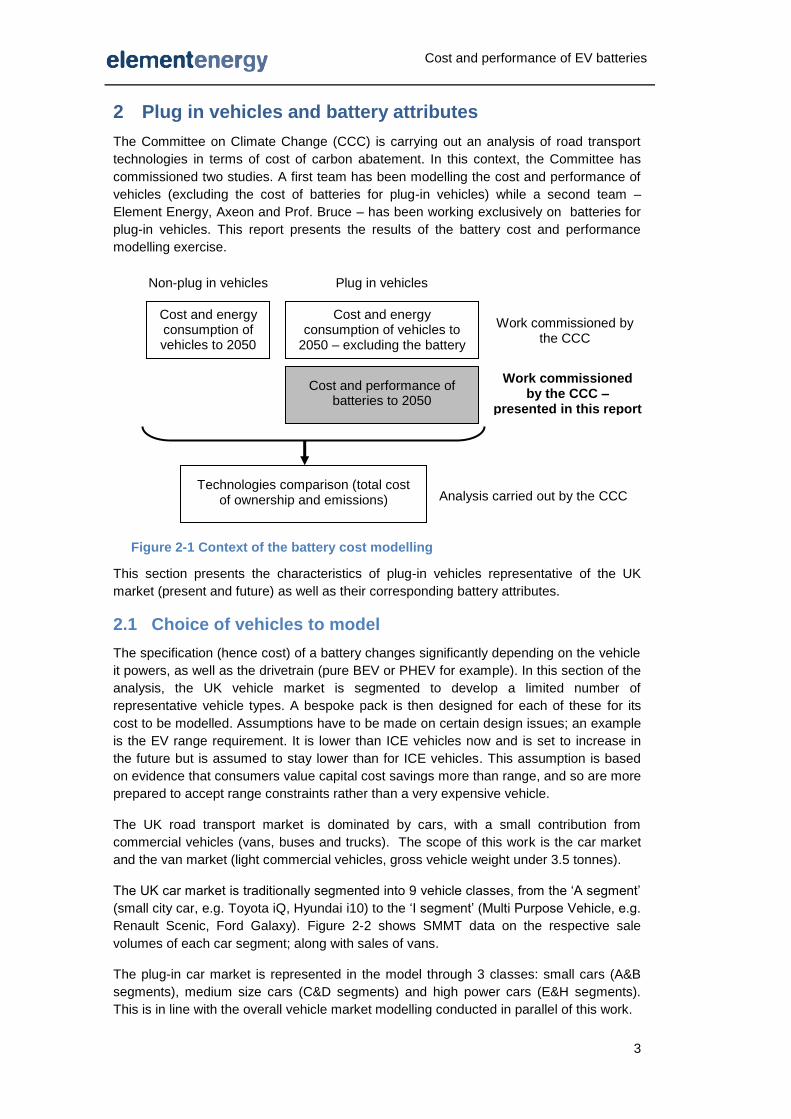
The Committee on Climate Change (CCC) is carrying out an analysis of road transport
technologies in terms of cost of carbon abatement. In this context, the Committee has
commissioned two studies. A first team has been modelling the cost and performance of
vehicles (excluding the cost of batteries for plug-in vehicles) while a second team –
Element Energy, Axeon and Prof. Bruce – has been working exclusively on batteries for
plug-in vehicles. This report presents the results of the battery cost and performance
modelling exercise.
This section presents the characteristics of plug-in vehicles representative of the UK
market (present and future) as well as their corresponding battery attributes.
2.1 Choice of vehicles to model
The specification (hence cost) of a battery changes significantly depending on the vehicle
it powers, as well as the drivetrain (pure BEV or PHEV for example). In this section of the
analysis, the UK vehicle market is segmented to develop a limited number of
representative vehicle types. A bespoke pack is then designed for each of these for its
cost to be modelled. Assumptions have to be made on certain design issues; an example
is the EV range requirement. It is lower than ICE vehicles now and is set to increase in
the future but is assumed to stay lower than for ICE vehicles. This assumption is based
on evidence that consumers value capital cost savings more than range, and so are more
prepared to accept range constraints rather than a very expensive vehicle.
The UK road transport market is dominated by cars, with a small contribution from
commercial vehicles (vans, buses and trucks). The scope of this work is the car market
and the van market (light commercial vehicles, gross vehicle weight under 3.5 tonnes).
The UK car market is traditionally segmented into 9 vehicle classes, from the ‘A segment’
(small city car, e.g. Toyota iQ, Hyundai i10) to the ‘I segment’ (Multi Purpose Vehicle, e.g.
Renault Scenic, Ford Galaxy). Figure 2-2 shows SMMT data on the respective sale
volumes of each car segment; along with sales of vans.
The plug-in car market is represented in the model through 3 classes: small cars (A&B
segments), medium size cars (C&D segments) and high power cars (E&H segments).
This is in line with the overall vehicle market modelling conducted in parallel of this work.
Figure 2-1 Context of the battery cost modelling
Cost and energy consumption of vehicles to 2050
Cost and energy consumption of vehicles to
2050 – excluding the battery cost
Non-plug in vehicles Plug in vehicles
Work commissioned by the CCC
Cost and performance of batteries to 2050
Work commissioned by the CCC –
presented in this report
Technologies comparison (total cost of ownership and emissions) Analysis carried out by the CCC
Cost and performance of EV batteries
4
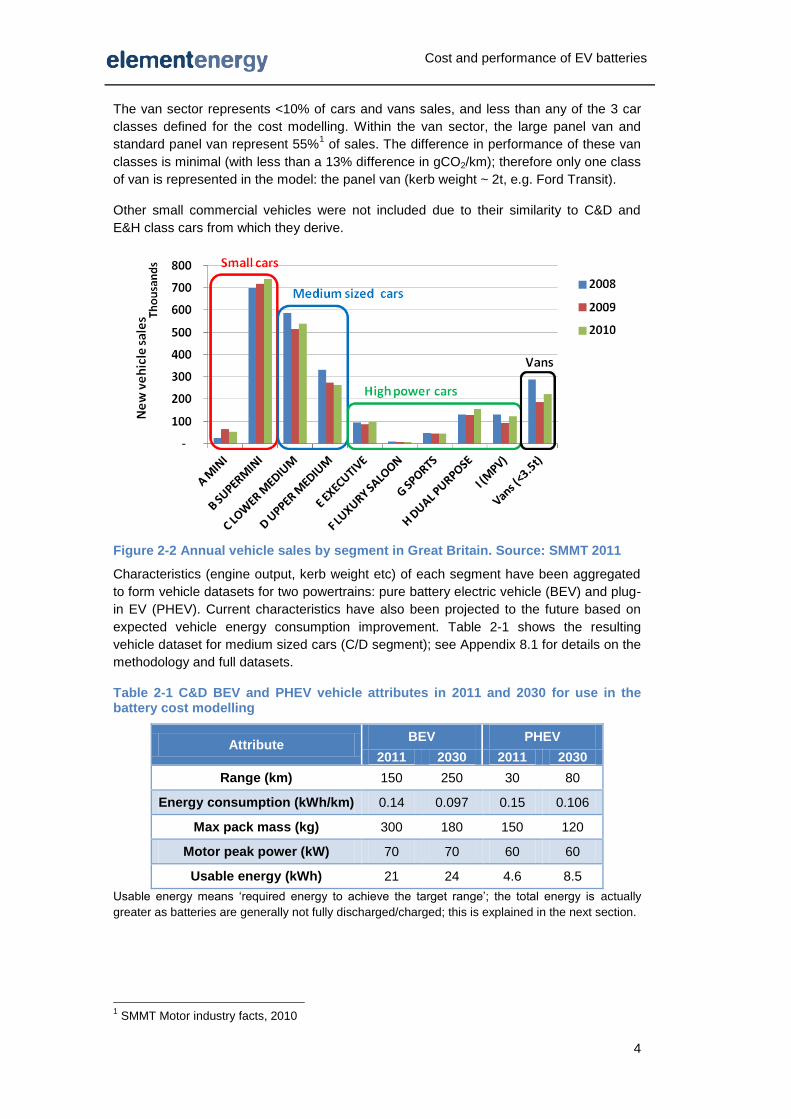
The van sector represents <10% of cars and vans sales, and less than any of the 3 car
classes defined for the cost modelling. Within the van sector, the large panel van and
standard panel van represent 55%1 of sales. The difference in performance of these van
classes is minimal (with less than a 13% difference in gCO2/km); therefore only one class
of van is represented in the model: the panel van (kerb weight ~ 2t, e.g. Ford Transit).
Other small commercial vehicles were not included due to their similarity to C&D and
E&H class cars from which they derive.
Figure 2-2 Annual vehicle sales by segment in Great Britain. Source: SMMT 2011
Characteristics (engine output, kerb weight etc) of each segment have been aggregated
to form vehicle datasets for two powertrains: pure battery electric vehicle (BEV) and plug-
in EV (PHEV). Current characteristics have also been projected to the future based on
expected vehicle energy consumption improvement. Table 2-1 shows the resulting
vehicle dataset for medium sized cars (C/D segment); see Appendix 8.1 for details on the
methodology and full datasets.
Table 2-1 C&D BEV and PHEV vehicle attributes in 2011 and 2030 for use in the battery cost modelling
Attribute BEV PHEV
2011 2030 2011 2030
Range (km) 150 250 30 80
Energy consumption (kWh/km) 0.14 0.097 0.15 0.106
Max pack mass (kg) 300 180 150 120
Motor peak power (kW) 70 70 60 60
Usable energy (kWh) 21 24 4.6 8.5
Usable energy means ‘required energy to achieve the target range’; the total energy is actually
greater as batteries are generally not fully discharged/charged; this is explained in the next section.
1 SMMT Motor industry facts, 2010

Cost and performance of EV batteries
5
2.2 Vehicle battery architectures
Figure 2-3 provides an example of an automotive battery pack. A pack is composed of a
large number of cells. As cells have a relatively low voltage (between 1.5-4V) and limited
capacity, these cells are arranged in series (to increase the overall voltage to a usable
level) and in parallel. Cells may be arranged into relatively self-contained modules which
themselves are arranged in series and parallel as required by the vehicle drivetrain.
The sections below first provide an overview of cells and their architecture, followed by
the rest of the pack elements.
Figure 2-3 Example of a battery pack. Source: Axeon guide to batteries
2.2.1 Introduction to batteries
All batteries consist of:
two electrodes: which supply and collect charge, connected to an external
electrical circuit
an electrolyte: this conducts ions which move between the electrodes (cations
(e.g. H+) and anions (e.g. OH
-)) but it does not conduct electrons, which must
instead flow through an external circuit.
chemical fuel: two species (elements or compounds) that spontaneously react
due to a desire to reach a lower energy state (different electro potentials)
In many common batteries, each of the two chemical fuels (solid) is attached to its
corresponding electrode (which is solid), and the two electrodes are immersed in a liquid
electrolyte. However, in general: the electrolyte may be liquid (lead-acid) or a polymer in
liquid (lithium polymer); and the chemical fuel supplied to the electrodes can be solid (e.g.
lead-acid batteries), liquid (flow batteries) or gaseous (Zinc-air or Lithium-Air).
The voltage of the battery is the sum of voltages of the reactions at the anode and
cathode. The battery capacity is set by the mass of reactive materials in the battery, the
quantity of electrons released per mole of material, and the cell voltage.
Battery
Management
System and
power electronics

Cost and performance of EV batteries
6
Table 2-2 Examples oxidation reactions and resulting specific energy.
ff PbO2 Al Li LiCoO2
Molar mass g/mol 239 26.98 6.94 97.87
Electropotential V 1.94 1.66 3.05 4.2
Electron per mol 2 3 1 1
kJ/g 1.57 17.81 42.40 4.41
Wh/kg 435 4,947 11,779 1,150
There are three routes to maximise specific energy at the half reaction level:
High electro potential: combining a highly electronegative and electropositive
species
High stochiometric transfer of electrons, i.e. electrons per mole of reactants
Low molar mass of the participating species
The table above shows that certain species (e.g. pure Lithium) have a very high specific
energy (ca. 12,000Wh/kg is very close to petrol/diesel). However in practice, the achieved
specific energy of a cell may be much less because:
The reactive element may need to be combined with other, heavier elements to
allow the reaction to be reversible (e.g. Li to lithium cobalt oxide LiCoO2)
Only a fraction of the mass of the battery is the reactants (typically between 25-
40%) the rest comprising electrolyte, charge collectors, electrode substrate,
physical containment, and unused/unreacted species.
The battery energy density can be increased by:
Using reacting species with high theoretical energy densities:
e.g. elemental Lithium or Aluminium (ideally) or Hydrogen (Nickel/Metal Hydride)
Better battery design: minimise non-reacting components, reducing the quantity
of electrolyte, e.g. liquid species and thin solid electrolyte (ZEBRA batteries)
Sourcing the oxidising species from the battery surroundings, e.g. metal-air cells
Taking both of the reacting species from the battery surroundings:
fuel cells, flow batteries (but then the “battery” should include the mass of the
reactant container)
2.2.2 Automotive battery technologies
While lithium ion is emerging as the preferred automotive technology, other technologies
have been deployed in vehicle application. A brief overview of lead-acid, nickel-cadmium
(Ni-Cd), nickel metal hydride (Ni-MH) and molten salt is set out below.
Lead acid
Lead acid batteries are better understood than any other battery types and were used in
the earliest traction vehicles. Their benefits are the very low cost and very high reliability.
However they are limited by a very low specific energy (a practical upper bound is
50Wh/kg) and this has all but excluded their serious consideration in a practical mass
market electric vehicle. This is likely to remain the case, unless users are happy to
accommodate low speeds, very limited ranges (less than 100km) and frequent fast
charging (which the technology is capable of). Lead acid batteries are currently in use in
applications where limited range and speed are not a concern (e.g. golf cart, mobility
scooters, forklifts) and in electric bikes. They are also used in small series electric cars
such as the 2 seater Norwegian Buddy (20-60km range, maximum 80km/h).

Cost and performance of EV batteries
7
Nickel-Cadmium
Ni-Cd batteries were used in EVs in the 90s and early 2000s but have since been banned
for consumer use and vehicle applications by the European Commission in 20062 on
toxicity grounds. They are authorised only for military and medical applications.
Nickel Metal Hydride
Ni-MH batteries currently dominate the (non plug-in) hybrid market but cannot compete
with lithium ion batteries in the plug-in market because of their lower specific energy
(<100Wh/kg against 100-180Wh/kg for current lithium ion cells). Ni-MH batteries have
been used in the most popular hybrid vehicle model – the Toyota Prius – and have
proved reliable. Despite this positive experience, Toyota has turned to lithium-ion
chemistries for their plug-in hybrid model, supporting the argument that higher energy
densities are required to deliver a fit-for-purpose electric vehicle.
Molten salt
These are batteries which operate at elevated temperatures (ca. 300deg. C), and include
sodium sulphur, sodium nickel chloride (e.g. the ZEBRA battery) and lithium iron
sulphide. There has been some deployment in commercial vehicles and the THINK and
Smart (in the first electric version only) cars.
High temperatures are required to keep the metal-salt electrolyte in liquid form and must
be maintained even when the vehicle is not in operation. The energy and CO2 penalty
arising from this can be very substantial, and is a serious drawback to the use of molten
salt batteries as a CO2 reduction technology in vehicles.
Complementary technologies: capacitors and flywheels
A capacitor is an electronic device that stores an electric charge, consisting of one or
more pairs of conductors separated by an insulator. Capacitors are found in common
electronic devices, and are used in circuit boards e.g. to create a time delay circuit, store
a voltage, filter frequencies and block direct current.
Capacitors considered for vehicle applications are much larger and have a much higher
energy density than conventional capacitors. They are “electric double-layer capacitors”,
often called ultracapacitors or supercapacitors.
Capacitors can charge and discharge very quickly; their power density can be 10 times
greater than for a lithium-ion battery. This characteristic makes them a good
complementary technology: using capacitors in tandem with a battery insulates the
battery from high power peaks and helps preserve its life. In practise, the added cost and
complexity of capacitors do not make them an attractive solution for plug-in vehicles3.
They are used in some hybrid vehicles (e.g. BMW 1 fuel cell hybrid vehicle) and there is
on-going work to improve their suitability for use in vehicles and decrease their costs.
Table 2-3 summarises the current status of capacitors. Their low energy density
(<10Wh/kg currently, 20Wh/kg in development versus 100-180Wh/kg for current lithium-
ion cells) disqualifies them as a storage solution for EVs. Although life characteristics are
better than for batteries, capacitors suffer from life limitations too; parameters
accelerating their degradation include: electrical aspects, temperature, vibrations,
pressure and humidity.
2 Directive 2006/66/CE
3 EDAG, Future steel vehicle phase 1 report, 2009
Cost and performance of EV batteries
8
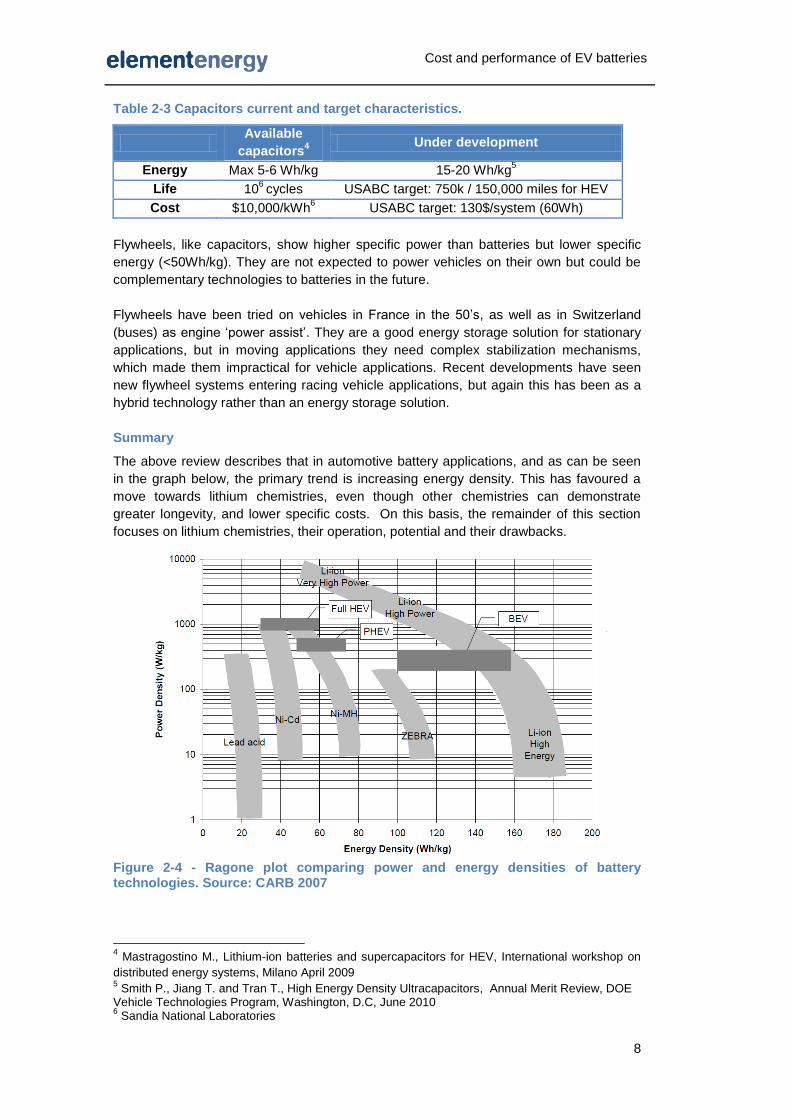
Table 2-3 Capacitors current and target characteristics.
Available
capacitors4
Under development
Energy Max 5-6 Wh/kg 15-20 Wh/kg5
Life 106 cycles USABC target: 750k / 150,000 miles for HEV
Cost $10,000/kWh6 USABC target: 130$/system (60Wh)
Flywheels, like capacitors, show higher specific power than batteries but lower specific
energy (<50Wh/kg). They are not expected to power vehicles on their own but could be
complementary technologies to batteries in the future.
Flywheels have been tried on vehicles in France in the 50’s, as well as in Switzerland
(buses) as engine ‘power assist’. They are a good energy storage solution for stationary
applications, but in moving applications they need complex stabilization mechanisms,
which made them impractical for vehicle applications. Recent developments have seen
new flywheel systems entering racing vehicle applications, but again this has been as a
hybrid technology rather than an energy storage solution.
Summary
The above review describes that in automotive battery applications, and as can be seen
in the graph below, the primary trend is increasing energy density. This has favoured a
move towards lithium chemistries, even though other chemistries can demonstrate
greater longevity, and lower specific costs. On this basis, the remainder of this section
focuses on lithium chemistries, their operation, potential and their drawbacks.
Figure 2-4 - Ragone plot comparing power and energy densities of battery technologies. Source: CARB 2007
4 Mastragostino M., Lithium-ion batteries and supercapacitors for HEV, International workshop on
distributed energy systems, Milano April 2009 5 Smith P., Jiang T. and Tran T., High Energy Density Ultracapacitors, Annual Merit Review, DOE
Vehicle Technologies Program, Washington, D.C, June 2010 6 Sandia National Laboratories

Cost and performance of EV batteries
9
2.2.3 Lithium ion cells
In a Li-ion cell, lithium ions shuttle back and forth between the intercalating electrodes.
The principle of intercalation is the reversible insertion of a guest atom (or molecule) into
a host structure without inducing a major disruption of the host material.
This is represented in the figure below. In operation (discharge cycle), the positive (ions)
and negative (electrons) charges leave the anode for the cathode: the flow of electrons
across a potential difference in the external circuit can be used to do work (e.g. drive a
motor) while the ions move across the electrolyte. In this case the guest atom is the
lithium ion.
Figure 2-5- Schematic of ions (charge and discharge) and electrons (discharge) movements in a lithium ion cell. Source: Axeon
The next figure depicts cell components in more detail:
Figure 2-6 Schematic of lithium ion cell. Source: Axeon

Cost and performance of EV batteries
10
The most common active material for the anode is graphite. Current anode R&D focuses
on developing materials that are safer, and have a higher capacity (charge per unit of
weight) than graphite (~300 mAh/g).
The cathode active material is currently either a lithium metal oxide or lithium iron
phosphate. Current R&D is focussing on improving the reversibility of the active material,
and developing new active materials with higher voltages and/or higher capacity (mAh/g).
The current highest reversible capacity used in commercial cells is approximately
160mAh/g. This is considerably lower than the anode capacity and therefore there is a
greater R&D focus on the cathode than the anode.
Current collectors - also called foils - are made of aluminium at the cathode and copper
at the anode. In the case of a lithium titanate anode the current collector is aluminium
due to higher electrode potential Vs Li.
The separator provides separation of the electrodes while being porous to the
conducting lithium ions. A polymer or solid electrolyte could eliminate the need for an
additional separator, as these can act as both an electrolyte and a separator.
R&D efforts are directed at improving separator stability for safety and reducing separator
thickness. The separator can be coated with a ceramic to improve thermal stability
(developed by German company Evonic).
The electrolyte is liquid (or a polymer/liquid or gel), most typically a lithium salt (e.g.
LiPF6) dissolved in organic solvents that conduct ions. Electrolyte additives can be used
to increase performance or improve cell life and safety (life and safety attributes are
defined in the next section). The challenge of current R&D is to increase the voltage
range the electrolyte can operate over, known as the electrolyte stability window.
Some solid materials could conduct as much as liquid electrolytes, with the advantage of
avoiding leaks. One of the big challenges in using solid material is maintaining surface
contact between electrodes and electrolyte over a wide temperature range, as the
materials in contact have different thermal volume expansion properties.
2.2.4 Battery pack attributes
Cells are assembled in series (to build voltage) and parallel (to build capacity, Ah) into
modules, which in turn are assembled into a pack. The total energy of the pack is the
voltage multiplied by the capacity. The cell voltage for a given type of battery is more or
less constant (e.g. lithium-ion cells are ca. 3-4V), while the capacity will vary based on the
cell design and size. For this reason, when pack assemblers are buying cells, they are
quoted prices in $/Ah rather than $/kWh and the battery capacity (Ah) is sometimes
quoted rather than its energy (kWh).
The pack components ensure the cells are performing at their best, and they are briefly
described here:
Battery Management System (BMS): an assembly of circuit boards that monitor
the cells (e.g. temperature, voltage), and monitors the whole pack to determine
state of health and state of charge. It ensures the safety of the pack and
interfaces with the vehicle electronics and charger. Its cost increases with the
number of cells it has to monitor.
Power electronics distribute the high currents and include safety devices:
shunts, fuses, contactors and safety disconnect. Note that these are distinct
from the power electronic devices required on the vehicle that outside of the
Cost and performance of EV batteries
11
pack (e.g. DC-DC conversion for managing voltage/current between a pack and
a motor driver).
Wiring harnesses are made to connect the main controller to the slave
monitoring boards, wiring and connectors (containing copper). Connectors to
the vehicle electronics have to pass automotive standards and sometimes
require high ingress7 protection levels (IP), which contributes to cost.
Internal cell support: made of plastic and/or metal, it holds the cells together to
the correct compression levels and allows a module assembly process. When
the pack is liquid cooled, the cell support is more complex as it acts as a cooling
matrix, e.g. it has a network of groves for the coolant to circulate through.
Temperature control: heating, cooling, heatsinks, fans, etc. Maintaining the
battery pack in the optimum temperature window is essential to maintaining and
extending battery life. For battery packs to be global products, both cooling and
heating are needed. Cooling can be active or passive. In active cooling, a fluid
(water, another liquid or air) cools the cell surface with forced circulation. In
passive cooling, excess heat is dissipated from the side of the cell or pack
without forced ventilation.
Delivering energy (kWh) and power (kW) are the first two obvious functions of a battery.
There are, however, other attributes crucial to the viability of an electric vehicle. This
section gives a short description of a selection of battery pack attributes and how they
relate to its cost and performance in the cost modelling.
Energy
In the model, the usable energy (kWh) for a given vehicle is defined by the energy
consumption and target vehicle range, for example a segment C&D car is fitted with
23kWh (useable energy) pack to deliver a 150 km range (from Table 2-1, page 4).
The total energy of the pack is however always higher: the full window of charge is not
used. A state of charge (SOC) of 100% and a depth of discharge (DOD) of 100%8 are
avoided for several reasons:
To meet power requirements: batteries have lower discharge power at low SOC
and lower charge power at high SOC.
To reduce safety risks: limiting the maximum SOC avoids overcharge situations.
To maximise the battery life: lowering the DOD window extends the battery cycle
life. Some chemistries (e.g. manganese oxides) degrade when fully charged or
fully discharged, due to chemical reactions with the electrolyte or cathode
material. Calendar life is also affected by the maximum SOC (see below for
definitions of cycle and calendar life).
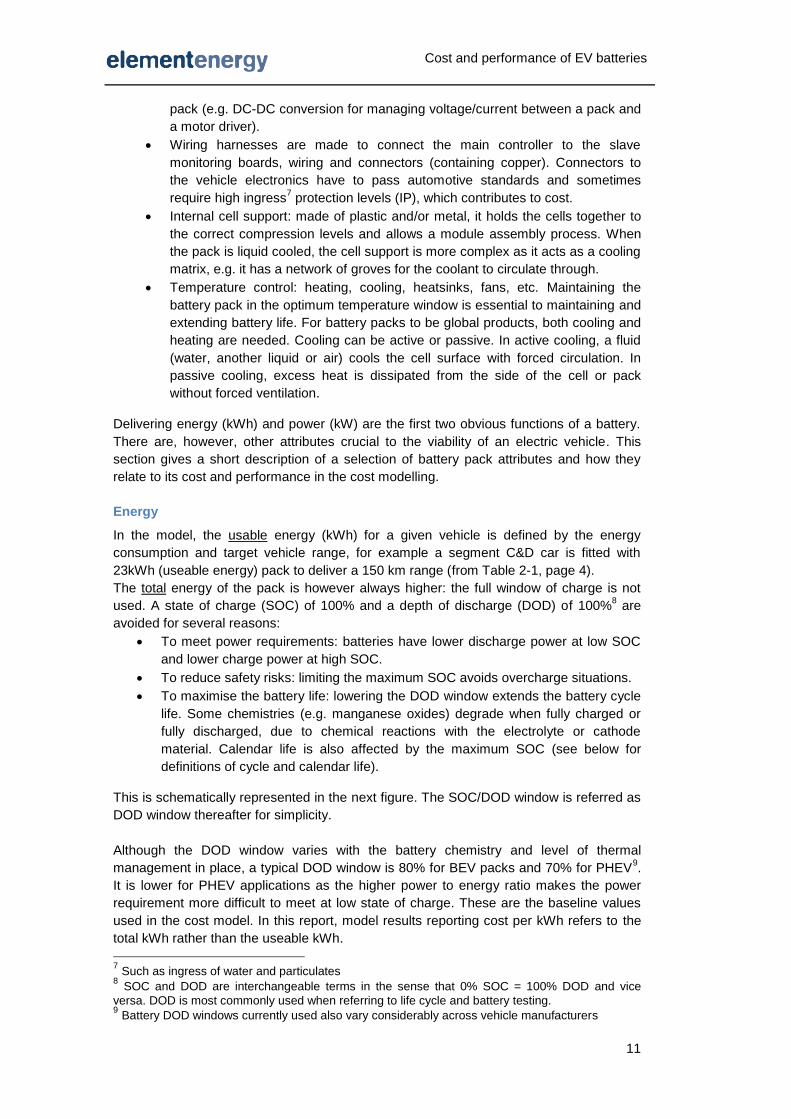
This is schematically represented in the next figure. The SOC/DOD window is referred as
DOD window thereafter for simplicity.
Although the DOD window varies with the battery chemistry and level of thermal
management in place, a typical DOD window is 80% for BEV packs and 70% for PHEV9.
It is lower for PHEV applications as the higher power to energy ratio makes the power
requirement more difficult to meet at low state of charge. These are the baseline values
used in the cost model. In this report, model results reporting cost per kWh refers to the
total kWh rather than the useable kWh.
7 Such as ingress of water and particulates
8 SOC and DOD are interchangeable terms in the sense that 0% SOC = 100% DOD and vice
versa. DOD is most commonly used when referring to life cycle and battery testing. 9 Battery DOD windows currently used also vary considerably across vehicle manufacturers
Cost and performance of EV batteries
12
Figure 2-7 Illustration of a battery with 80% DOD/SOC window
Power
The power (kW) a battery can deliver depends on the intrinsic properties of the chemistry
(kinetics of particles involved), it varies across the SOC and is defined for different time
intervals (continuous and peak, e.g. 2s). Power is the measure of how quickly the battery
can release its energy. The battery power output informs the thermal management
demand.
In operation, a power based battery may also be used with a constrained SOC window to
ensure that the maximum charge and discharge performance is achieved across the
entire usable energy window. Different chemistries have different degrees of variation of
power capability with state of charge, due to variation in voltage profile and this must be
taken into account when deriving SOC window.
For the purpose of a model looking at future costs, the power requirements of the
modelled packs are defined by the peak motor output (see Appendix 8.1 for values).
In a BEV pack, the large amount of energy carried for range requirements means the
power requirements can be met easily i.e. the required pack discharge current is
distributed through many/large cells so the power to energy ratio is low. In smaller
capacity PHEV packs, the power to energy ratio is high: the battery cells must discharge
at higher rates. This translates into a different cell design and higher thermal
management demand and ultimately a higher cost per kWh for PHEV packs.
Voltage
The minimum nominal voltage (V) required from a pack today is typically 300 or 350V for
cars, and can be up to 700V for vans. A higher voltage reduces losses in wiring and in
the electric motor. Using packs of lower voltage would be cheaper at battery level but
would effectively move the cost to other parts of the vehicle, e.g. the motor and electronic
control equipment. In the cost model, a 300V pack requirement is assumed in all years.
Battery life
On standing, a battery cell deteriorates even if it is not used; it has a ‘calendar life’. The
ageing is due to chemical side reactions occurring between the electrodes and electrolyte
and any dissolved impurities. The ageing mechanism cannot be stopped, but can be
significantly attenuated through storage at an appropriate temperature range and by the
Battery state of charge (SOC)
/Depth of Discharge (DOD):
0% SOC
100% SOC
0% SOC
100% DOD
100% SOC
0% DOD
Usable
DOD/SOC window
Total battery
energy 29kWh
Usable battery
energy 23kWh
Low discharge power,
overcharge risk, affects life State of charge (SOC)
seen by the driver:
Low discharge
power, affects life

Cost and performance of EV batteries
13
use of additives. Ageing has two outcomes: impedance growth (resulting in lower current
output capability) and capacity (Ah) loss.
A battery also has a ‘cycle life’: it deteriorates when used; some lithium deposits and
reacts, i.e. it will not intercalate at the electrodes and so will not carry charge. The battery
capacity (Ah) is thus reduced. Typically the end of life for vehicular application is defined
as the point when the battery capacity is less than or equal to 80% of its original capacity.
Mechanisms for influencing battery life are well understood, and are similar for all
chemistries, although they affect them to different extents. EV OEMs minimise the
temperature impact through thermal management of the battery pack (e.g. forced air,
liquid cooled) and they do not allow a full DOD window on the pack, i.e. they oversize the
pack.
Table 2-4 lists the parameters influencing battery life and gives the life requirement as
defined by the USABC (United States Advanced Battery Consortium, consortium of US
car OEMs involved in battery research funding).
Battery life is critical for the economics of EVs both in terms of total cost of ownership but
also in terms of the environmental impact10
; both would greatly be affected if the battery
must be replaced before the vehicle end of life.
Table 2-4 Battery life dependencies and typical requirements
Calendar life Cycle life
Temperature
impact High temperatures decrease life.
SOC / DOD
Impact
Voltage / SOC
A lower voltage is better for life.
Battery cells are not stored at full
SOC before being assembled into
a pack.
DOD
Cycle life has a strong relationship
with depth of discharge: the lower
the DOD, the longer the cycle life.
USABC
/DoE goals
15 years PHEV
10 years BEV
1000 to 80% DOD, 1600 to 50%
DOD, 2670 to 30% DOD
Safety
Lithium-ion batteries have several failure mechanisms that can lead to thermal runaway11
and thus cause a safety hazard. A thermal runaway can start from a sufficiently large
internal short circuit or, following a shock, from deposited lithium that becomes very
reactive. As cells contain combustible materials, in particular the electrolyte, a fire can
develop.
There have been incidents in the past with lithium ion cells that have resulted in large
scale and costly recalls of laptop batteries. Sony had to recall 340,000 laptop batteries in
2006 in the US alone, after overheating batteries caused property damage and minor
10
See DOI: 10.1021/es903729a for a life cycle analysis of EVs 11
Increase in temperature resulting in an increase reaction rate and net release of energy,
increasing the temperature further.
Cost and performance of EV batteries
14
burns12
. No serious injuries have been caused by small battery pack thermal runaway,
but with a large vehicle pack the consequences could be more dramatic. This is why the
safety of battery cells is a prime concern for car OEMs.
Separators – which separate the electrodes and thus prevent short circuits – play a key
role in terms of safety13
. A lot of improvement work is taking place, for example
preventing their softening at high temperatures. Evonik pioneered ceramic coatings to
give better temperature stability. However this is not enough to make a cell perfectly safe.
The quality of the electrode is the key to minimising the growth of dendrites (lithium
deposits) which can push through the separator and thus create an internal short circuit14
.
The Sony laptop battery product recall was not due to inherent safety concerns around Li-
ion cells and the materials themselves, but as a result of detection of metallic particles
due to manufacturing control issue. The metallic particles resulted in increased probability
of dendrite growth and therefore short circuit. Also the chemistry in use at the time
suffered from thermal runaway that could occur at lower battery temperatures and could
occur naturally during discharge in confined spaces. Other Li-ion chemistries are safer, in
that thermal runaway can only happen at more elevated temperatures that are not likely
to occur during normal operation.
Quality manufacturing must be employed to ensure the quality of electrodes and thus
improve cell safety. The quality of electrode manufacturing is defined by minimal variation
of electrode characteristics such as thickness, porosity etc within one batch, and high
repeatability, the ability to produce with high degree of uniformity across batches. Scaling
up from small cells to large cells for EVs scales up the quality control challenge, because
there is the need to control micro particles and ensure uniformity, but over a much bigger
electrode area.
Automotive cell safety demands dictate the need for reduced contaminants in finished
electrodes, i.e. cleaner working environments. Current best clean standards installed in
cell manufacturing are ISO6 (maximum 1million particles ≥ 0.1 µm per m3) while ISO4 or
ISO5 (10,000 and 100,000 particles per m3) levels are needed for safety demands of
automotive cells15
.
Safety concerns at vehicle OEMs level translate into longer vehicle development lead
times, due to cell testing. OEMs test cells assembled in pack in real-life conditions, e.g.
pilot vehicles, for several months to ensure the final product is safe.
Other parameters
Battery packs have other attributes, briefly summarised here:
Operating temperature range, e.g. ca. -5°C to +40°C for today’s packs. For
reference, the USABC minimum goals for long term commercialization are -40°C
to +50°C (20% performance loss permitted) and long term goal -40°C to +85°C.
The cost of technologies (pack thermal control) allowing for such a wide
temperature range are not explicitly estimated in the cost model.
12
Source: U.S. Consumer Product Safety Commission 13
One of the reasons for laptop battery recalls were due to poor (thin) separators 14
Barnett, New safety technologies for lithium-ion cells and batteries, Batteries 2011 conference, Mandelieu, September 2011 15
Quass J., Benhamou E., Keil A., Advances in Battery Electrode Coating, Drying and Solvent Recovery System Design, Batteries 2010 conference, Mandelieu, September 2010
Cost and performance of EV batteries
15
Charging rate: continuous charge rate (commanding pack recharge time) and
pulse rate (regenerative breaking). Current generation batteries are specified at
lower charge rates, but higher discharge rates. This is due to concerns about
safety and the very close control that is required during high charge currents
while ensuring safe operation. Future batteries might be required to handle
charging rates higher than the typical current charging post (3 to 7kW). For
reference, the USABC long term goal is 40-80% SOC in 15 minutes. Charging
rate capabilities are not explicitly modelled.
Volume and mass. In the development of the specification of plug-in vehicles to
model, an indicative maximum pack volume and maximum pack mass have been
defined, see the Appendix 8.1.
Summary
Battery pack cost will be modelled for a selection of vehicles representative of the
UK market: small cars, medium sized cars, high power cars and panel vans.
Current vehicles attributes such as energy consumption are defined based on
existing models while future vehicles attributes account for the expected light
weighting and increased range. Drivetrains considered are pure electric and plug-
in hybrid electric.
The general architecture of a battery has been presented: cells, module, thermal
control and electronics controls.
Among the past and existing automotive battery technologies, lithium-ion has the
highest energy density and has replaced other battery chemistries in production
vehicles. On this basis, it will be the only technology modelled for the short term.
Current lithium ion cells work on the principle of intercalation: reversible insertion
of a guest atom (lithium) into a solid host structure without inducing a major
disruption of the host material (electrode materials).
Attributes of batteries have been presented. Some, such as safety and life,
affects the lithium-ion battery pack design and cost as they require oversizing the
pack and integrating an advanced thermal control.

Cost and performance of EV batteries
16
3 Understanding current automotive cells
This section presents current lithium-ion cells, starting with historical development of
cells, followed by performance and cost of automotive cells across the existing lithium
chemistries16
. Costs of automotive packs are then introduced, followed by a short
description of the battery industry.
3.1 Historical trends of lithium-ion cells
The first commercial rechargeable lithium-ion cell, sold in Japan in 1991, had a lithium
cobalt oxide cathode (LCO) and a hard carbon anode. Performance (e.g. Ah, Wh/kg) and
the costs of cells have since significantly improved, materials have diversified and the
market size has grown. Table 3-1 gives a snapshot of performance, cost change and
market size for lithium-ion cells; these are commented in this section.
Table 3-1 Consumer market size and 18650 cell costs & size. Source: Avicenne 2011 and manufacturers’ data
1999 2011
Mobile phones sold
(millions)
Li-ion cells 100 1,400
Ni-MH cells 200 0
Laptops sold (millions) – Li-ion cells 14 225
Tablets sold (millions) – Li-ion cells 0 65
Tons of Li-ion cathode material 4,583 55,000
Li-ion 18650 cell price ($/kWh) 2,600 240
Typical Li-ion 18650 size (Ah) 1.5 2.2
Performance trajectory and cell markets
From an initial 0.8Ah capacity, 18650 cells (the most common and mass produced model,
a cylindrical 18 mm diameter, 65 mm high cell) reached 2.3Ah in 2005 and up to 2.6Ah
today, corresponding to a specific energy increase from 90Wh/kg to around 200Wh/kg17
.
This remarkable trajectory is the result of several improvements:
- Moving from a hard carbon anode (~200 mAh/g capacity) to graphite anodes,
(~280 mAh/g capacity)
- Introduction of electrolyte additives in 1998, allowing further graphitisation of the
anode (from 280mAh/g to 360mAh/g)
- Engineering process improvements, packing efficiencies e.g. reduction of non
active materials in the cathode (less carbon and less binder), increasing the
weight of active materials from approximately 85 to 95%.
By 2005, engineering process improvements had reached their limit and further
improvements in energy density or cost reductions had to come from other sources; new
cathode materials (with higher capacity or lower cost) started to be developed. Table 3-2
gives a list of cathode materials used in commercially available lithium-ion cells. While
some chemistries are now used in vehicles, the main cell market is still consumer
electronics: phones, laptops and cameras etc (see Figure 3-1). Li-ion cells market share
exceeded the cumulative share of Ni-Cd and Ni-MH cells by 2004, and now they account
for 80% of the rechargeable battery market.
16
Usually referenced by the chemistry at the cathode 17
2.9Ah cells are due to enter the market soon, based on silicon/carbon anode, they correspond to
230Wh/kg
Cost and performance of EV batteries
17
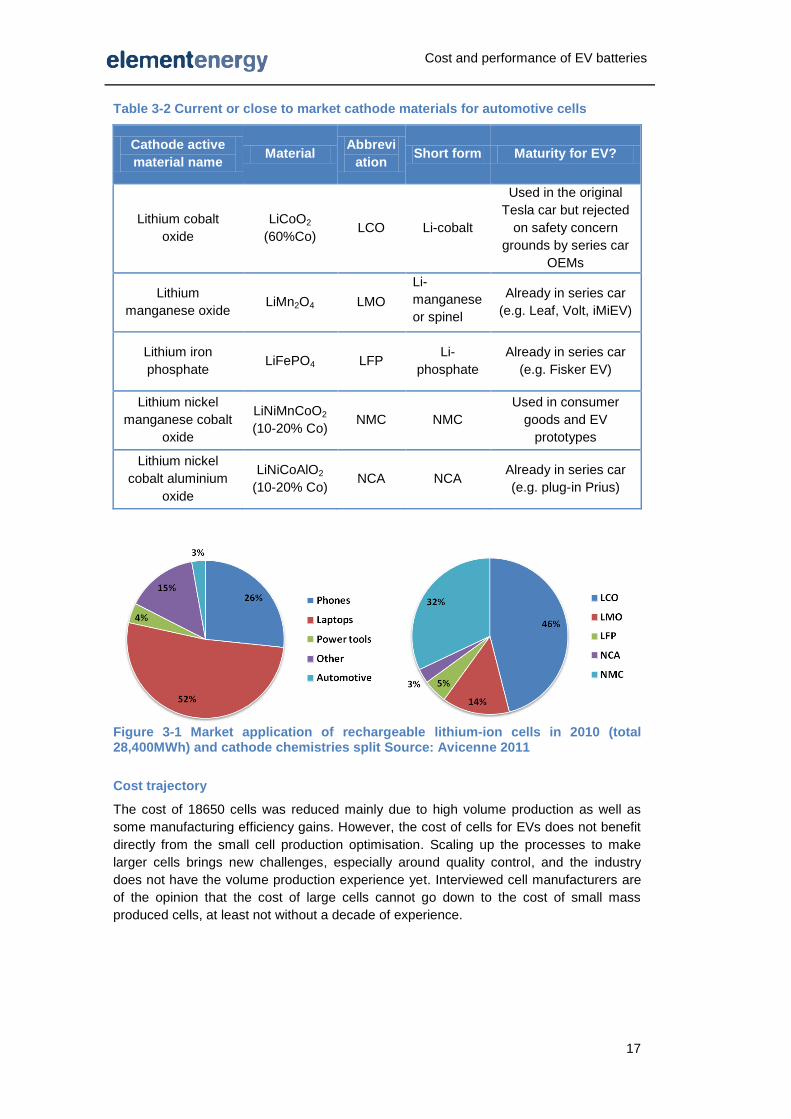
Table 3-2 Current or close to market cathode materials for automotive cells
Cathode active
material name Material
Abbrevi
ation Short form Maturity for EV?
Lithium cobalt
oxide
LiCoO2
(60%Co) LCO Li-cobalt
Used in the original
Tesla car but rejected
on safety concern
grounds by series car
OEMs
Lithium
manganese oxide LiMn2O4 LMO
Li-
manganese
or spinel
Already in series car
(e.g. Leaf, Volt, iMiEV)
Lithium iron
phosphate LiFePO4 LFP
Li-
phosphate
Already in series car
(e.g. Fisker EV)
Lithium nickel
manganese cobalt
oxide
LiNiMnCoO2
(10-20% Co) NMC NMC
Used in consumer
goods and EV
prototypes
Lithium nickel
cobalt aluminium
oxide
LiNiCoAlO2
(10-20% Co) NCA NCA
Already in series car
(e.g. plug-in Prius)
Figure 3-1 Market application of rechargeable lithium-ion cells in 2010 (total 28,400MWh) and cathode chemistries split Source: Avicenne 2011
Cost trajectory
The cost of 18650 cells was reduced mainly due to high volume production as well as
some manufacturing efficiency gains. However, the cost of cells for EVs does not benefit
directly from the small cell production optimisation. Scaling up the processes to make
larger cells brings new challenges, especially around quality control, and the industry
does not have the volume production experience yet. Interviewed cell manufacturers are
of the opinion that the cost of large cells cannot go down to the cost of small mass
produced cells, at least not without a decade of experience.
Cost and performance of EV batteries
18
Development time
New chemistries developed for the consumer electronics market find their way to the
vehicle market, typically many years later18
. Table 3-3 provides some examples.
The industry consensus is that this lag between consumer cells and vehicle cells will
remain constant because the development of a new product is easier (less stringent
requirements, especially in terms of battery life) and lower risk in small battery sizes
where the market is larger.
This means chemistries that are not already in use in consumer applications today are
not expected to penetrate the automotive market for at least 5 years. The next chemistry
in line to be used in series vehicles is the NMC cathode, already used in prototype
vehicles.
As the published literature search reveals no chemistries demonstrating a step-change in
performance increase entering the consumer cell market today, it is reasonable to
assume there will be no step-change in automotive cell performance by 2020. Instead we
expect a gradual performance improvement. In the longer term, as the automotive market
increases, cells will be increasingly developed for that market.
The time lapse between proof of concept in lab and commercialization for successful
battery chemistries is at least 10 years, and as the table below shows, may be
significantly greater. This is the time it takes to go from one promising electrode
chemistry, finding a compatible opposite electrode, and refining the cell (structure of
materials, electrolyte etc) into a product with rate and life characteristics appropriate for
consumer electronics.
This has profound consequences for the landscape of batteries for vehicles in the years
to come: any new chemistry that is still at the proof of concept stage in the laboratory will
not be expected to penetrate the automotive market for at least 10-15 years.
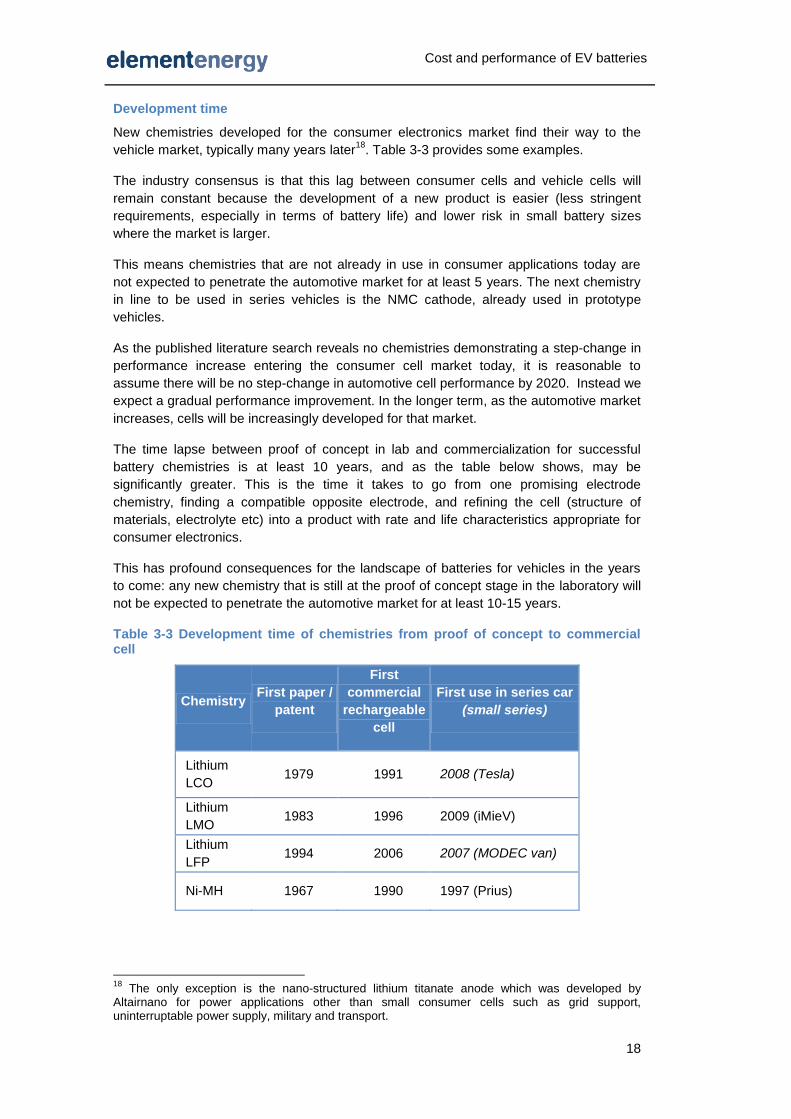
Table 3-3 Development time of chemistries from proof of concept to commercial cell
Chemistry First paper /
patent
First
commercial
rechargeable
cell
First use in series car
(small series)
Lithium
LCO 1979 1991 2008 (Tesla)
Lithium
LMO 1983 1996 2009 (iMieV)
Lithium
LFP 1994 2006 2007 (MODEC van)
Ni-MH 1967 1990 1997 (Prius)
18
The only exception is the nano-structured lithium titanate anode which was developed by Altairnano for power applications other than small consumer cells such as grid support, uninterruptable power supply, military and transport.

Cost and performance of EV batteries
19
3.2 Cost and performance of current lithium ion cells
The previous section introduced the general and historical lithium-ion cell market whereas
this section focuses on describing the current lithium cells characteristics.
Cathode chemistries
As introduced earlier, several cathode materials have been developed since the original
lithium cobalt oxide (LCO). Table 3-4 summarises the strengths and weaknesses of the
current 5 cathode chemistries type19
.
As mentioned earlier, LCO cathodes are not considered appropriate for automotive
applications due to the safety risk they would present. Their high cobalt content, a
material of high and volatile price, was a driver for developing alternative cathode
materials.
Table 3-4 Comparison of performance of current lithium ion cells
Cathode
LCO Lithium
Cobalt
Oxide
LMO Lithium
Manganese
Oxide
NCA Lithium nickel
cobalt
aluminium
oxide
NMC Lithium nickel
manganese
cobalt oxide
LFP Lithium iron
phosphate
Type Metal oxides Polyanion
Energy
Power
Safety
Expected
cost High (Co) Low High (Ni, Co)
Medium to
High
(Ni, Co)
Low
Low
temperature
High
temperature
Cycle life
Calendar life
LMO cathodes – also called spinel in reference to their structure – have the advantage of
being based on non toxic and cheap manganese. The main limitation of LMO is the
dissolution of manganese in the electrolyte, which translates into a shortened life,
especially at high temperatures. Batteries based on LMO cathodes need advanced
thermal management to mitigate this sensitivity to high temperature.
The NCA and NMC cathodes have had wide adoption in the laptop and power tool
markets, taking market share away from the LCO cathodes, thanks to their lower cobalt
content and overall good performance. NMC cathodes present more advantages in terms
of both safety and potential for improvement of the reversible capacity mAh/g and
voltage. They will therefore be taken forward to the cost model.
Poly-anion type cathodes, such as LFP, are considered intrinsically safer than metal
oxide cathodes that can release their oxygen more readily and fuel a potential thermal
19
Note that the exact composition of the cathode material varies across suppliers and can be a mix of chemistries described here, e.g. Boston Power has developed a ‘LMO-LCO’ cathode.
Cost and performance of EV batteries
20
runway. LFP is more stable at high temperatures than most chemistries, but its kinetics
(i.e. power) are poorer at low temperatures; this is mitigated by processing the LFP into
nano-sized particles, although this compromises the volumetric energy density.
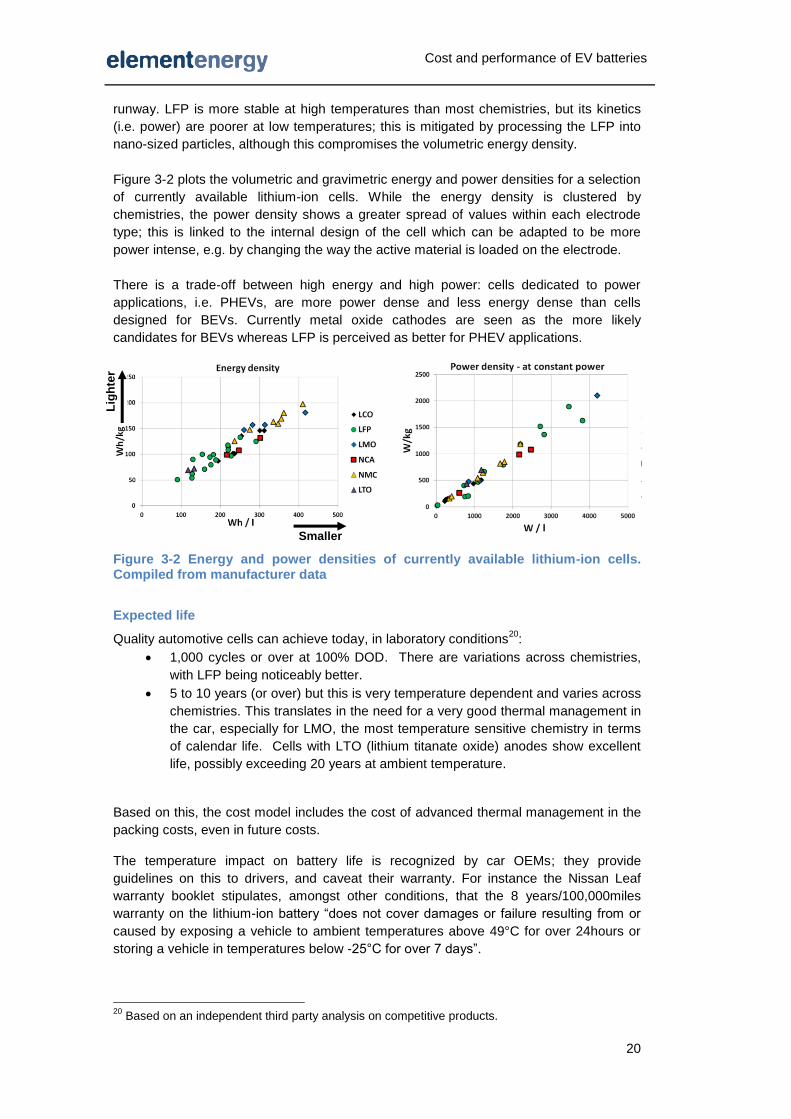
Figure 3-2 plots the volumetric and gravimetric energy and power densities for a selection
of currently available lithium-ion cells. While the energy density is clustered by
chemistries, the power density shows a greater spread of values within each electrode
type; this is linked to the internal design of the cell which can be adapted to be more
power intense, e.g. by changing the way the active material is loaded on the electrode.
There is a trade-off between high energy and high power: cells dedicated to power
applications, i.e. PHEVs, are more power dense and less energy dense than cells
designed for BEVs. Currently metal oxide cathodes are seen as the more likely
candidates for BEVs whereas LFP is perceived as better for PHEV applications.
Figure 3-2 Energy and power densities of currently available lithium-ion cells. Compiled from manufacturer data
Expected life
Quality automotive cells can achieve today, in laboratory conditions20
:
1,000 cycles or over at 100% DOD. There are variations across chemistries,
with LFP being noticeably better.
5 to 10 years (or over) but this is very temperature dependent and varies across
chemistries. This translates in the need for a very good thermal management in
the car, especially for LMO, the most temperature sensitive chemistry in terms
of calendar life. Cells with LTO (lithium titanate oxide) anodes show excellent
life, possibly exceeding 20 years at ambient temperature.
Based on this, the cost model includes the cost of advanced thermal management in the
packing costs, even in future costs.
The temperature impact on battery life is recognized by car OEMs; they provide
guidelines on this to drivers, and caveat their warranty. For instance the Nissan Leaf
warranty booklet stipulates, amongst other conditions, that the 8 years/100,000miles
warranty on the lithium-ion battery “does not cover damages or failure resulting from or
caused by exposing a vehicle to ambient temperatures above 49°C for over 24hours or
storing a vehicle in temperatures below -25°C for over 7 days”.
20
Based on an independent third party analysis on competitive products.
Lig
hte
r
Smaller
Cost and performance of EV batteries
21
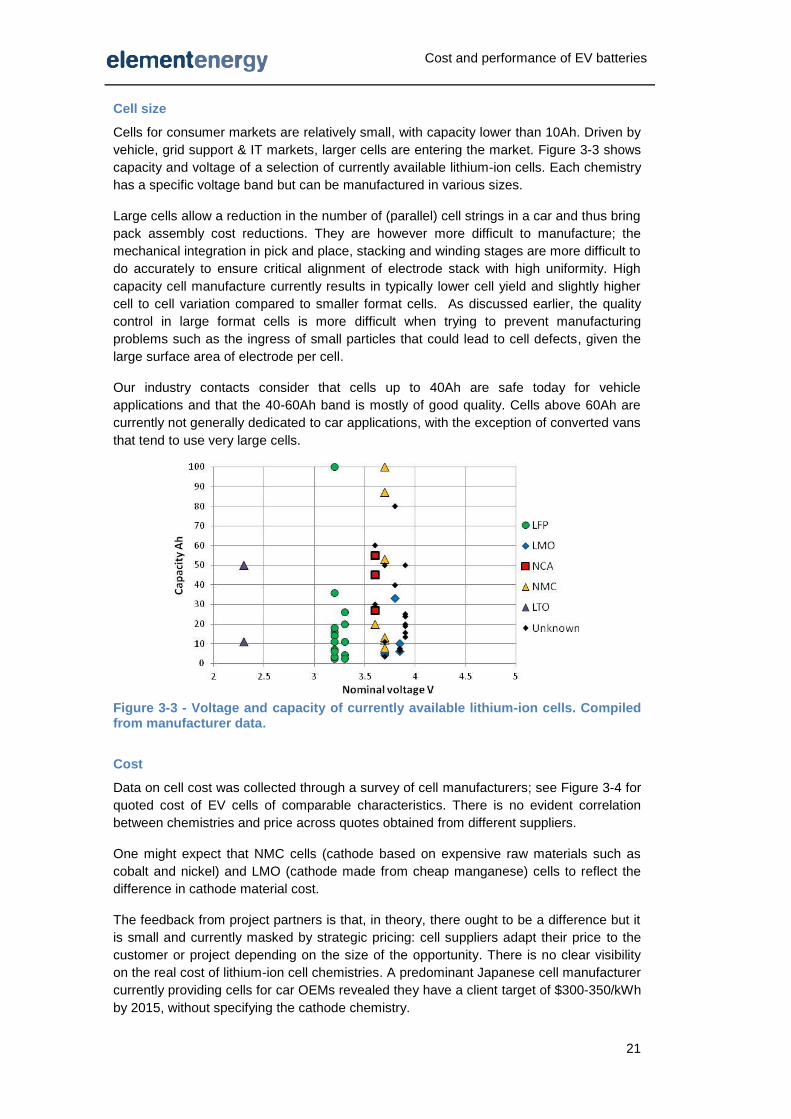
Cell size
Cells for consumer markets are relatively small, with capacity lower than 10Ah. Driven by
vehicle, grid support & IT markets, larger cells are entering the market. Figure 3-3 shows
capacity and voltage of a selection of currently available lithium-ion cells. Each chemistry
has a specific voltage band but can be manufactured in various sizes.
Large cells allow a reduction in the number of (parallel) cell strings in a car and thus bring
pack assembly cost reductions. They are however more difficult to manufacture; the
mechanical integration in pick and place, stacking and winding stages are more difficult to
do accurately to ensure critical alignment of electrode stack with high uniformity. High
capacity cell manufacture currently results in typically lower cell yield and slightly higher
cell to cell variation compared to smaller format cells. As discussed earlier, the quality
control in large format cells is more difficult when trying to prevent manufacturing
problems such as the ingress of small particles that could lead to cell defects, given the
large surface area of electrode per cell.
Our industry contacts consider that cells up to 40Ah are safe today for vehicle
applications and that the 40-60Ah band is mostly of good quality. Cells above 60Ah are
currently not generally dedicated to car applications, with the exception of converted vans
that tend to use very large cells.
Figure 3-3 - Voltage and capacity of currently available lithium-ion cells. Compiled from manufacturer data.
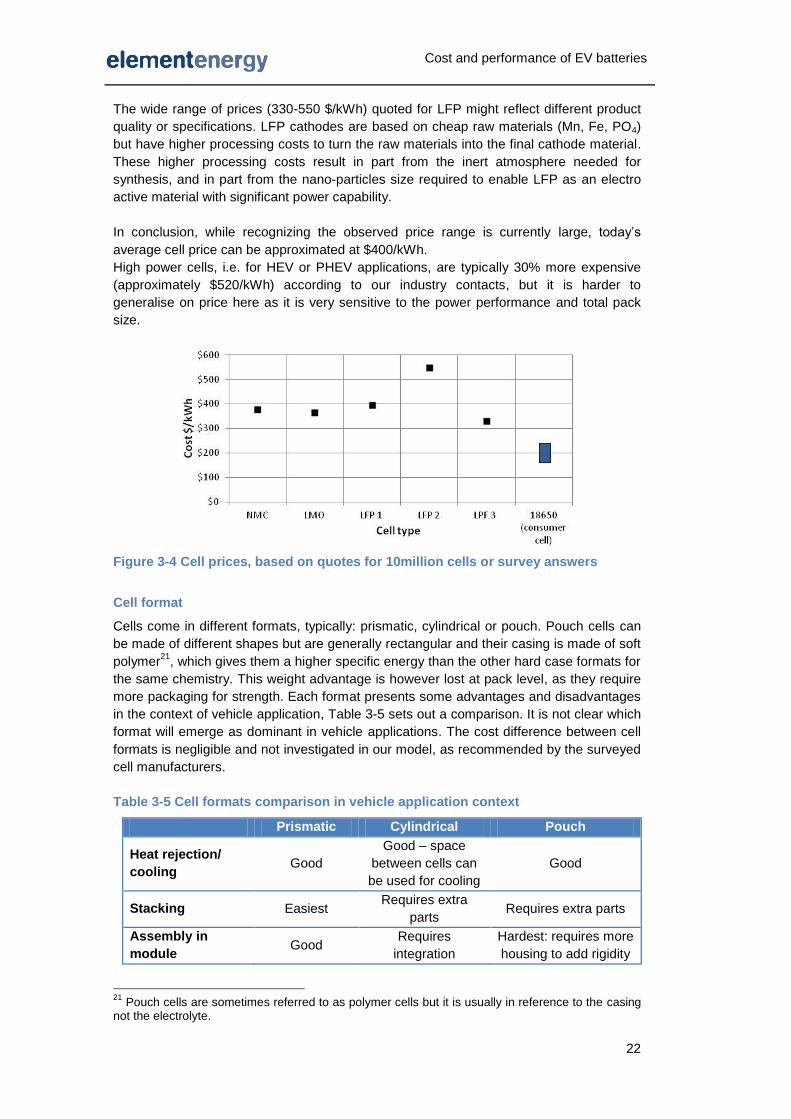
Cost
Data on cell cost was collected through a survey of cell manufacturers; see Figure 3-4 for
quoted cost of EV cells of comparable characteristics. There is no evident correlation
between chemistries and price across quotes obtained from different suppliers.
One might expect that NMC cells (cathode based on expensive raw materials such as
cobalt and nickel) and LMO (cathode made from cheap manganese) cells to reflect the
difference in cathode material cost.
The feedback from project partners is that, in theory, there ought to be a difference but it
is small and currently masked by strategic pricing: cell suppliers adapt their price to the
customer or project depending on the size of the opportunity. There is no clear visibility
on the real cost of lithium-ion cell chemistries. A predominant Japanese cell manufacturer
currently providing cells for car OEMs revealed they have a client target of $300-350/kWh
by 2015, without specifying the cathode chemistry.
Cost and performance of EV batteries
22
The wide range of prices (330-550 $/kWh) quoted for LFP might reflect different product
quality or specifications. LFP cathodes are based on cheap raw materials (Mn, Fe, PO4)
but have higher processing costs to turn the raw materials into the final cathode material.
These higher processing costs result in part from the inert atmosphere needed for
synthesis, and in part from the nano-particles size required to enable LFP as an electro
active material with significant power capability.
In conclusion, while recognizing the observed price range is currently large, today’s
average cell price can be approximated at $400/kWh.
High power cells, i.e. for HEV or PHEV applications, are typically 30% more expensive
(approximately $520/kWh) according to our industry contacts, but it is harder to
generalise on price here as it is very sensitive to the power performance and total pack
size.
Figure 3-4 Cell prices, based on quotes for 10million cells or survey answers
Cell format
Cells come in different formats, typically: prismatic, cylindrical or pouch. Pouch cells can
be made of different shapes but are generally rectangular and their casing is made of soft
polymer21
, which gives them a higher specific energy than the other hard case formats for
the same chemistry. This weight advantage is however lost at pack level, as they require
more packaging for strength. Each format presents some advantages and disadvantages
in the context of vehicle application, Table 3-5 sets out a comparison. It is not clear which
format will emerge as dominant in vehicle applications. The cost difference between cell
formats is negligible and not investigated in our model, as recommended by the surveyed
cell manufacturers.
Table 3-5 Cell formats comparison in vehicle application context
Prismatic Cylindrical Pouch
Heat rejection/
cooling Good
Good – space
between cells can
be used for cooling
Good
Stacking Easiest Requires extra
parts Requires extra parts
Assembly in
module Good
Requires
integration
Hardest: requires more
housing to add rigidity
21
Pouch cells are sometimes referred to as polymer cells but it is usually in reference to the casing not the electrolyte.

Cost and performance of EV batteries
23
Recycling/Disasse
mbly Good
Good
(depending on how
they are held in
place)
Can be difficult, if tabs
are laser welded
Use of space/
packing efficiency Good Worse Best
Casing
Aluminium,
steel or hard
plastic
Steel/aluminium Polymer
Used in vehicles? Pre-production
Yes, e.g.
Panasonic cells in
first Tesla car
Yes, e.g. LG cells in
Chevrolet Volt
3.3 Cost of automotive packs
Pack components were introduced in section 2.2.4. Table 3-6 gives an illustrative bill for
materials, with costs and mass, for a BEV 22kWh pack produced today in a facility
capable of producing 20,000 packs per annum. The components costs are based on
actual quotes for each component, for batches equivalent to 20,000 packs.
The table on the right gives our estimate of total pack cost, based on a cell cost of
$400/kWh. The resulting $792/kWh compares well with information collected through
surveys of pack suppliers, considering the small production volume assumed. They all
quoted large price ranges, stressing that price is very volume dependent and the overall
range was $450 to $800/kWh for 2013-2015.
As for cells, the costs for PHEV pack components are more expensive than for BEV due
to the higher power to energy ratio: the BMS has to have extra components and
architecture to be able to shuttle energy, and this comes at a significant cost overhead.
Table 3-6 Example of pack BOM and total pack cost estimates for 2012
Pack Bill of Materials (BOM) – excluding cells
Cost ($) Mass (kg)
Battery Management System (BMS)
$1,483 8
Power electronics $1,079 9
Wiring harnesses, interconnections and connectors
$923 11
Internal cell support $791 15
Housing $649 34
Temperature control (forced air)
$302 11
TOTAL $5,227 88
Estimation of total pack cost
$/kWh
Cells $400
Pack BOM excl. cells
$238
Pack overheads, depreciation and labour
$ 54
Margin and warranty
$100
Total pack $792
Based on 22kWh pack (246
25Ah cells). 20,000 packs per
annum
The cost of the BMS increases with the number of cells to monitor. Standardisation of this
component – currently customized for each vehicle model – is expected to strongly
decrease the cost in future. Wireless monitoring could in future reduce the amount of
wiring between the BMS and the cells and thus reduce cost and weight.
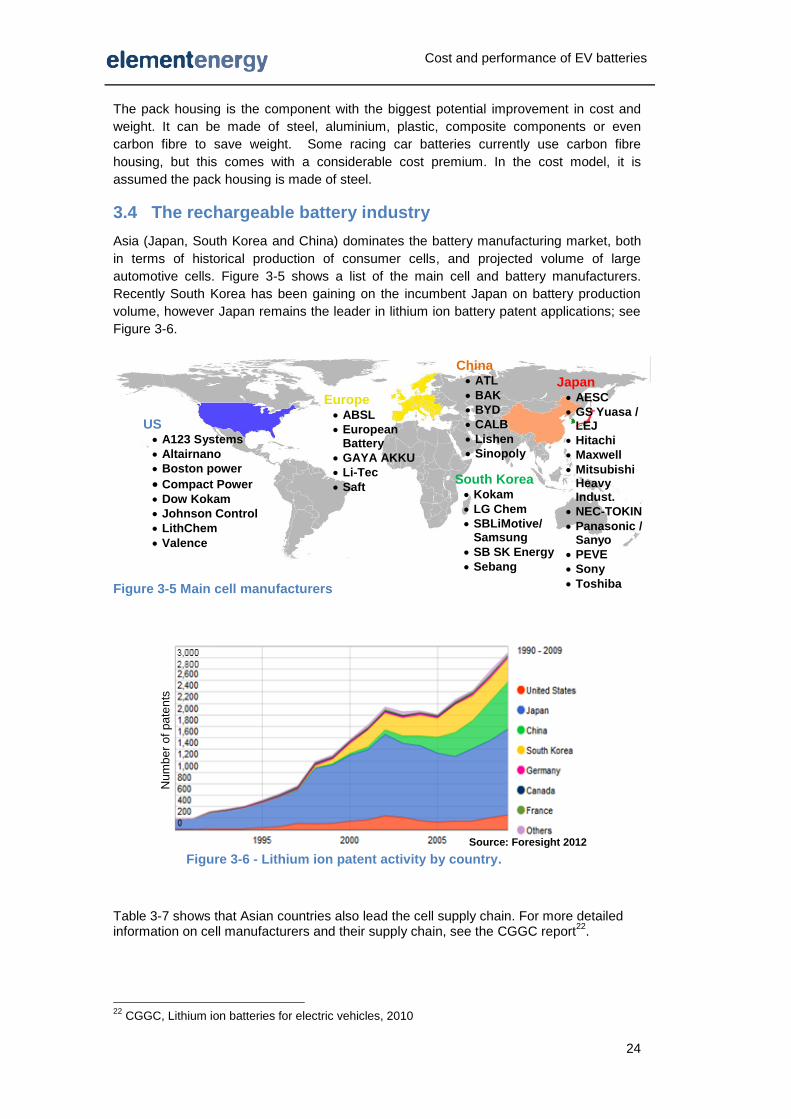
Cost and performance of EV batteries
24
The pack housing is the component with the biggest potential improvement in cost and
weight. It can be made of steel, aluminium, plastic, composite components or even
carbon fibre to save weight. Some racing car batteries currently use carbon fibre
housing, but this comes with a considerable cost premium. In the cost model, it is
assumed the pack housing is made of steel.
3.4 The rechargeable battery industry
Asia (Japan, South Korea and China) dominates the battery manufacturing market, both
in terms of historical production of consumer cells, and projected volume of large
automotive cells. Figure 3-5 shows a list of the main cell and battery manufacturers.
Recently South Korea has been gaining on the incumbent Japan on battery production
volume, however Japan remains the leader in lithium ion battery patent applications; see
Figure 3-6.
Figure 3-5 Main cell manufacturers
Table 3-7 shows that Asian countries also lead the cell supply chain. For more detailed information on cell manufacturers and their supply chain, see the CGGC report
22.
22
CGGC, Lithium ion batteries for electric vehicles, 2010
Figure 3-6 - Lithium ion patent activity by country.
Source: Foresight 2012
Num
be
r o
f pa
ten
ts
China ATL
BAK
BYD
CALB
Lishen
Sinopoly
US A123 Systems
Altairnano
Boston power
Compact Power Dow Kokam
Johnson Control
LithChem
Valence
Europe ABSL
European Battery
GAYA AKKU
Li-Tec
Saft
Japan AESC
GS Yuasa / LEJ
Hitachi
Maxwell
Mitsubishi Heavy Indust.
NEC-TOKIN
Panasonic / Sanyo
PEVE
Sony
Toshiba
South Korea Kokam
LG Chem
SBLiMotive/ Samsung
SB SK Energy
Sebang
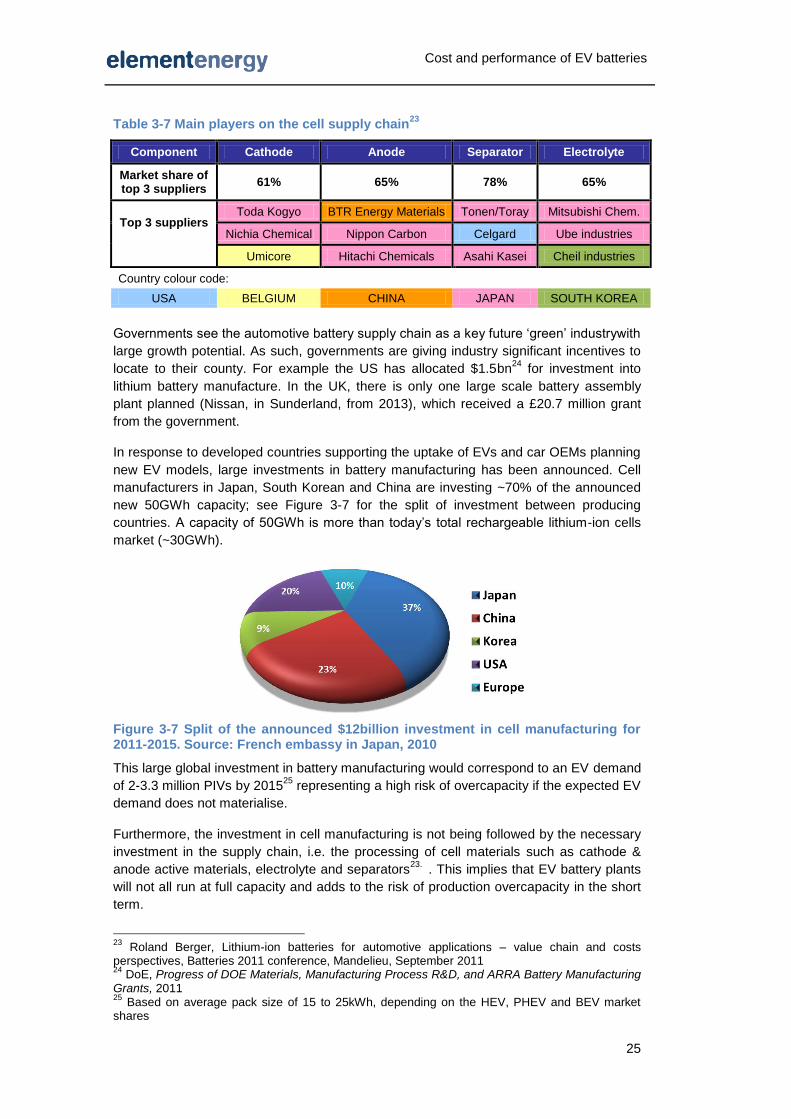
Cost and performance of EV batteries
25
Table 3-7 Main players on the cell supply chain
23
Component Cathode Anode Separator Electrolyte
Market share of top 3 suppliers
61% 65% 78% 65%
Top 3 suppliers Toda Kogyo BTR Energy Materials Tonen/Toray Mitsubishi Chem.
Nichia Chemical Nippon Carbon Celgard Ube industries
Umicore Hitachi Chemicals Asahi Kasei Cheil industries
Country colour code:
USA BELGIUM CHINA JAPAN SOUTH KOREA
Governments see the automotive battery supply chain as a key future ‘green’ industrywith
large growth potential. As such, governments are giving industry significant incentives to
locate to their county. For example the US has allocated $1.5bn24
for investment into
lithium battery manufacture. In the UK, there is only one large scale battery assembly
plant planned (Nissan, in Sunderland, from 2013), which received a £20.7 million grant
from the government.
In response to developed countries supporting the uptake of EVs and car OEMs planning
new EV models, large investments in battery manufacturing has been announced. Cell
manufacturers in Japan, South Korean and China are investing ~70% of the announced
new 50GWh capacity; see Figure 3-7 for the split of investment between producing
countries. A capacity of 50GWh is more than today’s total rechargeable lithium-ion cells
market (~30GWh).
Figure 3-7 Split of the announced $12billion investment in cell manufacturing for 2011-2015. Source: French embassy in Japan, 2010
This large global investment in battery manufacturing would correspond to an EV demand
of 2-3.3 million PIVs by 201525
representing a high risk of overcapacity if the expected EV
demand does not materialise.
Furthermore, the investment in cell manufacturing is not being followed by the necessary
investment in the supply chain, i.e. the processing of cell materials such as cathode &
anode active materials, electrolyte and separators23.
. This implies that EV battery plants
will not all run at full capacity and adds to the risk of production overcapacity in the short
term.
23
Roland Berger, Lithium-ion batteries for automotive applications – value chain and costs perspectives, Batteries 2011 conference, Mandelieu, September 2011 24
DoE, Progress of DOE Materials, Manufacturing Process R&D, and ARRA Battery Manufacturing Grants, 2011 25
Based on average pack size of 15 to 25kWh, depending on the HEV, PHEV and BEV market shares
Cost and performance of EV batteries
26
Summary
The predominant market for lithium-ion cells is consumer applications, mainly
phones and laptops. Since the first Li-ion cells sold in 1991, their cost has
dropped (to under 250$/kWh) and performance has improved (up to 200Wh/kg)
for small consumer cells.
Cells for automotive applications are however different from consumer cells, with
harder to achieve requirements in terms of size, power, life and safety. They
translate into a new manufacturing challenge that does not directly benefit from
the consumer cell manufacturing cost curve.
The quickly expanding and competitive cell consumer market has driven
innovation, with several new cathode materials developed in the last 7 years.
Automotive cells do benefit from this innovation but with a time lag of several
years, due to their more demanding requirements. Historical development times
indicate that any new chemistry to come in cars in the next 3-5 years must
already be in consumer cells today.
Cells suitable for transport applications today have an energy density of
approximately 100-180Wh/kg (200-350Wh/l), have a capacity up to 40 Ah and
require continuous thermal management to reach 10 years of life.
Large cells are not a commodity yet and as such there is no visibility on their
cost. A cost approximation would be $400/kWh for BEV cells. At pack level, the
cost can double.
Both automotive cell and pack production volumes are low today, but
considerable investment in production capacity indicates a cost reduction
potential in future. There is however a risk of overcapacity if the EV demand does
not increase significantly within a few years.
Asia (Japan, South Korean and China) dominates the current battery market and
lead on the investment in automotive battery production capacity.

Cost and performance of EV batteries
27
4 Looking ahead: chemistries of the future
Current battery technologies are both too expensive and bulky to make EVs competitive
compared to conventional vehicles. The considerable R&D focus and funding is expected
to bring improved, lighter and cheaper batteries to the market. This section presents the
battery technologies that are being researched and the key R&D challenges currently
hindering their development and mass manufacture. The funding and scope of national
R&D programs working on addressing these challenges are also briefly presented.
Finally, the technology roadmap, i.e. which cell chemistries will be used in cars in the
future, used to model the costs of future cells is presented.
4.1 Battery taxonomy
This section presents a brief list of the mechanisms in use or considered for large cells for
transferring charge, with their expected advantages over the incumbent technology.
Intercalation
Current lithium-ion cells are based on intercalation: ions intercalate at the electrodes (see
2.2.3 for more details). The theoretical capacity limit associated with intercalation
materials (with a single valance change) is approximately 300mAh/g; it corresponds to
the number of ions a host material can accept without collapsing. This would translate
into a theoretical cathode energy density of 1200 Wh/kg in a 4V cell.
Current intercalating cathode materials are still far from this theoretical ceiling, for
example the LMO cathode is around 550Wh/kg. Research to develop cathode materials
with higher capacities is on-going and will deliver improvements.
Even the maximum practical energy of intercalating cathode cells (1200 Wk/kg) is
however much lower than that of other types of cells, as illustrated in Table 4-1.
Table 4-1 Theoretical energy densities of some battery technologies (based on cathode theoretical capacity) and estimates of practical energy density
Type Example battery
Cell voltage
Theoretical Wh/kg
26
Theoretical Wh/l
26
Practical 1
cell Wh/kg
Intercalation Today’s LMO-Gr
3.8 550 110-165
Theoretical max intercalation 1,200 240-300
Reaction - sulphur Li-Sulphur 2.2 2567 2200 300-800
Reaction - Metal-air Li-O2 (non-aqueous)
3.0 3505 3430 700-1000
Reaction - Metal-air Li-O2
(aqueous) 3.2 3582 2230 700-1000
Reaction - Metal-air Zn-air 1.65 1086 6090 220-330
1 Not achieved today - approximation for indication purposes only
Reaction – Metal-sulphur
In a reaction cell based on sulphur, the sulphur reduces at the cathode and ultimately
combines with the metal. The metal can be lithium, sodium (Na) or magnesium (Mg).
The expected advantages over current intercalation cathodes are a higher energy density
and the utilisation of low costs materials, e.g. sulphur.
26
Adapted from Peter G. Bruce et al., High energy storage li-O2 and Li-S batteries
Cost and performance of EV batteries
28
Reaction – Metal-air (Metal-O2)
In this type of cell, part of the active material is not carried in the battery but received from
the air: oxygen from the air enters the cathode to be reduced. Lithium-air has the greatest
theoretical energy density, see previous table; this level of energy density would mean a
500km driving range EV could become practical. The other expected advantage over Li-
ion is the use of non-toxic and lower cost material.
Zn-air batteries have two advantages over Li-air batteries: zinc is cheaper than lithium
and (when compared with non-aqueous Li-air) water entering the cells does not cause
problems. However decades of work on rechargeable Zn-air have not delivered a
rechargeable battery. Their low voltage is also a disadvantage for the automotive market.
They are therefore excluded from the cost modelling. Other possible options for metal-air
cells include sodium and aluminium. These are excluded from the modelling as well, in
favour of lithium-air, the most promising metal-air battery as of today.
Alloying reactions
Elements used or considered for alloying anodes are silicon (Si) and tin (Sn). They
present much greater capacity (mAh/g) than intercalating anodes.
The development status and scientific challenges of these technologies are presented in
the next section.
Other technologies, not considered in this work
Some non-rechargeable batteries rely on conversion reactions (also called displacement)
but there is nothing commercial to date for the rechargeable market. One of the big
barriers is the significant gap between charge and discharge voltage. R&D in this field
has been abandoned in favour of alloying reactions.
Divalent batteries – where the anode is lithium metal and the intercalating cathode is
based a divalent metal, e.g. magnesium – might deliver higher energy density (the
divalent metal allows for 2 electrons to be released for each ion) but have low voltage,
low cycle life and safety issues. They are only a lab concept at this stage and will not be
considered in the model due to their overall low advantage over existing technologies.
Other technologies that show promising performances but are not appropriate for the
automotive market in the foreseeable future include flow batteries and redox batteries.
They show lower energy and power density than lithium-ion and need pumping solutions
to refuel the electrolyte. They are suitable for other markets with stationary applications
such as grid support and Uninterruptible Power Supply.
4.2 Key R&D challenges and development status
Publically funded R&D programs and research papers have been reviewed to understand
the current development status of the technologies presented in this section. Information
from private entities has been gathered from specialist conferences, direct conversations
with cell manufacturers and from the public domain (e.g. press releases).
4.2.1 Intercalating cathodes
Current cathodes such as LMO and LFP (see Table 3-2 for full chemistry names) have a
reversible capacity (i.e. usable capacity) under 150mAh/g while in theory the maximum
intercalation capacity could be as high as c.300mAh/g. The tables below show current

Cost and performance of EV batteries
29
values along with the potential improvements in terms of capacity and/or voltage that
chemistries under development now could bring in the future. The most promising work in
the short term is around the optimisation in the NMC triangle which could reach high
capacities (200mAh/g).
Table 4-2 NMC cathode development potential
NMC cathodes are already in
use in cells for electronic goods
but do not reach their full
potential. Numerous R&D
projects are on-going, with many
combinations and blends under investigation to get the reversible capacity closer to the
theoretical maximum.
The main challenges of NMC cathodes are around the volumetric density (particle
packing), improvement of cyclability and rate capability, and cost of raw materials (cobalt
being the most expensive). These problems are being addressed through control of
particle morphology by new synthesis techniques and also by reducing the amount cobalt
to a minimum. Cobalt is essential for power capability; it is estimated that 10% (by mass)
of Co would be the minimum amount possible.
Table 4-3 Lithium spinel development potential
Lithium manganese nickel oxide
(LNMO) cathodes are being
developed by both private
companies and through several
US DoE funded projects. They
suffer from poor stability of the electrode electrolyte interface, related to their higher
voltage (4.7-5V) compared to LMO or NMC. This will require either electrode coatings or
electrolytes that are stable to high voltage ranges.
In the polyanion family, lithium metal phosphates cathodes (Li(M)PO4, M= Mn, Ni or Co)
have the same theoretical capacity (mAh/g) as the currently produced LFP but would
bring higher energy density through their higher voltage. Several metals are being
investigated in the lab with LiMnPO4 (LMP) showing the most promise amongst the
polyanion family for future introduction into mass market cells.
Table 4-4 Polyanion cathodes development potential
The challenges to
overcome are a poor
capacity retention and
slow kinetics, attributed
to low intrinsic ionic and
electronic conductivity (using Mn results in a more insulating material than Fe). Solutions
developed include doping and nano-structured materials such as mesoporous materials.
For example, the Japanese cell manufacturer Yuasa is working on a LiMnPO4 cathode,
using a carbon layer (3-4nm) and a carbon network to compensate for the poor electronic
conductivity27
.
27
Junichi Maruta, High performance lithium-ion batteries for electrified vehicle application with
various chemistries and cell dimensions, Lithium Energy Japan, Batteries 2011 conference, Mandelieu, September 2011
Current NMC
Adv. NMC potential
Theoretical capacity (mAh/g) 280 300
Reversible capacity (mAh/g) 140 200
Voltage vs Li/Li+ (V) 3.7 3.7
Current LMO
LMNO potential
Theoretical capacity (mAh/g) 150 150
Reversible capacity (mAh/g) 100 120
Voltage vs Li/Li+ (V) 3.9 4.7
Current LFP
LMP potential
Li(M)SO4F potential
Theoretical capacity (mAh/g) 170 170 170
Reversible capacity (mAh/g) 130 150 150
Voltage vs Li/Li+ (V) 3.4 4 5
Cost and performance of EV batteries
30
Further away in the development timeline, fluorophosphates (PO4F) and fluorosulphates
(SO4F) cathodes present the advantage of a higher voltage than LFP, and better ionic
and electronic conductivity. The better conductivity means there would be no need for
nano-sizing and carbon coating, and this could bring a cost advantage over LFP.
However it is expensive to synthesise SO4F materials, as their sensitivity to water makes
them difficult and expensive to handle. There are R&D programs investigating new
synthesis routes with lower cost than the current solvothermal, ionic liquid method.
Another development worth noting is the high capacity layered composite cathode
(referred as layered-layered or LL thereafter). LL cathodes could have a capacity higher
than 230mAh/g but fundamental problems still need to be solved to make them viable.
The LL material is first activated by charging; it releases oxygen in this process that can
react with the electrolyte and degrade it. This oxygen loss changes the material structure
and allows increased lithium insertion.
LL cathodes also suffer from poor kinetics, and the cathode has to be cycled over a large
voltage range to get the full material capacity.
The Argonne National Laboratory (ANL) and BASF are working on such LL materials
(xLi2MnO3•(1-x)LiNiO2) with the support of DoE funding28
(LG Chemical is also a
licensee). They can produce the materials in kg batches, with particle spheres of high
homogeneity. They are studying surface modification to stabilise the material for cycle life
and using coating oxides to improve conductivity. Their cathode material can achieve
around 50 cycles without significant capacity loss.
Sodium-ion chemistries (Na-ion)
The basic concept for Na-ion cathodes is the same than Li-ion, and they are now at early
laboratory stage in terms of development. There are no compatible anodes at the
moment, so this technology is far from practical implementation.
Na-ion presents two advantages over Li-ion: sodium is cheaper than lithium and this
research opens the possibility of finding new high voltage/high capacity cathodes. It might
be easier to find high capacity Na-ion cathodes than to improve Li-ion cathodes. However
the power capability might not be as high as with Li-ion.
Na-ion cathodes are the subject of a number of research projects in 2012, with Argonne
National Laboratory in the US, St Andrews University in the UK and the French national
research centre all dedicating funding to the topic.
4.2.2 Intercalating anodes
Intercalating anodes can be split into categories: low and high voltage versus Li/Li+.
Low voltage anodes (<1 V vs. Li/Li+)
This is the type of anode currently in use. They are carbonaceous; with soft carbon, hard
carbon or graphite. The disadvantage of low voltage anodes is the risk of lithium plating
and dendrite formation, leading to safety issues. On-going work to address this issue
includes anode coatings and surface treatments.
At this low voltage, lithium is corroded by the electrolyte salts and solvent. A layer (called
solid-electrolyte interphase, SEI) forms at the anode and passivates the lithium,
preventing further chemical degradation. Additives are introduced to condition the SEI,
improving its properties and ensuring the electrode stability and thus cell safety.
28
Argonne National Laboratory, Engineering of High energy cathode material, 2011
Cost and performance of EV batteries
31
Graphite anodes (theoretical capacity 372mAh/g, reversible ~330mAh/g) are the most
commonly used anodes at the moment. Hard carbon anodes (theoretical capacity
480mAh/g and cheaper than graphite) are already used in some applications and could
be ready for series cars by 2020 but they suffer from volume expansion problems;
development might instead be directed to alloying anodes; see next section.
Another material being investigated is lithium vanadium oxide (LVO). It has the same
capacity as graphite but is twice as dense; it would thus result in a greater volumetric
density (Wh/l).
High voltage anodes (~1.5 V vs. Li/Li+)
Thanks to the higher voltage, these anodes (lithium titanate oxide, LTO) have very good
characteristics in terms of safety, cycle life, low temperature performance and power
rating, permitting fast recharge.
The use of LTO anodes enhances the safety of Li-ion cells due to their thermal stability,
no anode SEI and ability to absorb O2 released from unstable cathode compounds in
abuse conditions, therefore preventing thermal runaway.
But the higher voltage at the anode comes with a significant drawback: the resulting cell
has a lower voltage and thus low energy density, see Figure 3-2 and Figure 3-3 for
illustration. LTO anodes are also more expensive than graphite anodes and are prone to
stability problems (reactions) with the electrolyte at elevated temperatures.
Due to their limited energy density, LTO-based cells are perceived as more appropriate
for HEV applications than for plug-in vehicles. Nevertheless LTO anodes are coming to
the EV market , e.g. in the Honda Fit EV announced for summer 201229
.
LTO anode capacity is limited (175 mAh/g) while a titanate oxide (TiO2) anode would
have almost double this capacity. TiO2 anodes are being investigated but are still at an
early stage of development.
LTO and TiO2 anodes will not be modelled, due to their energy density, the improvement
prospects and costs.
4.2.3 Alloying anodes
Silicon (Si) alloying anodes offer theoretical capacities more than 10 times that of
intercalating anodes, see Table 4-5. But there are some significant challenges to their
use.
During the alloying/de-alloying reactions, there is a large volume expansion (up to 300%)
that can break up the electrode, resulting in reduced capacity and a short cycle life (<200
cycles). Solutions under development or investigation include the use of nano particle-Si,
Si nano-wires, porous Si and Si Graphite blends. The full capacity of silicon will never be
usable with the high cycle life requirements of the EV market. Instead, silicon will instead
be blended with carbon.
Silicon/carbon blend anodes are starting to penetrate the high end consumer cells. In
2010, Panasonic announced the commercialisation of 18650 cells based on Si anodes for
2012. They claimed 500 cycles and 80% capacity retained with a specific energy of
252Wh/kg at cell level. This corresponds to around 1,100 mAh/g of reversible capacity.
Nexeon, a UK based silicon anode manufacturer, claims their first nanostructure anode
achieved 1,000mAh/g and that their second generation will achieve up to 3,600mAh/g.
29
The Honda Fit EV will be fitted with the Toshiba SCiB battery that uses LTO anodes. The battery has been tested since Dec 2010 by Honda and officially qualified in Nov 2011.
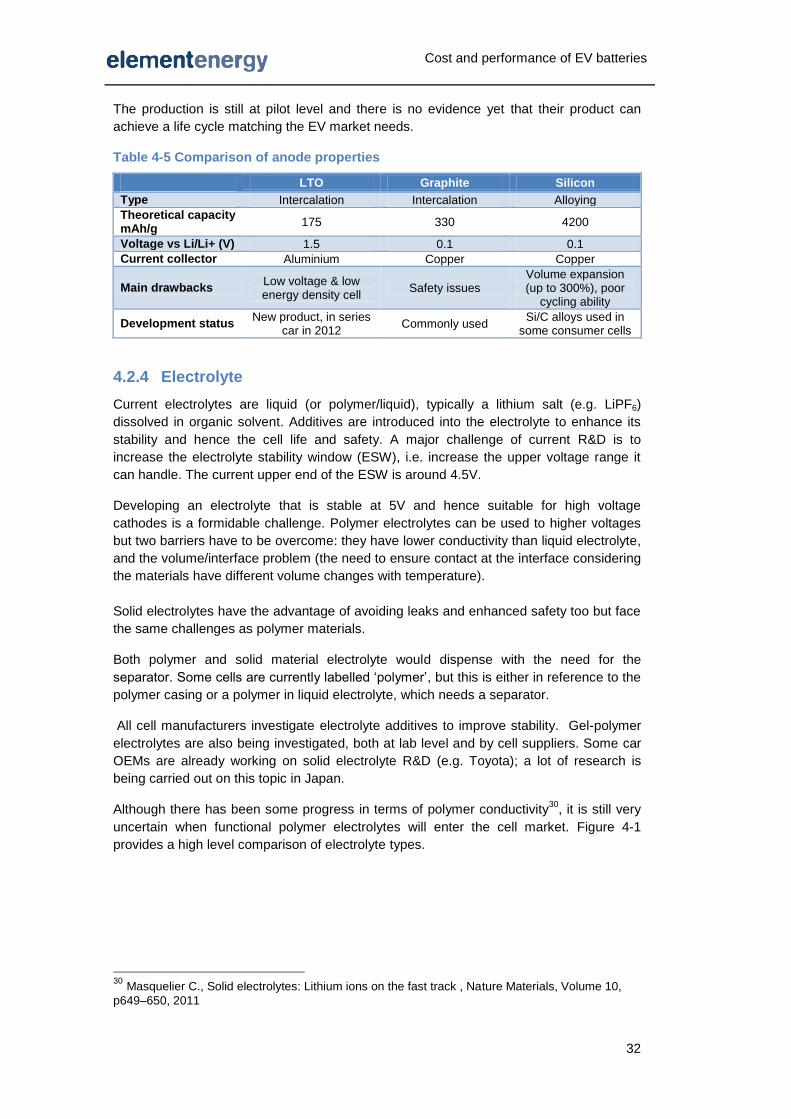
Cost and performance of EV batteries
32
The production is still at pilot level and there is no evidence yet that their product can
achieve a life cycle matching the EV market needs.
Table 4-5 Comparison of anode properties
LTO Graphite Silicon
Type Intercalation Intercalation Alloying
Theoretical capacity mAh/g
175 330 4200
Voltage vs Li/Li+ (V) 1.5 0.1 0.1
Current collector Aluminium Copper Copper
Main drawbacks Low voltage & low energy density cell
Safety issues Volume expansion (up to 300%), poor
cycling ability
Development status New product, in series
car in 2012 Commonly used
Si/C alloys used in some consumer cells
4.2.4 Electrolyte
Current electrolytes are liquid (or polymer/liquid), typically a lithium salt (e.g. LiPF6)
dissolved in organic solvent. Additives are introduced into the electrolyte to enhance its
stability and hence the cell life and safety. A major challenge of current R&D is to
increase the electrolyte stability window (ESW), i.e. increase the upper voltage range it
can handle. The current upper end of the ESW is around 4.5V.
Developing an electrolyte that is stable at 5V and hence suitable for high voltage
cathodes is a formidable challenge. Polymer electrolytes can be used to higher voltages
but two barriers have to be overcome: they have lower conductivity than liquid electrolyte,
and the volume/interface problem (the need to ensure contact at the interface considering
the materials have different volume changes with temperature).
Solid electrolytes have the advantage of avoiding leaks and enhanced safety too but face
the same challenges as polymer materials.
Both polymer and solid material electrolyte would dispense with the need for the
separator. Some cells are currently labelled ‘polymer’, but this is either in reference to the
polymer casing or a polymer in liquid electrolyte, which needs a separator.
All cell manufacturers investigate electrolyte additives to improve stability. Gel-polymer
electrolytes are also being investigated, both at lab level and by cell suppliers. Some car
OEMs are already working on solid electrolyte R&D (e.g. Toyota); a lot of research is
being carried out on this topic in Japan.
Although there has been some progress in terms of polymer conductivity30
, it is still very
uncertain when functional polymer electrolytes will enter the cell market. Figure 4-1
provides a high level comparison of electrolyte types.
30
Masquelier C., Solid electrolytes: Lithium ions on the fast track , Nature Materials, Volume 10,
p649–650, 2011

Cost and performance of EV batteries
33
Figure 4-1 Electrolyte types comparison
4.2.5 Sulphur metal
Although the concept of the sulphur cathode was demonstrated in the 60s, there are still
no commercial rechargeable metal-sulphur cells delivering the high energy density and
low cost that they were expected to deliver.
Lithium-sulphur (Li-S) cells are the most advanced metal-S cells. Three main companies
are working on their development today: Sion Power/BASF, Samsung, and Oxis Energy.
Polyplus used to work on Li-S but sold their patents to Sion Power to concentrate on
lithium-air.
Fundamental challenges of Li-S cells to be overcome are the poor rate capacity (i.e. low
power), high self-discharge and safety issues with electrolyte stability and use of lithium-
metal anode. The loss of capacity is due to the loss of sulphur following the formation of
soluble polysulfides that ‘shuttle’ between the electrodes and can eventually lead to
deposition of Li2S2 or Li2S at the anode and elsewhere31
. This is represented
schematically in the figure below.
Although Li-S cells do not use toxic materials, there is a risk of hydrogen sulphide (H2S,
highly toxic) forming if water were to leak into the cell. Another disadvantage of Li-S cells
in the context of automotive application is their low voltage (2.2V).
Figure 4-2 Schematic of lithium-sulphur cell. Source: BASF
US-based Sion Power has successfully fitted a Li-S battery in an unmanned aerial vehicle
(UAV) in 2010 with a reported specific energy of 350 Wh/kg, but lifecycle performance
was not reported. Although Sion Power were targeting small electronics, their area of
31
Peter G. Bruce et al., High energy storage li-O2 and Li-S batteries
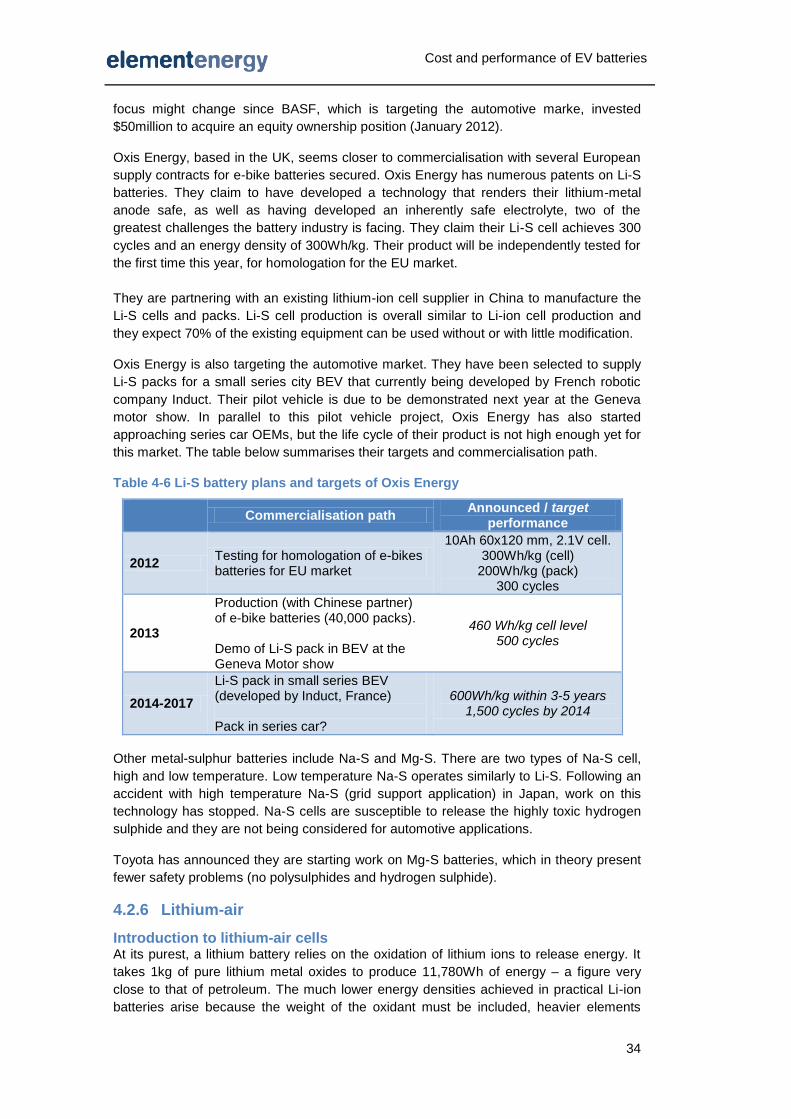
Cost and performance of EV batteries
34
focus might change since BASF, which is targeting the automotive marke, invested
$50million to acquire an equity ownership position (January 2012).
Oxis Energy, based in the UK, seems closer to commercialisation with several European
supply contracts for e-bike batteries secured. Oxis Energy has numerous patents on Li-S
batteries. They claim to have developed a technology that renders their lithium-metal
anode safe, as well as having developed an inherently safe electrolyte, two of the
greatest challenges the battery industry is facing. They claim their Li-S cell achieves 300
cycles and an energy density of 300Wh/kg. Their product will be independently tested for
the first time this year, for homologation for the EU market.
They are partnering with an existing lithium-ion cell supplier in China to manufacture the
Li-S cells and packs. Li-S cell production is overall similar to Li-ion cell production and
they expect 70% of the existing equipment can be used without or with little modification.
Oxis Energy is also targeting the automotive market. They have been selected to supply
Li-S packs for a small series city BEV that currently being developed by French robotic
company Induct. Their pilot vehicle is due to be demonstrated next year at the Geneva
motor show. In parallel to this pilot vehicle project, Oxis Energy has also started
approaching series car OEMs, but the life cycle of their product is not high enough yet for
this market. The table below summarises their targets and commercialisation path.
Table 4-6 Li-S battery plans and targets of Oxis Energy
Commercialisation path
Announced / target performance
2012 Testing for homologation of e-bikes batteries for EU market
10Ah 60x120 mm, 2.1V cell. 300Wh/kg (cell)
200Wh/kg (pack) 300 cycles
2013
Production (with Chinese partner) of e-bike batteries (40,000 packs). Demo of Li-S pack in BEV at the Geneva Motor show
460 Wh/kg cell level 500 cycles
2014-2017
Li-S pack in small series BEV (developed by Induct, France) Pack in series car?
600Wh/kg within 3-5 years 1,500 cycles by 2014
Other metal-sulphur batteries include Na-S and Mg-S. There are two types of Na-S cell,
high and low temperature. Low temperature Na-S operates similarly to Li-S. Following an
accident with high temperature Na-S (grid support application) in Japan, work on this
technology has stopped. Na-S cells are susceptible to release the highly toxic hydrogen
sulphide and they are not being considered for automotive applications.
Toyota has announced they are starting work on Mg-S batteries, which in theory present
fewer safety problems (no polysulphides and hydrogen sulphide).
4.2.6 Lithium-air
Introduction to lithium-air cells At its purest, a lithium battery relies on the oxidation of lithium ions to release energy. It
takes 1kg of pure lithium metal oxides to produce 11,780Wh of energy – a figure very
close to that of petroleum. The much lower energy densities achieved in practical Li-ion
batteries arise because the weight of the oxidant must be included, heavier elements
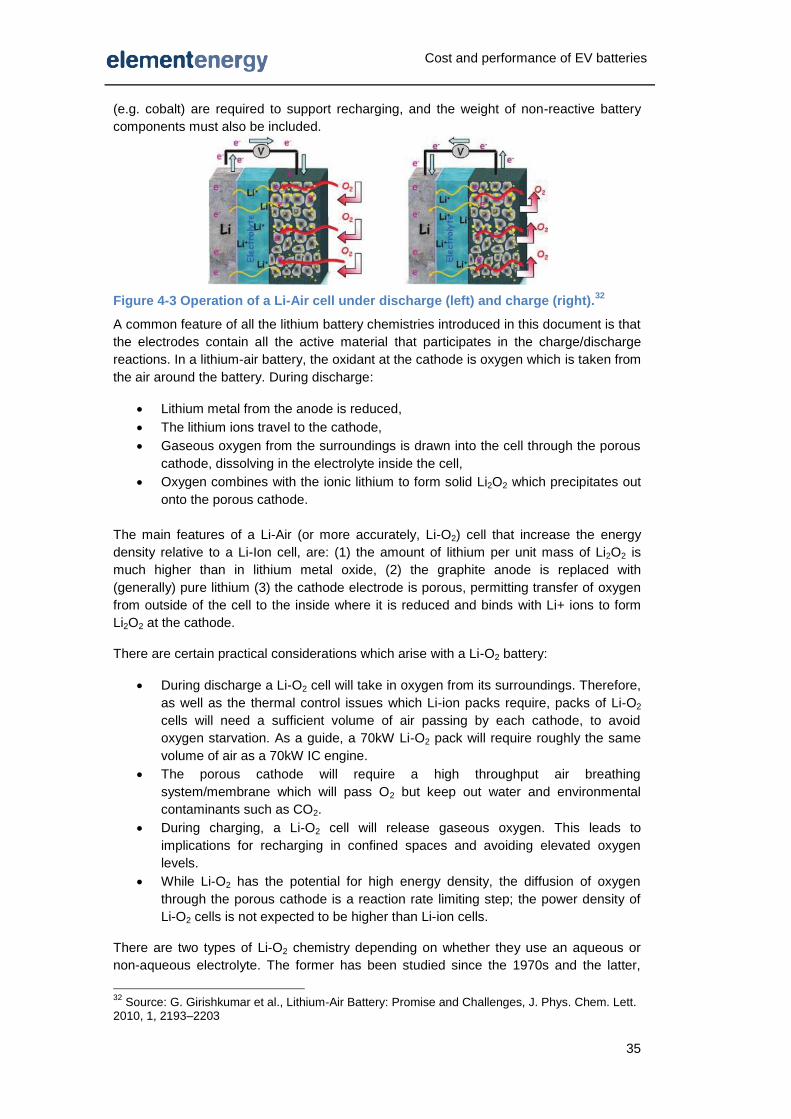
Cost and performance of EV batteries
35
(e.g. cobalt) are required to support recharging, and the weight of non-reactive battery
components must also be included.
Figure 4-3 Operation of a Li-Air cell under discharge (left) and charge (right).32
A common feature of all the lithium battery chemistries introduced in this document is that
the electrodes contain all the active material that participates in the charge/discharge
reactions. In a lithium-air battery, the oxidant at the cathode is oxygen which is taken from
the air around the battery. During discharge:
Lithium metal from the anode is reduced,
The lithium ions travel to the cathode,
Gaseous oxygen from the surroundings is drawn into the cell through the porous
cathode, dissolving in the electrolyte inside the cell,
Oxygen combines with the ionic lithium to form solid Li2O2 which precipitates out
onto the porous cathode.
The main features of a Li-Air (or more accurately, Li-O2) cell that increase the energy
density relative to a Li-Ion cell, are: (1) the amount of lithium per unit mass of Li2O2 is
much higher than in lithium metal oxide, (2) the graphite anode is replaced with
(generally) pure lithium (3) the cathode electrode is porous, permitting transfer of oxygen
from outside of the cell to the inside where it is reduced and binds with Li+ ions to form
Li2O2 at the cathode.
There are certain practical considerations which arise with a Li-O2 battery:
During discharge a Li-O2 cell will take in oxygen from its surroundings. Therefore,
as well as the thermal control issues which Li-ion packs require, packs of Li-O2
cells will need a sufficient volume of air passing by each cathode, to avoid
oxygen starvation. As a guide, a 70kW Li-O2 pack will require roughly the same
volume of air as a 70kW IC engine.
The porous cathode will require a high throughput air breathing
system/membrane which will pass O2 but keep out water and environmental
contaminants such as CO2.
During charging, a Li-O2 cell will release gaseous oxygen. This leads to
implications for recharging in confined spaces and avoiding elevated oxygen
levels.
While Li-O2 has the potential for high energy density, the diffusion of oxygen
through the porous cathode is a reaction rate limiting step; the power density of
Li-O2 cells is not expected to be higher than Li-ion cells.
There are two types of Li-O2 chemistry depending on whether they use an aqueous or
non-aqueous electrolyte. The former has been studied since the 1970s and the latter,
32
Source: G. Girishkumar et al., Lithium-Air Battery: Promise and Challenges, J. Phys. Chem. Lett. 2010, 1, 2193–2203

Cost and performance of EV batteries
36
although first reported in 1996, has only been investigated more intensively since 2006.
Some of the challenges to be met are the same for both technologies and some are
distinct. Currently, the major performance limitations are capacity fading and voltage gap.
These are detailed below (for the non-aqueous type), along with issues to be solved to
make a practical Li-air battery.
Scientific advances required for a practical Li-air battery The success of lithium batteries, combined with the recognition of their long-term
limitations, has kindled recent interest in the reversible Li-O2 battery. The technology has
only recently come under sustained study. Recent industry announcements have come
from BASF and IBM. Global chemicals company BASF has recently founded a science
network composed of academic experts from Germany, Switzerland, Israel and USA to
work on the topic. While BASF labels Li-O2 a long term R&D goal, IBM announced more
ambitious plans: they will have a prototype Li-air battery for 2013, aiming for
commercialisation in 2020.
Many fundamental scientific and technical issues remain to be solved before a practical
Li-O2 battery is available. The most important challenges to the development of a
practical battery are outlined below. When considering the potential role for Li-O2
technologies in an energy system, it is important to bear in mind that it is too early to tell
whether these fundamental challenges will in fact be overcome, and a practical Li-O2
battery will emerge.
Capacity fading
A significant challenge to practical Li-O2
cells is the considerable fading of cell
capacity with cycling.
The example shown here is from a recent
paper by Bruce et al. It shows that after 30
cycles the capacity has dropped from circa
2500mAh/g to a level approaching
500mAh/g. In some cases 100 cycles have
been achieved, but significant fading still
occurs.
Capacity fading is due to the gradual consumption of Li metal in (largely irreversible) side
reactions during charging and discharge. Mechanisms for lithium consumption include:
Side reactions with the electrolyte
Morphological changes during deposition of Li onto the anode during charging,
which can result in lithium dendrite formation and some lithium becoming
electrically insulated from the anode.
Reactions with reduced O2 from cathode.
A variety of approaches are being investigated to address this issue. For example, the
anode may be coated in a Li+ conducting solid layer, insulating the anode from the
electrolyte and from reduced O2. New electrolytes which result in lower Li loss have been
announced by IBM.
Overloading the cell with excess lithium at the start of its life is thought to be a pragmatic
approach, and this is one factor accounted for in estimates of the reduction of theoretical
energy density to practical energy density.
Figure 4-4 Example of Li-O2 cell capacity fading
26

Cost and performance of EV batteries
37
Overvoltage/voltage gap
The graph here shows that during constant current
charge and discharge, there is a significant
difference in the charging voltage (overpotential)
and discharge voltage for a Li-O2 cell. Therefore the
electrical efficiency for a charge discharge cycle is
only 65%. If not improved, this would be highly
detrimental to the economic and environmental
performance of a practical battery.
Currently, the use of electrocatalysts to narrow the
gap between the overpotentials is being studied.
Cathode and specific power
The cathode in a Li-O2 cell has a very complex task, permitting the diffusion of gaseous
O2 through to an interface with the Li+ containing electrolyte. The diffusion of O2 is
thought to worsen with deposition of Li2O2 in the porous electrode. The specific power
(i.e. mA/cm2) of Li-O2 is low at present, thought to be due to the kinetics at the cathode.
Specific challenges of the cathode are:
The development of a membrane which will pass oxygen but keep out
contaminants such as CO2.
The development of a porous cathode structure with pores small enough to give
high surface area, but large enough to limit the effects of clogging due to the
deposition of Li2O2.
Improving O2 transport - oxygen transport is currently limiting the cell rate.
Safety
Thermal runaway due to overcharging is not possible in Li-O2 cells because of the rate-
limited reaction at the cathode surface. However the use of lithium metal anodes is a
possible hazard, with both the potential for pure lithium to be exposed to the air in a
serious cell bursting incident, as well as the growth of pure lithium dendrites during
charging, possibly leading to short-circuits.
4.3 National programs and international research
International support for battery R&D and industry development is considerable. The split
of funding between R&D and industrial development varies by country; government
support for these activities also varies widely.
National R&D programs are a relatively small proportion of the total investment in battery
R&D worldwide; a single battery manufacturer can invest the equivalent of an entire
country’s R&D budget. This is true even in the US where the government budget for
battery R&D was $76million33
in 2010; by comparison GS Yuasa (a Japanese battery
manufacturer) invested $76million34
in 2011.
Most of the US national funding is channelled into improving existing lithium ion
intercalation chemistries, with the 2009 Recovery Act allocating $1.5 billion for
33
DoE, Annual Merit Review and Peer Evaluation Meeting, Energy Storage R&D, 2011 34
Company accounts 2011
Figure 4-5 Example of discharge-charge cycle for an Li-O2 cell
32

Cost and performance of EV batteries
38
manufacturing and material improvement35
; Figure 4-6 shows the corresponding funding
split.
Figure 4-6 DoE funding split for manufacturing and material improvement of lithium-ion batteries
Industry funded R&D is highly secretive and often a new technology (R&D stream) is only
known about in press releases before mass manufacture, or through patent applications.
A large proportion of world battery R&D is carried out in this way by companies such as;
Panasonic/Sanyo, Samsung, Sony, Toshiba, LG Chem, Mitsubishi, Hitachi, Toyota, GS
Yuasa, Lishen, BYD and 3M. Due to their secretive nature, the R&D spent on automotive
batteries for the majority of these companies remains difficult to estimate.
The US and Japan lead the world in national battery R&D funding. The US research
program is transparent and we have collected significant detail about the funding
distribution and research areas36
. This, combined with other inputs has been used to
inform the model technology roadmap (presented in the next section).
The US, Japan and Europe have considerable national battery R&D programs and more
recently South Korea and China have been setting up government and industry funded
research labs. Although the US may lead in national funding, Japan leads in industry
R&D funding as many of the established battery manufacturers are Japanese companies.
Most research programs have specific cost and performance targets and roadmaps that
the funding is meant to accomplish, these can of course vary between countries. An
example of a roadmap (Japan’s) is shown in Figure 4-7.
The main countries within Europe funding battery R&D programs are France and
Germany, with a future vehicle R&D funding worth up to €60million p.a. per country.
Germany’s Fraunhofer Institute has created a detailed roadmap for battery technology
development and implementation for Germany. There is, as yet, no Europe wide roadmap
or program.
35
DoE - NETL, Progress of DOE Materials, Manufacturing Process R&D, and ARRA Battery Manufacturing Grants, 2011 36
Especially DoE merit review papers that can be found at http://www1.eere.energy.gov/vehiclesandfuels/resources/proceedings/2011_merit_review.html
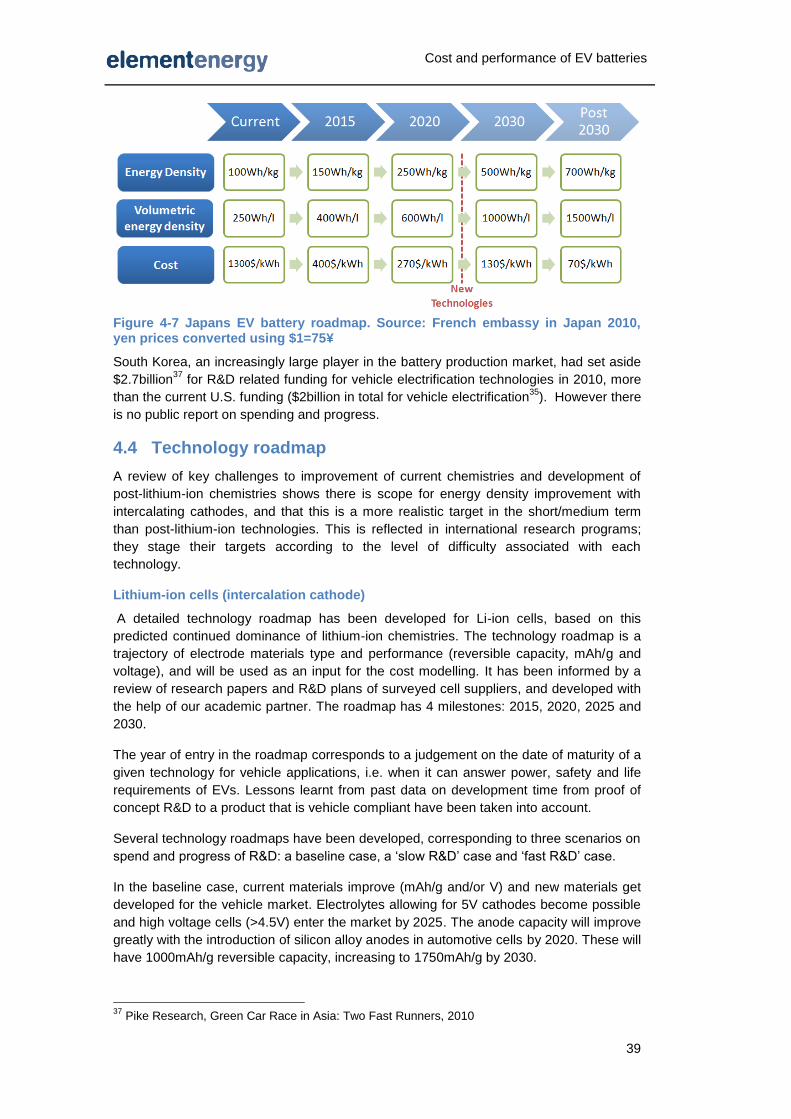
Cost and performance of EV batteries
39
Figure 4-7 Japans EV battery roadmap. Source: French embassy in Japan 2010, yen prices converted using $1=75¥
South Korea, an increasingly large player in the battery production market, had set aside
$2.7billion37
for R&D related funding for vehicle electrification technologies in 2010, more
than the current U.S. funding ($2billion in total for vehicle electrification35
). However there
is no public report on spending and progress.
4.4 Technology roadmap
A review of key challenges to improvement of current chemistries and development of
post-lithium-ion chemistries shows there is scope for energy density improvement with
intercalating cathodes, and that this is a more realistic target in the short/medium term
than post-lithium-ion technologies. This is reflected in international research programs;
they stage their targets according to the level of difficulty associated with each
technology.
Lithium-ion cells (intercalation cathode)
A detailed technology roadmap has been developed for Li-ion cells, based on this
predicted continued dominance of lithium-ion chemistries. The technology roadmap is a
trajectory of electrode materials type and performance (reversible capacity, mAh/g and
voltage), and will be used as an input for the cost modelling. It has been informed by a
review of research papers and R&D plans of surveyed cell suppliers, and developed with
the help of our academic partner. The roadmap has 4 milestones: 2015, 2020, 2025 and
2030.
The year of entry in the roadmap corresponds to a judgement on the date of maturity of a
given technology for vehicle applications, i.e. when it can answer power, safety and life
requirements of EVs. Lessons learnt from past data on development time from proof of
concept R&D to a product that is vehicle compliant have been taken into account.
Several technology roadmaps have been developed, corresponding to three scenarios on
spend and progress of R&D: a baseline case, a ‘slow R&D’ case and ‘fast R&D’ case.
In the baseline case, current materials improve (mAh/g and/or V) and new materials get
developed for the vehicle market. Electrolytes allowing for 5V cathodes become possible
and high voltage cells (>4.5V) enter the market by 2025. The anode capacity will improve
greatly with the introduction of silicon alloy anodes in automotive cells by 2020. These will
have 1000mAh/g reversible capacity, increasing to 1750mAh/g by 2030.
37
Pike Research, Green Car Race in Asia: Two Fast Runners, 2010

Cost and performance of EV batteries
40
The increase in material capacity and/or voltage translates into a greater energy density
and – because the volume of active material is assumed constant – cells with a greater
capacity (Ah) in the case of increased mAh/g. The expected cost reductions brought by
greater energy density are outlined in Appendix 8.3.2.
The slow R&D scenario is conservative, and some scientific challenges are not solved,
such as electrolytes that allow for high voltage cathodes. Overall there is slow
improvement in materials, and silicon anodes make their way into automotive cells from
2025 only. On the other hand, the fast R&D case is an optimistic scenario: material
breakthroughs are introduced as soon as 2015 and silicon anodes from 2020. Slow and
fast R&D roadmaps are illustrated in Appendix 8.3.2.
Figure 4-8 shows the cell gravimetric energy density resulting from the materials used in
the baseline scenario. In the polyanion cathode family, it is assumed that LiMnPO4 (LMP)
replaces LFP by 2020 bringing the voltage to 4V, while 5V Li(M)SO4F cathodes are
assumed to be ready for the car market from 2025. In the spinel family, 4.5V LMNO
cathodes would supplant LMO by 2020. By 2025, layered-layered cathodes (labelled ‘LL’
on the graph), with capacities greater than 200mAg/h, would take the cell energy density
above 200Wh/kg. The optimisation of NMC type of cathodes could see their reversible
capacity increased to 200mAh/g (for 3.7V).
Table 4-7 Cell density targets
These cell energy density results are more conservative
than other published battery performance roadmaps –
mostly because they are specific to the demanding
automotive market. High energy densities will be
achieved sooner in the consumer cell market. Table
4-7shows the cell energy density targets of three surveyed cell suppliers. With the
exception of the supplier B in 2015, the other targets match the baseline roadmap.
It is worth noting not all chemistries included in the roadmap would be suitable for both
BEV and PHEV. For example, todays composite cathodes (layered-layered) show poor
power capability and are thus unlikely candidate for PHEV cells.
Figure 4-8 Lithium-ion energy density (Wh/kg) at cell level in the baseline R&D scenario for different types of cathodes
Cell Wh/kg 2015 2020
Supplier A 180 220
Supplier B 250 -
Supplier C 150 200
Cost and performance of EV batteries
41
Post lithium-ion cells
Post lithium-ions have great challenges to overcome (briefly outlined in section 4.2)
before they reach the automotive market if they do at all. Assuming a maturity date is
very speculative.
Nonetheless, based on recent progress of Li-sulphur cells (presented in previous
sections) and if their life cycle properties were to be improved, a base scenario would see
their entry in the car market in 2025 with an energy density of 350Wh/kg, increasing to
500Wk/kg by 2030. A more aggressive scenario would see 300Wh/kg Li-S cells by 2020,
increasing to 500Wh/kg by 2030.
Batteries using lithium-air cells have a greater energy density potential (see Table 4-1, up
to 1,000Wh/kg for cells) and are receiving the most R&D of any of the post Li-ion
batteries. Lithium-air batteries are used as the only proxy for post-lithium technologies in
the long term cost modelling (post 2030).
Summary
The current research emphasis is on improving lithium-ion batteries
(intercalation). The main R&D challenges are around life, safety and power
requirements.
Through the development of high voltage cathodes or high capacity cathodes, the
specific energy of lithium-ion cells has the potential to increase from ~170Wh/kg
today to ~290Wh/kg by 2030. High voltage cathodes however require
overcoming a substantial challenge: developing an electrolyte that can withstand
a voltage at which organic materials breakdown.
A detailed technology roadmap of lithium-ion cathode and anode characteristics
was developed, to be used in the cost modelling, for up to 2030.
Post lithium-ion technologies have the potential to deliver much higher specific
energies, up to 1,000 Wh/kg in the case of lithium-air, and could therefore deliver
a 500km driving range, something that will not be possible for Li-ion. They
however are still far from commercialisation in the automotive market with several
fundamental R&D challenges to be resolved.
Estimating a date of technology readiness for various post-lithium-ion
technologies would be very speculative, and has not been not attempted.
Instead, only the technology with the greater theoretical energy (lithium-air) will
be used to model longer term (post 2030) costs.

Cost and performance of EV batteries
42
5 Cost and performance model
The objective of the cost and performance model is to answer the following questions and
produce the following outputs:
1. predict the cost of different battery packs through time (out to 2050)
2. allow the performance of battery packs to vary in line with key uncertainties
3. show the key drivers behind the costs of batteries
4. identify the largest cost components of battery packs
5. identify the key areas requiring R&D to reduce battery costs
5.1 Review of existing models
There are a large number of battery cost models used world-wide. To ensure that the
model incorporates state of the art techniques, an extensive review of over fifteen of the
most referenced battery cost models was undertaken. EPRI38
(Electric Power Research
Institute) in 2010 undertook a similar review of seven of the most used models with an in-
depth review of two of the bottom up models. The conclusions of this study and its
grading criteria were used to inform the larger, more general, review of existing models
undertaken in this study. The three key cost dependencies identified in the EPRI report
are: cell size, cell production volume and standardization.
5.1.1 Modelling methodologies
There are three main approaches to modelling battery costs, each with their own merits
and limitations.
Table 5-1 Merits and limitations of modelling approaches
Model Attribute Bottom
up Top
down Hybrid
Can produce long term time dependent forecasts easily? No Yes Yes
Allows the performance of the batteries to be modelled from explicit improvements
Yes No No
Level of detail of the key drivers behind costs High Medium Medium
Level of separation of the cost components High Medium High
Level of R&D needs identifiable High Low Medium
Number of inputs High Low Medium
Detail of outputs High Low Medium
Takes into account specific improvements in manufacturing techniques
Yes No No
Allows the effect of battery cell capacity and structure to be modelled directly
Yes No No
Non direct costs modelled Yes No No
Bottom up (component based)
This method is based on a detailed set of inputs, uses a specified manufacturing process
(with associated costs) and specifies a design of a battery pack. The EPRI study
concluded this was the most informative and useful model format, with assumptions
generally more explicit and better documented than the ‘top down’ approach.
38
EPRI, Large-Format Lithium-Ion Battery Costs Analysis - Critical Review of Existing PHEV
Lithium Ion Battery Cost Studies, 2010

Cost and performance of EV batteries
43
Top down
This is the preferred method used by financial institutions. From a starting reference year,
learning rates are applied to the different battery cost components, using historical
learning rates or primary analysis with industry consultation. This kind of analysis is very
good for identifying overall patterns of developments in industries, but often does not
have the explanatory power to identify the origin of changes, or fundamentals which might
constrain such changes in the future.
Hybrid
This uses a combination of the two models, starting from a bottom up model but with
industry informed trajectories on costs and performance improving the validity of the
results through time.
To ensure that no important models were overlooked in our review the following process
was used:
A search of all the major battery research programs and institutions worldwide,
Consultation with battery industry experts and private discussions with
manufacturers,
A recent publications search including conference proceedings and merit
reviews.
A summary of a selection of reviewed models is shown in Table 5-2; some comparative
fields are also explored in this table.
Table 5-2 Summary of attributes of different battery cost models used worldwide
5.1.2 Review of state of the art battery cost models
From the initial review, further interrogation of two state of the art models was carried out:
a bottom up model and a top down model, both developed in 2011. They stand out from
other models by the transparency of the assumptions and thus usefulness.
Bottom up model – ANL’s BatPaC 2011
Argonne National Laboratory (ANL), in the US, has extensive knowledge of the battery
industry and is a leading research entity, with the 5th largest number of international
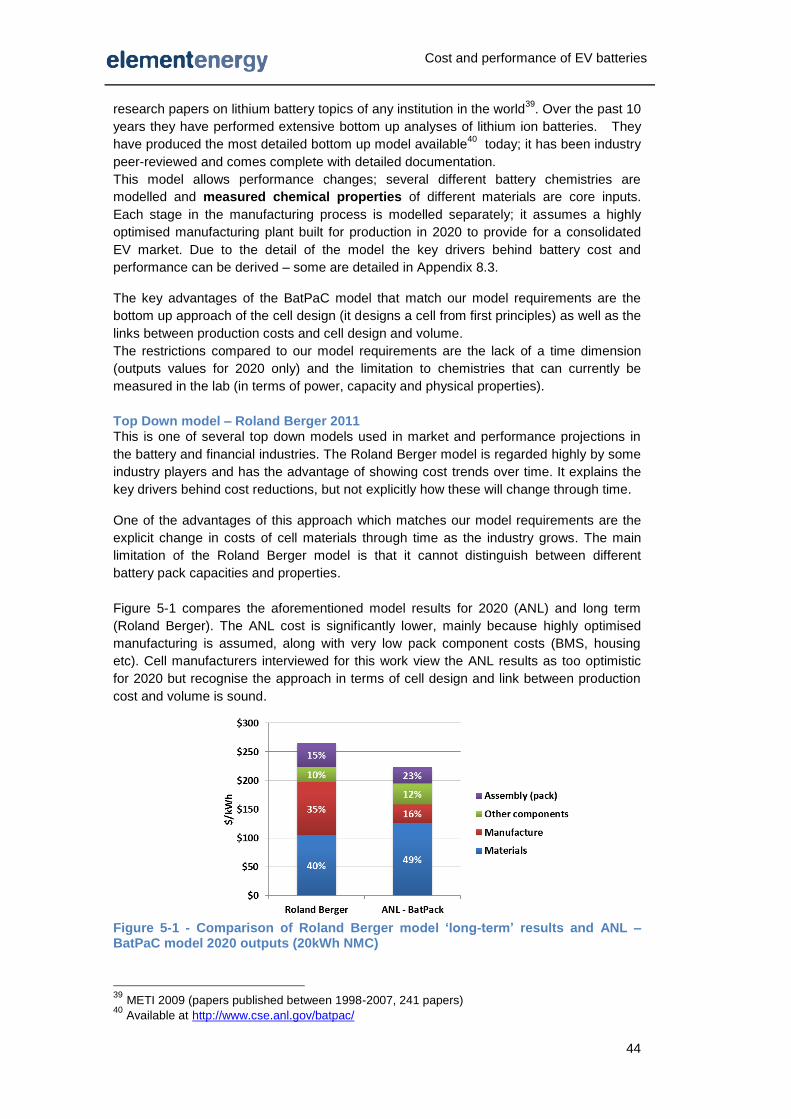
Cost and performance of EV batteries
44
research papers on lithium battery topics of any institution in the world39
. Over the past 10
years they have performed extensive bottom up analyses of lithium ion batteries. They
have produced the most detailed bottom up model available40
today; it has been industry
peer-reviewed and comes complete with detailed documentation.
This model allows performance changes; several different battery chemistries are
modelled and measured chemical properties of different materials are core inputs.
Each stage in the manufacturing process is modelled separately; it assumes a highly
optimised manufacturing plant built for production in 2020 to provide for a consolidated
EV market. Due to the detail of the model the key drivers behind battery cost and
performance can be derived – some are detailed in Appendix 8.3.
The key advantages of the BatPaC model that match our model requirements are the
bottom up approach of the cell design (it designs a cell from first principles) as well as the
links between production costs and cell design and volume.
The restrictions compared to our model requirements are the lack of a time dimension
(outputs values for 2020 only) and the limitation to chemistries that can currently be
measured in the lab (in terms of power, capacity and physical properties).
Top Down model – Roland Berger 2011 This is one of several top down models used in market and performance projections in
the battery and financial industries. The Roland Berger model is regarded highly by some
industry players and has the advantage of showing cost trends over time. It explains the
key drivers behind cost reductions, but not explicitly how these will change through time.
One of the advantages of this approach which matches our model requirements are the
explicit change in costs of cell materials through time as the industry grows. The main
limitation of the Roland Berger model is that it cannot distinguish between different
battery pack capacities and properties.
Figure 5-1 compares the aforementioned model results for 2020 (ANL) and long term
(Roland Berger). The ANL cost is significantly lower, mainly because highly optimised
manufacturing is assumed, along with very low pack component costs (BMS, housing
etc). Cell manufacturers interviewed for this work view the ANL results as too optimistic
for 2020 but recognise the approach in terms of cell design and link between production
cost and volume is sound.
Figure 5-1 - Comparison of Roland Berger model ‘long-term’ results and ANL – BatPaC model 2020 outputs (20kWh NMC)
39
METI 2009 (papers published between 1998-2007, 241 papers) 40
Available at http://www.cse.anl.gov/batpac/
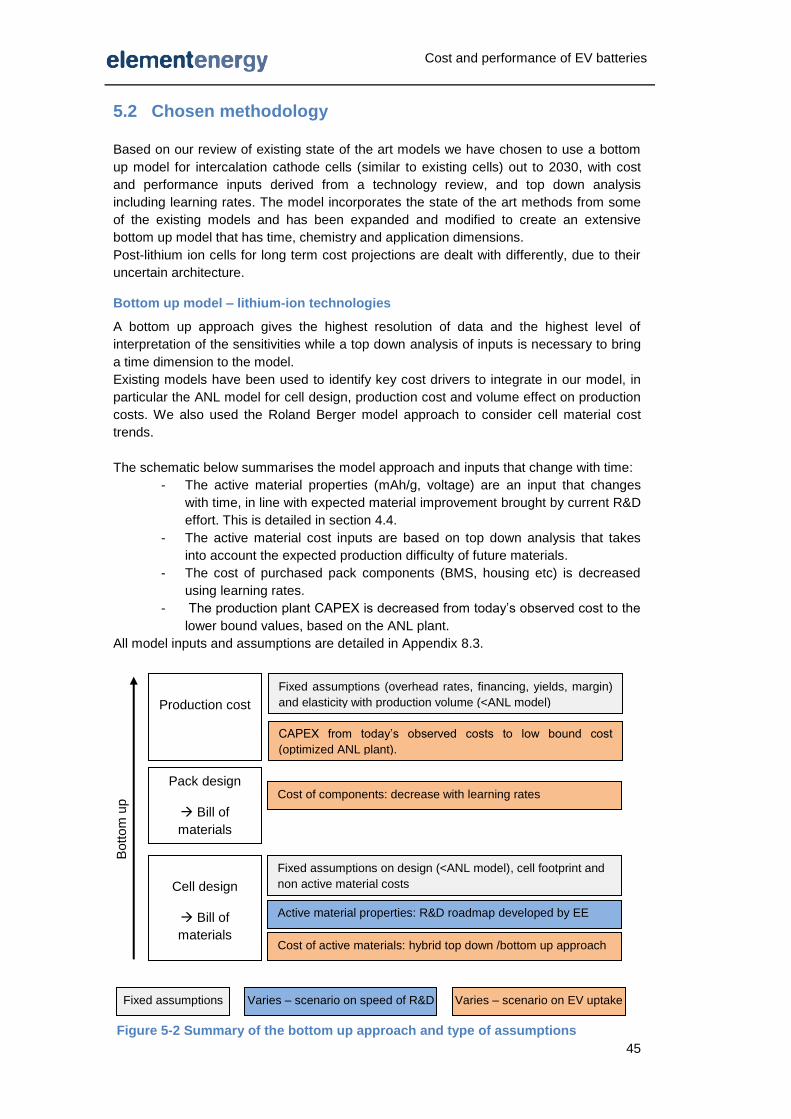
Cost and performance of EV batteries
45
5.2 Chosen methodology
Based on our review of existing state of the art models we have chosen to use a bottom
up model for intercalation cathode cells (similar to existing cells) out to 2030, with cost
and performance inputs derived from a technology review, and top down analysis
including learning rates. The model incorporates the state of the art methods from some
of the existing models and has been expanded and modified to create an extensive
bottom up model that has time, chemistry and application dimensions.
Post-lithium ion cells for long term cost projections are dealt with differently, due to their
uncertain architecture.
Bottom up model – lithium-ion technologies
A bottom up approach gives the highest resolution of data and the highest level of
interpretation of the sensitivities while a top down analysis of inputs is necessary to bring
a time dimension to the model.
Existing models have been used to identify key cost drivers to integrate in our model, in
particular the ANL model for cell design, production cost and volume effect on production
costs. We also used the Roland Berger model approach to consider cell material cost
trends.
The schematic below summarises the model approach and inputs that change with time:
- The active material properties (mAh/g, voltage) are an input that changes
with time, in line with expected material improvement brought by current R&D
effort. This is detailed in section 4.4.
- The active material cost inputs are based on top down analysis that takes
into account the expected production difficulty of future materials.
- The cost of purchased pack components (BMS, housing etc) is decreased
using learning rates.
- The production plant CAPEX is decreased from today’s observed cost to the
lower bound values, based on the ANL plant.
All model inputs and assumptions are detailed in Appendix 8.3.
Cell design
Bill of
materials
Pack design
Bill of
materials
Production cost
Fixed assumptions on design (<ANL model), cell footprint and
non active material costs
Active material properties: R&D roadmap developed by EE
) Cost of active materials: hybrid top down /bottom up approach
Cost of components: decrease with learning rates
Fixed assumptions (overhead rates, financing, yields, margin)
and elasticity with production volume (<ANL model)
and elasticity with production volume (<ANL model)
CAPEX from today’s observed costs to low bound cost
(optimized ANL plant).
Fixed assumptions Varies – scenario on speed of R&D Varies – scenario on EV uptake
Bott
om
up
Figure 5-2 Summary of the bottom up approach and type of assumptions

Cost and performance of EV batteries
46
A detailed flow diagram of the model is included in Appendix 8.2, a simplified and
annotated version of the flow diagram is shown in Figure 5-3.
Long term cost – post-lithium-ion technologies
Using the bottom up model results from 2030 as a starting point, long term costs are
estimated for lithium-air cells. The costs of the main components of the 2030 lithium-ion
cells are projected for Li-air cell based on judgement of the new materials needed. The
process is described along with results in section 7.
Pack requirements Informed from our extensive work on low carbon vehicles, combined with a NEDC drive cycle test and data from Axeon and car OEMs
• kWh required • Indicative max volume
• kW output required • Max mass
• Pack voltage requirement
Cell design module The cell design is based on the ANL model and consists of a prismatic cell. These basic design parameters have been imported but the cell footprint is set (A4).
• The cell is designed based on its chemistry and pack requirement.
• It outputs the B.O.M for a single cell and the number of cells
required.
Cell production module Capex and labour are calculated based on the ANL methodology
but calibrated against real world plants. The plant is designed based on the annual process volume (number of cells and kg of materials handled). Finance, payback and overheads are incorporated separately based on figures observed across the industry.
Packing module Packs are designed based on the vehicle type, number of cells (in
series and parallel) and kWh of the pack. This packing module has been created using Axeon data and learning rates for the different components.
• Outputs pack costs, mass and volume
Figure 5-3 – Simple bottom up model module diagram with explanations
Cost and performance of EV batteries
47
5.3 Key assumptions and scenarios
Key assumption - Standardisation and manufacturing of large cells
At the core of the model is the assumption that some degree of standardisation in large
cell manufacturing will emerge in the coming decade, in line with the CCC transport
roadmap that envisages policy support that stimulates electric vehicle uptake.
It is assumed that manufacturing improvements will make standardised quality large cells
achievable, at high production yields, by 2015. The adjective ‘quality’ refers here to the
high standard of consistency, safety and life that automotive packs require.
EV uptake and production volumes
In the model, three cost areas are affected by standardisation and learning brought by
cumulative production: cell material costs, cell production (plant capacity and CAPEX),
packing costs.
The production costs are based on the methodology developed by ANL for their BatPaC
model. It reproduces the relationships between volume (e.g. quantity of material handled,
number of cells produced) and manufacturing cost. The ANL BatPaC plant costs are used
as the lower bound of our CAPEX plant costs; it assumes a highly optimised plant,
producing one type of cell, operating after a large adoption of EVs.
This lower bound manufacturing cost, corresponding to a consolidated EV market, is
assumed to be reached by 2025 in the base case. This would correspond to a global EV
uptake following the same trajectory as HEVs since 2000, thanks to policy support in
developed countries, to reach around 1% of global sales by 2020 (~4million cumulative
sales).
Cell production assumptions, material costs and packing costs are detailed in section 8.3.
Material improvement
It is expected that the current R&D on cell materials will deliver increased energy density
and bring new, cheaper materials into cells. Several R&D scenarios have been developed
around this theme, presented in section 4.4.
In the baseline scenario, lithium-ion cells answering the automotive market needs (safety,
power, life) exceed 200Wh/kg by 2020 and reaches 290Wh/kg by 2030.
Post-lithium-ion chemistries, represented by lithium-air, would deliver up to 1000Wh/kg.
Scenarios
The baseline technology roadmap together with the central EV uptake constitutes the
base case of the lithium-ion battery model. The central EV uptake scenario represents a
successful trajectory for EVs, i.e. their uptake, supported by policy, increases steadily and
advances in materials bring high energy density cells.
Two other scenarios have been developed to represent alternative narratives. A more
conservative scenario (‘Niche EV’) sees slower material improvements and no EV uptake
beyond niche or localised markets while the third scenario is very optimistic (‘EV push’).
In the ‘Niche EV’ scenario, progress on materials is made, and cell production costs do
decrease over time, despite the globally low uptake of EVs. It is assumed other emerging
large cell markets (e.g. grid back up) will grow and contribute to innovation and cost
reduction.

Cost and performance of EV batteries
48
The ‘EV push’ scenario corresponds to quick EV uptake and material improvements,
bringing the production costs to their optimized level as early as 2020. The table below
summarises the scenarios.
Table 5-3 Main model assumptions and scenarios
Scenario R&D path EV uptake
Niche EV
Slow R&D
This is a conservative
scenario.
Some scientific challenges
do not get overcome (5V
electrolyte, capacity
cathode >200mAh/g).
Overall little/slow material
improvement, silicon blend
anode from 2025.
Cells at 200Wh/kg by 2020
and 260Wh/kg by 2030.
Low uptake
Lack of strong policy support and no
rapid improvement in
cost/performance of EVs means EVs
stay a niche product for at least a
decade (<1% global sales by 2020).
This corresponds to 3 million
cumulative sales by 2020.
Learning brought by cumulative
production drives the cell production
cost (CAPEX) down. The low EV
uptake means the production cost are
not optimized before 2030.
Baseline case
Steady EV
Baseline R&D
Baseline scenario.
Existing materials improve
and new materials get
developed. 5V cells
become possible. Silicon
blend anode from 2020.
Cells at 250Wh/kg by 2020
and 290Wh/kg by 2030.
Baseline uptake
Plug-in vehicle uptake follows the
same path as hybrid vehicles since
2000, thanks to policy support in
developed countries.
This corresponds to 4 million
cumulative sales by 2020.
Learning brought by cumulative
production means production costs
are optimized by 2025.
EV push
Fast R&D
This is an
aggressive/optimistic
scenario.
Faster introduction of the
baseline R&D. Material
breakthrough introduced as
soon as 2015.
Cells at 280Wh/kg by 2020
and 300Wh/kg by 2030.
Stretch uptake
In line with the CCC central scenario
of uptake in the UK – this
corresponds to a strong global policy
push, delivering over 5% EV uptake
at global level by 2020.
This corresponds to 16 million
cumulative sales by 2020.
The fast uptake means production
costs are optimized by 2020.
More details on
assumptions
provided in:
Section 4.4
Appendix 8.3.2
Appendix 8.3.3 for cell material costs
Appendix 8.3.4 for production costs
Appendix 8.3.5 for packing costs
Cost and performance of EV batteries
49
Caveat on PHEV results
PHEV cells differ from BEV cells in their relative power requirements, with PHEV cells
having a higher power to energy ratio. This makes their cost very sensitive to defined
vehicle power requirement. Results shown for PHEV cells are therefore very dependent
on the definition of the modelled vehicles and are by no means applicable to all kinds of
PHEVs. Power capability of future materials is also poorly documented. While the energy
content is an intrinsic characteristic property of a given material, i.e. the theoretical energy
density can be calculated from the molecular weight of material, power (speed of release
of the energy) must be measured and varies with parameters such state of charge of the
cell and cell design parameters. PHEV results have therefore been run only for existing
cathode chemistries (LMO, LFP) or chemistries with similar power capability to existing
chemistries (LMNO).
Summary
Based on a review of existing models, a bottom up approach to cost modelling of
lithium-ion cells was selected. Key cell design assumptions and the elasticity of
production costs to the volume of material handled are based on the state of art,
peer-reviewed model, developed by Argonne National Laboratory.
Key cost inputs feeding the bottom up model are developed through a top down
approach, e.g. learning rates are applied to pack components.
At the core of the model is the assumption that some degree of standardisation in
large cell manufacturing will emerge in the coming decade, in line with the CCC
transport roadmap that envisages a policy support that stimulates the uptake of
electric vehicles.
Scenarios have been developed around the anticipated main cost reduction
drivers: the improvement in material properties delivering higher energy densities
(based on technology roadmaps) and the speed of cost reduction of
manufacturing & material cost (based on EV uptake assumptions).
Costs of long term post lithium-ion technologies cannot be modelled directly with
a bottom-up approach. Their cost is modelled on an estimate of lithium-air battery
cost that takes into account the technology barriers to be overcome.
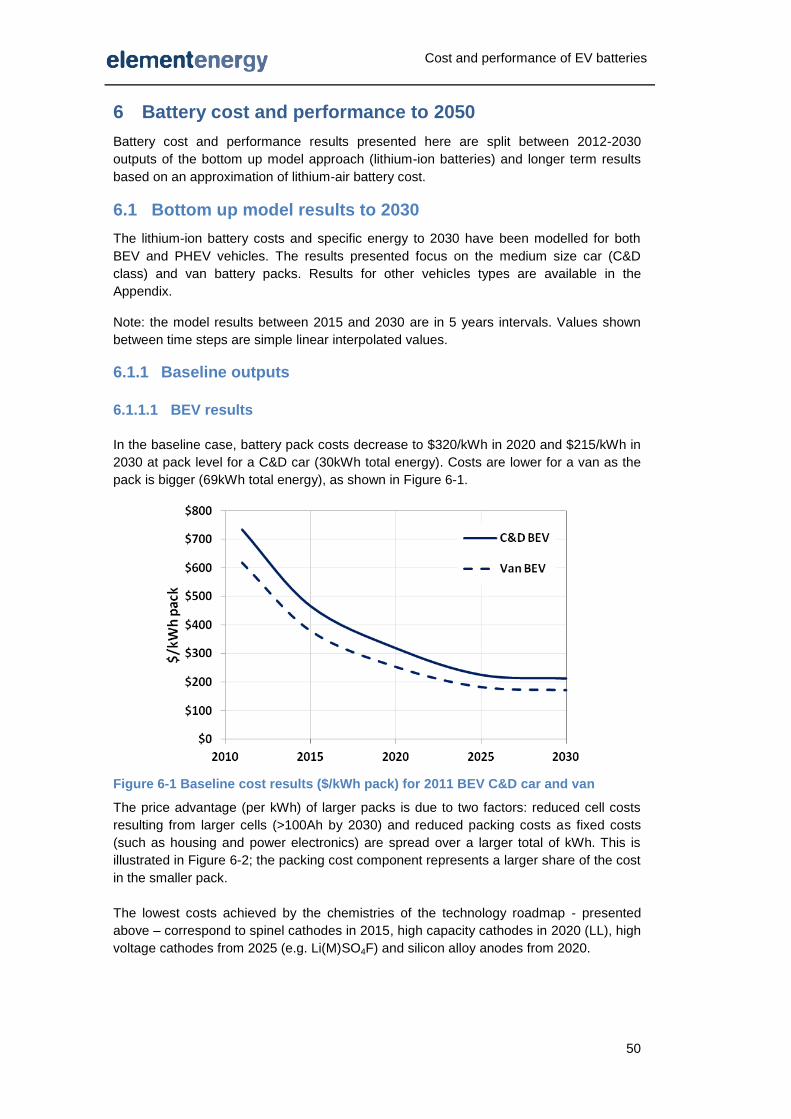
Cost and performance of EV batteries
50
6 Battery cost and performance to 2050
Battery cost and performance results presented here are split between 2012-2030
outputs of the bottom up model approach (lithium-ion batteries) and longer term results
based on an approximation of lithium-air battery cost.
6.1 Bottom up model results to 2030
The lithium-ion battery costs and specific energy to 2030 have been modelled for both
BEV and PHEV vehicles. The results presented focus on the medium size car (C&D
class) and van battery packs. Results for other vehicles types are available in the
Appendix.
Note: the model results between 2015 and 2030 are in 5 years intervals. Values shown
between time steps are simple linear interpolated values.
6.1.1 Baseline outputs
6.1.1.1 BEV results
In the baseline case, battery pack costs decrease to $320/kWh in 2020 and $215/kWh in
2030 at pack level for a C&D car (30kWh total energy). Costs are lower for a van as the
pack is bigger (69kWh total energy), as shown in Figure 6-1.
Figure 6-1 Baseline cost results ($/kWh pack) for 2011 BEV C&D car and van
The price advantage (per kWh) of larger packs is due to two factors: reduced cell costs
resulting from larger cells (>100Ah by 2030) and reduced packing costs as fixed costs
(such as housing and power electronics) are spread over a larger total of kWh. This is
illustrated in Figure 6-2; the packing cost component represents a larger share of the cost
in the smaller pack.
The lowest costs achieved by the chemistries of the technology roadmap - presented
above – correspond to spinel cathodes in 2015, high capacity cathodes in 2020 (LL), high
voltage cathodes from 2025 (e.g. Li(M)SO4F) and silicon alloy anodes from 2020.

Cost and performance of EV batteries
51
Figure 6-2 Cell and packing cost split in 2020 for the four defined BEV types
The specific energy of battery packs increases from around 100Wh/kg today to 150Wh/kg
in 2020 and 185Wh/kg from 2025 at pack level for a C&D car. As with costs, bigger packs
are at an advantage because the packing weight overhead is spread over more kWh; see
Figure 6-3.
Figure 6-3 Baseline specific energy results (Wh/kg pack) for BEVs
Life expectancy
Today’s cells can achieve a 10 year life and over 1,000 cycles at 100% DOD in laboratory
conditions (albeit with variations in life performance across the different cathode
chemistries, see 3.2). In the field, these figures should be achievable under temperate
climates and provided a thermal management system keeps the cells at their optimum
temperature range. In the model, advanced thermal management costs are accounted
for, even in the long term.
Based on the expected improvements in thermal control and management, it is
reasonable to assume that future cells will achieve a 12 year lifetime (temperate climates)
and at least 1,000 cycles at 100%DOD41
from 2020.
If the packs are oversized to restrict the useable DOD/SOC window to 80%, this cycle life
can increase to 1,500 cycles42
. For a 2020 C&D car this translates to a distance limit of
41
Reminder: 100% DOD is used for cell testing/benchmarking but not on cells used in vehicles.
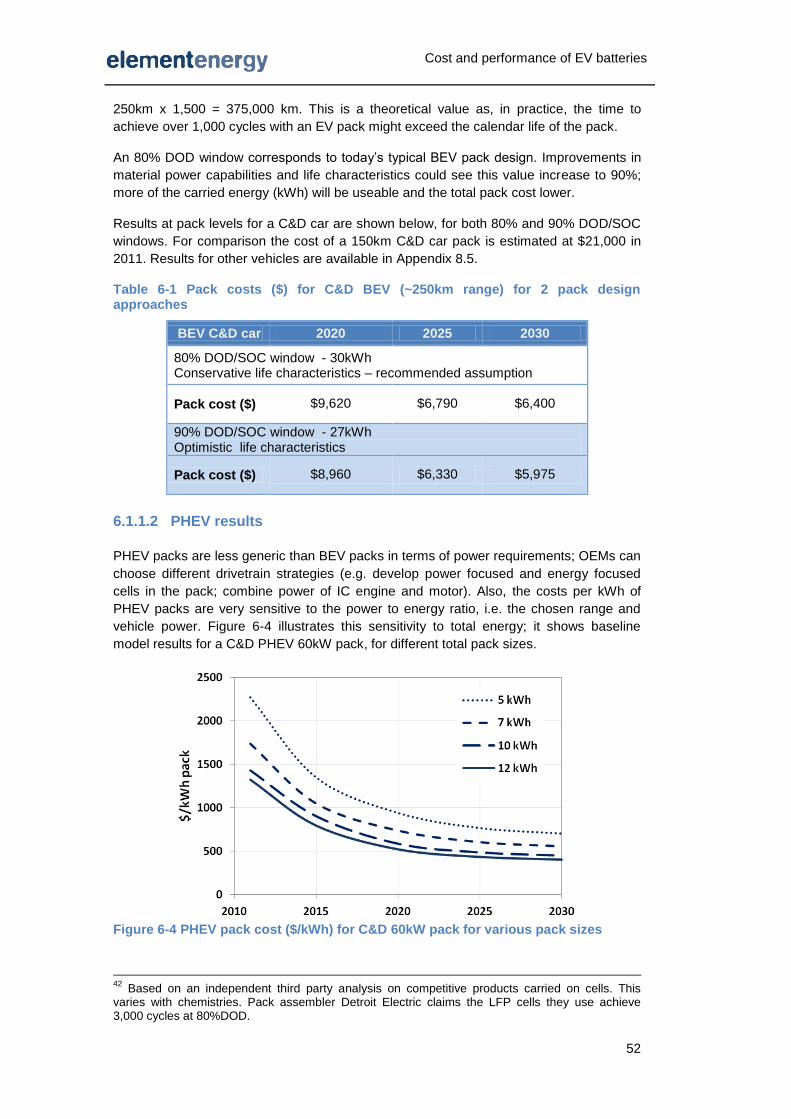
Cost and performance of EV batteries
52
250km x 1,500 = 375,000 km. This is a theoretical value as, in practice, the time to
achieve over 1,000 cycles with an EV pack might exceed the calendar life of the pack.
An 80% DOD window corresponds to today’s typical BEV pack design. Improvements in
material power capabilities and life characteristics could see this value increase to 90%;
more of the carried energy (kWh) will be useable and the total pack cost lower.
Results at pack levels for a C&D car are shown below, for both 80% and 90% DOD/SOC
windows. For comparison the cost of a 150km C&D car pack is estimated at $21,000 in
2011. Results for other vehicles are available in Appendix 8.5.
Table 6-1 Pack costs ($) for C&D BEV (~250km range) for 2 pack design approaches
BEV C&D car 2020 2025 2030
80% DOD/SOC window - 30kWh Conservative life characteristics – recommended assumption
Pack cost ($) $9,620 $6,790 $6,400
90% DOD/SOC window - 27kWh Optimistic life characteristics
Pack cost ($) $8,960 $6,330 $5,975
6.1.1.2 PHEV results
PHEV packs are less generic than BEV packs in terms of power requirements; OEMs can
choose different drivetrain strategies (e.g. develop power focused and energy focused
cells in the pack; combine power of IC engine and motor). Also, the costs per kWh of
PHEV packs are very sensitive to the power to energy ratio, i.e. the chosen range and
vehicle power. Figure 6-4 illustrates this sensitivity to total energy; it shows baseline
model results for a C&D PHEV 60kW pack, for different total pack sizes.
Figure 6-4 PHEV pack cost ($/kWh) for C&D 60kW pack for various pack sizes
42
Based on an independent third party analysis on competitive products carried on cells. This varies with chemistries. Pack assembler Detroit Electric claims the LFP cells they use achieve 3,000 cycles at 80%DOD.

Cost and performance of EV batteries
53
The cost per kWh of small 5kWh packs43
is 80% higher than for 12kWh packs in 2020
($940/kWh Vs. $525/kWh), i.e. small packs are relatively uneconomical. Doubling the
pack size to 10kWh comes at only a 25-30% premium on the total pack cost, at $14,335
for 10kWh compared to $11,370 for 5kWh in 2011.
This mitigates against one of the proposed advantages of PHEV’s, that the smaller
battery capacity leads to proportionally lower cost. This indicates that plug-in hybrid
drivetrains might not be appropriate for small city cars that have low energy consumption
but might rather be more suited to upper end car segments. It also means PHEV pack
costs should always indicate the pack size assumption and not be linearly scaled from
BEV pack costs and capacity.
Figure 6-5 shows the specific energy trajectory for two PHEV packs. As for BEVs, larger
packs have both an energy density benefit and cost benefit, in part due to the lower
packing cost per kWh of larger packs; see Figure 6-6.
Figure 6-5 Baseline specific energy results (Wh/kg pack) for PHEVs
Figure 6-6 Cell and packing cost split in 2020 for PHEVs packs
43
A 5kWh pack with a 70% usable window corresponds to 20-25km electric range based on today’s vehicle estimated energy consumption of 0.155 kWh/km for a C&D class vehicle.
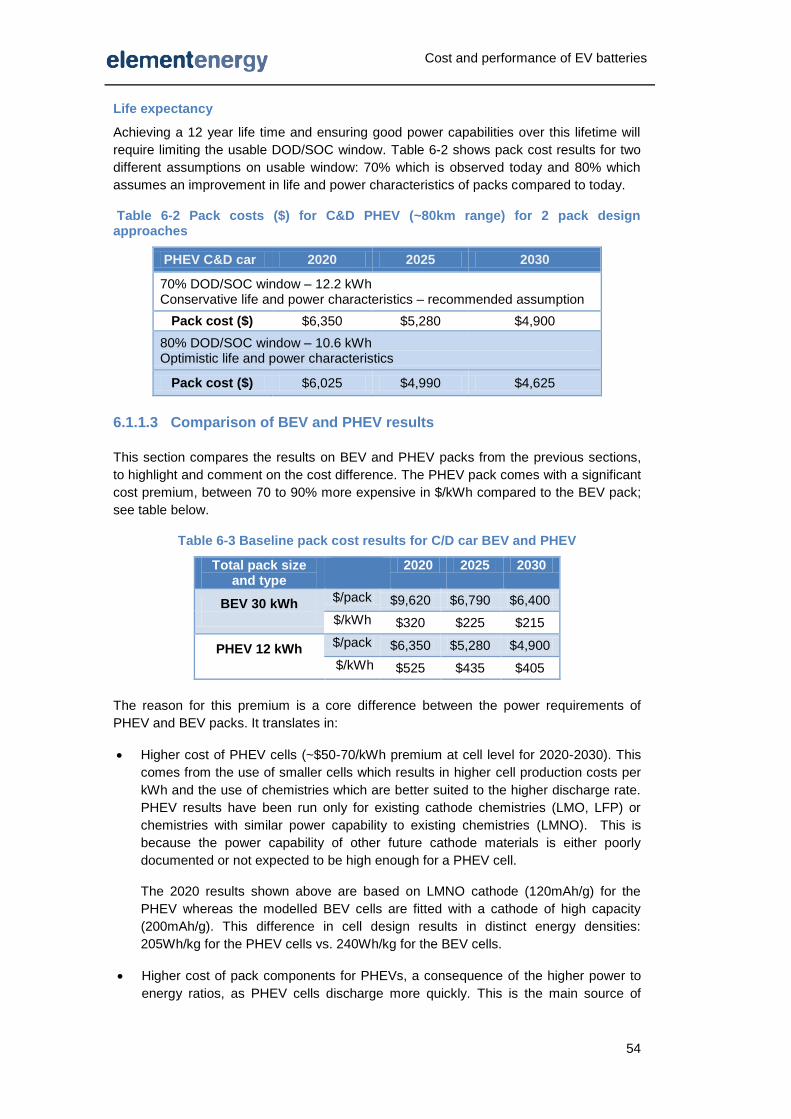
Cost and performance of EV batteries
54
Life expectancy
Achieving a 12 year life time and ensuring good power capabilities over this lifetime will
require limiting the usable DOD/SOC window. Table 6-2 shows pack cost results for two
different assumptions on usable window: 70% which is observed today and 80% which
assumes an improvement in life and power characteristics of packs compared to today.
Table 6-2 Pack costs ($) for C&D PHEV (~80km range) for 2 pack design approaches
PHEV C&D car 2020 2025 2030
70% DOD/SOC window – 12.2 kWh Conservative life and power characteristics – recommended assumption
Pack cost ($) $6,350 $5,280 $4,900
80% DOD/SOC window – 10.6 kWh Optimistic life and power characteristics
Pack cost ($) $6,025 $4,990 $4,625
6.1.1.3 Comparison of BEV and PHEV results
This section compares the results on BEV and PHEV packs from the previous sections,
to highlight and comment on the cost difference. The PHEV pack comes with a significant
cost premium, between 70 to 90% more expensive in $/kWh compared to the BEV pack;
see table below.
Table 6-3 Baseline pack cost results for C/D car BEV and PHEV
Total pack size and type
2020 2025 2030
BEV 30 kWh
$/pack $9,620 $6,790 $6,400
$/kWh $320 $225 $215
PHEV 12 kWh
$/pack $6,350 $5,280 $4,900
$/kWh $525 $435 $405
The reason for this premium is a core difference between the power requirements of
PHEV and BEV packs. It translates in:
Higher cost of PHEV cells (~$50-70/kWh premium at cell level for 2020-2030). This
comes from the use of smaller cells which results in higher cell production costs per
kWh and the use of chemistries which are better suited to the higher discharge rate.
PHEV results have been run only for existing cathode chemistries (LMO, LFP) or
chemistries with similar power capability to existing chemistries (LMNO). This is
because the power capability of other future cathode materials is either poorly
documented or not expected to be high enough for a PHEV cell.
The 2020 results shown above are based on LMNO cathode (120mAh/g) for the
PHEV whereas the modelled BEV cells are fitted with a cathode of high capacity
(200mAh/g). This difference in cell design results in distinct energy densities:
205Wh/kg for the PHEV cells vs. 240Wh/kg for the BEV cells.
Higher cost of pack components for PHEVs, a consequence of the higher power to
energy ratios, as PHEV cells discharge more quickly. This is the main source of

Cost and performance of EV batteries
55
added cost as shown by the comparison of cost breakdown ($/kWh) for BEV and
PHEV packs in Figure 6-7.
Figure 6-7 Pack cost ($/kWh) comparison in 2020 for BEV and PHEV applications.
Figure 6-8 gives a cost breakdown of the pack components. The main difference between
the BEV and PHEV are:
Power electronics: the smaller PHEV packs have to provide the same overall
power, and so the specific discharge rate per cell (‘C rate’) is higher. The higher
rated connectors and cables in a PHEV translate into a higher cost per kWh.
Thermal management and cell internal support: the cells of the PHEV pack are
placed in a more complex cooling matrix; they are liquid cooled whereas BEV
packs are currently air cooled and are assumed to remain so in the future. Liquid
cooling is more appropriate for both power reasons (the higher discharge rates
generate more heat) and for space constraint reasons: it requires less space
between the cells and so the IC engine can also be accommodated in the PHEV.
Liquid cooling offers a better temperature control than forced air but however
comes at a cost premium.
The battery management system (BMS): both the hardware and software are more
expensive, as a result of the more complex balancing44
required by PHEV packs.
The lower charge/discharge requirements (‘C rating’) of BEV packs means they
can be balanced during recharging while stationary. With PHEVs, the operational
cycle (requiring the battery to be charged while the vehicle is in motion) combined
with higher C ratings, requires the pack to be actively balanced throughout
charging and discharging. This means that the balance leads (required for each of
the cells in series) will need to be rated more highly and therefore be more
expensive in a PHEV pack.
For both the BEV and PHEV packs, some components have a fixed cost element e.g.
power electronics, housing. The voltage of the modelled pack is constant (regardless of
44
Lithium-ion packs need to be frequently balanced i.e. cell voltages are equalised across the
pack. The cells level of energy is balanced to ensure homogenous performance and ageing among the cells. Cells with higher level of capacity left can be discharged (passive balancing) or energy can be transferred between cells (active balancing)

Cost and performance of EV batteries
56
the pack size in kWh), which means that the components which have a cost proportional
to the number of cells (e.g. BMS) will have approximately the same cost in $/pack.
For these reasons, increasing the total PHEV pack kWh brings the cost $/kWh down, as
shown in Figure 6-4. In the model, it is assumed OEMs will take advantage of this cost
curve and favour relatively large packs: an 80km electric range is modelled for future
PHEVs.
Figure 6-8 Comparison of cost of pack components ($/kWh) in 2020
This cost reduction with size, as well as the large cost premium of PHEV pack over BEV
pack (see Table 6-3), seem to imply that a very large pack could be fitted in a PHEV for
little extra cost. Certainly it is the case that the model indicates that the optimum PHEV
pack size is hard to define, and that in practice, the assumptions made here about PHEV
pack size could be challenged.
Currently OEMs are developing PHEVs with relatively small pack sizes, to limit overall
vehicle costs. The modelling indicates that PHEV pack size could increase without
significant cost impact. As pack size increases, it is the case that certain cost elements
such as air/liquid cooling, or passive/active balancing, bring “step changes” in costs. An
optimum PHEV pack size may be near to one of these step changes. (Similarly, the cost
optimum BEV size could be less than indicated here, i.e. reduced towards a threshold
beyond which liquid cooling would be required). In consultation with our packing experts,
we conclude that the baseline 12kWh pack is far from one of these thresholds, but with
16kWh and beyond it may be the case that the pack could be fundamentally redesigned.
Figure 6-9 compares the PHEV results for the baseline 12kWh pack and 16kWh45
, the
size beyond which we estimate our PHEV model becomes invalid. The graph also shows
the cost of a BEV 20 kWh pack (energy cells, air cooled) to give a perspective on the cost
premium.
We do not suggest OEMs would choose to fit such a large pack in a PHEV; in fact based
on our knowledge of vehicle powertrain costs and exchange with industry players, it
seems that, currently, beyond a certain pack size, a BEV architecture will be preferred
over the PHEV configuration.
45
See in Appendix page 87 for details on cost breakdown.
Thermal
control
system
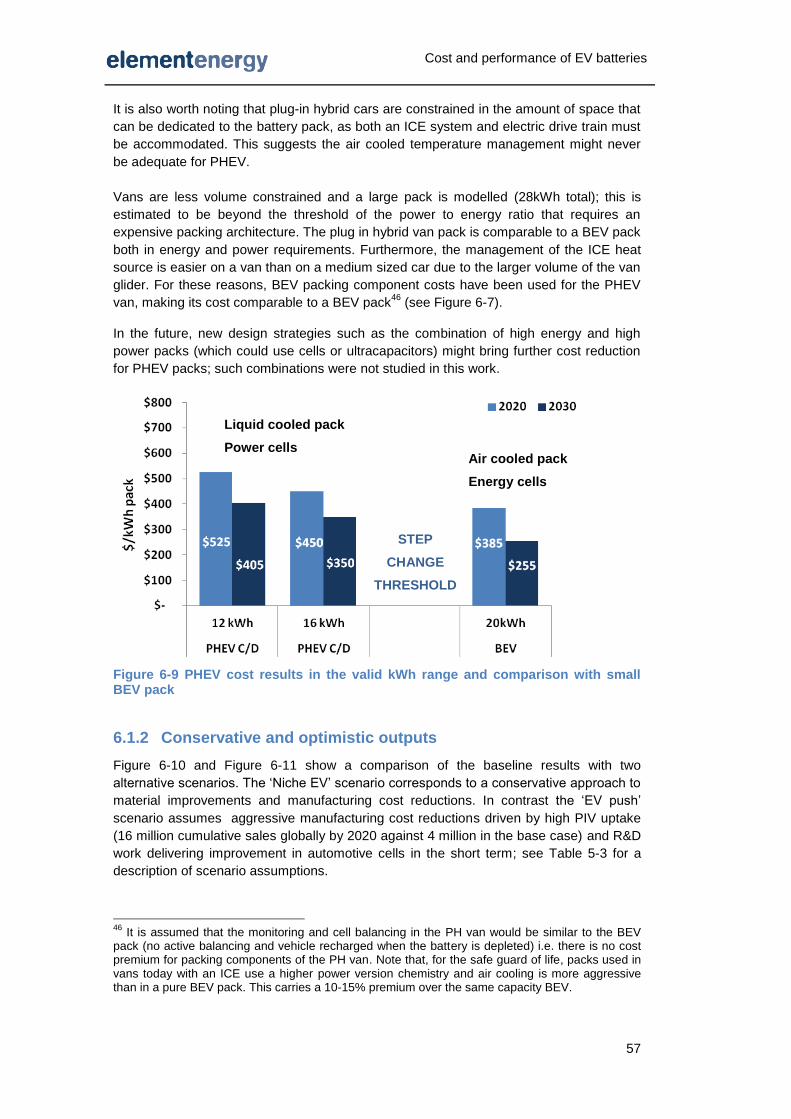
Cost and performance of EV batteries
57
It is also worth noting that plug-in hybrid cars are constrained in the amount of space that
can be dedicated to the battery pack, as both an ICE system and electric drive train must
be accommodated. This suggests the air cooled temperature management might never
be adequate for PHEV.
Vans are less volume constrained and a large pack is modelled (28kWh total); this is
estimated to be beyond the threshold of the power to energy ratio that requires an
expensive packing architecture. The plug in hybrid van pack is comparable to a BEV pack
both in energy and power requirements. Furthermore, the management of the ICE heat
source is easier on a van than on a medium sized car due to the larger volume of the van
glider. For these reasons, BEV packing component costs have been used for the PHEV
van, making its cost comparable to a BEV pack46
(see Figure 6-7).
In the future, new design strategies such as the combination of high energy and high
power packs (which could use cells or ultracapacitors) might bring further cost reduction
for PHEV packs; such combinations were not studied in this work.
Figure 6-9 PHEV cost results in the valid kWh range and comparison with small BEV pack
6.1.2 Conservative and optimistic outputs
Figure 6-10 and Figure 6-11 show a comparison of the baseline results with two
alternative scenarios. The ‘Niche EV’ scenario corresponds to a conservative approach to
material improvements and manufacturing cost reductions. In contrast the ‘EV push’
scenario assumes aggressive manufacturing cost reductions driven by high PIV uptake
(16 million cumulative sales globally by 2020 against 4 million in the base case) and R&D
work delivering improvement in automotive cells in the short term; see Table 5-3 for a
description of scenario assumptions.
46
It is assumed that the monitoring and cell balancing in the PH van would be similar to the BEV pack (no active balancing and vehicle recharged when the battery is depleted) i.e. there is no cost premium for packing components of the PH van. Note that, for the safe guard of life, packs used in vans today with an ICE use a higher power version chemistry and air cooling is more aggressive than in a pure BEV pack. This carries a 10-15% premium over the same capacity BEV.
Liquid cooled pack
Power cells Air cooled pack
Energy cells
STEP
CHANGE
THRESHOLD

Cost and performance of EV batteries
58
In the ‘EV push’ scenario, results for cost and energy density that are equivalent to those
in the baseline scenario are obtained earlier: $245/kWh and 165Wh/kg (pack level) by
2020 against approximately 2023 in the baseline case. Both baseline and EV push
scenarios plateau at the same values (although costs are slightly lower in the optimistic
scenario as material costs decrease further due to the higher cumulative production)
because both scenarios get to the limit of intercalation in terms of energy density.
Reaching this cost plateau relies on the development of high voltage cells, a scientific
challenge not guaranteed to be overcome.
Figure 6-10 Pack costs ($/kWh) for C&D BEV for various scenarios
The niche EV scenario assumes more modest technology development and so
represents a lower risk future. Results ($/kWh and Wh/kg) equivalent to those from the
baseline in 2020 are in this case delayed to approximately 2024.
Figure 6-11 Pack specific energy (Wh/kg) for C&D BEV for various scenarios
Note that the cost ranges created by the conservative and optimistic scenarios and
presented here do not imply lower and upper cost bounds. Rather each scenario
represents a reasonably realistic set of conclusions following changes in market uptake
and speed of technology development. Many of the cost improvements rely on the
practical deployment of technology improvements, which may not occur in practice. For
illustration of cost sensitivity and alternative costs, see Appendix 8.4.

Cost and performance of EV batteries
59
6.2 Long term cost and performance
A lithium-air battery is used to represent post-lithium-ion technologies and estimate long
term battery costs.
From the presentation of lithium-air cells and their key challenges (section 4.2.6) it should
be clear that the fundamental scientific uncertainty in the production of a practical Li-air
cell will limit the confidence in any projection of cost and performance, particularly when
the actual production of a practical cell is many years away. In developing the model
approach, we have adopted a relatively transparent and defensible methodology.
Performance
Based on the observed ratio of practical to theoretical specific energy for a range of
batteries (typically 30%, range of 20-40%), a practical Li-air cell specific energy can be
estimated to be 500 - 1,000Wh/kg. The lower estimate would correspond to high lithium
overloading (to replace the lost material consumed during operation) while the high
estimate assumes better lithium cycling efficiency.
The practical volumetric energy density is particularly sensitive to the amount of excess
lithium needed. This could range from 500Wh/l to 800Wh/l. These speculative ranges are
wide as Li-air cells are currently only laboratory experiments.
The range of 500-1000Wh/kg is in line with most academic predictions. It should be noted
that many commercial predictions are much higher. It is possible that they incorrectly
quote figures of energy density of the reduction of pure lithium, or the production of Li2O,
or not count the oxygen as a component in the system.
Cost
A practical Li-air cell has yet to be constructed; hence estimates of practical cell cost must
be treated with caution. Similar chemistries and electrochemical devices such as Li-ion
cells, and fuel cells (FC), are reasonable proxies for some elements of a future Li-air cell
and pack; they are used to estimate future cost.
Comparing a 2030 high performance Li-ion cell and a Li-air cell, the main differences are:
• The Li-ion cell may use lithium metal oxide or polyanion cathode – Li-O2 requires
a much more complex porous carbon substrate, with a layer impermeable to CO2.
• Li-ion anodes may use carbon or silicon alloy – Li-O2 uses lithium metal.
• Li-O2 will require the development of more exotic electrolytes, possibly with a cost
premium.
On a pack level, a Li-O2 system will require an air management system while a Li-ion
does not (except indirectly when air cooling). This would require air systems similar to
those required in fuel cells. Furthermore, the lower voltage of a Li-O2 cell results in the
need for more cells to maintain overall pack/system voltage, with an increase in cost.
The two tables below represent a reasonable lower and an upper-bound to the projected
costs for a Li-air battery pack.
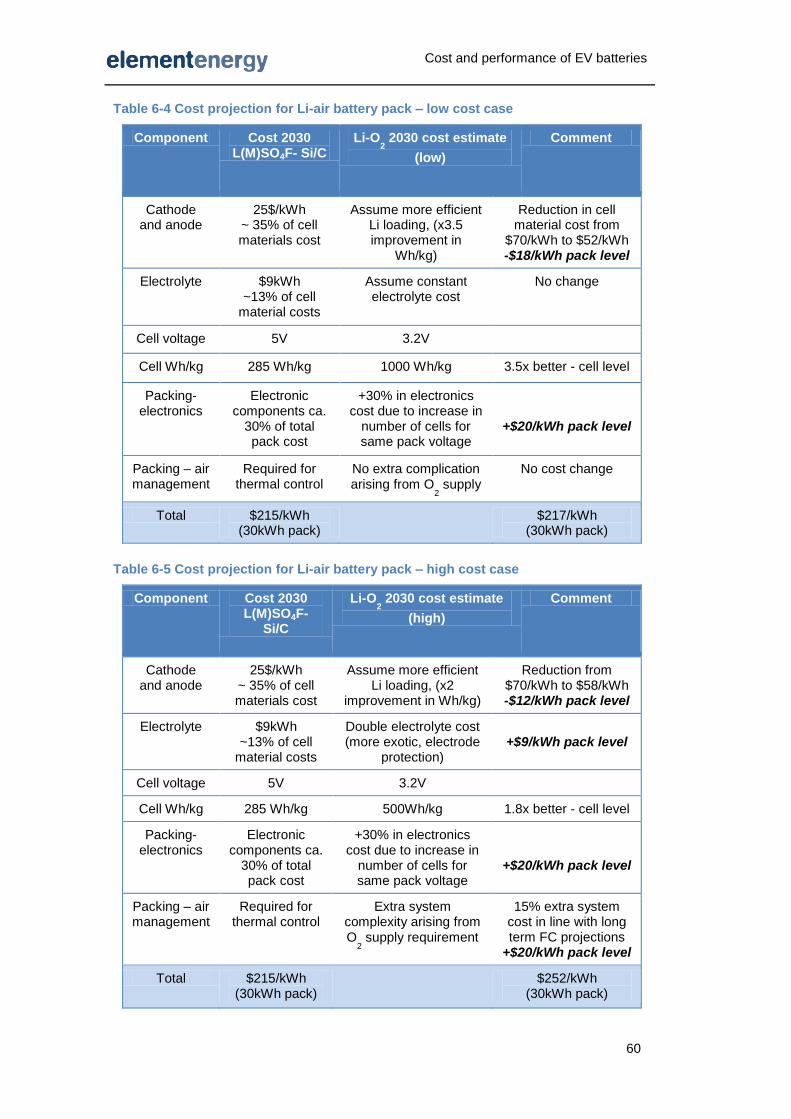
Cost and performance of EV batteries
60
Table 6-4 Cost projection for Li-air battery pack – low cost case
Component Cost 2030 L(M)SO4F- Si/C
Li-O2 2030 cost estimate
(low)
Comment
Cathode and anode
25$/kWh ~ 35% of cell materials cost
Assume more efficient Li loading, (x3.5 improvement in
Wh/kg)
Reduction in cell material cost from
$70/kWh to $52/kWh -$18/kWh pack level
Electrolyte
$9kWh ~13% of cell
material costs
Assume constant electrolyte cost
No change
Cell voltage 5V 3.2V
Cell Wh/kg 285 Wh/kg 1000 Wh/kg 3.5x better - cell level
Packing- electronics
Electronic components ca.
30% of total pack cost
+30% in electronics cost due to increase in
number of cells for same pack voltage
+$20/kWh pack level
Packing – air management
Required for thermal control
No extra complication arising from O
2 supply
No cost change
Total $215/kWh (30kWh pack)
$217/kWh (30kWh pack)
Table 6-5 Cost projection for Li-air battery pack – high cost case
Component Cost 2030 L(M)SO4F-
Si/C
Li-O2 2030 cost estimate
(high)
Comment
Cathode and anode
25$/kWh ~ 35% of cell materials cost
Assume more efficient Li loading, (x2
improvement in Wh/kg)
Reduction from $70/kWh to $58/kWh -$12/kWh pack level
Electrolyte
$9kWh ~13% of cell
material costs
Double electrolyte cost (more exotic, electrode
protection)
+$9/kWh pack level
Cell voltage 5V 3.2V
Cell Wh/kg 285 Wh/kg 500Wh/kg 1.8x better - cell level
Packing- electronics
Electronic components ca.
30% of total pack cost
+30% in electronics cost due to increase in
number of cells for same pack voltage
+$20/kWh pack level
Packing – air management
Required for thermal control
Extra system complexity arising from O
2 supply requirement
15% extra system cost in line with long term FC projections
+$20/kWh pack level
Total $215/kWh (30kWh pack)
$252/kWh (30kWh pack)

Cost and performance of EV batteries
61
While reiterating that such estimates must be treated with extreme caution, it is important
to observe the following points involved in the previous estimates:
The anode/cathode materials of high performance Li-ion cells account for 35% of cell
material cost, and cell materials account for c. 30% of final pack cost in the modelled
2030 Li-ion pack. Therefore, the cost reduction on electrode material brought by a Li-
air technology with very efficient lithium loading is expected to benefit a relatively small
proportion of the overall cost.
Although the high energy density of lithium air could translate in high capacity cells (in
Ah/cell), the low voltage of each cells means the overall number of cells will be greater
than for a 2030 lithium-ion pack to achieve 300V. Therefore lithium-air packs are not
likely to benefit from the cost reductions in production line and packing usually
expected from a reduced number of cells per kWh (outlined in Table 8-4, page 74). As
mentioned in section 2.2.4, lowering the system voltage requirement would enable
some cost reduction at the pack level but would effectively displace the cost to other
part of the vehicle (e.g. electric motor). This trade-off was not studied here.
There is the potential for cost increases in some system elements arising from Li-air,
including battery BMS and air management.
Overall therefore, while it is reasonable to expect that a successful Li-air pack could
provide significant weight savings for a fixed kWh of stored energy, we cannot find a
reasonable basis for expecting $/kWh pack costs to be significantly different from
projected 2030 (high performance) Li-ion figures. The overall cost and performance
trajectory result is shown on the graph below. Li-air cell energy density has been
converted to pack level density by adding the same pack component weight as observed
in for Li-ion packs in 2030.
Figure 6-12 Long term cost and performance trajectories for BEV 30 kWh pack
Projections of timescales for the achievement of such outcomes are exposed to as much
uncertainty as projections of cost and performance. In developing temporal estimates, we
note the following:
“Automotive propulsion batteries are just beginning the transition from nickel metal
hydride to Li-ion batteries, after nearly 35 years of research and development on the
latter. The transition to Li-air batteries (if successful) should be viewed in terms of a
similar development cycle.47
”
47
Lithium-Air Battery: Promise and Challenges G. Girishkumar,* B. McCloskey, A. C. Luntz, S. Swanson, and W. Wilcke, IBM research 2010.

Cost and performance of EV batteries
62
It is reasonable to assume that projected developments in practical Li-air batteries in
automotive applications should arise in the period 2030-2050.
6.3 Interpretation
The baseline results show that incremental improvements of lithium-ion batteries and
production cost reduction through volume production could cut the pack cost of a medium
size car down to $215/kWh by 2030; this is a ca. 70% reduction compared to today’s
costs.
Cost reductions due to improvements in materials (higher energy density)
The main driver behind this cell cost reduction is the improvement of active materials –
i.e. higher energy densities – which reduces the amount of both active and non active
material needed per kWh.
The effect of improvement in active materials is illustrated in Figure 6-13; it shows the cell
cost reduction for the three technology roadmaps when material costs and production
parameters are kept constant, and so only the material properties such as voltage and
capacity mAh/g change with time.
Delivering the assumed material improvements requires overcoming several scientific
challenges, such as developing an electrolyte compatible with high voltage cathode. The
consumer electronics market for cells is driving innovation and will continue to bring
incremental material improvement. However requirements for automotive cells are more
challenging in terms of life, power and safety. The amount of R&D effort focused on
designing improved Li-ion automotive cells suggests the modelled material improvements
will enter vehicle applications. There is however uncertainty around the speed of
development of improved materials, represented in the model by the ‘Slow R&D’ path
which sees a slower and less ambitious increase in material energy density.
Figure 6-13 Cell cost reduction due to material improvements (other parameters kept constant) compared to 2011
Cost reductions due to cumulative production/EV uptake
Cost reductions due to cumulative production – linked to EV uptake scenarios in the
model – have less effect on cell costs than material improvements but have a very
significant impact on the cost of pack components excluding cells: housing, power
electronics, BMS etc. For illustration, Figure 6-14 shows the cell cost reduction compared
to 2011 when material properties and all input costs are kept constant. This shows the
effect of the reduced CAPEX cost and increase in annual pack production per plant. In

Cost and performance of EV batteries
63
the baseline EV uptake case, the cell cost is reduced by 12% against 40% from material
improvement.
Figure 6-15 shows the impacts of cumulative production on packing costs; they are much
greater than for cell cost as packing is done in low volumes today. Most components (e.g.
housing, temperature control systems) are designed for each vehicle model and will
benefit greatly from standardisation and volume production.
Figure 6-14 Cell cost reductions due to learning rates/EV uptake assumptions (other parameters kept constant) compared to 2011
Figure 6-15 Packing cost reductions due to learning rates/EV uptake assumptions (other parameters kept constant) compared to 2011
The risks around realising cost reductions for large cell production are lower than for pack
assembly: new markets are emerging for large cells (e.g. grid support, IT back up)
whereas pack assembly for the automotive market does not have comparable markets to
support scale-up and spread investment risks.
Long term projections
The baseline results show that incremental improvements of lithium-ion batteries could
take the pack specific energy of a medium size car to 185 Wh/kg. Although this is an 85%
improvement on today’s pack, this would translate into a battery pack of more than 300kg
to achieve a 500km range.
Only post-lithium technologies, with densities higher than 300Wh/kg at pack level, would
make a long range electric vehicle practical. Taking post-lithium-ion technologies from
their current lab or prototype stage will require many years of development work and the
date when this will be achieved is uncertain.

Cost and performance of EV batteries
64
7 Conclusions
The objective of this report is to predict the cost and performance of automotive drivetrain
batteries, over the medium and long term, for a set of vehicles representative on the UK
market, for both pure electric and plug-in hybrid electric drivetrains.
Following a review of automotive battery cost models, a bottom up model approach was
developed for cost and performance up to 2030. This is a component based approach
which allows packs to be bespoke designed to meet the specifications of each vehicle.
In determining future vehicle specifications, the modelled pack voltage is assumed to
remain constant at 300V. This high voltage limits losses in the power electronics and
motor, but there is a cost to assembling a high voltage string of Li-Ion cells, requiring
extensive pack monitoring. We have not explored the potential for packing savings arising
from lower system voltages. For other vehicle specifications such as pack size in kWh,
the expected improvement in vehicle energy consumption (brought by a series of
efficiency measures such as better aerodynamics and light weighting) is taken into
account.
Battery developments
A range of historical, current and future chemistries were examined. A clear theme which
emerges is that energy density is the most important parameter for battery design (more
so than price). In practice this means that while cheaper technologies are available,
OEMs have chosen to deploy high cost high performance (based on Wh/kg)
technologies, which at present are represented by lithium-ion family chemistries.
Observation of the time lag between cells demonstrated in the laboratory and
technologies deployed in automotive applications shows that a period of 15-25 years is
representative. This pattern may not hold in the future – as the automotive battery
drivetrain market expands, accelerated technology deployment may occur. Nevertheless,
it is reasonable to assume the next decade will not see step change technology
improvements arriving in series production electric vehicles. New technologies do provide
improvements, but these are expected to be gradual.
The longer term cost and performance predictions, summarised below, can only be
achieved if a number of significant technical improvements can be integrated together
into a practical battery pack. This includes the use of significantly higher energy density
cathode materials, which in turn requires electrolytes stable at higher voltage, as well as
higher performance anodes. There are many significant fundamental scientific
uncertainties which must be overcome before all of these advances can be demonstrated
in a rechargeable lab cell. For example, a 5V electrolyte which does not break down in a
cell is not yet available. It must be acknowledged that in developing these cost predictions
we have taken a position not only on scientific advances, but also on certain cell, pack
and vehicle design parameters, all of which are inherently uncertain.
Cost and performance of battery packs to 2050
Under the baseline results, a C/D BEV pack cost could decrease to $320/kWh in 2020
and $215/kWh in 2030, from over
$700/kWh today. Roughly half of
the battery pack cost is in the
cells, and the remainder is
packing cost. Pack specific
BEV 30 kWh pack 2011 2020 2030
Pack cost $/pack $21,950 $9,620 $6,400
Pack cost $/kWh $725 $320 $215
Pack mass kg 320 200 165
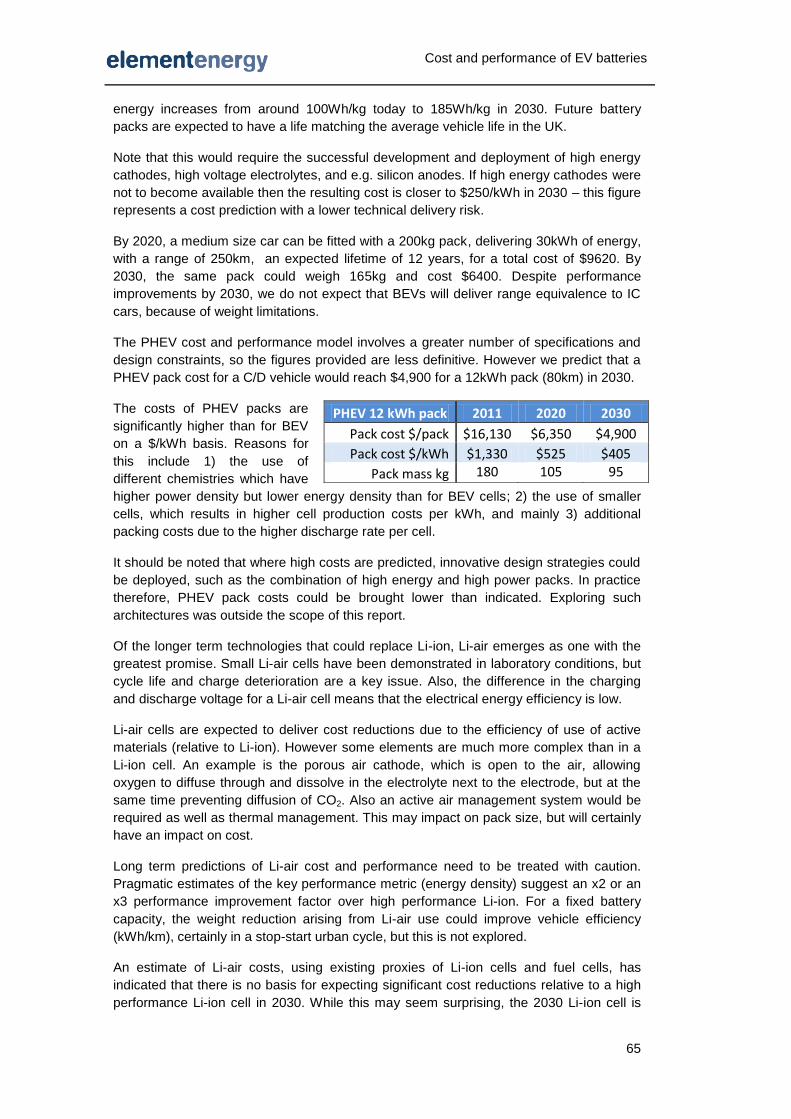
Cost and performance of EV batteries
65
energy increases from around 100Wh/kg today to 185Wh/kg in 2030. Future battery
packs are expected to have a life matching the average vehicle life in the UK.
Note that this would require the successful development and deployment of high energy
cathodes, high voltage electrolytes, and e.g. silicon anodes. If high energy cathodes were
not to become available then the resulting cost is closer to $250/kWh in 2030 – this figure
represents a cost prediction with a lower technical delivery risk.
By 2020, a medium size car can be fitted with a 200kg pack, delivering 30kWh of energy,
with a range of 250km, an expected lifetime of 12 years, for a total cost of $9620. By
2030, the same pack could weigh 165kg and cost $6400. Despite performance
improvements by 2030, we do not expect that BEVs will deliver range equivalence to IC
cars, because of weight limitations.
The PHEV cost and performance model involves a greater number of specifications and
design constraints, so the figures provided are less definitive. However we predict that a
PHEV pack cost for a C/D vehicle would reach $4,900 for a 12kWh pack (80km) in 2030.
The costs of PHEV packs are
significantly higher than for BEV
on a $/kWh basis. Reasons for
this include 1) the use of
different chemistries which have
higher power density but lower energy density than for BEV cells; 2) the use of smaller
cells, which results in higher cell production costs per kWh, and mainly 3) additional
packing costs due to the higher discharge rate per cell.
It should be noted that where high costs are predicted, innovative design strategies could
be deployed, such as the combination of high energy and high power packs. In practice
therefore, PHEV pack costs could be brought lower than indicated. Exploring such
architectures was outside the scope of this report.
Of the longer term technologies that could replace Li-ion, Li-air emerges as one with the
greatest promise. Small Li-air cells have been demonstrated in laboratory conditions, but
cycle life and charge deterioration are a key issue. Also, the difference in the charging
and discharge voltage for a Li-air cell means that the electrical energy efficiency is low.
Li-air cells are expected to deliver cost reductions due to the efficiency of use of active
materials (relative to Li-ion). However some elements are much more complex than in a
Li-ion cell. An example is the porous air cathode, which is open to the air, allowing
oxygen to diffuse through and dissolve in the electrolyte next to the electrode, but at the
same time preventing diffusion of CO2. Also an active air management system would be
required as well as thermal management. This may impact on pack size, but will certainly
have an impact on cost.
Long term predictions of Li-air cost and performance need to be treated with caution.
Pragmatic estimates of the key performance metric (energy density) suggest an x2 or an
x3 performance improvement factor over high performance Li-ion. For a fixed battery
capacity, the weight reduction arising from Li-air use could improve vehicle efficiency
(kWh/km), certainly in a stop-start urban cycle, but this is not explored.
An estimate of Li-air costs, using existing proxies of Li-ion cells and fuel cells, has
indicated that there is no basis for expecting significant cost reductions relative to a high
performance Li-ion cell in 2030. While this may seem surprising, the 2030 Li-ion cell is
PHEV 12 kWh pack 2011 2020 2030
Pack cost $/pack $16,130 $6,350 $4,900
Pack cost $/kWh $1,330 $525 $405
Pack mass kg 180 105 95

Cost and performance of EV batteries
66
already very cost efficient, and the loadings of the active materials (which Li-air can
reduce significantly) are a small percentage of the overall pack cost.
Key drivers behind cost reductions
While noting that overall cost reductions arise from multiple sources, the ca. 70%
reduction in pack costs predicted by 2030 arises primarily through the improvement in
material properties delivering higher energy densities, and the scaling up of production of
large cell packs.
In practice these issues will be linked. Continued and sustained uptake of automotive
electric drivetrains will support the R&D investments required to develop new chemistries.
The same market pull will be required to support investments in the development of high
quality, large format cells, at the production volumes necessary to make these cost
effective.
These cost predictions indicate that electric drivetrains will, for ca. 20 years, cost a
premium to produce. It is highly debateable whether the mass market and late adopters
will accept a price premium for such a long period of time. To sustain the uptake required,
it would seem necessary to have either regulations focusing on OEMs (i.e. fleet average
emissions targets favouring some EV production) or incentives (such as grants to reduce
the cost difference to consumers).
If the combination of regulation/incentives were not in place over the time period – in the
UK and beyond – then the predictions given in this document may be very optimistic.
While material improvements are more likely to emerge (because there are other, larger
markets for these high performance cells), the production of large format cells, and the
learning rate improvement in packing costs, will not emerge if EV uptake stalls.
Cost and performance of EV batteries
67
References
ANL, Modelling the Performance and Cost of Lithium-Ion Batteries for Electric-Drive Vehicles, 2011 Avicenne, The rechargeable battery market past and future, 2011 Axeon, Our guide to batteries, 2011 Barnett, New safety technologies for lithium-ion cells and batteries, Batteries 2011 conference, Mandelieu, September 2011 Boston Consulting, Batteries for electric cars, 2010 Roland Berger, Lithium-ion batteries for automotive applications – value chain and costs perspectives, Batteries 2011 conference, Mandelieu, September 2011 Peter G. Bruce et al., High energy storage li-O2 and Li-S batteries CARB, Status and Prospects for Zero Emissions Vehicle Technology, 2007 CGGC, Lithium ion batteries for electric vehicles, 2010 Deutsche bank, ElectricCarsPluggedIn2, 2009 DLR, Assessment of Future Li-Ion Battery Production Costs, 2009 EDAG, Future steel vehicle phase 1 report, 2009 Element Energy, Influences on the Low Carbon Car Market from 2020-2030, 2011 Element Energy, Ultra Low Emission Vans study, 2012 EPRI, Large-Format Lithium-Ion Battery Costs Analysis - Critical Review of Existing PHEV Lithium Ion Battery Cost Studies, 2010 French embassy in Japan, Etat de la R&D dans le domaine des batteries pour véhicules électriques au Japon, October 2010 Junichi Maruta, High performance lithium-ion batteries for electrified vehicle application with various chemistries and cell dimensions, Lithium Energy Japan, Batteries 2011 conference, Mandelieu, September 2011 Quass J., Benhamou E., Keil A., Advances in Battery Electrode Coating, Drying and Solvent Recovery System Design, Batteries 2010 conference, Mandelieu, September 2010 Prayion, Strategic approach from an industrial point of view as new advanced active materials supplier, Batteries 2011 conference, Mandelieu, September 2011 Sartorelli G., Ultracapacitors: some view about the life duration and performances over the time, Batteries 2010 conference, Mandelieu, September 2010 TIAX, PHEV and LEESS Battery Cost Assessment, 2011 Yoshio M., Brodd, R.J.m Kozawa A., Lithium-ion batteries: science and technologies, Published by Springer, ISBN0387344446, 9780387344447, 2009
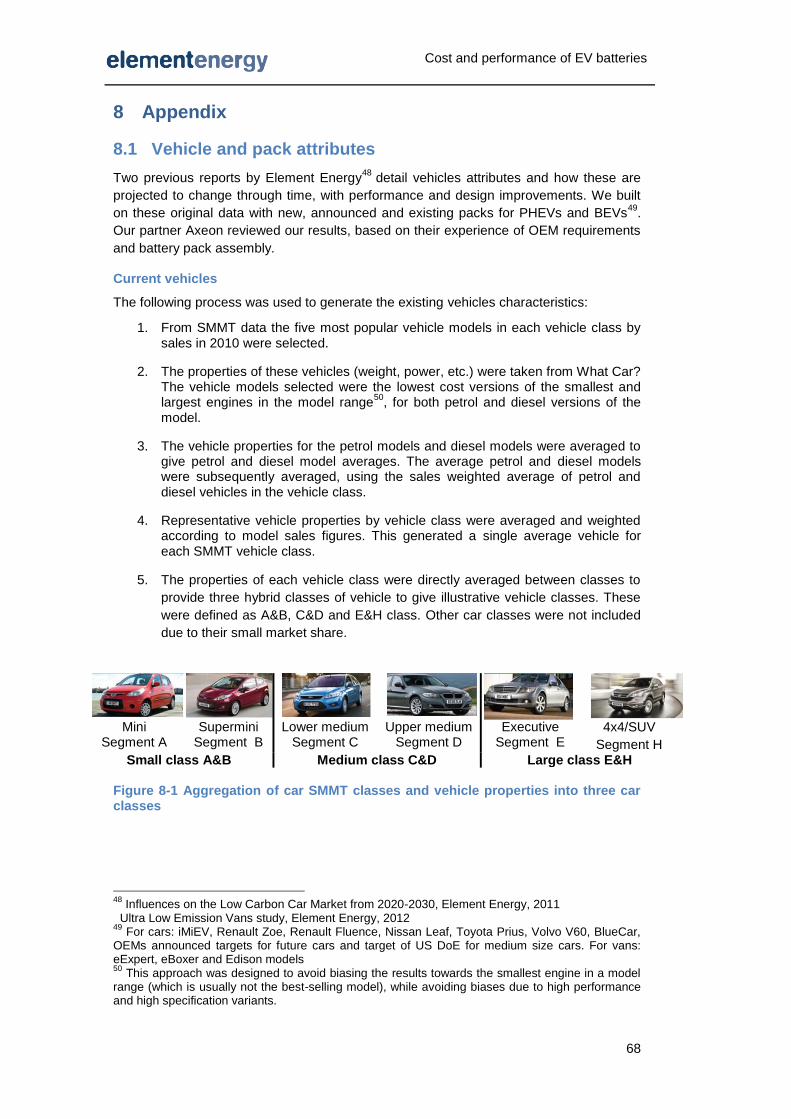
Cost and performance of EV batteries
68
8 Appendix
8.1 Vehicle and pack attributes
Two previous reports by Element Energy48
detail vehicles attributes and how these are
projected to change through time, with performance and design improvements. We built
on these original data with new, announced and existing packs for PHEVs and BEVs49
.
Our partner Axeon reviewed our results, based on their experience of OEM requirements
and battery pack assembly.
Current vehicles
The following process was used to generate the existing vehicles characteristics:
1. From SMMT data the five most popular vehicle models in each vehicle class by sales in 2010 were selected.
2. The properties of these vehicles (weight, power, etc.) were taken from What Car? The vehicle models selected were the lowest cost versions of the smallest and largest engines in the model range
50, for both petrol and diesel versions of the
model.
3. The vehicle properties for the petrol models and diesel models were averaged to give petrol and diesel model averages. The average petrol and diesel models were subsequently averaged, using the sales weighted average of petrol and diesel vehicles in the vehicle class.
4. Representative vehicle properties by vehicle class were averaged and weighted according to model sales figures. This generated a single average vehicle for each SMMT vehicle class.
5. The properties of each vehicle class were directly averaged between classes to
provide three hybrid classes of vehicle to give illustrative vehicle classes. These
were defined as A&B, C&D and E&H class. Other car classes were not included
due to their small market share.
Mini Segment A
Supermini Segment B
Lower medium Segment C
Upper medium Segment D
Executive Segment E
4x4/SUV
Segment H Small class A&B Medium class C&D Large class E&H
Figure 8-1 Aggregation of car SMMT classes and vehicle properties into three car classes
48
Influences on the Low Carbon Car Market from 2020-2030, Element Energy, 2011 Ultra Low Emission Vans study, Element Energy, 2012 49
For cars: iMiEV, Renault Zoe, Renault Fluence, Nissan Leaf, Toyota Prius, Volvo V60, BlueCar, OEMs announced targets for future cars and target of US DoE for medium size cars. For vans: eExpert, eBoxer and Edison models 50
This approach was designed to avoid biasing the results towards the smallest engine in a model range (which is usually not the best-selling model), while avoiding biases due to high performance and high specification variants.

Cost and performance of EV batteries
69
SMMT sales data and Vans123 data on van characteristics were used to generate a
generic van class using a similar approach to cars.
Future vehicles
The expected improvements in the conventional ICE vehicle are used to predict the
characteristics of future low carbon vehicles. This approach provides future vehicle
properties, against which other powertrains can be compared. It also allows
improvements outside the powertrain, such as aerodynamic improvements and vehicle
‘light weighting’, to be quantified and applied across vehicle types.
Table 8-1 represents how these improvements change the energy requirements of the
different vehicles types from 2011 to 2030. (For a full description of the individual
improvements in vehicles over this time frame please view the reports; Influences on the
Low Carbon Car Market from 2020-2030, and Ultra Low Emission Vans study, both by
Element Energy). The indicated energy consumption is based on assumptions on kerb
weight mass (which includes battery pack mass).
Battery capacity is set using the vehicle range. The range is a trade-off between issues
such as cost and weight, and the need to provide sufficient utility (range) to meet drivers’
needs. In practice, electric ranges of future BEV and PHEVs will be set by user
requirements, cost considerations and OEM marketing decisions. The purpose of this
study is not to attempt to predict OEM decisions on range offered, so instead simple rules
have been used to provide illustrative range estimates for each powertrain to generate
pack requirements.
Existing (2011) vehicle ranges are set by vehicles currently on the market. Future vehicle
ranges are set according to the expected range requirements of each vehicle class based
on travel statistics and OEM discussions. For example A&B class vehicles are used as
city cars and have fewer long distance trips; they therefore have a lower range
requirement than the other vehicle classes.
Peak power requirement is based on the ICE model engine output and checked along
with the assumed pack mass with the Element Energy vehicle modelling of the NEDC
drive cycle, Element Energy analysis of SMMT vehicle data, and Axeon data on OEM
pack requirements.
The tables below show the resulting plug-in vehicle datasets. The maximum pack volume
is given only as an indication; it is harder to estimate as the volume envelope dedicated to
the battery pack will depend partly on the shape / modularity of the pack.
Table 8-1 Definition of current and future BEVs for pack cost modelling
Attribute BEV 2011 BEV 2030
A&B C&D E&H Van A&B C&D E&H Van
Range (km) 150 150 150 150 200 250 300 250
Energy consumption (kWh/km)
0.12 0.14 0.18 0.28 0.084 0.097 0.13 0.22
Max pack mass (kg) 240 300 460 500 110 180 360 400
Max pack volume (L) 180 270 360 550 100 130 280 375
Motor peak power (kW) 50 70 120 60 50 70 120 70
Assumed kerb mass (kg) 1270 1700 2300 2250 920 1280 1790 1800
Usable energy (kWh) 18 21 27 42 17 24 40 55
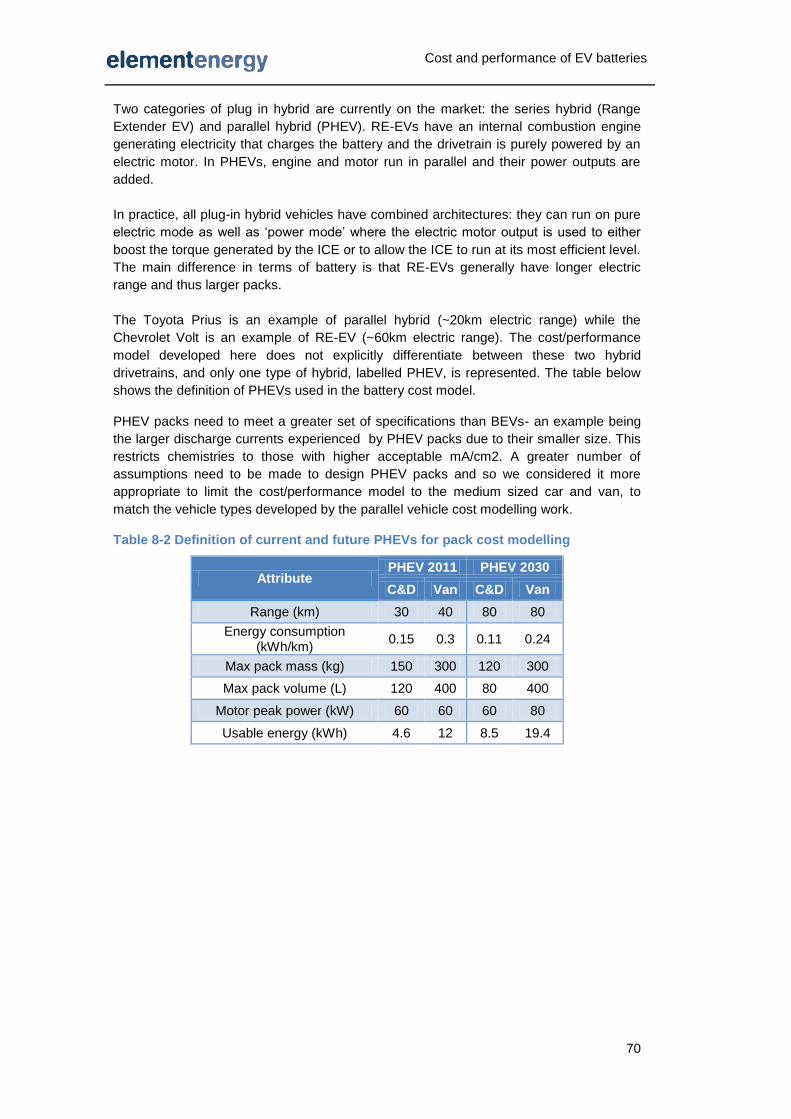
Cost and performance of EV batteries
70
Two categories of plug in hybrid are currently on the market: the series hybrid (Range
Extender EV) and parallel hybrid (PHEV). RE-EVs have an internal combustion engine
generating electricity that charges the battery and the drivetrain is purely powered by an
electric motor. In PHEVs, engine and motor run in parallel and their power outputs are
added.
In practice, all plug-in hybrid vehicles have combined architectures: they can run on pure
electric mode as well as ‘power mode’ where the electric motor output is used to either
boost the torque generated by the ICE or to allow the ICE to run at its most efficient level.
The main difference in terms of battery is that RE-EVs generally have longer electric
range and thus larger packs.
The Toyota Prius is an example of parallel hybrid (~20km electric range) while the
Chevrolet Volt is an example of RE-EV (~60km electric range). The cost/performance
model developed here does not explicitly differentiate between these two hybrid
drivetrains, and only one type of hybrid, labelled PHEV, is represented. The table below
shows the definition of PHEVs used in the battery cost model.
PHEV packs need to meet a greater set of specifications than BEVs- an example being
the larger discharge currents experienced by PHEV packs due to their smaller size. This
restricts chemistries to those with higher acceptable mA/cm2. A greater number of
assumptions need to be made to design PHEV packs and so we considered it more
appropriate to limit the cost/performance model to the medium sized car and van, to
match the vehicle types developed by the parallel vehicle cost modelling work.
Table 8-2 Definition of current and future PHEVs for pack cost modelling
Attribute PHEV 2011 PHEV 2030
C&D Van C&D Van
Range (km) 30 40 80 80
Energy consumption (kWh/km)
0.15 0.3 0.11 0.24
Max pack mass (kg) 150 300 120 300
Max pack volume (L) 120 400 80 400
Motor peak power (kW) 60 60 60 80
Usable energy (kWh) 4.6 12 8.5 19.4

Cost and performance of EV batteries
71
8.2 Model diagram
The figure below shows a schematic representation of the model calculation steps and
input/outputs modules.
Figure 8-2 Model diagram
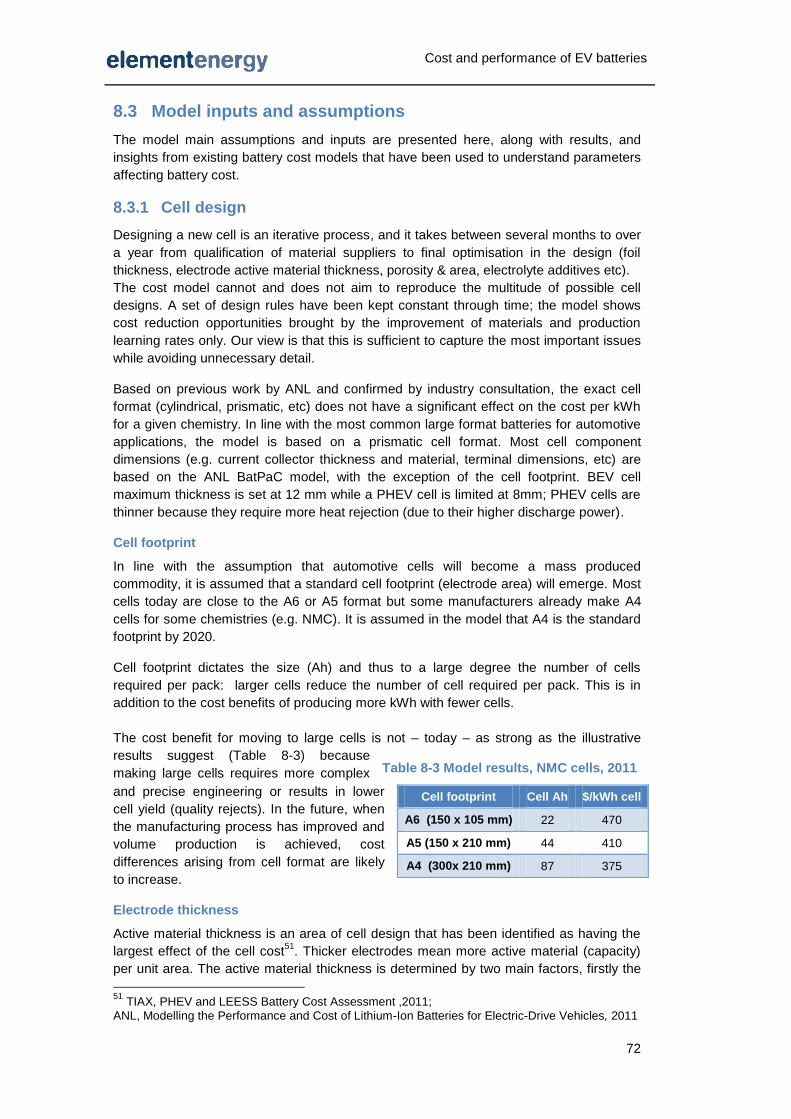
Cost and performance of EV batteries
72
8.3 Model inputs and assumptions
The model main assumptions and inputs are presented here, along with results, and
insights from existing battery cost models that have been used to understand parameters
affecting battery cost.
8.3.1 Cell design
Designing a new cell is an iterative process, and it takes between several months to over
a year from qualification of material suppliers to final optimisation in the design (foil
thickness, electrode active material thickness, porosity & area, electrolyte additives etc).
The cost model cannot and does not aim to reproduce the multitude of possible cell
designs. A set of design rules have been kept constant through time; the model shows
cost reduction opportunities brought by the improvement of materials and production
learning rates only. Our view is that this is sufficient to capture the most important issues
while avoiding unnecessary detail.
Based on previous work by ANL and confirmed by industry consultation, the exact cell
format (cylindrical, prismatic, etc) does not have a significant effect on the cost per kWh
for a given chemistry. In line with the most common large format batteries for automotive
applications, the model is based on a prismatic cell format. Most cell component
dimensions (e.g. current collector thickness and material, terminal dimensions, etc) are
based on the ANL BatPaC model, with the exception of the cell footprint. BEV cell
maximum thickness is set at 12 mm while a PHEV cell is limited at 8mm; PHEV cells are
thinner because they require more heat rejection (due to their higher discharge power).
Cell footprint
In line with the assumption that automotive cells will become a mass produced
commodity, it is assumed that a standard cell footprint (electrode area) will emerge. Most
cells today are close to the A6 or A5 format but some manufacturers already make A4
cells for some chemistries (e.g. NMC). It is assumed in the model that A4 is the standard
footprint by 2020.
Cell footprint dictates the size (Ah) and thus to a large degree the number of cells
required per pack: larger cells reduce the number of cell required per pack. This is in
addition to the cost benefits of producing more kWh with fewer cells.
The cost benefit for moving to large cells is not – today – as strong as the illustrative
results suggest (Table 8-3) because
making large cells requires more complex
and precise engineering or results in lower
cell yield (quality rejects). In the future, when
the manufacturing process has improved and
volume production is achieved, cost
differences arising from cell format are likely
to increase.
Electrode thickness
Active material thickness is an area of cell design that has been identified as having the
largest effect of the cell cost51
. Thicker electrodes mean more active material (capacity)
per unit area. The active material thickness is determined by two main factors, firstly the
51
TIAX, PHEV and LEESS Battery Cost Assessment ,2011;
ANL, Modelling the Performance and Cost of Lithium-Ion Batteries for Electric-Drive Vehicles, 2011
Cell footprint Cell Ah $/kWh cell
A6 (150 x 105 mm) 22 470
A5 (150 x 210 mm) 44 410
A4 (300x 210 mm) 87 375
Table 8-3 Model results, NMC cells, 2011

Cost and performance of EV batteries
73
maximum thickness that that can be deposited evenly on the current collector
(engineering limit), secondly the power requirement of the cell.
The electrode thickness
affects cost because it
controls the amount of non-
active material used in a cell
battery: the thicker the
electrode, the smaller the cell area and the lesser the quantity of inactive material (foil,
electrolyte, separator, casing etc) to use.
The kinetics of the active material
chemistry determine the maximum power
that can be drawn from a cell with a
specific active material thickness. This
relationship varies with electrode material
chemistries.
In the cost model, the active material
thickness is set at 100μm; this thickness
meets the power (rate) requirements of all
vehicles modelled. Following consultation
with our partners we have decided to keep
this value constant through time to limit
assumptions.
Figure 8-3 Active material rate capability example
Cells developed for PHEV applications have greater power to energy ratios, which
translate into thinner
electrodes and more
expensive cells because of
the greater use of inactive
material. As a
consequence, PHEV cell
costs are more sensitive to
the vehicle power
requirement, as illustrated
by the ANL BatPac model
results (graph in the right).
Same volume of cathode
material but double the
thickness
50% less foil

Cost and performance of EV batteries
74
8.3.2 Technology roadmap of active materials
The electrode active material properties (reversible capacity mAh/g and voltage) are input
into the model while the cell footprint and electrode thickness are kept constant. Future
cathode materials, under development now, have greater capacity and/or voltage, i.e.
cells will have a greater energy density - this is illustrated in the figure below.
Figure 8-4 Effect of the technology roadmap assumptions on cell Ah and V
This is expected to reduce battery cost for the reasons outlined in the table below.
Increasing the material capacity reduces the amount of active material used to generate
the same battery capacity. Given the same cell footprint, increasing the active material
capacity increases the total capacity of a single cell and can help reduce the number of
cells placed in parallel. This is also true of increasing the cell voltage; this reduces the
number of cells required in series to meet the pack voltage requirements.
Table 8-4 Cost reductions brought by fewer cells per kWh and increased Wh/kg
Pack production Cell materials Pack components
Cheaper as fewer cells to
handle and test per kWh
on the production line.
Greater active material
Wh/kg (mAh/g and/or
voltage) also means less
cell material to handle in
the plant.
A greater active material
Wh/kg means less material
to purchase per kWh.
This translates in a cost
reduction if the material cost
per kg does not increase
when mAh/g and/or V
increase.
Fewer cells to connect and
monitor: cost reduction in
BMS, wiring harness and
interconnectors.
Smaller pack volume
reduces the housing cost.
Based on a review of material under development, a technology roadmap was
developed. Future materials considered are:
- Anode: graphite and in future silicon alloy (blended with carbon)
- High capacity cathode: NMC, layered cathode
- Medium to high voltage cathode: LMP, LNMO, L(M)SO4F
The resulting baseline cell energy density was presented in section 4.4. The figure below
shows how the best baseline energy density available compares to the other roadmaps
(‘Fast R&D’ and ‘Slow R&D’). Table 8-5 shows the assumptions in terms of date of entry
of new technologies or new performances for the three R&D scenarios.
Changes in active material:
Higher reversible capacity mAh/g higher cell capacity Ah
might reduce the number of cells in parallel.
And/or
Higher voltage higher cell voltage V
reduced number of cells in series.
Both cases result in higher energy density and cost reduction in $/kWh.
Constant assumptions Assumptions varying with time according to technology roadmap
Area: A4
100 µm
Active material
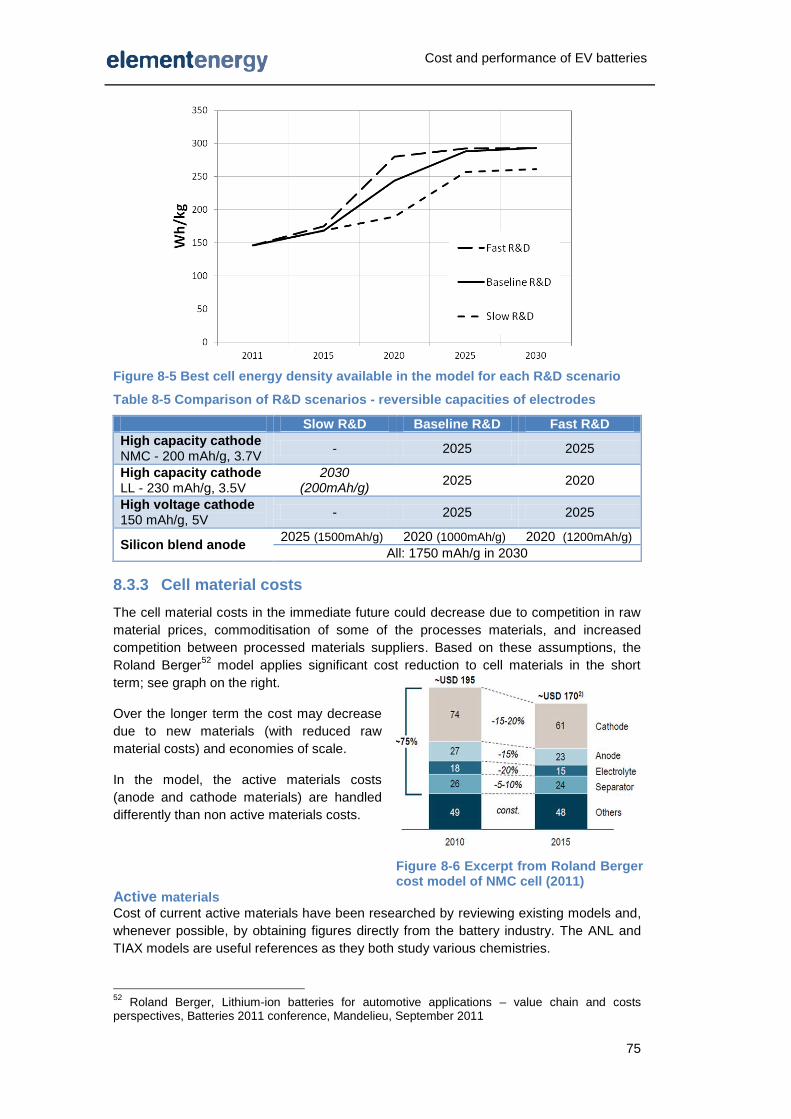
Cost and performance of EV batteries
75
Figure 8-5 Best cell energy density available in the model for each R&D scenario
Table 8-5 Comparison of R&D scenarios - reversible capacities of electrodes
Slow R&D Baseline R&D Fast R&D
High capacity cathode NMC - 200 mAh/g, 3.7V
- 2025 2025
High capacity cathode LL - 230 mAh/g, 3.5V
2030 (200mAh/g)
2025 2020
High voltage cathode 150 mAh/g, 5V
- 2025 2025
Silicon blend anode 2025 (1500mAh/g) 2020 (1000mAh/g) 2020 (1200mAh/g)
All: 1750 mAh/g in 2030
8.3.3 Cell material costs
The cell material costs in the immediate future could decrease due to competition in raw
material prices, commoditisation of some of the processes materials, and increased
competition between processed materials suppliers. Based on these assumptions, the
Roland Berger52
model applies significant cost reduction to cell materials in the short
term; see graph on the right.
Over the longer term the cost may decrease
due to new materials (with reduced raw
material costs) and economies of scale.
In the model, the active materials costs
(anode and cathode materials) are handled
differently than non active materials costs.
Active materials Cost of current active materials have been researched by reviewing existing models and,
whenever possible, by obtaining figures directly from the battery industry. The ANL and
TIAX models are useful references as they both study various chemistries.
52
Roland Berger, Lithium-ion batteries for automotive applications – value chain and costs perspectives, Batteries 2011 conference, Mandelieu, September 2011
Figure 8-6 Excerpt from Roland Berger cost model of NMC cell (2011)
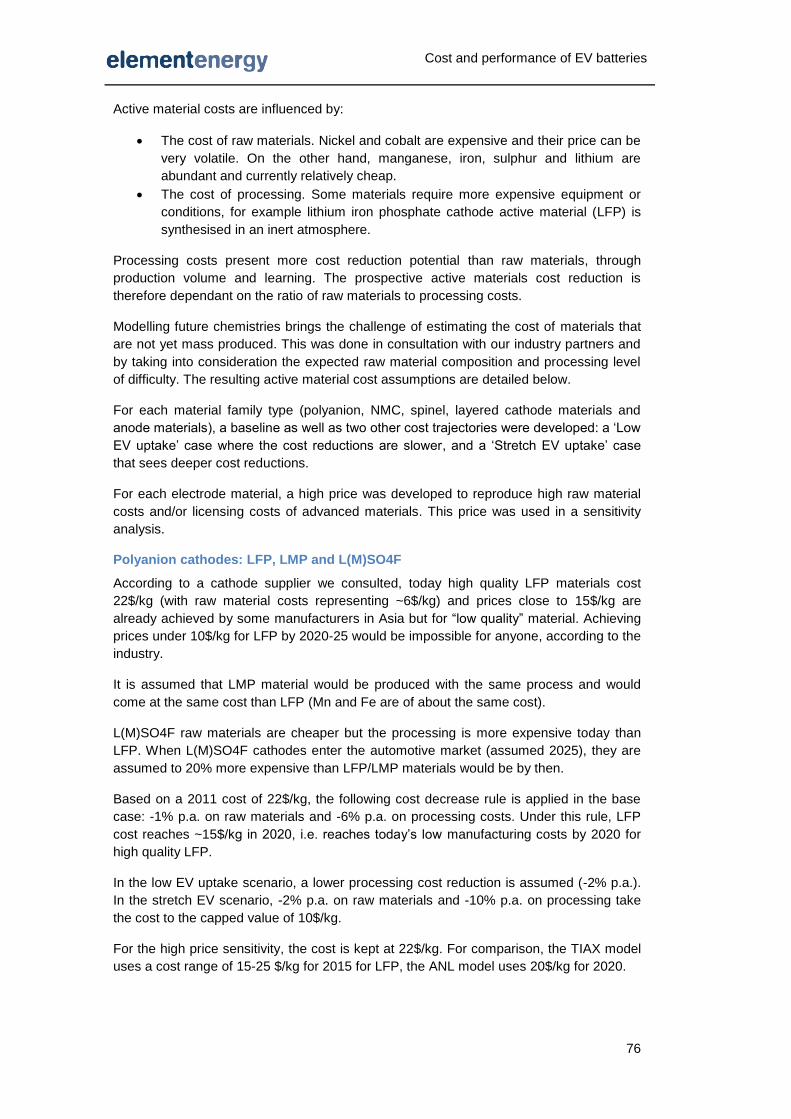
Cost and performance of EV batteries
76
Active material costs are influenced by:
The cost of raw materials. Nickel and cobalt are expensive and their price can be
very volatile. On the other hand, manganese, iron, sulphur and lithium are
abundant and currently relatively cheap.
The cost of processing. Some materials require more expensive equipment or
conditions, for example lithium iron phosphate cathode active material (LFP) is
synthesised in an inert atmosphere.
Processing costs present more cost reduction potential than raw materials, through
production volume and learning. The prospective active materials cost reduction is
therefore dependant on the ratio of raw materials to processing costs.
Modelling future chemistries brings the challenge of estimating the cost of materials that
are not yet mass produced. This was done in consultation with our industry partners and
by taking into consideration the expected raw material composition and processing level
of difficulty. The resulting active material cost assumptions are detailed below.
For each material family type (polyanion, NMC, spinel, layered cathode materials and
anode materials), a baseline as well as two other cost trajectories were developed: a ‘Low
EV uptake’ case where the cost reductions are slower, and a ‘Stretch EV uptake’ case
that sees deeper cost reductions.
For each electrode material, a high price was developed to reproduce high raw material
costs and/or licensing costs of advanced materials. This price was used in a sensitivity
analysis.
Polyanion cathodes: LFP, LMP and L(M)SO4F
According to a cathode supplier we consulted, today high quality LFP materials cost
22$/kg (with raw material costs representing ~6$/kg) and prices close to 15$/kg are
already achieved by some manufacturers in Asia but for “low quality” material. Achieving
prices under 10$/kg for LFP by 2020-25 would be impossible for anyone, according to the
industry.
It is assumed that LMP material would be produced with the same process and would
come at the same cost than LFP (Mn and Fe are of about the same cost).
L(M)SO4F raw materials are cheaper but the processing is more expensive today than
LFP. When L(M)SO4F cathodes enter the automotive market (assumed 2025), they are
assumed to 20% more expensive than LFP/LMP materials would be by then.
Based on a 2011 cost of 22$/kg, the following cost decrease rule is applied in the base
case: -1% p.a. on raw materials and -6% p.a. on processing costs. Under this rule, LFP
cost reaches ~15$/kg in 2020, i.e. reaches today’s low manufacturing costs by 2020 for
high quality LFP.
In the low EV uptake scenario, a lower processing cost reduction is assumed (-2% p.a.).
In the stretch EV scenario, -2% p.a. on raw materials and -10% p.a. on processing take
the cost to the capped value of 10$/kg.
For the high price sensitivity, the cost is kept at 22$/kg. For comparison, the TIAX model
uses a cost range of 15-25 $/kg for 2015 for LFP, the ANL model uses 20$/kg for 2020.

Cost and performance of EV batteries
77
Figure 8-7 Cost inputs for polyanion cathode materials. Based on observed values for 2011 and scenarios developed by Element Energy for future years and materials
NMC cathodes
Today NMC costs are taken to be 42$/kg based on recommendation from industry
contacts. For comparison, the Tiax model uses a base value of 45$/kg (40$/kg for low
and 53$/kg for high case), the ANL model assumes 39$/kg for 2020, and Deustche Bank
modelled NMC cells are based on 39$/kg in 2009.
The expected 15% cost decrease (Roland Berger analysis) reduces NMC cost to
$35.7/kg. This is staged according to the EV uptake scenario: by 2015 in the Stretch EV
case, by 2020 in the base case and by 2025 in the Low EV uptake scenario. A decrease
of -1% p.a. is applied thereafter.
Figure 8-8 Cost inputs for NMC cathode material. Based on observed values for 2011 and scenarios developed by Element Energy for future years
Spinel cathodes (LMO, LNMO)
The TIAX model base value of 16$/kg for LMO is used for 2011. LNMO – replacing LMO
from 2020 in the model – is expected to be more expensive because on the addition of
nickel and more expensive process (LNMO is more difficult to synthesise than LMO and
needs to the coated for high voltage stability). Figure 8-9 below shows the assumed
costs trajectories.
For comparison, the ANL model assumes 10$/kg for 2020 and the TIAX model low and
high costs are 12 and 20 $/kg for LMO.
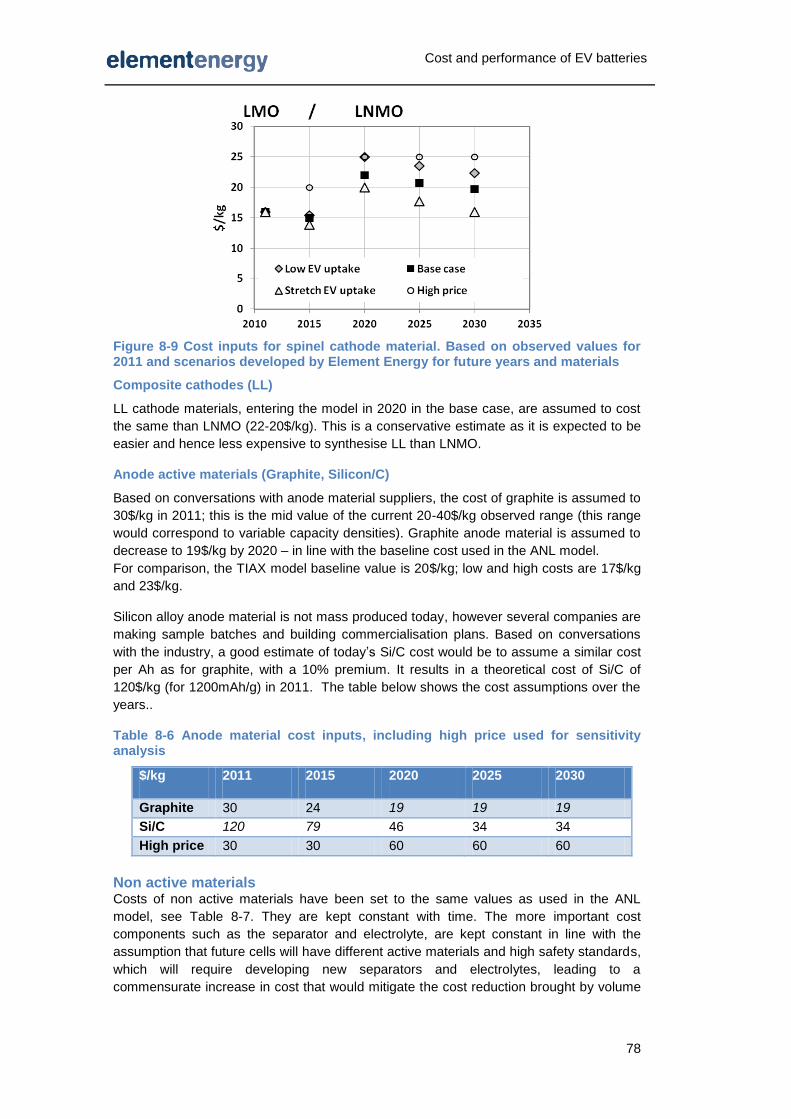
Cost and performance of EV batteries
78
Figure 8-9 Cost inputs for spinel cathode material. Based on observed values for 2011 and scenarios developed by Element Energy for future years and materials
Composite cathodes (LL)
LL cathode materials, entering the model in 2020 in the base case, are assumed to cost
the same than LNMO (22-20$/kg). This is a conservative estimate as it is expected to be
easier and hence less expensive to synthesise LL than LNMO.
Anode active materials (Graphite, Silicon/C)
Based on conversations with anode material suppliers, the cost of graphite is assumed to
30$/kg in 2011; this is the mid value of the current 20-40$/kg observed range (this range
would correspond to variable capacity densities). Graphite anode material is assumed to
decrease to 19$/kg by 2020 – in line with the baseline cost used in the ANL model.
For comparison, the TIAX model baseline value is 20$/kg; low and high costs are 17$/kg
and 23$/kg.
Silicon alloy anode material is not mass produced today, however several companies are
making sample batches and building commercialisation plans. Based on conversations
with the industry, a good estimate of today’s Si/C cost would be to assume a similar cost
per Ah as for graphite, with a 10% premium. It results in a theoretical cost of Si/C of
120$/kg (for 1200mAh/g) in 2011. The table below shows the cost assumptions over the
years..
Table 8-6 Anode material cost inputs, including high price used for sensitivity analysis
$/kg 2011 2015 2020 2025 2030
Graphite 30 24 19 19 19
Si/C 120 79 46 34 34
High price 30 30 60 60 60
Non active materials Costs of non active materials have been set to the same values as used in the ANL
model, see Table 8-7. They are kept constant with time. The more important cost
components such as the separator and electrolyte, are kept constant in line with the
assumption that future cells will have different active materials and high safety standards,
which will require developing new separators and electrolytes, leading to a
commensurate increase in cost that would mitigate the cost reduction brought by volume

Cost and performance of EV batteries
79
production. The cost of electrolyte is increased for high voltage cathodes, in line with the
scientific challenge it represents.
Table 8-7 Cost of non-active materials used in model
Component Unit Marginal cost
Fixed cost
Comments
Carbon (conductor)
$/kg 6.8
Binder (PDEF) $/kg 10
Al foil $/kg 14.8
Cu foil $/kg 16.8
Separator $/m2 2.0
USABC objective is 1$/m2
Electrolyte $/dm3 21.6
20% premium added when cathode voltage is >4.9V
Solvent (NMP) $/kg 3.2
Positive terminal $/kg 4 0.25
Negative terminal $/kg 6 0.25
Cell Container $/kg 3 0.20
8.3.4 Cell production cost
Figure 8-10 Cell production plant processing steps
We have researched investment costs of current and announced battery manufacturing
plants worldwide. These plants use similar processes to produce cells (see Figure 8-10).
This process, although complex, can be separated into its component parts and the cost
dependence of each part can be separated. The plant costs depend mainly on the types
of cells manufactured and annual production capacity53
. This dictates how many
machines are required in the plant and to a lesser extent the cost of these machines. We
use the methodology developed by the ANL team to represent the elasticity between cell
design/ cell volume and CAPEX costs.
53
The number of cells and cell type combine to give the volume, area and kWh of material
processed, these few inputs dictate the production costs.

Cost and performance of EV batteries
80
The ANL calculations have been calibrated using our real world plant cost research. The
plant cost / pack volume relationship generated using this method is shown in Figure 8-11
with real world plant cost included.
Figure 8-11 Investment costs ($million) of current and planned battery manufacturing plants dedicated to the automotive market. Publically available data collected by Element Energy
The ANL BatPaC plant costs are used as the lower bound of our baseline CAPEX plant
costs, as the ANL model assumes a highly optimised plant operating in 2020 after a large
adoption of EVs. The rate at which this cost is reached is dependent on the scenario on
uptake of EVs: 2025 in the base case, 2030 in the conservative scenario (‘Niche EV’) and
as early as 2020 in the optimistic scenario (‘EV push’).
There are several other costs that are included as part of the manufacturing costs. These
include financing (rate and period), direct labour and overheads. We use a finance rate of
7% (all plant CAPEX costs are financed) and a payback period of 5 years, this is
consistent with industry figures and peer review54
. Direct labour is a small component of
the cell cost as the production process is highly automated. Labour rates are set at $18/h.
Cell yield is set at 95%.
Plant overheads include; R&D, sales and administration, maintenance (and other indirect
labour), utilities and insurance. The overhead is set at flat rate of 30% of all direct costs
(amortised plant CAPEX, direct labour and cell material cost); this has been checked
against the battery manufactures company accounts55
and quoted overhead rates56
.
The figure below shows the 2011 baseline cell cost and its variation with changing
production parameters. The blue shaded area is the range of quoted cell costs. The
modelled cost stays within this range when varying the production parameters, indicating
the choice of baseline values is reasonable.
54
A payback period of 5 years was one of the recommendations on the public consultation of the ANL BatPaC model. 55
E.g. GS Yuasa and 3M 56
Deutsche bank, ElectricCarsPluggedIn2, 2009

Cost and performance of EV batteries
81
Figure 8-12 – Cost variations with alternative production parameters. 2011 cell costs, based on a C&D BEV pack (22kWh, NMC cathode)
Production volume
There is a large dependence between
cost and production volume. The ANL
model can reproduce the volume/cost
relationship. Most other models state a
single production volume and work
only from this.
The ANL methodology to model cell
production has been imported in our
model to reproduce the volume effect
as there is an expected change in production volume per plant with time. Currently there
are no individual plants with an operational output volume above 50,000 packs, but some
plants have a theoretical operational capacity of above 100,000 packs. The table below
shows the production volume assumptions, per scenario, used in the model.
Table 8-8 Modelled plant production volumes - scenario and time dependence
Scenario 2011 2015 2020 2025 2030
Niche EV 50,000 50,000 100,000 100,000 100,000
Baseline 50,000 100,000 100,000 100,000 100,000
EV push 50,000 100,000 150,000 180,000 200,000
8.3.5 Pack assembly
Production lines
The table below shows the pack assembly production line costs used in the model; they
are based on observed costs today and projected costs accounting for expected
decrease. The future low costs are reached in 2025 in the baseline (in 2020 in the
‘Stretch EV uptake’ and 2030 in the ‘low EV uptake’ cases).
Pack assembly currently involves testing the pack at each assembly stage. Tester line
costs are assumed to come down thanks to a reduced need for testing (e.g. 1 pack/hour)
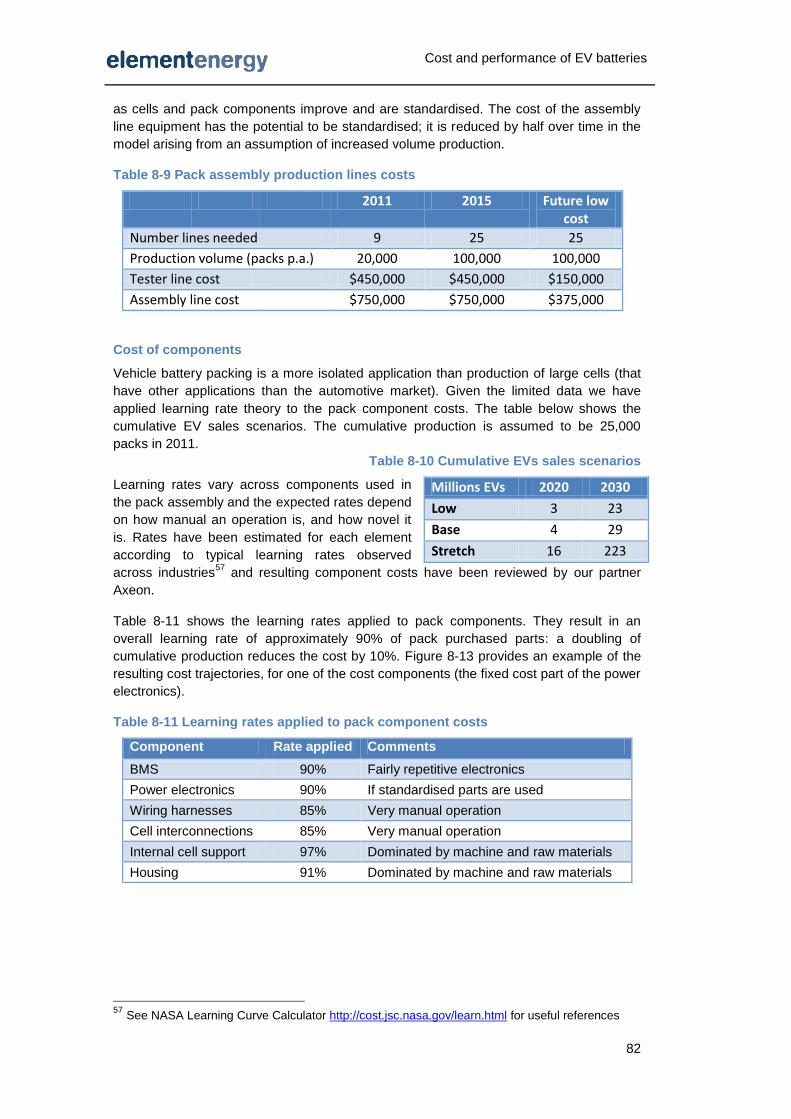
Cost and performance of EV batteries
82
as cells and pack components improve and are standardised. The cost of the assembly
line equipment has the potential to be standardised; it is reduced by half over time in the
model arising from an assumption of increased volume production.
Table 8-9 Pack assembly production lines costs
2011 2015 Future low cost
Number lines needed 9 25 25
Production volume (packs p.a.) 20,000 100,000 100,000
Tester line cost $450,000 $450,000 $150,000
Assembly line cost $750,000 $750,000 $375,000
Cost of components
Vehicle battery packing is a more isolated application than production of large cells (that
have other applications than the automotive market). Given the limited data we have
applied learning rate theory to the pack component costs. The table below shows the
cumulative EV sales scenarios. The cumulative production is assumed to be 25,000
packs in 2011.
Table 8-10 Cumulative EVs sales scenarios
Learning rates vary across components used in
the pack assembly and the expected rates depend
on how manual an operation is, and how novel it
is. Rates have been estimated for each element
according to typical learning rates observed
across industries57
and resulting component costs have been reviewed by our partner
Axeon.
Table 8-11 shows the learning rates applied to pack components. They result in an
overall learning rate of approximately 90% of pack purchased parts: a doubling of
cumulative production reduces the cost by 10%. Figure 8-13 provides an example of the
resulting cost trajectories, for one of the cost components (the fixed cost part of the power
electronics).
Table 8-11 Learning rates applied to pack component costs
Component Rate applied Comments
BMS 90% Fairly repetitive electronics
Power electronics 90% If standardised parts are used
Wiring harnesses 85% Very manual operation
Cell interconnections 85% Very manual operation
Internal cell support 97% Dominated by machine and raw materials
Housing 91% Dominated by machine and raw materials
57
See NASA Learning Curve Calculator http://cost.jsc.nasa.gov/learn.html for useful references
Millions EVs 2020 2030
Low 3 23
Base 4 29
Stretch 16 223
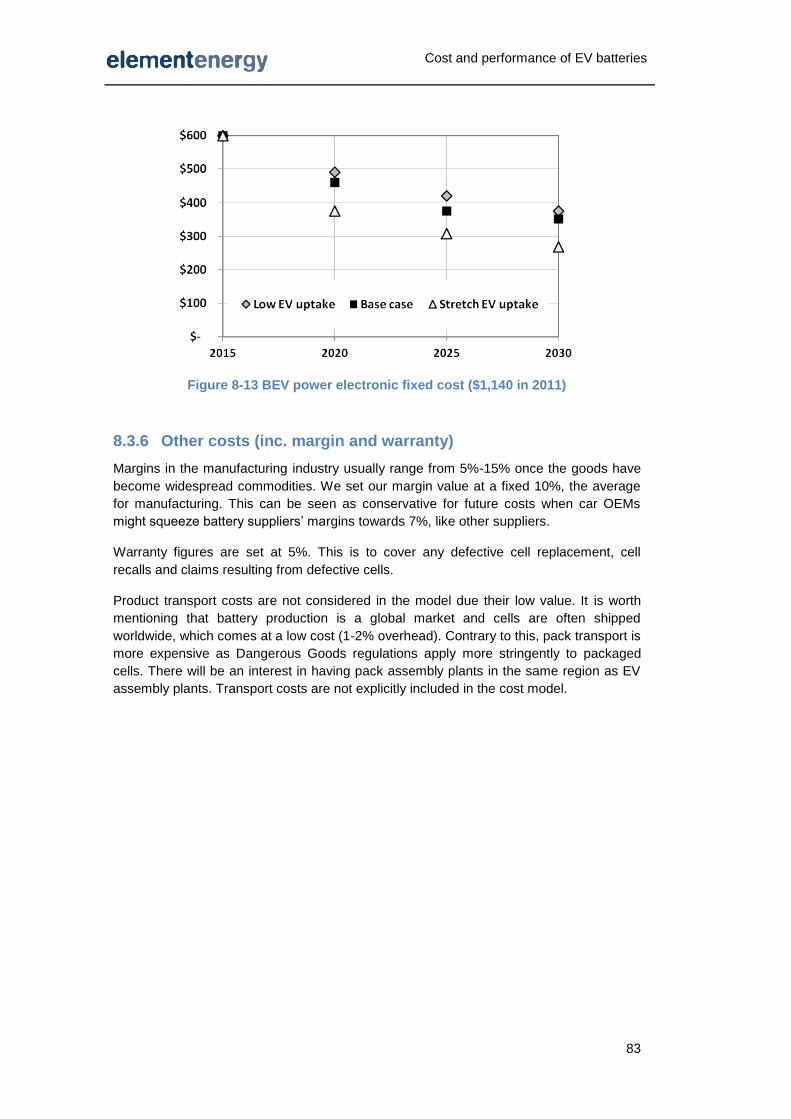
Cost and performance of EV batteries
83
Figure 8-13 BEV power electronic fixed cost ($1,140 in 2011)
8.3.6 Other costs (inc. margin and warranty)
Margins in the manufacturing industry usually range from 5%-15% once the goods have
become widespread commodities. We set our margin value at a fixed 10%, the average
for manufacturing. This can be seen as conservative for future costs when car OEMs
might squeeze battery suppliers’ margins towards 7%, like other suppliers.
Warranty figures are set at 5%. This is to cover any defective cell replacement, cell
recalls and claims resulting from defective cells.
Product transport costs are not considered in the model due their low value. It is worth
mentioning that battery production is a global market and cells are often shipped
worldwide, which comes at a low cost (1-2% overhead). Contrary to this, pack transport is
more expensive as Dangerous Goods regulations apply more stringently to packaged
cells. There will be an interest in having pack assembly plants in the same region as EV
assembly plants. Transport costs are not explicitly included in the cost model.
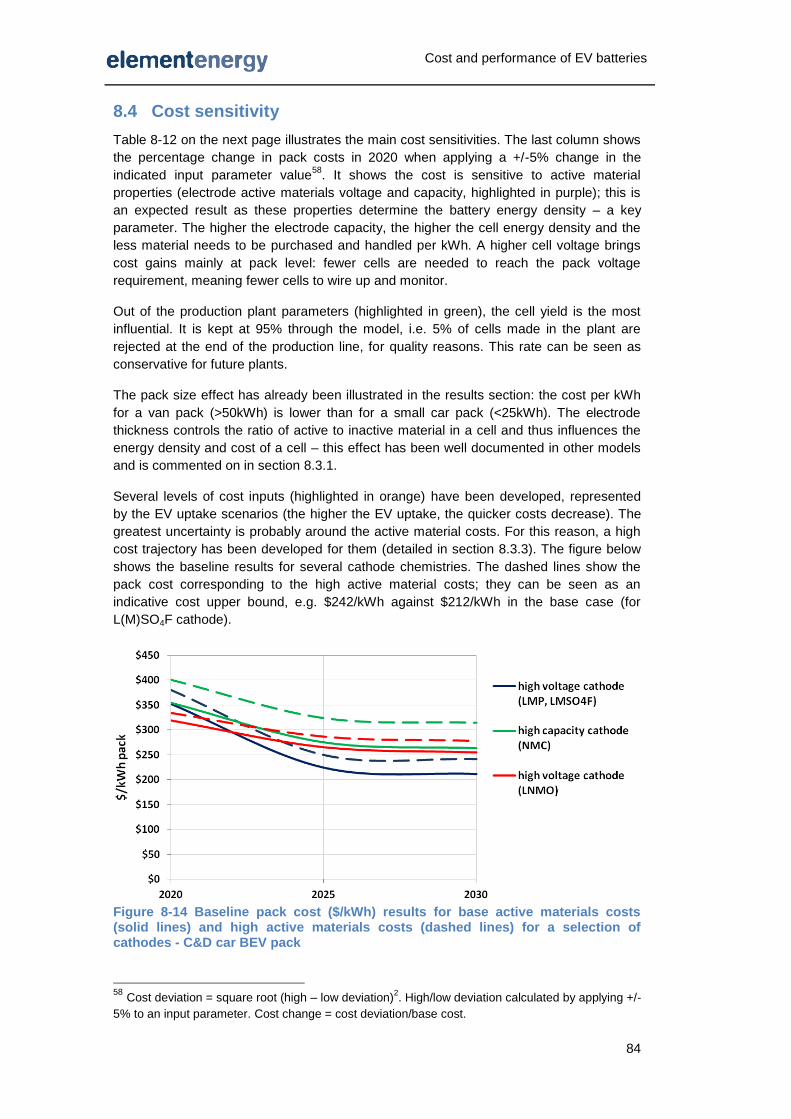
Cost and performance of EV batteries
84
8.4 Cost sensitivity
Table 8-12 on the next page illustrates the main cost sensitivities. The last column shows
the percentage change in pack costs in 2020 when applying a +/-5% change in the
indicated input parameter value58
. It shows the cost is sensitive to active material
properties (electrode active materials voltage and capacity, highlighted in purple); this is
an expected result as these properties determine the battery energy density – a key
parameter. The higher the electrode capacity, the higher the cell energy density and the
less material needs to be purchased and handled per kWh. A higher cell voltage brings
cost gains mainly at pack level: fewer cells are needed to reach the pack voltage
requirement, meaning fewer cells to wire up and monitor.
Out of the production plant parameters (highlighted in green), the cell yield is the most
influential. It is kept at 95% through the model, i.e. 5% of cells made in the plant are
rejected at the end of the production line, for quality reasons. This rate can be seen as
conservative for future plants.
The pack size effect has already been illustrated in the results section: the cost per kWh
for a van pack (>50kWh) is lower than for a small car pack (<25kWh). The electrode
thickness controls the ratio of active to inactive material in a cell and thus influences the
energy density and cost of a cell – this effect has been well documented in other models
and is commented on in section 8.3.1.
Several levels of cost inputs (highlighted in orange) have been developed, represented
by the EV uptake scenarios (the higher the EV uptake, the quicker costs decrease). The
greatest uncertainty is probably around the active material costs. For this reason, a high
cost trajectory has been developed for them (detailed in section 8.3.3). The figure below
shows the baseline results for several cathode chemistries. The dashed lines show the
pack cost corresponding to the high active material costs; they can be seen as an
indicative cost upper bound, e.g. $242/kWh against $212/kWh in the base case (for
L(M)SO4F cathode).
Figure 8-14 Baseline pack cost ($/kWh) results for base active materials costs (solid lines) and high active materials costs (dashed lines) for a selection of cathodes - C&D car BEV pack
58
Cost deviation = square root (high – low deviation)2. High/low deviation calculated by applying +/-
5% to an input parameter. Cost change = cost deviation/base cost.

Cost and performance of EV batteries
85
Table 8-12 Change in pack costs in 2020 for a +/-5% change in parameter value
Parameter Units Base value
% change in pack cost
Cathode voltage V 4 8%
Cell yield % 95% 6%
Cathode capacity mAh/g 150 5%
Total pack size (DOD window) % 80% 4%
Cathode active material density g/cm3 3.45 3%
Maximum electrode thickness μm 100 3%
Overhead rate % 0.30 2%
CAPEX cost factor - 1.00 1%
Pack voltage V 300 1%
Factory load factor % 95% 1%
Payback period years 5 1%
Cathode active material cost $/kg 14.65 1%
Margin % 10% 1%
Anode capacity mAh/g 1000 1%
Electrolyte cost $/dm3 21.6 1%
Anode active material cost $/kg 46 1%
Labour rate $/h 18 1%
Pack housing cost $/pack 325 1%
Warranty % 5% 1%
Power electronics cost $/pack 307 0.5%
Number of packs produced p.a. 100,000 0.5%
BMS cost $/cell 3.2 0.4%
Anode voltage V 0.1 0.4%
Labour time factor - 1 0.3%
Finance rate % 7.00% 0.2%
Production plant parameters Base cost: $352/kWh,
Cost inputs, linked to EV uptake LMP cathode Si/C anode
Material properties < R&D roadmap
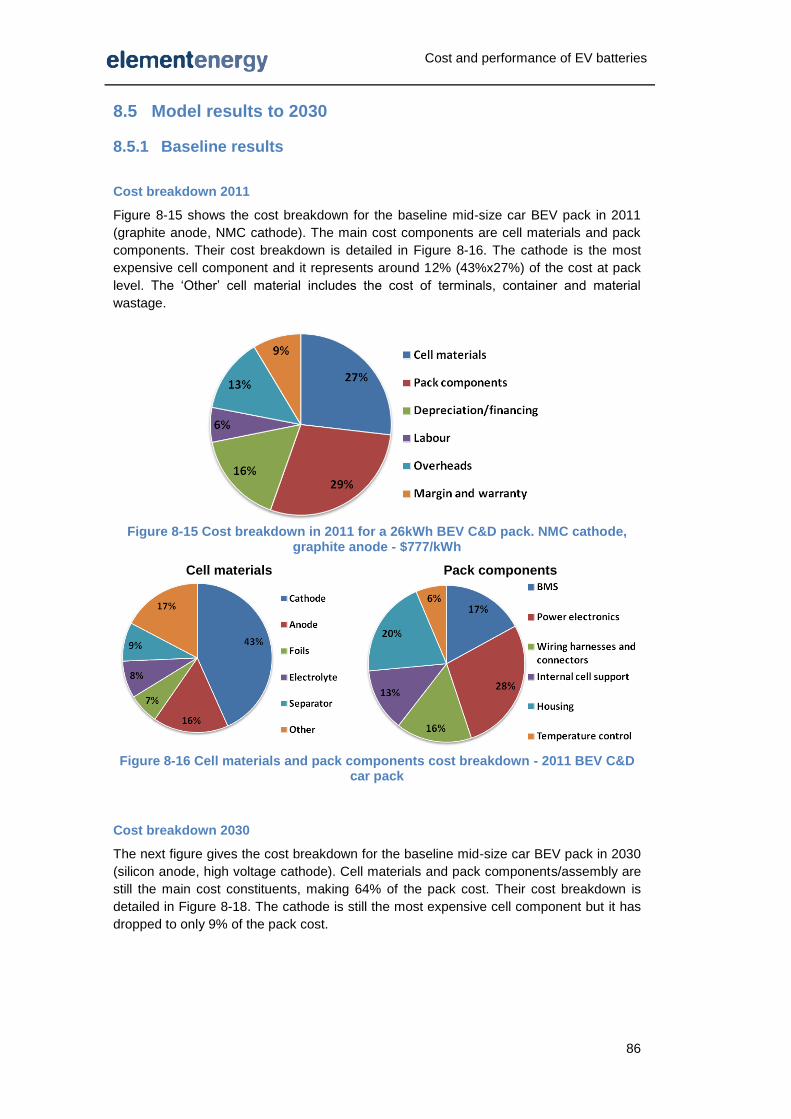
Cost and performance of EV batteries
86
8.5 Model results to 2030
8.5.1 Baseline results
Cost breakdown 2011
Figure 8-15 shows the cost breakdown for the baseline mid-size car BEV pack in 2011
(graphite anode, NMC cathode). The main cost components are cell materials and pack
components. Their cost breakdown is detailed in Figure 8-16. The cathode is the most
expensive cell component and it represents around 12% (43%x27%) of the cost at pack
level. The ‘Other’ cell material includes the cost of terminals, container and material
wastage.
Figure 8-15 Cost breakdown in 2011 for a 26kWh BEV C&D pack. NMC cathode,
graphite anode - $777/kWh
Cell materials
Pack components
Figure 8-16 Cell materials and pack components cost breakdown - 2011 BEV C&D
car pack
Cost breakdown 2030
The next figure gives the cost breakdown for the baseline mid-size car BEV pack in 2030
(silicon anode, high voltage cathode). Cell materials and pack components/assembly are
still the main cost constituents, making 64% of the pack cost. Their cost breakdown is
detailed in Figure 8-18. The cathode is still the most expensive cell component but it has
dropped to only 9% of the pack cost.

Cost and performance of EV batteries
87
Figure 8-17 Cost breakdown in 2030 for a 30kWh BEV C&D pack. High voltage cathode, Si/C anode - $212/kWh
Cell materials
Pack components
Figure 8-18 Cell materials and pack components cost breakdown - 2030 BEV C&D car pack
Pack results
The next table shows the model baseline results for BEV and PHEV applications. Several
cathode chemistries were run; only the one delivering the lowest cost is reported here.
Results for 2011 have been reviewed and validated by our industry partners but they
should be viewed as indicative only. As explained earlier in the report, current automotive
packs are built at low production volumes, and a wide range of costs is observed,
especially at cell level. The element of strategic pricing is certainly an important
determinant of costs at the present time, and it is challenging to remove this signal from
the market data.
The model results for 2015 already indicate a substantial cost decrease. This is mainly
driven by assumptions on cost reductions of pack components and cell footprint
standardisation, both in line with the announced investment in battery production
capacity. However if demand for EV stalls, and if the announced production capacity is
not fully utilised by 2015 (there are indications this may be the case), then the 2015
results should be interpreted as optimistic. Under such circumstances, it may be that a
2020 time horizon is more realistic for achieving the beneficial effects of volume
production.
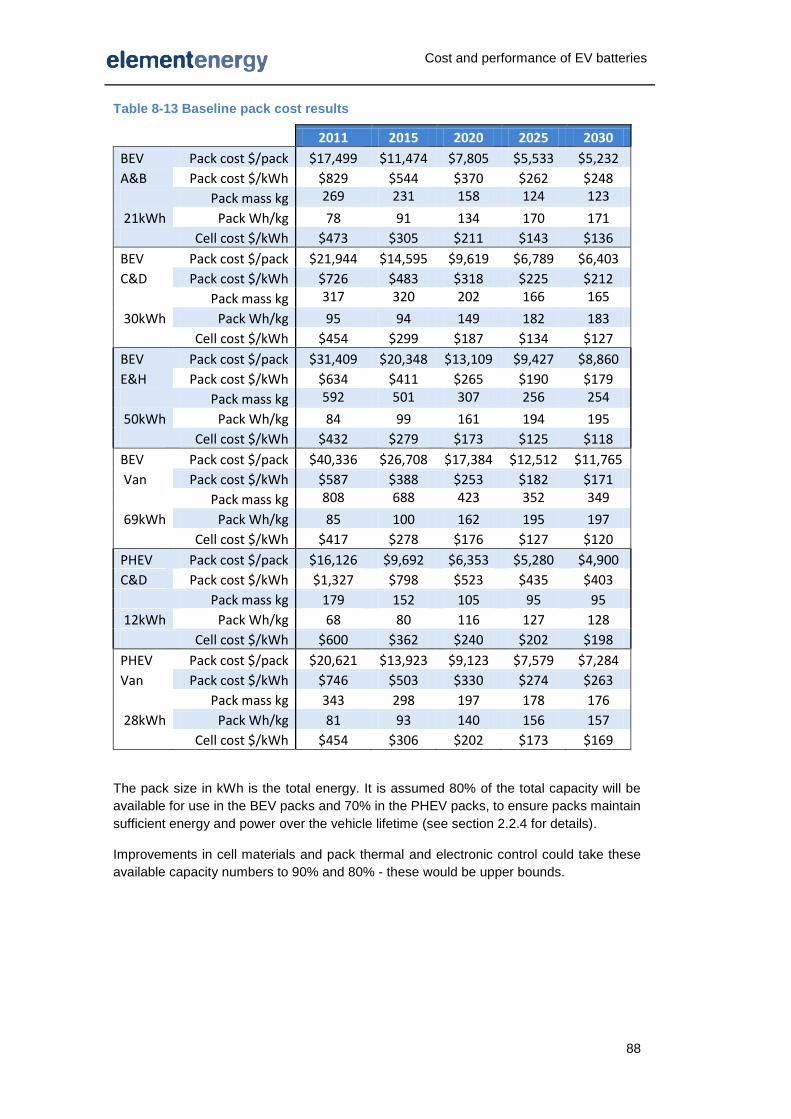
Cost and performance of EV batteries
88
Table 8-13 Baseline pack cost results
2011 2015 2020 2025 2030
BEV Pack cost $/pack $17,499 $11,474 $7,805 $5,533 $5,232
A&B Pack cost $/kWh $829 $544 $370 $262 $248
Pack mass kg 269 231 158 124 123
21kWh Pack Wh/kg 78 91 134 170 171
Cell cost $/kWh $473 $305 $211 $143 $136
BEV Pack cost $/pack $21,944 $14,595 $9,619 $6,789 $6,403
C&D Pack cost $/kWh $726 $483 $318 $225 $212
Pack mass kg 317 320 202 166 165
30kWh Pack Wh/kg 95 94 149 182 183
Cell cost $/kWh $454 $299 $187 $134 $127
BEV Pack cost $/pack $31,409 $20,348 $13,109 $9,427 $8,860
E&H Pack cost $/kWh $634 $411 $265 $190 $179
Pack mass kg 592 501 307 256 254
50kWh Pack Wh/kg 84 99 161 194 195
Cell cost $/kWh $432 $279 $173 $125 $118
BEV Pack cost $/pack $40,336 $26,708 $17,384 $12,512 $11,765
Van Pack cost $/kWh $587 $388 $253 $182 $171
Pack mass kg 808 688 423 352 349
69kWh Pack Wh/kg 85 100 162 195 197
Cell cost $/kWh $417 $278 $176 $127 $120
PHEV Pack cost $/pack $16,126 $9,692 $6,353 $5,280 $4,900
C&D Pack cost $/kWh $1,327 $798 $523 $435 $403
Pack mass kg 179 152 105 95 95
12kWh Pack Wh/kg 68 80 116 127 128
Cell cost $/kWh $600 $362 $240 $202 $198
PHEV Pack cost $/pack $20,621 $13,923 $9,123 $7,579 $7,284
Van Pack cost $/kWh $746 $503 $330 $274 $263
Pack mass kg 343 298 197 178 176
28kWh Pack Wh/kg 81 93 140 156 157
Cell cost $/kWh $454 $306 $202 $173 $169 The pack size in kWh is the total energy. It is assumed 80% of the total capacity will be
available for use in the BEV packs and 70% in the PHEV packs, to ensure packs maintain
sufficient energy and power over the vehicle lifetime (see section 2.2.4 for details).
Improvements in cell materials and pack thermal and electronic control could take these
available capacity numbers to 90% and 80% - these would be upper bounds.

Cost and performance of EV batteries
89
Results presented above were obtained when running the model for a target usable
energy (kWh), as defined in Appendix 8.1.
It has been shown that the cost per kWh varies with the pack size, especially for small
PHEV packs. The tables below show alternative results, when modelling a bigger pack to
reduce the cost per kWh, while staying in the range of input validity.
Note that in the case of the plug in hybrid C/D car, the cost premium is mostly down to the
thermal and electronic management of the pack (see page 57). Increasing the size of the
pack decreases the power to energy ratio and thus reduces the $/kWh of packing. The
model reproduces this – see Figure 8-19 – but does not reproduce a step change (such
as a change in thermal control method or cell type) that might occur in practice when
reducing the power to energy ratio.
Table 8-14 PHEV C/D car results when increasing the pack size
Unit 2020 2025 2030
12 kWh total (baseline)
Total pack cost $/kWh $523 $435 $403
$ $6,353 $5,280 $4,900
16kWh pack
Total pack cost $/kWh $448 $375 $350
$ $7,170 $5,995 $5,585
Figure 8-19 Cost of pack components for C/D PHEV in 2020
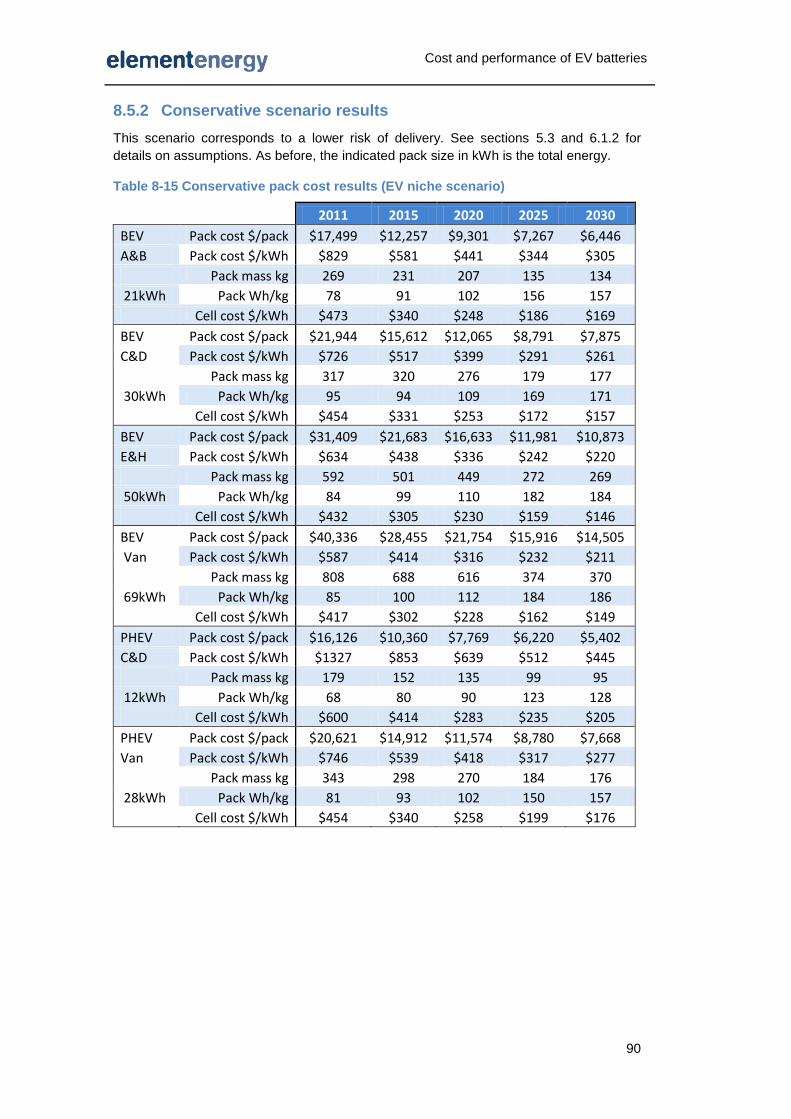
Cost and performance of EV batteries
90
8.5.2 Conservative scenario results
This scenario corresponds to a lower risk of delivery. See sections 5.3 and 6.1.2 for
details on assumptions. As before, the indicated pack size in kWh is the total energy.
Table 8-15 Conservative pack cost results (EV niche scenario)
2011 2015 2020 2025 2030
BEV Pack cost $/pack $17,499 $12,257 $9,301 $7,267 $6,446
A&B Pack cost $/kWh $829 $581 $441 $344 $305
Pack mass kg 269 231 207 135 134
21kWh Pack Wh/kg 78 91 102 156 157
Cell cost $/kWh $473 $340 $248 $186 $169
BEV Pack cost $/pack $21,944 $15,612 $12,065 $8,791 $7,875
C&D Pack cost $/kWh $726 $517 $399 $291 $261
Pack mass kg 317 320 276 179 177
30kWh Pack Wh/kg 95 94 109 169 171
Cell cost $/kWh $454 $331 $253 $172 $157
BEV Pack cost $/pack $31,409 $21,683 $16,633 $11,981 $10,873
E&H Pack cost $/kWh $634 $438 $336 $242 $220
Pack mass kg 592 501 449 272 269
50kWh Pack Wh/kg 84 99 110 182 184
Cell cost $/kWh $432 $305 $230 $159 $146
BEV Pack cost $/pack $40,336 $28,455 $21,754 $15,916 $14,505
Van Pack cost $/kWh $587 $414 $316 $232 $211
Pack mass kg 808 688 616 374 370
69kWh Pack Wh/kg 85 100 112 184 186
Cell cost $/kWh $417 $302 $228 $162 $149
PHEV Pack cost $/pack $16,126 $10,360 $7,769 $6,220 $5,402
C&D Pack cost $/kWh $1327 $853 $639 $512 $445
Pack mass kg 179 152 135 99 95
12kWh Pack Wh/kg 68 80 90 123 128
Cell cost $/kWh $600 $414 $283 $235 $205
PHEV Pack cost $/pack $20,621 $14,912 $11,574 $8,780 $7,668
Van Pack cost $/kWh $746 $539 $418 $317 $277
Pack mass kg 343 298 270 184 176
28kWh Pack Wh/kg 81 93 102 150 157
Cell cost $/kWh $454 $340 $258 $199 $176

Cost and performance of EV batteries
91
8.5.3 Optimistic scenario results
This scenario corresponds to a rapid deployment of new cell materials and high EV
uptake. See sections 5.3 and 6.1.2 for details on assumptions. As before, the indicated
pack size in kWh is the total energy.
Table 8-16 Optimistic pack cost results (EV push scenario)
2011 2015 2020 2025 2030
BEV Pack cost $/pack $17,499 $10,002 $6,082 $4,935 $4,687
A&B Pack cost $/kWh $829 $474 $288 $234 $222
Pack mass kg 269 197 142 123 123
21kWh Pack Wh/kg 78 107 149 171 171
Cell cost $/kWh $473 $250 $152 $131 $128
BEV Pack cost $/pack $21,944 $12,609 $7,394 $6,091 $5,806
C&D Pack cost $/kWh $726 $417 $245 $202 $192
Pack mass kg 317 272 186 165 165
30kWh Pack Wh/kg 95 111 162 183 183
Cell cost $/kWh $454 $245 $142 $124 $121
BEV Pack cost $/pack $31,409 $17,422 $10,149 $8,522 $8,163
E&H Pack cost $/kWh $634 $352 $205 $172 $165
Pack mass kg 592 423 281 254 254
50kWh Pack Wh/kg 84 117 176 195 195
Cell cost $/kWh $432 $229 $132 $116 $114
BEV Pack cost $/pack $40,336 $22,737 $13,503 $11,358 $10,915
Van Pack cost $/kWh $587 $331 $196 $165 $159
Pack mass kg 808 581 387 350 349
69kWh Pack Wh/kg 85 118 178 197 197
Cell cost $/kWh $417 $228 $135 $118 $115
PHEV Pack cost $/pack $16,126 $8,457 $5,338 $4,622 $4,311
C&D Pack cost $/kWh $1327 $696 $439 $380 $355
Pack mass kg 179 130 104 95 95
12kWh Pack Wh/kg 68 94 117 128 128
Cell cost $/kWh $600 $297 $200 $182 $175
PHEV Pack cost $/pack $20,621 $12,045 $7,615 $6,749 $6,374
Van Pack cost $/kWh $746 $436 $275 $244 $230
Pack mass kg 343 253 195 177 176
28kWh Pack Wh/kg 81 110 142 157 157
Cell cost $/kWh $454 $251 $174 $157 $151