final report de-fg02-08er41548
TRANSCRIPT

1
Final Report on Benchmarking Heavy Ion Transport Codes
FLUKA, HETC-HEDS MARS15, MCNPX, and PHITS
DE-FG02-08ER41548

2
Final Report on Benchmarking Heavy Ion Transport Codes
FLUKA, HETC-HEDS MARS15, MCNPX, and PHITS
DE-FG02-08ER41548
Funding received in k$ FY 08/09
Michigan State University (R. M. Ronningen)
72
Oak Ridge National Laboratory (I. Remec)
127
University of Tennessee-Knoxville 30 Total 229
3
Table of Contents Table of Contents .......................................................................................................................... 3 Table of Figures............................................................................................................................. 4 1 Overview of Efforts ................................................................................................ 7
1.1 Introduction ................................................................................................ 7 1.2 Purpose ..................................................................................................... 7 1.3 R&D Collaboration ..................................................................................... 8 1.4 Expertise in Collaboration .......................................................................... 9 1.4.1 Facilities and Resources used in the R&D Efforts ..................................... 9 1.4.2 Execution of Collaborative Effort .............................................................. 10
2 Executive Summary............................................................................................. 10 3 Project Publications ............................................................................................. 10 4 Background ......................................................................................................... 11
4.1 Overview .................................................................................................. 11 5 Computer Codes Used in Study .......................................................................... 12
5.1 Code Descriptions ................................................................................... 12 5.1.1 FLUKA ..................................................................................................... 13 5.1.2 PHITS ...................................................................................................... 13 5.1.3 MCNPX .................................................................................................... 14 5.1.4 MARS15 .................................................................................................. 15 5.1.5 HETC-HEDS ............................................................................................ 15
6 Results ................................................................................................................ 19 6.1 Thin, Thick Target Neutron Calculations using FLUKA, MARS15, MCNPX,
PHITS and HETC-HEDS ......................................................................... 19 6.1.1 Experimental Data ................................................................................... 19 6.1.2 Modeling and Simulations ........................................................................ 20 6.1.3 Results ..................................................................................................... 21 6.1.4 Discussion ............................................................................................... 33 6.1.5 Conclusions ............................................................................................. 35 6.2 Shielding Calculations.............................................................................. 36 6.2.1 Highlights of Shielding Calculation Effort ................................................. 37 6.2.2 Conclusions of Effort on Shielding Benchmarks ...................................... 40 6.3 Fragment Production Calculations ........................................................... 41 6.3.1 Isotope distributions from projectile fragmentation reactions ................... 41 6.4 Testing PHITS Capabilities for Beam Energies Less Than 20 MeV/u ..... 45 6.4.1 Introduction .............................................................................................. 45 6.4.2 Highlights of Effort towards Testing PHITS Capabilities for Beam Energies
Less Than 20 MeV/u ................................................................................ 46 6.4.3 Validating Calculations of Neutron Dose Equivalents against
Measurements for Heavy Ion Incident Reactions below 20 MeV/u .......... 49 7 Conclusions and Recommendations ................................................................... 51 8 References .......................................................................................................... 53 9 Appendices .......................................................................................................... 57
9.1 Appendix 1. Measured and calculated (PHITS) double-differential neutron spectra from 230 MeV/u 4He + Al, 400 MeV/u N + C, 600 MeV/u Si + C, 500 MeV/u Fe + Li, and 400 MeV/u Xe + Li ............................................. 57

4
9.2 Appendix 2. Measured and calculated (MARS15) double-differential neutron spectra from 230 MeV/u 4He + Al, ……...................................... 57
9.3 Appendix 3. Isotope production in 140 MeV/u 48Ca Fragmentation Reactions with Be .................................................................................... 57
9.4 Appendix 4. Isotope production in 140 MeV/u 48Ca Fragmentation Reactions with Ta .................................................................................... 57
9.5 Appendix 5. Isotope production in 140 MeV/u 64Ni Fragmentation Reactions with Be .................................................................................... 57
9.6 Appendix 6. Isotope production in 140 MeV/u 64Ni Fragmentation Reactions with Ta .................................................................................... 57
Table of Figures
Figure 6-1. General layout of the HIMAC experimental setup on beam line SB2 for thin target measurements. ............................................................................................................................... 19
Figure 6-2. Model of the experiment used for simulations with MCNPX code: (right panel) three dimensional sketch of the surfaces used for tallying neutrons; (left panel) details of the surface dimensions. ................................................................................................................................... 21
Figure 6-3. Measured and calculated double-differential neutron spectra from 400 MeV/nucleon 132Xe on 0.9-cm-thick Li target; (upper panel) MARS15 simulation; (lower panel) MCNPX simulation. ..................................................................................................................................... 23
Figure 6-4. Measured and calculated double-differential neutron spectra from 230 MeV/nucleon 4He on thin (2.0 cm) Al target: (upper panel) PHITS simulation; (lower panel) FLUKA simulation. ..................................................................................................................................... 24
Figure 6-5. Measured and calculated double-differential neutron spectra from 600 MeV/nucleon Si on 0.4-cm-thick Cu target: (upper panel) MCNPX2.7b simulation; (lower left panel) MCNPX 2.7d03 simulation; (lower right panel) MCNP6 simulation. ........................................................ 25
Figure 6-6. Measured and calculated double-differential neutron spectra from 400 MeV/nucleon 132Xe on 0.05-cm-thick Pb target: (left panel) PHITS simulation; (right panel) MCNPX simulation. ..................................................................................................................................... 26
Figure 6-7. Angular distribution of neutrons from 400 MeV/nucleon 132Xe on (left panel) 0.9-cm-thick Li target and (right panel) 0.05-cm-thick Pb target. Simulations were performed with the MCNPX code. ......................................................................................................................... 26
Figure 6-8. Measured and calculated double-differential neutron spectra at 5 degrees from 600 MeV/nucleon 28Si on 0.4-cm-thick Cu target. The measured data (Exp) are from the study of Heilbronn et al. [32]. Calculations were performed using the HIC 1 model with the HETC-HEDS code (red line) [9], the LAQGSM code (green line) [20] and the MCNPX 2.7b code (black line) [8]. ................................................................................................................................................. 27
Figure 6-9. Measured and calculated double-differential neutron spectra at 20 degrees from 600 MeV/nucleon 28Si on 0.4-cm-thick Cu target. The measured data (Exp) are from the study of

5
Heilbronn et al. [32]. Calculations were performed using the HIC 1 model with the HETC-HEDS code (red line) [9].......................................................................................................................... 27
Figure 6-10. Measured and calculated double-differential neutron spectra at 80 degrees from 600 MeV/nucleon 28Si on 0.4-cm-thick Cu target. The measured data (Exp) are from the study of Heilbronn et al. [32]. Calculations were performed using the HIC 1 model with the HETC-HEDS code (red line) [9], and the LAQGSM code (green line) [20]. ..................................................... 28
Figure 6-11. Measured and calculated double-differential thick-target neutron yields from 400 MeV/nucleon C on a 15.0-cm-thick Al target. Simulations were performed with the FLUKA code. .............................................................................................................................................. 29
Figure 6-12. Measured and calculated double-differential thick-target neutron yields from 400 MeV/nucleon Ar on a 5.5-cm-thick Al target. Simulations were performed with the FLUKA code. .............................................................................................................................................. 30
Figure 6-13. Measured and calculated double-differential thick-target neutron yields from 400 MeV/nucleon Fe on a 3.0-cm-thick Al target. Simulations were performed with the FLUKA code. .............................................................................................................................................. 30
Figure 6-14. Measured and calculated double-differential thick-target neutron yields from 400 MeV/nucleon C on a 5.0-cm-thick Cu target: (upper panel) at laboratory angles 0, 7.5, and 15 degrees; (lower panel) at laboratory angles 30, 60, and 90 degrees. Simulations were performed with the MCNPX code. ............................................................................................... 31
Figure 6-15. Measured and calculated double-differential thick-target neutron yields from 400 MeV/nucleon Ar on 5.5-cm-thick Al target: (upper panel) at laboratory angles 0, 7.5, and 15 degrees; (lower panel) at laboratory angles 30, 60, and 90 degrees. Simulations were performed with the MCNPX code. ................................................................................................................. 32
Figure 6-16. Measured and calculated angular distribution of neutrons from (left panel) 400 MeV/nucleon Ar on 5.5-cm-thick Al target, and (right panel) 400 MeV/nucleon C on 15.0-cm-thick Al target. Simulations were performed with the FLUKA code. .......................................... 33
Figure 6-17. Measured and calculated angular distribution of neutrons from (left panel) 400 MeV/nucleon C on 5.0-cm-thick Cu target, and (right panel) 400 MeV/nucleon Ar on 5.5-cm-thick Al target. Simulations were performed with the MCNPX code. ......................................... 33
Figure 6-18. Comparison of various data on neutron attenuation length at 90° for concrete (left panel) and iron (right panel) as a function of incident proton energy (Ban et al. [40],[41], Nunomiya et al. [42], Stevenson et al. [43], Alsmiller et al. [44], Bull et al. [45], Tesh [39], Agosteo et al. [31],[34]. ................................................................................................................ 38
Figure 6-19. Attenuation length in concrete for secondary neutrons generated at 0-10° and 85-95° (80-90° for Agosteo) by specific energy ions. The lines are only to guide the eye. .............. 39
Figure 6-20. Attenuation length in cast iron for secondary neutrons generated at 0-10° and 85-95° by specific energy ions. The solid lines are only to guide the eye. ........................................ 40
Figure 6-21. Isotopic distributions of measured fragmentation production cross sections are plotted as a function of neutron excess for elements boron through calcium isotopes produced in reactions of 140 MeV/u 48Ca with a beryllium target (left panel) and with a tantalum target (right

6
panel). The data are shown as solid circles. The solid lines connect results of simulations using the code PHITS (version 2.13) for the JQMD time parameter nqtmax = 100 fm/c (see text). ..... 43
Figure 6-22. Cross sections for sulphur isotopes produced by beam fragmentation in the reaction 140 MeV/u 48Ca on a beryllium target are shown as a function of mass number. The solid pink circles are experimental data and the solid lines are from simulations using the code PHITS (version 2.13) with the JQMD time parameter nqtmax = 150, 130, and 100 fm/c (see text). ...... 44
Figure 6-23. Neutron energy spectra using switching times 50, 100 and 150 fm c-1 for 6.25 MeV amu-1 12C incident ion reactions with a thick copper target. One fm c-1 is 3.3 x 10⁻²⁴ s. ............. 47
Figure 6-24. Neutron energy spectra using switching times 50, 100 and 150 fm c-1 for 10 MeV amu-1 12C incident ion reactions with a thick copper target. One fm c-1 is 3.3 x 10⁻²⁴ s. ............. 47
Figure 6-25. Neutron energy spectra using switching times 50, 100 and 150 fm c-1 for 10 MeV amu-1 16O incident ion reactions with on a thick copper target. One fm c-1 is 3.3 x 10⁻²⁴ s. ........ 48
Figure 6-26. Neutron dose equivalent rates at 1 m from thick targets of iron, nickel and copper, and at 90° from the incident heavy ion beam direction. The beam current is 1 particle nanoAmpere, equal to 6.25x10⁹ particles/s. Lines are the fitting results using the equation 𝑫 = 𝜶𝑬𝜷, where D is the neutron dose equivalent rate (µSv h-1), E is the incident specific energy (MeV amu-1), and α and β are constants that depend on the target material (see Table 3 in Reference [52]. .............................................................................................................................. 50

7
1 Overview of Efforts 1.1 Introduction This report is the Final Report for the project “Benchmarking Heavy Ion Transport Codes
PHITS, FLUKA, HETC-HEDS, and MARS15” (DE-FG02-08ER41548). The report is organized
in the following way. First, a brief overview of the overall purpose of the R&D efforts will be
given together with a presentation of the collaboration and resources. This will be followed by a
detailed description of the achieved R&D results. Within the report the specific energy of an ion
in a beam is specified in units of MeV/u (or MeV amu-1) and is taken to mean MeV per nucleon.
1.2 Purpose The US nuclear physics community’s effort towards realizing a next-generation facility for rare
isotope ion beams [1] has resulted in the design and establishment of the Facility for Rare
Isotope Beams (FRIB) [2]. This has been accompanied with substantial research and
development work involving many institutions in the US. FRIB is to be based on a driver linac
capable of accelerating light and heavy ions with a beam power up to 400 kW and a specific
energy of 200 MeV/u for uranium. There are possibilities for energy upgrades, to ~ 1 GeV
protons, ~ 500 MeV/u for heavy ions such as xenon, and 400 MeV/u for uranium. Interactions of
beams having high beam power at these energies with materials may pose significant personnel
safety challenges. In such rare isotope beam facilities dedicated to scientific research with heavy
ions, simulations are necessary to support the design of components, such as production targets
and beam stops, and predictions of radiation fields are necessary to support shielding design and
safety analyses, to assess lifetime of components because of radiation-induced damage, and to
plan safe operation of facilities. Given the relatively short time (~ 10 years) that simulation tools
such as heavy ion transport codes have been publically available it is thus important to
benchmark and validate the codes used in design support.
8
This report summarizes a one-year collaborative R&D project carried out by Michigan State
University (MSU), Oak Ridge National Laboratory (ORNL), University of Tennessee-Knoxville
(UTK), Scientific Investigation and Development (SID), and Research Organization for
Information Science & Technology (RIST, Japan).
There is significant overlap in the radiation effects issues and methods used to address them
between this project and the following previously completed DOE-funded RIA R&D and RIB
Capabilities collaborative efforts performed between 2003 and 2008:
• “Development of a Concept for High Power Beam Dumps and Catchers, and the Pre-
separator Area Layout for Fragment Separators for the Rare Isotope Accelerator
Project (funded under DE-FG02-04ER41313);”
• “Development of a Concept for the ISOL Target Areas for RIA (funded under DE-
FG02-04ER41322);”
• “Determination of Component Activation and Radiation Environment in the RIA
Second Stripper Region (funded under DE-FG02-05ER41403).”
• “Studies of Limits on Uncontrolled Heavy Ion Beam Losses for Allowing Hands-On
Maintenance (funded under DE-FG02-07ER41475)”
1.3 R&D Collaboration The R&D Collaboration for this project consisted of members of Michigan State University
(MSU), Oak Ridge National Laboratory (ORNL), University of Tennessee-Knoxville (UTK),
Scientific Investigation and Development (SID), and Research Organization for Information
Science & Technology (RIST, Japan).

9
1.4 Expertise in Collaboration Rare isotope beam production and neutronics experts at MSU, ORNL, UTK, SID, RIST, and
JAEA have established a strong collaboration regarding the calculations of radiation fields,
shielding, and material damage.
Full and part-time members of the present R&D collaboration:
• Georg Bollen, Mikhail Kostin, Reginald M. Ronningen, Man Yee Betty Tsang, Roger
Roberts, Amy Coronado (undergraduate student), and Kyle Bort (undergraduate student)
Michigan State University, National Superconducting Cyclotron Laboratory
• Igor Remec, Oak Ridge National Laboratory
• Lawrence H. Heilbronn and Josh Marshall (graduate student), University of Tennessee-
Knoxville
• Tony Gabriel, Scientific Investigation and Development, 9608 Lyttleton Lane,
Knoxville, TN 37922
• Koji Niita, Research Organization for Information Science & Technology (RIST)
• Yosuke Iwamoto, Japan Atomic Energy Agency
1.4.1 Facilities and Resources used in the R&D Efforts ORNL has extensive analytical, computational, and experimental resources available to support
this project. A wide range of computer codes, including MCNPX, PHITS, MARS and ORIHET
are licensed and were used in this work. There is access to several clusters of high-end PC’s
operating under LINUX with a distributed processing capability.
MSU has extensive experience in accelerator design (cyclotrons, superconducting linear
accelerator components), rare isotope production, and the design of fragment separators.

10
Detailed knowledge exists of the effects of radiation on the facility components and impact on
facility operation and design. MSU also has experience with several of the relevant computer
codes (MCNPX, PHITS, MARS15, DCHAIN-SP 2001) and access to adequate computational
resources to perform the work. Within the previous DOE-funded RIA R&D efforts the NSCL
purchased a 16-node/32-processor computing cluster dedicated to DOE-funded R&D
calculations. In addition, MSU has an established high-performance computing center, which is
available to the NSCL. Both computing capabilities were extensively used within this work.
1.4.2 Execution of Collaborative Effort Efficient and frequent communication between the collaborating partners has been of particular
importance for a project. The collaboration is small enough that frequent phone conferences and
e-mail exchanges between the MSU, ORNL, and UTK PIs to address project and data
management issues have taken place at regular intervals.
2 Executive Summary This research provided insight on the reliability and opportunities for improvement of currently
available heavy ion radiation transport codes for the simulation of radiation fields, which is
necessary for the safe, reliable and cost effective design of any future radioactive ion beam
facility. Benchmarking data were obtained. Simulations using each code were carried out and
compared against data for secondary neutron production from thick-targets, double-differential
cross sections for secondary neutron production from thin targets, isotope production, neutron
attenuation lengths in shielding materials, and for prompt neutron dose rates produced by low-
energy heavy ion reactions.
3 Project Publications The collaboration produced the following publications during the project:
• Improvements to Neutron Data Relevant to GCR Transport, Lawrence Heilbronn, Lawrence Townsend, Hiroshi Iwase, and Takashi Nakamura, Aerospace Conference,
11
2009 IEEE, Big Sky, Montana, March 7-14, 2009. 10.1109/AERO.2009.4839361
• Estimating Neutron Dose Equivalent Rates from Heavy-Ion Reactions around 10 MeV amu-1 using the PHITS Code, Yosuke Iwamoto, R.M. Ronningen, and Koji Niita, Health Physics 98, pp. 591-596 (2010).
• Attenuation of ambient dose equivalent from neutrons by thick concrete, cast iron and composite shields for high energy proton, 3He, 48Ca and 238U ions on Cu targets for shielding design, Yosuke Iwamoto and R.M. Ronningen, Nucl. Instrum. Methods B 269, pp.353-363(2011). http://dx.doi.org/10.1016/j.nimb.2010.11.046
• Benchmarking of Neutron Production of Heavy-Ion Transport Codes, I. Remec, R. M. Ronningen, and L. Heilbronn, Journal of ASTM International Vol. 9, April 12, 2012. DOI: 10.1520/JAI104227
• FLUKA Benchmarking Studies of Secondary Neutron Production, Josh Marshall, Master's Degree Project Report, Department of Nuclear Engineering, University of Tennessee (2010)
• NEUTRON ENERGY SPECTRA AND DOSE EQUIVALENT RATES FROM HEAVY-ION REACTIONS BELOW 20 MEV/U USING THE PHITS CODE, Yosuke Iwamoto, Reginald Ronningen, and Koji Niita, TU6RFP058, Proceedings of the 23rd Particle Accelerator Conference PAC09, 4 – 8 May 2009, Vancouver, BC, Canada pp. 1683-1685 (2009)
4 Background 4.1 Overview Simulations of heavy ion (HI) interactions and predictions of resulting radiation fields are needed
in such diverse areas as medicine, space exploration, and construction and operation of facilities
for scientific research. In medicine, HI beams are used for radiotherapy, and simulations are
needed to optimize the treatment [3]. In space explorations, adequate shielding will be needed to
protect astronauts in spacecraft and in habitats on the Moon or Mars from galactic cosmic
radiation (GCR) and solar energetic particle (SEP) events. While GCR and SEP predominantly
consist of protons, heavy ions also contribute and are of particular concern because of their
higher ionization rate [4]. In facilities dedicated to scientific research with heavy ions,
simulations are necessary to support the design of components, such as production targets and
beam stops, and predictions of radiation fields are necessary to support shielding design, to
assess lifetime of components because of radiation-induced damage, and to plan operation of

12
facilities. One such facility — the Facility for Rare Isotope Beams (FRIB) [2] — is being
designed by Michigan State Univ. and will be established as a U.S. Dept. of Energy Office of
Science User Facility in support of the mission of the Office of Nuclear Physics. FRIB will
deliver an energetic beam of primary ions, ranging from hydrogen (at about 600 MeV/proton) to
uranium (at about 200 MeV/nucleon) to a production target where rare isotopes will be produced
through the fragmentation process. A specific rare isotope, selected for an experiment, will be
separated from other fragments and delivered to the experimental area where the capabilities to
perform experiments with fast, stopped, or reaccelerated beams will be available. With a primary
beam power of 400 kW, the FRIB (which is projected to be complete around 2020) is expected
to be the most intense source of rare isotope beams worldwide. The FRIB project requires
accurate and reliable simulations of HI transport and is the main reason for this benchmarking
effort. Whereas interactions of energetic HIs with targets generate a host of fragments, we will
concentrate on the neutron production in this section. Neutrons are the most penetrating
secondary particles produced and as such dictate shielding requirements, which in turn often
represent a large part of the facility cost. Except in areas in close proximity to the primary beam,
neutrons are also responsible for most of the activation and radiation damage to the materials and
components of the facility.
5 Computer Codes Used in Study 5.1 Code Descriptions We selected for benchmarking the codes FLUKA [5], MARS15 [6], PHITS [7], MCNPX [8],
and HETC-HEDS [9] mostly because they are well established and in widespread use for particle
and radiation transport calculations, but also because members of our collaboration have ample
experience with these codes. Significant characteristics of these codes are briefly outlined in the
following sections.

13
5.1.1 FLUKA FLUKA treats nucleus–nucleus interactions with the Boltzmann master equation (BME) at
energies below 0.1 GeV/nucleon, with the modified relativistic quantum molecular dynamics
(RQMD) model in the energy interval from 0.1 GeV/nucleon to 5 GeV/nucleon, and with the
Dual Parton Model (DPMJETII or DMPJET-III) above 5 GeV/nucleon. Hadron–nucleus
interactions below 5 GeV/nucleon are treated with the pre-equilibrium approach to nuclear
thermalization (PEANUT) cascade model. The version used in this study was FLUKA 2009-b.
5.1.2 PHITS PHITS is a three dimensional radiation transport code system with the capabilities of
transporting heavy ions as well as protons, neutrons, charged pions, electrons, positrons, gamma
rays, etc. The main transport module and the proton, neutron, and charged pion collision modules
of PHITS were originally obtained from the ORNL code NMTC [9] and have been modified
with various upgrades and improvements. For high-energy neutrons and other particles, Jet AA
Microscopic Transport Model (JAM) [11] and JAERI Quantum Molecular Dynamics (JQMD)
[12] are used to simulate particle induced reactions up to about 200 GeV, and nucleus–nucleus
collisions up to about 100A GeV, respectively. Hadron–nucleus interactions at energies below
200 GeV are treated with the Jet AA microscopic transport model (JAM) and with JQMD or the
Bertini model at energies below ~3.5 GeV followed by the Generalized Evaporation Model
(GEM) [13]. Fission and evaporation processes are treated by GEM. The GEM code calculates
the final yields of light nuclei produced from the de-excitation of residual nuclei.
The JQMD model is a semiclassical simulation method based on the following assumptions:
(i) Each nucleon can be represented by a Gaussian wave packet in both coordinate and
momentum space. (ii) The time evolution of position and momentum of the i-th nucleon can be
described by Newtonian equations and the stochastic two-body collision term. (iii) Since the
14
JQMD model does not have Fermionic properties, the physical ground state cannot be calculated.
However, the binding energy and phase space distribution are those typical of the real ground
state, so that a random packing procedure can be employed in this model. (iv). At the end of the
dynamical stage of the reaction, the JQMD simulation yields many fragments, and so a switch is
made to the statistical model GEM. The GEM model is a simulation program which describes
the de-excitation process of an excited nucleus, and is based [14] on the generalized evaporation
model and the Atchison fission model.
Neutrons which emerge from the nucleus below about 20-MeV are then transported in the same
manner as in the MCNP4C radiation transport code [15]. PHITS employs the cross sections from
evaluated nuclear data libraries such as ENDF-B/VI [16] and JENDL-3.3 [17] up to 20 MeV and
LA150 up to 150 MeV [18]. PHITS also uses evaluated nuclear data for photon and electron
transport below 1 GeV in the same manner as the MCNP4C code. The geometry input to PHITS
may be either Combinatorial Geometry (CG) or Generalized Geometry (GG). It is possible to
import directly any MCNPX-type geometry definition. Versions PHITS 2.13 and PHITS 2.14
were used in this work.
5.1.3 MCNPX MCNPX is a general-purpose radiation simulation code that transports up to 34 particle types
and, in addition, heavy ions. Physics models are used from 1 TeV down to energies where
tabular data are available (most generally below 20 MeV, and below 150 MeV in some cases).
Currently, MCNPX is a merger project of MCNP 4C [15] and LAHET 2.8 [19]. There are
several intra-nuclear cascade, fission, and evaporation physics models that may be used in
combinations. These combinations are: Bertini/Dresner, CEM2K, ISABEL/Dresner,
Bertini/ABLA, ISABEL/ABLA, INCL4/Dresner, and INCL4/ABLA. MCNPX can also use the
15
Los Alamos quark–gluon string model (LAQGSM [20], version 03.03) for nucleus–-nucleus
interactions at energies up to ~1 TeV/nucleon. For interactions of protons, neutrons, pions, and
gamma rays at energies below ~3.5 GeV, the cascade-exciton model (CEM) is recommended.
Both LAQGSM and CEM include intranuclear cascade, coalescence, and preequilibrium decay,
followed by equilibrium evaporation/fission stage. For projectiles with mass numbers less than
13, the Fermi breakup model is also included. Except where specifically marked otherwise, the
results reported here were obtained with MCNPX 2.7d03. MCNPX uses an enhanced
Combinatorial Geometry (CG) to treat arbitrary three-dimensional configurations of geometric
cells, bounded by first- and second-degree surfaces and fourth-degree elliptical tori that contain
materials of interest. MCNP also provides a “macrobody” capability, where basic shapes such as
spheres, boxes, cylinders, etc., may be combined using Boolean operators.
5.1.4 MARS15 MARS15 uses LAQGSM (version 03.03) for nucleus–nucleus interactions at energies up to 1
TeV/nucleon. At higher energies, DMPJET-III is used. The CEM model is employed as the
default for hadron–nucleus interactions below 5 GeV. Both LAQGSM and CEM have
capabilities as described in the paragraph on MCNPX. The version of the code used in this work
was MARS15.
5.1.5 HETC-HEDS HETC-HEDS is an extension of the Monte Carlo radiation transport code HETC to include
transport of energetic heavy ions, such as are found in the galactic cosmic ray spectrum. An
event generator capable of providing nuclear interaction data for use in HETC was developed
and incorporated into the code. The event generator predicts the interaction product yields and
production angles and energies using nuclear models and Monte Carlo techniques.

16
The original version of HETC simulated the particle cascade by using Monte Carlo techniques to
compute the trajectories of the primary particle and the secondary particles produced in nuclear
collisions [21]. The particles considered by the original version of HETC (protons, neutrons, π+,
π-, μ+, or μ-) could be arbitrarily distributed in angle, energy, and space. The energy loss of
protons, charged pions, and muons due to the excitation and ionization of atomic electrons is
treated using the well-established Bethe-Bloch stopping power formula based on the continuous
slowing-down approximation. Multiple Coulomb scattering of primary particles is treated.
Charged-pion decay in flight is taken into account. A π+ which comes to rest is assumed to decay
immediately into a μ+ and a neutrino. A π- that comes to rest may either decay or be captured by
a nucleus. HETC does not transport π0, although the energy, direction, and spatial point of the π0
produced are included as part of the output. Muon decay in flight is taken into account using the
known muon lifetime. Muons that come to rest are assumed to decay immediately. No
information for the electrons, positrons, or neutrinos from muon decay is calculated. Elastic
collisions of protons and π with all nuclei other than hydrogen are neglected at all energies. Pion
production is based on the isobar model of Sternheimer and Lindenbaum [22]. Only single- and
double- pion production in nucleon-hydrogen collisions and single- pion production in p-nucleon
collisions are accounted for. Nonelastic nucleon collisions and charged- pion collisions with
hydrogen at energies above 3.5 GeV and 2.5 GeV, respectively, are treated by using calculational
methods that utilize experimental data for the total nonelastic n-p, p-p, π+-p, and π--p cross
sections and analytic fits to experimental data. The intranuclear-cascade evaporation concept of
particle-nucleus interaction as implemented by Bertini [10] is used to determine the effect of
particle-nucleus collisions below 3.5 GeV for nucleons and 2.5 GeV for charged pions.
Following the intranuclear-cascade the excitation energy left in the nucleus is treated using an

17
evaporation model. The particles emitted during evaporation include protons, neutrons, d, 3H,
3He, and alphas. For high energy (10-20 GeV) hadron-nucleus collisions, a complete intranuclear
cascade does not develop. A multi-chain fragmentation model of hadron-nucleus collisions that
has been developed and implemented in FLUKA [5], is used, with some modifications. To fill
the gap between 3 to ~15 GeV, a scaling model is used. HETC used the combinatorial geometry
package so virtually arbitrary geometries are allowed. Each particle in the cascade is followed
until it eventually disappears by escaping from the geometric boundaries of the system,
undergoes nuclear collision or absorption, comes to rest due to energy losses from ionization and
excitation of atomic electrons, or, in the case of pions and muons, decays. Neutrons produced
below a given cutoff, usually 20 MeV, and photons produced in the cascade or from deexcitation
are not transported. Instead, the information is stored for transport by codes such as MCNPX [8],
MORSE [23], or EGS [24]. The complete cascade history file is provided.
Not included in the original HETC code was the transport and interactions of incident particles
with A > 1. HETC has now been modified to include the transport of heavier nuclei. Included in
this newer version of HETC, now called HETC-HEDS, are nucleus-nucleus cross sections,
range-energy tables scaled from the proton data, and a nuclear collision module for heavy ion
interactions [9],[25]. The nucleus-nucleus cross sections include the total, total reaction, and
elastic scattering cross sections. The total reaction cross section is the cross section for all
nuclear interactions that are not elastic scattering events. The elastic scattering cross section is
the difference between the total cross section and the total reaction cross section. The nuclear
collision module has two parts, one for elastic scattering events and one for fragmentation
events. The fragmentation/spallation part is divided into two pieces as well, one for choosing the
species of fragments produced and one for choosing those particles’ kinetic energies and

18
directions of travel. In non-elastic collisions, the resulting fragments, kinetic energies, and
directions of travel are calculated for the projectile. Target quantities are obtained by
interchanging the target and projectile. Choosing fragments produced in non-elastic collisions is
accomplished by using a semiempirical model [26] to calculate heavy ion fragment production
cross sections, where heavy is defined as lithium and heavier. Alpha fragmentation has been
parameterized, and equations for helium-3, triton, and deuteron production cross sections were
taken from NASA TP 3285 [27]. Particle production due to helium-3 and triton breakup is based
on their total proton and neutron production cross sections since each of these particles only have
two reaction channels each. Deuteron breakup simply uses the total reaction cross section since it
only has one reaction channel. The kinetic energy of fragmentation/spallation products is chosen
using a microscopic model for the estimation of energy degradation in nucleus-nucleus collisions
developed at the Naval Research Laboratory [28]. The momentum distribution of projectile
fragmentation products is isotropic in a rest frame moving with nearly the projectile velocity.
The momentum distribution of target fragmentation products is isotropic in a rest frame nearly at
rest. Details can be found in references [9] and [25]. Missing from the extension of HETC to
HETC-HEDS are mesons produced in heavy ion collisions. Also missing are contributions from
de-excitation gammas produced in the heavy ion fragmentation events. However, pion
production and gamma decays in nucleon - nucleus collisions were included in the original
HETC code. Recently models of pion production from heavy ion collisions have been developed
for use in HETC-HEDS, but are not yet incorporated [29],[30].

19
6 Results 6.1 Thin, Thick Target Neutron Calculations using FLUKA, MARS15,
MCNPX, PHITS and HETC-HEDS 6.1.1 Experimental Data The experiments that we selected for benchmarking were performed at the Heavy Ion Medical
Accelerator in Chiba (HIMAC) facility of the National Institute of Radiological Sciences in
Japan. Figure 6-1 shows a general layout of the experimental setup for measurements with thin
targets.
Figure 6-1. General layout of the HIMAC experimental setup on beam line SB2 for thin target measurements.

20
Ion beams extracted from the synchrotron had a pulse width between 0.5 s and 1 s. Neutron
detectors were located at angles from 5 degrees to 80 degrees with respect to the ion beam
direction at distances between ~3 m and 5 m from the center of the target (the target position is
shown in Figure 6-1). Neutron detectors were NE213 cylindrically shaped liquid scintillators
with a 12.7-cm-diameter base and 12.7 cm length. With respect to the target, each neutron
detector subtended a solid angle ranging from ~0.5 millisteradians (detector at 5°, 5.06 m) to
1.35 msr (detector at 80°, 3.06 m). Neutron spectra were measured with a time-of-flight
technique, and precautions were taken to exclude contributions from charged particles, gamma
rays, and background generated by neutrons scattered in the room and components of the
experimental setup other than the ion target itself. A similar setup was used for the thick target
experiments; however, the detectors were located at different angles with respect to the ion beam
direction and at different distances from the target. Details about the experiments can be found in
Refs. [19] and [30], which were the main sources of data for this work.
6.1.2 Modeling and Simulations The models of the experimental setup used in the MCNPX, FLUKA, and PHITS simulations
were quite simple, consisting just of the HI beam target and scoring surfaces or volumes
representing the neutron detectors. Because the background corrections were applied to the
measurements, there was no need to model the room and the details of the experimental setup.
The HI beam was modeled as a monodirectional and monoenergetic “pencil beam.” To improve
the efficiency of the Monte Carlo simulations, neutron current was not tallied over the actual
surface area of the detector but, instead, over larger surfaces of the spherical segments. The left
panel of Figure 6-2 is a three-dimensional sketch of the “tally surfaces,” and the right panel of
Figure 6-2 gives the dimensions of the surfaces. “Extending” the tallying surface of the detector
into a spherical segment does not introduce any approximations because the neutron field has

21
axial symmetry around the direction of the HI beam. However, the intervals of the polar angle
covered by spherical segments were larger than the polar angle intervals covered by the
detectors. This introduces an approximation: in the simulation the neutron spectrum at any given
detector location is averaged over a larger polar angle than the measured spectrum. A simulation
with tally surfaces equal to detector surfaces was also performed, and it was found that the effect
of this approximation is negligible.
Figure 6-2. Model of the experiment used for simulations with MCNPX code: (right panel) three dimensional sketch of the surfaces used for tallying neutrons; (left panel) details of the surface dimensions.
The simulations using MARS code was carried out by creating the geometry of the experiment
utilizing so-called ‘non-standard’ geometry. Neutron double differential cross sections were
generated in control detectors representing the seven neutron detectors used in the experiment.
6.1.3 Results 6.1.3.1 Thin targets results “Thin” targets are thin in comparison to the beam range; therefore, ion slowdown in the target is
small and interactions occur essentially at the beam energy. The contributions of secondary

22
interactions—for example, interactions of secondary fragments in the target—are also negligible.
Thin target experiments allow the determination of double-differential neutron production cross
sections. Figure 6-3 to Figure 6-6 show comparisons of measured and calculated double-
differential neutron spectra. The spectra at each laboratory angle are offset by factors of 10.
Figure 6-7 compares measured and calculated angular distributions of neutrons, which are
obtained by integrating double-differential neutron spectra over energy. The statistical
uncertainties of the double-differential cross sections obtained from computer simulations were
typically better than 1 % and in a few cases reached a few %. The uncertainties of the measured
double-differential cross sections varied considerably; however, they were typically in the 20–30
% range, with larger uncertainties typically observed at the highest and the lowest energies at
each angle; details can be found in References [21] and [32].

23
Figure 6-3. Measured and calculated double-differential neutron spectra from 400 MeV/nucleon 132Xe on 0.9-cm-thick Li target; (upper panel) MARS15 simulation; (lower panel) MCNPX simulation.

24
Figure 6-4. Measured and calculated double-differential neutron spectra from 230 MeV/nucleon 4He on thin (2.0 cm) Al target: (upper panel) PHITS simulation; (lower panel) FLUKA simulation.
25
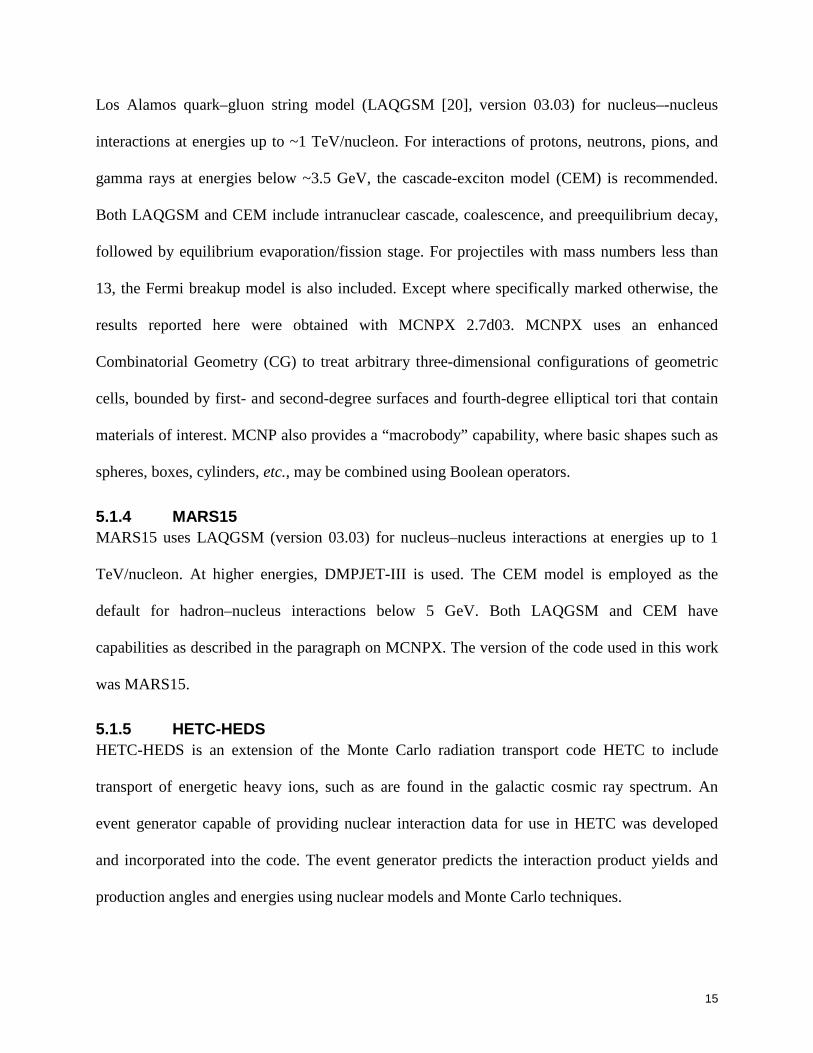
Figure 6-5. Measured and calculated double-differential neutron spectra from 600 MeV/nucleon Si on 0.4-cm-thick Cu target: (upper panel) MCNPX2.7b simulation; (lower left panel) MCNPX 2.7d03 simulation; (lower right panel) MCNP6 simulation.

26
Figure 6-6. Measured and calculated double-differential neutron spectra from 400 MeV/nucleon 132Xe on 0.05-cm-thick Pb target: (left panel) PHITS simulation; (right panel) MCNPX simulation.
Figure 6-7. Angular distribution of neutrons from 400 MeV/nucleon 132Xe on (left panel) 0.9-cm-thick Li target and (right panel) 0.05-cm-thick Pb target. Simulations were performed with the MCNPX code.

27
Figure 6-8. Measured and calculated double-differential neutron spectra at 5 degrees from 600 MeV/nucleon 28Si on 0.4-cm-thick Cu target. The measured data (Exp) are from the study of Heilbronn et al. [32]. Calculations were performed using the HIC 1 model with the HETC-HEDS code (red line) [9], the LAQGSM code (green line) [20] and the MCNPX 2.7b code (black line) [8].
Figure 6-9. Measured and calculated double-differential neutron spectra at 20 degrees from 600 MeV/nucleon 28Si on 0.4-cm-thick Cu target. The measured data (Exp) are from the study of Heilbronn et al. [32]. Calculations were performed using the HIC 1 model with the HETC-HEDS code (red line) [9].

28
Figure 6-10. Measured and calculated double-differential neutron spectra at 80 degrees from 600 MeV/nucleon 28Si on 0.4-cm-thick Cu target. The measured data (Exp) are from the study of Heilbronn et al. [32]. Calculations were performed using the HIC 1 model with the HETC-HEDS code (red line) [9], and the LAQGSM code (green line) [20].
Additional comparisons of measured and calculated double-differential neutron spectra are
shown in Appendices 1 and 2.
Appendix 1 in Section 9.1 shows comparisons of measured and calculated double-differential
neutron spectra as calculated by PHITS. Ratios of calculated-to-experimental cross sections over
experimentally determined energy bins within each angle bin are also shown.
Appendix 2 in Section 9.2 shows comparisons of measured and calculated double-differential
neutron spectra as calculated by MARS15.
6.1.3.2 Thick target results “Thick” targets are typically slightly thicker than the HI range. In these targets HIs slow down
and ultimately stop, so interactions can occur at any energy from the initial beam energy to the
threshold for nuclear interactions. Fragments generated by primary HI beam interactions can also
interact and contribute to neutron production. The neutrons produced can themselves interact in
the target. Figure 6-1 - Figure 6-15 show comparisons of measured and calculated double-

29
differential thick-target neutron yields. The yields at each laboratory angle are offset by factors
of 10. Figure 6-16 and Figure 6-17 compare measured and calculated angular distributions of
neutron yields from thick targets, which are obtained by integrating double-differential neutron
yields over energy. The statistical uncertainties of the double-differential thick-target neutron
yields obtained from computer simulations were typically better than 1% and in a few cases
reached a few %. The uncertainties of the measured double-differential thick-target neutron
yields are likely somewhat larger than those of the double-differential cross sections; some
information can be found in Ref. [32].
Figure 6-11. Measured and calculated double-differential thick-target neutron yields from 400 MeV/nucleon C on a 15.0-cm-thick Al target. Simulations were performed with the FLUKA code.
30
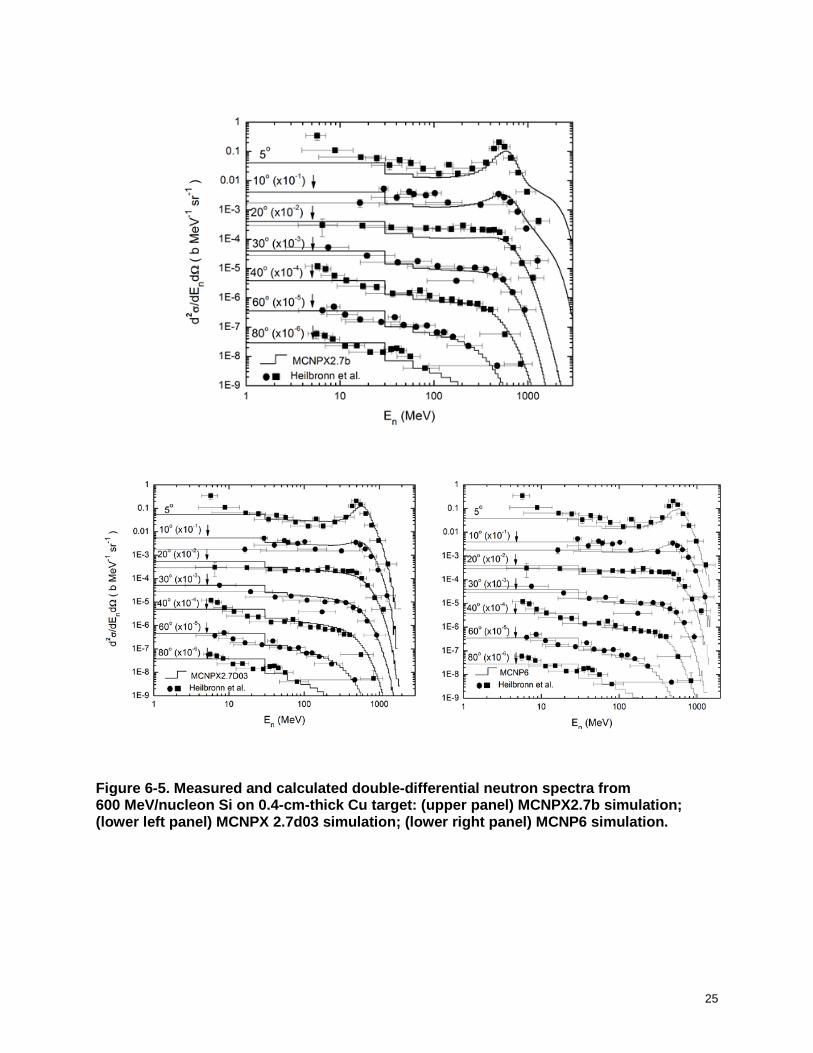
Figure 6-12. Measured and calculated double-differential thick-target neutron yields from 400 MeV/nucleon Ar on a 5.5-cm-thick Al target. Simulations were performed with the FLUKA code.
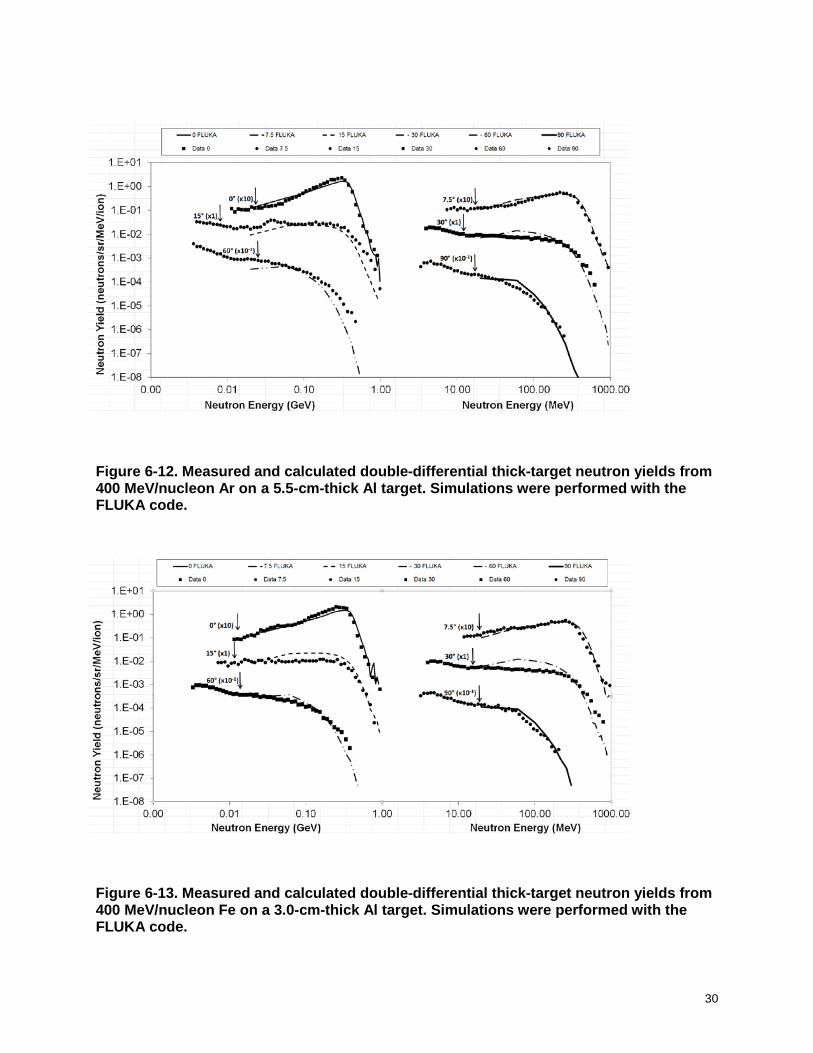
Figure 6-13. Measured and calculated double-differential thick-target neutron yields from 400 MeV/nucleon Fe on a 3.0-cm-thick Al target. Simulations were performed with the FLUKA code.

31
Figure 6-14. Measured and calculated double-differential thick-target neutron yields from 400 MeV/nucleon C on a 5.0-cm-thick Cu target: (upper panel) at laboratory angles 0, 7.5, and 15 degrees; (lower panel) at laboratory angles 30, 60, and 90 degrees. Simulations were performed with the MCNPX code.

32
Figure 6-15. Measured and calculated double-differential thick-target neutron yields from 400 MeV/nucleon Ar on 5.5-cm-thick Al target: (upper panel) at laboratory angles 0, 7.5, and 15 degrees; (lower panel) at laboratory angles 30, 60, and 90 degrees. Simulations were performed with the MCNPX code.

33
Figure 6-16. Measured and calculated angular distribution of neutrons from (left panel) 400 MeV/nucleon Ar on 5.5-cm-thick Al target, and (right panel) 400 MeV/nucleon C on 15.0-cm-thick Al target. Simulations were performed with the FLUKA code.
Figure 6-17. Measured and calculated angular distribution of neutrons from (left panel) 400 MeV/nucleon C on 5.0-cm-thick Cu target, and (right panel) 400 MeV/nucleon Ar on 5.5-cm-thick Al target. Simulations were performed with the MCNPX code.
6.1.4 Discussion All four codes reproduce the basic characteristics of the double-differential neutron spectra from
thin targets reasonably well. The spectra at forward directions (at 5 and 10 degrees) exhibit a
pronounced peak at the neutron energies approximately corresponding to the energy-per-nucleon
of the HI beam, indicating that they are mostly produced by fragmentation of the HI projectiles.
However, the spectra also exhibit a “high-energy tail,” which is particularly important in
shielding applications.

34
We observed that MCNPX 2.7B predicted excessive production of high energy neutrons in
forward directions (upper panel of Figure 6-5) and we communicated the findings to the code
developers. This anomaly was corrected in later versions of the MCNPX code and the MCNP6
code (see lower panels of Figure 6-5).
At larger angles with respect to the HI beam direction, the peak in the neutron spectrum at the
specific energy of the HI beam is less pronounced; these spectra are mostly dictated by neutron
emission during the preequilibrium phase, which produces neutrons with energies from a few
MeV to several hundred MeV (depending on the HI beam energy) and evaporation from the
residual nuclide that dominates neutron spectra at low energies. In general, simulations agree
well with the experiment at larger angles, indicating that preequilibrium and equilibrium
processes are adequately modeled. It appears that FLUKA to some extent overpredicts neutron
production from light beams (see Figure 6-4) but is more consistent for heavier projectiles.
Angular distributions of neutrons are predicted quite well, as illustrated in Figure 6-6.
For thick targets, only results from FLUKA and MCNPX are shown here. FLUKA again shows
overprediction of neutrons at all angles for lighter ions (see Figure 6-11) but agrees better with
measurements for heavier projectiles (Figure 6-12 and Figure 6-13). MCNPX results for thick
targets are less consistent with the measurements than the results for thin targets. They show
considerable underprediction of neutron production for forward directions (0 and 7.5 degrees)
from low energies up to the specific energy of the HI beam, and overprediction at 90 degrees at
all energies (Figure 6-14 and Figure 6-15). The comparisons of angular distributions of neutron
yields from thick targets (Figure 6-16 and Figure 6-17) support the observations made for
double-differential neutron yields.
35
From the calculations shown in Appendix 1 in Section 9.1, it appears that PHITS somewhat
underpredicts neutron production from the lightest (He and N) beams, somewhat overpredicts
production from the Si beam, and provides good agreement with experiment for a heavy beam
like Xe.
The results of MARS15 calculations for all projectile-target combinations are shown in
Appendix 2 in Section 9.2. Combinations of Si and lighter projectiles and light targets have a
tendency of producing an excess of neutrons over the experimental data, whereas interactions of
those projectiles and heavier targets, and heavier projectiles/targets provide better agreement
with experiment (the Xe + Pb system is an exception). The over-prediction of neutrons for the
He + Al system is significant. These results have been communicated to the code author. Further
validation work is recommended as the code development matures.
It is also recommended that because of the interest in 3He beams for rare isotope production by
isotope-separation-on-line (ISOL) techniques, neutron production from 3He beams should be
experimentally studied. Literature searches for appropriate published data proved negative.
6.1.5 Conclusions We performed simulations of a series of benchmark-quality heavy ion experiments with the
computer codes FLUKA, HETC-HEDS, MARS15, MCNPX, and PHITS. We focused on the
comparisons of secondary neutron production. All of the selected codes reproduce the shape of
the double-differential neutron spectra from thin targets reasonably well; however, further
development appears to be necessary to achieve consistency over the full range of projectile
masses and energies. It is recommended that because of the interest in 3He beams for rare isotope
production by isotope-separation-on-line (ISOL) techniques, neutron production from 3He beams
should be experimentally studied. Literature searches for appropriate published data proved
36
negative. Simulations of the double-differential thick-target neutron yields were also in
reasonable agreement with experiments. The value of benchmark and validation studies such as
performed here was emphasized by observations of excess high-energy neutron production at
forward angles by MCNPX2.7B that were communicated to and rapidly corrected by the code
developers.
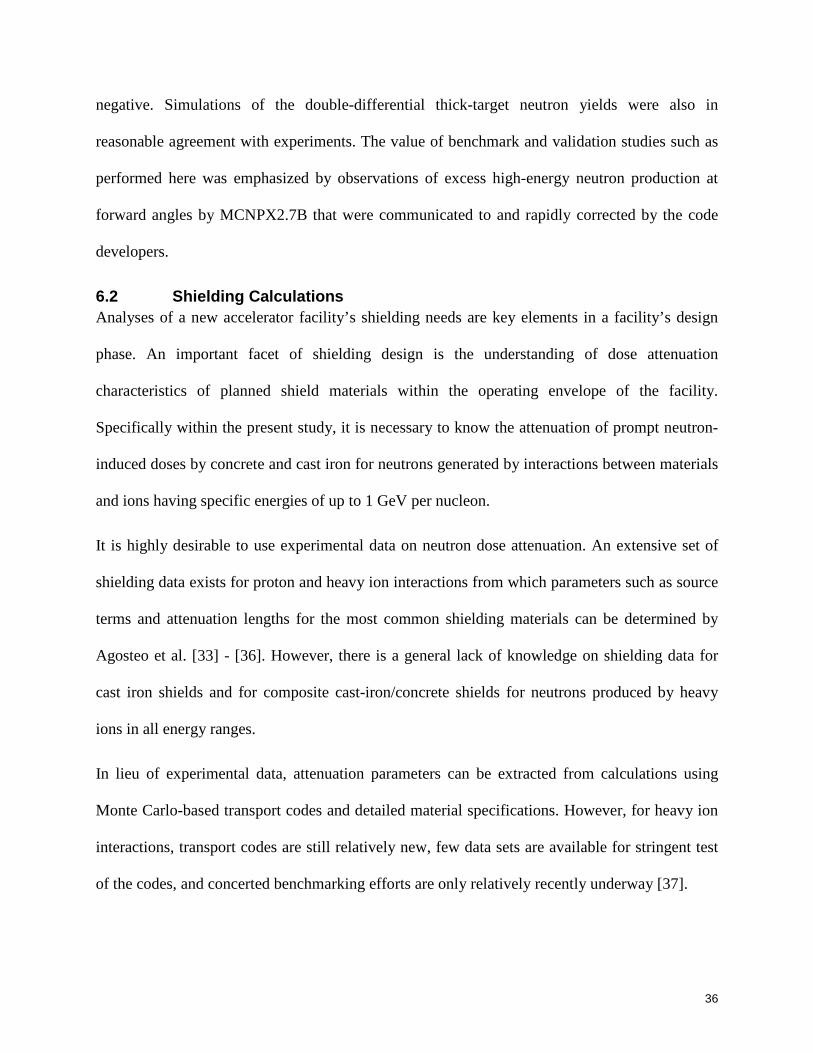
6.2 Shielding Calculations Analyses of a new accelerator facility’s shielding needs are key elements in a facility’s design
phase. An important facet of shielding design is the understanding of dose attenuation
characteristics of planned shield materials within the operating envelope of the facility.
Specifically within the present study, it is necessary to know the attenuation of prompt neutron-
induced doses by concrete and cast iron for neutrons generated by interactions between materials
and ions having specific energies of up to 1 GeV per nucleon.
It is highly desirable to use experimental data on neutron dose attenuation. An extensive set of
shielding data exists for proton and heavy ion interactions from which parameters such as source
terms and attenuation lengths for the most common shielding materials can be determined by
Agosteo et al. [33] - [36]. However, there is a general lack of knowledge on shielding data for
cast iron shields and for composite cast-iron/concrete shields for neutrons produced by heavy
ions in all energy ranges.
In lieu of experimental data, attenuation parameters can be extracted from calculations using
Monte Carlo-based transport codes and detailed material specifications. However, for heavy ion
interactions, transport codes are still relatively new, few data sets are available for stringent test
of the codes, and concerted benchmarking efforts are only relatively recently underway [37].

37
Encouraged by the good agreement between calculations and measurements of neutron fluences
outside of thick shields found during the work in part supported by the U.S. Department of
Energy under Grant No. DE-FG02-ER41313 (summarized in Reference [38]), Iwamoto and
Ronningen [39] published results of calculations using PHITS of neutron dose attenuation by
thick concrete, cast iron, and cast iron plus concrete composite, shields, for heavy ions and
protons having high energies (200 – 1000 MeV/u). This work is in part supported by the present
Grant No. DE-FG02-08ER41548 and details of the calculations are found within Reference [39].
Parameterized fits of the calculated results to simple equations were made in order to obtain
numerical relationships between values of the effective dose equivalents and shield thickness.
The methodology was validated against a similar study [33] - [37] by Agosteo et al. who used
FLUKA and against some experimental and calculated attenuation lengths.
6.2.1 Highlights of Shielding Calculation Effort Calculations were performed with the version 2.14 of the PHITS Monte Carlo code using the
same geometry used in work by Agosteo et al. [34] except that neutron energy and angular
distributions of experimental data for the neutron source were replaced by those generated by
PHITS calculations. The evaluated nuclear data files ENDF/B-VI [40] were used for neutron
transport below 20 MeV with respect to the resonance structure in many materials.
Calculated neutron attenuation lengths in concrete and iron for the 1 GeV proton incident
reaction at 90o and comparisons to other calculated results [33] [36] and experimental data [42]
are shown in Figure 6-18.
38
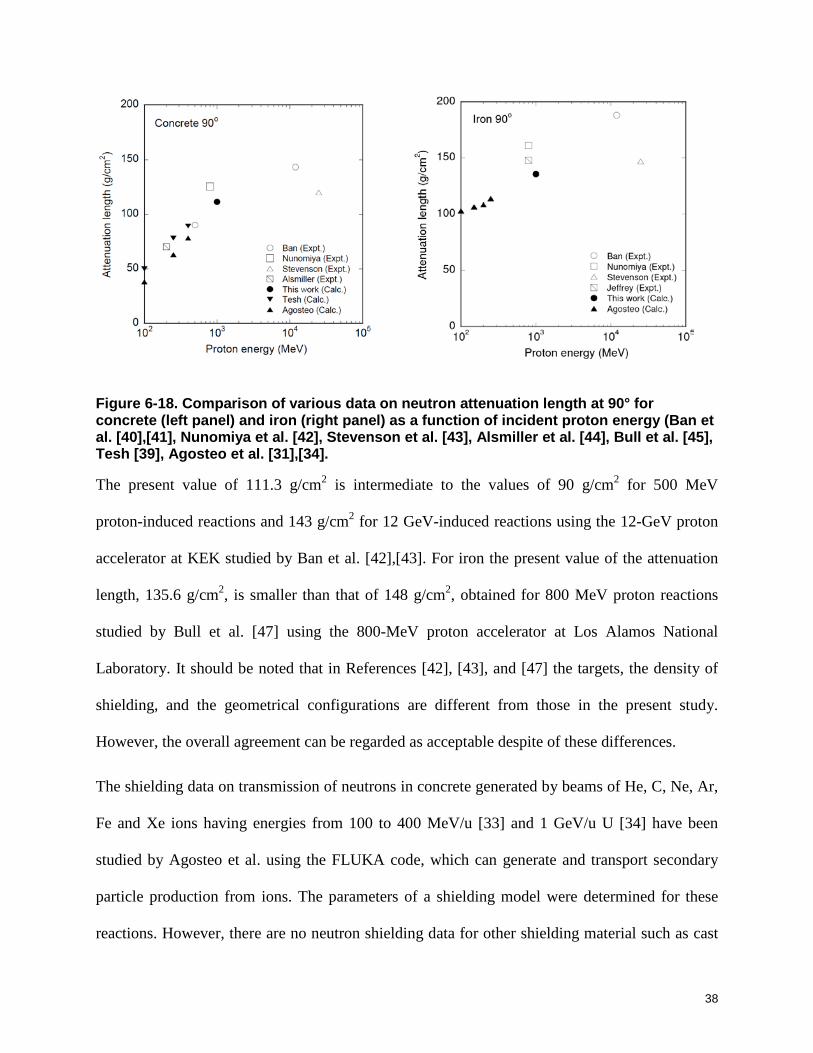
Figure 6-18. Comparison of various data on neutron attenuation length at 90° for concrete (left panel) and iron (right panel) as a function of incident proton energy (Ban et al. [40],[41], Nunomiya et al. [42], Stevenson et al. [43], Alsmiller et al. [44], Bull et al. [45], Tesh [39], Agosteo et al. [31],[34].
The present value of 111.3 g/cm2 is intermediate to the values of 90 g/cm2 for 500 MeV
proton-induced reactions and 143 g/cm2 for 12 GeV-induced reactions using the 12-GeV proton
accelerator at KEK studied by Ban et al. [42],[43]. For iron the present value of the attenuation
length, 135.6 g/cm2, is smaller than that of 148 g/cm2, obtained for 800 MeV proton reactions
studied by Bull et al. [47] using the 800-MeV proton accelerator at Los Alamos National
Laboratory. It should be noted that in References [42], [43], and [47] the targets, the density of
shielding, and the geometrical configurations are different from those in the present study.
However, the overall agreement can be regarded as acceptable despite of these differences.
The shielding data on transmission of neutrons in concrete generated by beams of He, C, Ne, Ar,
Fe and Xe ions having energies from 100 to 400 MeV/u [33] and 1 GeV/u U [34] have been
studied by Agosteo et al. using the FLUKA code, which can generate and transport secondary
particle production from ions. The parameters of a shielding model were determined for these
reactions. However, there are no neutron shielding data for other shielding material such as cast

39
iron and cast iron-concrete composite shields for neutrons from heavy ion reactions. The
attenuation lengths for all reactions in concrete at 0o-10o and 85o-95o for this work and 80o-90o
for Agosteo et al. [34] are compared in Figure 6-19. The results from Agosteo et al. shown in
Figure 6-19 are the mean values of the attenuation length for the various projectile-target
combinations in the specific energy with 400 MeV/u [34] and 1 GeV [35]. The attenuation
lengths in cast iron for this work are shown in Figure 6-20. Our results are in general agreement
with the results of Agosteo et al. For the incident energy of 1 GeV/u in the study by Agosteo et
al, the averaged attenuation length was determined by the attenuation length of 12C and 238U with
specific energy of 1 GeV/u.
Figure 6-19. Attenuation length in concrete for secondary neutrons generated at 0-10° and 85-95° (80-90° for Agosteo) by specific energy ions. The lines are only to guide the eye.

40
Figure 6-20. Attenuation length in cast iron for secondary neutrons generated at 0-10° and 85-95° by specific energy ions. The solid lines are only to guide the eye.
6.2.2 Conclusions of Effort on Shielding Benchmarks The attenuation length and source term of the neutron dose rates of the bulk shielding in the
angular range from 0o to 125o have been determined by the PHITS calculations for
300 MeV/u and 550 MeV/u 48Ca, 200 MeV/u and 400 MeV/u 238U, 800 MeV/u 3He and 1 GeV
protons on Cu targets. Bulk shields of concrete, cast iron and a composite of cast iron plus
concrete were considered. For the 1 GeV proton incident reaction, calculated interaction lengths
for concrete and cast iron at 90o agree well with experimental data having somewhat different
density and geometry than used in the present study. Calculated interaction lengths for concrete
used as shielding against neutrons from heavy-ions incident reactions at 0o-10o and 85o-95o were
also compared to the mean value of interaction lengths for the various projectile-target by

41
Agosteo et al., and the agreement can be regarded as acceptable. High energy limits of
interaction length at 90o in the energy region above 400 MeV/u by this work, 111g/cm2 for
concrete and 136 g/cm2 for cast iron, were almost the same as the values obtained using a simple
geometrical approximation, 117 g/cm2 for concrete and 134 g/cm2 for iron (see discussion in
Ref. [48]). As composite barrier is more effective than concrete or cast iron alone, neutron dose
attenuation can be achieved with thinner shielding. The results of this work should be useful in
the shielding design of high-powered, high-energy heavy ion accelerators such as FRIB, with a
view to reduce time-consuming Monte Carlo calculations.
6.3 Fragment Production Calculations The performance of the Monte Carlo code system PHITS is validated for heavy ion transport
capabilities by performing simulations and comparing results against experimental data from
heavy ion reactions of benchmark quality. These data are from measurements of isotope yields
produced in the fragmentation of a 140 MeV/u 48Ca beam on a beryllium target and on a
tantalum target, and a 140 MeV/u 64Ni beam on a beryllium target and on a tantalum target. The
prediction of residual radioactivity and nuclide distributions is needed in determining inventories
for facility licensing and for radiation protection purposes. Simulations are then often necessary
to obtain residual radioactivity from spallation, fragmentation and fission processes. The results
of these comparisons can be used to suggest possible improvements to code models. Simulations
were carried out using the PHITS code system [7].
6.3.1 Isotope distributions from projectile fragmentation reactions Recent studies of isotope production cross sections from projectile fragmentation reactions were
carried out [49],[50] using 40,48Ca and 58,64Ni beams at 140 MeV/u on beryllium and tantalum
targets from the Coupled Cyclotron Facility at NSCL. These data, and other high quality data
obtained [51] using the 86Kr beam at 64 MeV/u at RIKEN, produced nearly 1800 isotope

42
production cross sections. We performed simulations using PHITS to obtain fragmentation
production cross sections for the 48Ca + Be, Ta systems and the 64Ni + Be, Ta for comparison
with the experiments. Isotopic distributions of the measured and calculated fragmentation
reaction production cross sections as a function of neutron excess for these latter systems are
shown in the appendices in Sections 9.3-9.6.
As an example, Figure 6-21 shows isotopic distributions of the measured and calculated
fragmentation reaction production cross sections as a function of neutron excess for 140 MeV/u
48Ca reactions on Be and Ta. As seen from this figure and from the results shown in the
appendices, PHITS provides good agreement with experiment in magnitude and in isotopic
dependence on neutron excess for N-Z up to about 7. For larger values of neutron excess, PHITS
overpredicts the cross sections, which is apparently related to interplay between descriptions of
the dynamical and statistical processes in fragment formation.

43
Figure 6-21. Isotopic distributions of measured fragmentation production cross sections are plotted as a function of neutron excess for elements boron through calcium isotopes produced in reactions of 140 MeV/u 48Ca with a beryllium target (left panel) and with a tantalum target (right panel). The data are shown as solid circles. The solid lines connect results of simulations using the code PHITS (version 2.13) for the JQMD time parameter nqtmax = 100 fm/c (see text).
PHITS uses the JQMD model [12] to treat dynamical processes in nucleus-nucleus collisions,
e.g. direct and non-equilibrium reactions, forming highly excited fragments. The statistical
model GEM [13] is then used to describe statistical processes later in the time evolution of the
systems, e.g. decays of the fragments by fission and evaporation. The time evolution of a system
from the dynamical to statistical phase is of significant interest. Within PHITS simulations, the
JQMD calculations of dynamical processes are stopped, excited nuclei are created, and results
transferred to GEM for decay in a statistical way at a time specified by the parameter nqtmax
(“switching time”). The default value in PHITS is 150 fm/c. This value may not be optimum and
study is warranted. Beginning with PHITS version 2.13, the parameter nqtmax can be set

44
externally. Simulations of the system 48Ca+Be were carried out using nqtmax = 150, 130 and
100 fm/c. The results are shown in Figure 6-22 for the sulphur isotopes.
Figure 6-22. Cross sections for sulphur isotopes produced by beam fragmentation in the reaction 140 MeV/u 48Ca on a beryllium target are shown as a function of mass number. The solid pink circles are experimental data and the solid lines are from simulations using the code PHITS (version 2.13) with the JQMD time parameter nqtmax = 150, 130, and 100 fm/c (see text).
There are significant differences for most isotopes when the neutron excess is large. The
improvement with decreasing switching times for the dynamic evolution of fragments having
large neutron excesses suggests the hot fragments produced by PHITS are not too excited for
significant neutron emission to occur in the statistical phase. Further study of this issue is
needed, and this was done as described in the following section.

45
6.4 Testing PHITS Capabilities for Beam Energies Less Than 20 MeV/u 6.4.1 Introduction The Monte Carlo-based heavy ion transport codes system PHITS [7] has been typically used to
predict radiation levels around high-energy (above 100 MeV amu-1) heavy-ion accelerator
facilities and to predict radiation doses outside of shielding. However, predictions of radiation
levels by PHITS around low-energy (around 10 MeV amu-1) heavy-ion facilities to our
knowledge have not yet been investigated. In this energy region, the fusion reaction generates
compound nuclei (Maruyama et al. 1990) from which neutrons are emitted in subsequent
evaporation and fission processes. Neutron production is calculated by PHITS using the JAERI
Quantum Molecular Dynamics model (JQMD) [12] to describe the dynamical phase of nucleus-
nucleus interactions. JQMD output is coupled to the Generalized Evaporation Model (GEM) [13]
to describe statistical phases of reactions. The separation of the JQMD and GEM calculations
within PHITS can give individual production cross sections of various residues before and after
statistical decay calculations. This possibility provides information on the relation between the
dynamical and the statistical processes as a function of projectile energy and impact parameter.
On the contrary, this hybrid approach introduces an ambiguity because the “switching time tsw”,
defined as the time when the JQMD calculation stops and the GEM calculation begins, is an
arbitrary parameter. In a study of this parameter using 1.5 GeV (p,xn) reaction neutron energy
spectra [14] a value of 150 fm c-1 was chosen (one fm c-1 is 3.3 x 10⁻²⁴ s). However, this does not
necessarily mean that 150 fm c-1 is also appropriate to predict reliable neutron energy spectra,
which are related to neutron dose equivalent rates.
This work is in part supported by the present Grant No. DE-FG02-08ER41548 and details of the
calculations are found within Reference [52]. The highlights of this effort are presented below.

46
6.4.2 Highlights of Effort towards Testing PHITS Capabilities for Beam Energies Less Than 20 MeV/u
6.4.2.1 Study of “switching time tsw” We have firstly investigated the value of the switching time that can best reproduce experimental
neutron energy spectra. The switching time, tsw, is set by the input parameter named “nqtmax”,
whose behavior was also studied in Section 6.3.
Values for tsw of 50, 100, and 150 fm c-1 were used to generate neutron energy spectra for
comparison against experimental data [53] from 6.25 MeV amu-1 and 10 MeV amu-1 12C ions
and 10 MeV amu-1 16O ions incident on a thick copper target. The way to determine the
switching time tsw from JQMD to GEM stages is to compare the shape of neutron energy spectra
with experimental data near the evaporation component. Calculated thick target neutron energy
spectra using switching times of 50, 100 and 150 fm c-1 were compared to experimental data [53]
taken at 0°, 60° 90° and 120° for 10 MeV amu-1 12C ions and 16O ions incident on a copper target
and at 0°, 60° and 120° for 6.25 MeV amu-1 12C ions on a copper target as shown in Figure 6-23,
Figure 6-24, and Figure 6-25.

47
Figure 6-23. Neutron energy spectra using switching times 50, 100 and 150 fm c-1 for 6.25 MeV amu-1 12C incident ion reactions with a thick copper target. One fm c-1 is 3.3 x 10⁻²⁴ s.
Figure 6-24. Neutron energy spectra using switching times 50, 100 and 150 fm c-1 for 10 MeV amu-1 12C incident ion reactions with a thick copper target. One fm c-1 is 3.3 x 10⁻²⁴ s.
48
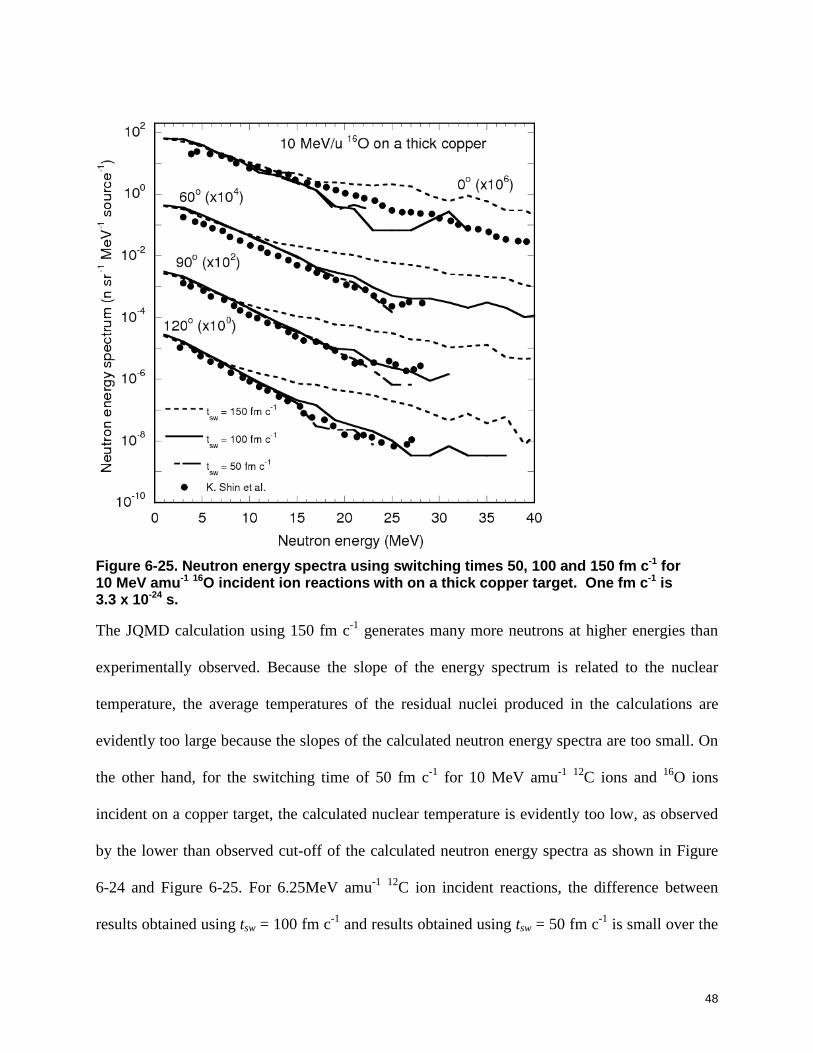
Figure 6-25. Neutron energy spectra using switching times 50, 100 and 150 fm c-1 for 10 MeV amu-1 16O incident ion reactions with on a thick copper target. One fm c-1 is 3.3 x 10⁻²⁴ s.
The JQMD calculation using 150 fm c-1 generates many more neutrons at higher energies than
experimentally observed. Because the slope of the energy spectrum is related to the nuclear
temperature, the average temperatures of the residual nuclei produced in the calculations are
evidently too large because the slopes of the calculated neutron energy spectra are too small. On
the other hand, for the switching time of 50 fm c-1 for 10 MeV amu-1 12C ions and 16O ions
incident on a copper target, the calculated nuclear temperature is evidently too low, as observed
by the lower than observed cut-off of the calculated neutron energy spectra as shown in Figure
6-24 and Figure 6-25. For 6.25MeV amu-1 12C ion incident reactions, the difference between
results obtained using tsw = 100 fm c-1 and results obtained using tsw = 50 fm c-1 is small over the

49
region where experimental data exist. Calculated neutron energy spectra with 100 fm c-1
switching time agree well with experimental data as shown in Figure 6-23, Figure 6-24, and
Figure 6-25. We conclude that the switching time value of 100 fm c-1 is the best value of the
three used to simulate neutron energy spectra at these low incident heavy ion energies. We also
find that PHITS can reliably simulate neutron energy spectra in the energy region above 1 MeV.
6.4.3 Validating Calculations of Neutron Dose Equivalents against Measurements for Heavy Ion Incident Reactions below 20 MeV/u
We then used PHITS with a switching time of 100 fm c-1 to simulate the experimental study of
Ohnesorge et al. [54] by calculating neutron dose equivalent rates for the 3-16 MeV amu-1 heavy
ion incident reactions. In that study, neutron dose rates were measured at several facilities at Oak
Ridge National Laboratory: at ORIC’s heavy ion time-of-flight target station and, for 3 MeV
amu-1 12C-induced reactions only, at the ORNL EN Tandem Van de Graaff facility.
We assumed the ORIC facility end station shielded target room geometry for all of our
calculations. We also assumed the fluence-to-dose conversion factors from the NCRP-38 [55], as
used in the neutron detector response. A comparison was also made of dose equivalent rates
obtained with the NCRP-38 conversion factors to ones obtained using more recent conversion
factors generally used in PHITS [56] for 12C + copper systems at 3, 10 and 16 MeV amu-1. In
these comparisons the dose equivalent rates agreed to within about 2 %.
Calculated neutron equivalent dose rates and comparisons to experimental data are shown in
Figure 6-26. The calculated results agree well with experimental data despite the lack of specific
information on the targets. Neutron equivalent dose rates from the nickel target are smaller than
those from iron and copper targets. This is because Q-values for neutron emission reactions
using a nickel target are negative and are smaller than for other targets. Therefore, the threshold
energies for neutron emission for reactions using a nickel target are larger than for other targets.

50
Figure 6-26. Neutron dose equivalent rates at 1 m from thick targets of iron, nickel and copper, and at 90° from the incident heavy ion beam direction. The beam current is 1 particle nanoAmpere, equal to 6.25x10⁹ particles/s. Lines are the fitting results using the equation 𝑫 = 𝜶𝑬𝜷, where D is the neutron dose equivalent rate (µSv h-1), E is the incident specific energy (MeV amu-1), and α and β are constants that depend on the target material (see Table 3 in Reference [52].
From the neutron energy spectra as shown in Figs. 1-3, there should be more high energy
neurons around 0o with respect to the beam direction than at 90o. Calculations for 0o indicated
higher dose equivalent rates than at 90o with differences increasing with the ion’s specific
energy. Our estimate is that neutron dose rate in the forward direction should be about 1.7 times
larger than at 90o for the 15.9 MeV amu-1 ions incident reactions and almost equal to the dose
rate at 90o for the 3.0 MeV amu-1 ions incidence reactions.
We conclude by this validation effort that PHITS should be a useful and reliable code for the
study of neutron fields generated from heavy-ion beam interactions with targets. And, because
PHITS can also transport the produced secondary radiation through shielding materials, it should

51
also be useful and reliable for facility design and personnel safety at accelerator facilities using
low-energy heavy-ion beams.
7 Conclusions and Recommendations We performed simulations of a series of benchmark-quality heavy ion experiments with the
computer codes FLUKA, MARS15, MCNPX, PHITS and HETC-HEDS. We first focused on the
comparisons of secondary neutron production by interactions with thick and thin targets. All of
the selected codes reproduce the shape of the double-differential neutron spectra from thin
targets reasonably well; however, further development appears to be necessary to achieve
consistency over the full range of projectile masses and energies. The over-prediction of neutrons
for light-mass beam + light-mass target systems, such as the He + Al system, by MARS15 is
significant, as is the under-prediction of neutrons for heavy-mass beam + heavy-mass target
systems such as Xe + Pb. Further validation work is recommended as the code matures. It is also
recommended that because of the interest in 3He beams for rare isotope production using isotope-
separation-on-line (ISOL) techniques, neutron production from 3He beams should be
experimentally studied. Literature searches for appropriate published data proved negative.
Simulations of the double-differential thick-target neutron yields were also in reasonable
agreement with experiments. The value of benchmark and validation studies such as performed
here was emphasized by observations of excess high-energy neutron production at forward
angles by MCNPX2.7B that were communicated to and rapidly corrected by the code
developers.
The attenuation lengths and source terms of the neutron dose rates in bulk shielding design
calculations using PHITS in proton and heavy ion stopping reactions were also obtained and
compared to experimental data. For 1 GeV proton incident reactions, calculated interaction

52
lengths for concrete and cast iron at 90° agree well with experimental data having somewhat
different density and geometry than used in the present study. Calculated interaction lengths for
concrete used as shielding against neutrons from heavy-ions incident reactions were also
compared to the mean value of interaction lengths for the various projectile-target by Agosteo et
al., and the agreement can be regarded as acceptable. The results of this study show PHITS to be
a reliable tool for shielding design of high-powered, high-energy heavy ion accelerators.
Isotopic distributions of the measured and calculated fragmentation reaction production cross
sections as a function of neutron excess for 140 MeV/u 48Ca, 64Ni reactions on Be and Ta were
compared. PHITS provides good agreement with experiment in magnitude and in isotopic
dependence on neutron excess for N-Z up to about 7 in these reactions. For larger values of
neutron excess, PHITS overpredicts the cross sections, which is apparently related to interplay
between descriptions of the dynamical and statistical processes in fragment formation. The
improvement with decreasing switching times for the dynamic evolution of fragments having
large neutron excesses suggests the hot fragments produced by PHITS are not too excited for
significant neutron emission to occur in the statistical phase. Further study of this issue is
needed, and a further comparison using other codes is encouraged.
The interplay between descriptions of the dynamical and statistical processes in terms of the
switching time were also studied via calculations using PHITS to predict neutron energy spectra
for ~ 10 MeV/u heavy ions stopped in copper. In agreement with the fragmentation cross section
studies, the value of 100 fm/c for the switching time improves agreement. Using this value in
place of the default value of 150 fm/c in PHITS, calculated neutron equivalent dose rates and
comparisons to experimental data for stopped heavy ions having specific energies below 20
MeV/u show very good agreement with experimental data. It is concluded by this validation
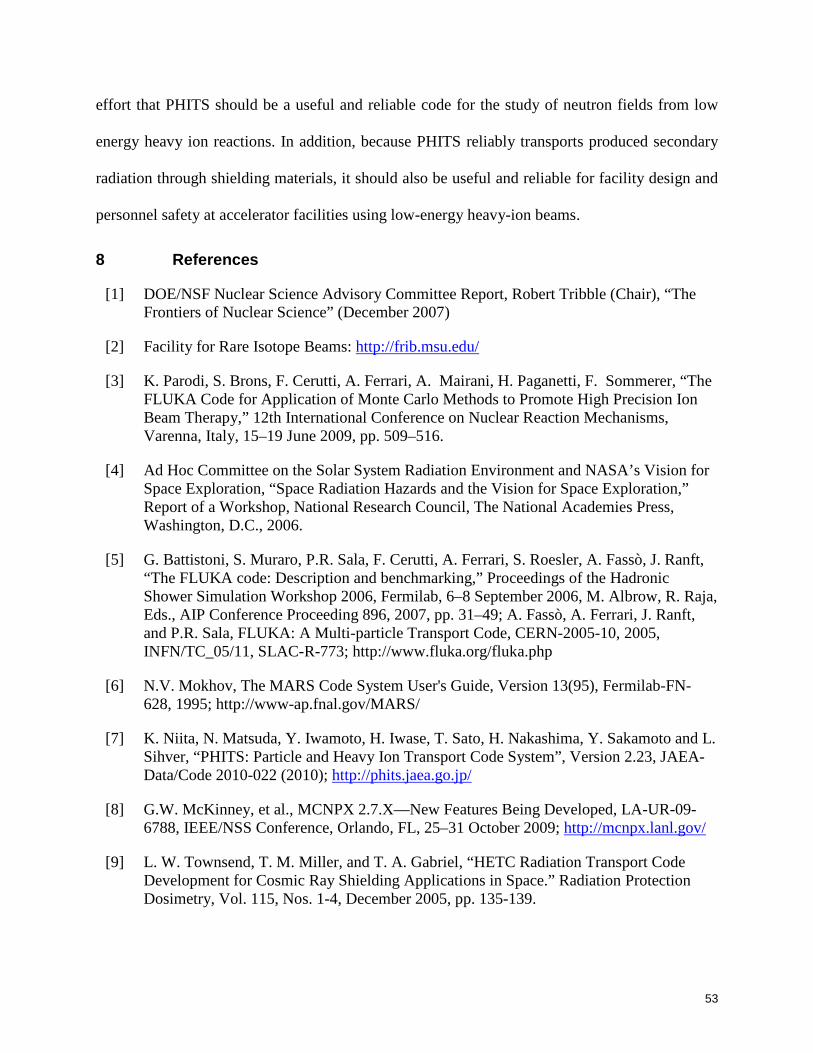
53
effort that PHITS should be a useful and reliable code for the study of neutron fields from low
energy heavy ion reactions. In addition, because PHITS reliably transports produced secondary
radiation through shielding materials, it should also be useful and reliable for facility design and
personnel safety at accelerator facilities using low-energy heavy-ion beams.
8 References
[1] DOE/NSF Nuclear Science Advisory Committee Report, Robert Tribble (Chair), “The Frontiers of Nuclear Science” (December 2007)
[2] Facility for Rare Isotope Beams: http://frib.msu.edu/
[3] K. Parodi, S. Brons, F. Cerutti, A. Ferrari, A. Mairani, H. Paganetti, F. Sommerer, “The FLUKA Code for Application of Monte Carlo Methods to Promote High Precision Ion Beam Therapy,” 12th International Conference on Nuclear Reaction Mechanisms, Varenna, Italy, 15–19 June 2009, pp. 509–516.
[4] Ad Hoc Committee on the Solar System Radiation Environment and NASA’s Vision for Space Exploration, “Space Radiation Hazards and the Vision for Space Exploration,” Report of a Workshop, National Research Council, The National Academies Press, Washington, D.C., 2006.
[5] G. Battistoni, S. Muraro, P.R. Sala, F. Cerutti, A. Ferrari, S. Roesler, A. Fassò, J. Ranft, “The FLUKA code: Description and benchmarking,” Proceedings of the Hadronic Shower Simulation Workshop 2006, Fermilab, 6–8 September 2006, M. Albrow, R. Raja, Eds., AIP Conference Proceeding 896, 2007, pp. 31–49; A. Fassò, A. Ferrari, J. Ranft, and P.R. Sala, FLUKA: A Multi-particle Transport Code, CERN-2005-10, 2005, INFN/TC_05/11, SLAC-R-773; http://www.fluka.org/fluka.php
[6] N.V. Mokhov, The MARS Code System User's Guide, Version 13(95), Fermilab-FN-628, 1995; http://www-ap.fnal.gov/MARS/
[7] K. Niita, N. Matsuda, Y. Iwamoto, H. Iwase, T. Sato, H. Nakashima, Y. Sakamoto and L. Sihver, “PHITS: Particle and Heavy Ion Transport Code System”, Version 2.23, JAEA-Data/Code 2010-022 (2010); http://phits.jaea.go.jp/
[8] G.W. McKinney, et al., MCNPX 2.7.X—New Features Being Developed, LA-UR-09-6788, IEEE/NSS Conference, Orlando, FL, 25–31 October 2009; http://mcnpx.lanl.gov/
[9] L. W. Townsend, T. M. Miller, and T. A. Gabriel, “HETC Radiation Transport Code Development for Cosmic Ray Shielding Applications in Space.” Radiation Protection Dosimetry, Vol. 115, Nos. 1-4, December 2005, pp. 135-139.

54
[10] H.W. Bertini, “Monte Carlo Calculations on Intranuclear Cascade”, ORNL-pp.3833, Oak Ridge National Laboratory (1963)
[11] Y. Nara, N. Otuka, A. Ohnishi, K. Niita, S. Chiba, “Study of relativistic nuclear collisions at AGS energies from p + Be to Au + Au with Hadronic Cascade Model”, Phys. Rev. C 61, 024901 (1999)
[12] K. Niita, H. Takada, S. Meigo, Y. Ikeda, “High-energy transport code NMTC/JAM”, Nucl. Instr. Meth. B 184, pp. 406 (2001).
[13] S. Furihata, Nucl. Instr. Meth. B171, 251 (2000).
[14] K. Niita, et al., Phy. Rev. C 52 (1995) 2620.
[15] J.F. Briesmeister, “MCNP – a General Monte Carlo N-Particle Transport Code”, Los Alamos National Laboratory, LA-12625-M (1997)
[16] V. McLane, et al., "ENDF/B-VI Summary Documentation", BNL-NCS-17541 (1996)
[17] K. Shibata et al., "Japanese Evaluated Nuclear Data Library Version 3 Revision-3: JENDLE-3.3", J. Nucl. Sci. Technol. 39, 1125 (2002)
[18] M.B. Chadwick et al., "LAI50 Documentation of Cross Sections, Heating, and Damage", Los Alamos National Laboratory, LA-UR-99-1222 (1999)
[19] R.E. Prael, H. Lichtenstein, “User guide to LCS: The LAHET Code System”, Los Alamos National Laboratory, LA-UR-89-3014, Revised (September 15, 1989)
[20] K.K. Gudima, S. G. Mashnik, and A. J. Sierk, User Manual for the Code LAQGSM, Los Alamos National Laboratory Report LA-UR-01-6804, 2001.
[21] K.C. Chandler and T.W. Armstrong. Operating instructions for the high-energy nucleon-meson transport code, HETC. ORNL-4744, Oak Ridge National Laboratory, Oak Ridge, TN (1972).
[22] R.M. Sternheimer and S.J. Lindenbaum, Phys. Rev. 123, 333(1961).
[23] M.B. Emmett. MORSE-CGA, a Monte Carlo radiation transport code with array geometry capability. ORNL-6174, Oak Ridge National Laboratory, Oak Ridge, TN (April 1985).
[24] A.F. Bielajew, H. Hirayama, W.R. Nelson, and D.W.O. Rogers. History, overview and recent improvements of EGS4. SLAC-PUB-6499 (NRC-PIRS-0436, KEK Internal 94-4) (Revised June 1, 1994).
[25] T.M. Miller and L.W. Townsend, “Comprehensive Cross Section Database Development for Generalized Three Dimensional Radiation Transport Codes.” Nuclear Science and Engineering, Vol. 149, No. 1, January 2005, pp. 65-73.

55
[26] J.W. Wilson, J. L. Shinn, L.W. Townsend, R.K. Tripathi, F.F. Badavi and S.Y. Chun. “ NUCFRG2: a semiempirical nuclear fragmentation model.” Nuclear Instruments and Methods in Physics Research, Part B, Vol. 94, Nos. 1-2, October 1994, pp. 95-102.
[27] F.A. Cucinotta, L.W. Townsend, and J.W. Wilson. Description of alpha-nucleus interaction cross sections for cosmic ray shielding studies. TP-3285, National Aeronautics and Space Administration, Washington, DC (1993).
[28] C.H. Tsao, R. Silberberg, A.F. Barghouty, and L. Shiver.” Energy degradation in cosmic-ray nuclear spallation reactions: relaxing the straight-ahead approximation.” The Astrophysical Journal, Vol. 451, September 1995, pp. 275-283.
[29] J.W. Norbury and L.W. Townsend, “Parameterizations of Inclusive Cross Sections for Pion Production in Proton-Proton Collisions. II. Comparison to New Data. “ Physical Review D, Vol. 75, 034001, February 2007.
[30] J.W. Norbury and L.W. Townsend, “Parameterized Total Cross Sections for Pion Production in Nuclear Collisions.” Nuclear Instruments and Methods in Physics Research B, Vol. 254, No. 2, January 2007, pp. 187-192.
[31] T. Nakamura and L. Heilbronn, Handbook on Secondary Particle Production and Transport by High-Energy Heavy Ions, ISBN 981-256-558-2, World Scientific, 2005.
[32] L. Heilbronn, et al., “Secondary Neutron-Production Cross Sections from Heavy-Ion Interactions Between 230 and 600 MeV/Nucleon,” Nuclear Science and Engineering, 157, 2007, p. 142.
[33] S. Agosteo, A. Fasso, A. Ferrari, P.R. Sala, M. Silari, P. Tabarelli de Fatis, Nucl. Instr. and Meth. B 114 (1996) 70.
[34] S. Agosteo, T. Nakamura, M. Silari, Z. Zajacova, Nucl. Instr. and Meth. B 217 (2004) 221.
[35] S. Agosteo, G. Fehrenbacher, M. Silari, Nucl. Instr. and Meth. B 226 (2004) 231.
[36] S. Agosteo, M. Magistris, A. Mereghetti, M. Silari, Z. Zajacova, Nucl. Instr. and Meth. B 266 (2008) 3406.
[37] S. Agosteo, Radiat. Protect. Dosim. 96 (2001) 393.
[38] Reginald M. Ronningen, Validation of Heavy Ion Capabilities in PHITS, Hadronic Shower Simulation Workshop, edited by M. Albrow and R. Raja, American Institute of Physics Conference Proceedings 896 (Melville, NY) pp.71-80 (2007).
[39] Attenuation of ambient dose equivalent from neutrons by thick concrete, cast iron and composite shields for high energy proton, 3He, 48Ca and 238U ions on Cu targets for shielding design, Yosuke Iwamoto and R.M. Ronningen, Nucl. Instrum. Methods B 269, pp.353-363 (2011). http://dx.doi.org/10.1016/j.nimb.2010.11.046

56
[40] National Nuclear Data Center, Brookhaven National Laboratory, URL http://www.nndc.bnl.gov/exfor/endf00.htm.
[41] K. Tesch, A simple estimation of the lateral shielding for proton accelerators in the energy range 50 to 1000 MeV, Radiat. Prot. Dosim. 11 (1985) 165–172.
[42] S. Ban, H. Hirayama, K. Kondo, S. Miura, K. Hozumi, M. Taino, A. Yamamoto, H. Hirabayashi, K. Katoh, Measurement of transverse attenuation lengths for paraffin, heavy concrete and iron around an external target for 12 GeV protons, Nucl. Instrum. Methods 174 (1980) 271–276.
[43] S. Ban, H. Hirayama, K. Katoh, Measurement of secondary neutron fluxes around beam stop for 500 MeV protons, Nucl. Instrum. Methods 184 (1981) 409–412.
[44] T. Nunomiya, N. Nakao, P. Wright, et al., Al., Measurements of attenuation lengths through concrete and iron for neutrons produced by 800-MeV proton on tantalum target at ISIS, Nucl. Instrum. Methods A 476 (2002) 85–89.
[45] G.R. Stevenson, K.L. Liu, R.H. Thomas, Determination of transverse shielding for proton accelerators using the Moyer model, Health Phys. 43 (1982) 13.
[46] R.G. Alsmiller Jr., R.T. Santro, J. Barish, Shielding calculations for a 200-MeV proton accelerator and comparisons with experimental data, Particle Accel. 7 (1975) 1–7.
[47] J.S. Bull, J.B. Donahue, R.L. Burman, in: Proceedings of the Fourth Workshop on Simulating Accelerator Radiation Environments, Knoxvill, Tennessee, September 1998, p. 201.
[48] J. Donald Cossairt, “Radiation Physics for Personnel and Environmental Protection”, FERMILAB REPORT TM-1834 Revision 11, November 2011
[49] M. Mocko, M. B. Tsang, L. Andronenko, M. Andronenko, F. Delaunay, M. Famiano, T. Ginter, V. Henzl, D. Henzlova, H. Hua, S. Lukyanov, W. G. Lynch, A. M. Rogers, M. Steiner, A. Stolz, O.Tarasov, M.-J. van Goethem, G. Verde, W. S. Wallace, and A. Zalessov, Projectile fragmentation of 40Ca, 48Ca, 58Ni, and 64Ni at 140 MeV/nucleon, Phys. Rev. C 74 (2006) 054612.
[50] Michal Mocko, Ph.D. thesis, Michigan State University (September 2006).
[51] M. Mocko, M. B. Tsang, Z. Y. Sun, N. Aoi, J. M. Cook, F. Delaunay, M. A. Famiano, H. Hui, N. Imai, H. Iwasaki, W. G. Lynch, T. Motobayashi, M. Niikura, T. Onishi, A. M. Rogers, H. Sakurai, A. Stolz, H. Suzuki, E. Takeshita, S. Takeuchi, and M. S. Wallace, Projectile fragmentation of 86Kr at 64 MeV/nucleon, Phys. Rev. C 76 (2007) 014609.
[52] Yosuke Iwamoto, R.M. Ronningen, and Koji Niita, Estimating Neutron Dose Equivalent Rates from Heavy-Ion Reactions around 10 MeV amu-1 using the PHITS Code, Health Physics 98, pp. 591-596 (2010).
57
[53] K. Shin, K. Miyahara, E. Tanabe, and Y. Uwamino, Thick-target neutron yield for charged particles. Nucl Sci Eng 120, pp. 40–54 (1995).
[54] W.F. Ohnesorge, H.M. Butler, C.B. Fulmer, and S.W. Mosko, Heavy ion target area fast neutron dose equivalent rates, Health Phys. 39, pp.633– 636 (1980).
[55] National Council on Radiation Protection and Measurements, Protection against neutron radiation, Bethesda, MD: NCRP; NCRP Report No. 38; 1971.
[56] Y. Sakamoto and Y. Yamaguchi, Dose conversion coefficients in the shielding design for high energy proton accelerator facilities, Japan Atomic Energy Research Institute, Tokai, Ibaraki, Japan, JAERI-Tech 2001-042; 2001.
9 Appendices 9.1 Appendix 1. Measured and calculated (PHITS) double-differential
neutron spectra from 230 MeV/u 4He + Al, 400 MeV/u N + C, 600 MeV/u Si + C, 500 MeV/u Fe + Li, and 400 MeV/u Xe + Li
Comparison of experimentally measured and calculated (PHITS) double-differential neutron spectra from 230 MeV/u 4He + Al, 400 MeV/u N + C, 600 MeV/u Si + C, 500 MeV/u Fe + Li, and 400 MeV/u Xe+ Li.
9.2 Appendix 2. Measured and calculated (MARS15) double-differential neutron spectra from 230 MeV/u 4He + Al, …….
9.3 Appendix 3. Isotope production in 140 MeV/u 48Ca Fragmentation Reactions with Be
Comparison of experimentally measured isotope production cross sections from fragmentation reactions of 140 MeV/u 48Ca with Be with calculations using the PHITS code.
9.4 Appendix 4. Isotope production in 140 MeV/u 48Ca Fragmentation Reactions with Ta
Comparison of experimentally measured isotope production cross sections from fragmentation reactions of 140 MeV/u 48Ca with Ta with calculations using the PHITS code.
9.5 Appendix 5. Isotope production in 140 MeV/u 64Ni Fragmentation Reactions with Be
Comparison of experimentally measured isotope production cross sections from fragmentation reactions of 140 MeV/u 64Ni with Be with calculations using the PHITS code.
9.6 Appendix 6. Isotope production in 140 MeV/u 64Ni Fragmentation Reactions with Ta
Comparison of experimentally measured isotope production cross sections from fragmentation reactions of 140 MeV/u 64Ni with Ta with calculations using the PHITS code.

Appendix 1
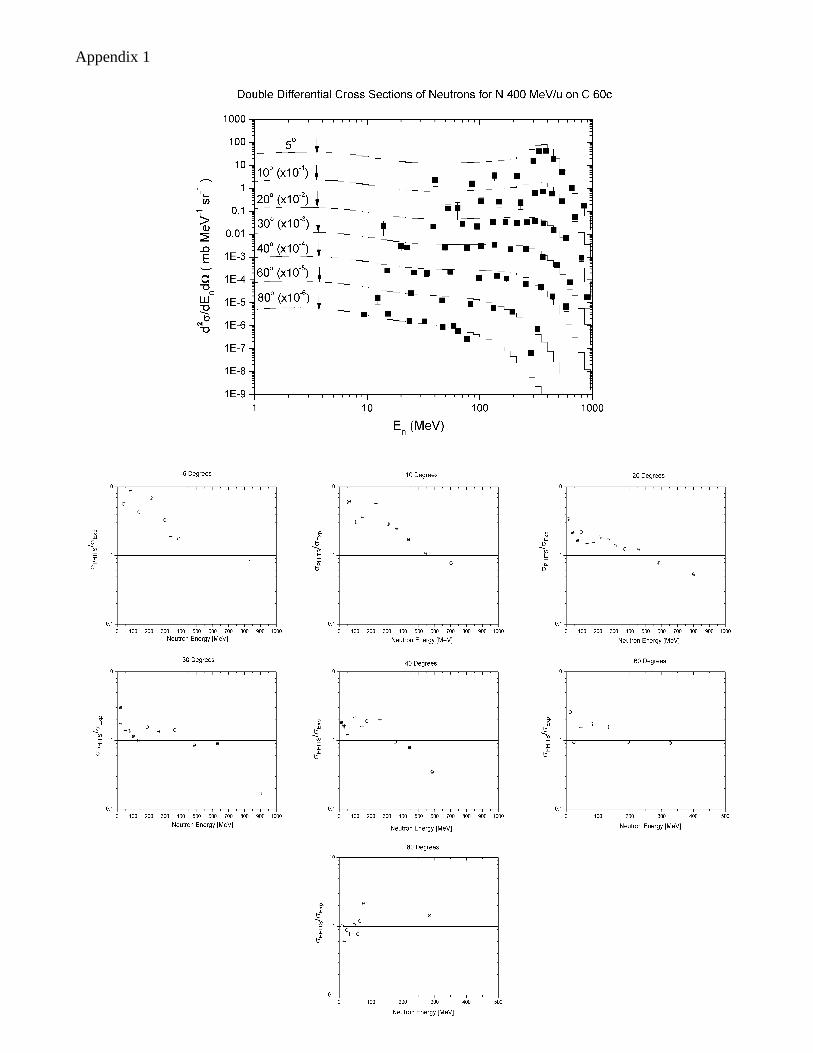
Appendix 1

Appendix 1

Appendix 1

Appendix 1


Appendix 3

Appendix 3
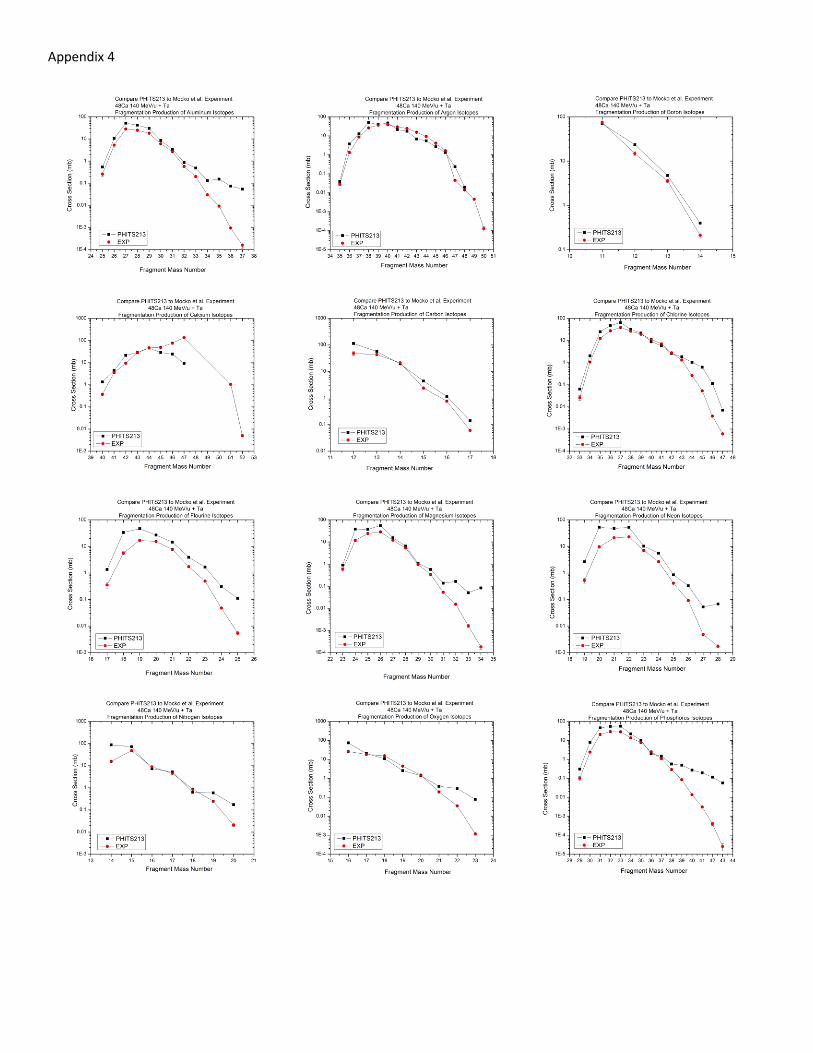
Appendix 4

Appendix 4

Appendix 5
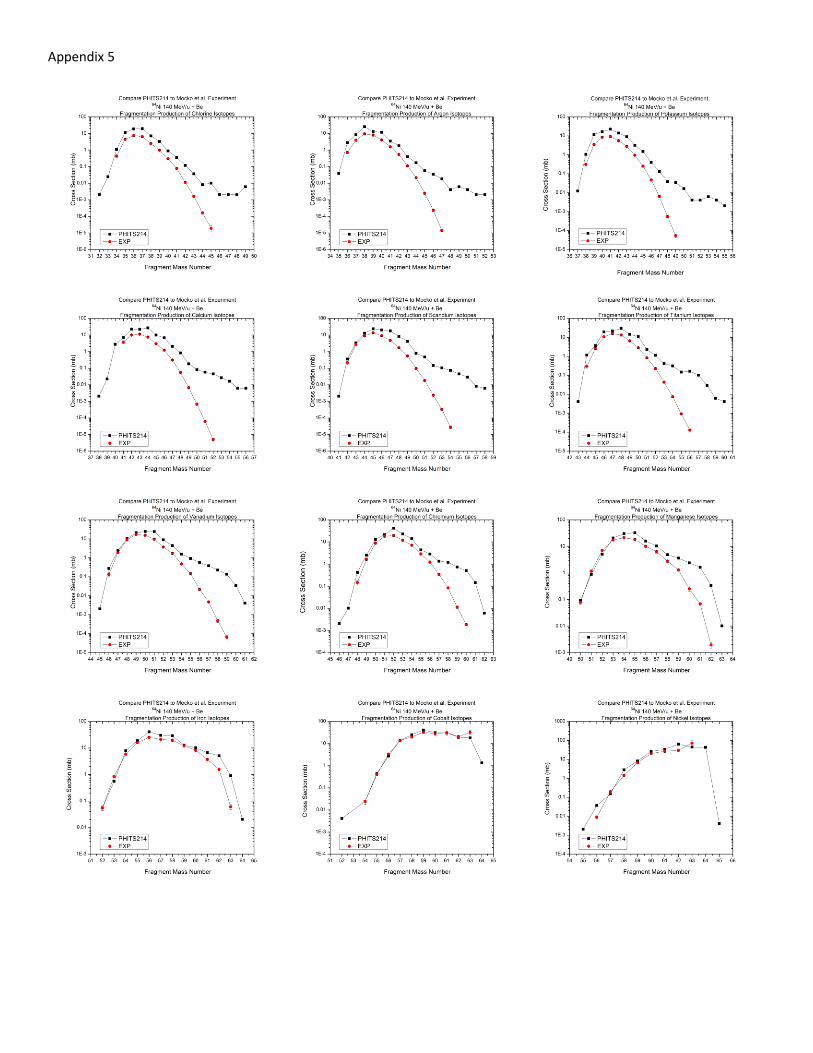
Appendix 5

Appendix 5

Appendix 6

Appendix 6

Appendix 6