final report - california department of transportation · material were the three austin sand...
TRANSCRIPT

BMP Retrofit Pilot Program
FINAL REPORT
REPORT ID CTSW - RT - 01 - 050 JANUARY 2004 California Department of Transportation CALTRANS, DIVISION of ENVIRONMENTAL ANALYSIS 1120 N Street Sacramento, CA 95814

Dedication On August 27, 2001, Mr. Peter Van Riper, who coordinated the efforts of Caltrans District 7, passed away. Mr. Van Riper played an integral role in the completion of the BMP Retrofit Pilot program and made a significant contribution to the project. His dedication to the pursuit of an objective and practical study, and his relaxed and positive style was appreciated by all who worked with him. He will be sorely missed. This report is dedicated to his memory.

BMP Retrofit Pilot Program Final Report
January 2004
i
EXECUTIVE SUMMARY
Introduction
Litigation between the California Department of Transportation (Caltrans) and the Natural Resources Defense Council (NRDC), Santa Monica BayKeeper, the San Diego BayKeeper, and the United States Environmental Protection Agency (USEPA) resulted in a requirement that Caltrans develop a Best Management Practice (BMP) Retrofit Pilot Program in Caltrans Districts 7 (Los Angeles) and 11 (San Diego). The objective of this program was to acquire experience in the installation and operation of a wide range of structural BMPs for treating stormwater runoff from existing Caltrans facilities and to evaluate the performance and costs of these devices. A study team made up of representatives from the parties to the lawsuit, their attorneys, local vector control agencies, and outside technical experts provided oversight of the retrofit pilot program.
Technical feasibility and costs were assessed through detailed records kept on the process of designing, building, operating and maintaining each retrofit device. Technical feasibility considered siting, design, construction, operation, maintenance, safety, performance and public health issues. These elements are elaborated on in Section 1.10. In addition, by establishing the life-cycle costs and performance for each of the technologies, a basis for selecting one technology over another was developed. The benefit assessment used in this project was based primarily on the pollutant removal of each of the tested techno logies.
Each BMP was designed, constructed, and maintained at what was “state-of-the-art” at the time the project began. The types of BMP pilot projects included in the study are shown in Table 1.
Table 1 BMP Types included in the Retrofit Study
Media Filters Biofiltration Austin sand filter (5) Swale (6) Delaware sand filter (1) Strip (3) Multi-Chambered Treatment Train (2) Infiltration Devices Storm-Filter™ (1) Basin (2)
Extended Detention Basins (5) Trench (2) Drain Inlet Inserts Wet Basin (1)
FossilFilter™ (3) Oil-water Separator (1) StreamGuard™ (3) Continuous Deflective Separation (1)
Sites selected for retrofit with the piloted technologies were considered to be the most appropriate and feasible in terms of siting criteria established for each BMP. The

BMP Retrofit Pilot Program Final Report
January 2004
ii
potential sites for each type of technology were ranked using a weighted decision matrix; BMPs with the most restrictive siting criteria (such as infiltration) were sited prior to BMPs with less restrictive criteria. No right-of-way was purchased for the project; instead, all BMPs were retrofitted within existing State-owned areas. Retrofit Pilot Program Accomplishments The retrofit pilot program is thought to be the most comprehensive test of common stormwater management BMPs ever conducted, and the first significant evaluation in a climate of southern California's type. The program succeeded in demonstrating the effectiveness of several BMP types in reducing pollutant concentrations and mass loadings. The results generally are consistent with the performance of these devices measured in previous studies. The program further yielded substantial information on the technical feasibility of the BMPs as retrofits in highway and support facility settings. The determination of the technical feasibility at any particular location requires site specific evaluation. The team conducting the program surmounted a number of challenges to constructability and operation.
The project also accounted for the costs of construction and operations and maintenance under pilot program circumstances. Potential cost reduction strategies were identified and are detailed in Chapter 14.
Technical Feasibility and Benefits This study was designed to allow the parties to gain experience with the actual design, installation, operation, and maintenance of structural BMPs in the setting of the freeway system in southern California. Many BMPs have been used in other parts of the country, but cost, performance, and operation data were not generally available for retrofit implementation, especially in a semi-arid highway environment. In addition, the study included a number of proprietary BMPs. Many of these BMPs are relatively specialized for specific constituents, flow or physical conditions, limiting their applicability. Accordingly, the study was designed to confirm or determine the technical feasibility for potential retrofit of the selected BMPs into the Caltrans highway environment. In several instances, siting of the BMPs presented technical challenges, among them the restrictive siting requirements related to the need for specific soil and subsurface conditions (infiltration devices), available space, or perennial baseflow (wet basin). At many of the sites a significant portion of the cost was associated with changes to the original storm drain system to direct more runoff to the test sites. These difficulties point out the need to include planning for BMP retrofit in the early stages of reconstruction projects to take advantage of possible drainage system reconstruction.

BMP Retrofit Pilot Program Final Report
January 2004
iii
An unexpected element encountered at the beginning of the study was the importance of avoiding standing water in the BMPs. Standing water presents opportunities for vectors to establish themselves, and mosquito breeding was observed at all of the sites where standing water persisted for at least 72 hours. In addition to the technologies that incorporate a permanent pool (i.e., wet basin, MCTT, Storm-Filter™, Continuous Deflective Separation (CDS®) and Delaware sandfilter), standing water also occurred in stilling basins, around riprap used for energy dissipation, in flow spreaders, and in some outlet structures. Consequently, many of the BMPs were modified during the course of the study to eliminate standing water. To minimize vector concerns in future installations, the potential for standing water should be avoided during design.
A significant component of the overall reduction in constituent load of several of the BMPs was infiltration of runoff into the soil. This includes not only infiltration basins and trenches, where infiltration is the primary mechanism for mitigation of stormwater impacts, but also in unlined extended detention basins and biofiltration swales and strips. Although infiltration of runoff clearly reduces the potential impacts on surface water quality of highway runoff, there remains the possibility for groundwater contamination. The portion of the study concerned with identifying the impacts of infiltration devices on groundwater quality was not successful. Consequently, additional investigation of the potential for groundwater contamination from infiltrated runoff is warranted.
In general, the pollutant removal effectiveness of the tested BMPs was consistent with previously reported values. Analysis of the water quality data collected during the study indicated that in many cases the traditional method of reporting performance as a percent reduction in the influent concentration did not correctly convey the relative performance of the BMPs. The problem was primarily the result of differences in influent runoff quality among the various sites and was especially noticeable for the MCTTs. These devices were installed at park-and-rides, where the untreated runoff had relatively low constituent concentrations. These low influent concentrations resulted in a low calculated removal efficiency even though the quality of the effluent was equal to that achieved in the best of the other BMPs. Consequently, a methodology was developed using linear regression to predict the expected effluent quality for each of the BMPs as if they were subject to identical influent quality. The study found that a comparison on this basis resulted in a more valid assessment of the relative performance of the technologies. Table 2 presents the expected effluent quality for total suspended solids (TSS), total phosphorus, and total zinc that would be achieved if each of the BMPs were subject to runoff with influent concentrations equal to that observed on average for highway and maintenance stations during the study. Effective effluent concentrations of 0 are shown for the infiltration devices, since there is no discharge to surface waters. As experience with BMP selection, design and operational performance increases, it is expected that benefits measured in terms of pollutant removal and receiving water quality improvement will also increase.

BMP Retrofit Pilot Program Final Report
January 2004
iv
Table 2 Effluent Expected Concentrations for BMP types
Device TSS
(Influent 114 mg/L) Total Phosphorus
(Influent 0.38 mg/L) Total Zn
(Influent 355 ug/L)
Austin Sand Filter 7.8 0.16 50
Delaware Sand Filter 16.2 0.34 24
EDB unlined 36.1 0.24 139
EDB lined 57.1 0.31 132
Wet Basin 11.8 0.54 37
Infiltration Basin 0 0 0
Infiltration Trench 0 0 0
Biofiltration Swale 58.9 0.62 96
Biofiltration Strip 27.6 0.86 79
Storm-Filter™ 78.4 0.30 333
MCTT 9.8 0.24 33
CDS® 68.6 0.28 197
The retrofit pilot program findings provide a basis to develop a procedure for selecting the technically feasible BMP expected to provide the greatest and most consistent reduction of pollutants of interest in highway runoff. The procedure guides judgment of technical feasibility and utilizes graphs and equations developed from the program’s database to estimate effectiveness in reducing pollutant mass loadings and when regulatory effluent limits exist.
All sediment and collected material that accumulated in the BMPs was tested for hazardous materials prior to disposal. The BMPs that required disposal of accumulated material were the three Austin sand filters in District 7, the one Delaware sand filter in District 11, the Storm-Filter™ and the material in the spreader ditch of one of the biofiltration strips in District 7. Title 22 testing was done and all locations were found to have non-hazardous material and therefore all material was disposed of at the landfill.
Media Filters
The Austin and Delaware sand filters and the MCTT provided substantial water quality improvement and produced a very consistent, relatively high quality effluent. Although the greatest concentration reduction occurred for constituents associated with particles, substantial reduction in dissolved metals concentrations was also observed when the influent concentrations were sufficiently high, contradicting expectations that little

BMP Retrofit Pilot Program Final Report
January 2004
v
removal of the dissolved phase would occur in this type of device. Maintenance of the sand filter beds to alleviate clogging was not excessive at the test sites, and the siting requirements are compatible with the small, highly impervious watersheds characteristic of Caltrans facilities. Consequently, the piloted Austin and Delaware sand filters, and the MCTT sand filters are considered technically feasible.
The Delaware and MCTT designs both incorporate permanent pools in the sedimentation chamber, which can increase vector concerns and maintenance requirements. The Delaware filter could be applicable at certain sites where an underground vault system is desired or where a perimeter location is preferred, assuming the vector issues associated with the permanent pool are addressed. The MCTT was found to have a similar footprint and provide a water quality benefit comparable to the Austin sand filter; however, higher life-cycle cost, and the permanent pool and associated vector issues of the MCTT suggest that in general the Austin filter would be preferred.
The Storm-Filter™ did not perform on par with other media filters tested, showing little attenuation of the peak runoff rate and producing a reduction in most constituent concentrations that was not statistically significant. In addition, the standing water in the Storm-Filter™ has the potential to breed mosquitoes. Although technically feasible at the piloted location, the Storm-Filter™ pollutant removal was less and its life-cycle cost was more than the Austin filter. Therefore, the Storm-Filter™ will not be considered to be preferable for use at Caltrans facilities based on the media evaluated in this study, even if the vector problems were avoided.
Maintenance and operation of pumps at several sites was a recurring problem. Consequently, other technologies should be considered at sites with insufficient hydraulic head for operation of media filters by gravity flow.
Future research on construction methods and materials for sand filters is needed to improve the cost/benefit ratio for these devices. In addition, evaluation of alternative media may also allow the targeting of specific constituents or improvement in the performance for soluble constituents, such as nitrate, which are not effectively removed by a sand medium.
Extended Detention Basins
Extended detention basins have an especially extensive history of implementation in many areas and are recognized as one of the most flexible structural controls. The pollutant removal observed in the extended detention basins was similar to that reported in previous studies (Young, 1996) and appeared to be independent of length/width ratio, which is a commonly used design parameter. Resuspension of previously accumulated material was more of an issue in the concrete- lined basin, which exhibited less constituent concentration reduction than in-situ, earthen designs. Based on these findings, unlined extended basins are preferred except where potential groundwater contamination is an over-riding concern.

BMP Retrofit Pilot Program Final Report
January 2004
vi
There are few constraints for siting extended detention basins, although larger tributary areas can reduce the unit cost and increase the size of the outlet orifices, making clogging less likely. The relatively small head requirement (as compared to Austin sand filters) associated with this technology is particularly useful in retrofit situations where the elevation of existing stormwater infrastructure is a design constraint. The unlined installations in southern California did not experience any problems associated with establishment of wetland vegetation, erosion or excessive maintenance (as compared to the lined basin). Except where groundwater quality may be impacted, unlined basins are preferred on a water quality basis because of the substantial infiltration and associated pollutant load reductions that were observed at these sites.
This study reaffirms the flexibility and performance of this conventional technology and confirms their technical feasibility, depending on site specific conditions. The effectiveness, small head requirement and few siting constraints suggest that these devices are one of the most applicable technologies for stormwater treatment at Caltrans facilities.
Wet Basin
One wet basin was successfully sited and operated for this study, and observed pollutant removal was substantial. An important finding of this study is that the discharge quality from a wet basin with a large permanent pool volume is largely a function of the quality of the baseflow used to maintain that pool and of the transformation of the quality of that flow during its residence time in the basin. It should be noted that for this specific pilot installation and receiving water (impaired by nutrients), an ancillary benefit was the treatment provided in the wet basin for the ‘offsite’ base flow and the substantial nutrient reduction observed during dry weather periods.
Depending on site specific information, wet basins are considered technically feasible for highway stormwater treatment; however, there are a number of concerns regarding the applicability of wet basins for retrofit of Caltrans facilities. The long-term maintenance requirements and costs of wet basins may not have been accurately estimated because some major maintenance activities did not occur during the study period. The potential for the basin to become a habitat for endangered species may result in required consultation with the USFWS and subsequent mitigation, should habitat ‘take’ occur during routine maintenance activities. The cost of these potential mitigation activities also is unknown. Consequently, wet basins warrant further study to understand the risk and cost of habitat mitigation and other potential impacts of endangered or threaten species issues.
Vector (mosquito) control required additional vegetation management that resulted in observed maintenance that was much higher than for other devices. Vector cont rol experts were only marginally satisfied with the level of vector prevention provided by mosquito fish, although they were generally effective in reducing mosquitoes.

BMP Retrofit Pilot Program Final Report
January 2004
vii
A primary siting constraint of this technology is the need for a perennial flow to sustain the permanent pool. The siting process showed that the vast majority of the pilot BMP locations constructed were in small, highly impervious watersheds with no dry weather flow.
Basin size also limited siting opportunities. With a permanent pool volume three times the water quality volume, the wet basin had as much as four times the volume of other technologies, such as detention basins. The larger size results in higher cost and land requirements higher than those of alternative technologies. Many other criteria for sizing the permanent pool have been recommended, which may reduce the facility size while providing only slightly less pollutant removal. (See Composite Siting Study, District 11, Appendix A)
A number of questions are left unanswered by this study and warrant further investigation. Additional work could help define the relationship between permanent pool volume, construction cost, and water quality benefit. An assessment of the feasibility of a seasonal wet basin, where the pool was allowed to go dry during the summer, would increase siting opportunities by potentially allowing siting of these devices where perennial flow is not present. Finally, additional work is needed to evaluate the impact of endangered and threatened species that would be attracted to the basin and affect the maintenance schedule or requirements.
Biofiltration
Biofiltration BMPs, including bioswales and biofiltration strips are considered technically feasible depending on site-specific considerations. Overall, the reduction of concentration and load of the constituents monitored was comparable to the results reported in other studies, except for nutrients. Nutrient removal was compromised by the natural leaching of phosphorus from the salt grass vegetation used in the pilot study. This condition was not known at the start of the project but was discovered later in the program (see Chapter 8 for details). While space limitations in highly urban areas may make siting these BMPs difficult, they are suitable for fitting into available space such as medians and shoulder areas. Their use should be considered where existing space and hydraulic conditions permit.
Although irrigation was used to establish vegetation for the pilot biofiltration swales and strips, natural moisture from rainfall was sufficient to maintain them once they were established. Complete vegetation coverage, especially on the sideslopes of swales, was difficult to maintain, even with repeated hydroseeding of these areas. Lower vegetation density and occasional bare spots are to be expected in an arid climate, but do not appear to seriously compromise pollutant removal. An important lesson of this study is that a mixture of drought-tolerant native grasses is preferred to the salt grass monoculture used at the pilot sites. In southern California, it is preferable to specify species that grow best during the winter and spring (the wet season) and to schedule vegetation establishment accordingly. Few erosion problems were noted in the operation of the sites; however, damage by burrowing gophers was a problem at several sites.

BMP Retrofit Pilot Program Final Report
January 2004
viii
Biofiltration swales and strips were among the least expensive devices evaluated in this study and were among the best performers in reducing sediment and heavy metals in runoff. Removal of phosphorus was less than that reported by Young et al. (1996) but may be related to leaching of nutrients from the saltgrass during its dormant season. The swales are easily sited along highways and within portions of maintenance stations, and do not require specialized maintenance. In addition, the test sites were similar in many ways to the vegetated shoulders and conveyance channels common along highways in many areas of the state. Consequently, these areas, which were not designed as treatment devices, could be expected to offer water quality benefit comparable to these engineered sites. More research is needed to investigate this possibility.
The research needs involving biofiltration devices center on refinement of the design criteria and evaluation of the performance with vegetation other than salt grass. The current design criteria for strips are especially poor with little guidance on the relative size of the tributary area to the buffer strip, and almost no data on the effect of slope and length on removal efficiency. In southern California and other relatively dry climates, it is also important to establish the minimum vegetation coverage needed to provide effective pollutant removal.
Infiltration
Infiltration basins and trenches are considered be technically feasible depending on site specific conditions. However, there are three main constraints to widespread implementation of infiltration devices: locating sites with appropriate soils, the potential threat to groundwater quality, and the risk of site failure due to clogging. Further investigation of these constraints is recommended.
Infiltration basins and trenches can be an especially attractive option for BMP implementation, since they provide the highest level of surface water quality protection. In addition, they reduce the total amount of runoff, restoring some of the original hydrologic conditions of an undeveloped watershed. Although trenches and basins are similar in terms of their water quality benefits, the siting and maintenance requirements of the two devices are distinctly different. Infiltration basins generally treat runoff from relatively larger tributary areas and require more routine maintenance such as vegetation management, but they are easier to rehabilitate when clogged. Conversely, infiltration trenches generally treat runoff from smaller areas, and their smaller footprint allows them to be sited in more space-constrained areas. Observed routine maintenance was less; however, once clogged, partial or complete reconstruction may be required, resulting in uncertain long-term cost.
The original siting study did not identify sufficient suitable locations for the number of infiltration installations specified in the District 7 Stipulation within the time frame provided in the agreement. This study is being followed by assessments in both Districts to gauge the potential extent of infiltration opportunities. In Los Angeles, the assessment is being accomplished with field investigations in selected highway corridors and in San Diego by existing data, but more broadly based through the District. In addition, there is

BMP Retrofit Pilot Program Final Report
January 2004
ix
concern at the state and regional levels about the impact on groundwater quality from infiltrated runoff. The portion of this study that was implemented to assess the potential impact to groundwater quality from infiltrated stormwater runoff was largely unsuccessful and longer term, more comprehensive studies than were possible under this pilot program are warranted. Despite these uncertainties, the parties in this study worked cooperatively to develop interim guidelines for siting infiltration devices in response to requests by the State and Regional Water Quality Control Boards.
In summary, infiltration can be a more challenging technology in that site assessment, groundwater concerns, and long-term maintenance issues are important elements that are subject to some uncertainty. The experience in this study is that siting these devices under marginal soil and subsurface conditions entails a substantial risk of early failure. Analysis of this experience resulted in development of a detailed set of site assessment guidelines for locating infiltration devices in the future to ensure that soil and subsurface conditions are appropriate for their implementation. It is important that these guidelines be implemented to insure that infiltration is used with adequate separation from groundwater and in soils with a favorable infiltration rate. In addition, loss of soil structure, clogging, and other changes that may occur during the life of the facility may be difficult to ameliorate. Nevertheless, infiltration devices are considered technically feasible at suitable sites and they were among the most cost-effective BMPs tested in this study.
Continuous Deflective Separators
Two CDS® units were successfully sited, constructed and monitored during the study. The devices were developed in Australia with the primary objective of gross pollutant (trash and litter) removal from stormwater runoff. The devices are considered technically feasible depending on site specific conditions. They were highly successful at removing gross pollutants, capturing an average of 88 percent, with bypass of this material occurring mainly when the flow capacity of the units was exceeded. Even though these two units were sited on elevated sections of freeways, 94 percent of the captured material by weight was vegetation. Consequently, the maintenance requirements may be excessive if these units are located in an area with a significant number of trees or other sources of vegetative material.
A secondary objective of the CDS® units is the capture of sediment and associated pollutants, particularly the larger size fractions. The average sediment concentration in the influent to the two systems was relatively low and no significant reduction was observed. Reductions in the concentrations of other constituents were also not significant. It should be noted that the specific fiberglass CDS units tested in this study are no longer offered by the manufacturer. CDS does manufacture similar concrete units that were not evaluated as a part of this study.
These devices maintain a permanent pool in their sumps and mosquito breeding was observed repeatedly at the two sites. The frequency of breeding was reduced by sealing the lids of the units and installing mosquito netting over the outlet. Other non-proprietary

BMP Retrofit Pilot Program Final Report
January 2004
x
devices developed by Caltrans for litter control, which do not maintain a permanent pool, may be preferred to this techno logy to minimize vector concerns.
Drain Inlet Inserts
Two models of proprietary drain inlet inserts were evaluated. The data collected during this study indicate that they cannot be operated unattended because of hydraulic limitations that resulted in flooding on a number of occasions and clogging that caused bypass of untreated runoff. Their pollutant removal was also minimal. The absolute number of maintenance hours was not large; however, the timing of maintenance was critical, right before and during storm events. Because of their frequent maintenance requirements and safety considerations (access along active freeways and highways), implementation on roadsides would not be appropriate. Installation at maintenance stations might be considered safer; however, timely maintenance is often infeasible due to other maintenance activities required during storm events. In addition, they were only marginally effective, with constituent removal generally less than 10 percent. Consequently, these particular models were judged to be not technically feasible at the piloted locations.
The two types of inserts monitored in this study were carefully selected from the many types that were available at the start of the study based on an evaluation of their water quality improvement potential. There are many other types of proprietary drain inlet inserts on the market that were not evaluated and may perform better than the two evaluated here; however, until there is better independent documentation of their pollutant removal effectiveness as well as operation and maintenance requirements, this technology should not be routinely considered for implementation. The variety of drain inlet inserts on the market has increased since the beginning of the pilot program, and one of the inserts evaluated during this study is no longer being manufactured. Some newer insert types are now available but the results of this study should not be used to assess the expected feasibility and/or performance of these recently available technologies. It should be noted trash removal was not monitored as part of this study and certain types of drain inlet inserts may be effective for this purpose.
Oil-Water Separator
Although an oil-water separator (OWS) was successfully sited, constructed and monitored, the results indicate that this is not an applicable technology for the piloted location. Twenty-two maintenance stations were originally considered for implementation of this technology and the ten with the potential for higher concentrations of petroleum hydrocarbons in runoff were subject to further evaluation. Four of these were subsequently selected for monitoring and of these, only one site appeared to have concentrations that were sufficiently high to warrant installation of an oil-water separator. However, concentrations of free oil in stormwater runoff observed during the course of the study from this site were too low for effective operation of this technology. Runoff quality from three other maintenance stations was monitored during the study and concentrations of petroleum hydrocarbons at these sites were also below the threshold

BMP Retrofit Pilot Program Final Report
January 2004
xi
required for effective operation of the oil-water separator. Improved source-control measures at Caltrans maintenance stations have generally been effective in reducing hydrocarbon pollutant levels below that which OWS are effective in removing. In conclusion, none of the 25 maintenance stations in Districts 7 and 11 that were evaluated had sufficiently high concentrations of free oil for successful implementation of this technology. At these low levels, other conventional stormwater controls can provide better treatment of hydrocarbons, as well as other pollutants of concern in runoff; however, they may be appropriate in certain non-stormwater situations (e.g., where source controls cannot ensure low oil and grease concentrations).
Cost
The incurred costs of constructing and operating the BMPs in this pilot study were documented in detail. These costs reflect the requirements of stormwater retrofit in the highway environment in the urban areas of southern California and may not be representative of those that might be incurred in other settings. There has been extensive discussion among the parties involved in this study regarding whether these numbers accurately represent the costs that would be incurred in a more extensive (widespread) retrofit program. Many reasons have been suggested for possible differences including, among others: costs specific to pilot projects, the bidding climate at the time the contracts were advertised, the lack of standard competitive bidding, and the dispersed nature of the construction activities. While the parties disagree to some extent about the degree of departure from a normal scenario, both parties agree that there were pilot-specific costs incurred in this project that would not be replicated in a larger scale retrofit implementation program. A separate study commissioned by the retrofit parties suggested ways to reduce costs. Additional cost information from elsewhere in the nation is provided in Appendix C.
The actual construction costs were reviewed on a site-by-site basis by a technical workgroup that included water quality specialists, construction managers and design engineers. The goal of the workgroup was to develop ‘generic’ retrofit costs that could reasonably be applied to other Caltrans BMP retrofit projects. The costs were developed by (1) reviewing the specific construction items for each site; (2) eliminating those that were atypical; and (3) adjusting the costs that were considered to be outside of what would ‘routinely’ be encountered in a retrofit situation. Specific construction items that were reduced or eliminated from the realized costs are discussed in the individual device chapters. The average adjusted construction costs for each of the technologies are presented in Table 3.
The construction costs for each of the BMPs have been normalized by the water quality volume rather than by tributary area to account for the significant differences in design storm depth used for sizing the controls in different parts of the study area and for the differences in the runoff coefficient at each site. For the flow-through devices, such as swales, the cost per unit volume calculations used the water quality volume for the tributary area that would be used for BMP sizing if a capture-and-treat type device, such

BMP Retrofit Pilot Program Final Report
January 2004
xii
as a detention basin, were implemented at the site. Where more than one facility of the same type was constructed, the mean cost per water quality volume is reported.
Life-cycle costs were developed by adding the present value of normalized expected operation and maintenance cost to the normalized adjusted construction cost. The expected maintenance requirements were developed based on the recommended Operation and Maintenance Plan (Appendix D) and are also presented in Table 3. The present value calculation used a 20 year life-cycle and a 4 percent discount rate. There was a substantial range of values for the life-cycle cost of biofiltration strip s and drain inlet inserts among the individual sites because the size of the devices was fixed, while the tributary areas varied greatly. Nevertheless, the average value observed in the study was used for computations in this table as it was for other devices.
The pilot program construction cost figures represented throughout this report are directly applicable only to Caltrans and its operations. The unique environment and constraints associated with retrofitting BMPs into the California Highway system makes comparison to other possible applications of the same BMPs difficult. Furthermore, even within the Caltrans system, information on construction costs will undoubtedly increase greatly as BMPs continue to be developed and implemented, such that the construction cost information in this report will be of limited value over time. It should be recognized that the Operation and Maintenance cost information was based partly upon estimates and projections of future needs.
The parties engaged the assistance of outside experts to review the costs experienced in the retrofit pilot program and to make suggestions for cost reductions and improvements in efficiency. Eventually these consultants prepared a report, which is appended to this report in Appendix C.
Table 3 Cost of BMP Technologies (1999 dollars)
BMP Type (No. of installations)
Avg. Adjusted
Construction Cost
Adjusted Construction Cost/m3 of the Design Storm
Annual Adjusted
O&M Cost
Present Value O&M
Cost/m3 Life-Cycle a
Cost/m3
Wet Basin (1) $ 448,412 $ 1,731 $ 16,980 $ 452 $ 2,183
Multi-chambered Treatment Train (2) $ 275,616 $ 1,875 $ 6,410 $ 171 $ 2,046
Oil-Water Separator (1) $ 128,305 $ 1,970 $ 790 $ 21 $ 1,991
Delaware Sand Filter (1) $ 230,145 $ 1,912 $ 2,910 $ 78 $ 1,990
Storm-Filter™ (1) $ 305,355 $ 1,572 $ 7,620 $ 204 $ 1,776
Austin Sand Filter (5) $ 242,799 $ 1,447 $ 2,910 $ 78 $ 1,525
Biofiltration Swale (6) $ 57,818 $ 752 $2,750 $ 74 $ 826
Biofiltration Strip (3) $ 63,037 $ 748 $2,750 $ 74 $ 822

BMP Retrofit Pilot Program Final Report
January 2004
xiii
BMP Type (No. of installations)
Avg. Adjusted
Construction Cost
Adjusted Construction Cost/m3 of the Design Storm
Annual Adjusted
O&M Cost
Present Value O&M
Cost/m3 Life-Cycle a
Cost/m3
Infiltration Trench (2) $ 146,154 $ 733 $ 2,660 $ 71 $ 804
Extended Detention Basin (5) $172,737 $590 $ 3,120 $ 83 $ 673
Infiltration Basin (2) $ 155,110 $ 369 $ 3,120 $ 81 $ 450
Drain Inlet Insert (6) $ 370 $ 10 $1,100 $ 29 $ 39 a Present value of operation and maintenance unit cost (20 yr @ 4%) plus construction unit cost.
Despite the uncertainty in the projected costs of a wholesale BMP retrofit program, the cost data can be used to rank BMPs by life-cycle costs, which can serve as the first step in selecting the most cost-effective technology for a given site.
Recurring issues that strongly affected the capital cost of the devices were the discovery of unsuitable material in the subsurface and buried utilities at the sites selected for implementation of the devices. Unsuitable material included both natural and manmade objects that increased the cost of excavation. At several sites, large boulders had to be removed and the site over-excavated and backfilled. Other sites had been used as disposal areas, the extent of which was not realized until after construction began. Rarely did the as-built plans correctly identify the location of utilities, requiring their relocation or the repositioning of the BMP during construction. These types of conditions may be encountered fairly frequently in retrofit construction. Consequently, average published costs may be appropriate for planning purposes, but should not generally be used to estimate the cost for a particular site, unless supplemented with a detailed site assessment.
In addition to construction costs, it is also important to consider the operation and maintenance costs for each technology. An important element in selecting the most appropriate BMP for a site is an understanding of the amount and type of operation and maintenance required. BMPs that require less maintenance are preferred, other factors being equal.

BMP Retrofit Pilot Program Final Report
January 2004
xiv
TABLE OF CONTENTS
1 INTRODUCTION ..................................................................................................1-1
1.1 The Program’s Purpose and Goal ....................................................................1-1 1.2 Study Background ............................................................................................1-1 1.3 Research Objectives .........................................................................................1-9 1.4 BMP Siting.......................................................................................................1-9 1.5 BMP Sizing and Design.................................................................................1-10 1.6 Operation and Maintenance ...........................................................................1-12 1.7 Monitoring Overview.....................................................................................1-13
1.7.1 Chemical Monitoring ................................................................................1-13 1.7.2 Empirical Observations.............................................................................1-18
1.8 Vector Issues..................................................................................................1-19 1.9 Biological Issues ............................................................................................1-21 1.10 Maintenance Effort and Construction Cost....................................................1-22 1.11 Technical Feasibility......................................................................................1-23 1.12 Retrofit Pilot Program Accomplishments ......................................................1-24
2 SAND FILTERS .....................................................................................................2-1
2.1 Siting ................................................................................................................2-1 2.2 Design ..............................................................................................................2-2 2.3 Construction.....................................................................................................2-2
2.3.1 Material Availability...................................................................................2-5 2.3.2 Excavation and Unknown Field Conditions ...............................................2-5 2.3.3 Interface with Existing Activities ...............................................................2-6
2.4 Maintenance .....................................................................................................2-6 2.5 Performance .....................................................................................................2-8
2.5.1 Chemical Monitoring ..................................................................................2-8 2.5.2 Empirical Observations.............................................................................2-13
2.6 Cost ................................................................................................................2-17 2.6.1 Construction..............................................................................................2-17 2.6.2 Operation and Maintenance ......................................................................2-20
2.7 Criteria, Specifications and Guidelines..........................................................2-22 2.7.1 Siting .........................................................................................................2-22 2.7.2 Design .......................................................................................................2-23 2.7.3 Construction..............................................................................................2-24 2.7.4 Operation and Maintenance ......................................................................2-24
3 EXTENDED DETENTION BASINS ....................................................................3-1
3.1 Siting ................................................................................................................3-1 3.2 Design ..............................................................................................................3-2 3.3 Construction.....................................................................................................3-4
3.3.1 Constructability...........................................................................................3-4 3.3.2 Unknown Field Conditions .........................................................................3-7 3.3.3 Coordination................................................................................................3-7

BMP Retrofit Pilot Program Final Report
January 2004
xv
TABLE OF CONTENTS (cont'd)
3.4 Maintenance .....................................................................................................3-7 3.5 Performance ...................................................................................................3-10
3.5.1 Chemical Monitoring ................................................................................3-10 3.5.2 Empirical Observations.............................................................................3-15
3.6 Cost ................................................................................................................3-18 3.6.1 Construction..............................................................................................3-18 3.6.2 Operation and Maintenance ......................................................................3-19
3.7 Criteria, Specifications and Guidelines..........................................................3-21 3.7.1 Siting .........................................................................................................3-22 3.7.2 Design .......................................................................................................3-22 3.7.3 Construction..............................................................................................3-23 3.7.4 Operation and Maintenance ......................................................................3-24
4 WET BASIN ...........................................................................................................4-1
4.1 Siting ................................................................................................................4-1 4.2 Design ..............................................................................................................4-2 4.3 Construction.....................................................................................................4-7
4.3.1 Constructability...........................................................................................4-7 4.3.2 Unknown Field Conditions .........................................................................4-7
4.4 Maintenance .....................................................................................................4-7 4.5 Performance .....................................................................................................4-9
4.5.1 Chemical Monitoring ..................................................................................4-9 4.5.2 Empirical Observations.............................................................................4-14
4.6 Cost ................................................................................................................4-14 4.6.1 Construction..............................................................................................4-14 4.6.2 Operation and Maintenance ......................................................................4-16
4.7 Criteria, Specifications and Guidelines..........................................................4-18 4.7.1 Siting .........................................................................................................4-18 4.7.2 Design .......................................................................................................4-19 4.7.3 Construction..............................................................................................4-19 4.7.4 Operation and Maintenance ......................................................................4-20
5 INFILTRATION BASINS......................................................................................5-1
5.1 Siting ................................................................................................................5-1 5.2 Design ..............................................................................................................5-2 5.3 Construction.....................................................................................................5-4
5.3.1 Unknown Field Conditions .........................................................................5-5 5.3.2 Impacts to Freeways ....................................................................................5-5
5.4 Maintenance .....................................................................................................5-5 5.5 Performance .....................................................................................................5-7
5.5.1 Chemical Monitoring ..................................................................................5-7 5.5.2 Empirical Observations...............................................................................5-8
5.6 Cost ..................................................................................................................5-9

BMP Retrofit Pilot Program Final Report
January 2004
xvi
TABLE OF CONTENTS (cont'd)
5.6.1 Construction................................................................................................5-9 5.6.2 Operation and Maintenance ......................................................................5-10
5.7 Criteria, Specifications and Guidelines..........................................................5-12 5.7.1 Siting .........................................................................................................5-12 5.7.2 Design .......................................................................................................5-14 5.7.3 Construction..............................................................................................5-15 5.7.4 Operation and Maintenance ......................................................................5-15
6 INFILTRATION TRENCHES ...............................................................................6-1
6.1 Siting ................................................................................................................6-1 6.2 Design ..............................................................................................................6-2 6.3 Construction.....................................................................................................6-6
6.3.1 Constructability Issues ................................................................................6-6 6.3.2 Unknown Field Conditions .........................................................................6-6 6.3.3 Impacts to Maintenance Stations ................................................................6-7
6.4 Maintenance .....................................................................................................6-8 6.5 Performance .....................................................................................................6-9
6.5.1 Chemical Monitoring ..................................................................................6-9 6.5.2 Empirical Observations.............................................................................6-10
6.6 Cost ................................................................................................................6-10 6.6.1 Construction..............................................................................................6-10 6.6.2 Operation and Maintenance ......................................................................6-11
6.7 Criteria, Specifications and Guidelines..........................................................6-13 6.7.1 Siting .........................................................................................................6-14 6.7.2 Design .......................................................................................................6-14 6.7.3 Construction..............................................................................................6-15 6.7.4 Operation and Maintenance ......................................................................6-15
7 BIOFILTRATION SWALES .................................................................................7-1
7.1 Siting ................................................................................................................7-1 7.2 Design ..............................................................................................................7-3 7.3 Construction.....................................................................................................7-5 7.4 Maintenance .....................................................................................................7-6 7.5 Performance .....................................................................................................7-7
7.5.1 Chemical Monitoring ..................................................................................7-7 7.5.2 Empirical Observations.............................................................................7-12
7.6 Cost ................................................................................................................7-13 7.6.1 Construction..............................................................................................7-13 7.6.2 Operation and Maintenance ......................................................................7-14
7.7 Criteria, Specifications and Guidelines..........................................................7-16 7.7.1 Siting .........................................................................................................7-16 7.7.2 Design .......................................................................................................7-17 7.7.3 Construction..............................................................................................7-18

BMP Retrofit Pilot Program Final Report
January 2004
xvii
TABLE OF CONTENTS (cont'd)
7.7.4 Operation and Maintenance ......................................................................7-19
8 BIOFILTRATION STRIPS ....................................................................................8-1
8.1 Siting ................................................................................................................8-1 8.2 Design ..............................................................................................................8-3 8.3 Construction.....................................................................................................8-5 8.4 Maintenance .....................................................................................................8-6 8.5 Performance .....................................................................................................8-7
8.5.1 Chemical Monitoring ..................................................................................8-7 8.5.2 Empirical Observations.............................................................................8-11
8.6 Cost ................................................................................................................8-13 8.6.1 Construction..............................................................................................8-13 8.6.2 Operation and Maintenance ......................................................................8-14
8.7 Criteria, Specifications and Guidelines..........................................................8-16 8.7.1 Siting .........................................................................................................8-16 8.7.2 Design .......................................................................................................8-17 8.7.3 Construction..............................................................................................8-17 8.7.4 Operation and Maintenance ......................................................................8-18
9 STORM-FILTER™ ................................................................................................9-1
9.1 Siting ................................................................................................................9-1 9.2 Design ..............................................................................................................9-1 9.3 Construction.....................................................................................................9-4
9.3.1 Constructability...........................................................................................9-4 9.3.2 Unknown Field Conditions .........................................................................9-4
9.4 Maintenance .....................................................................................................9-5 9.5 Performance .....................................................................................................9-6
9.5.1 Chemical Monitoring ..................................................................................9-6 9.5.2 Empirical Observations...............................................................................9-8
9.6 Cost ................................................................................................................9-10 9.6.1 Construction..............................................................................................9-10 9.6.2 Operation and Maintenance ......................................................................9-11
9.7 Criteria, Specifications and Guidelines..........................................................9-13 9.7.1 Siting .........................................................................................................9-13 9.7.2 Design .......................................................................................................9-14 9.7.3 Construction..............................................................................................9-14 9.7.4 Operation and Maintenance ......................................................................9-14
10 MULTI-CHAMBERED TREATMENT TRAIN .................................................10-1
10.1 Siting ..............................................................................................................10-1 10.2 Design ............................................................................................................10-1 10.3 Construction...................................................................................................10-4 10.4 Maintenance ...................................................................................................10-5 10.5 Performance ...................................................................................................10-7

BMP Retrofit Pilot Program Final Report
January 2004
xviii
TABLE OF CONTENTS (cont'd)
10.5.1 Chemical Monitoring ................................................................................10-7 10.5.2 Empirical Observations.............................................................................10-9
10.6 Cost ..............................................................................................................10-10 10.6.1 Construction............................................................................................10-10 10.6.2 Operation and Maintenance ....................................................................10-11
10.7 Criteria, Specifications and Guidelines........................................................10-13 10.7.1 Siting .......................................................................................................10-13 10.7.2 Design .....................................................................................................10-14 10.7.3 Construction............................................................................................10-14 10.7.4 Operation and Maintenance ....................................................................10-14
11 DRAIN INLET INSERTS ....................................................................................11-1
11.1 Siting ..............................................................................................................11-1 11.2 Design ............................................................................................................11-2 11.3 Construction...................................................................................................11-4 11.4 Maintenance ...................................................................................................11-4 11.5 Performance ...................................................................................................11-5
11.5.1 Chemical Monitoring ................................................................................11-5 11.5.2 Empirical Observations.............................................................................11-7
11.6 Cost ................................................................................................................11-8 11.6.1 Construction..............................................................................................11-8 11.6.2 Operation and Maintenance ......................................................................11-9
11.7 Criteria, Specifications and Guidelines........................................................11-12 11.7.1 Siting .......................................................................................................11-12 11.7.2 Design .....................................................................................................11-13 11.7.3 Construction............................................................................................11-13 11.7.4 Operation and Maintenance ....................................................................11-13
12 OIL-WATER SEPARATOR................................................................................12-1
12.1 Siting ..............................................................................................................12-1 12.2 Design ............................................................................................................12-2 12.3 Construction...................................................................................................12-2
12.3.1 Unknown Field Conditions .......................................................................12-4 12.3.2 Interface with Existing Activities .............................................................12-4
12.4 Maintenance ...................................................................................................12-4 12.5 Performance ...................................................................................................12-4
12.5.1 Chemical Monitoring ................................................................................12-4 12.5.2 Empirical Observations.............................................................................12-6
12.6 Cost ................................................................................................................12-6 12.6.1 Construction..............................................................................................12-6 12.6.2 Operation and Maintenance ......................................................................12-7
12.7 Criteria, Specifications and Guidelines..........................................................12-9
13 CONTINUOUS DEFLECTIVE SEPARATORS (CDS®) ..................................13-1

BMP Retrofit Pilot Program Final Report
January 2004
xix
TABLE OF CONTENTS (cont'd)
13.1 Siting ..............................................................................................................13-1 13.2 Design ............................................................................................................13-1 13.3 Construction...................................................................................................13-4 13.4 Maintenance ...................................................................................................13-4 13.5 Performance ...................................................................................................13-5
13.5.1 Chemical Monitoring ................................................................................13-5 13.5.2 Gross Pollutant Monitoring.....................................................................13-10 13.5.3 Empirical Observations...........................................................................13-13
13.6 Cost ..............................................................................................................13-15 13.6.1 Construction............................................................................................13-15 13.6.2 Operation and Maintenance ....................................................................13-16
13.7 Criteria, Specifications and Guidelines........................................................13-18 13.7.1 Application..............................................................................................13-18 13.7.2 Siting .......................................................................................................13-18 13.7.3 Design .....................................................................................................13-19 13.7.4 Construction............................................................................................13-19 13.7.5 Operation and Maintenance ....................................................................13-19
14 CAPITAL, OPERATION, AND MAINTENANCE COSTS...............................14-1
14.1 Introduction....................................................................................................14-1 14.2 Pilot Program Construction Cost ...................................................................14-1
14.2.1 Actual Construction Cost..........................................................................14-2 14.2.2 General Cost Guidance – BMP Retrofit Construction Cost .....................14-2 14.2.3 Considerations for Future Projects............................................................14-3 14.2.4 Cost Reduction Strategies .........................................................................14-5 14.2.5 BMP Construction Costs from Other Projects ........................................14-10
14.3 Pilot Program Operation Cost......................................................................14-11
15 PERFORMANCE SUMMARY ...........................................................................15-1
15.1 Methodology and Results ..............................................................................15-1 15.2 Implications of the Methodology.................................................................15-19
16 CONCLUSIONS AND RECOMMENDATIONS ...............................................16-1
16.1 Media Filters ..................................................................................................16-1 16.2 Extended Detention Basins ............................................................................16-3 16.3 Wet Basins .....................................................................................................16-4 16.4 Infiltration Basins and Trenches ....................................................................16-5 16.5 Biofiltration Swales and Strips ......................................................................16-7 16.6 Continuous Deflective Separators..................................................................16-9 16.7 Drain Inlet Inserts...........................................................................................16-9 16.8 Oil-Water Separator .....................................................................................16-10

BMP Retrofit Pilot Program Final Report
January 2004
xx
LIST OF APPENDICES
Note: The appendices to this final report are contained on two CD-ROMs attached to the inside back cover of this document. The CD-ROMs contain the following appendices:
CD-ROM No. 1 : APPENDIX A: APPENDIX B: APPENDIX C: APPENDIX D: APPENDIX E: APPENDIX F: CD-ROM No. 2: APPENDIX G: APPENDIX H:
SITING AND SCOPING SUMMARY: SITING AND SCOPING REPORTS DESIGN SUMMARY: BASIS OF DESIGN REPORTS CONSTRUCTION COST SUMMARY OPERATION AND MAINTENANCE SUMMARY VECTOR MONITORING AND ABATEMENT WATER QUALITY MONITORING SUMMARY AS-BUILT PLANS FOR BMP PILOT SITES QUARTERLY AND BIWEEKLY REPORTS

BMP Retrofit Pilot Program Final Report
January 2004
xxi
LIST OF TABLES
Table Page
Table 1 BMP Types included in the Retrofit Study..............................................................i
Table 2 Effluent Expected Concentrations for BMP types................................................iv
Table 3 Cost of BMP Technologies (1999 dollars) ......................................................... xii
Table 1-1 BMP Types and Project Locations ..................................................................1-2
Table 1-2 Key Team Members ........................................................................................1-6
Table 1-3 Consultant Responsibility by BMP Pilot Site .................................................1-8
Table 1-4 Rainfall Design Characteristics for BMP Sites .............................................1-12
Table 1-5 Selected Constituents and Analytical Methods .............................................1-15
Table 2-1 Summary of Contributing Watershed Characteristics for Sand Filters ...........2-1
Table 2-2 Design Characteristics of the Sand Filters.......................................................2-5
Table 2-3 Concentration Reduction of Austin Sand Filters ..........................................2-10
Table 2-4 Concentration Reduction of the Delaware Sand Filter .................................2-11
Table 2-5 Predicted Effluent Concentrations - Austin Filter ........................................2-14
Table 2-6 Predicted Effluent Concentrations - Delaware Filter ...................................2-15
Table 2-7 Incidences of Mosquito Breeding – Sand Filters .........................................2-17
Table 2-8 Actual Construction Costs for Sand Filters (1999 dollars) ..........................2-18
Table 2-9 Adjusted Construction Costs for Sand Filters (1999 dollars)........................2-19
Table 2-10 Actual Operation and Maintenance Hours for Sand Filters ........................2-20
Table 2-11 Actual Average Annual Maintenance Effort – Sand Filters........................2-21
Table 2-12 Expected Annual Maintenance Costs for Final Version of MID – Sand Filter......................................................................................................................2-22
Table 3-1 Summary of Contributing Watershed Characteristics for EDB ......................3-2
Table 3-2 Design Characteristics of the EDBs ................................................................3-2

BMP Retrofit Pilot Program Final Report
January 2004
xxii
LIST OF TABLES (cont'd)
Table Page
Table 3-3 Incidences of Mosquito Breeding - EDB ........................................................3-9
Table 3-4 Concentration Reduction of Unlined EDBs .................................................3-11
Table 3-5 Load Reduction of Unlined EDB ..................................................................3-12
Table 3-6 Concentration Reduction of Concrete - Lined EDB......................................3-13
Table 3-7 Removal Efficiency of TSS and Total Cu for each EDB.............................3-14
Table 3-8 Predicted Effluent Concentrations – EDBs ..................................................3-16
Table 3-9 Actual Construction Costs for EDBs (1999 dollars) ....................................3-18
Table 3-10 Adjusted Construction Costs for EDBs (1999 dollars) ...............................3-19
Table 3-11 Actual Operation and Maintenance Hours for EDBs ..................................3-20
Table 3-12 Actual Average Annual Maintenance Effort - EDB....................................3-20
Table 3-13 Expected Annual Maintenance Costs for Final Version of MID – EDB ....3-21
Table 4-1 Summary of Contributing Watershed Characteristics – Wet Basin ................4-1
Table 4-2 Design Characteristics of the La Costa Wet Basin.........................................4-4
Table 4-3 Comparison of Recommended Permanent Pool Volumes – Wet Basin..........4-5
Table 4-4 Incidences of Mosquito Breeding – Wet Basin ...............................................4-9
Table 4-5 Concentration Reduction of the Wet Basin for Storm Runoff ......................4-11
Table 4-6 Concentration Reduction observed in Wet Season Baseflow .......................4-12
Table 4-7 Predicted Effluent Concentrations – Wet Basin ...........................................4-13
Table 4-8 Actual Construction Costs for Wet Basin (1999 dollars).............................4-14
Table 4-9 Adjusted Construction Costs for Wet Basin (1999 dollars) ..........................4-15
Table 4-10 Actual Average Annual Maintenance Effort – Wet Basin ..........................4-17
Table 4-11 Expected Annual Maintenance Costs for Final Version of MID – Wet Basin......................................................................................................................4-18

BMP Retrofit Pilot Program Final Report
January 2004
xxiii
LIST OF TABLES (cont'd)
Table Page
Table 5-1 Infiltration Basin Permeability Rates ..............................................................5-1
Table 5-2 Summary of Contributing Watershed Characteristics for Infiltration Basins .5-2
Table 5-3 Design Characteristics of the Infiltration Basins .............................................5-2
Table 5-4 Incidences of Mosquito Breeding – Infiltration Basins...................................5-7
Table 5-5 I-605 / SR-91 Infiltration Basin Soil Samples................................................5-8
Table 5-6 Actual Construction Costs for Infiltration Basins (1999 dollars)....................5-9
Table 5-7 Adjusted Construction Costs for Infiltration Basins (1999 dollars) ..............5-10
Table 5-8 Actual Operation and Maintenance Hours for Infiltration Basins.................5-10
Table 5-9 Actual Average Annual Maintenance Effort – Infiltration Basin .................5-11
Table 5-10 Expected Annual Maintenance Costs for Final Version of MID – Infiltration Basin.............................................................................................................5-12
Table 6-1 - Infiltration Trench Permeability Rates ..........................................................6-1
Table 6-2 Summary of Contributing Watershed Characteristics for Infiltration Trench.6-2
Table 6-3 Design Characteristics of the Infiltration Trenches .........................................6-2
Table 6-4 Infiltration Trench Rock Specifications ..........................................................6-4
Table 6-5 Actual Construction Costs for Infiltration Trenches and Pretreatment Biofiltration Strip (1999 dollars) .................................................................6-10
Table 6-6 Adjusted Construction Costs for Infiltration Trenches with Pretreatment Biofiltration Strip (1999 dollars) .................................................................6-11
Table 6-7 Actual Operation and Maintenance Hours for Infiltration Trenches.............6-12
Table 6-8 Actual Average Annual Maintenance Effort – Infiltration Trench ...............6-12
Table 6-9 Expected Annual Maintenance Costs for Final Version of MID – Infiltration Trench ..........................................................................................................6-13
Table 7-1 Summary of Contributing Watershed Characteristics for Biofiltration Swales ...........................................................................................................................7-1

BMP Retrofit Pilot Program Final Report
January 2004
xxiv
LIST OF TABLES (cont'd)
Table Page
Table 7-2 Design Characteristics of the Biofiltration Swales..........................................7-4
Table 7-3 Concentration Reduction of Biofiltration Swales............................................7-8
Table 7-4 Load Reduction of Biofiltration Swales ..........................................................7-8
Table 7-5 Predicted Effluent Concentrations -Biofiltration Swales ..............................7-11
Table 7-6 Actual Construction Costs for Biofiltration Swales (1999 dollars)...............7-13
Table 7-7 Adjusted Construction Costs for Biofiltration Swales (1999 dollars) ..........7-14
Table 7-8 Actual Operation and Maintenance Hours for Biofiltration Swales .............7-15
Table 7-9 Actual Average Annual Maintenance Effort – Biofiltration Swales .............7-15
Table 7-10 Expected Annual Maintenance Costs for Final Version of MID – Biofiltration Swales ..........................................................................................................7-16
Table 8-1 Summary of Contributing Watershed Characteristics for Biofiltration Strips 8-1
Table 8-2 Design Characteristics of the Biofiltration Strips............................................8-4
Table 8-3 Treatment Ratios for Biofiltration Strip Sites .................................................8-5
Table 8-4 Concentration Reduc tion of Biofiltration Strips..............................................8-9
Table 8-5 Load Reduction of Biofiltration Strips ..........................................................8-10
Table 8-6 Comparison of Individual Sites for Representative Constituents – Biofiltration Strips ............................................................................................................8-10
Table 8-7 Predicted Effluent Concentrations – Biofiltration Strips...............................8-12
Table 8-8 Actual Construction Costs for Biofiltration Strips (1999 dollars).................8-13
Table 8-9 Adjusted Construction Costs for Biofiltration Strips (1999 dollars) .............8-14
Table 8-10 Actual Operation and Maintenance Hours for Biofiltration Strips .............8-14
Table 8-11 Actual Average Annual Maintenance Effort – Biofiltration Strips .............8-15
Table 8-12 Expected Annual Maintenance Costs for Final Version of MID – Biofiltration Strips ............................................................................................................8-16

BMP Retrofit Pilot Program Final Report
January 2004
xxv
LIST OF TABLES (cont'd)
Table Page
Table 9-1 Summary of Contributing Watershed Characteristics for Storm-Filter™.......9-1
Table 9-2 Design Criteria of the Storm-Filter™..............................................................9-1
Table 9-3 Design Characteristics of the Storm-Filter™ ..................................................9-2
Table 9-4 Incidences of Mosquito Breeding – Storm-Filter™ ........................................9-6
Table 9-5 Concentration Reduction of the Storm-Filter™ ..............................................9-8
Table 9-6 Predicted Effluent Concentrations – Storm-Filter™ .......................................9-9
Table 9-7 Actual Construction Costs for Storm-Filter™ (1999 dollars).......................9-11
Table 9-8 Adjusted Construction Costs for Storm-Filter™ (1999 dollars) ...................9-11
Table 9-9 Actual Average Annual Maintenance Effort – Storm-Filter™ .....................9-12
Table 9-10 Expected Annual Maintenance Costs for Final Version of MID- Storm-Filter™ .........................................................................................................9-13
Table 10-1 Summary of Contributing Watershed Characteristics for MCTTs ..............10-1
Table 10-3 Incidences of Mosquito Breeding - MCTTs................................................10-7
Table 10-4 Concentration Reduction of MCTTs ...........................................................10-8
Table 10-5 Predicted Effluent Concentrations - MCTT ................................................10-9
Table 10-6 Actual Construction Costs for MCTTs (1999 dollars) ..............................10-10
Table 10-7 Adjusted Construction Costs for MCTTs (1999 dollars) ..........................10-10
Table 10-8 Actual Operation and Maintenance Hours for MCTTs .............................10-11
Table 10-9 Actual Average Annual Maintenance Effort – MCTT..............................10-12
Table 10-10 Expected Annual Maintenance Costs for Final Version of MID – MCTT ..........................................................................................................................10-12
Table 11-1 Summary of Contributing Watershed Characteristics for DIIs ...................11-2
Table 11-2 Design Characteristics of the DIIs...............................................................11-4

BMP Retrofit Pilot Program Final Report
January 2004
xxvi
LIST OF TABLES (cont'd)
Table Page
Table 11-3 Mass Reduction Efficiencies for StreamGuard™ (excluding litter and debris)...........................................................................................................11-7
Table 11-4 Mass Reduction Efficiencies for FossilFilter™ (excluding litter and debris)......................................................................................................................11-7
Table 11-5 Incidences of Mosquito Breeding – DIIs.....................................................11-8
Table 11-6 Actual Construction Costs for DIIs (1999 dollars)......................................11-9
Table 11-7 Adjusted Construction Costs for DIIs (1999 dollars) ................................11-10
Table 11-8 Actual Operation and Maintenance Hours for DIIs...................................11-10
Table 11-9 Actual Average Annual Maintenance Effort - DII ....................................11-11
Table 11-10 Expected Annual Maintenance Costs for Final Version of MID – DII...11-12
Table 12-1 Oil/Grease Sampling Results.......................................................................12-1
Table 12-2 Summary of Contributing Watershed Characteristics for Oil-Water Separator......................................................................................................................12-2
Table 12-3 Design Characteristics of the OWS .............................................................12-2
Table 12-4 Concentration Reduction for the OWS........................................................12-5
Table 12-5 Incidences of Mosquito Breeding – OWS...................................................12-6
Table 12-6 Actual Construction Costs for OWS (1999 dollars) ....................................12-6
Table 12-7 Adjusted Construction Costs for OWS (1999 dollars) ................................12-7
Table 12-8 Actual Average Annual Maintenance Effort – OWS ..................................12-8
Table 12-9 Expected Annual Maintenance Costs for Final Version of MID – OWS ...12-8
Table 13-1 Summary of Contributing Watershed Characteristics for CDS® ...............13-1
Table 13-2 Design Characteristics of the CDS® ...........................................................13-3
Table 13-3 Constituent Removal Performance of CDS® (Scoping Study Method) .....13-8
Table 13-4 Predicted Effluent Concentrations –CDS®.................................................13-9

BMP Retrofit Pilot Program Final Report
January 2004
xxvii
LIST OF TABLES (cont'd)
Table Page
Table 13-5 Performances of CDS® (Gross Pollutant Removal 2000-2002)...............13-10
Table 13-6 Characteristics of Gross Pollutants Captured by the CDS® units (2000-2002)................................................................................................13-11
Table 13-7 Summary on Non-Volatile Inorganic Solids Captured .............................13-12
Table 13-8 Summary of Incineration Based Calculation of Removal Efficiency (2001-2002)................................................................................................13-13
Table 13-9 Incidences of Mosquito Breeding – CDS® (2000-01) ..............................13-14
Table 13-10 Actual Construction Costs for CDS® (2000 dollars) ..............................13-15
Table 13-11 Adjusted Construction Costs for CDS® (2000 dollars) ..........................13-16
Table 13-12 Actual Operation and Maintenance Hours for CDS®.............................13-16
Table 13-13 Actual Average Annual Maintenance Effort – CDS® ............................13-17
Table 13-14 Expected Annual Maintenance Costs for Final Version of MID – CDS® ..........................................................................................................................13-18
Table 14-1 Actual Construction Cost of BMP Technologies (1999 dollars).................14-2
Table 14-2 Adjusted Construction Costs by BMP Type (1999 dollars) ........................14-4
Table 14-3 Comparison of Mean Unit Costs and Water Quality Volumes from Nationwide Survey to Adjusted Mean Unit Costs and Water Quality Volumes in Caltrans Retrofit Pilot Program (1999 dollars) ......................................14-11
Table 14-4 BMP Actual Annual Maintenance Effort for Caltrans BMP Retrofit Pilot Program......................................................................................................14-12
Table 14-5 Projected Future Annual Maintenance Requirements for Caltrans BMP Retrofit Pilot Program................................................................................14-13
Table 14-6 Projected Present Worth of BMP Capital, Maintenance and Total Cost Requirements for Caltrans BMP Retrofit Pilot Program...........................14-14
Table 15-1 Water Quality Design Storm Concentrations (Mean EMC for Pilot Study) ............................................................................................................................15-1
Table 15-2 Effluent Expected Concentrations for BMP types ......................................15-3

BMP Retrofit Pilot Program Final Report
January 2004
xxviii
Table 15-3 Representative Pollutant Removal Efficiencies (Percent) for Pilot Study BMPs............................................................................................................15-4
LIST OF FIGURES
Figure Page
Figure 2-1 Schematic of an Austin Sand Filter................................................................2-3
Figure 2-2 I-5/SR-78 Austin Sand Filter ........................................................................2-3
Figure 2-3 Schematic of a Delaware Sand Filter (Young et al., 1996)............................2-4
Figure 2-4 Escondido MS Delaware Sand Filter .............................................................2-4
Figure 2-5 Field Maintenance Activities at Sand Filter Sites (1999-2001) .....................2-8
Figure 2-6 Influent and Effluent Concentration Relationship of TSS for all Austin Sand Filters ...........................................................................................................2-12
Figure 2-7 Influent and Effluent Concentration Relationship of Dissolved Copper for all Austin Sand Filters.......................................................................................2-12
Figure 2-8 Comparison of Influent and Effluent Flow Rates at the La Costa Sand Filter .........................................................................................................................2-16
Figure 3-1 District 11 Outlet Riser ..................................................................................3-4
Figure 3-2 District 7 Outlet Riser ....................................................................................3-4
Figure 3-3 I-5/SR-56 Unlined Basin..............................................................................3-5
Figure 3-4 I-5/I-605 Concrete Lined Basin ...................................................................3-5
Figure 3-5 Schematic of Extended Detention Basin........................................................3-6
Figure 3-6 Field Maintenance Activities at EDBs (1999-2001) ......................................3-8
Figure 3-7 TSS Concentration Reduction as a Function of Length-to-Width Ratio in EDBs ............................................................................................................3-15
Figure 3-8 Theoretical vs. Measured Residence Time at Manchester EDB..................3-17
Figure 4-1 La Costa Wet Basin........................................................................................4-2
Figure 4-2 Cross-Section of La Costa Wet Basin ............................................................4-6

BMP Retrofit Pilot Program Final Report
January 2004
xxix
LIST OF FIGURES (cont'd)
Figure Page
Figure 4-3 Field Maintenance Activities at Wet Basin (1999-2001)...............................4-9
Figure 5-1 I-5/La Costa Infiltration Basin ......................................................................5-3
Figure 5-2 I-605/SR-91 Infiltration Basin .......................................................................5-3
Figure 5-3 Schematic of Infiltration Basin ......................................................................5-4
Figure 5-4 Field Maintenance Activities at Infiltration Basins (1999-2001) .................5-7
Figure 6-1 Carlsbad Maintenance Station........................................................................6-5
Figure 6-2 Altadena Maintenance Station .......................................................................6-5
Figure 6-3 – Schematic of Infiltration Trench.................................................................6-6
Figure 6-4 Field Maintenance Activities at Infiltration Trenches (1999-2001) .............6-9
Figure 7-1 Typical Swale (SR-78/Melrose Drive)...........................................................7-2
Figure 7-2 Schematic of Biofiltration Swale and Strip....................................................7-2
Figure 7-3 Field Maintenance Activities at Swale Sites (1999-2001) .............................7-7
Figure 7-4 Salt Crystals on the Leaves of Salt Grass.....................................................7-10
Figure 8-1 Biofiltration Strip (District 7, I-605/SR-91)...................................................8-2
Figure 8-2 Schematic of Biofiltration Strip and Swale....................................................8-2
Figure 8-3 Field Maintenance Activities at Strip Sites (1999-2001) ...............................8-7
Figure 9-1 Schematic of a Storm-Filter™ .......................................................................9-2
Figure 9-2 Surface View at Kearny Mesa........................................................................9-3
Figure 9-3 Internal View at Kearny Mesa .......................................................................9-3
Figure 9-4 Field Maintenance Activities for the Storm-Filter™ (1999-2001) ................9-6
Figure 9-5 Comparison of Storm-Filter™ Influent and Effluent Flow Rates................9-10
Figure 10-1 Schematic of an MCTT (Source: Pitt, et al., 1999)...................................10-2
Figure 10-2 Surface View of an MCTT (Via Verde P&R) ...........................................10-3

BMP Retrofit Pilot Program Final Report
January 2004
xxx
LIST OF FIGURES (cont'd)
Figure Page
Figure 10-3 Internal View of an MCTT (Lakewood P&R)...........................................10-3
Figure 10-4 Field Maintenance Activities at MCTT Sites (1999-2001)........................10-6
Figure 11-1 Schematic of FossilFilter™ SOURCE: KriStar.............................................11-3
Figure 11-2 Schematic of StreamGuard™ SOURCE: Foss Environmental .........................11-3
Figure 11-3 FossilFilter™..............................................................................................11-3
Figure 11-4 StreamGuard™...........................................................................................11-3
Figure 11-5 Field Maintenance Activities at DII Sites (1999-2001) .............................11-6
Figure 12-1 Schematic of an OWS (Source: Highland Tank and Manufacturing Company).....................................................................................................12-3
Figure 12-2 Alameda OWS............................................................................................12-3
Figure 12-3 Field Maintenance Activities at OWS (1999-2001)...................................12-5
Figure 13-1 Plan View of CDS®...................................................................................13-2
Figure 13-2 Elevation View of CDS®...........................................................................13-2
Figure 13-3 CDS® Unit (I-210 / Filmore) .....................................................................13-3
Figure 13-4 Depth of Settlables and Floatable Gross Pollutants in CDS® Units..........13-6
Figure 13-5 Field Maintenance Activities (Average Annual) at CDS® Units (2000-2002)......................................................................................................................13-7
Figure 13-6 Characterization of the Litter Captured (Based on Count, Both Study Sites Over Entire Study Period)..........................................................................13-11
Figure 13-7 CDS® Mosquito-Proofing Bag................................................................13-14
Figure 14-1 Unit Cost vs. Water Quality Volume for Selected Technologies ..............14-6
Figure 15-1 Predicted TSS Effluent Concentration (a) and Load Reduction (b) ..........15-8
Figure 15-2 Predicted Nitrate Effluent Concentration (a) and Load Reduction (b) ......15-9
Figure 15-3 Predicted TKN Effluent Concentration (a) and Load Reduction (b) .......15-10

BMP Retrofit Pilot Program Final Report
January 2004
xxxi
LIST OF FIGURES (cont'd)
Figure Page
Figure 15-4 Predicted Dissolved P Effluent Concentration (a) and Load Reduction (b)..............................................................................................15-11
Figure 15-5 Predicted Particulate P Effluent Concentration (a) and Load Reduction (b)..............................................................................................15-12
Figure 15-6 Predicted Particulate Zn Effluent Concentration (a) and Load Reduction (b)..............................................................................................15-13
Figure 15-7 Predicted Particulate Cu Effluent Concentration (a) and Load Reduction (b)..............................................................................................15-14
Figure 15-8 Predicted Particulate Pb Effluent Concentration (a) and Load Reduction (b)..............................................................................................15-15
Figure 15-9 Predicted Dissolved Cu Effluent Concentration (a) and Load Reduction (b)..............................................................................................15-16
Figure 15-10 Predicted Dissolved Zn Effluent Concentration (a) and Load Reduction (b)..............................................................................................15-17
Figure 15-11 Predicted Dissolved Pb Effluent Concentration (a) and Load Reduction (b)..............................................................................................15-18
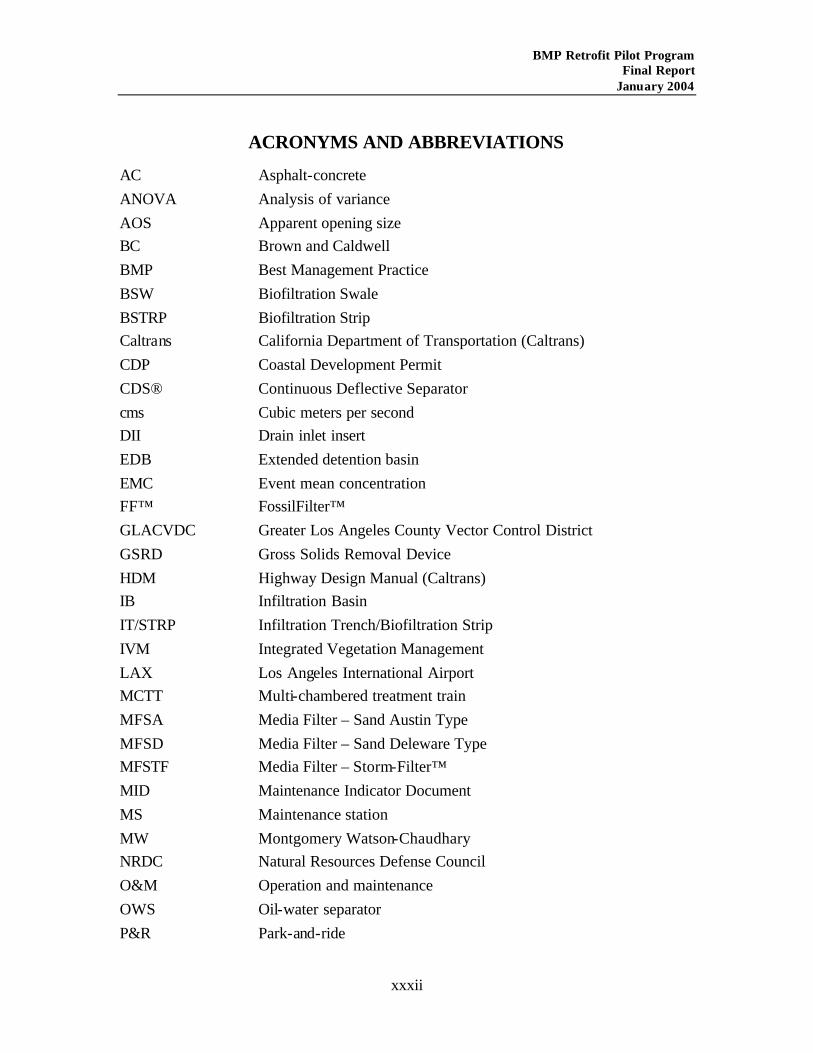
BMP Retrofit Pilot Program Final Report
January 2004
xxxii
ACRONYMS AND ABBREVIATIONS
AC Asphalt-concrete ANOVA Analysis of variance AOS Apparent opening size BC Brown and Caldwell BMP Best Management Practice BSW Biofiltration Swale BSTRP Biofiltration Strip Caltrans California Department of Transportation (Caltrans) CDP Coastal Development Permit CDS® Continuous Deflective Separator cms Cubic meters per second DII Drain inlet insert EDB Extended detention basin EMC Event mean concentration FF™ FossilFilter™ GLACVDC Greater Los Angeles County Vector Control District GSRD Gross Solids Removal Device HDM Highway Design Manual (Caltrans) IB Infiltration Basin IT/STRP Infiltration Trench/Biofiltration Strip IVM Integrated Vegetation Management LAX Los Angeles International Airport MCTT Multi-chambered treatment train MFSA Media Filter – Sand Austin Type MFSD Media Filter – Sand Deleware Type MFSTF Media Filter – Storm-Filter™ MID Maintenance Indicator Document MS Maintenance station MW Montgomery Watson-Chaudhary NRDC Natural Resources Defense Council O&M Operation and maintenance OWS Oil-water separator P&R Park-and-ride

BMP Retrofit Pilot Program Final Report
January 2004
xxxiii
PS&E Plans, specifications, and Estimate Package QA/QC Quality Assurance/Quality Control ROW Right-of-way SDCOVC San Diego County Vector Control District SG™ StreamGuard™ SF™ Storm-Filter™ TKN Total Kjeldahl Nitrogen TPH Total petroleum hydrocarbons TSS Total suspended solids USEPA United States Environmental Protection Agency USFWS United States Fish and Wildlife Service VBDS Vector Borne Disease Section, California Department of Health
Services VCD Vector Control District WB Wet basin WQV Water quality volume

BMP Retrofit Pilot Program Final Report
January 2004
1-1
1 INTRODUCTION The objectives of this document are to report on Caltrans’ experiences in the retrofit pilot program, including cost, technical feasibility and benefits of a wide range of structural Best Management Practices (BMPs) for treating stormwater runoff from a variety of Caltrans facilities. Each BMP type evaluated during this study is discussed in a separate chapter describing siting, design, construction, operation, and maintenance. The results of the monitoring program, including the remova l efficiencies determined, also are presented for each technology. Recommendations on design, operation and maintenance elements are made for each BMP type based on the lessons learned during this study. Appendices referenced provide a more detailed description of each element of this study.
The three concluding chapters present an overview of the study results; comparing relative cost and expected pollutant removal and presenting conclusions, recommendations and technical feasibility for Caltrans facilities. The findings reported here are the result of a collaborative effort between Caltrans and plaintiffs described below. A study team made up of representatives from the parties to the lawsuit, their attorneys, local vector control agencies, and outside technical experts provided oversight of the retrofit pilot program; however, it should be noted that there are elements about which there is some disagreement. This effort has resulted in an unparalleled, comprehensive study of the performance of many common, and a few uncommon, structural BMPs implemented along highways and at associated facilities.
1.1 The Program’s Purpose and Goal
Experience in the stormwater management field over the past 20 years provided some basis to address BMP retrofit questions at the outset. A small set of BMP types has been fairly widely applied. A number of previous research projects measured their effectiveness in capturing and holding pollutants. The ability to construct, operate, and maintain these devices attests to their technical feasibility in the circumstances of their application.
Quantification of costs has not received as much attention as measurement of effectiveness. In recent years the relatively small set of available BMPs began to expand, especially through the introduction of a variety of commercial devices. Therefore, the goal of the retrofit pilot program was to produce and interpret data on the effectiveness, technical feasibility, costs, and benefits of the principal BMPs now available with respect to the southern California highway environment.
1.2 Study Background
Litigation between Caltrans and the Natural Resources Defense Council (NRDC) and Santa Monica BayKeeper resulted in a Stipulation requiring the development of a Best Management Practice (BMP) Retrofit Pilot Program in Caltrans District 7 (Los Angeles area). The goal of this program was to gain important experience in retrofitting existing

BMP Retrofit Pilot Program Final Report
January 2004
1-2
Caltrans facilities with structural BMPs to improve the quality of stormwater discharges. The Stipulation originally called for 38 individual pilot projects. The District 7 Stipulation permitted 10 pilot projects, involving six types of BMPs, to be located within Caltrans District 11, San Diego. After substitutions of specific BMP types, 36 pilots were required under the Stipulation. The types of devices constructed and monitored included drain inlet inserts, biofiltration strips, biofiltration swales, infiltration basins, infiltration trenches, media filters, extended detention basins, oil-water separators, and multi-chamber treatment trains.
Separate litigation in District 11 (San Diego area) between Caltrans and a consortium of plaintiffs, comprised of the San Diego BayKeeper, NRDC and USEPA, resulted in a Consent Decree that included an agreement to implement a BMP Retrofit Pilot Program in District 11. The types of BMP pilot projects within District 11 included biofiltration strips, biofiltration swales, an infiltration basin, infiltration trench, media filters, extended detention basins, and a wet basin. The construction cost for all pilot projects within District 11 was required to total at least $2.5 million. The entire BMP Retrofit Pilot Program included the design, construction, and monitoring of 39 discrete BMP pilot projects. The BMP types, site location numbers, and locations are listed in Table 1-1.
Table 1-1 BMP Types and Project Locations
BMP Type District 7 Site Location/Site
No. District 11 Site Location/Site
No.
Extended Detention Basin I-5/I-605 (s) 74101 I-605/SR-91 (s) 74102
I-5/Manchester (sc) 111105 I-5/SR-56 (c) 111101
I-15/SR-78 (c) 111102 Wet Basin I-5/La Costa (c) 111104 Austin Sand Filter Eastern MS (s) 74202
Foothill MS (s) 74203 Termination P&R (s) 74204
Paxton P&R (s) 74103
La Costa PR (sc) 112203 SR-78/I-5 P&R (sc) 112204
Delaware Sand Filter Escondido MS (sc) 112202 Multi Chamber Treatment Train
Via Verde P&R (s) 74206 Metro MS (s) 74104 Lakewood P&R (s) 74208
Storm-Filter™ Kearny Mesa MS (sc) 112201 Biofiltration Swale I-605/SR-91 (s) 73222b
Cerrito MS (s) 73223 I-5/I-605 (s) 73224 I-605/Del Amo (s) 73225
SR-78/Melrose Dr (sc) 112205 I-5/Palomar Airport Rd (sc) 112206
Biofiltration Strip I-605/SR-91 (s) 73222a Carlsbad MS (sc) 112207a

BMP Retrofit Pilot Program Final Report
January 2004
1-3
BMP Type District 7 Site Location/Site
No. District 11 Site Location/Site
No.
Altadena MS (s) 73211b Infiltration Basin I-605/SR-91 (s) 73101 I-5/La Costa (sc) 111103 Infiltration Trench Altadena MS (s) 73211a Carlsbad MS (sc) 112207b Drain Inlet Insert – FossilFilter™
Foothill MS (s) 73216b
Las Flores MS (s) 73217b Rosemead MS (s) 73218b
Drain Inlet Insert – StreamGuard™
Foothill MS (s) 73216a Las Flores MS (s) 73217a Rosemead MS (s) 73218a
Oil Water Separator Alameda MS (s) 74201 Continuous Deflective Separators (CDS®)
I-210 / Orcas (s) 73102 I-210 / Filmore (s) 73103
c - Consent Decree s – Stipulation
The study was conducted as a cooperative effort by the study team. The study team was comprised of the entities shown on the project organization chart. Key team members and their affiliation are listed in Table 1-2. Consultants hired by Caltrans were responsible for the majority of the day-to-day study operations. RBF Consulting provided overall study and consultant management under the direction of Caltrans and the Plaintiffs. RBF Consulting developed the project Scoping Study, Siting Studies and the Plans, Specifications, and Estimate Packages (PS&E) for the sites located in District 11. RBF Consulting also provided construction management for the District 11 sites with District oversight. Montgomery Watson (MW) and Brown and Caldwell (BC) Consultants provided PS&E, and construction management services (with District oversight) for sites located in District 7. MW and BC also provided construction services for some of the sites located in District 7. Operation and maintenance of the study sites was carried out by RBF Consulting in District 11 and MW and BC in District 7.
The responsibilities of Department of Health Services, University of California at Riverside, and Larry Walker and Associates regarding vector research are described in Section 1.7. The Glenrose Engineering and Holmes and Narver team efforts in reviewing cost are described in Section 1.9. Specific responsibilities of the study team by site location are shown in Table 1-3.
Communication within the study team was accomplished through several methods. First, biweekly reports were generated by Caltrans and the consultants to update the remainder of the study team. Biweekly conference calls were held with the Plaintiffs to respond to questions and receive input on the study. Second, quarterly reports were prepared which

BMP Retrofit Pilot Program Final Report
January 2004
1-4
included the biweekly reports and to-date preliminary study results. The quarterly reports were reviewed during quarterly meetings, held with the entire study team (typically attended by about 30 persons). The study team ordered changes and modifications to the program as appropriate at these quarterly meetings. Minutes of the quarterly meetings were circulated after the meeting. These minutes were then included in an appendix of the subsequent quarterly report; all quarterly reports can be found in Appendix H of this report. About mid-August (2001), the parties agreed to end the regular biweekly conference calls and reports since monitoring of all BMPs, except the CDS® units, was complete. Subsequent working sessions and conference calls were held on an ad-hoc basis with the parties to go over the conclusions and findings of the study and to develop the final report.
The study team reviewed all monitoring data for conformance with the guidelines developed for the study. Once the study team determined that the monitoring data met the guidelines, information regarding device performance was released on an annual basis to the manufacturers of the proprietary devices (drain inlet inserts, Storm-Filter™) and to the designer of the MCTT (Dr. Robert Pitt).

1-5

1-6
BLANK BACK

BMP Retrofit Pilot Program Final Report
January 2004
1-6
Table 1-2 Key Team Members
Organization/Name
Caltrans District 7 Doug Failing, P.E. Paul Thakur, P.E.
University of California at Davis (UCD)/California State University Sacramento (CSUS) Technical Advisors
Peter Van Riper, P.E. Dr. John Johnston (CSUS) Richard Gordon Dr. Ed Dammel (UCD) James McCarthy, P.E. Howard Yamaguchi, P.E. (UCD)
William A. Evans, Esq. University of California at Riverside Charles Belenky, Esq. Dr. Bill Walton Bill Reagan, P.E. University of Alabama
Caltrans District 11 Dr. Robert Pitt, P.E., DEE Cid Tesoro, P.E. URS Consultants
Sayra Ramos, P.E. Carol Forrest, P.E.
John Fredrick Smith, Esq. Ron Johnson, P.E. Lanny Chronert Holmes and Narver
Caltrans Headquarters David Sluga, P.E. Steve Borroum, P.E. Gary Sjelin, P.E. Kim Noonan, P.E. Glenrose Engineering
Dr. Kenneth Smarkel, P.E. Lauren Ross Bob Wu, P.E. Matt Hollon Marcello Peinado, P.E. RBF Consulting Mark Rayback, P.E. Scott Taylor, P.E. Mike Flake, P.E. Anna Lantin, P.E.
Natural Resources Defense Council Bill Whittenberg, P.E., DEE David Beckman, Esq. Dr. Michael Barrett, P.E. Everett DeLano, Esq. Richard Watson, AICP Alex Helperin Laura Larsen, P.E.
Ann Walker, P.E. Natural Resources Defense Council Technical Consultants Tom Ryan, P.E.
Dr. Richard Horner Montgomery Watson-Chaudhary Dr. Christopher May Gary Friedman
Santa Monica BayKeeper William Weidenbacher, P.E.
Terry Tamminen Chuck Paul, P.E. Steve Fleischli, Esq. Glen Grant, P.E.
San Diego BayKeeper Ronald Wurz Ken Moser Larry Walker Associates
John Barth, Esq. Dr. Dean Messer
Bruce Reznick Earthworks, Inc.
San Diego BayKeeper Technical Consultant Margo Griswold Richard Graff, P.E. Martha Blaine Associates
Martha Blaine
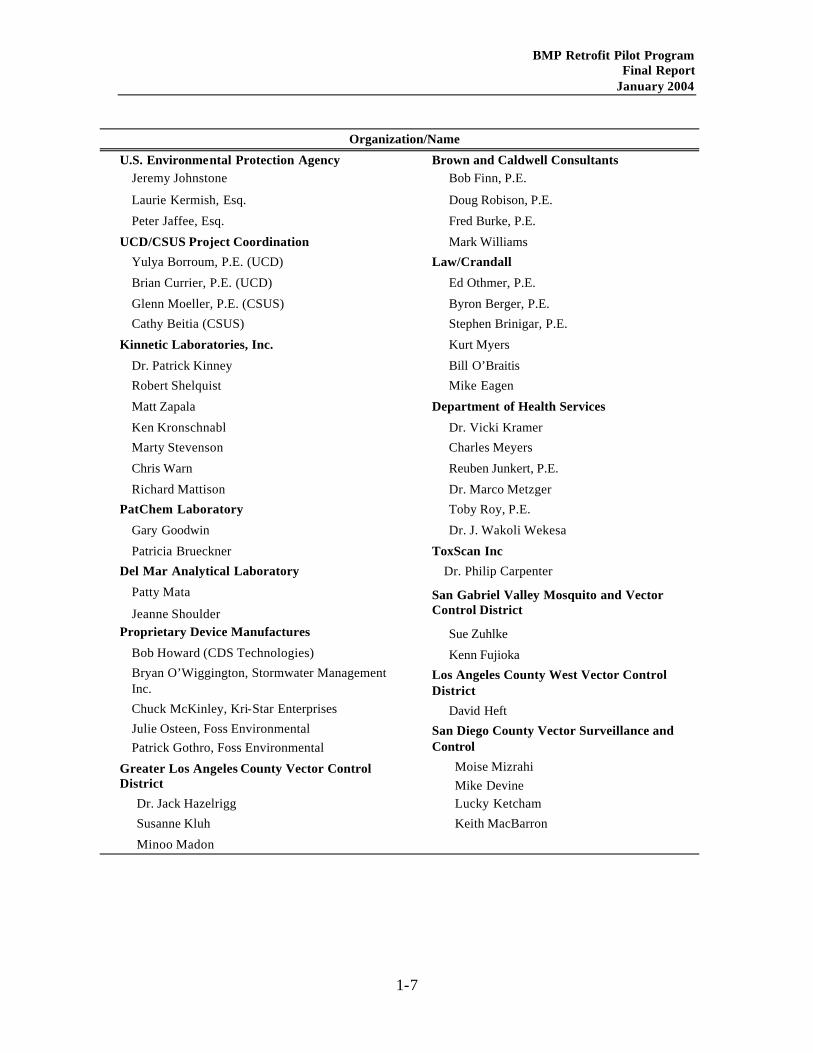
BMP Retrofit Pilot Program Final Report
January 2004
1-7
Organization/Name
U.S. Environmental Protection Agency Brown and Caldwell Consultants Jeremy Johnstone Bob Finn, P.E.
Laurie Kermish, Esq. Doug Robison, P.E.
Peter Jaffee, Esq. Fred Burke, P.E.
UCD/CSUS Project Coordination Mark Williams
Yulya Borroum, P.E. (UCD) Law/Crandall
Brian Currier, P.E. (UCD) Ed Othmer, P.E.
Glenn Moeller, P.E. (CSUS) Byron Berger, P.E.
Cathy Beitia (CSUS) Stephen Brinigar, P.E.
Kinnetic Laboratories, Inc. Kurt Myers
Dr. Patrick Kinney Bill O’Braitis
Robert Shelquist Mike Eagen
Matt Zapala Department of Health Services
Ken Kronschnabl Dr. Vicki Kramer
Marty Stevenson Charles Meyers
Chris Warn Reuben Junkert, P.E.
Richard Mattison Dr. Marco Metzger
PatChem Laboratory Toby Roy, P.E.
Gary Goodwin Dr. J. Wakoli Wekesa
Patricia Brueckner ToxScan Inc
Del Mar Analytical Laboratory Dr. Philip Carpenter
Patty Mata
Jeanne Shoulder San Gabriel Valley Mosquito and Vector Control District
Proprietary Device Manufactures Sue Zuhlke Bob Howard (CDS Technologies) Kenn Fujioka Bryan O’Wiggington, Stormwater Management Inc.
Los Angeles County West Vector Control District
Chuck McKinley, Kri-Star Enterprises David Heft Julie Osteen, Foss Environmental Patrick Gothro, Foss Environmental
San Diego County Vector Surveillance and Control
Moise Mizrahi Greater Los Angeles County Vector Control District Mike Devine
Dr. Jack Hazelrigg Lucky Ketcham
Susanne Kluh Keith MacBarron
Minoo Madon

BMP Retrofit Pilot Program Final Report
January 2004
1-8
Table 1-3 Consultant Responsibility by BMP Pilot Site
Location BMP Type Scoping/
Siting Design Construction Management
Maintenance and
Monitoring Laboratory
DISTRICT 7
I-605/SR-91 IB RBFa MWb MW MW PatChem I-210 E of Orcas CDS® RBF MW MW MW PatChem I-210 E of Filmore CDS® RBF MW MW MW PatChem I-5/I-605 EDB RBF BCc BC BC PatChem I-605/SR-91 EDB RBF BC BC BC PatChem Alameda MS OWS RBF BC BC BC PatChem Eastern MS MF RBF BC BC BC PatChem Foothill MS MF RBF BC BC BC PatChem Termination P&R MF RBF BC BC BC PatChem Via Verde P&R MCTT RBF BC BC BC PatChem Lakewood P&R MCTT RBF BC BC BC PatChem Altadena Bio Strip/IT RBF MW MW MW PatChem Foothill MS DII RBF MW MW MW PatChem Las Flores MS DII RBF MW MW MW PatChem Rosemead MS DII RBF MW MW MW PatChem I-605/SR-91 Bio strip/Swale RBF MW MW MW PatChem Cerritos MS BioSwa le RBF MW MW MW PatChem I-5/I-605 BioSwale RBF BC BC BC PatChem I-605/ Del Amo BioSwale RBF MW MW MW PatChem
DISTRICT 11
I-5/SR-56 EDB RBF RBF RBF RBF Toxscan I-15/SR-78 EDB RBF RBF RBF RBF Toxscan I-5/La Costa (W) IB RBF RBF RBF RBF Toxscan I-5/La Costa (E) WB RBF RBF RBF RBF Toxscan I-5/Manchester (E) EDB RBF RBF RBF RBF Toxscan Kearny Mesa MS Storm-Filter™
(Perlite/Zeolite) RBF RBF RBF RBF Toxscan
Escondido MS MF RBF RBF RBF RBF Toxscan La Costa P&R MF RBF RBF RBF RBF Toxscan SR-78/I-5 P&R MF RBF RBF RBF RBF Toxscan Melrose Drive / SR-78
Bio Swale RBF RBF RBF RBF Toxscan
I-5/Palomar Airport Road
Bio Swale
RBF
RBF
RBF
RBF
Toxscan
Carlsbad MS Bio Strip/IT RBF RBF RBF RBF Toxscan a RBF Consulting
b Montgomery Watson
c Brown and Caldwell

BMP Retrofit Pilot Program Final Report
January 2004
1-9
Midway through the pilot study it was determined that the resultant interim reports and data were public records. At that time, other interested parties (most notably the State Water Resources Control Board Staff) were invited to attend the quarterly meetings, and they regularly received reports and information of findings and results.
Communication outside of the study team (verbal, written correspondence and professional papers) with other agencies or experts was reported to the study team during biweekly and quarterly meetings.
1.3 Research Objectives
The objectives of the BMP Retrofit Pilot Program included:
• Evaluation of the performance (constituent removal efficiency and effluent quality) of the device;
• Collection of information to assess the technical feasibility of design, construction, and maintenance in a retrofit environment;
• Evaluation of the operational aspects associated with maintenance of the structures and potential solutions to any identified problems;
• Assessment of costs for constructing and maintaining selected types of BMPs; and
• Evaluation of benefits to surrounding environment and to public health
This study documents the effectiveness of the various BMPs in removing selected constituents in highway runoff. Detailed records were kept of siting, design, construction, and operation and maintenance issues. Operational problems and procedures and resultant solutions were documented. Observations of the BMP operations were, for the most part, recorded in journal format due to the difficulty in characterizing these types of information. Costs were assessed through detailed records kept on the design, construction, operation and maintenance of each of the retrofit devices.
1.4 BMP Siting
The criteria used to select sites varied depending on the nature and specific requirements of the type of BMP to be evaluated. However, four general criteria controlled the selection of all retrofit pilot project sites:
• Each site had to be appropriate for the capabilities of the BMP being evaluated.
• Each site had to have a realistic opportunity to install, operate, and observe the devices being evaluated.

BMP Retrofit Pilot Program Final Report
January 2004
1-10
• All sites had to be owned and operated by Caltrans.
• All sites had to be operational and observed for two years under the District 7 Stipulation, and for at least one year under the District 11 Consent Decree.
Specific siting requirements for each BMP are included in the project Scoping Studies (RBF Consulting, 1998a, 1998b; included in Appendix A).
The retrofit pilot projects were sited to permit observations pertaining to technical feasibility, costs of retrofitting, and pollutant removal performance. Sites were originally selected because they were typical along Caltrans rights-of-way and at associated facilities, including interchanges, park-and-rides, and maintenance facilities. This was done to ensure that the program evaluated retrofit opportunities similar to those that would be encountered on a larger scale. Each site for a retrofit pilot project was selected to be appropriate, if not ideal, for the type of best management practice to be evaluated without pre-judgment about the outcome of the associated retrofit pilot study. A detailed discussion of the siting for each technology is contained in Appendix A.
Sites were selected using a weighted decision matrix process for each type of BMP in order to select the ‘best’ site from among candidate sites. Significant criteria in the selection of the retrofit project were assembled and then assigned a weighting factor to emphasize the more important selection criteria. All candidate sites were reviewed and ranked according to the weighted criteria established for the subject BMP. Among the primary criteria used in site selection (in no particular order) were:
• Maintenance access
• Presence of vehicles and heavy equipment (on maintenance station sites for obvious sources of pollutants)
• Space availability for BMP structure
• Proximity to structures for infiltration type devices
• Drainage pattern to available location
Several constraints were encountered in selecting appropriate sites for the BMPs. There was a limited amount of suitable, available surplus area within the right-of-way owned by Caltrans; consequently, relatively little area was available for the land- intensive BMPs. The second significant constraint was the lack of infiltration capacity of the soils at sites that would otherwise be appropriate for an infiltration basin or trench.
1.5 BMP Sizing and Design
Attempts were made to design each of the BMPs to fit the existing terrain while providing space for monitoring equipment or other features. The objectives were to

BMP Retrofit Pilot Program Final Report
January 2004
1-11
locate, size, and shape the devices to best match site topography and provide extended flow paths to maximize their treatment potential. Designing in this way makes efficient use of space to provide the needed treatment volume. Due to the compressed study schedule, aesthetics were not always considered in the design of these devices; however, this element can be more prominent in future implementations. Detailed design information for each BMP is in the Basis of Design reports included in Appendix B. As-built plans for the BMPs can be found in Appendix G.
During the design of each BMP, an evaluation was made as to whether runoff from additional tributary areas could be captured and conveyed to the BMP for treatment in order to increase the pollutant removal and reduce the unit costs. There were two main impediments to increasing the area and runoff treated by each device. In many cases, the cost of bringing in additional runoff greatly increased the estimated cost of the BMP because of the extensive modifications to the existing storm drains that would be required, including jacking of pipe under active freeway lanes. Secondly, the existing piping downstream of the proposed BMP location was sized to handle the flow from only the original drainage area. Directing runoff from other watersheds to the device would require increasing the size of the storm drain system downstream to the point where sufficient capacity was available. Consequently, substantially increasing the tributary area to the BMPs was normally not cost-effective.
The BMPs were sized to treat the runoff generated by the 1 yr, 24 hr rainfall event. The runoff volume produced by this storm was used to size the storage type devices (detention basins, media filters, etc). In District 7, the Caltrans Stormwater Facilities Retrofit Evaluation (Brown and Caldwell, 1999) was used to estimate size of the water quality design storm by analyzing rain gauge stations within the study area. Rainfall values were determined using precipitation records from 1944 to 1995 (24 hr rainfall totals) from the Los Angeles International Airport (LAX) weather station. The data were analyzed using the log-Pearson type III method and by the annual series method. For comparison and to verify the data, second and third sets of rainfall records were analyzed from the Van Nuys and the downtown Los Angeles weather stations. Both methods indicated that a rainfall depth of 25.4 mm is approximately equal to the 1 yr, 24 hr storm. Runoff rates were calculated according to the methods specified by Los Angeles County (1989).
In District 11, the average rainfall depth for the design storm was calculated using the rainfall obtained from isohyetal maps and Averaged Mass Rainfall Plotting Sheets (Basis of Design Reports, RBF, 1999c, d, e; included in Appendix B). This procedure indicated that the rainfall depth for a 1 yr, 24 hr storm in District 11 varies between 33 and 48 mm. Rainfall depths and intensity for the design storms for both districts are summarized in Table 1-4. Areas contributing runoff to the BMPs were usually paved and a large percentage was impervious. To calculate volume of runoff, a runoff coefficient of 0.90 to 0.95 was assumed for impervious areas and 0.15 for pervious areas. Runoff rates in District 11 were calculated according to the methodology specified by the County of San Diego (1993).

BMP Retrofit Pilot Program Final Report
January 2004
1-12
For design of in-line devices, the 25 yr discharge was also calculated to ensure conveyance capacity. In- line devices were designed to pass the 25 yr storm runoff in addition to capturing the water quality volume (WQV). Off- line devices had upstream structures to divert runoff that exceeded the water quality design volume (peak flow).
The peak discharge rate was determined for those devices that were designed based on flow rates such as biofiltration swales. The peak discharge rate depends directly on the average intensity of the rainfall for the desired frequency, as well as the time of concentration. The time of concentration for each BMP Pilot was computed using topographic information and the local method to compute inlet time. Estimated flow rates for the water quality design storm and the 25 yr recurrence interval drainage design storm were computed using the Rational Method.
Table 1-4 Rainfall Design Characteristics for BMP Sites
Parameter Used for Design District 7 District 11
1 yr rainfall intensity 6.1 – 35.6 mm/hr 32.0 – 48.2 mm/hr
25 yr rainfall intensity 73.7 – 82.6 mm/hr 78.7 – 121.9 mm/hr
1 yr rainfall depth 25.4 mm 33.0 – 48.3 mm
1.6 Operation and Maintenance
The devices evaluated by the pilot study were operated and maintained at state-of-the-art levels, i.e., the best technology and/or practice available at the time, which was consistent with the research aspect of this study. Operation, maintenance and monitoring plans (RBF Consulting, 1999a, 1999b) were developed for both districts to provide comprehensive guidance on the development of site-specific plans. Field guidance notebooks (Brown and Caldwell, et al., 1999; Kinnetic Laboratories Inc., 1999 were then prepared to facilitate record keeping, to document all maintenance activities and to ensure state-of-the-art operation and maintenance. These documents are included in Appendix D. In addition, a Maintenance Indicator Document (MID) (17 unpublished versions), which was modified and updated as the study progressed, described the maintenance protocols and identified the conditions under which maintenance would be required. The last version of the MID used during the study and the recommended final version is contained in Appendix D.
Since the BMPs were operated at state-of-the-art levels, they were inspected and maintained at more frequent intervals than is common for most municipal or highway operations. For instance, each BMP was inspected after every storm event to ensure that they were operating as designed. Based on operation and maintenance experience gained during the retrofit pilot program, the amount of maintenance specified in the earlier versions of the MID was frequently found to be overly intensive. The requirements were reduced in the later versions, which should result in lower maintenance costs than those

BMP Retrofit Pilot Program Final Report
January 2004
1-13
incurred in this study. The actual maintenance hours reported for the study period are a product of these changing maintenance guidelines.
Maintenance was performed for aesthetic reasons and to ensure proper functioning of the BMP (RBF Consulting, 1999a, 1999b). Aesthetic maintenance generally included graffiti removal, grass trimming, weed control, and other miscellaneous details such as tree pruning and painting. Functional maintenance included both preventive and corrective maintenance. Preventive maintenance was performed regularly and included such activities as vegetation management at BMP sites and removal of trash and debris from outlet structures of the extended detention basins and sand filters. Vegetation control also served as a vector prevention function. Corrective maintenance was required on an ad-hoc basis to address intermittent operational problems.
1.7 Monitoring Overview
The monitoring program included a comprehensive effort to document not only the chemical pollutant removal, but also to make and record visual observations of the operation of the devices; these observations were termed “empirical observations.” Detailed stormwater monitoring protocols were developed for each device and a series of field data sheets were developed to record the empirical observations as described below (Brown and Caldwell, et al., 1999; Kinnetic Laboratories Inc., 1999).
1.7.1 Chemical Monitoring
The BMPs were monitored to determine their effectiveness at removing a number of conventional constituents commonly observed in highway runoff. With the exception of the drain inlet insert, oil-water separator and infiltration BMPs, all the sites were outfitted with automatic samplers (Sigma 900 Max Series) and flow meters (Sigma 950 Series) to collect flow weighted composite samples of the influent and effluent of the devices. In drain inlet inserts samples were collected from the effluent only and at the oil-water separator samples were collected as grab samples. Automatic samplers consist of a peristaltic pump, pump control electronics, a sample distribution system, a power supply, and a housing that contains the composite bottle(s). Rain gauges (Sigma 2149) were installed at all sites. In addition to the monitoring related construction costs shown in the following chapters, an additional $30,000 to $40,000 is required to equip and calibrate a site with paired samplers.
Flow measurements were taken at the BMP sites to allow the calculation of constituent loads. For extended detention basins, media filters, MCTTs, and the wet basin, the influent was measured using a Parshall flume or H-flume. The effluent flows were measured using a V-notch weir. The influent and effluent of the biofiltration strips and swales were measured using flumes. The oil-water separator did not have equipment to measure flow; flow was determined using rainfall amount and impervious area. At the drain inlet inserts only effluent flow was measured using flumes. The infiltration basins had a bubbler type flow meter to determine basin depth and calculate the infiltration

BMP Retrofit Pilot Program Final Report
January 2004
1-14
rates. The flow monitoring equipment was calibrated according to the manufacturer’s specifications.
Sampling teams mobilized to capture storms that were predicted to produce at least 6.4 mm of rain with 75 percent or greater probability. An antecedent dry period of at least 48 hours was required, with a preferred separation of 72 hours; however, if the first event of two consecutive storms was not captured and the rainfall total was less than 6.4 mm, and the second event was forecast to be at least as large as the first event, then sampling was attempted for the second event.
Twelve aliquots, 75 percent capture and 2.5 mm of rain were the general minimum criteria for a successfully monitored event. However, if a sample represented between 50–75 percent of the runoff, and had 20 or more aliquots, then the data were analyzed. If a composite sample had less than 12 aliquots, percent capture was greater than 85 percent, and sample volume captured was sufficient for full analysis, the data were also analyzed. In some cases as few as eight aliquots and 50 percent capture was considered sufficient. Data not meeting the general criteria were flagged and acceptance was based on review by members of the study team. Samples were refrigerated at sites where it was possible to connect to an existing power source. At sites where connection to an existing power source was not possible marine batteries were used and samples were placed on ice. Additional detail and results from the monitoring effort is contained in Appendix F.
In general, all sites were monitored for solids, nutrients, total and dissolved heavy metals, organics, and fecal coliform. Groundwater samples from infiltration trenches and infiltration basins were only analyzed for metals to assess the potential impact on groundwater quality. At the drain inlet insert sites only suspended solids, metals, and petroleum hydrocarbons were analyzed. Since many constituents can impair beneficial uses of receiving waters at extremely low concentrations, only analytical methods that have appropriate detection limits were selected. Table 1-5 summarizes the constituents selected for analysis along with the required analytical procedure.
Grab samples of runoff were collected at the oil-water separator and analyzed for organics, fecal coliform, and TSS. Suspended solids, nutrients, and metals were collected as composite samples, where a number of individual sample aliquots were mixed together over the duration of the storm. Total nitrogen concentrations are calculated as the sum of nitrate and Total Kjeldahl Nitrogen (TKN), which assumes that the concentration of nitrite is small compared to the other components. This is generally a safe assumption.
Detailed QA/QC plans were developed for each type of the BMPs monitored (Kinnetic Laboratories Inc., 1999; Brown and Caldwell, 1999). These plans required the collection and analysis of duplicate samples, field and laboratory blanks, equipment blanks, matrix spike and matrix duplicate spikes, and laboratory replicate/splits. Water quality analyses not achieving the required accuracy are qualified in the study database.

BMP Retrofit Pilot Program Final Report
January 2004
1-15
Two different methodologies were used to describe the constituent removal of the devices. The first methodology, required under the Scoping Study (RBF Consulting, 1998a and 1999b), uses an assumed log-normal distribution of influent and effluent concentrations to estimate load reduction. The performance calculated using these values is strongly affected by the average influent concentration at a particular site and can make devices evaluated at locations with low influent concentrations appear to perform less effectively in comparison to those located at sites with higher influent concentrations. Consequently, a second, innovative methodology was developed based on a regression analysis of influent and effluent concentrations to predict performance at all the devices based on a common influent concentration typical of highway and associated land uses.
Table 1-5 Selected Constituents and Analytical Methods
Parameter
Reporting Detection Limit mg/L
Analytical Method (USEPA, 1979; 1994)
Total suspended solids (TSS) 1 160.2 Zinc (Zn) 0.001 200.8 Lead (Pb) 0.001 200.8 Copper (Cu) 0.001 200.8 Nitrate Nitrogen (NO3-N) 0.01 300.00
Total Kjeldahl Nitrogen (TKN) 0.1 351.3
Total Phosphorus (TP) 0.002 365.3 Ortho-phosphate (OP) 0.001 365.3 Fecal Coliform (FC) 2 – 200 MPN/100 ml SM 9221Ea
Total Petroleum Hydrocarbons – gasoline (TPH-G)
0.05 8015 mod/ext.
Total Petroleum Hydrocarbons – diesel (TPH-D)
0.1 8015 mod/ext.
Total Petroleum Hydrocarbons – motor oil (TPH-MO)
0.2 8015 mod/ext.
Total Recoverable Petroleum Hydrocarbons (TRPH)
5 1664 a Standard Methods
1. Italicized constituents limited to maintenance stations. 2. Fecal coliform originally run at 200 but dropped to 2 MPN/100 ml later
In the first method, the data were assumed to be log-normally distributed and the mean (µ) and variance (s2) of the log transformed event mean concentrations (EMCs) were calculated as:

BMP Retrofit Pilot Program Final Report
January 2004
1-16
n
x∑=µ
( )( )( )1
222
−
−= ∑∑
nn
xxns
where: x is the natural log of EMCs.
Σx represents the summation of data points (x).
n is the number of data points (x).
The mean of the EMCs (a) was calculated as:
a = e (µ + s2/2)
An analysis of variance (ANOVA) was then performed to determine whether the mean influent and effluent concentrations were significantly different. The probability (P) that the two means are not different is reported for all measured constituents for each BMP type.
The annual constituent loads were obtained by multiplying the season total runoff volume by the mean concentration. The efficiency was determined by comparing the influent and effluent loadings over the entire wet season using the following equation:
Efficiency (%) = [(Loading in – Loading out)/Loading in] * 100
These efficiencies represent the average pollutant removal for the water treated and do not take into account untreated bypasses that occur when the storm runoff exceeds the design WQV. The water quality of the bypassed fraction would need to be known to
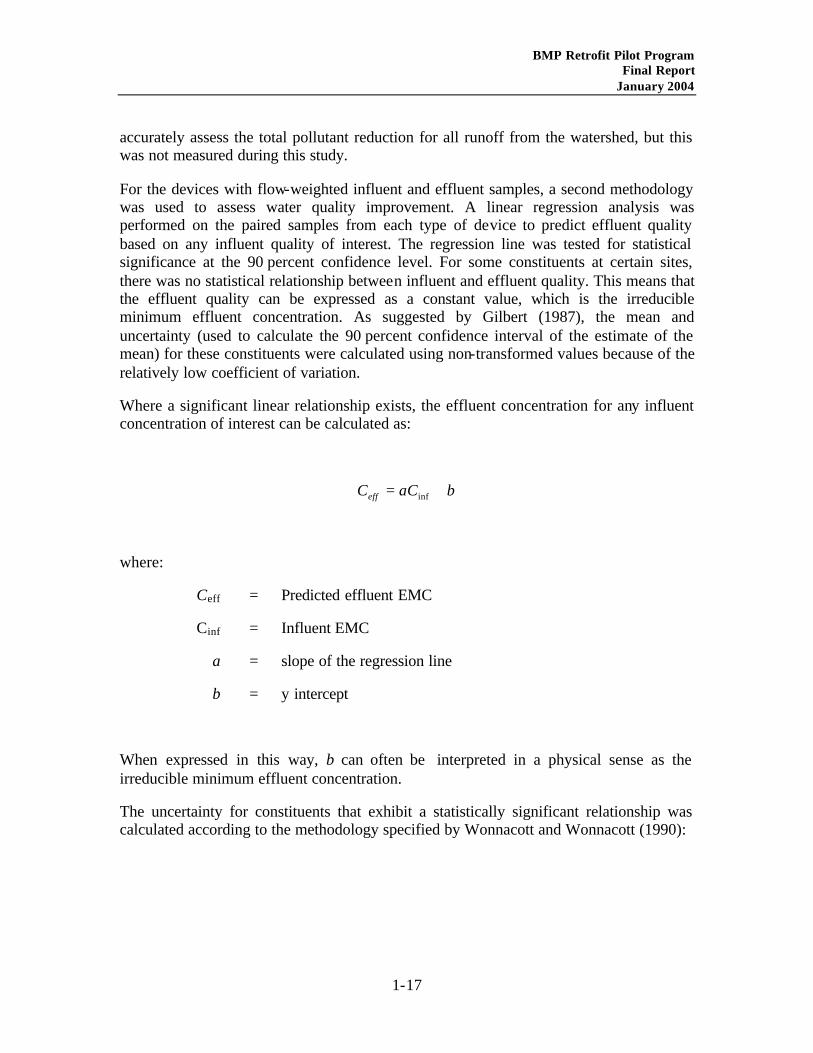
BMP Retrofit Pilot Program Final Report
January 2004
1-17
accurately assess the total pollutant reduction for all runoff from the watershed, but this was not measured during this study.
For the devices with flow-weighted influent and effluent samples, a second methodology was used to assess water quality improvement. A linear regression analysis was performed on the paired samples from each type of device to predict effluent quality based on any influent quality of interest. The regression line was tested for statistical significance at the 90 percent confidence level. For some constituents at certain sites, there was no statistical relationship between influent and effluent quality. This means that the effluent quality can be expressed as a constant value, which is the irreducible minimum effluent concentration. As suggested by Gilbert (1987), the mean and uncertainty (used to calculate the 90 percent confidence interval of the estimate of the mean) for these constituents were calculated using non-transformed values because of the relatively low coefficient of variation.
Where a significant linear relationship exists, the effluent concentration for any influent concentration of interest can be calculated as:
baCCeff += inf
where:
Ceff = Predicted effluent EMC
Cinf = Influent EMC
a = slope of the regression line
b = y intercept
When expressed in this way, b can often be interpreted in a physical sense as the irreducible minimum effluent concentration.
The uncertainty for constituents that exhibit a statistically significant relationship was calculated according to the methodology specified by Wonnacott and Wonnacott (1990):

BMP Retrofit Pilot Program Final Report
January 2004
1-18
( )( )∑
=
−
−+ n
ii XX
XXn
st
1
2
2
05.0
1
where:
t = value of the t statistic for the appropriate degrees of freedom (n-2)
s = standard error of the estimate
n = number of paired data points
X = Influent value of interest
Xi = Observed influent concentrations from monitoring data
Note that the size of the confidence interval is a function of the value at which the mean is calculated. The confidence interval is smallest when the influent concentration of interest equals the average observed influent concentration.
1.7.2 Empirical Observations
Significant effort during this study was directed to recording and analyzing the operation and maintenance experience. Forms were developed so that engineers and support staff could record their observations to facilitate compilation of this information. During each visit to the site, a site visit log was filled out to record observations. The types of observations varied with the type of BMP being evaluated. Some of the general types of observations recorded on applicable forms in the Field Guidance Notebooks (Brown and Caldwell et al., 1999; Kinnetic Laboratories Inc., 1999; see Appendix D) included:
• Water level
• Visual evidence of flow short circuiting (for wet weather visits)
• Description of amount and locations of sediment accumulation
• Evidence of scouring and of resuspension of settled particles
• Amount of litter and predominant type
• Change in litter accumulation and location since previous visit
• Conditions/clogging of outlet structure

BMP Retrofit Pilot Program Final Report
January 2004
1-19
• Evidence of erosion
• Condition of BMP
• Degree and type of vegetation establishment (if present)
• Stability of basin slopes / evidence of erosion
• Evidence of vandalism of equipment or basin structures
• Presence of unpleasant odors
Information collected on these forms was entered into a database. Separate forms for Site Inspections, Maintenance Activities, and Empirical Observations were used. Also included in the database were results from sampling activities. The database was updated monthly with the previous month’s inspections and sampling data. Reports were generated and displayed on the project’s website on a monthly basis.
1.8 Vector Issues
A special study team was created to investigate the presence and development of vectors in the pilot BMPs. Because of their ability to transmit human diseases, the vectors of greatest concern and the primary focus of this study effort were mosquitoes. Caltrans, the Vector-Borne Disease Section of the California Department of Health Services (VBDS), the University of California at Riverside, local vector control agencies, and consultants worked together to monitor vector populations associated with BMPs, determine proper strategies for vector suppression at the various study sites, and present findings. A comprehensive final report summarizing all vector-related activities during the study, Final Vector Report, Caltrans BMP Retrofit Project sites Districts 7 and 11, September 2001, is available in Appendix E.
In 1998, the University of California at Riverside, developed a monitoring program to compare the populations of adult mosquito and midges at selected BMP sites, pre- and post-construction. Three different traps were used to sample populations; carbon dioxide-baited traps were used to capture host-seeking adult female mosquitoes, gravid traps were used to capture gravid female mosquitoes, and light traps were used to capture midges. Two documents summarize the monitoring plan for Caltrans District 7 and 11, and the final report gives a detailed discussion of the methodology and results. The three documents are listed below and are available in Appendix E.
• Vector Control Background Monitoring Plan for Caltrans Retrofit BMP Pilot Project, District 7, September 2001.
• Vector Control Background Monitoring Plan for Caltrans Retrofit BMP Pilot Project, District 11, July 1, 1998.

BMP Retrofit Pilot Program Final Report
January 2004
1-20
• Monitoring Program for Pathogen-Transmitting and Nuisance Adult Diptera Associated with the Stormwater BMP Retrofit Pilot Program in Caltrans District 7 and District 11, September 1, 2000.
In 1999, VBDS developed a separate monitoring and abatement program for immature stages of mosquitoes and other vectors associated with BMPs. Any source of standing water has the potential to create the habitat necessary for vectors to reproduce. Inspections were conducted weekly at all BMP sites by local vector control agencies and VBDS to determine if standing water and subsequent mosquito larvae were present. When necessary, abatement of larvae was performed by the local districts by using altisoid liquid or pellets and a few occasions at the start of the study Golden Bear oil was used. Golden Bear oil use was discontinued because of potential interference with water quality monitoring. VBDS prepared a document outlining the immature mosquito monitoring and abatement plan for Caltrans District 7 and 11. The final report gives a detailed summary of mosquito production during the two-year study. The two documents are listed below and are available in Appendix E.
• BMP Mosquito Production Study, September 1999.
• An Initial Assessment of Vector Production in Structural Best Management Practices in Southern California, June 2001.
In addition to monitoring for mosquito larvae, the study team modified BMPs that held standing water for over 72 hours to suppress mosquito production to the greatest extent possible, without impairing their intended function. Caltrans, VBDS, the local southern California vector control agencies, and stormwater consultants recommended and implemented appropriate changes to BMP designs to eliminate vector-breeding habitats. A report prepared by VBDS, A Preliminary Assessment of Design Criteria for Vector Prevention in Structural Best Management Practices in Southern California, June 2001 includes recommendations for preventing vector habitat in BMP structures; it is available in Appendix E.
To further clarify their position on BMPs that hold water longer than 72 hours, the VBDS prepared a memorandum on this subject. The memorandum summarizes the legal authority and requirement of the Department of Health Services to protect public health, including the ability to assess civil penalties. The memorandum, “Standing Water in Structural Best Management Practices for Stormwater Runoff,” September 4, 2001, is provided in Appendix E
Finally, to better understand the relationship between stormwater management structures, such as treatment BMPs, and vectors, VBDS undertook an extensive, independent study to obtain information from different agencies across the United States. Through the use of detailed surveys as well as email and telephone communication, VBDS contacted several hundred agencies. In addition, VBDS was invited to participate in tours of treatment BMPs in Portland, Oregon and in Austin, Texas to witness potential vector habitats first hand. Two reports were prepared by VBDS that provide details of these

BMP Retrofit Pilot Program Final Report
January 2004
1-21
out-of-state investigations. The two document titles are listed below and are available in Appendix E.
• A Preliminary Assessment of Vectors Associated with Storm Water Management Structures in the United States: A Nationwide Vector Control Perspective, June 2001.
• A Preliminary Assessment of Vectors Associated with Storm Water Management Structures in the United States: Addendum, June 2001.
The health code statutes, as written, give vector control district managers wide latitude in determining what constitutes a public health threat and under what conditions abatement will occur. The vector control districts in Los Angeles County have established an abatement threshold of one larva for the BMPs. With this threshold, these districts can abate when a single larva is collected from a site. The San Diego County Vector Surveillance and Control Division generally does not rely on thresholds in determining abatement needs. San Diego County prefers an approach where factors such as BMP location, larval density, and proximity to residential areas are considered.
1.9 Biological Issues
Biological issues were an important concern for BMP operation and maintenance. The presence of endangered species, threatened species and species of special concern in a BMP could affect scheduled maintenance and other activities. Early and effective coordination with the U.S. Fish and Wildlife Service (USFWS) and the California Department of Fish and Game could avert some of the problems associated with the presence of biological resources; however, the potential presence of protected species may result in siting, construction, operation, and maintenance restrictions.
In District 11 there were several species of concern. The nesting period of the least tern was a concern at the La Costa Austin filter and construction had to be delayed until the end of the nesting period. Nets were installed over the Austin sand filters and infiltration basin during the dry season to prevent the nesting of the least tern and Snowy Plover in the sand filter bed. Mylar strips were used at the La Costa wet basin to discourage the nesting of sensitive species in the wet pond vegetation. Salt grass used in biofilters is also a habitat for the salt marsh skipper (butterfly). The sites in District 11 were monitored for the presence of the skipper. In District 7, the primary concern was the opportunity for burrowing owls, an endangered species, to use the gopher mounds and ground squirrel burrows. There was abundant gopher activity at many of the swales and detention basins in District 7, but no owls were observed.
The trees located adjacent to the biofiltration swale for the I-5/Palomar Airport Road offramp had to be protected in accordance with the Coastal Development Permit (CDP) in effect for the Cannon Road improvements. The CDP required that any existing trees that would be removed by construction activities be replaced at a 5:1 ratio. The BMP was redesigned to eliminate the need for mitigation by confining flow in concrete

BMP Retrofit Pilot Program Final Report
January 2004
1-22
channels around the two areas of concern. To further protect the trees, excavation activities were restricted to the area beyond the tree dripline. Consequently, the BMP facility incorporates three biofiltration swales and two intermedia te concrete swales.
1.10 Maintenance Effort and Construction Cost
One of the research objectives of the BMP Retrofit Pilot Program was to develop reliable information relative to the effort required for operation and maintenance of the BMPs under study. This included more detailed record keeping of maintenance activities than would normally be necessary in a routine operational setting. The scope of work included routine and as-needed maintenance functions as specified in the Maintenance Indicator Document (see Appendix D), as well as stormwater runoff sampling and empirical observation (RBF Consulting, 1999a, 1999b). Routine and as-needed maintenance and operation efforts (maintenance hours) were accounted for separately from stormwater runoff sampling, empirical observation and maintenance or related services for sampling equipment. Two categories for each BMP (not by site) were developed over the course of the study: 1) maintenance and operation, and 2) sampling and empirical observation.
The operation and maintenance hours presented are limited to those spent on actual field activities and required equipment. These activities include wet and dry season inspections and unscheduled inspections of the BMPs. Maintenance included time spent maintaining the BMPs for scheduled and unscheduled maintenance, vandalism, and acts of nature. Equipment time included the time equipment was allocated to the BMP for maintenance.
Construction cost items included the original bid schedule, additional items of work authorized following contract award, and State-furnished materials. Since this was a pilot program, most sites were equipped with water quality sampling and flow measurement equipment. Therefore, the costs that were unique to the monitoring of the pilot program were separated from the total construction costs.
There has been extensive discussion among the parties involved in this study as to whether the construction cost numbers accurately represent the costs that would be incurred in a more extensive (widespread) retrofit program. Many reasons have been suggested for possible differences, including, among others: the compressed nature of the study schedule, the bidding climate at the time the contracts were advertised, the lack of standard competitive bidding, and the dispersed nature of the construction activities. The parties in the study subsequently agreed upon adjusted costs and these are presented in addition to the incurred costs. Adjusted construction costs include allowances for site-specific costs and ancillary costs of construction that may be encountered during future BMP retrofits (Adjusted Retrofit Construction Cost Tables, Appendix C).
The adjusted construction cost is the actual cost minus all pilot-unique cost and minus adjustments to site-specific cost. Certain site-specific costs were adjusted when the original cost could potentially be avoided in future BMP retrofits. For example, buried concrete rubble was found at one EDB location that doubled the construction cost. This was a site-specific cost that was adjusted by using the average buried materials cost of

BMP Retrofit Pilot Program Final Report
January 2004
1-23
similar basin- type BMPs. For each BMP, the subtracted costs were expressed as a percentage of the adjusted construction cost. These percentages are reported in the individual BMP chapters in bulleted statements explaining the cost adjustments. These percentages represent what additional cost could be expected above the adjusted cost if the conditions in which the subtracted cost occurred were replicated.
1.11 Technical Feasibility
Technical feasibility is defined as the acceptability of a BMP for use at any suitable site according to the criteria in the list below. Whether a technically feasible BMP should or should not be used depends on a number of site-specific factors that are spelled out in subsequent chapters.
1. The BMP should operate passively during storm events. No personnel are required to be on site prior to or during a storm event to initiate operation of the BMP or perform routine maintenance to keep the device operational. This does not imply that routine inspections, periodic maintenance, and/or emergency maintenance will not be required to ensure the proper operation of the BMP.
2. Maintenance requirements for a BMP should be well understood and defined with respect to scope and periodicity (see MID). In addition, regular maintenance personnel should be able to perform routine inspections and maintenance tasks using available equipment and without special training.
3. Maintenance personnel must be able to perform operational and maintenance (O&M) inspections and tasks without significant safety risks. Also, safe access to BMPs should be provided.
4. Estimates of the long-term maintenance requirements for the device should be identified.
5. The BMP device should be designed and operated so that it does not create a public nuisance or health hazard. Specifically, this is a concern with regard to potential disease vectors such as mosquitoes. Structural BMP design and prescribed O&M should be adequate to ensure BMP operation with respect to water quality, while at the same time reducing potential vector concerns to an acceptable level.
6. The BMP device should be appropriate for the local climatic conditions. Except for initial installation and vegetation establishment periods, irrigation should not be required. An artificial source of water should not be required except in the case where specific BMP design requirements call for sufficient supplementary water to support wetland plants (i.e., wet pond or constructed wetland).
7. The BMP device should be appropriate for the local geological and topographical conditions. Local soil characteristics, underlying geology, and groundwater

BMP Retrofit Pilot Program Final Report
January 2004
1-24
should support the use of a particular BMP type. Furthermore, stormwater runoff drainage patterns (i.e., sheet flow or channelized flow) and topography (i.e., gradient and elevation differential) should support the use of a particular BMP type at a specific location.
8. The BMP device should be able to be sited within the highway right-of-way (ROW) clear recovery zone or within a highway-related facility (i.e., maintenance station or park-and-ride lot) so that it is in compliance with the safety requirements of the Highway Design Manual (HDM).
9. The BMP device must meet the drainage design criteria of the HDM. The device should accommodate flow up to and including the design flow rate without flooding.
10. The BMP device should be designed and sited such that stormwater flows greater than the design flows for the BMP will be routed around or through the device in a way that avoids damage (e.g., erosion) and/or flushing of pollutants already trapped within the device. This may be accomplished through an off- line design or by other structural design features incorporated into the BMP.
11. The BMP device should provide for the significant removal of target constituents of concern based on the influent concentrations typically encountered in runoff from highway ROW areas or highway-related facilities and pollutant mass loading reductions and concentration decreases as given in this report.
12. The siting, design, and operation of a BMP device should not produce any significant adverse environmental impacts.
1.12 Retrofit Pilot Program Accomplishments
The retrofit pilot program is thought to be the most comprehensive test of common stormwater management BMPs ever conducted, and the first significant evaluation in a climate of southern California's type. The program succeeded in demonstrating the effectiveness of several BMP types in controlling effluent pollutant concentrations and mass loadings. The results generally are consistent with the performance of these devices measured in previous studies. The knowledge produced on the relative effectiveness and cost of the BMP options in southern California furnishes a basis for applying the Permanent Injunction's provision on BMP selection.
The program further yielded substantial information on the technical feasibility of the BMPs as retrofits in highway and support facility settings. The team conducting the program surmounted a number of challenges to constructability and operability, particularly in reducing mosquito vector risks, by revisions in design and operations.
While the retrofit pilot program was designed to meet the terms of a court order to a California transportation agency, its findings have much broader application. They

BMP Retrofit Pilot Program Final Report
January 2004
1-25
showed that performance expectations derived elsewhere are similar in this differing climate, The experience gained here in the linear, relatively constrained highway environment as well as in related support facilities, can also be utilized by other transportation agencies at state and local levels, as well as other jurisdictions dealing with stormwater runoff and non-point source (NPS) pollution.

BMP Retrofit Pilot Program Final Report
January 2004
2-1
2 SAND FILTERS
2.1 Siting
Seven sand filters were sited and constructed for this study, four in District 7 and three in District 11. Of these, six were “Austin” style sand filters and one was a “Delaware” sand filter (located in District 11). One of the Austin-style sand filters was constructed at the Paxton Park-and-Ride, but was not monitored and that site is excluded from the following discussion.
Several siting criteria that are similar for both types of filters were considered in order to maximize the effectiveness of these devices. The most important consideration was the extent to which runoff from bare soil would be able to enter the filter. The biggest threat to the long-term successful operation of filtration BMPs is the introduction of excessive amounts of sediment that cause premature clogging of the filter media. For this reason, site selection was limited to relatively small, highly impervious watersheds such as park-and-ride (P&R) lots and maintenance stations (MS). It was also verified that there were no construction activities up-gradient from the selected filter sites. The characteristics of the contributing watersheds for the selected sites are shown in Table 2-1.
These facilities need enough head to operate hydraulically – a minimum of about 1 m. The available head between the inlet and outlet must exceed the depth of the sedimentation basin, depth of water over the filter, the filter media, and the underdrain system. All of the sites in District 7 lacked sufficient head, and pumps were installed to return the treated discharge to the existing drainage system. All the systems in District 11 were successfully designed to use gravity flow.
Table 2-1 Summary of Contributing Watershed Characteristics for Sand Filters
Site Location Filter Type Watershed Area Hectare
Impervious Cover %
Eastern Regional MS Austin 0.6 90
Foothill MS Austin 0.7 100
Termination P&R Austin 1.1 90
La Costa P&R Austin 1.1 56
SR-78/I-5 P&R Austin 0.3 80
Escondido MS Delaware 0.3 85

BMP Retrofit Pilot Program Final Report
January 2004
2-2
2.2 Design
The Austin design (Figure 2-1 and Figure 2-2) has an open-air filter and a separate sedimentation basin. A concrete wall separates the sedimentation basin and the filter chamber. This is one of two designs approved by the City of Austin and is known there as “full sedimentation.” Runoff from the sedimentation basin enters a perforated riser that transfers the runoff to the filter chamber. An orifice plate on the outlet of the riser was sized so that the sedimentation basin would completely drain from basin-full condition in 24 hours. A level spreader was provided in the filter basins to distribute runoff evenly over the 450 mm deep sandbed. Guidelines developed by the City of Austin (1988) for filter configuration were used in the facility designs.
The Delaware unit (Figure 2-3 and Figure 2-4) operates along the curbside edge of paved areas and parking lots and requires the least area for installation among the various sand filter types. The device consists of separate sedimentation and filter chambers, but differs from the Austin design in that a permanent pool is maintained in the sedimentation chamber. Ideally, runoff enters the sedimentation chamber as surface flow. However, to increase the amount of area treated by the device at the Escondido MS, a storm drain system was used to collect the runoff, which was then introduced at one end of the sedimentation chamber.
As runoff enters the sedimentation chamber, water remaining in the device from previous storms is displaced and flows over a weir into the sand filter chamber. The Delaware unit was designed and installed according to the guidelines described by Young et al. (1996), except the depth of sand was 300 mm rather than 450 mm. It should be noted that according to these guidelines, there is only storage in the unit for 5 mm of runoff; consequently, if a larger water quality volume is to be treated using this design, the unit must act as a flow-through device. Design characteristics for all of the sand filters are shown in Table 2-2.
2.3 Construction
The lessons learned during the construction of sand filters centered on material availability for the filter, excavation during filter construction, unknown field conditions, and interface with existing activities at the sites. The filters were all constructed in maintenance stations or park-and-ride facilities that provided a limited work area and the requirement to coordinate with normal facility operations.

BMP Retrofit Pilot Program Final Report
January 2004
2-3
Figure 2-1 Schematic of an Austin Sand Filter
Figure 2-2 I-5/SR-78 Austin Sand Filter

BMP Retrofit Pilot Program Final Report
January 2004
2-4
Figure 2-3 Schematic of a Delaware Sand Filter (Young et al., 1996)
Figure 2-4 Escondido MS Delaware Sand Filter

BMP Retrofit Pilot Program Final Report
January 2004
2-5
Table 2-2 Design Characteristics of the Sand Filters
Site Location Design Storm mm
WQV m3
Sedimentation Basin Area
m2
Filter Basin Area m2
Eastern Regional MS 25 115 54 27
Foothill MS 25 217 102 40
Termination P&R 25 222 114 57
La Costa P&R 36 286 180 72
78/I-5 P&R 38 106 56 32
Escondido MS 48 12.2 (120)a 27 27
a The volume of water treated at Escondido MS is 120 m3 during the design storm. The Delaware design specifications require the filter design volume to be 38 m3/ha of tributary area. Therefore, the sedimentation basin at Escondido is designed to capture 12.2 m3 of water; but during the design storm, 120 m3 of water flows through the device.
2.3.1 Material Availability
There was some confusion among the design and construction personne l regarding the sand specifications for the filters. The engineers and contractors initially interpreted the Austin guidelines incorrectly as requiring a special gradation that was not available locally. The intent of the Austin guidelines is to require an aggregate appropriate for making concrete as specified in ASTM C-33. The project engineers substituted a standard locally available sand mix that was in keeping with the intent of the Austin guidelines.
2.3.2 Excavation and Unknown Field Conditions
Problems with excavation for the sand filters included structurally unsuitable soils, buried manmade objects and interference with existing utilities. Structurally unsuitable soils require over-excavation to provide a suitable subgrade for construction. Detailed geotechnical investigation prior to construction (soil borings) can usually identify this condition. Buried manmade objects (broken concrete) were also encountered; the presence of these also can be detected through comprehensive subsurface investigation. Unknown utilities were encountered during excavation at four of the seven sand filter pilot sites. At two locations, the existing storm drain system location did not match that shown on the as-built drawings. Some of the problems encountered during excavation were magnified due to the large, deep design of the sedimentation basin and sand filter necessitated by the required water quality volume, the need to intercept pre-existing storm drains, and the desire to minimize the footprint of the device.

BMP Retrofit Pilot Program Final Report
January 2004
2-6
2.3.3 Interface with Existing Activities
Retrofit of sand filters at maintenance stations and park-and-ride lots impacts the operation of the facility during construction operations. The contractor has a limited lay-down area, and must coordinate with the activities at the maintenance station or in the case of the park-and-ride lots, must temporarily restrict use to portions of the lot. Environmental factors may influence construction start time. For example, a least tern nesting site delayed by several weeks the construction start up at one retrofit location.
2.4 Maintenance
At the beginning of the study, sand filters were generally assumed to have greater maintenance requirements than many other types of stormwater treatment facilities. Major maintenance items include removal of sediment from the sedimentation basin when the accumulation exceeds 300 mm and removal of the uppermost layer (50 mm) of the sand bed when the drain time exceeds 48 hours. Sediment removal was not required during the course of the study. After three wet seasons total accumulated sediment depth was less than 25 mm. This indicates that sediment removal may not be required for as many as 10 years or more at these sand filters. Maintenance of the sand bed may be required every 3 to 5 years as described below.
Removal of the top 50 mm of sand was required in the third year at the Delaware filter and the three Austin filters in District 7. According to the maintenance plan, after successive removal of 50 mm of sand lowers the thickness to 300 mm, new sand is installed to restore the depth to 450 mm. Because the Delaware was initially constructed with a sand depth of 300 mm, the removed sand is immediately replaced to maintain a thickness of 300 mm.
The condition of the sand bed varied strikingly between sites. For instance, at the Foothill, Eastern, Termination and Escondido Maintenance Stations, a stiff crust formed on the surface of the sand after about 2 years of operation, while runoff never completely covered the sand at the La Costa Park-and-Ride after 3 years of operation. The Delaware filter had the smallest filter area relative to the tributary area of any of the sand filters, so it is not surprising that this facility experienced clogging; however, the filter areas at the other three District 7 sites were roughly similar to those in District 11.
One potentially significant difference is that all of the Austin filters that clogged incorporated pumps in their design. Repeated problems with pump operation resulted in standing water on the filter bed for extended periods that may have contributed to the clogging by allowing sufficient time for biological growth on the surface of the filter. In all filters, clogging appeared to be due to cementing of the top layer of sand rather than to a distinct accumulation of sediment on the surface. These data indicate that the interval between sand rejuvenation may be site-specific and a function of the runoff quality (loading rate) or operational characteristics of the filter, so that no general guidance for appropriate interval can be developed. Regular inspections are needed to indicate when filter rejuvenation should occur.

BMP Retrofit Pilot Program Final Report
January 2004
2-7
Weekly inspections for trash accumulation and the presence of endangered or threatened species were conducted during the wet season. Because of the proximity of the La Costa sand filter to endangered species nesting areas, plastic netting was placed over the filtration chamber to prevent entrance by these species. Monthly inspections were also conducted to identify damage to inlet and outlet structures, emergence of woody vegetation, and evidence of graffiti or vandalism.
An average of only about 51 hr/yr were required for field activities based on data from 2000 and 2001, not including vector control activities. The Austin and Delaware designs did not have significantly different maintenance needs during the period of record and the hours from the two types of devices have been combined for this analysis. The incorporation of a permanent pool in the Delaware design increased the amount of vector control required at the site, compared to other sand filters that drained fully.
As shown in Figure 2-5, pump replacement and maintenance account for the largest field activity, followed by inspections, media maintenance, and structural repair. The large proportion of operation and maintenance time spent on pump-related problems indicates that designs utilizing gravity flow are preferred.
The number of inspections and time spent reflect the requirements of the MID, which specified weekly inspections during the wet season. Minor structural repairs are commonly required to repair defects such as cracks that form in the structure; however, the majority of hours assigned to this category were associated with filling a subsiding area near the perimeter of the Eastern MS site. Dewatering was required to eliminate standing water that collected in the level spreader (Austin type) in the filtration chamber and which provided a breeding site for mosquitoes.
Maintenance at all of the Austin sand filter sites was hampered by the lack of adequate access. Although each basin was fitted with a rung-type ladder to allow maintenance personnel access, these were not sufficient for equipment access for major maintenance activities. Access ramps could be included in the design of the filters where sufficient space is available. Limiting the depth of the basins would also provide better access.

BMP Retrofit Pilot Program Final Report
January 2004
2-8
Figure 2-5 Field Maintenance Activities at Sand Filter Sites (1999-2001)
2.5 Performance
2.5.1 Chemical Monitoring
Since all of the Austin filters were designed using the same guidelines, the data for all sites have been treated as if it came from a single site. It should be noted, however, that there are statistically significant differences in the mean TSS concentration in the effluent of the Austin sand filters. These differences were not large, ranging from about 4 mg/L to 11 mg/L, and the ability to detect the differences is mainly a result of the extremely consistent TSS concentration in the effluent. For most constituents, the differences among the sites were not significant; so grouping the data together is an appropriate way to estimate the average performance that might be expected from a large number of facilities.
There were substantial differences in the measured influent and effluent volumes, especially at sites that incorporated pumps in their design, such as the Termination Park-and-Ride location. This was due at least in part to the lack of a check valve in the effluent piping, allowing some of the treated runoff to flow back into the sump. For the purpose of calculating performance, it was assumed that the effluent volume equals the influent

BMP Retrofit Pilot Program Final Report
January 2004
2-9
volume, since all of the sand filters are constructed of concrete (i.e., there are no significant infiltration or evaporation losses). Therefore, all constituent mass reduction is the result of reduction in concentration between the treated and untreated runoff.
The data collected dur ing the first year of monitoring at the Delaware sand filter site was not used in the calculations, since the facility was a net exporter of many constituents during that time. It appeared that the sand used at that site was not as well washed as at the Austin sites, and by the second year, performance had improved dramatically. Consequently, it is recommended that the specifications in Caltrans standard specification for fine aggregate (90-2.02 and 90-3), which limits the amount of fine materials in the sand be followed. It is similar to the ASTM C-33 specification, with the addition of a washing requirement, which further limits fines.
The average influent and effluent concentrations and the percent reduction shown in Tables 2-3 and 2-4 were calculated using the methodology described in the introductory chapter for constituents with a log-normal distribution. The column titled “Significance” is the probability that the influent and effluent concentrations are not significantly different, based on a one-way ANOVA. Constituent removal was generally very good, except for nutrients, particularly nitrate. The concentrations of this constituent increased in both types of sand filters. Nevertheless, the data indicate that modest removal of total nitrogen does occur. The results for nitrate and other constituents are similar to those reported in studies from the Austin area (Glick et al., 1998). A comparison of removal efficiencies of selected constituents for the two types of filters indicates that despite the overall similarity there are some substantial differences in performance.
The estimate of a percent reduction to characterize the pollutant removal of a device implies a functional relationship between influent and effluent quality and assumes that the effluent quality from a site with different runoff characteristics can be estimated from the percent reduction observed at these sites. This is not the case for TSS and most other particle-associated constituents. This can be demonstrated by plotting the influent versus effluent concentration for TSS and dissolved copper for the Austin sand filters as shown in Figure 2-6 and Figure 2-7.
The data in Figure 2-6 indicate that rather than being a fraction of the influent concentration, the effluent concentration of TSS is constant with an average value of about 7 mg/L. This is an important distinction if these data will be used to estimate effluent quality from sand filters installed at other sites or for estimating compliance with water quality standards for storms with high concentrations of TSS.

BMP Retrofit Pilot Program Final Report
January 2004
2-10
Table 2-3 Concentration Reduction of Austin Sand Filters
Mean EMC
Constituent Influent
mg/L Effluent
mg/L
Removal %
Significance P
Concentration Reduction
Previous Work (Glick et al.,
1998) TSS 88 8.6 90 <0.000 89
NO3-N 0.660 1.10 -67 0.009 -76
TKN 3.120 1.48 53 0.002 50
Total Na 3.780 2.58 32 - 17
Ortho-phosphate
0.180 0.14 24 0.376 NA
Phosphorus 0.410 0.25 39 0.003 59
Total Cu 0.021 0.010 50 <0.000 72
Total Pb 0.020 0.003 87 <0.000 86
Total Zn 0.236 0.047 80 <0.000 76
Dissolved Cu 0.009 0.008 7 0.645 NA
Dissolved Pb 0.002 0.001b 40 0.001 NA
Dissolved Zn 0.094 0.036 61 <0.000 NA
TPH-Oilc 1.300 0.9 31 0.271 NA
TPH-Gasolinec 0.100 b 0.1 b - - NA
TPH-Dieselc 0.900 0.7 22 0.171 NA
Fecal Coliformc 5,800 MPN/100mL
1,600 MPN/100mL
72 0.190 NA
a Sum of NO3-N and TKN b Equals value of reporting limit c TPH and Coliform are collected by grab method and may not accurately reflect removal

BMP Retrofit Pilot Program Final Report
January 2004
2-11
Table 2-4 Concentration Reduction of the Delaware Sand Filter
Mean EMC Constituent
Influent mg/L
Effluent mg/L
Removal, %
Significance P
TSS 102 19 81 <0.000
NO3-N 0.35 0.84 -142 0.016
TKN 1.91 1.22 36 0.059
Total Na 2.26 2.06 9 -
Ortho-Phosphate 0.08 0.07 11 0.780 Phosphorus 0.37 0.21 44 0.049 Total Cu 0.021 0.007 66 0.003 Total Pb 0.015 0.002 85 0.062 Total Zn 0.429 0.033 92 <0.000 Dissolved Cu 0.007 0.004 40 0.124 Dissolved Pb 0.002 0.001b 31 0.099 Dissolved Zn 0.215 0.012 94 <0.000 TPH-Oilc
2.20 1.00 55 0.186 TPH-Gasolinec
0.05 b 0.05 b - - TPH-Dieselc 1.5 0.8 47 0.399 Fecal Coliformc 5,800
MPN/100mL 1,200
MPN/100mL 79 0.435
a Sum of NO3-N and TKN b Equals value of reporting limit c TPH and Coliform are collected by grab method and may not accurately reflect removal

BMP Retrofit Pilot Program Final Report
January 2004
2-12
y = 0.01x + 7.4R2 = 0.0037
0
50
100
150
200
250
300
350
400
0 50 100 150 200 250 300 350 400 450TSS Influent (mg/L)
TS
S E
fflu
ent
(mg
/L)
Figure 2-6 Influent and Effluent Concentration Relationship of TSS for all Austin Sand Filters
y = 0.76x + 1.61R2 = 0.5974
0
5
10
15
20
25
30
35
0 5 10 15 20 25 30
Dissolved Cu Influent (mg/L)
Dis
solv
ed C
u E
fflu
ent
(ug/
L)
Figure 2-7 Influent and Effluent Concentration Relationship of Dissolved Copper for all Austin Sand Filters

BMP Retrofit Pilot Program Final Report
January 2004
2-13
Conversely, dissolved copper does exhibit a linear relationship between influent and effluent quality as shown in Figure 2-7, so it is appropriate to represent performance as a function of influent quality. Based on previous studies, sand filters were not expected to produce substantial reductions in dissolved constituents; however, a significant reduction was observed when the influent concentration exceeded about 15 µg/L. The observed behavior for dissolved copper and other metals indicates that adsorption on the sand grains or accumulated sediment may be occurring. Alternatively, the dissolved and particulate phases may not be in equilibrium when the runoff enters the facility as a result of rapid changes in runoff pH (very low pH in rainfall, which is rapidly neutralized during the runoff process). Therefore, some of the dissolved phase may become associated with particles during the residence time within the sedimentation basin, facilitating removal by physical processes (i.e., settling and straining).
Tables 2-5 and 2-6 present the results of the regression analysis for the constituents in this study. Where a constant is shown, the effluent concentration is statistically independent of the influent concentration. If the effluent concentration is correlated with the influent concentration, that functional relationship is shown as the “Expected Concentration.” The last column in Tables 2-5 and 2-6 indicates the uncertainty of the estimate at the 90 percent confidence level. As suggested by Gilbert (1987), the mean and uncertainty for the constituents that are not a function of influent quality are calculated using non-transformed values because of the relatively low coefficient of variation. The uncertainty for constituents that exhibit a linear relationship is calculated according to the methodology specified by Wonnacott and Wonnacott (1990). Note that rather than predicting values for constituents measured as total and dissolved, these tables differentiate between dissolved and particulate (total minus dissolved) phases. This was done to clearly distinguish between the different relationships that might exist for dissolved and particulate constituents.
The top 50 mm of sand was replaced in the third year at the Delaware filter and the three Austin filters in District 7. All sand and collected material that accumulated in the sand bed was tested for hazardous materials prior to disposal. Testing found the sand material to be nonhazardous and therefore all material was disposed of at the landfill. Testing results can be found in Appendix F.
2.5.2 Empirical Observations
Empirical observations were recorded during and after storm events. The most striking observation for the Austin design was that very little of the filter bed was actually used during most events and at some sites even after 3 years of use, parts of the filter bed remained in their initial, pristine condition. Because of slight irregularities in the sand surface elevation, the discharge from the sedimentation basin would collect in the lower areas of the filter bed and infiltrate quickly enough that the water level would never rise high enough to cover the entire filter surface. This observation indicates that the permeability assumed in the City of Austin guidelines is very conservative and smaller filter areas may be adequate. Reducing the size of the filter area may, however, increase

BMP Retrofit Pilot Program Final Report
January 2004
2-14
maintenance frequency because the same amount of sediment will be deposited on a smaller filter area, possibly causing more rapid clogging of the media. Further investigation would be required to determine the impact of filter area on maintenance requirements.
Table 2-5 Predicted Effluent Concentrations - Austin Filter
Constituent Expected Concentration a Uncertainty, ±
TSS 7.8 1.2
NO3-N 0.93x + 0.37 ( ) 5.02
01.2467.0
641
86.0
−+
x
TKN 0.60x – 0.11 ( ) 5.02
36271.2
601
99.0
−+
x
Particulate P 0.07 0.02
Ortho-Phosphate 0.62x + 0.02 ( ) 5.02
74.118.0
331
14.0
−+
x
Particulate Cu 2.0 0.6
Particulate Pb 0.057x + 0.49 ( ) 5.02
946017
631
82.4
−+
x
Particulate Zn 11 3.1
Dissolved Cu 0.76x + 1.62 ( ) 5.02
21958.8
631
27.6
−+
x
Dissolved Pb 0.22x + 0.81 ( ) 5.02
1951.2
631
27.1
−+
x
Dissolved Zn 0.23x + 10.6 ( ) 5.02
910,29692
631
1.42
−+
x
a Concentrations in mg/L, except metals which are in µg/L. x = influent concentration of interest

BMP Retrofit Pilot Program Final Report
January 2004
2-15
Table 2-6 Predicted Effluent Concentrations - Delaware Filter
Constituent Expected Concentration a Uncertainty, ±
TSS 16.2 5.6
NO3-N 0.96x + 0.47 ( ) 5.02
93.034.0
131
96.0
−+
x
TKN 0.35x + 055 ( ) 5.02
69.986.1
131
38.1
−+
x
Particulate P 0.25 0.09
Ortho-Phosphate 0.5x + 0.03 ( ) 5.02
042.008.0
81
048.0
−+
x
Particulate Cu 3.0 1.1
Particulate Pb 0.14x – 0.35 ( ) 5.02
3087.11
121
97.1
−+
x
Particulate Zn 16.5 6.3
Dissolved Cu 0.52x + 0.53 ( ) 5.02
34081.6
131
09.3
−+
x
Dissolved Pb 1.0b 0.05
Dissolved Zn 0.054x + 1.0 ( ) 5.02
67096213
101
62.7
−+
x
a Concentrations in mg/L, except metals which are in µg/L b Equals value of reporting limit x = influent concentration of interest
A second observation was that the level spreader incorporated in the Austin filter designs does not perform any real function. Despite the presence of the spreader, runoff still tends to collect in the lowest part of the filter bed. In addition, the level spreaders retained water between storm events, raising concerns about potential mosquito breeding and increasing maintenance related to vector control at all of the sites. A better design would incorporate energy dissipation in front of the riser outlet to prevent scouring of the sand bed in lieu of the spreader.

BMP Retrofit Pilot Program Final Report
January 2004
2-16
One advantage of sand filters is the attenuation in peak runoff rates and the potential for mitigation of channel erosion downstream. Figure 2-8 compares the influent and effluent flow rates for the La Costa sand filter for a single event. The peak flow rate entering the facility is nearly 18 times larger that the peak discharge rate.
0
0.05
0.1
0.15
0.2
0.25
0.3
0.35
0.4
10/26/0012:00
10/27/000:00
10/27/0012:00
10/28/000:00
10/28/0012:00
10/29/000:00
10/29/0012:00
Flo
w (c
fs)
Influent Effluent
Figure 2-8 Comparison of Influent and Effluent Flow Rates at the La Costa Sand Filter
Table 2-7 shows the number of occurrences of mosquito breeding and number of abatement actions that were taken. This table highlights the disparity between the Los Angeles and San Diego areas in regard to abatement actions. In the Los Angeles area, breeding was observed a total of 16 times and abatement actions were carried out 14 times, while in the San Diego area, 66 breeding observations resulted in only one abatement action, reflecting the different policies in the two areas.
Different riser designs were used to transfer runoff from the sedimentation basin to the filter basin in Districts 7 and 11. In District 7, rate control was provided by limiting the number of perforations in the riser pipe and installing bags of gravel around the openings. This method did not seem to provide consistent flow control and periodically replacing the gravel bags, which deteriorated in the sun, increased maintenance. In District 11, the rate control was provided by affixing an orifice plate to the outlet of the riser. The riser

BMP Retrofit Pilot Program Final Report
January 2004
2-17
itself incorporated many regularly spaced perforations surrounded by a trash screen. This design seemed to provide more consistent flow control, less clogging, and had fewer maintenance requirements. One potential problem with this design is that the outlet riser entered at the chamber separation wall and the last few centimeters of water did not drain completely from the sedimentation basin. Increasing the slope of the sedimentation basin floor may help alleviate this situation.
Table 2-7 Incidences of Mosquito Breeding – Sand Filters
Number of Times District Site
Breeding Observed Abatement Performed
Eastern Regional MS 6 6
Foothill MS 2 2 7 (Los Angeles)
Termination P&R 8 6
La Costa P&R 32 1
SR-78/I-5 P&R 27 0 11 (San Diego)
Escondido MS 7 0
In the Delaware sand filter, water filled the pretreatment sediment chamber and on two occasions of heavy rain backed up into the inlet pipe. After periods of extended dryness, the filter drained slowly during the following storm.
2.6 Cost
2.6.1 Construction
Actual construction costs for the sand filters are shown in Table 2-8. The costs in District 11 were much less than those for District 7, because of differences in the design between the two districts. In District 7, all of the facility excavations were particularly deep in order to intercept existing storm drain systems or to reduce the device footprint at maintenance stations and park-and-ride lots where space was at a premium. Because of the depth, extensive shoring was required during the construction phase. In addition, pumps were required to return the treated runoff to the storm drain systems. In District 11, all of the devices were constructed to use gravity flow so that no pumping was necessary. In addition, the excavations were generally less, further reducing the cost.

BMP Retrofit Pilot Program Final Report
January 2004
2-18
Table 2-8 Actual Construction Costs for Sand Filters (1999 dollars)
District Site Actual Cost $
Actual Cost w/o Monitoring
$
Costa/WQV $/m3
Eastern Regional MS 353,702 342,660 2,979
Foothill MS 485,946 476,106 2,194 7 (Los Angeles)
Termination P&R 471,637 463,461 2,088
La Costa P&R 239,678 225,285 787
78/I-5 P&R 222,529 211,631 1,997 11 (San Diego)
Escondido MS 453,012 416,714 3,472 a Actual cost w/o monitoring.
SOURCE: Caltrans Cost Summary Report CTSW-RT-01-003.
Adjusted construction costs for the Austin and Delaware sand filters are presented in Table 2-9. The actual Austin sand filter costs were reduced to the values shown in Table 2-9 for the following reasons:
• The three Austin sand filters in District 7 were installed in areas where existing conditions did not allow for gravity drainage and space constraints required extensive shoring. Including the cost of pumps and shoring costs, due to limited space, between Districts 7 and 11 adds 45 percent to 67 percent above the adjusted construction cost, and these costs were excluded in the adjusted cost.
• Removal of existing storage bins at one location caused greater than usual clearing and grubbing cost. Including the original clearing and grubbing cost would increase the adjusted construction cost for that location by 20 percent. Instead, the average clearing and grubbing cost for similar BMPs was used for estimating the adjusted construction cost.
• Rebuilding storage bins at one location caused greater than usual facility restoration cost. Including the original facility restoration cost would increase the adjusted construction cost for that location by 15 percent. Instead, the average facility reconstruction cost for similar BMPs was used for estimating the adjusted construction cost.
• Costs attributed to miscellaneous site-specific factors would increase cost by up to 3 percent over the adjusted construction cost. These costs were excluded in the adjusted cost.

BMP Retrofit Pilot Program Final Report
January 2004
2-19
Table 2-9 Adjusted Construction Costs for Sand Filters (1999 dollars)
Sand Filter Adjusted Construction
Cost, $
Cost/WQV
$/m3
Austin Sand Filter
Mean (5) 242,799 1,447
High 314,346 2,118
Low 203,484 746
Delaware Sand Filter
One location 230,145 1,912
SOURCE: Adjusted Retrofit Construction Cost Tables, Appendix C.
The actual Delaware sand filter costs were reduced for the following reasons:
• The cost of the Delaware sand filter was adjusted because of contractor inexperience with the extensive cast-in-place construction. This change is estimated to increase cost by 64 percent above the adjusted construction cost. This cost was excluded in the adjusted cost.
• The Delaware type sand filter incurred additional cost due to the device being subject to heavy traffic loads, adding approximately $65,000 to the total cost. While this cost would be incurred in most situations, it could be avoided if the filter were located away from heavy traffic or shielded from such traffic with a barricade. Alternative non-traffic bearing covers used to cover the MCTT units were constructed for about $560/m2. Using non-traffic bearing covers would cost about $30,000, resulting in a $35,000 dollar savings. The cost for traffic bearing covers would increase cost by 15 percent over the adjusted construction cost. The cost of non-traffic bearing covers was used in lieu of traffic bearing in estimating the adjusted construction cost.
Delaware sand filters are useful in perimeter applications, although this requires that the design team address covering the structure to meet the requirements of the intended use of the retrofitted facility. In the Pilot Program this application was in a maintenance yard, thus requiring a cover that will allow vehicle loading over the structure. Maintenance of the structure during the monitoring was also addressed in the design and construction, requiring full access to the sand filter chamber. During construction, it was necessary to pay special attention to the layout, forming and concrete placement to meet the design parameters of the structure.

BMP Retrofit Pilot Program Final Report
January 2004
2-20
All sand filter installations were in park-and-ride lots or maintenance stations and subsequently did not incur traffic control costs. If sand filters are constructed roadside, they could incur traffic control cost typical of EDBs, in which traffic control accounted for an average of 9 percent of the adjusted construction cost. Traffic control costs were not used to estimate adjusted construction cost.
2.6.2 Operation and Maintenance
Table 2-10 shows the average annual operations and maintenance equipment and field hours experienced for each sand filter during the course of the study. The operation and maintenance hours were generally higher in District 7 due to numerous problems encountered with the pumps. Pumps had to be replaced during the study at both the Eastern MS and Termination P&R. In addition, Termination P&R had problems receiving enough power during the evening hours when park-and-ride lights were on, thus requiring more maintenance. Field hours include inspections, maintenance and vector control.
Table 2-10 Actual Operation and Maintenance Hours for Sand Filters
Average Annual District Site Equipment Hours Field Hours
Eastern Regional MS 2 128 Foothill MS 2 52
Termination P&R 1 187 7 (Los Angeles)
Average Value 2 122
La Costa P&R 0 70 78/I-5 P&R 0 58
Escondido MS 0 58 11 (San Diego)
Average Value 0 62
Termination P&R needed more maintenance than other District 7 sites, which were maintenance stations, because of greater accumulation of wind-blown debris and more work associated with pump maintenance. At the Eastern MS, the sand filter was found to be leaking during the 1998-1999 season, and additional integrity testing was performed during 1999-2000 to ensure proper functioning of the sand filter. At the La Costa P&R, the weep holes in the drain plugs routinely had to be cleared after storm events.
Table 2-11 presents the cost of the average annual requirements for operation and maintenance performed by consultants in accordance with earlier versions of the MID. The operation and maintenance efforts are based on the following task components: administration, inspection, maintenance, vector control, equipment use, and direct costs. Included in administration was office time required to support the operation and

BMP Retrofit Pilot Program Final Report
January 2004
2-21
maintenance of the BMP. Inspections include wet and dry season inspections and unscheduled inspections of the BMPs. Maintenance included time spent maintaining the BMPs for scheduled and unscheduled maintenance, vandalism, and acts of nature. Vector control included maintenance effort by the vector control districts and time required to perform vector prevention maintenance. Equipment time included the time equipment was allocated to the BMP for maintenance.
Table 2-11 Actual Average Annual Maintenance Effort – Sand Filters
Activity Labor Hours Equipment and Materials $
Inspections 12 0
Maintenance 40 40
Vector control* 41 0
Administration 65 0
Direct cost - 832
Total 158 $ 872
* Includes hours spent by consultant vector control activities and hours by Vector Control District for inspections
The hours shown above do not correspond to the effort that would routinely be required to operate a sand filter or reflect the lessons learned during the course of the study. Table 2-12 presents the expected maintenance costs that would be incurred under the final version of the MID (Version 17) for a sand filter serving about 2 ha, constructed following the recommendations in Section 2.7. A detailed breakdown of the hours associated with each maintenance activity is included in Appendix D.
Some of the estimated hours are higher than those documented during the study because certain activities, such as sediment removal, were not performed during the relatively short study period. Design refinements will eliminate the need for activities such as dewatering, pump maintenance, and vector control. Only four hours are shown for facility inspection, which is assumed to occur simultaneously with all other inspection requirements for that time period. This estimate also assumes that the facility is constructed of concrete and no vegetation maintenance is required. Labor hours have been converted to cost assuming a burdened hourly rate of $44 (see Appendix D for documentation). Equipment generally consists of a single truck for the crew, their tools, and disposal of material removed from the sand filter.

BMP Retrofit Pilot Program Final Report
January 2004
2-22
Table 2-12 Expected Annual Maintenance Costs for Final Version of MID – Sand Filter
Activity Labor Hours Equipment and Materials, $ Cost, $
Inspections 4 0 176
Maintenance 36 125 1,709
Vector control 0 0 0
Administration 3 0 132
Direct costs - 888 888
Total 43 $1,013 $2,905
2.7 Criteria, Specifications and Guidelines
The findings of this study show that sand filters are technically feasible depending on site specific conditions. However, there are several design and operational issues that warrant additional study. Future research on construction methods and materials for sand filters is needed to improve the cost/benefit ratio for these devices. In addition, evaluation of alternative media may allow the targeting of specific constituents or improvement in the performance for constituents, such as nitrate, which are not effectively removed by a sand medium. This section discusses various guidelines for the siting, design, construction and operation of sand filters derived from the experiences in this study.
2.7.1 Siting
The original siting criteria seem to have been generally successful at locating sand filters where they could operate effectively. Although there is concern about the effect of excessive sediment loading on filter life, the devices performed well when installed in maintenance yards where sediment and other debris collected from highways and roadsides are temporarily stored. The lack of sufficient head to drive these devices with gravity flow was overcome at some sites with the use of pumps. Due to a variety of problems, including power delivery issues, the pumps have not performed well. Based on the results of this study, the primary siting criteria that are recommended for future installations include the following:
• To avoid the use of pumps, sufficient hydraulic head should be available to operate filters by gravity flow (about 1 m), which may require modification of the existing drainage system.

BMP Retrofit Pilot Program Final Report
January 2004
2-23
• If construction is planned up-gradient of the proposed location, it should be completed before installation of the sand in the filter.
• Sand filters are most appropriate for sites with a relatively high level of imperviousness.
2.7.2 Design
Because these devices have limited implementation history in California, design engineers were unfamiliar with basin configuration, filter sizing and appropriate sand for the filter. Consequently, standard design details need to be developed for these devices so that engineers with limited experience can successfully incorporate them in future projects when desired. Design recommendations for the Austin filter in addition to the filter configuration and sizing guidance described in the City of Austin criteria (http://www.ci.austin.tx.us/watershed/regulation.htm) include:
• When possible, use standardized sand filter designs and prefabricated vaults, where a concrete vault is needed.
• Minimize basin depth to save excavation and shoring costs and to avoid the need for pumps.
• Use locally available sand specification that complies with Caltrans Standard Specifications for fine aggregate in Sections 90-2.02 and 90-3, which is generally equivalent to the requirements for fine aggregate contained in ASTM C-33.
• Include ramps into each basin to facilitate access where side slopes are steeper than 1:4 (V:H), with width appropriate for required maintenance equipment.
• Transfer water from the sedimentation basin to the filter basin by using a perforated riser surrounded by a trash rack with rate control provided by an orifice plate attached to the riser outlet. The outlet riser should enter at the floor of the sedimentation chamber rather than the wall to ensure that the chamber will completely drain between storm events.
• Provide energy dissipation (riprap or rock gabion) in front of the riser outlet to prevent scouring of the sand filter bed.
• Do not use level spreaders in the filter basin to distribute the runoff.
• Slope the sedimentation chamber floor toward the riser outlet for easier maintenance and improved draining.
• Cover the sand filter or add locations to attach netting to keep unwanted birds out of open sand filters if a problem is likely to occur during operation of the device.
There are other types of sand filter designs not tested in this study, such as earthen wall design, partial sedimentation design (combined sedimentation and filtration basin) and under-pavement configuration that may be more economical, less intrusive on workspace,

BMP Retrofit Pilot Program Final Report
January 2004
2-24
and acceptably fulfill other requirements. The Delaware-style filter appeared to operate effectively when designed according guidelines described by Young et al. (1996).
2.7.3 Construction
Determining the location of all utilities prior to construction may be difficult due to limited documentation of utility locations. It is suggested that a small (1–2 percent) contingency is provided in case unknown utilities are encountered. In addition, unsuitable material was encountered at many of the construction sites. Conducting sufficient borings before going out for bid may avoid the delays and expense of contract change orders associated with removal of this material.
2.7.4 Operation and Maintenance
Several factors contributed to the low maintenance requirements for the sand filters. The basins were constructed of concrete; consequently, no vegetation maintenance was required, and slope stability was not an issue as it was at other sites. Where there is a reason to restrict infiltration due to groundwater quality concerns another benefit of constructing the basin of concrete is that it eliminated the possible risk of groundwater contamination from runoff infiltrating through the basin inverts. Of course, the initial construction cost is significantly higher than it would be at a comparable site with earthen walls and floors. In areas with the potential for groundwater contamination, earthen basins can be lined with an impermeable membrane or compacted clay. Additional reduction in maintenance costs could be expected by eliminating the spreader ditch in the filtration basin and by not siting sand filters where pumping is required. Further research is recommended to investigate capital cost reduction strategies and potential performance enhancement through the use of alternate media.
Rainfall in southern California is much lower (about 250 mm/yr) than it is in the Austin area (about 800 mm/yr) where most of the previous research on sand filters has been conducted. Less runoff reduces the sediment load to the filter, since influent sediment concentrations are similar to those in Austin. Consequently, the interval between major maintenance activities would be expected to be as much as three times greater than that observed in Austin. However, major maintenance of the sand bed appears to be needed during the third wet season for many of the devices.
Based on the low level of maintenance required in this study, recommended future maintenance activities include:
• Perform inspections and maintenance as recommended in MID (Version 17) in Appendix D, including inspection for standing water, sediment, trash and debris.
• Schedule semiannual inspection for beginning and end of wet season to identify potential problems.
• Remove accumulated trash and debris in the sedimentation basin and from the riser pipe and bed during routine inspections.

BMP Retrofit Pilot Program Final Report
January 2004
2-25
• Inspect the facility once during the wet season after a large rain event to determine whether the facility is draining completely within 72 hours.
• Remove the top 50 mm of sand and dispose of sediment if facility drain time exceeds 72 hours. Restore media depth to 450 mm when overall media depth drops to 300 mm.
• Remove accumulated sediment in the sedimentation basin every 10 years or when the sediment occupies 10 percent of the basin volume, whichever occurs first.

BMP Retrofit Pilot Program Final Report
January 2004
3-1
3 EXTENDED DETENTION BASINS
3.1 Siting
Five extended detention basins (EDBs) were sited as part of this study, two sites in District 7 and three in District 11. All sites were located within the highway right-of-way and collected runoff exclusively from the highway.
Siting of extended detention basins was generally straightforward since adequate space and safety considerations were the primary constraints. Space constraints included room for the basin, topography to provide sufficient head to operate the outlet works, and sufficient area to allow for access by maintenance vehicles. Other siting criteria included safe maintenance ingress and egress routes. These devices have one of the lowest hydraulic head requirements for successful implementation. However, retrofitting the basins into the existing storm drain system where slopes were often very low occasionally produced basin bottom slopes that were less than optimum for good drainage (e.g., the I-15/SR-78 site). Where this happened, the facility was modified to create drainage that would comply with the criterion of fully emptying within 72 hours.
Primary siting criteria included:
• Sufficient space to provide a 9 m clear recovery zone for motorists (or installation of guardrail)
• Sufficient head to allow operation by gravity flow
According to previous guidance, tributary areas greater than 4 ha are generally preferred since there is a larger water volume to treat and this allows the use of larger discharge orifices in the basin outlet riser that are more resistant to clogging. Because of the integration of Caltrans and urban drainage systems and the generally linear nature of Caltrans facilities, very few locations with large drainage areas exist solely within Caltrans rights-of-way; however, during highway reconstruction drainage areas could be consolidated when hydraulically feasible to create larger catchments. In addition, as discussed later, the EDBs with tributary areas of less than 4 ha operated successfully without orifice clogging, making revision of previous guidance prudent.
As shown in Table 3-1 only one site with a drainage area of greater than 4 ha was identified in this pilot study; however, only 28 percent of that watershed was paved and therefore produced a relatively smaller water quality volume than would most highway catchments of that size. The best prospects for siting EDBs to serve large drainage areas entirely within highway rights-of-way are probably in interchanges.

BMP Retrofit Pilot Program Final Report
January 2004
3-2
Table 3-1 Summary of Contributing Watershed Characteristics for EDB
Site Location Watershed Area Hectare
Impervious Cover %
I-5/I-605 2.75 54
I-605/SR-91 0.40 100
I-5/SR-56 2.14 69
I-15/SR-78 5.42 28
I-5/Manchester 1.94 56
3.2 Design
The basic design criteria involved detention time, length/width ratio, and depth. Additional design criteria included side slope ratio, maintenance access, basin shape, inlet/outlet type, and in- line or off- line configuration. The study included a concrete-lined basin site (I-5/I-605). All other sites were unlined. This was done to compare the removal efficiencies and maintenance requirements of the two designs. Table 3-2 provides the specific criteria used to size each detention basin.
Table 3-2 Design Characteristics of the EDBs
Site Location Type Design Storm
mm
WQV m3
Design Storm Water Depth
m
Maximum Water Depth
m
Basin Material
Length- to-Width Ratio
I-5/I-605 Off-line 25 365 0.60 1.36 Concrete 4.5:1
I-605/SR-91 In-line 25 70 0.60 1.17 Earthen 9:1
I-5/SR-56 In-line 33 391 0.50 1.10 Earthen 6:1
I-15/SR-78 In-line 48 1,123 1.15 2.50 Earthen 10:1
I-5/Manchester Off-line 33 253 0.83 1.22 Earthen 3:1
The extended detention basins were designed for a full-basin (water quality volume) drawdown time of 72 hours.
Since most storms are much smaller than the design water quality storm, the goal was to produce a drawdown time of at least 24 hours for average conditions rather than full basin conditions. The primary objective for this specification was to provide adequate time for sediment deposition.
To enhance particle settling, the hydraulic flow length of the basin was extended by requiring a minimum length to width ratio of 3:1 for the basin, locating the inlets and outlets as far apart as possible. Relatively shallow depths in detention basins can

BMP Retrofit Pilot Program Final Report
January 2004
3-3
improve removal efficiencies, but there is potential for resuspension of settled material. Therefore, the water depths in the basin for the design storm were designed to be between 0.5 and 1.2 m. Incorporating long flow paths in the design may result in very low slopes in the basin resulting in poor drainage, such as occurred at the I-15/SR-78 site. Adding a concrete low flow channel when the slope is less than about 1 percent could help alleviate this problem.
Of concern is stabilization of basin side slopes to prevent erosion and contribution of additional sediment to the runoff. During this study, vegetation was not particularly effective for stabilizing slopes steeper than 1:4 (V:H). This was likely the result of poor soil conditions and inadequate moisture. In some instances, the side slopes were steeper, as in the I-5/I-605 and I-605/SR-91 basins, where the slopes adjacent to the freeway were 1:2 (V:H). Embankment slopes were compacted in an effort to prevent surficial erosion and ensure structural integrity.
Inlet structures for all basins except the I-5/I-605 were designed to dissipate flow energy at the inlet point in order to limit erosion and promote quiescent conditions in the basin. Riprap or concrete aprons were used to reduce the velocity and to distribute flows. Riprap energy dissipation at some sites had to be removed and replaced with a concrete apron to prevent mosquito breeding in water ponded continuously in the riprap. In addition, a riprap berm at the I-5/SR-56 site was used to increase the length-to-width ratio, but resulted in standing water between the rocks. A simple earthen berm could perform the same function and eliminate the ponded water. Sediment forebays common to EDB designs throughout the nation were not used in Caltrans designs due to the low sediment load expected from the highly impervious highway tributary areas.
District 11 sites used an outlet riser with the riser overflow height set at the 1 yr, 24 hr storage elevation. A screen was placed around the outlet riser to ensure that the orifices would not become clogged with debris. The basins used either a separate riser or broad crested weir for overflow of runoff for the 25 yr and greater year storms.
In District 7, a standpipe with orifices sized to discharge the water quality volume was used. The standpipe was surrounded by crushed rock to prevent trash and debris from clogging the orifices. The concrete outlet structure allows the 25 yr event to discharge via weir flow. An emergency spillway was provided at both District 7 sites to discharge runoff that exceeded the design storm.
The use of different outlet designs in Districts 7 and 11 allowed for comparison and evaluation of performance to determine the better choice. Figures 3-1 and 3-2 show the two types of outlet structures used. The District 11 screen type design is preferred since the outlet orifices can be visually inspected, and maintenance access is improved as compared to the District 7 riprap design.
The extended detention basins were designed to be either off- line or in- line. The off- line basins have an upstream weir at the diversion structure to divert flows greater than the design storm away from the basin to the storm drain system. The in- line basins receive

BMP Retrofit Pilot Program Final Report
January 2004
3-4
all storm runoff for the tributary area and have an overflow weir at the discharge structure to allow excess stormwater to flow through the basin while retaining the water quality volume for further settling. The decision to configure the basins as off- line or in- line was based on the existing storm drain configuration.
Figure 3-1 District 11 Outlet Riser
Figure 3-2 District 7 Outlet Riser
Figures 3-3 and 3-4 show an unlined basin and the concrete- lined basin, and a schematic diagram is presented in Figure 3-5. The I-5/SR-56 facility is located in District 11 and is an in- line basin. The I-5/I-605 EDB is located in District 7 and is an off- line basin.
3.3 Construction
The specific issues that occurred during construction of the EDBs centered on constructability, unknown field conditions, and coordination with concurrent construction projects.
3.3.1 Constructability
The two main issues related to the constructability of the extended detention basins were the delivery of specialized components, such as canal gates, and the precise elevation measurements required at some sites due to low site relief. Anticipating a long lead-time, many specialized items were ordered prior to the start of construction; however, they still

BMP Retrofit Pilot Program Final Report
January 2004
3-5
did not arrive on schedule. To minimize delays, it is suggested that the manufacturing time for construction materials be verified prior to specifying the product.
Figure 3-3 I-5/SR-56 Unlined Basin
Riprap berm was used to increase the flow length. Water stays pooled in berm and has caused mosquito problems.
Figure 3-4 I-5/I-605 Concrete Lined Basin
Some resuspension of sediments has occurred near inlet.

BMP Retrofit Pilot Program Final Report
January 2004
3-6
Figure 3-5 Schematic of Extended Detention Basin
Limited hydraulic head, precise tolerances are required. At the I-15/SR-78 EDB, small errors in measurement resulted in ponded water when the outlet structure was constructed at an elevation higher than shown on the plans. This situation was mitigated by two actions. The outlet structure was modified to lower the elevation by grinding the concrete in the structure, and a low-flow swale was graded in the basin.
Tire ruts and other irregular surface features downstream of the outlet of the I-5/I-605 site (in the maintenance road area) resulted in ponded water and mosquito breeding. Asphalt surfacing was installed in order to eliminate this problem.

BMP Retrofit Pilot Program Final Report
January 2004
3-7
3.3.2 Unknown Field Conditions
The largest impact on construction activities was the discovery of unsuitable material encountered during the excavation of the basins. For instance, large boulders and broken concrete that had been disposed at the I-15/SR-78 site were discovered during construction. The presence of the debris was not detected during the design geotechnical subsurface investigation (2 soil borings), and the cost of the change order to remove the debris exceeded the original contract cost. Similarly, trash and debris were encountered in the excavation at the I-5/Manchester site. An appropriate site evaluation performed during the siting and design phases of the project should alert designers to this problem and help prevent costly contract change orders. Better tracking of material disposal onsite and recording the locations on as-built plans may prevent these problems. In addition, discussion with local maintenance staff may reveal undocumented information on field conditions.
As in many of the other BMP sites, buried utilities were present and required relocation. For instance, construction of the I-5/SR-56 EDB required relocation of an electrical line owned by San Diego Gas and Electric, delaying the start of construction of the BMP.
3.3.3 Coordination
The main coordination issue encountered during construction of the extended detention basins was the need to include Caltrans traffic personnel early in the design process. For instance, during the final construction walk-through of the I-5/I-605 and I-605/SR-91 EDBs the need for metal beam guardrail along the roadway was identified because of the proximity of above-ground structures to the edge of the travel way. Additionally, an access road was needed around the I-5/I-605 site to increase the safety of maintenance vehicles exiting from the site and merging with freeway traffic.
3.4 Maintenance
The EDBs were maintained at a state-of-the-art level through a formal maintenance program that is described in the MID (see Appendix D). The sites were inspected monthly for general maintenance, including checking the inlet and outlet structures, side slopes and overall site for signs of erosion, woody vegetation, graffiti, and vandalism. Monthly inspections were also performed for indications of burrowing rodent activity that could endanger the structural integrity of the facility. The side slopes and invert were planted for erosion control, and coverage was assessed monthly. In addition, monthly and before every target storm for monitoring, the site was inspected for trash and debris accumulation in the inlet and outlet structures. Other maintenance items included inspection for vectors monthly and after every target storm.
To ensure that the EDBs met the required drain time of 72 hours for the design storm, each site was assessed after a design storm. The basins were inspected for vegetation coverage in October of every year to ensure 70 percent coverage; the sites were reseeded at this time if coverage did not meet the criteria. Sediment accumulation in the invert

BMP Retrofit Pilot Program Final Report
January 2004
3-8
was inspected and characterized (based on hazardous thresholds) on approximately June 1 of each year. During the wet season, the EDBs were inspected weekly for endangered and threatened species and species of special concern.
Figure 3-6 shows the average number of hours required to maintain the EDBs. An average of 72 hours was spent in the field completing inspections and maintenance at the sites, not including vector control agency hours. Hydroseeding of the basins and vegetation trimming and removal required the most hours, followed by site inspections. Vegetation maintenance was required at all sites including the concrete lined EDB at I-5/I-605. This site required vegetation maintenance around the perimeter of the site, with virtually no savings in maintenance time as compared to the unlined sites. The unlined basins failed to fully sustain vegetation and were hydroseeded each year of the study to reestablish vegetation as required in the earlier versions of the MID.
Figure 3-6 Field Maintenance Activities at EDBs (1999-2001)
The vast majority of maintenance activities at the extended detention basins were associated with plant establishment and management. Less time was required for activities related to collection of trash and debris, sediment removal or other items directly associated with EDB performance. Vector abatement was required periodically

BMP Retrofit Pilot Program Final Report
January 2004
3-9
at several of the sites; however, this maintenance item can be avoided with proper design to eliminate standing water in the facility structures.
A potentially major maintenance item for an extended detention basin is the removal of accumulated sediment; however, during the 3 years of monitoring, the total amount of accumulated sediment (average of all sites) was less than 20 mm throughout the basin, or less than 3 percent of basin volume. This suggests that sediment removal may not be necessary more than once every 10 years based on the criteria that removal should occur when the sediment occupies more than 10 percent of the basin volume.
The outlet structures in District 7 were surrounded with riprap that held small pools of water and had a greater tendency to collect debris that was not easily accessible. Also, maintenance inspections were difficult due to lack of visibility of the outlet orifice(s).
Vector breeding and abatement occurred primarily at two sites. The I-5/SR-56 basin contained a riprap berm and riprap energy dissipation at the inlet. Small pockets of water were held in the rock and did not dry up quickly, providing a breeding ground for mosquitoes. At the I-5/I-605 EDB, the outlet structure was designed with a sump that held a permanent pool of water and breeding was often observed. The sump was filled in at the site in February 2001, and there were no further observations of breeding. Table 3-3 shows the number of occurrences of mosquito breeding and number of abatement actions that were taken.
Table 3-3 Incidences of Mosquito Breeding - EDB
Number of Times District Site
Breeding Observed Abatement Performed
I-5/I-605 20 18 7 (Los Angeles)
I-605/SR-91 0 0
I-5/SR-56 51 4
I-15/SR-78 3 0 11 (San Diego)
I-5/Manchester 0 0
A potential maintenance concern at the beginning of the study was the establishment of wetland vegetation in the earthen basins. It was thought that the appearance of wetland plants or harborage of endangered species could result in maintenance constraints. However, consultation with regulators resulted in the agreement that basins would not be regulated as wetlands as long as they were operated as treatment systems and regular maintenance was provided. Of the four unlined basins, three had minimal vegetation for most of the year, mostly grasses. The I-605/SR-91 basin had the most complete coverage by vegetation, while the San Diego sites tended to have numerous bare spots, particularly
BMP Retrofit Pilot Program Final Report
January 2004
3-10
near the basin invert. Maintenance requirements were adequate to control nuisance vegetation.
3.5 Performance
3.5.1 Chemical Monitoring
Table 3-4 presents the average removal efficiencies for the constituents monitored during the pilot study at the unlined basins. The concentrations are the mean of the EMCs for the entire monitoring period. The column labeled “Significance” indicates the probability that the influent and effluent concentrations are not significantly different, based on an ANOVA. Load reductions shown in Table 3-5 are computed based on total estimated wet season influent and effluent runoff volumes for all four sites and the concentrations reported in Table 3-4. The EDBs were best at removing particulate constituents, while removal of nutrients and dissolved metals was comparatively modest and generally not statistically significant. Infiltration also accounted for some of the reduction in the constituent load in the effluent for the unlined basin sites. The data from the concrete lined I-5/I-605 site was analyzed separately because its performance was significantly worse than the other sites and no infiltration occurred.
Table 3-6 presents the concentration reduction for the concrete lined basin located at the I-5/I-605 site. Based on an ANOVA, none of the removals are statistically significant. All of the earthen basins had significantly better removal efficiencies than the concrete-lined basin. In four events at the lined basin, there was an export of suspended solids, which suggests that resuspension of particulates was occurring. The average TSS concentration reduction for the concrete lined basin was 40 percent, while the average for all other basins for TSS was 73 percent. The difference in load removed is even greater because of the infiltration that occurred in the unlined basins. Although the infiltration of stormwater is clearly beneficial to surface receiving waters, there is the potential for groundwater contamination, which was not evaluated in this study. No load reduction is shown for the I-5/I-605 basin since it is the same as the concentration reduction (no infiltration occurs in the concrete lined basin).
There were substantial differences in the amount of infiltration that occurred in the earthen basins. On average, approximately 40 percent of the runoff entering the unlined basins infiltrated and was not discharged. The percentage ranged from a high at the I-605/SR-91 basin of about 60 percent to a low at the I-5/SR-56 site of only about 8 percent. Soil and climatic conditions and local water table elevation are likely the principal causes of this difference. The I-5/SR-56 basin is located on the coast where humidity is higher and the basin invert is within a few meters of sea level. Conversely, the I-605/SR-91 is located well inland in Los Angeles County where the climate is much warmer and the humidity is less, resulting in lower soil moisture content in the basin floor at the beginning of storms. It should be noted that these infiltration volumes are rough estimates. On many occasions at certain sites the volume discharged was greater than the

BMP Retrofit Pilot Program Final Report
January 2004
3-11
measured influent volumes and adjustments were made to the volumes to resolve this physical impossibility.
Table 3-4 Concentration Reduction of Unlined EDBs
Mean EMC Constituent Influent
mg/L Effluent
mg/L
Removal %
Significance P
TSS 137 39 72 <0.000 NO3-N 1.06 0.98 8 0.529 TKN 2.24 1.85 17 0.206
Total Na 3.30 2.83 14 - Ortho-phosphate 0.11 0.14 -22 0.332 Particulate P 0.52 0.32 39 <0.000
Phosphorus 0.52 0.32 39 0.001 Total Cu 0.053 0.022 58 <0.000
Total Pb 0.087 0.024 72 <0.000 Total Zn 0.418 0.115 73 <0.000 Particulate Cu 0.041 0.010 76 <0.000 Particulate Pb 0.084 0.022 74 <0.000 Particulate Zn 0.347 0.055 84 <0.000
Dissolved Cu 0.012 0.012 0 0.899 Dissolved Pb 0.003 0.002 29 0.078 Dissolved Zn 0.071 0.060 16 0.279 TPH-Oil c 2.800 2.300 18 0.773 TPH-Diesel c 1.900 1.300 32 0.321
TPH-Gasoline c 0.050b 0.050b - - Fecal Coliform c 900 MPN/100mL 2000 MPN/100mL -122 0.607
a Sum of NO3-N and TKN b Equals value of reporting limit c TPH and Coliform are collected by grab method and may not accurately reflect removal

BMP Retrofit Pilot Program Final Report
January 2004
3-12
Table 3-5 Load Reduction of Unlined EDB
Load, kg/yr Constituent
Influent Effluent % Removal
TSS 1417 302 79
NO3-N 10.9 7.6 30
TKN 23.1 14.4 38
Total N 34.0 22.0 35
Ortho-phosphate 1.17 1.07 8
Particulate P 4.19 1.41 66
Phosphorus 5.36 2.48 54
Total Cu 0.551 0.176 68
Total Pb 0.898 0.189 79
Total Zn 4.317 0.892 79
Particulate Cu 0.422 0.078 82
Particulate Pb 0.863 0.171 80
Particulate Zn 3.581 0.425 88
Dissolved Cu 0.129 0.098 24
Dissolved Pb 0.035 0.019 46
Dissolved Zn 0.735 0.467 36

BMP Retrofit Pilot Program Final Report
January 2004
3-13
Table 3-6 Concentration Reduction of Concrete - Lined EDB
Mean EMC Constituent Influent
mg/L Effluent
mg/L
Removal %
Significance P
TSS 96 58 40 0.119 NO3-N 0.90 0.84 8 0.898 TKN 2.05 1.72 16 0.670 Total Na 2.96 2.56 14 - Ortho-phosphate 0.18 0.16 10 0.909 Particulate P 0.31 0.26 16 0.292
Phosphorus 0.49 0.42 15 0.426 Total Cu 0.025 0.018 27 0.247 Total Pb 0.049 0.035 30 0.174 Total Zn 0.221 0.103 54 0.119 Particulate Cu 0.016 0.008 50 0.832 Particulate Pb 0.060 0.027 55 0.513
Particulate Zn 0.153 0.053 65 0.127 Dissolved Cu 0.012 0.011 8 0.832 Dissolved Pb 0.007 0.004 42 0.382 Dissolved Zn 0.087 0.053 39 0.415 TPH-Oil b 0.900 0.800 11 0.739
TPH-Diesel b 1.100 1.100 0 0.981 TPH-Gasoline b 0.050c 0.050c - -
Fecal Coliform b 6700 MPN/100mL
7500 MPN/100mL -12 0.900
a Sum of NO3-N and TKN b TPH and Coliform are collected by grab method and may not accurately reflect removal c Equals value of reporting limit
The I-605/SR-91 facility performed the best of all the sites, having an average TSS load reduction efficiency of 85 percent. This was largely due to the greater infiltration that occurred at the site during small rainfall events. The Manchester site also had comparatively good constituent removal. Its average residence time was the longest of all the sites.
EDB removal efficiencies reported by Young et al. (1996) indicated sediment reduction (TSS) of 68 to 90 percent, total phosphorus reduction of 42 to 50 percent, total nitrogen reduction of 28 to 40 percent and total heavy metals reduction of 42 to 50 percent. This study found that the TSS and metals removals were within the ranges reported by Young et al. (1996). However, removal efficiencies for nitrogen and phosphorus were lower.

BMP Retrofit Pilot Program Final Report
January 2004
3-14
Table 3-7 shows the performance of each extended detention basin for TSS and total copper as representative examples. These detailed results are presented as an example to illustrate the variation in performance among the different sites. Note that the concentration reduction in the earthen basins for TSS is closely associated with influent concentration.
Table 3-7 Removal Efficiency of TSS and Total Cu for each EDB
TSS (mg/L) Total Cu, ug/L
Site Inf Eff
Conc. Reduction
%
Load Reduction
% Inf Eff
Conc. Reduction
%
Load Reduction
%
I-5/I-605 95.6 57.6 40 40 25.4 18.5 27 27
I-605/SR-91 83.0 32.7 61 85 38.5 24.6 36 76
I-5/SR-56 88.7 39.9 55 62 34.2 17.0 50 58
I-15/SR-78 186.9 48.3 74 80 57.2 20.2 65 73
I-5/Manchester 206.9 55.0 73 80 88.0 33.0 63 72
Many design guidelines for EDBs contain minimum requirements for length-to-width ratio of the basins. This requirement is normally predicated on the assumption that the basins are not well mixed and plug flow predominates at least some of the time. Figure 3-7 presents a comparison of average TSS concentration reduction and L:W ratio for the EDBs in this study. The basin with the shortest L:W ratio (Manchester) had substantially the same TSS removal as the basin with the largest ratio (I-5/SR-78). Consequently, there appears to be no significant advantage in designing basins with a ratio of greater than 3:1.
As with the other technologies, a linear regression analysis of influent and effluent concentrations was performed. Table 3-8 shows the expected concentration and the amount of uncertainty at the 90 percent confidence level for each constituent for both lined and unlined basins. The regression analysis was less effective at identifying an association between influent and effluent concentrations for the concrete lined basin. This was primarily the result of highly variable effluent quality at this site, with effluent concentrations higher than influent concentrations for a number of events. In addition, there were normally only about 13 data points for each constituent, while the other four sites combined had a total of about 55 points.

BMP Retrofit Pilot Program Final Report
January 2004
3-15
0%
20%
40%
60%
80%
100%
0:1 2:1 4:1 6:1 8:1 10:1 12:1
L:W Ratio
Co
nce
ntr
atio
n R
edu
ctio
n
Figure 3-7 TSS Concentration Reduction as a Function of Length-to-Width Ratio in EDBs
3.5.2 Empirical Observations
Accumulation of trash and debris on the outlet riser was generally not found to be a problem. Floatable materials tended to accumulate on the shore downwind of the prevailing breeze. This was especially evident at the I-5/SR-56 site, where trash accumulated in the apex of the basin, away from the outlet. Consequently, placing the maintenance road in this area could facilitate access to the accumulated trash. In addition, locating the outlet structure upwind could further reduce the likelihood of clogging.
In general, sediment accumulated over the entire invert at each site with some concentration near the inlet of each basin. Resuspension of particles at the inlet of the basins was observed on several occasions including: five of the 32 inspections at the I-5/ I-605 EDB, three of 32 inspections at the I-5/Manchester EDB and five of the 23 inspections at I-605/SR-91. At the I-5/I-605 basin, this was due to the lack of energy dissipation. There were very few occurrences of resuspension of particles near the basin outlets. At the I-5/I-605 basin, soil at the eastern slope near the freeway had eroded and accumulated in the EDB basin due to lack of vegetative cover.

BMP Retrofit Pilot Program Final Report
January 2004
3-16
Table 3-8 Predicted Effluent Concentrations – EDBs
Unlined EDB Lined EDB Constituent Expected
Conc a Uncertainty, ± Expected Conca Uncertainty, ±
TSS 0.11x+23.6 ( )5.02
498318139
551
9.30
−+
x 57.1 28.3
NO3-N 0.74x+0.19 ( ) 5.02
3506.1
571
77.0
−+
x 1.12x-0.16 ( )
5.02
72.893.0
131
45.0
−+
x
TKN 0.77x+0.20 ( )5.02
7821.2
581
67.1
−+
x 0.91x-0.15 ( )5.02
5211.2
131
79.0
−+
x
Particulate Phosphorus
0.10 0.03 0.15 0.11
Ortho-Phosphate
1.0x+0.02 ( ) 5.02
166.011.0
311
19.0
−+
x 0.16 0.09
Particulate Cu 0.105x+5.8 ( ) 5.02
5829338
561
69.9
−+
x 7.6 2.04
Particulate Pb 0.15x+10.4 ( )5.02
3799845.79
571
2.135
−+ x 0.48x+12.7 ( ) 5.02
1061338
131
8.23
−+
x
Particulate Zn 0.05x+38.7 ( ) 5.02
7672000340
571
5.66
−+
x 47.9 15.4
Dissolved Cu 0.91x+1.3 ( ) 5.02
23104.12
571
31.5
−+
x 1.14x-2.45 ( ) 5.02
98112
131
89.5
−+
x
Dissolved Pb 0.37x+1.18 ( )5.02
7394.3
571
97.2
−+
x 0.66x+0.30 ( ) 5.02
10255.7
131
38.9
−+
x
Dissolved Zn 0.57x+19.1 ( ) 5.02
19895668
571
1.44
−+
x 0.64x+5.26 ( ) 5.02
7353376
131
1.31
−+
x
a Concentrations in mg/L except for metals, which are in µg/L
x = influent concentration of interest

BMP Retrofit Pilot Program Final Report
January 2004
3-17
On two occasions at the I-5/SR-56 basin, water was observed to be short-circuiting through the riprap berm that was constructed to increase the effective length to width ratio of the basin. During two events at the same site (events with rainfall greater than 38 mm), water was observed discharging into the standpipe overflow weir.
At the District 11 sites with the riser pipe outlet design, water was found to discharge through the riser pipe boltholes. This flow had an impact on the detention time, given the small diameter of the orifices used. Figure 3-8 shows the residence time for various volumes at the Manchester EDB based on the difference between the centroids of the influent and effluent hydrographs. The theoretical residence times were calculated by routing a synthetic hydrograph through the basin. The measured residence times were substantially longer than the theoretical residence times except for small storms. This was typical at all the extended detention basin sites. Regardless, the drain time of 48 to 72 hours was met for most of these events.
There were very few observations of clogging of the orifices at any of the EDB sites. The smallest orifice used in the District 11 sites had a diameter of 25 mm (1 in). In District 7, the smallest orifice was at the I-605/SR-91 basin where the orifice at the basin invert and had a diameter of 13 mm (½ in). Consequently, EDBs can be successfully implemented in relatively small drainage areas (0.40 ha).
Residence Times
0
12
24
36
48
0 0.5 1 1.5 2 2.5StormVolume
WQV
Res
iden
ce (h
ou
rs)
Theoretical
Measured
Figure 3-8 Theoretical vs. Measured Residence Time at Manchester EDB
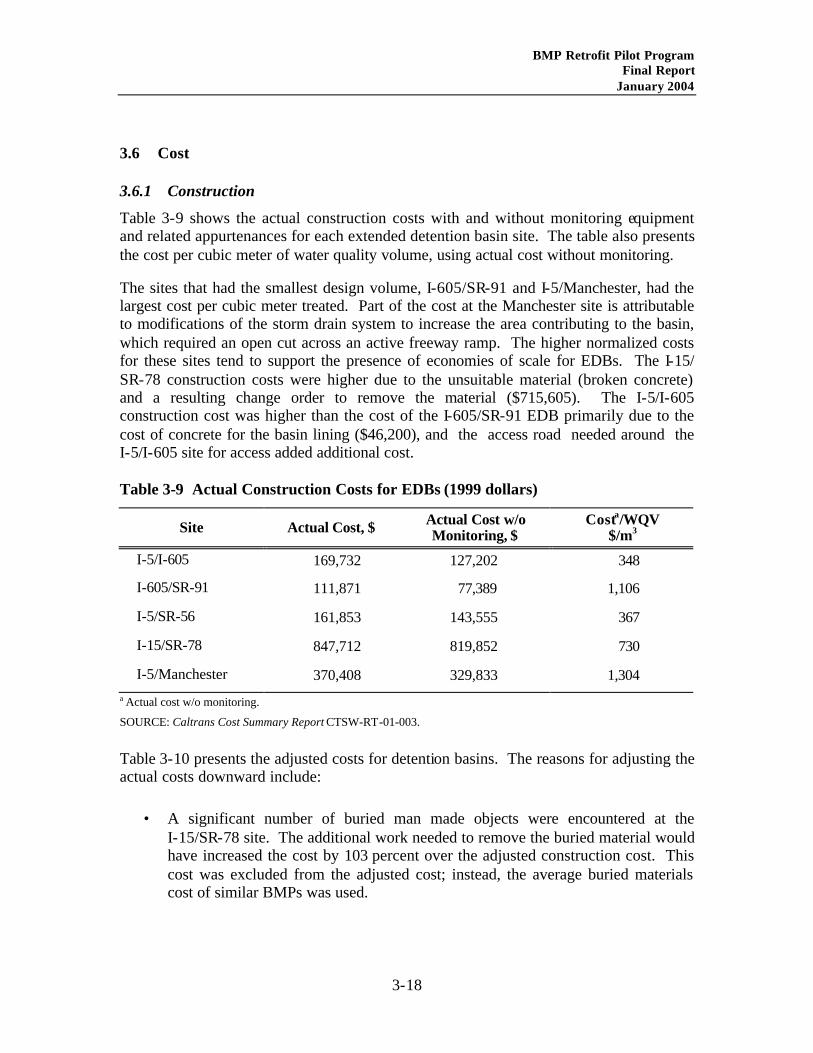
BMP Retrofit Pilot Program Final Report
January 2004
3-18
3.6 Cost
3.6.1 Construction
Table 3-9 shows the actual construction costs with and without monitoring equipment and related appurtenances for each extended detention basin site. The table also presents the cost per cubic meter of water quality volume, using actual cost without monitoring.
The sites that had the smallest design volume, I-605/SR-91 and I-5/Manchester, had the largest cost per cubic meter treated. Part of the cost at the Manchester site is attributable to modifications of the storm drain system to increase the area contributing to the basin, which required an open cut across an active freeway ramp. The higher normalized costs for these sites tend to support the presence of economies of scale for EDBs. The I-15/ SR-78 construction costs were higher due to the unsuitable material (broken concrete) and a resulting change order to remove the material ($715,605). The I-5/I-605 construction cost was higher than the cost of the I-605/SR-91 EDB primarily due to the cost of concrete for the basin lining ($46,200), and the access road needed around the I-5/I-605 site for access added additional cost.
Table 3-9 Actual Construction Costs for EDBs (1999 dollars)
Site Actual Cost, $ Actual Cost w/o Monitoring, $
Costa/WQV $/m3
I-5/I-605 169,732 127,202 348
I-605/SR-91 111,871 77,389 1,106
I-5/SR-56 161,853 143,555 367
I-15/SR-78 847,712 819,852 730
I-5/Manchester 370,408 329,833 1,304 a Actual cost w/o monitoring.
SOURCE: Caltrans Cost Summary Report CTSW-RT-01-003.
Table 3-10 presents the adjusted costs for detention basins. The reasons for adjusting the actual costs downward include:
• A significant number of buried man made objects were encountered at the I-15/SR-78 site. The additional work needed to remove the buried material would have increased the cost by 103 percent over the adjusted construction cost. This cost was excluded from the adjusted cost; instead, the average buried materials cost of similar BMPs was used.

BMP Retrofit Pilot Program Final Report
January 2004
3-19
• The I-5/I-605 location was constructed with a concrete liner. Including the cost of the liner would have increased the adjusted cost by 42 percent for that location. This cost was excluded from the adjusted cost.
• At the Manchester location, additional cost was incurred because the basin treated water from catchments on opposite sides of the basin and the runoff was diverted to a single influent point to minimize short-circuiting and to simplify influent for sampling. This resulted in greater than usual conveyance costs. Including the original conveyance cost would increase the adjusted construction cost for that location by 59 percent. The I-15/SR-78 location also incurred greater than usual conveyance cost, which would have increased the cost by 12 percent above the final adjusted cost. The original conveyance cost was not used to estimate the adjusted cost at either location; instead, the average conveyance cost of similar BMPs was used.
• Miscellaneous site-specific factors caused increased construction cost. This cost would have increased the adjusted cost by 8 percent at one location and 1 percent at another. These costs were excluded from the adjusted cost.
• At Manchester, higher than usual facility restoration costs were incurred due to an effort to establish trees. Including this cost would have increased the adjusted construction cost by 5 percent. This cost was excluded from the adjusted cost.
Table 3-10 Adjusted Construction Costs for EDBs (1999 dollars)
EDB Adjusted Construction Cost, $ Cost/WQV $/m3
Mean (5) 172,737 590
High 356,300 1,307
Low 91,035 303
SOURCE: Adjusted Retrofit Construction Cost Tables, Appendix C.
Most of the EDBs were located adjacent to freeways that provided access to the construction sites. Consequently, traffic control costs were a significant budget item, accounting for 9 percent of the total EDB adjusted construction cost.
3.6.2 Operation and Maintenance
Table 3-11 shows the average annual operation and maintenance hours for each EDB. The table also provides a breakdown of average annua l field labor hours and the average annual hours for equipment. Field hours include inspections, maintenance and vector control.

BMP Retrofit Pilot Program Final Report
January 2004
3-20
Table 3-11 Actual Operation and Maintenance Hours for EDBs
Average Annual District Site
Equipment Hours Field Hours
I-5/I-605 32 198 I-605/SR-91 10 149
7 (Los Angeles)
Average Value 21 174 I-5/SR-56 0 108 I-15/SR-78 0 74 I-5/Manchester 0 59
11 (San Diego)
Average Value 0 80
Table 3-12 presents the cost of the average annual requirements for operation and maintenance performed by consultants in accordance with earlier versions of the MID. The operation and maintenance efforts are comprised of the following task components: administration, inspection, maintenance, vector control, equipment use, and direct costs. Included in administration was office time required to support the operation and maintenance of the BMP. Inspections include wet and dry season inspections and unscheduled inspections of the BMPs. Maintenance included time spent maintaining the BMPs for scheduled and unscheduled maintenance, vandalism, and acts of nature. Vector control included maintenance effort by the vector control districts and time required to perform vector prevention maintenance. Equipment time included the time equipment was allocated to the BMP for maintenance.
Table 3-12 Actual Average Annual Maintenance Effort - EDB
Activity Labor Hours Equipment & Materials, $
Inspections 13 0
Maintenance 60 43
Vector control* 45 0
Administration 70 0
Direct cost - 915
Total 188 958
* Includes hours spent by consultant vector control activities and hours by Vector Control District for inspections

BMP Retrofit Pilot Program Final Report
January 2004
3-21
The hours shown above do not correspond to the effort that would routinely be required to operate an EDB nor do they reflect the design lessons learned during the course of the study. Table 3-13 presents the expected maintenance costs that would be incurred under the final version of the MID for an EDB serving about 2 ha, constructed following the recommendations in Section 3.7. A detailed breakdown of the hours associated with each maintenance activity is included in Appendix D.
Some of the estimated hours are higher than those documented during the study because certain activities, such as sediment removal, were not performed during the relatively short study period. Design refinements may eliminate the need for activities such as dewatering, and vector control. Only 4 hours are shown for facility inspection, which is assumed to occur simultaneously with all other inspection requirements for that time period. This estimate also assumes that the facility is an earthen basin and vegetation maintenance is required. Labor hours have been converted to cost assuming a burdened hourly rate of $44 (see Appendix D for documentation). Equipment generally consists of a single truck for the crew and their tools.
Table 3-13 Expected Annual Maintenance Costs for Final Version of MID – EDB
Activity Labor Hours Equipment and Materials, $ Cost, $
Inspections 4 7 183
Maintenance 49 126 2,282
Vector control 0 0 0
Administration 3 0 132
Materials - 535 535
Total 56 $668 $3,132
3.7 Criteria, Specifications and Guidelines
The extended detention basin technology has been previously researched and few additional research needs remain. This study found little correlation between length-to-width ratios from 3:1 to 10:1, and pollutant removal. Whether or not this performance would be achieved at lower ratios is unknown, and further work to explore this point may be warranted. If this specification could be relaxed, EDBs could be implemented at sites where a larger aspect ratio may be difficult to obtain.
Based on the results of this study, extended detention basins are considered technically feasible depending on site specific conditions.
BMP Retrofit Pilot Program Final Report
January 2004
3-22
This section discusses various guidelines for the siting, design, construction, operation and maintenance of EDBs. These guidelines are based on lessons learned through experience and observations during the project.
3.7.1 Siting
From the results of this study, the primary siting criteria recommended for future installations include the following:
• Provide adequate space for installation, maintenance activities, and safety considerations
• Contributing watershed area should be at least 2 ha to reduce fixed costs and minimize clogging potential of small orifices.
• An appropriate site evaluation should be done to identify unsuitable subsurface material and prevent costly contract change orders.
• Check for sufficient available hydraulic head to facilitate complete drainage after 72 hours and avoid ponding in the basin invert.
3.7.2 Design
Proper design of extended detention basins is imperative to improve performance, reduce maintenance, and reduce costs. Based on the observations and measurements in this study, the following guidelines are recommended:
• Locate, size, and shape EDBs relative to topography using terrain-fitting design to optimize use of available space and enhance appearance.
• Use earthen (unlined) basins where space is available and groundwater conditions permit because of their lower initial cost and better constituent remova l; however, additional evaluation is needed since there is appreciable infiltration in the basins and the potential impacts on groundwater quality are unknown.
• Use a 72 hr drain time and a minimum 3:1 length-to-width ratio to provide constituent removal comparable to that reported for the best performing detention basins in other studies.
• Use earthen basin side slopes of 1:4 (V:H) or flatter. Where steeper side slopes are unavoidable, consider other slope stability measures where vegetation is difficult to establish.
• Include energy dissipation in the inlet design for all basins to reduce resuspension of accumulated sediment. The preferred design is poured- in-place concrete using

BMP Retrofit Pilot Program Final Report
January 2004
3-23
a design that does not have a permanent sump to eliminate standing water and associated vector problems.
• Use an outlet design with an orifice in a riser, surrounded by a screen mesh for debris control. Seal all boltholes in the riser pipe and outlet structure to prevent flow from leaking out other openings.
• Design inlet, outlet, and basin so that no standing water is present after 72 hours. This requires a positive slope in the basin invert of about 1 percent minimum.
• For sites with minimal positive slope of the basin invert (<1 percent), incorporate a concrete low flow channel to reduce the potential for standing water.
• If the side slopes exceed 1:4 (V:H), incorporate a ramp in the design to facilitate access to the basin floor for maintenance activities.
• Develop standard details for BMP items. Because BMP details are not standardized, greater detail is required than for typical Caltrans plans.
• Minimize paved access road consistent with maintenance vehicle turnaround and DHS requirements.
• For locations adjacent to active roadways, seek out and place high priority on traffic engineer’s comments during design.
• Avoid above-ground structures near the roadway that will require a setback or guardrail protection.
3.7.3 Construction
Several issues arose during the construction of the detention basins, and lessons were learned on how to improve the construction. Listed below are guidelines that should improve the construction process:
• To minimize construction delays, verify manufacturing time for construction materials prior to specifying the product.
• Quality control is critical for drainage items with minimal slopes.
• Discuss with local maintenance staff to attempt to discern undocumented information on utility lines and other buried objects.
• Use a locally appropriate erosion control seed mix for the specific project and location.

BMP Retrofit Pilot Program Final Report
January 2004
3-24
3.7.4 Operation and Maintenance
Based on the level of maintenance required in this study, recommended future maintenance activities include:
• Perform inspections and maintenance as recommended in MID (Appendix D, Version 17), which includes inspection for standing water, slope stability, presence of burrows, sediment, trash and debris, and erosion control plantings.
• Observe drain time for the design storm after completion or modification of the facility to confirm that the desired drain time has been achieved. If necessary, modify the outlet orifice to achieve design values.
• Schedule semiannual inspection for the beginning and end of the wet season to identify potential operational problems.
• Remove accumulated trash and debris in the basin and around the riser pipe during the semiannual inspections. The frequency of this activity may be altered to meet specific site conditions.
• Trim vegetation at the beginning and end of the wet season and inspect monthly to prevent establishment of woody vegetation and for aesthetic and vector control reasons.
• Remove accumulated sediment and regrade about every 10 years or whenever the accumulated sediment volume exceeds 10 percent of the basin volume. Inspect the basin each year for accumulated sediment volume
• Follow maintenance plan in accordance with regulatory requirements to avoid the establishment of jurisdictional wetlands.

BMP Retrofit Pilot Program Final Report
January 2004
4-1
4 WET BASIN
4.1 Siting
One wet basin was sited in District 11 as part of this study. The site is located within the highway right-of-way and collects runoff from the northbound lanes of I-5. Siting requirements included:
• A high water table or other source of water to provide continuous baseflow
• A soil substrate ranging in texture from loam to clay
• Sufficient space for the basin, maintenance access, and a clear recovery zone
Table 4-1 summarizes the characteristics of the contributing watershed for the site selected. Identifying a location in southern California with perennial flow in the highway environment proved to be the most difficult criterion to meet. However, wetland vegetation can be sustained with interruption of baseflow for up to several months, meaning that sites receiving baseflow only during the wet season could be considered. The performance of this design alternative may differ substantially from that reported for the installation monitored in this study.
Table 4-1 Summary of Contributing Watershed Characteristics – Wet Basin
Site Location Watershed Area Hectare
Impervious Cover %
I-5/La Costa 1.7 48
Since the basin was constructed in sandy material rather than in the preferred substrate, an impermeable liner was included in the design to improve the water-holding capability of the basin and ensure continuous circulation through the basin. To install the liner, the basin was over-excavated by 0.5 m and the liner was installed along the bottom and side slopes. The liner met the following criteria:
• Thickness: minimum 0.76 mm PVC
• Specific gravity: 1.30 ± 0.03 by ASTM D 792
• Tensile strength: 15 to 21 MPa by ASTM D 882 and D 412
• % elongation: 200 by ASTM D 882 and D 412
• Minimum width: 1.8 m
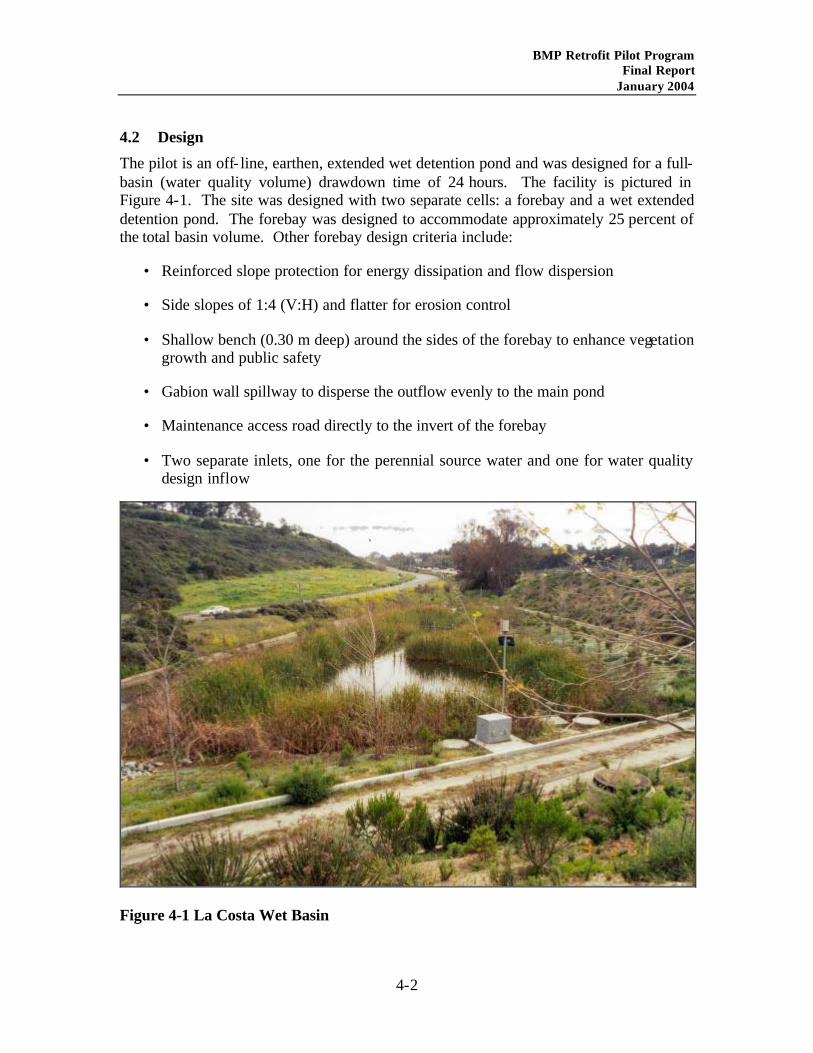
BMP Retrofit Pilot Program Final Report
January 2004
4-2
4.2 Design
The pilot is an off- line, earthen, extended wet detention pond and was designed for a full-basin (water quality volume) drawdown time of 24 hours. The facility is pictured in Figure 4-1. The site was designed with two separate cells: a forebay and a wet extended detention pond. The forebay was designed to accommodate approximately 25 percent of the total basin volume. Other forebay design criteria include:
• Reinforced slope protection for energy dissipation and flow dispersion
• Side slopes of 1:4 (V:H) and flatter for erosion control
• Shallow bench (0.30 m deep) around the sides of the forebay to enhance vegetation growth and public safety
• Gabion wall spillway to disperse the outflow evenly to the main pond
• Maintenance access road directly to the invert of the forebay
• Two separate inlets, one for the perennial source water and one for water quality design inflow
Figure 4-1 La Costa Wet Basin

BMP Retrofit Pilot Program Final Report
January 2004
4-3
The primary function of the wet basin is to create a potentially favorable environment for physical, biological, and chemical processes that reduce pollutants in stormwater runoff. Other elements incorporated into the current design include:
• A meandering flow path to increase residence time and provide a greater runoff- to-soil (and vegetation) interface;
• Side slopes of 1:3 (V:H) between the basin invert and the shallow bench for erosion control and increased wetted perimeter;
• A 1:6 (V:H) side slope around the sides of the wet basin to enhance vegetation growth and public safety and increase the littoral zone area;
• A diverse selection of plant species to enhance pollutant removal through filtration and biological uptake and degradation;
• Pond stocked with Gambusia affinis to minimize mosquito breeding;
• An expanded width near the outlet of the basin to further reduce velocity and trap finer sediment;
• Basin outlet designed to be submerged to prohibit floating material from discharging;
• A permanent pool volume equal to three times the water quality volume (see following discussion);
• An extended detention riser outlet designed to release the design storm over a period of 24 hours;
• A rock slope protected emergency overflow spillway at the maximum design water quality water surface; and
• A canal gate located in the water quality outlet structure to provide basin drainage; an additional canal gate was provided at the inlet structure to shut off the low flow for basin maintenance.
Inflow to the basin occurs at a single point, and treated runoff is discharged through a single orifice set at the permanent pool water surface elevation. A debris screen prevents the orifice from clogging. A canal gate at the basin invert is provided in the water quality outlet structure to drain the basin if the outlet orifice should clog. The weir of the water quality outlet structure riser was set at the 1 yr, 24 hr storage elevation. Surcharge from larger storms discharges over the rock slope protection spillway adjacent to the existing trapezoidal channel. Design characteristics for the basin are summarized in Table 4-2.

BMP Retrofit Pilot Program Final Report
January 2004
4-4
Table 4-2 Design Characteristics of the La Costa Wet Basin
Site Type Design Storm mm
WQV m3
Permanent Pool Volume
m3
Avg. Perm. Pool Depth
m
I-5/La Costa Off-line 34 259 777 0.7
Through agreement with the plaintiffs, a deviation was made from the original design guidelines for the volume calculations of the permanent pool as outlined in the project Scoping Study (RBF, 1998a). This deviation resulted from the realization that the site could support a larger wet basin than required in the Scoping Study and that the larger size would incorporate some of the terrain-fitting concepts that improve the aesthetics of the device. According to the original guidelines, the permanent pool volume should equal the water quality volume, which is then increased by a factor of 10 percent to accommodate reduction in the available storage volume due to deposition of solids in the time between full-scale maintenance activities. However, according to Young et al. (1996), a common requirement is that the permanent pool be three times the water quality volume. Since this requirement was larger, the permanent pool volume was designed using the larger volume to maximize constituent removal.
It should be noted that there are a wide variety of sizing recommendations for wet basins, some of which are shown in Table 4-3. These alternative guidelines would result in a smaller basin than that constructed at the La Costa site. Based on data from the National Urban Runoff Program (U.S. EPA, 1983), a smaller size may provide only slightly less pollutant removal than the design monitored here, while affording substantial cost savings. Additional research is needed to establish the relationship between permanent pool volume and pollutant removal, so that the most cost effective design can be identified.
Wet basin vegetation design consists of four planting zones, as shown in Figure 4-2. The designed water surface elevation affects zones 2 and 3, the shallow water bench and zone of periodic inundation, respectively. The shallow water bench was initially specified for vegetation planted in water depths of 150 to 300 mm. This zone was extended to the permanent pool water surface elevation. The zone of periodic inundation is the temporary water storage volume impounded between the permanent pool and the overflow weir (i.e., the water quality storage volume). Selection criteria for the plants included native species and those suitable for stormwater treatment.
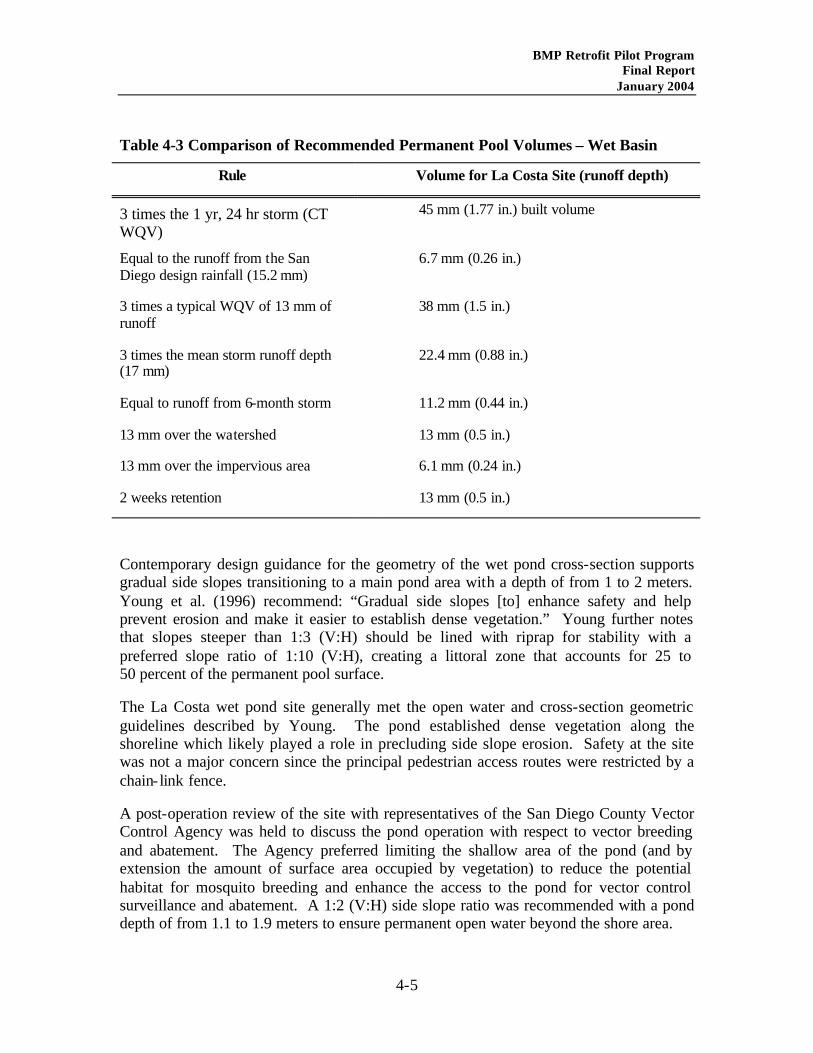
BMP Retrofit Pilot Program Final Report
January 2004
4-5
Table 4-3 Comparison of Recommended Permanent Pool Volumes – Wet Basin
Rule Volume for La Costa Site (runoff depth)
3 times the 1 yr, 24 hr storm (CT WQV)
45 mm (1.77 in.) built volume
Equal to the runoff from the San Diego design rainfall (15.2 mm)
6.7 mm (0.26 in.)
3 times a typical WQV of 13 mm of runoff
38 mm (1.5 in.)
3 times the mean storm runoff depth (17 mm)
22.4 mm (0.88 in.)
Equal to runoff from 6-month storm 11.2 mm (0.44 in.)
13 mm over the watershed 13 mm (0.5 in.)
13 mm over the impervious area 6.1 mm (0.24 in.)
2 weeks retention 13 mm (0.5 in.)
Contemporary design guidance for the geometry of the wet pond cross-section supports gradual side slopes transitioning to a main pond area with a depth of from 1 to 2 meters. Young et al. (1996) recommend: “Gradual side slopes [to] enhance safety and help prevent erosion and make it easier to establish dense vegetation.” Young further notes that slopes steeper than 1:3 (V:H) should be lined with riprap for stability with a preferred slope ratio of 1:10 (V:H), creating a littoral zone that accounts for 25 to 50 percent of the permanent pool surface.
The La Costa wet pond site generally met the open water and cross-section geometric guidelines described by Young. The pond established dense vegetation along the shoreline which likely played a role in precluding side slope erosion. Safety at the site was not a major concern since the principal pedestrian access routes were restricted by a chain- link fence.
A post-operation review of the site with representatives of the San Diego County Vector Control Agency was held to discuss the pond operation with respect to vector breeding and abatement. The Agency preferred limiting the shallow area of the pond (and by extension the amount of surface area occupied by vegetation) to reduce the potential habitat for mosquito breeding and enhance the access to the pond for vector control surveillance and abatement. A 1:2 (V:H) side slope ratio was recommended with a pond depth of from 1.1 to 1.9 meters to ensure permanent open water beyond the shore area.

BMP Retrofit Pilot Program Final Report
January 2004
4-6
In areas where pedestrian access is restricted or prohibited, steeper side slopes (1:2 (V:H)) may be a viable alternative. Erosion and bank sloughing concerns can likely be mitigated through the use of geotextiles. Vegetation density and surface area is expected to be reduced as compared to a pond developed using traditional design criteria. Reducing the quantity of vegetation may have a performance penalty since uptake will be reduced; however, sedimentation appears to be the primary removal mechanism for this BMP (Minton, 2002). Vegetation should still be periodically harvested to allow access for vector control personnel, to limit vector breeding opportunities and provide a mechanism for nutrient export rather than allowing the basin to fill with decaying organics.
Figure 4-2 Cross-Section of La Costa Wet Basin

BMP Retrofit Pilot Program Final Report
January 2004
4-7
4.3 Construction
The main issues during construction of the wet pond centered around constructability and unknown field conditions.
4.3.1 Constructability
The primary issues related to the constructability of the wet pond were the delivery of specialized components such as canal gates and flumes, and the installation of the impermeable pond liner. In anticipation of a long lead-time for delivery, many specialized items were ordered prior to the start of construction; however, they still did not arrive on schedule.
Construction of the pond liner proceeded without incident but required specialized experience and subgrade preparation. Groundwater was encountered during the excavation and was drained by gravity to the adjacent open channel. The subgrade surface was graded with extra care to ensure a smooth homogeneous surface to preclude damage to the impermeable liner. A specialty contractor installed the liner and supervised the backfill operation (cover over the liner) to ensure that liner integrity was maintained.
4.3.2 Unknown Field Conditions
There were essentially no issues related to unknown field conditions associated with the wet pond. Groundwater was expected during the excavation and was encountered. Dewatering was accomplished by gravity drainage to a settling pond, where the water was pumped to a BakerTM tank prior to being discharged to the adjacent creek. A small amount of pyrite in the groundwater that was encountered during the excavation was determined to be non-hazardous.
The plans were modified to include a retaining wall 1.2 m high and 15 m long during construction along the northeast access road. Field conditions did not allow construction of the slope as shown on the drawings (the slope would have been locally over-steepened, a condition that did not show on the base topography); consequently, the wall was constructed to maintain the pond footprint as designed.
4.4 Maintenance
The wet basin was maintained at a state-of-the-art level through a formal maintenance program that is described in the MID. The site was inspected monthly for:
• General maintenance, including checking the inlet and outlet structures, side slopes and overall site for signs of erosion, woody vegetation, graffiti, and vandalism

BMP Retrofit Pilot Program Final Report
January 2004
4-8
• Indications of burrowing rodent activity that could endanger the structural integrity of the site
• Accumulation of trash and debris in the inlet and outlet structures
• Presence of endangered and/or threatened species or species of special concern
• Presence of vectors
To ensure that the wet basin met the required drain time of 24 hours for the design storm, the site was assessed after every monitored storm. The basin was inspected annually in May for plant coverage and density in Zone 1 (Figure 4-2) to ensure efficacy of vector abatement and quarterly in Zone 2. Sediment accumulation in the invert was inspected and characterized (based on hazardous thresholds) on approximately June 1 of each year. There were no deviations from the MID.
Figure 4-3 shows the average number of hours required to maintain the wet basin. An average of 388 hr/yr, not including vector control agency hours, was spent in the field completing inspections and maintenance at the site, making this device the most maintenance intensive of any of those evaluated in this study. The most time-consuming activities, totaling more than 350 hr/yr, were those associated with vegetation management. These activities were prompted by concerns of the vector control agencies that the dense vegetation in the shallow water zones hampered the ability of the mosquito fish to adequately control all mosquito larvae; however, vegetation harvesting had the additional benefit of removing nutrients from the system. Less time was required for activities related to collection of trash and debris, sediment removal or other items directly associated with basin performance.
Table 4-4 shows the number of occurrences of mosquito breeding and number of abatement actions that were taken. Mosquito larvae were frequently observed in the basin despite the presence of mosquito fish, which were introduced as predators.

BMP Retrofit Pilot Program Final Report
January 2004
4-9
Figure 4-3 Field Maintenance Activities at Wet Basin (1999-2001)
Table 4-4 Incidences of Mosquito Breeding – Wet Basin
Number of Times Site
Breeding Observed Abatement Performed
I-5/La Costa 34 5
4.5 Performance
4.5.1 Chemical Monitoring
A summary of the wet weather water quality monitoring data is presented in Table 4-5, along with the probability that the average influent and effluent concentrations are not significantly different. The wet basin was best at removing particulate constituents including metals from stormwater, but was less effective at removing phosphorus, where the influent and effluent concentrations were not statistically different. TSS and total metals removals were the highest of any of the devices evaluated in this study. The reductions observed in this study exceed those reported by Winer (2000) for all

BMP Retrofit Pilot Program Final Report
January 2004
4-10
constituents except total phosphorus. The lower performance for this constituent is likely related to the relatively high concentrations of phosphorus present in the permanent pool at the start of storm events.
Grab samples were collected from the influent and effluent and analyzed for each constituent under ambient (baseflow) conditions during the wet season. The results are shown Table 4-6. The concentration of suspended solids was low, and there was no additional removal. There was a reduction of nitrate, but the concentration of TKN increased. The mean baseflow effluent concentration of nitrate may be misleading since the magnitude of the reported value is largely a function of the large variance of the individual sample values. The geometric mean of those same samples is only 1.17 mg/L, rather than the mean of 7.9 mg/L shown in Table 4-6. The reported value for nitrate also reduces the total nitrogen reduction for baseflow conditions substantially.
During dry weather, nitrate concentrations decreased, TKN increased and the total nitrogen decreased. The reduction in nitrate concentration was likely caused mainly by plant uptake. The TKN may have increased during dry weather as plants decayed and fell into the water, adding organic nitrogen. The TKN increase was relatively small in this system as compared to the nitrate decrease, resulting in a net decrease in total nitrogen (estimated as the sum of nitrate and TKN) during dry weather. On an average annual basis, most of the nutrient removal occurred during dry weather rather than during storm events. This is consistent with one of the principles for the operation of this type of wet pond design, which is to effectively store 75 percent of the storm runoff in the permanent pool for an indefinite period of time, allowing for uptake by the basin vegetation. Subsequent harvesting of the vegetation then removes these constituents from the system, thereby providing a pollutant removal mechanism as demonstrated by the overall nitrogen reduction observed.
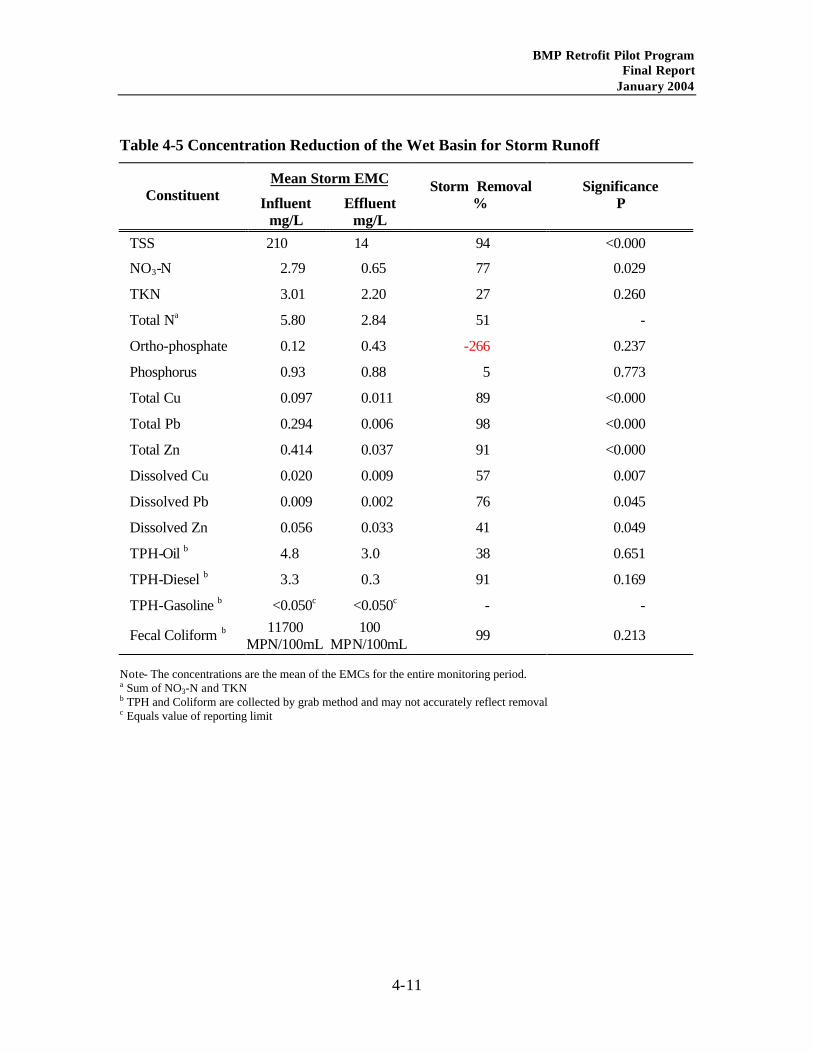
BMP Retrofit Pilot Program Final Report
January 2004
4-11
Table 4-5 Concentration Reduction of the Wet Basin for Storm Runoff
Mean Storm EMC Constituent Influent
mg/L Effluent
mg/L
Storm Removal %
Significance P
TSS 210 14 94 <0.000
NO3-N 2.79 0.65 77 0.029
TKN 3.01 2.20 27 0.260
Total Na 5.80 2.84 51 -
Ortho-phosphate 0.12 0.43 -266 0.237
Phosphorus 0.93 0.88 5 0.773
Total Cu 0.097 0.011 89 <0.000
Total Pb 0.294 0.006 98 <0.000
Total Zn 0.414 0.037 91 <0.000
Dissolved Cu 0.020 0.009 57 0.007
Dissolved Pb 0.009 0.002 76 0.045
Dissolved Zn 0.056 0.033 41 0.049
TPH-Oil b 4.8 3.0 38 0.651
TPH-Diesel b 3.3 0.3 91 0.169
TPH-Gasoline b <0.050c <0.050c - -
Fecal Coliform b 11700 MPN/100mL
100 MPN/100mL 99 0.213
Note- The concentrations are the mean of the EMCs for the entire monitoring period. a Sum of NO3-N and TKN b TPH and Coliform are collected by grab method and may not accurately reflect removal c Equals value of reporting limit

BMP Retrofit Pilot Program Final Report
January 2004
4-12
Table 4-6 Concentration Reduction observed in Wet Season Baseflow
Mean Baseflow EMC Constituent Influent
mg/L Effluent
mg/L
Baseflow Removal %
Significance P
TSS 15.82 12.50 21 0.716
NO3-N 15.52 7.85 49 <0.000
TKN 1.67 1.86 -11 0.548
Total Na 17.19 9.72 43 -
Ortho-phosphate 0.96 1.18 -24 0.714
Phosphorus 2.23 1.13 49 0.528
Total Cu 0.063 0.029 54 0.434
Total Pb 0.004 0.001 62 0.096
Total Zn 0.072 0.027 62 0.005
Dissolved Cu 0.053 0.005 90 0.010
Dissolved Pb 0.001 0.001 22 0.182
Dissolved Zn 0.058 0.032 45 0.006
TPH-Oil b 0.30 0.20 33 0.455
TPH-Diesel b 0.40 0.10c 75 0.370
TPH-Gasoline b 0.10c 0.10c - -
Fecal Coliform b 4400
MPN/100mL 20
MPN/100mL 99 0.251
a Sum of NO3-N and TKN b TPH and Coliform are collected by grab method and may not accurately reflect removal c Equals value of reporting limit A regression analysis was performed on the paired storm samples and the results are shown in Table 4-7. It is particularly interesting that effluent concentration is independent of influent concentration for almost all constituents at the 90 percent confidence level. At the 95 percent level, the relationship between influent and effluent TKN concentrations also is not statistically significant. Part of the lack of correlation may be the result of the relatively fewer samples collected at this single site compared to the BMPs implemented at several locations. However, much of the observed performance may be related to processes within the wet basin during storm events.

BMP Retrofit Pilot Program Final Report
January 2004
4-13
These data suggest that for wet ponds with a large permanent pool volume (3 times the volume of the 1 yr, 24 hr storm in this case) the primary process during periods of storm runoff is displacement of the permanent pool with some minor mixing with the influent runoff. This is suggested by the similarity in the effluent TSS concentrations during storms (14 mg/L) and dry weather (12.5 mg/L). Consequently, a one-way ANOVA was performed to compare the wet weather discharges to the ambient baseflow discharges during the wet season. This analysis indicated no significant difference between the effluent concentrations measured during storm events and those observed during dry weather for every constituent except total lead. The concentration of total lead in stormwater influent was approximately 70 times that observed in the influent during dry weather, which indicates that if the difference between ambient and stormwater influent concentrations is sufficiently large, then there is enough mixing to result in different effluent concentrations under dry and wet weather conditions.
Table 4-7 Predicted Effluent Concentrations – Wet Basin
Constituent Expected Concentration a Uncertainty, ±
TSS 11.8 4.0 NO3-N 0.45 0.25
TKN 0.21x + 1.57 ( ) 5.02
5793.2
131
44.1
−+
x
Particulate P 0.21 0.06 Ortho-Phosphate 0.33 0.28 Particulate Cu 1.9 0.5 Particulate Pb 3.4 1.1 Particulate Zn 4.6 1.6 Dissolved Cu 8.7 3.1 Dissolved Pb 2.2 0.8 Dissolved Zn 32.8 7.8
a Concentrations in mg/L except for metals, which are in µg/L; x = influent concentration
The displacement model also explains the relatively low removals observed during wet weather for nitrogen and phosphorus. The baseflow influent concentrations shown for total nitrogen (17.2 mg/L) and total phosphorus (2.2 mg/L) in Table 4-6 are extremely high for surface water, and although the concentrations are reduced during the residence time within the pond, the concentrations are nearly as large as the concentrations in untreated highway runoff resulting in a calculated removal that is at the low end of the range reported by the U.S. EPA (1993). One might therefore expect a wide range of observed reductions for other studies, depending primarily on differences in the quality of the runoff that sustains the permanent pool.

BMP Retrofit Pilot Program Final Report
January 2004
4-14
Consequently, the expected effluent quality from a wet basin with a large permanent pool is determined primarily by the quality of the perennial flow that sustains the permanent pool and the transformations that occur to that water during its residence within the basin. This also suggests that a good estimate of the expected effluent quality during wet weather can be obtained by sampling the wet basin baseflow discharge during dry weather.
4.5.2 Empirical Observations
A sand bag berm was built in the dry weather flow inlet channel to help divert water into the wet basin for monitoring purposes (to maintain a precise dry weather pond volume). This low flow diversion berm was destroyed by the high flow rates during storm events larger than about 5 mm. There were observations of trash, sediment, and vegetation blocking influent outfall.
Vegetation re-growth after the harvest was rapid, contributing to the large number of hours required for vegetation management. The amount of open water space was approximately 55 percent in March 2001, nearly the same as before the harvest in August 2000. Consequently, major vegetation removal would be required every year to meet the expectations of the vector control agency.
4.6 Cost
4.6.1 Construction
Table 4-8 shows the actual construction costs with and without monitoring equipment and related appurtenances for the wet basin. The table also presents the cost per cubic meter of water quality volume, using actual cost without monitoring.
Table 4-8 Actual Construction Costs for Wet Basin (1999 dollars)
Site Actual Cost, $ Actual Cost w/o Monitoring, $
Costa/WQV $/m3
I-5/La Costa 708,526 691,496 2,670 a Actual cost w/o monitoring.
SOURCE: Caltrans Cost Summary Report CTSW-RT-01-003.
Adjusted construction costs for the wet basin are presented in Table 4-9. The major reasons for cost adjustment included:
• The wet basin was constructed with a liner to ensure no infiltration losses during the pilot program. Lining would increase the adjusted cost by 15 percent. Lining was required at this location because the baseflow was not sufficient to maintain the designed permanent water level considering all losses. This was a design

BMP Retrofit Pilot Program Final Report
January 2004
4-15
decision for this wet basin in order to maintain a sufficient level to ensure a year-round wet pool; this, in turn, ensures conditions supportive of wetland vegetation. If groundwater contamination is not a concern and if site-specific conditions allow, a wet basin could be designed without a liner, while sustaining wetland vegetation during dry periods of some length. The liner cost was excluded from the adjusted cost.
• A lane closure throughout the wet basin construction caused greater than usual traffic control cost because grading and inlet construction was necessary up to the edge of pavement. The traffic control cost of similar BMPs was substituted for the original traffic control cost. Using the original traffic control cost would increase the adjusted cost by 8 percent. This added cost was excluded from the adjusted cost.
• A geogrid access road was installed. Using asphalt concrete (AC) pavement in lieu of geogrid for the access road would decrease the cost of the access road by 49 percent. Using geogrid in the cost analysis would increase the total adjusted cost by 5 percent. The cost of AC was substituted for the geogrid so that the increased cost due to installing geogrid was excluded from the adjusted cost.
• The site chosen had several large trees, which, along with a large footprint caused greater than usual clearing and grubbing cost. Including the original clearing and grubbing cost would increase the adjusted cost by 7 percent. This additional cost was excluded from the adjusted cost; instead, the average clearing and grubbing cost of similar BMPs was used.
• Greater than usual conveyance costs were incurred. Including the original conveyance cost would increase the adjusted construction cost by 7 percent. The original conveyance cost was not used to estimate the adjusted cost; instead, the average conveyance cost of similar basin type BMPs was used.
• Costs were incurred for monitoring flumes, other structures associated with the flumes, and the additional cost of stainless steel over alternative materials. If included, these costs would add 9 percent to the adjusted construction cost. These costs were excluded from the adjusted costs.
• Miscellaneous site-specific factors caused increased construction cost. This cost would increase the adjusted cost by 4 percent. These costs were excluded from the adjusted cost.
Table 4-9 Adjusted Construction Costs for Wet Basin (1999 dollars)
Wet Basin Adjusted Construction Cost, $
Cost/WQV $/m3
One Location 448,412 1,731
SOURCE: Adjusted Retrofit Construction Cost Tables, Appendix C.

BMP Retrofit Pilot Program Final Report
January 2004
4-16
The traffic control costs at this site were particularly high due to the need to close a lane near the off-ramp for 6 months during construction. Consequently, the adjusted traffic control costs account for 6 percent of the adjusted construction cost.
As mentioned previously, there exist a number of suggested sizing criteria relating the permanent pool to the water quality volume, average storm at the site, and other factors. This basin was sized to provide a permanent pool equal to three times the water quality volume, which in this study was the runoff produced by the 1 yr, 24 hr storm. Design guidelines from other sources generally recommended a much smaller permanent pool often based on mean storm size at the site, rather than on the largest storm one would expect to occur annually. A smaller permanent pool would result in a le ss costly installation, while providing only slightly less pollutant removal (U.S. EPA, 1983).
4.6.2 Operation and Maintenance
All effort related to the operation and maintenance of the wet basin was compiled separately from the effort associated with sampling activities, empirical observations, and analysis of the water samples. On average, 436 hours were required for field activities annually, including inspections, maintenance and vector control activities. No specialized equipment was required for these activities. It is possible that the presence of endangered species could impact the schedule, effort and ability to perform maintenance over the long-term. Consultation with appropriate regulatory agencies on the issue of maintenance impacts should there be endangered species present was initiated and is ongoing to determine the scope of mitigation that would be required if endangered species took up harborage in the device.
Table 4-10 presents the cost of the requirements for operation and maintenance performed by consultants in accordance with earlier versions of the MID. The operation and maintenance efforts are comprised of the following task components: administration, inspection, maintenance, vector control, equipment use, and direct costs. Included in administration was office time required to support the operation and maintenance of the BMP. Inspections include wet and dry season inspections and unscheduled inspections of the BMPs. Maintenance included time spent maintaining the BMPs for scheduled and unscheduled maintenance, vandalism, and acts of nature. Vector control included maintenance effort by the vector control districts and time required to perform vector prevention maintenance. Equipment time included the time equipment was allocated to the BMP for maintenance.

BMP Retrofit Pilot Program Final Report
January 2004
4-17
Table 4-10 Actual Average Annual Maintenance Effort – Wet Basin
Activity Labor Hours Equipment & Materials $
Inspections 13 0
Maintenance 376 0
Vector control* 48 0
Administration 49 0
Direct cost - 2,148
Total 486 $2,148
* Includes hours spent by consultant vector control activities and hours by Vector Control District for inspections
The hours shown above do not correspond to the effort that would routinely be required to operate a wet basin under the latest version of the MID or reflect the design lessons learned during the course of the study. Table 4-11 presents the expected maintenance costs that would be incurred under the final version of the MID for a wet basin serving about 2 ha, constructed following the recommendations in Section 4.7. A detailed breakdown of the hours associated with each maintenance activity is included in Appendix D.
Some of the estimated hours are higher than those documented during the study because certain activities, such as sediment removal, were not performed during the relatively short study period. Only 8 hours are shown for facility inspection, which is assumed to occur simultaneously with all other inspection requirements for that time period. Labor hours have been converted to cost assuming a burdened hourly rate of $44 except for biological assessments when a rate of $70 was used (see Appendix D for documentation). Vector control hours were converted to cost assuming an hourly rate of $62. Equipment generally consists of a single truck for the crew and their tools.

BMP Retrofit Pilot Program Final Report
January 2004
4-18
Table 4-11 Expected Annual Maintenance Costs for Final Version of MID – Wet Basin
Activity Labor Hours Equipment and Materials, $ Cost, $
Inspections 8 0 352
Maintenance 262 375 11,903
Vector control 12 0 744
Administration 3 0 133
Materials - 4,500 4,500
Total 285 $ 4,875 $17,632
4.7 Criteria, Specifications and Guidelines
Based on the results of this study, wet basins are considered technically feasible depending on site specific conditions. This section discusses various guidelines for the siting, design, construction, operation and maintenance of wet basins. These are based on lessons learned through the experience and observations made during the project.
4.7.1 Siting
Based on the results of this study, the primary siting criteria recommended for wet basins include:
• A high water table or other source of water to provide baseflow sufficient to maintain the plant community and vector prevention attributes desired.
• The soil substrate should range in texture from loam to clay.
• Provide sufficient space for the basin, maintenance access, and a clear recovery zone.
• Perform a site evaluation to identify unsuitable material in the subgrade.
• BMP retrofit would benefit from early planning in reconstruction projects to take advantage of possible drainage system reconstruction, to direct additional flow to the site and to coordinate with the right-of-way acquisition processes to accommodate the land requirements for wet basins.
• To avoid costly linings, avoid locations where available baseflow is insufficient to circulate the basin considering all losses, including infiltration.

BMP Retrofit Pilot Program Final Report
January 2004
4-19
4.7.2 Design
Proper design of wet basins is imperative for performance, to reduce maintenance, and lower costs. Based on the observations and measurements in this study, the following guidelines are recommended:
• Locate, size, and shape wet basins relative to topography and provide extended flow paths to maximize their treatment potential.
• Use unlined basins where soil type and groundwater elevation permit because of their lower initial cost; however, additional investigation is needed to determine the potential impacts to groundwater quality.
• The 3:1 permanent pool to water quality volume ratio and 24 hr drain time for the water quality volume resulted in removal comparable to those reported for wet basins in other studies. Many other criteria for sizing the permanent pool have been recommended, which may reduce the facility size, while providing only slightly less pollutant removal. A 1:1 permanent pool to water quality volume ratio has been determined to be feasible by others but testing is needed to verify performance of less conservative designs.
• Include energy dissipation in the inlet design and a sediment forebay to reduce resuspension of accumulated sediment and facilitate maintenance.
• Design inlet structures to direct baseflow and runoff to the wet pond without interfering with the diversion stream hydraulics, or resulting in sedimentation.
• Include a concrete maintenance ramp in the design to facilitate access to the forebay for maintenance activities.
• Minimize paved access road consistent with maintenance vehicle turnaround and requirements for access to all parts of the basin for vector control.
• Select appropriate wetland vegetation to minimize the potential for formation of monocultures or introduction of invasive species that would increase maintenance.
• Consider 1:2 (V:H) side slopes where pedestrian access is restricted or prohibited
• Where side slopes steeper than 1:2 (V:H) are used, stabilize with a geotextile and prohibit run-on.
4.7.3 Construction
Several issues occurred during the construction of the wet basin and lessons were learned on how to improve the construction. Listed below are guidelines that should improve the construction process.
• Verify manufacturing time for construction materials prior to specifying the product to minimize delays.

BMP Retrofit Pilot Program Final Report
January 2004
4-20
• Seek out and place high priority on traffic engineer’s comments during design for those sites adjacent to highways.
• Avoid above-ground structures near the roadway that will require a setback or guardrail protection.
• Consult with local maintenance staff to attempt to discern undocumented information on utility lines and other buried objects.
4.7.4 Operation and Maintenance
Based on the results of this study, recommended maintenance items include:
• Perform schedule inspections and maintenance as recommended in MID (Version 17) in Appendix D, which includes inspection for burrows, inspection for sediment and general maintenance inspection.
• Introduce mosquito fish and maintain vegetation to assist their movements to control mosquitoes, as well as to provide access for vector inspectors. An annual vegetation harvest in August appears to be optimum, in that it is after the bird breeding season, mosquito fish can provide the needed control until vegetation reaches late summer density, and there is time for regrowth for runoff treatment purposes before the wet season.
• Observe drain time for the design storm after completion or modification of the facility to confirm that the desired drain time has been obtained. If necessary, modify orifice to achieve design values.
• Schedule semiannual inspection in August and February to identify potential operational problems.
• Remove accumulated trash and debris in the basin at the middle and end of the wet season. The frequency of this activity may be altered to meet specific site conditions.
• Remove accumulated sediment in the forebay and regrade about every 10 years or when the accumulated sediment volume exceeds 10 percent of the basin volume. Inspect the basin each year for accumulated sediment volume.

BMP Retrofit Pilot Program Final Report
January 2004
5-1
5 INFILTRATION BASINS
5.1 Siting
Two infiltration basins were sited as part of this study. One site was located in District 7 at the I-605/SR-91 interchange and the other in District 11 at the offramp of southbound I-5 at La Costa Avenue. Both sites were located within the highway right-of-way and collected runoff exclusively from the highway (District 11) and from the highway and a maintenance station (District 7).
Site characteristics considered during the siting of the infiltration basins included:
• Hydrologic Soil Type A or B
• Minimum infiltration rate of 7 mm/hr
• Minimum separation between the basin invert and water table of 0.6 to 1.2 m
• Sufficient area for siting the infiltration basin
• Thirty-meter setback from structures foundations
• Maintenance access
The permeability of the soil was the most important characteristic in the siting of the infiltration basins. Fourteen sites were initially evaluated using a weighted decision matrix. Five sites with the best preliminary scores were the subjects of a detailed geotechnical investigation. Where test wells indicated sufficient separation between the anticipated basin invert and the water table, in-drill-hole field permeability tests were conducted. Table 5-1 shows the groundwater depth and permeability rates determined at these sites during this investigation.
Table 5-1 Infiltration Basin Permeability Rates
Site Permeability mm/hr
Groundwater Depth *bgs, m
I-605 /SR-91 5.8 >9
I-5/La Costa 22.3 1.45
I-5/Manchester (E) - 0.84
I-5/Manchester (W) - 1.14
SR-78/I-15 0.9 9.14
*bgs = below ground surface

BMP Retrofit Pilot Program Final Report
January 2004
5-2
Two sites displayed acceptable infiltration capacities and water table levels, I-605/SR-91 in District 7 and I-5/La Costa Avenue. in District 11. The I-605/SR-91 location was considered to be only marginally acceptable; however, given the site’s surplus available space and access characteristics, it was considered a suitable location. Table 5-2 summarizes the watershed characteristics for the chosen sites.
Table 5-2 Summary of Contributing Watershed Characteristics for Infiltration Basins
Site Land Use Watershed Area Hectare
Impervious Cover %
I-605/SR-91 Highway/MS 1.70 68
I-5/La Costa Avenue
Highway 1.30 72
5.2 Design
The design of the infiltration basins was based on infiltration rate, drain time, capture volume, groundwater separation distance, and proximity to adjacent structures. Additional factors considered in the design included basin shape, side slope ratio, maintenance access, vegetation type, inlet configuration and in- line or off- line configuration. Table 5-3 provides characteristics used to size each infiltration basin.
Table 5-3 Design Characteristics of the Infiltration Basins
Site Design Storm mm
WQV m3
Basin Design Depth
m
Basin Invert Surface Area
m2
I-605/SR-91 25 432 0.22 1963
I-5/La Costa Avenue
33 407 0.90 450
The basins were designed to drain within 72 hours based on the infiltration rate and the water quality volume to be treated. Groundwater separation also has an effect on the drain time of the basins, so the basin inverts were designed to have a minimum 0.60-m separation from the seasonally high groundwater elevation. The basin floor was as flat as possible to ensure an even infiltration surface. The side slopes were 1:3 and 1:4 (V:H) for the I-605/SR-91 and I-5/La Costa Avenue sites, respectively.

BMP Retrofit Pilot Program Final Report
January 2004
5-3
An energy dissipation device was used at the inlet to reduce inflow velocities and to distribute flow evenly over the basin floor. The inlet pipe entered at the basin invert elevation to help prevent erosion.
The infiltration basins were designed to be off- line. At I-605/SR-91, a weir in the inlet structure was placed at an elevation so that once the design storm volume was captured, the excess runoff would be diverted away from the basin. At the I-5/La Costa Avenue basin the existing inlets were fitted with weir plates to accommodate the 1 yr storm peak discharge.
The initial designs were later modified to address problems identified at the sites. The sump used to dissipate energy at I-605/SR-91 had to be filled in because it became a breeding habitat for mosquitoes. At the I-5/La Costa Avenue basin modifications to the original design elevations were made to accommodate the higher groundwater elevation measured during construction. Figures 5-1 and 5-2 show the La Costa Avenue and I-605/SR-91 infiltration basins. A schematic diagram is presented in Figure 5-3.
Figure 5-1 I-5/La Costa Infiltration Basin
Figure 5-2 I-605/SR-91 Infiltration Basin

BMP Retrofit Pilot Program Final Report
January 2004
5-4
Figure 5-3 Schematic of Infiltration Basin
5.3 Construction
During construction of the La Costa Avenue infiltration basin, it was discovered that the groundwater was higher than previously measured. The basin invert was raised to an elevation of 2 m, 0.5 m higher than the original design to provide the minimum required separation between the invert of the basin and the measured groundwater elevation. The inlet to the basin from the storm drain system was also raised by the same amount. This realignment was accommodated in the remainder of the storm drain system by flattening the grade in the pipe.
Compaction of the soil during construction was avoided at each site to the greatest extent possible. Excavation of the basin was done from the sides rather than the basin floor. Only light equipment was used on the basin floor, and the floor was then tilled upon

BMP Retrofit Pilot Program Final Report
January 2004
5-5
completion of excavation. Vegetation was established to help maintain and improve the infiltration capacity of the basin floor by root penetration.
5.3.1 Unknown Field Conditions
Problems with the excavation of the infiltration basins included excessive surface mulch, utility conflicts, and low relief. These problems were encountered at I-605/SR-91, where the variability in the thickness of a mulch layer was not detected during the design geotechnical investigation, requiring additional soil to be brought in to form the perimeter berm. An unknown temporary electrical system also was encountered, requiring additional efforts to protect the system during excavation. Also at I-605/SR-91, the runoff that was normally tributary to the basin site was not flowing through the existing outlet pipe because of blockage by soil. A new headwall was constructed to service the bypass flows from the basin.
As noted previously, the groundwater elevation rose substantially at the La Costa site from the time of the initial site investigation (December 1997) to the time of the start of construction (August 1998). The basin construction proceeded under marginal conditions; however, as construction was completed, the water table continued to rise, ultimately coming within about 0.3 m of the basin invert. The infiltration basin ultimately failed and a forensic analysis of the basin to determine the cause of failure was completed (URS, 1999a; see also Appendix B). The analysis indicates that the cause of failure was the high water table. Poor local soil conditions may have been a contributing factor.
5.3.2 Impacts to Freeways
During construc tion of the infiltration basin within the freeway right-of-way at La Costa Avenue, it was necessary to close a lane at night to install the storm drain located under the highway shoulder.
5.4 Maintenance
The sites were inspected monthly for:
• General maintenance needs, which included checking the inlet structure, side slopes, and overall site for signs of erosion, woody vegetation, graffiti, and vandalism
• Indications of burrowing rodent activity that could endanger the structural integrity of the site
• Coverage and effectiveness of vegetation planted for erosion control on the side slopes and basin invert
• Trash and debris accumulation in the inlet structures
• Presence of vectors

BMP Retrofit Pilot Program Final Report
January 2004
5-6
To ensure that the infiltration basins met the required drain time of 72 hours for the design storm WQV, each site was assessed after every target storm. The basins were inspected annually in September for vegetation coverage to ensure 70 percent coverage; annually in June to measure sediment accumulation in the invert; and characterized (based on hazardous material thresholds) on May 1 of each year. During the wet season, the infiltration basins were inspected weekly for endangered and threatened species and species of special concern. The basins were inspected for standing water annually on May 1.
As shown in Figure 5-4, the most significant field activity was trimming and removing vegetation, followed by structural repair, hydroseeding and inspections. The time required for inspections reflects the requirements of the MID. An average of 106 hours was spent on maintenance of the infiltration basin, not including the vector control agency hours. A net was placed over the La Costa Avenue infiltration basin so that the site did not become a habitat for fairy shrimp, a federally listed endangered species that can be transported by birds. The presence of fairy shrimp may have precluded maintenance and operation activities at the site. The net was required since the basin did not meet the design drain time due to high groundwater.
Table 5-4 shows the number of observations of mosquito breeding at the infiltration basins along with the number of abatements performed. Because the La Costa Avenue infiltration basin failed to drain completely, it was stocked with mosquito fish to help reduce the breeding. Breeding at the I-605/SR-91 site occurred in the inlet structure stilling well, which was subsequently filled with concrete, thus eliminating this problem.
GLACVCD monitored the I-605/SR-91 infiltration basin and SDCoVC monitored the I-5/La Costa infiltration basin. GLACVCD had a more aggressive approach in abatement of mosquitoes. Since the I-5/La Costa Avenue infiltration basin was located near Batiquitos Lagoon, SDCoVC performed mosquito abatement less frequently.

BMP Retrofit Pilot Program Final Report
January 2004
5-7
Figure 5-4 Field Maintenance Activities at Infiltration Basins (1999-2001)
Table 5-4 Incidences of Mosquito Breeding – Infiltration Basins
Number of Times District Site
Breeding Observed Abatement Performed
7 (Los Angeles) I-605/SR-91 3 3
11 (San Diego) I-5/La Costa Avenue
37 3
5.5 Performance
5.5.1 Chemical Monitoring
Constituent removal is considered to be 100 percent for infiltration devices when the entire WQV is infiltrated and no water is discharged to surface waters. However, bypass

BMP Retrofit Pilot Program Final Report
January 2004
5-8
can occur fairly regularly if the design storm selected for treatment is not sufficiently large. Bypass flows were not monitored as part of this study.
Baseline groundwater sampling was conducted prior to construction and during operation of the infiltration basins. However, it is difficult to interpret groundwater movement and due to the relatively short time frame of the project it is not possible to draw any conclusions from the data.
Core samples in the infiltration basins were collected to determine the rate at which constituents were transported into the subsurface. Samples of soil were collected from depths of 0.3 m and 0.6 m and were analyzed for zinc, lead, copper, and total petroleum hydrocarbons. An initial sample was collected from the I-605/SR-91 IB site when construction was completed in January 1999. Additional samples were collected there in June 2000 and May 2001. There was little difference in results from the samples. However, the pilot study may not be of sufficient duration to fully discover the potential for pollutants to be transported within the site soil. The average concentrations determined in these tests are shown in Table 5-5.
Table 5-5 I-605 / SR-91 Infiltration Basin Soil Samples
Soil Sample Concentration (mg/kg)
Depth 0.0-0.2 m Depth 0.3-0.5 m Depth 0.6-0.8 m
Constituent Jan
1999 Jun 2000
May 2001
Jan 1999
Jun 2000
May 2001
Jan 1999
Jun 2000
May 2001
Total Cu Na 22.8 20.1 19.5 16.1 16.4 15.5 16.1 12.7
Total Pb Na 39.4 6.7 5.1 3.4 6.4 3.8 3.5 3.5
Total Zn Na 54.4 46.9 45.9 35.8 42.2 39.9 36.6 31
TRPH Na <10a <333a <10a <10a <333a <10a <10a <333a
a Detection Limit. The DL of 10 is based upon use of Freon and the IR method. This cannot be achieved with hexane and gravimetric procedures used after June 2000.
5.5.2 Empirical Observations
During and after each target storm event, observations were made at the infiltration basin sites. The most notable observation was that the La Costa Avenue site was not draining within 72 hours. Water remained in the La Costa Avenue infiltration basin continuously, only drying up in the summer months. The top 0.3 m of soil over the center of the basin was over-excavated and backfilled with more permeable material shortly after completion of construction to try to remedy this situation; however, the basin held water continuously during and for weeks fo llowing the wet season.
The I-605/SR-91 infiltration basin functioned as designed. The maximum measured drain time was 34 hours. The basin did bypass runoff during seven events that were larger than the design storm. Before the start of the 2000-2001 wet season, the overflow

BMP Retrofit Pilot Program Final Report
January 2004
5-9
weir plate height was increased to the maximum height to minimize the flow bypass. Some sediment deposition was noted near the inlet but no noticeable deposition occurred in other areas of the basin. Some minor erosion was noted on the north side slope. The vegetation coverage was good over the duration of the period of the study.
5.6 Cost
5.6.1 Construction
Table 5-6 shows the actual construction costs with and without monitoring equipment and related appurtenances for each infiltration basin site. The table also presents the cost per cubic meter of water treated, using actual cost without monitoring.
Table 5-6 Actual Construction Costs for Infiltration Basins (1999 dollars)
Site Actual Cost, $ Actual Cost w/o Monitoring, $
Costa/WQV $/m3
I-605/SR-91 268,130 267,980 620
I-5/La Costa 272,676 267,724 658 a Actual cost w/o monitoring.
SOURCE: Caltrans Cost Summary Report CTSW-RT-01-003.
Table 5-7 presents the adjusted costs for the infiltration basins. The major reasons for cost adjustment included:
• At the I-605/SR-91 site, a significant overburden of landscaping mulch, along with a large footprint, caused greater than usual clearing and grubbing costs. Including the original clearing and grubbing cost would increase the adjusted cost by 14 percent. This additional cost was excluded from the adjusted cost; instead, the average clearing and grubbing cost of similar BMPs was used.
• The I-605/SR-91 site incurred greater than usual traffic control cost. Including the original traffic control cost would increase the adjusted cost by 7 percent. This additional cost was excluded from the adjusted cost; instead, the average traffic control cost of similar BMPs was used.
• Greater than usual conveyance costs were incurred at the La Costa Avenue location. Including the original conveyance cost would increase the adjusted construction cost by 63 percent. The original conveyance cost was not used to estimate the adjusted cost at either location; instead, the average conveyance cost of similar BMPs was used.

BMP Retrofit Pilot Program Final Report
January 2004
5-10
• Costs were incurred for monitoring flumes, other structures associated with the flumes, and the additional cost of stainless steel over alternative materials. These costs were excluded from the adjusted costs. If these costs were included, the adjusted construction cost would increase by 6 percent.
• The costs of miscellaneous site-specific factors caused increased construction cost. This cost would increase the adjusted cost by 2 percent at one location and 28 percent at another. These costs were excluded from the adjusted cost.
Table 5-7 Adjusted Construction Costs for Infiltration Basins (1999 dollars)
Infiltration Basins Adjusted Construction Cost, $
Cost/WQV $/m3
Mean (2) 155,110 369 High 171,707 397 Low 138,512 340
SOURCE: Adjusted Retrofit Construction Cost Tables, Appendix C.
Construction access for future infiltration basins sites likely will be from active freeway lanes; consequently, adjusted traffic control costs are a significant budget item, accounting for 18 percent of the total infiltration basin adjusted construction cost. Traffic control costs were particularly high at the I-605/SR-91 site where a lane was taken for 6 months during construction.
5.6.2 Operation and Maintenance
The I-5/La Costa Avenue infiltration basin became operational on January 24, 1999, and received reduced monitoring after the first storm event, since the basin never completely drained during the wet season. The infiltration basin received only empirical observations for the remainder of the study. The operation and maintenance hours are provided for the two sites in Table 5-8. Field hours include inspections, maintenance and vector control.
Table 5-8 Actual Operation and Maintenance Hours for Infiltration Basins
Average Annual Site Name Equipment Hours Field Hours
I-605/SR-91 52 205
I-5/La Costa 0 90

BMP Retrofit Pilot Program Final Report
January 2004
5-11
Table 5-9 presents the cost of the average annual requirements for operation and maintenance performed by consultants in accordance with earlier versions of the MID. The operation and maintenance efforts are based on the following task components: administration, inspection, maintenance, vector control, equipment use, and direct costs. Included in administration was office time required to support the operation and maintenance of the BMP. Inspections include wet and dry season inspections and unscheduled inspections of the BMPs. Maintenance included time spent maintaining the BMPs for scheduled and unscheduled maintenance, vandalism, and acts of nature. Vector control included maintenance effort by the vector control districts and time required to perform vector prevention maintenance. Equipment time included the time equipment was allocated to the BMP for maintenance.
Table 5-9 Actual Average Annual Maintenance Effort – Infiltration Basin
Activity Labor Hours Equipment & Materials
$
Inspections 11 -
Maintenance 95 156
Vector control* 41 -
Administration 91 -
Direct cost - 2,969
Total 238 $3,125
* Includes hours spent by consultant vector control activities and hours by Vector Control District for inspections
The hours shown in Table 5-9 do not correspond to the effort that would routinely be required to operate an infiltration basin or reflect the design lessons learned during the course of the study. Table 5-10 presents the expected maintenance costs that would be incurred under the final version of the MID for an infiltration basin serving about 2 ha, constructed following the recommendations in Section 5.7. A detailed breakdown of the hours associated with each maintenance activity is included in Appendix D.
Some of the estimated hours are higher than those documented during the study because certain activities, such as sediment removal, were not performed during the relatively short study period. Design refinements will eliminate the need for activities such as vector control. Only one hour is shown for facility inspection, which is assumed to occur simultaneously with all other inspection requirements for that time period. This estimate also assumes that vegetation maintenance is required. Labor hours have been converted to cost assuming a burdened hourly rate of $44 (see Appendix D for documentation). Equipment generally consists of a single truck for the crew and their tools.

BMP Retrofit Pilot Program Final Report
January 2004
5-12
Table 5-10 Expected Annual Maintenance Costs for Final Version of MID – Infiltration Basin
Activity Labor Hours Equipment and Materials, $ Cost, $
Inspections 1 0 44
Maintenance 52 127 2,415
Vector control 0 0 0
Administration 3 0 132
Materials - 435 435
Total 56 $562 $3,026
5.7 Criteria, Specifications and Guidelines
This section provides guidance on siting and design of infiltration basins based on lessons learned during the siting, design, construction, operation and maintenance of the infiltration basins. Additional criteria and guidelines for siting of infiltration devices can be found in Appendices A and B. The parties in this study worked cooperatively to develop interim guidelines for siting infiltration basins to respond to requests by the State Regional Water Quality Control Boards; however, determination of whether there is a potential threat to groundwater quality requires further investigation. Based on the findings of this study, infiltration basins can be technically feasible for use on Caltrans facilities; however, two important questions remain unanswered. The primary research question left unresolved is the potential impact of the infiltrated runoff on groundwater quality. Additional study of these potential impacts is certainly warranted. In addition, further study of the pilot installations is recommended to better establish the expected life of these devices and the long-term cost of operation and maintenance.
5.7.1 Siting
The key element in siting infiltration basins is identifying sites with appropriate soil and hydrogeologic properties. Because of problems with the performance of the La Costa Avenue site, a peer review study was conducted to determine the cause of failure (URS, 1999a). The peer review study concluded that under ideal conditions an infiltration basin with an infiltration rate as low as 11 mm/hr and a groundwater separation of only 0.6 m would drain within 72 hours (or 7 mm/hr if the separation is at least 1.2 m). Because of the variability in soil textures at a site, it would be prudent to add a margin of safety to these numbers. In addition, guidance manuals in other areas are now recommending a minimum infiltration rate of 12 mm/hr. Preliminary selection criteria for infiltration basins should include:

BMP Retrofit Pilot Program Final Report
January 2004
5-13
• Determine the soil type (consider RCS soil type ‘A, B or C’ only) from mapping and consult USDA soil survey tables to review other parameters such as the amount of silt and clay, presence of a restrictive layer or seasonal high water table, and estimated permeability. The soil shall not have more than 30 percent clay or more than 40 percent clay and silt combined. Eliminate sites that are clearly unsuitable for infiltration.
• Groundwater separation should be at least 1.2 m from the basin invert to the measured groundwater elevation. However, 3 m of separation is preferred. If groundwater separation is less than 3 m, secondary screening should be conducted as described below. There is concern at the state and regional levels of the impact on groundwater quality from infiltrated runoff.
• Site area sufficient for the basin footprint and 9 m setback from the edge of traveled way, calculated by assuming an infiltration rate and checking the area required according to the method provided below.
• Locate the site away from buildings, slopes and highway pavement (greater than 6 m) and wells and bridge structures (greater than 30 m). Sites constructed of fill, having a base flow or with a slope greater than 15 percent, should not be considered.
• Ensure that adequate head is available to operate flow splitter structures (to allow the basin to be offline) without ponding in the splitter structure or creating backwater upstream of the splitter.
• Assure there is adequate maintenance access available.
• Base flow should not be present in the tributary watershed.
Secondary screening methods based on site geotechnical investigation are listed below.
• If a more detailed investigation to determine the groundwater elevation is required per the guidance above, establish at least two monitoring wells, one near the basin but down gradient by no more than approximately 10 m and the other within the proposed basin footprint. The two wells shall be observed over a wet and dry season; this observation period shall be extended to a second wet season if the initially observed wet season produces rainfall less than 80 percent of that in a normal year. The minimum acceptable spacing between the proposed infiltration basin invert and the seasonal high water table, as measured at either of the two established monitoring wells, is 1.2 m. A registered engineer or geologist must oversee the detailed investigation, and must also consider other potential factors that may influence the groundwater elevation such as local or regional groundwater recharge projects, future urbanization or agriculture. The geotechnical engineer shall also examine the soil borings for indications of previous high water.

BMP Retrofit Pilot Program Final Report
January 2004
5-14
• At least three in-hole conductivity tests shall be performed using USBR 7300-89 or Bouwer-Rice procedures (the latter if groundwater is encountered within the boring), two tests at different locations within the proposed basin and the third down gradient by no more than approximately 10 m. The tests shall measure permeability in the side slopes and the bed within a depth of 3 m of the invert.
• The minimum acceptable hydraulic conductivity as measured in any of the three required test holes is 13 mm/hr. If any test hole shows less than the minimum value, the sites shall be disqualified from further consideration.
• Use the minimum measured value of hydraulic conductivity multiplied by a safety factor of 0.5 to determine basin invert area.
• Exclude from consideration sites constructed in fill or partially in fill unless no silts or clays are present in the soil boring. Fill tends to be compacted, with clays in a dispersed rather than flocculated state, greatly reducing permeability.
• The geotechnical investigation should be such that a good understanding is gained as to how the stormwater runoff will move in the soil (horizontally or vertically), and if there are any geological conditions that could inhibit the movement of water.
5.7.2 Design
Based on the observations and measurements in this study, the following guidelines are recommended:
• Locate, size and shape the infiltration basin relative to topography.
• Provide pretreatment if sediment loading is a maintenance concern for the basin.
• Include energy dissipation in the inlet design for the basins. The preferred design is poured- in-place concrete using a design that does not have a permanent sump to reduce opportunity for standing water and associated vector problems.
• Configure basin so the last water to infiltrate stands in a small area with good accessibility so that maintenance is confined to a smaller location.
• Minimize paved access road consistent with maintenance vehicle turnaround and requirements of vector control agencies.
BMP Retrofit Pilot Program Final Report
January 2004
5-15
• Determine the basin invert area using the following equation:
ktWQV
A =
where A = Basin invert area (m2)
WQV = water quality volume (m3)
k = 0.5 times the lowest field-measured hydraulic conductivity (m/hr)
t = drawdown time (hr)
• Do not use vertical piping, either for distribution or infiltration enhancement to avoid device classification as a Class V injection well per 40 CFR146.5(e)(4).
5.7.3 Construction
Listed below are guidelines that should improve the construction process:
• Sufficient borings should be made before the job is put out for bid to determine the presence of any subsurface unsuitable materials and consequently to avoid the delays and expense incurred with contract change orders.
• Before construction begins, stabilize the entire area draining to the facility. If impossible, place a diversion berm around the perimeter of the infiltration site to prevent sediment entrance during construction.
• Place excavated material such that it cannot be washed back into the basin if a storm occurs during construction of the facility.
• Build the basin without driving heavy equipment over the infiltration surface. Any equipment driven on the surface should have extra-wide (“low pressure”) treads or tires. Prior to any construction, rope off the infiltration area to stop entrance by unwanted equipment.
• After final grading, till the infiltration surface deeply.
• Use appropriate erosion control seed mix for the specific project and location.
5.7.4 Operation and Maintenance
Recommended operation and maintenance guidelines include:
• Perform inspections and maintenance as recommended in MID (Version 17) in Appendix D, which includes ensuring vegetation of the basin side slopes and invert, inspection for standing water, trash and debris, sediment accumulation, and slope stability.

BMP Retrofit Pilot Program Final Report
January 2004
5-16
• Observe drain time for the design storm after completion or modification of the facility to confirm that the desired drain time has been obtained.
• Schedule semiannual inspections for the beginning and end of the wet season to identify potential problems.
• Remove accumulated trash and debris in the trench at the start and end of the wet season.
• Inspect for standing water at the end of the wet season.
• Trim vegetation at the beginning and end of the wet season to prevent establishment of woody vegetation and for aesthetic and vector reasons.
• Inspect for minimum 70 percent vegetation coverage in the basin before the start of the wet season and reseed/replant as necessary.
• Remove accumulated sediment and regrade when the accumulated sediment volume exceeds 10 percent of the basin.
• If erosion is occurring within the basin, revegetate immediately and stabilize with an erosion control mulch or mat until vegetation cover is established.
• To avoid reversing soil development, scarification or other disturbance should only be performed when there are actual signs of clogging, rather than on a routine basis. Always remove deposited sediments before scarification, and use a hand-guided rotary tiller, if possible, or a disc harrow pulled by a very light tractor.

BMP Retrofit Pilot Program Final Report
January 2004
6-1
6 INFILTRATION TRENCHES
6.1 Siting
Two infiltration trenches were sited as part of this study. One site was located in District 7 at the Altadena Maintenance Station and the other in District 11 at the Carlsbad Maintenance Station. All runoff to the trenches originated within the maintenance stations.
Several criteria were used to site the infiltration trenches, including:
• Hydrological Soil Type A or B
• Minimum infiltration rate of 7 mm/hr
• Minimum separation between the basin invert and water table of 0.6 to 1.2 m
• Sufficient area for siting the infiltration trench
• 30-m setback from foundations
• Maintenance access
The permeability of the soil was the most important consideration in the siting of the infiltration trenches. Initially, 37 sites were evaluated using a weighted decision matrix. Eight sites with the best preliminary scores were the subjects of a detailed geotechnical investigation. In-drill-hole field permeability tests were conducted at the selected sites to determine if the soils had suitable infiltration rates and groundwater separation. Table 6-1 shows the permeability rates determined at these sites.
Table 6-1 - Infiltration Trench Permeability Rates
Site and District Permeability mm/hr Groundwater Depth m
Altadena – D7 39.6 > 10 Carlsbad – D11 31.3 > 5 Cerritos – D7 2.7 > 9 Cerritos – D7 5.8 > 9 Escondido – D11 - 0.9 Kearny Mesa – D11 0.08 >15 San Fernando D7 0.08 > 6 Tarzana – D7 0.12 >15 Westdale – D7 0.01 >15

BMP Retrofit Pilot Program Final Report
January 2004
6-2
Two sites demonstrated acceptable infiltration capacities and water table levels, Altadena MS and Carlsbad MS. Table 6-2 shows a summary of the watershed characteristics for the selected sites.
Table 6-2 Summary of Contributing Watershed Characteristics for Infiltration Trench
Site Watershed Area Hectare
Impervious Cover %
Altadena MS 0.7 100
Carlsbad MS 0.7 100
6.2 Design
The design of the infiltration trenches was based on infiltration rate, drain time, and water quality volume. Additional criteria for design included trench shape, dimensions, and rock matrix specifications. Table 6-3 provides lists the characteristics of each infiltration trench.
Table 6-3 Design Characteristics of the Infiltration Trenches
Site Design Storm mm
WQV m3
Trench Depth m
Bottom Surface Area
m2
Altadena MS 25 172 3 161
Carlsbad MS 33 83 * 4 94
*Carlsbad MS infiltration trench was sized per Caltrans Stormwater Quality Handbook for 83 m3; however, the WQV based on the 1 yr, 24 hr storm is 222 m3.
The trenches were designed to drain within 72 hours. Since groundwater separation affects the drain time of the trenches, a minimum separation of 1.2 m was desired. The inverts of the trenches were more than 5 m from the water table. Two different consultants designed the two trenches and used different methods to determine trench size. Both approaches are legitimate.
The Altadena trench was sized using the following equation:
CiAWQV **=

BMP Retrofit Pilot Program Final Report
January 2004
6-3
where
WQV = water quality volume (m3)
A = drainage area (m2)
i = m. of rainfall (m)
C = runoff coefficient
The trench volume was determined by assuming the WQV would fill the 35 percent void space. This volume was divided by the infiltration rate and drain time to determine what bottom surface area would be needed to drain the trench within 72 hours.
tIV
SA*
=
where
SA = bottom surface area (m2)
V = volume of trench (m3)
I = infiltration rate (m/hr)
t = time to drain (72 hr)
The volume divided by the bottom surface area determined the depth.
where
d = Depth (m)
V = Volume of trench (m3)
SA = Bottom surface area (m3)
The Carlsbad trench was sized per the Caltrans Storm Water Quality Handbook, (Caltrans, 1996) PDIIB (1), storm volume chart. Based on Zone 1, Riverside, and
SAV
d =

BMP Retrofit Pilot Program Final Report
January 2004
6-4
100 percent impervious area (a conservative assumption), the unit basin storage volume was 119.2 m3/ha. The basin storage volume was determined by the equation:
V = 119.2 m3/ha * Catchment Area
The trench volume was determined by assuming that 30 percent void space would remain after filling the trench with rock, which was the recommendation of the supplier. The site constraints for the trench were a width of 2 m and length of about 45 m. The depth was determined by dividing the volume by the surface area, as shown in the previous equation. The time to drain was determined by dividing the WQV by the infiltration rate. The recommended maximum depth for an infiltration trench is 2.5 m (Schueler, 1987), but both trenches were deeper than this recommended value because of horizontal area sizing constraints.
The trench rock specified for each infiltration trench was originally 25 mm to 75 mm but was changed to 100 mm minus, a locally available rock. The exact specification is shown in Table 6-4. There is a difference in the rock specified for each infiltration trench, but differences in trench rock size have little effect on the void space available.
Table 6-4 Infiltration Trench Rock Specifications
Carlsbad MS Altadena MS
Sieve Size mm % Passing Sieve Size
mm % Passing
100 100 75 100
75 50-80 38 87-100
50 0-20 25 30-65
37.5 0-5 19 0-12
A biofiltration strip was designed to intercept runoff before it entered the infiltration trench at each location. The strips were to provide pretreatment by removing sediment. Shown in Figures 6-1 and 6-2 are the infiltration trenches and associated biofiltration strips. Figure 6-3 presents a schematic diagram of an infiltration trench.

BMP Retrofit Pilot Program Final Report
January 2004
6-5
Figure 6-1 Carlsbad Maintenance Station
Figure 6-2 Altadena Maintenance Station

BMP Retrofit Pilot Program Final Report
January 2004
6-6
Figure 6-3 – Schematic of Infiltration Trench
6.3 Construction
Issues that occurred during construction of the infiltration trenches centered on constructability issues, unknown field conditions, and operational impacts to maintenance stations.
6.3.1 Constructability Issues
The design of the infiltration trench originally specified the use of 25 mm to 75 mm rock as backfill material. During construction, it was found that this rock gradation was unavailable locally and would have to be brought in from out of state. To avoid delays, the backfill material was changed to “100 mm minus” natural rounded rock, which was available locally. The change did not significantly affect the storage volume of the infiltration trenches but was a deviation from the original design specification.
6.3.2 Unknown Field Conditions
Problems with the excavation of the infiltration trenches included encountering unsuitable materials, underground utility conflicts, utility easement conflicts, and excavation pavement problems. Unsuitable materials (wet clayey soil) were encountered at the Carlsbad site in an area to be paved adjacent to the trench, requiring removal and replacement with aggregate base to get sheet flow back to the site. Geotechnical

BMP Retrofit Pilot Program Final Report
January 2004
6-7
reinforcing fabric recommended by the geotechnical engineer was utilized to stabilize the unsuitable materials, minimizing unsuitable material removal and replacement.
In constructing BMPs within maintenance facilities, underground utility lines serving the facility were routinely encountered. Underground utilities in maintenance stations may have been modified numerous times as changes occurred at the station, and existing documentation of utility locations in maintenance stations may be unreliable. Replacement, rerouting, or avoidance of the utility represents an additional cost and often results in project delays. Better as-built plans could reduce the number of contract change orders by correctly identifying the location of utilities; however, hydraulic considerations may require that a BMP be sited in a certain location despite the presence of identified conflicts.
There are often easements to utility service providers within Caltrans maintenance facilities. Although the land is state property, the easement holder can place restrictions on or even prohibit construction within an easement, depending on the rights provided in the easement documents. At the Altadena MS the area originally proposed for the infiltration trench (parallel to the curb and behind the existing concrete storage bays) was within an easement granted to the City of Pasadena Water Department and the Foothill Municipal Water District. Two water mains ran parallel to the curb, and no construction was permitted within the easement. Neither the easement nor the water mains were shown on the as-built drawings or were known to the Maintenance Station Supervisor or the Caltrans Permit Inspector. Work was subsequently suspended while the BMP design was modified to avoid any construction within the easement.
For construction within paved areas, the existing pavement is typically sawcut to provide a firm edge to join to the new paving. In some cases, the existing pavement condition was such that disturbance by the BMP construction caused it to become unserviceable. The unsuitable pavement section had to be removed and replaced at the Altadena MS. Although the pavement was somewhat deteriorated prior to construction, it would not otherwise have required replacement. At the Carlsbad MS, saw-cutting the existing pavement caused fractures at the proposed joint location. The fractured pieces had to be removed in order to make a suitable joint between the existing and new pavement section.
6.3.3 Impacts to Maintenance Stations
Maintenance stations were impacted by the loss of the available space normally used for parking vehicles or for storing equipment and materials. Access to certain areas within the maintenance station was blocked during construction. This restricted the hours of various construction activities. In some cases, the sequence of operations was unacceptable to the operators of the maintenance stations. At Altadena, three existing storage bins were demolished to provide space for BMP installation and had to be replaced and relocated prior to construction of the trench at a cost of almost $60,000.

BMP Retrofit Pilot Program Final Report
January 2004
6-8
6.4 Maintenance
A formal maintenance program was established to maintain the infiltration trenches at the highest level. Sites were inspected monthly for general maintenance items that included checking the inlet structure, side slopes and overall site for signs of erosion, woody vegetation, graffiti, and vandalism, and indications of burrowing rodent activity that could endanger the structural integrity of the site. In addition, monthly and before every target storm, the sites were inspected for trash and debris accumulation in the inlet structures. Other maintenance items included inspection for vectors monthly and after every target storm.
To ensure that the infiltration trenches met the required drain time of 72 hours for the design storm, the water level in the monitoring well at each site was observed after each target storm. Sediment accumulation in the invert was inspected monthly during the dry season and after every storm greater than 12.5 mm. The trenches were inspected annually in May for standing water.
Infiltration trenches required the least maintenance of any of the BMPs evaluated in this study; approximately 17 field hours were spent on the operation and maintenance of each site, not including vector control agency hours. As shown in Figure 6-4, inspection of the infiltration trench was the largest field activity, requiring approximately 8 hr/yr. The time required for inspections reflects the requirements of the MID.

BMP Retrofit Pilot Program Final Report
January 2004
6-9
Figure 6-4 Field Maintenance Activities at Infiltration Trenches (1999-2001)
6.5 Performance
6.5.1 Chemical Monitoring
Constituent removal is considered 100 percent for this technology for storm events smaller than the water quality design storm, since the entire runoff volume is infiltrated and no water is discharged to surface waters.
Baseline sampling was conducted prior to construction and during operation of the infiltration trenches; however, it is difficult to understand groundwater movement and due to the relatively short timeframe of the project it is not possible to draw any conclusions from the data.
Collection of samples from the vadose zone was attempted at the Altadena maintenance stations because the groundwater depth was greater than 10 m below the trench floor, as well as at Carlsbad maintenance station where groundwater was 2 m below the trench floor. For the vadose samples, a lysimeter was installed and samples were to be collected at a depth of 1 - 2 m below the trench floor; however, samples were never successfully collected despite repeated attempts. Based on review of the sampling procedures, site lithology and performance of the lysimeters, the most likely causes preventing the

BMP Retrofit Pilot Program Final Report
January 2004
6-10
lysimeters from collecting samples was that the silica flour encasing the lysimeter may have dried out and/or water was not available to be collected.
6.5.2 Empirical Observations
During and after each target storm event, observations were made at the infiltration trench sites. At the Carlsbad MS and Altadena MS infiltration trenches, it was observed that water was flowing out of the trench overflow for storm events larger than the design storm. This occurred on four occasions at Altadena and five occasions at Carlsbad. As designed, the infiltration trenches filled and discharged through the overflow pipe or overflow weir.
The Altadena MS never took more than approximately 36 hours for complete infiltration. The Carlsbad site infiltrated at a rate slower than the designed rate and generally took longer than 72 hours to drain; however, no mosquito breeding was observed at either of the trenches.
Sediment deposits were observed on the media at both sites. On two occasions, resuspension of particles was noted where flow enters the infiltration trench at Carlsbad MS. Erosion was noted at Carlsbad MS at the interface between the strip and trench.
6.6 Cost
6.6.1 Construction
Table 6-5 shows the actual construction costs with and without monitoring equipment and related appurtenances for each infiltration trench, with pretreatment biofiltration strip included. The table also presents the cost per cubic meter of water treated, using actual cost without monitoring. The cost per WQV is higher for Carlsbad MS partially due to structurally unsuitable soil below the subgrade that had to be removed and replaced. Carlsbad construction costs include the one biofiltration strip providing pretreatment.
Table 6-5 Actual Construction Costs for Infiltration Trenches and Pretreatment Biofiltration Strip (1999 dollars)
Site Actual Cost, $ Actual Cost w/o Monitoring, $
Costa/WQV $/m3
Altadena MS 293,588 252,845 1,470
Carlsbad MS 202,838 179,620 2,164 a Actual cost w/o monitoring.
SOURCE: Caltrans Cost Summary Report CTSW-RT-01-003.
The adjusted costs for the infiltration trenches and pretreatment strips are presented in Table 6-6. The major reasons for cost adjustment included:

BMP Retrofit Pilot Program Final Report
January 2004
6-11
• Rebuilding storage bins at one location caused greater than usual facility restoration cost. Including the original facility restoration cost would increase the adjusted construction cost for that location by 22 percent. Instead, the average facility reconstruction cost for similar BMPs was used for estimating the adjusted construction cost.
• One location incurred cost due to the limited space available for construction, which would increase the adjusted cost by 56 percent. This cost was excluded from the adjusted construction cost.
• Due to the accelerated nature of construction, sod was used for the vegetated strips. The cost of using soil preparation and hydroseeding in lieu of sod was substituted for the sod cost. Using sod would increase the adjusted cost at one site by 4 percent, while the using hydroseeding cost at the other site had a negligible effect on adjusted cost.
Table 6-6 Adjusted Construction Costs for Infiltration Trenches with Pretreatment Biofiltration Strip (1999 dollars)
Infiltration Trenches Adjusted Construction Cost ($)
Cost/WQV ($/m3)
Mean (2) 146,154 733
High 156,975 775
Low 135,333 691
SOURCE: Adjusted Retrofit Construction Cost Tables, Appendix C.
All infiltration trench installations were in maintenance stations and did not incur traffic control costs. If constructed roadside, infiltration trenches could incur traffic control cost typical of EDBs, in which traffic control accounted for an average of 9 percent of the adjusted construction cost. Traffic control costs were not used to estimate adjusted construction cost.
6.6.2 Operation and Maintenance
Table 6-7 includes average annual hours spent on field activities for the infiltration trenches for the 1999-2001 seasons. Field hours include inspections, maintenance and vector control.

BMP Retrofit Pilot Program Final Report
January 2004
6-12
Table 6-7 Actual Operation and Maintenance Hours for Infiltration Trenches
Average Annual Site Equipment Hours Field Hours
Altadena MS 0 39 Carlsbad MS 0 44
Table 6-8 presents the cost of the average annual requirements for operation and maintenance performed by consultants in accordance with earlier versions of the MID. The operation and maintenance efforts are based on the following task components: administration, inspection, maintenance, vector control, equipment use, and direct costs. Included in administration was office time required to support the operation and maintenance of the BMP. Inspections include wet and dry season inspections and unscheduled inspections of the BMPs. Maintenance included time spent maintaining the BMPs for scheduled and unscheduled maintenance, vandalism, and acts of nature. Vector control included maintenance effort by the vector control districts and time required to perform vector prevention maintenance. Equipment time included the time equipment was allocated to the BMP for maintenance.
Table 6-8 Actual Average Annual Maintenance Effort – Infiltration Trench
Activity Labor Hours Equipment & Materials $
Inspections 8 -
Maintenance 9 0
Vector control* 24 -
Administration 57 -
Direct cost - 723
Total 98 $ 723
* Includes hours spent by consultant vector control activities and hours by Vector Control District for inspections
The hours shown above do not correspond to the effort that would routinely be required to operate an infiltration trench or reflect the design lessons learned during the course of the study. Table 6-9 presents the expected maintenance costs that would be incurred under the final version of the MID for an infiltration trench serving about 2 ha,

BMP Retrofit Pilot Program Final Report
January 2004
6-13
construc ted following the recommendations in Section 6.7. A detailed breakdown of the hours associated with each maintenance activity is included in Appendix D.
Some of the estimated hours are higher than those documented during the study because certain activities, such as sediment removal, were not performed during the relatively short study period. Long-term maintenance (resulting from clogging of trench) was not required during this study; consequently, further research is needed to determine the expected lifetime of this type of device. Design refinements will eliminate the need for activities such as vector control. Only one hour is shown for facility inspection, which is assumed to occur simultaneously with all other inspection requirements for that time period. Labor hours have been converted to cost assuming a burdened hourly rate of $44 (see Appendix D for documentation). Equipment generally consists of a single truck for the crew and their tools.
Table 6-9 Expected Annual Maintenance Costs for Final Version of MID – Infiltration Trench
Activity Labor Hours Equipment and Materials, $ Cost, $
Inspections 1 0 44
Maintenance 23 251 1,263
Vector control 0 0 0
Administration 3 0 132
Materials - 1,200 1,200
Total 27 $1,451 $2,639*
* Rehabilitation cost due to clogging is unknown
6.7 Criteria, Specifications and Guidelines
Based on the results of this study, infiltration trenches are considered technical feasible depending on site specific conditions. This section lists various suggestions for the siting, design, construction, operation, and maintenance of infiltration trenches. These are based on lessons learned through experience and observations made during the project. In deference to advocacy of the State Water Resources Control Board and the local Regional Water Quality Control Boards, the parties in this study worked cooperatively to develop interim guidelines for siting infiltration trenches; however, determination of whether there is a potential threat to groundwater quality requires further investigation. This project was not successful in determining the potential impact to groundwater quality from infiltrated runoff. Additional investigation is also needed to determine the maintenance interval for sediment removal and the extent and frequency to which the trench must be reconstructed during the maintenance operation.

BMP Retrofit Pilot Program Final Report
January 2004
6-14
6.7.1 Siting
The specifications and guidelines for siting infiltration trenches are the same as for infiltration basins. See Section 5.7 for a detailed description of these elements.
6.7.2 Design
Based on the observations and measurements in this study, the following guidelines are recommended:
• Provide pretreatment for infiltration trenches (such as with a biofiltration strip) in order to reduce the sediment load.
• Specify locally available trench rock in the range of 25 - 100 mm.
• Determine the trench volume by assuming the WQV will fill the void space based on the computed porosity of the rock matrix.
• Determine the bottom surface area needed to drain the trench within 72 hours by dividing the WQV by the infiltration rate.
• Calculate trench depth using the following equation:
SARFVWQV
d+
=
where:
D = Trench depth
WQV = Water quality volume
RFV = Rock fill volume
SA = Surface area
• The use of vertical piping, either for distribution or infiltration enhancement shall not be allowed to avoid device classification as a Class V injection well per 40 CFR146.5(e)(4).
• Provide observation well to allow observation of drain time.

BMP Retrofit Pilot Program Final Report
January 2004
6-15
6.7.3 Construction
Listed below are guidelines that should improve the construction process:
• Sufficient borings should be made before the job is put out for bid to determine the presence of any unsuitable materials and consequently to avoid the delays and expense incurred with contract change orders.
• Stabilize the entire area draining to the facility before construction begins. If impossible, place a diversion berm around the perimeter of the infiltration site to prevent sediment entrance during construction. Stabilize the entire contributing drainage area before allowing any runoff to enter once construction is complete.
6.7.4 Operation and Maintenance
Based on the level of maintenance required in this study, recommended future maintenance activities include:
• Perform inspections and maintenance as recommended in the MID (Version 17) in Appendix D, which includes inspection for standing water, trash and debris, sediment accumulation and general maintenance.
• Observe drain time for the design storm after completion or modification of the facility to confirm that the desired drain time has been obtained.
• Schedule semiannual inspections for the beginning and end of the wet season to identify potential problems.
• Remove accumulated trash and debris in the trench at the start and end of the wet season.
• Inspect for accumulated sediment at the beginning and end of wet season. If sediment is visible on top of the trench, remove top layer of trench, silt, filter fabric and stone; wash stone and reinstall fabric and stone into trench.
• Inspect for standing water at the end of the wet season.
• If it is observed by observation well or surface observation that the trench is clogging, a possible corrective action could include further stabilizing the contributing drainage or by installing additional pretreatment devices before the trench is rehabilitated. If only the filter fabric at the tip of the trench is clogging, it can be removed and replaced before clogging progresses further.

BMP Retrofit Pilot Program Final Report
January 2004
7-1
7 BIOFILTRATION SWALES
7.1 Siting
Six biofiltration swales were sited, constructed and monitored for this study: four in District 7 and two in District 11. Natural topographic lows and existing roadside ditches were the primary candidates for conversion to engineered swales. General criteria used for siting the swales included:
• Tributary areas of less than about 4 ha
• Slopes no greater than 5 percent
• A seasonal high water table at least 0.3 to 0.6 m below the surface
The linear nature of the highway system did not provide as many siting opportunities for swales as had been expected. Many of the swales, including three of the four in District 7, were sited in open areas associated with highway interchanges. Site constraints that restricted installation parallel to highways included:
• The mostly impervious nature of rights-of-way in these highly urban areas
• Highways built on fill
• Lack of adjacent right-of-way
• Sound walls and other structural elements located adjacent to the highways
• Concerns about safe access for operation, monitoring, and maintenance crews
Each of the swales treated runoff from highways. The other characteristics of the contributing watersheds for each of the swale installations are summarized in Table 7-1. A typical installation is shown in Figure 7-1 and a schematic diagram is presented in Figure 7-2.
Table 7-1 Summary of Contributing Watershed Characteristics for Biofiltration Swales
Site Watershed Area Hectare
Impervious Cover %
I-605/SR-91 0.08 95
I-5/I-605 0.28 95
Cerritos MS 0.16 95
I-605/Del Amo Avenue 0.28 95
SR-78/Melrose Drive 0.96 90
I-5/Palomar Road 0.92 90

BMP Retrofit Pilot Program Final Report
January 2004
7-2
Figure 7-1 Typical Swale (SR-78/Melrose Drive)
Figure 7-2 Schematic of Biofiltration Swale and Strip

BMP Retrofit Pilot Program Final Report
January 2004
7-3
Important considerations for the siting and use of vegetative controls are whether the climate of the area provides suitable growing conditions and whether the existing soil will support the vegetation. A monoculture of salt grass was used for this pilot study. Irrigation was provided at all sites to help establish the vegetation for the pilot study. Once irrigation ended, a mixed vegetation assemblage became established naturally at many of the biofilter sites, indicating that a monoculture of salt grass is not naturally sustainable. These additional species with varying moisture preferences and seasonality appeared to improve the overall vegetated coverage as the sites recovered from periodic disturbances.
Swales are versatile and have potential use both along highways and in auxiliary Caltrans facilities, such as maintenance bases, truck inspection stations, park-and-ride lots, and rest areas. Swales lend themselves well to being part of a “treatment-train” system of BMPs and should be considered whenever siting other BMPs that could benefit from pretreatment, especially infiltration basins and trenches.
7.2 Design
Retrofitting biofiltration swales into the existing drainage system was facilitated by the relatively small head loss associated with this technology. The major design criteria for the swales included:
• Minimum hydraulic residence time of 5 minutes, target of 9 minutes
• Maximum velocity of 0.3 m/s for the water quality design storm
• Maximum longitudinal slope of 5 percent
• Bottom width of 0.6-2.5 m
• Water depth calculated with Manning’s equation using a roughness coefficient (n) of 0.2, with the depth about one-half the vegetation height
The actual design parameters for the individual sites are shown in Table 7-2. The guidelines used to design the test sites were mostly successful in creating installations that performed effectively. Each of the swales in District 7 was designed with a stilling basin at the entrance to provide energy dissipation and flow spreading; however, the standing water in them allowed mosquito breeding. A total of 21 mosquito abatement actions were required at the swales in District 7, compared with none at the District 11 sites. Grouting of the District 7 stilling basins eliminated standing water at the sites and stopped the breeding.
One of the main design constraints for several of the biofiltration swales was the protection of existing vegetation, particularly mature trees. This was especially true in

BMP Retrofit Pilot Program Final Report
January 2004
7-4
areas where a permit was required from the California Coastal Commission or the project was within the boundaries of a local coastal program. Many areas along highways where swales could be implemented may face this same obstacle. However, swale design is flexible enough that this usually not an insurmountable obstacle.
A key element for the performance and viability of biofiltration systems is the selection of the appropriate vegetation for the climate and soil conditions. For the Pilot Study, salt grass (Distichlis spicata) was selected because it is a native plant, is perennial, and adapts to conditions in the area (it should not require irrigation if planted at the right time of year). In addition, salt grass was selected because it could be grown as sod, which was judged to provide the best means of achieving full coverage in a short time schedule.
Table 7-2 Design Characteristics of the Biofiltration Swales
Site Design Storm mm
Peak WQ Flow, L/s
Length m
Width m Slope
I-605/SR-91 25 2 40 1.5 0.020
I-5/I-605 25 7 40 2 0.020
Cerritos MS 25 4 20 1.5 0.021
I-605/Del Amo Avenue
25 6 54 1 0.020
SR-78/Melrose Drive*
46 106 20
86
3
6
0.008
I-5/Palomar Road 33 47 142 3 0.0014
* - Melrose has 20 m at a width of 3 m and 86 m at a width of 6 m.
There were two problems associated with this decision. First, salt grass is a warm season grass that is dormant during the winter. Plantings installed in the fall do not become established until the following warm season (May to September). Irrigation was required for initial establishment of salt grass plantings because soil moisture was insufficient during the summer growing season. The second problem was the decision to plant only one species. A monoculture is typically more susceptible to pests, disease, and invasion by weeds, whereas a mix of different species is more resilient to disturbance (URS, 1999b, see Appendix B). Appropriate species for a plant mix are identified in Section 7.7.2.
Future biofilter installations should use a mix of plant species. The salt grass plantings have been successful at achieving the desired initial cover, but this success required a substantial level of effort. Other species combinations may perform the same function with lower short-term and long-term costs.

BMP Retrofit Pilot Program Final Report
January 2004
7-5
In some cases, more land was available than required to meet the minimum hydraulic residence times for the biofiltration swales. Consequently, two of the biofiltration swales, at I-5/I-605 and I-605/Del Amo, were modified during the bid period to make more use of the available space and increase the hydraulic residence time of the biofilters. Two widths and lengths are shown for the SR-78/Melrose site, because the first 20 m of the swale is only 3 m wide and expands to the larger dimensions shown in Table 7-2.
All of the swales are in-line devices, meaning they also convey the flood control discharge. The maximum velocity under drainage design conditions was maintained at 1.2 m/s or less to ensure the vegetation was not scoured.
The construction specifications could be improved by requiring appropriate fertilizer and soil amendments in addition to an establishment schedule that includes irrigation. Fertilizing based on actual plant requirements in relation to nutrition provided by the soil would reduce nutrient discharges. To accomplish this, soil should be tested for nutrients and expert guidance used to specify the fertilizer and its application rate for the selected plants. These measures may improve the removal of nutrients in biofilters.
7.3 Construction
As mentioned above, protection of existing trees along the right-of-way and the requirement for rapid establishment of the new vegetation were the main construction constraints. Since the Coastal Commission required that areas within the canopy of existing trees not be extensively disturbed, short concrete channels were constructed to convey the runoff around the trees at the Palomar site.
Rapid vegetation establishment was desired since the projects were located in existing flow areas that would otherwise be subject to erosion and scour; consequently, grass was established through the use of sod. Although this was more expensive than using seed, the sod provided high initial soil stability in the channels where it was installed. Plantings were installed according to the specifications, mainly along the floor of the swales, while hydroseeding was used to stabilize the side slopes.
Winter dormancy affected the quality of plant material installed at the biofilter sites. The nursery contract for sod was implemented in mid-August 1998 because of state budgetary constraints. Plantings were established at the nursery very late in the growing season and most of the sod flats had less than 40 percent cover when they were installed at the pilot sites in December 1998 and February 1999. Once the plantings were installed, low temperatures and low precipitation substantially delayed the establishment of the salt grass. Irrigation was required at all of the sites for the first year to establish the salt grass, but was not used on the hydroseeded areas. These latter areas generally failed to establish a thick vegetative cover.

BMP Retrofit Pilot Program Final Report
January 2004
7-6
7.4 Maintenance
Maintenance activities specified in the MID included weekly inspections for endangered species, and monthly inspections for condition of inlet and outlet structures, side slope stability, debris and sediment accumulation, vegetation height, and presence of burrowing animals. Vegetation was trimmed to 150 mm when the height exceeded 250 mm. Since a monoculture of salt grass was specified, weeds and woody vegetation were removed when observed. The maintenance was later revised to allow other non-woody plant species to compete with the monoculture.
The number of hours of field maintenance activities is shown in Figure 7-3. An average of about 91 hr/yr per site were spent on these activities, with vegetation-related tasks responsible for about 50 of these. This does not include vector control agency hours, which was approximately 42 hours. All of the hours for structural repair were incurred at a single site, Cerritos MS, where the swale was constructed at the bottom of a fill slope and a berm was used to confine the flow. Gopher burrows in the berm consistently compromised structural integrity at this site, allowing water to bypass the swale through the gopher holes. Chicken wire was placed inside the berm to provide a barrier to prevent gophers causing further damage. This extra measure to stabilize the berm was unsuccessful, as the gophers were able to penetrate the wire fence.
At other locations concern about burrowing owls, an endangered species that nest in abandoned gopher burrows, resulted in unsuccessful efforts to eradicate the gophers. Traps were set at the Cerritos, I-605/SR-91 and I-5/I-605 biofiltration swales to capture gophers and prevent damage to the biofilters. The traps were removed at the end of the 1999/2000 wet season after it was decided that eradication of gophers in highway rights-of-way was impractical.

BMP Retrofit Pilot Program Final Report
January 2004
7-7
Figure 7-3 Field Maintenance Activities at Swale Sites (1999-2001)
7.5 Performance
7.5.1 Chemical Monitoring
The constituent concentration changes observed in the chemical monitoring program are shown in Table 7-3. The column titled “Significance” is the probability that the influent and effluent concentrations are not significantly different, based on an ANOVA. Since the effluent concentrations for most constituents were not significantly different among the sites (P<0.05), the data from all the sites were combined to calculate effectiveness. The load reduction shown in Table 7-4 is the total reduction expected for all the sites in a typical year and is greater than the concentration reduction because of the amount of infiltration that occurs. It should be noted that at Palomar, runoff from the freeway entered the swale along its entire length rather than just through the influent sampling location. Consequently, the influent volumes at this site were estimated as the sum of the measured influent volume and the expected contribution from the ungauged areas assuming a constant runoff coefficient.
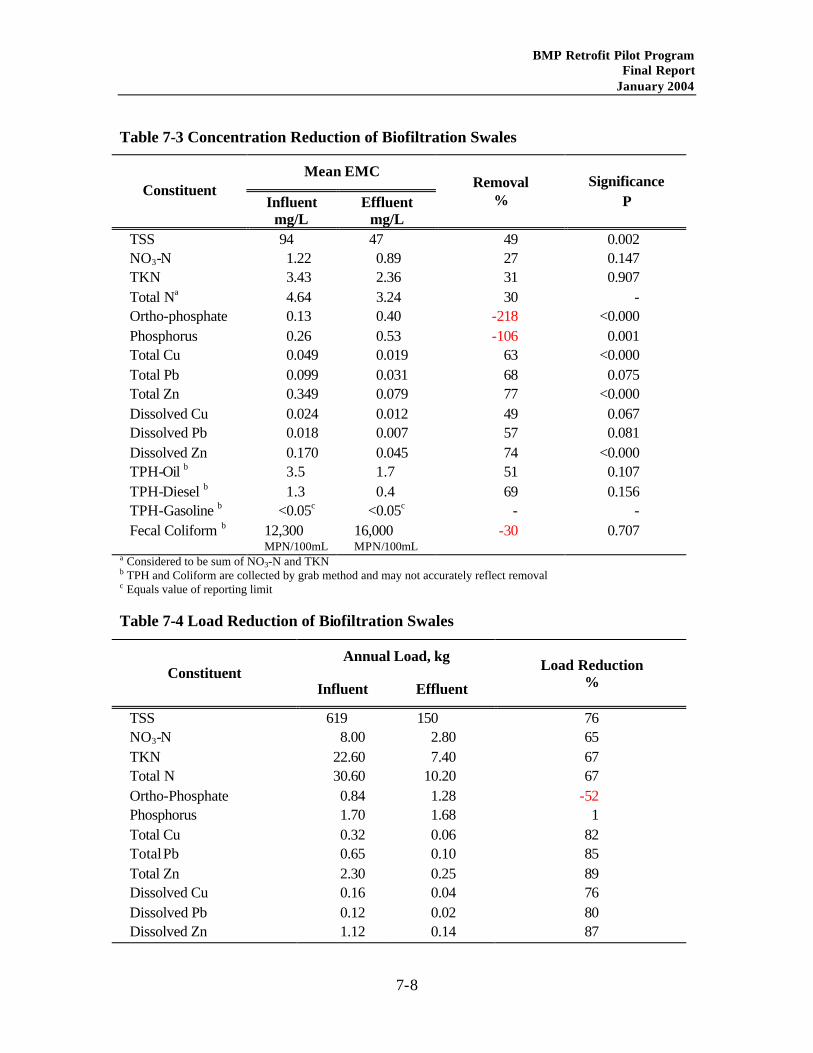
BMP Retrofit Pilot Program Final Report
January 2004
7-8
Table 7-3 Concentration Reduction of Biofiltration Swales
Mean EMC Constituent
Influent mg/L
Effluent mg/L
Removal %
Significance P
TSS 94 47 49 0.002 NO3-N 1.22 0.89 27 0.147 TKN 3.43 2.36 31 0.907 Total Na 4.64 3.24 30 - Ortho-phosphate 0.13 0.40 -218 <0.000 Phosphorus 0.26 0.53 -106 0.001 Total Cu 0.049 0.019 63 <0.000 Total Pb 0.099 0.031 68 0.075 Total Zn 0.349 0.079 77 <0.000 Dissolved Cu 0.024 0.012 49 0.067 Dissolved Pb 0.018 0.007 57 0.081 Dissolved Zn 0.170 0.045 74 <0.000 TPH-Oil b 3.5 1.7 51 0.107 TPH-Diesel b 1.3 0.4 69 0.156 TPH-Gasoline b <0.05c <0.05c - - Fecal Coliform b 12,300
MPN/100mL 16,000 MPN/100mL
-30 0.707
a Considered to be sum of NO3-N and TKN b TPH and Coliform are collected by grab method and may not accurately reflect removal c Equals value of reporting limit
Table 7-4 Load Reduction of Biofiltration Swales
Annual Load, kg Constituent
Influent Effluent
Load Reduction %
TSS 619 150 76 NO3-N 8.00 2.80 65 TKN 22.60 7.40 67 Total N 30.60 10.20 67 Ortho-Phosphate 0.84 1.28 -52 Phosphorus 1.70 1.68 1 Total Cu 0.32 0.06 82 Total Pb 0.65 0.10 85 Total Zn 2.30 0.25 89 Dissolved Cu 0.16 0.04 76 Dissolved Pb 0.12 0.02 80 Dissolved Zn 1.12 0.14 87

BMP Retrofit Pilot Program Final Report
January 2004
7-9
Higher removals were observed for metals than for many of the other constituents. The worst performance was for phosphorus, which generally had higher effluent than influent concentrations. The concentration reductions observed for metals are generally better than those compiled by Young et al. (1996). For instance, Young reported concentration reductions for total copper of 46 percent, lead 67 percent, and zinc 63 percent. Reduction of TSS and phosphorus was less than that compiled by Young (83 percent and 29 percent respectively). The increase in fecal coliform concentrations has been reported in other studies such as Barrett et al. (1998), but the amount of phosphorus export was unusual.
Much of the observed load reduction is a function of the amount of infiltration that occurred in the swales. On average, about 50 percent of the runoff that entered the swales infiltrated and was not discharged to surface waters. The amount of infiltration varied greatly with Melrose experiencing the most (80 percent) and I-605/Del Amo the least (33 percent). This high rate of infiltration occurred despite generally unfavorable characteristics for infiltration found in attempting to site infiltration BMPs in the same regions. This is an interesting finding and highlights the importance of vegetation and soil in managing storm runoff quantity and quality.
The load reduction observed in this study is generally comparable to that measured by Barrett et al. (1998) in highway medians and adjacent vegetated channels designed solely for stormwater conveyance. Consequently, swales and other vegetated surfaces that are not engineered specifically for water quality may still provide substantial water quality benefit. Overall, the average load reduction observed for metals in this study also is comparable to that observed in more complex devices such as media filters.
The results of the linear regression analysis of influent and effluent EMCs are shown in Table 7-5. Of the constituents analyzed, only the phosphorus effluent concentrations were independent of influent concentrations. This suggests that a source of phosphorus exists within the swale that is leached at a rate relatively independent of influent concentration. An experiment was conducted to determine whether the salt grass itself was a substantial source of the phosphorus. Results are shown in Appendix F. This track was explored because of a unique property of salt grass. This plant has specialized glands in the leaves that secrete excessive salt, allowing the rain to wash it away (Figure 7-4). Since plant growth is normally nitrogen limited, there is excess phosphorus in the soil moisture that might be transported from the ground to the leaf surface.

BMP Retrofit Pilot Program Final Report
January 2004
7-10
Figure 7-4 Salt Crystals on the Leaves of Salt Grass
Samples of both Bermuda grass and salt grass were collected from several sites in District 11 during the wet season and were placed in deionized water for 1 hour. At the end of this time the water was decanted and analyzed for total and dissolved phosphorus. In most cases, the phosphorus concentrations were about twice as large in the water samples that contained salt grass as in those that contained Bermuda. This indicates that phosphorus can be leached from both plant species during their dormant season. The generally higher concentrations that were observed for the salt grass may be related to dissolution of the salt crystals.

BMP Retrofit Pilot Program Final Report
January 2004
7-11
Table 7-5 Predicted Effluent Concentrations -Biofiltration Swales
Constituent Concentrationa Uncertainty, ±
TSS 0.42x + 11.0 ( ) 5.02
000,1395.84
391
6.54
−+
x
NO3-N 1.31x - 0.03 ( ) 5.02
1.671.0
381
69.0
−+
x
TKN 0.78x + 0.42 ( ) 5.02
7409.2
401
50.1
−+
x
Particulate P 0.22 0.11
Ortho-phosphate 0.40 0.12
Particulate Cu 0.18x +2.33 ( ) 5.02
520,74.19
371
80.5
−+
x
Particulate Pb 0.28x + 3.5 ( ) 5.02
000,24467
391
4.29
−+
x
Particulate Zn 0.11x + 13.8 ( ) 5.02
000,449141
381
9.30
−+
x
Dissolved Cu 0.55x +3.3 ( ) 5.02
425616
391
13.8
−+
x
Dissolved Pb 0.49x + 3.5 ( ) 5.02
946613
391
87.8
−+
x
Dissolved Zn 0.40x + 7.7 ( ) 5.02
600,21399
391
6.58
−+
x
a Concentration in mg/L except for metals, which are in µg/L; x = influent concentration

BMP Retrofit Pilot Program Final Report
January 2004
7-12
7.5.2 Empirical Observations
As mentioned above, infiltration in the swales was a significant factor in the reduction of constituent loads. Empirical observations during storm events indicated that normally the discharge from the swale did not occur until the moisture in the swale was relatively high. There was generally insufficient discharge for monitoring until at least February of each year.
A problem in swales is channelization, where the runoff is confined to a fairly small region of the swale; however, runoff was generally evenly distributed across the width of the swale at the study sites and no channelization like that reported in other studies (Colwell et al., 2000) was observed. Channelization was probably avoided because the maximum slope was 2.1 percent. Colwell observed that swales with slopes in the range of 1.5 – 2.5 percent maintained a flat bottom unlike many of those with steeper slopes.
The Cerritos swale was constructed by importing fill to create a berm. Numerous problems were encountered at this site where gophers were active. Gophers continually burrowed through the site and created tunnels through the berm. These tunnels allowed flow to bypass the swale and pick up additional sediment. Consequently, creation of swales with the use of berms should be avoided wherever gophers are expected to be active.
Although there is no formal mechanism for litter control in swales, the swales generally retained accumulated litter as documented during the scheduled maintenance visits. For most of the sites, the water depths in the swales were generally not high enough to transport trash and debris. The amount of bypassed litter was not quantified because there was no downstream litter monitoring.
At many of the swale sites other vegetative species introduced naturally or through erosion control efforts competed successfully with the salt grass. Frequent weeding of the sites was needed initially since the MID required pulling weeds over 300 mm high monthly. Later in the study this practice was halted to allow other native non-woody vegetation to establish.
Adopt-A-Highway volunteers inadvertently cut the vegetation below the MID specifications at the Palomar swale in October 2000. The salt grass had difficulty recovering since it is dormant during the winter months. Consequently, weeds were able to overrun the site and many bare spots were created when weeds higher than 300 mm were removed. In addition, extensive gopher damage further reduced the vegetation coverage. A similar situation occurred at the Cerritos swale where the vegetation was cut below the MID specifications. However, at Cerritos, the site was not weeded, and different types of vegetation, primarily Bermuda grass, met the minimum requirement for cover. These inappropriate mowing events demonstrate the need to coordinate all operations and maintenance activities in the highway right-of-way environment. Signage was subsequently used during the pilot study to avoid recurrence of this problem.

BMP Retrofit Pilot Program Final Report
January 2004
7-13
7.6 Cost
7.6.1 Construction
Table 7-6 shows the actual construction costs with and without monitoring equipment and related appurtenances for each biofiltration swale site. The table also presents the cost per cubic meter of water treated, using actua l cost without monitoring. The two sites in District 11 (SR-78/Melrose and 1-5/Palomar Airport Road) have the lowest cost per WQV and treat the largest area. The sites that treated the smallest total tributary area had a higher unit cost per WQV. This observation tends to support the presence of significant economies of scale for biofiltration swales.
Table 7-6 Actual Construction Costs for Biofiltration Swales (1999 dollars)
Site Actual Cost, $ Actual Cost w/o Monitoring, $
Costa/WQV $/m3
I-605/SR-91b 64,544 42,820 2,192
I-5/I-605 99,734 73,179 1,125
Cerritos MS 60,383 31,992 780
I-605/Del Amo Avenue 127,823 70,138 1,031
SR 78/Melrose Drive 142,418 133,077 332
I-5/Palomar Road 137,336 136,174 246 a Actual cost w/o monitoring. b Adjusted Retrofit Construction Cost Tables; included in Appendix C SOURCE: Caltrans Cost Summary Report CTSW-RT-01-003.
Adjusted construction costs for the swales are presented in Table 7-7. The major reasons for cost adjustment included:
• Due to the accelerated nature of construction, sod was used for the swales. The cost of using soil preparation and hydroseeding in lieu of sod was substituted for the sod cost. Using sod would increase the adjusted cost by 5 percent to 58 percent. The larger the biofilter, the larger the percent change in adjusted cost because the cost of vegetation begins to dominate the total project cost. The additional cost for using sod was excluded from the adjusted construction cost.
• At the Cerritos MS, limited head required additional grading costs. This cost would increase the adjusted cost by 15 percent. This cost was excluded from the adjusted cost.

BMP Retrofit Pilot Program Final Report
January 2004
7-14
• The four swales in District 7 had costs associated with vector control issues that would not have occurred with proper design. These costs would increase the individual adjusted costs by 6 percent to 9 percent. These costs were excluded from the adjusted cost.
• Adjustments to cost attributed to the level of contractor experience caused both increases and decreases to the adjusted cost. Excluding the cost adjustments for contractor experience would result in adjusted cost changes of –12 percent to 27 percent. These cost changes were included in the adjusted cost.
Table 7-7 Adjusted Construction Costs for Biofiltration Swales (1999 dollars)
Swales Adjusted Construction Cost, $
Cost/WQV $/m3
Mean (6) 57,818 752
High 100,488 2,005
Low 24,546 182
SOURCE: Adjusted Retrofit Construction Cost Tables, Appendix C.
The adjusted traffic control costs account for 28 percent of the total swale adjusted construction cost, excluding the swale near Cerritos MS which only had 7 percent of its adjusted cost attributed to traffic control. Construction crews accessed the Cerritos MS via a surface street, rather than the freeway.
7.6.2 Operation and Maintenance
Table 7-8 shows the average annual operations and maintenance hours for each biofiltration swale. The I-605/Del Amo Avenue swale required additional irrigation in October and November 1999 to restore the vegetation after it was "weeded" by Caltrans maintenance personnel. Field hours include inspections, maintenance and vector control.
Table 7-9 presents the cost of the average annual requirements for operation and maintenance performed by consultants in accordance with earlier versions of the MID. The operation and maintenance efforts are based on the following task components: administration, inspection, maintenance, vector control, equipment use, and direct costs. Included in administration was office time required to support the operation and maintenance of the BMP. Inspections include wet and dry season inspections and unscheduled inspections of the BMPs. Maintenance included time spent maintaining the BMPs for scheduled and unscheduled maintenance, vandalism, and acts of nature. Vector control included maintenance effort by the vector control districts and time

BMP Retrofit Pilot Program Final Report
January 2004
7-15
required to perform vector prevention maintenance. Equipment time included the time equipment was allocated to the BMP for maintenance.
Table 7-8 Actual Operation and Maintenance Hours for Biofiltration Swales
Average Annual District Site Equipment Hours Field Hours
I-605/SR-91 29 133 I-5/I-605 20 136 Cerritos MS 34 169 I-605/Del Amo Avenue
72 146 7 (Los Angeles)
Average Value 39 146 SR-78/Melrose Drive 1 106 I-5/Palomar Road 2 107 11 San Diego) Average Value 1 106
Table 7-9 Actual Average Annual Maintenance Effort – Biofiltration Swales
Activity Labor Hours Equipment & Materials $
Inspections 11 -
Maintenance 80 126
Vector control* 42 -
Administration 113 -
Direct cost - 2110
Total 246 $ 2,236
* Includes hours spent by consultant vector control activities and hours by Vector Control District for inspections
The hours shown above do not correspond to the effort that would routinely be required to operate a biofiltration swale or reflect the design lessons learned during the course of the study. Table 7-10 presents the expected maintenance costs that would be incurred under the final version of the MID for a swale serving about 2 ha, constructed following the recommendations in Section 7.7. A detailed breakdown of the hours associated with each maintenance activity is included in Appendix D.

BMP Retrofit Pilot Program Final Report
January 2004
7-16
Some of the estimated hours are higher than those documented during the study because certain activities, such as sediment removal, were not performed during the relatively short study period. Design refinements will eliminate the need for activities such as vector control. Labor hours have been converted to cost assuming a burdened hourly rate of $44 (see Appendix D for documentation). Equipment generally consists of a single truck for the crew and their tools.
Table 7-10 Expected Annual Maintenance Costs for Final Version of MID – Biofiltration Swales
Activity Labor Hours Equipment and Materials, $ Cost, $
Inspections 1 0 44
Maintenance 47 182 2,250
Vector control 0 0 0
Administration 3 0 132
Materials - 310 310
Total 51 $492 $2,736
7.7 Criteria, Specifications and Guidelines
Based on the findings of this study, swales are considered technically feasible depending on site specific conditions; however, a number of questions remain about their operation and deployment. This study implemented a monoculture of salt grass at all the biofilter sites, so the effectiveness of other grass species for pollutant removal was not quantified. Additional information would also be useful on the minimum vegetation density for effective operation and the limit of their deployment for other areas based on rainfall and climate considerations.
7.7.1 Siting
Based on the results of this study, the primary siting criteria that are recommended for future installations include the following:
• Site swales in natural lows and in cut sections to prevent structural problems caused by burrowing animals.
• Be sure that any proposed site receives sufficient sunlight to support a dense growth of vegetation.

BMP Retrofit Pilot Program Final Report
January 2004
7-17
• Consider highway interchanges and any linear pervious areas in the right-of-way as the primary locations for siting swales in an urban setting. Siting opportunities may also be found in auxiliary Caltrans facilities, such as maintenance stations, truck inspections stations, park-and-ride lots and rest areas.
• Swales lend themselves to being part of a “treatment-train” system of BMPs. Consider using swales when siting other BMPs that could benefit from pretreatment, especially infiltration basins and trenches. Also look for opportunities to drain over-the-shoulder sheet flow through a biofiltration strip and then into a biofiltration swale.
• Verify that the natural vegetation in the climate provides a dense enough surface to stabilize the bottom of the swale and to provide effective pollutant removal.
7.7.2 Design
As described in the monitoring section, pollutant load reductions of the swales in this study were similar to those observed in studies of vegetated channels along highways designed solely for stormwater conveyance. Consequently, vegetated surfaces appear to be very robust pollution reduction systems that are not sensitive to many design parameters, such as vegetation type, bottom width, etc. The guidelines summarized below proved effective in this study; however, less engineered systems may also provide substantial pollutant removal. Monitoring of alternative configurations to document their benefits relative to those observed in this study is warranted.
Based on the observations and measurements in this study, the following guidelines are recommended:
• Locate, size, and shape biofiltration BMPs relative to topography and extended flow paths to maximize their treatment potential.
• Swales constructed in cut are preferred, or in fill areas that are far enough from an adjacent slope to minimize the potential for gopher damage. Do not use side slopes constructed of fill, which are prone to structural damage by gophers or other burrowing animals.
• The longitudinal slopes should be less than that which causes scour or transport of sediment. (Colwell et al. (2000) recommends less than 2.5 percent)
• Energy dissipaters may be required but use those that do on include standing water in their design, since this leads to vector problems.
• Use a mixture of drought-tolerant native grasses. In southern California, it is preferable to plant species that grow best during the winter and spring (the wet season), and to schedule biofilter establishment accordingly.
• Minimize use of sod as a primary means of establishing or restoring vegetation in bioswales because it results in increased project costs.

BMP Retrofit Pilot Program Final Report
January 2004
7-18
• Use a local erosion control seed mix and planting procedures appropriate for the specific project and location for both the bed and the side slopes. Use of vegetation that occurs naturally in the area can minimize establishment and maintenance costs.
• If channel stability is an issue in the period immediately following construction, consider the use of matting or other temporary erosion control measures rather than specifying the use of sod.
• Local climate should be able to support vegetation without irrigation systems; however, vegetation may become dormant during the dry season without adversely affecting the performance.
Some species suggested for future biofilter plantings in southern California are listed below. (URS, 1999b; included in Appendix B)
Seashore bent grass Creeping wild rye California brome Perennial rye Tufted hair grass Pygmy-leaf lupine Blue wild rye Foothill meddlers Red fescue Purple needle grass Tall (fowl) manna grass Tomcat clover Meadow barley Regreen hybrid wheat grass
All of these species are capable of performing the design functions of the bioswales. Most of these species are cool season grasses that germinate and grow during the winter rainy season. Therefore, these species should require less irrigation and can be implemented with shorter lead times for growing. Most of the species listed above can be grown from plugs or seed and some of them produce rhizomes like salt grass that might be compatible with a sod planting. Install when season allows for establishment without irrigation. Other studies on the performance of swales, such as Barrett et al. (1998), indicate that the grass species selected do not have a significant impact on pollutant removal as long as slopes and channels are stabilized. Consequently, additional species beyond those listed may provide comparable performance.
7.7.3 Construction
Listed below are guidelines that should improve the construction process:
• Include directions in the specifications for use of appropriate fertilizer and soil amendments based on soil properties determined through testing and compared to the needs of the vegetation requirements.
• Install swales at the time of the year when there is a reasonable chance of successful establishment without irrigation; however, it is recognized that rainfall in a given year may not be sufficient and temporary irrigation may be used at the discretion of the Resident Engineer.

BMP Retrofit Pilot Program Final Report
January 2004
7-19
• If sod tiles must be used, they should be placed so that there are no gaps between the tiles; stagger the ends of the tiles to prevent the formation of channels along the swale or strip.
• Use a roller on the sod to ensure that no air pockets form between the sod and the soil.
• Soil preparation should be to the extent necessary to establish the vegetative cover.
Remedial plantings have consisted of salt grass plugs, seed, and transplants. This approach is appropriate for plantings during the growing season, but a modified approach should be used if remedial plantings are required during the fall. Plantings during the late fall and early winter season should include a mix of species. Plants that germinate and actively grow during the cooler months of winter and early spring should be overseeded on bare areas. Physical erosion controls will be necessary to protect seeds for at least 75 days after the first rainfall of the season. Erosion controls might include the placement of a blanket, mulch, or other biodegradable cover over the seeded portion of the site.
7.7.4 Operation and Maintenance
It is important that maintenance crews are familiar with the purpose of the swale and that only authorized individuals provide needed maintenance. Based on the level of maintenance required in this study, recommended future maintenance activities include:
• Perform inspections and maintenance as recommended in MID (Version 17) in Appendix D, which includes inspection of vegetation, observation of flow across swale invert and sediment and debris accumulation.
• Inspect swales at least twice annually for erosion or damage to vegetation, preferably at the end of the wet season to schedule summer maintenance and before major fall runoff to be sure the swale is ready for winter. However, additional inspection after periods of heavy runoff is desirable. The swale should be checked for debris and litter and areas of sediment accumulation.
• Recent research (Colwell et al., 2000) indicates that grass height and mowing frequency have little impact on pollutant removal. Consequently, mowing may only be necessary once or twice a year for safety or aesthetics or to suppress weeds and woody vegetation.
• Trash tends to accumulate in swale areas, particularly along highways. The need for litter removal is determined through periodic inspection, but litter should always be removed prior to mowing.
• Sediment accumulating near culverts and in channels should be removed when it builds up to 75 mm at any spot, or covers vegetation.
• A healthy dense grass should be maintained in the channel and side slopes. Grass damaged during the sediment removal process should be replaced per the MID.
• The Caltrans Integrated Vegetation Management (IVM) Plan should be implemented for vegetated areas.

BMP Retrofit Pilot Program Final Report
January 2004
8-1
8 BIOFILTRATION STRIPS
8.1 Siting
Biofiltration strips were sited, constructed, and monitored at three sites as a part of this study. Of these, two were located in District 7 and one in District 11. One of the goals of the siting process was to identify sites where this technology could be constructed in conjunction with infiltration devices (trenches) to provide pretreatment, and a ‘treatment-train’ approach. Optimum sites for strips are locations receiving overland sheet flow of runoff; however, monitoring required that the flow at a proposed site be concentrated to facilitate measurement and sample collection.
Additional siting criteria for the strips included:
• Soils and moisture adequate to grow relatively dense vegetative stands
• Sufficient space available
• Slope of less than 12 percent
Two of the strips were installed to pretreat runoff entering infiltration trenches at maintenance stations, while one site in District 7 was constructed as a stand-alone facility along a highway shoulder.
The characteristics of the contributing watersheds for each of the strip installations are summarized in Table 8-1. A typical installation is shown in Figure 8-1 and a schematic diagram is presented in Figure 8-2. The District 11 Carlsbad site contains two strips: one used for pretreatment of an infiltration trench (0.7 ha) and one that discharges directly to a municipal street (0.28 ha).
Table 8-1 Summary of Contributing Watershed Characteristics for Biofiltration Strips
Site Land Use Watershed Area Hectare
Impervious Cover %
Altadena MS Maintenance Station 0.70 100
I-605/SR 91 Highway 0.20 100
Carlsbad MS Trench Maintenance Station 0.70 100
Carlsbad MS Drain Maintenance Station 0.28 100

BMP Retrofit Pilot Program Final Report
January 2004
8-2
Figure 8-1 Biofiltration Strip (District 7, I-605/SR-91)
Figure 8-2 Schematic of Biofiltration Strip and Swale
BMP Retrofit Pilot Program Final Report
January 2004
8-3
Although the required number of strips was successfully sited, narrow shoulders and conflicts with sound walls and other structures suggest that there will not be abundant opportunities fo r retrofit with this technology on existing freeways in the most highly urbanized areas. Freeways often retain pervious areas within the right-of-way in less urbanized areas that could become biofiltration strips when drainage systems are rebuilt during highway reconstruction projects.
An important consideration for the siting and use of vegetative controls is whether the climate of the area provides suitable growing conditions. Irrigation was provided at all sites to help establish the vegetation. Once irrigation ceased, a mixed vegetation assemblage became established naturally at many of the biofilter sites that were initially salt grass sod, indicating that a monoculture of salt grass is not naturally sustainable. These additional species with varying moisture preferences and seasonality appeared to improve the overall vegetated coverage as the sites recovered from periodic disturbances.
These BMPs proved to be versatile and have potential use both along highways and in auxiliary Caltrans facilities, such as maintenance bases, truck inspection stations, park-and-ride lots, and rest areas. Biofiltration strips also are well suited to being part of a “treatment-train” system of BMPs and should be considered whenever siting other BMPs that could benefit from pretreatment, especially infiltration basins and trenches.
8.2 Design
Retrofitting biofiltration strips into the existing drainage system was facilitated by the relatively small head loss associated with this technology. The major design criteria for the strips included:
• Slope of no more than 12 percent
• A minimum recommended length in the direction of flow of a filter strip of 8 m
• No gullies or rills that can concentrate overland flow
• Top edge of the filter strip should be level with the plane of the adjacent pavement
The actual design parameters for the individual sites are shown in Table 8-2.
A key element for the performance and viability of biofiltration systems is the selection of appropriate vegetation for the climate and soil conditions. As with biofiltration swales, salt grass was selected because it is a native plant, perennial, and adapted to conditions in the area. In addition, this species could be grown as sod and it was believed that sod would provide the best means of achieving full cover in the given time schedule. There were two problems associated with this decision. First, salt grass is a warm season grass that is dormant during the winter. Plantings installed in the fall do not become established until the fo llowing warm season (May to September). Irrigation was required for salt grass plantings because soil moisture is insufficient during the summer growing

BMP Retrofit Pilot Program Final Report
January 2004
8-4
season. The second problem was the decision to plant only one species. A monoculture is typically more susceptible to pests, disease, and invasion by weeds, whereas a mix of different species is more resilient to disturbance (URS, 1999b).
Table 8-2 Design Characteristics of the Biofiltration Strips
Site Design Storm
mm
WQ Design Peak Flow
L/s
Length m
Area m2
Slope %
WQV m3
Altadena MS 25 34 8 160 3 172
I-605/SR-91 25 2.8 8 480 2 52
Carlsbad MS Trench 33 37 8 200 1 222
Carlsbad MS Drain 33 17 8 216 1 93
Future biofilter installations should be implemented using a mix of hardy plant species. The salt grass plantings have been successful at achieving the desired cover, but this success has required a substantial level of effort and cost. Other species combinations may perform the same function with lower short-term and long-term costs. A list of species that are suggested for future biofilter plantings in southern California is contained in Section 7.7.2. All of these species are capable of performing the design functions of the biofilters. Most of these species are cool season grasses that germinate and grow during the winter rainy season. Therefore, these species should require less irrigation and can be implemented with shorter lead times for growing. Most of the species can be grown from plugs or seed and some of them produce rhizomes like salt grass that might be compatible with sod planting. Temporary irrigation systems should be considered for all future biofilter installations to supplement natural deficiencies that may occur during plant establishment.
As shown in Table 8-3, there was a wide range of tributary-to-treatment area ratios for the monitored sites. Consequently, the design standard implemented, a width of 8 m, may not be applicable to all sites. The design value was originally derived from Barrett et al. (1998) where it was applied to implementation of strips parallel to highways with a constant pavement width of 15 m, resulting in tributary-to-treatment area ratio of only 2. Since two of the monitored sites were in maintenance stations with treatment areas much larger than the freeway site, the width of 8 m resulted in higher ratios. Because hydraulic loading rates were not a design consideration and removal efficiencies among widely varying loading rates were not distinguishable in this study, the reader is cautioned when reviewing the costs per WQV in the following cost section (Tables 8-8 and 8-9).

BMP Retrofit Pilot Program Final Report
January 2004
8-5
Table 8-3 Treatment Ratios for Biofiltration Strip Sites
Site Tributary Area/Treatment Area Ratio
Altadena MS 43
I-605/SR-91 4
Carlsbad MS w/Trench 35
Carlsbad MS 13
8.3 Construction
A common construction problem encountered at the biofiltration strips was the need to use level spreaders to convert concentrated flow into sheet flow. At the I-605/SR-91 and Carlsbad MS the flows were initially sheet flow, which had to be concentrated so flows could be monitored and then converted back to sheet flow. The Altadena MS originally had concentrated flow, which was monitored and then converted to sheet flow. Flow spreading was a more difficult problem than expected. One of the major difficulties was the construction of a truly level “level spreader.” The level spreaders also tended to hold water between events, creating a potential vector problem. At the Altadena MS, mosquito abatement was required on seven occasions before drain plugs were installed to address this issue. Consequently, implementation of biofiltration strips would be preferred in areas where sheet flow predominates.
Rapid vegetation establishment was needed to meet the time schedule of the Pilot Program; consequently, grass was established through the use of sod. Although this could be more expensive than using seed, the sod provided high initial soil stability where it was installed and avoided the potential for erosion and damage. Irrigation was required at all of the sites for the first year to establish the vegetation.
Winter dormancy also affected the quality of plant material installed at the biofilter sites. The nursery contract was implemented in mid-August 1998 because of delays in approval of the State budget. Plantings were established at the nursery very late in the growing season and most of the sod flats had less than 40 percent cover when they were planted in December 1998 and February 1999. Once the plantings were installed, low temperatures and low precipitation substantially delayed the establishment of the salt grass.
Plantings were installed according to the specifications; however, modifications recommended to the specifications include soil testing, appropriate fertilizer and soil amendments in addition to an establishment schedule that includes irrigation. Fertilizer application rates should be based on actual plant requirements in relation to nutrition provided by the soil and based on soil tests for nutrients and expert guidance.
Remedial plantings (for strip maintenance) have consisted of salt grass plugs, seed, and transplants. This approach is appropriate for plantings during the growing season, but a

BMP Retrofit Pilot Program Final Report
January 2004
8-6
modified approach is recommended if remedial plantings are required during the fall. Plantings during the late fall and early winter season should include a mix of species. Plants that germinate and actively grow during the cooler months of winter and early spring should be overseeded on bare areas.
At the Carlsbad Maintenance Station, establishment of the grass also was hindered by the presence of rabbits, which came into the maintenance yard at night and ate the grass. Once a small fence was installed around the perimeter of the vegetated area, full coverage with the salt grass was rapidly established.
8.4 Maintenance
Maintenance activities were the same as those at the biofiltration swale sites and included weekly inspections for endangered species, and monthly inspections for condition of inlet and outlet structures, side slope stability, debris and sediment accumulation, vegetation height (during the dry season), and presence of burrowing animals. Vegetation was trimmed to 150 mm when the height exceeded 250 mm. Woody vegetation was removed when observed during monthly inspections, weeds were removed only during the first season of plant establishment.
The number of hours of field maintenance activities is shown below in Figure 8-3. An average of about 105 hr/yr were spent on these activities, not including 26 hours for vector control activities. Of these, more than 67 hr/yr were required for vegetation management, included mowing, weeding, irrigation, and rehabilitation of bare areas, to comply with the requirements of the MID. An additional 6 hours were needed just to remove the drain plugs and drain the level spreaders.

BMP Retrofit Pilot Program Final Report
January 2004
8-7
Figure 8-3 Field Maintenance Activities at Strip Sites (1999-2001)
8.5 Performance
8.5.1 Chemical Monitoring
Monitoring of the District 7 Altadena MS and I-605/SR-91 sites consisted of paired influent and effluent samples; however, at Carlsbad (District 11) the influent to the strip providing pretreatment to the infiltration trench was monitored, but the effluent from the second strip was monitored. Therefore, the influent and effluent samples were from different contributing areas. Load and concentration reductions were calculated for Carlsbad under the assumption that the runoff coefficient and influent concentrations were the same for both strips.
The results of the chemical monitoring program are shown in Table 8-4. The column titled “Significance” is the probability that the influent and effluent concentrations are not significantly different, based on an ANOVA. The reduction in constituent concentrations is highly variable, with substantial reductions in sediment and metals, but effectively no reduction in nitrogen species and an increase in phosphorus concentration. The concentration reductions observed at this site are greater for sediment and metals than those compiled by Young et al. (1996), but less than those reported for nutrients. For

BMP Retrofit Pilot Program Final Report
January 2004
8-8
instance, Young reported concentration reductions for TSS of 70 percent, nitrate 10 percent, phosphorus 40 percent, and zinc 40 percent.
The load reduction shown in Table 8-5 is the total reduction expected for all three sites in a typical year. Much of the observed load reduction shown, which is greater than the concentration reduction, is a function of the amount of infiltration that occurred in the strips. On average, 30 percent of the runoff that entered the strips infiltrated and was not discharged to surface waters. There were significant differences among the sites in the amount of infiltration, which was highest at the Carlsbad MS, where about 80 percent of the runoff infiltrated. Losses resulting from infiltration were much less at the I-605/SR-91 site (37 percent) and the Altadena MS (14 percent). The low value at the Altadena MS may have been a function of less strip area relative to the size of the drainage area and occasional bypass of the influent control structure during periods of high intensity rainfall. Like swales, the load reduction for many constituents is comparable to that observed in more complex devices such as media filters.
Surprisingly, the concentration reduction for many constituents at the I-605/SR-91 site was less consistent than that observed at the other two sites, despite the fact it had the smallest tributary area relative to the size of the strip (Table 8-3). When the percent reduction in concentration is calculated using the methodology described in the introduction, the high variance results in a prediction of sediment export. This erratic performance may have been caused by wind blown sediment along the highway shoulder and/or dirt from gopher mounds accumulating in the sample collection trench between storms. The percent reduction of the monitored constituents observed at the Carlsbad site was greater than the other two sites, likely because of the much higher influent concentrations.
The percent reduction in constituent concentrations for the individual strips also was calculated using the geometric mean of the influent and effluent EMCs. The results of this analysis and the amount of infiltration at each site are shown in Table 8-6. The data are not sufficient for determining the maximum tributary area for a biofilter strip because of the relatively poor performance of the I-605/SR-91 site. In addition, all the strips had slopes of less than 3 percent, so no new information relative to the impact of slope on pollutant removal was developed.

BMP Retrofit Pilot Program Final Report
January 2004
8-9
Table 8-4 Concentration Reduction of Biofiltration Strips
Mean EMC Constituent
Influent mg/L
Effluent mg/L
Removal %
Significance P
TSS 100 31 69 <0.000
NO3-N 0.44 0.58 -30 0.367
TKN 2.00 2.10 -5 0.542
Total Na 2.45 2.68 -10 -
Ortho-Phosphate 0.15 0.46 -216 0.047
Phosphorus 0.42 0.62 -46 0.035
Total Cu 0.058 0.009 85 <0.000
Total Pb 0.046 0.006 88 <0.000
Total Zn 0.240 0.066 72 <0.000
Dissolved Cu 0.019 0.007 65 0.004
Dissolved Pb 0.004 0.002 65 0.006
Dissolved Zn 0.073 0.035 53 <0.000
TPH-Oil b 1.7 0.7 59 0.101
TPH-Diesel b 0.9 0.3 66 0.138
TPH-Gasoline b <0.05c <0.05c - -
Fecal Coliform b 17,700 MPN/100mL
1,500 MPN/100mL
92 0.061
a Sum of NO3-N and TKN b TPH and Coliform are collected by grab method and may not accurately reflect removal c Equals value of reporting limit

BMP Retrofit Pilot Program Final Report
January 2004
8-10
Table 8-5 Load Reduction of Biofiltration Strips
Annual Load , kg Constituent
Influent Effluent
Load Reduction %
TSS 183 30 83
NO3-N 1.00 0.60 45
TKN 3.90 2.10 47
Total N 5.00 2.80 44
Ortho-Phosphate 0.25 0.44 -76
Phosphorus 0.70 0.60 7
Total Cu 0.090 0.009 90
Total Pb 0.071 0.005 92
Total Zn 0.377 0.054 86
Dissolved Cu 0.044 0.006 85
Dissolved Pb 0.007 0.001 78
Dissolved Zn 0.152 0.034 78
Table 8-6 Comparison of Individual Sites for Representative Constituents – Biofiltration Strips
Site TSS Reduction, %
TKN Reduction, %
Dissolved Copper Reduction, %
Infiltration %
Altadena MS 70 -8 20 14
I-605/SR-91 73 -50 12 37
Carlsbad MS 83 46 87 80
A linear regression analysis was also performed on the influent and effluent EMCs aggregated data from all sites and the results are shown in Table 8-7. Of the constituents monitored only the phosphorus effluent concentrations are independent of the influent

BMP Retrofit Pilot Program Final Report
January 2004
8-11
concentration. In addition, these phosphorus values are significantly higher than those measured in the influent, resulting in an increase for almost all events, similar to that observed in the swales. This suggests that leaching of phosphorus from dormant vegetation results in an effluent concentration that is independent of the influent concentration.
The sediment collected in the spreader ditch of the Altadena biofiltration strip had to be removed in June and December of 1999. All sediment and collected material that accumulated in the spreader ditch was tested for hazardous materials prior to disposal. Testing found the material to be nonhazardous and therefore all material was disposed of at the landfill. Testing results can be found in Appendix F.
8.5.2 Empirical Observations
One of the biggest difficulties with these strips was reestablishing uniform sheet flow once the flow was concentrated for measurement. Although concrete level spreaders were included in the design for this purpose they were not very effective and often continued to hold water long after runoff ceased. This problem would not exist in the general application where flow and water quality monitoring would not be necessary. Strips should be used where sheet flow conditions occur.
Although there is no formal mechanism for litter control in strips, the strips generally retained accumulated litter at the strip pavement interface or within the vegetated area until scheduled maintenance visits. The water depths in the strips were not high enough to transport trash and debris.
The vegetation at the Altadena and Carlsbad MS strips was overrun by weedy species or species from an erosion control mix. At the I-605/SR-91 strip there were fewer weedy species. This is probably due to the fact that seeds from other species are not blown or washed into the strip since it is adjacent to and downwind of the highway. All the sites maintained the required vegetative coverage, if the weedy species are included.

BMP Retrofit Pilot Program Final Report
January 2004
8-12
Table 8-7 Predicted Effluent Concentrations – Biofiltration Strips
Constituent Concentrationa Uncertainty, ±
TSS 0.074x +19.2 ( ) 5.02
000,200101
271
2.29
−+
x
NO3-N 1.31x – 0.03 ( ) 5.02
98.038.0
261
59.0
−+
x
TKN 1.09x + 0.08 ( ) 5.02
2378.1
281
74.2
−+
x
Particulate P 0.36 0.17
Ortho-phosphate 0.50 0.26
Particulate Cu 0.078x + 0.70 ( ) 5.02
697416
281
69.2
−+
x
Particulate Pb 0.083x + 1.7 ( ) 5.02
1578027
281
17.5
−+
x
Particulate Zn 0.10x +5 ( ) 5.02
000,19289
281
3.13
−+
x
Dissolved Cu 0.11x + 4.6 ( ) 5.02
842117
281
57.8
−+
x
Dissolved Pb 0.074x + 1.2 ( ) 5.02
8034
281
11.0
−+
x
Dissolved Zn 0.31x + 12.4 ( ) 5.02
000,3568
261
8.38
−+
x
a Concentration in mg/L except for metals, which are in µg/L; x = influent concentration

BMP Retrofit Pilot Program Final Report
January 2004
8-13
8.6 Cost
8.6.1 Construction
Table 8-8 shows the actual construction costs with and without monitoring equipment and related appurtenances for each biofiltration strip. The table presents the cost per cubic meter of water treated, using actual cost without monitoring. The construction cost for the Carlsbad MS is for the stand-alone biofiltration strip.
Table 8-8 Actual Construction Costs for Biofiltration Strips (1999 dollars)
Site Actual Cost, $ Actual Cost w/o Monitoring, $
Costa/WQV $/m3
Altadena MS 146,400 106,348 618
I-605/SR-91 157,174 85,570 1,646
Carlsbad MS Drain 89,243 80,561 866 a Actual cost w/o monitoring.
SOURCE: Caltrans Cost Summary Report CTSW-RT-01-003.
Adjusted construction costs for the strips are presented in Table 8-9. The primary reasons that costs were adjusted include:
• The cost of the associated infiltration trench was estimated and removed.
• Due to the accelerated nature of construction, sod was used for the strips. The cost of using soil preparation and hydroseeding cost in lieu of sod was substituted for the sod cost. Using sod would increase the individual adjusted cost by 0 percent, 6 percent, and 28 percent for the three sites, respectively. The larger the biofilter, the larger the percent change in adjusted cost because the cost of vegetation begins to dominate the total project cost. The additional cost for using sod was excluded from the adjusted construction cost.
• Rebuilding storage bins at one location caused greater than usual facility restoration cost. Including the original facility restoration cost would increase the adjusted construction cost for that location by 23 percent. Instead, the average facility reconstruction cost for similar BMPs was used for estimating the adjusted construction cost.
• At one location, adjustments to cost attributed to the level of contractor experience caused an increase to adjusted cost. Excluding the cost increase for contractor experience would decrease adjusted cost by 8 percent. These cost changes were included in the adjusted cost.

BMP Retrofit Pilot Program Final Report
January 2004
8-14
• Miscellaneous site-specific factors caused increased construction cost. This cost would increase the adjusted cost by 14 percent. These costs were excluded from the adjusted cost.
• One location incurred cost due to limited space for construction. Including this cost would increase adjusted cost by 29 percent for that location. This cost was excluded from the adjusted cost.
Table 8-9 Adjusted Construction Costs for Biofiltration Strips (1999 dollars)
Strips Adjusted Construction Cost, $
Cost / WQV $/m3
Mean (3) 63,037 748
High 67,099 1,237
Low 58,262 384
SOURCE: Adjusted Retrofit Construction Cost Tables, Appendix C.
The construction costs of off-highway (maintenance station) strips are similar to the cost of the on-highway strip. The additional site-specific costs for clearing and grubbing existing AC and facility restoration at maintenance stations are roughly equal to the cost of traffic control incurred at the highway sites.
8.6.2 Operation and Maintenance
Table 8-10 shows the average annual operations and maintenance hours for each strip. The I-605/SR-91 strip had the largest vegetated area and consequently required more maintenance time. Field hours include inspections, maintenance and vector control.
Table 8-10 Actual Operation and Maintenance Hours for Biofiltration Strips
Average Annual District Site Name
Equipment Hours Field Hours
Altadena MS 14 122 7 (Los Angeles) I-605/SR-91 34 213
11 (San Diego) Carlsbad MS 0 58
Average Value 16 131
Table 8-11 presents the cost of the average annual requirements for operation and maintenance performed by consultants in accordance with earlier versions of the MID. The operation and maintenance efforts are based on the following task components: administration, inspection, maintenance, vector control, equipment use, and direct costs.

BMP Retrofit Pilot Program Final Report
January 2004
8-15
Included in administration was office time required to support the operation and maintenance of the BMP. Inspections include wet and dry season inspections and unscheduled inspections of the BMPs. Maintenance included time spent maintaining the BMPs for scheduled and unscheduled maintenance, vandalism, and acts of nature. Vector control included maintenance effort by the vector control districts and time required to perform vector prevention maintenance. Equipment time included the time equipment was allocated to the BMP for maintenance.
Table 8-11 Actual Average Annual Maintenance Effort – Biofiltration Strips
Activity Labor Hours Equipment & Materials
$
Inspections 10 -
Maintenance 96 101
Vector control* 26 -
Administration 101 -
Direct cost - 1,762
Total 233 $ 1,863
* Includes hours spent by consultant vector control activities and hours by Vector Control District for inspections
The hours shown above do not correspond to the effort that would routinely be required to operate a biofiltration strip or reflect the design lessons learned during the course of the study. Table 8-12 presents the expected maintenance costs that would be incurred under the final version of the MID for a strip serving about 2 ha, constructed following the recommendations in Section 8.7. A detailed breakdown of the hours associated with each maintenance activity is included in Appendix D.
Some of the estimated hours are higher than those documented during the study because certain activities, such as sediment removal, were not performed during the relatively short study period. Design refinements will eliminate the need for activities such as vector control. Labor hours have been converted to cost assuming a burdened hourly rate of $44 (see Appendix D for documentation). Equipment generally consists of a single truck for the crew and their tools.

BMP Retrofit Pilot Program Final Report
January 2004
8-16
Table 8-12 Expected Annual Maintenance Costs for Final Version of MID – Biofiltration Strips
Activity Labor Hours Equipment and Materials, $ Cost, $
Inspections 1 0 44
Maintenance 47 182 2,250
Vector control 0 0 0
Administration 3 0 132
Materials - 310 310
Total 51 $492 $2,736
8.7 Criteria, Specifications and Guidelines
Based on the findings of this study, strips are considered technically feasible depending on site specific conditions; however, there are a number of research needs associated with this type of vegetated controls. There is little empirical data on the effect of slope and length on pollutant removal performance. In addition, there was no relationship between the ratio of the strip size and tributary area, and pollutant removal. Consequently, additional information is needed relative to sizing of these devices. This study implemented a monoculture of salt grass at all the biofilter sites, so the effectiveness of other grass species for pollutant removal was not quantified. Finally additional information would be useful on the minimum vegetation density for effective operation and the limit of their deployment for other areas based on rainfall and climate factors. Considerations for siting, design, and operation are described below.
8.7.1 Siting
Based on the results of this study, the primary siting criteria recommended for future installations include the following:
• Consider strips for pretreating runoff before entering devices that are susceptible to clogging such as infiltration trenches and basins and sand filters. Also look for opportunities to direct shoulder sheet flow from highways through a biofiltration strip and then into a biofiltration swale.
• Construct strips on highway shoulders where adequate space is available.
• Verify that the natural vegetation in the climate is dense enough to stabilize surfaces and to provide effective pollutant removal.
• Site in areas where sheet flow predominates.

BMP Retrofit Pilot Program Final Report
January 2004
8-17
8.7.2 Design
The general guidelines used for design of the test sites were successful in creating installations that performed effectively. The test sites were similar in many regards to the vegetated shoulders common along highways in many areas of the state. Consequently, one would expect these areas, which were not originally designed as treatment devices, to offer the comparable water quality benefit as these engineered sites. One potential issue was that all strips had the same width even though the size of the tributary areas varied widely; however, these data do not definitely establish a maximum tributary/treatment area ratio. Based on the observations and measurements in this study, the following guidelines are recommended:
• Locate, size, and shape biofiltration BMPs relative to topography and provide extended flow paths to maximize their treatment potential.
• Specify vegetation that occurs naturally in the area to minimize establishment and maintenance costs. (See Section 7.7.2 for specific plant list.)
• If slope stability is an issue in the period immediately following construction, consider the use of matting or other temporary erosion control measures rather than specifying the use of sod.
• Avoid the use of concrete level spreaders to distribute runoff. If the existing flow at a proposed site is concentrated, consider the implementation of a biofiltration swale instead of a strip.
• Specifications should include appropriate fertilizer and soil amendments based on soil properties determined through testing and compared to the needs of the vegetation requirements.
• Install strips at the time of the year when there is a reasonable chance of successful establishment without irrigation; however, it is recognized that rainfall in a given year may not be sufficient and temporary irrigation may be used at the discretion of the Resident Engineer.
• While not tested in this study, consensus guidance recommends slopes less than or equal to 20 percent for filter strips.
8.7.3 Construction
Listed below are guidelines recommended to improve the construction process:
• Soil should be conditioned so that it is sufficient to establish and support the vegetation selected for the site.
• Time biofilter establishment to coincide with periods of greater rainfall and the natural growing season of the selected vegetation.

BMP Retrofit Pilot Program Final Report
January 2004
8-18
• If use of sod is unavoidable, place it without gaps and staggered to avoid channelization.
• Use a roller on the sod to ensure that no air pockets form between the sod and the soil.
Physical erosion controls will be necessary on steeper slopes to protect seeds for at least 75 days after the first rainfall of the season. Erosion controls might include the placement of a blanket, mulch, or other biodegradable cover over the seeded portion of the site.
8.7.4 Operation and Maintenance
Based on the level of maintenance required in this study, future maintenance activities should include:
• Perform inspections and maintenance as recommended in MID (Version 17) in Appendix D, which includes inspection of vegetation, observation of flow across swale invert and sediment and debris accumulation.
• Inspect strips at least twice annually for erosion or damage to vegetation, preferably at the end of the wet season to schedule summer maintenance and before major fall runoff to be sure the strip is ready for winter. However, additional inspection after periods of heavy runoff is most desirable. The strip should be checked for debris and litter, and areas of sediment accumulation.
• Recent research on biofiltration swales but likely also applicable to strips (Colwell et al., 2000) indicates tha t grass height and mowing frequency have little impact on pollutant removal; consequently, mowing may only be necessary once or twice a year for safety and aesthetics or to suppress weeds and woody vegetation.
• Trash tends to accumulate in strip areas, particularly along highways. The need for litter removal should be determined through periodic inspection, but litter should always be removed prior to mowing.

BMP Retrofit Pilot Program Final Report
January 2004
9-1
9 STORM-FILTER™
9.1 Siting
The Storm-Filter™ is a proprietary water quality treatment device that uses cartridges filled with different types of media to filter stormwater runoff. One maintenance station in District 11 (Kearny Mesa) was selected for installation of this technology and the watershed characteristics for this site are summarized in Table 9-1. Siting criteria are similar to those for other media filters and include:
• No bare soil or construction activities up-gradient of the site
• Tributary area of less than 8 ha
• Adequate hydraulic head (about 1 m) to operate by gravity flow
Table 9-1 Summary of Contributing Watershed Characteristics for Storm-Filter™
Site Land Use Watershed Area Hectare
Impervious Cover %
Kearny Mesa Maintenance Station 0.6 100
9.2 Design
The Storm-Filter™ is sized based on the maximum flow rate to be treated as specified by the manufacturer. Design specifications are summarized in Table 9-2 and the hydrologic conditions are listed in Table 9-3. A schematic of the device is presented in Figure 9-1 and pictures of the actual site are shown in Figures 9-2 and 9-3.
Table 9-2 Design Criteria of the Storm-Filter™
Design Criteria Value Discussion
Number of canisters Based on infiltration rate of media canisters
The manufacturer estimates that 30 canisters treat approximately 0.028 m3/s or 0.0009 m3/s/canister.
Pretreatment vault volume
2 min at peak flow The volume of the pretreatment vault should be sized with a volume produced by the peak flow rate for a 2 min period.
Filter media Media canisters Canisters are supplied by manufacturer; media type is combination of perlite and zeolite.

BMP Retrofit Pilot Program Final Report
January 2004
9-2
Table 9-3 Design Characteristics of the Storm-Filter™
Site Design Storm
mm
Design Storm Discharge
L/s
WQVa m3
Number of Canisters
Number of Chambers
Kearny Mesa 36 76 194 86 3
a Volume treated during a design storm.
The manufacturer offers various media types. A perlite/zeolite combination was selected for this study based on a recommendation by the manufacturer. Perlite is a puffed volcanic ash. It is porous with rough edges and the manufacturer recommended it for the removal of TSS and oil and grease. Zeolite is a naturally occurring mineral recommended for the removal of soluble metals, ammonium and some organics.
Figure 9-1 Schematic of a Storm-Filter™
(SOURCE: Stormwater Management, Inc.)

BMP Retrofit Pilot Program Final Report
January 2004
9-3
Figure 9-2 Surface View at Kearny Mesa
Figure 9-3 Internal View at Kearny Mesa

BMP Retrofit Pilot Program Final Report
January 2004
9-4
9.3 Construction
9.3.1 Construc tability
Stormwater Management, Inc. (SMI) provided media cartridge filters in precast vaults as a package system. During the design and construction phase, it was difficult to obtain specific design details on the vaults and appurtenances required to prepare the construction drawings and specifications.
The filter media was changed from CSF® leaf media (compost) to perlite/zeolite during the design phase of the project. The treatment system specifications for this site were developed in February and March of 1998. SMI provided specifications on CSF® leaf media (compost) for incorporation into the Special Provisions. Although CSF® leaf media was the standard filter media in use at the time, SMI was conducting research into the use of perlite/zeolite media. By the time of actual construction in early 1999, research had led to the selection of perlite/zeolite as the media of choice for a maintenance station type application and SMI provided it as the filter cartridge media.
9.3.2 Unknown Field Conditions
During excavation for the filter and pretreatment vaults, sandstone was encountered at a depth of approximately 1 m. To remove this material, special excavation equipment (hoe ram) was used to break through the sandstone. The excavated materials were not suitable for backfill and had to be removed from the site at an additional cost. Removing the sandstone at the subgrade produced an uneven surface; thus, it was as necessary to excavate beyond the subgrade and to backfill to the subgrade with imported materia ls to provide a uniform foundation under the vault.
The contractor began excavation and was informed by the Caltrans permit inspector that the work was in potential conflict with a City of San Diego 900 mm high-pressure water transmission main within an existing easement. The existence of the pipeline and easement were not shown on the plans and were not discovered during utility research for the project. Further research and coordination with the City of San Diego confirmed that the location of this easement was in conflict with the proposed BMP. The contractor was directed to stop construction, while the exact easement location was determined. The plans were revised, and construction staking was rescheduled. The filter vaults were moved approximately 4 m northeast of the original location. This new location required removal and replacement of approximately 30 m of concrete gutter and minor asphalt pavement. The relocation also caused a manhole with a non-traffic-rated lid to be moved into a traffic area, requiring replacement of the lid with a traffic-rated lid. In addition, the contractor incurred expenses due to down time of equipment that had been mobilized to the site and was inactive. This experience reinforces the necessity for site characterization to identify utility conflicts and other unseen potential problems.
BMP Retrofit Pilot Program Final Report
January 2004
9-5
Additionally, the existing storm drain outlet for the BMP was located in an easement owned by the City of San Diego. The project was delayed while modification of the storm drain was discussed with the City. The City required an encroachment permit in order for the work to be completed.
9.4 Maintenance
Maintenance items for the Storm-Filter™ included inspection of sediment accumulation and removal of sediment from the pretreatment sedimentation basin when the accumulation exceeded 300 mm. Sediment removal was not required during the course of the study. In addition, weekly inspections for trash accumulation were conducted during the wet season. The design flow rate of 0.0009 m3/s per canister was evaluated during one storm per month during the wet season. The Storm-Filter™ was inspected for standing water annually at the end of the wet season, and monthly to identify damage to inlet and outlet structures, and evidence of graffiti or vandalism.
The Storm-Filter™ was inspected monthly for minor maintenance in accordance with the manufacturer’s guidelines, including flushing of the underdrains. The site was inspected annually in August/September for major maintenance.
An average of only about 23 hr/yr were required for field activities, not including 45 hours for vector control activities. As shown in Figure 9-4, field inspections were the largest field activity. The number of inspections and time spent reflect the requirements of the (MID), which required weekly inspections during the wet season. Seasoning of the Storm-Filter™ at the beginning of the second wet season was the second largest activity. This involved flushing the Storm-Filter™ with water to remove suspended solids from the media. This was done because data from the first year of monitoring indicated significant export of some constituents (TSS, dissolved Pb). It is suggested that seasoning of the media before installation by the manufacturer be required for any future installations.
The Storm-Filter™ holds water in the pretreatment sedimentation chamber and thus is a potential source of vector problems. Table 9-4 shows the number of occurrences of mosquito breeding and number of abatement actions that were taken.

BMP Retrofit Pilot Program Final Report
January 2004
9-6
Figure 9-4 Field Maintenance Activities for the Storm-Filter™ (1999-2001)
Table 9-4 Incidences of Mosquito Breeding – Storm-Filter™
Number of Times Site
Breeding Observed Abatement Performed
Kearny Mesa 14 0
9.5 Performance
9.5.1 Chemical Monitoring
The concentration reductions observed during the monitoring program are shown in Table 9-5. Since this device is constructed of concrete, it was assumed that influent and effluent volumes were equal and consequently the load reduction is equal to the concentration reduction. The column labeled “Significance” is the probability that the influent and effluent concentrations are not significantly different. Statistically significant differences between influent and effluent concentrations at the 90 percent confidence

BMP Retrofit Pilot Program Final Report
January 2004
9-7
level were observed only for TSS and total metals. In general, the results compare unfavorably to filters that employ sand as the filter medium, such as the Austin and Delaware designs.
The results of the monitoring program shown in Table 9-5 do not include the first year’s monitoring data. During this period, the device was a net exporter of almost all constituents. The Storm-Filter™ was “seasoned” during the following summer by flushing the canisters with potable water and performance improved markedly during the following wet seasons.
The generally low removals were surprising in that the average influent concentrations at this site were among the highest measured in this study. For instance, the TSS influent concentration was approximately twice that observed for the Austin-style filter sites. The modest TSS removal resulted in a concentration in the effluent that was still larger than the influent concentrations at many other pilot program sites. Although the selected media (zeolite and perlite) reputedly provide better metals removal than sand, lead and zinc removals were much less than that of the Austin filters. There are no previously published independent studies of the effectiveness of other Storm-Filter™ units utilizing this media with which to compare the performance of this particular installation.
Table 9-6 presents the results of the regression analysis of influent and effluent concentrations. In contrast to the sand filters, the effluent TSS concentration is correlated with the influent concentration, indicating that the effluent quality is not as consistent as that produced by the other types of filters.

BMP Retrofit Pilot Program Final Report
January 2004
9-8
Table 9-5 Concentration Reduction of the Storm-Filter™
Mean EMCd
Constituent Influent mg/L
Effluent mg/L
Removal %
Significance P
TSS 174 104 40 0.038 NO3-N 1.03 1.09 -7 0.759 TKN 3.15 2.56 19 0.292
Total N a 4.18 3.65 13 - Ortho-phosphate 0.15 0.14 9 0.659 Phosphorus 0.43 0.36 17 0.318 Total Cu 0.142 0.066 53 0.004 Total Pb 0.070 0.033 52 0.006
Total Zn 0.802 0.389 51 0.001 Dissolved Cu 0.038 0.031 18 0.257 Dissolved Pb 0.003 0.002 15 0.534 Dissolved Zn 0.205 0.167 18 0.296 TPH-Oil b 3.3 1.6 52 0.119
TPH-Diesel b 3.3 1.1 67 0.281 TPH – Gasoline b < 0.05c < 0.05c - -
Fecal Coliform b 1500 MPN/100mL 800 MPN/100mL 47 0.574 a Sum of NO3-N and TKN b TPH and Coliform are collected by grab method and may not accurately reflect removal c Equals value of reporting limit d Event mean concentration The sediment collected in the chambers of the Storm-Filter™ had to be removed in October 2000 and October 2001. All sediment and collected material that accumulated in the Storm-Filter™ was tested for hazardous materials prior to disposal. Testing found the material to be nonhazardous and therefore all material was disposed of at the landfill. Testing results can be found in Appendix F.
9.5.2 Empirical Observations
Most of the relevant empirical observations at this site concern standing water in the facility. Standing water was observed repeatedly in the pretreatment vault and cartridge chambers. The Storm-Filter™ is designed such that there is always standing water in the pre-sedimentation chamber and in the basin preceding the energy dissipaters in each chamber. Also, water is always present in the PVC piping that routes water from the filters to the outlet chambers. The vector control district reported minor breeding in these locations.

BMP Retrofit Pilot Program Final Report
January 2004
9-9
One potential reason for the modest pollutant removal observed is that the runoff has a very short residence time within the device. Figure 9-5 compares influent and effluent hydrographs for a typical storm. It is clear from this figure that there is little or no attenuation of peak flows in the device and consequently little time for particles to be filtered or to settle out of the runoff. This is in stark contrast to the hydrographs produced by sand filters and illustrated in Figure 2-8.
Table 9-6 Predicted Effluent Concentrations – Storm-Filter™
Constituent Expected Concentrationa Uncertainty, ±
TSS 0.42x + 30.5 ( ) 5.02
1589598.174
151
9.92
−+
x
NO3-N 0.84x + 0.23 ( ) 5.02
26.70.1
151
567.0
−+
x
TKN 0.68x + 0.40 ( ) 5.02
4114.3
151
45.0
−+
x
P Particulate 0.19 0.10
Ortho-phosphate 0.78x + 0.02 ( ) 5.02
04.015.0
91
044.0
−+
x
Particulate Cu 35.9 8.0
Particulate Pb 0.34x + 0.06 ( ) 5.02
2034669
141
9.35
−+
x
Particulate Zn 224 67
Dissolved Cu 0.81x + 1.06 ( ) 5.02
33906.37
141
2.17
−+
x
Dissolved Pb 0.77x + 0.24 ( ) 5.02
593
141
68.1
−+
x
Dissolved Zn 0.77x + 14.7 ( ) 5.02
148350204
141
9.52
−+
x
a Concentration in µg/L for metals; x = influent concentration

BMP Retrofit Pilot Program Final Report
January 2004
9-10
0
0.5
1
1.5
2
2.5
3
3.5
2/20/20000:00
2/20/200012:00
2/21/20000:00
2/21/200012:00
2/22/20000:00
Flo
w (
cfs)
Influent Effluent
Figure 9-5 Comparison of Storm-Filter™ Influent and Effluent Flow Rates
9.6 Cost
9.6.1 Construction
The construction costs for the Kearny Mesa site are presented in Table 9-7. The cost per unit water quality volume treated was similar to the Austin sand filters that did not include pumps in the design.
The adjusted cost for the Storm-Filter™ is shown in Table 9-8. As in Table 9-7, the only adjustment to the cost was for features associated with monitoring. Including this cost would increase the adjusted cost by 6 percent. This cost was excluded from the analysis for estimating the adjusted cost.

BMP Retrofit Pilot Program Final Report
January 2004
9-11
Table 9-7 Actual Construction Costs for Storm-Filter™ (1999 dollars)
Site Actual Cost, $ Actual Cost w/o Monitoring, $
Costa/WQV $/m3
Kearny Mesa 325,517 305,355 1,575
a Actual cost w/o monitoring.
SOURCE: Caltrans Cost Summary Report CTSW-RT-01-003.
Table 9-8 Adjusted Construction Costs for Storm-Filter™ (1999 dollars)
Storm-Filter™ Adjusted Construction
Cost, $ Cost/WQV $/m3
One location 305,356 1,572
SOURCE: Adjusted Retrofit Construction Cost Tables, Appendix C.
The Storm-Filter™ installation was in a maintenance station and consequently did not incur traffic control costs. If constructed roadside, Storm-Filter™ could incur traffic control cost typical of EDBs, in which traffic control accounted for an average of 9 percent of the adjusted construction cost. Traffic control costs were not used to estimate adjusted construction cost.
9.6.2 Operation and Maintenance
An average of 67 hr/yr was spent on field activities, including inspections, maintenance and vector control activities and no equipment was required. Table 9-9 presents the cost of the average annual requirements for operation and maintenance performed by consultants in accordance with earlier versions of the MID. The operation and maintenance efforts are based on the following task components: administration, inspection, maintenance, vector control, equipment use, and direct costs. Included in administration was office time required to support the operation and maintenance of the BMP. Inspections include wet and dry season inspections and unscheduled inspections of the BMPs. Maintenance included time spent maintaining the BMPs for scheduled and unscheduled maintenance, vandalism, and acts of nature. Vector control included maintenance effort by the vector control districts and time required to perform vector prevention maintenance. Equipment time included the time equipment was allocated to the BMP for maintenance.

BMP Retrofit Pilot Program Final Report
January 2004
9-12
Table 9-9 Actual Average Annual Maintenance Effort – Storm-Filter™
Activity Labor Hours Equipment & Materials $
Inspections 12 -
Maintenance 11 0
Vector control* 45 -
Administration 39 -
Direct Cost - 308
Total 107 $ 308
* Includes hours spent by consultant vector control activities and hours by Vector Control District for inspections
The hours shown above do not correspond to the effort that would routinely be required to operate a Storm-Filter™ or reflect the design lessons learned during the course of the study. Table 9-10 presents the expected maintenance costs that would be incurred under the final version of the MID for a Storm-Filter™ serving about 2 ha, constructed following the recommendations in Section 9.7. A detailed breakdown of the hours associated with each maintenance activity is included in Appendix D.
Some of the estimated hours are higher than those documented during the study because certain activities, such as filter media replacement, were not performed during the relatively short study period. Only one hour is shown for facility inspection, which is assumed to occur simultaneously with all other inspection requirements for that time period. This estimate also assumes that the facility is constructed of concrete and no vegetation maintenance is required. Labor hours have been converted to cost assuming a burdened hourly rate of $44 (see Appendix D for documentation). Vector control hours were converted to cost assuming an hourly rate of $62. Equipment generally consists of a single truck for the crew, their tools, and material removed from the filter.

BMP Retrofit Pilot Program Final Report
January 2004
9-13
Table 9-10 Expected Annual Maintenance Costs for Final Version of MID- Storm-Filter™
Activity Labor Hours Equipment and Materials, $ Cost, $
Inspections 1 0 44
Maintenance 39 131 1,847
Vector control 12 0 744
Administration 3 0 132
Direct Costs - 2,800 2,800
Total 55 $2,931 $5,567
9.7 Criteria, Specifications and Guidelines
The Storm-Filter™ did not perform as well as other non-proprietary media filters (Austin and Delaware sand filters). The Storm-Filter™ manufacturer continues to refine and develop new filter media; consequently, improvements in this area may support consideration in the future. The Storm-Filter™ is considered technically feasible for use at the piloted location; however, other technologies provide better performance for less capital cost. Should this technology be selected for implementation, the following information may be useful.
9.7.1 Siting
The original siting criteria seem to have been generally successful at locating the Storm-Filter™. Based on the results of this study, the primary siting criteria recommended for future installations include the following:
• Sufficient head to allow operation by gravity flow (about 1.0 m)
• Relatively small, highly impervious ultra-urban contributing watershed
• No construction planned up-gradient of the proposed location
• No installation in areas where vector control is not feasible
• No construction near side slopes where leaks could impact slope stability
• Avoid areas with potentially high sediment load

BMP Retrofit Pilot Program Final Report
January 2004
9-14
9.7.2 Design
Since these devices are proprietary, the manufacturer provides sizing and configuration design and all materials. Based on the observations and measurements in this study, the following guidelines are recommended:
• Provide a method to completely drain the facility between storms and during the dry season to address concerns about vector issues.
• Consider alternative media since the zeolite/perlite mixture in the filter cartridges did not provide any improvement in constituent removal as compared to compost.
• When possible, use standardized designs and prefabricated vaults to reduce costs.
• If mosquito breeding is a concern, include vector-restricting covers in the initial design.
9.7.3 Construction
Determining the location of all utilities prior to construction may not be practical due to limited documentation of utility locations. It is suggested that a small (1 to 2 percent) contingency be provided in case unknown utilities are encountered. In addition, unsuitable material was encountered at many of the construction sites. Sufficient borings should be made before going out for bid to avoid the delays and expense of contract change orders.
As noted previously, the Storm-Filter™ exported constituents until flushed with potable water following the first wet season. For future installations, a requirement that the supplier provide cartridges that are pre-washed would improve performance and reduce the short-term impact to receiving waters.
9.7.4 Operation and Maintenance
Several factors contributed to the reduced maintenance requirements for the Storm-Filter™. The chambers were constructed of concrete consequently no vegetation maintenance was required and slope stability was not an issue. Additional reduction in maintenance costs could be expected by reducing the maintenance frequency from weekly to semiannually (assuming vectors are adequately controlled).
Based on the level of maintenance required in this study, recommended future maintenance activities include:
• Perform inspections and maintenance as recommended in MID (Version 17) in Appendix D, which includes checking for media clogging, replacement of filter media, and inspection for standing water.

BMP Retrofit Pilot Program Final Report
January 2004
9-15
• Schedule semiannual inspection for beginning and end of the wet season to identify potential problems.
• Remove accumulated trash and debris in the pretreatment chamber, stilling basin, and the filter chamber during routine inspections.
• Develop guidance to identify the proper interval for removal and replacement of media canisters. Ensure canisters are properly seasoned before start of the wet season.
• Remove accumulated sediment in the pretreatment chamber every 5 years or when the sediment occupies 10 percent of the volume of the filter chamber, whichever occurs first.

BMP Retrofit Pilot Program Final Report
January 2004
10-1
10 MULTI-CHAMBERED TREATMENT TRAIN
10.1 Siting
Three Multi-Chambered Treatment Trains (MCTTs) were planned for District 7 for inclusion in this study. The Metro Maintenance station installation was not completed in time for this evaluation; therefore, the following discussion is based on the experience with this technology at the Via Verde and Lakewood Park & Rides.
The MCTT was developed for treatment of stormwater at critical source areas specifically to reduce stormwater toxicity in the ultra-urban environment (Pitt et al., 1999). The target area for use of this particular device includes vehicle service facilities, parking areas, paved storage areas and fueling stations with tributary areas of 0.1 to 1 ha. Similar types of land use areas are common at Caltrans facilities. Characteristics of the contributing watersheds for the two subject sites are shown in Table 10-1.
MCTTs need enough vertical clearance to operate hydraulically, a minimum of about 1.5 m for gravity flow. The elevation difference between the inlet and outlet must include clearance for the depth of the inlet sump, sedimentation chamber, water on top of the filter, the filter media, and the underdrains. The selected sites lacked sufficient head for unit operation and two pumps were installed at each site, one to transfer runoff from the sedimentation chamber to the filter and one to return the treated discharge to the pre-existing drainage system.
Table 10-1 Summary of Contributing Watershed Characteristics for MCTTs
Site Land Use Watershed Area Hectare
Impervious Cover %
Via Verde P&R Park & Ride lot 0.44 100
Lakewood P&R Park & Ride lot 0.76 100
10.2 Design
The MCTTs were designed as a three-stage device as illustrated in Figure 10-1. Figures 10-2 and 10-3 show internal and external views of the MCTTs, respectively. The first stage consisted of a catch basin with sump and packed column aerators. This was followed by the main settling chamber that included tube settlers to improve particulate removal and sorbent pillows to capture floating hydrocarbons. The sedimentation basin was designed so that the water quality volume is held above the tube settlers, which are nominally 0.6 m deep with about 0.3 m of plenum space underneath. The sorbent pillows are “Oilup Sorbent Blue Booms.” The dimensions of the MCTTs are summarized in Table 10-2.

BMP Retrofit Pilot Program Final Report
January 2004
10-2
Figure 10-1 Schematic of an MCTT (Source: Pitt, et al., 1999)
Fine bubble aerators were not incorporated in the study designs, because the concentration of volatile organics was expected to be low in runoff from a park-and-ride. As mentioned previously, pumps were included in the design to move the runoff from the sedimentation chamber to the filter chamber. Although the pumps could be triggered automatically, for this study they were activated manually on the day following a storm event to ensure that the runoff remained in the sedimentation basin for at least 24 hours.
The final chamber consisted of a 600 mm thick filter media layer consisting of a 50/50 mixture of sand and peat moss. This layer is separated from a gravel-packed underdrain by a layer of filter fabric. The filter area was determined from the recommended solids loading rate of the peat/sand mixture of 5000 g TSS/m2/yr (Pitt, et al., 1999). To estimate the solids loading it was assumed that the TSS influent concentration to the device was 100 mg/L, of that half was retained in the settling chamber, and of the remainder, 90 percent was retained on the filter. Pumps were employed to return the filtered runoff to the pre-existing drainage system.

BMP Retrofit Pilot Program Final Report
January 2004
10-3
Figure 10-2 Surface View of an MCTT (Via Verde P&R)
Figure 10-3 Internal View of an MCTT (Lakewood P&R)

BMP Retrofit Pilot Program Final Report
January 2004
10-4
Table 10-2 Design Characteristics of the MCTTs
Site Design Storm mm
WQV m3
Sedimentation Basin Area
m2
Filter Basin Area
m2
Via Verde P&R
25 123 35.5 17.4
Lakewood P&R
25 173 61.2 32.9
10.3 Construction
The lessons learned during the construction of the MCTTs were similar to those described for sand filters and centered on material availability for the filter, excavation of the site for the device, unknown field conditions, and interface with existing activities at the site. The filters were all constructed in park-and-ride facilities that provided a limited work area and the requirement to coordinate with normal facility operations. For additional information, see Section 2.3 in Sand Filters.
The tube settler systems and associated stainless steel hardware were special-order items requiring a significant lead-time. The fabrication and delivery time should be considered in the construction schedule, or the items should be pre-purchased. Further, the sand specified in the plans for the filter was a special gradation and required a custom mix with additional time and expense.
Since the MCTTs are designed to maintain a permanent pool covering the tube settlers, it is important that the facilities be made watertight. Leaks were detected at the Via Verde site during operation of the facility and an additional $35,000 was required to waterproof the sedimentation chamber and line the piping between the grit and sedimentation chambers.
Difficult excavation was a problem at the Via Verde site. The MCTT unit requires a significant excavation with a sound subgrade. Large boulders were removed at the site from the excavation, resulting in increased costs and construction time.
Unmapped utilities were encountered at the Lakewood site. Two 100 mm water service lines were damaged as well as a 50 mm electrical conduit. None of these utilities were shown on as-built drawings.
Site layout was also an issue during construction. At the Via Verde site, the City requested that a recently installed electric vehicle charging station not be relocated to avoid conflict with the MCTT. The MCTT design was modified at the City’s request. In addition, power was not available at the Via Verde site to operate the pumps, except from the existing lighting system, and additional trenching was required to establish the service.

BMP Retrofit Pilot Program Final Report
January 2004
10-5
10.4 Maintenance
Major maintenance items for MCTTs include removal of sediment from the sedimentation basin when the accumulation exceeds 150 mm and removing and replacing the filter media every 3 years. Neither of these activities where required during the course of the study. After two wet seasons, total accumulated sediment depth was less than 25 mm. This indicates that sediment removal may not be required for as many as 10 years or more. The sorbent pillows are scheduled to be replaced annually or sooner if darkened by oily stains.
In addition, weekly inspections for trash accumulation in the inlet and outlet structures were conducted during the wet season. Finally, monthly inspections also were conducted to identify damage to inlet and outlet structures, and evidence of graffiti or vandalism.
MCTTs generally have greater maintenance requirements than many other types of stormwater treatment facilities. An average of about 108 hr/yr was required for field activities, not including the 70 hours needed for vector control activities. This is nearly twice the maintenance required for the Austin and Delaware media filter designs. As shown in Figure 10-4, vector-related issues, including dewatering and mosquito proofing the sites account for a significant amount of the fieldwork. Structural repair of the leaks at Via Verde and pump replacement and repair also contributed substantially to the large total. As with the pumped sand filters, the pumps and associated electrical circuits were a continual source of problems. The number of inspections and time spent reflect the requirements of the MID, which required weekly inspections during the wet season.
Previous MCTT installations in Wisconsin did not use pumps, but used small orifices to control the water flows (Corsi et al., 1999). These installations therefore did not experience these electrical or pumping maintenance problems. In addition, it is expected that underground and fully sealed MCTT installations would have needed much less vector abatement activity.
MCTTs were originally conceived to be small footprint devices that would be covered. Because of the size of the drainage area and required water quality volume, the two constructed devices are much larger than any implemented previously. Consequently, the original designs did not call for covers for the two facilities. Unfortunately, the open design provided easy access for mosquitoes to the permanent pool of water below the tops of the tube settlers in the sedimentation chamber. This standing water required repeated abatement activities, and the tube settlers compromised the ability of the vector control agencies to adequately monitor larval growth. The tube settlers also made abatement difficult since each settler formed, in effect, a separate chamber. Covers were fabricated for both sites and installed in February 2001 to eliminate mosquito access to the areas with standing water.
Maintenance activities at the MCTT sites also were hampered by the lack of adequate access and by the presence of the tube settlers. Each basin was fitted with a rung-type

BMP Retrofit Pilot Program Final Report
January 2004
10-6
ladders to allow maintenance personnel access; however, these are not sufficient for allowing equipment access for major maintenance activities.
Since the MCTT maintains a permanent pool below the tops of the tube settlers, mosquito breeding was a constant problem at these sites. Table 10-3 shows the number of occurrences of mosquito breeding and the number of abatement actions that were taken. In addition, the presence of the settlers restricted access to the runoff and hampered effective mosquito abatement activities. The operation practices had to be modified to allow 0.3 m of water to remain above the settling tubes to allow for vector inspection and abatement. Both sites were ultimately completely enclosed to prevent mosquito access, which added $35,000 to the cost (excluded from costs shown in Tables 10-6 and 10-7). Litter and other debris also occasionally blew into the basin, and the tube settlers impeded access when removal of this material was necessary.
Figure 10-4 Field Maintenance Activities at MCTT Sites (1999-2001)

BMP Retrofit Pilot Program Final Report
January 2004
10-7
Table 10-3 Incidences of Mosquito Breeding - MCTTs
Number of Times Site
Breeding Observed Abatement Performed Via Verde P&R 7 7
Lakewood P&R 49 43
Draining of the MCTTs at the end of the wet season was also extremely difficult due to the need to remove the settling tubes. In addition, a supplemental pump or relocation of an existing pump was needed to pump the MCTT dry. A method for complete draining of the sedimentation basin should be incorporated in the design of the MCTT.
10.5 Performance
10.5.1 Chemical Monitoring
Data from both of the MCTT sites were combined for calculating performance. Since both of the devices are constructed of concrete, it is assumed that the effluent volume equals the influent volume (i.e., there are no significant infiltration or evaporation losses). Therefore, all constituent mass reduction is reflected by the reduction in concentration between the influent and effluent.
The data shown in Table 10-4 indicate that the observed constituent reduction is generally comparable to that observed in sand filters. As with the sand filters, nitrate increased; however, unlike the sand filters there was no removal of total nitrogen. In addition, there was export of ortho-phosphate indicating that the peat used in the media mixture was exporting nutrients. The column labeled “Significance” is the probability that the influent and effluent concentrations are not significantly different.
The performance for constituents such as TSS is especially good in light of the very low influent concentrations measured. The last column in the table summarizes removal efficiencies reported by Pitt et al. (1999). These data indicate that the devices in this study performed roughly the same as those evaluated previously.
Although the filter media consisted of a mixture of sand and peat, which is intended to provide better performance than filter systems using sand alone, the difference in constituent removal between Austin sand filters and the MCTTs was generally small.

BMP Retrofit Pilot Program Final Report
January 2004
10-8
Table 10-4 Concentration Reduction of MCTTs
Mean EMC
Constituent Influent
mg/L Effluent
mg/L
Removal %
Significance P
Concentration Reduction
Previous Work (Pitt et al., 1999)
TSS 40.8 10.2 75 <0.000 83
NO3-N 0.47 0.78 -68 0.004 24
TKN 1.93 1.61 17 0.471 NA
Total N a 2.40 2.39 0 - NA
Ortho-phosphate 0.120 0.123 -3 0.972 NA
Phosphorus 0.22 0.18 18 0.302 NA
Total Cu 0.011 0.007 35 0.129 22
Total Pb 0.007 0.002 74 <0.000 93
Total Zn 0.146 0.037 75 0.009 91
Dissolved Cu 0.006 0.005 22 0.408 17
Dissolved Pb 0.002 0.001 32 0.177 42
Dissolved Zn 0.074 0.022 71 <0.000 46
TPH-Oil b 1.0 0.3 70 0.161 NA
TPH-Diesel b 1.0 0.2 80 0.186 NA
TPH-Gasoline b <0.05c <0.05c - - NA
Fecal Coliform b 700 MPN/100mL
600 MPN/100mL
14 1.000 NA
a Sum of NO3-N and TKN b TPH and Coliform are collected by grab method and may not accurately reflect removal c Equals value of reporting limit
Table 10-5 summarizes the results of the linear regression analysis of influent and effluent concentrations. The analysis revealed many of the same phenomena observed for the sand filters. The effluent concentrations of most of the particulate constituents were independent of the influent concentration and are best represented as constant values, while the effluent concentrations of dissolved constituents were generally a function of influent concentration.
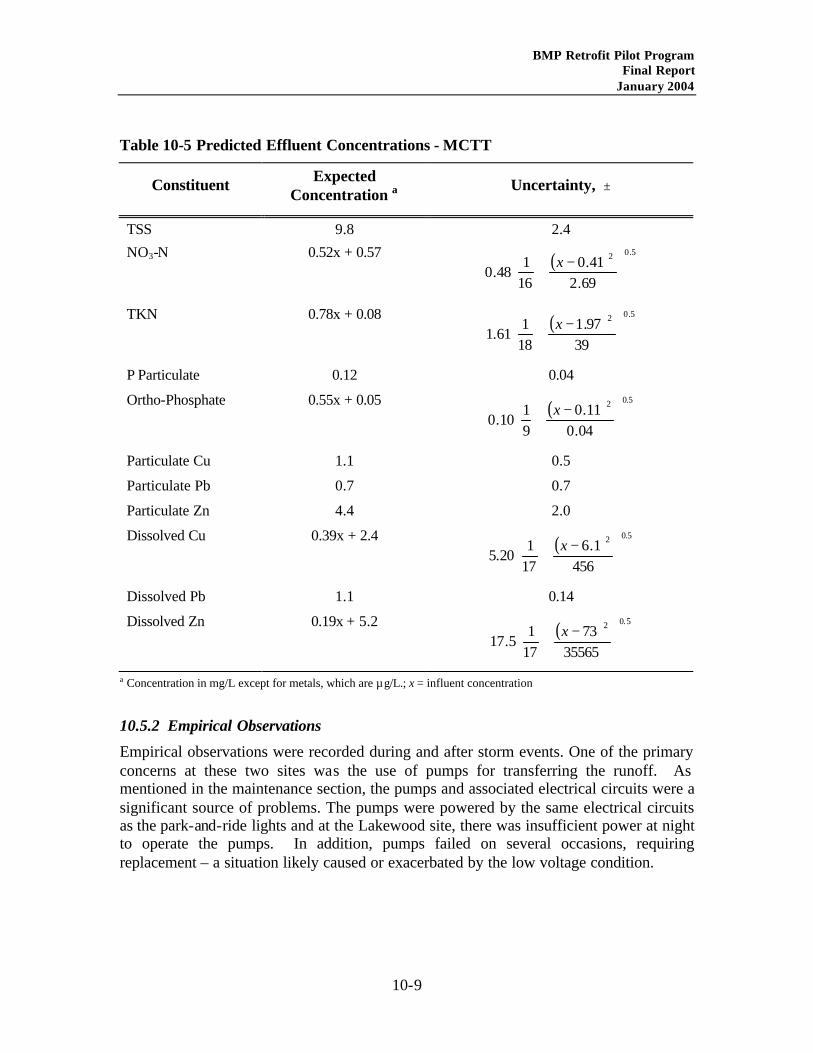
BMP Retrofit Pilot Program Final Report
January 2004
10-9
Table 10-5 Predicted Effluent Concentrations - MCTT
Constituent Expected Concentration a Uncertainty, ±
TSS 9.8 2.4
NO3-N 0.52x + 0.57 ( ) 5.02
69.241.0
161
48.0
−+
x
TKN 0.78x + 0.08 ( ) 5.02
3997.1
181
61.1
−+
x
P Particulate 0.12 0.04
Ortho-Phosphate 0.55x + 0.05 ( ) 5.02
04.011.0
91
10.0
−+
x
Particulate Cu 1.1 0.5
Particulate Pb 0.7 0.7
Particulate Zn 4.4 2.0
Dissolved Cu 0.39x + 2.4 ( ) 5.02
4561.6
171
20.5
−+
x
Dissolved Pb 1.1 0.14
Dissolved Zn 0.19x + 5.2 ( ) 5.02
3556573
171
5.17
−+
x
a Concentration in mg/L except for metals, which are µg/L.; x = influent concentration
10.5.2 Empirical Observations
Empirical observations were recorded during and after storm events. One of the primary concerns at these two sites was the use of pumps for transferring the runoff. As mentioned in the maintenance section, the pumps and associated electrical circuits were a significant source of problems. The pumps were powered by the same electrical circuits as the park-and-ride lights and at the Lakewood site, there was insufficient power at night to operate the pumps. In addition, pumps failed on several occasions, requiring replacement – a situation likely caused or exacerbated by the low voltage condition.

BMP Retrofit Pilot Program Final Report
January 2004
10-10
10.6 Cost
10.6.1 Construction
The construction costs for the two sites are presented in Table 10-6. The costs per water quality volume treated were similar to the Austin sand filters that included pumps, although the costs were significantly more than for Austin sand filters that drained by gravity.
Table 10-6 Actual Construction Costs for MCTTs (1999 dollars)
Site Actual Cost, $ Actual Cost w/o Monitoring, $
Costa/WQV $/m3
Via Verde P&R 383,793 375,617 3,054
Lakewood P&R 464,743 456,567 2,639 a Actual cost w/o monitoring.
SOURCE: Caltrans Cost Summary Report CTSW-RT-01-003.
The adjusted construction costs for the MCTTs are shown in Table 10-7. Reductions to the actual MCTT costs were made for the following reasons:
• The MCTTs were installed in areas where existing conditions did not allow for gravity drainage and space constraints required extensive shoring. Including the cost of pumps and extensive shoring increases adjusted cost by 41 percent and 52 percent for the two locations. These costs were excluded from the adjusted cost.
• Miscellaneous site-specific factors caused increased construction cost at both locations. This cost would increase the adjusted cost by 1 percent. These costs were excluded from the adjusted cost.
Table 10-7 Adjusted Construction Costs for MCTTs (1999 dollars)
MCTT Adjusted Construction Cost, $
Cost/WQV $/m3
Mean 275,616 1,875
High 320,531 1,895
Low 230,701 1,856
SOURCE: Adjusted Retrofit Construction Cost Tables, Appendix C.

BMP Retrofit Pilot Program Final Report
January 2004
10-11
All MCTT installations were in park-and-ride lots and subsequently did not incur traffic control costs. If constructed roadside, MCTTs could incur traffic control cost typical of EDBs, in which traffic control accounted for an average of 9 percent of the adjusted construction cost. Traffic control costs were not used to estimate adjusted construction cost. In January 2001 the sedimentation chamber and inlet pipe at the Via Verde MCTT had to be repaired and waterproofed when the BMP was found to be leaking. This was done at a cost of $15,000.
10.6.2 Operation and Maintenance
Table 10-8 shows the annual average number of hours required for maintaining the BMP as described above. The operation and maintenance hours are generally higher due to numerous problems encountered with the pumps. Lakewood did not receive enough power during the evening hours when the park-and-ride lights were on, so the site had to be visited after every storm to manually turn on the pump during the daylight hours when there was enough power. Problems encountered with the pumps themselves also resulted in additional maintenance. The higher number of field hours at Via Verde was mainly associated with the work to repair leaks in the facility. Field hours include inspections, maintenance and vector control.
Table 10-8 Actual Operation and Maintenance Hours for MCTTs
Average Annual District Site Name Equipment Hours Field Hours
Via Verde P&R 44 125 7 (Los Angeles)
Lakewood P&R 35 231
Average Value 40 178
Table 10-9 presents the cost of the average annual requirements for operation and maintenance performed by consultants in accordance with earlier versions of the MID. The operation and maintenance efforts are based on the following task components: administration, inspection, maintenance, vector control, equipment use, and direct costs. Included in administration was office time required to support the operation and maintenance of the BMP. Inspections include wet and dry season inspections and unscheduled inspections of the BMPs. Maintenance included time spent maintaining the BMPs for scheduled and unscheduled maintenance, vandalism, and acts of nature. Vector control included maintenance effort by the vector control districts and time required to perform vector prevention maintenance. Equipment time included the time equipment was allocated to the BMP for maintenance.

BMP Retrofit Pilot Program Final Report
January 2004
10-12
Table 10-9 Actual Average Annual Maintenance Effort – MCTT
Activity Labor Hours Equipment & Materials, $
Inspections 24 -
Maintenance 84 308
Vector control* 70 -
Administration 131 -
Direct cost - 2,504
Total 309 $ 2,812
* Includes hours spent by consultant vector control activities and hours by Vector Control District for inspections
The hours shown above do not correspond to the effort that would routinely be required to operate an MCTT or reflect the design lessons learned during the course of the study. Table 10-10 presents the expected maintenance costs that would be incurred under the final version of the MID for an MCTT serving about 2 ha, constructed following the recommendations in Section 10.7. A detailed breakdown of the hours associated with each maintenance activity is included in Appendix D.
Some of the estimated hours are higher than those documented during the study because certain activities, such as sediment removal, were not performed during the relatively short study period. Only one hour is shown for facility inspection, which is assumed to occur simultaneously with all other inspection requirements for that time period. This estimate also assumes that the facility is constructed of concrete and no vegetation maintenance is required. Labor hours have been converted to cost assuming a burdened hourly rate of $44 (see Appendix D for documentation). Vector control hours were converted to cost assuming an hourly rate of $62. Equipment generally consists of a single truck for the crew, their tools, and material removed from the filter.
Table 10-10 Expected Annual Maintenance Costs for Fina l Version of MID – MCTT
Activity Labor Hours Equipment and Materials, $ Cost, $
Inspections 1 0 44
Maintenance 46 216 2,240
Vector control 12 0 744
Administration 3 0 132
Direct costs - 4,006 4,006
Total 62 $4,222 $7,166

BMP Retrofit Pilot Program Final Report
January 2004
10-13
10.7 Criteria, Specifications and Guidelines
MCTTs were originally designed to reduce toxicity in runoff from critical stormwater source areas, including gas stations, oil change facilities, transmission repair shops and other auto repair facilities. The MCTT was designed with enhanced pollutant removal capabilities compared to a conventional sand filter in order to better operate in heavily contaminated areas for longer periods of time. The extra pretreatment capability protects the media from clogging before the filtration media is exhausted and the selection of appropriate filtration/sorption media also allows targeted control of specific pollutants.
In this study, MCTTs were installed at park-and-ride sites where the runoff contained relatively low levels of pollutants. Consequently, the extra pretreatment capabilities were not utilized. In addition, the performance evaluation of MCTTs was based on the removal of a number of conventional stormwater constituents, rather than on toxicity or PAH reduction. Using this measure of performance, the MCTTs provided approximately the same pollutant removal as sand filters. This is not surprising given that the device, in essence, is an enhanced media filter. At the same time, there are a number of areas in which MCTTs were at a disadvantage to the Austin sand filter design relative to maintenance requirements. A permanent pool of water is maintained in the MCTT, which increased vector concerns and hampered maintenance. The presence of tube settlers in the sedimentation basin also impeded maintenance activities.
MCTTs are considered technically feasible depending on site specific conditions. However, given the comparable performance, it is difficult to conceive of a situation within the context of Caltrans operations in which the selection of an Austin sand filter would not be a better choice for implementation where media filtration of stormwater discharges is desired. Nevertheless, should implementation of an MCTT be considered, the following lessons learned, similar to those for sand filters, may be useful.
10.7.1 Siting
The original siting criteria seem to have been generally successful at locating MCTTs where they could operate effectively. The lack of sufficient head to drive these devices with gravity flow was overcome at all sites with the use of pumps. The pumps have not performed well. Based on the results of this study the primary siting criteria for future installations should include:
• Allow sufficient head to operate by gravity flow (about 1.0 m).
• Contributing watershed area should be relatively small and highly impervious.
• Do not plan any construction up-gradient of the proposed location.
• Avoid installing the device in areas where vector propagation may be a concern.

BMP Retrofit Pilot Program Final Report
January 2004
10-14
10.7.2 Design
Because these devices have had no implementation history in California, design engineers were unfamiliar with basin configuration, filter sizing and appropriate sources of sand for the filter, tube settlers, and absorbent booms. Consequently, design details would be useful to engineers with limited experience. In addition, there are other media filter configurations not tested in this study, such as under-pavement designs and shallower chambers that may be more economical, less intrusive on work space, and acceptably fulfill other requirements. Based on the observations and measurements in this study, the following guidelines are recommended:
• Provide a method to completely drain the sedimentation basin during the dry season if vector issues are a concern.
• The sand/peat mixture in the filtration chamber showed no improvement in removal of the monitored constituents as compared with a filter system using sand alone. Thus, the simpler medium may be preferred.
• When possible, use standard details and prefabricated vaults, where concrete vaults are needed.
• If mosquito breeding is a concern, include vector-restricting covers in the initial design.
10.7.3 Construction
Determining the location of all utilities before construction may not be practical due to limited documentation of utility locations. It is suggested that a small (1-2 percent) contingency be provided in case unknown utilities are encountered. In addition, unsuitable material was encountered at many of the construction sites. Sufficient borings should be made before going out for bid to avoid the delays and expense of contract change orders.
10.7.4 Operation and Maintenance
The MCTTs required more maintenance than other devices in this study; however, some factors helped control maintenance. The basins were constructed of concrete; consequently, no vegetation maintenance was required and slope stability was not an issue. Of course, the initial construction cost is significantly higher than it would be at a comparable site with earthen walls and floors. Additional reduction in maintenance costs could be expected by reducing the maintenance frequency from weekly to semiannually (assuming vectors are adequately controlled) and not siting the units where pumping is required.
Based on the level of maintenance required in this study, recommended future maintenance activities include:

BMP Retrofit Pilot Program Final Report
January 2004
10-15
• Perform inspections and maintenance as recommended in MID (Version 17) in Appendix D, which includes inspections for trash and debris, sediment accumulation, standing water, and pump operation.
• Schedule semiannual inspections for the beginning and end of wet season to identify potential problems.
• Remove accumulated trash and debris in the sedimentation basin and the filter bed during routine inspections.
• Inspect the facility once during the wet season after a large rain event to determine whether the facility is draining completely within 48 hours.
• Remove and dispose of top 50 mm of media if facility drain time exceeds 72 hours. Restore media depth to 450 mm when overall media depth drops to 300 mm.
• Remove accumulated sediment in the sedimentation basin every 10 years or when the sediment occupies 50 percent of the volume underneath the tube settlers.
• Where there is a long dry season and concern with mosquito breeding, pump MCTTs dry at the end of the wet season.

BMP Retrofit Pilot Program Final Report
January 2004
11-1
11 DRAIN INLET INSERTS
11.1 Siting
A total of six drain inlet inserts (DIIs) were sited, installed, and monitored for this study. All were located within District 7. Of the six inserts, three were FossilFilter™ and three were StreamGuard™. One of each type of drain inlet insert was sited at each of three maintenance stations. Initially, six different DII manufacturers were considered. These included Aquafend Filter, FossilFilter™, Gullywasher® Geotextile CB Insert, Hydro-Kleen, StreamGuard™, and Zero Discharge Storm Drain Liner. These candidates use a variety of arrangements (e.g., trays, bags, and baskets) and construction materials (e.g., stainless steel, fiberglass, polypropylene, PVC, and galvanized steel).
The process of selecting two types of DIIs included review of manufacturers’ literature and the limited test data available to identify the advantages and constraints of each of the technologies. Two different types of arrangements (bag vs. tray) where selected by the study team to allow for comparison between types of arrangements. FossilFilter™ had over 5,000 installations according to the manufacturer and was the most thoroughly evaluated insert. The StreamGuard™ had over 20,000 installations according to the manufacturer, although data on performance was limited. After the first year of operation, all of the inserts, including some that were introduced since the study began, were again considered for testing; however, the study team elected to continue testing the FossilFilter™ and StreamGuard™.
One of the primary siting criteria that reduced the number of viable sites was that the proposed sites needed to contain at least two drain inlet structures so that a comparison between each DII type could be made under similar conditions. Additional criteria included storage of heavy vehicles and/or equipment in the tributary area, since petroleum hydrocarbons were primary target constituents for the inserts. Initially, the Alameda, Altadena, Central, Eastern Regional, Foothill, Las Flores, Metro and Rosemead Maintenance Stations were considered for drain inlet insert retrofit because they contained drain inlet structures with heavy equipment on site. Reasons for rejection included: the absence of two onsite catch basins, the high cost of site improvements required to direct water to a second inlet, and the cost and feasibility associated with extensive offsite improvements for those sites not containing adequate onsite drainage facilities.
After review, only three sites met the site selection criteria: Foothill, Rosemead, and Las Flores Maintenance Stations. These sites contained multiple drainage inlets and site activities consistent with the criteria for the study. Table 11-1 shows the characteristics of the contributing watersheds for each drain inlet insert.
Since the purpose of the pilot study was to assess the effectiveness of two types of drain inlet inserts, ideally each insert would have treated the same amount of runoff. Since this

BMP Retrofit Pilot Program Final Report
January 2004
11-2
was not possible, the inserts were rotated over the course of the study placed so that one type did not always treat the larger flow at all sites.
Another important siting criterion for DIIs was that flows should enter the insert from all sides of the inlet. Flow that concentrates on one side or corner of device can cause bypass for even moderate events. This was most relevant for the FossilFilter™, which had a center bypass through the perimeter ‘tray.’
Table 11-1 Summary of Contributing Watershed Characteristics for DIIs
Site Drain Inlet Insert Type
Watershed Area Hectare
Impervious Cover %
Foothill MS FossilFilter™ 0.64 100
StreamGuard™ 0.07 100
Rosemead MS FossilFilter™ 0.10 100
StreamGuard™ 0.49 100
Las Flores MS FossilFilter™ 0.32 70
StreamGuard™ 0.09 62
11.2 Design
The FossilFilter™ DII is a trough structure that is installed under the grate of a drain inlet. The trough contains stainless steel filter cartridges filled with amorphous alumina silicate for the removal of petroleum hydrocarbons and other contaminants. The trough is made of fiberglass and consists of a large center opening for the bypass of water when the flow-through capacity of the filter is exceeded. A schematic of the device is shown in Figure 11-1. An installation is shown in Figure 11-3.
The StreamGuard™ DII is a conical-shaped porous bag made of polypropylene fabric and contains an oil absorbent polymer. As stormwater flows through the insert, the fabric absorbs oil and retains sediment. Floating oil and grease are absorbed by the absorbent polymer. The insert has two overflow cutouts near the top of the cone to allow bypass when the fabric’s flow-through capacity is exceeded. A schematic is shown in Figure 11-2. An installation is shown in Figure 11-4.

BMP Retrofit Pilot Program Final Report
January 2004
11-3
Each pair of drain inlets at the three maintenance stations originally operated in series, with one drain inlet discharging into the other drain inlet. This situation would distort the monitoring results of the downstream inlet since the effluent sample would contain runoff that did not flow through the insert. Therefore, the design included the diversion of the upstream piping to isolate the retrofitted inlet. For widespread installation of DIIs this would be unnecessary.
The StreamGuard™ fits catch basins up to 0.760 m by 1.02 m. Bypass was observed when the depth of water reached 0.56 m. This occurred at various flow rates depending on the filter fabric, but generally the StreamGuard™ is designed to handle flow rates up to 0.005 m3/s. It is designed to fill with the heavier sediment particles, and the oil rises to
Figure 11-1 Schematic of FossilFilter™ SOURCE: KriStar
Figure 11-2 Schematic of StreamGuard™ SOURCE: Foss Environmental
Figure 11-3 FossilFilter™ Figure 11-4 StreamGuard™

BMP Retrofit Pilot Program Final Report
January 2004
11-4
the surface where it is absorbed in the oil-absorbent media. The FossilFilter™ fits a standard Caltrans G1 type inlet using type 450-9X and 600-12X grates. It has a flow capacity of 0.0025 m3 /s/m of filter rail. The design peak flows for the water quality storm are shown in Table 11-2.
Table 11-2 Design Characteristics of the DIIs
Site Design Storm mm
Design Storm Peak Flow
m3/s
WQV m3
Foothill MS FF* 25 0.010 160
Foothill MS SG* 25 0.001 12
Rosemead MS FF 25 0.003 25
Rosemead MS SG 25 0.014 123
Las Flores MS FF 25 0.005 86
Las Flores MS SG 25 0.001 25
*FF = FossilFilter™, SG = StreamGuard™
11.3 Construction
Both the StreamGuard™ and FossilFilter™ were installed according to the manufacturer’s guidelines. However, the guidelines were insufficient for providing a tight seal between the frame of the drain inlet and the insert. Both DIIs had to be sealed to minimize flow bypass around the insert. For the FossilFilter™, this was done by sealing the DII-inlet interface with foam material. For the StreamGuard™, this was done by inserting wood between the insert and the inlet edge to form a tight seal between the grate, the grate frame and the insert fabric. This is likely to be a consideration for most DII applications.
Most of the other issues that occurred during construction and installation of the drain inlet inserts were caused by construction activities that were associated exclusively with the monitoring equipment and the need to redirect flows as part of the monitoring program. Installation of the inserts themselves had little impact on normal facility operations and was not impacted by unknown field conditions, presence of utilities or lack of accurate as-built plans.
11.4 Maintenance
Maintenance of the drain inlet inserts depended on the rate pollutants and debris accumulated, the storage capacity, and the requirements for proper operation. Inspections for debris and trash were conducted at each DII site before, during and after each storm event, and monthly during the dry season. In general, small amounts of trash, debris, and
BMP Retrofit Pilot Program Final Report
January 2004
11-5
sediment were removed from the insert. The DIIs were inspected for oil and grease at the end of each target storm, and monthly during the dry season. Monthly inspections of the structural integrity of the insert were conducted and the medium was replaced annually. Additionally, sediment was scheduled for removal when more than 150 mm had accumulated at the StreamGuard™ sites.
The FossilFilter™ inserts were subject to flow bypass because of sediment and debris (leaves, litter, etc.) covering the cartridges. Therefore, sediment and debris had to be removed from the top of the cartridges before a storm event and generally once during the event. This requirement could be a major operation and maintenance burden depending on the DII siting.
The StreamGuard™ inserts at Las Flores and Rosemead had to be refitted into the drain inlet after they had slipped because of the weight of the water and material collected within the filter bag. Pre-storm inspections and maintenance of the inserts were necessary to minimize the slipping of the insert into the drain inlet during the storms. Inspections were conducted prior to and during each storm event, as well as monthly. Figure 11-5 shows the average number of hours spent in the field for maintenance at the DIIs. An average of 40 hours was needed to maintain the FossilFilter™ DII and 32 hours to maintain the StreamGuard™ DII. Of these hours each had approximately 17 hours for vector control related activities.
11.5 Performance
11.5.1 Chemical Monitoring
Removal efficiencies were estimated using a mass-balance approach for each DII, because paired influent and effluent samples were not collected. The effluent pollutant mass was determined through flow weighted monitoring and the influent mass was estimated from the amount of material retained on the insert as described below.
1. Calculate percent efficiency representing the time interval since the last time the insert medium was changed, using the equation:
100x MassPollutant Influent Estimated
MassPollutant Effluent MassPollutant Influent Estimated(%) Efficiency −=
2. Estimate the influent pollutant mass for the time interval according to: Estimated Influent Pollutant Mass = Insert Medium Pollutant Mass
+ Total Effluent Pollutant Mass for the Time Interval
3. Estimate the total effluent mass for all storm events in the time interval according to:
Estimated Total Effluent Pollutant Mass = Mean EMC x Total Runoff Volume

BMP Retrofit Pilot Program Final Report
January 2004
11-6
4. Compute mean efficiencies for each pollutant for the monitoring period.
Figure 11-5 Field Maintenance Activities at DII Sites (1999-2001)
Tables 11-3 and 11-4 show the average removal efficiencies for the StreamGuard™ and FossilFilter™. The amount of material retained by the device is the total weight from all the installations of each type of device during the 2000-2001 monitoring period. For most constituents less than a 10 percent reduction in concentration was observed despite a maintenance program that included removal of obstructing material during storm events. Solids removal is slightly higher than that calculated for metals and hydrocarbons.
Solids, metals and hydrocarbon removal efficiency by the FossilFilter™ DII generally decreased with increased flow volume. Solids removal efficiency by the FossilFilter™ at Rosemead MS and the StreamGuard™ DIIs at Foothill and Las Flores MS were comparatively higher than the other DIIs because of the quantity of wind-blown material entrapped by the DIIs. Consequently, these removal efficiencies are not directly comparable to those monitored using automated equipment, since the automated devices

BMP Retrofit Pilot Program Final Report
January 2004
11-7
do not collect samples of the large debris that was manually removed from the inserts. Therefore, the amount of litter that bypassed the devices could not be measured. Efficiencies of the StreamGuard™ DII at Rosemead MS were especially low, at or near zero, and this was attributed to the large flow volume passing through the DII and the relatively small amount of sediment and debris in its watershed.
Table 11-3 Mass Reduction Efficiencies for StreamGuard™ (excluding litter and debris)
Constituent Gram Retained Absorbent
Gram Retained Fabric Gram Effluent Removal, %
TSS 2,410 6,170 248,930 3 Total Cu 0.03 0.33 98.8 0
Total Pb 0.05 0.68 55.07 1 Total Zn 0.22 4.70 695.88 1 Hydrocarbons 69.94 13.55 3613.05 2
Table 11-4 Mass Reduction Efficiencies for FossilFilter™ (excluding litter and debris)
Constituent Gram Retained Insert Gram Effluent Removal, %
TSS 22,320 131,730 14 Total Cu 0.74 39.64 2 Total Pb 1.08 13.89 7 Total Zn 6.80 417.52 2 Hydrocarbons 7.43 1628.57 0
Note: The manufacturer of FossilFilter™ advises that all models of the FossilFilter™ similar to those used in this study are no longer in production and have been replaced by a product called FloGard™.
11.5.2 Empirical Observations
The hydraulic capacity of the FossilFilter™ DII had an impact on the performance of this insert. The FossilFilter™ DII was designed not to impede flow to prevent flooding from backwater. Therefore, during higher discharge rates, the runoff had sufficient velocity and/or volume to pass over the lip of the cartridges and enter the storm drain directly through the tray bypass area. This occurred during 10 of 18 events at Foothill, five of 18 events at Las Flores and eight of 19 events at Rosemead.
Flow bypass also occurred in the FossilFilter™ DII due to accumulation of trash, debris, and sediment on top of the filter cartridge screens. This blocked the filter cartridge screens so that stormwater could not pass through them. At the Foothill MS FossilFilter™ bypass was observed during 11 events with rainfall intensities as low as

BMP Retrofit Pilot Program Final Report
January 2004
11-8
6 mm/hr. At the Rosemead FossilFilter™ bypass was observed during 15 events with rainfall intensities as low as 3.3 mm/hr. At the Las Flores FossilFilter™ bypass was observed during seven events with rainfall intensities starting at 9 mm/hr.
Flow bypass also occurred at the StreamGuard™ DII sites during five of 18 events at Foothill, six of 18 events at Las Flores and eight of 19 events at Rosemead. This was due to runoff filling the cone and flowing through the overflow cut-outs. The cone of the StreamGuard™ is 0.61 m deep; when the standing water in the cone reached a depth of 0.56 m, bypass occurred through the two overflow cut-outs on the sides. It was determined that there were variations in the pore size of the filter fabric and the smaller pore size reduced the flow rate. The manufacturer indicated that the apparent opening size (AOS) of the fabric used to construct the unit was highly variable, resulting in substantial differences in the hydraulic capacity of a specific filter unit.
A secondary failure due to low hydraulic capacity occurred when the weight of the standing water in the cone caused the insert to slip downward into the inlet. This caused a gap in the inlet- insert interface and allowed bypass to occur. During heavy rainfall conditions, the StreamGuard™ did not have sufficient flow bypass capacity; consequently, flooding occurred at the Rosemead MS on three occasions.
Each DII site was monitored for mosquito activity by the local vector control agency. One location, Rosemead MS, had observations of breeding on five occasions; however, this was due to standing water associated with the monitoring equipment and was not related to the performance of the DII. At the Las Flores Maintenance Station, abatement was performed on one occasion when standing water was observed in the monitoring vault, even though no breeding had been detected. The vector control district was subsequently notified to only abate when vector breeding was verified. Table 11-5 lists the incidences of mosquito breeding at the DII sites.
Table 11-5 Incidences of Mosquito Breeding – DIIs
Number of Times Site
Breeding Observed Abatement Performed Foothill MS 0 0
Rosemead MS 5 5
Las Flores MS 0 1
11.6 Cost
11.6.1 Construction
Table 11-6 shows the cost for construction and installation of the drain inlet inserts. The actual costs are the costs incurred for the installation of the drain inlet inserts and the associated monitoring facilities needed for the pilot program. This includes the

BMP Retrofit Pilot Program Final Report
January 2004
11-9
installation of flumes for monitoring and diversion of flows to isolate effluent flow for monitoring. These costs are easily the lowest of any of the BMPs evaluated in this study. Costs were normalized for drain inlet inserts by calculating a water quality volume for the drainage area treated by the device and the amount of rainfall during the design storm. While the size of inlets does vary according to catchment area, the variation is not enough to significantly affect the cost of a DII; in most cases, these types of BMPs would be installed on a unit (per drain inlet) basis and not according to runoff volume or flow.
The adjusted construction costs for the DIIs are shown in Table 11-7. No single item was responsible for the cost adjustment. The majority of the cost for the drain inlet insert pilot was related to monitoring. Since the material cost of the inserts was a minor part of the bid package, the labor to install these could have been incorporated into the larger bid items. Consequently, the adjusted construction cost seems to reflect the purchase price of the inserts and may not accurately include labor cost.
Table 11-6 Actual Construction Costs for DIIs (1999 dollars)
Site Actual Cost, $ Actual Cost w/o Monitoring, $
Costa/WQV $/m3
Foothill MS FF 36,879 1,186 7.30
Foothill MS SG 36,879 1,186 66.70
Rosemead MS FF 32,116 1,186 46.69
Rosemead MS SG 32,116 1,186 9.53
Las Flores MS FF 51,696 1,186 14.59
Las Flores MS SG 51,696 1,186 51.88 a Actual cost w/o monitoring.
SOURCE: Caltrans Cost Summary Report CTSW-RT-01-003.
All DII installations were in maintenance stations and subsequently did not incur traffic control costs. If constructed roadside, DII could incur significant traffic control cost. Traffic control costs were not used to estimate adjusted construction cost.
11.6.2 Operation and Maintenance
Table 11-8 shows the average annual operation and maintenance hours for each site and the average annual hours for equipment. Field hours include inspections, maintenance and vector control.

BMP Retrofit Pilot Program Final Report
January 2004
11-10
Table 11-7 Adjusted Construction Costs for DIIs (1999 dollars)
DII Adjusted Construction Cost $ Cost/WQV $/m3
Mean 370 10.23
High 371 20.81
Low 369 2.28
SOURCE: Adjusted Retrofit Construction Cost Tables, Appendix C.
Table 11-8 Actual Operation and Maintenance Hours for DIIs
Average Annual Site Name
Equipment Hours Field Hours
Foothill MS FF* 0 31
Rosemead MS FF 0 56
Las Flores MS FF 0 31
Foothill MS SG* 0 21
Rosemead MS SG 0 51
Las Flores MS SG 0 24
Average Value 0 36
*FF = FossilFilter™; SG = StreamGuard™
Slightly more hours were spent at the FossilFilter™ DIIs than at the StreamGuard™ DIIs. This was primarily due to the more frequent cleaning needed by the FossilFilter™ DII to prevent flow bypass during storm events. The actual number of maintenance hours spent in the field for the FossilFilter™ was an average of 36 hr/yr and for the StreamGuard™ an average of 20 hr/yr.
Table 11-9 presents the cost of the average annual requirements for operation and maintenance performed by consultants in accordance with earlier versions of the MID. The operation and maintenance efforts are based on the following task components: administration, inspection, maintenance, vector control, equipment use, and direct costs. Included in administration was office time required to support the operation and maintenance of the BMP. Inspections include wet and dry season inspections and unscheduled inspections of the BMPs. Maintenance included time spent maintaining the BMPs for scheduled and unscheduled maintenance, vandalism, and acts of nature. Vector control included maintenance effort by the vector control districts and time

BMP Retrofit Pilot Program Final Report
January 2004
11-11
required to perform vector prevention maintenance. Equipment time included the time equipment was allocated to the BMP for maintenance.
Table 11-9 Actual Average Annual Maintenance Effort - DII
Activity Labor Hours Equipment & Materials $
Inspections 11 -
Maintenance 9 0
Vector control* 17 -
Administration 84 -
Direct cost - 563
Total 121 $ 563
* Includes hours spent by consultant vector control activities and hours by Vector Control District for inspections
The hours shown above do not correspond to the effort that would routinely be required to operate a DII or reflect the design lessons learned during the course of the study. Table 11-10 presents the expected maintenance costs that would be incurred under the final version of the MID for a DII at a single inlet. A detailed breakdown of the hours associated with each maintenance activity is included in Appendix D.
Only one hour is shown for facility inspection, which is to occur simultaneously with all other inspection requirements for that time period. Hours assume maintenance will occur during business hours. If maintenance is required during non-business hours bypass may occur. Labor hours have been converted to cost assuming a burdened hourly rate of $44 (see Appendix D for documentation). Equipment generally consists of a single truck for the crew and their tools.

BMP Retrofit Pilot Program Final Report
January 2004
11-12
Table 11-10 Expected Annual Maintenance Costs for Final Version of MID – DII
Activity Labor Hours Equipment and Materials, $ Cost, $
Inspections 1 0 44
Maintenance 18 21 813
Vector control 0 0 0
Administration 3 0 132
Direct Costs - 115 115
Total 22 $136 $1,104
11.7 Criteria, Specifications and Guidelines
The DII devices selected for the pilot program appeared to be the best available at the time for the intended use. The most appropriate application for DII is probably an area where source controls can prevent most but not all pollutant releases to the drainage system, and with personnel in attendance to provide the level of maintenance needed. However, the devices proved to be more maintenance- intensive and less effective than expected. The main maintenance issue was that personnel had to be available during storms to remove material causing bypass of the devices.
This technology is continually evolving and new configurations may be developed that are better suited for Caltrans facilities and that should be considered. However, they are not considered technically feasible for use at the piloted locations at this time due to poor constituent removal, and required level of maintenance. It also would be beneficial to have a test site for DII devices, where manufacturers could install their devices and have them operated and tested at their expense to facilitate rapid adoption of those devices that prove successful.
11.7.1 Siting
Based on the results of this study, the primary siting criteria recommended for future installations include the following:
• Implement DIIs where the drainage area is less than 0.8 ha.
• DII should be installed in maintenance yards or other facilities where there are personnel available to do regular maintenance and monitor operation.
• Source control should be the primary means to prevent pollutants from coming in contact with stormwater.

BMP Retrofit Pilot Program Final Report
January 2004
11-13
• DIIs may be more appropriate for temporary conditions (e.g., a construction project or a special operation that may release pollutants), than for installation as a primary treatment BMP.
• Avoid installation of DIIs in areas with overhanging vegetation and other sources of material that could potentially clog the filters, or where wind-blown debris from off-site is a problem.
11.7.2 Design
Based on the observations and measurements in this study, the following guidelines are recommended:
• Avoid installing perimeter-type drain inlet inserts where runoff enters the insert as concentrated flow.
• If flows do not enter the insert along all sides of the inlet, determine the maximum flow rate allowed considering only the sides the flows enter.
11.7.3 Construction
Listed below are guidelines that should improve the construction process:
• To prevent flow bypass seal all gaps between the inlet and the drain inlet insert.
• Be aware of mesh-size variation in “sock” type DIIs.
11.7.4 Operation and Maintenance
Based on the level of maintenance required in this study, recommended future maintenance activities include:
• Perform inspections and maintenance as recommended in MID (Version 17) in Appendix D, which includes inspections for trash and debris, structural integrity and sediment accumulation.
• Inspect the insert for debris and trash weekly during the wet season and remove accumulated material.
• Inspect the structural integrity at the beginning and end of the wet season.
• Renew the insert or medium annually at the end of the wet season or per manufacturer’s direction.
• For the StreamGuard™, remove sediment when it accumulates to more than 150 mm, and inspect weekly during the wet season.

BMP Retrofit Pilot Program Final Report
January 2004
12-1
12 OIL-WATER SEPARATOR
12.1 Siting
One Oil-Water Separator (OWS) was sited, installed, and monitored for this study. It was located in District 7 at the Alameda Maintenance Station.
The primary siting criteria for an OWS were:
• Presence of heavy equipment, light-duty vehicles and cars
• Presence of liquid asphalt crack sealant and solids
• Quality of oil waste storage area
• Type of runoff flow paths (concentrated for sampling purposes)
• Site exposure to rain
• Existence of drain inlets on site
• Accessibility of site for sampling
• Safety with respect to vehicular traffic
Initially, 22 sites were investigated within District 7 and District 11; the 10 sites with the most potential were then subject to further investigations. Those sites were Alameda, Altadena, Eastern Regional, Escondido, Foothill, Kearny Mesa, Metro, San Fernando, Tarzana and Westdale Maintenance Stations. Sites with concentrations of free oil and grease in runoff of greater than 10 mg/L were preferred since this is about the lowest concentration the coalescing plate separator technology can achieve. Stormwater runoff was sampled during the site screening process at the four maintenance stations that had the most potential for high levels of oil and grease. The results are shown in Table 12-1.
Table 12-1 Oil/Grease Sampling Results
Location Maintenance Station Average Oil/Grease Concentration mg/L
Alameda 34.7
Altadena 20.3
Metro 8.6
Escondido 9.4

BMP Retrofit Pilot Program Final Report
January 2004
12-2
Alameda MS was selected for implementation of the oil-water separator because it had the highest oil and grease concentration. More than 25 heavy vehicles were located in areas of the site exposed to stormwater. There was also onsite petroleum-based material storage, such as oil waste, asphalt crack sealant, and solid asphalt. Tables 12-2 and 12-3 show the characteristics of the selected contributing watershed for the oil-water separator.
Table 12-2 Summary of Contributing Watershed Characteristics for Oil-Water Separator
Site Watershed Area Hectare
Impervious Cover %
Alameda MS 0.3 100
12.2 Design
The oil-water separator selected for this study was an Areo-Power® 500 gallon ST1-P3. The OWS separates oil and water by allowing the oil droplets to collide and coalesce to become larger globules that are then captured in the separator. There are three compartments in the separator, a forebay, an oil separation chamber, and an afterbay. The forebay traps and collects sediments. The oil separation chamber contains a parallel, corrugated plate coalescer and a removable oleophilic fiber coalescer that promote the separation of oil and water. The oil is captured and held in this cell (second chamber). The afterbay discharges treated stormwater with a free oil and grease concentrations of about 10 mg/L or less. A schematic of the device, shown in Figure 12-1, summarizes the design characteristics for the oil water separator. The actual OWS installed is shown in Figure 12-2.
Table 12-3 Design Characteristics of the OWS
Site Design Storm mm
Design Storm Peak Flow
m3/s
WQV m3
Alameda MS 25 0.03 65
12.3 Construction
Construction problems centered primarily on conflict with existing utilities. The site is also somewhat constrained with relatively limited space for maintenance station activities. Consequently, some conflicts with the ongoing operation of the station were also encountered.

BMP Retrofit Pilot Program Final Report
January 2004
12-3
Figure 12-1 Schematic of an OWS (Source: Highland Tank and Manufacturing Company)
Figure 12-2 Alameda OWS

BMP Retrofit Pilot Program Final Report
January 2004
12-4
12.3.1 Unknown Field Conditions
The final location of the oil-water separator was changed twice during construction because of conflicts with a fire water line, irrigation line, and electrical conduit. These utilities were in locations different than shown on as-built drawings. The re-excavation resulted in additional labor and equipment costs as well as increased costs for soil and asphalt disposal and backfill. Additional design work was required to re-calculate the system elevations in order to ensure proper drainage of the BMP in the new location. These changes resulted in increased costs and schedule delays.
12.3.2 Interface with Existing Activities
The maintenance station supervisor identified the need for improved access to an existing building entrance. The perimeter fence length was increased to provide better access.
12.4 Maintenance
Initially, there were monthly inspections for sediment accumulation in the pre-separator and separator chamber and inspections for oil accumulation in the oil chamber. The MID requires removal of the accumulated oil when it occupies more than 50 percent of the chamber volume. Because little or no accumulation was observed, the inspection frequency was reduced to quarterly after the first monitoring season.
Additional maintenance included inspection of the coalescer for debris and gummy deposits at the beginning and end of the wet season. On a monthly basis, the water level of the tank was measured to ensure it was at the operating level. The general mechanical integrity of the oil-water separator was assessed monthly before the beginning of and during the wet season.
The annual number of maintenance field hours, 74 hours, by activity is shown in Figure 12-3. Because of the small amount of oil and grease in the runoff, little actual maintenance of the facility was required. Inspections required under the MID and by the vector control agencies constituted almost all of the activities at the site, 14 hours and 57 hours, respectively.
12.5 Performance
12.5.1 Chemical Monitoring
Removal efficiencies were estimated for the oil-water separator based on grab samples collected at the influent and effluent. TSS, TPH-gasoline, TPH-diesel, TPH-oil and oil and grease removal efficiencies were analyzed and the results are shown in Table 12-4. TPH-diesel exhibited the highest removal efficiency, followed closely by TSS. Despite the relatively high concentrations of oil and grease measured during the siting phase at this location, most events after installation of the device had no detectable amounts of oil and grease. During one event (10/26/00) a concentration of 216 mg/L of oil and grease

BMP Retrofit Pilot Program Final Report
January 2004
12-5
was reported; however, this far exceeds the concentrations of TPH gasoline and diesel (both below reporting limits) and TPH oil (3.1 mg/L) measured for the same event. This single high value is mainly responsible for the average oil and grease concentration of 30 mg/L shown in Table 12-4. Only low levels of other hydrocarbons were observed.
Figure 12-3 Field Maintenance Activities at OWS (1999-2001)
Table 12-4 Concentration Reduction for the OWS
Mean of Grab Samples Constituent Influent
mg/L Effluent
mg/L
Removal %
TSS 144.7 74.3 49 TPH – Oil b 0.83 0.71 14 TPH – Diesel b 0.83 0.40 52 TPH – Gasoline b <0.050a <0.050a - Oil & Grease b 30 <5a 89
a Equals value of reporting limit b TPH was collected by grab method and may not accurately reflect removal

BMP Retrofit Pilot Program Final Report
January 2004
12-6
12.5.2 Empirical Observations
The observations of the OWS indicated there was no bypass or short-circuiting of the unit during design level storms. The influent water generally appeared brown with suspended solids and a slight oily sheen. The effluent discharged was clear with black suspended solids and a hydrocarbon odor; however, as noted previously, oil accumulation in the device was never observed.
The OWS was monitored for mosquito activity by the local vector control agency. As shown in Table 12-5, mosquito breeding was observed and abatement was performed on two occasions.
Table 12-5 Incidences of Mosquito Breeding – OWS
Number of Times Site Breeding Observed Abatement Performed
Alameda MS 2 2
12.6 Cost
12.6.1 Construction
Table 12-6 shows the cost for construction and installation of the oil-water separator. The actual costs are the costs incurred for the installation of the oil-water separator and the associated monitoring facilities needed for the pilot program. Construction costs without monitoring related equipment are also shown.
Table 12-6 Actual Construction Costs for OWS (1999 dollars)
Site Actual Cost, $ Actual Cost w/o Monitoring, $
Costa/WQV $/m3
Alameda MS 179,437 165,043 2,540 a Actual cost w/o monitoring.
SOURCE: Caltrans Cost Summary Report CTSW-RT-01-003.

BMP Retrofit Pilot Program Final Report
January 2004
12-7
The adjusted construction costs for the OWS are presented in Table 12-7. Reductions to the actual OWS costs were made for the following reasons:
• Limited head and space caused construction cost that would increase the adjusted cost by 23 percent. This cost was excluded from the adjusted cost.
• Miscellaneous site-specific factors caused increased construction cost. This cost would increase the adjusted cost by 4 percent. These costs were excluded from the adjusted cost.
The oil-water separator installation was at a maintenance station and subsequently did not incur traffic control costs. If constructed roadside, an OWS could incur traffic control cost typical of EDBs, in which traffic control accounted for an average of 9 percent of the adjusted construction cost. Traffic control costs were not used to estimate adjusted construction cost.
Table 12-7 Adjusted Construction Costs for OWS (1999 dollars)
Oil-Water Separator Adjusted Construction Cost $ Cost/WQV
$/m3
One Location 128,305 1,970
SOURCE: Adjusted Retrofit Construction Cost Tables, Appendix C.
12.6.2 Operation and Maintenance
Approximately 74 man-hr/yr were required for inspections, maintenance and vector control activities and no special equipment was required. Table 12-8 presents the cost of the average annual requirements for operation and maintenance performed by consultants in accordance with earlier versions of the MID. The operation and maintenance efforts are based on the following task components: administration, inspection, maintenance, vector control, equipment use, and direct costs. Included in administration was office time required to support the operation and maintenance of the BMP. Inspections include wet and dry season inspections and unscheduled inspections of the BMPs. Maintenance included time spent maintaining the BMPs for scheduled and unscheduled maintenance, vandalism, and acts of nature. Vector control included maintenance effort by the vector control districts and time required to perform vector prevention maintenance. Equipment time included the time equipment was allocated to the BMP for maintenance.

BMP Retrofit Pilot Program Final Report
January 2004
12-8
Table 12-8 Actual Average Annual Maintenance Effort – OWS
Activity Labor Hours Equipment & Materials $
Inspections 14 -
Maintenance 3 0
Vector control* 57 -
Administration 65 -
Direct cost - 1,066
Total 139 $1,066
* Includes hours spent by consultant vector control activities and hours by Vector Control District for inspections
The hours shown above do not correspond to the effort that would routinely be required to operate an OWS or reflect the design lessons learned during the course of the study. Table 12-9 presents the expected maintenance costs that would be incurred under the final version of the MID for an OWS serving about 2 ha. A detailed breakdown of the hours associated with each maintenance activity is included in Appendix D.
Table 12-9 Expected Annual Maintenance Costs for Final Version of MID – OWS
Activity Labor Hours Equipment and Materials, $ Cost, $
Inspections 1 0 44
Maintenance 10 0 440
Vector Control 12 0 744
Administration 3 0 132
Direct Costs - 180 180
Total 26 $180 $1,540
Some of the estimated hours are higher than those documented during the study because certain activities, such as oil and sediment removal, were not performed during the relatively short study period. Only one hour is shown for facility inspection, which is to occur simultaneously with all other inspection requirements for that time period. Labor hours have been converted to cost assuming a burdened hourly rate of $44 (see Appendix D for documentation). Vector control hours were converted to cost assuming an hourly rate of $62. Equipment generally consists of a single truck for the crew and their tools.

BMP Retrofit Pilot Program Final Report
January 2004
12-9
12.7 Criteria, Specifications and Guidelines
Oil-water separators have generally been thought to be applicable for treatment of stormwater from “gasoline stations, and truck, car, and equipment maintenance and washing enterprises and other commercial and industrial facilities” (WEF and ASCE, 1998). Although Caltrans maintenance stations fit this profile, the initial site screening and subsequent monitoring at the Alameda Maintenance Station and other MS locations indicate that the concentrations of free oil and grease in runoff from these types of facilities is normally very low. This is primarily due to source-control measures in effect at all Caltrans maintenance station facilities.
Manufacturers indicate that free oil and grease concentrations in the influent must routinely be at 50 mg/L or higher for the units to be considered applicable for the site. Other conventional controls, such as extended detention basins, biofilters or sand filters, could be expected to provide better removal of other constituents, while providing comparable reduction in oil and grease at the concentrations observed in this study. A simple baffle box may be appropriate under certain circumstances for spill control; however, treatment of stormwater runoff would not be an objective. An oil-water separator should not be considered the first choice for a stormwater BMP. However, they may be appropriate in certain non-stormwater situations (e.g., where source controls cannot ensure low oil and grease concentrations).

BMP Retrofit Pilot Program Final Report
January 2004
13-1
13 CONTINUOUS DEFLECTIVE SEPARATORS (CDS®)
13.1 Siting
Continuous Deflective Separators (CDS®) are a proprietary water quality treatment device originally developed in Australia and marketed through CDS Technologies in the United States. They are hydrodynamic devices designed primarily as gross pollutant traps to capture trash, debris and floatables in stormwater runoff. A secondary objective is removal of sediment and associated pollutants. Two CDS® units were sited and constructed for this study, both located in District 7. Table 13-1 presents the watershed characteristics for the two sites. Siting criteria for the CDS® units included:
• Maintenance access
• Equipment security
• Sampling safety and access
• Absence of median drains
• Minimum of four and maximum of ten drain inlets contributing to the unit
• No offsite tributary area
• Sufficient space at the storm drain outfall to construct the unit and appurtenances
Table 13-1 Summary of Contributing Watershed Characteristics for CDS®
Site Location Land Use Watershed Area Hectare
Impervious Cover %
I-210 WB east of Orcas Highway 0.44 100
I-210 WB east of Filmore Highway 1.02 100
13.2 Design
The CDS® units work by diverting flow from the storm drain system via a weir into the unit separation chamber and sump. Flow must be subcritical in the storm drain system for the diversion weir to function effectively. These hydrodynamic units are designed to introduce the flow in a direction tangent to the arc of the separation chamber. Using this approach, the dominant velocity vector is parallel to the unit screen, which tends to keep the screen from blocking with debris. Water passes through the screen to an outer peripheral chamber where it reverses direction and flows back into the storm drain system. The screen retains gross pollutants from the diverted flow except for material smaller than the openings in the screen. Figures 13-1 and 13-2 show a plan and elevation view of the device.

BMP Retrofit Pilot Program Final Report
January 2004
13-2
Figure 13-1 Plan View of CDS®
Figure 13-2 Elevation View of CDS®
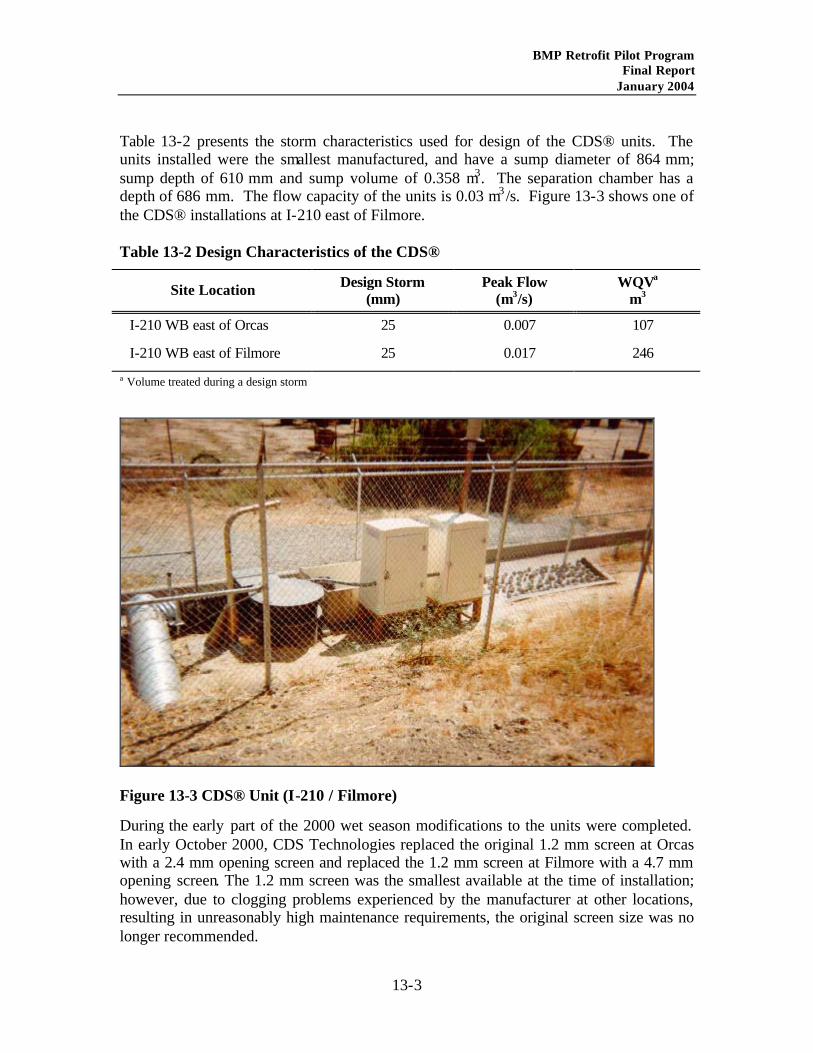
BMP Retrofit Pilot Program Final Report
January 2004
13-3
Table 13-2 presents the storm characteristics used for design of the CDS® units. The units installed were the smallest manufactured, and have a sump diameter of 864 mm; sump depth of 610 mm and sump volume of 0.358 m3. The separation chamber has a depth of 686 mm. The flow capacity of the units is 0.03 m3 /s. Figure 13-3 shows one of the CDS® installations at I-210 east of Filmore.
Table 13-2 Design Characteristics of the CDS®
Site Location Design Storm (mm)
Peak Flow (m3/s)
WQVa
m3
I-210 WB east of Orcas 25 0.007 107
I-210 WB east of Filmore 25 0.017 246
a Volume treated during a design storm
Figure 13-3 CDS® Unit (I-210 / Filmore)
During the early part of the 2000 wet season modifications to the units were completed. In early October 2000, CDS Technologies replaced the original 1.2 mm screen at Orcas with a 2.4 mm opening screen and replaced the 1.2 mm screen at Filmore with a 4.7 mm opening screen. The 1.2 mm screen was the smallest available at the time of installation; however, due to clogging problems experienced by the manufacturer at other locations, resulting in unreasonably high maintenance requirements, the original screen size was no longer recommended.

BMP Retrofit Pilot Program Final Report
January 2004
13-4
13.3 Construction
The CDS® units were installed with only one minor change order required. The existing drainage system at the I-210 / Orcas Avenue site is a concrete v-ditch channel that runs along the bottom of the embankment parallel to the roadway. The first 5 m of the channel was removed as part of the construction for the device. Following preliminary site clearing and grubbing, the contractor informed Caltrans that the v-ditch downstream of the pilot site was blocked with debris, which caused a backwater condition at the construction site during runoff events. This prevented the contractor from proceeding with construction until the v-ditch was cleaned. Caltrans maintenance forces subsequently cleaned the v-ditch and the contractor was able to resume construction. No schedule delays resulted from this action.
Site access at the I-210 / Filmore Street CDS® unit was from an existing gate at the end of the cul-de-sac on Filmore Street. During an initial progress meeting, the contractor informed Caltrans that there was not enough room between the gate and the toe-of-slope for vehicles to access the site. Caltrans concluded that although there was enough room when the freeway was originally constructed, the toe-of-slope had migrated closer to the gate over time. The contractor was instructed to remove the gate to facilitate site access. Near the end of construction, a Contract Change Order was issued for the installation of a new 3-m wide chain link gate.
13.4 Maintenance
Routine inspections of the CDS® units were conducted on a monthly basis and weekly during extended periods of wet weather, in accordance with the MID. Major maintenance items for the CDS® units included removal of trash and debris from the site area, clearing of the weir box of sediment and debris, and cleaning out gross pollutants (litter and vegetation) from the unit sump. Some unscheduled maintenance also had to be performed at each site. In July 2000 the manufacturer placed concrete in each unit’s weir box so the invert elevation matched the pipe inlet/outlet inverts and CDS® unit invert. The manufacturer made this modification to improve the system hydraulics and eliminate standing water at the weir.
The maintenance threshold for gross pollutant removal in the sump was set at 85 percent full. During the 2000-2001 wet season, this threshold was reached in January and March 2001 at the Orcas site, and in January 2001 at the Filmore site. Neither site had been cleaned since units were placed in service in October 2000. Both units were also cleaned in May 2001, in accordance with the MID.
During the 2001-2002 wet season floatables were cleaned out of the Orcas site on November 19 and January 9. Settlables and floatables were both removed on November 28 and January 30. No cleanouts were required during the wet season at the Filmore site. At the end of the wet season both Orcas and Filmore were cleaned. Figure 13-4 shows the accumulation with respect to time of floatable and settable material in the sump at each CDS® site.
BMP Retrofit Pilot Program Final Report
January 2004
13-5
Figure 13-5 shows the amount of time spent on each identified maintenance activity. A measuring stick was inserted into the sump to determine the depth of trash and debris to assess the need for maintenance. A measuring tape was inserted into the top portion of the CDS® unit to measure the floating trash and debris.
13.5 Performance
13.5.1 Chemical Monitoring
There was some concern among the participants in the study that the protocol for estimating removal efficiencies for the other pilot BMPs would understate the performance of the CDS® units. This concern arose over potential problems of collecting a representative influent sample that included the full range of particle sizes present in the runoff. Consequently, an additional mass balance procedure was used to confirm the efficiencies determined from data collected by the automatic samplers. The manufacturer commented critically on the protocol for estimating removal efficiencies used in this study. A copy of this correspondence is included in Appendix F.
BMP constituent removal performance presented in Table 13-3 was calculated using the standard analysis procedure for the Pilot Program based upon EMCs measured at the influent and effluent points of each BMP. Since influent and effluent volumes are equal, the constituent load reduction is the same as the concentration reduction (e.g., no loss due to infiltration). The average concentrations of the influent and effluent were not significantly different for any of the conventional constituents monitored.
The mass balance approach was initiated in the second year of monitoring and consisted of quantifying the amount of sediment retained in each device as well as the amount discharged. Knowing the amount of sediment captured in the unit and the amount discharged allowed computation of the influent load and the load removal efficiency. The CDS® device targets larger sediment size fractions (greater than about 1 mm) of suspended solids. There was concern that the automatic samplers and TSS laboratory analysis procedure biased the results towards smaller size fractions. Automatic samples collected of the CDS® effluent may be more representative since the larger grain sized material would have been captured by the device and the smaller material would be captured by the sampler. Consequently, the efficiency could be calculated as:
Removal Efficiency = (Load Captured)/(Load Discharged + Load Captured)

BMP Retrofit Pilot Program Final Report
January 2004
13-6
Figu
re 1
3-4
Dep
th o
f Set
tlab
les
and
Flo
atab
le G
ross
Pol
luta
nts
in C
DS®
Uni
ts

BMP Retrofit Pilot Program Final Report
January 2004
13-7
Figure 13-5 Field Maintenance Activities (Average Annual) at CDS® Units (2000-2002)
During the second year of monitoring 0.06 kg and 1.33 kg of TSS were removed from the separation chamber of the Orcas and Filmore sites, respectively, while 12.1 kg and 67.3 kg bypassed, based on the average concentration measured in the effluent and the total volume of runoff treated by the unit during the same time period. The resulting TSS removal efficiencies for each location using a mass balance approach were 0.75 percent for Orcas and 3.56 percent for Filmore. The mass balance approach for sediment removal and the comparison of influent and effluent TSS concentrations (Table 13-3) both show similar results – little or no TSS reduction.

BMP Retrofit Pilot Program Final Report
January 2004
13-8
Table 13-3 Constituent Removal Performance of CDS® (Scoping Study Method)
Mean EMC Constituent Influent
mg/La Effluent mg/La
Removal %
Significance P
TSS 45.3 45.4 0 0.190
NO3-N 1.46 1.24 15 0.581
TKN 2.67 2.67 0 0.962
Total N 4.13 3.91 5 -
Ortho-Phosphate 0.08 0.08 0 0.863
Phosphorus 0.29 0.25 15 0.351
Total Cu 24.6 22.6 8 0.612
Total Pb 9.5 8.5 11 0.610
Total Zn 244.2 203.9 17 0.637
Dissolved Cu 16.7 14.1 16 0.339
Dissolved Pb 4.7 4.4 6 0.889
Dissolved Zn 178.5 153.9 14 0.779
TPH-Oil c 2900 1900 34 0.331
TPH-Diesel c 250b 250b 0 -
TPH-Gasoline c 50b 50b 0 -
Fecal Coliform c 8600 MPN/100mL
19000 MPN/100mL
-121 0.365
a Concentration in µg/L for metals b Equals value of reporting limit c TPH and Coliform are collected by grab method and may not accurately reflect removal
Table 13-4 shows the expected concentration and the amount of uncertainty at the 90 percent confidence level for each constituent for both lined and unlined basins. The regression analysis was less effective at identifying an association between influent and effluent concentrations. This was primarily the result of highly variable effluent quality, with effluent concentrations higher than influent concentrations for a number of events.

BMP Retrofit Pilot Program Final Report
January 2004
13-9
Table 13-4 Predicted Effluent Concentrations –CDS®
Constituent Concentrationa Uncertainty, ±
TSS 0.66x + 12.4 ( ) 5.02
200,777.45
281
9.39
−+
x
NO3-N 0.72x + 0.11 ( ) 5.02
20347.1
281
7.1
−+
x
TKN 1.01x – 0.08 ( ) 5.02
53166.2
281
44.2
−+
x
Particulate P 0.26x + 0.09 ( ) 5.02
48.22.0
281
32.0
−+
x
Ortho-phosphate 0.79x + 0.01 ( ) 5.02
64.009.0
281
9.0
−+
x
Particulate Cu 0.92x + 1.29 ( ) 5.02
880,20.8
281
28.9
−+
x
Particulate Pb 0.34x + 2.32 ( ) 5.02
096,298.4
281
0.10
−+
x
Particulate Zn 0.57x + 12.0 ( ) 5.02
000,2166.65
281
4.76
−+
x
Dissolved Cu 0.76x + 1.61 ( ) 5.02
100,128.16
281
4.16
−+
x
Dissolved Pb 0.95x + 0.0 ( ) 5.02
890,194.4
281
18.2
−+
x
Dissolved Zn 0.91x –1.18 ( ) 5.02
200,649,23.186
281
8.133
−+
x
a Concentration in mg/L except for metals, which are in µg/L; x = influent concentration

BMP Retrofit Pilot Program Final Report
January 2004
13-10
13.5.2 Gross Pollutant Monitoring
Table 13-5 shows the gross pollutant removal efficiencies. Gross pollutants are defined by Caltrans Litter Study as solids greater than about 4 mm (Caltrans, August 2001). Gross pollutant removal efficiencies were calculated as the amount of material captured by the device divided by the total amount of material captured and bypassed. Removal efficiency was substantial at each site and was mainly affected by the amount of flow bypassing the devices. Overall, the Filmore site performed better than the Orcas site, with better constituent removal and less gross pollutant bypass. The Orcas site required more frequent cleanout due to the greater number of trees in the tributary watershed and the resulting leaf litter. Bypass may also have occurred more frequently at Orcas due to clogging of the smaller screen size.
The total wet and dry weight and volume of floatables, settlables, material contained in the weir box and bypass material were measured following each clean out. The material contained in the weir box consisted of small amounts of sediment. The litter and vegetation were separated and measured. The material was then left to dry on separate drying racks for a minimum period of 24 hours. Dry weights and volumes of the collected and bypassed material were analyzed for litter and vegetation. Approximately 93 percent of the gross pollutants retained was vegetated material with the remainder being litter. Figure 13-6 shows the percentage of the different types of material making up the litter component. The amount of litter bypass at Orcas is largely due to the January 2001 event, when debris filled the mosquito-proofing bags. This January 2001 event produced more than 100 mm of rain in a 42 hr period. However the measured peak flow rate was only 0.013 m3/s, less than half of the capacity of the unit.
Table 13-5 Performances of CDS® (Gross Pollutant Removal 2000-2002)
Site Gross Pollutant Captured
Gross Solids, kg
Bypassed Gross Solids,
kg
Total Gross Solids, kg
Removal Efficiency %
Orcas Dry Mass 252 45 298 85
Filmore Dry Mass 98 9 107 92

BMP Retrofit Pilot Program Final Report
January 2004
13-11
Figure 13-6 Characterization of the Litter Captured (Based on Count, Both Study Sites Over Entire Study Period)
The characteristics of the material, based on count, captured by the CDS® units are shown in Table 13-6. The majority of the debris captured by the CDS® unit at both sites was vegetation. Even though both sites are located on elevated sections of highway, there are numerous trees in the area and windblown vegetation was present in the watershed.
Table 13-6 Characteristics of Gross Pollutants Captured by the CDS® units (2000-2002)
Site Dry Mass Captured
Dry Mass (Vegetation)
Dry Mass (Litter)
Orcas 252 kg 241 kg 11 kg
Filmore 98 kg 89 kg 10 kg

BMP Retrofit Pilot Program Final Report
January 2004
13-12
Material collected in the final cleanout of the CDS® units at the end of the 2001-2002 monitoring season was analyzed using a third approach as well. The litter and debris collected within the unit was burned to remove the volatile organic portion of the material in an attempt to provide another estimate the suspended solids concentration. The results are shown in Table 13-7.
Table 13-7 Summary on Non-Volatile Inorganic Solids Captured
Site Settlables and Sump Sediment Dry Mass
Settlables and Sump Sediment Inorganic Mass
(Incinerated)
Orcas 9,076 g 4,266 g
Filmore 63,432 g 31,081 g
At the Orcas site the entire mass of the sump material was burned and approximately 4.3 kg of non-volatile solids resulted. This was the amount of non-volatile solids that accumulated within the basket since the previous cleanout (3 months prior) and within the unit’s sump since the previous cleanout (12 months prior). At the Filmore site, a representative sample was incine rated and approximately 31.1 kg of non-volatile solids remained. This was the amount of non-volatile solids that accumulated within the basket and within the sump since the previous cleanout (both 12 months prior).
Table 13-8 shows the calculations of removal efficiency based on the incinerated mass. The inorganic mass for the entire season was calculated (see 4th Year Annual Report in Appendix F). The mean event mean concentration was used, along with the volume of runoff treated by the unit during the wet season, to determine the mass of TSS that passed through the unit. Using the mass remaining in the unit and the mass passing through the unit the removal efficiency was calculated.
Removal Efficiency (%) = (Mass retained) *100
(Mass retained + Mass passing)

BMP Retrofit Pilot Program Final Report
January 2004
13-13
Table 13-8 Summary of Incineration Based Calculation of Removal Efficiency (2001-2002)
Site
Settlables and Sump Sediment Inorganic
Mass (entire season), kg
Volume of Water Passing through Unit, L
TSS Effluent EMC, mg/L
Effluent TSS Mass, kg
Removal Efficiency,
%
Orcas 6.366 309,528 41.21 12.8 33
Filmore 31.164 789,366 78.73 62.1 33
The material remaining after incineration included not only sediment associated with the gross solids, but ash remaining from the incineration of the captured trash. Therefore, the mass remaining after incineration is not equivalent to the suspended solids and suspended solids attached to the gross solids. In addition, there were likely solids attached to the debris and trash bypassed at each site (about 45 kg at Orcas), which were not quantified. Consequently, calculations based on these results are not viewed as representative of the performance of these devices.
13.5.3 Empirical Observations
Because the CDS® unit is designed to retain water in the sump, standing water was always present in each unit. During the early part of the storm monitoring season, mosquito breeding was observed in both CDS® units. To prevent mosquitoes from entering the CDS® units, the bypass litterbags were changed to a finer mesh and the lids of each CDS® unit were sealed with foam. Bolt holes and other openings were sealed with silicon. During one large storm event in January 2001, debris filled the mosquito-proofing bags, which caused each CDS® unit to overflow through the top of the weir box. The ends of the mosquito-proofing bags were subsequently cut out to prevent flow impedance, and litter bypass baskets were installed at the discharge ends of the H-flumes. Figure 13-7 shows a typical mosquito-proofing bag installation. Following these changes, mosquito breeding was observed within the CDS® units about 20 percent of the time (per inspection), which was much less frequently than before the modifications were made. Table 13-9 presents the number of incidents of observed mosquito breeding.
During each monitored event, the CDS® units generally operated according to design. However, there were more trees in and near the Orcas watershed; thus, more organic debris entered the Orcas unit than the Filmore unit, resulting in the need for more frequent maintenance.
It was noted that some sediment was retained in the corners of the weir box. Most sediment passed into the CDS® units and settled in the sump litter basket. Finer sediment passed through the CDS® units. In general, from visual observation, the water

BMP Retrofit Pilot Program Final Report
January 2004
13-14
quality appearance (clarity) of the effluent was improved. When oil and grease sheen was observed in the influent, it was generally observed to a lesser extent in the effluent.
Figure 13-7 CDS® Mosquito-Proofing Bag
Table 13-9 Incidences of Mosquito Breeding – CDS® (2000-01)
Number of Times
Site Breeding Observed
Abatement Performed
Inspections Performed following installation of
Mosquito bags
I-210 WB east of Orcas 15 15 75
I-210 WB east of Filmore 9 9 75

BMP Retrofit Pilot Program Final Report
January 2004
13-15
Bypass was observed during five storms at Filmore and three storms at Orcas. Occasionally, flows greater than the design flows would overflow the weir in the weir box and at times pop the lid off the weir box and flow out of the top. The internal riser was raised during the first season to reduce the amount of bypass occurring. Bypass also occurred due to debris such as foam plates blocking the entrance to the CDS® units. The weir opening to the CDS® unit is 204 mm x 305 mm. During several monitoring visits at each site, it was noticed that the weir box top was missing and water had evidently bypassed the unit during the storm. This was likely due to debris blocking the unit entrance at the diversion weir.
13.6 Cost
13.6.1 Construction
Actual construction costs for the CDS® units are shown in Table 13-10. Costs are shown with and without monitoring equipment and related appurtenances for each CDS® site. The table also presents the cost per cubic meter of water quality volume, using actual cost without monitoring.
Table 13-10 Actual Construction Costs for CDS® (2000 dollars)
Site Actual Cost, $ Actual Cost w/o Monitoring, $
Costa/WQV $/m3
I-210 WB east of Orcas 39,736 31,684 296
I-210 WB east of Filmore 45,024 35,681 145 a Actual cost w/o monitoring.
SOURCE: Caltrans Cost Summary Report CTSW-RT-01-003.
Adjusted construction costs for the CDS® units are presented in Table 13-11. Additions to the actual CDS® unit costs without monitoring were made for the following reasons:
• The low bid for construction of these two units was 40 percent lower than the engineer’s estimate. Due to problems with the low bidder, the construction management team felt the low bid was not representative of the true project cost. For this reason, the second low bid was used to estimate retrofit cost. The second low bid was 30 percent lower than the engineer’s estimate. Using the original bid numbers would decrease the Adjusted Construction Cost by 16 to 17 percent.
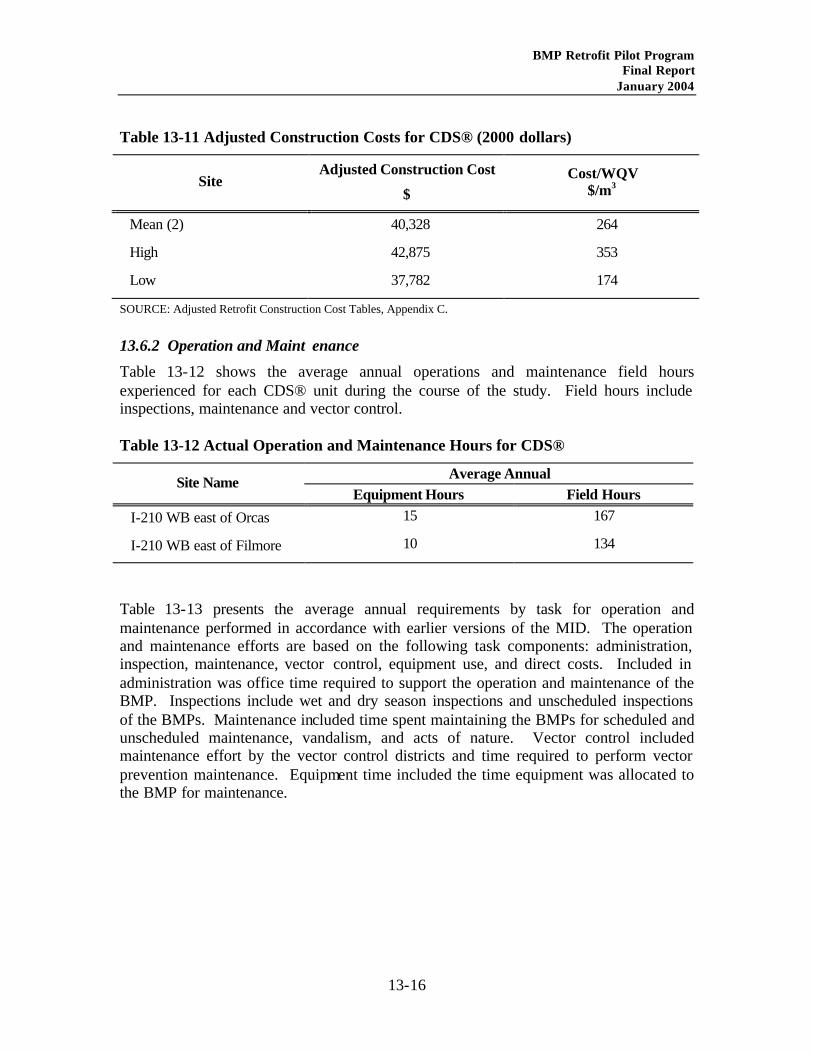
BMP Retrofit Pilot Program Final Report
January 2004
13-16
Table 13-11 Adjusted Construction Costs for CDS® (2000 dollars)
Site Adjusted Construction Cost
$ Cost/WQV
$/m3
Mean (2) 40,328 264
High 42,875 353
Low 37,782 174
SOURCE: Adjusted Retrofit Construction Cost Tables, Appendix C.
13.6.2 Operation and Maint enance
Table 13-12 shows the average annual operations and maintenance field hours experienced for each CDS® unit during the course of the study. Field hours include inspections, maintenance and vector control.
Table 13-12 Actual Operation and Maintenance Hours for CDS®
Average Annual Site Name Equipment Hours Field Hours
I-210 WB east of Orcas 15 167
I-210 WB east of Filmore 10 134
Table 13-13 presents the average annual requirements by task for operation and maintenance performed in accordance with earlier versions of the MID. The operation and maintenance efforts are based on the following task components: administration, inspection, maintenance, vector control, equipment use, and direct costs. Included in administration was office time required to support the operation and maintenance of the BMP. Inspections include wet and dry season inspections and unscheduled inspections of the BMPs. Maintenance included time spent maintaining the BMPs for scheduled and unscheduled maintenance, vandalism, and acts of nature. Vector control included maintenance effort by the vector control districts and time required to perform vector prevention maintenance. Equipment time included the time equipment was allocated to the BMP for maintenance.

BMP Retrofit Pilot Program Final Report
January 2004
13-17
Table 13-13 Actual Average Annual Maintenance Effort – CDS®
Activity Labor Hours Equipment & Material ($)
Inspection 11 -
Maintenance 89 63
Vector Control* 51 -
Administration 103 -
Direct Cost - 722
Total 254 785
* Includes hours spent by consultant vector control activities and hours by Vector Control District for inspections
The hours shown above do not correspond to the effort that would routinely be required to operate a CDS® unit since they do not reflect the modifications made to the maintenance protocol during the study. Table 13-14 presents the expected maintenance costs that would be incurred under the final version of the MID for a CDS® unit serving about 2 ha, constructed following the recommendations in Section 0. A detailed breakdown of the hours associated with each maintenance activity is included in Appendix D.
There is some trade off between maintenance cost and construction cost for a CDS® unit. A larger unit can be installed at a higher construction cost that will require less frequent maintenance due to the larger capacity of the sump.
Only one hour is shown for facility inspection, which is assumed to occur simultaneously with all other inspection requirements for that time period. Labor hours have been converted to cost assuming a burdened hourly rate of $44 (see Appendix D for documentation). Vector control hours were converted to a cost assuming an hourly rate of $62. Equipment generally consists of a single truck for the crew and their equipment.

BMP Retrofit Pilot Program Final Report
January 2004
13-18
Table 13-14 Expected Annual Maintenance Costs for Final Version of MID – CDS®
Activity Labor Hours Equipment and Materials, $ Cost, $
Inspections 1 - 44
Maintenance 40 1,037 2,797
Vector Control 12 - 744
Administration 3 - 132
Materials - - 0
Total 56 1,037 3,717
13.7 Criteria, Specifications and Guidelines
The CDS® units performed effectively for removal of litter and debris, but were not as effective for removing conventional stormwater constituents. The permanent pool of water maintained in the device was a breeding area for mosquitoes, even though the frequency was much reduced by attaching nets to the outlet and sealing the unit. Consequently, other non-proprietary devices developed by Caltrans for litter control (such as gross solids removal devices, GSRDs, Caltrans 2001), which do not maintain a permanent pool may be preferred to this technology. Should a CDS® unit be selected for implementation, the following information may be useful.
13.7.1 Application
CDS® units are a below grade ‘end-of-pipe’ device that have a relatively small footprint. As a result, they are especially suited to locations where surface use must be maintained, and in locations where space to accommodate a BMP is limited. CDS® devices are also best designed to incorporate multiple drain inlets to centralize maintenance activities and provide access in a location that may be more conducive from a personnel safety or site operation perspective. The design of the unit is flow-based; the manufacturer makes several standard unit sizes that can accommodate a wide range of subcritical discharges.
13.7.2 Siting
The original siting criteria seem to have been generally successful at locating CDS® units where they could operate effectively. Based on the results of this study, the primary siting criteria for future installations should include the following:
• Provide adequate space for safe construction, operation and maintenance.

BMP Retrofit Pilot Program Final Report
January 2004
13-19
• Locate where flow is subcritical, or modifications can be made to the storm drain system to achieve subcritical flow conditions upstream of the unit.
13.7.3 Design
Based on the observations and measurements in this study, the following guidelines are recommended:
• Use a screen size opening of 4.7 mm.
• Provide a method to completely drain the facility between storms and during the dry season to address concerns about vector issues.
• When possible, use standardized designs to reduce costs.
• If mosquito breeding is a concern, include vector-restricting covers in the initial design.
• Provide adequate head to avoid adversely impacting the hydraulic grade line in the upstream storm drain system.
• Avoid the use of 90o bends in the inlet pipes. When a 90o bend is needed, ensure there is maintenance access for cleanout of debris.
• Size CDS® unit sump to capture gross solids and sediment for the entire wet season.
13.7.4 Construction
Listed below are guidelines that should improve the construction process:
• Avoid above-ground structures near the roadway that will require a setback or guardrail protection.
13.7.5 Operation and Maintenance
Based on the level of maintenance required in this study, recommendations for future maintenance activities include:
• Perform inspections and maintenance as recommended in MID (Version 17) in Appendix D, which includes inspections for structural integrity, vectors and sediment accumulation.
• Empty CDS® unit annually or when needed based on watershed characteristics.
• Remove trash and debris from weir box on a monthly basis.
• Inspect the screen for damage annually.
• Inspect the structural integrity of the device annually.

BMP Retrofit Pilot Program Final Report
January 2004
14-1
14 CAPITAL, OPERATION, AND MAINTENANCE COSTS
14.1 Introduction
An important objective of this study was to establish design, construction, and maintenance costs for retrofit of structural BMP devices in existing highway infrastructure. The actual cost data developed through this study have been analyzed for two purposes: 1) to develop a relative ranking with respect to water quality volume treated in order to assist in selecting the most cost-effective BMP technology for a given set of conditions, and 2) to provide general guidance for future BMP retrofit applications by itemizing the significant independent cost items unique to retrofit construction and operation. Project delivery costs such as siting, design and construction management are excluded from the costs reported in this study. Procedures for cost estimation are presented in Appendix C.
The pilot program construction cost figures represented throughout this report are directly applicable only to Caltrans and its operations. The unique environment and constraints associated with retrofitting BMPs into the California Highway system makes comparisons to other possible applications of the same BMPs difficult. Furthermore, even within the Caltrans system, information on construction costs will undoubtedly increase greatly as BMPs continue to be developed and implemented, such that the construction cost information in this report will be of limited value over time. It should be recognized that the Operations and Maintenance cost information was based partly upon estimates and projections of future needs.
It is also recognized that the construction costs compiled as a part of the program represent stand-alone retrofit projects that, with some exceptions, do not take advantage of potential economies that would occur if the devices were constructed as a part of a new highway, or a highway undergoing substantial reconstruction. During the process of reviewing the costs incurred for this study, additional cost data from other programs throughout the country were compiled. In the interest of providing a complete record, these additional cost data also are provided.
14.2 Pilot Program Construction Cost
The costs incurred for constructing the BMPs in this pilot study have been documented in detail in the Caltrans Construction Cost Data Summary Districts 7 and 11, report no. CTSW-RT-01-003, included in Appendix C of this report. The Construction Cost Data Summary Districts 7 and 11 provides cost breakdown by site, differentiates between those items constructed as a part of the original bid and those constructed by change order, and distributes the actual cost into ‘site-specific’ cost categories. The Construction Cost Data Summary Districts 7 and 11 report makes no estimate of costs that might be incurred in a future retrofit program, or what steps might be taken to reduce future implementation costs.

BMP Retrofit Pilot Program Final Report
January 2004
14-2
14.2.1 Actual Construction Cost
The construction costs for each of the BMPs have been normalized by the WQV rather than tributary area to account for the significant differences in design storm depth used for sizing the controls in different parts of the study area and the differences in the runoff coefficient at each site. For the flow-through devices, such as swales, the water quality volume was calculated as if a capture and treat type device (e.g., detention basin) were implemented at the site. Where more than one facility of the same type was constructed, the mean cost per unit WQV is reported.
The capital cost of the BMP types (in cost per unit WQV) is shown in Table 14-1. The costs shown are based on the actual cons truction cost incurred at each site, less the cost of monitoring and sampling equipment. No site-specific cost reductions or other allowances were made for the costs shown in Table 14-1.
Table 14-1 Actual Construction Cost of BMP Technologies (1999 dollars)
BMP Type Cost/m3 of the Design Storm $
Delaware Sand Filter 3,472
Multi-chambered Treatment Train 847
Wet Basin 2,670
Oil-Water Separator 2,540
Austin Sand Filter 2,009
Infiltration Trench 1,954
Storm-Filter™ 1,575
Swales 951
Unlined Extended Detention Basin 877
Strips 835
Infiltration Basins 639
Lined Extended Detention Basin 348
Continuous Deflective Separator 220
Drain Inlet Inserts 33
14.2.2 General Cost Guidance – BMP Retrofit Construction Cost
The site-specific costs shown in the Construction Cost Data Summary Districts 7 and 11 were further reviewed on a site-by-site basis by a technical work group comprised of

BMP Retrofit Pilot Program Final Report
January 2004
14-3
water quality specialists, construction managers and design engineers. The goal of the work group was to develop ‘generic’ retrofit costs that could reasonably be applied to other BMP retrofit projects. The costs were developed by reviewing the specific construction items for each site, eliminating those that were atypical and reducing the costs that were considered to be in excess of what would ‘routinely’ be encountered in a retrofit situation. Where there is not complete flexibility in selecting a BMP for a specific site, the cost reduction strategies (Section 14.2.4) are not sufficient in preventing cost from exceeding the costs used for planning (i.e. the ‘adjusted’ construction cost). Specific construction items that were reduced or eliminated from the actual costs are discussed in the individual device chapters. The results of the adjusted cost are summarized in Table 14-2.
14.2.3 Considerations for Future Projects
The technical work group that reviewed the construction cost data also identified fundamental approaches and strategies to reduce the capital cost of BMP retrofit. Many of the identified cost reduction strategies are consistent with normal evolutionary economies realized as technology and application methods mature over the course of more intensive implementation. Other strategies summarize some of the lessons learned associated with the implementation of the pilot program. The identified cost reduction strategies presented below may be useful for implementation on future projects.
In addition to the recommendations enumerated below for reducing costs of installing structural BMPs, it is generally assumed that source control is the most cost-effective stormwater best management practice. Many source control practices applicable to maintenance stations avoid contact between polluting agents and rainfall or runoff. These practices include covering materials and wastes; maintaining, fueling, and cleaning vehicles where rain and surface runoff will not contact contaminating residues; spill and leak prevention and clean-up; stabilizing bare ground; and general good housekeeping. Pollutants in runoff can be decreased on highways and in park-and-ride lots through designs that reduce impervious surfaces and retain natural soil and vegetation. However, source controls alone may not be sufficient to protect water bodies and their beneficial uses fully, and stormwater treatment BMPs may also be needed. The following cost reduction strategies can save substantially in implementing structural BMPs.

BMP Retrofit Pilot Program Final Report
January 2004
14-4
Table 14-2 Adjusted Construction Costs by BMP Type (1999 dollars)
BMP Type Adjusted Construction Cost $
Adjusted BMP Cost per WQV, $/m3
EDB (4) Avg 172,737 590 High 356,300 1,307
Low 91,035 303 IB (2) Avg 155,110 369 High 171,707 397 Low 138,512 340 WB 448,412 1,731 MFSTF 305,356 1,572 MFSD 230,145 1,912 MFSA (5) Avg 242,799 1,447 High 314,346 2,118 Low 203,484 746 MCTT (2) Avg 275,616 1,875 High 320,531 1,895 Low 230,701 1,856 BSW (6) Avg 57,818 752 High 100,488 2,005 Low 24,546 182 BSTRP (3) a Avg 63,037 748
High 67,099 1,237 Low 58,262 384 IT/STRP (2) Avg 146,154 733 High 156,975 775 Low 135,333 691 OWS 128,305 1,970 CDS® (2) Avg 40,328 264 High 42,875 353 Low 37,782 174 DII (6) b Avg 370 10 High 371 21 Low 369 2
a Unit costs for strips varied widely because the unit loading ratio, or tributary area/treatment area, varied significantly in the study, ranging from 4 at the I-605/SR-91 biofilter strip in District 7 to 43 at the Altadena Maintenance Station in District 7. b Unit cost for drain inlet inserts varied widely because the treatment area varied significantly.

BMP Retrofit Pilot Program Final Report
January 2004
14-5
14.2.4 Cost Reduction Strategies
1. Integration of stormwater BMP projects with larger construction projects is one of the keys to reducing costs over the long term. This principle applies to both retrofits and new construction. Long-range, integrated planning will almost always result in the most cost-effective project. Based on the experience of other state transportation agencies, including the Maryland State Highway Administration, incorporating stormwater management as an integral part of highway construction and operation and maintenance programs offers a variety of benefits, including:
a) More opportunities to locate BMPs in conjunction with other features (e.g., drainage systems, interchanges)
b) Enhanced experience of engineering staff with respect to stormwater BMP design, construction, operation, and maintenance
c) Reduction of mobilization, traffic-control, and equipment costs, as well as economies of scale during the construction process
d) Regulatory compliance cost savings through the use of single permits for the entire project
An example from the BMP Pilot Retrofit Program of this strategy was the construction of the biofiltration swale at Palomar Road in District 11. This site was built as a part of a larger project to construct an auxiliary lane in the same vicinity as the pilot swale. The Palomar Road site had the smallest unit construction cost ($246/m3) of any swale in the program, with unit costs for swales ranging as high as $2,192/m3 at I-605/SR-91 in District 7. It is reasonable to assume that some of the economy realized at the Palomar Road site was achieved by integrating the swale into a larger construction project.
2. There is an economy of scale in treating runoff from the largest possible drainage catchment. The unit costs for many of the BMPs evaluated in this study declined sharply as the water quality volume approached 400 m3. There are insufficient data beyond that point to determine whether there is additional advantage with greater size. The unit cost of Austin sand filters decreased at the rate of approximately $6.60 per m3 of additional water quality volume up to about 300 m3, the largest volume treated. Unit costs of extended-detention basins and biofiltration swales also declined substantially in a similar range, although not as uniformly as the unit costs of Austin sand filters. The units costs of an extended-detention basin and a biofilter each treating approximately 400 m3 were lower than the unit costs of the smallest devices of each type by factors of about four and ten, respectively.

BMP Retrofit Pilot Program Final Report
January 2004
14-6
Figure 14-1 provides a graph of unit cost vs. water quality volume for three of the pilot technologies to illustrate this point. The graphed data clearly indicate that as the water quality volume increases, the cost per unit volume for the device decreases. While it is likely that the curves shown in Figure 14-1 cannot be accurately extrapolated, it is apparent from the data that economies of scale can be realized.
3. The various BMP types do differ in the amount of runoff, and therefore catchment size, they can serve. For example, biofiltration swales cannot practically serve drainage areas as large as extended-detention basins can. Treating a larger area, and gaining the consequent economy of scale, should be considered in selection and siting of the BMP. Economies may also be gained by simultaneously constructing several BMPs of the same type to treat runoff from neighboring catchments or implementing even larger numbers of BMPs across wider geographic areas as part of a large-scale implementation program. It is probable that the significance of economy of scale is amplified for devices that serve relatively small watersheds, such as in a retrofit situation. This is because the fixed costs account for a relatively greater portion of the overall cost as compared to a site serving a relatively larger watershed.
0
500
1000
1500
2000
2500
0 200 400 600 800 1000 1200
WQV (m3)
$/m
3
Austin Sand Filter
Extended-Detention Basins
Biofiltration Swales
Figure 14-1 Unit Cost vs. Water Quality Volume for Selected Technologies
BMP Retrofit Pilot Program Final Report
January 2004
14-7
Two examples from the BMP Pilot program can serve to illustrate this point. The extended detention basin at I-15/SR-78 in District 7 served a tributary area of 5.42 ha and had an adjusted unit cost of $317/m3. The extended detention basin at I-605/SR-91 in District 7 served a watershed of 0.4 hectares and had an adjusted unit cost of $1,307/m3. Similarly, for biofilter swales, the site at Melrose Drive in District 11 served 0.96 ha (the largest tributary watershed for swales in the study) and had an adjusted unit cost of $204/m3, and the biofilter swale at I-605/SR-91 in District 7 served a tributary watershed of only 0.08 ha and had an adjusted unit cost of $2,005/ha.
4. The BMP sizing criterion (e.g., water quality volume) also plays a role in determining BMP costs. The criterion can be set based on hydrologic analysis for the climatological setting and is normally prescribed by regulation. Where space constraints or other factors make capture of the entire WQV infeasible, BMP implementation should still be pursued consistent with the efforts to maximize pollution reduction.
5. Engineering design and construction experience is a major cost-savings factor for state and local transportation and stormwater agencies throughout the United States. In common with most engineering programs, as the experience level of an agency increases, so does the cost effectiveness of highway stormwater projects. Contributing to higher costs, before personnel gain experience, are lack of familiarity with BMP technologies; inexperience with their selection, siting, and design; and modification of existing standard operating procedures.
6. Cross-jurisdictional partnerships within watersheds where highways are located have the potential for creating significant cost savings and water quality improvements. They must, however, be implemented in a way that ensures receiving water protection. Cost sharing and cooperation between Caltrans and other agencies in constructing joint stormwater treatment facilities should result in greater cost effectiveness for several reasons:
a) Economies of scale associated with construction of BMP facilities that serve large drainage areas, reducing the percentage influence of fixed costs;
b) Sharing design, construction, and operation and maintenance costs;
c) Avoidance of traffic-control costs where jurisdictional cooperation allows for constructing BMPs outside the highway right-of-way;
d) Other opportunities for locating BMPs, with possible avoidance of costs associated with construction of BMPs at sites constrained by space limitations within the right-of-way;

BMP Retrofit Pilot Program Final Report
January 2004
14-8
e) More hydraulic flexibility, with possible avoidance of costs associated with construction of BMPs at sites where extensive drainage system modifications are required; and
f) More flexibility in BMP design and opportunities for BMP “treatment trains,” where multiple BMPs are shared by several jurisdictions.
7. The development of standardized BMP designs has the potential to reduce the costs of materials needed for building BMPs. Standardizing BMP components (e.g., inlet and outlet structures, pre-cast vaults, etc.) have resulted in substantial cost savings in other parts of the country. Continued improvement in BMP selection guidance should lead to reduced costs and better BMP performance in the field. Particular highway-related facilities often have common water quality problems. If a standard BMP suite can be developed for specific types of highway facilities or locations (e.g., maintenance stations, clover leafs, center medians, highway shoulders, etc.), there can be cost savings realized throughout the planning, design, and implementation processes.
8. BMP design complexity should be minimized. In general, non-structural (vegetation-based) BMPs are less costly than structural devices. These types of BMPs (biofiltration swales and filter strips) also tend to have pollutant removal efficiencies comparable to more expensive structural BMP devices like extended-detention ponds or sand filters. Experience in other locations in the nation supports emphasizing vegetative controls where appropriate based on site conditions. The use of distributed biofiltration and bioretention was found to be a significant component of several state transportation agency stormwater programs. Biofiltration systems can also be integrated more easily into the highway landscape (medians, shoulders, intersections, etc.), thus requiring less right-of-way space. In addition, potentially expensive piping modifications are usually minimal with these types of treatment devices.
9. Specialized BMP devices, such as the oil-water separator, multi-chamber treatment train (MCTT), and Storm-FilterTM, may not be as cost-effective as other BMPs for highway installation due to the unique aspects of that environment. They do have potential application, however, in site-specific situations (such as a unique site or specific pollutant of concern), or when the benefits of installation outweigh the costs (such as for protection of a sensitive water body or endangered species). There are situations where proprietary devices are merited, but they are generally not the most cost-effective selection for widespread highway deployment and should be lower priority choices than the other BMPs covered in the pilot program. These technologies are constantly improving, so this observation applies strictly to the experience with the BMPs evaluated in this study.
10. While all BMP categories are amenable to cost reductions through the strategies recommended herein, the type offering the greatest potential for savings is

BMP Retrofit Pilot Program Final Report
January 2004
14-9
probably biofiltration (i.e., swales and filter strips). These BMP facilities can frequently do double duty as both drainage conveyances and runoff treatment devices. To the extent they can replace single-purpose conveyance conduits, they can ameliorate the costs normally expended for conveyance while fulfilling water quality objectives. Since structural conveyance elements (e.g., pipes) are more costly than vegetated channels and slopes, there is great potential to lower the costs exclusive to complying with stormwater management requirements through building vegetated drainage systems as part of reconstruction or new construction.
11. The following general guidelines also have potential to improve overall BMP cost effectiveness for retrofits and new construction. Generally, these guidelines are recommended when their use would not otherwise delay the implementation of structural BMPs.
a) Utilize the natural topography and terrain to maximize BMP performance and to achieve an aesthetic balance in design and siting.
b) Use natural landscape features and materials instead of concrete and other structural components.
c) Perform adequate site and geotechnical surveys to avoid unexpected costs and ensure post-construction BMP effectiveness, especially for infiltration BMPs and wet basins.
d) Select BMPs that do not require pumping, extensive shoring, or both to overcome constraints imposed by available space and head.
e) Minimize support features such as fencing, access roads, and gates to those necessary for safety and O&M purposes.
f) Minimize access road surfaces to what is necessary for O&M and use permeable materials for access roads where feasible. It should be noted that permeable materials for access roads may have a higher capital and O&M cost as compared to AC.
g) Include vector-control features in design and O&M plans.
h) Utilize prefabricated components as much as possible.
i) Purchase common BMP components in bulk to save on shipping and other related costs.
j) A site selection and assessment process should help to avoid hidden costs associated with obstructions like utility conflicts and buried objects.
k) Cost savings can be realized by integrating BMPs with future flood-control systems. Certain tasks would be performed if a BMP or flood control project

BMP Retrofit Pilot Program Final Report
January 2004
14-10
were constructed alone, such as mobilization, clearing and grubbing, and some excavation, piping, and concrete work. Both projects would benefit from the efficiency of sha ring these costs.
l) During long-range planning and integration, some BMP retrofits will be identified that are critical to improving water quality at ecologically significant or environmentally sensitive sites. Many potential cost savings would be lost if these projects were constructed as stand-alone retrofits. In these cases future highway repair and upgrade needs should be evaluated. If potential reconstruction projects are identified, they should be considered for early installation along with BMPs for greatest overall efficiency.
In summary, analysis of the program cost data indicates that the cost to retrofit structural BMPs is highly site-specific and does not readily lend itself to normalization for application to other studies or projects. The finding itself is a valuable conclusion, and it must be stressed that accurate BMP retrofit costs may best be determined with a complete unit cost estimate based on design plans for the site.
14.2.5 BMP Construction Costs from Other Projects
A review of BMP installation costs in other jurisdictions indicates the potential for lower unit prices ($/WQV) than were realized in this study, for BMPs constructed in a non- project-specific retrofit environment. Table 14-3 presents mean unit costs ($/m3 of water quality volume) calculated by the Third Party cost workgroup from data collected in a nationwide survey (see Appendix C). One set of columns lists the statistics from the Caltrans Pilot Study, a second set lists statistics of all nationwide data (excluding Caltrans), and a third set gives statistics only from BMP construction by the Maryland State Highway Administration (MD SHA). The MD SHA projects were singled out because they were BMP retrofits installed under a policy that limited cost in conjunction with broader highway reconstructions, therefore representing a potentially more efficient and less costly approach to BMP retrofit compared to other retrofit programs. The survey was not able to obtain specific line- item costs for these BMPs, because their costs were combined with those of other features of the overall projects. As a result, the authors of this study were unable to independently verify the accuracy of the data through review of the bid tabulations. The database is small, containing between one and three examples of each BMP type, except for wet ponds (five). Site-specific anomalies have a strong effect on a small data set, which can be seen where, contrary to expectation, the average cost of extended-detention basins exceeds the costs of wet ponds and wetlands.
Despite the limitations of the Maryland database, it is worth considering as an example of costs that could be realized with the application of cost-saving strategies like those listed in section 14.2.4. In addition to cost savings associated with integrating BMP retrofits with larger projects as was done in Maryland, a second likely reason for the costs being relatively low is the larger water quality volumes generally treated. This observation

BMP Retrofit Pilot Program Final Report
January 2004
14-11
supports the finding that it is important to treat the largest watershed possible to maximize economies of scale of the device.
14.3 Pilot Program Operation Cost
An important element in selecting the most appropriate BMP for a site is an understanding of the amount and type of maintenance required. BMPs that require less maintenance are preferred, other factors being equal. Table 14-4 summarizes the annual maintenance performed for each of the tested devices. This level of effort is related to the requirements of the earlier versions of the MID. Vector control district hours were high for all devices. Unless constructed of concrete, the largest maintenance item for each of the BMPs was vegetation management. Details on the type of activity at each site are contained in the relevant BMP chapter.
The hours shown in Table 14-4 do not correspond to the effort that would routinely be required to operate the piloted BMPs or reflect the design lessons learned during the course of the study. Table 14-5 summarizes the expected maintenance costs that would be incurred under the final version of the MID for a device serving about 2 ha, and constructed following the recommendations in each chapter. A detailed breakdown of the hours associated with each maintenance activity is included in Appendix D. Table 14-3 Comparison of Mean Unit Costs and Water Quality Volumes from
Nationwide Survey to Adjusted Mean Unit Costs and Water Quality Volumes in Caltrans Retrofit Pilot Program (1999 dollars)
Pilot Study Nationwide a MD SHAb,e
BMP Adjusted Cost $/m3
WQ Volume
m3
Cost $/m3
WQ Volume
m3
Cost $/m3
WQ Volume
m3
Austin sand filter 1,447 168 82 12,123 32.81c 1,140c
Delaware sand filter 1,912 120 200 1,836
Extended-detention basin 590 293 5.25 99,537 18.37 32,279
Infiltration trench 733 199 46 2,485 11.48 4,304
Biofiltration swale 752 748 8.86c 2,066c
Wet pond 1,731 259 7.55 44,833 9.19 20,391
Wetland 4.59 416,695 3.94 4,877
Storm-FilterTM 1,572 194 19d 2,350d a Means for all entries in the Third Party Cost nationwide survey where water quality volume is available. b Means for all Maryland State Highway Administration BMPs where water quality volume is available. c Based on a single installation. d Based on compost filters in nationwide survey e MD SHA had a retrofit policy that capped retrofit costs at $12,000 per acre

BMP Retrofit Pilot Program Final Report
January 2004
14-12
Table 14-4 BMP Actual Annual Maintenance Effort for Caltrans BMP Retrofit Pilot Program
BMP Equipment & Materials, $ Average Labor Hours
Sand Filters 872 157
Extended Detention Basin 958 188
Wet Basin 2,148 485
Infiltration Basin 3,126 238
Infiltration Trench 723 98
Biofiltration Swales 2,236 246
Biofiltration Strips 1,864 233
Storm-Filter™ 308 106
Multi-Chambered Treatment Train
2,812 299
Drain Inlet Inserts 563 121
Oil-water Separator 1,066 139
Continuous Deflective Separator
785 254
Some of the estimated hours in Table 14-5 are higher than those documented during the study because certain activities, such as sediment removal, were not performed during the relatively short study period. Design refinements may eliminate the need for activities such as vector control. Equipment generally consists of a single truck for the crew and their tools.
The relative ranking of BMP types with known life-cycle costs is shown in Table 14-6. The table includes the adjusted annualized capital cost and total annualized maintenance cost based on a 20 yr life-cycle and a 4 percent discount rate.

BMP Retrofit Pilot Program Final Report
January 2004
14-13
Table 14-5 Projected Future Annual Maintenance Requirements for Caltrans BMP Retrofit Pilot Program
BMP Equipment & Materials, $ Average Labor Hours
Sand Filters 1,013 43
Extended Detention Basin 668 56
Wet Basin 4,875 273
Infiltration Basin 562 56
Infiltration Trench 251 27
Biofiltration Swales 492 51
Biofiltration Strips 492 51
Storm-Filter™ 5,731 55
Multi-Chambered Treatment Train
4,222 62
Drain Inlet Inserts 136 22
Oil-Water Separator 180 26
Continuous Deflective Separator
1,037 56

BMP Retrofit Pilot Program Final Report
January 2004
14-14
Table 14-6 Projected Present Worth of BMP Capital, Maintenance and Total Cost Requirements for Caltrans BMP Retrofit Pilot Program
BMP Present Worth
Adjusted Capital Cost /m3 - $
Present Worth Maintenance Cost /m3 a - $
Present Worth Total Cost /m3
$
Wet Basin 1,731 452 2,183
MCTT 1,875 171 2,046
OWS 1,970 21 1,991
Delaware Sand Filter 1,912 78 1,990
Storm-Filter™ 1,572 204 1,776
Austin Sand Filter 1,447 78 1,525
Biofiltration Swale 752 74 826
Biofiltration Strip 748 74 822
Infiltration Trench 733 71 804
Extended Detention Basin 590 83 673
Infiltration Basin 369 81 450
Continuous Deflective Separator 264 99 363
Drain Inlet Inserts 10 29 39
a Total maintenance cost based on life cycle of 20 years and 4% discount rate.

BMP Retrofit Pilot Program Final Report
January 2004
15-1
15 PERFORMANCE SUMMARY The objective of this section is to summarize the performance data of the tested BMPs. The relative benefits of each of the subject technologies are based on a comparison of the expected discharge quality and load reduction from each of the devices. Regression analyses were performed on the data from each of the sites with paired influent and effluent composite samples. This allows the prediction of effluent quality from each of the BMPs based on any influent concentration of interest and selection of a BMP based on a comparison between the different technologies for specific constituents of interest.
15.1 Methodology and Results
The first step in this comparison process is to select the concentration in the untreated runoff for each constituent of interest for the watershed in which the BMP will be sited. This could be the average concentration expected at a site or potent ially the highest concentration that one might expect to observe. In this example, concentrations were estimated for the influent for selected constituents by calculating the arithmetic mean of all the event mean concentrations observed at the highway and maintenance station monitoring sites. The park-and-rides were excluded because of their relatively low concentrations of constituents of concern. These mean concentrations, shown in Table 15-1, are the calculated water quality design storm concentrations, which will be used to compare the performance of all the BMPs.
Table 15-1 Water Quality Design Storm Concentrations (Mean EMC for Pilot Study)
Constituent Concentrationa USEPA NURP
TSS 114 mg/L 100 mg/L NO3-N 0.97 mg/L 0.68 mg/L TKN 2.36 mg/L NA Ortho-phosphate 0.12 mg/L 0.12 mg/L Particulate Phosphorus 0.26 mg/L 0.21 mg/L Dissolved Copper 18 ug/L NA Dissolved Zinc 122 ug/L NA Dissolved Lead 8 ug/L NA Particulate Copper 76 ug/L 34 b ug/L Particulate Zinc 233 ug/L 160 b ug/L Particulate Lead 79 ug/L 144b ug/L a Park-and-ride sites not included. b Total metal concentration

BMP Retrofit Pilot Program Final Report
January 2004
15-2
In general, the pollutant removal effectiveness of the tested BMPs was consistent with previously reported values (see Table 15-1). Analysis of the water quality data collected during the study indicated that in many cases the traditional method of reporting performance as a percent reduction in the influent concentration did not correctly convey the relative performance of the BMPs. The problem was primarily the result of differences in influent runoff quality among the various sites and was especially noticeable for the MCTTs. These devices were installed at park-and-rides, where the untreated runoff had relatively low constituent concentrations. This resulted in low calculated removal efficiencies even though the quality of the effluent was equal to that achieved in the best of the other BMPs. Consequently, a methodology was developed using linear regression to predict the expected effluent quality for each of the BMPs as if they were subject to identical influent quality. The study found that a comparison on this basis resulted in a more valid assessment of the relative performance of the technologies as compared to the more traditional percent removal approach. Table 15-2 presents the expected effluent quality for total suspended solids (TSS), total phosphorus, and total zinc that would be achieved if each of the BMPs were subject to runoff with influent concentrations equal to that observed on average for highway and maintenance stations during the study. Effective concentrations of zero are shown for the infiltration devices, since there is no discharge to surface waters.
Table 15-3 provides performance removal for selected constituents by percent removal across the device. As can be seen from Table 15-3, comparison between some of the devices for TSS shows counterintuitive results. For example, the MCTT has a lower percent removal for TSS than the Austin Sand Filter, even though the filter beds for each device are nearly identical. This is the result of low influent concentration of TSS at the MCTT locations. Other devices, such as the wet basin, also do not lend themselves to performance assessment using percent removal since the effluent quality from the type of wet basin used in this study is a function of the stored dry weather flow influent in the pond, not the influent wet weather runoff. For these reasons, the values shown in Table 15-3 were not used for the performance comparisons in this study and are provided here only as an illustration of the technical difficulties of this type of analysis.

BMP Retrofit Pilot Program Final Report
January 2004
15-3
Table 15-2 Effluent Expected Concentrations for BMP types
Device TSS
(Influent 114 mg/L)
Total Phosphorus (Influent 0.38
mg/L)
Total Zn (Influent 355 ug/L)
Austin Sand Filter 7.8 0.16 50
Delaware Sand Filter 16.2 0.34 24
EDB unlined 36.1 0.24 139
EDB lined 57.1 0.31 132
Wet Basin 11.8 0.54 37
Infiltration Basin 0 0 0
Infiltration Trench 0 0 0
Biofiltration Swale 58.9 0.62 96
Biofiltration Strip 27.6 0.86 79
Storm-Filter™ 78.4 0.30 333
MCTT 9.8 0.24 33
CDS® 68.6 0.28 197

BMP Retrofit Pilot Program Final Report
January 2004
15-4
Table 15-3 Representative Pollutant Removal Efficiencies (Percent) for Pilot Study BMPs
BMP Type TSS TN TP TZn TCu TPb
Infiltration Basin N/A N/A N/A N/A N/A N/A
Infiltration Trench
N/A N/A N/A N/A N/A N/A
Extended Detention Basin (Lined)
40 14 15 54 27 30
Extended Detention Basin (Unlined)
72 14 39 73 58 72
Wet Basin 94 51 5 91 89 98
Austin Sand Filter 90 32 39 80 50 87
Delaware Sand Filter
81 9 44 92 66 85
Multi-Chambered Treatment Train (MCTT)
75 0 18 75 35 74
Storm-Filter™ 40 13 17 51 53 52
Biofiltration Strip 69 10 N/A 72 65 65
Biofiltration Swale 49 30 N/A 77 63 68
Drain Inlet Insert N/A N/A N/A N/A N/A N/A
Oil-Water Separator
N/A N/A N/A N/A N/A N/A
The following graphs compare the discharge concentration and load reduction (including the effects of infiltration) for the technologies for treatment up to the design capacity (design storm). Infiltration basins are assumed to have 100 percent load reduction, and no constituent effluent concentration for the water quality design storm. Effectively, the

BMP Retrofit Pilot Program Final Report
January 2004
15-5
discharge concentration is always zero and the load reduction 100 percent of the design storm volume. The drain inlet inserts are included in these comparisons but the monitoring strategy did not include paired samples for the inserts; the average of the actual observed effluent quality and load reduction was used in the comparison analysis.
Figure 15-1(a) compares the expected effluent concentration for TSS for each of the BMPs. A detailed explanation of how this graph was developed can be used as an example of how the other figures were created. For the Delaware sand filter the average TSS concentration in the effluent is a constant 16.2 mg/L (from Table 2-11) with an uncertainty of 5.6 mg/L; consequently, the 90 percent confidence interval in Figure 15-1(a) ranges from 10.6 to 21.8 mg/L. Since the TSS effluent concentration for Delaware sand filters is independent of the influent concentration, these values are not affected by the selected influent concentration.
In contrast, the TSS effluent concentration for swales is dependent on influent concentration and is represented by the sum (from Table 7-5):
0.42x + 11.0
Substituting the selected influent concentration of 114 mg/L, gives a predicted effluent concentration of about 59 mg/L. The uncertainty in this estimate is given by (from Table 7-5):
( ) 5.02
000,1395.84
391
6.54
−+
x
Substituting the influent concentration of 114 mg/L into this relation, gives a calculated uncertainty of 9.8 mg/L. Consequently, the confidence interval ranges from about 49 to 69 mg/L in Figure 15-1(a). Expected concentrations and confidence intervals for the other BMPs are, likewise, obtained from the tabulated values and/or relations presented in the appropriate BMP chapters.
The load reductions presented in Figure 15-1(b) for TSS are calculated based on the concentration reduction displayed in Figure 15-1(a) and the amount of infiltration observed for each of the BMP types. For biofiltration strips and unlined extended detention basins, approximately 30 percent of the runoff infiltrated, while for biofiltration swales the reduction was about 50 percent. The following equation describes the load reduction:
( ) 10011inf
×
−−= I
CC
L effr
where:

BMP Retrofit Pilot Program Final Report
January 2004
15-6
Lr = Load reduction
I = Fraction of runoff which infiltrates
Concentration and load reductions for other constituents were calculated similarly.
Figure 15-1 demonstrates the comparatively low TSS concentrations produced by the sand filters (Delaware, Austin, and MCTT) and the wet basin. The small error bars for these devices reflect the consistent effluent created. The Storm-Filter™ and concrete-lined extended detention basin typically have higher concentrations of TSS in the effluent. The large error bars are a result of a highly variable effluent quality (the concrete lined EDB exported TSS on four occasions) and the relatively fewer storms for these devices that consisted of only a single site each. The graph of TSS load reduction shows that the overall difference among the devices is not large, all with load reduction of about 80 percent or more, when the Storm-Filter™, CDS®, DII and lined EDB are excluded.
Figure 15-2 compares the expected performance of the devices for nitrate removal. The wet basin is the only device in this study with an effluent concentration statistically less than the influent concentration of interest (0.97 mg/L) for nitrate (excluding infiltration devices). Media filters are consistent exporters of nitrate according to every published study, presumably the result of nitrification of ammonia in the filter. The quality of the effluent of the EDBs is not significantly different from the influent concentration (90 percent confidence level), while the swales and strips are predicted to have higher effluent than influent concentrations. The nitrate export observed in this study in the strips was during the first year of monitoring and may be related to fertilization of the grass when installed and from hydroseed maintenance. Export of nitrate occurred consistently from the swales and may be related to export of nutrients during the dormant season of the vegetation. Despite the higher concentrations in the effluent from the biofilters, there is a net load reduction of nitrate when infiltration is accounted for.
The relative performance of the various BMPs for reducing TKN in runoff is shown in Figure 15-3. Filter strips are predicted to have effluent concentrations that are higher than influent concentrations; however, a net load reduction should occur due to infiltration in this type of BMP. The concentration increase may be related to the fertilizer used to establish the salt grass at the beginning of the study.
Predicted effluent concentrations and load reduction for dissolved phosphorus are presented in Figure 15-4. Swales, strips, and the wet basin all exhibit much higher effluent than influent concentrations. For the biofilters, this may be related to export of phosphorus from the dormant vegetation. The effluent quality of the wet basin is related primarily to the quality of the wet season baseflow that is displaced from the permanent pool during storms. Consequently, these data should be used with care in estimating the performance of a wet basin relative to other BMPs if implemented at a site with higher or lower quality perennial flow.

BMP Retrofit Pilot Program Final Report
January 2004
15-7
Figure 15-5 demonstrates the highly variable performance among the BMPs for particulate phosphorus removal. As with dissolved phosphorus, strips are predicted to have higher effluent than influent concentrations. Highest load reduction was observed for Austin sand filters and unlined extended detention basins.
The relative performance of the various BMPs for particulate metals (total minus dissolved) is presented in Figures 15-6 through 15-8. In general, the Storm-Filter™ produced the highest effluent concentration, although the drain inlet inserts and the lined and unlined extended detention basin also did not perform well for these constituents. Most of the other technologies reduce the load of particulate metals by 80 percent or more.
Figures 15-9 through 15-11 compare the removal of dissolved metals for the subject BMPs. For these constituents, the load reductions associated with the swales and strips is among the best of all the technologies, often exceeding that associated with sand filters.
In each of the graphs (Figure 15-1 through Figure 15-11) the technologies are ranked by life-cycle cost from most to least expensive and graphed against constituent concentration and load reduction. The life-cycle costs include expected maintenance cost, rather than actual maintenance cost incurred during the study. One would therefore expect that those devices on the left side of the graph would have lower effluent concentrations and greater load reduction. One can easily see that this is not always the case, however. Error bars on the graphs indicate the reliability of the estimated effluent concentrations and load reductions. This uncertainty indicates the 90 percent confidence interval of the estimate of the mean effluent concentration.
Because of the influence of infiltration on load reduction estimates for the extended detention basins, biofiltration strips and biofiltration swales load reduction estimates are particularly site specific for these BMPs. The load reductions are less certain than concentrations reduction estimates due to the reliance on flow measurements (and inherent error) used to determine total volume. For the extended detention basins 30 percent infiltration was used, for the biofiltration strips 30 percent infiltration was used and for the biofiltration swales 47 percent infiltration was used. The load estimates for these devices will be site specific depending on the soil characteristics and infiltration rates. Caution should be used when using these load reduction estimates for other locations.

BMP Retrofit Pilot Program Final Report
January 2004
15-8
a)
0.0
50.0
100.0
150.0
200.0
Wet
Bas
in
MC
TT
OW
S
Del
awar
e F
ilter
Sto
rmF
ilter
Au
stin
Filt
er
Sw
ales
Str
ips
Infi
ltra
tio
n
Tren
ch
Lin
ed E
DB
Un
lined
E
DB
Infi
ltra
tio
n
Bas
in CD
S
Dra
in
Inle
t In
sert
s
TS
S (
mg
/L)
More Expensive Less Expensive
b)
-40%
-20%
0%
20%
40%
60%
80%
100%
Wet
Bas
in
MC
TT
OW
S
Del
awar
e F
ilter
Sto
rmF
ilter
Aus
tinF
ilter
Sw
ales
Str
ips
Infi
ltra
tio
n
Tre
nch
Lin
ed E
DB
Un
lined
E
DB
Infi
ltra
tio
n
Bas
in CD
S
Dra
in
Inle
t
Lo
ad R
edu
ctio
n
More Expensive Less Expensive
Figure 15-1 Predicted TSS Effluent Concentration (a) and Load Reduction (b)

BMP Retrofit Pilot Program Final Report
January 2004
15-9
a)
0.0
0.5
1.0
1.5
2.0
2.5
Wet
Bas
in
MC
TT
OW
S
Del
awar
e F
ilter
Sto
rmF
ilter
Au
stin
Filt
er
Sw
ales
Str
ips
Infi
ltra
tio
n
Tre
nch
Lin
ed E
DB
Un
lined
E
DB
Infi
ltra
tio
n
Bas
in CD
S
Dra
in
Inle
t In
sert
s
Nitr
ate
(mg/
L)
More Expensive Less Expensive
b)
-140%
-100%
-60%
-20%
20%
60%
100%
Wet
Bas
in
MC
TT
OW
S
Del
awar
e F
ilter
Sto
rmF
ilter
Au
stin
Filt
er
Sw
ales
Str
ips
Infi
ltra
tio
n
Tre
nch
Lin
ed E
DB
Un
lined
E
DB
Infi
ltra
tio
n
Bas
in CD
S
Dra
in
Inle
t In
sert
s
Lo
ad R
edu
ctio
n
More Expensive Less Expensive
Figure 15-2 Predicted Nitrate Effluent Concentration (a) and Load Reduction (b)

BMP Retrofit Pilot Program Final Report
January 2004
15-10
a)
0.0
0.5
1.0
1.5
2.0
2.5
3.0
3.5
Wet
Bas
in
MC
TT
OW
S
Del
awar
e F
ilter
Sto
rmF
ilter
Aus
tinF
ilter
Sw
ales
Str
ips
Infi
ltra
tio
n
Tren
ch
Lin
ed E
DB
Un
lined
E
DB
Infi
ltra
tio
n
Bas
in CD
S
Dra
in
Inle
t
TK
N (
mg
/L)
More Expensive Less Expensive
b)
-40%
-20%
0%
20%
40%
60%
80%
100%
Wet
Bas
in
MC
TT
OW
S
Del
awar
e F
ilter
Sto
rmF
ilter
Aus
tinF
ilter
Sw
ales
Str
ips
Infi
ltra
tio
n
Tre
nch
Lin
ed E
DB
Un
lined
E
DB
Infi
ltra
tio
n
Bas
in CD
S
Dra
in
Inle
t
Lo
ad R
edu
ctio
n
More Expensive Less Expensive
Figure 15-3 Predicted TKN Effluent Concentration (a) and Load Reduction (b)

BMP Retrofit Pilot Program Final Report
January 2004
15-11
a)
0.0
0.1
0.2
0.3
0.4
0.5
0.6
0.7
0.8
Wet
Bas
in
MC
TT
OW
S
Del
awar
e Fi
lter
Sto
rmFi
lter
Aus
tin F
ilter
Sw
ales
Str
ips
Infil
trat
ion
Tren
ch
Line
d E
DB
Unl
ined
ED
BIn
filtr
atio
n B
asin C
DS
Dra
in
Inle
t Ins
erts
Ort
hoph
osph
ate
(mg/
L)
More Expensive Less Expensive b)
-500%
-400%
-300%
-200%
-100%
0%
100%
Wet
Bas
in
MC
TT
OW
S
Del
awar
e F
ilter
Sto
rmF
ilter
Aus
tinF
ilter
Sw
ales
Str
ips
Infi
ltra
tio
n
Tre
nch
Lin
ed E
DB
Un
lined
E
DB
Infi
ltra
tio
n
Bas
in CD
S
Dra
in
Inle
t
Lo
ad R
edu
ctio
n
More Expensive Less Expensive
Figure 15-4 Predicted Dissolved P Effluent Concentration (a) and Load Reduction (b)

BMP Retrofit Pilot Program Final Report
January 2004
15-12
a)
0.0
0.1
0.2
0.3
0.4
0.5
0.6
Wet
Bas
in
MC
TT
OW
S
Del
awar
e F
ilter
Sto
rmF
ilter
Au
stin
Filt
er
Sw
ales
Str
ips
Infi
ltra
tio
n
Tre
nch
Lin
ed E
DB
Un
lined
E
DB
Infi
ltra
tio
n
Bas
in CD
S
Dra
in
Inle
t In
sert
sPar
ticu
late
Ph
osp
ho
rus
(mg
/L)
More Expensive Less Expensive
b)
-60%
-40%
-20%
0%
20%
40%
60%
80%
100%
Wet
Bas
in
MC
TT
OW
S
Del
awar
e F
ilter
Sto
rmF
ilter
Aus
tinF
ilter
Sw
ales
Str
ips
Infi
ltra
tio
n
Tren
ch
Lin
ed E
DB
Un
lined
E
DB
Infi
ltra
tio
n
Bas
in CD
S
Dra
in
Inle
t
Lo
ad R
edu
ctio
n
More Expensive Less Expensive
Figure 15-5 Predicted Particulate P Effluent Concentration (a) and Load
Reduction (b)

BMP Retrofit Pilot Program Final Report
January 2004
15-13
a)
0.0
50.0
100.0
150.0
200.0
250.0
300.0
Wet
Bas
in
MC
TT
OW
S
Del
awar
e F
ilter
Sto
rmF
ilter
Aus
tinF
ilter
Sw
ales
Str
ips
Infi
ltra
tio
n
Tre
nch
Lin
ed E
DB
Un
lined
E
DB
Infi
ltra
tio
n
Bas
in CD
S
Dra
in
Inle
t
Par
ticu
late
Zn
(u
g/L
)
More Expensive Less Expensive
b)
-40%
-20%
0%
20%
40%
60%
80%
100%
Wet
Bas
in
MC
TT
OW
S
Del
awar
e F
ilter
Sto
rmF
ilter
Aus
tinF
ilter
Sw
ales
Str
ips
Infi
ltra
tio
n
Tre
nch
Lin
ed E
DB
Un
lined
E
DB
Infi
ltra
tio
n
Bas
in CD
S
Dra
in
Inle
t
Lo
ad R
edu
ctio
n
More Expensive Less Expensive
Figure 15-6 Predicted Particulate Zn Effluent Concentration (a) and Load
Reduction (b)

BMP Retrofit Pilot Program Final Report
January 2004
15-14
a)
0.0
10.0
20.0
30.0
40.0
50.0
60.0
70.0
80.0
90.0
Wet
Bas
in
MC
TT
OW
S
Del
awar
e F
ilter
Sto
rmF
ilter
Aus
tinF
ilter
Sw
ales
Str
ips
Infi
ltra
tio
n
Tre
nch
Lin
ed E
DB
Un
lined
E
DB
Infi
ltra
tio
n
Bas
in CD
S
Dra
in
Inle
t
Par
ticul
ate
Cu
(ug/
L)
More Expensive Less Expensive
b)
-20%
0%
20%
40%
60%
80%
100%
Wet
Bas
in
MC
TT
OW
S
Del
awar
e F
ilter
Sto
rmF
ilter
Aus
tinF
ilter
Sw
ales
Str
ips
Infi
ltra
tio
n
Tren
ch
Lin
ed E
DB
Un
lined
E
DB
Infi
ltra
tio
n
Bas
in CD
S
Dra
in
Inle
t
Lo
ad R
edu
ctio
n
More Expensive Less Expensive
Figure 15-7 Predicted Particulate Cu Effluent Concentration (a) and Load
Reduction (b)

BMP Retrofit Pilot Program Final Report
January 2004
15-15
a)
0.0
10.0
20.0
30.0
40.0
50.0
60.0
70.0
Wet
Bas
in
MC
TT
OW
S
Del
awar
e F
ilter
Sto
rmF
ilter
Aus
tinF
ilter
Sw
ales
Str
ips
Infi
ltra
tio
n
Tren
ch
Lin
ed E
DB
Un
lined
E
DB
Infi
ltra
tio
n
Bas
in CD
S
Dra
in
Inle
t
Par
ticu
late
Pb
(u
g/L
)
More Expensive Less Expensive
b)
0%
20%
40%
60%
80%
100%
Wet
Bas
in
MC
TT
OW
S
Del
awar
e F
ilter
Sto
rmF
ilter
Aus
tinF
ilter
Sw
ales
Str
ips
Infi
ltra
tio
n
Tre
nch
Lin
ed E
DB
Un
lined
E
DB
Infi
ltra
tio
n
Bas
in CD
S
Dra
in
Inle
t
Lo
ad R
edu
ctio
n
More Expensive Less Expensive
Figure 15-8 Predicted Particulate Pb Effluent Concentration (a) and Load
Reduction (b)

BMP Retrofit Pilot Program Final Report
January 2004
15-16
a)
0.0
5.0
10.0
15.0
20.0
25.0
Wet
Bas
in
MC
TT
OW
S
Del
awar
e F
ilter
Sto
rmF
ilter
Aus
tinF
ilter
Sw
ales
Str
ips
Infi
ltra
tio
n
Tren
ch
Lin
ed E
DB
Un
lined
E
DB
Infi
ltra
tio
n
Bas
in CD
S
Dra
in
Inle
t
Dis
solv
ed C
u (
ug
/L)
More Expensive Less Expensive
b)
-40%
-20%
0%
20%
40%
60%
80%
100%
Wet
Bas
in
MC
TT
OW
S
Del
awar
e F
ilter
Sto
rmF
ilter
Aus
tinF
ilter
Sw
ales
Str
ips
Infi
ltra
tio
n
Tre
nch
Lin
ed E
DB
Un
lined
E
DB
Infi
ltra
tio
n
Bas
in CD
S
Dra
in
Inle
t
Lo
ad R
edu
ctio
n
More Expensive Less Expensive
Figure 15-9 Predicted Dissolved Cu Effluent Concentration (a) and Load Reduction (b)

BMP Retrofit Pilot Program Final Report
January 2004
15-17
a)
0.0
20.0
40.0
60.0
80.0
100.0
120.0
140.0
160.0
Wet
Bas
in
MC
TT
OW
S
Del
awar
e F
ilter
Sto
rmF
ilter
Au
stin
Filt
er
Sw
ales
Str
ips
Infi
ltra
tio
n
Tre
nch
Lin
ed E
DB
Un
lined
E
DB
Infi
ltra
tio
n
Bas
in CD
S
Dra
in
Inle
t
Dis
solv
ed Z
n (
ug
/L)
More Expensive Less Expensive
b)
-20%
0%
20%
40%
60%
80%
100%
Wet
Bas
in
MC
TT
OW
S
Del
awar
e F
ilter
Sto
rmF
ilter
Aus
tinF
ilter
Sw
ales
Str
ips
Infi
ltra
tio
n
Tren
ch
Lin
ed E
DB
Un
lined
E
DB
Infi
ltra
tio
n
Bas
in CD
S
Dra
in
Inle
t
Lo
ad R
edu
ctio
n
More Expensive Less Expensive
Figure 15-10 Predicted Dissolved Zn Effluent Concentration (a) and Load Reduction (b)

BMP Retrofit Pilot Program Final Report
January 2004
15-18
a)
0.0
1.0
2.0
3.0
4.0
5.0
6.0
7.0
8.0
9.0
Wet
Bas
in
MC
TT
OW
S
Del
awar
e F
ilter
Sto
rmF
ilter
Aus
tinF
ilter
Sw
ales
Str
ips
Infi
ltra
tio
n
Tren
ch
Lin
ed E
DB
Un
lined
E
DB
Infi
ltra
tio
n
Bas
in CD
S
Dra
in
Inle
t
Dis
solv
ed P
b (
ug
/L)
More Expensive Less Expensive
b)
-20%
0%
20%
40%
60%
80%
100%
Wet
Bas
in
MC
TT
OW
S
Del
awar
e F
ilter
Sto
rmF
ilter
Au
stin
Filt
er
Sw
ales
Str
ips
Infi
ltra
tio
n
Tren
ch
Lin
ed E
DB
Un
lined
E
DB
Infi
ltra
tio
n
Bas
in CD
S
Dra
in
Inle
t In
sert
s
Lo
ad R
edu
ctio
n
More Expensive Less Expensive
Figure 15-11 Predicted Dissolved Pb Effluent Concentration (a) and Load Reduction (b)

BMP Retrofit Pilot Program Final Report
January 2004
15-19
15.2 Implications of the Methodology
One of the primary products of this pilot program has been the development of this BMP selection methodology that allows a direct comparison of many BMP types based on life-cycle cost, removal efficiency for specific constituents of concern, and the concentration predicted for the untreated runoff at the proposed location. The graphs previously presented display the results based on the average runoff concentrations observed in highway runoff in southern California; however, the tabulated results allow one to make this comparison based on any runoff concentration of interest. This calculation of the expected concentration discharged from the BMPs evaluated allows a direct comparison with receiving water quality standards and a determination of the extent to which these standards can be met with conventional structural controls. Care should be taken when using this method to estimate the performance of BMPs installed in significantly different site conditions.
This methodology attempts to correct for biases introduced by the fact that many of the BMPs were evaluated at sites with very different runoff quality. For instance, the conventional analysis of removal efficiency indicates that the TSS reduction expected in an MCTT would be only 75 percent, while the very similar Austin sand filter had a calculated reduction of 90 percent. However, Figure 15-1(a) indicates that the predicted effluent TSS concentration of the two devices is not significantly different. It was only because the untreated runoff at the two MCTT sites had generally low concentrations (P&R sites) that the performance appeared to be worse. Consequently, the technique developed for performance comparison in this study may have widespread application for assessing the relative performance of BMPs nationwide.

BMP Retrofit Pilot Program Final Report
January 2004
16-1
16 CONCLUSIONS AND RECOMMENDATIONS The objectives of this section are to compare and summarize the study findings of the technical feasibility and applicability for Caltrans facilities of the tested BMPs. In addition, recommendations are made for future research. Technical feasibility was assessed through detailed records kept during the installation and operation of each retrofit device. The technical feasibility considers siting, construction, operation, performance, maintenance, safety, and public health issues as described in Section 1.11.
The retrofit pilot program required Caltrans to install and implement a range of BMPs in one of the most challenging settings in the country – freeways. Despite these challenges, and despite several difficulties along the way, the program proved a large success, and several successful BMPs are now operating throughout many portions of urban southern California.
All of the tested devices were successfully sited without compromising the safety of the traveling public or Caltrans personnel; consequently, no devices were deemed infeasible based on this criterion. All of the devices met the drainage design criteria (see section 1.10) as well, except the StreamGuard™, which repeatedly caused localized flooding problems at the sites where it was installed. Siting of many of the BMPs was a technical challenge. The reasons for the difficulties included restrictive siting requirements related to the need for specific soil and subsurface conditions (infiltration devices), required baseflow (wet basin), or space imitations within the highway right-of-way. At many of the sites a significant portion of the cost was associated with changes to the original storm drain system to direct more runoff to the test sites. These difficulties point to the need to include BMP retrofit early in the planning stages of reconstruction projects to take advantage of possible drainage system reconstruction. This would also facilitate coordination with the right-of-way acquisition process to accommodate the land requirements of some types of BMPs.
An unexpected design element was the importance of avo iding standing water in the BMPs. Standing water presents opportunities for mosquito vectors to establish themselves. Mosquito breeding was observed at all of the sites where standing water occurred. In addition to the technologies that incorporate a permanent pool (i.e., wet basin, Storm-Filter™, MCTT, and Delaware filter), standing water also occurred in stilling basins, around riprap used for energy dissipation, in flow spreaders and in some outlet structures of other types of BMPs. In any future installations, nonessential pools should be avoided to minimize vector concerns.
16.1 Media Filters
This study confirmed the high level of pollutant removal associated with filtration systems. The Austin and Delaware sand filters and the MCTT provided substantial water quality improvement and produced a very consistent, relatively high quality effluent. Although the greatest concentration reduction occurred for constituents associated with

BMP Retrofit Pilot Program Final Report
January 2004
16-2
particles, substantial reduction in dissolved metals concentrations were also observed when the influent concentrations were sufficiently high. This contradicts expectations that little removal of the dissolved phase would occur in this type of device.
Information generated in this study showed that maintenance requirements were comparable to other devices studied, with clogging of the filter (and reconditioning) only expected to occur every 3-5 years. The main question remaining concerning applicability of Austin sand filters is whether the incremental improvement in water quality over that observed in extended detention basins justifies the higher construction costs. This would be a site specific decision based on receiving water conditions and is beyond the scope of this study. It should also be noted that implementing design alternatives will result in capital cost reductions to the Austin sand filter designs implemented in this pilot program, but may increase O&M cost.
The media filters are considered technically feasible for treatment of Caltrans stormwater runoff depending on site specific conditions. The Austin and Delaware sand filters and the MCTT provided substantial water quality improvement, and are compatible with the small, highly impervious watershed characteristic of Caltrans facilities. As discussed earlier, maintenance and operation of the pumps at several of the sites was a recurring problem. Consequently, other technologies may be a better choice at sites with insufficient hydraulic head for operation of media filters by gravity flow.
The Delaware and MCTT designs both incorporate permanent pools in the sedimentation chamber, which can increase vector concerns and maintenance requirements. Alternative designs to remedy this problem would be warranted prior to deployment consideration. The Delaware filter could be applicable at certain sites where an underground vault system was desired; however, the vector issues associated with the permanent pool must be continually monitored. The MCTT was found to have a similar footprint and provide a water quality benefit comparable to the Austin sand filter; however, the permanent pool and associated vector issues of the MCTT suggest that the Austin filter would be preferred.
In general, the Storm-Filter™ did not perform on par with other media-filters tested, showing little attenuation of the peak runoff rate and producing a reduction in concentrations that was not statistically significant for most constituents. In addition, the standing water in the Storm-Filter™ has the potential to breed mosquitoes. Since Storm-Filter™ performance was less and the life-cycle cost was greater than the Austin filter; the Storm-Filter™ is not considered applicable for implementation based on the media evaluated in this study, even if the vector problems were eliminated.
Future research on construction methods and materials for sand filters is warranted to improve the cost/benefit ratio for these devices prior to consideration for deployment. In addition, evaluation of alternative media may also allow the targeting of specific constituents or improvement in the performance for constituents, such as nitrate, which are not effectively removed by a sand medium. Caltrans has initiated extensive

BMP Retrofit Pilot Program Final Report
January 2004
16-3
additional research examining design alternatives to improve performance and reduce costs for sand filters.
Where media filters are to be deployed, the following guidelines are recommended:
• Avoid siting a media filter where a pump would be required due to lack of head for gravity operation.
• Develop standardized design details for the inlets, outlets and filter bed.
• Use a locally available filter sand specification that generally meets Caltrans Standard Specifications for fine aggregate in sections 90-2.02 and 90-3, which is similar to ASTM C-33 requirements.
• Include maintenance access ramps to the sedimentation chamber and sand filter chamber where the chamber side slope will exceed 1:4 (V:H).
• Do not use a level spreader to distribute flow over the sand bed. Local energy dissipation is acceptable, in lieu of the spreader.
• Slope the floor of the sedimentation chamber to the outlet riser to promote positive drainage and for ease of maintenance.
• Include provisions to allow a net to be installed over the sand bed to keep birds out of the filter.
• Continue research to reduce the device capital cost and maintenance cost, and improve filter performance.
• Follow the guidelines recommended in the final version of the MID for operation and maintenance (see Appendix D).
16.2 Extended Detention Basins
This study confirms the flexibility and performance of this conventional stormwater treatment technology. Extended detention basins have an especially extensive history of implementation in other areas and are currently considered technically feasible at suitable sites. There are few constraints for siting, although larger tributary areas can substantially reduce the cost and make clogging of the outlet orifice less likely. The relatively small head loss (as compared to sand filters) associated with this technology is particularly useful in retrofit situations where the elevations of existing stormwater infrastructure are a design constraint. The unlined installations in southern California did not experience any problems associated with establishment of wetland vegetation, erosion, or excessive maintenance (as compared to the concrete- lined basin). Except where groundwater quality may be impacted, unlined basins are preferred on a water quality basis because of the substantial infiltration and associated pollutant load reductions that were observed at these sites.
The pollutant remova l observed in the extended detention basins was similar to that reported in previous studies and appeared to be independent of length/width ratio as low

BMP Retrofit Pilot Program Final Report
January 2004
16-4
as 3:1, which is a commonly used design parameter. Re-suspension of previously accumulated material seemed to be more of an issue in the concrete-lined basin, which exhibited less concentration reduction than those constructed of earth.
Extended detention basins are a thoroughly studied technology; however, Caltrans is currently researching design alternatives that reduce capital cost without sacrificing performance. These studies include refinements to inlet and outlet structures and investigating reduction of the water quality capture volume.
This study found little correlation between length-to-width ratio, which is a common design specification, and pollutant removal. Consequently, further work to define this relationship may be warranted. In addition, relaxing this requirement may allow implementation at sites where a large aspect ratio may be difficult to obtain.
Where extended detention basins are to be deployed, the following guidelines are recommended:
• Site in a watershed of at least 2 ha to minimize the potential for clogging of orifice(s) in the outlet riser.
• Additional research is warranted to determine the effect of the basin length to width ratio on constituent removal performance.
• Use earth basins in favor of concrete lined basins for best constituent removal performance.
• Tolerances may be close in retrofit situations with respect to basin inlet and outlet elevations. Ensure the contractor incorporates good quality control during construction.
• Check the drain time for a full basin in the field to ensure it coincides with the calculated design value. Modify the riser outlet orifice(s) as necessary.
• Follow the guidelines recommended in the final version of the MID for operation and maintenance (see Appendix D).
16.3 Wet Basins
A wet basin was successfully sited and operated for this study and pollutant removal was found to be among the best of the piloted BMPs. As described previously, the effluent quality from a wet basin with a large permanent pool volume is largely a function of the quality of the baseflow used to maintain that pool and of the transformation of the quality of that flow during its residence time in the basin.
The largest technical challenge in siting a wet basin will be finding sites with perennial flow. The siting process found that at the sites looked at many were from small, highly impervious watersheds with no dry weather flow. Footprint size was also a factor, restricting siting opportunities and increasing construction cost. With a permanent pool volume three times the WQV, the wet basin was substantially larger than other similar

BMP Retrofit Pilot Program Final Report
January 2004
16-5
technologies, such as EDBs. Larger size generally results in higher cost and land requirements above those of alternative technologies. Wet basin construction cost is among the highest of the technologies evaluated, and the annual maintenance requirements were much higher than the other devices due to vegetation management.
Two long-term operation and maintenance cost issues were not able to be determined as a part of the Pilot Study. The first issue is the possibility of harborage of endangered species in the basin. Measures were employed (such as the use of mylar in the wet basin vegetation) to preclude the harborage of endangered species during the study, but it is recognized that over a period of long-term operation, endangered species may be encountered. Further, consultation with the appropriate regulatory agency is necessary to determine the mitigation requirements for continuing maintenance at the facility if endangered species are present.
There are two additional issues related to design and operation of wet basins that warrant further research. Wetland vegetation can be sustained with interruption of baseflow for up to several months, meaning that sites receiving baseflow only during the wet season could be considered. The performance of this seasonal wet basin design alternative may differ substantially from that reported for the installation monitored in this study; consequently additional study of this design modification should be pursued. In addition, there are numerous published guidelines for sizing of the permanent pool and there could be additional work to further refine the relationship between pool size and pollutant removal for various constituents.
Where wet basins are to be deployed, the following guidelines are recommended:
• The effluent quality during storms is determined primarily by the quality of the permanent pool, which is largely a function of the baseflow.
• Additional research is needed to define the performance threshold for the minimum water quality volume to permanent pool ratio.
• Additional research is needed to determine long-term maintenance requirements and cost.
• Observe the drain time of the water quality volume to ensure that it is consistent with the design expectation. Modify the outlet riser to achieve the design drain time if needed.
• Follow the guidelines recommended in the final version of the MID for operation and maintenance (see Appendix D).
16.4 Infiltration Basins and Trenches
Infiltration basins were shown to be technically feasible at one of the piloted locations and can be an especially attractive option for BMP implementation, since they provide the highest level of surface water quality performance. In addition, they reduce the total amount of runoff, restoring some of the original hydrologic conditions of an undeveloped

BMP Retrofit Pilot Program Final Report
January 2004
16-6
watershed. Maintenance requirements were especially low for infiltration trenches and construction costs are similar to those of extended detention basins; however, periodic trench rehabilitation is an expected but unknown cost. In addition, there are three main constraints to widespread implementation of infiltration devices: locating sites with appropriate soils, potential threat to groundwater quality (especially from potentially toxic spills), and the risk of site failure due to clogging.
The original siting study did not ident ify sufficient suitable locations for the number of infiltration device installations specified in the District 7 Stipulation within the time frame provided. This pilot study is being followed by assessments in both District 7 and District 11 to gauge the extent of infiltration opportunities, in Los Angeles with field investigations in selected highway corridors and in San Diego using existing data, but more broadly based through the District. In addition, there is concern at the state and regional levels of the impact on groundwater quality from infiltrated stormwater runoff. The portion of this study that was implemented to assess the potential impact to groundwater quality from infiltrated stormwater runoff was largely unsuccessful; however, no adverse impacts to groundwater quality were observed. Longer term more comprehensive studies than were possible under this pilot program are warranted. Despite these uncertainties, the parties in this study worked cooperatively to develop interim guidelines for sit ing infiltration devices in response to requests by the State and Regional Water Quality Control Boards.
In summary, although infiltration is considered to be technically feasible depending on site specific conditions it tends to be a more challenging technology in that site assessment and long-term maintenance issues are critical elements that are subject to some uncertainty. Clearly, the experience in this study is that siting these devices under marginal soil and subsurface conditions entails a substantial risk of early failure. Analysis of this experience resulted in development of a detailed set of site assessment guidelines for locating infiltration devices in the future. It is important that these guidelines be implemented to insure that infiltration is used with adequate separation from groundwater and with soil providing a favorable infiltration rate. Even at appropriate sites, degradation of soil structure, fine sediment clogging, and other changes that may occur during construction or over the life of the facility could be difficult to ameliorate.
The primary research question left unresolved is the potential impact of the infiltrated runoff on groundwater quality. Further study of these potential impacts is certainly warranted. In addition, further study of the pilot installations is recommended to better establish the expected life of these devices and the long-term cost of operation and maintenance.
Where infiltration devices are to be deployed, the following guidelines are recommended:
• Groundwater separation of at least 3 m from the device invert to the seasonal high water table is preferred.

BMP Retrofit Pilot Program Final Report
January 2004
16-7
• Conduct a minimum of three in-drill-hole permeability tests on the site to measure the in-situ hydraulic conductivity.
• Use the minimum field-measured value from the permeability tests. The minimum acceptable value is 13 mm/hr.
• Multiply the measured conductivity value by a factor of safety of 0.5.
• Basin invert area should be determined by the equation
ktWQV
A =
where A = Basin invert area (m2)
WQV = water quality volume (m3)
k = 0.5 times the lowest field-measured hydraulic conductivity (m/hr)
t = drawdown time (hr)
• The use of vertical piping, either for distribution or infiltration enhancement should not be allowed to avoid device classification as a Class V injection well per 40 CFR146.5(e)(4).
• Follow the guidelines recommended in the final version of the MID for operation and maintenance (see Appendix D).
16.5 Biofiltration Swales and Strips
Vegetated swales and strips were found to be technically feasible at the piloted locations and are particularly applicable where sufficient space is available. They were among the least expensive devices evaluated in this study and were among the best performers for reducing sediment and heavy metals in runoff. It was generally not necessary to remove deposited sediment at the pilot installations during the course of this study; however, sediment removal and occasional regrading and revegetation must be considered a long-term operation and maintenance cost.
Although irrigation was used to establish the biofiltration swales and strips, natural moisture from rainfall was sufficient to maintain them once established. However, complete vegetation coverage, especially on the side slopes in swales, was difficult to maintain. Repeated hydroseeding of these areas had little effect other than to possibly increase the amount of nutrients leached from the sites. An important lesson of this study is that a mixture of drought-tolerant native grasses is preferred to the salt grass monoculture used at the pilot sites. In southern California, it is preferable to select species that grow best during the winter and spring (the wet season), and to schedule biofilter establishment accordingly. Few erosion problems were noted in the operation of the sites; however, damage by burrowing gophers was a problem at two sites.

BMP Retrofit Pilot Program Final Report
January 2004
16-8
Since the reduction of concentration and load of the constituents monitored was comparable in other respects to the results reported in other studies (Young et al., 1996), except for phosphorus, one could conclude that pollutant removal is not seriously compromised by lower vegetation density and occasional bare spots. While space limitations in highly urban areas may make siting these BMPs difficult, they are flexible relative to the alternatives in fitting into available space such as medians and shoulder areas. Consequently, these vegetated controls should certainly be considered where sufficient space and appropriate flow conditions are present. The swales are easily sited along highways and within portions of maintenance stations and do not require specialized maintenance. In addition, the test sites were similar in many regards to the vegetated shoulders and conveyance channels common along highways in many areas of the state. Consequently, one would expect these areas, which were not originally designed as treatment devices, to offer comparable water quality benefit as these engineered sites.
There are a number of research needs associated with vegetated controls. This is especially true for filter strips. There are few empirical data on the effect of slope and length on pollutant removal performance. In addition, there was no relationship between the ratio of the strip size to tributary area and pollutant removal. Consequently, additional information is needed relative to sizing of these devices. These questions are currently under study by Caltrans at eight sites throughout the state under a separate program. The pilot study implemented a monoculture of salt grass at all biofilter sites, so the effectiveness of other grass species for pollutant removal was not quantified. Finally, additional information is needed on the minimum vegetation density for effective operation and on the limitations on their deployment for other areas based on rainfall and climate considerations.
Where strips and swales are to be deployed, the following guidelines are recommended:
• A mixture of drought tolerant grasses is preferred. Species that grow best during the winter and spring (for southern California) will provide the best potential for good coverage during the storm season.
• Follow the guidelines presented in the final MID (see Appendix D) for operation and maintenance.
• Additional study is warranted to determine potential impacts to groundwater resources.
• Additional study is needed to determine the minimum dimensions and maximum slope (for both swales and strips) to maintain acceptable performance.
• Do not use concrete level spreaders to attempt to obtain a sheet flow condition for strips.

BMP Retrofit Pilot Program Final Report
January 2004
16-9
16.6 Continuous Deflective Separators
Two CDS® units were successfully sited, constructed and monitored during the study. The devices were developed in Australia with the primary objective of gross pollutant (trash and litter) removal from stormwater runoff. The devices were found to be technically feasible at the piloted locations and highly successful for removing gross pollutants, capturing an average of 88 percent, with bypass of this material occurring mainly when the flow capacity of the units was exceeded. Even though these two units were sited on elevated sections of freeways, 94 percent of the captured material by weight was vegetation. Consequently, the maintenance requirements may be excessive if these units are located in an area with a significant number of trees or other sources of vegetative material.
A secondary objective of the CDS® units is the capture of sediment and associated pollutants, particularly the larger size fractions. The average sediment concentration in the influent to the two systems was relatively low and no significant reduction was observed. Reductions in the concentrations of other constituents were also not significant.
These devices maintain a permanent pool in their sumps and mosquito breeding was observed repeatedly at the two sites. The frequency of breeding was reduced by sealing the lids of the units and installing mosquito netting over the outlet. Other non-proprietary devices developed by Caltrans for litter control, which do not maintain a permanent pool may be preferred to this technology to minimize vector concerns.
16.7 Drain Inlet Inserts
Two proprietary drain inlet inserts were evaluated. The data collected during this study indicate that the tested inserts were maintenance intensive and provided minimal pollutant removal. The absolute number of maintenance hours was not large, but timing is critical, immediately before and during storm events. Because of safety considerations, installation at maintenance stations might be considered more appropriate; however, timely maintenance is infeasible due to other demands on maintenance personnel during storm events. These devices did not operate passively and unattended.
In addition, the inserts tested were only marginally effective, with constituent removal generally less than 10 percent. These particular inserts would not be considered technically feasible at the piloted locations based on the observed performance and the fact that proper functioning required maintenance during storm events (i.e., they did not operate passively and unattended). There are many other types of proprietary drain inlet inserts on the market that were not evaluated and some new designs have become available since the study began. In addition, improvements are continually being made to the tested devices; consequently, the monitoring results may not reflect the performance of currently available models. Further, one of the inserts tested is no longer available from the manufacturer. It should be noted trash removal was not monitored as part of this study and certain types of drain inlet inserts may be effective for this purpose.

BMP Retrofit Pilot Program Final Report
January 2004
16-10
Where drain inlet inserts are to be deployed, the following guidelines are recommended:
• Considering the performance and maintenance requirements found in this study, DIIs may be more appropriate for temporary conditions (e.g., a construction project or a special operation), than for installation as a primary treatment BMP.
• Avoid installation of DIIs in areas with overhanging vegetation and other sources of material that could clog the filter.
• Avoid the use of perimeter type filter inserts where flow enters the inlet in concentrated stream.
• Be aware of poor quality control for apparent opening size in drain inlet insert fabrics.
• Follow the guidelines presented in the final MID (see Appendix D) for operation and maintenance.
16.8 Oil-Water Separator
An oil-water separator was successfully sited, constructed and monitored; however, this technology should not be considered the first choice for a stormwater BMP based on the water quality performance observed. Concentrations of free oil in stormwater runoff from the monitored site were too low for effective operation of this technology (minimum of about 50 mg/l). At these low levels, other conventional stormwater controls can provide better treatment of hydrocarbons in runoff. However, there may be appropriate in certain non-stormwater situations (e.g., where source controls cannot ensure low oil and grease concentrations).

BMP Retrofit Pilot Program Final Report
January 2004
R-1
REFERENCES
Barrett, Michael E., Walsh, Patrick M., Malina, Joseph F., Jr., Charbeneau, Randall J., 1998. “Performance of Vegetative Controls for Treating Highway Runoff,” ASCE Journal of Environmental Engineering, Vol. 124, No. 11, pp 1121-1128.
Brown and Caldwell, and Law Crandall, 1999. Operation Maintenance and Monitoring
Plan District 7: Volumes I & II – BMP Stormwater Monitoring Field Guidance Notebooks, prepared for the California Department of Transportation, Report No. CTSW-RT-99-052.
California Department of Transportation (Caltrans), 1996. Caltrans Storm Water Quality
Handbook, Planning and Design Staff Guide. California Department of Transportation (Caltrans), 2001. Gross Solids Removal Device
(GSRD) Pilot Study 2000-2001 Interim Report. August 2001. California Department of Transportation (Caltrans), Highway Design Manual. February
1995. City of Austin, 1988. Environmental Criteria Manual, Drainage Utility Department,
Austin, TX. Colwell, Shanti R., Horner, Richard R., and Booth, Derek B., 2000. Characterization of
Performance Predictors and Evaluation of Mowing Practices in Biofiltration Swales. Report to King County Land and Water Resources Division et al., by Center for Urban Water Resources Management, Department of Civil and Environmental Engineering, University of Washington, Seattle, WA.
Corsi, S.R., Greb, S.R., Bannerman, R.T., and Pitt, R.E., 1999. Evaluation of the Multi-
Chambered Treatment Train, a Retrofit Water Quality Management Practice. U.S. Geological Survey. Open-File Report 99-270. Middleton, WI. 24 pgs.
Gilbert, R.O., 1987. Statistical Methods for Environmental Pollution Monitoring, Van
Nostrand Reinhold, NY. Glick, Roger, Chang, George C., and Barrett, Michael E., 1998. “Monitoring and
Evaluation of Stormwater Quality Control Basins,” in Watershed Management: Moving from Theory to Implementation. Denver, CO, May 3-6, 1998, pp 369 - 376.
Kinnetic Laboratories Inc., 1999. Operation Maintenance and Monitoring Plan
District 11: Volumes I & II – BMP Storm Water Monitoring Field Guidance Notebooks, prepared for the California Department of Transportation, CTSW-RT-99-053.

BMP Retrofit Pilot Program Final Report
January 2004
R-2
Los Angeles County Department of Public Works, 1989. Hydrology Manual, prepared by the Hydraulic Division, Alhambra CA.
Minton, Gary R., 2002. Stormwater Treatment, Biological, Chemical, and Engineering
Principles. Resource Planning Associates, Seattle, WA. Pitt, R.E., Robertson, B., Barron, P., Ayyoubi, A., and Clark, S., 1999. Storm Water
Treatment at Critical Areas: The Multi-Chambered Treatment Train (MCTT). U.S. Environmental Protection Agency, Wet Weather Flow Management Program, National Risk Management Research Laboratory. EPA/600/R-99/017. Cincinnati, OH. 505 pgs.
RBF Consulting, 1998a. BMP Retrofit Pilot Program Scoping Study, District 11,
prepared for the California Department of Transportation, CTSW-RT-98-026. RBF Consulting, 1998b. BMP Retrofit Pilot Program Scoping Study, District 7, prepared
for the California Department of Transportation, Report CTSW-RT-98-027. RBF Consulting, 1999a. Operation Maintenance and Monitoring Plan District 7: Volume
I – Guidance for Preparing Site-specific Plans, prepared for the California Department of Transportation, CTSW-RT-99-002.
RBF Consulting, 1999b. Operation Maintenance and Monitoring Plan District 11:
Volume I – Guidance for Preparing Site-specific Plans, prepared for the California Department of Transportation, CTSW-RT-99-003.
RBF Consulting, 1999c. Basis of Design Report – Drainage Design, District 11
Procurement. Prepared for the California Department of Transportation, CTSW-RT-98-52-A1.
RBF Consulting, 1999d. Basis of Design Report – Drainage Design, District 11 PS&E,
Interstate 5/La Costa Avenue Constructed Wetland. Prepared for the California Department of Transportation, CTSW-RT-98-52-A2.
RBF Consulting, 1999e. Basis of Design Report – Drainage Design, District 11 PS&E.
Prepared for the California Department of Transportation, CTSW-RT-98-52. San Diego, County of, 1993, "Hydrology Manual", prepared by the Department of Public
Works, Flood Control Division, San Diego, CA. Schueler, T.R., 1987, Controlling Urban Runoff: A Practical Manual for Planning and
Designing Urban BMPs, Department of Environmental Programs, Metropolitan Washington Council of Governments, Washington, DC.

BMP Retrofit Pilot Program Final Report
January 2004
R-3
U.S. EPA, 1983. Results of the Nationwide Urban Runoff Program, Volume 1 – Final Report, Water Planning Division WH-554, Washington DC.
U.S. EPA, 1993. Guidance Specifying Management Measures for Sources of Nonpoint
Pollution in Coastal Waters, 840-B-92-002, Office of Water, Washington, DC. URS Greiner Woodward Clyde, 1999a. “Geotechnical Engineering Peer Review I-5/La
Costa Avenue Infiltration Basin Caltrans BMP Retrofit Program Carlsbad, CA. Prepared for the California Department of Transportation.
URS Greiner Woodward Clyde, 1999b. BMP Retrofit Pilot Program Biofilter Sod Peer
Review. Prepared for the California Department of Transportation, CTSW-RT-99-081.
Water Environment Federation and ASCE, 1998. “Urban Runoff Quality Management,”
WEF Manual of Practice, No. 23, ASCE Manual and Report on Engineering Practice No. 87.
Winer, R., 2000a. National Pollutant Removal Performance Database for Storm water
Treatment Practices: 2nd ed., Report to the USEPA by the Center for Watershed Protection.
Winer, R., 2000b, National Pollutant Removal Performance Database for Storm water
Treatment Practices 2nd ed., Prepared by the Center for Watershed Protection for the USEPA Office of Science and Technology.
Wonnacott, T.H., and Wonnacott, R.J., 1990. Introductory Statistics 5th ed., John Wiley
and Sons, NY. Young, G.K., et al., 1996. Evaluation and Management of Highway Runoff Water
Quality, Publication No. FHWA-PD-96-032, U.S. Department of Transportation, Federal Highway Administration, Office of Environment and Planning.

BMP Retrofit Pilot Program Final Report
January 2004
APPENDICES
The appendices to this final report can be found on the CDs attached to the inside back cover of this document. The CD-ROMs contain the following appendices: CD-ROM NO. 1:
APPENDIX A: SITING AND SCOPING APPENDIX B: DESIGN APPENDIX C: CONSTRUCTION COST APPENDIX D: OPERATION AND MAINTENANCE APPENDIX E: VECTOR MONITORING AND ABATEMENT APPENDIX F: MONITORING SUMMARY
CD-ROM NO. 2
APPENDIX G: AS-BUILT PLANS OF BMP PILOT SITES APPENDIX H: QUARTERLY AND BIWEEKLY REPORTS
The following pages list the appendices and the documents contained on the CD-ROMs. Included in the CD-ROM directory is a FinRptReadme.doc, which duplicates these pages and provides links to the individual documents.