final report biofertiliser management: best practice for … odour... · 2012-04-23 · final...
TRANSCRIPT

Final Report
Biofertiliser management: best
practice for agronomic benefit &
odour control
This report examines the potential links between digestate stability and digestate odour potential. It also examines the impacts of separation on digestate nutrient characteristics, and recommends spreading techniques that minimize odour potential while maximising beneficial use of the ammonium content of digestates („biofertilisers‟).
Project code: OAV036-210 Date: September 2011

WRAP‟s vision is a world without waste, where resources are used sustainably. We work with businesses and individuals to help them reap the benefits of reducing waste, develop sustainable products and use resources in an efficient way. Find out more at www.wrap.org.uk
Document reference: [e.g. WRAP, 2006, Report Name (WRAP Project TYR009-19. Report prepared by…..Banbury, WRAP]
Written by: Phil Wallace, Gwyn Harris (SKM Enviros), Jim Frederickson, Graham Howell (The Open University)
Edited by: David Tompkins, WRAP
Front cover photography: Shallow injection of digestate into grass (Picture courtesy of Bryan Lewens, AnDigestion)
WRAP and SKM Enviros believe the content of this report to be correct as at the date of writing. However, factors such as prices, levels of recycled content and regulatory
requirements are subject to change and users of the report should check with their suppliers to confirm the current situation. In addition, care should be taken in using
any of the cost information provided as it is based upon numerous project-specific assumptions (such as scale, location, tender context, etc.).
The report does not claim to be exhaustive, nor does it claim to cover all relevant products and specifications available on the market. While steps have been taken to
ensure accuracy, WRAP cannot accept responsibility or be held liable to any person for any loss or damage arising out of or in connection with this information being
inaccurate, incomplete or misleading. It is the responsibility of the potential user of a material or product to consult with the supplier or manufacturer and ascertain
whether a particular product will satisfy their specific requirements. The listing or featuring of a particular product or company does not constitute an endorsement by
WRAP and WRAP cannot guarantee the performance of individual products or materials. This material is copyrighted. It may be reproduced free of charge subject to the
material being accurate and not used in a misleading context. The source of the material must be identified and the copyright status acknowledged. This material must
not be used to endorse or used to suggest WRAP‟s endorsement of a commercial product or service. For more detail, please refer to WRAP‟s Terms & Conditions on its
web site: www.wrap.org.uk

Biofertiliser management: best practice for agronomic benefit & odour
control 1
Executive summary
The PAS110 specification includes a compulsory digestate stability test – developed to demonstrate that input
materials have genuinely been subjected to a digestion process and have not simply been passed through the
system. This Residual Biogas Potential (RBP) test is time consuming to perform, and feedback from industry has
questioned whether the current RBP (stability) limit is set at an appropriate level.
In addition, there have been documented complaints about odours associated with land-spreading of digestate.
This could be due to use of inappropriate spreading practise, or spreading of digestates that might be deemed
„unstable‟, but this was difficult to determine without a clear understanding of the links between stability and
odour. The impacts of separating digestate (into separate fibre and liquor fractions) on stability and nutrient
content were also unknown.
Possible links between odour potential and stability, as well as odour potential and nutrient partitioning associated
with separation of whole digestate into liquor and fibre fractions were investigated. The potential for a
Sequencing Batch Reactor (SBR) approach to increase stability, reduce odour potential and convert ammonium to
nitrate was also investigated. The findings are summarized below:
Anaerobic treatment of biodegradable wastes was shown to be capable of producing digestates with low
odour potentials. However, the relationship between digestate stability and odour potential was not clear since some anomalies were found, in which some stabilised digestates passed the RBP test, but still had
elevated odour potentials. Best practice (for example: Defra, 20101) suggests that digestates be band-spread
at the soil surface or injected into the soil. These measures will reduce ammonia losses and minimise potential odour emissions.
It was recommended that the current RBP threshold be maintained at the level of 0.25 L/g VS, which was
shown to be comparable with the range of RBP values found for cattle slurries, and which seemed to be best associated with digestates with low to medium odour potentials.
Separating the digestate into liquor and fibre fractions generally had little impact on the nutrient profiles of
the different fractions. However, since the liquor fraction comprised by far the majority of the total digestate mass, this represents the most significant reserve of nutrients that could be recovered for agronomic benefit.
Subjecting whole digestates to sequencing batch reactor (SBR) tests successfully converted the ammoniacal-
nitrogen to nitrate-nitrogen. Digestate stability was also greatly increased, and the BOD (Biological Oxygen Demand), COD (Chemical Oxygen Demand), total VFAs (Volatile Fatty Acids)2 and dissolved carbon lowered.
The odour potential and hydrogen sulphide were eliminated – demonstrating the potential of this technique to
reduce digestate handling issues.
1 http://www.defra.gov.uk/publications/files/rb209-fertiliser-manual-110412.pdf 2 BOD and COD are proxy measures for the stability of materials, while VFAs are naturally produced as part of biogas production – and their excessive presence may indicate inefficient digestion

Biofertiliser management: best practice for agronomic benefit & odour
control 2
Contents
1.0 Introduction ................................................................................................................................ 4 1.1 Biofertilisers – quality and certification .................................................................................. 4 1.2 Digestate separation ............................................................................................................ 4 1.3 Whole digestate .................................................................................................................. 5 1.4 Liquor ................................................................................................................................ 5 1.5 Solid fraction/fibre ............................................................................................................... 5 1.6 Digestate testing ................................................................................................................. 5 1.7 Project aims........................................................................................................................ 5
2.0 Methodology ............................................................................................................................... 7 2.1 Types of materials ............................................................................................................... 7 2.2 Separation .......................................................................................................................... 8 2.3 Chemical analyses ............................................................................................................... 9 2.4 Odour tests ........................................................................................................................ 9 2.5 Odour potential – apparatus and procedure ........................................................................... 9 2.6 Odour concentration measurements ...................................................................................... 9 2.7 Hedonic Tone Assessment.................................................................................................. 10 2.8 SBR tests .......................................................................................................................... 10
2.8.1 Background .......................................................................................................... 10 2.8.2 Objectives for SBR trials ........................................................................................ 11 2.8.3 The Treatment Units ............................................................................................. 11 2.8.4 Operation ............................................................................................................. 11 2.8.5 Digestates treated ................................................................................................. 12
3.0 Results and discussion ............................................................................................................. 12 3.1 Chemical characteristics of digestate ................................................................................... 12
3.1.1 Basics .................................................................................................................. 12 3.1.2 Nutrients and typical loading rates .......................................................................... 12 3.1.3 Impacts of separation on nutrients, dry matter and Volatile Solids in digestate ........... 13 3.1.4 Potentially Toxic Elements (PTEs) ........................................................................... 15
3.2 Stability ............................................................................................................................ 15 3.2.1 RBP stability values ............................................................................................... 15
3.3 Impacts of separation on stability and odour potential .......................................................... 17 3.3.1 Odour Potentials ................................................................................................... 17 3.3.2 Relationship between stability (RBP value) and Odour Potential ................................ 18 3.3.3 Characterisation of odour ...................................................................................... 20 3.3.4 Alternative metrics for determining digestate stability or degree of digestion .............. 21 3.3.5 Total volatile fatty acid (VFA) concentration ............................................................ 22 3.3.6 BOD and COD/BOD ratio ....................................................................................... 23 3.3.7 Dissolved carbon (DC) ........................................................................................... 24 3.3.8 Hedonic tone ........................................................................................................ 25
3.4 Treatment options/additives ............................................................................................... 27 3.4.1 SBR ..................................................................................................................... 27 3.4.2 Sewer discharge consents ...................................................................................... 29 3.4.3 Additives .............................................................................................................. 30 3.4.3.1 Addition of trace elements ..................................................................................... 30 3.4.3.2 Addition of various chemicals and micro-organisms to control odour .......................... 30 3.4.4 Previous research and support systems ................................................................... 31 3.4.5 Application ........................................................................................................... 31 3.4.5.1 Liquor and Whole Digestate application ................................................................... 32 3.4.5.2 Application – solid fraction/fibre ............................................................................. 33 3.4.6 Other factors for consideration regarding application ................................................ 33 3.4.6.1 Application at correct rate ...................................................................................... 33 3.4.6.2 Odour and other emissions .................................................................................... 33 3.4.6.3 Timing of Applications and Cropping ....................................................................... 34 3.4.7 Spreading equipment sources ................................................................................ 34

Biofertiliser management: best practice for agronomic benefit & odour control 3
4.0 Conclusions and recommendations .......................................................................................... 36 5.0 References ................................................................................................................................ 37 Appendix 1 Data tables ......................................................................................................................... 38 Appendix 2 Hedonic tone graphs .......................................................................................................... 48 Appendix 3 ............................................................................................................................................ 60

Biofertiliser management: best practice for agronomic benefit & odour control 4
1.0 Introduction
Anaerobic digestion (AD) is not a new technology in the UK, but has only recently been used here on any
commercial scale to process inputs such as food wastes, farm manures and slurries, and biomass crops.
Anaerobic digestion results in two main outputs: biogas (a source of renewable energy) and digestate (a source
of crop-available nutrients).
PAS110:2010 is the UK‟s specification for whole digestate, separated liquor and separated fibre derived from the
anaerobic digestion of source-segregated biodegradable materials. This, coupled with the Anaerobic Digestion
Quality Protocol (ADQP), defines the point at which the waste becomes a product and is no longer considered a
waste in Wales, Northern Ireland and England. A similar approach has been adopted in Scotland, but this differs
from the ADQP in some details (SEPA, 2010). The Biofertiliser Certification Scheme3 has adopted the name
„biofertiliser‟ for Quality Digestate that complies with PAS110, the ADQP (where appropriate) and (again, where
appropriate) the Additional Scheme Rules for Scotland. This scheme is overseen by Renewable Energy Assurance
Ltd (REAL – a subsidiary of the Renewable Energy Association), but sites are audited and certified by two
independent certification bodies.
1.1 Biofertilisers – quality and certification
The PAS110:20104 specification for digestate quality has two aims for AD operators: (1) to ensure that digested
materials (biofertilisers) are made using suitable inputs (feedstocks) and processed sufficiently to pass the set
stability threshold, and (2) to ensure that the process has been well managed and monitored to produce quality
biofertiliser that meets market needs and protects the environment when used in accordance with good
agricultural practice. PAS110 does not cover production or quality of biogas.
The ADQP5 sets out additional criteria for the production of biofertilisers from specific (listed) waste types and
imposes various other constraints (for example, biofertilisers must comply with PAS110 and may only be used in
identified markets if specific records of such are kept). Compliance with these criteria is considered sufficient to
ensure that the material is fully recovered (complies with European „End of Waste‟ criteria) and can be used
without the need for further waste management controls. In addition, the ADQP indicates how compliance may
be demonstrated and points to best practice for the use of the fully recovered product. The ADQP aims to provide
increased market confidence in the quality of products made from wastes and reduce the financial burden of
compliance with waste regulation, encouraging greater recovery and recycling. Neither PAS110 nor the ADQP
exempt sites processing wastes from Environmental Permitting or other regulatory controls such as the Animal
By-Products Regulations.
If an AD operation complies with both PAS110:2010 and the ADQP then the digestate produced is not legally
considered a waste in England, Wales or Northern Ireland, and the Environmental Permitting Regulations (Waste
Management Licensing Regulations in Northern Ireland) no longer apply to the spreading of the biofertiliser to
land. A similar approach has been adopted in Scotland, but this differs from the ADQP in some details SEPA
(2010).
1.2 Digestate separation
Digestate can be utilised as is from the digester (whole) or it can be separated into „liquor‟ and „fibre‟ fractions
prior to land application. It should be noted that certification under the Biofertiliser Certification Scheme relates
to specific digestate fractions, which must be used in the form as supplied – separation of whole quality digestate
on farm would invalidate the „product‟ status of that material. If digestate is delivered to the farm as separate
fractions, then each should be accompanied by the agronomic data required by PAS110 to maximise crop benefit
from the different nutrient fractions present in the different digestate fractions.
3 http://www.biofertiliser.org.uk/ 4 Specification for whole digestate, separated liquor and separated fibre derived from the anaerobic digestion of source-segregated biodegradable materials. Available from: http://www.biofertiliser.org.uk/pdf/PAS-110.pdf 5 Quality Protocol. Anaerobic Digestate. End of waste criteria for the production and use of quality outputs from the anaerobic digestion of source segregated biodegradable waste. Waste Protocols Project (Environment Agency and WRAP), September 2009. (Abbreviated title Anaerobic Digestate Quality Protocol (ADQP). Available from: http://www.environment-agency.gov.uk/static/documents/Business/AD_Quality_Protocol_GEHO0610BSVD-E-E.pdf

Biofertiliser management: best practice for agronomic benefit & odour control 5
1.3 Whole digestate
Whole digestate is unprocessed (in terms of physical properties) digestate delivered from the AD plant. The
physical and chemical properties of the whole digestate will vary according to feedstock input, AD process and
operation but typically the whole digestate will be between 6 – 12% dry matter (DM), and from some AD
processes („dry‟ processes) even higher. The whole digestate may also contain a fraction of a percentage of some
larger particles of plastics as well as materials such as small stones. When considering land applications of whole
digestate, the selection of spreading machinery should consider these physical attributes as the whole digestate
may be approaching the upper limits for effective distribution through conventional slurry application systems.
The whole digestate can be physically separated (e.g. via a belt press or centrifuge) to produce two fractions
called the liquor and the solid fraction (or fibre). These treatment processes are similar to the processes used for
the separation of livestock and other slurries into liquid and solid fractions.
1.4 Liquor
The coarse fibres will (to some extent) have been removed in this fraction. The liquor produced is generally more
easily applied through conventional band and injection spreading equipment. Liquor tends to contain up to 6%
DM, but this will be subject to the type of post-process separation completed.
1.5 Solid fraction/fibre
This fraction can be used effectively as a soil conditioner. The fibre may be subjected to aerobic composting prior
to application, which improves its stability, reduces its biological activity and lowers its ammonium nitrogen
content.
1.6 Digestate testing
Within PAS110 there are tests that have to be conducted on the products. These include:
nutrient content (total N, P, K and ammoniacal-N, sodium and chloride),
stability as the residual biogas potential (RBP) test,
volatile fatty acids (VFAs),
dry matter,
pH,
organic matter,
potentially toxic elements (PTEs) and
physical contaminants.
1.7 Project aims
The digestate stability test (Walker et al., 2010) determines the residual biogas potential of the sample under
test. The digestate has to pass with a result below the upper limit of 0.25 l / g Volatile Solids (VS). This limit
was based on a study of the RBP values of a limited number of samples of organic materials already commonly
applied to agricultural land (cattle slurry, pig slurry and anaerobically digested municipal wastewater biosolids).
This project was designed to test a greater range and number of materials to demonstrate that this upper limit
remains valid. Materials examined included samples of farm manures and slurries, biosolids and the digestates
that are now being produced from facilities treating source-segregated wastes.
Whilst some operators of commercial AD facilities may believe that the RBP is limit is too low, there are also those
who believe that the RBP limit is too high and that, at this limit, the digestates may be potentially sufficiently
odorous to routinely cause a nuisance when spread (as are some of the other (undigested) materials already
commonly spread on farmland). The available nitrogen in digestates is usually in the ammonium form. When
spread, this can be transformed through volatilisation into ammonia, which is one of the compounds that
commonly causes odour when at sufficiently high concentrations. Through secondary treatment, the ammonium
in digestates can be biologically converted to nitrate, reducing both its odour potential and opportunities for
ammonia volatilisation, potentially increasing the crop benefit of this valuable renewable fertiliser. Appropriate
spreading techniques might also be used to achieve similar ends.

Biofertiliser management: best practice for agronomic benefit & odour control 6
Anaerobic digestion is also a reasonably conservative process, with little (~10%) of the input mass lost during
digestion. Whilst the resulting whole digestate has considerable agronomic value, the low dry matter content can
make it uneconomic to transport the whole digestate sufficiently far to fully realise its agronomic value. There is
therefore considerable interest in understanding how digestate volumes can be decreased, and the impacts that
separate approaches have on the agronomic value of the separated fractions.
The aims of this project were:
to investigate relationships between digestate odour and digestate stability (as determined by the PAS110
Residual Biogas Potential test), and stability and odour management through the use of appropriate spreading techniques;
to find out if there are alternative processing systems or process additives that could reduce the odour
potential of digestates;
to assess alternatives to the current PAS110 RBP test;
to investigate the impact of physical separation on the nutrient properties of different digestate fractions;
to formulate best practice for the spreading of digestates on agricultural land to minimise odours, to maximise nutrient benefits and to minimise the potential for environmental pollution; and
to produce a document outlining guidelines for the best practice in digestate spreading, including information
on sources of spreading equipment.
Biofertiliser management: best practice for agronomic benefit & odour control 7
2.0 Methodology
This project was managed by SKM Enviros in collaboration with the Open University. Silsoe Odours Ltd undertook
the gas stripping and odour testing of the digestates.
2.1 Types of materials
Digestates were collected from nine AD facilities in Great Britain. Subsamples of two of these digestates were
processed through the research Sequencing Batch Reactor (SBR) units at SKM Enviros to produce a further two
post-treatment samples for „before‟ and „after‟ reactor testing. Five cow manure slurries, one cow/pig manure
slurry mix, and one digested sewage sludge were also collected for testing and analysis (Table 2-1). To maintain
the anonymity of those sites that were visited during this project, limited detail on input materials and typical AD
operating parameters (such as mean hydraulic retention times or the use of process additives) can be provided.
However, an indication of the types of digestate collected is given in Table 2-2.
Some digestates were derived from commercial and municipal food wastes, and the whole digestates were
approximately 2 to 6% dry matter contents. Some digestates were made from purpose-grown crops, such as
silage, mixed with farm slurry. Typical hydraulic retention times varied.
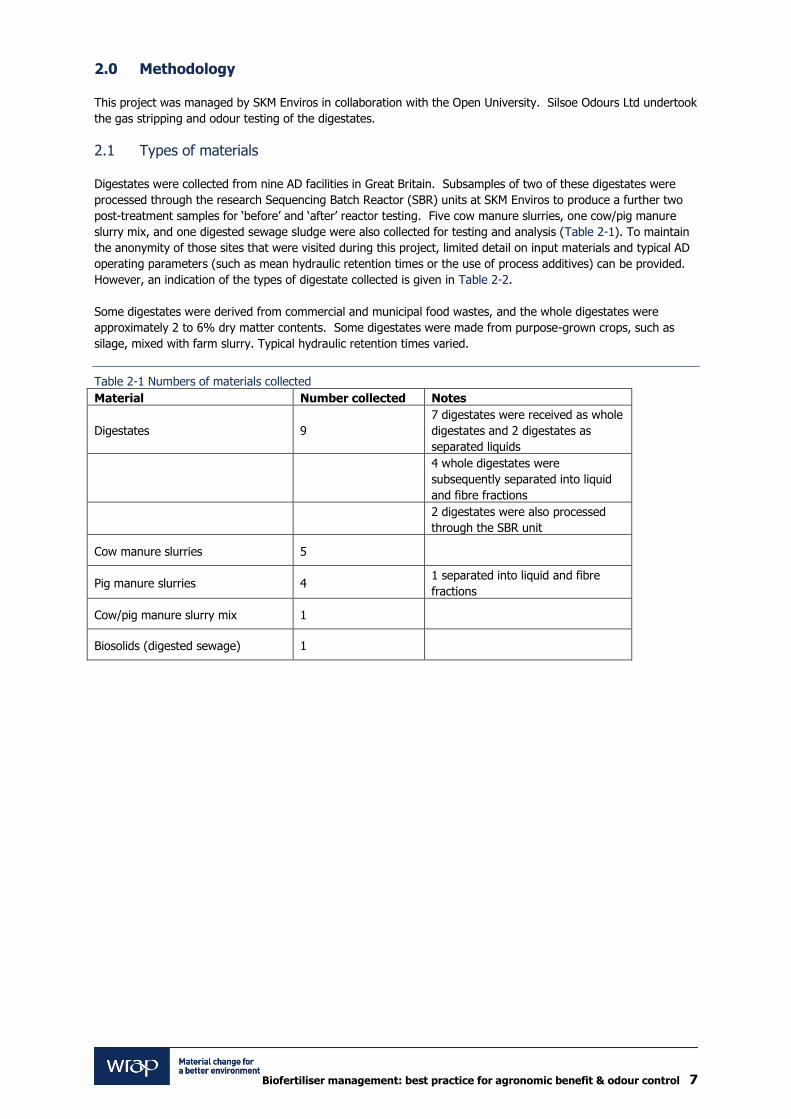
Table 2-1 Numbers of materials collected
Material Number collected Notes
Digestates 9
7 digestates were received as whole
digestates and 2 digestates as
separated liquids
4 whole digestates were
subsequently separated into liquid
and fibre fractions
2 digestates were also processed
through the SBR unit
Cow manure slurries 5
Pig manure slurries 4 1 separated into liquid and fibre
fractions
Cow/pig manure slurry mix 1
Biosolids (digested sewage) 1

Biofertiliser management: best practice for agronomic benefit & odour control 8
2.2 Separation
A range of digestates was collected. Separation of four of the whole digestates (into fibre and liquor fractions)
and one pig manure slurry was carried out at the Open University (for method see Appendix 3). The digestate
samples processed were samples W29/13, 14, 16 and 20. The whole digestate was coded „w‟ and the liquor and
fibre as „l‟ and „f‟, respectively. Where separated liquors were produced, these were less than 2% dry matter.
Table 2-2 List of materials collected
OU Code Description Report Code Input type during study
period
W29/08 Digestate (separated liquor) Digestate A cattle slurry
W29/13 Digestate (whole) Digestate B food waste
W29/14 Digestate (whole) Digestate C cattle slurry with some maize
silage
W29/02 Digestate (whole) Digestate D (used in SBR2) mainly food waste
W29/03 Digestate (whole) Digestate E mainly food waste
W29/01 Digestate (separated liquor) Digestate F (used in SBR1) food waste with some cattle slurry
W29/20 Digestate (whole) Digestate G food waste
W29/16 Digestate (whole) Digestate H food waste
W29/12 Digestate (whole) Digestate I mainly food waste
W29/21 Treated Digestate Digestate SBR 1
W29/22 Treated Digestate Digestate SBR 2
W29/05 Whole cow slurry Cow slurry 1
W29/17 Whole cow slurry Cow slurry 2
W29/06 Whole cow slurry Cow slurry 3
W29/11 Whole cow slurry Cow slurry 4
W29/04 Whole cow slurry Cow slurry 5
W29/10 Pig and cow mix slurry Cow/Pig slurry
W29/15 Whole pig slurry Pig slurry 1
W29/09 Whole pig slurry Pig slurry 2
W29/07 Whole pig slurry Pig slurry 3
W29/19 Whole pig slurry Pig slurry 4
W29/18 Digested sewage Digested sewage

Biofertiliser management: best practice for agronomic benefit & odour control 9
2.3 Chemical analyses
In addition to the odour and SBR tests described below, the following chemical and stability tests were performed
on the digestates: (for Open University methods, see Appendix 3).
Tests on whole samples:
Residual Biogas potential (RBP) in triplicate as per Walker et al. (2010)
pH (diluted to 5% dry solids where required)
Electrical Conductivity (EC) (diluted to 5% dry solids where required)
Total Nitrogen (N), Phosphorus (P), Potassium (K), Magnesium (Mg) and Sulphur (S).
Biological Oxygen Demand (BOD)
Chemical Oxygen Demand (COD)
Potentially Toxic Elements (PTEs): Zinc (Zn), Copper (Cu), Nickel (Ni), Mercury (Hg), Cadmium (Cd), Chromium (Cr) and Lead (Pb)
Tests on filtrates:
Volatile Fatty Acids (VFA)
Ammonium in solution plus other ions: Calcium, Magnesium, Potassium, Sodium, Chloride, Nitrate, Phosphate,
Sulphate.
Total dissolved carbon as purgeable dissolved carbon and non-purgeable organic carbon (NPOC).
Dry Matter (DM), Loss on Ignition at 550°C (LoI) and Volatile Solids (VS)
2.4 Odour tests
The olfactometry and hedonic tone tests were carried out by Silsoe Odours Ltd. The Silsoe Odour Laboratory is
accredited by UKAS (Testing Laboratory 0604) for odour determination by dynamic olfactometry. The odorous
gases were firstly stripped from the digestates using a standard technique (adapted from Hobson, 2002) , “Odour
Control in Wastewater Treatment – A Technical Reference Document” UKWIR Report Ref No.01/WW/13/3). The
odours were then tested by an odour panel with a sample retained for gas chromatography-mass spectrometry
(GCMS) characterisation by the Open University.
2.5 Odour potential – apparatus and procedure
The apparatus included:
A 20-litre plastic or stainless steel aeration cylinder;
A supply of odour free air;
A sampling arrangement, allowing both instantaneous and volumetric flow measurements.
The procedures for odour potential measurement are:
1 Measure the temperature of the liquid.
2 Fill the aeration cylinder with the 15litre liquid sample (digestate / slurry etc). If necessary, for sludges, dilute
the liquid sample to a final suspended solid concentration of <1%. Record the dilution factor.
3 Sparge air through the cylinder at a flow rate of 5 litres per minutes for 2 minutes to purge the headspace.
4 Collect 15 litres of the subsequent offgas using a Nalophan NA sample bag.
5 Measure the H2S concentration in the odour sample using a Jerome 631X monitor (0-50 ppm), or a Drager
tube (>50 ppm) depending on the range of concentrations detected.
6 Empty and wash the aeration cylinder.
7 The odour potential of the liquid sample is equal to the odour strength of the collected air multiplied by the
dilution factor. The equivalent H2S concentration was also adjusted to account for the pre-dilution of the sample.
2.6 Odour concentration measurements
Odour concentration measurements are made following the protocols described in BSEN13725:2003 'Air quality -
determination and odour concentration by dynamic dilution olfactometry‟. Olfactometry employs a panel of
human noses as sensors. A human nose can detect odour at concentrations well below the sensitivity levels of
chemical analytical methods. This measurement of odour concentration based on dilution of an odour sample to
the odour threshold is the most widespread method to quantify odours.
To establish the odor concentration, an olfactometer is used which employs a group of six panelists. A diluted
odorous mixture and an odour-free air are presented from sniffing ports to the six panelists. (The panelists must

Biofertiliser management: best practice for agronomic benefit & odour control 10
fulfill certain requirements regarding their sensitivity of odour perception. The panel calibration gas used is Butan-
1-ol., which at a concentration of 40ppb gives an odour concentration of 1 ouE/m³). In comparing the odour
emitted from each port, the panelists are asked to report if they can detect a difference between the ports. The
gas-diluting ratio is then decreased by a factor of 1.6 (i.e. the concentration is increased accordingly). The
panelists are asked to repeat their judgment. This continues until each of the panelists respond „certain‟ and
correct twice in a row. The numerical value of the odour concentration is equal to the dilution factor that is
necessary to reach the odour threshold. Its unit is the European Odour Unit, ouE. Therefore, the odour
concentration at the odour threshold is 1 ouE by definition.
2.7 Hedonic Tone Assessment
In addition to odour, hedonic tone was determined. Hedonic assessment is the process of scaling odours on a
scale ranging from extremely unpleasant via neutral up to extremely pleasant. It is important to note that
intensity and hedonic tone, whilst similar, refer to different things. That is, the strength of the odour (intensity)
and the pleasantness of an odour (hedonic tone). Moreover, it is important to note that perception of an odour
may change from pleasant to unpleasant with increasing concentration and intensity.
The German guidelines „VDI 3882 Olfactometry; Determination of Hedonic Odour Tone‟ was used as a basis for
the assessment of hedonic tone and adapted for use with the olfactometer when making odour concentration
measurements following the protocols described in BSEN13725:2003. When the panelists responded with a
„certain‟ response to the odour presented during determination of the odour concentration, they were asked to
rank the hedonic tone on a +4 to -4 scale. Extremely unpleasant is -4, zero is neither pleasant nor unpleasant
and +4 is extremely pleasant. Panelists were asked to rank the hedonic tone until all the panelists had responded
to at least four supra threshold concentrations.
The results are presented graphically in Appendix 2, which show the mean panel responses to the odour
concentration presented.
2.8 SBR tests
2.8.1 Background
Digestates may exhibit relatively high concentrations of ammoniacal nitrogen (NH4-N). Also, depending upon the
degree of anaerobic degradation that has taken place, they can contain high concentrations of volatile fatty acids
(VFAs), which impact upon chemical oxygen demand (COD) and odour. Likewise, in landfills, liquids (termed
leachates) with high NH4-N and VFAs also occur. These liquids are routinely treated prior to discharge to sewer or
watercourse, and most reported successful treatment of landfill leachates has been carried out using aerobic
biological processes within a Sequencing Batch Reactor (SBR) system.
SBR treatment systems not only readily reduce high concentrations of COD, but also high concentrations of
ammoniacal-nitrogen by a process known as nitrification. Nitrification is the aerobic biological conversion of
ammoniacal nitrogen, (NH4-N), to nitrate nitrogen, (NO3-N).
The concentration of NH4-N contained in digestates will depend on the feedstocks. High protein input materials
such as food wastes are likely to lead to higher concentrations of ammonium. If the ammoniacal nitrogen was to
be converted to nitrate nitrogen prior to farm spreading, then there would be a lower odour potential as the latter
has no smell, and the agronomic value would be enhanced because less nitrogen would be lost through
volatilization to the atmosphere during spreading.
Given the success of Sequencing Batch Reactor approaches in reducing odours and ammoniacal loadings in
leachates, it was considered worthwhile trialling this approach for digestate management. Therefore two of the
digestates collected for analysis at the Open University were also processed through the SBR treatability trial
units based at SKM Enviros‟ Shrewsbury site.

Biofertiliser management: best practice for agronomic benefit & odour control 11
2.8.2 Objectives for SBR trials
The objectives of the SBR trials were as follows:
(i) Digestate treatability: To confirm whether there are any fundamental features of digestate quality that
are likely to impair successful treatment by standard aerobic biological processes in a Sequencing Batch
Reactor (SBR) system.
(ii) To investigate nitrification of ammoniacal nitrogen to nitrate nitrogen;
(iii) To investigate reduction of odours;
(iv) To investigate reduction of VFAs;
(v) To determine the effect of treatment on RBP.
In order to test these objectives, two digestates were subject to SBR treatment, to enable „before‟ and „after‟
comparisons of ammoniacal nitrogen, odour, VFAs and RBP to be made.
2.8.3 The Treatment Units
The pilot-scale treatability units were constructed as shown in Figure 2-1, and consisted of a polyethylene
wheeled bin, modified to act as an aeration unit. A 20mm pipe was inserted to act as a small bellmouth overflow
weir, at a measured level within the tank. The discharge end of this pipe was connected via a solenoid valve to
an effluent storage container. Air was supplied from a compressor, enabling both oxygenation and mixing to
occur. A dosing pump was used to deliver digestate feed from the storage tank into the aeration unit.
Figure 2-1 General laboratory setup of the SBR trials
The treatment cycle followed an automatic 24 hour cycle comprising the following phases – feed and aeration,
settlement, discharge. After a quiet period, the 24 hour cycle repeats.
2.8.4 Operation
The trial units were seeded with sludge that was already acclimatised to concentrations of ammoniacal nitrogen
similar to those in the digestates under test, and the trials conducted between January and March 2011.
The 24 hour cycle of feed, aeration, settle, discharge was operated every day throughout the trial period. Prior to
discharge each day, samples were tested for ammoniacal nitrogen, nitrite, nitrate and pH. The volume of
digestate to be fed for the next cycle was determined, and pH adjusted as necessary to maintain it within the
optimum range for nitrification. The temperature of each unit was maintained within the range 240C – 270C
throughout the trial period.

Biofertiliser management: best practice for agronomic benefit & odour control 12
2.8.5 Digestates treated
Two digestates were treated as follows:
Digestate D – After 2.8 SBR container volumes had been passed through the trial unit, a 25 litre sample was delivered to the Open University for comparison testing.
Digestate F – After 4 SBR container volumes had been passed through the trial unit, a 25 litre sample was
again delivered to the Open University for comparison testing.
The „before‟ and „after‟ results are presented and discussed at Section 3.1.3
3.0 Results and discussion
Results are discussed in the sections below. Raw data tables are provided in the Appendix 1 and hedonic tone
graphs in Appendix 2.
3.1 Chemical characteristics of digestate
3.1.1 Basics
Table A 1 and Table A 2 in Appendix 1 show data on the basic properties of the materials. The pHs are generally
slightly alkaline (6.8 to 8.4). The electrical conductivity (EC) represents the salt concentration (made up by the
cations e.g. ammonium, potassium, calcium, magnesium and sodium, and the anions e.g. chloride, sulphate,
nitrate and phosphate, plus organic ions) and ranged from 7.9 to 23.6 mS/cm. The range of ECs of the
digestates was similar to that of the farm slurries.
The dry matter contents of the dairy and pig slurries were typical of these materials, ranging from 7 to 10 % and
1 to 5%, respectively. The digestates were from wet digestion processes and their dry matter contents ranged
from 1 to 5%. The digested sewage had a dry matter content of 5%.
The organic matter contents of the materials were measured by loss on ignition of the dry matter, and volatile
solids (VS) in the materials calculated. The dry matter itself comprised over 50% organic matter in all materials,
and up to around 82% in the cow slurries. The VS contents ranged from 0.6% to 9%, being higher in the cow
slurries. The higher the VS content, the greater the amount of organic matter that will be applied to the soil per
tonne of material.
3.1.2 Nutrients and typical loading rates
Table A 15 and Table A 17 (Appendix 1) provide the data for the principal nutrient elements in the materials
(total N, P, K, Mg, Ca and S). These data have been transformed into farm fertiliser equivalents (Table A 16 and
Table A 18).
Table 3-1 Nutrient contents of whole materials
units Whole digestate
(n=9)
Dairy slurries
(n=6)
Pig slurries
(n=4) Sewage
Dry matter (DM) % 3.1 9.2 2.4 5.5
pH 8.0 7.2 7.3 7.9
Total N kg/m3 (n=8) 4.3 4.0 3.1 4.3
Ammonium N kg/m3 1.55 0.75 1.19 0.77
Total P2O5 kg/m3 0.8 1.4 1.0 3.8
Total K2O kg/m3 2.4 4.3 2.5 0.3
Total MgO kg/m3 0.2 0.9 0.5 0.3
Total SO3 kg/m3 0.6 3.2 0.6 1.9
The nitrogen availability depends on the proportion of ammonium-N to total N, how and when it is spread, and if
it is retained in the soil or lost to the atmosphere as ammonia. Almost all of the potassium (90%) can be taken

Biofertiliser management: best practice for agronomic benefit & odour control 13
as available as the majority will be in solution. Phosphate availability is dependent on soil pH, but 50% can
usually be used as a release figure over the crop rotation (Fertiliser Manual (RB2096)).
The ions in solution were measured (see Appendix 1 Table A 11 and Table A 12). Due to the generally alkaline
pH of the materials, phosphate in solution was very low. During the AD process, nitrogen is made more available
as ammonium. As a proportion of the total N, a maximum of 70% ammonium was found in one digestate with
the others being between approximately 20 to 40%, generally greater than the farm slurries.
Taking the average data of the whole digestates as an example, the maximum amount of material that could be
applied to achieve 250 kg N/ha in an NVZ area would be 58 m3/ha and the amounts of total nutrients that would
be applied are shown in Table 3-2.
Table 3-2 Nutrients applied per hectare (from whole digestate @ 58 m3/ha)
kg/ha
Total N 250
Ammonium N 90
Total P2O5 47
Total K2O 140
Total MgO 12
Total SO3 35
A rough guide to crude fertiliser values of various materials is available at
http://www.wrap.org.uk/farming_growing_and_landscaping/compost_calculator.html. This guide takes the
approach (as per the Fertiliser Manual (RB20935)) that all of the phosphate and potash will become available to
crops over the following rotations and are as effective as artificial fertiliser.
3.1.3 Impacts of separation on nutrients, dry matter and Volatile Solids in digestate
Five of the materials were physically separated by screening through a sieve. The five materials that were
separated into liquid and fibre fractions were two digestates that passed the RBP test (B and C), two digestates
that failed the RBP test (G and H) and one pig slurry as a comparison with non-digestates. The volumes of each
fraction were on average 90.9 % liquor and 9.1 % fibre of the whole, resulting in average dry matters of 3.7 %
and 9.2 % for the liquor and fibre fractions, respectively, compared with the whole material at 4.0% DM (Table
3-3).
6 http://www.defra.gov.uk/publications/files/rb209-fertiliser-manual-110412.pdf

Biofertiliser management: best practice for agronomic benefit & odour control 14
Table 3-3 Separation percentage, dry matter, LOI and VS
% of whole DM % LOI % DM VS %
Pig slurry
Whole 4.81 71.7 3.42
Liquor 93.2 4.56 72.9 3.32
Fibre 6.80 9.68 84.4 8.16
Digestate B
Whole 4.50 66.8 3.01
Liquor 90.1 4.35 65.4 2.84
Fibre 9.90 5.91 75.4 4.46
Digestate C
Whole 5.24 74.7 3.92
Liquor 78.2 4.41 70.0 3.08
Fibre 21.8 9.36 83.0 7.76
Digestate H
Whole 2.05 63.9 1.31
Liquor 98.4 1.90 63.6 1.21
Fibre 1.60 9.80 87.9 8.61
Digestate G
Whole 3.57 76.8 2.74
Liquor 94.8 3.45 76.3 2.64
Fibre 5.20 11.3 77.9 8.84
Average
Whole 4.00 70.8 2.88
Liquor 90.9 3.70 69.6 2.62
Fibre 9.10 9.20 81.7 7.57
The organic matter content of the dry matter in the fibre was greater (81.7%) than in that of the liquor (69.6%)
leading to three times more volatile solids in the fibre material. The fibre, when spread, will therefore lead to
more organic matter being applied per tonne.
Separation of the five digestates resulted in an increase in the DM contents of the fibre materials to 9.2% and a
decrease in the liquor fraction to 3.7%; the organic matter contents changed to 7.6 and 2.6%, respectively. This
organic matter, when applied at the rates possible governed by the total nitrogen content of the digestate, will
provide soil conditioning effects.
The nutrient contents of the various digestates and their fractions are shown in Table 3-1. The nutrient profiles of
the separated fractions are reasonably similar, but of most interest is the relative proportions of the different
fractions resulting from the separation (Table 3-4). Given the very large liquor proportion, the majority of
nutrients will be present in this liquid fraction.
Table 3-4 Nutrient contents of separated materials kg/m3
Total N P2O5 K2O SO3 Ca MgO
Pig slurry
Whole 4.1 2.5 3.5 1.1 2.1 1.3
Liquor 4.0 2.4 3.3 0.9 2.0 1.2
Fibre i/s 2.8 3.4 1.5 2.6 1.3
Digestate B
Whole 4.1 1.2 3.2 1.2 2.3 0.2
Liquor 4.0 1.2 3.3 1.2 2.2 0.2
Fibre 4.3 1.3 3.5 1.3 2.4 0.2
Digestate C
Whole 3.7 1.3 4.2 1.0 1.3 0.7
Liquor 3.3 1.2 3.8 0.8 1.2 0.7
Fibre 2.8 1.1 3.9 1.2 1.4 0.6
Digestate H
Whole i/s 0.6 1.5 0.3 0.7 0.2
Liquor 3.6 0.6 1.4 0.2 0.6 0.2
Fibre i/s 1.3 1.8 1.0 2.1 0.5
Digestate G
Whole 4.2 1.0 2.3 0.4 0.7 0.3
Liquor 4.3 0.9 2.3 0.4 0.6 0.3
Fibre 13 3.7 2.3 1.0 4.7 1.2
Average
Whole 4.0 1.3 2.9 0.8 1.4 0.5
Liquor 3.9 1.2 2.8 0.7 1.3 0.5
Fibre 6.7 2.1 3.0 1.2 2.6 0.8
i/s=insufficient sample

Biofertiliser management: best practice for agronomic benefit & odour control 15
3.1.4 Potentially Toxic Elements (PTEs)
Limited PTE analysis was carried out on the digestates and slurries (see Appendix 1 Table A 17 and Table A 18).
Biofertiliser applications must adhere to the maximum permissible annual rate of PTE addition over a 10-year
period as per the Code of Practice for the Agricultural Use of Sewage Sludge7 (the „Sludge Code‟). Copper and
zinc supplements are often added to pig feeds, which can lead to relatively high levels in pig slurries. All of the
pig slurries were above the 400 mg/kg PAS110 limit for zinc on a dry matter basis and two were above the
copper limit. One cow slurry exceeded the chromium limit (100 mg/kg dry matter).
Four digestates passed the PTE limits on a dry matter basis, three of these were mainly food waste derived.
Occasional exceedences of chromium, copper, nickel and zinc were found for other digestate samples. However,
the loading rates (on a dry matter basis) in these cases would still be extremely low and would not present a risk
to humans, animals, crops or the environment. It should also be considered that, when applying biofertilisers to
land, the receiving soils must first be analysed to baseline their PTE contents. The PTE loading from the applied
biofertilisers must then be calculated and compared with soil limits according to the ADQP requirements to ensure
that future risks are avoided.
3.2 Stability
3.2.1 RBP stability values
The Residual Biogas Potential (RBP) test aims to estimate the stability of digestates by recording the potential
volume of biogas (methane and carbon dioxide) produced by samples under ideal anaerobic test conditions. The
RBP result is presented as litres of biogas produced per g of volatile solids of the sample being tested (Walker,
M). Materials containing a high proportion of easily biodegradable carbon will produce more biogas and will have
a higher RBP value compared with a material containing a low proportion of easily biodegradable carbon. The
material containing a low proportion of easily biodegradable carbon (low RBP value) would be considered to be
more stable as it would be less biodegradable under anaerobic conditions.
Walker et al. (2010) recommended that the pass/fail stability threshold for PAS110 be set at the approximate
maximum level of RBP (0.25 litres biogas/g vs) that was found for cattle and pig slurries (n=4) and sewage
sludges (n=6) which were investigated during their study. It was argued that it was appropriate to set the
threshold at this level as slurries and sewage sludges are commonly permitted to be spread to land. However, it
was acknowledged by Walker et al., (2010) that setting the RBP threshold in this way was a relatively arbitrary
measure, and further research into the environmental impact of the threshold levels was recommended, as was
identification of further criteria for setting the threshold.
The research findings presented here (Figure 3-1) show that of the nine whole digestates tested, six passed the
RBP stability test. Of these six passes, three had RBP values much lower than the threshold (0.04, 0.06 and 0.09
litres biogas/g vs) and of these, two digestates were derived exclusively or mainly from cattle slurries (A and C)
while digestate B was derived from an AD plant treating food waste but employing a very long hydraulic retention
time. The three digestates which had values approaching the RPB threshold (0.18, 0.19 and 0.22 litres biogas/g
vs) were derived mainly from food waste.
Of the three digestates that failed the test, one digestate only just failed, with a high acetic acid concentration
suggesting it was quite active but not fully stabilised. The plant from which this was derived was still undergoing
commissioning. Two further digestates had very high RBP values which greatly exceeded the threshold level and
these also had relatively high digestate propanoic acid concentrations, indicating that the anaerobic digestion
processes from which the digestates had been derived may have been inhibited.
Figure 3-2 shows RBP values for the cattle and pig slurries. In general, the RBP values for the cattle slurries and
the mixed cattle and pig slurry tested were broadly comparable to the RBP threshold. However, the RBP values
for the pig slurries greatly exceeded the RBP threshold. It would be expected that the cattle slurries would have
RBP values lower than those for the pig slurries since the cattle slurries have already gone through a process of
anaerobic digestion in the guts of the cattle from which the slurries were derived. This anaerobic digestion
process would selectively digest the fraction of the organic matter in the cattle feed which would be amenable to
7 http://archive.defra.gov.uk/environment/quality/water/waterquality/sewage/documents/sludge-cop.pdf

Biofertiliser management: best practice for agronomic benefit & odour control 16
anaerobic digestion leaving the anaerobic RBP test to respond to the partially stabilised residue only. The pig
slurry, by contrast, would be expected to contain material which would be highly biodegradable under the
anaerobic conditions of the RBP test.
Based on the data from this study, it might be observed that high-stability (i.e. low RBP value) digestates can be
produced from food-based inputs using very long retention times and from inputs based on cattle slurries utilising
typical retention times in the range 25-30 days. Also, it would appear that it is possible to achieve the PAS110
RBP stability threshold for digestates derived from mainly food-based inputs using retention times within the
range 20 to 60 days.
Figure 3-1 RBP values for the nine digestates (A to I) tested. The PAS110 RBP threshold is 0.25 L/g VS as shown
Figure 3-2 RBP values for the five cattle slurries (C1 to C5), cattle plus pig slurry (CP) and pig slurries (P1 to P4)
tested. The PAS110 RBP threshold is 0.25 L/g VS as shown

Biofertiliser management: best practice for agronomic benefit & odour control 17
3.3 Impacts of separation on stability and odour potential
For the whole and separated digestates as presented in Table 3-5, it can be seen that the RBP results for whole
digestates and their separated liquor and fibre fractions can differ. This is because the RBP test is responding to
the relative amounts of biodegradable carbon found in each of the fractions, and also to the degree of
biodegradability of the carbon found in each fraction. For example, while whole digestate B easily passed the
PAS110 RBP test as did the separated liquor fraction, the fibre fraction showed an elevated RBP result which
approached the RBP threshold of 0.25 L/g VS. In this case it is likely that VFA concentrations were very low in the
whole digestate and separated liquor fraction, while the carbon in the fibre material was moderately
biodegradable. Digestate C was similar, except that the fibre fraction for this digestate appeared to contain
carbon which was less readily biodegradable under anaerobic conditions, resulting in a low RBP value.
Overall, it is important to recognise the fact that whole digestate and respective liquor and fibre fractions can
have different RBP values. Furthermore, since RBP values for separated liquor and fibre fractions will depend on
the concentration of VFAs in solution and the biodegradability of the solid carbon in the fibre, it is difficult to
predict how separation of the whole digestate will affect the RBP values for the resulting fractions.
For the highly odorous pig slurry, it would appear that separating the whole slurry greatly increased the odour
potential of the separated liquor fraction compared with the original whole slurry. However, for the digestates
which were characterised as having relatively little odour, it was found that the fibre fractions usually had slightly
higher odour potentials compared with the liquor fractions.
Table 3-5 Stability
COD g/L BOD g/L COD/BOD RPB
L/g VS
Odour
Potential
Pig slurry
Whole 44.7 28.3 1.60 0.638 3010
Liquor 81.8 38.2 2.10 0.546 10,600
Fibre 0.338 22.0
Digestate B
Whole 20.9 8.20 2.50 0.061 8.00
Liquor 50.0 8.90 5.60 0.062 6.00
Fibre 0.185 30.0
Digestate C
Whole 46.3 42.1 1.10 0.086 575
Liquor 41.9 11.6 3.60 0.097 249
Fibre 0.039 10.0
Digestate H
Whole 31.8 17.1 1.90 0.531 37.0
Liquor 29.0 17.7 1.60 0.406 12.0
Fibre 0.224 21.0
Digestate G
Whole 37.2 18.6 2.00 0.311 3.00
Liquor 40.9 20.7 2.00 0.410 13.0
Fibre 0.418 46.0
Average
Whole 36.2 22.9 1.82 0.325
Liquor 48.7 19.4 2.98 0.304
Fibre 0.241
3.3.1 Odour Potentials
Determination of Odour Potential for the digestates and slurries involved two distinct stages. Odours were first
stripped from each of the digestates and slurries using a controlled volume of odour-free air, and the resulting
gases were then pre-diluted before being presented to a testing panel during an assessment process called
dynamic olfactometry. The off-gas for each sample under test was further diluted in a series of steps until
panellists were confident that the odour threshold had been established (i.e. the point at which odour is just
detected; the odour concentration at the odour threshold is 1 ouE by definition). The degree of dilution for each
sample represents the Odour Potential and is expressed as an odour concentration (ouE m-3).
It should be appreciated that the odour stripping technique and the use of dynamic olfactometry to determine
Odour Potential is a laboratory-based method that is appropriate to ranking relatively similar materials in terms of
their potential to generate odour. Findings from this exercise should not be taken to reflect the actual odour
impact of those materials in the environment.

Biofertiliser management: best practice for agronomic benefit & odour control 18
In general, the Odour Potentials for the untreated pig and cattle slurries were much higher than those for the
digestates. That is to say, the odours that were stripped from the slurries had much higher odour concentrations
compared with the digestates, as the gases stripped from the slurries required much more dilution to reach the
odour threshold.
The mean odour potentials for the three main types of materials tested were:
digestates 178 x 103 ouE m-3
cattle slurries 2,542 x 103 ouE m-3
pig slurries 15,125 x 103 ouE m-3
The odour potentials for the digestates selected for the study and for the comparison slurries are presented in
Table 3-6.
Table 3-6 Odour potentials for digestates and comparator slurries
Digestates
Odour
potential
103 ouE/m3
Comparator slurries
Odour
potential
103 ouE/m3
Digestate A (liquor) 5 Cow slurry 1 639
Digestate B 8 Cow slurry 2 3570
Digestate C 575 Cow slurry 3 6550
Digestate D 133 Cow slurry 4 1840
Digestate E 4 Cow slurry 5 113
Digestate F (liquor) 888 Cow/Pig slurry 5730
Digestate G 3 Pig slurry 1 45000
Digestate H 37 Pig slurry 2 3940
Digestate I 5 Pig slurry 3 3010
Digestate SBR 1 2 Pig slurry 4 8550
Digestate SBR 2 0.3 Digested sewage 30
3.3.2 Relationship between stability (RBP value) and Odour Potential
In terms of odour emissions from slurries and digestates it might be expected that anaerobic conditions during
AD treatment or storage would encourage the generation of odorous metabolic products such as reduced sulphur
compounds and hydrogen sulphide, ammonia, amines and thiols. A three-stage scheme for complete anaerobic
degradation of organic matter is usually proposed (Mackie et al., 1998). The first stage, or acid-forming stage,
involves a complex range of bacteria that hydrolyze the primary substrate polymers such as polysaccharides,
proteins, and lipids and ferment them, producing fatty and other organic acids, alcohol, NH3, sulphur compounds,
CO2, and H2. Propionate and longer-chain fatty acids, some organic acids, and alcohols are subsequently
degraded by a second intermediate group of bacteria called the obligate H2-producing acetogenic bacteria.
Finally, methanogens rapidly utilize the H2 produced by other bacteria to reduce CO2 to CH4, while the aceticlastic
methanogens cleave acetate to CH4 and CO2.
Efficiency of methane fermentation during complete anaerobic digestion is related to two important operational
factors: the hydraulic retention time and the volumetric organic matter loading rate. The rate-limiting step in
most fermentations is degradation of fatty acids. This clearly suggests that odorous metabolic carbon compounds
such as volatile fatty acids and reduced sulphur compounds which are readily produced during the anaerobic
digestion process can accumulate with high digester loading rates accompanied by low rates of conversion to
biogas. Odorizzi et al., (2003) contend that odour from waste treatment plants is associated with the stability (i.e.
degree of decomposition) of the waste being treated. Hence, it is likely that odour is associated mainly with the
early stages of biological waste treatment, often due to anaerobic conditions prevailing, when most readily
biodegradable material is available and when odorous metabolic products have yet to be effectively decomposed.
High levels of readily biodegradable carbon being present during digestion and in digestate or in stored slurries is

Biofertiliser management: best practice for agronomic benefit & odour control 19
likely to give rise to high RBP values (i.e. showing high levels of biodegradability or low stability) and possible
odour problems. Equally, it might be expected that optimum hydraulic retention times and loading rates should
produce the necessary conditions during anaerobic digestion to fully digest the entrained biodegradable
compounds leading to low RBP values, reduced odour in the digestate – and maximum biogas yield.
This hypothesis is largely borne-out by the findings in this study for the livestock slurries, but not the data
determined for digestates. Most of the pig and cow slurries that were tested had high or very high odour
potentials and in general these were also associated with high or very high RBP values. The four pig slurries that
were tested were characterised as having very high RBP values which greatly exceeded the PAS110 RBP
threshold and they all had high or very high Odour Potentials (3,010, 3,940, 8,550 and 45,000x 103 ouE m-3). All
five cattle slurries had RBP values which were comparable to the RBP threshold and three of these had high
Odour Potentials (1840, 3570 and 6550 x 103 ouE m-3).
Unfortunately, this relationship between stability and odour potential was not demonstrated for the digestates
(see Figure 3-3). Three of the six digestates that passed the RBP test had very low Odour Potentials (4, 5 and 8 x
103 ouE m-3) while all of the three digestates that exceeded (i.e. failed) the RBP test threshold also had very low
Odour Potentials (3, 5, and 37 x 103 ouE m-3). In contrast, three of the digestates that passed the RBP test had
elevated Odour Potentials (133, 575 and 888 x 103ouE m-3).
Figure 3-3 Digestate RBP values with numerical values of Odour Potentials expressed as x 103 ouE m-3
As noted above, while odour potential is a useful tool, these findings should not be taken to reflect the actual
impact of those materials in the environment. Thus, both digestate stability and digestate odour should be
adequately managed within AD systems. It should be noted that some sites providing digestates for this study did
employ odour control methods separately from digestate stability management. To maintain the anonymity of
sites providing sample materials, the details of specific odour control methods cannot be provided in this report.
Many odorous compounds are detected by the human nose at very low concentrations. Therefore even emissions
from low odour potential digestates may be perceived as being unpleasant due to the presence of specific
compounds in relatively low concentrations, such as hydrogen sulphide or dimethyl disulphide. An analysis of the
compounds present in the gases stripped from the digestates with elevated odour potentials (C, D and F) showed
elevated levels of hydrogen sulphide. It is possible that the presence of elevated concentrations of hydrogen
sulphide may have been principally responsible for the elevated odour potentials for these digestates, which in
other respects appeared to be well stabilised.
In terms of identifying the origins of the hydrogen sulphide, the two digestates with the highest levels of
hydrogen sulphide in the off-gases (C and F) also used cattle slurry as input wastes to the digestion process and,
as shown in this report, some untreated cattle slurries can contain very high levels of hydrogen sulphide which
may have contributed significantly to the elevated levels found in the digestates. However, this effect was not
evident with Digestate A, which was derived exclusively from cattle slurry and was characterised as having a low

Biofertiliser management: best practice for agronomic benefit & odour control 20
odour potential, with the off-gases containing very low concentrations of hydrogen sulphide. Digestates derived
from food-based inputs only contained very low concentrations of hydrogen sulphide in the off-gases with the
exception of Digestate D. It would appear that individual digestion processes and input materials can affect the
properties of the resulting digestates and further research is needed to more fully understand the nature of this
relationship.
From an odour perspective, decreasing the RBP threshold significantly to match the RBP values for highly
stabilised digestates (<0.1 L biogas/gVS) would seem to be inappropriate, as there is no current evidence that
this will guarantee low odour potentials. The method previously used for setting the RBP threshold is based on
RBP values for cattle and pig slurries that are applied to land untreated. On this basis the current threshold is set
at 0.25 L biogas/gVS, but using data from this study, it could be argued that the RBP threshold could be
increased to take account of the new RBP values for pig slurries. This would mean increasing the threshold to
approximately 0.8 L biogas/gVS, and further evidence from this study suggests that digestates with RBP values
up to this level also had low odour potentials.
However, given the uncertain linkage between stability and odour, together with the clear evidence that high RBP
values are linked to inhibited digestion processes (that are not maximising their biogas (and hence, revenue)
potential), it is recommended that the current RBP threshold is retained at the level of 0.25 litres biogas/g VS.
3.3.3 Characterisation of odour
A number of authors have identified odorous compounds associated with anaerobic processes. Adalberto Noyola,
studied odours associated with anaerobic sewage treatment works and cited odour sources as:
(a) inorganic gases such as hydrogen sulphide and ammonia;
(b) organic acidic compounds such as acetic, propanoic, butyric and lactic acids; and
(c) amines such as cadaverine and putrescine.
Other odorous organic compounds found in wastewater treatment plants cited by Adalberto Noyola, were:
skatole, phenols, oxysulfide, carbon disulfide, mercaptans of low molecular weight, thiophenes, dimethylsulfide,
dimethyldisulfide and dimethyltrisulfide, aldehydes and ketones. According to Smet & Van Langenhove (1998) in
the environs of AD and wastewater treatment facilities, hydrogen sulphide possesses such characteristic odour
that it generally masks the scent of other organic sulphide compounds. For this reason, hydrogen sulphide is
considered to be the most characteristic bad odour constituent in biogas (Metcalf & Eddy, 2003) , and (bio)
chemical steps are often deployed to strip hydrogen sulphide from solution during or after digestion.
Parker et al., (2002) identified a number of odorous compounds in landfill gas with the most odorous five
compounds being hydrogen sulphide, methanethiol, butanoic acid, ethanal (acetaldehyde) and carbon disulphide.
Similarly Susaya (2011) identified the dominant odorous compounds in lake sediment resulting from anaerobic
decomposition as hydrogen sulphide, ammonia, butanoic acid, pentanoic acid, ethanal, butanal, and dimethyl
sulphide.
The preliminary instrumental analyses of odorous gasses presented here focused on a selected set of odorous
compounds which were found to be typically associated with anaerobic decomposition. Digestates were stripped
of odour using the method detailed by Hobson (2002) and odour compounds were determined by Fourier
Transform Infrared Spectroscopy (FTIR) and Jerome hydrogen sulphide analysis. Total VOCs were measured by
Flame Ionisation Detection (FID), Photo Ionisation Detection (PID), and gas chromatography-mass spectrometry
(GC-MS).
As noted above, hydrogen sulphide is often associated with odours from anaerobic digestion processes. In this
study, hydrogen sulphide was found to be consistently present in the collected digestate gases and Figure 3-4
suggests that there was a reasonably good relationship between Odour Potential and the concentration of
hydrogen sulphide for all samples tested. From Appendix 1, Table A 3, it can be seen that the gasses stripped
from digestates C (138 ppm), D (22.7 ppm) and F (150 ppm) contained elevated concentrations of hydrogen
sulphide compared with other digestates. These elevated levels of hydrogen sulphide were also associated with
elevated odour potentials for these digestates.
Pentanoic acid was not detected. Butanoic acid and ethanal were each detected in only one sample.
Methanethiol, carbon disulphide, dimethyl sulphide and dimethyl disulphide were detected mainly in the cattle
and pig slurries. Ammonia concentrations were consistently low for all samples tested and it is possible that the

Biofertiliser management: best practice for agronomic benefit & odour control 21
odour stripping method failed to adequately volatilise ammonia from the materials under test. Ammonia is known
to be highly soluble at ambient temperatures.
Figure 3-4 Concentration of hydrogen sulphide in gas collected during Odour Potential test plotted against Odour
potential results. One very high value for odour potential has been excluded. Hydrogen sulphide concentration
has been adjusted to account for dilution
3.3.4 Alternative metrics for determining digestate stability or degree of digestion
The Residual Biogas Potential (RBP) test is the current method used to determine digestate stability or degree of
digestion. The test is based on digesting samples in small-scale, batch anaerobic digesters over the 28 day period
of test. For digestates, the RBP test gives a direct measure of the capacity of the residual carbon in digestates to
produce biogas (methane and carbon dioxide) which in turn indicates how well the feedstock has been digested.
For digestates, the current RBP test will respond principally to the VFAs in solution, with low concentrations giving
a low RBP result and high concentrations giving a high RBP result, up to a limiting concentration which is known
to cause test inhibition. For this reason, the PAS110 RBP test is currently preceded by a VFA screen, which aims
to screen out samples with high VFA concentrations in solution lest they deliver subsequent false negatives in the
RBP test.
As noted above, the RBP test gives a direct measure of the capacity of the residual carbon in digestates to
produce biogas and to some degree the RBP test could be regarded as a test for assessing the effectiveness of
the AD process rather than for assessing the suitability of digestates for land spreading. Indeed, the RBP test is
included within the PAS110 specification (partly) to ensure that input materials have genuinely been submitted to
an anaerobic digestion process, limiting the potential for „sham‟ recovery of input materials. The main advantages
are that the RBP test is an anaerobic test and therefore reflects the anaerobic characteristics of the samples. It is
also capable of testing all fractions of digestate (liquid, slurry and fibre). Inhibition of the RBP test at high VFA
concentrations, and the relatively long test duration (28 days) are two disadvantages.
Hydrogen sulphide vs. Odour potential for digestates and
slurries
y = 0.1656x
R2 = 0.7637
0
200
400
600
800
1000
1200
1400
1600
0 1000 2000 3000 4000 5000 6000 7000 8000 9000
Odour potential 10^3 ouE/m3
H2
S, p
pm
v/v

Biofertiliser management: best practice for agronomic benefit & odour control 22
It should be noted that the RBP test gives a direct measure of digestate stability under anaerobic conditions and
as such provides the “benchmark” of stability against which other metrics or surrogate methods are compared.
This project investigated three digestate metrics as a possible alternative to the RBP test:
Total volatile fatty acid concentration
BOD and COD/BOD ratio
Dissolved carbon (DC)
The metrics above were assessed as direct alternatives to the RBP test rather than as possible pre-RBP
screening tests.
3.3.5 Total volatile fatty acid (VFA) concentration
This metric is currently used as the pre-RBP screen to identify possible test inhibition. The RBP value will reflect
the total VFA level in the digestate as well as reflecting other forms of carbon, such as partially decomposed
waste in solid particulate form. It should be noted VFA concentrations for slurry and liquid digestate samples are
determined using the filtered eluates from samples, rather than using the unfiltered liquids – which would also
contain carbon in solid form.
It would be expected that the total VFA concentration was positively related to the RBP value and this was found
as shown in Figure 3-5. However, total VFA concentration cannot be used with certainty to predict stability or
degree of digestion on its own, as carbon in solid particulate form in the digestate „as received‟ may also make a
significant contribution to RBP value (and is currently discarded prior to VFA testing). Hence, the VFA
concentration in the sample eluents may underestimate the full level of stability – which is given by the RBP test.
This is shown in Figure 3-5, where the VFA concentration was found to be less than the RBP value for many of
the digestate samples. Also, VFA determination cannot normally be carried out on separated fibre samples or dry
digestates since the test relies upon a liquid sample fraction.
Figure 3-5 Total volatile fatty acids (sum C2 to C6) as mg/L acetic acid against RBP L/g(VS), for digestates only

Biofertiliser management: best practice for agronomic benefit & odour control 23
3.3.6 BOD and COD/BOD ratio
From Figure 3-6 it can be seen that a good relationship was found between BOD and respective RBP values for
the digestates that were tested – once a very high BOD outlier had been removed from the data set. BOD is an
aerobic biological test which uses diluted but unfiltered sample liquids and this tends to reflect all forms of carbon
present in the original samples. However, the BOD test is an aerobic test, and it is possible for it to produce very
different results from the anaerobic RBP test, depending on the composition of the digestates. Digestates
containing high levels of ligno-cellulose material, which will be resistant to decomposition under anaerobic
conditions, may produce low RBP values but high BOD values. This might be the case with the one outlier in
Figure 3-6 which was removed. This effect needs to be further investigated before the BOD test could be
recommended for testing the stability of anaerobic digestates. Furthermore, the BOD test, while it has the
capacity to test the whole sample, is only suitable for relatively dilute digestates (approximately <5% dry matter)
and is therefore not suitable for testing separated fibre samples or dry digestates. Because of this, the BOD test
may not be suitable as a direct replacement for the RBP test, but it may have merit as a separate screening test
for dilute digestates in terms of stability and suitability assessment for land application.
Figure 3-6 BOD values against RBP L/g(VS), for digestates only
No clear relationship can be discerned for COD/BOD ratios when plotted against respective RBP values (Figure
3-7). In this case, it can be seen that six values of COD:BOD ratio falling within the narrow range 2:1 to 3:1 are
associated with a range of RBP values extending from 0.05 to 0.55 L/g VS.

Biofertiliser management: best practice for agronomic benefit & odour control 24
Figure 3-7 COD/BOD ratios against RBP L/g(VS), for digestates only
3.3.7 Dissolved carbon (DC)
As noted previously, the current RBP test incorporates a VFA screening test to identify high concentrations of
VFAs which may inhibit the subsequent RBP test. The VFA determination is carried out on filtered samples
extracted directly from digestate samples.
Instead of determining the VFA concentration using a gas chromatograph, the total dissolved carbon content may
be determined directly on the filtrate. In digestate samples, total dissolved carbon can take the form of organic
carbon (such as ethanioc acid) and inorganic carbon (such as carbonates). Purgable dissolved carbon is the
standard method for determining inorganic carbon, i.e. purging with carbon-free air after pre-treatment with acid,
though this may also liberate some volatile organic species. The remaining organic carbon fraction is known as
non-purgable organic carbon (NPOC).
Figure 3-8 shows the relationship between dissolved non-purgable organic carbon (NPOC) and RBP. A slightly
weaker correlation is found between total dissolved carbon and RBP. Compared with total VFA concentration,
NPOC concentrations reflect a wider range of carbon forms, though (obviously) exclude inorganic forms such as
carbonate, and possibly some volatile organic species.
It is recommended that further research is conducted to fully assess the potential of using concentrations of
dissolved carbon as a surrogate for RBP values. Most dissolved carbon equipment, such as the Shimadzy TOC
ASI-V used here, requires a filtered sample for analysis. However, alterations can be made to include
determination of suspended particulate carbon as well as dissolved carbon and this would be necessary if this test
is to be considered as a direct substitute for the RBP test. In addition, sample introduction and furnace modules
capable of handling sludges directly are now available. Further investigation of these methods is recommended.
With all indirect or surrogate tests, it is important to note that they may not be able to identify how
biodegradable the organic carbon might be under aerobic or anaerobic conditions. Until other tests are
investigated, the RBP remains the most fit-for-purpose methodology for determining the stability of anaerobic
digestates.

Biofertiliser management: best practice for agronomic benefit & odour control 25
Figure 3-8 Non-purgable organic carbon against RBP L/g(VS), for digestates only
3.3.8 Hedonic tone
As previously discussed, olfactometry testing was used to assess the odour potential of the gasses stripped from
each digestate and each animal slurry. In addition, the stripped gasses were assessed for pleasantness of odour
using the Hedonic tone method. Panellists were subjected to increasing concentrations of each of the stripped
gasses and asked to rate their degree of pleasantness on a scale of +4 (most pleasant) to -4 (most unpleasant).
Hedonic tone data are presented in graphical format in Appendix 2. All of the gases stripped from all of the
organic materials under test were considered unpleasant in odour. The odour concentrations at, for example, a
hedonic tone of -2 (moderately unpleasant) was, on average 15 ouE m-3 for pig, 36 ouE m
-3 for cow and 12 ouE m-
3 for the digestates (Table 3-7). This indicates that the cow slurries required a greater concentration of odour to
be deemed unpleasant at a scale of -2 compared with the pig slurries and digestates. Equally, panellists rated
both the digestates and pig slurries to be moderately unpleasant at broadly similar odour concentrations,
suggesting that the odour from digestates at relatively low odour concentrations was considered to be as
offensive as pig slurry.
Odour will be dispersed from source and diluted by wind. The initial odour concentration of the material and
weather conditions will therefore determine the effect on any sensitive receptor. While digestates on average had
odour potentials which were some 14 times lower than the cow slurries that were tested, the hedonic tone rating
for digestates was on average, three times greater than for the cow slurries. This again suggests that digestates,
although having lower odour potentials compared with untreated cow slurries, can be considered to be
unpleasant even at low concentrations.
The separation of the five materials into liquid and fibre did affect the hedonic tone score of two materials, with
the fibres of pig slurry 3 and digestate C (slurry/crops) being unpleasant at lower odour concentrations than the
liquids or un-separated material. The hedonic tone ratings of the separated fibre and liquid for digestates B, G
and H were little affected.
Treatment by SBR did reduce the odour concentration slightly for a hedonic tone score of 2 but the odour
concentration (Table 3-7) had been greatly reduced.
Non-purgable organic carbon vs. RBP for digestates
y = 15628x
R2 = 0.8016
0
2000
4000
6000
8000
10000
12000
14000
16000
0.0 0.1 0.2 0.3 0.4 0.5 0.6 0.7 0.8
RBP, L/g(VS)
NP
OC
, m
g/L

Biofertiliser management: best practice for agronomic benefit & odour control 26
Table 3-7 Odour concentration at hedonic tone score 2 (estimated from Appendix 2 graphs)
OU Code Report Code Input waste type during
study
Whole
Digestate
Separated
Liquid
Separated
Fibre
W29/08 Digestate A cattle slurry 10
W29/13 Digestate B food waste 7 2.5 5
W29/14 Digestate C cattle slurry with some
maize silage 43 35 3
W29/02 Digestate D (used
in SBR2) mainly food waste 18
W29/03 Digestate E mainly food waste 4
W29/01 Digestate F (used
in SBR1)
food waste with some cattle
slurry 12
W29/20 Digestate G food waste 5 5 3
W29/16 Digestate H food waste 4 3 5
W29/12 Digestate I mainly food waste 9
W29/21 Digestate SBR 1 After treatment 4
W29/22 Digestate SBR 2 After treatment 3
W29/05 Cow slurry 1 26
W29/17 Cow slurry 2 20
W29/06 Cow slurry 3 41
W29/11 Cow slurry 4 100
W29/04 Cow slurry 5 11
W29/10 Cow/Pig slurry 20
W29/15 Pig slurry 1 6
W29/09 Pig slurry 2 12
W29/07 Pig slurry 3 22 22 2
W29/19 Pig slurry 4 23
W29/18 Digested sewage 5

Biofertiliser management: best practice for agronomic benefit & odour control 27
3.4 Treatment options/additives
3.4.1 SBR
One of the main objectives of the SBR trials was to investigate nitrification of ammoniacal nitrogen to nitrate as a
mechanism for improving the agronomic value and ease of management of digestates. Ammoniacal nitrogen in
sample D reduced from 3182 mg/l to 99 mg/l and in sample F from 1795 mg/l to 112 mg/l. The corresponding
increase in nitrate was from 2 mg/l to 1542 mg/l in sample D and from 13 mg/l to 768 mg/l in sample F. Some
nitrogen would have been taken up by sludge growth within the trial units (sludge growth is discussed further in
Section 3.4.3).
Results for potential biodegradability parameters and other parameters are tabulated and summarised below.
KEY
„D before‟ = Digestate D prior to SBR treatment.
„D after‟ = Digestate D after SBR treatment.
„F before‟ = Digestate F prior to SBR treatment.
„F after‟ = Digestate F after SBR treatment.
Table 3-8 Potential biodegradability parameters
RBP
L/g(VS)
COD
g/L
BOD
g/L COD/BOD
Total VFAs
g/L as
acetic
Total
dissolved
carbon
g/L
D before 0.181 20.4 7.9 2.6 0.90 5.33
D after <0 1.52 0.225 6.9 0.33 0.37
F before 0.220 20.9 7.9 2.7 2.11 4.41
F after <0 10.0 1.9 5.3 0.07 0.75
All measures of biodegradability were substantially reduced.
Of note, the RBP for the digestates were below zero.
COD:BOD ratio for both was higher.
Table 3-9 Odour potentials and associated gases
Odour
potential
103 ouE/m3
H2S
ppm
FID
ppm (CH4)
PID
ppm
(isobutane)
NH3
ppm
D before 133 22.7 5611 21.3 20.5
D after 0 0.0 10 0.9 1.9
F before 888 150 i/s* i/s* i/s*
F after 2 0.0 29 1.3 1.3
*i/s = insufficient gas sample.
Odour potential was virtually eliminated.
Complete removed of H2S.
Substantial reduction in CH4, isobutane and NH3 for D. *Insufficient sample. Gas volume produced in odour-stripping test was required for olfactometry testing in F
before treatment, so no direct comparison can be made. However, F after are similar in magnitude to D after.
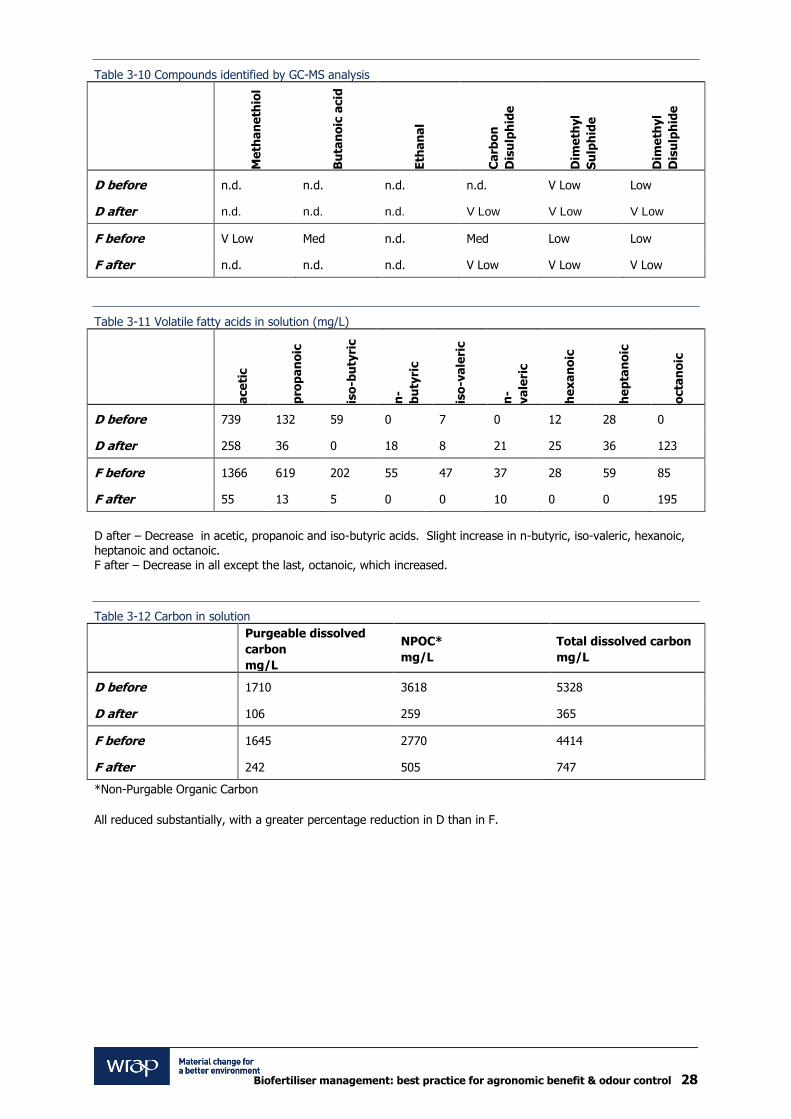
Biofertiliser management: best practice for agronomic benefit & odour control 28
Table 3-10 Compounds identified by GC-MS analysis
Me
tha
ne
thio
l
Bu
tan
oic
acid
Eth
an
al
Ca
rbo
n
Dis
ulp
hid
e
Dim
eth
yl
Su
lph
ide
Dim
eth
yl
Dis
ulp
hid
e
D before n.d. n.d. n.d. n.d. V Low Low
D after n.d. n.d. n.d. V Low V Low V Low
F before V Low Med n.d. Med Low Low
F after n.d. n.d. n.d. V Low V Low V Low
Table 3-11 Volatile fatty acids in solution (mg/L)
ace
tic
pro
pa
no
ic
iso
-bu
tyri
c
n-
bu
tyri
c
iso
-va
leri
c
n-
va
leri
c
he
xa
no
ic
he
pta
no
ic
octa
no
ic
D before 739 132 59 0 7 0 12 28 0
D after 258 36 0 18 8 21 25 36 123
F before 1366 619 202 55 47 37 28 59 85
F after 55 13 5 0 0 10 0 0 195
D after – Decrease in acetic, propanoic and iso-butyric acids. Slight increase in n-butyric, iso-valeric, hexanoic,
heptanoic and octanoic.
F after – Decrease in all except the last, octanoic, which increased.
Table 3-12 Carbon in solution
Purgeable dissolved
carbon
mg/L
NPOC*
mg/L
Total dissolved carbon
mg/L
D before 1710 3618 5328
D after 106 259 365
F before 1645 2770 4414
F after 242 505 747
*Non-Purgable Organic Carbon
All reduced substantially, with a greater percentage reduction in D than in F.

Biofertiliser management: best practice for agronomic benefit & odour control 29
3.4.2 Sewer discharge consents
If it is not possible for the biofertiliser to be applied to land (for example there being insufficient agricultural land
available within economic distance) then an option for disposal of the liquid fraction might be discharge to sewer
or to watercourse. However, in order to control loadings on the sewage works, or to protect the quality of the
receiving watercourse, either the utility operators or the Environment Agency will impose conditions on the
quality of liquor discharged.
Parameters of relevance to digestate that are routinely controlled include COD, BOD, suspended solids and
ammoniacal nitrogen. The exact consent conditions will vary according to location, but will be related to the
capacity of the receiving works or watercourse to receive the liquor without adverse impact.
Consent conditions are usually stipulated as a maximum concentration that may not be exceeded, and sometimes
as a maximum daily load that may be discharged. The charges levied (by the utilities) for the receipt and
treatment of trade effluents correspond to the volume and strength of the effluent, with „strength‟ typically being
defined and measured by COD, suspended solids and ammoniacal nitrogen. Therefore, the lower the strength,
the lower the charges will be for a given volume of discharge.
As discussed in 3.4.1 above, aerobic treatment of digestates will reduce the concentration of these parameters
prior to discharge, particularly ammoniacal nitrogen.
SBR practicalities (including likely costs)
During the SBR trials, relatively rapid sludge growth within the trials units required sludge to be discarded on two
occasions in order to maintain nitrification, to prevent foaming and to aid settlement. This sludge growth was
probably due to the solids content and COD of the digestates being treated.
In a full scale treatment system, rapid sludge growth and the need for relatively frequent de-sludging is also likely
to occur. However, whenever de-sludging takes place, some of the nitrifying bacteria are also removed with the
sludge. This could lead to problems due to the differing growth rates of the various bacterial populations;
nitrifiers grow more slowly than the organisms that consume carbonaceous matter, so if the de-sludging
frequency is too great, there is the risk that the nitrifying population will be reduced at a faster rate than it can
re-grow. This would result in a loss of nitrifying capability over time. A balance needs to be struck between the
need to de-sludge and the need to retain nitrifying bacteria.
If SBR processes such as the one tested here are to be utilised for post-digestion transformation of digestates,
then more research is required, but the microbiological balance could be addressed by reducing the COD before
the nitrification stage in order to limit sludge growth. This could be achieved by:
a) Physical removal of solids by means of a suitable dewatering system, such as belt press or centrifuge.
b) A two stage biological system; the first stage being used for reduction of COD, and the second stage for
nitrification. Thus when the first stage is de-sludged, no nitrifiers would be lost.
Costs of a digestate treatment system will vary according to the volume and strength to be treated, and the
discharge consent parameters to be met. The typical throughput of current commercial SBR systems treating
leachate is 20,000 to 75,000m3/annum, which is similar to the typical range of throughputs for AD plants. A
reasonable budget estimate for incorporating a system into an AD plant would be around 5% of the overall
capital cost of the AD plant. Economies of scale at larger plants, and duplication of common equipment such as
dewatering plant and control systems might reduce the overall cost.
Operating costs would primarily be related to the electricity used for aeration, which might typically be in the
range 3 – 6 kWh per m3 of digestate treated, and which could be obtained from a CHP unit on site.

Biofertiliser management: best practice for agronomic benefit & odour control 30
3.4.3 Additives
Two types of additives are particularly relevant to this report. Firstly, the addition of trace elements to the
digestion process to reduce the effects of inhibition associated with food waste inputs. Inhibition is known to
increase digestate VFA concentrations and this in turn could increase odour. Secondly, arising out of the
water/sewage anaerobic digestion treatment sector, it has been found that additions of various chemicals and
micro-organisms can reduce odour problems typically associated with reduced sulphur compounds (such as H2S).
These are briefly discussed below.
3.4.3.1 Addition of trace elements
Research by Yue Zhang carried out at the University of Southampton highlighted potential problems with the
stable digestion of source segregated food waste in commercial digesters. When operating on this substrate, the
digestion process typically has a high ammonia concentration and elevated levels of volatile fatty acids (VFA),
which can bring about acidification and (ultimately) failure of the digester if the buffering capacity is overcome.
They postulated that the relationship between ammonia and the elevated VFA levels resulted from toxicity to the
methanogen population, further complicated by impairment of the function of methanogens by trace element
deficiency. The University of Southampton concluded that selenium and cobalt are the key trace elements that
are needed for the long-term stability of anaerobic food waste digestion, but that are likely to be deficient in food
waste. The minimum concentrations recommended for selenium and cobalt in anaerobic food waste digesters at
moderate organic loading rates (~2-3 kg VS m3 day-1) are around 0.16 and 0.22 mg l-1, respectively.
Molybdenum, tungsten and nickel (Mo, W, and Ni) were found to be present in food waste in sufficient quantities
for moderate organic loading rates, but may also have to be supplemented in anaerobic digestion systems
operating with a higher rates (~5 kg VS m3 day-1and above). Prevention of VFA accumulation in the digester by
trace element supplementation is seen as an essential precaution, as microbiological recovery of a severely VFA-
laden digester is not a rapid process even after supplements are added – reducing potential biogas yields (and
site revenue). Some commercial anaerobic digester operators are currently experimenting with selenium and
cobalt additions to reduce ammonia inhibition.
3.4.3.2 Addition of various chemicals and micro-organisms to control odour
According to Curtin Water Quality Research Centre (CWQRC) Report No: Curtin Water Quality Research Centre, a
study of one particular waste water treatment plant showed that a biosolids product with a 15% lime dose still
produced substantial odours after four days of storage and the odours increased over time, while biosolids
products stabilised with 30% and 40% lime doses were very stable and the odours appeared to decrease as
storage time increased.
In general, an increase in iron concentration in the sludge or biosolids resulted in higher Total Volatile Organic
Sulphur Compounds (TVOSC) concentrations in the dewatered biosolids headspace, especially if iron was added
prior to or during digestion. It was found that addition of ferric chloride (FeCl3) to anaerobically digested solids
before dewatering did not reduce TVOSC emissions from cake until FeCl3 dose was at least 8% on a dry mass-
mass basis and this also required additional lime addition to maintain near neutral pH. However, a full-scale trial
at a different waste water treatment plant (WWTP) showed that iron addition at lower dosage rates may be
effective in reducing odours in some biosolids. Thus, it was concluded that the effectiveness of iron addition in
reducing odours seemed to be dependent on the site-specific characteristics of the biosolids.
Tepe, N bioaugmented a biosolids digester with Bacillus, Pseudomonas and Actinomycetes. Resulting digestates
were stored for ten days and odour from the bioaugmented digestate was compared with a control digestate.
The bioaugmented digestate (negligible) achieved significant reductions in methyl mercaptan emission compared
to control (300 ppm) while peak dimethyl sulphide emission was only 37% of that from the control.
Spreading best practice to reduce odour and maximise agronomic benefit
The nitrogen availability within digestate (of the total nitrogen) is typically higher than in farm slurries8 because of
the relatively high percentage of ammonium nitrogen within the digestate. It is estimated that for digestate
applications approximately 80% of applied nitrogen uptake by arable crops and grassland can be achieved if good
agricultural practices are followed. However, due to the large ammonium content within the digestate losses
8 Utilisation of digestate from biogas plants as biofertiliser – IEA Bioenergy 2010.
Biofertiliser management: best practice for agronomic benefit & odour control 31
through volatilisation (odour release), nutrient leaching and runoff can be high if application and management
techniques are not adequate.
PAS110 includes a comprehensive suite of tests and maximum thresholds which must be applied to each of the
fractions of the digestate (whole digestate, separated liquor and separated fibre) which are proposed for
accreditation to the PAS. Farmers should ensure that the digestate properties match those that are
allowed/required for their farm applications and that the digestate is physically suitable for use. A FACTS advisor
(http://www.factsinfo.org.uk/facts/) must be used to determine the correct application rate and timing of the
digestate spreading.
3.4.4 Previous research and support systems
A great deal of research has been carried out by MAFF/Defra to improve spreading practices and to reduce
ammonia losses from farm manures and slurries. Defra project AM0120 (2002) reported that ammonia emissions
from slurries could be reduced by up to 90% using injection techniques, but that band spreading was less
effective at 30%. Incorporation of broadcast slurries reduced ammonia losses by 71% compared with not
cultivating them into the soil (Defra project WA0632, 2001). Incorporation techniques (Defra project WA0716,
2005) showed that losses of ammonia could be reduced by 65% or 85% by ploughing manures in within 24
hours or within 4 hours, respectively; discing was less effective than ploughing.
MANNER9 is a decision support system that can be used to accurately predict the fertiliser nitrogen value of
organic manures on a field specific basis. MANNER has been developed using results from the research, funded
by Defra, on organic manure utilisation on agricultural land and incorporates ammonia losses depending on the
management system for spreading/incorporation employed. A slurry type that most closely resembles digestate,
such as pig slurry, can currently be used for planning purposes.
Assistance for nutrient planning is available through free software at http://www.planet4farmers.co.uk/ and
practical advice is available at http://www.nutrientmanagement.org/.
3.4.5 Application
A number of factors should be considered when looking to apply digestate to land. Digestate, particularly when
produced from food waste feedstocks, can have chemical properties comparable to or stronger than raw farm
slurries. Therefore, the potential for odour, nutrient loadings and run-off or leaching should be fully assessed and
understood before spreading.
Application systems should be fit for purpose and be suitable according to Good Agricultural Practice. Before
application, as well as PAS110 and ADQP, the implications of each of the following should be considered:
Farm nutrient management plans10
NVZ legislation11 (currently approximately 4% of Wales in within an NVZ) in relation to total nutrient
application (250kg total nitrogen per hectare per year)
Previous results of soil sampling and nitrogen loadings
Agricultural and other Best Practice Codes
RB209 Fertiliser Manual
The application of the digestate should form the primary fertiliser application for the receiving crop, and other
fertilisers should be used to top up the required loading according to crop requirements and previous field
cropping history. It may be that when planning to use digestate as the primary fertiliser application that the
application requirements/rates may be limited by the phosphorus content of the digestate in relation to the soil
phosphorus index and the crop rotation requirements, rather than by the total nitrogen content of the digestate.
9 http://www.adas.co.uk/MANNER/FurtherInfo/tabid/274/Default.aspx 10 http://www.nutrientmanagement.org/Support-and-advice/NVZs/Grassland-derogation/ 11 http://www.netregs.gov.uk/netregs/businesses/agriculture/118732.aspx

Biofertiliser management: best practice for agronomic benefit & odour control 32
The systems and methods for application of digestate are very similar to those for farm slurries and organic
manures (such as biosolids). Reference should therefore be made to the available guidance handbooks for
manure applications, for example:
Making better use of livestock manures on arable land (2001)12
Making better use of livestock manures on grassland (2001)13
Spreading systems for slurries and solid manures (2001)14
Managing manure on organic farms (2002)15
Application of slurries will correspond to whole digestate and the liquid fraction, while application of solid manure
corresponds to the fibre/solid fraction of digestate.
The following sections indicate where further technical consideration should be given.
3.4.5.1 Liquor and Whole Digestate application
Digestate can be spread to land either as whole digestate or the separate fractions of liquor and solid/fibre. The
choice of slurry handling, pumping and spreading system should be based on the properties of the digestate
fraction to be applied. Environmentally friendly slurry application requires the slurry to be evenly applied near or
under the soil surface. It is much more complicated to fulfil this requirement when the slurry has a high dry
matter content than when it has a low viscosity and can easily flow through band spreading hoses (Amon et al.,
2006).
Table 3-13 provides a general indication of the suitability of farm slurry application systems to cope with whole
and liquor digestate fractions.
As well as considering dry matter, it is worth noting that for selection of suitable machinery the following limits
are specified for PAS110. Bear in mind that these limits are based on dry matter contents, so total loadings of any
contraries should be very low indeed:
Total glass, metal, plastic and any other non-stone man-made fragments = <0.5%m/m dry matter
Stones >5mm = <8% m/m dry matter
Stones are known to be a particular issue for digestates derived from manures and slurries.
Table 3-13 Application systems
Digestate Fraction Application
Typical range of
dry matter
Dig
esta
te
Tra
nsp
ort
Syste
ms
Vacuum tanker Liquor - yes, Whole Digestate – possible if
DM% suitable Up to 12%
Pumped Tanker Liquor - yes, Whole Digestate – possible if
DM% suitable Up to 12%
Umbilical hose Liquor - yes, Whole Digestate may be
possible if DM% and particulates suitable. Up to 8%
Irrigator
Liquor – yes if DM% allows, Whole
Digestate unlikely to be suitable due to
DM% and particulates.
Up to 3%
Dig
esta
te
Dis
trib
uti
on
Syste
ms
Dual purpose
Spreader (or side
impeller discharge
spreader).
Whole Digestate and Liquor – no, unless
odour potential low -
Broadcast
Spreader
Whole Digestate and Liquor – no, unless
odour potential low Up to 12%
12 http://www.defra.gov.uk/foodfarm/landmanage/land-soil/nutrient/documents/manure/livemanure1.pdf 13 http://www.defra.gov.uk/foodfarm/landmanage/land-soil/nutrient/documents/manure/livemanure2.pdf 14 http://www.defra.gov.uk/foodfarm/landmanage/land-soil/nutrient/documents/manure/livemanure3pt1.pdf and http://www.defra.gov.uk/foodfarm/landmanage/land-soil/nutrient/documents/manure/livemanure3pt2.pdf 15 http://www.defra.gov.uk/foodfarm/landmanage/land-soil/nutrient/documents/manure/livemanure4.pdf

Biofertiliser management: best practice for agronomic benefit & odour control 33
Digestate Fraction Application
Typical range of
dry matter
Band Spreader Liquor – yes, Whole Digestate if DM% and
particulates allow Up to 9%
Trailing Hose/Shoe Liquor - yes, Whole Digestate unlikely to
be suitable due to DM% and particulates. Up to 6%
Shallow injector Liquor - yes, Whole Digestate unlikely to
be suitable due to DM% and particulates. Up to 6%
Deep Injector Liquor - yes, Whole Digestate unlikely to
be suitable due to DM% and particulates. Up to 6%
3.4.5.2 Application – solid fraction/fibre
Application of the solid fraction/fibre can be achieved by machinery typically used for solid manure spreading:
Rotaspreader
Rear discharge spreader
Dual purpose spreader or side impeller discharge spreader
If using „fresh‟ rather than the composted solid fraction/fibre, its properties should be checked to ensure it will not have a negative effect on crops as if used fresh in some cases it can cause reduction in seed germination
rates and, in the short-term, lock up nitrogen within the soil.
3.4.6 Other factors for consideration regarding application
3.4.6.1 Application at correct rate
It is important that the equipment chosen for the application can apply the digestate fraction at the required flow
rate to achieve the application rate as identified by the farm Nutrient Management Plan and cropping
requirements. Equipment should be calibrated before use in order to achieve a uniform spread across the full
pass width to avoid uneven crop growth.
3.4.6.2 Odour and other emissions
Ammonia and VFAs are lost to the atmosphere on spreading and dispersed by air movements, which can cause
odours and offense to neighbours.
Around 40% of the readily available nitrogen content of manures is often lost following surface application to
land. Ammonia loss and odour nuisance can be reduced by ensuring that manures are rapidly incorporated into
soils (within 6 hours of application for slurries and 24 hours for solid manures to tillage land). For slurries, shallow
injection and band spreading techniques are effective application methods that reduce ammonia emission
(typically by 30 – 70%) compared with broadcast application. Also, slurry band spreading (trailing shoe and
trailing hose) and shallow injection application techniques increase the number of spreading days, and cause less
sward contamination than surface broadcast applications. These practices will also increase the amount of
nitrogen available for crop uptake. Ammonia losses are generally smaller from low dry matter slurries because
they more rapidly infiltrate into the soil. Higher dry matter slurries remain on the soil/crop surface for longer
leading to greater losses. Losses are also higher when slurries are applied to dry soils under warm weather
conditions (Fertiliser Manual (RB209) 16).
The use of broadcast spreaders and dual purpose spreaders should be avoided if the liquor fraction has a high
odour potential as this type of application is likely to cause odour issues. In this case application systems which
apply the liquor under the crop or grass canopy should be used, i.e. band spreaders, trailing hoses and injectors.
On arable rotations, digestate should be incorporated into the soil as soon as possible following application to
limit ammonia losses and odour, or below the crop canopy in a standing crop using trailing hoses.
16 http://www.defra.gov.uk/foodfarm/landmanage/land-soil/nutrient/nmu01.htm

Biofertiliser management: best practice for agronomic benefit & odour control 34
3.4.6.3 Timing of Applications and Cropping
Within NVZs, there are closed periods during which manures containing more than 30% readily available nitrogen
(cattle or pig slurry, poultry manures and most biofertilisers) must not be applied, although limited applications
may be made by registered organic farmers.
Table 3-14 Closed periods
Grassland Tillage land
Sandy or shallow soil 1 September to 31 December 1 August to 31 December*
All other soils 15 October to 15 January 1 October to 15 January
Manufactured fertiliser 15 September to 15 January 1 September to 15 January
*If crop sown before 15 Sept - applications permitted between 1 Aug → 15 Sept
Consideration should also be given to the timing of the applications in relation to cropping cycles and grazing.
Where digestate applications are made to grazed grassland, the pasture should not be grazed for at least four
weeks following application, or until all visible signs of slurry solids have disappeared.
Where digestate applications are made before “ready to eat crops” i.e. crops that are generally not cooked before
eating, relevant industry guidance should be followed to minimise the risks of pathogen transfer.
Applications should only be considered when soil moisture content is at a level where there is negligible risk of
significant leaching or run-off. Spring applications should be avoided if the moisture content is not suitable as
this will increase the risk of leaching and run-off incidents particularly on heavy soils.
Sensible, practical precautions to reduce the likelihood of causing odour problems when spreading are to:
Check the weather forecast prior to spreading.
Check the wind direction and try to spread only when wind is blowing away from neighbouring properties.
Avoid spreading at weekends, bank holidays or evenings.
Do not spread close to houses.
Plough in immediately after application or use injection to minimise odour.
In addition to this, use of certain slurry application systems e.g. large slurry tankers could, under wet/heavy
conditions, cause considerable compaction which could negatively impact claims for Single Farm Payment.
Consider the application system being used in relation to compaction. A number of AD operators report the use of umbilical systems to avoid the use of tankers. Suitable irrigation systems and using a smaller boom size
to decrease the tanker size required could also be considered as potential options, although this might mean
crop-trampling, with shorter booms meaning that the whole crop cannot be covered if sticking to tramlines
3.4.7 Spreading equipment sources
Lack of available suitable low trajectory spreading machinery and associated services within Wales has previously
been cited as a potential issue for AD digestate application. However, recently a survey conducted by WAG‟s
Dairy Development Centre “Making allowances for nutrients in slurry”, indicated this was no longer the case17.
This report considers slurry handling and application and states that: “The key barrier of lack of available
machinery is no longer valid, with all groups acknowledging injectors/trailing shoes available in their area.”
When considering the installation of AD facilities farmers/operators should investigate the availability of local
contractors and the services they can offer. Many contractors currently own and operate suitable spreading
machinery which can be used for both farm slurries and digestates. A list of local contractors can be generated
using on-line search tools such as www.Yell.com. This link18 provides an example search showing agricultural
contractors in Wales.
This type of search is not likely to provide an exhaustive list, and services offered by local contractors will change
over time and in response to market demands.
17 http://www.ddc-wales.co.uk/client_files/nutrient_planning_-_making_allowances.pdf 18
http://www.yell.com/map/#mapSearchType=yellSearch&keywords=agicultural+contractors&companyName=&location=wales
&workflow=&scrambleSeed=90013014

Biofertiliser management: best practice for agronomic benefit & odour control 35
If suitable local contractor services are not available then prior to investment in AD, discussions should be held
with local contractors to see if there is willingness to invest in spreading equipment. Operators of AD facilities
have reported that local contractors have responded to the introduction facilities in their area, setting up services
and purchasing equipment in response. Typically this is facilitated by contractual arrangements for exclusive
rights for spreading of the digestate. Offering contractual arrangements of this nature provides confidence in
longer-term markets and profitability, and therefore increases the contractor‟s readiness to invest the significant
capital required for the equipment.
If machinery and contractor services are not available locally or if the farmer/contractor wishes to invest in the
required machinery this will be able to be sourced through most local agricultural equipment merchants or direct
from the manufacturers.
When considering the installation of AD facilities farmers/operators should also keep in mind:
A FACTS advisor must be used to determine the correct application rate and timing of the digestate
spreading. If neither the farmer nor contractor is FACTS qualified then FACTS consultancy services will also be required.
A significant landbank may be required for the spreading of the digestate. The landbank requirements should
be calculated at the early stages of planning and if required other local farmers may need to be engaged as outlets for the digestate.
Appendix 4 gives examples of spreading contractors in Wales and the Borders, as well as a more
comprehensive list including UK and further afield.

Biofertiliser management: best practice for agronomic benefit & odour control 36
4.0 Conclusions and recommendations
The PAS110 RBP test has been shown to be a robust and cost-effective method for determining the stability and
degree of digestion for digestates. The PAS110 stability test needs to be capable of testing both solid and liquid
samples and because of this there is currently no single suitable alternative test – although a range of possible
alternatives was investigated.
A wider range of organic materials was also examined than had been possible when the RBP test was originally
developed. Based on the findings of this work, it is recommended that the current RBP threshold is retained at
the level of 0.25 L/g VS, which is comparable with the range of RBP values found for cattle slurries and which
seems to be associated with digestates with low to medium odour potentials.
Other findings from this study suggest that anaerobic treatment of biodegradable wastes can produce digestates
with low odour potentials. However, there were also anomalies with stabilised digestates passing the RBP test,
but having elevated odour potentials, possibly related to hydrogen sulphide. One hypothesis is that some high
digestate odour potentials may be associated with cattle slurry inputs as these can contain very high
concentrations of hydrogen sulphide – but this hypothesis needs to be tested. Certainly it is the case that
individual anaerobic digestion processes and input materials can affect the properties of the resulting digestates,
and this relationship is not yet fully understood.
It should be noted that Odour Potential is a laboratory-based method that is appropriate to ranking materials in
terms of their potential to generate odour. Odour Potential findings in this study should not be taken to reflect
the actual odour impact of those materials in the environment
The sequencing batch reactor (SBR) tests successfully demonstrated that the ammoniacal-nitrogen could be
converted to nitrate-nitrogen. Digestate stability was greatly increased, and the BOD, COD, total VFAs and
dissolved carbon lowered. The odour potential and hydrogen sulphide were eliminated. If it was intended that
the liquid digestates be discharged to sewer (for instance, if suitable land bank was not economically available),
then the loading of BOD, COD, suspended solids and ammoniacal nitrogen would have to be suitably low to
enable the sewage treatment works to cope with the extra demand on the system. This could be achieved
through an SBR approach – although costs would not be insignificant.
Separating the digestate into liquor and fibre fractions generally had little impact on the nutrient profiles of the
different fractions. However, since the liquor fraction comprised by far the majority of the total digestate mass,
this represents the biggest reserve of nutrients that could be recovered for agronomic benefit.
Currently, there are no agreed protocols for monitoring odour at AD sites and related areas. However, the degree
to which odour is a problem for AD sites, and the nature of those odour problems is unknown – although
anecdotal evidence suggest that odours at the time of spreading have proven problematic for some operators.
Good spreading practice should limit odours and maximise agronomic benefit from digestates, but the extent to
which this is the case can only be determined through fieldwork.
Various other aspects could also be investigated in more detail, to provide AD operators with a suite of tools from
which to select solutions appropriate to their own circumstances:
The role and performance of odour control additives, such as various iron compounds;
The possible use of hydrogen sulphide as a cost-effective marker compound for odour at AD sites;
The potential for new analytical equipment to determine total organic carbon in both solid and liquid samples
– and whether this offers a cheaper and equally robust alternative testing route than the RBP test.
Finally, a set of validated protocols could be established for monitoring odours at AD facilities.

Biofertiliser management: best practice for agronomic benefit & odour control 37
5.0 References
Adalberto Noyola, Juan Manuel Morgan-Sagastume & Jorge E. Lopez-Hernandez (2006). Treatment of biogas
produced in anaerobic reactors for domestic wastewater: odor control and energy/resource recovery
Amon B, Kryvoruchko V, Amon T, Zechmeister-Boltenstern S. (2006). Methane, nitrous oxide and ammonia
emissions during storage and after application of dairy cattle slurry and influence of slurry treatment. Agriculture,
Ecosystems and Environment 112, 153–162.
Curtin Water Quality Research Centre. Literature Review on Reduction of Odour in Biosolids. CWQRC Report No:
CWQRC-2011-003.
http://www.watercorporation.com.au/_files/InfrastructureProjects/Biosolids_Reduction_of_Odour_Literature_Revi
ew_V2_2010.pdf Accessed 23 July 2011
Hobson, Yang. (2002). Odour Control in Wastewater Treatment – A Technical Reference Document. UKWIR
Report Ref No. 01/ww/13/3.
Mackie R.I., P. G. Stroot and V. H. Varel. (1998). Biochemical identification and biological origin of key odor
components in livestock waste J Anim Sci 1998. 76:1331-1342.
Metcalf & Eddy Inc. (2003). Wastewater Engineering: Treatment and Reuse. 4th edition, McGraw Hill, New York.
Odorizzi G., L. Paradisi and S. Silvestri (2003). Odour Impact Assessment from Waste Treatment Plants by
Olfactometry. Proceedings Sardinia 2003, Ninth International Waste Management and Landfill Symposium. S.
Margherita di Pula, Cagliari, Italy; 6 - 10 October 2003.
Parker, T., Dottridge, J., Kelly, S. (2002). Investigation of the composition and emissions of trace components in
landfill gas. Environment Agency R&D Technical Report P1-438/TR.
Tepe, N., Yurtsever D., Mehta R.J., Bruno C., Punzi V.L. and Duran M. (2008). Water Science and Technology, 57
(4), 589-594.
Yue Zhang and Mark Walker (September 2010). Optimising Processes for the Stable Operation of Food Waste
Digestion. Technical Report Defra project Code WR1208.
http://randd.defra.gov.uk/Document.aspx?Document=WR1208_9922_TRP.pdf Accessed July 23 2011
SEPA (2010). SEPA Regulatory Position Statement: the Use of PAS 110 certified Digestate from Anaerobic
Digestion. www.sepa.org.uk/waste/waste_regulation/idoc.ashx?docid=0bc42e43-c846-4b31-adfc-
599542358a7b&version=-1 Accessed July 23 2011
Smet E & Van Langenhove H (1998). Abatement of volatile organic sulfur compounds in odorous emissions from
the bioindustry. Biodegradation 9: 273–284
Steen, I. (1998). Phosphorus availability in the 21st Century: management of a non-renewable resource.
Phosphorus and Potassium 217: 25–31
Susaya, J., Kim, K., and Chang, Y. (2011). Characterisation of major offensive odorants released from lake
sediment. Atmospheric Environment 45, 1236-1241.
Walker, M., Banks, C., Heaven, S., and Frederickson, J. (2010). Development and evaluation of a method for
testing the residual biogas potential of digestates. Published by WRAP OFW004-005. ISBN: 1-84405-421-7.
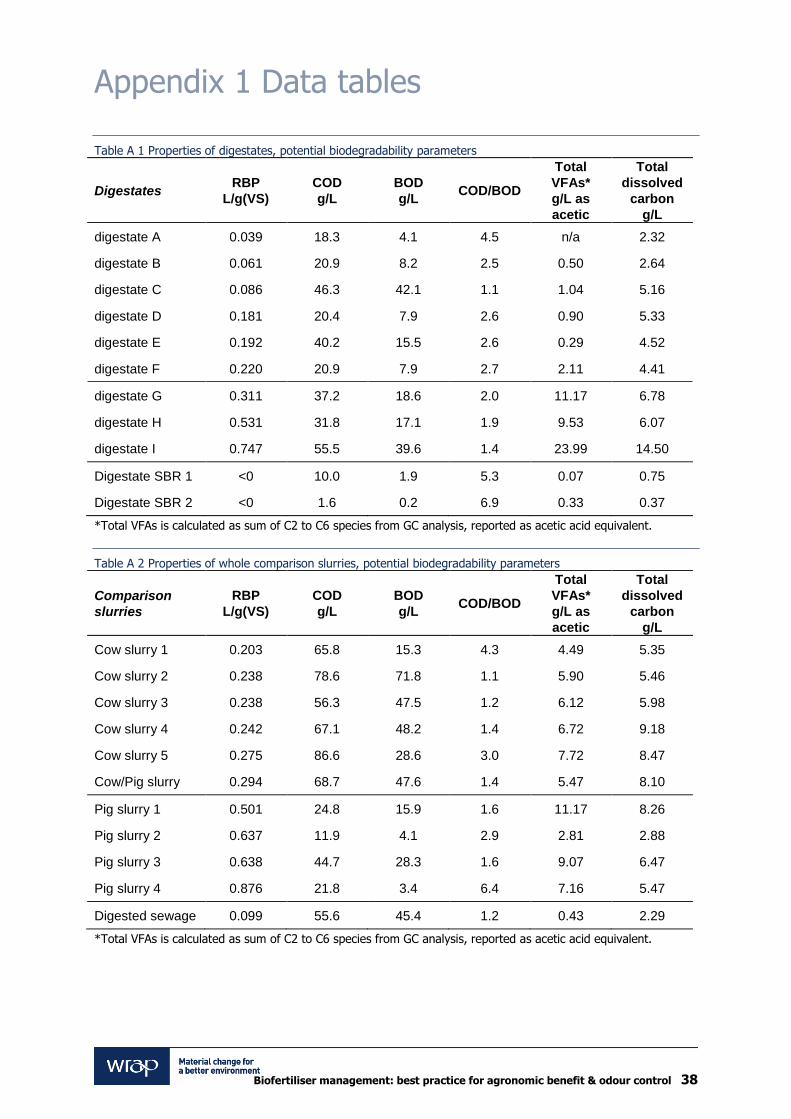
Biofertiliser management: best practice for agronomic benefit & odour control 38
Appendix 1 Data tables
Table A 1 Properties of digestates, potential biodegradability parameters
Digestates RBP
L/g(VS)
COD
g/L
BOD
g/L COD/BOD
Total
VFAs*
g/L as
acetic
Total
dissolved
carbon
g/L
digestate A 0.039 18.3 4.1 4.5 n/a 2.32
digestate B 0.061 20.9 8.2 2.5 0.50 2.64
digestate C 0.086 46.3 42.1 1.1 1.04 5.16
digestate D 0.181 20.4 7.9 2.6 0.90 5.33
digestate E 0.192 40.2 15.5 2.6 0.29 4.52
digestate F 0.220 20.9 7.9 2.7 2.11 4.41
digestate G 0.311 37.2 18.6 2.0 11.17 6.78
digestate H 0.531 31.8 17.1 1.9 9.53 6.07
digestate I 0.747 55.5 39.6 1.4 23.99 14.50
Digestate SBR 1 <0 10.0 1.9 5.3 0.07 0.75
Digestate SBR 2 <0 1.6 0.2 6.9 0.33 0.37
*Total VFAs is calculated as sum of C2 to C6 species from GC analysis, reported as acetic acid equivalent.
Table A 2 Properties of whole comparison slurries, potential biodegradability parameters
Comparison
slurries
RBP
L/g(VS)
COD
g/L
BOD
g/L COD/BOD
Total
VFAs*
g/L as
acetic
Total
dissolved
carbon
g/L
Cow slurry 1 0.203 65.8 15.3 4.3 4.49 5.35
Cow slurry 2 0.238 78.6 71.8 1.1 5.90 5.46
Cow slurry 3 0.238 56.3 47.5 1.2 6.12 5.98
Cow slurry 4 0.242 67.1 48.2 1.4 6.72 9.18
Cow slurry 5 0.275 86.6 28.6 3.0 7.72 8.47
Cow/Pig slurry 0.294 68.7 47.6 1.4 5.47 8.10
Pig slurry 1 0.501 24.8 15.9 1.6 11.17 8.26
Pig slurry 2 0.637 11.9 4.1 2.9 2.81 2.88
Pig slurry 3 0.638 44.7 28.3 1.6 9.07 6.47
Pig slurry 4 0.876 21.8 3.4 6.4 7.16 5.47
Digested sewage 0.099 55.6 45.4 1.2 0.43 2.29
*Total VFAs is calculated as sum of C2 to C6 species from GC analysis, reported as acetic acid equivalent.

Biofertiliser management: best practice for agronomic benefit & odour control 39
Table A 3 Odour potentials and associated gases from digestates
Digestates
Odour
potential
103 ouE/m
3
H2S
ppm
FID
ppm (CH4)
PID
ppm
(isobut.)
NH3
ppm
digestate A 5 0.1 2330 0.7 0.4
digestate B 8 1.7 2305 66.1 13.5
digestate C 575 138 9092 43.9 5.5
digestate D 133 22.7 5611 21.3 20.5
digestate E 4 0.4 6964 6.8 17.7
digestate F 888 150 0 0.0 n/a
digestate G 3 1.8 5465 5.6 1.6
digestate H 37 0.7 731 9.5 2.0
digestate I 5 0.4 1344 57.5 19.7
Digestate SBR 1 2 0.0 29 1.3 1.3
Digestate SBR 2 0.3 0.0 10 0.9 1.9
Table A 4 Odour potentials and associated gases from whole comparison slurries
Comparison slurries
Odour
potential
103 ouE/m
3
H2S
ppm
FID
ppm (CH4)
PID
ppm
(isobut.)
NH3
ppm
Cow slurry 1 639 187 4478 45.4 12.1
Cow slurry 2 3570 451 8391 119.7 3.3
Cow slurry 3 6550 1258 3779 288.4 4.5
Cow slurry 4 1840 40.8 988 59.9 13.1
Cow slurry 5 113 24.0 7197 23.1 15.3
Cow/Pig slurry 5730 1161 5123 369.5 10.4
Pig slurry 1 45000 3809 2539 672.8 4.1
Pig slurry 2 3940 1360 2187 298.1 0.0
Pig slurry 3 3010 692 2439 147.6 4.1
Pig slurry 4 8550 852 1615 257.1 0.1
Digested sewage 30 1.0 2774 14.4 3.0

Biofertiliser management: best practice for agronomic benefit & odour control 40
Table A 5 Digestates: Compounds identified by GC-MS analysis
Digestates
Meth
an
eth
iol
Bu
tan
oic
acid
Eth
an
al
Carb
on
Dis
ulp
hid
e
Dim
eth
yl
Su
lph
ide
Dim
eth
yl
Dis
ulp
hid
e
digestate A n.d. V Low n.d. V Low V Low n.d.
digestate B n.d. n.d. n.d. n.d. n.d. n.d.
digestate C n.d. n.d. n.d. n.d. n.d. n.d.
digestate D n.d. n.d. n.d. n.d. V Low Low
digestate E n.d. n.d. n.d. n.d. n.d. n.d.
digestate F V Low Med n.d. Med Low Low
digestate G V Low n.d. n.d. V Low n.d. V Low
digestate H n.d. n.d. n.d. Low Low Low
digestate I n.d. n.d. n.d. V Low V Low V Low
Digestate SBR 1 n.d. n.d. n.d. V Low V Low V Low
Digestate SBR 2 n.d. n.d. n.d. V Low V Low n.d.
n.d. = not detected
Table A 6 Whole comparison slurries, Compounds identified by GC-MS analysis
Comparison
slurries
Meth
an
eth
iol
Bu
tan
oic
acid
Eth
an
al
Carb
on
Dis
ulp
hid
e
Dim
eth
yl
Su
lph
ide
Dim
eth
yl
Dis
ulp
hid
e
Cow slurry 1 n.d. n.d. n.d. V Low V Low V Low
Cow slurry 2 n.d. n.d. n.d. V Low V Low V Low
Cow slurry 3 n.d. n.d. n.d. Med Low Low
Cow slurry 4 n.d. n.d. n.d. Low High Med
Cow slurry 5 n.d. n.d. n.d. V Low n.d. n.d.
Cow/Pig slurry n.d. n.d. n.d. Low High Med
Pig slurry 1 V Low n.d. n.d. V Low V Low V Low
Pig slurry 2 Low n.d. Low High High V High
Pig slurry 3 n.d. n.d. n.d. Low V Low V Low
Pig slurry 4 V Low n.d. n.d. Low Low Med
Digested sewage V Low n.d. n.d. V Low n.d. V Low
n.d. = not detected

Biofertiliser management: best practice for agronomic benefit & odour control 41
Table A 7 Properties of digestates
Digestates pH EC
mS/cm
Dry Matter
%
Loss on
Ignition
%DM
Volatile
Solids
%
digestate A 7.9 9.5 1.74 62.2 1.08
digestate B 7.7 12.6 4.50 66.8 3.01
digestate C 7.9 11.4 5.24 74.7 3.92
digestate D 8.4 21.2 2.81 61.5 1.73
digestate E 8.0 23.6 3.39 65.3 2.21
digestate F 8.3 18.7 1.70 59.4 1.01
digestate G 7.5 14.8 3.57 76.8 2.74
digestate H 7.8 15.7 2.05 63.9 1.31
digestate I 8.2 22.6 2.81 63.5 1.79
Digestate SBR 1 8.1 16.9 3.36 34.1 1.15
Digestate SBR 2 7.8 19.8 2.67 11.6 0.31
Table A 8 Properties of whole comparison slurries
Comparison slurries pH EC
mS/cm
Dry Matter
%
Loss on
Ignition
%DM
Volatile
Solids
%
Cow slurry 1 7.3 7.9 9.84 81.3 8.00
Cow slurry 2 7.2 8.1 7.35 79.3 5.83
Cow slurry 3 6.9 8.0 7.96 82.8 6.58
Cow slurry 4 7.5 10.3 9.57 81.9 7.83
Cow slurry 5 6.8 7.4 10.41 86.4 9.00
Cow/Pig slurry 7.5 11.1 10.03 52.2 5.23
Pig slurry 1 7.8 20.5 2.20 53.1 1.17
Pig slurry 2 7.3 7.0 1.05 63.5 0.66
Pig slurry 3 7.1 12.7 4.81 71.1 3.42
Pig slurry 4 7.2 11.8 1.57 57.4 0.90
Digested sewage 7.9 7.5 5.46 63.7 3.47

Biofertiliser management: best practice for agronomic benefit & odour control 42
Table A 9 digestates: Volatile fatty acids in solution (mg/L)
Digestates
aceti
c
pro
pan
oic
iso
-
bu
tyri
c
n-
bu
tyri
c
iso
-vale
ric
n-
vale
ric
hexan
oic
hep
tan
oic
octa
no
ic
digestate A n/a n/a n/a n/a n/a n/a n/a n/a n/a
digestate B 190 329 20 8 42 6 0 0 32
digestate C 960 69 10 7 12 0 18 0 117
digestate D 739 132 59 0 7 0 12 28 0
digestate E 275 0 16 0 0 0 0 0 909
digestate F 1366 619 202 55 47 37 28 59 85
digestate G 9169 819 248 440 1363 76 40 5 32
digestate H 6159 2657 642 244 812 199 34 6 232
digestate I 6609 17542 1502 568 2617 295 81 22 923
Digestate SBR 1 55 13 5 0 0 10 0 0 195
Digestate SBR 2 258 36 0 18 8 21 25 36 123
Table A 10 Whole comparison slurries, Volatile fatty acids in solution (mg/L)
Comparison
slurries
aceti
c
pro
pan
oic
ios
-
bu
tyri
c
n-
bu
tyri
c
iso
-
vale
ric
n-
vale
ric
hexan
oic
hep
tan
oic
octa
no
ic
Cow slurry 1 3377 845 128 253 192 61 35 24 5039
Cow slurry 2 4475 1014 184 423 210 71 39 9 528
Cow slurry 3 4593 1135 139 447 233 91 28 20 2726
Cow slurry 4 5315 1141 107 408 149 66 0 28 2382
Cow slurry 5 5168 2127 313 468 253 162 104 127 5146
Cow/Pig slurry 4607 582 96 265 197 47 0 59 9840
Pig slurry 1 8339 2257 339 503 590 106 39 7 247
Pig slurry 2 1809 609 102 363 184 98 41 22 822
Pig slurry 3 5605 2198 366 1093 645 297 271 61 2096
Pig slurry 4 4423 1499 244 993 447 294 473 34 125
Digested sewage 412 14 0 0 0 0 6 4 10

Biofertiliser management: best practice for agronomic benefit & odour control 43
Table A 11 Digestates: Ions in solution (mg/L)
Digestates Cl
mg/L
PO4
mg/L
NO3
mg/L
SO4
mg/L
Na
mg/L
NH4
mg/L
K
mg/L
Mg
mg/L
Ca
mg/L
digestate A 257 8 2 50 131 619 505 75 38
digestate B 972 10 2 <5 205 1058 904 <10 24
digestate C 542 27 2 13 308 971 1124 53 28
digestate D 488 71 2 10 980 3182 2217 <50 73
digestate E 938 11 <1 <5 444 2103 176 <50 <10
digestate F 263 86 13 8 <50 1795 322 82 170
digestate G 969 13 2 <5 310 1569 445 <10 21
digestate H 438 7 <1 <5 361 1223 546 <50 19
digestate I 1642 40 <1 14 242 1421 223 <50 12
Digestate SBR 1 564 52 768 105 2431 112 409 12 26
Digestate SBR 2 731 22 1542 118 1875 99 422 <10 49
Table A 12 Whole comparison slurries, Ions in solution (mg/L)
Comparison
slurries
Cl
mg/L
PO4
mg/L
NO3
mg/L
SO4
mg/L
Na
mg/L
NH4
mg/L
K
mg/L
Mg
mg/L
Ca
mg/L
Cow slurry 1 889 18 12 151 153 661 951 85 89
Cow slurry 2 275 4 11 48 142 688 913 75 10
Cow slurry 3 469 13 17 218 111 677 619 68 59
Cow slurry 4 569 12 24 625 260 990 1059 74 105
Cow slurry 5 674 16 19 269 <50 354 322 82 170
Cow/Pig slurry 475 18 22 1107 133 1156 1283 118 305
Pig slurry 1 1348 77 <1 <5 503 2115 892 <50 38
Pig slurry 2 360 36 13 126 70 454 285 <10 58
Pig slurry 3 278 40 11 28 170 1130 777 <50 70
Pig slurry 4 316 22 12 8 138 1044 541 14 43
Digested sewage 83 67 2 <5 85 768 363 <10 23

Biofertiliser management: best practice for agronomic benefit & odour control 44
Table A 13 digestates: carbon in solution
Digestates
Purgeable dissolved
carbon
mg/L
NPOC*
mg/L
Total dissolved
carbon
mg/L
digestate A 1141 1179 2320
digestate B 1619 1018 2637
digestate C 1451 3709 5160
digestate D 1710 3618 5328
digestate E 2049 2468 4517
digestate F 1645 2770 4414
digestate G 776 6009 6785
digestate H 1068 5000 6068
digestate I 1115 13380 14495
Digestate SBR 1 242 505 747
Digestate SBR 2 106 259 365
Table A 14 Whole comparison slurries, carbon in solution
Comparison slurries
Purgeable dissolved
carbon
mg/L
NPOC*
mg/L
Total dissolved
carbon
mg/L
Cow slurry 1 575 4777 5352
Cow slurry 2 422 5035 5457
Cow slurry 3 495 5487 5982
Cow slurry 4 749 8435 9184
Cow slurry 5 524 7946 8470
Cow/Pig slurry 637 7465 8102
Pig slurry 1 1441 6822 8263
Pig slurry 2 313 2563 2876
Pig slurry 3 511 5958 6469
Pig slurry 4 400 5070 5470
Digested sewage 902 1392 2293

Biofertiliser management: best practice for agronomic benefit & odour control 45
Table A 15 Nutrient content of digestates in dry matter
Digestates P
%DM
K
%DM
S
%DM
Ca
%DM
Mg
%DM
digestate A 1.01 11.35 0.83 2.78 1.48
digestate B 1.20 5.89 1.09 5.10 0.26
digestate C 1.05 6.57 0.74 2.53 0.80
digestate D 1.37 6.88 0.54 6.28 0.21
digestate E 1.82 2.43 1.23 2.42 0.32
digestate F 0.94 11.03 0.76 1.17 0.06
digestate G 1.18 5.34 0.49 2.66 0.58
digestate H 1.26 6.00 0.52 3.34 0.62
digestate I 0.75 6.68 0.40 2.30 0.09
Digestate SBR 1 0.42 5.71 0.35 0.56 0.06
Digestate SBR 2 0.09 8.60 0.20 0.26 0.05
i/s = insufficient sample
Table A 16 Nutrient content of digestates kg/m3
Digestates N
kg/m3
P2O5
kg/m3
K2O
kg/m3
SO3
kg/m3
Ca
kg/m3
MgO
kg/m3
digestate A 1.81 0.42 2.49 0.38 0.51 0.45
digestate B 4.11 1.27 3.28 1.26 2.36 0.20
digestate C 3.66 1.31 4.29 1.00 1.37 0.72
digestate D 4.64 0.89 2.37 0.39 1.79 0.10
digestate E 5.21 1.44 1.01 1.07 0.84 0.18
digestate F 4.32 0.37 2.28 0.33 0.20 0.02
digestate G 4.24 0.98 2.33 0.44 0.74 0.35
digestate H i/s 0.60 1.50 0.27 0.69 0.21
digestate I 6.16 0.61 2.86 0.36 0.82 0.05
Digestate SBR 1 0.79 0.33 2.36 0.30 0.15 0.05
Digestate SBR 2 0.74 0.05 2.81 0.13 0.06 0.02
i/s = insufficient sample

Biofertiliser management: best practice for agronomic benefit & odour control 46
Table A 17 Nutrient content of whole comparison slurries in dry matter
Comparison
slurries
P
%DM
K
%DM
S
%DM
Ca
%DM
Mg
%DM
Cow slurry 1 0.66 3.81 0.43 2.27 0.60
Cow slurry 2 0.57 3.76 0.34 1.87 0.50
Cow slurry 3 0.82 3.33 0.60 2.51 0.65
Cow slurry 4 0.61 4.14 0.63 2.35 0.58
Cow slurry 5 0.66 3.50 0.44 1.35 0.51
Cow/Pig slurry 0.67 4.40 5.54 13.92 0.75
Pig slurry 1 0.78 12.75 1.28 1.36 0.32
Pig slurry 2 1.45 8.54 1.00 3.70 0.69
Pig slurry 3 2.28 5.97 0.95 4.44 1.60
Pig slurry 4 2.20 10.83 0.77 5.20 1.63
Digested sewage 3.07 0.44 1.41 4.66 0.30
i/s = insufficient sample
Table A 18 Nutrient content of whole comparison slurries kg/m3
Comparison
slurries
N
kg/m3
P2O5
kg/m3
K2O
kg/m3
SO3
kg/m3
Ca
kg/m3
MgO
kg/m3
Cow slurry 1 3.41 1.49 4.52 1.07 2.23 0.98
Cow slurry 2 3.10 0.96 3.33 0.63 1.07 0.61
Cow slurry 3 3.46 1.53 3.24 1.22 2.03 0.88
Cow slurry 4 4.59 1.39 4.98 1.58 2.34 0.96
Cow slurry 5 4.20 1.57 4.39 1.15 1.40 0.89
Cow/Pig slurry 4.98 1.58 5.47 14.28 14.37 1.28
Pig slurry 1 4.73 0.40 3.45 0.72 0.31 0.12
Pig slurry 2 1.21 0.35 1.07 0.26 0.39 0.12
Pig slurry 3 4.05 2.52 3.47 1.14 2.14 1.29
Pig slurry 4 2.28 0.80 2.06 0.30 0.64 0.43
Digested sewage 4.32 3.93 0.29 1.96 2.29 0.27
i/s = insufficient sample
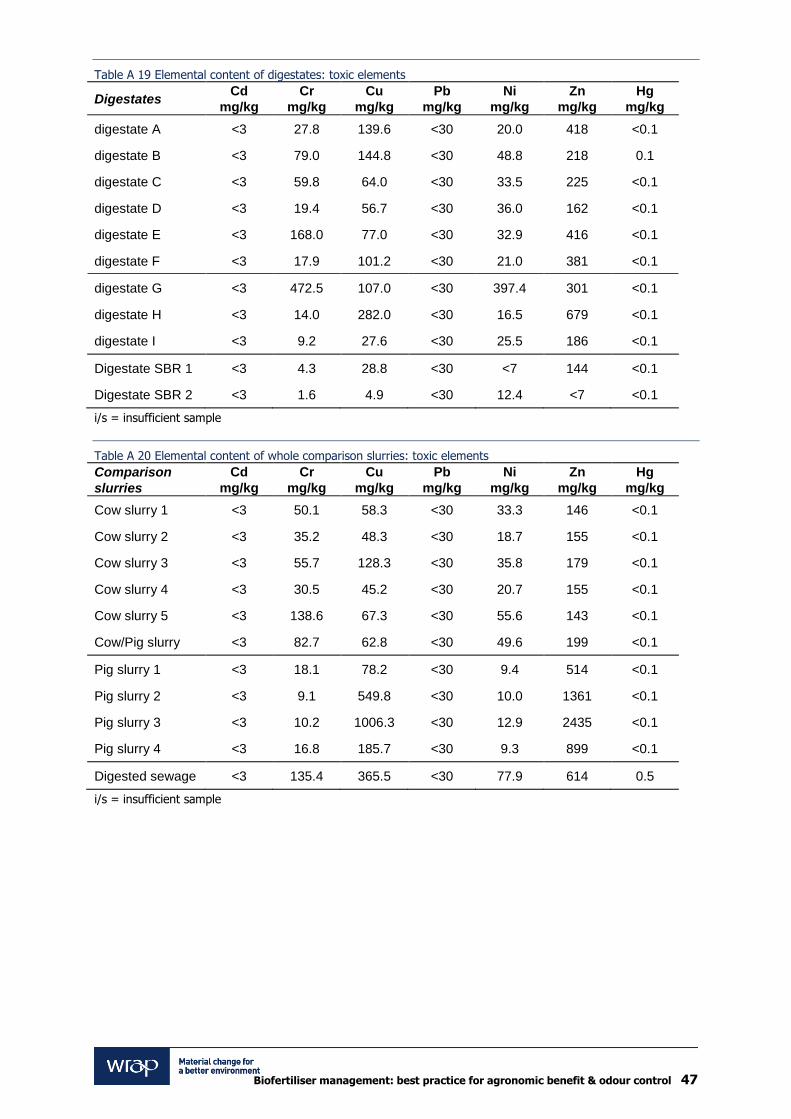
Biofertiliser management: best practice for agronomic benefit & odour control 47
Table A 19 Elemental content of digestates: toxic elements
Digestates Cd
mg/kg
Cr
mg/kg
Cu
mg/kg
Pb
mg/kg
Ni
mg/kg
Zn
mg/kg
Hg
mg/kg
digestate A <3 27.8 139.6 <30 20.0 418 <0.1
digestate B <3 79.0 144.8 <30 48.8 218 0.1
digestate C <3 59.8 64.0 <30 33.5 225 <0.1
digestate D <3 19.4 56.7 <30 36.0 162 <0.1
digestate E <3 168.0 77.0 <30 32.9 416 <0.1
digestate F <3 17.9 101.2 <30 21.0 381 <0.1
digestate G <3 472.5 107.0 <30 397.4 301 <0.1
digestate H <3 14.0 282.0 <30 16.5 679 <0.1
digestate I <3 9.2 27.6 <30 25.5 186 <0.1
Digestate SBR 1 <3 4.3 28.8 <30 <7 144 <0.1
Digestate SBR 2 <3 1.6 4.9 <30 12.4 <7 <0.1
i/s = insufficient sample
Table A 20 Elemental content of whole comparison slurries: toxic elements
Comparison
slurries
Cd
mg/kg
Cr
mg/kg
Cu
mg/kg
Pb
mg/kg
Ni
mg/kg
Zn
mg/kg
Hg
mg/kg
Cow slurry 1 <3 50.1 58.3 <30 33.3 146 <0.1
Cow slurry 2 <3 35.2 48.3 <30 18.7 155 <0.1
Cow slurry 3 <3 55.7 128.3 <30 35.8 179 <0.1
Cow slurry 4 <3 30.5 45.2 <30 20.7 155 <0.1
Cow slurry 5 <3 138.6 67.3 <30 55.6 143 <0.1
Cow/Pig slurry <3 82.7 62.8 <30 49.6 199 <0.1
Pig slurry 1 <3 18.1 78.2 <30 9.4 514 <0.1
Pig slurry 2 <3 9.1 549.8 <30 10.0 1361 <0.1
Pig slurry 3 <3 10.2 1006.3 <30 12.9 2435 <0.1
Pig slurry 4 <3 16.8 185.7 <30 9.3 899 <0.1
Digested sewage <3 135.4 365.5 <30 77.9 614 0.5
i/s = insufficient sample

Biofertiliser management: best practice for agronomic benefit & odour control 48
Appendix 2 Hedonic tone graphs
20110201 w29-1a
-4.00
-3.00
-2.00
-1.00
0.00
0.0 10.0 20.0 30.0 40.0
Odour concentration ouE/m3
He
do
nic
sc
ore
20110201 w29-1b
-4
-3
-2
-1
0
0.0 5.0 10.0 15.0 20.0 25.0 30.0
Odour concentration ouE/m3
He
do
nic
sc
ore
20110201 w29-2a
-4
-3
-2
-1
0
0.0 20.0 40.0 60.0 80.0
Odour concentration ouE/m3
He
do
nic
sc
ore

Biofertiliser management: best practice for agronomic benefit & odour control 49
20110201 w29-2b
-4
-3
-2
-1
0
0.0 10.0 20.0 30.0 40.0
Odour concentration ouE/m3
He
do
nic
sc
ore
20110214 w29-2
-4.00
-3.00
-2.00
-1.00
0.00
0.0 20.0 40.0 60.0 80.0
Odour concentration ouE/m3
He
do
nic
sc
ore
20110214 w29-3
-4.00
-3.00
-2.00
-1.00
0.00
0.0 2.0 4.0 6.0 8.0 10.0 12.0
Odour concentration ouE/m3
Hed
on
ic s
co
re

Biofertiliser management: best practice for agronomic benefit & odour control 50
20110214 w29-4
-4.00
-3.00
-2.00
-1.00
0.00
0.0 5.0 10.0 15.0 20.0
Odour concentration ouE/m3
Hed
on
ic s
co
re
20110214 w29-5
-4.00
-3.00
-2.00
-1.00
0.00
0.0 10.0 20.0 30.0 40.0 50.0 60.0
Odour concentration ouE/m3
Hed
on
ic s
co
re
20110214 w29-6
-4.00
-3.00
-2.00
-1.00
0.00
0.0 20.0 40.0 60.0 80.0 100.0 120.0 140.0
Odour concentration ouE/m3
Hed
on
ic s
co
re

Biofertiliser management: best practice for agronomic benefit & odour control 51
20110214 w29-7
-4.00
-3.00
-2.00
-1.00
0.00
0.0 10.0 20.0 30.0 40.0 50.0 60.0
Odour concentration ouE/m3
Hed
on
ic s
co
re
20110214 w29-9
-4.00
-3.00
-2.00
-1.00
0.00
0.0 10.0 20.0 30.0 40.0
Odour concentration ouE/m3
He
do
nic
sc
ore
20110214 w29-10
-4.00
-3.00
-2.00
-1.00
0.00
0.0 20.0 40.0 60.0 80.0 100.0
Odour concentration ouE/m3
Hed
on
ic s
co
re

Biofertiliser management: best practice for agronomic benefit & odour control 52
20110214 w29-11
-4.00
-3.00
-2.00
-1.00
0.00
0.0 50.0 100.0 150.0 200.0
Odour concentration ouE/m3
Hed
on
ic s
co
re
20110214 w29-12
-4.00
-3.00
-2.00
-1.00
0.00
0.0 2.0 4.0 6.0 8.0 10.0 12.0 14.0
Odour concentration ouE/m3
Hed
on
ic s
co
re
20110214 w29-13
-4.00
-3.00
-2.00
-1.00
0.00
0.0 5.0 10.0 15.0
Odour concentration ouE/m3
Hed
on
ic s
co
re

Biofertiliser management: best practice for agronomic benefit & odour control 53
20110214 w29-14
-4.00
-3.00
-2.00
-1.00
0.00
0.0 20.0 40.0 60.0 80.0 100.0
Odour concentration ouE/m3
Hed
on
ic s
co
re
20110218 w7L
-4.00
-3.00
-2.00
-1.00
0.00
0.0 20.0 40.0 60.0 80.0 100.0
Odour concentration ouE/m3
Hed
on
ic s
co
re
20110218 w7F
-4.00
-3.00
-2.00
-1.00
0.00
0.0 2.0 4.0 6.0 8.0
Odour concentration ouE/m3
Hed
on
ic s
co
re

Biofertiliser management: best practice for agronomic benefit & odour control 54
20110218 W8
-4.00
-3.00
-2.00
-1.00
0.00
0.0 10.0 20.0 30.0 40.0 50.0
Odour concentration ouE/m3
Hed
on
ic s
co
re
20110218 w13L
-4.00
-3.00
-2.00
-1.00
0.00
0.0 2.0 4.0 6.0 8.0 10.0
Odour concentration ouE/m3
Hed
on
ic s
co
re
20110218 w13F
-4
-3
-2
-1
0
0.0 5.0 10.0 15.0 20.0
Odour concentration ouE/m3
Hed
on
ic s
co
re

Biofertiliser management: best practice for agronomic benefit & odour control 55
20110218 w14L
-4
-3
-2
-1
0
0.0 50.0 100.0 150.0 200.0 250.0
Odour concentration ouE/m3
Hed
on
ic s
co
re
20110218 w14F
-4.00
-3.00
-2.00
-1.00
0.00
0.0 1.0 2.0 3.0 4.0
Odour concentration ouE/m3
Hed
on
ic s
co
re
20110218 w15
-4
-3
-2
-1
0
0.0 10.0 20.0 30.0 40.0 50.0
Odour concentration ouE/m3
Hed
on
ic s
co
re

Biofertiliser management: best practice for agronomic benefit & odour control 56
20110218 w16w
-4
-3
-2
-1
0
0.0 5.0 10.0 15.0 20.0
Odour concentration ouE/m3
Hed
on
ic s
co
re
20110218 w16L
-4.00
-3.00
-2.00
-1.00
0.00
0.0 5.0 10.0 15.0 20.0
Odour concentration ouE/m3
Hed
on
ic s
co
re
20110221 w29-16f
-4.00
-3.00
-2.00
-1.00
0.00
0.0 2.0 4.0 6.0 8.0 10.0
Odour concentration ouE/m3
He
do
nic
sc
ore

Biofertiliser management: best practice for agronomic benefit & odour control 57
20110221 w29-17
-4.00
-3.00
-2.00
-1.00
0.00
0.0 10.0 20.0 30.0 40.0
Odour concentration ouE/m3
Hed
on
ic s
co
re
20110221 w29-18
-4.00
-3.00
-2.00
-1.00
0.00
0.0 5.0 10.0 15.0
Odour concentration ouE/m3
Hed
on
ic s
co
re
20110221 w29-19
-4.00
-3.00
-2.00
-1.00
0.00
0.0 10.0 20.0 30.0 40.0
Odour concentration ouE/m3
Hed
on
ic s
co
re

Biofertiliser management: best practice for agronomic benefit & odour control 58
20110221 w29-20f
-4.00
-3.00
-2.00
-1.00
0.00
0.0 2.0 4.0 6.0 8.0 10.0
Odour concentration ouE/m3
Hed
on
ic s
co
re
20110221 w29-20L
-4.00
-3.00
-2.00
-1.00
0.00
0.0 5.0 10.0 15.0 20.0 25.0 30.0 35.0
Odour concentration ouE/m3
Hed
on
ic s
co
re
20110221 w29-20w
-4.00
-3.00
-2.00
-1.00
0.00
0.0 2.0 4.0 6.0 8.0 10.0 12.0 14.0
Odour concentration ouE/m3
He
do
nic
sc
ore

Biofertiliser management: best practice for agronomic benefit & odour control 59
20110221 w29-21
-4.00
-3.00
-2.00
-1.00
0.00
0.0 2.0 4.0 6.0 8.0
Odour concentration ouE/m3
Hed
on
ic s
co
re
20110329 w29-08
-4.00
-3.00
-2.00
-1.00
0.00
0.0 2.0 4.0 6.0 8.0 10.0 12.0
Odour concentration ouE/m3
He
do
nic
sc
ore
20110329 w29-22
-4.00
-3.00
-2.00
-1.00
0.00
0.0 1.0 2.0 3.0 4.0 5.0
Odour concentration ouE/m3
He
do
nic
sc
ore

Biofertiliser management: best practice for agronomic benefit & odour control 60
Appendix 3
Open University methods
All samples were delivered to the laboratory within 24 hours and refrigerated stored at 0 to 4oC for the minimum storage time possible (BS12176). Five selected samples were separated into liquor and fibre fractions by passing through a 1mm sieve, and if feasible a 0.5mm sieve. The separated fractions were weighed. Odour measurement was carried out by Silsoe odours using a standard “odour potential” extraction. Additional analysis of the gas collected was carried out at the Open University. VOCs were collected from 1L gas on sorbent tubes using Tenax TA and analysed by thermal-desorption GC-MS. Also H2S was analysed by Jerome X731 for levels up to 50ppm, and using a Draeger X-am 7000 and dilution as necessary for higher levels. Ammonia was measured by Gasmet FTIR, which also allowed other gases to be quantified including NOx, CH4. Total VOC indices
by FIC and PID were tested on a Thermo TVA toxic gas analyser if sufficient gas remained. Biodegradability under anaerobic conditions was measured by production of biogas according to the PAS100 Residual Biogas Potential test (Walker et al., 2010). Dry matter was determined by drying at 103º C and organic carbon by loss on ignition at 550 ºC (BS12879). A Kjeldahl digestion modified to include nitrates was used for total N (BS13654-1). Aqua regia digests for total elements (BSI 2001/1) were analysed for major and trace elements by ion-coupled plasma atomic emission spectrometry (BSI, 1998) on a Leeman Prodigy ICP-AES. Mercury was analysed on the digest on a Leeman Hydra AF Gold+ mercury analyser. Biological and chemical oxygen demand (BOD, COD) were measured by Aqua Enviro Ltd using in house methods, see below. A clear solution of each whole sludge was prepared by centrifugation and filtration to <0.45 µm. Volatile fatty
acids were measured on a mixture of clear solution and phosphoric acid by GC-FID (Shimadzu News 3/2007). Ions in solution including NH4, K, Ca and Mg were analysed on a Dionex DX3000 ion chromatograph. Total dissolved organic carbon was measured on a Shimadzu TOC ASI-V total organic carbon analyser. A pre-treatment with acid and purging with carbon-free air was used as for inorganic carbon, though as this may include some volatile fatty acids, it is termed purgeable carbon. The remaining carbon in solution was measured as non-purgeable organic carbon. Reference: Walker, M., Banks, C., Heaven, S., and Frederickson, J. (2010). Development and evaluation of a method for testing the residual biogas potential of digestates. Published by WRAP OFW004-005. ISBN: 1-84405-421-7.

Biofertiliser management: best practice for agronomic benefit & odour control 61
Aqua Enviro COD Method
Reagents 1.
Substance Hazard Protective measures
First Aid
Digestion reagent
TOXIC IRRITANT
CORROSIVE
May cause cancer May cause heritable genetic
damage Harmful by inhalation in contact with skin and
swallowed Danger of cumulative effects
Causes severe burns Harmful to aquatic
organisms, may cause long-term adverse effect on aquatic environment.
Wear gloves and eye
protection. Avoid
inhalation
SKIN: removed contaminated clothing, wash skin up to 10
mins. If severe obtain medical atttention
EYES: irrigate with water for 20 mins. OBTAIN MEDICAL
ATTENTION In case of accident or feeling
unwell seek medical advice with label from box is possible
Procedure 2. PUT ON GLOVES AND EYE PROTECTION a. Shake the sample well b. Carefully remove the cap from the COD digestion reagent vial for the appropriate range.
Range
Low 0-150mg/l
Medium 0-1500mg/l
High 0-15000mg/l
c. Hold the vial at a 45° angle d. Add 2ml of sample to the low and medium range vials or 0.2ml to the high range vials. e. Replace the cap tightly f. Hold the vial by the cap and invert several times to mix the contents g. Place in a heating block at 150°c for 2 hours h. Prepare a blank using distilled water in the same way, again using 2ml for the low and medium
range and 0.2ml for the high range and place in the heating block i. After 2 hours remove and allow to cool for 5 minutes before inverting again to mix j. Leave until room temperature.
To read the vials – Low Range 3.
k. Use program 16 on the DR890 for the low range vials. l. Press 7 (PGRM) m. Press 1 and 6 and Enter the display will show mg/l COD n. Insert the COD/TNT adapter o. Clean the outside of the blank vial with a paper towel p. Place blank in the adaptor and cover with the lid q. Press ZERO display will show 0mg/l COD r. Clean the outside of the sample with a paper towel s. Place sample in the adaptor and cover with the lid t. Press READ value in mg/l will be displayed (Press CONC to view in other units)
To read the vials – Medium and high range 4.
u. Use program 17 on the DR890 for the low range vials. v. Press 7 (PGRM) w. Press 1 and 7 and Enter the display will show mg/l COD x. Insert the COD/TNT adapter y. Clean the outside of the blank vial with a paper towel

Biofertiliser management: best practice for agronomic benefit & odour control 62
z. Place blank in the adaptor and cover with the lid aa. Press ZERO display will show 0mg/l COD bb. Clean the outside of the sample with a paper towel cc. Place sample in the adaptor and cover with the lid dd. Press READ value in mg/l will be displayed (Press CONC to view in other units) ee. Multiply the value by 10 for the high range vials
Interferences 5. Chloride is the most common cause of interference and the vial can turn cloudy if too high a level of chloride is present. Mercuric sulphate is present in the vials and this can eliminate chloride up to the concentration shown in the table below, if this is exceeded it can be possible to add 0.50g mercuric sulphate and this will raise the maximum concentration to that shown in the second column
Maximum Cl- concentration
in sample
Maximum Cl- concentration, with addition of 0.50 mercuric
sulphate
Low range 2000mg/l 8000mg/l
Medium range 2000mg/l 4000mg/l
High range 20,000mg/l 40,000mg/l
Blanks 6.The blank may be repeatedly used for measurements using the same lot of vials. It should be stored in the dark. Monitor decomposition by measuring the absorbance at the appropriate wavelength (420 or 610nm). Zero the instrument in the absorbance mode, using a vial containing 5ml of deionised water and measure the absorbance of the blank. Record the value. Prepare a new blank when the absorbance has changed by about 0.01 absorbance units.

Biofertiliser management: best practice for agronomic benefit & odour control 63
Aqua Enviro BOD Method
1. Reagents a. Phosphate buffer (BOD/a) b. Magnesium sulphate solution (BOD/b) c. Calcium chloride solution (BOD/c) d. Ferric chloride solution (BOD/d)
Substance Hazard Protective measures
First Aid Spillage Procedures
Phosphate Buffer
Solution
None assigned at this
concentration
Standard lab procedures
Standard lab procedures Dilute with water and run to waste
Magnesium sulphate solution
None assigned at this
concentration
Standard lab procedures
Standard lab procedures Dilute with water and run to waste
Calcium chloride
Irritating to eyes
Standard lab procedures
EYES: irrigate with plenty of water. If
severe obtain medical attention
Dilute with water and run to waste
Ferric chloride solution
Irritating to eyes
Standard lab procedures
EYES: irrigate with plenty of water. If
severe obtain medical attention
Dilute with water and run to waste
Place sufficient distilled water in a container for the number of BOD bottles you are using and add 1ml of each nutrient solution for every 1l of water. Aerate for at least 1 hour; the temperature of water should be 20 ±3°c, if necessary the container should be placed in warmer or colder water to achieve this.
2. Calibrating dissolved oxygen meter. e. Ensure the DO probe tip is free of water. Place the probe tightly into a BOD bottle half full of water
and leave for 15minutes. During this time, the air above the water will saturate with water vapour, this is the equivalent of oxygen-saturated water, which has a fixed DO content at a given temperature.
f. Turn on the DO meter, press the right hand button on the top row to enter the calibration menu, then press the left hand button to automatically calibrate, it should then display DO calibration saved on the screen.
g. It is imperative that all equipment used in the test is clean and free from organics to avoid contamination.
h. The table shows concentration of dissolved oxygen at saturation for a range of temperatures. This
is a guide and the values alter according to the altitude. If the DO probe has a vastly different value then the calibration should be checked.
Temperature C
Dissolved oxygen (saturated) mg/l
15 10.1
16 9.8
17 9.6
18 9.4
19 9.2
20 9.1
21 8.9
22 8.7
23 8.6
24 8.4
25 8.3
26 8.1

Biofertiliser management: best practice for agronomic benefit & odour control 64
3. Dilution of samples
i. The samples must be diluted in the bottle with the dilution water (check with COD test to find
approximate strength). Approximately for domestic wastewater BOD=COD/2. Industrial samples can be higher or lower than this carrying out the BOD test with couple of dilutions can eliminate any problems).
Expected BOD range (mg O2/l)
Volume of sample to be diluted to 275ml in BOD bottle (ml)
0-21 100
12-42 50
30-105 20
60-210 10
120-420 5
300-1050 2
600-2100 1
1200-4200 0.5
j. If the expected BOD is greater than this range, additional dilution should be carried out prior to the
BOD test. Record any additional dilution and use it in the final calculation. k. Samples should be warmed to room temperature if you are using 50ml of sample of more.
4. Procedure
l. You need 1 bottle per sample and an extra 1 for a blank. Label each of these appropriately and half fill them all with dilution water.
m. Add 1ml of ATU mixture to each bottle. n. Consulting the above table decide which dilutions are appropriate for the sample and pipette or use
a measuring cylinder to insert the required volume of sample into the bottle. Fill all the bottles to the top with dilution water. Tap the bottles to get trapped air bubbles to rise to the surface.
o. One by one take the bottles and measure the DO concentration of the contents as follows. i. If the probe does not have a stirrer then a magnetic one must be added to the bottle before
measurement, ii. Rinse the probe with distilled water and place it carefully in the bottle avoiding the entrapment
of air bubbles. Switch on the stirrer and wait for the display to equilibrate. Record the reading (this should be similar to the value you got when the calibration was carried out if it isn‟t there may be a problem with the calibration or the temperature of the water/sample).
p. Remove the probe and refill the bottle very carefully with dilution water and put the top on. Invert the bottle to see if there are any air bubbles; if so they must be removed by removing the stopper and topping the bottle up again.
q. Place all bottles in the BOD incubator, this is set at 20c and is dark to prevent the growth of algae.
Leave for 5 days. r. After 5 days, remove the samples from the incubator and measure the DO content of each by
removing the stopper and placing the probe into the sample without introducing any air bubbles.
5. Calculation of BOD5
BOD5 = dDODO 21
Where: DO1 = initial dissolved oxygen reading DO2 = final dissolved oxygen reading after 5 days
d = dilution factor = sampleofvolume
275
The blank should not have a BOD of >0.5mg/l if it does then the other results are not valid and the analysis should be repeated.

www.wrap.org.uk/agriculture