final report assessment of thermal pollution … · 2019-06-18 · final report assessment of...
TRANSCRIPT
Final Report
ASSESSMENT OF THERMAL POLLUTION ASSOCIATED RIPARIAN CANOPY CLEARING
Prepared by
Daniel E. Line, PE
NC State University Biological and Agricultural Engineering Dept.
Box 7625, 3110 Faucette Drive Raleigh, NC 27695
August 15, 2013
2
TECHNICAL REPORT DOCUMENTATION PAGE 1. Report No.
2. Government Accession No.
3. Recipient’s Catalog No.
4. Title and Subtitle
Assessment of Thermal Pollution Associated With Riparian Canopy Clearing
5. Report Date
Aug. 15, 2013 6. Performing Organization Code
7. Author(s)
Daniel E. Line
8. Performing Organization Report No.
9. Performing Organization Name and Address
NCSU Biological & Agricultural Engineering Dept. NC State University Box 7625, 3110 Faucette Dr. Room 200 Raleigh, NC 27695
10. Work Unit No. (TRAIS)
11. Contract or Grant No.
12. Sponsoring Agency Name and Address
North Carolina Department of Transportation Research and Analysis Group 104 Fayetteville Street Raleigh, NC 27601
13. Type of Report and Period Covered
Final Report 8/16/10-8/15/13
14. Sponsoring Agency Code RP 2011-14
15. Supplementary Notes
16. Abstract
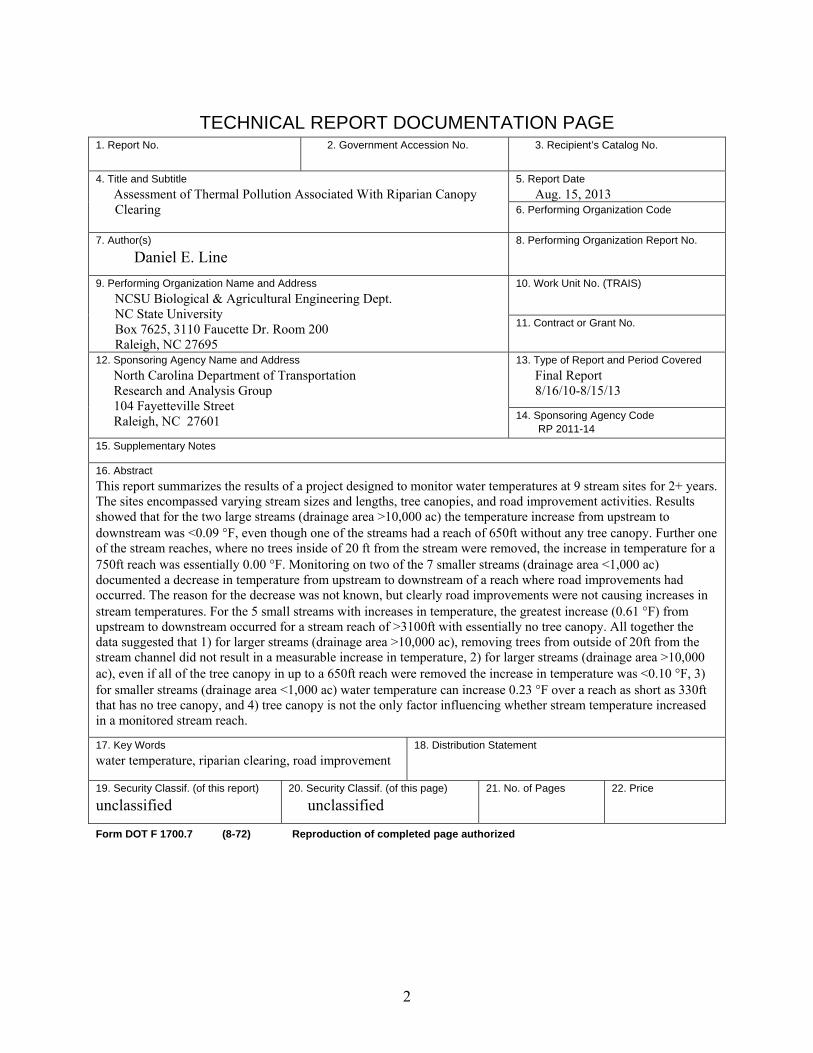
This report summarizes the results of a project designed to monitor water temperatures at 9 stream sites for 2+ years. The sites encompassed varying stream sizes and lengths, tree canopies, and road improvement activities. Results showed that for the two large streams (drainage area >10,000 ac) the temperature increase from upstream to downstream was <0.09 °F, even though one of the streams had a reach of 650ft without any tree canopy. Further one of the stream reaches, where no trees inside of 20 ft from the stream were removed, the increase in temperature for a 750ft reach was essentially 0.00 °F. Monitoring on two of the 7 smaller streams (drainage area <1,000 ac) documented a decrease in temperature from upstream to downstream of a reach where road improvements had occurred. The reason for the decrease was not known, but clearly road improvements were not causing increases in stream temperatures. For the 5 small streams with increases in temperature, the greatest increase (0.61 °F) from upstream to downstream occurred for a stream reach of >3100ft with essentially no tree canopy. All together the data suggested that 1) for larger streams (drainage area >10,000 ac), removing trees from outside of 20ft from the stream channel did not result in a measurable increase in temperature, 2) for larger streams (drainage area >10,000 ac), even if all of the tree canopy in up to a 650ft reach were removed the increase in temperature was <0.10 °F, 3) for smaller streams (drainage area <1,000 ac) water temperature can increase 0.23 °F over a reach as short as 330ft that has no tree canopy, and 4) tree canopy is not the only factor influencing whether stream temperature increased in a monitored stream reach.
17. Key Words
water temperature, riparian clearing, road improvement 18. Distribution Statement
19. Security Classif. (of this report)
unclassified
20. Security Classif. (of this page)
unclassified
21. No. of Pages
22. Price
Form DOT F 1700.7 (8-72) Reproduction of completed page authorized
3
ACKNOWLEDGEMENTS
This project was funded by the NC Department of Transportation (RP-2011-14). The
guidance and assistance of members of the steering and implementation committee, especially Heath Slaughter, toward the completion of the project was much appreciated.
Additionally, monitoring help from NCSU personnel including James Blackwell was invaluable toward the completion of this project.
DISCLAIMER
The contents of this report reflect the views of the author(s) and not necessarily the views of the University. The author(s) are responsible for the facts and the accuracy of the data presented herein. The contents do not necessarily reflect the official views or policies of either the North Carolina Department of Transportation or the Federal Highway Administration at the time of publication. This report does not constitute a standard, specification, or regulation.
4
SUMMARY Water temperature is an important component of habitat for many aquatic organisms. The
temperature of stream discharge has been shown to increase significantly in some cases when the riparian tree canopy is removed. The magnitude of the temperature increase is a function of many factors including length of reach with no canopy, discharge, stream width/depth ratio, and stream gradient/velocity. This project was designed to monitor stream temperatures at 10 sites (5 intensive monitoring and 5 less intensive) that will include several combinations of the factors listed above. Results showed that for the two large streams (drainage area >10,000 ac) the temperature increase from upstream to downstream was <0.09 °F, even though one of the streams had a reach of 650ft without any tree canopy. For the other larger stream, Beaver Creek, no trees inside of 20-30ft from the stream were removed and the increase in temperature for a 750ft reach was essentially 0.00 °F. Monitoring on two of the 7 smaller streams (drainage area <1,000 ac) documented a decrease in temperature from upstream to downstream of a reach where road improvements had occurred. The reason for the decrease was not known, but clearly road improvements were not causing increases in stream temperatures. For the small streams with increases in temperature, Wallace Branch had the greatest increase (0.61 °F), which was expected given that the distance between the monitoring stations was >3100ft with essentially no tree canopy. All together the data suggested that 1) for larger streams (drainage area >10,000 ac), removing trees from outside of 20ft from the stream channel did not result in a measurable increase in temperature, 2) for larger streams (drainage area >10,000 ac), even if all of the tree canopy in up to a 650ft reach were removed the increase in temperature was <0.10 °F, 3) for smaller streams (drainage area <1,000 ac) water temperature can increase 0.23 °F over a reach as short as 330ft that has no tree canopy, 4) tree canopy is not the only factor influencing whether stream temperature increases in a stream reach, and 5) additional research is needed where stream temperature is monitored before during and after road improvement to more definitively document the effects of riparian canopy reductions on stream temperatures.
5
TABLE OF CONTENTS
Contents TECHNICAL REPORT DOCUMENTATION PAGE .................................................................. 2 DISCLAIMER ................................................................................................................................ 3 SUMMARY .................................................................................................................................... 4 TABLE OF CONTENTS ................................................................................................................ 5 INTRODUCTION .......................................................................................................................... 6 METHODOLOGY AND PROCEDURES ..................................................................................... 7 RESULTS ....................................................................................................................................... 8
Beaver Creek Site ....................................................................................................................... 8 Raccoon Creek Site ..................................................................................................................... 9 Little Windfall Branch Site ......................................................................................................... 9 SR1169-trib Site........................................................................................................................ 10 SR1169 Site (West Fork Pine Swamp) ..................................................................................... 10 Wallace Branch Site .................................................................................................................. 11 Cranberry Creek Site ................................................................................................................. 12 Brummetts Creek Site ............................................................................................................... 13 Bear Wallow Site ...................................................................................................................... 14 Comparisons Between Sites ...................................................................................................... 15
SUMMARY AND CONCLUSIONS ........................................................................................... 15 CITED REFERENCES ................................................................................................................. 16 LIST OF TABLES ........................................................................................................................ 17
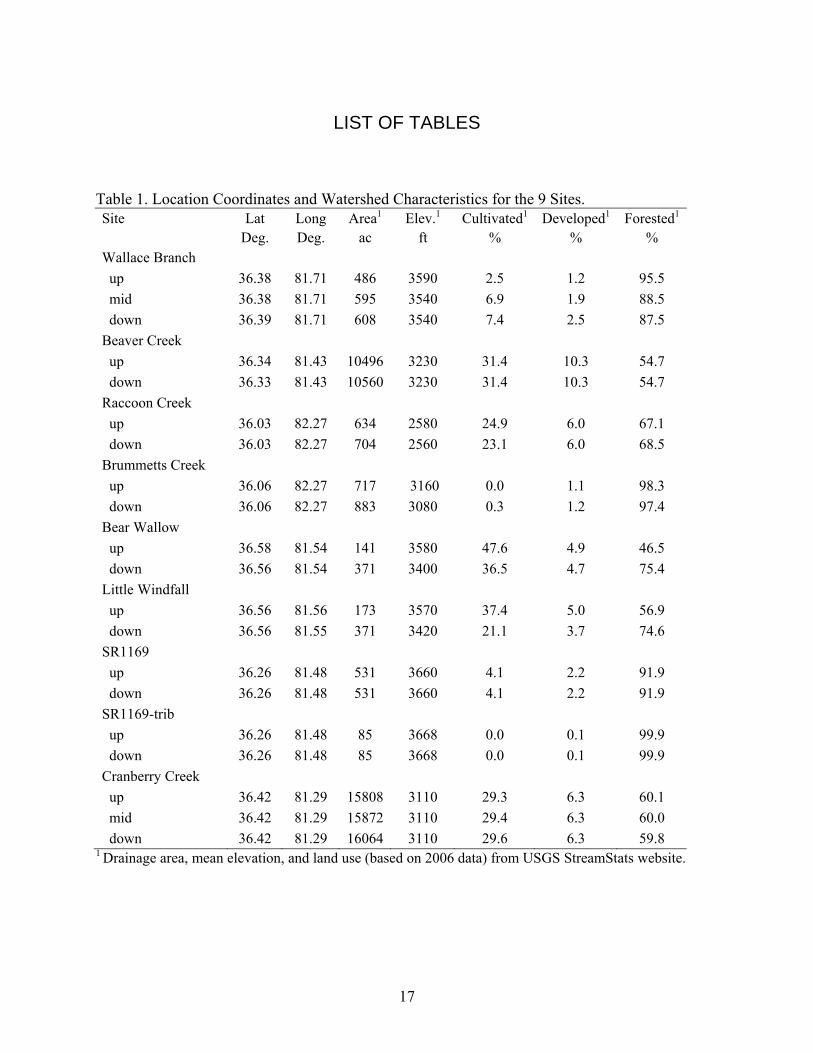
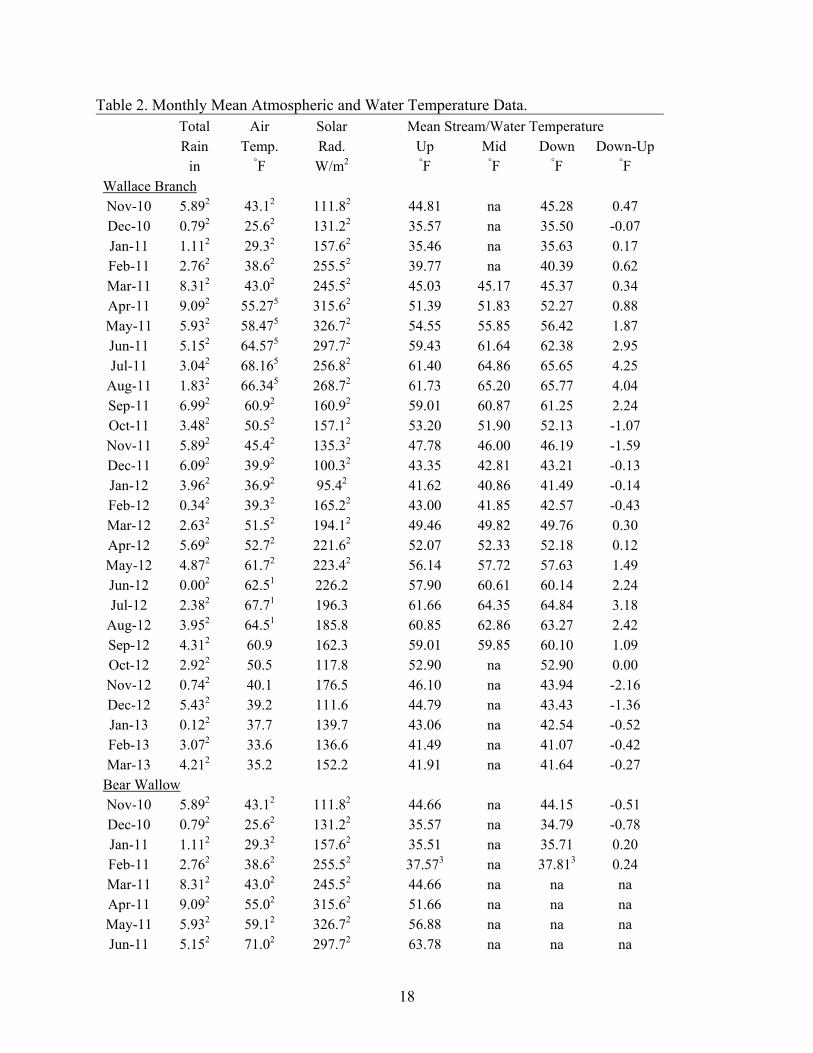
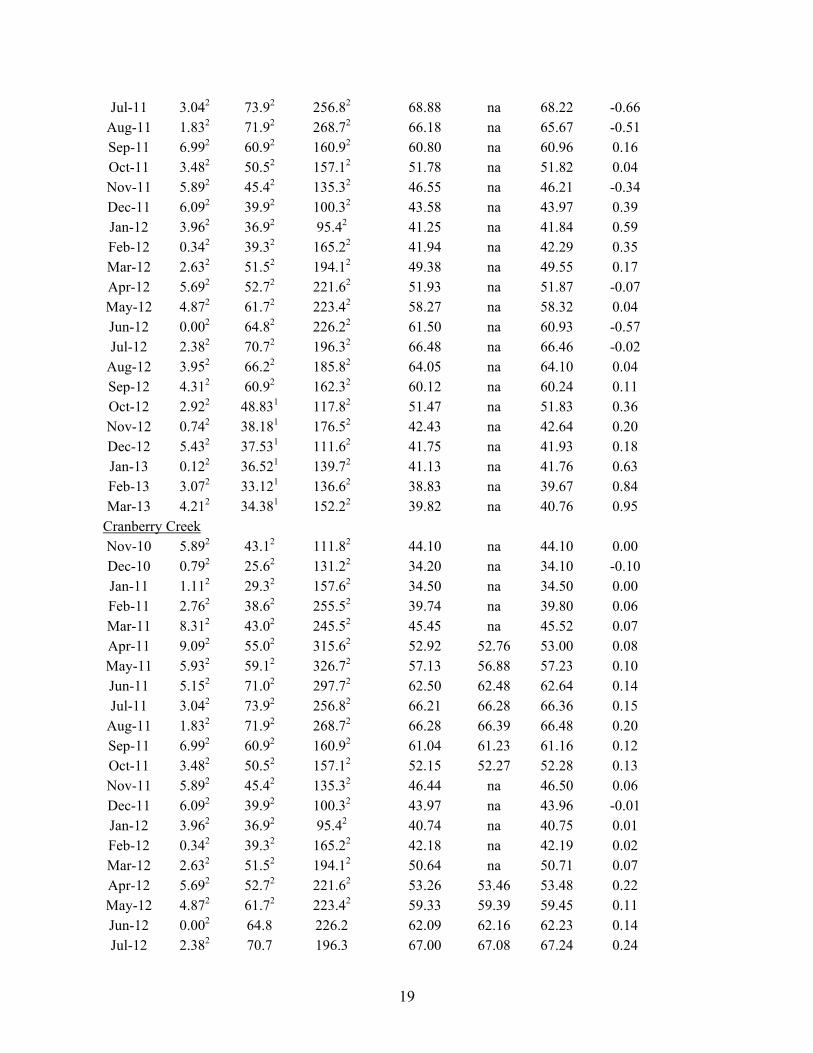
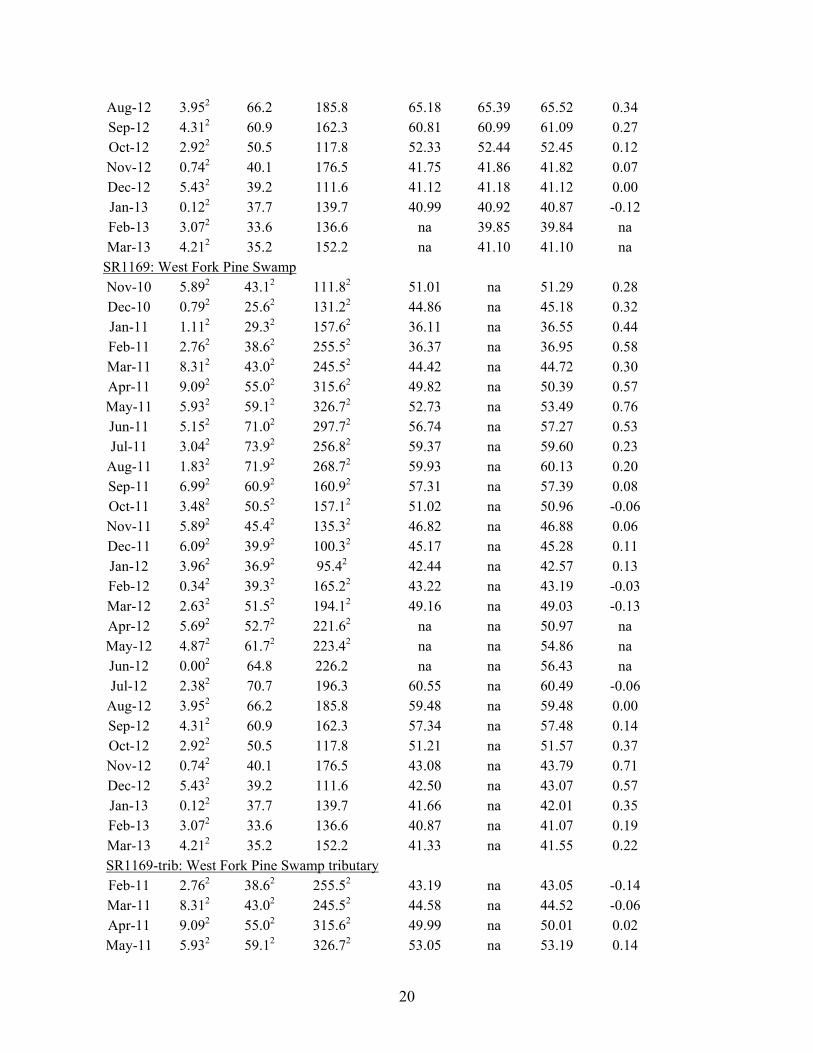
Table 1. Location Coordinates and Watershed Characteristics for the 9 Sites. ........................ 17 Table 2. Monthly Mean Atmospheric and Water Temperature Data ....................................... 18 Table 3. Statistical Comparison Between Stations for the 9 Sites ............................................ 24
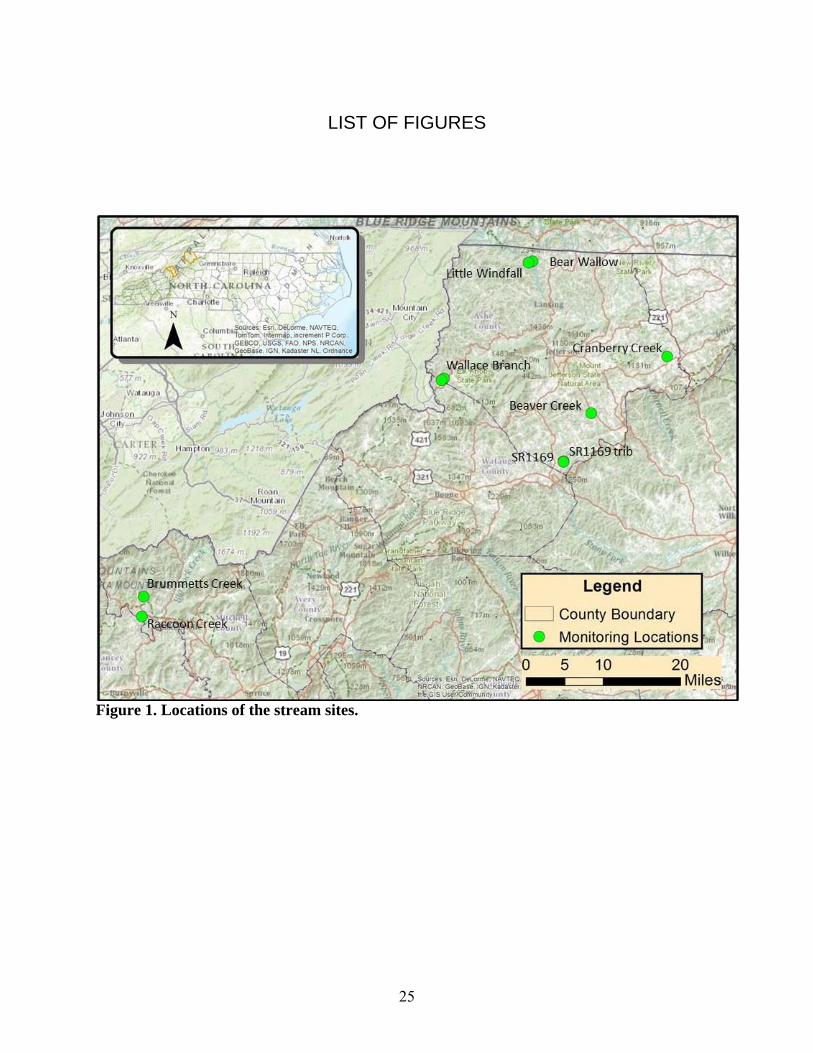
LIST OF FIGURES ...................................................................................................................... 25 Figure 1. Locations of the stream sites. .................................................................................... 25 Figure 2. Raccoon Creek downstream of upstream station ...................................................... 26 Figure 3. Little Windfall Branch near upstream station. .......................................................... 26 Figure 4. Monitored stream reach for SR1169-trib. ................................................................. 27 Figure 5. Monitored reach for SR1169 site. ............................................................................. 27 Figure 6. Wallace Branch near upstream station (left) and mid station (right). ....................... 28 Figure 7. Monthly mean temperatures for the 3 stations on Wallace Branch. .......................... 28 Figure 8. Looking upstream from downstream monitoring station. ......................................... 29 Figure 9. Cranberry Creek site temperature and flow data. ...................................................... 29 Figure 10. Cranberry Creek temperature and discharge data. .................................................. 30 Figure 11. Tree canopy removal from utility crews at Brummetts Creek . .............................. 31 Figure 12. Typical section of the stream at the Bear Wallow site. ........................................... 32
6
INTRODUCTION
The removal of trees during road improvement projects is often necessary, especially in mountainous areas of North Carolina where forests dominate the land. Because many of the roads are located along streams, the tree removal often occurs within the riparian corridor of a stream. Since many of the streams are trout supporting or are tributaries to designated trout waters, the question of whether the removal of trees from the riparian corridor results in an increase in water temperature becomes important.
Water temperature is an important part of the habitat for many aquatic organisms as it affects their metabolism, feeding and reproduction. Trout, and other salmonids, are among the most sensitive to water temperature changes (Jones and Hunt, 2009) and macroinvertebrates have also been shown to be adversely affected by increases in water temperature (Sweeney, 1993). Although water temperature at a given location varies naturally due to diurnal and seasonal factors, anthropogenic changes can skew natural variability significantly. For example, several studies have shown that the removal of a large area of trees during logging resulted in increases in the temperature of streams located within the logged area (Beschta and Taylor, 1988; Holtby, 1988; Swift and Messer, 1971). However, few, if any, studies have documented the effects on stream temperature of removing selected or a small number of trees from within the riparian area such as would be done for road improvement projects.
Many factors affect the extent of thermal heating resulting from limited clearing of the tree canopy including stream flow rate, ambient air and water temperature, extent of clearing relative to total riparian corridor, width and depth of the water column, and possibly turbidity/solids concentration of the stream/waterbody. Studies of Pacifica and Alaskan streams have shown increases in stream temperature resulting from removing trees from riparian zones in some cases; however, they have also shown that the water temperature in small streams (<1 cfs) decreases relatively quickly downstream to the 'natural' temperature if the tree canopy is restored. Thus, there is a need to document under what conditions riparian canopy removal has a significant effect on stream temperature.
This study was designed to document water temperature during a three-year period in mountain streams that have had limited tree removal in their riparian corridor as a result of road improvement. Streams of varying discharge rate, bed slope, and tree canopy were monitored as well as streams with vary extents of tree removal from road improvement were monitored. In addition, a stream section was monitored prior to road improvement to document changes in temperature following road improvement.
7
METHODOLOGY AND PROCEDURES
The project included continuous temperature monitoring of 9 streams reaches in Ashe and Mitchell Counties of North Carolina (fig. 1). Several of the reaches were on unnamed tributaries; hence, the names of reaches/sites used in this report may be the name of the road or another name assigned to the site at random. Location coordinates and watershed characteristics for the 9 stream sites/reaches are shown in Table 1. The drainage areas for the sites range from 85 to 16,064 acres. Given that the sites were in the mountains the elevations, average slope, and forested land use were high for North Carolina watersheds. Regarding land use, pasture was included in the cultivated land use. For the SR1169 and SR1169-trib sites the distance between the upstream and downstream station was relatively short; thus, the characteristics for both sites are the same.
Of the 9 stream reaches five were intensively monitored (Bear Wallow, Brummetts Creek, Cranberry Creek, Wallace Branch, and SR1169) and four less intensively monitored (Beaver Creek, Little Windfall, Raccoon Creek, and SR1169-trib). All of the stream sites, except Bear Wallow, were along roads that had been improved in the recent past, which required the removal of some trees within 50ft of the stream. The Bear Wallow site was monitored prior to an anticipated road improvement project, which is currently occurring; however, data contained in the report will include only the pre-improvement period. The 5 intensively monitored reaches included a variety of stream sizes and tree canopy removal extents to provide data for determining when an increase in temperature might be an issue. The intensive monitoring included continuous measurement of water stage and temperature along with occasional measurements of water depth and width, solar radiation, and stream cross section. Air temperature was also monitored continuously at about 2-3 ft above the ground surface at several of these sites using the same types of sensors that were used to monitor water temperature. A staff gage and an automated pressure transducer were installed at each discharge monitoring site to provide continuous water stage measurements and a reference for calibration. Because the pressure transducers were installed under water they measured the sum of the atmospheric and water pressure; thus, the atmospheric pressure had to be measured or otherwise determined and subtracted from the measurements to obtained water depth. Water depth measurements were then correlated to the staff gage to compute stage measurements. The stage measurements were converted to discharge using stage-discharge rating tables. The stage-discharge rating tables were developed from at least 5 manual measurements of discharge encompassing a range of stages. For most sites, the range of stages encompassed at least 70% of the range of stages actually measured. The manual measurements of discharge were conducted using standard stream gaging equipment and techniques.
For the 4 less intensively monitored sites water temperature was also monitored continuously at upstream and downstream locations. However, only instantaneous discharge measurements were made occasionally to document current conditions and no solar radiation measurements were made.
All water and air temperature sensors had continuous measurement capability (15-30 minute interval). They were installed at shaded locations, when possible, to prevent direct solar radiation on the sensor itself. For several sites shaded locations could not be found, so the sensor was placed inside a white PVC pipe (white pipe reflects heat to minimize local heating) to shade it from the sun. Although, the water in most streams appeared to be well-mixed, temperature sensors were installed in areas of flow where the measured temperature was representative of the
8
entire stream cross section. Atmospheric pressure was monitored at Bear Wallow and Wallace Branch during some of the duration of the project. Solar radiation measurements to document shading from nearby trees and other vegetation were also made. Photos of monitoring sites, roads, and tree canopy were also taken to document current conditions.
Because of the variable nature of climatic conditions, more than 2.5 years of data were collected to attempt to establish long-term relationships/trends as opposed to short-term trends caused by unusual climatic and/or other conditions. Temperature data from monitoring stations located upstream and downstream of stream reaches affected by highway improvements were collected. Paired t-tests were used to determine if differences between upstream and downstream data were statistically significant. Unless otherwise stated all paired t-tests used 0.05 as the level of significance. The data were not tested for normalcy because the sample size was quite large (>500 data points).
RESULTS Because of the amount of temperature and discharge data only summaries will be
presented in this report, except for graphical representations, which will often use all of the data. The statistical analysis depended on a comparison between upstream and downstream stations; therefore, when data was missing from one station, data from the other station was deleted to perform the statistical test.
Beaver Creek Site
The Beaver Creek site was located along Mash Road (SR1182). The monitored stream reach began with the stream channel at the base of a large and steep road embankment and went about 750ft downstream to where the channel was nearly at the same elevation as the road and within 50ft of the road. The drainage area to the upstream station was 10,496 acres most of which was forested (Table 1). The stream channel had at least 25ft of undisturbed well-established tree canopy on both sides with only the outlying 10-15ft of trees removed on the one side for road the improvement. The width of the stream in the channel was 24-30ft with discharge at upstream and downstream measured on one occasion at 11 cfs. Hence, this was a relatively large stream with a good tree canopy over the stream that had tree removal for road improvement outside of 25ft from the stream.
Mean monthly temperatures for Beaver Creek are shown in Table 2. For February, 2011 to June 2012 differences between upstream and downstream temperatures were slight with the greatest being a 1.19 °F decrease in January 2012. For this 17-month period, the overall mean at the downstream station was 54.63 °F, which was only 0.004 °F less than the upstream station (Table 3). Even so, the temperatures at the two stations were significantly different according to a paired t-test (0.05 level of significance), albeit at the 0.01 level they would not be significantly different. Even though the 0.004 °F increase in the overall mean temperature was statistically significant, it may not have been physically real given that the difference was much less than the resolution (0.04 °F) and measurement accuracy of the temperature sensors (0.36 °F). Further, the small increase may be insignificant to aquatic organisms. Thus, the temperature data suggests that removing trees from the outer section of this riparian buffer had no significant effect on the stream temperature.
9
Raccoon Creek Site
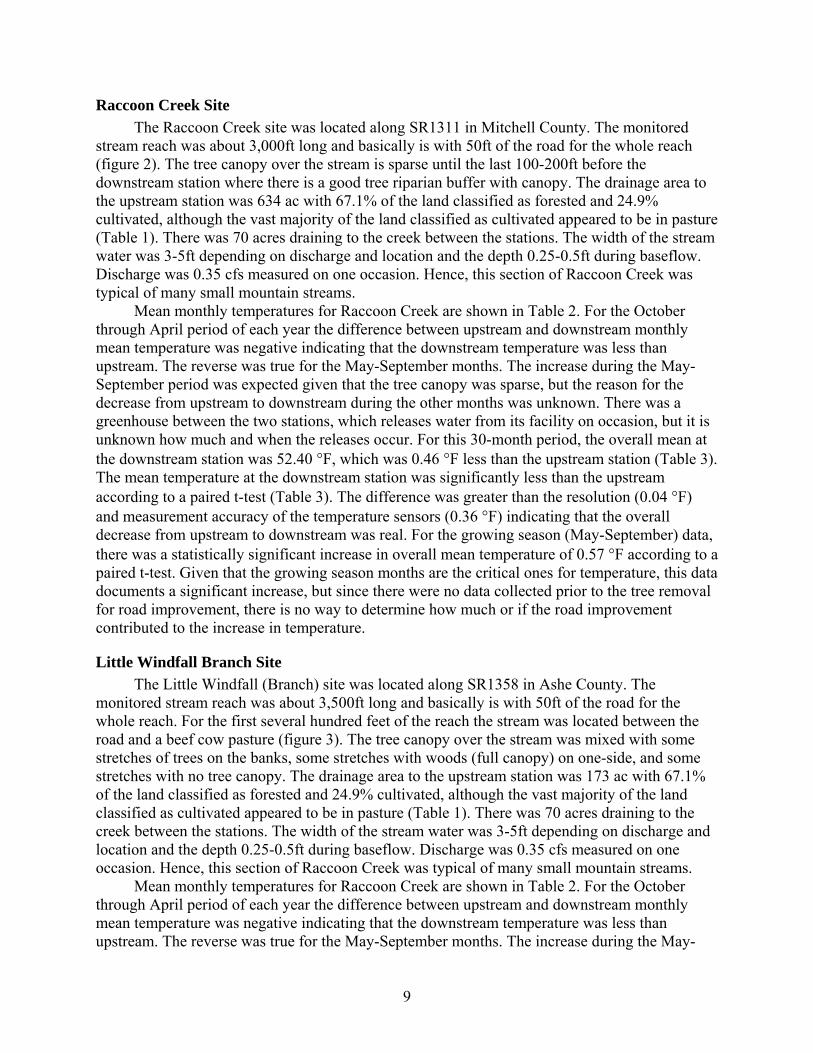
The Raccoon Creek site was located along SR1311 in Mitchell County. The monitored stream reach was about 3,000ft long and basically is with 50ft of the road for the whole reach (figure 2). The tree canopy over the stream is sparse until the last 100-200ft before the downstream station where there is a good tree riparian buffer with canopy. The drainage area to the upstream station was 634 ac with 67.1% of the land classified as forested and 24.9% cultivated, although the vast majority of the land classified as cultivated appeared to be in pasture (Table 1). There was 70 acres draining to the creek between the stations. The width of the stream water was 3-5ft depending on discharge and location and the depth 0.25-0.5ft during baseflow. Discharge was 0.35 cfs measured on one occasion. Hence, this section of Raccoon Creek was typical of many small mountain streams.
Mean monthly temperatures for Raccoon Creek are shown in Table 2. For the October through April period of each year the difference between upstream and downstream monthly mean temperature was negative indicating that the downstream temperature was less than upstream. The reverse was true for the May-September months. The increase during the May-September period was expected given that the tree canopy was sparse, but the reason for the decrease from upstream to downstream during the other months was unknown. There was a greenhouse between the two stations, which releases water from its facility on occasion, but it is unknown how much and when the releases occur. For this 30-month period, the overall mean at the downstream station was 52.40 °F, which was 0.46 °F less than the upstream station (Table 3). The mean temperature at the downstream station was significantly less than the upstream according to a paired t-test (Table 3). The difference was greater than the resolution (0.04 °F) and measurement accuracy of the temperature sensors (0.36 °F) indicating that the overall decrease from upstream to downstream was real. For the growing season (May-September) data, there was a statistically significant increase in overall mean temperature of 0.57 °F according to a paired t-test. Given that the growing season months are the critical ones for temperature, this data documents a significant increase, but since there were no data collected prior to the tree removal for road improvement, there is no way to determine how much or if the road improvement contributed to the increase in temperature.
Little Windfall Branch Site
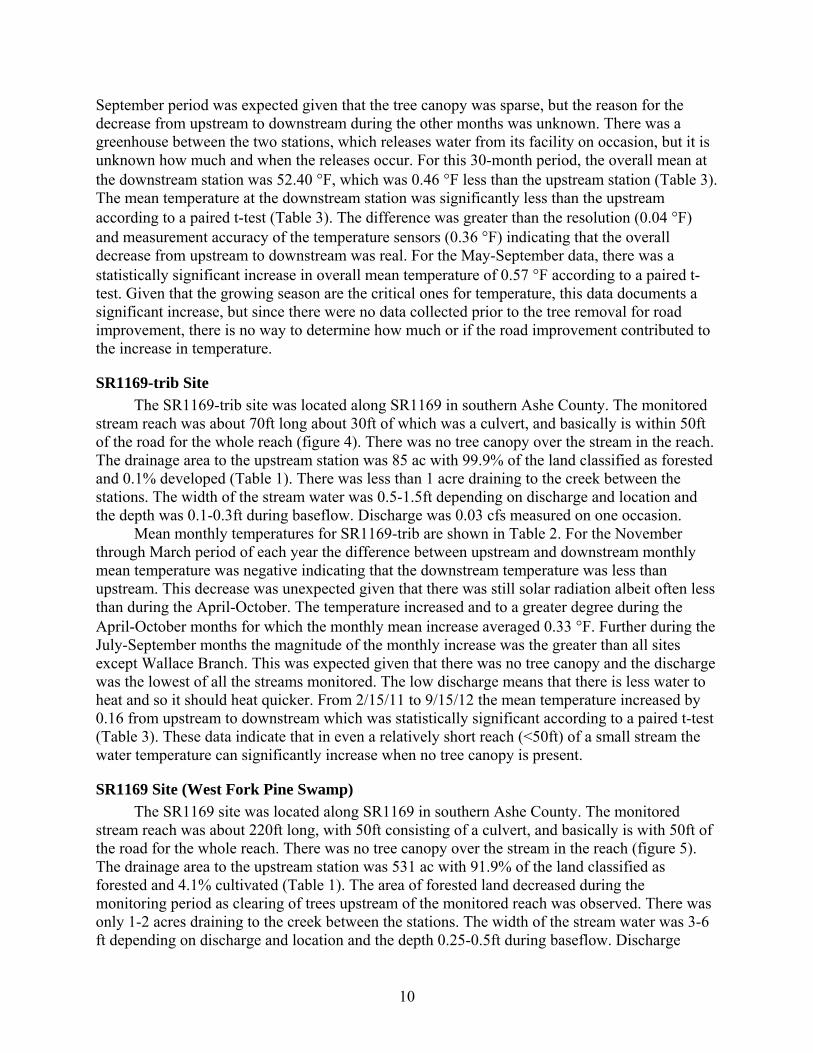
The Little Windfall (Branch) site was located along SR1358 in Ashe County. The monitored stream reach was about 3,500ft long and basically is with 50ft of the road for the whole reach. For the first several hundred feet of the reach the stream was located between the road and a beef cow pasture (figure 3). The tree canopy over the stream was mixed with some stretches of trees on the banks, some stretches with woods (full canopy) on one-side, and some stretches with no tree canopy. The drainage area to the upstream station was 173 ac with 67.1% of the land classified as forested and 24.9% cultivated, although the vast majority of the land classified as cultivated appeared to be in pasture (Table 1). There was 70 acres draining to the creek between the stations. The width of the stream water was 3-5ft depending on discharge and location and the depth 0.25-0.5ft during baseflow. Discharge was 0.35 cfs measured on one occasion. Hence, this section of Raccoon Creek was typical of many small mountain streams.
Mean monthly temperatures for Raccoon Creek are shown in Table 2. For the October through April period of each year the difference between upstream and downstream monthly mean temperature was negative indicating that the downstream temperature was less than upstream. The reverse was true for the May-September months. The increase during the May-
10
September period was expected given that the tree canopy was sparse, but the reason for the decrease from upstream to downstream during the other months was unknown. There was a greenhouse between the two stations, which releases water from its facility on occasion, but it is unknown how much and when the releases occur. For this 30-month period, the overall mean at the downstream station was 52.40 °F, which was 0.46 °F less than the upstream station (Table 3). The mean temperature at the downstream station was significantly less than the upstream according to a paired t-test (Table 3). The difference was greater than the resolution (0.04 °F) and measurement accuracy of the temperature sensors (0.36 °F) indicating that the overall decrease from upstream to downstream was real. For the May-September data, there was a statistically significant increase in overall mean temperature of 0.57 °F according to a paired t-test. Given that the growing season are the critical ones for temperature, this data documents a significant increase, but since there were no data collected prior to the tree removal for road improvement, there is no way to determine how much or if the road improvement contributed to the increase in temperature.
SR1169-trib Site
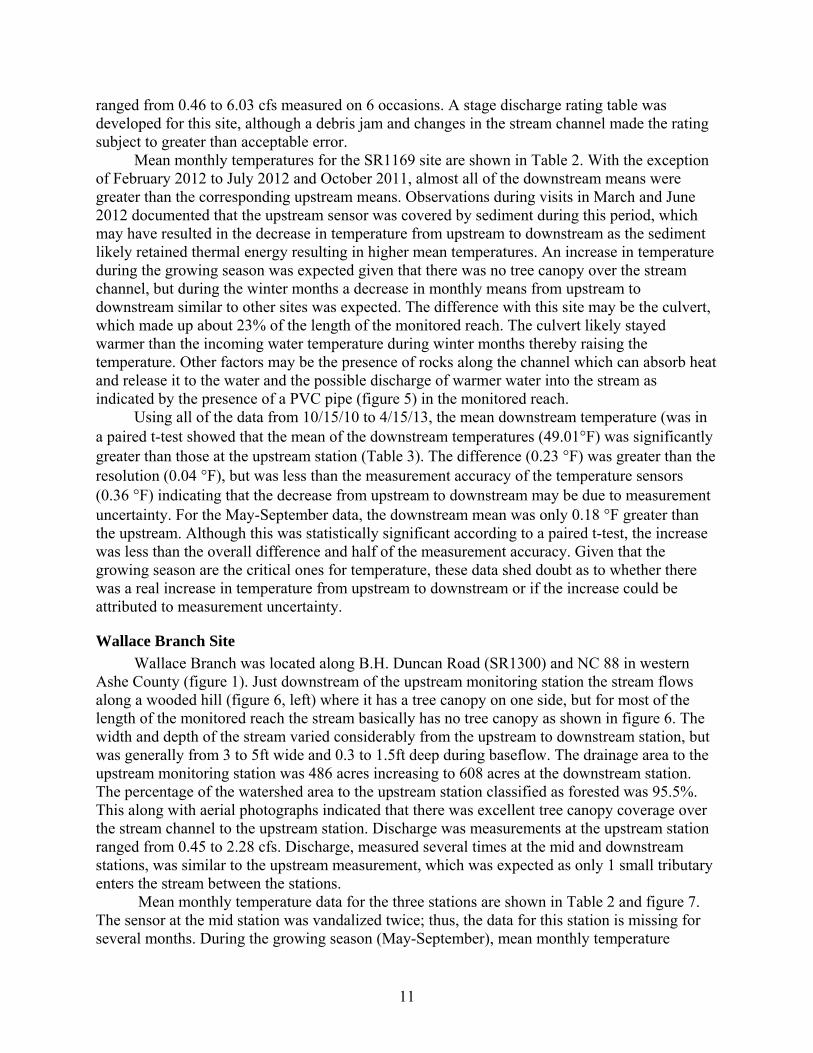
The SR1169-trib site was located along SR1169 in southern Ashe County. The monitored stream reach was about 70ft long about 30ft of which was a culvert, and basically is within 50ft of the road for the whole reach (figure 4). There was no tree canopy over the stream in the reach. The drainage area to the upstream station was 85 ac with 99.9% of the land classified as forested and 0.1% developed (Table 1). There was less than 1 acre draining to the creek between the stations. The width of the stream water was 0.5-1.5ft depending on discharge and location and the depth was 0.1-0.3ft during baseflow. Discharge was 0.03 cfs measured on one occasion.
Mean monthly temperatures for SR1169-trib are shown in Table 2. For the November through March period of each year the difference between upstream and downstream monthly mean temperature was negative indicating that the downstream temperature was less than upstream. This decrease was unexpected given that there was still solar radiation albeit often less than during the April-October. The temperature increased and to a greater degree during the April-October months for which the monthly mean increase averaged 0.33 °F. Further during the July-September months the magnitude of the monthly increase was the greater than all sites except Wallace Branch. This was expected given that there was no tree canopy and the discharge was the lowest of all the streams monitored. The low discharge means that there is less water to heat and so it should heat quicker. From 2/15/11 to 9/15/12 the mean temperature increased by 0.16 from upstream to downstream which was statistically significant according to a paired t-test (Table 3). These data indicate that in even a relatively short reach (<50ft) of a small stream the water temperature can significantly increase when no tree canopy is present.
SR1169 Site (West Fork Pine Swamp)
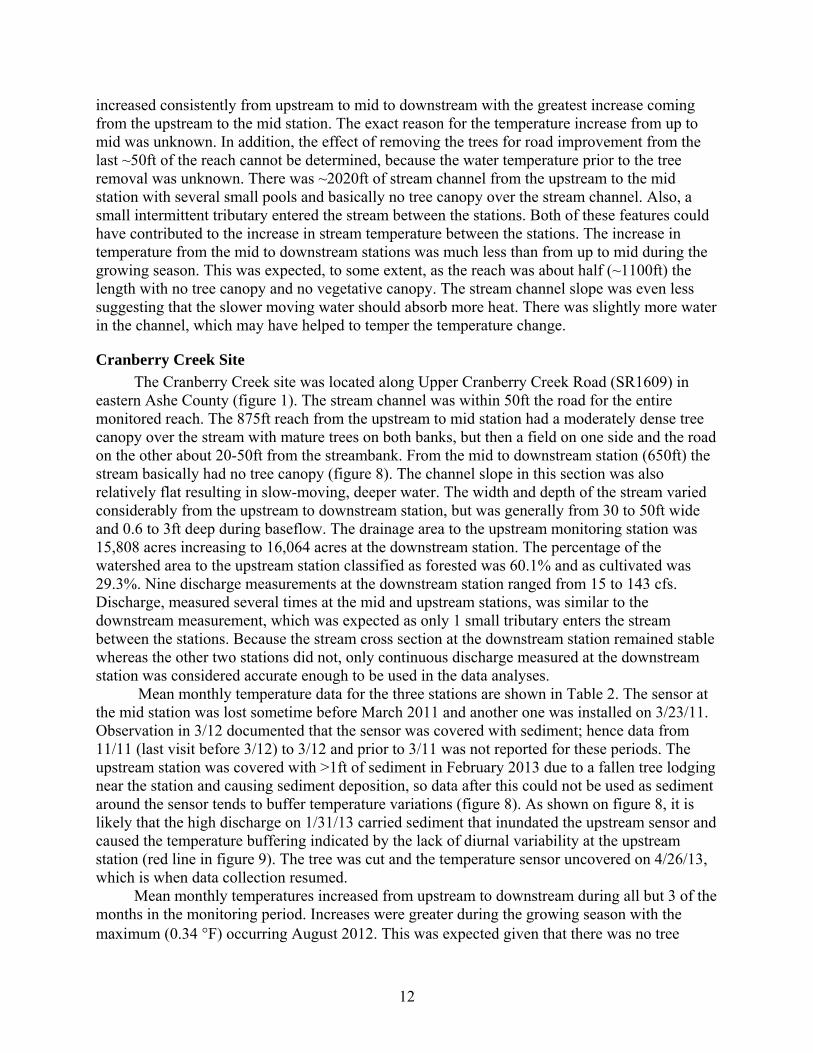
The SR1169 site was located along SR1169 in southern Ashe County. The monitored stream reach was about 220ft long, with 50ft consisting of a culvert, and basically is with 50ft of the road for the whole reach. There was no tree canopy over the stream in the reach (figure 5). The drainage area to the upstream station was 531 ac with 91.9% of the land classified as forested and 4.1% cultivated (Table 1). The area of forested land decreased during the monitoring period as clearing of trees upstream of the monitored reach was observed. There was only 1-2 acres draining to the creek between the stations. The width of the stream water was 3-6 ft depending on discharge and location and the depth 0.25-0.5ft during baseflow. Discharge
11
ranged from 0.46 to 6.03 cfs measured on 6 occasions. A stage discharge rating table was developed for this site, although a debris jam and changes in the stream channel made the rating subject to greater than acceptable error.
Mean monthly temperatures for the SR1169 site are shown in Table 2. With the exception of February 2012 to July 2012 and October 2011, almost all of the downstream means were greater than the corresponding upstream means. Observations during visits in March and June 2012 documented that the upstream sensor was covered by sediment during this period, which may have resulted in the decrease in temperature from upstream to downstream as the sediment likely retained thermal energy resulting in higher mean temperatures. An increase in temperature during the growing season was expected given that there was no tree canopy over the stream channel, but during the winter months a decrease in monthly means from upstream to downstream similar to other sites was expected. The difference with this site may be the culvert, which made up about 23% of the length of the monitored reach. The culvert likely stayed warmer than the incoming water temperature during winter months thereby raising the temperature. Other factors may be the presence of rocks along the channel which can absorb heat and release it to the water and the possible discharge of warmer water into the stream as indicated by the presence of a PVC pipe (figure 5) in the monitored reach.
Using all of the data from 10/15/10 to 4/15/13, the mean downstream temperature (was in a paired t-test showed that the mean of the downstream temperatures (49.01°F) was significantly greater than those at the upstream station (Table 3). The difference (0.23 °F) was greater than the resolution (0.04 °F), but was less than the measurement accuracy of the temperature sensors (0.36 °F) indicating that the decrease from upstream to downstream may be due to measurement uncertainty. For the May-September data, the downstream mean was only 0.18 °F greater than the upstream. Although this was statistically significant according to a paired t-test, the increase was less than the overall difference and half of the measurement accuracy. Given that the growing season are the critical ones for temperature, these data shed doubt as to whether there was a real increase in temperature from upstream to downstream or if the increase could be attributed to measurement uncertainty.
Wallace Branch Site
Wallace Branch was located along B.H. Duncan Road (SR1300) and NC 88 in western Ashe County (figure 1). Just downstream of the upstream monitoring station the stream flows along a wooded hill (figure 6, left) where it has a tree canopy on one side, but for most of the length of the monitored reach the stream basically has no tree canopy as shown in figure 6. The width and depth of the stream varied considerably from the upstream to downstream station, but was generally from 3 to 5ft wide and 0.3 to 1.5ft deep during baseflow. The drainage area to the upstream monitoring station was 486 acres increasing to 608 acres at the downstream station. The percentage of the watershed area to the upstream station classified as forested was 95.5%. This along with aerial photographs indicated that there was excellent tree canopy coverage over the stream channel to the upstream station. Discharge was measurements at the upstream station ranged from 0.45 to 2.28 cfs. Discharge, measured several times at the mid and downstream stations, was similar to the upstream measurement, which was expected as only 1 small tributary enters the stream between the stations.
Mean monthly temperature data for the three stations are shown in Table 2 and figure 7. The sensor at the mid station was vandalized twice; thus, the data for this station is missing for several months. During the growing season (May-September), mean monthly temperature
12
increased consistently from upstream to mid to downstream with the greatest increase coming from the upstream to the mid station. The exact reason for the temperature increase from up to mid was unknown. In addition, the effect of removing the trees for road improvement from the last ~50ft of the reach cannot be determined, because the water temperature prior to the tree removal was unknown. There was ~2020ft of stream channel from the upstream to the mid station with several small pools and basically no tree canopy over the stream channel. Also, a small intermittent tributary entered the stream between the stations. Both of these features could have contributed to the increase in stream temperature between the stations. The increase in temperature from the mid to downstream stations was much less than from up to mid during the growing season. This was expected, to some extent, as the reach was about half (~1100ft) the length with no tree canopy and no vegetative canopy. The stream channel slope was even less suggesting that the slower moving water should absorb more heat. There was slightly more water in the channel, which may have helped to temper the temperature change.
Cranberry Creek Site
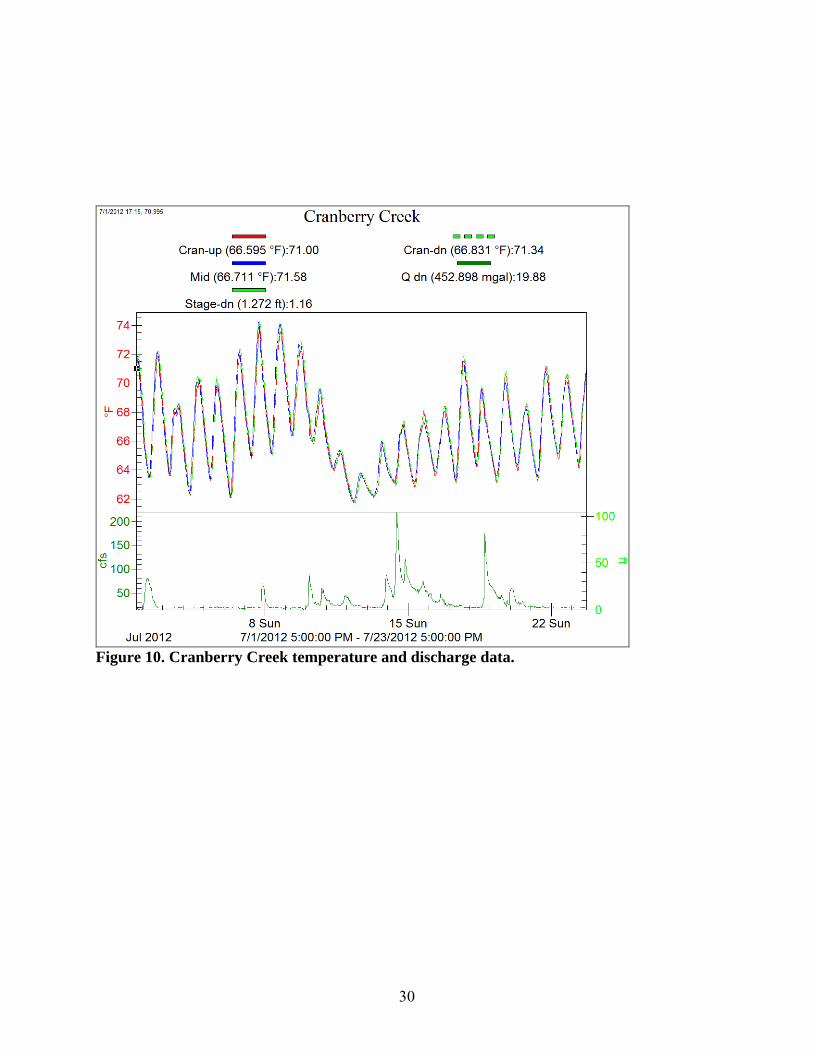
The Cranberry Creek site was located along Upper Cranberry Creek Road (SR1609) in eastern Ashe County (figure 1). The stream channel was within 50ft the road for the entire monitored reach. The 875ft reach from the upstream to mid station had a moderately dense tree canopy over the stream with mature trees on both banks, but then a field on one side and the road on the other about 20-50ft from the streambank. From the mid to downstream station (650ft) the stream basically had no tree canopy (figure 8). The channel slope in this section was also relatively flat resulting in slow-moving, deeper water. The width and depth of the stream varied considerably from the upstream to downstream station, but was generally from 30 to 50ft wide and 0.6 to 3ft deep during baseflow. The drainage area to the upstream monitoring station was 15,808 acres increasing to 16,064 acres at the downstream station. The percentage of the watershed area to the upstream station classified as forested was 60.1% and as cultivated was 29.3%. Nine discharge measurements at the downstream station ranged from 15 to 143 cfs. Discharge, measured several times at the mid and upstream stations, was similar to the downstream measurement, which was expected as only 1 small tributary enters the stream between the stations. Because the stream cross section at the downstream station remained stable whereas the other two stations did not, only continuous discharge measured at the downstream station was considered accurate enough to be used in the data analyses.
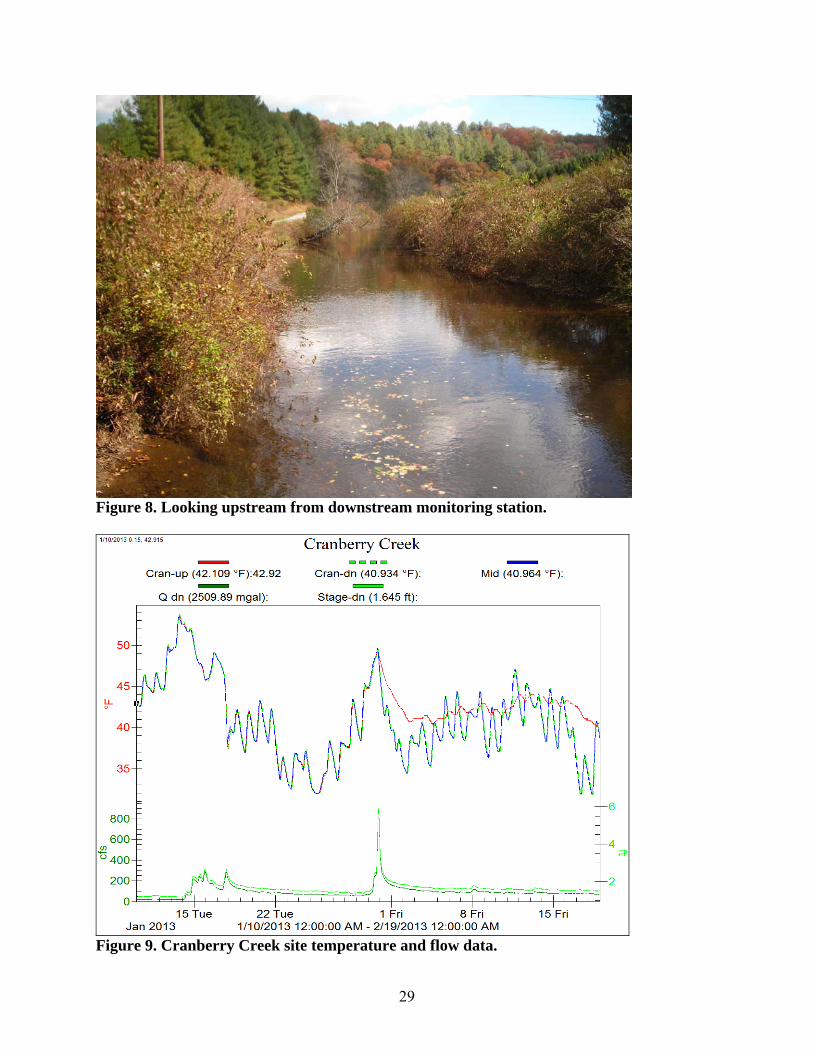
Mean monthly temperature data for the three stations are shown in Table 2. The sensor at the mid station was lost sometime before March 2011 and another one was installed on 3/23/11. Observation in 3/12 documented that the sensor was covered with sediment; hence data from 11/11 (last visit before 3/12) to 3/12 and prior to 3/11 was not reported for these periods. The upstream station was covered with >1ft of sediment in February 2013 due to a fallen tree lodging near the station and causing sediment deposition, so data after this could not be used as sediment around the sensor tends to buffer temperature variations (figure 8). As shown on figure 8, it is likely that the high discharge on 1/31/13 carried sediment that inundated the upstream sensor and caused the temperature buffering indicated by the lack of diurnal variability at the upstream station (red line in figure 9). The tree was cut and the temperature sensor uncovered on 4/26/13, which is when data collection resumed.
Mean monthly temperatures increased from upstream to downstream during all but 3 of the months in the monitoring period. Increases were greater during the growing season with the maximum (0.34 °F) occurring August 2012. This was expected given that there was no tree
13
canopy over the last 650ft of the stream reach between the stations. Comparing temperature increases from upstream to mid and mid to downstream during the May-September period for each year shows no consistent trend; for some months there was a greater increase from upstream to mid and for other months the increase from mid to downstream was greater. This was unexpected as the greatest increase in temperature was expected to occur from mid to downstream where the stream had no canopy and was slow-moving. This indicates that the presence/absence of tree canopy may not be the most important factor in determining changes in stream temperature. It is also important to remember the differences in temperature between these stations is relatively small (<0.21 °F) when compared to the accuracy of the sensors (0.36 °F) and the effect of sediment deposition on temperature measurements, which may be quite dynamic during the periods between visits (observations).
Using all of the data from 10/15/10 to 1/31/13, the mean downstream temperature was significantly greater than the upstream according to a paired t-test (Table 3). However, the difference in overall means was only 0.09 °F. This difference was slightly greater than the resolution (0.04 °F), but was much less than the reported measurement accuracy of the temperature sensors (0.36 °F) indicating that the decrease from upstream to downstream is within the range of measurement uncertainty. For the May-September data, the downstream mean was 0.18 °F greater than the upstream, which was also statistically significant according to a paired t-test, but was still half of the reported measurement accuracy of the sensor. Given the above information and data we cannot say with confidence that there was a real increase in temperature from upstream to downstream.
Stream discharge had an effect on water temperature during growing season in that higher stream discharge tended lower mean temperatures by reduce the diurnal peaks in temperatures as shown in figure 10. Following the increased discharge on 6/14-15, daily peak temperature decreased. Whether this can be attributed more to higher discharge or perhaps lower solar radiation due to cloud cover during these days has yet to be determined.
Brummetts Creek Site
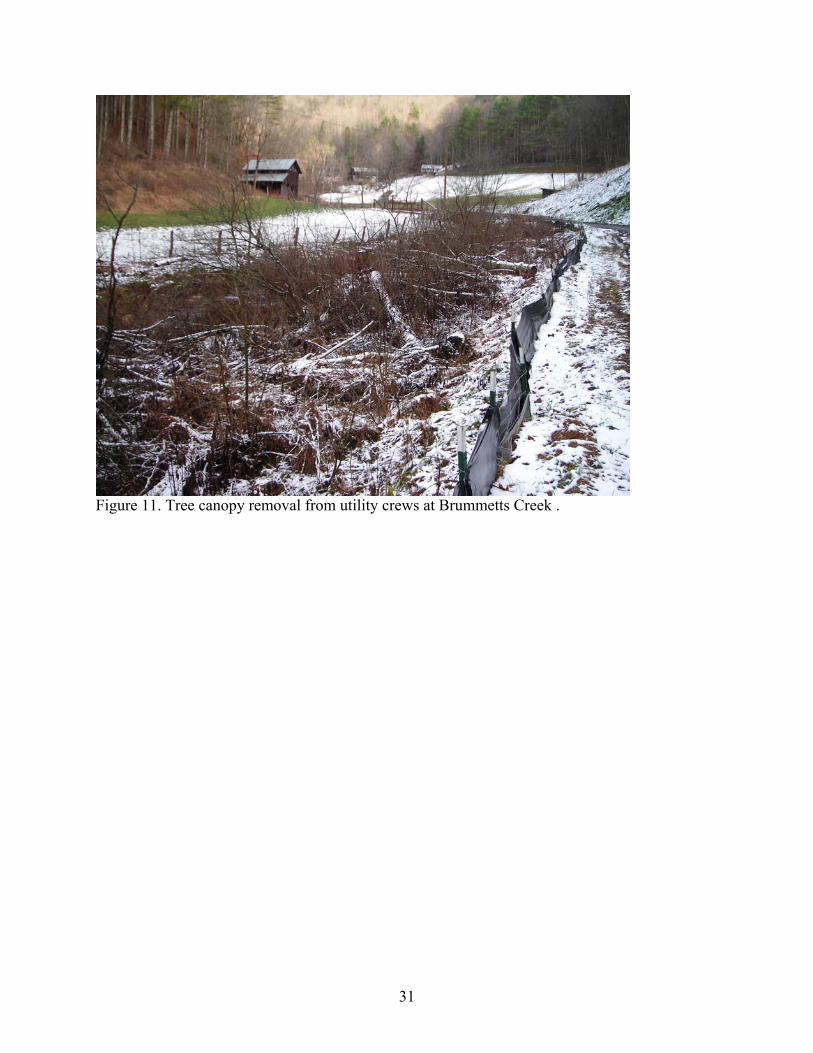
The Brummetts Creek site was located along SR1276 in southern Mitchell County (figure 1). The stream channel was within 50ft the road for the entire monitored reach. The reach had a moderately dense tree canopy within the first 100ft from the downstream station, but upstream from there the canopy was sparse. Several hundred feet of tree canopy was removed by utility crews (figure 11). The width and depth of the stream varied from the upstream to downstream station, but was generally from 1 to 3ft wide and 0.2 to 0.7ft deep during baseflow. The drainage area to the upstream monitoring station was 717 acres increasing to 883 acres at the downstream station. The percentage of the watershed area to the upstream station classified as forested was 98.3% and as cultivated was 0.0%. Eight discharge measurements were conducted at the downstream station with results ranging from 0.1 to 2.62 cfs. Discharge, measured several times at the upstream station, was similar to the downstream measurement. Because the initial sensor installed at the upstream station was vandalized stage and discharge were not measured continuously there.
Mean monthly temperature data for the two stations are shown in Table 2. Observation on 9/23/11 documented that the sensor was covered with sediment; hence data from 7/11 (last visit before) to 9/11 were not reported for these periods. Also, the upstream sensor became partially out of the water on occasion resulting in the loss of data (July, 2012). Mean monthly temperatures consistently decreased from upstream to downstream during the November to
14
February months and increased during the other months. Increases during May-September ranged to 2.46 °F occurring for June 2011. This was expected given that there was sparse to no tree canopy over much of the reach between the stations and the discharge rate was low. Because of the amount of missing and suspect data no further analysis of this data was conducted.
Bear Wallow Site
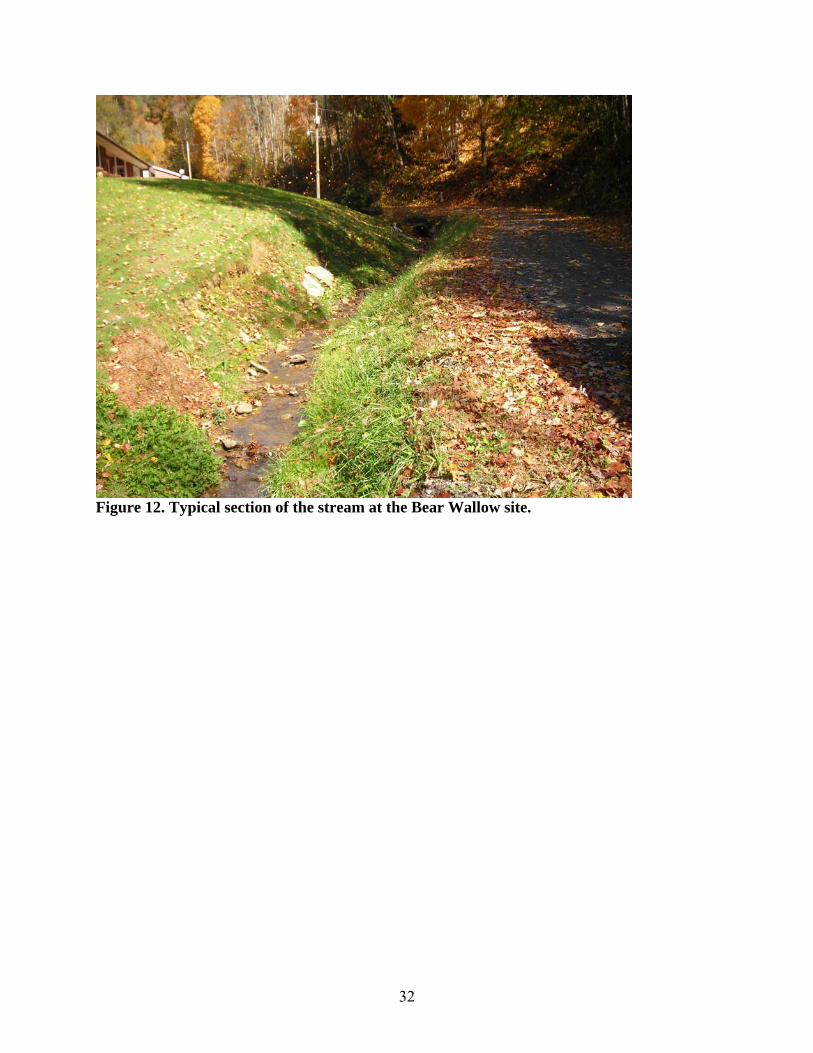
The Bear Wallow site was located along SR1358 in northern Ashe County (figure 1). The stream channel was within 50ft the road for the entire monitored reach (figure 12). The reach had a moderately dense tree canopy over much of its 5,220ft of length. The elevation drops 460ft between the stations making the average channel slope equal to 8.8%. An analysis of the amount of sunlight hitting the stream channel area given the spatial orientation of the stream and the terrain revealed that given a 20ft wide stream corridor, 32-36% of the corridor receives 10-11 hours of sunlight per day during the summer months. The width and depth of the stream varied from the upstream to downstream station, but was generally from 2 to 4ft wide and 0.1 to 1.0ft deep during baseflow. The drainage area to the upstream monitoring station was 140 acres increasing to 365 acres at the downstream station. The percentage of the watershed area to the upstream station classified as forested was 46.5% and as cultivated was 47.6%. Observation from driving in the area and aerial photographs indicated that most, if not nearly all, of the cultivated land was in pasture. Eight discharge measurements were conducted at the downstream station with results ranging from 0.3 to 7.4 cfs. Discharge, measured several times at the upstream station, was similar to the downstream measurement. Because one of the original temperature and pressure sensors was lost and discharge was similar between upstream and downstream, continuously discharge measurement was only performed at the downstream station.
Mean monthly temperature data for the two stations are shown in Table 2. Temperature data for the downstream station was missing from March, 2011 through June, 2001 due to the loss of the sensor. Mean monthly temperatures showed no consistent seasonal trend, except that downstream temperatures were greater during January to March. During the growing season, the mean temperature at the downstream station was greater or less than the upstream an equal number of months. The reason for the lack of consistent results is unknown. A paired t-test using all of the paired data points showed that the overall mean at the upstream station (49.62 °F) was significantly less than the overall mean (49.71 °F) at the downstream station; however, the difference 0.09 °F was quite small compared to the reported measurement accuracy of the temperature sensors (0.36 °F). Using data from the May-September months only, documented that the mean temperature at the upstream station (62.86 °F) was significantly greater than the mean (62.71 °F) at the downstream station. The decrease (0.15 °F) was unexpected, especially for the these warmer months and the length of channel between station, but taking into account that the area upstream of the upstream station includes a cow pasture and farmstead with lots of stream channel exposed to solar radiation it could be that the water temperature was elevated due to this open area. Then as the water flowed through more shaded sections between the stations where the channel was also narrower it cooled slightly before reaching the downstream station. In any case, the decrease in temperature from upstream to downstream was relatively little, but the more important test will be whether the relationship remains the same following road improvement, which is occurring now.
15
Comparisons Between Sites
Comparing differences between upstream and downstream overall temperatures, the data shows that Raccoon Creek and Little Windfall had decreases in mean temperature whereas all the other sites had increases (Table 3). The reason for the decrease in temperature at Raccoon Creek was unknown, but it may be related to the presence of a greenhouse between the stations. For the Little Windfall site, the decrease may be due to the fact that there was only 11 months of paired data or that the upstream station had a large cattle pasture around it. In any case, because temperatures decreased from upstream to downstream, road improvement between the stations was not resulting in significant thermal pollution during the monitoring period.
Among the sites where mean temperatures increased upstream to downstream, Beaver Creek increased the least (0.01 °F). This was expected given that it was a large stream, the channel had a dense tree canopy, the distance between the stations was relatively short, and the road improvement did not affect the near-stream (within 20ft of the bank) canopy. In addition, the mean temperature at the upstream station was the highest of all the sites. The next greatest increase (0.09 °F) was at the Cranberry Creek site. Unlike Beaver Creek, Cranberry Creek had a 650ft reach of stream channel with no tree canopy; thus, an increase in temperature was expected albeit the increase was relatively modest. Data from these two larger streams indicate that a relatively long section of canopy removal is likely required to significantly raise water temperatures in larger streams.
Among the smaller streams with increases in temperature, the Bear Wallow site had the least increase (0.09 °F) and the Wallace Branch site had the greatest (0.61 °F). This was expected given that Wallace Branch had the greatest length of stream channel (>3100ft) without tree canopy and Bear Wallow had the least as a percentage of the total reach between the monitoring stations. The SR1169 sites had second greatest increase in temperature (0.23 °F), even though the exposed reach was only 330ft. A possible reason for this was that the mean temperature recorded by the upstream monitoring station was the coldest of all stations. The reason for this was unknown, but may be related to the fact that the water was deeper and the sensor was set further below the water surface than most stations. In addition, the sensor was inundated with sediment on a number of occasions at this station.
SUMMARY AND CONCLUSIONS In summary, temperature upstream and downstream of a section of 9 streams of various
sizes was monitored during a 2+ year period. On 5 of the 9 streams, discharge was also monitored continuously. For the two large streams (drainage area >10,000 ac) the temperature increase from upstream to downstream was <0.09 °F, even though one of the streams had a reach of 650ft without any tree canopy. For the other stream, Beaver Creek, no trees inside of 20-30ft from the stream were removed and the increase in temperature for a 750ft reach was essentially 0.00 °F. Monitoring on two of the 7 smaller streams (drainage area <1,000 ac) documented a decrease in temperature from upstream to downstream of a reach where road improvements had occurred. The reason for the decrease was not known, but clearly road improvements were not causing increases in stream temperatures. For the small streams with increases in temperature, Wallace Branch had the greatest increase (0.61 °F), which was expected given that the distance
16
between the monitoring stations was >3100ft with essentially no tree canopy. While not definitive the data suggest the following conclusions:
• For larger streams (drainage area >10,000 ac), removing trees from outside of 20ft from the stream channel did not result in a measurable increase in temperature
• For larger streams (drainage area >10,000 ac), even if all of the tree canopy in up to a 650ft reach were removed the increase in temperature was <0.10 °F.
• For smaller streams (drainage area <1,000 ac) water temperature can increase 0.23 °F over a reach as short as 330ft that has no tree canopy
• Tree canopy is not the only factor influencing whether stream temperature increases in a stream reach
• Great care must be taken to locate temperature sensors where they will not be inundated with sediment or exposed to the air and/or sun, especially for streams in which the channel is narrow and/or shallow.
• Additional research is needed where stream temperature is monitored before, during, and after road improvement to more definitively document the effects of riparian canopy reductions on stream temperatures.
CITED REFERENCES
Beschta, R.L. and R.L. Taylor. 1988. Stream Temperature Increases and Land Use in a Forested Oregon Watershed. Water Resources Bulletin, Journal of the American Water Resources Association 24(1):19-25.
Holtby, L.B. 1988. Effects of Logging on Stream Temperatures in Carnation Creek, British Columbia, and Associated Impacts on the Coho Salmon (Oncorhynchus kisutch). Canadian Journal of Fisheries and Aquatic Sciences 45:502-515.
Jones, M.P. and W.F. Hunt. 2009. Bioretention impact on runoff temperature in trout sensitive waters. Journal of Environmental Engineering 135(8):577-585.
Sweeney, B.W. 1993. Effect of Streamside Vegetation on Macroinvertebrate Communities of White Clay Creek in Eastern North America. Proceedings of the Academy of Natural Sciences of Philadelphia 144:291-340.
Swift, L.W. and J. Messer. 1971. Forest Cuttings Raise Temperatures of Small Streams in the Southern Appalachians. J. Soil and Water Conservation 26(3):111-116.
17
LIST OF TABLES
Table 1. Location Coordinates and Watershed Characteristics for the 9 Sites. Site Lat Long Area1 Elev.1 Cultivated1 Developed1 Forested1
Deg. Deg. ac ft % % % Wallace Branch
up 36.38 81.71 486 3590 2.5 1.2 95.5
mid 36.38 81.71 595 3540 6.9 1.9 88.5
down 36.39 81.71 608 3540 7.4 2.5 87.5
Beaver Creek
up 36.34 81.43 10496 3230 31.4 10.3 54.7
down 36.33 81.43 10560 3230 31.4 10.3 54.7
Raccoon Creek
up 36.03 82.27 634 2580 24.9 6.0 67.1
down 36.03 82.27 704 2560 23.1 6.0 68.5
Brummetts Creek
up 36.06 82.27 717 3160 0.0 1.1 98.3
down 36.06 82.27 883 3080 0.3 1.2 97.4
Bear Wallow
up 36.58 81.54 141 3580 47.6 4.9 46.5
down 36.56 81.54 371 3400 36.5 4.7 75.4
Little Windfall
up 36.56 81.56 173 3570 37.4 5.0 56.9
down 36.56 81.55 371 3420 21.1 3.7 74.6
SR1169
up 36.26 81.48 531 3660 4.1 2.2 91.9
down 36.26 81.48 531 3660 4.1 2.2 91.9
SR1169-trib
up 36.26 81.48 85 3668 0.0 0.1 99.9
down 36.26 81.48 85 3668 0.0 0.1 99.9
Cranberry Creek
up 36.42 81.29 15808 3110 29.3 6.3 60.1
mid 36.42 81.29 15872 3110 29.4 6.3 60.0
down 36.42 81.29 16064 3110 29.6 6.3 59.8 1 Drainage area, mean elevation, and land use (based on 2006 data) from USGS StreamStats website.
18
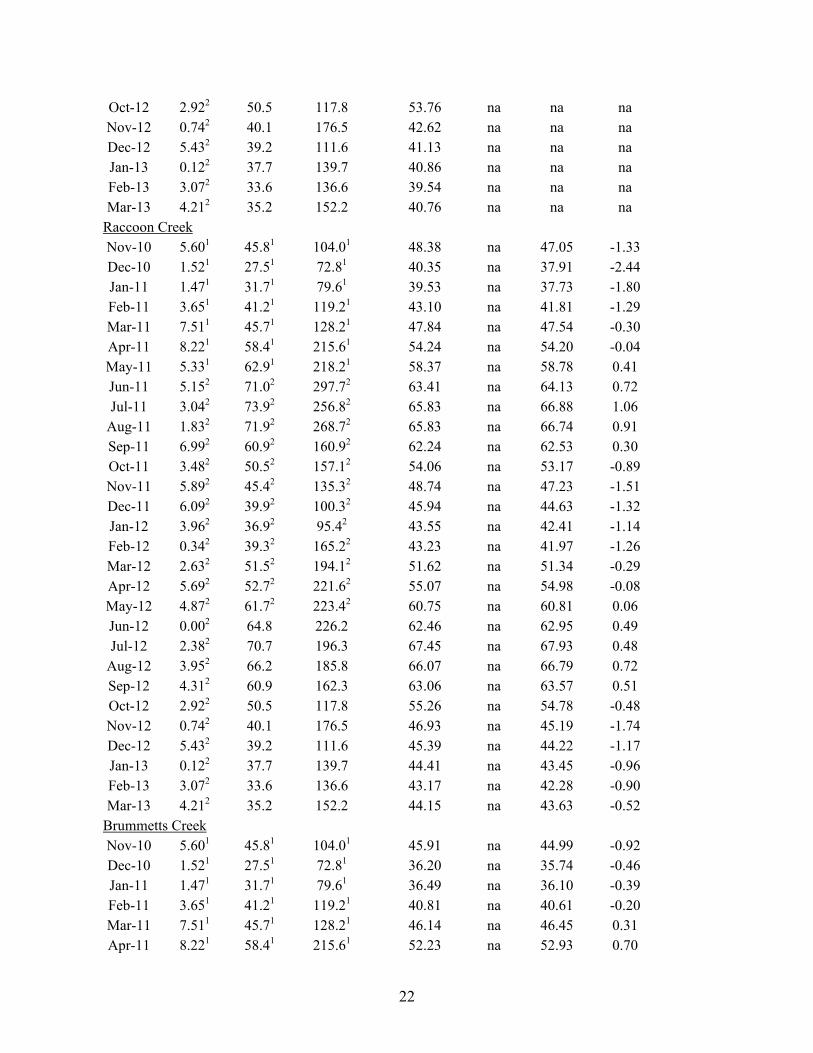
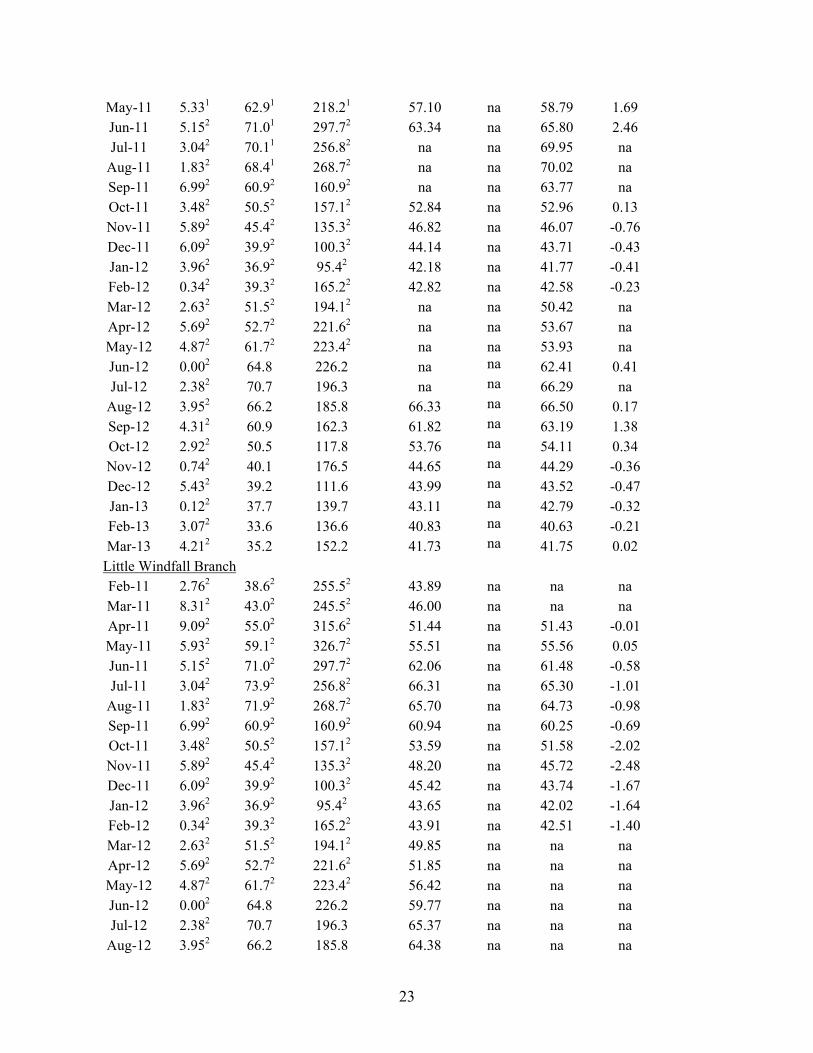
Table 2. Monthly Mean Atmospheric and Water Temperature Data. Total Air Solar Mean Stream/Water Temperature Rain Temp. Rad. Up Mid Down Down-Up
in ◦F W/m2 ◦F ◦F ◦F ◦F Wallace Branch Nov-10 5.892 43.12 111.82 44.81 na 45.28 0.47 Dec-10 0.792 25.62 131.22 35.57 na 35.50 -0.07 Jan-11 1.112 29.32 157.62 35.46 na 35.63 0.17 Feb-11 2.762 38.62 255.52 39.77 na 40.39 0.62 Mar-11 8.312 43.02 245.52 45.03 45.17 45.37 0.34 Apr-11 9.092 55.275 315.62 51.39 51.83 52.27 0.88 May-11 5.932 58.475 326.72 54.55 55.85 56.42 1.87 Jun-11 5.152 64.575 297.72 59.43 61.64 62.38 2.95 Jul-11 3.042 68.165 256.82 61.40 64.86 65.65 4.25
Aug-11 1.832 66.345 268.72 61.73 65.20 65.77 4.04 Sep-11 6.992 60.92 160.92 59.01 60.87 61.25 2.24 Oct-11 3.482 50.52 157.12 53.20 51.90 52.13 -1.07 Nov-11 5.892 45.42 135.32 47.78 46.00 46.19 -1.59 Dec-11 6.092 39.92 100.32 43.35 42.81 43.21 -0.13 Jan-12 3.962 36.92 95.42 41.62 40.86 41.49 -0.14 Feb-12 0.342 39.32 165.22 43.00 41.85 42.57 -0.43 Mar-12 2.632 51.52 194.12 49.46 49.82 49.76 0.30 Apr-12 5.692 52.72 221.62 52.07 52.33 52.18 0.12 May-12 4.872 61.72 223.42 56.14 57.72 57.63 1.49 Jun-12 0.002 62.51 226.2 57.90 60.61 60.14 2.24 Jul-12 2.382 67.71 196.3 61.66 64.35 64.84 3.18
Aug-12 3.952 64.51 185.8 60.85 62.86 63.27 2.42 Sep-12 4.312 60.9 162.3 59.01 59.85 60.10 1.09 Oct-12 2.922 50.5 117.8 52.90 na 52.90 0.00 Nov-12 0.742 40.1 176.5 46.10 na 43.94 -2.16 Dec-12 5.432 39.2 111.6 44.79 na 43.43 -1.36 Jan-13 0.122 37.7 139.7 43.06 na 42.54 -0.52 Feb-13 3.072 33.6 136.6 41.49 na 41.07 -0.42 Mar-13 4.212 35.2 152.2 41.91 na 41.64 -0.27
Bear Wallow Nov-10 5.892 43.12 111.82 44.66 na 44.15 -0.51 Dec-10 0.792 25.62 131.22 35.57 na 34.79 -0.78 Jan-11 1.112 29.32 157.62 35.51 na 35.71 0.20 Feb-11 2.762 38.62 255.52 37.573 na 37.813 0.24 Mar-11 8.312 43.02 245.52 44.66 na na na Apr-11 9.092 55.02 315.62 51.66 na na na May-11 5.932 59.12 326.72 56.88 na na na Jun-11 5.152 71.02 297.72 63.78 na na na
19
Jul-11 3.042 73.92 256.82 68.88 na 68.22 -0.66 Aug-11 1.832 71.92 268.72 66.18 na 65.67 -0.51 Sep-11 6.992 60.92 160.92 60.80 na 60.96 0.16 Oct-11 3.482 50.52 157.12 51.78 na 51.82 0.04 Nov-11 5.892 45.42 135.32 46.55 na 46.21 -0.34 Dec-11 6.092 39.92 100.32 43.58 na 43.97 0.39 Jan-12 3.962 36.92 95.42 41.25 na 41.84 0.59 Feb-12 0.342 39.32 165.22 41.94 na 42.29 0.35 Mar-12 2.632 51.52 194.12 49.38 na 49.55 0.17 Apr-12 5.692 52.72 221.62 51.93 na 51.87 -0.07 May-12 4.872 61.72 223.42 58.27 na 58.32 0.04 Jun-12 0.002 64.82 226.22 61.50 na 60.93 -0.57 Jul-12 2.382 70.72 196.32 66.48 na 66.46 -0.02
Aug-12 3.952 66.22 185.82 64.05 na 64.10 0.04 Sep-12 4.312 60.92 162.32 60.12 na 60.24 0.11 Oct-12 2.922 48.831 117.82 51.47 na 51.83 0.36 Nov-12 0.742 38.181 176.52 42.43 na 42.64 0.20 Dec-12 5.432 37.531 111.62 41.75 na 41.93 0.18 Jan-13 0.122 36.521 139.72 41.13 na 41.76 0.63 Feb-13 3.072 33.121 136.62 38.83 na 39.67 0.84 Mar-13 4.212 34.381 152.22 39.82 na 40.76 0.95
Cranberry Creek Nov-10 5.892 43.12 111.82 44.10 na 44.10 0.00 Dec-10 0.792 25.62 131.22 34.20 na 34.10 -0.10 Jan-11 1.112 29.32 157.62 34.50 na 34.50 0.00 Feb-11 2.762 38.62 255.52 39.74 na 39.80 0.06 Mar-11 8.312 43.02 245.52 45.45 na 45.52 0.07 Apr-11 9.092 55.02 315.62 52.92 52.76 53.00 0.08 May-11 5.932 59.12 326.72 57.13 56.88 57.23 0.10 Jun-11 5.152 71.02 297.72 62.50 62.48 62.64 0.14 Jul-11 3.042 73.92 256.82 66.21 66.28 66.36 0.15
Aug-11 1.832 71.92 268.72 66.28 66.39 66.48 0.20 Sep-11 6.992 60.92 160.92 61.04 61.23 61.16 0.12 Oct-11 3.482 50.52 157.12 52.15 52.27 52.28 0.13 Nov-11 5.892 45.42 135.32 46.44 na 46.50 0.06 Dec-11 6.092 39.92 100.32 43.97 na 43.96 -0.01 Jan-12 3.962 36.92 95.42 40.74 na 40.75 0.01 Feb-12 0.342 39.32 165.22 42.18 na 42.19 0.02 Mar-12 2.632 51.52 194.12 50.64 na 50.71 0.07 Apr-12 5.692 52.72 221.62 53.26 53.46 53.48 0.22 May-12 4.872 61.72 223.42 59.33 59.39 59.45 0.11 Jun-12 0.002 64.8 226.2 62.09 62.16 62.23 0.14 Jul-12 2.382 70.7 196.3 67.00 67.08 67.24 0.24
20
Aug-12 3.952 66.2 185.8 65.18 65.39 65.52 0.34 Sep-12 4.312 60.9 162.3 60.81 60.99 61.09 0.27 Oct-12 2.922 50.5 117.8 52.33 52.44 52.45 0.12 Nov-12 0.742 40.1 176.5 41.75 41.86 41.82 0.07 Dec-12 5.432 39.2 111.6 41.12 41.18 41.12 0.00 Jan-13 0.122 37.7 139.7 40.99 40.92 40.87 -0.12 Feb-13 3.072 33.6 136.6 na 39.85 39.84 na Mar-13 4.212 35.2 152.2 na 41.10 41.10 na
SR1169: West Fork Pine Swamp Nov-10 5.892 43.12 111.82 51.01 na 51.29 0.28 Dec-10 0.792 25.62 131.22 44.86 na 45.18 0.32 Jan-11 1.112 29.32 157.62 36.11 na 36.55 0.44 Feb-11 2.762 38.62 255.52 36.37 na 36.95 0.58 Mar-11 8.312 43.02 245.52 44.42 na 44.72 0.30 Apr-11 9.092 55.02 315.62 49.82 na 50.39 0.57 May-11 5.932 59.12 326.72 52.73 na 53.49 0.76 Jun-11 5.152 71.02 297.72 56.74 na 57.27 0.53 Jul-11 3.042 73.92 256.82 59.37 na 59.60 0.23
Aug-11 1.832 71.92 268.72 59.93 na 60.13 0.20 Sep-11 6.992 60.92 160.92 57.31 na 57.39 0.08 Oct-11 3.482 50.52 157.12 51.02 na 50.96 -0.06 Nov-11 5.892 45.42 135.32 46.82 na 46.88 0.06 Dec-11 6.092 39.92 100.32 45.17 na 45.28 0.11 Jan-12 3.962 36.92 95.42 42.44 na 42.57 0.13 Feb-12 0.342 39.32 165.22 43.22 na 43.19 -0.03 Mar-12 2.632 51.52 194.12 49.16 na 49.03 -0.13 Apr-12 5.692 52.72 221.62 na na 50.97 na May-12 4.872 61.72 223.42 na na 54.86 na Jun-12 0.002 64.8 226.2 na na 56.43 na Jul-12 2.382 70.7 196.3 60.55 na 60.49 -0.06
Aug-12 3.952 66.2 185.8 59.48 na 59.48 0.00 Sep-12 4.312 60.9 162.3 57.34 na 57.48 0.14 Oct-12 2.922 50.5 117.8 51.21 na 51.57 0.37 Nov-12 0.742 40.1 176.5 43.08 na 43.79 0.71 Dec-12 5.432 39.2 111.6 42.50 na 43.07 0.57 Jan-13 0.122 37.7 139.7 41.66 na 42.01 0.35 Feb-13 3.072 33.6 136.6 40.87 na 41.07 0.19 Mar-13 4.212 35.2 152.2 41.33 na 41.55 0.22 SR1169-trib: West Fork Pine Swamp tributary Feb-11 2.762 38.62 255.52 43.19 na 43.05 -0.14 Mar-11 8.312 43.02 245.52 44.58 na 44.52 -0.06 Apr-11 9.092 55.02 315.62 49.99 na 50.01 0.02 May-11 5.932 59.12 326.72 53.05 na 53.19 0.14
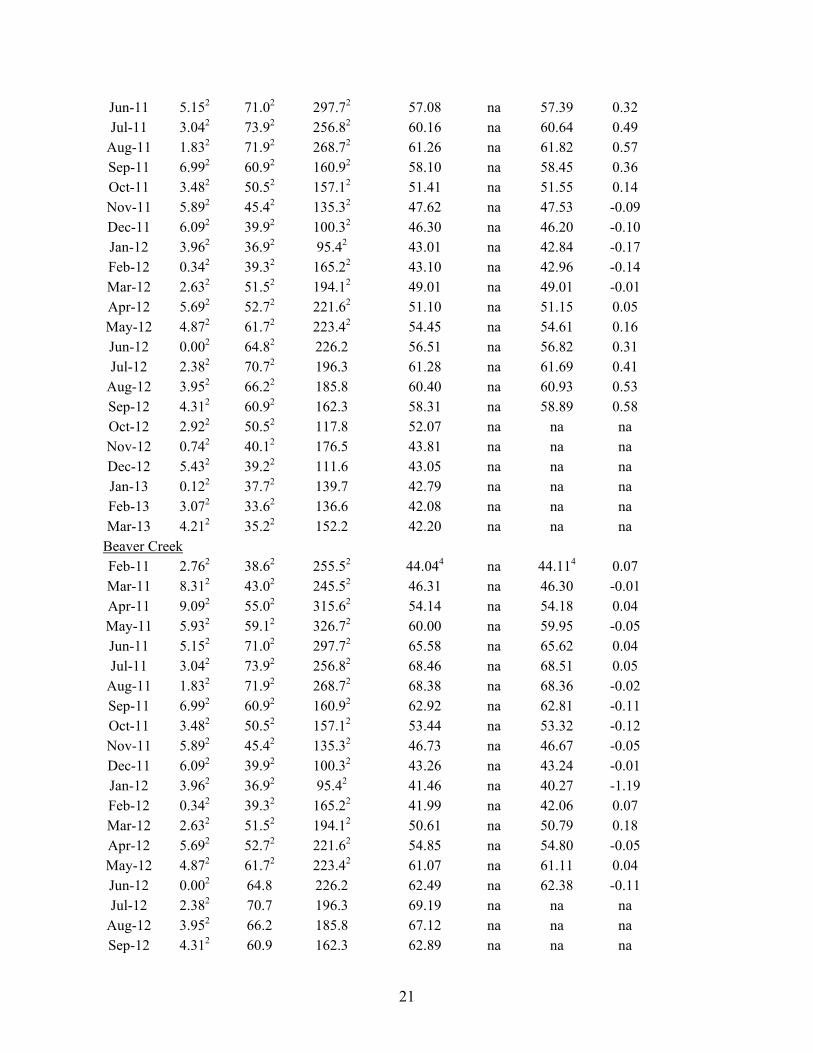
21
Jun-11 5.152 71.02 297.72 57.08 na 57.39 0.32 Jul-11 3.042 73.92 256.82 60.16 na 60.64 0.49
Aug-11 1.832 71.92 268.72 61.26 na 61.82 0.57 Sep-11 6.992 60.92 160.92 58.10 na 58.45 0.36 Oct-11 3.482 50.52 157.12 51.41 na 51.55 0.14 Nov-11 5.892 45.42 135.32 47.62 na 47.53 -0.09 Dec-11 6.092 39.92 100.32 46.30 na 46.20 -0.10 Jan-12 3.962 36.92 95.42 43.01 na 42.84 -0.17 Feb-12 0.342 39.32 165.22 43.10 na 42.96 -0.14 Mar-12 2.632 51.52 194.12 49.01 na 49.01 -0.01 Apr-12 5.692 52.72 221.62 51.10 na 51.15 0.05 May-12 4.872 61.72 223.42 54.45 na 54.61 0.16 Jun-12 0.002 64.82 226.2 56.51 na 56.82 0.31 Jul-12 2.382 70.72 196.3 61.28 na 61.69 0.41
Aug-12 3.952 66.22 185.8 60.40 na 60.93 0.53 Sep-12 4.312 60.92 162.3 58.31 na 58.89 0.58 Oct-12 2.922 50.52 117.8 52.07 na na na Nov-12 0.742 40.12 176.5 43.81 na na na Dec-12 5.432 39.22 111.6 43.05 na na na Jan-13 0.122 37.72 139.7 42.79 na na na Feb-13 3.072 33.62 136.6 42.08 na na na Mar-13 4.212 35.22 152.2 42.20 na na na
Beaver Creek Feb-11 2.762 38.62 255.52 44.044 na 44.114 0.07 Mar-11 8.312 43.02 245.52 46.31 na 46.30 -0.01 Apr-11 9.092 55.02 315.62 54.14 na 54.18 0.04 May-11 5.932 59.12 326.72 60.00 na 59.95 -0.05 Jun-11 5.152 71.02 297.72 65.58 na 65.62 0.04 Jul-11 3.042 73.92 256.82 68.46 na 68.51 0.05
Aug-11 1.832 71.92 268.72 68.38 na 68.36 -0.02 Sep-11 6.992 60.92 160.92 62.92 na 62.81 -0.11 Oct-11 3.482 50.52 157.12 53.44 na 53.32 -0.12 Nov-11 5.892 45.42 135.32 46.73 na 46.67 -0.05 Dec-11 6.092 39.92 100.32 43.26 na 43.24 -0.01 Jan-12 3.962 36.92 95.42 41.46 na 40.27 -1.19 Feb-12 0.342 39.32 165.22 41.99 na 42.06 0.07 Mar-12 2.632 51.52 194.12 50.61 na 50.79 0.18 Apr-12 5.692 52.72 221.62 54.85 na 54.80 -0.05 May-12 4.872 61.72 223.42 61.07 na 61.11 0.04 Jun-12 0.002 64.8 226.2 62.49 na 62.38 -0.11 Jul-12 2.382 70.7 196.3 69.19 na na na
Aug-12 3.952 66.2 185.8 67.12 na na na Sep-12 4.312 60.9 162.3 62.89 na na na
22
Oct-12 2.922 50.5 117.8 53.76 na na na Nov-12 0.742 40.1 176.5 42.62 na na na Dec-12 5.432 39.2 111.6 41.13 na na na Jan-13 0.122 37.7 139.7 40.86 na na na Feb-13 3.072 33.6 136.6 39.54 na na na Mar-13 4.212 35.2 152.2 40.76 na na na
Raccoon Creek Nov-10 5.601 45.81 104.01 48.38 na 47.05 -1.33 Dec-10 1.521 27.51 72.81 40.35 na 37.91 -2.44 Jan-11 1.471 31.71 79.61 39.53 na 37.73 -1.80 Feb-11 3.651 41.21 119.21 43.10 na 41.81 -1.29 Mar-11 7.511 45.71 128.21 47.84 na 47.54 -0.30 Apr-11 8.221 58.41 215.61 54.24 na 54.20 -0.04 May-11 5.331 62.91 218.21 58.37 na 58.78 0.41 Jun-11 5.152 71.02 297.72 63.41 na 64.13 0.72 Jul-11 3.042 73.92 256.82 65.83 na 66.88 1.06
Aug-11 1.832 71.92 268.72 65.83 na 66.74 0.91 Sep-11 6.992 60.92 160.92 62.24 na 62.53 0.30 Oct-11 3.482 50.52 157.12 54.06 na 53.17 -0.89 Nov-11 5.892 45.42 135.32 48.74 na 47.23 -1.51 Dec-11 6.092 39.92 100.32 45.94 na 44.63 -1.32 Jan-12 3.962 36.92 95.42 43.55 na 42.41 -1.14 Feb-12 0.342 39.32 165.22 43.23 na 41.97 -1.26 Mar-12 2.632 51.52 194.12 51.62 na 51.34 -0.29 Apr-12 5.692 52.72 221.62 55.07 na 54.98 -0.08 May-12 4.872 61.72 223.42 60.75 na 60.81 0.06 Jun-12 0.002 64.8 226.2 62.46 na 62.95 0.49 Jul-12 2.382 70.7 196.3 67.45 na 67.93 0.48
Aug-12 3.952 66.2 185.8 66.07 na 66.79 0.72 Sep-12 4.312 60.9 162.3 63.06 na 63.57 0.51 Oct-12 2.922 50.5 117.8 55.26 na 54.78 -0.48 Nov-12 0.742 40.1 176.5 46.93 na 45.19 -1.74 Dec-12 5.432 39.2 111.6 45.39 na 44.22 -1.17 Jan-13 0.122 37.7 139.7 44.41 na 43.45 -0.96 Feb-13 3.072 33.6 136.6 43.17 na 42.28 -0.90 Mar-13 4.212 35.2 152.2 44.15 na 43.63 -0.52
Brummetts Creek Nov-10 5.601 45.81 104.01 45.91 na 44.99 -0.92 Dec-10 1.521 27.51 72.81 36.20 na 35.74 -0.46 Jan-11 1.471 31.71 79.61 36.49 na 36.10 -0.39 Feb-11 3.651 41.21 119.21 40.81 na 40.61 -0.20 Mar-11 7.511 45.71 128.21 46.14 na 46.45 0.31 Apr-11 8.221 58.41 215.61 52.23 na 52.93 0.70
23
May-11 5.331 62.91 218.21 57.10 na 58.79 1.69 Jun-11 5.152 71.01 297.72 63.34 na 65.80 2.46 Jul-11 3.042 70.11 256.82 na na 69.95 na
Aug-11 1.832 68.41 268.72 na na 70.02 na Sep-11 6.992 60.92 160.92 na na 63.77 na Oct-11 3.482 50.52 157.12 52.84 na 52.96 0.13 Nov-11 5.892 45.42 135.32 46.82 na 46.07 -0.76 Dec-11 6.092 39.92 100.32 44.14 na 43.71 -0.43 Jan-12 3.962 36.92 95.42 42.18 na 41.77 -0.41 Feb-12 0.342 39.32 165.22 42.82 na 42.58 -0.23 Mar-12 2.632 51.52 194.12 na na 50.42 na Apr-12 5.692 52.72 221.62 na na 53.67 na May-12 4.872 61.72 223.42 na na 53.93 na Jun-12 0.002 64.8 226.2 na na 62.41 0.41 Jul-12 2.382 70.7 196.3 na na 66.29 na
Aug-12 3.952 66.2 185.8 66.33 na 66.50 0.17 Sep-12 4.312 60.9 162.3 61.82 na 63.19 1.38 Oct-12 2.922 50.5 117.8 53.76 na 54.11 0.34 Nov-12 0.742 40.1 176.5 44.65 na 44.29 -0.36 Dec-12 5.432 39.2 111.6 43.99 na 43.52 -0.47 Jan-13 0.122 37.7 139.7 43.11 na 42.79 -0.32 Feb-13 3.072 33.6 136.6 40.83 na 40.63 -0.21 Mar-13 4.212 35.2 152.2 41.73 na 41.75 0.02
Little Windfall Branch Feb-11 2.762 38.62 255.52 43.89 na na na Mar-11 8.312 43.02 245.52 46.00 na na na Apr-11 9.092 55.02 315.62 51.44 na 51.43 -0.01 May-11 5.932 59.12 326.72 55.51 na 55.56 0.05 Jun-11 5.152 71.02 297.72 62.06 na 61.48 -0.58 Jul-11 3.042 73.92 256.82 66.31 na 65.30 -1.01
Aug-11 1.832 71.92 268.72 65.70 na 64.73 -0.98 Sep-11 6.992 60.92 160.92 60.94 na 60.25 -0.69 Oct-11 3.482 50.52 157.12 53.59 na 51.58 -2.02 Nov-11 5.892 45.42 135.32 48.20 na 45.72 -2.48 Dec-11 6.092 39.92 100.32 45.42 na 43.74 -1.67 Jan-12 3.962 36.92 95.42 43.65 na 42.02 -1.64 Feb-12 0.342 39.32 165.22 43.91 na 42.51 -1.40 Mar-12 2.632 51.52 194.12 49.85 na na na Apr-12 5.692 52.72 221.62 51.85 na na na May-12 4.872 61.72 223.42 56.42 na na na Jun-12 0.002 64.8 226.2 59.77 na na na Jul-12 2.382 70.7 196.3 65.37 na na na
Aug-12 3.952 66.2 185.8 64.38 na na na
24
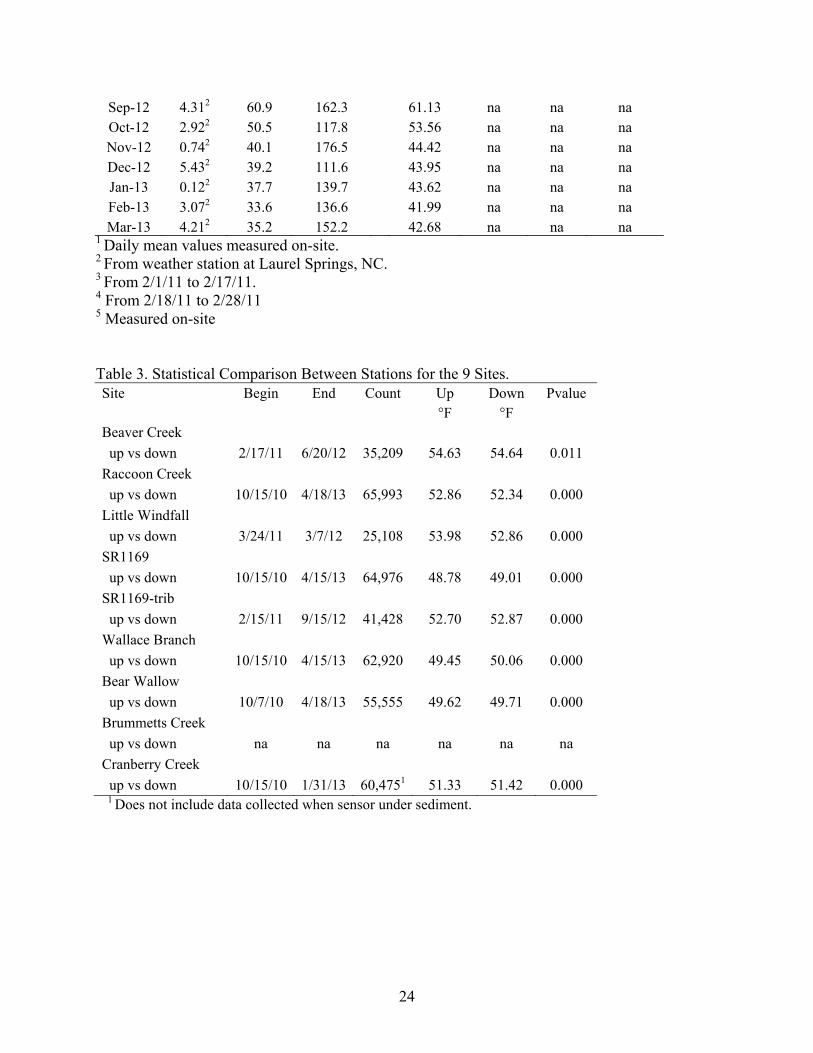
Sep-12 4.312 60.9 162.3 61.13 na na na Oct-12 2.922 50.5 117.8 53.56 na na na Nov-12 0.742 40.1 176.5 44.42 na na na Dec-12 5.432 39.2 111.6 43.95 na na na Jan-13 0.122 37.7 139.7 43.62 na na na Feb-13 3.072 33.6 136.6 41.99 na na na Mar-13 4.212 35.2 152.2 42.68 na na na
1 Daily mean values measured on-site. 2 From weather station at Laurel Springs, NC. 3 From 2/1/11 to 2/17/11. 4 From 2/18/11 to 2/28/11 5 Measured on-site
Table 3. Statistical Comparison Between Stations for the 9 Sites. Site Begin End Count Up Down Pvalue
°F °F Beaver Creek
up vs down 2/17/11 6/20/12 35,209 54.63 54.64 0.011
Raccoon Creek
up vs down 10/15/10 4/18/13 65,993 52.86 52.34 0.000
Little Windfall
up vs down 3/24/11 3/7/12 25,108 53.98 52.86 0.000
SR1169
up vs down 10/15/10 4/15/13 64,976 48.78 49.01 0.000
SR1169-trib
up vs down 2/15/11 9/15/12 41,428 52.70 52.87 0.000
Wallace Branch
up vs down 10/15/10 4/15/13 62,920 49.45 50.06 0.000
Bear Wallow
up vs down 10/7/10 4/18/13 55,555 49.62 49.71 0.000
Brummetts Creek
up vs down na na na na na na
Cranberry Creek
up vs down 10/15/10 1/31/13 60,4751 51.33 51.42 0.000 1 Does not include data collected when sensor under sediment.
25
LIST OF FIGURES
Figure 1. Locations of the stream sites.
26
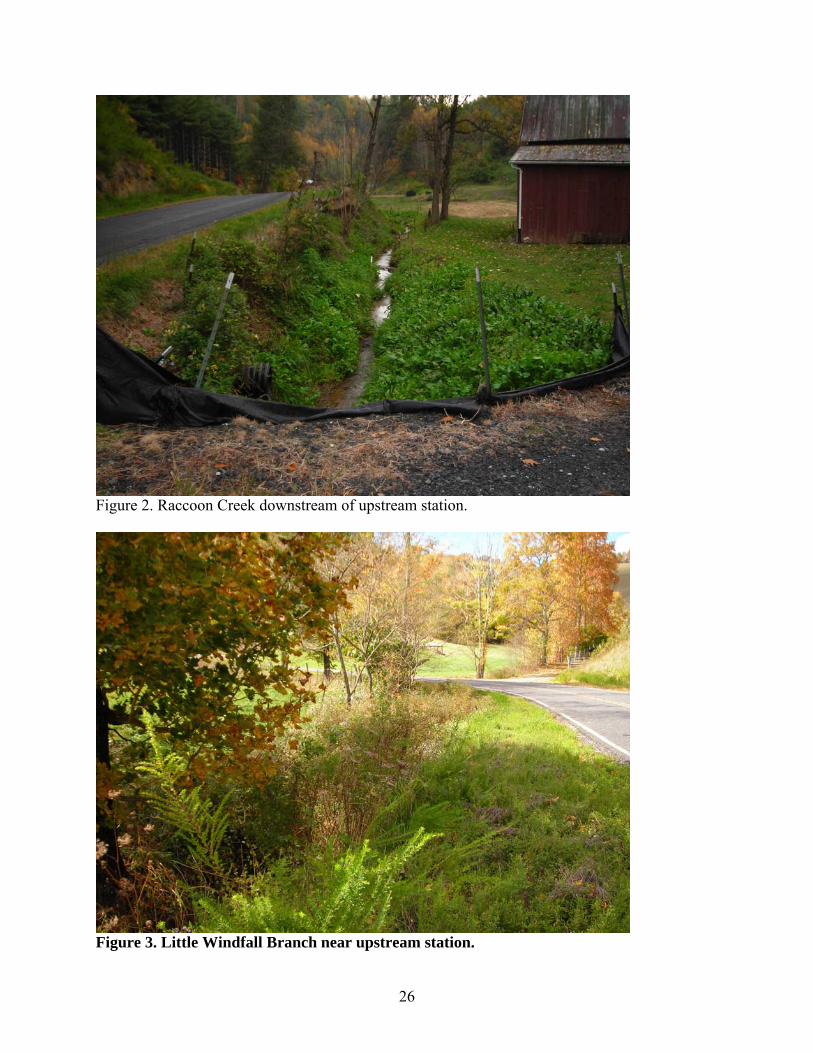
Figure 2. Raccoon Creek downstream of upstream station.
Figure 3. Little Windfall Branch near upstream station.
27
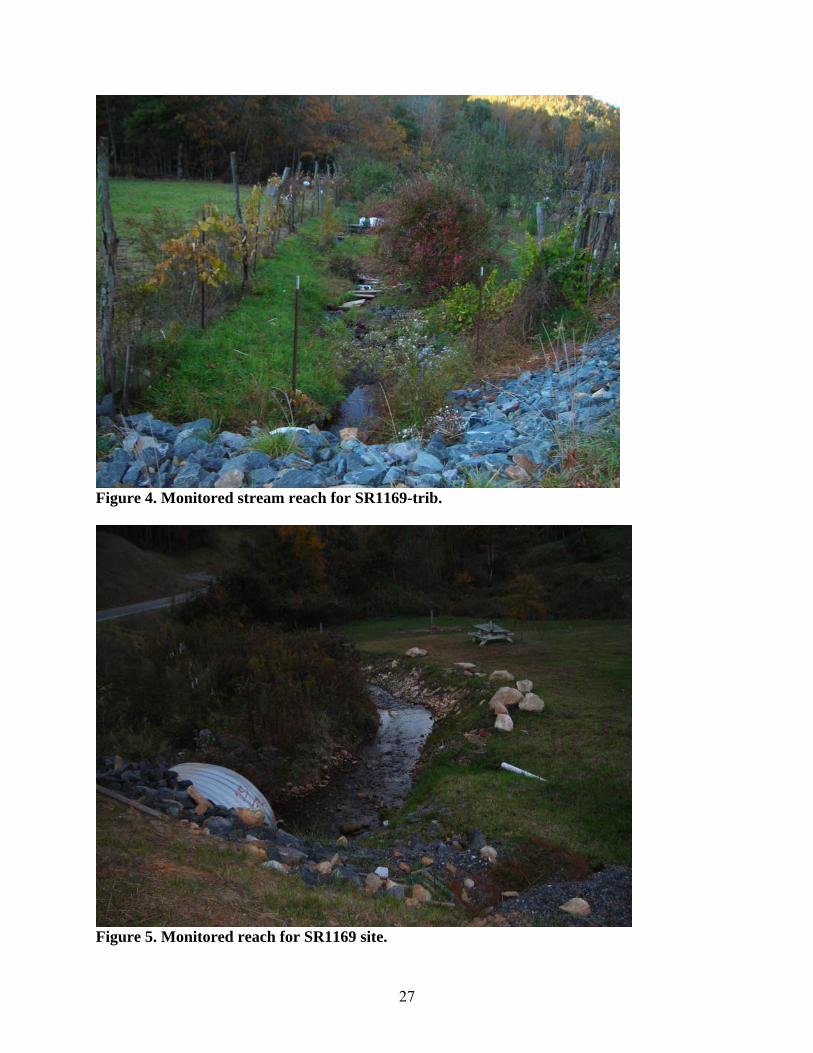
Figure 4. Monitored stream reach for SR1169-trib.
Figure 5. Monitored reach for SR1169 site.

28
Figure 6. Wallace Branch near upstream station (left) and mid station (right).
Figure 7. Monthly mean temperatures for the 3 stations on Wallace Branch.
29
Figure 8. Looking upstream from downstream monitoring station.
Figure 9. Cranberry Creek site temperature and flow data.
30
Figure 10. Cranberry Creek temperature and discharge data.
31
Figure 11. Tree canopy removal from utility crews at Brummetts Creek .
32
Figure 12. Typical section of the stream at the Bear Wallow site.