final report analysis of nutrient-response … · funding for this project was provided by ... the...
TRANSCRIPT

Final Report
Analysis of Nutrient-Response Characteristics to Support Criteria Development for Constructed Reservoirs
Submitted to: Mr. Mark Barath
U.S. EPA Region 3
Submitted by: Dr. Tamim Younos
Authors: Meredith Pavlick Warren
Tamim Younos
VWRRC Special Report No. SR37-2008
VIRGINIA POLYTECHNIC INSTITUTE AND STATE UNIVERSITY BLACKSBURG, VIRGINIA
May 2008

i
Acknowledgments Funding for this project was provided by the U.S. Environmental Protection Agency Region 3 under Grant Agreement No. X7-973350-01-0. State agencies in the USEPA Region 3 provided reservoirs’ water quality and physical data for this study. Several individuals in Region 3 state agencies responded to follow up questions and inquiries. Special acknowledgments are due to Elinor Zetina, Timothy C. Rule and Visty P. Dalal (Maryland Department of the Environment); Jean Gregory (Virginia Department of Environmental Quality); Barbara Lathrop and Martina Q. McGravey (Pennsylvania Department of Environmental Protection); John Wirts and James Adkins (West Virginia Department of Environmental Protection); and David Wolanski (Delaware Department of Natural Resources & Environmental Protection). Thank you to Dr. Carl Zipper, Associate Professor of Crop and Soil Environmental Sciences at Virginia Tech, for his advice on data analysis and review of the final report.
********************************************
Disclaimer
The views and conclusions contained in this document are those of the authors and should not be interpreted as necessarily representing the official policies, either expressed or implied, of the U.S. Government, the Virginia Water Resources Research Center or Virginia Tech.
********************************************
Virginia Water Resources Research Center 210 Cheatham Hall (0444)
Virginia Tech Blacksburg, VA 24061
(540)231-5624 FAX: (540)231-6673 E-mail: [email protected]
Website: http://www.vwrrc.vt.edu
Stephen Schoenholtz, Director
Virginia Tech does not discriminate against employees, students, or applicants on the basis of race, color, sex, sexual orientation, disability, age, veteran status, national origin, religion, or political affiliation. Anyone having questions concerning discrimination should contact the Equal Opportunity and Affirmative Action Office.
ii
Executive Summary In 1998, the USEPA mandated that all states develop numeric nutrient criteria for rivers, streams, lakes, reservoirs, wetlands and estuaries. This study focus on nutrient criteria development for constructed impoundments (“reservoirs”). A fundamental assumption in developing nutrient criteria for reservoirs is that nutrient level-nutrient response relationships similar to those found in literature for natural lakes can be applied to reservoirs. Research has shown that natural lakes within a given physiographic region often respond similarly to nutrient inflows because of a similarity of physical characteristics. However, nutrient response relationships among reservoirs in a given region can be more variable because the greater variability of reservoir physical characteristics. The purpose of this project was to investigate nutrient response relationships that are relevant to nutrient criteria development for reservoirs within USEPA Region 3 states. Specific objectives of the project were: (1) develop a regional dataset for nutrient criteria development; (2) determine if reservoirs demonstrate consistent relationships between nutrient levels (total nitrogen and total phosphorous) and two response variables (secchi depth and chlorophyll-a); and (3) determine if factors such as reservoir physical features and ecoregion exert influence on reservoirs’ nutrient-response characteristics. Water quality data and reservoirs’ physical characteristic data for this study were obtained from the federal and state agencies in USEPA Region 3. The data were processed in accordance to the USEPA nutrient criteria development guidance. Statistical analysis was performed using linear and multivariate regression statistical models. Results of this study mostly support published scientific literature. The nutrient level – nutrient response relationships resemble those which are found in lakes and reservoirs elsewhere, but the variability in how nutrients respond in reservoirs is clearly evident through the generally moderate to weak relationships present. Results show that total phosphorus and chlorophyll-a are highly correlated in Region 3 reservoirs. This indicates that chlorophyll-a could be a good indicator of nutrient impairment in Region 3 reservoirs. The relationship between TP and secchi depth was also strong. However, the relationship between secchi depth and chlorophyll-a was weaker than expected. The analysis found minimal influence of reservoir physical parameters on nutrient responses. Furthermore, from results of this study, it was difficult to conclude whether or not the relationships between nutrients, nutrient responses and physical characteristics are significantly different within the ecoregions. These results may be due to poor quality of reservoirs’ physical data or due to the highly variable nature of reservoirs. Therefore, results of this study cannot suggest a criteria formulation that includes both nutrients and reservoir physical features. A major effort of this project was to develop a regional dataset. Inconsistent water quality data and incomplete/unverified reservoir physical characteristic data increased the uncertainty of statistical analysis. Standardizing data reporting/data management methods between states and within individual states should be a high priority activity.

iii
Table of Contents Page Acknowledgments i Executive Summary ii 1. Project Overview 1 2. Project Objectives 3 3. Research Approach 3 4. Results and Discussion Developing Regional Dataset 4 Dataset Development Issues 9
Data Characteristics and Distribution 10
Statistical Analysis 16
Scatter Plot Matrix and Spearman’s ρ 16 Linear Regression Models- Nutrient Responses: Reservoir Nutrients Levels 19
Reservoir Physical Characteristics 23 Ecoregion Influences 24
Multivariate Regression Models – Nutrient Responses: Physical Characteristics 29 Ecoregion Influences 31
5. Conclusions 33 6. References 35 7. Appendix – Nutrients Data 38

1
1 Project Overview
1.1 National Nutrient Strategy In 1998, the Environmental Protection Agency (USEPA) mandated that all states develop numeric nutrient criteria for rivers, streams, lakes, reservoirs, wetlands and estuaries (USEPA 1998). This ruling was in response to the increasing number of water bodies suffering from nutrient pollution across the country. The USEPA recommended that criteria be developed for nitrogen, phosphorus, chlorophyll-a, and secchi depth. Some states have already established nutrient criteria, but the process is still underway in other states (USEPA 2008a). Criteria development is scheduled for completion in 2010 for all 50 states (USEPA 2008b). As of January 2008, all USEPA Region 3 states were on schedule to finish criteria development by the 2010 deadline1. West Virginia (WV) and Virginia (VA) have established nutrient criteria for lakes and reservoirs. West Virginia’s lakes and reservoirs criteria have been approved by the state legislature and are waiting final USEPA approval and the state is currently developing criteria for rivers and streams. Virginia’s lake and reservoir criteria have been submitted to the USEPA for final approval. Virginia has satisfied the nutrient criteria requirements for estuarine waters by adopting the Chesapeake Bay standards. The District of Columbia has also adopted the Chesapeake Bay standards for estuaries and has satisfied USEPA requirements. Maryland (MD) and Delaware (DE) are near the end of the data collection and analysis phase of criteria development for lakes and reservoirs and rivers and stream; both states are scheduled to complete these criteria development by the end of 2008. Delaware has adopted the Chesapeake Bay nutrient standards for estuaries, while MD is nearing the end of this process. Pennsylvania (PA) is still in the data collection and analysis phase for all criteria. The state is scheduled to develop final criteria in 2009.
1.2 Lake vs. Reservoirs The USEPA defines lakes as “natural and artificial impoundments with a surface area greater than 10 acres and a mean water [retention] time of 14 days” (USEPA 2000a, p.3-1). Reservoirs are defined as “man-made lakes for which the primary purpose of the impoundment is other than recreation (e.g., boating, swimming) or fishing, and the water retention time and water body depth and volume vary widely” (USEPA 2000a, p. 3-1). For this research, reservoirs are defined as man-made impoundments with potential to be regulated by the states’ numeric and/or narrative nutrient criteria. A majority of standing water bodies in the USEPA Region 3 are man-made reservoirs. For example, there are only two natural lakes in VA, only one natural lake in WV and approximately 70% of the lakes managed by the state of PA are man-made. The USEPA reservoir definition highlights similarities and differences between lakes and man-made reservoirs. These bodies of water are similar in that both are affected by land use, climate
1 All information in this paragraph from USEPA (2008b).
2
and geologic features of the watershed. However, physical features such as dam height and width, water inflow, and retention time are major characteristics that differentiate reservoirs from lakes. Dam height and width will influence the surface area, depth and volume of a reservoir. Reservoir inflow sources include direct precipitation, tributary and groundwater inflow, and surface runoff. Reservoirs usually receive a greater portion of their inflow from their tributaries than natural lakes. “Because of the significant flow of water from tributaries and the slowing of this water by the dam, reservoirs have a longitudinal gradient (from the region of inflow to the dam) that is lacking in lakes” (Walker, Younos and Zipper 2007, p.6). “[Retention] times vary widely between natural lakes and reservoirs and among reservoirs” (USEPA 2000a, p.3-7). A reservoir’s retention time is defined as the ratio of volume to average inflow from tributaries. A 1998 study of the National Inventory of Dams found that retention time varied between 1 and 750 days, and that retention time is influenced by location (as cited in Walker, Younos and Zipper 2007). For example, reservoirs located along the Mississippi River typically have a much lower retention times than located along headwater streams (study cited by Walker, Younos and Zipper 2007). Retention time is a reservoir characteristic that can influence nutrient responses. “Limnologists generally consider lake-like characteristics to increase with water mean [retention] time. Many studies suggest that phytoplankton do not accumulate at retention times less than 7 days” (USEPA 2000a, p.3-1). In general, a reservoir may resemble a river, if it is long and narrow and the water retention time is less than 14 days. A reservoir may more closely resemble a natural lake if the water body has a smaller shoreline to surface area ratio and the water retention time is long (months to over a year).
1.3 Lake and Reservoir Nutrient Responses Nitrogen (N) and phosphorus (P) are essential nutrients for the nourishment and growth of living organisms. N and P are considered macronutrients, meaning they are required in large quantities to sustain life. Various forms of these nutrients are used by organisms that inhabit lakes and reservoirs, such as photosynthesizing organisms known as primary producers. Macrophytes (aquatic plants) and algae constitute primary producers in lake and reservoirs. When nutrients (N and P) in lakes and reservoirs are limited (i.e., less available), growth of primary producers is usually slowed or halted. When nutrients are in excess, proliferation of primary producers may occur, a condition that usually results in the eutrophication of a lake and reservoir. There is a significant body of scientific literature on the relationship between nutrient level and nutrient response in natural lakes. Nutrient response in lakes is measured in several ways: the amount of living organisms found in the water column (total chlorophyll-a) and/or water turbidity (usually expressed as secchi depth). The relationship between phosphorus and chlorophyll-a in lakes has been well documented since Schindler’s (1974) research on the effects of P-limitations on algal responses in lakes (Walker, Younos and Zipper 2007). Previous research has shown that at low TP levels, algal responses is often linear or log-linear at commonly occurring TP levels, while at high TP levels, the
3
relationship between TP and chlorophyll-a can be sigmoid in data sets extending from relatively low to very high TP levels (studies cited by Walker, Younos and Zipper 2007). Similar response relationships in lakes have been found between nitrogen and algal production. Research has shown that lakes can be nitrogen limited at least part of the year, even if on average nitrogen levels are high. In some instances local limitation occurs, for example because of stratification. Phosphorous is generally considered to be the nutrient that has the greatest limiting effect in algal biomass in natural lakes because some algal species can fix N from the atmosphere. However, research has also shown that algal biomass production in lakes can be co-limited by N and P (Walker, Younos and Zipper 2007). “Co-limitation (of N and P) occurs because numerous species are present and because algal communities and species vary in the proportions in which they require nitrogen and phosphorus. When algal populations are co-limited by nitrogen and phosphorus, populations can be expected to respond to changes in the supply of either nutrient” (Walker, Younos and Zipper 2007, p.12). A fundamental assumption in developing nutrient criteria for reservoirs is that nutrient level-nutrient response relationships similar to those found in literature for natural lakes can be applied to reservoirs. Research has shown that lakes within a given physiographic region often respond similarly to nutrient inflows because of a similarity of physical characteristics. This is attributed to the fact that, within a given region, a common set of geomorphologic forces were responsible for the formation of lakes. However, nutrient response relationships among reservoirs in a given region can be more variable because the greater variability of reservoir physical characteristics.
2 Project Objectives This study was conducted in association with a comprehensive literature review of nutrients in lakes and reservoirs that was funded independently of this project (Walker, Younos and Zipper 2007). The purpose of this project is to investigate nutrient response relationships that are relevant to nutrient criteria development for constructed impoundments (“reservoirs”) within USEPA Region 3 states. Specific objectives of the project are:
(a) Develop a regional dataset (b) Determine if reservoirs demonstrate consistent relationships between water-column
nutrient levels (TN and TP) and response variables (secchi depth, and chlorophyll-a) (c) Determine if factors such as physical features and ecoregion exert a consistent and
predictable influence on reservoirs’ nutrient-response characteristics.
3 Research Approach Water quality and reservoir physical characteristic data used in this study were provided by the USEPA Region 3 states. The data were processed in accordance to the USEPA nutrient criteria development guidance (USEPA 2000a and USEPA 2000b). Statistical analysis was performed using linear and multiple regression and nonparametric statistical models (JMP 2007).
4
4 Results and Discussion Study results described in this report include reservoir regional dataset development, data characteristics, data distribution, and statistical analysis including general correlations (scatter plot matrix and Spearman’s ρ), and using linear regression models to predict nutrient levels versus nutrient responses, and using multivariate regression models for assessing the effects of reservoir physical characteristics and ecoregions on nutrient responses in reservoirs.
4.1 Developing Regional Dataset
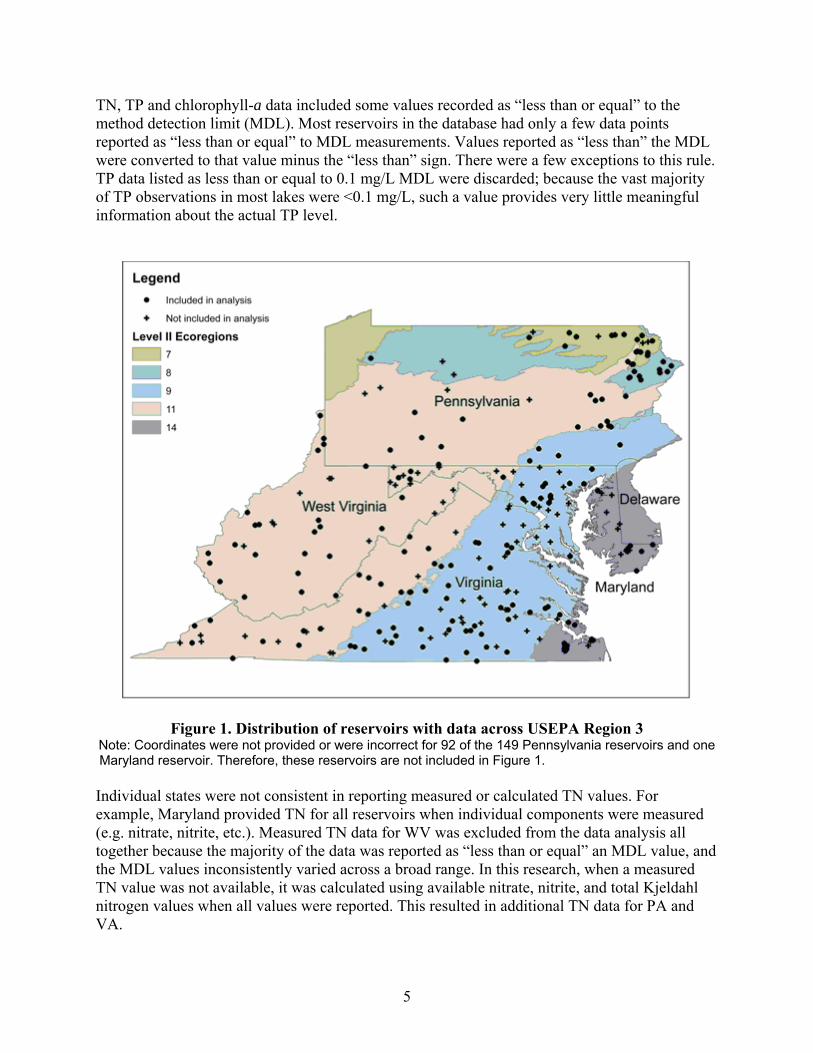
4.1.1 Data Retrieval Data for water quality and reservoir physical characteristics used in this study were provided by the USEPA Region 3 states. The following state agencies in USEPA Region 3 provided water quality and physical data for reservoirs: Virginia Department of Environmental Quality, Virginia Department of Conservation and Recreation, Pennsylvania Department of Environmental Protection, Maryland Department of the Environment, West Virginia Department of Environmental Protection. In addition, water quality and physical data for West Virginia generated by the U.S. Army Corps of Engineers Huntington District were obtained from the West Virginia Nutrient Criteria Committee. Data for Delaware reservoirs was obtained from the USEPA River Nutrient Database that was established for developing guidance nutrient criteria (USEPA 2003). The USEPA River Nutrient Database was cross-referenced with data provided by the other Region 3 states (MD, PA, VA and WV). However, the database did not provide any additional data above what was provided by the four states. Figure 1 shows the distribution of USEPA Region 3 reservoirs with available data, and those included in the data analysis. Initially, the retrieved data for each state were screened for parameter consistency and reformatted for ease in data merging. Then the clean data were merged and processed into a dataset for statistical analysis. The process of screening and merging data from different states was time exhaustive effort due to data management and reporting inconsistencies among the states. The screened and merged dataset included 354 reservoirs from PA, MD, VA and WV.
4.1.2 Data Screening – Water Quality Data Water quality parameters used in this analysis included total nitrogen (TN) and total phosphorus (TP) and nutrient response variables, i.e., chlorophyll-a and secchi depth. Available data for these parameters spanned over 20 years, with some data dating back to the early 1980s. Following the USEPA’s recommended practice for developing guidance criteria, all data collected before 1990 were discarded (USEPA 2000b). Furthermore, only the water-quality data (TN, TP, and chlorophyll-a) collected within 1 meter or less of the water surface were considered for statistical analysis. Secchi depths measured at the same location as the collection of water samples were included in analysis.
5
TN, TP and chlorophyll-a data included some values recorded as “less than or equal” to the method detection limit (MDL). Most reservoirs in the database had only a few data points reported as “less than or equal” to MDL measurements. Values reported as “less than” the MDL were converted to that value minus the “less than” sign. There were a few exceptions to this rule. TP data listed as less than or equal to 0.1 mg/L MDL were discarded; because the vast majority of TP observations in most lakes were <0.1 mg/L, such a value provides very little meaningful information about the actual TP level.
Figure 1. Distribution of reservoirs with data across USEPA Region 3 Note: Coordinates were not provided or were incorrect for 92 of the 149 Pennsylvania reservoirs and one Maryland reservoir. Therefore, these reservoirs are not included in Figure 1. Individual states were not consistent in reporting measured or calculated TN values. For example, Maryland provided TN for all reservoirs when individual components were measured (e.g. nitrate, nitrite, etc.). Measured TN data for WV was excluded from the data analysis all together because the majority of the data was reported as “less than or equal” an MDL value, and the MDL values inconsistently varied across a broad range. In this research, when a measured TN value was not available, it was calculated using available nitrate, nitrite, and total Kjeldahl nitrogen values when all values were reported. This resulted in additional TN data for PA and VA.

6
The data remaining after the initial screening represented the entire calendar year. However, a large percentage of the data fell between and within the months of April and October. A smaller percentage of reservoirs had data available for November through March. The varied temporal data distribution is the result of changing state water monitoring programs in recent years. More recent data usually fell within the April to October range. States also typically collected samples during the same months each year. For example, Pennsylvania reservoirs were mainly monitored in April/May, July/August and October. Virginia reservoirs were monitored most months between April and October. It was decided that only data sampled in the April to October range would be included in the statistical analysis. Selecting April to October data ensured that data collected during a large part of the growing season were included in the analysis. This approach also eliminated the bias toward states and reservoirs with more data available November through March. Table 1 outlines the monthly distribution of the data. Table 2 provides descriptions of parameters included in the screened and merged water quality dataset. Table 1. Number of reservoirs with at least one water monitoring point per given month
SD (m) TN (mg/L) TP (mg/L) Chl-a (μg/L) VA MD PA WV VA MD PA WV VA MD PA WV VA MD PA WV
1 0 1 1 0 3 5 4 0 4 5 7 1 1 5 4 0 2 2 1 0 10 4 3 4 0 5 3 6 11 2 3 4 10 3 2 9 3 1 4 11 8 0 5 11 11 2 2 11 8 1 4 49 10 67 20 58 12 78 0 56 12 81 18 56 12 77 17 5 62 12 57 23 68 10 61 0 68 11 60 22 63 12 70 21 6 59 27 7 16 67 6 22 0 67 28 23 13 67 29 23 13 7 69 42 48 17 80 18 53 0 80 39 53 24 83 41 53 13 8 75 39 86 26 87 18 85 0 86 43 85 31 81 43 97 25 9 26 25 19 20 67 11 33 0 67 27 33 24 59 26 33 16
10 49 5 73 8 40 5 85 0 48 8 85 20 54 7 84 9 11 3 4 35 11 5 6 35 0 5 6 37 12 3 6 40 11 12 2 3 0 5 4 5 5 0 5 5 8 6 1 5 5 6
Total 398 178 396 157 487 110 473 0 496 198 489 184 472 200 498 142
Table 2. Description of all nutrient and nutrient response data prior to data reduction
MD PA VA WV SD TN TP Chl-a SD TN TP Chl-a SD TN TP Chl-a SD TN TP Chl-a ft mg/L mg/L μg/L ft mg/L mg/L μg/L ft mg/L mg/L μg/L ft mg/L mg/L μg/L
Count 1,208 520 732 961 796 2,142 2,104 1,704 1,704 2,605 2,628 1,907 332 NA 549 279 Median 1.5 1.5 0.027 7.46 1.4 0.8 0.026 7.70 1.5 0.5 0.020 5.07 1.4 NA 0.020 6.00 Mean 2.2 1.8 0.060 15.8 1.8 1.7 0.183 1029 1.8 0.6 0.034 13.7 1.9 NA 0.031 15.6 Max. 10.0 6.5 1.009 483 7.8 40.0 44.444 550,000 9.2 4.8 4.000 754 14.5 NA 0.520 255 Min. 0.1 0.2 0.003 0.10 0.2 0 0.0004 0 0.1 0.2 0.010 0 0.2 NA 0.001 0

7
4.1.3 Data Reduction – Water Quality Data The complete dataset included 354 reservoirs from PA, MD, VA and WV (see Figure 1). The amount of data available for each reservoir and associated parameters varied from a few samples to over a thousand. To equally weight all reservoirs, the data for each water quality parameter were reduced to a single value for each reservoir. The process was completed following USEPA recommendations for data reduction for lakes and reservoirs (USEPA 2000a; USEPA 2000b). Data reduction was completed in a two step process. First, median monthly values were calculated from all data available for a given month for each reservoir. At least one data point had to be present during a month for a monthly median to be calculated. A median value was then calculated from the monthly median values for each reservoir. Median values for at least three months (April through October) had to available for a reservoir median value to be calculated and included in the statistical analysis. The minimum of three values is reflective of the available data. Many reservoirs in MD, PA and WV were only sampled during three months from April through October. Increasing the minimum median requirements would have resulted in a loss of about a third of the reservoirs included in the final analysis. The data reduction process also lessened the effect of outliers on the outcome of statistical analysis. The wide range of measured values is evident in Table 2. For example, reported chlorophyll-a values from Pennsylvania ranged from 0 μg/L to 550,000 μg/L, yet the calculated median value is 7.7 μg/L. A chlorophyll-a value of 550,000 μg/L is obviously very high, and is possibly erroneous, but it was ultimately muted by the reduction process. See Figure 2 for an overview of the data reduction process.
Figure 2. Data reduction process Source: Adopted from USEPA region IX guidelines (USEPA 2000b).
8
The reduced dataset used for statistical analysis included monthly median values of TN, TP, secchi depth and chlorophyll-a for 218 lakes, down from 354 reservoirs in the original dataset. However, the 218 reservoirs in the dataset did not have a complete set of values for all four (SD, TN, TP, and chlorophyll-a) nutrient-criteria parameters.
4.1.4 Data screening and Data Reduction – Reservoirs’ Physical Characteristics Reservoir physical characteristic data used in the analysis include reservoir depth, volume, surface area and retention time. Compared to water quality data, available physical data was limited in terms of amount and accuracy. Unlike water quality data, there are no certified or standard methods for determining the physical characteristics of a reservoir and methods vary across the states and state agencies. Most of the reported physical data were estimated or calculated using different and often unverified methods. For example, PA used aerial photos to estimate reservoir surface area when no other data was available (Lathrop 2007). In Virginia, the Academic Advisory Committee for the VADEQ extrapolated mean through flow as a function of watershed area using a relationship estimated from USGS flow gages (AAC 2005). Mean through flow was used to estimate retention time when reservoir volume was known (AAC 2005). Some state datasets included both a “maximum” and “average” value for reservoir depth, volume, and surface area. For example, Bear Lake in WV had a maximum depth of 20ft and an average depth of 6ft. Some reservoirs also had multiple values for some physical parameters due to multiple agencies providing data for this research. In most instances the values were labeled as either “average” or “maximum,” but some values were only labeled with the name of the parameter represented. For example, three values were provided for “surface area” for Forest Lake in PA: 46ac, 49ac and 65ac. However, it was unknown whether the values represented average or maximum values. Only a single value for each parameter for a given reservoir was included in the analysis. A data reduction process was used to calculate a single value for each parameter when multiple values were provided. Based on professional judgment, it was decided that “average” values would be used in the analysis since they are a better representation of the overall physical characteristic of each reservoir. As previously stated, the method for determination of the physical data was often unreported, so it was difficult to decide which values were the most accurate representations of “average” conditions. However, this discrepancy in data had to be considered during the data reduction process. Based on professional judgment, it was decided that when multiple values were provided for a given parameter, and not labeled as “maximum,” they would be averaged to calculate a single parameter value for a reservoir. If two parameter values were provided and were within 20% of each other, the given values were considered “average” values and therefore included in the calculation of the parameter for a reservoir. If the two values differed by more than 20%, the lower value was included in the dataset, the assumption being that the larger value was a “maximum” value and the smaller value was the “average” value. When three or more values were provided, once again all values had to be within 20% of each other. When any value(s)
9
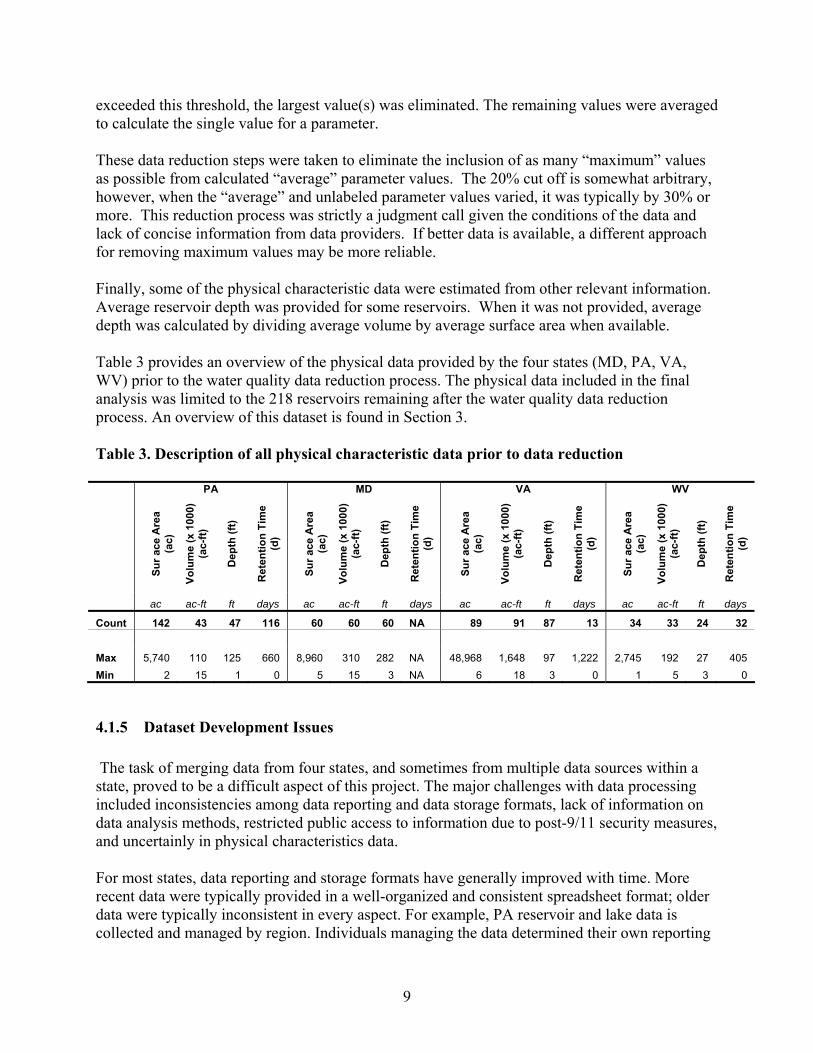
exceeded this threshold, the largest value(s) was eliminated. The remaining values were averaged to calculate the single value for a parameter. These data reduction steps were taken to eliminate the inclusion of as many “maximum” values as possible from calculated “average” parameter values. The 20% cut off is somewhat arbitrary, however, when the “average” and unlabeled parameter values varied, it was typically by 30% or more. This reduction process was strictly a judgment call given the conditions of the data and lack of concise information from data providers. If better data is available, a different approach for removing maximum values may be more reliable. Finally, some of the physical characteristic data were estimated from other relevant information. Average reservoir depth was provided for some reservoirs. When it was not provided, average depth was calculated by dividing average volume by average surface area when available. Table 3 provides an overview of the physical data provided by the four states (MD, PA, VA, WV) prior to the water quality data reduction process. The physical data included in the final analysis was limited to the 218 reservoirs remaining after the water quality data reduction process. An overview of this dataset is found in Section 3. Table 3. Description of all physical characteristic data prior to data reduction PA MD VA WV
Su
r ace
Are
a (a
c)
Volu
me
(x 1
000)
(a
c-ft)
Dep
th (f
t)
Ret
entio
n Ti
me
(d)
Sur a
ce A
rea
(ac)
Volu
me
(x 1
000)
(a
c-ft)
Dep
th (f
t)
Ret
entio
n Ti
me
(d)
Sur a
ce A
rea
(ac)
Volu
me
(x 1
000)
(a
c-ft)
Dep
th (f
t)
Ret
entio
n Ti
me
(d)
Sur a
ce A
rea
(ac)
Volu
me
(x 1
000)
(a
c-ft)
Dep
th (f
t)
Ret
entio
n Ti
me
(d)
ac ac-ft ft days ac ac-ft ft days ac ac-ft ft days ac ac-ft ft days
Count 142 43 47 116 60 60 60 NA 89 91 87 13 34 33 24 32 Max 5,740 110 125 660 8,960 310 282 NA 48,968 1,648 97 1,222 2,745 192 27 405 Min 2 15 1 0 5 15 3 NA 6 18 3 0 1 5 3 0
4.1.5 Dataset Development Issues The task of merging data from four states, and sometimes from multiple data sources within a state, proved to be a difficult aspect of this project. The major challenges with data processing included inconsistencies among data reporting and data storage formats, lack of information on data analysis methods, restricted public access to information due to post-9/11 security measures, and uncertainly in physical characteristics data. For most states, data reporting and storage formats have generally improved with time. More recent data were typically provided in a well-organized and consistent spreadsheet format; older data were typically inconsistent in every aspect. For example, PA reservoir and lake data is collected and managed by region. Individuals managing the data determined their own reporting

10
formats, ranging from word documents to text files to excel spreadsheets. In WV, all data was provided in spreadsheets, however each agency provided it in a different format. The second challenge for merging the data resulted from limited information on data analysis procedures and reporting protocols. With the exception of MD, and to some extent VA, the procedures for data analysis were not provided with the reported data. Data analysis information was crucial for determining if a column of data labeled ‘nitrate mg/L’ for PA was processed and reported in a similar manner to a column of data with the same or similar heading for VA. Analysis procedure and parameter descriptions could be inferred from the USEPA STORET analytic method and parameter codes when provided with the retrieved data. However, this information was limited because some analytical methods for nutrients are used to assess multiple parameters. In many cases, the only information that could be inferred from the analytical method code was a potential list of represented parameters. Problems also existed with the STORET parameter codes. The STORET system was updated in 1999 (USEPA 2008c). The switch to a new system, as well as varying data entry procedures for individual states, created conflicts in codes between individual states. Ultimately, to assure accuracy with merging data, it was necessary to contact each state to verify any assumption about data analysis methods and actual reported parameters. Obtaining physical characteristics data for reservoirs was hindered by post-9/11 data security measures. Some agencies were hesitant, or refused, to release information about the physical characteristics of reservoirs due to U.S. Homeland Security concerns regarding terrorist attacks on drinking water supplies (Dalal 2007). Physical data that was not readily available from previous research had to be requested from each agency housing the information. Even when agencies provided data, the use of the data was severely restricted. Unfortunately, this is a problem that will unlikely go away in the foreseeable future.
4.2 Data Characteristics and Distribution The analyzed dataset included water quality and physical characteristic data for 218 reservoirs from MD, PA, VA and WV. Table 4 and Table 5 provide a general description of the analyzed dataset. The complete dataset (for water quality data only) is documented in Appendix A. Table 4. Description of water quality data included in the statistical analysis
MD PA VA WV
SD TN TP Cl-a ft mg/L mg/L μg/L
SD TN TP Cl-a ft mg/L mg/L μg/L
SD TN TP Cl-a ft mg/L mg/L μg/L
SD TN TP Cl-a ft mg/L mg/L μg/L
Count 21 13 21 22
74 96 92 90
66 70 70 71
24 0 19 20
Max
Min
5.0 3.8 0.153 92.6 0.4 0.3 0.008 1.85
5.6 4.4 0.196 160 0.3 0.1 0.005 1..35
7.9 1.7 0.155 180 0.4 0.2 0.010 1.34
6.5 0 0.072 43.7 0.3 0 0.004 0.50

11
Table 5. Description of physical characteristic data included in the statistical analysis
MD PA VA WV
Surf
ace
Are
a
Dep
th
Volu
me
(x10
00)
Ret
entio
n Ti
me
Surf
ace
Are
a
Dep
th
Volu
me
(x10
00)
Ret
entio
n Ti
me
Surf
ace
Are
a
Dep
th
Volu
me
(x10
00)
Ret
entio
n Ti
me
Surf
ace
Are
a
Dep
th
Volu
me
(x10
00)
Ret
entio
n Ti
me
ac ft ac-ft days ac ft
ac-ft days ac ft ac-ft days ac ft
ac-ft days
Count 22 22 22 0 96 37 32 84 68 68 69 11 25 15 24 23
Max 4,500 151 132 NA 5,740 125 110 660 48,968 97 1,648 1,222 2,745 16 192 405 Min 5 3 15 NA 2 1 15 1 6 3 41 16 1 4 5 2
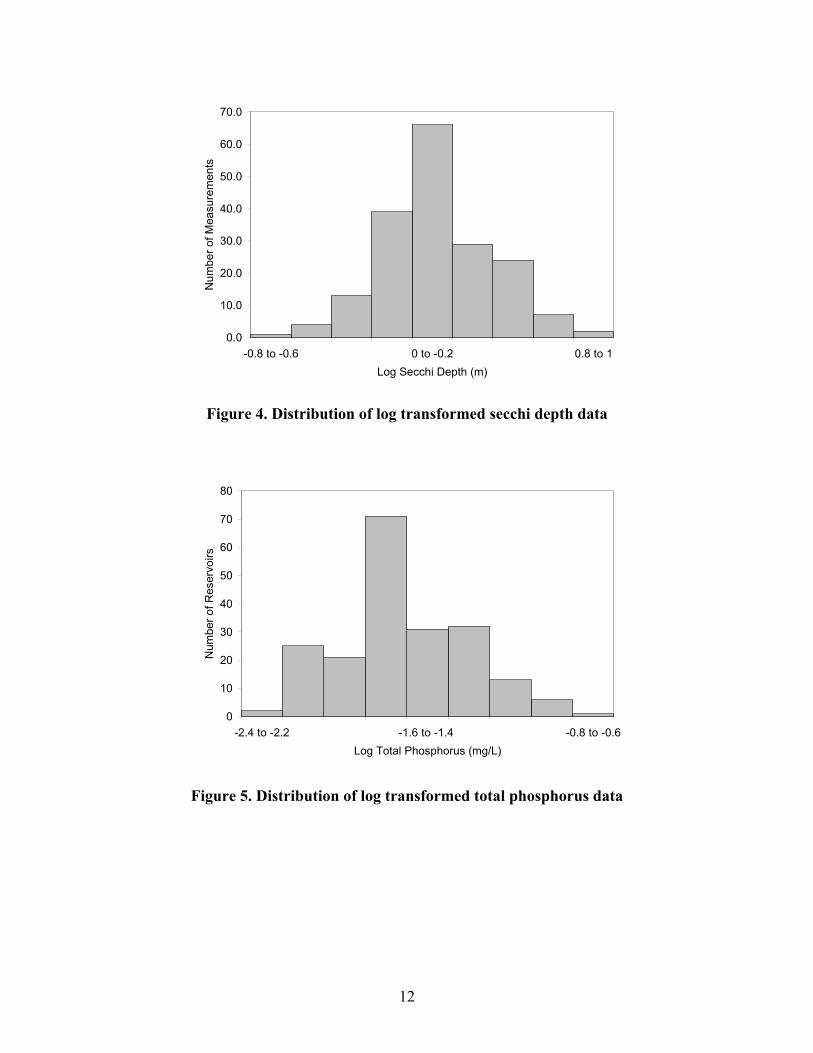
4.3 Data Distribution Nutrient parameters The data for nutrient parameters included in the statistical analysis were not normally distributed. TP, TN and chlorophyll-a data are typically found at low levels in the reservoir water column. The majority of the data for these parameters were skewed to the lower-end of the scale. All parameters included in the statistical analysis had to be base-10 log transformed to obtain a normal distribution. Secchi depth offers a good example of the difference between the skewed data distribution (Figure 3) and log transformed data distribution (Figure 4) for the nutrient parameters. Over 75 percent of the secchi depth measurements were taken at 2m or less, but the data included measurements taken at 0.3m to 7.9m. Figures 5, 6 and 7 show the log transformed distributions of TP, chlorophyll-a and TN.
0
10
20
30
40
50
60
70
80
90
0-1 1-2 2-3 3-4 4-5 5-6 6-7 7-8Secchi Depth (m)
Num
ber o
f Mea
sure
men
ts
Figure 3. Distribution of secchi depth data Note: Secchi depth data has not been log transformed.
12
0.0
10.0
20.0
30.0
40.0
50.0
60.0
70.0
0.8 to 10 to -0.2-0.8 to -0.6Log Secchi Depth (m)
Num
ber o
f Mea
sure
men
ts
Figure 4. Distribution of log transformed secchi depth data
0
10
20
30
40
50
60
70
80
-0.8 to -0.6-1.6 to -1.4 -2.4 to -2.2Log Total Phosphorus (mg/L)
Num
ber o
f Res
ervo
irs
Figure 5. Distribution of log transformed total phosphorus data
13
0
5
10
15
20
25
30
35
40
45
2.25 to 2.5 1 to 0.75-0.75 to -0.5Log Chlorophyll-a (μg/L)
Num
ber o
f Res
ervo
irs
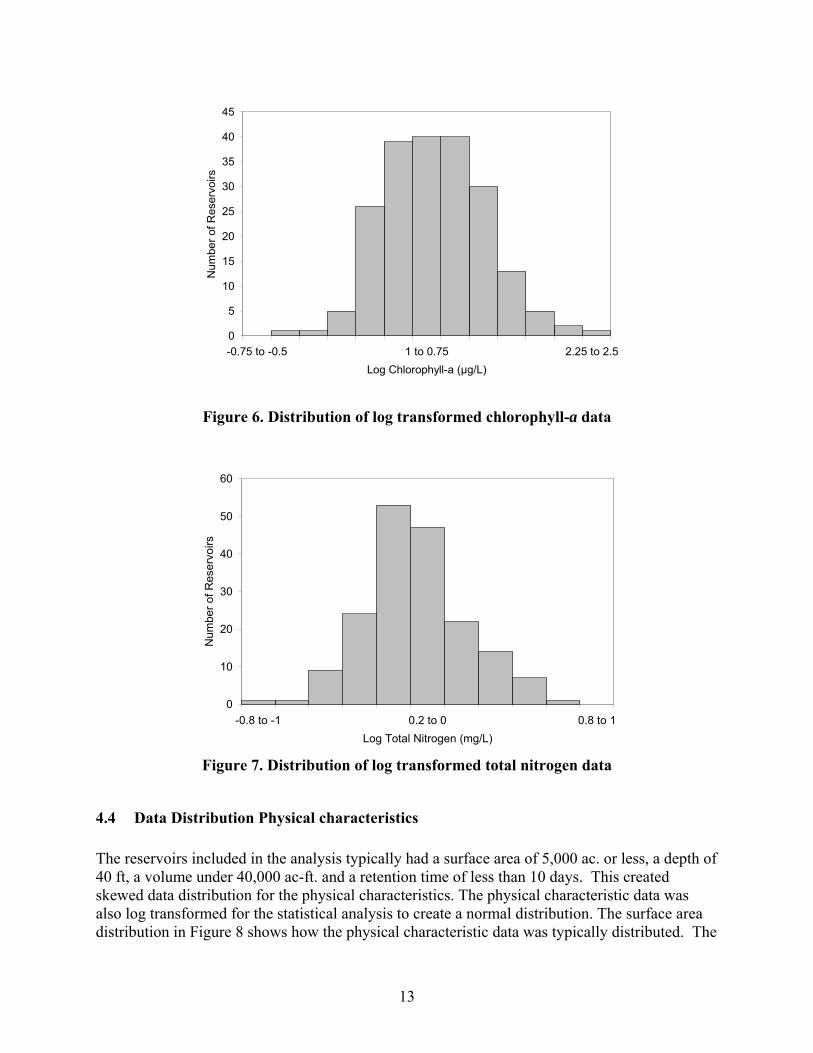
Figure 6. Distribution of log transformed chlorophyll-a data
0
10
20
30
40
50
60
0.8 to 10.2 to 0-0.8 to -1Log Total Nitrogen (mg/L)
Num
ber o
f Res
ervo
irs
Figure 7. Distribution of log transformed total nitrogen data
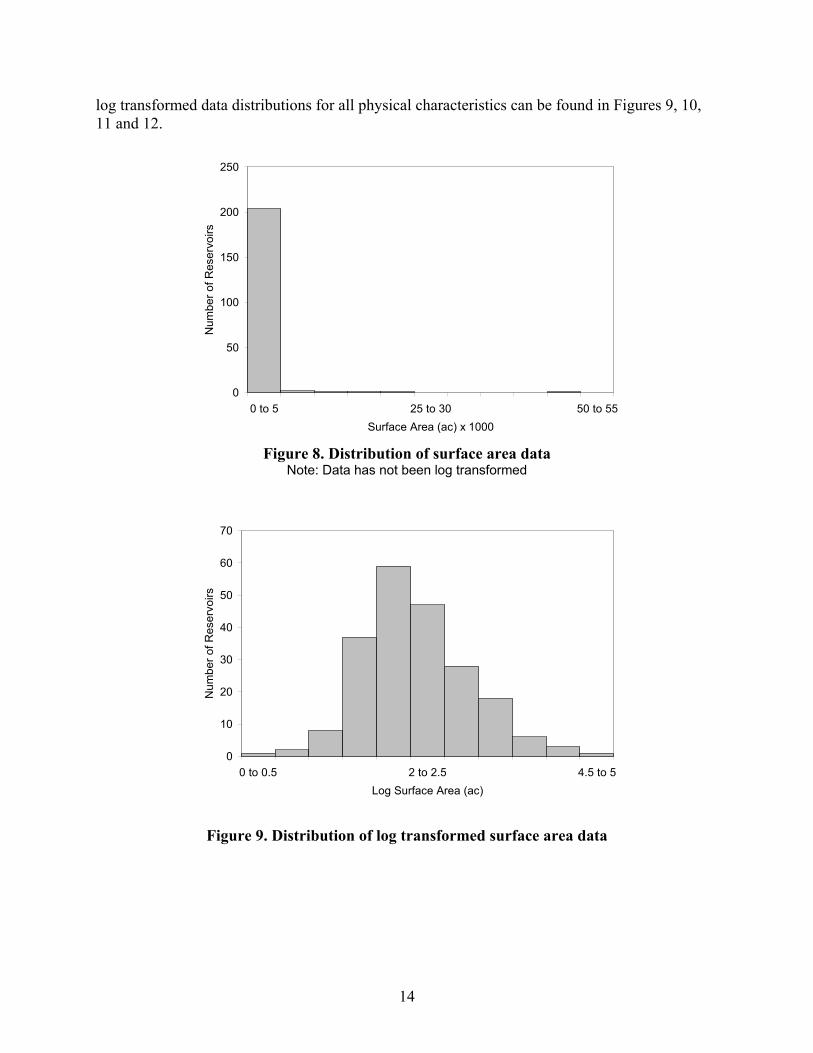
4.4 Data Distribution Physical characteristics The reservoirs included in the analysis typically had a surface area of 5,000 ac. or less, a depth of 40 ft, a volume under 40,000 ac-ft. and a retention time of less than 10 days. This created skewed data distribution for the physical characteristics. The physical characteristic data was also log transformed for the statistical analysis to create a normal distribution. The surface area distribution in Figure 8 shows how the physical characteristic data was typically distributed. The
14
log transformed data distributions for all physical characteristics can be found in Figures 9, 10, 11 and 12.
0
50
100
150
200
250
0 to 5 25 to 30 50 to 55Surface Area (ac) x 1000
Num
ber o
f Res
ervo
irs
Figure 8. Distribution of surface area data
Note: Data has not been log transformed
0
10
20
30
40
50
60
70
0 to 0.5 2 to 2.5 4.5 to 5Log Surface Area (ac)
Num
ber o
f Res
ervo
irs
Figure 9. Distribution of log transformed surface area data

15
0
5
10
15
20
25
30
35
40
0 to 0.25 1 to 1.25 2 to 2.25Log Depth (ft)
Num
ber o
f Res
ervo
irs
Figure 10. Distribution of log transformed depth data
0
5
10
15
20
25
30
35
0 to 0.5 3 to 3.5 6 to 6.5Log Volume (ac-ft)
Num
ber o
f Res
ervo
irs
Figure 11. Distribution of log transformed volume data

16
0
5
10
15
20
25
0 to 0.25 1.5 to 1.75 3 to 3.25 Log Retention Time (d)
Num
ber o
f Res
ervo
irs
Figure 12. Distribution of log transformed retention time data
4.5 Statistical Analysis2
4.5.1 Scatter Plot Matrix and Spearman’s ρ The first step in the statistical analysis was to assess the correlations between individual nutrient and nutrient response parameters. The independent variables included TN, TP, N:P ratio, reservoir depth, surface area, volume, and retention time. The dependent variables included SD and chlorophyll-a. Characteristics of the individual parameters are found in Table 6
Table 6. Univariate Simple Statistics
Column N Mean Std. Dev. Sum Minimum Maximum
TP (mg/L) 202 0.0325 0.0287 6.564 0.004 0.196
TN (mg/L) 179 0.8687 0.751 155.49 0.07 4.43
N:P Ratio 175 34.7657 34.9594 6084 9 271
Secchi D (m) 185 1.7022 1.2079 314.9 0.3 7.9
Chl.-a (µg/l) 203 15.4921 22.6003 3144.9 0.5 180
Surface Area (ac) 210 913.548 4049 191845 1 48968
Depth (ft) 141 19.8794 24.7471 2803 1 151
Volume (ac-ft) 146 40747 177926 5949067 5 1647510
Retention Time (days) 118 93.0085 149.442 10975 1 1222 Note: Statistics were calculated for each column independently without regard for missing values in other columns. 2 All statistical analyses were complete using JMP (2007).

17
The scatter plot matrix in Figure 13 shows the linear relationships between all of the untransformed variables. It highlights the skewed distributions of the dataset and the strongest relationships between individual parameters prior to data transformation. The Spearman’s ρ analyses provide a summary of the relationships among individual parameters. It is a nonparametric statistical analysis that is determined by data ranking. This analysis was selected due to the skewed distributions for the original data. The statistic is calculated by ranking the data (n1, n2, …nk) by value from lowest to the highest. This approach makes the original data distribution irrelevant since the values are ranked from 1 to n. Spearman’s ρ has a value between -1 and +1 and is determined by the level of correlation between two parameters. The closer the Spearman’s ρ value is to +/- 1 the greater the correlation between the data when ranked. Numerically, speaking the statistical value is similar to r. If the ranked data are plotted, the data would be in a straight line if the Spearman’s ρ value is +1 or -1. Table 7 contains the Spearman’s ρ statistics for all data parameters. The Spearman’s ρ analysis highlights many of expected strong relationships between nutrients, physical characteristics and nutrient responses in reservoirs. Notably, TP and secchi depth, TP and chlorophyll-a, TN and chlorophyll-a, chlorophyll-a and secchi depth, secchi depth and depth, surface area and volume, volume and depth, and retention time and depth all have strong, statistically significant relationships. These relationships, as well as the others that are statistically significant, highlight the correlation between TP and both nutrient responses and TN and chlorophyll-a values. This model also shows that secchi depth is strongly influenced by chlorophyll-a, indicating that secchi depth may be a good surrogate for measuring nutrient impairment in Region 3 reservoirs.

18
Figure 13. Scatter plot matrix of untransformed data
Note: Axis labels are located along the diagonal of the matrix. For example, the upper most right correlation is retention time (d) vs. secchi depth (m). Values along the axis correspond to the parameters labeled above or to the right. The 95% density ellipse is indicated by the red line.
0
0.1
0
1.5 2.5
0
100 200
0246
0
100
0
20000 40000
0
100
0
1000000
-100 300 700
0 0.1 0 1 2 3 0 100 200 0 2 4 6 0 100 0 20000 0 100 01000000 -100 600

19
Table 7. Spearman’s ρ statistics for all variables
TP (mg/L) TN (mg/L) N:P Ratio Secchi Depth (m)
Chl-a (µg/l)
Surface Area (ac) Depth (ft)
Volume (ac-ft)
Retention Time (d)
TP (mg/L)
0.5568* 175** <0.0001***
-0.5151 175 <0.0001
-0.6658 175 <0.0001
0.7497 193 <0.0001
-0.2265 195 0.0014
-0.4779 136 <0.0001
-0.4244 135 <0.0001
-0.1240 105 0.2076
TN (mg/L)
0.5568* 175** <0.0001***
0.3121 175 <0.0001
-0.4845 150 <0.0001
0.5842 171 <0.0001
-0.0184 173 0.8101
-0.1667 115 0.0750
-0.1028 111 0.2829
0.0580 92 0.5828
N:P Ratio
-0.5151 175 <0.0001
0.3121 175 <0.0001
0.2463 149 0.0025
-0.2158 168 0.0050
0.1492 169 0.0528
0.3138 114 0.0007
0.3147 110 0.0008
0.0856 88 0.4280
Secchi Depth (m)
-0.6658 175 <0.0001
-0.4845 150 <0.0001
0.2463 149 0.0025
-0.6381 174 <0.0001
0.1238 179 0.0987
0.5672 128 <0.0001
0.3844 135 <0.0001
0.3395 94 0.0008
Chl-a (µg/l)
0.7497 193 <0.0001
0.5842 171 <0.0001
-0.2158 168 0.0050
-0.6381 174 <0.0001
-0.1614 195 0.0242
-0.3804 135 <0.0001
-0.3459 136 <0.0001
-0.1398 104 0.1569
Surface Area (ac)
-0.2265 195 0.0014
-0.0184 173 0.8101
0.1492 169 0.0528
0.1238 179 0.0987
-0.1614 195 0.0242
0.4436 141 <0.0001
0.9087 145 <0.0001
0.4359 116 <0.0001
Depth (ft)
-0.4779 136 <0.0001
-0.1667 115 0.0750
0.3138 114 0.0007
0.5672 128 <0.0001
-0.3804 135 <0.0001
0.4436 141 <0.0001
0.6813 132 <0.0001
0.5350 57 <0.0001
Volume (ac-ft)
-0.4244 135 <0.0001
-0.1028 111 0.2829
0.3147 110 0.0008
0.3844 135 <0.0001
-0.3459 136 <0.0001
0.9087 145 <0.0001
0.6813 132 <0.0001
0.4723 65 <0.0001
Retention Time (d)
-0.1240 105 0.2076
0.0580 92 0.5828
0.0856 88 0.4280
0.3395 94 0.0008
-0.1398 104 0.1569
0.4359 116 <0.0001
0.5350 57 <0.0001
0.4723 65 <0.0001
Note:* = Spearman’s ρ; ** = n; *** = p-value. Values in bold are statistically significant relationships.
4.5.2 Linear Regression Models: Nutrients vs. Nutrient Responses Linear regression models are one of the most common methods of analysis used for assessing water column nutrient – nutrient response relationships. The relationship between total phosphorus and chlorophyll-a (representing algal biomass) in natural lakes has been well documented using linear regression models (Schindler1974, Schindler 1978, Canfield and Bachman 1981, Smith and Shapiro 1981, Canfield 1983, McCauley et al. 1989, Correll 1998). In natural lakes, as total phosphorus increases, chlorophyll-a levels also increase. However, relationships for reservoirs show similar but inconsistent trends. Our analysis found a strong relationship between TP and chlorophyll-a. The model has a regression coefficient of 0.55 and a p-value of <0.001. As expected, the model showed chlorophyll-a levels increasing with increased concentrations of TP in the water column. The regression models are found in Figure 14 to Figures 18. Summary statistics are documented in Table 8.

20
-0.5
0
0.5
1
1.5
2
2.5
-3 -2.5 -2 -1.5 -1 -0.5 0Log Total Phosphorus (mg/L)
Log
Chl
orop
hyll-
a (μ
g/L)
Figure 14. Total phosphorus vs. chlorophyll-a Note: Data has been log transformed.
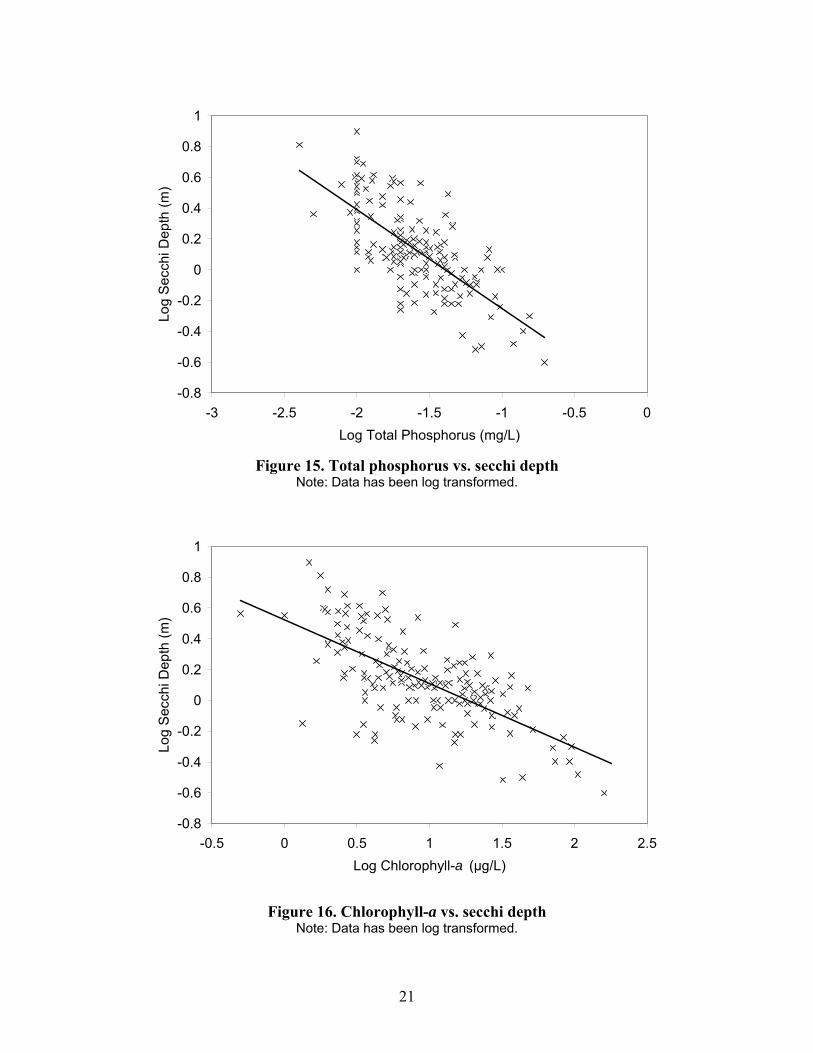
The use of secchi depth as a true measure of nutrient impairment is debated. As cited in Walker, Younos and Zipper, 2007, “Some suggest that secchi depth (SD) should only be used as a simple visual index of the clarity of a body of water (Priesdorfer 1986 in Carlson and Simpson 1996). Others have found strong relationships between SD, Chl-a values, and TP concentrations so suggest the use of “secchi depth as a surrogate measure of algal chlorophyll or algal biomass” (Carlson 1977). Our analysis found a strong relationship between TP and secchi depths in reservoirs, with secchi depths decreasing with increased concentrations of TP. The TP vs. secchi depth model is found in Figure 15. The model has an R2 value of 0.60 and a p-value of <0.001. The relationship between secchi depth and chlorophyll-a was also assessed. Figure 16 and Table 8 show a strong relationship between Secchi depth and chlorophyll-a. As expected secchi depths decreased as chlorophyll-a levels increased. The model has an R2 value of 0.46 and a p-value of <0.001, indicating that secchi depth is strongly influenced by chlorophyll-a (algal biomass) levels in the water column. Therefore, secchi depth is likely a good indicator of nutrient response in Region 3 reservoirs. The relationships between TN and the nutrient responses were statistically significant. However, they were not as strong as the relationships between total phosphorus and the nutrient responses. The TN versus chlorophyll-a model had an R2 value of 0.23 and a p-value of <0.001, and the TN versus secchi depth model had an R2 value of 0.31 and a p-value of <0.001. The models indicate nutrient responses are somewhat influenced by TN levels.
21
-0.8
-0.6
-0.4
-0.2
0
0.2
0.4
0.6
0.8
1
-3 -2.5 -2 -1.5 -1 -0.5 0Log Total Phosphorus (mg/L)
Log
Sec
chi D
epth
(m)
Figure 15. Total phosphorus vs. secchi depth
Note: Data has been log transformed.
-0.8
-0.6
-0.4
-0.2
0
0.2
0.4
0.6
0.8
1
-0.5 0 0.5 1 1.5 2 2.5Log Chlorophyll-a (μg/L)
Log
Sec
chi D
epth
(m)
Figure 16. Chlorophyll-a vs. secchi depth Note: Data has been log transformed.

22
-0.5
0
0.5
1
1.5
2
2.5
-1.5 -1 -0.5 0 0.5 1Log Total Nitrogen (mg/L)
Log
Chl
orop
hyll-
a (μ
g/L)
Figure 17. Total nitrogen (mg/L) vs. chlorophyll-a Note: Data has been log transformed.
-1.5
-1
-0.5
0
0.5
1
-1 -0.5 0 0.5 1Log Total Nitrogen (mg/L)
Log
Sec
chi D
epth
(m)
Figure 18. Total nitrogen vs. secchi depth Note: Data has been log transformed.
23
Table 8. Summary statistics for simple linear regression models for nutrients and nutrient
responses
Independent Variable
Dependent Variable n Model Equation R2 p
TP (mg/L) Chlorophyll-a (μg/L) 193 y = 1.0756x + 2.6743 0.58 <0.0001TP (mg/L) Secchi depth (m) 175 y = -0.6414x - 0.8931 0.50 <0.0001TN (mg/L) Secchi depth (m) 150 y = -0.5328x - 0.1217 0.23 <0.0001TN (mg/L) Chlorophyll-a (μg/L) 171 y = 0.783x + 1.0807 0.31 <0.0001Chlorophyll-a (μg/L) Secchi depth (m) 174 y = -0.4144x + 0.5255 0.46 <0.0001
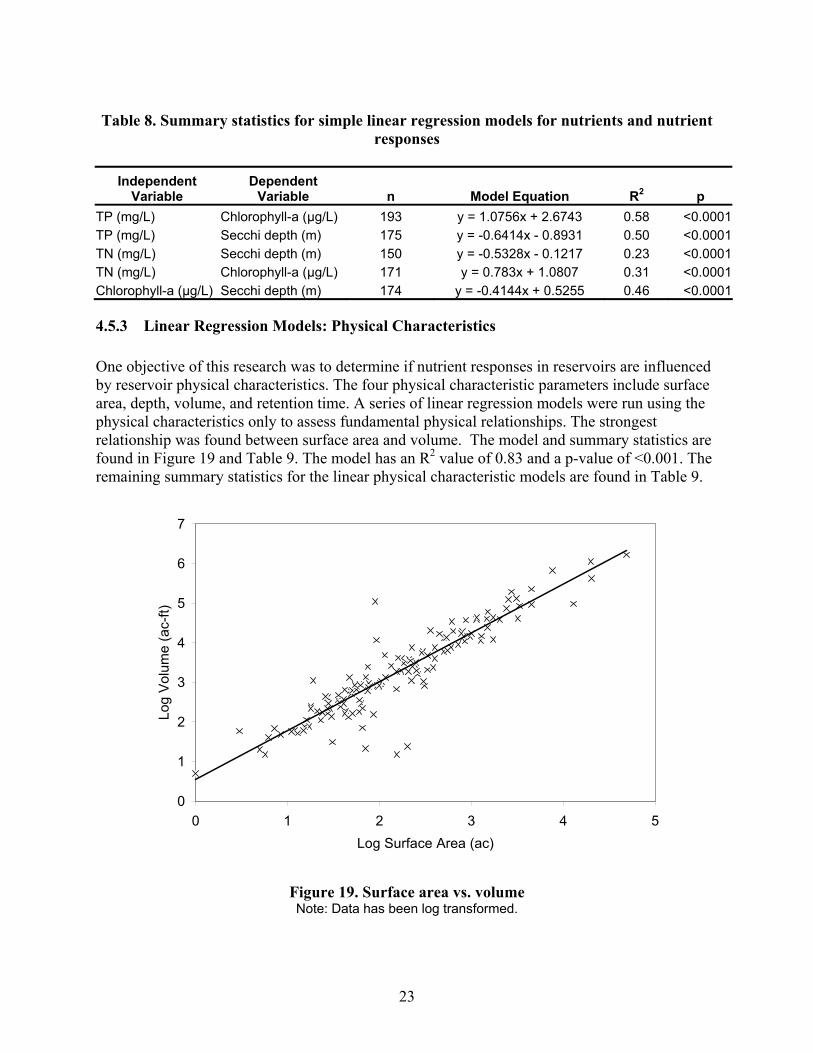
4.5.3 Linear Regression Models: Physical Characteristics One objective of this research was to determine if nutrient responses in reservoirs are influenced by reservoir physical characteristics. The four physical characteristic parameters include surface area, depth, volume, and retention time. A series of linear regression models were run using the physical characteristics only to assess fundamental physical relationships. The strongest relationship was found between surface area and volume. The model and summary statistics are found in Figure 19 and Table 9. The model has an R2 value of 0.83 and a p-value of <0.001. The remaining summary statistics for the linear physical characteristic models are found in Table 9.
0
1
2
3
4
5
6
7
0 1 2 3 4 5Log Surface Area (ac)
Log
Vol
ume
(ac-
ft)
Figure 19. Surface area vs. volume Note: Data has been log transformed.
24
Table 9. Summary statistics for physical characteristic linear regression models
Independent variable
Dependent variable n Model Equation R2 p
Surface Area (ac) Depth (ft) 141 y = 0.2182x + 0.6279 0.18 <0.0001Surface Area (ac) Volume (ac-ft) 145 y = 1.2329x + 0.5371 0.83 <0.0001Surface Area (ac) Retention Time (d) 116 y = 0.3522x + 0.8577 0.2 <0.0001Depth (ft) Volume (ac-ft) 132 y = 1.7575x + 1.2399 0.45 <0.0001Depth (ft) Retention Time (d) 57 y = 0.8354x + 0.7341 0.28 <0.0001Volume (ac-ft) Retention Time (d) 65 y = 0.2523x + 0.7347 0.24 <0.0001
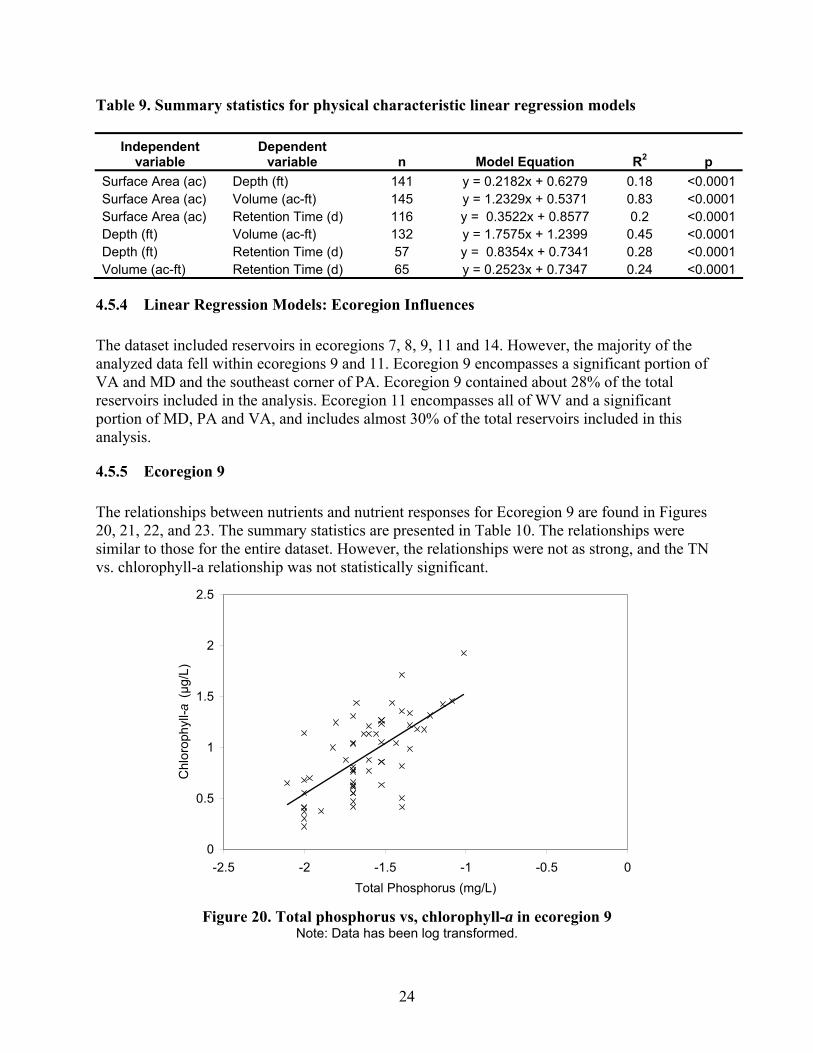
4.5.4 Linear Regression Models: Ecoregion Influences The dataset included reservoirs in ecoregions 7, 8, 9, 11 and 14. However, the majority of the analyzed data fell within ecoregions 9 and 11. Ecoregion 9 encompasses a significant portion of VA and MD and the southeast corner of PA. Ecoregion 9 contained about 28% of the total reservoirs included in the analysis. Ecoregion 11 encompasses all of WV and a significant portion of MD, PA and VA, and includes almost 30% of the total reservoirs included in this analysis.
4.5.5 Ecoregion 9 The relationships between nutrients and nutrient responses for Ecoregion 9 are found in Figures 20, 21, 22, and 23. The summary statistics are presented in Table 10. The relationships were similar to those for the entire dataset. However, the relationships were not as strong, and the TN vs. chlorophyll-a relationship was not statistically significant.
0
0.5
1
1.5
2
2.5
-2.5 -2 -1.5 -1 -0.5 0Total Phosphorus (mg/L)
Chl
orop
hyll-
a (μ
g/L)
Figure 20. Total phosphorus vs, chlorophyll-a in ecoregion 9
Note: Data has been log transformed.

25
-0.4
-0.2
0
0.2
0.4
0.6
0.8
-2.5 -2 -1.5 -1 -0.5 0Total Phosphorus (mg/L)
Secc
hi d
epth
(m)
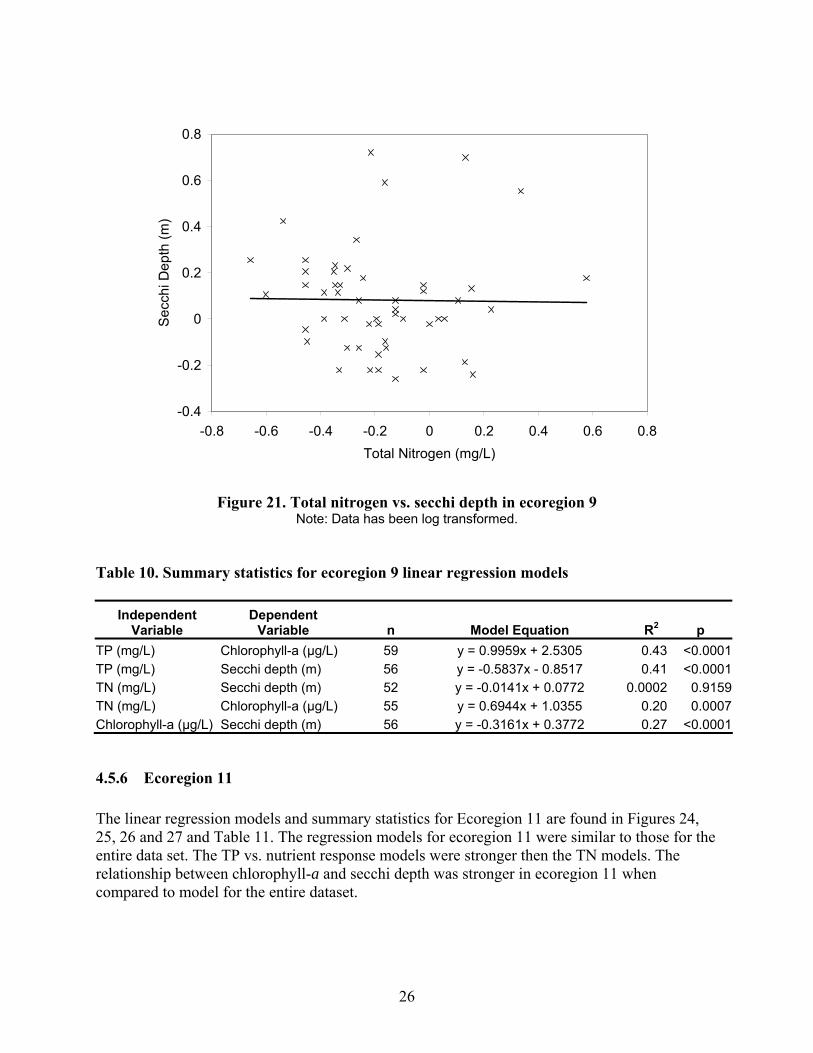
Figure 19. Total phosphorus vs. secchi depth in ecoregion 9 Note: Data has been log transformed.
0
0.5
1
1.5
2
2.5
-0.8 -0.6 -0.4 -0.2 0 0.2 0.4 0.6 0.8Total Nitrogen (mg/L)
Chl
orop
hyll-
a (μ
g/L)
Figure 20. Total nitrogen vs. chlorophyll-a in ecoregion 9 Note: Data has been log transformed.
26
-0.4
-0.2
0
0.2
0.4
0.6
0.8
-0.8 -0.6 -0.4 -0.2 0 0.2 0.4 0.6 0.8Total Nitrogen (mg/L)
Sec
chi D
epth
(m)
Figure 21. Total nitrogen vs. secchi depth in ecoregion 9 Note: Data has been log transformed.
Table 10. Summary statistics for ecoregion 9 linear regression models
Independent Variable
Dependent Variable n Model Equation R2 p
TP (mg/L) Chlorophyll-a (μg/L) 59 y = 0.9959x + 2.5305 0.43 <0.0001TP (mg/L) Secchi depth (m) 56 y = -0.5837x - 0.8517 0.41 <0.0001TN (mg/L) Secchi depth (m) 52 y = -0.0141x + 0.0772 0.0002 0.9159TN (mg/L) Chlorophyll-a (μg/L) 55 y = 0.6944x + 1.0355 0.20 0.0007Chlorophyll-a (μg/L) Secchi depth (m) 56 y = -0.3161x + 0.3772 0.27 <0.0001
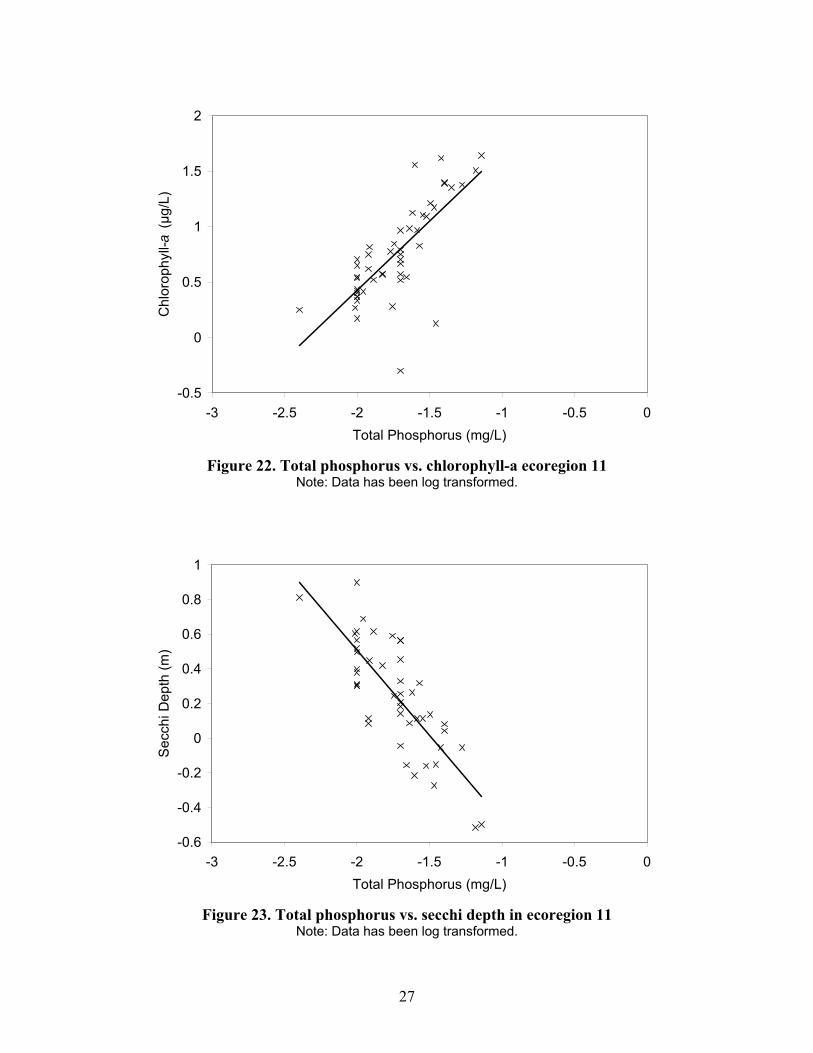
4.5.6 Ecoregion 11 The linear regression models and summary statistics for Ecoregion 11 are found in Figures 24, 25, 26 and 27 and Table 11. The regression models for ecoregion 11 were similar to those for the entire data set. The TP vs. nutrient response models were stronger then the TN models. The relationship between chlorophyll-a and secchi depth was stronger in ecoregion 11 when compared to model for the entire dataset.
27
-0.5
0
0.5
1
1.5
2
-3 -2.5 -2 -1.5 -1 -0.5 0Total Phosphorus (mg/L)
Chl
orop
hyll-
a (μ
g/L)
Figure 22. Total phosphorus vs. chlorophyll-a ecoregion 11
Note: Data has been log transformed.
-0.6
-0.4
-0.2
0
0.2
0.4
0.6
0.8
1
-3 -2.5 -2 -1.5 -1 -0.5 0Total Phosphorus (mg/L)
Sec
chi D
epth
(m)
Figure 23. Total phosphorus vs. secchi depth in ecoregion 11
Note: Data has been log transformed.

28
-0.5
0
0.5
1
1.5
2
-1.5 -1 -0.5 0 0.5 1Total Nitrogen (mg/L)
Chl
orop
hyll-
a (μ
g/L)
Figure 24. Total nitrogen vs. chlorophyll-a in ecoregion 11
Note: Data has been log transformed.
-0.6
-0.4
-0.2
0
0.2
0.4
0.6
0.8
1
-1.5 -1 -0.5 0 0.5 1Total Nitrogen (mg/L)
Sec
chi D
epth
(m)
Figure 25. Total nitrogen vs. secchi depth in ecoregion 11 Note: Data has been log transformed.
29
-0.6
-0.4
-0.2
0
0.2
0.4
0.6
0.8
1
-0.5 0 0.5 1 1.5 2Chlorophyll-a (μg/L)
Sec
chi d
epth
(m)
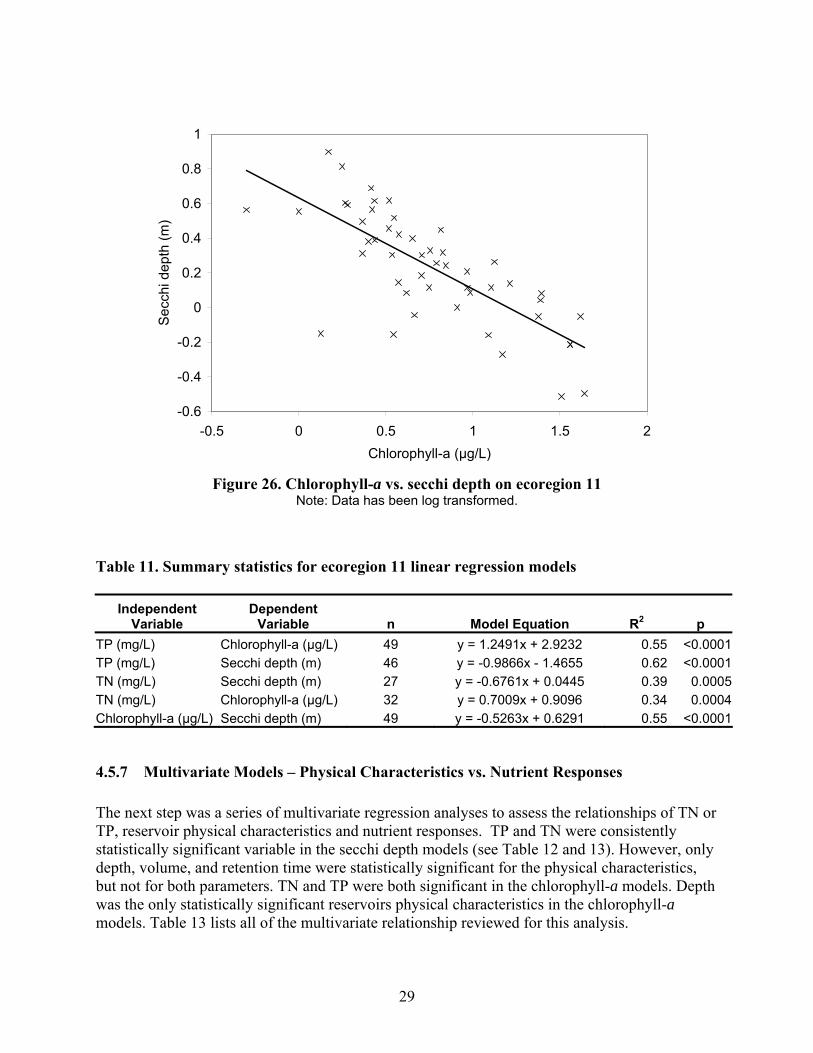
Figure 26. Chlorophyll-a vs. secchi depth on ecoregion 11
Note: Data has been log transformed. Table 11. Summary statistics for ecoregion 11 linear regression models
Independent Variable
Dependent Variable n Model Equation R2 p
TP (mg/L) Chlorophyll-a (μg/L) 49 y = 1.2491x + 2.9232 0.55 <0.0001TP (mg/L) Secchi depth (m) 46 y = -0.9866x - 1.4655 0.62 <0.0001TN (mg/L) Secchi depth (m) 27 y = -0.6761x + 0.0445 0.39 0.0005TN (mg/L) Chlorophyll-a (μg/L) 32 y = 0.7009x + 0.9096 0.34 0.0004Chlorophyll-a (μg/L) Secchi depth (m) 49 y = -0.5263x + 0.6291 0.55 <0.0001
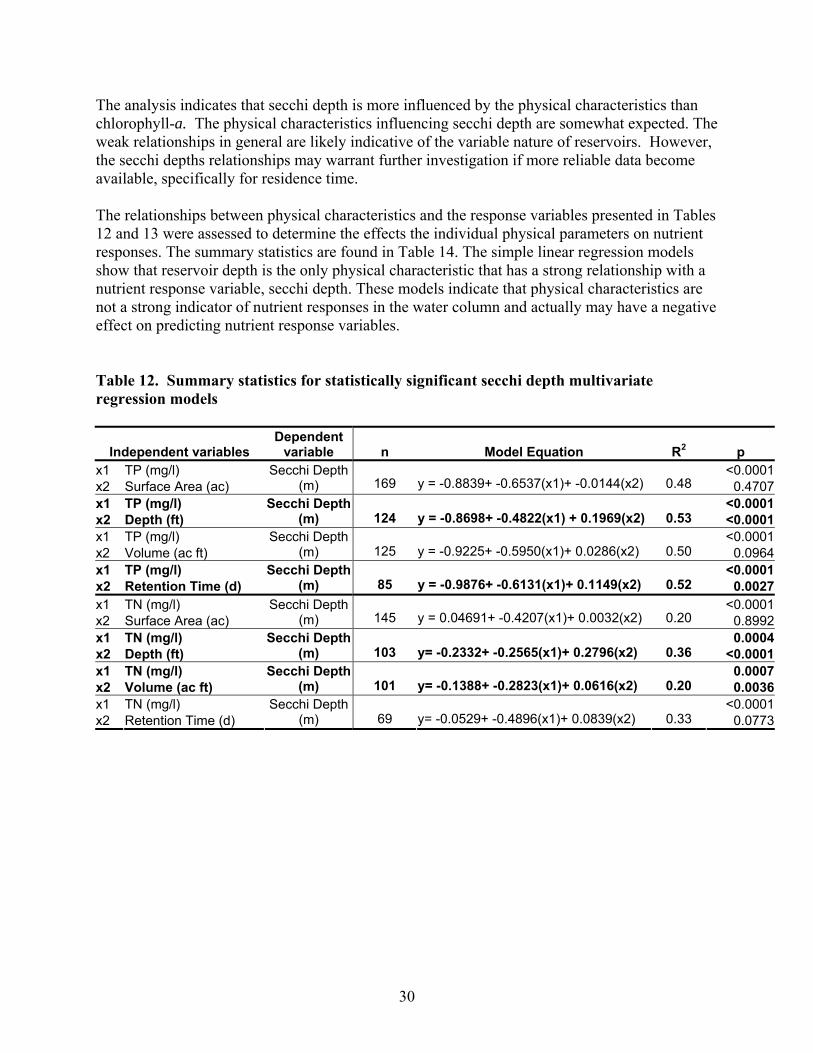
4.5.7 Multivariate Models – Physical Characteristics vs. Nutrient Responses The next step was a series of multivariate regression analyses to assess the relationships of TN or TP, reservoir physical characteristics and nutrient responses. TP and TN were consistently statistically significant variable in the secchi depth models (see Table 12 and 13). However, only depth, volume, and retention time were statistically significant for the physical characteristics, but not for both parameters. TN and TP were both significant in the chlorophyll-a models. Depth was the only statistically significant reservoirs physical characteristics in the chlorophyll-a models. Table 13 lists all of the multivariate relationship reviewed for this analysis.
30
The analysis indicates that secchi depth is more influenced by the physical characteristics than chlorophyll-a. The physical characteristics influencing secchi depth are somewhat expected. The weak relationships in general are likely indicative of the variable nature of reservoirs. However, the secchi depths relationships may warrant further investigation if more reliable data become available, specifically for residence time. The relationships between physical characteristics and the response variables presented in Tables 12 and 13 were assessed to determine the effects the individual physical parameters on nutrient responses. The summary statistics are found in Table 14. The simple linear regression models show that reservoir depth is the only physical characteristic that has a strong relationship with a nutrient response variable, secchi depth. These models indicate that physical characteristics are not a strong indicator of nutrient responses in the water column and actually may have a negative effect on predicting nutrient response variables. Table 12. Summary statistics for statistically significant secchi depth multivariate regression models
Independent variables Dependent
variable n Model Equation R2 p x1 TP (mg/l) <0.0001x2 Surface Area (ac)
Secchi Depth (m) 169 y = -0.8839+ -0.6537(x1)+ -0.0144(x2) 0.48 0.4707
x1 TP (mg/l) <0.0001x2 Depth (ft)
Secchi Depth (m) 124 y = -0.8698+ -0.4822(x1) + 0.1969(x2) 0.53 <0.0001
x1 TP (mg/l) <0.0001x2 Volume (ac ft)
Secchi Depth (m) 125 y = -0.9225+ -0.5950(x1)+ 0.0286(x2) 0.50 0.0964
x1 TP (mg/l) <0.0001x2 Retention Time (d)
Secchi Depth (m) 85 y = -0.9876+ -0.6131(x1)+ 0.1149(x2) 0.52 0.0027
x1 TN (mg/l) <0.0001x2 Surface Area (ac)
Secchi Depth (m) 145 y = 0.04691+ -0.4207(x1)+ 0.0032(x2) 0.20 0.8992
x1 TN (mg/l) 0.0004x2 Depth (ft)
Secchi Depth (m) 103 y= -0.2332+ -0.2565(x1)+ 0.2796(x2) 0.36 <0.0001
x1 TN (mg/l) 0.0007x2 Volume (ac ft)
Secchi Depth (m) 101 y= -0.1388+ -0.2823(x1)+ 0.0616(x2) 0.20 0.0036
x1 TN (mg/l) <0.0001x2 Retention Time (d)
Secchi Depth (m) 69 y= -0.0529+ -0.4896(x1)+ 0.0839(x2) 0.33 0.0773
31
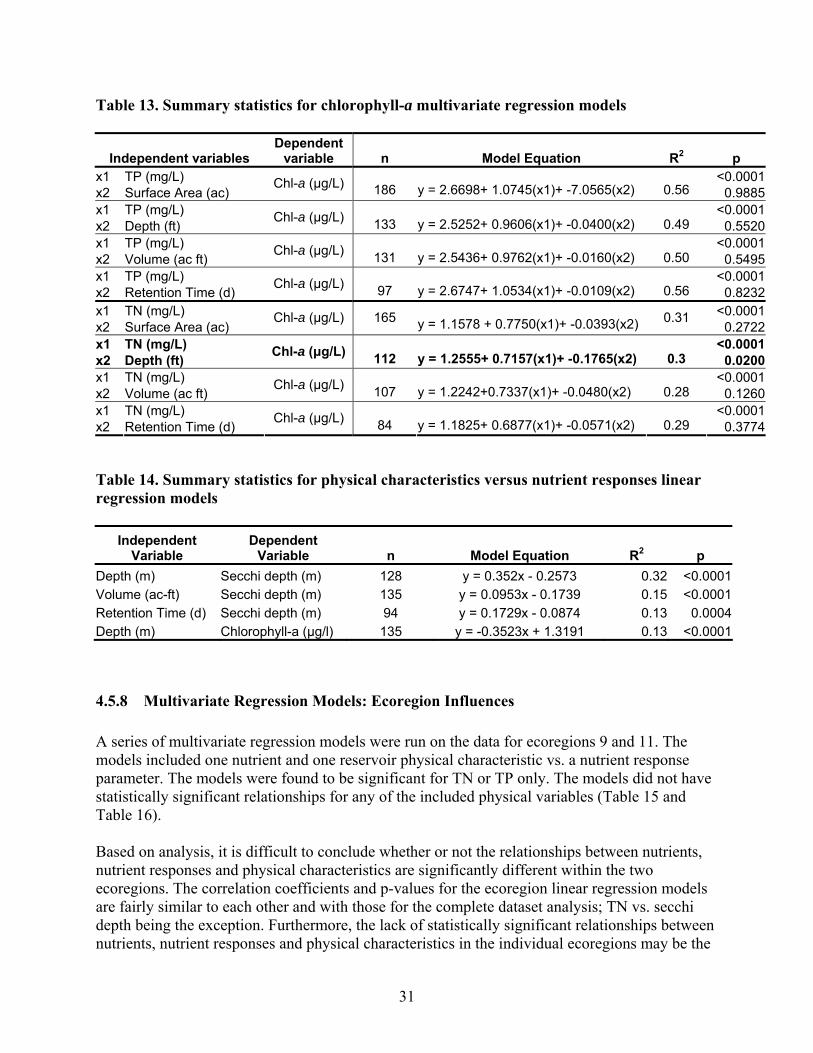
Table 13. Summary statistics for chlorophyll-a multivariate regression models
Independent variables Dependent
variable n Model Equation R2 p x1 TP (mg/L) <0.0001x2 Surface Area (ac)
Chl-a (μg/L) 186 y = 2.6698+ 1.0745(x1)+ -7.0565(x2) 0.56 0.9885x1 TP (mg/L) <0.0001x2 Depth (ft)
Chl-a (μg/L) 133 y = 2.5252+ 0.9606(x1)+ -0.0400(x2) 0.49 0.5520x1 TP (mg/L) <0.0001x2 Volume (ac ft)
Chl-a (μg/L) 131 y = 2.5436+ 0.9762(x1)+ -0.0160(x2) 0.50 0.5495x1 TP (mg/L) <0.0001x2 Retention Time (d)
Chl-a (μg/L) 97 y = 2.6747+ 1.0534(x1)+ -0.0109(x2) 0.56 0.8232x1 TN (mg/L) <0.0001x2 Surface Area (ac)
Chl-a (μg/L) 165 y = 1.1578 + 0.7750(x1)+ -0.0393(x2) 0.31 0.2722
x1 TN (mg/L) <0.0001x2 Depth (ft) Chl-a (μg/L) 112 y = 1.2555+ 0.7157(x1)+ -0.1765(x2) 0.3 0.0200x1 TN (mg/L) <0.0001x2 Volume (ac ft)
Chl-a (μg/L) 107 y = 1.2242+0.7337(x1)+ -0.0480(x2) 0.28 0.1260x1 TN (mg/L) <0.0001x2 Retention Time (d)
Chl-a (μg/L) 84 y = 1.1825+ 0.6877(x1)+ -0.0571(x2) 0.29 0.3774 Table 14. Summary statistics for physical characteristics versus nutrient responses linear regression models
Independent Variable
Dependent Variable n Model Equation R2 p
Depth (m) Secchi depth (m) 128 y = 0.352x - 0.2573 0.32 <0.0001Volume (ac-ft) Secchi depth (m) 135 y = 0.0953x - 0.1739 0.15 <0.0001Retention Time (d) Secchi depth (m) 94 y = 0.1729x - 0.0874 0.13 0.0004Depth (m) Chlorophyll-a (μg/l) 135 y = -0.3523x + 1.3191 0.13 <0.0001
4.5.8 Multivariate Regression Models: Ecoregion Influences A series of multivariate regression models were run on the data for ecoregions 9 and 11. The models included one nutrient and one reservoir physical characteristic vs. a nutrient response parameter. The models were found to be significant for TN or TP only. The models did not have statistically significant relationships for any of the included physical variables (Table 15 and Table 16). Based on analysis, it is difficult to conclude whether or not the relationships between nutrients, nutrient responses and physical characteristics are significantly different within the two ecoregions. The correlation coefficients and p-values for the ecoregion linear regression models are fairly similar to each other and with those for the complete dataset analysis; TN vs. secchi depth being the exception. Furthermore, the lack of statistically significant relationships between nutrients, nutrient responses and physical characteristics in the individual ecoregions may be the

32
result of too little data. It may also be the result of the varying relationships between physical characteristics and nutrients already highlighted in the literature. Table 15. Summary statistics for statistically significant chlorophyll-a multivariate regression models
Independent variables Dependent
variable n Model Equation R2 p x1 TP (mg/l) <0.0001x2 Surface Area (ac)
Chl-a (μg/l) 57 y = 2.4839+ 1.0155(x1)+ 0.0347(x2) 0.42 0.4820x1 TP (mg/l) <0.0001x2 Depth (ft)
Chl-a (μg/l) 35 y = 2.4534+ 0.9396(x1)+ -0.0229(x2) 0.40 0.8338x1 TP (mg/l) <0.0001x2 Volume (ac ft)
Chl-a (μg/l) 36 y = 2.3492+ 0.9140(x1)+ 0.0161(x2) 0.42 0.7728x1 TP (mg/l) 0.0007x2 Retention Time (d)
Chl-a (μg/l) 34 y = 2.2088+ 0.8148(x1)+ 0.0328(x2) 0.32 0.7127x1 TN (mg/l) 0.0018x2 Surface Area (ac)
Chl-a (μg/l) 54 y = 1.0878+ 0.6542(x1)+ -0.0226(x2) 0.18 0.6949
x1 TN (mg/l) 0.0145x2 Depth (ft)
Chl-a (μg/l) 33 y = 0.8351+ 0.6463(x1)+ 0.1804(x2) 0.20 0.1533x1 TN (mg/l) 0.0303x2 Volume (ac ft)
Chl-a (μg/l) 34 y = 0.7194+ 0.5762(x1)+0.0964(x2) 0.13 0.1361x1 TN (mg/l) 0.3580x2 Retention Time (d)
Chl-a (μg/l) 31 y = 0.8466+ 0.2520(x1)+ 0.0675(x2) 0.03 0.5510 Table 16. Summary statistics for statistically significant secchi depth multivariate regression models
Independent variables Dependent
variable n Model Equation R2 p x1 TP (mg/l) <0.0001x2 Surface Area (ac)
Secchi Depth (m) 54
y = -0.8621+ -0.5505(x1)+ 0.0249(x2) 0.40 0.4133
x1 TP (mg/l) 0.0004x2 Depth (ft)
Secchi Depth (m) 33 y = -0.7954+ -0.5349(x1)+ -0.0082(x2) 0.37 0.9039
x1 TP (mg/l) 0.0006x2 Volume (ac ft)
Secchi Depth (m) 33 y = -0.6468+ -0.5103(x1)+ -0.0254(x2) 0.39 0.4900
x1 TP (mg/l) 0.0002x2 Retention Time (d)
Secchi Depth (m) 33 y = -0.7311+ -0.5822(x1)+ -0.0868(x2) 0.42 0.1253
x1 TN (mg/l) 0.7311x2 Surface Area (ac)
Secchi Depth (m) 51 y = -0.0741+ 0.0445(x1)+ 0.0651(x2) 0.06 0.0774
x1 TN (mg/l) 0.6597x2 Depth (ft)
Secchi Depth (m) 31 y = 0.1666+ -0.0750(x1)+ -0.1010(x2) 0.06 0.2033
x1 TN (mg/l) 0.9125x2 Volume (ac ft)
Secchi Depth (m) 31 y = 0.2784+ -0.0190(x1)+ -0.0667(x2) 0.09 0.1107
x1 TN (mg/l) 0.5886x2 Retention Time (d)
Secchi Depth (m) 30 y = 0.2650+ 0.0992(x1)+ -0.1018(x2) 0.08 0.1881

33
5 Conclusions The analysis supports much of what has been published in the literature regarding nutrients, nutrient responses and reservoirs. The relationships resemble those which are found in lakes and other reservoirs, but the variability in how nutrients respond in reservoirs is clearly evident through the generally moderate to weak relationships present. Total phosphorus and chlorophyll-a are highly correlated in Region 3 reservoirs. This indicates that chlorophyll-a could be a good indicator of nutrient levels and nutrient impairment in Region 3 reservoirs. The relationship between TP and secchi depth was also strong. However, the relationship between secchi depth and chlorophyll-a was weaker than expected. The USEPA and some states consider secchi depth to be a fundamental component of nutrient criteria, being an indicator of algal growth in the water column. It is recommended that states conduct further analysis on water samples for fixed solids to gain a better understanding of the water column influences on secchi depth measurements. Objectives of this project included an assessment of the validity of using reservoir physical characteristics as an indicator of nutrient responses and response within ecoregions. The analysis found minimal influence of physical parameters on nutrient responses. Furthermore, it is difficult to conclude whether or not the relationships between nutrients, nutrient responses and physical characteristics are significantly different within the ecoregions. These results may be due to poor quality of physical data or it may be due to the highly variable nature of reservoirs. Scientific literature suggests that reservoir physical characteristics exert an influence on reservoirs’ nutrient response dynamics. Analyses of these data provide only weak support for that hypothesis. Both depth and retention time were found to influence TP vs. secchi depth relationships. Depth and volume were found to influence TP vs. chlorophyll-a relationships. However, the linear regression models of physical characteristics vs. nutrient responses indicate that physical characteristics have little if any influence on the nutrient responses. Therefore, results of this study cannot suggest a criteria formulation that includes both reservoir physical characteristics as well as nutrients. The results do suggest, however, a potential role for reservoirs’ physical characteristics in nutrient criteria development – if better and more completed data on reservoirs’ physical characteristics were available for use in model development. Notably the reservoir physical characteristic data was incomplete and unverified. Readily available physical characteristics data was very limited, and for some parameters the accuracy was questionable. While it is probably fair to say that in the past measuring the physical characteristics of a reservoir was not an important use of public resources, policy changes have increased the value in this type of information. States should look to expand and improve their reservoir physical characteristic data. It is recommended that reservoir physical characteristics be established and verified before additional analysis is completed on Region 3 reservoirs. It is recommended that states take strides toward standardizing data reporting and management methods for lakes and reservoirs between states and within individual states. Changes to policy
34
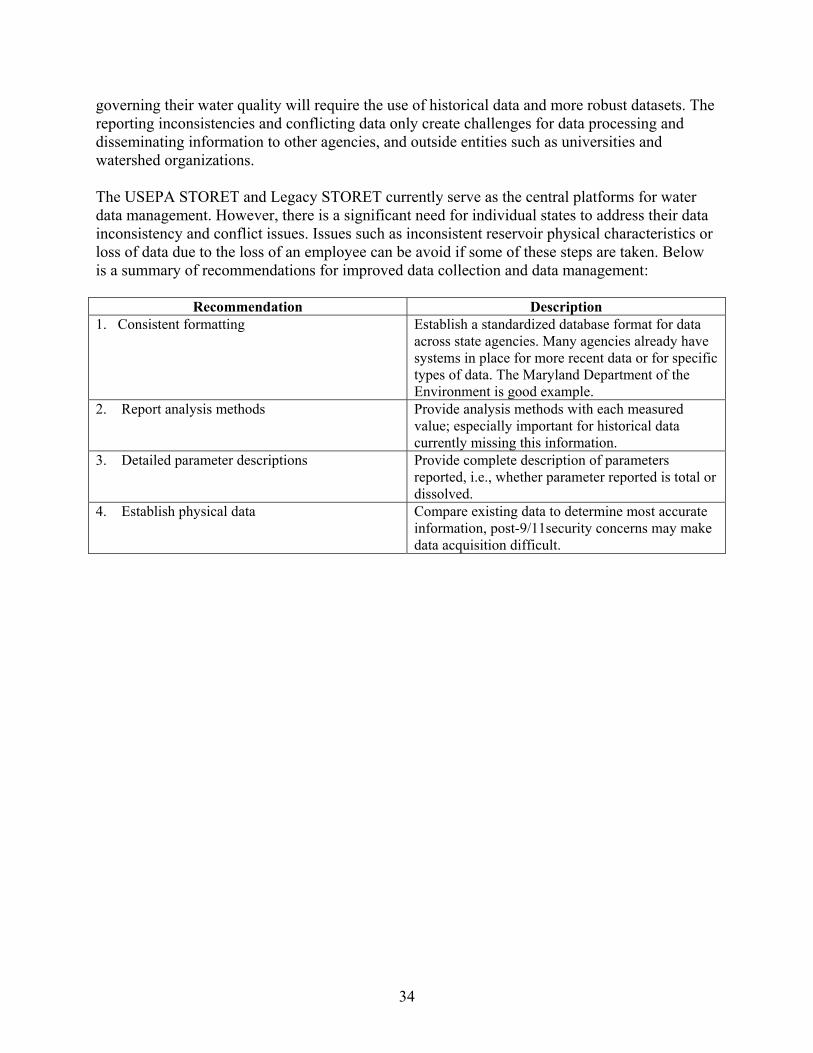
governing their water quality will require the use of historical data and more robust datasets. The reporting inconsistencies and conflicting data only create challenges for data processing and disseminating information to other agencies, and outside entities such as universities and watershed organizations. The USEPA STORET and Legacy STORET currently serve as the central platforms for water data management. However, there is a significant need for individual states to address their data inconsistency and conflict issues. Issues such as inconsistent reservoir physical characteristics or loss of data due to the loss of an employee can be avoid if some of these steps are taken. Below is a summary of recommendations for improved data collection and data management:
Recommendation Description 1. Consistent formatting Establish a standardized database format for data
across state agencies. Many agencies already have systems in place for more recent data or for specific types of data. The Maryland Department of the Environment is good example.
2. Report analysis methods Provide analysis methods with each measured value; especially important for historical data currently missing this information.
3. Detailed parameter descriptions Provide complete description of parameters reported, i.e., whether parameter reported is total or dissolved.
4. Establish physical data Compare existing data to determine most accurate information, post-9/11security concerns may make data acquisition difficult.

35
6 References
Section 1 United States Environmental Protection Agency (USEPA). 1998. National Strategy for the Development of Regional Nutrient Criteria. United States Office of Water. EPA 822-R-98-002. USEPA. 2000a. Nutrient Criteria Technical Guidance Manual. Lakes and Rivers. First Edition. Office of Water. Office of Science and Technology. EPA-822-B00-001. USEPA. 2000b. Ambient Water Quality Criteria Recommendations, Information Supporting the Development of State and Tribal Nutrient Criteria, Lakes and Reservoirs in Nutrient Ecoregion IX. Office of Water. EPA 822-B-00-011. USEPA. 2008a. Water Quality Criteria for Nitrogen and Phosphorus Pollution. Basic Information. http://www.epa.gov/waterscience/criteria/nutrient/policy.html. Accessed January 2008. USEPA. 2008b. Email from Mark A. Barath to author Pavlick. Environmental Scientist. Office of Standards, Assessment & Information Management. Water Protection Division USEPA Region III. Schindler, D.W. 1974. Eutrophication and recovery in experimental lakes: Implications for lake management. Science 184: 897–899. Walker, Jane, T. Younos and C. Zipper. 2007. Nutrients in Lakes and Reservoirs – A Literature Review for Use in Nutrient Criteria Development. Virginia Water Resources Research Center. VWRRC Special Report SR34-2007. http://www.vwrrc.vt.edu/pdfs/specialreports/sr342007.pdf. Accessed April 2008.
Section 2 Walker, Jane, T. Younos and C. Zipper. 2007. Nutrients in Lakes and Reservoirs – A Literature Review for Use in Nutrient Criteria Development. Virginia Water Resources Research Center. VWRRC Special Report SR34-2007. http://www.vwrrc.vt.edu/pdfs/specialreports/sr342007.pdf. Accessed April 2008.
Section 3 JMP. 2007. JMP statistical analysis program. SAS Institute Inc.
36
USEPA. 2000a. Nutrient Criteria Technical Guidance Manual. Lakes and Rivers. First Edition. Office of Water. Office of Science and Technology. EPA-822-B00-001. USEPA. 2000b. Ambient Water Quality Criteria Recommendations, Information Supporting the Development of State and Tribal Nutrient Criteria, Lakes and Reservoirs in Nutrient Ecoregion IX. Office of Water. EPA 822-B-00-011.
Section 4 Academic Advisory Committee. 2005. Issues related to freshwater nutrient criteria for lakes and reservoirs in Virginia. Report of the Academic Advisory Committee to Virginia Department of Environmental Quality: Freshwater Nutrient Criteria. VWRRC Special Report SR27-2005. http://www.vwrrc.vt.edu/pdfs/specialreports/sr272005.pdf. Canfield, D. and R. Bachmann. 1981. Prediction of total phosphorus concentrations, chlorophyll a, and Secchi depths in natural and artificial lakes. Canadian Journal of Fisheries and Aquatic Sciences 38: 414–423. Canfield, D.E. 1983. Prediction of chlorophyll a concentrations Florida lakes: The importance of phosphorus and nitrogen. Water Resources Bulletin 19: 255–262. Carlson, R.E. and J. Simpson. 1996. A Coordinator’s Guide to Volunteer Lake Monitoring Methods. North American Lake Management Society. 96 pp. Correll, D.L. 1998. The role of phosphorous in the eutrophication of receiving waters: a review. Journal of Environmental Quality 27: 261–266. Dalal, Visty. 2007. Personal communication. Email and telephone conversations with author Pavlick regarding Maryland reservoir physical characteristic data retrieval. January to December. JMP. 2007. JMP statistical analysis program. SAS Institute Inc. Lathrop, Barbara. 2007. Personal communication. Email communication with author Pavlick. Pennsylvania Department of Environmental Protection. Bureau of Watershed Management. September 17. McCauley, E., J.A. Downing, and S. Watson. 1989. Sigmoid relationships among nutrients and chlorophyll among lakes. Canadian Journal of Fisheries and Aquatic Sciences 46: 1171–1175. Preisendorfer, R.W. 1986. Eyeball optic of natural waters: Secchi disk science. NOAA Tech. Memo. ERL PMEL 67. NTIS PB86 224060/AS. 90 pp. Schindler, D.W. 1974. Eutrophication and recovery in experimental lakes: Implications for lake management. Science 184: 897–899.

37
Schindler, D.W. 1978. Factors regulating phytoplankton production and standing crop in the world’s freshwaters. Limnology and Oceanography 23(3): 478–486. Smith, V.H. and J. Shapiro. 1981. Chlorophyll-phosphorus relations in individual lakes: Their importance to lake restoration strategies. Environmental Science and Technology 15: 444–451. USEPA. 2000a. Nutrient Criteria Technical Guidance Manual. Lakes and Rivers. First Edition. Office of Water. Office of Science and Technology. EPA-822-B00-001. USEPA. 2000b. Ambient Water Quality Criteria Recommendations, Information Supporting the Development of State and Tribal Nutrient Criteria, Lakes and Reservoirs in Nutrient Ecoregion IX. Office of Water. EPA 822-B-00-011. December. USEPA. 2003. Region 3 Nutrient Database Project. ENSR Corporation. Prepared for EPA Region 3, Philadelphia, PA. USEPA. 2008c. STORET Database Access. http://www.epa.gov/storet/dbtop.html

38
7 Appendix: Analyzed Nutrient Data Table 17 includes all of the nutrient and nutrient response paramter variables (orignial and log trasnformed) included in the statistical analysis. Data are sorted alphabetically by state. Table 17: Nutrient and nutrient response data included in the analysis
Reservoir Name State SD (m)Log SD
(m) TP
(mg/l) Log TP (mg/l)
Chl-a (µg/l)
Log Chl-a (µg/l)
TN (mg/l)
Log TN (mg/l)
N:P Ratio
Log N:P Ratio
MARYLAND Adkins Pond MD 0.4 -0.398 0.14 -0.855 92.61 1.967 Big Mill Pond MD 1 0.000 0.099 -1.004 20.06 1.302 Bishopville Pond MD 0.153 -0.815 14.6 1.164 2.34 0.369 15 1.185Brighton Dam MD 1.1 0.041 0.02 -1.699 20.16 1.304 1.69 0.227 85 1.927Centennial Lake MD 1.5 0.176 0.04 -1.395 2.59 0.413 3.79 0.578 95 1.977Conowingo Dam MD 1.3 0.114 0.037 -1.432 10.99 1.041 Deep Creek Lake MD 2.8 0.447 0.012 -1.915 6.54 0.816 0.31 -0.509 26 1.412Edgewater Village Lake MD 1 0.000 0.072 -1.144 26.39 1.421 1.14 0.055 16 1.200Greenbrier Lake MD 4 0.602 0.01 -2.014 1.85 0.267 Johnson Pond MD 0.9 -0.046 0.065 -1.186 11.98 1.078 3.8 0.580 58 1.767Lake Frank MD 1.3 0.114 0.023 -1.633 13.5 1.130 Lake Needwood MD 1 0.000 0.028 -1.556 13.58 1.133 Leonard Mill Pond MD 0.8 -0.097 0.061 -1.218 38.71 1.588 1.28 0.107 21 1.322Liberty Reservoir MD 3.6 0.553 0.008 -2.105 4.41 0.644 2.17 0.336 271 2.433Little Seneca Lake MD 3.9 0.591 0.011 -1.968 5 0.699 0.69 -0.164 63 1.797Loch Raven Reservoir MD 3.8 0.580 0.013 -1.894 2.35 0.371 New Germany Lake MD 1 0.000 8.1 0.908 Piney Run Reservoir MD 5 0.699 0.01 -2.000 4.74 0.676 1.36 0.133 136 2.134Rocky Gorge Dam MD 1.2 0.079 0.016 -1.807 17.5 1.243 1.28 0.106 80 1.903Savage River Reservoir MD 3.9 0.591 0.018 -1.757 1.9 0.279 St. Mary's Lake MD 1.2 0.079 0.018 -1.745 7.56 0.879 0.55 -0.260 31 1.485Still Pond MD 1.2 0.079 0.079 -1.100 47.67 1.678 1.46 0.165 18 1.267
PENNSYLVANIA
Acre Lake PA 1.1 0.041 0.037 -1.438 32 1.505 0.85 -0.071 23 1.361Allen Lake (Allens Lake, Allens Pond) PA 1.3 0.097 0.022 -1.658 7.9 0.898 1.1 0.041 50 1.699Arrowhead Lakes (Main Lake) PA 0.022 -1.668 5 0.699 0.38 -0.420 17 1.237Arrowhead North Lake PA 1 0.000 0.042 -1.377 11.3 1.053 0.52 -0.284 12 1.093Balsam Pond PA 0.3 -0.602 0.196 -0.708 159.7 2.203 3.94 0.595 20 1.303Belmont Lake PA 2.2 0.344 0.013 -1.903 5.25 0.720 0.32 -0.495 25 1.391Beltsville Lake (Dam) PA 2.13 0.328 0.69 -0.164Bernhart Dam PA 2 0.290 0.046 -1.337 26.55 1.424 1.17 0.068 25 1.405Big Bass Lake (Tamarack Lake) PA 1.3 0.117 0.018 -1.757 8.45 0.927 0.61 -0.218 34 1.530Blacks Lake (Black Pond) PA 0.7 -0.171 0.052 -1.288 8.05 0.906 0.96 -0.020 18 1.266Blue Marsh Lake (Reservoir) PA 16.91 1.228 3.62 0.558Canoe Creek Lake PA 0.04 -1.398 0.35 -0.456 9 0.942Carbondale No.4 PA 4.1 0.615 0.013 -1.886 3.3 0.519 0.25 -0.602 19 1.284Childrens Lake (Boiling Springs Lake) PA 0.013 -1.886 2 0.301 1.9 0.279 146 2.165Cold Spring Lake PA 1.3 0.114 0.029 -1.545 12.7 1.104 0.55 -0.264 19 1.278

39
Reservoir Name State SD (m)Log SD
(m) TP
(mg/l) Log TP (mg/l)
Chl-a (µg/l)
Log Chl-a (µg/l)
TN (mg/l)
Log TN (mg/l)
N:P Ratio
Log N:P Ratio
Conemaugh Lake (Reservoir) PA 2.4 0.371 0.009 -2.046 2 0.301 1.6 0.203 178 2.250Curtis Reservoir PA 3.7 0.562 0.028 -1.561 3.7 0.568 0.55 -0.260 20 1.293Decker Swamp Dam (Decker Marsh Dam) PA 1.2 0.081 0.02 -1.699 4.8 0.681 0.42 -0.382 21 1.322Deep Creek Lake PA 1.2 0.081 0.04 -1.398 24.84 1.395 0.57 -0.248 14 1.154Doubling Gap Lake PA 1.3 0.114 Duck Harbor Pond PA 1.5 0.176 0.03 -1.523 21.5 1.332 0.63 -0.201 21 1.322Dunmore No.1 PA 4.9 0.688 0.011 -1.959 2.6 0.415 0.2 -0.710 18 1.260Egypt Meadow Lake PA 1.2 0.079 0.021 -1.678 7.25 0.860 0.47 -0.333 22 1.350Ford Lake (Fords Lake and Fords Pond) PA 0.7 -0.174 0.09 -1.047 26.9 1.430 0.87 -0.060 10 0.985Forest Lake PA 1.6 0.199 0.025 -1.611 13.35 1.125 0.36 -0.450 14 1.158Francis E. Walter Reservoir (FE Walter) PA 1.35 0.129 Fuller Lake PA 2.45 0.389 Glade Dam Lake (Glades Wild) PA 0.4 -0.426 0.054 -1.272 11.75 1.070 0.84 -0.076 16 1.192Green Lick Reservoir/Run PA 1.5 0.161 0.013 -1.886 0.81 -0.094 62 1.795Greenlane Reservoir PA 0.8 -0.078 0.068 -1.171 34.7 1.540 1.12 0.048 16 1.217Haig (or Haighs) Pond PA 1.8 0.243 0.018 -1.745 7 0.845 0.51 -0.292 28 1.452Hills Creek Lake/Dam PA 0.06 -1.222 18.3 1.262 0.64 -0.197 11 1.028Justus Lake (Two Mile Run Reservoir) PA 3.4 0.525 0.012 -1.939 5.15 0.712 0.31 -0.509 26 1.412Kaercher Creek Lake PA 2.1 0.322 0.019 -1.721 9.1 0.959 1.76 0.246 93 1.967Keystone Lake PA 1.2 0.079 0.016 -1.796 4.2 0.623 0.57 -0.248 36 1.552Keystone Reservoir (Plum Creek Reservoir) PA 2.3 0.362 0.005 -2.301 2 0.301 0.35 -0.456 70 1.845Lackawanna Lake PA 1.5 0.183 0.027 -1.569 8.3 0.919 0.48 -0.323 18 1.250Lake Antietam PA 1.8 0.243 0.036 -1.450 16.15 1.208 1.62 0.208 45 1.653Lake Cadjaw (Cadjaw Pond) PA 1.2 0.076 0.048 -1.323 24.18 1.383 1.13 0.051 24 1.372Lake Galena (Peace Valley PA 617) PA 0.8 -0.084 0.057 -1.244 18.23 1.261 1.13 0.051 20 1.297Lake Genero PA 1 0.003 0.094 -1.029 10.7 1.029 1.71 0.233 18 1.260Lake Gordon PA 0.017 -1.770 5.97 0.776 0.55 -0.260 32 1.510Lake Greeley (Lake Colleen) PA 1.4 0.156 0.025 -1.602 5.3 0.724 0.3 -0.523 12 1.079Lake Heritage PA 1.4 0.130 0.082 -1.089 28.45 1.454 1.43 0.154 17 1.242Lake Koon (Thomas A. Koon or Koon Lake) PA 0.023 -1.638 9.06 0.957 0.78 -0.108 34 1.530Lake Ladore (Stanton Pond) PA 1.9 0.282 0.046 -1.340 19.83 1.297 0.56 -0.256 12 1.085Lake Luxembourg (Core Creek Dam) PA 0.5 -0.308 0.084 -1.076 70.98 1.851 1.66 0.219 20 1.296Lake Marburg PA 0.008 -2.125 3.55 0.550 1.69 0.227 211 2.325Lake Meade PA 0.6 -0.240 0.097 -1.013 83.75 1.923 1.45 0.160 15 1.175Lake Montrose PA 1.6 0.190 0.022 -1.658 6.05 0.782 0.55 -0.260 25 1.398Lake Nockamixon PA 1.4 0.161 0.038 -1.420 36.63 1.564 0.77 -0.112 20 1.307Lake Ondawa (Big Pond) PA 1 -0.022 0.024 -1.620 22.4 1.350 0.79 -0.102 33 1.517Lake Ontelaunee PA 0.045 -1.347 22.5 1.352 2.24 0.349 50 1.697Lake Raylean PA 1.5 0.176 0.023 -1.638 6.4 0.806 0.7 -0.155 30 1.483Lake Redman (York Water Co. Dam) PA 1.3 0.097 0.024 -1.629 18.8 1.274 2.72 0.434 113 2.054Lake Scranton PA 2.8 0.439 0.024 -1.629 0.6 -0.225 25 1.398Lake Wallenpaupack PA 0.018 -1.745 6.16 0.789 0.44 -0.357 24 1.388Lake Wanoka (Collins Pond Dam) PA 1.3 0.097 0.047 -1.328 23.3 1.367 0.86 -0.066 18 1.262Lake Williams Dam (York Reservoir and Dunkard Dam) PA 0.021 -1.678 27.2 1.435 2.34 0.369 111 2.047Lakeside Pond aka Tarbell Pond PA 1.4 0.146 0.036 -1.444 1.12 0.047 31 1.493Locust Lake (upper) PA 3.9 0.596 0.07 -1.174
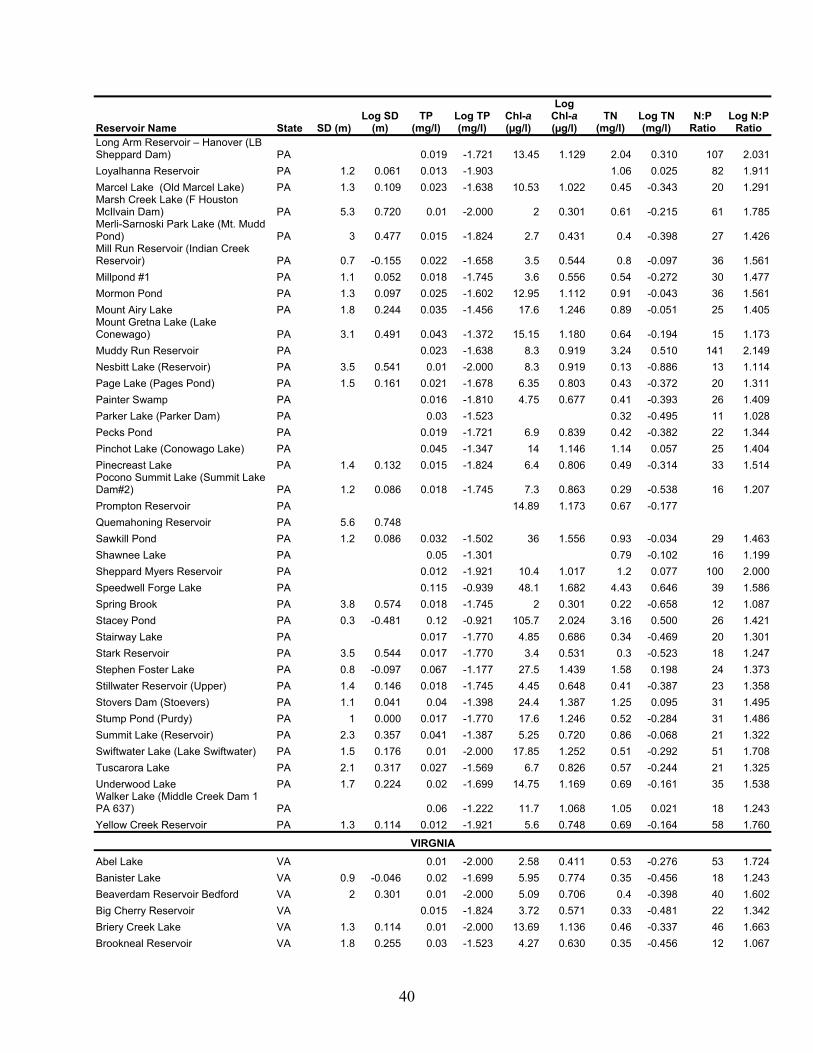
40
Reservoir Name State SD (m)Log SD
(m) TP
(mg/l) Log TP (mg/l)
Chl-a (µg/l)
Log Chl-a (µg/l)
TN (mg/l)
Log TN (mg/l)
N:P Ratio
Log N:P Ratio
Long Arm Reservoir – Hanover (LB Sheppard Dam) PA 0.019 -1.721 13.45 1.129 2.04 0.310 107 2.031Loyalhanna Reservoir PA 1.2 0.061 0.013 -1.903 1.06 0.025 82 1.911Marcel Lake (Old Marcel Lake) PA 1.3 0.109 0.023 -1.638 10.53 1.022 0.45 -0.343 20 1.291Marsh Creek Lake (F Houston McIlvain Dam) PA 5.3 0.720 0.01 -2.000 2 0.301 0.61 -0.215 61 1.785Merli-Sarnoski Park Lake (Mt. Mudd Pond) PA 3 0.477 0.015 -1.824 2.7 0.431 0.4 -0.398 27 1.426Mill Run Reservoir (Indian Creek Reservoir) PA 0.7 -0.155 0.022 -1.658 3.5 0.544 0.8 -0.097 36 1.561Millpond #1 PA 1.1 0.052 0.018 -1.745 3.6 0.556 0.54 -0.272 30 1.477Mormon Pond PA 1.3 0.097 0.025 -1.602 12.95 1.112 0.91 -0.043 36 1.561Mount Airy Lake PA 1.8 0.244 0.035 -1.456 17.6 1.246 0.89 -0.051 25 1.405Mount Gretna Lake (Lake Conewago) PA 3.1 0.491 0.043 -1.372 15.15 1.180 0.64 -0.194 15 1.173Muddy Run Reservoir PA 0.023 -1.638 8.3 0.919 3.24 0.510 141 2.149Nesbitt Lake (Reservoir) PA 3.5 0.541 0.01 -2.000 8.3 0.919 0.13 -0.886 13 1.114Page Lake (Pages Pond) PA 1.5 0.161 0.021 -1.678 6.35 0.803 0.43 -0.372 20 1.311Painter Swamp PA 0.016 -1.810 4.75 0.677 0.41 -0.393 26 1.409Parker Lake (Parker Dam) PA 0.03 -1.523 0.32 -0.495 11 1.028Pecks Pond PA 0.019 -1.721 6.9 0.839 0.42 -0.382 22 1.344Pinchot Lake (Conowago Lake) PA 0.045 -1.347 14 1.146 1.14 0.057 25 1.404Pinecreast Lake PA 1.4 0.132 0.015 -1.824 6.4 0.806 0.49 -0.314 33 1.514Pocono Summit Lake (Summit Lake Dam#2) PA 1.2 0.086 0.018 -1.745 7.3 0.863 0.29 -0.538 16 1.207Prompton Reservoir PA 14.89 1.173 0.67 -0.177Quemahoning Reservoir PA 5.6 0.748 Sawkill Pond PA 1.2 0.086 0.032 -1.502 36 1.556 0.93 -0.034 29 1.463Shawnee Lake PA 0.05 -1.301 0.79 -0.102 16 1.199Sheppard Myers Reservoir PA 0.012 -1.921 10.4 1.017 1.2 0.077 100 2.000Speedwell Forge Lake PA 0.115 -0.939 48.1 1.682 4.43 0.646 39 1.586Spring Brook PA 3.8 0.574 0.018 -1.745 2 0.301 0.22 -0.658 12 1.087Stacey Pond PA 0.3 -0.481 0.12 -0.921 105.7 2.024 3.16 0.500 26 1.421Stairway Lake PA 0.017 -1.770 4.85 0.686 0.34 -0.469 20 1.301Stark Reservoir PA 3.5 0.544 0.017 -1.770 3.4 0.531 0.3 -0.523 18 1.247Stephen Foster Lake PA 0.8 -0.097 0.067 -1.177 27.5 1.439 1.58 0.198 24 1.373Stillwater Reservoir (Upper) PA 1.4 0.146 0.018 -1.745 4.45 0.648 0.41 -0.387 23 1.358Stovers Dam (Stoevers) PA 1.1 0.041 0.04 -1.398 24.4 1.387 1.25 0.095 31 1.495Stump Pond (Purdy) PA 1 0.000 0.017 -1.770 17.6 1.246 0.52 -0.284 31 1.486Summit Lake (Reservoir) PA 2.3 0.357 0.041 -1.387 5.25 0.720 0.86 -0.068 21 1.322Swiftwater Lake (Lake Swiftwater) PA 1.5 0.176 0.01 -2.000 17.85 1.252 0.51 -0.292 51 1.708Tuscarora Lake PA 2.1 0.317 0.027 -1.569 6.7 0.826 0.57 -0.244 21 1.325Underwood Lake PA 1.7 0.224 0.02 -1.699 14.75 1.169 0.69 -0.161 35 1.538Walker Lake (Middle Creek Dam 1 PA 637) PA 0.06 -1.222 11.7 1.068 1.05 0.021 18 1.243Yellow Creek Reservoir PA 1.3 0.114 0.012 -1.921 5.6 0.748 0.69 -0.164 58 1.760
VIRGNIA Abel Lake VA 0.01 -2.000 2.58 0.411 0.53 -0.276 53 1.724Banister Lake VA 0.9 -0.046 0.02 -1.699 5.95 0.774 0.35 -0.456 18 1.243Beaverdam Reservoir Bedford VA 2 0.301 0.01 -2.000 5.09 0.706 0.4 -0.398 40 1.602Big Cherry Reservoir VA 0.015 -1.824 3.72 0.571 0.33 -0.481 22 1.342Briery Creek Lake VA 1.3 0.114 0.01 -2.000 13.69 1.136 0.46 -0.337 46 1.663Brookneal Reservoir VA 1.8 0.255 0.03 -1.523 4.27 0.630 0.35 -0.456 12 1.067

41
Reservoir Name State SD (m)Log SD
(m) TP
(mg/l) Log TP (mg/l)
Chl-a (µg/l)
Log Chl-a (µg/l)
TN (mg/l)
Log TN (mg/l)
N:P Ratio
Log N:P Ratio
Byllesby Reservoir VA 0.7 -0.152 0.035 -1.456 1.34 0.125 0.8 -0.097 23 1.359Carvin Cove Reservoir VA 0.9 -0.046 0.02 -1.699 4.61 0.663 0.53 -0.280 27 1.423Cherrystone Lake VA 1.7 0.230 0.02 -1.699 4.54 0.657 0.45 -0.347 23 1.352Chickahominy Lake VA 1 0.000 0.055 -1.260 14.94 1.174 0.8 -0.097 15 1.163Claytor Lake VA 1.8 0.255 0.02 -1.699 6.18 0.791 0.64 -0.194 32 1.505Crystal Lake VA 0.8 -0.125 0.045 -1.347 9.65 0.985 0.69 -0.160 15 1.186Curtis Lake VA 0.7 -0.187 0.04 -1.398 51.53 1.712 1.35 0.130 34 1.528Diascund Reservoir VA 1 -0.022 0.03 -1.523 18.27 1.262 0.65 -0.187 22 1.336Douthat Lake VA 3.7 0.565 0.01 -2.000 2.63 0.420 0.25 -0.602 25 1.398Elkhorn Lake VA 3.1 0.497 0.01 -2.000 2.33 0.367 0.25 -0.602 25 1.398Emporia Lake VA 0.8 -0.097 0.025 -1.602 5.87 0.768 0.36 -0.450 14 1.158Fairy Stone Lake VA 1.8 0.255 0.01 -2.000 1.67 0.223 0.22 -0.658 22 1.342Falling Creek Reservoir VA 1 0.000 0.03 -1.523 11.16 1.048 0.64 -0.194 21 1.329Fort Pickett Reservoir VA 0.6 -0.222 0.05 -1.301 15.13 1.180 0.61 -0.218 12 1.086Gatewood Reservoir VA 2.1 0.312 0.01 -2.000 2.33 0.367 0.3 -0.523 30 1.477Graham Reservoir VA 1.6 0.204 0.02 -1.699 2.94 0.468 0.35 -0.456 18 1.243Great Creek Reservoir VA 1.3 0.106 0.02 -1.699 4.07 0.609 0.25 -0.602 13 1.097Gretna Lake VA 0.8 -0.125 0.02 -1.699 5.96 0.775 0.5 -0.303 25 1.398Harrison Lake VA 0.6 -0.222 0.04 -1.398 3.14 0.497 0.95 -0.022 24 1.376Harwoods Mill Reservoir VA 1.3 0.097 0.025 -1.602 8.79 0.944 0.55 -0.260 22 1.342Hungry Mother Lake VA 2 0.302 0.01 -2.000 3.43 0.535 0.32 -0.495 32 1.505John W. Flannagan Reservoir VA 4.1 0.614 0.01 -2.000 2.72 0.435 0.41 -0.387 41 1.613Kerr Reservoir VA 1.4 0.146 0.02 -1.699 11.02 1.042 0.47 -0.328 24 1.371Keysville Reservoir VA 1 -0.022 0.045 -1.347 21.62 1.335 1 0.000 22 1.347Lake Albemarle VA 1.3 0.121 0.03 -1.523 18.38 1.264 0.95 -0.022 32 1.501Lake Anna VA 1.4 0.146 0.01 -2.000 2.56 0.408 0.45 -0.347 45 1.653Lake Burnt Mills VA 1.1 0.055 0.02 -1.699 20.42 1.310 0.67 -0.174 34 1.525Lake Chesdin VA 0.7 -0.155 0.06 -1.222 20.43 1.310 0.65 -0.187 11 1.035Lake Cohoon VA 0.8 -0.097 0.048 -1.323 26.9 1.430 0.95 -0.022 20 1.296Lake Gaston VA 1.3 0.114 0.02 -1.699 6.41 0.807 0.41 -0.387 21 1.312Lake Gordon VA 180 2.255 Lake Kilby VA 1.2 0.061 0.038 -1.426 26.81 1.428 0.69 -0.160 18 1.259Lake Meade VA 1.1 0.021 0.04 -1.398 22.53 1.353 0.75 -0.125 19 1.273Lake Moomaw VA 2.4 0.380 0.01 -2.000 2.52 0.401 0.35 -0.456 35 1.544Lake Nelson VA 1.4 0.146 0.03 -1.523 7.19 0.857 0.95 -0.022 32 1.501Lake Pelham VA 0.6 -0.260 0.02 -1.699 4.17 0.620 0.75 -0.125 38 1.574Lake Prince VA 1.3 0.114 0.02 -1.699 11.81 1.072 0.46 -0.337 23 1.362Lake Robertson VA 2.9 0.455 0.02 -1.699 3.29 0.517 0.35 -0.456 18 1.243Lake Smith VA 0.4 -0.398 0.14 -0.854 73.29 1.865 1.45 0.161 10 1.015Lee Hall Reservoir VA 0.9 -0.046 0.03 -1.523 10.72 1.030 0.75 -0.125 25 1.398Leesville Lake VA 1.5 0.176 0.02 -1.699 3.54 0.549 0.57 -0.244 29 1.455Little Creek Reservoir VA 0.5 -0.301 0.155 -0.810 95.27 1.979 1.65 0.217 11 1.027Martinsville Reservoir VA 1 0.000 0.01 -2.000 3.59 0.554 0.49 -0.312 49 1.690Modest Creek Reservoir VA 1.1 0.041 0.03 -1.523 16.95 1.229 0.75 -0.125 25 1.398Motts Run Reservoir VA 0.015 -1.824 9.95 0.998 0.67 -0.174 45 1.650Mountain Run Lake VA 1.2 0.079 0.02 -1.699 10.82 1.034 0.75 -0.125 38 1.574North Fork Pound Reservoir VA 0.01 -2.000 2.15 0.332 0.16 -0.796 16 1.204Nottoway Falls Lake VA 0.8 -0.125 0.04 -1.398 6.48 0.812 0.55 -0.260 14 1.138Pedlar River Reservoir VA 2.5 0.398 0.01 -2.000 4.48 0.651 0.25 -0.602 25 1.398Philpott Reservoir VA 2.7 0.423 0.01 -2.000 2.34 0.369 0.29 -0.538 29 1.462

42
Reservoir Name State SD (m)Log SD
(m) TP
(mg/l) Log TP (mg/l)
Chl-a (µg/l)
Log Chl-a (µg/l)
TN (mg/l)
Log TN (mg/l)
N:P Ratio
Log N:P Ratio
Roaring Fork Reservoir VA 1.4 0.146 0.02 -1.699 3.54 0.549 0.35 -0.456 18 1.243Shenandoah Lake VA 0.7 -0.160 0.03 -1.523 12.31 1.090 0.65 -0.187 22 1.336Slate River Dam VA 0.6 -0.222 0.02 -1.699 4.23 0.626 0.47 -0.333 24 1.371Smith Mountain Lake VA 2.2 0.342 0.02 -1.699 2.6 0.415 0.54 -0.268 27 1.431South Fork Rivanna Rerservoir VA 1.6 0.204 0.025 -1.602 7.5 0.875 0.45 -0.352 18 1.255South Holston Lake VA 1.6 0.207 0.02 -1.699 9.24 0.966 0.49 -0.310 25 1.389Stonehouse Creek Reservoir VA 0.8 -0.097 0.035 -1.456 27.18 1.434 0.69 -0.163 20 1.295Sugar Hollow Reservoir VA 2.6 0.419 0.015 -1.824 3.75 0.574 0.26 -0.585 17 1.239Swift Creek Lake VA 0.6 -0.222 0.045 -1.347 16.43 1.216 0.65 -0.187 14 1.160Swift Creek Reservoir VA 1 -0.022 0.025 -1.602 16.09 1.207 0.6 -0.222 24 1.380Switzer Lake VA 7.9 0.898 0.01 -2.000 1.48 0.170 0.65 -0.187 65 1.813Thrashers Creek Reservoir VA 1 0.000 0.025 -1.602 13.53 1.131 0.41 -0.387 16 1.215Totier Creek Reservoir VA 1 0.000 0.03 -1.523 7.2 0.857 1.08 0.033 36 1.556Waller Mill Reservoir VA 1.7 0.217 0.02 -1.699 5.75 0.760 0.5 -0.301 25 1.398Western Branch Reservoir VA 1.4 0.130 0.015 -1.824 9.32 0.969 0.51 -0.297 34 1.531
WEST VIRGINIA Bear Lake WV 1.4 0.137 0.032 -1.495 16.27 1.211 Beech Fork WV 0.9 -0.039 Bluestone WV 1.2 0.086 Boley WV 3.3 0.516 0.01 -2.000 3.52 0.547 Burches Run WV 0.9 -0.053 0.053 -1.276 23.83 1.377 Burnsville WV 0.6 -0.215 36.08 1.557 Castleman Run WV 0.9 -0.053 0.038 -1.420 41.52 1.618 Cheat Lake WV 3.7 0.563 0.02 -1.699 0.5 -0.301 East Lynn WV 1.5 0.183 0.02 -1.699 5.05 0.703 Elk Fork WV 0.025 -1.598 Hurricane WS Reservoir WV 0.3 -0.516 0.066 -1.180 32.16 1.507 Kanawha State Forest WV 1.2 0.086 0.023 -1.638 9.62 0.983 Laurel WV 1.2 0.083 0.012 -1.921 4.16 0.619 Moncove WV 2.1 0.329 0.02 -1.699 5.66 0.753 Mount Storm WV 6.5 0.811 0.004 -2.398 1.78 0.249 O'Brien WV 1.4 0.142 0.02 -1.699 3.74 0.573 RDBailey WV 2.4 0.387 2.74 0.438 Ridenour WV 0.5 -0.273 0.034 -1.469 14.81 1.171 Saltlick Pond 9 WV 1.3 0.113 0.026 -1.585 9.3 0.968 Spruce Knob WV 1.8 0.262 0.024 -1.620 13.28 1.123 Summersville WV 3.6 0.553 1 0.000 Summit WV 3.7 0.563 0.02 -1.699 Sutton WV 2.9 0.466 Tomlinson Run WV 0.6 -0.215 0.025 -1.602 36.06 1.557 Turkey Run WV 0.3 -0.499 0.072 -1.143 43.72 1.641 Note: Reservoir physical characteristics not included due to U.S. Homeland Security concerns and at the request of state agencies providing the data. See Section 3 for more information.