final report a study of the potential for dedicated ... · bureau of infrastructure, ... an...
TRANSCRIPT
Final Report
A study of the potential for dedicatedfreight infrastructure in AustraliaDepartment of Infrastructure and Regional DevelopmentOctober 2014 Update
Ernst & Young8 Exhibition StreetMelbourne VIC 3000 AustraliaGPO Box 67 Melbourne VIC 3001
Tel: +61 3 9288 8000Fax: +61 3 8650 7777ey.com/au
Liability limited by a scheme approved under Professional Standards Legislation
Dr Mark HarveyBureau of Infrastructure, Transport and Regional EconomicsDepartment of Infrastructure and Regional Development67 Northbourne AvenueCANBERRA ACT 2600
2 October 2014
Private and confidential
Re: An investigation of the potential for dedicated freight infrastructure
Dear Mark
I am pleased to provide you with our final report on our study of the potential for dedicated andpriority freight infrastructure in Australia.
This report consolidates the results of our investigations that were commenced in February2012 as part of Stage One of the study, and largely completed in Stage Two by the middle ofthat year. Since that time, and due to the nature of the study and the need to engage with andobtain data from state infrastructure agencies, we have been undertaking a process of graduallyrefining and updating our analysis so that this report could be finalised.
Purpose of our report and restrictions on its use
The Department of Infrastructure and Regional Development (formerly the Department ofInfrastructure and Transport) engaged Ernst & Young (EY) to undertake an investigation of thepotential for dedicated freight infrastructure in serving Australia’s container ports. Thisaccompanying final report (“the Report”) provides an overview of the analysis completed by EY.
The Report may be relied upon by the Department of Infrastructure and Regional Developmentfor the purpose of assessing the case for dedicated freight infrastructure in Australia. EYdisclaims all liability to any party other than the Department of Infrastructure and RegionalDevelopment for all costs, loss, damage and liability that the third party may suffer or incurarising from or relating to or in any way connected with the provision of the deliverables to athird party without our prior written consent. Where the Report is distributed to outside parties,EY does not accept any liability for reliance on the report’s findings. If others choose to rely onthe Report in any way they do so entirely at their own risk.
Scope of our work
All assumptions developed by EY have been discussed in the Report. We have not independentlyverified, and we do not accept any responsibility or liability for independently verifying, anysuch information. We do not make any representation as to the accuracy or completeness of theinformation provided by the Department of Infrastructure and Regional Development and otherproject stakeholders. We accept no liability for any loss or damage, which may result from yourreliance on any research, analyses or information so supplied.
Australian Government Department of Infrastructure and Regional DevelopmentA study of the potential for dedicated freight infrastructure in Australia Ernst & Young ÷ ii
Summary of our work
Our work has found:
► Unlocking of productivity gains in landside transport networks is vital to thecompetitiveness of the national economy. The inefficiencies hindering productivity inAustralia’s ports and freight networks are varied – so are the solutions.
► The challenges facing each of Australia’s container ports are unique. Each port has varyinglevels of capacity, congestion, growth in the freight task and long term planning issues,coupled with unique landside transport links and governance arrangements.
► Examples of good dedicated or priority freight infrastructure are beginning to emerge inAustralia in line with experience overseas. This includes examples for the movement of bulkfreight in particular, with examples for containerised freight including links such as thoseserving Port Botany through the intermodal terminals at Enfield and Chullora. Theseexamples demonstrate the ability to alleviate congestion and enhance freight efficiency formajor container ports, although many of the dedicated freight lines that currently exist stillinvolve conflicts with urban passenger rail networks.
► There are different reasons under which this type of infrastructure may be justified. Eachproposal for dedicated or priority freight infrastructure must be considered on a case-by-case basis.
► There are emerging proposals for dedicated or priority freight infrastructure in Australia, atvarying stages of development.
► We have undertaken two detailed case studies of conceptual projects for dedicated freightinfrastructure serving the major container ports in Melbourne and Brisbane. In both ofthese examples, many of the demand-side and supply-side preconditions for consideringthe case for investing in dedicated freight infrastructure appear to be in place. However,the infrastructure solutions that were brought forward for consideration in this studycontained certain limitations that would undermine their provision as dedicated or priorityfreight links. In this regard, the case studies provide valuable lessons on the challenges forsuch infrastructure in serving Australia’s container ports on an economically andcommercially feasible basis.
► The Melbourne case study considered proposals for a new link between the Port andthe West Gate Freeway, which would run through a heavily congested part of the roadnetwork in the inner west of the city. While the new link would be expected to provide arange of transport benefits for freight operators and other road users, there are anumber of factors that would limit the scope to provide it on a commerciallysustainable basis, and any moves to restrict access to non-freight vehicles would erodemuch of the economic benefits of the project.
► As a contrast, the Brisbane case study considered a proposal for a dedicated heavy railfreight line from the Surat Basin to the Port of Brisbane, which would provide thepotential for freight movements to avoid major arterials that are becomingincreasingly congested and separate freight and passenger train paths on the busyCitytrain network. However, in this case, given the scale and complexity of the railwayconstruction task, the estimated economic benefits of the project were significantlyoutweighed by the upfront capital costs. In this context it is not surprising thatopportunities for cost recovery from commercial freight users would be limited, andthe Port of Brisbane has advised that they have been refining the project inconsultation with key stakeholders in the development of its submission. The statedaim of the Port is to identify a sustainable and balanced transport solution that,following the completion of a pre-feasibility study that is currently underway, willdemonstrate the commercial, social and environmental viability of dedicated rail fromthe Surat Basin to the Port of Brisbane.
► While these case studies do not demonstrate the case for dedicated or priority freightinfrastructure, there may be good opportunities for such investments in Australia in the
Australian Government Department of Infrastructure and Regional DevelopmentA study of the potential for dedicated freight infrastructure in Australia Ernst & Young ÷ iii
near future. What we have learned is that in cases where the principles of demand suggestthere could be a good case for investment, it is important that solutions are discovered thatare properly focussed on the objectives for container freight efficiency, and can beprovided in a well-designed and cost effective fashion.
We have greatly enjoyed the opportunity of working with you on this engagement. We will watchwith interest as the Australian container freight sector responds to its future growth andinfrastructure challenges, and we will continue to work with the industry in developing solutionsthat target the unique situation facing our container ports.
Yours sincerely
John MatthewsPartner

Australian Government Department of Infrastructure and Regional DevelopmentA study of the potential for dedicated freight infrastructure in Australia Ernst & Young ÷ i
Contents
Executive summary .......................................................................................................... 1
PART A: Scoping Study (April 2012) ................................................................................. 7
1. Introduction ............................................................................................................. 8
2. The Pursuit of Freight Productivity .......................................................................... 11
3. Examples of Dedicated and Priority Freight Infrastructure ........................................ 19
4. Principles for Dedicated or Priority Freight Infrastructure ........................................ 40
5. The Australian Context: Challenges at Major Container Ports ................................... 46
6. Case studies for further investigation ...................................................................... 69
PART B: Case Studies (2012-2014) ................................................................................ 83
CASE STUDY 1: MELBOURNE ......................................................................................... 84
1. Introduction ........................................................................................................... 85
2. Overview & strategic context for the case study ...................................................... 87
3. Traffic impacts & benefits appraisal ......................................................................... 94
4. Financial assessment ............................................................................................ 103
5. Market views and potential participation ................................................................ 111
6. Key findings of this case study .............................................................................. 116
CASE STUDY 2: BRISBANE ........................................................................................... 119
1. Overview .............................................................................................................. 120
2. Overview and strategic context for the case study ................................................. 122
3. Demand analysis for the concept project ............................................................... 127
4. Cost estimates and other key assumptions ............................................................ 134
5. Economic appraisal (rapid cost-benefit analysis) .................................................... 139
6. Financial analysis ................................................................................................. 147
7. Market views and potential participation ................................................................ 154
8. Key findings of this case study .............................................................................. 158
APPENDICES ……………………..……………………………………………………………………………………………….…162
© 2014 Ernst & Young Australia
Ernst & Young is a registered trademark. Our report may be relied upon by the Department of Infrastructure and Regional Development for thepurpose of it being used only pursuant to the terms of our engagement letter. We disclaim all responsibility to any other party for any loss or liabilitythat the other party may suffer or incur arising from or relating to or in any way connected with the contents of our report, the provision of our reportto the other party or the reliance upon our report by the other party.
Australian Government Department of Infrastructure and Regional DevelopmentA study of the potential for dedicated freight infrastructure in Australia Ernst & Young ÷ 1
Executive summaryPromoting freight productivity is vital to the nation’s economic performance
Australia is heavily reliant on efficient ports, freight networks and supply chains to providecompetitive links and international gateways for international trade. It is estimated that thetransport and logistics sectors of the Australian economy contribute 14.5 % of GDP, with Australia’ssupply chain worth an estimated $150 billion every year.
The total container trade at Australia’s ports is expected to grow from around 6 million TEU in 2010to more than 20 million TEU by 2030. Container imports at Australia’s metropolitan ports areexpected to double in size every ten years placing substantial pressure on landside transportnetworks.
Despite their national significance, Australia’s ports and landside transport networks face severalchallenges from growth in the freight task, most notably rising congestion levels and urbanencroachment.
These constraints hinder the productivity of Australia’s freight networks and impose economic, socialand environmental costs to industries and communities. Congestion alone represents a drag on thenational economy and without action, could cost up to $20 billion by 2020.1
Dedicated and priority freight infrastructure is one approach that can be used to un-lockproductivity gains and address congestion and capacity constraints
While different ports face different challenges, many of their issues stem from a common problem:much of the infrastructure used by the freight sector is shared, and conflicts around access and useare not efficiently managed or addressed. For example, freight transporters compete with bothpassenger vehicles on roads and passenger trains on rail. This gives rise to ‘conflicts’ in the provisionand use of infrastructure by parties with competing interests and demands.
The introduction of dedicated and priority freight infrastructure could transform port and landsidelogistics by separating freight traffic from other forms of traffic and thereby provide an efficientpurpose-built means of transporting freight.
At a state level, there has been a raft of policy activity targeting improved efficiency for Australia’sports. At a national level, the Ports Strategy published by Infrastructure Australia and the NationalTransport Commission was the first genuinely national approach to infrastructure planning. Theports strategy made several recommendations including that the ‘Bureau of Infrastructure Transportand Regional Economies (BITRE) assess the conditions under which the introduction of dedicatedfreight land transport infrastructure would be justified’.
The objective of this study is to provide a practical and evidence based assessment of the conditionsthat would support the development of dedicated and priority freight infrastructure in Australia, andassist BITRE in responding to the Ports Strategy recommendation.
This study consisted of two stages. The first stage involved a scoping study aimed at developing abroad understanding of the conditions that may justify this type of infrastructure and identifyingpotential case studies for dedicated or priority freight infrastructure. The second stage (consideredselected case studies in more detail by conducting a rapid cost benefit anlaysis, financial analysis andcommercial assessment.
1 BITRE, Estimating urban traffic and congestion cost trends for Australian cities, 2007

Australian Government Department of Infrastructure and Regional DevelopmentA study of the potential for dedicated freight infrastructure in Australia Ernst & Young ÷ 2
Scoping Study Findings (April 2012)
The Scoping Study, which was completed in April 2012, defined the issues that drive considerationsof dedicated freight infrastructure proposals to improve the efficiency of port related freightmovements across infrastructure networks, minimise negative externalities associated with freightmovements and influence freight policy development. The Scoping Study examined internationalexamples and their emerging application in the Australian context, with a key output being theanalysis of a set of potential case studies for more detailed examination in the second stage of thisStudy.
The Scoping Study found:
There are many examples of this type of infrastructure in Australia and overseas. These vary interms of their purpose and effectiveness, and highlight the need for each proposal to beconsidered on a case by case basis
In Australia, dedicated freight infrastructure has been used to transport bulk freight such as coal andiron ore from mines to ports. These systems carry large volumes of homogenous products and aretypically built in isolation and not widely integrated with wider freight networks. Most of thededicated and priority freight infrastructure servicing Australia’s mining sector is self-funded orfunded by private investment.
Dedicated freight rail also services several of Australia’s major container ports including Port Botany,Port of Brisbane and Fremantle Port. For example, at Port Botany, there are segments of dedicatedrail links from the port to intermodal terminals and Enfield and Chullora. However, these rail linksalso share transport corridors with passenger rail that has priority on the network. This creates‘conflicts’ between competing users of the transport corridor, even if segments of the tracks arededicated to one use or the other.
There are several interesting international examples of dedicated and priority freight infrastructure.A freight tunnel connecting Port Dublin to a major motorway has alleviated freight congestion byremoving more than 8,000 trucks per day from the Dublin city centre. The tunnel gives priorityaccess to freight by tolling all vehicles under a certain weight. A cost benefit analysis of the tunnelidentified a range of benefits including time savings, fewer accidents and reduced accidents costs,and concluded that the net present value of the study was €54.4 million.
The Alameda corridor is a USD 2.4 billion twenty mile long railway dedicated to transporting freightbetween the United States busiest container ports and the transcontinental rail line. This effectivelyreduced transportation time from two hours to 45 minutes and eliminated conflicts at 200 railcrossings.
There is a range of factors that influence the viability of dedicated and priority freightinfrastructure
Each port has a complex mix of interactions between several key parameters including congestionlevels, port capacity, trade task, transport links, prices and regulatory and governance frameworks.Each type of dedicated and priorty freight infrastructure is associated with a unique stream of costsand benefts. These factors combined mean that it is not possible to develop a standardised equationor congestion threshold for considering dedicated and priority freight infrastructure. Rather, eachport and infrastructure proposal must be considered on a case by case basis.
There are however, a range of underlying factors that affect the viability of dedicated and prorityfreight infrastructure. These include a mix of supply and demand market factors.

Australian Government Department of Infrastructure and Regional DevelopmentA study of the potential for dedicated freight infrastructure in Australia Ernst & Young ÷ 3
Table E.1: Factors of Demand and Supply
Factors of Demand Factors of Supply
Conflicts between usersThe freight task and volumesCongestionLand use planningAmenity concernsPoor freight accessSafety concernsWillingness to pay
CapacityCost effectivenessForm of infrastructure (i.e road, rail)
As the drivers of supply and demand for dedicated and priority use infrastructure change over time,so does the viability of such infrastructure. Therefore, it is vital to take a long term and dynamic viewof all the factors affecting supply and demand for freight infrastructure to adequately plan for thefuture transport task.
The challenges at Australia’s major container ports vary from port to port – so do the solutions
We have examined each of Australia’s major container ports on a case by case basis with referenceto the current and forecast freight task, capacity constraints, rail and road access, governancearrangements and pricing approaches for access and use of infrastructure. We found that severalports face capacity constraints, high congestion levels, and growing pressure on landside transportnetworks to handle the rising freight task. The scale and range of the problems facing each portvaries depending on the unique characteristics of their surrounding infrastructure network andconnecting supply chains.
There is patchwork of policy activity underway by state governments aimed at enhancing freightefficiency. These include large scale capital investment in new infrastructure such as the GatewayMotorway in Brisbane, upgrades to existing infrastructure such as the M5 West widening project inSydney and importantly, reform and regulation to improve access and use of existing infrastructuresuch as the Port Botany Landside Improvement Strategy.
There are several emerging proposals for dedicated or priority freight infrastructure in Australiaand we have identified two for further consideration as case study examples
Our conversations with stakeholders and research on Australia’s major container ports revealedseveral emerging proposals for dedicated or priority freight infrastructure, at varying stages ofdevelopment – ranging from being in the planning stage to being more greenfield suggestions.
In selecting the case studies, we assessed each of the proposals against the factors of demand andsupply for dedicated and priority freight infrastructure to develop a short list of potential casestudies. Secondly, we considered a range of practical realities such as the availability of data toundertake a cost benefit analysis, the need to ensure a range were selected for road and rail andimportantly, the ability for the study to deliver meaningful information on dedicated and priorityfreight infrastructure.
In doing this, we identified two case studies for more detailed investigation and a rapid cost benefitanalysis in stage two. The first case study presented is for Melbourne and focuses on a conceptproject to provide a new road link between the Port of Melbourne (PoM) precinct and the West GateFreeway. The second case study is for Brisbane and focuses on a concept project to provide a newrail link between the Port of Brisbane and the Surat Basin to the south west of the city.
Australian Government Department of Infrastructure and Regional DevelopmentA study of the potential for dedicated freight infrastructure in Australia Ernst & Young ÷ 4
Case Study Findings (2012-2014)
EY consulted with VicRoads and Port of Brisbane Pty Ltd to obtain and analyse data in thedevelopment of the detailed case studies. While they are linked to past project and other sources ofactual data, the projects analysed are purely conceptual in order to explore issues in providingdedicated freight infrastructure between each port and their user catchments. While we have drawnon the results of previous work undertaken in developing the projects, for example by VicRoads andthe Victorian State Government in particular, we wish to stress that the concept projects do notconstitute State Government or defined Port projects.
Due to the nature of this exercise, the depth of data required and the need to engage with and obtaindata from state infrastructure agencies and stakeholders, we have been undertaking a process ofgradually refining and updating the analysis in order to finalise the case studies for this report. Therehave been significant changes in government policies and infrastructure development over theperiod during which these case studies were finalised. However, the findings of the case studyprovide valuable insights into the issues and challenges for dedicated freight infrastructure inserving our larger container ports that sit close to or within highly congestion urban areas.
The case studies found:
The new link in the Melbourne case study would be expected to provide a range of benefits forfreight operators and other road users. However, there are a number of factors that would limitthe scope to provide it on a commercially sustainable basis, and any moves to restrict access tonon-freight vehicles would erode much of the economic benefits of the project.
Road links between the Port of Melbourne and the West Gate Freeway have been an ongoing concernfor the Port and its surrounding communities. In particular, Francis Street and Whitehall Street linkthe Port to the West Gate Freeway as well as neighbouring container parks and are regularly utilisedas a link to the Port by many users. Discontent regarding use of these suburban streets has beenbuilding over many years and more recently, strong population growth across Yarraville andFootscray has heightened the issue.
This issue has been studied as part of previous State Government initiatives, which included theprovision of a new link to alleviate trucks travelling through this urban area. These initiatives did notinclude any aspect of dedicated or prioritised truck access for the new link. Our concept project is toinclude this in the analysis. Thus it considers prioritised truck access to the West Gate Freeway viathe new route.
While a range of demand and supply pre-conditions appear to be in place for a priority freight link tosupport the operation of the PoM and ensure it is better integrated with priority freight links in thewest of Melbourne, the project as defined does not constitute a suitable form of dedicated freightinfrastructure.
This could be due to a number of demand and supply factors, including:
► The size of the freight task, while large, may not justify investment in priority infrastructuregiven the extent of other traffic types in the area (demand).
► The patterns of demand in the inner-west of Melbourne are diverse and involve a number oforigin-destination flows that are not related to the Port, meaning that it is not possible todisentangle these flows and target freight demand through a single infrastructureinvestment (demand).
► The existence of alternative routes to access the Port from the M1 corridor via CityLink andother strategic connections reduces the criticality of improving connections to the west.
► The design has not been developed with the aim of prioritising freight vehicles, and if thiswas an overarching objective, then the design solution might be better targeted ataddressing PoM access issues (supply).
Australian Government Department of Infrastructure and Regional DevelopmentA study of the potential for dedicated freight infrastructure in Australia Ernst & Young ÷ 5
► The nature of the existing road layout and other barriers (natural or otherwise) may limitthe opportunity to develop cost effective solutions on the west side of the Port (supply).This recognises that there may be an access problem on the west of the Port, but thatthere may be insurmountable barriers to developing suitable dedicated freightinfrastructure.
While each of these causes are possible, the case study also highlights that the need for dedicatedfreight infrastructure would be limited when alternative network modifications provide a feasible wayof addressing the perceived problems. It is only when there is a lack of alternative network optionsavailable that the case for investing in dedicated freight infrastructure is strengthened. In thisexample, it might be when congestion on the M1 corridor reaches a certain level and spills over ontothe new route that it becomes imperative to restrict access to private motor vehicles in order toprioritise freight flows.
Should this occur, and as the size of the PoM freight task continues to grow, we may reach a pointwhere the market, including road freight operators and the PoMC, may start to demand and bewilling to pay for a tailored infrastructure solution to strengthen the connection between the Portand key transport links in the west of Melbourne.
The Victorian Government recognises the challenges and opportunities in managing the efficientmovement of freight vehicles on the city’s transport networks. In August 2013 it released its freightand logistics plan – Victoria: The Freight state. This plan has an overarching goal to maximise thecontribution of the freight and logistics sector to Victoria’s productivity and liveability.
A number of directions have been identified in the plan that will contribute to addressing some of theissues identified in this case study. For example, there is an emphasis on using spare overnightcapacity (Direction 8), providing an efficient freight network that includes major new investments(Direction 9), increasing the role of rail freight (Direction 10), and better managing freight deliveryin urban areas (Direction 15).
The Victorian Government has identified the western section of East West Link as the next priorityproject to improve freight efficiency by providing a new major connection between the Port and keyindustrial centres in the west. This is anticipated to also reduce noise and air pollution in the westernsuburbs by providing a motorway option for trucks, and contribute to urban renewal in the west byproviding a safer environment for pedestrians and cyclists.
Detailed planning for the western section of the East West Link will be underway in 2014, with earlyworks expected to be commenced by the end of 2015.
The Brisbane proposal would provide the potential for freight movements to avoid major arterialsthat are becoming increasingly congested and separate freight and passenger train paths on thebusy Citytrain network. However, given the scale and complexity of the railway construction taskas it was defined for the case study, the estimated economic benefits of the project weresignificantly outweighed by the upfront capital costs.
This involves development of a new and upgraded 300 kilometre long railway from the coalfieldswest of Brisbane over the Toowoomba Range to the Port of Brisbane. The line would be targetingmillions of tonnes of coal situated in the Surat basin. This has the potential to deliver spin-offbenefits to the container trade by paving the way for long train lengths, double stacking, dedicatedaccess and improved transit time for all rail freight.
A central issue with this study is whether the costs and reliability issues associated with congestionon current road and rail networks justify the construction of such a significant infrastructureproposal. Our economic and financial analysis has suggested that the case for the project would bedifficult to justify.
The central issue with the proposal is the very high cost of construction, which is linked to the scaleand complexity of the task of constructing a new railway through difficult terrain as well as an
Australian Government Department of Infrastructure and Regional DevelopmentA study of the potential for dedicated freight infrastructure in Australia Ernst & Young ÷ 6
established and well utilised urban rail corridor. Our analysis has shown that even with substantialcoal and other significant volumes from the inland rail, this railway as a whole could not generaterevenues sufficient to justify the cost. This would not be the case in a more remote area, or wherethe terrain is more straightforward, which highlights the challenges for considering investments indedicated rail freight links in the Brisbane context.
Advice from the Port of Brisbane is that lower cost options currently are being investigated as partof its pre-feasibility study, which is being undertaken to identify a sustainable and balanced transportsolution that will demonstrate the commercial, social and environmental viability of dedicated railfrom the Surat Basin to the Port of Brisbane. As part of their ongoing work, the Port has also beenre-thinking and updating its assessment of market potential for the project, and preliminary findingssuggest the railway may deliver greater value potential than what has been modelled in this casestudy.
Where to from here?
While these case studies do not demonstrate the case for dedicated or priority freight infrastructure,there may be good opportunities for such investments in Australia in the near future. What we havelearned is that in cases where the principles of demand suggest there could be a good case forinvestment, it is important that solutions are discovered that are properly focussed on the objectivesfor container freight efficiency, and can be provided in a well-designed and cost effective fashion.
Australian Government Department of Infrastructure and Regional DevelopmentA study of the potential for dedicated freight infrastructure in Australia Ernst & Young ÷ 7
PART A: Scoping Study (April 2012)
Australian Government Department of Infrastructure and Regional DevelopmentA study of the potential for dedicated freight infrastructure in Australia Ernst & Young ÷ 8
1. Introduction1.1 Background to the StudyIn 2008, Infrastructure Australia (IA) and the National Transport Commission (NTC) were tasked bythe Council of Australian Governments (COAG) to prepare a National Ports Strategy. That Strategywas finalised and agreed by Australian Infrastructure and Transport ministers, and is to beconsidered for adoption by COAG in early 2012.
The Strategy seeks to improve the efficiency of port related freight movements across infrastructurenetworks, minimise negative externalities associated with freight movements and influence freightpolicy development. A recommendation in the Strategy (rec 3.10) is that:
“The Bureau of Infrastructure Transport and Regional Economies should assess theconditions under which the introduction of dedicated freight land transportinfrastructure segments related to relevant container ports would be justified”
The Bureau of Infrastructure Transport and Regional Economies (BITRE) appointed Ernst & Young(EY) to prepare a report that would inform its response to the recommendation. It sought advice onthe conditions under which dedicated land freight transport infrastructure segments would bejustified, and consideration of any case studies for such freight infrastructure development aroundcontainer ports in Australia.
1.2 What is ‘dedicated or priority freight infrastructure’?For this study, the term ‘dedicated or priority freight infrastructure’ refers to infrastructure thatdemarcates freight traffic from other transport users such as commuters or passengers, either byproviding exclusive or preferential access to freight on that infrastructure network or asset.
Dedicated freight infrastructure can involve a wholly discrete network such as a dedicated truckroad, or a segment of wider access infrastructure such as a truck lane on a major freeway.
Priority freight infrastructure may involve signalling, pricing or other measures such as curfews thatprovide advantageous access to freight users.
Introducing dedicated and priority freight infrastructure may mean retrofitting existinginfrastructure to provide dedicated or priority use or developing new infrastructure.
The focus of this study is on dedicated or priority freight infrastructure associated with Australia’smajor metropolitan container ports.
In defining the conditions that would justify dedicated or priority freight infrastructure, we haveexamined economic, market and commercial conditions around Australia’s five major containerports – Port Botany, Melbourne Port, Port of Adelaide, Freemantle Port and Port of Brisbane.
1.3 Study objectives and purposeThe objective of the study is to assist BITRE to respond to the National Ports Strategyrecommendation by providing a practical and evidence based assessment of the conditions thatwould support the development of dedicated and priority freight infrastructure around Australia’smajor container ports.
The study consists of two stages of work and this report constitutes completion of Stage One.
Stage One: A scoping study and literature review
The purpose of this stage is to:
Australian Government Department of Infrastructure and Regional DevelopmentA study of the potential for dedicated freight infrastructure in Australia Ernst & Young ÷ 9
► Define the issues that drive dedicated or priority freight infrastructure proposals with referenceto international examples and the Australian context
► Propose case studies for further examination in Stage Two
The key output from this stage of the analysis is a set of case studies for more detailed examination.
Stage Two: Detailed analysis on case studies
The purpose of this stage is to:
► Undertake detailed research and analysis of the case studies identified in Stage One andconduct a rapid cost-benefit analysis on each case study
► Drawing on the findings of the cost benefit analysis, identify the conditions under whichdedicated and priority freight infrastructure would be justified
The key outputs from Stage Two are case studies in the form of rapid cost-benefit analyses, rapidfinancial analyses and gauging potential private sector interest in delivering the projects.
1.4 Methodology1.4.1 Stage OneStage One is comprised of four steps set out below, which is the basis of this Report.
Step 1: Literature Review
A literature review drawing on international and domestic literature from government, industry andacademia. The focus of the review was on developing a deep understanding of the challenges facingAustralia’s port and freight sectors and the market for developing infrastructure.
The findings in this review were then applied to the Australian context through an examination ofAustralia’s major ports.
Step 2: Stakeholder Consultation
Stakeholder consultations were undertaken with port and supply chain industry leaders and policymakers.2 The purpose of the discussions wasto establish the potential for dedicated freightinfrastructure around Australia’s major container ports and identify a list of potential case studies forStage 2 of the study.
Step 3: Establish the principles for dedicated and priority freight infrastructure
Drawing on the research gathered in the previous steps, develop a principles-based framework forconsidering the conditions which justify dedicated and priority freight infrastructure. The principles-based framework considers the drivers of demand and supply for dedicated and priority freightinfrastructure.
Step 4: Identify case studies for further examination
Apply the framework to the long list of potential case studies of dedicated and priority freightinfrastructure to identify 2-3 case studies for further examination in Stage Two of the study.
1.4.2 Stage TwoStage Two is comprised of five steps set out below.
2 A full list of stakeholders consulted can be found in Appendix A
Australian Government Department of Infrastructure and Regional DevelopmentA study of the potential for dedicated freight infrastructure in Australia Ernst & Young ÷ 10
Step 1: Project Data Collection and Further Consultation
Working closely with state government and other project stakeholders in order to obtain relevantproject data and insights.
This involved first working with stakeholders in order to understand the availability of robust data.EY contacted the key state government transport officials to discuss the availability of data for thecase studies.
Project stakeholders were cooperative in the provision of sensitive project data that has enableddetailed and rich analyses of project drivers.
Step 2: Rapid Cost-Benefit Analysis
This step sought to identify and value the cost and benefit steams associated with each of the casestudies. In the case of the Melbourne case study, it involved interrogating traffic modelling andeconomic appraisal data already completed as part of a formal business case for the proposal. Forthe Brisbane case study, it involved undertaking an independent cost-benefit with available data inline with national project evaluation guidelines.
Step 3: Financial Analysis
The study assessed the commercial feasibility of the project through identifying and measuring thecost and revenue streams associated with each case study. This analysis also sets the scene forconsidering the types of commercial delivery models that would be suitable for the case study.
Step 4: Commercial Analysis
Based on the findings of Stage One, combined with the economic and financial assessments, thestudy considered the potential commercial models and governance issues for introducing dedicatedand priority freight infrastructure.
Step 5: Assess Market Views
For each of the proposals, the study considered the level of market interest and demand fromrelevant stakeholders, and in particular with respect to contributing to its commercial delivery.
1.5 Structure of this reportThis report covers the findings of Stage One of the study. It includes:
► A discussion on Freight and Port Productivity in Australia
► A review of examples of dedicated and priority freight infrastructure
► An assessment of the principles for considering dedicated and priority freight infrastructure
► An assessment of the potential need for dedicated or priority freight infrastructure atAustralia’s major container ports
► An analysis of the range of potential case studies for further investigation
The detailed case studies that are part of Stage Two are to be reported separately.
Australian Government Department of Infrastructure and Regional DevelopmentA study of the potential for dedicated freight infrastructure in Australia Ernst & Young ÷ 11
2. The Pursuit of Freight ProductivityThis chapter examines the critical nature of improving freight productivity in Australia. It considers:
► The importance of freight productivity
► Market failures relating to freight infrastructure
► Responses to Market Failures
► The rationale for dedicated and priority freight infrastructure
2.1 The Importance of Freight ProductivityAustralia’s freight networks are vital to the Australian economy. As an island nation with widelydispersed populations, we rely on efficient freight networks to facilitate the movement of goods fromour shores to our cities and across the country. Despite this, our freight networks suffer from poorproductivity, which imposes economic, social and environmental costs to industries andcommunities.
While freight inefficiencies take on a number of forms, congestion is the major impediment facingthe country’s two largest metropolitan ports – Sydney and Melbourne – which combined, account for70% of Australia’s container freight throughput. Congestion can be measured by the avoidable socialcost it imposes on the community, including extra travel time, increased unreliability, higher vehicleand fuel costs and poorer air quality.
Transport inefficiencies such as congestion represent a drag on national competitiveness in the formof higher transport costs and lost productivity. The social cost of congestion in our capital cities wasestimated at $9.4 billion in 2005, including 3.5 billion in private time cost, $3.6 billion in businesstime costs and $1.2 billion in extra vehicle operating costs. The Sydney metropolitan area had thehighest cost of congestion out of all Australian cities; $3.5 billion. Without significant action, thecost of congestion in Australia’s capital cities is expected to double by 2020, reaching approximately$20.4 billion per year.3
The landside costs at Australian ports are another impediment on productivity and competivenessof freight supply chains. These are the largest and most rapidly increasing cost element of containerfreight transport. Indeed, for Sydney and Melbourne, landside costs exceed the total of all otherport container supply chain costs.4 Rapidly rising costs would suggest that supply constraints arebecoming more acute at those ports.
Therefore, Australia’s major container ports and landside connections are at a critical juncture,whereby the level of publically provided infrastructure will soon be inadequate to service the growingfreight task for many of Australia’s metropolitan ports. This highlights the urgent need for reformand investment to improve the productivity of freight networks servicing Australia’s ports.
If action is taken, a background paper to the ports strategy indicates that the potential productivitygains from improving the efficiency of Australia’s ports could be up to $300 million per year to theAustralian economy5.
Improving the productivity of ports and landside transport networks would have direct benefitsthrough a better functioning freight sector and reduced costs of moving freight and indirect benefitsthrough enhanced competitiveness down the supply chain to supporting industries. Combined, thiswould lead to greater national output. Improved freight productivity could also benefit transport
3 BTRE2007, Estimating urban traffic and congestion cost trends for Australian cities, Working paper 71.4 Infrastructure Australia and the National Transport Commission, National Ports Strategy Background Paper, 20105 GHD Background Paper 3 for the National Ports Strategy 2010

Australian Government Department of Infrastructure and Regional DevelopmentA study of the potential for dedicated freight infrastructure in Australia Ernst & Young ÷ 12
system users through reduced accident exposure risk, improved amenity and better environemntaloutcomes.
There are several potential drivers of productivity imovements in Australia’s freight networks:improvements in technology, an increase in organisational efficiency, better coordination along thefreight supply chains, and re-allocation of investment and resources to the most productive and cost-effective mode of transport.
These ‘natural’ drivers of freight productivity are somewhat hampered by the market failuresassociated with freight infrastructure. This gives rise to a fundamental need for market developmentand innovative solutions to improving freight productivity.
2.2 Market Failures relating to Freight InfrastructureEconomic theory suggests that market failures in the provision of freight infrastructure and servicesconstrain freight efficiency and lower overall productivity.
‘Market failures’ occur where the market does not provide the level of infrastructure required ordoes not promote its efficient use. It can include situations where the market does not allocateresources efficiently, does not provide what users demand in the quantities or at the time that theywant, or where there are spill over effects to third parties.
In the case of freight infrastructure in Australia, notable market failures can be seen both in ports’supply chains that move goods and raw materials, and in freight infrastructure planning and funding.Four key market failures relating to freight infrastructure are considered in detail below.
Infrastructure as a public good
The market may not provide the necessary freight infrastructure when required because of thepublic good characteristics of infrastructure, meaning that an investor is unable to capture the fullbenefits of investment, creating a disincentive to investment.6 As a result, road and railinfrastructure has tended to be delivered by direct government provision.
Consultation with the ARTC brought to light that, to attract users, it prices some of its regulatedinfrastructure at up to 30% of the ceiling minus floor price,7 meaning that rail infrastructureproviders do not fully recover their capital costs. There are many examples of intermodal rail freightoperators closing down due to the lack of profitability.8
Competitive distortions between road and rail
Non-excludable and open infrastructure characteristics make it difficult to effectively price roadinfrastructure. The resulting competitive distortion between road and rail transport can give rise toan ‘unlevel playing field’ between modes.
In a perfect market, users of road and rail would pay the short-run marginal costs plus an amount tocover other costs structured so that price-marginal cost ratios are similar where the modes compete.This would ensure the most efficient allocation of resources between competing modes. However,road and rail have inherently different pricing models.
Unpriced negative externalities in the form of congestion, pollution and poor amenity are notaccounted for in road freight pricing. The inability of road prices to capture and pass on the costs ofusing the infrastructure further distorts consumption and investment decisions.
6 Australia’s Infrastructure Policy and the COAG National Reform Agenda, Luke McInerney, Chris Nadarajah and FrancesPerkins, The Australian Treasury.7 Discussions with ARTC management in Adelaide March 20128 CRT in Melbourne with its Cargo Sprinter train between the port and Altona North ceased business in 2006 and Patrick Railceased its regional and metropolitan service to Camellia in 2010. Patrick said they had been subsiding the service to creategreater throughput through its Port Botany terminal. Rail Express April 27 2010.

Australian Government Department of Infrastructure and Regional DevelopmentA study of the potential for dedicated freight infrastructure in Australia Ernst & Young ÷ 13
The 2006 Productivity Commission (PC) Inquiry into Road and Rail Freight Infrastructure Pricingfound limited price distortions between road and rail once registration and fuel charges wereaccounted for, and factoring in externalities.
The Commission also argued that road and rail have unique advantages and therefore substitutabilityis low: road freight is flexible and suited to short distances and time-sensitive items, while rail issuited for higher volumes and longer hauls.9 The federal Bureau of Infrastructure, Transport andRegional Economics (BITRE) likewise estimated that rail only effectively competes with road onfreight journeys over 1000 kilometres.10
As such, short haul rail freight faces challenges in competing with road transport. As well as this,consultation with several stakeholders including the ARTC, Asciano, QRN and Sydney PortsCorporation suggested that the different pricing regimes between road and rail was a key barrier tomore efficient network use around congested container ports.
Poor coordination in container freight supply chains
Coordination externalities arise where a group of companies or individuals do not coordinate todevelop the most efficient solution, either in terms of infrastructure development or supply chainperformance. There may be several reasons why effective coordination is difficult, includingimperfect information, mistrust between parties or poor visibility of the requirements of others.
Fragmented supply chains with multiple participants require a high-level of coordination betweeneach functional stage of the supply chain. Failure to coordinate can result in several inefficiencies. Astudy on Port Botany’s supply chain found that lack of coordination along the supply chain results inincreased costs, underutilisation of resources, capacity mismatches at different stages in the supplychain, bottle necks and an overall mismatch between system demand and capacity.11
A recent study by Shipping Australia also highlighted the inefficiencies of rail service qualityeffecting Port Botany caused by lack of coordination along supply chains.12 There is a misalignmentbetween stevedore timeframes and accessing the rail network. This means rail operators have towork around the stevedores’ timetable when collecting freight, and then work around theRailCorp/ARTC timetable in accessing the rail network. Misalignment of the schedules causes delaysand increased costs in moving the freight out of the port yard.
2.3 Policy Responses to Market FailuresThere is a wide range of potential policy options to address market failures and improve theproductivity of Australia’s ports and landside connections. This section outlines key policydevelopments targeting improved freight productivity, a more thorough examination of the policyinitiatives in each port can be found at Chapter 5 of this report.
It is important to recognise that dedicated and priority freight infrastructure is only one of a range ofpolicy initiatives for improving the freight productivity of Australia’s ports. While stakeholdersacknowledged the potential innovative role for dedicated and priority freight infrastructure inimproving freight productivity, several stakeholders also commented on the importance of ‘sweating’existing assets through reform initiatives before investing in new infrastructure.
Strategic Planning
In recent years there has been greater emphasis on strategic coordination and planning ofinfrastructure to drive productivity. For the port sector, this has culminated in the development ofthe National Ports Strategy which was the first genuinely national perspective to coordinate portsplanning in Australia.
9 BITRE (2009), Where and how do road and rail freight compete with or complement each other?, Fact Sheet, April.10 BITRE,2009, Road and Rail Freight: Competitors or Complements?, Information Sheet 3411 IPART, Reforming Port Botany’s links with inland transport, Draft, 200712 Shipping Australia Metropolitan Intermodal Terminal Study 2011
Australian Government Department of Infrastructure and Regional DevelopmentA study of the potential for dedicated freight infrastructure in Australia Ernst & Young ÷ 14
The ports strategy made a series of recommendations covering planning, implementation, landsideefficiency and accountability. The strategy seeks to improve the transparency across port supplychains, improve the efficient coordination of freight movements, and minimise negativeexternalities.
State governments have also adopted a more strategic focus on planning and coordination for portsand transport networks:
► The NSW Government is preparing a state ports policy for later in 2012, as part of itsdevelopment of a NSW Freight Strategy.
► The Victorian Government is developing the Transport Solutions strategy with the aim ofreducing road, rail and port logistical bottlenecks, improving freight efficiency and prioritisinginvestment in road, rail and port facilities across local, arterial and national transport corridors.
► The Queensland Government are developing a strategic plan for ports following the release ofan integrated freight strategy last year with an emphasis on optimising existing assets.
Pricing reform
There are several initiatives underway aimed at reforming road infrastructure pricing.
In 2007 the Council of Australian Government (COAG) set an agenda for road infrastructure pricereform with the aims of delivering more efficient road transport networks and enhancing freightproductivity. A Road Reform Unit was established. Central to this is the promotion of the user paysprinciple and strengthening the link between price and actual use of the road network.
The current charging framework for road infrastructure consists of a combination of registrationfees and fuel-based subsidies but does not reflect the actual use of the road network by vehicles.The Road Reform Unit has developed an Evaluation Framework Reference Guide and PolicyFramework Reference Guide outlining the high-level principles to guide the development ofalternative pricing models. Two of the pricing principles are that prices should reflect marginal costsof use of the infrastructure and should recover the efficient cost of infrastructure provision. Cost-based prices provide signals for heavy vehicle operators to make informed operational choices thathave the potential to change the nature of road use and ultimately, reduce road maintenance costs.
These policy moves towards direct pricing of road use are supported by improved technology tomonitor truck freight movements and more accurately estimate the cost of using the infrastructure.
Targeted mode shift from road to rail
Movement of container freight by rail rather than road is key strategy for alleviating congestionaround ports. Most states have policies to increase the share of rail. NSW has set a target to doublethe share of rail freight from 14% to 28%, and Victoria has earmarked it as a key initiative in futuretransport plans and strategies. In Western Australia, there is a long term plan to cap containermovements through Fremantle Port at 1.2 million TEU, almost double the current level, and for railto handle 30% of the container movements. At the federal level, there is also strong support forpolicies that would encourage rail freight to remove trucks from the roads.13
Improved coordination
In 2008, the NSW Independent Pricing and Regulatory Tribunal (IPART) recommended a logisticscoordination team be established to drive efficiencies at Port Botany.14 In response, the NSWGovernment established the two-stage Port Botany Landside Improvement Strategy (PBLIS) reformprocess.
13 See http://www.financeminister.gov.au/archive/media/2010/mr_202010_joint.html and Joint Media Statement by AnthonyAlbanese Federal Minister of Infrastructure and Transport and John Fullerton, CEO of ARTC, “Port Botany Rail Upgrade: FirstStage Completed” 3 April 201214 Recommendation 15, IPART (2008), Reforming Port Botany‘s Links with Inland Transport.

Australian Government Department of Infrastructure and Regional DevelopmentA study of the potential for dedicated freight infrastructure in Australia Ernst & Young ÷ 15
Stage 1 has involved a Regulated Operational Performance Management (OPM) process for roads,and a voluntary approach for rail. Road performance regulations set benchmarks for transferringfreight between stevedores and road carriers, with financial penalties applying to both groups fordelays/late arrivals, etc. Already, this has delivered consistent improvements to truck turnaroundtimes, increased take up of off peak and weekend time slots, and greater transparency aroundstevedores’ time slots.
It was intended that Stage 2 would be introduced in 2012 if voluntary measures in Stage 1 are notproven to be effective. Stage 2 measures could include a Demand Management System (peak periodpricing), options to improve empty container parks’ operating hours and performance, and aregulated OPM Rail Framework.15 It is understood that at this time, no further work will becompleted for a Demand Management System at the Port.
Another initiative aimed at improving coordination is Adelaide’s Vehicle Management Systemintroduced to improve truck waiting times.
Control and management along supply chains
There is growing trend towards ports reaching beyond their traditional port boundaries to manageother parts of the supply chain’s landside connections, such as freight railways, intermodalterminals, container parks and cold store facilities, all of which use the port’s monopoly influence tomaximise overall supply chain efficiency. Through management and greater control over supplychains, ports can achieve greater efficiency by exerting ‘command and control’ rather thanstruggling with lack of coordination along fragmented supply chains with many operators.
The Port of Brisbane operates the multimodal terminal near the dock. Similarly, Sydney Ports ownsand is developing the Enfield intermodal terminal as a container staging area. It is in Brisbane wherethis trend is being extended to the fullest extent. The port, which was only privatised in late 2010, islooking to control a major rail link to the port in order to ensure its ability to grow.
Institutional reform
Recent decades has seen extensive institutional reform in Australia’s port sector towards morecommercialised enterprises with clear commercial objectives.16 The precise nature of the reformhas varied between jurisdictions with a common underlying theme to establish more commercialoperations that improve port performance.
In September 2011 The NSW Government announced its intention to refinance the Port of Botanyvia a 99 year lease. This is in effect a privatisation on a similar basis to the Port of Brisbane. Therefinancing process is expected to be completed by mid-2013. In principle, by introducing a privateoperator, the refinancing has the potential to reduce conflicts of interest by separating theoperational and regulatory functions of Port Botany, drive improved efficiencies, attract privateinvestment and raise public funds to upgrade supporting infrastructure networks.
Privatisation of the Port of Brisbane has provided a more commercial and market focused outlookfor the port. A good example of this is the Port Access Charge (PAC) for collecting funds to build thelast mile of the Port of Brisbane Motorway. The PAC of $7.83 per TEU is levied on containerstransported by road while rail containers are exempt from the levy.
Improving Truck Productivity
Improving truck productivity refers to the number of containers per truck, round trip. This ismonitored by the BITRE’s Waterline publication, which shows truck productivity increased from 2.1in September 2006 to 2.3 in December 2010. In part this could be the result of trucks with greatercapacity, that is, B-Doubles taking some market share from semi-trailers. The greatest gains in this
15 Gunn (2011), Congestion Versus Landside Reform at Port Botany.16 Infrastructure Australia and the National Transport Commission, Background paper for the NPS ‘Effective port governanceand project evaluation’ April 2010
Australian Government Department of Infrastructure and Regional DevelopmentA study of the potential for dedicated freight infrastructure in Australia Ernst & Young ÷ 16
area will come from increased back-loading of trucks. This will require greater coordination, withmatching of export and import bookings within the stevedore’s vehicle booking systems.
The Port of Freemantle has permission from the ACCC to give preferential treatment to two wayloaded trucks that both deliver and receive containers. Unfortunately the project was cancelled dueto high costs, but it would have had the potential to enhance the productivity of trucks.
Regulatory reform
The former prescriptive approach to regulating heavy vehicles, including mandating how to achieveregulatory standards was found to inhibit innovation, limit efficiency and raise freight costs.17 This isnow being replaced with the National Transport Commission’s Performance Based Standards. Themove to a more cost-effective framework has the potential to enhance the productivity of roadtransport.
The introduction of Performance Based Standards has brought forward innovations from thetrucking industry to expand the capacity of high performance vehicles. In Queensland, largegovernment expenditures on upgraded road infrastructure has accompanied the introduction of newA-double trucks that can carry two forty foot, hi-cube containers (four TEU) with a higher weight perunit, taking containerised grain and cotton volumes from rail.
Another example of regulation is a cap on inner harbour container movements at the Port ofFreemantle. The cap of 1.2 million TEU is almost double the current TEU level and effectively placesan upper limit on congestion caused by freight trucks. This has required long term planning to movea large proportion of containers onto rail and develop plans for a new port at Kwinana, 20 kilometressouth of the current port.
Investment in infrastructure
There is a patchwork of investment in infrastructure across states and territories targeted atimproving freight productivity and alleviating congestion. Key initiatives in each state are listedbelow:
17 http://www.pc.gov.au/__data/assets/pdf_file/0003/47532/freight.pdf
Australian Government Department of Infrastructure and Regional DevelopmentA study of the potential for dedicated freight infrastructure in Australia Ernst & Young ÷ 17
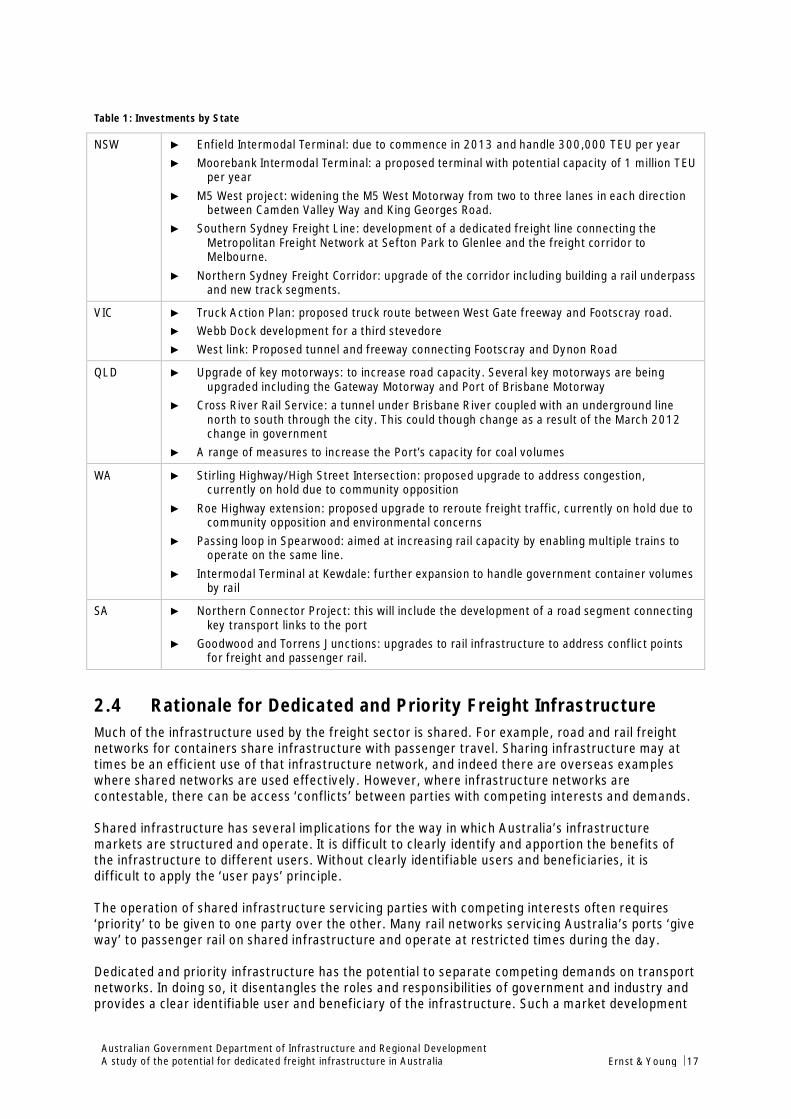
Table 1: Investments by State
NSW ► Enfield Intermodal Terminal: due to commence in 2013 and handle 300,000 TEU per year► Moorebank Intermodal Terminal: a proposed terminal with potential capacity of 1 million TEU
per year► M5 West project: widening the M5 West Motorway from two to three lanes in each direction
between Camden Valley Way and King Georges Road.► Southern Sydney Freight Line: development of a dedicated freight line connecting the
Metropolitan Freight Network at Sefton Park to Glenlee and the freight corridor toMelbourne.
► Northern Sydney Freight Corridor: upgrade of the corridor including building a rail underpassand new track segments.
VIC ► Truck Action Plan: proposed truck route between West Gate freeway and Footscray road.► Webb Dock development for a third stevedore► West link: Proposed tunnel and freeway connecting Footscray and Dynon Road
QLD ► Upgrade of key motorways: to increase road capacity. Several key motorways are beingupgraded including the Gateway Motorway and Port of Brisbane Motorway
► Cross River Rail Service: a tunnel under Brisbane River coupled with an underground linenorth to south through the city. This could though change as a result of the March 2012change in government
► A range of measures to increase the Port’s capacity for coal volumes
WA ► Stirling Highway/High Street Intersection: proposed upgrade to address congestion,currently on hold due to community opposition
► Roe Highway extension: proposed upgrade to reroute freight traffic, currently on hold due tocommunity opposition and environmental concerns
► Passing loop in Spearwood: aimed at increasing rail capacity by enabling multiple trains tooperate on the same line.
► Intermodal Terminal at Kewdale: further expansion to handle government container volumesby rail
SA ► Northern Connector Project: this will include the development of a road segment connectingkey transport links to the port
► Goodwood and Torrens Junctions: upgrades to rail infrastructure to address conflict pointsfor freight and passenger rail.
2.4 Rationale for Dedicated and Priority Freight InfrastructureMuch of the infrastructure used by the freight sector is shared. For example, road and rail freightnetworks for containers share infrastructure with passenger travel. Sharing infrastructure may attimes be an efficient use of that infrastructure network, and indeed there are overseas exampleswhere shared networks are used effectively. However, where infrastructure networks arecontestable, there can be access ‘conflicts’ between parties with competing interests and demands.
Shared infrastructure has several implications for the way in which Australia’s infrastructuremarkets are structured and operate. It is difficult to clearly identify and apportion the benefits ofthe infrastructure to different users. Without clearly identifiable users and beneficiaries, it isdifficult to apply the ‘user pays’ principle.
The operation of shared infrastructure servicing parties with competing interests often requires‘priority’ to be given to one party over the other. Many rail networks servicing Australia’s ports ‘giveway’ to passenger rail on shared infrastructure and operate at restricted times during the day.
Dedicated and priority infrastructure has the potential to separate competing demands on transportnetworks. In doing so, it disentangles the roles and responsibilities of government and industry andprovides a clear identifiable user and beneficiary of the infrastructure. Such a market development
Australian Government Department of Infrastructure and Regional DevelopmentA study of the potential for dedicated freight infrastructure in Australia Ernst & Young ÷ 18
would allow for application of the user pays principle and swiftly shift the onus for provision offreight infrastructure from government to industry.
The introduction of dedicated and priority freight infrastructure could transform port and landsidelogistics by separating freight traffic from other forms of traffic and thereby providing an efficientpurpose-built means of transporting freight. In this regard, dedicated and priority freightinfrastructure is one approach that can be used to unlock productivity gains and address congestionand capacity constraints where it promotes the freer movement of freight.
The underlying ‘theme’ of port strategy is the desire to unlock productivity gains and raiseinternational competiveness through the efficient use and provision of infrastructure. Importantly,the ports strategy noted that high levels of passenger usage dominate rail and road infrastructurearound Australia’s ports and therefore, at some level of demand, it may be worth consideringdedicated or priority freight infrastructure.
The draft National Land Freight Strategy considers dedicated and priority freight infrastructure to bea potentially important contributor to a truly national and interoperable freight network. The draftstrategy paper notes a move toward dedicated road infrastructure, where traffic density permits,between port and intermodal centres or freight cluster sites. It also suggests dedicated freightinfrastructure as an option to overcome crowding out of freight on some routes and for appropriateseparation of personal and freight transport in urban areas (including dedicated railinfrastructure).18
However, a case by case study of existing dedicated and priority freight infrastructure suggests thatthere are factors to consider other than simple traffic volumes and densities, although these dobolster the economic case for that infrastructure. There may be other considerations such as portaccess, land use, or managing user conflicts on the network.
18 National Land Freight Strategy, Discussion Paper, February 2011

Australian Government Department of Infrastructure and Regional DevelopmentA study of the potential for dedicated freight infrastructure in Australia Ernst & Young ÷ 19
3. Examples of Dedicated and Priority FreightInfrastructure
This section sets out examples in Australia and overseas of dedicated and priority freightinfrastructure. It considers:
► Why these pieces of infrastructure were developed
► How they addressed local freight productivity problems
► What outcomes they have delivered
In Australia, examples of dedicated freight infrastructure do exist, but rarely around containerports. Where cases of dedicated freight infrastructure exist at container ports in Australia, they are,with a few exceptions, provided in only limited segments of the overall freight link and/or poorlyintegrated with the transport network.
A primary problem with the so-called dedicated rail infrastructure in Sydney, Brisbane, Adelaide andFremantle is that none of them are truly unencumbered as they all share a corridor or interact withpassenger trains at some point, and due to passenger priority, delays result. Unfortunately, data oneach of the examples of domestic dedicated/priority freight infrastructure is limited, restricting theability to analyse the infrastructures’ effectiveness.
There are a number of international cases (road and rail) where dedicated freight infrastructure hasbeen used. Enough information on each of these international projects was found in order toprovide a comprehensive analysis of the principles that justified the investment in dedicated freightinfrastructure, and their effectiveness.
The rail examples studied were found at the Ports of Los Angeles, Miami and Rotterdam and involvein the main, separating freight and passenger trains and carrying out large infrastructureinvestments to reduce interaction with motor vehicles in busy city environs.
One of the road examples that were studied involves a road tunnel connecting the Port of Dublin toareas beyond the central business district, providing an alternative means for heavy vehicles totravel between the port and the motorway and reduce congestion in the city. Other road forms ofdedicated freight infrastructure considered were studies of truck only lanes, which involve thesegregation of lanes solely for heavy vehicles from remaining lanes on the motorway to increaseroad safety and reduce congestion. All of these forms of dedicated freight infrastructure have beenchosen because they have direct relevance to Australia and this study.
3.1 Australian cases of dedicated and priority freightinfrastructure
In Australia, examples of dedicated freight infrastructure do exist, but mostly around bulk freight,such as to move iron ore and coal from mine to port. In the Pilbara, the movement of iron oreutilises unencumbered access to the track at any time. On the East Coast, the coal lines have tocross main lines or interact with passenger and other freight trains, but the infrastructure is suchthat interactions are in the main minimal (passing loops and overpasses).
These systems carry large volumes of one product from a few customers to one point, one way. Theprovision of the infrastructure and the transport service is either self-provided or provided by thirdparties who receive sufficient profit to keep re-investing to expand capacity. They are extremelyefficient and in many cases involve world best-practice in their task. These assets also have clearlydefined property rights, such that the infrastructure owner is properly incentivised to optimise thatinfrastructure’s use.
Australian Government Department of Infrastructure and Regional DevelopmentA study of the potential for dedicated freight infrastructure in Australia Ernst & Young ÷ 20
However, when it comes to the provision of dedicated infrastructure around container ports, thepicture is somewhat less efficient. Volumes are smaller, more diverse and minutely partitioned.Interaction with passenger traffic on road or rail is constant leading to congestion and a morecomplex freight task. Most container freight journeys are shorter distance, involve operations inurban environments, and these supply chains cater to many customers who require door -to-doorservice, a factor which can make road more suitable.
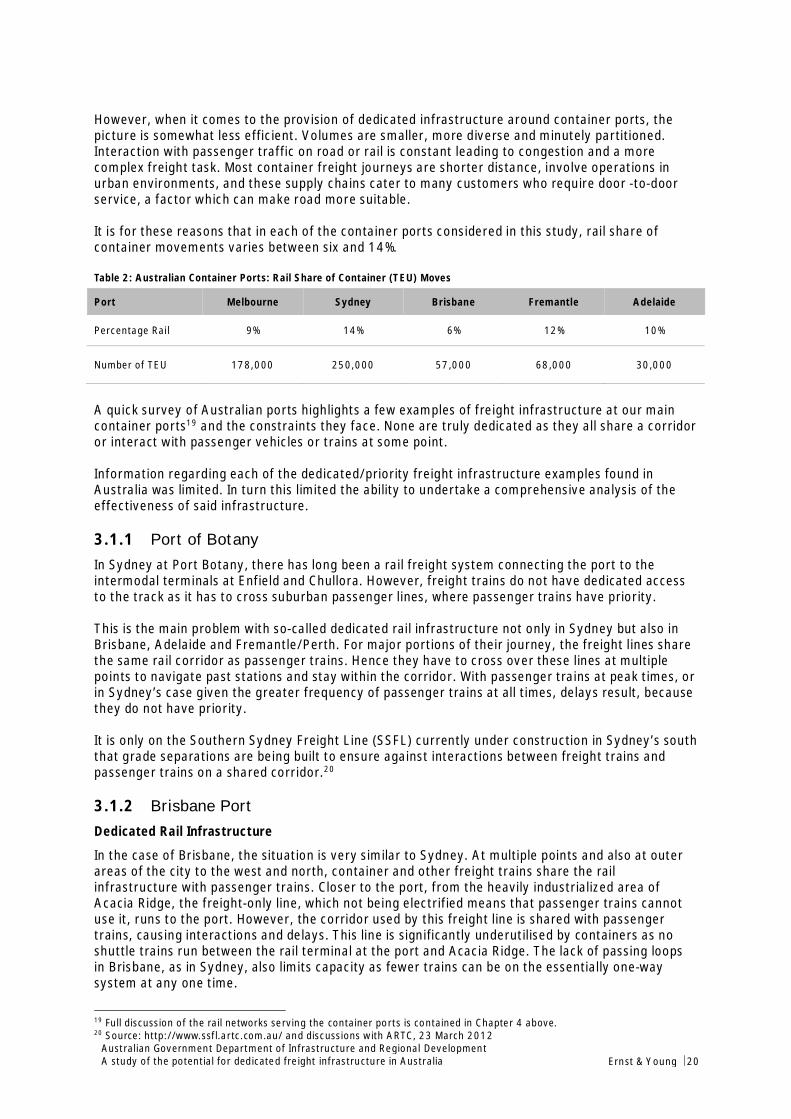
It is for these reasons that in each of the container ports considered in this study, rail share ofcontainer movements varies between six and 14%.
Table 2: Australian Container Ports: Rail Share of Container (TEU) Moves
Port Melbourne Sydney Brisbane Fremantle Adelaide
Percentage Rail 9% 14% 6% 12% 10%
Number of TEU 178,000 250,000 57,000 68,000 30,000
A quick survey of Australian ports highlights a few examples of freight infrastructure at our maincontainer ports19 and the constraints they face. None are truly dedicated as they all share a corridoror interact with passenger vehicles or trains at some point.
Information regarding each of the dedicated/priority freight infrastructure examples found inAustralia was limited. In turn this limited the ability to undertake a comprehensive analysis of theeffectiveness of said infrastructure.
3.1.1 Port of BotanyIn Sydney at Port Botany, there has long been a rail freight system connecting the port to theintermodal terminals at Enfield and Chullora. However, freight trains do not have dedicated accessto the track as it has to cross suburban passenger lines, where passenger trains have priority.
This is the main problem with so-called dedicated rail infrastructure not only in Sydney but also inBrisbane, Adelaide and Fremantle/Perth. For major portions of their journey, the freight lines sharethe same rail corridor as passenger trains. Hence they have to cross over these lines at multiplepoints to navigate past stations and stay within the corridor. With passenger trains at peak times, orin Sydney’s case given the greater frequency of passenger trains at all times, delays result, becausethey do not have priority.
It is only on the Southern Sydney Freight Line (SSFL) currently under construction in Sydney’s souththat grade separations are being built to ensure against interactions between freight trains andpassenger trains on a shared corridor.20
3.1.2 Brisbane PortDedicated Rail Infrastructure
In the case of Brisbane, the situation is very similar to Sydney. At multiple points and also at outerareas of the city to the west and north, container and other freight trains share the railinfrastructure with passenger trains. Closer to the port, from the heavily industrialized area ofAcacia Ridge, the freight-only line, which not being electrified means that passenger trains cannotuse it, runs to the port. However, the corridor used by this freight line is shared with passengertrains, causing interactions and delays. This line is significantly underutilised by containers as noshuttle trains run between the rail terminal at the port and Acacia Ridge. The lack of passing loopsin Brisbane, as in Sydney, also limits capacity as fewer trains can be on the essentially one-waysystem at any one time.
19 Full discussion of the rail networks serving the container ports is contained in Chapter 4 above.20 Source: http://www.ssfl.artc.com.au/ and discussions with ARTC, 23 March 2012
Australian Government Department of Infrastructure and Regional DevelopmentA study of the potential for dedicated freight infrastructure in Australia Ernst & Young ÷ 21
Prioritised Road Infrastructure
In 2010, the Queensland Department of Transport and Main Roads undertook a trial on the BrisbaneUrban Corridor, a major freight corridor in the south-west industrial area of Brisbane, near AcaciaRidge.21 The trial was to consider whether restricting trucks to using the left lane of the two-laneroad for various sections of the 11 kilometre route would help ease congestion or reduce delays formotorists without compromising safety.
The results of the six month trial found it did not “significantly reduce congestion” or increaseefficiency along the corridor because:
► Full enforcement of the use left lane rule was not achieved, participation was voluntary and notat very high levels
► With only a “small proportion” of trucks moving into the left lane, cars did not take advantage ofany additional capacity created in the right lane
► Consistent travel time improvements for cars were not recorded
► The trial did not clear queues more quickly
The trial was also unpopular with the surrounding community and with truck drivers whoparticipated. The department is now investigating legislative and technological solutions to thisissue. The actual road has a large number of local access points, where cars have to enter the leftlane to exit, or enter. This meant there were always cars weaving in or out of the left lane.
Trucking industry stakeholders told us that a system is in place on the same section of road thataims to reduce congestion by discouraging through-traffic. Trucks entering and leaving the sectionare monitored, with those completing the 11 kilometre journey in less than 35 minutes being finedbecause it indicates they travelled through without stopping to make a pick up or delivery. However,industry sources told us that drivers stop for five minutes or so to get their time up and then transitthe whole road.
The government’s aim is to get through-traffic to travel on the Logan Motorway, a toll road furthersouth of the Brisbane Urban Corridor. The toll, plus the extra kilometres involved, is unattractive toindustry. Furthermore, because the Brisbane Urban Corridor transits an area that is industriallyintensive, trucks cannot be banned completely from it.
These findings confirm in a theoretical sense the view of a 2005 Staff Paper from the BITRE.22 TheStaff Paper considered the issue from the perspective of welfare economics. It found that althougha truck has a high value of time for the vehicle as a whole, on a passenger car unit (PCU) basis,which relates to a vehicle’s use of road space (the study assumed an articulated truck requires thesame road space as three cars), its value of time is comparable to that of a private car. From aneconomic efficiency viewpoint, the value of truck-only lanes can therefore be questionable. It alsofound that splitting road users between lanes by regulation, which the trial tried to do, may beinferior on economic efficiency grounds to using pricing (charging more for use of less congested,higher-speed lanes). Generally, regulation can be a clumsy instrument for achieving segregation ofhigh- and low-value-of-time traffic.
3.1.3 Port of FremantleIn Fremantle/Perth there is an extensive dedicated freight railway, within its own corridor, with linksto a number of intermodal terminals/freight cluster points such as Kewdale/Canning Vale andKwinana. But there is one sector, at the Fremantle Rail Bridge, where it has to share access withpassenger trains for roughly a kilometre. This does result in limiting access. Passenger rail takes
21 QTMR, Brisbane Urbane Corridor “Trucks Use Left Lane” Trial: Summary Report March 201122 The Economic Efficiency of Lane Differentiation Policies, Staff paper given by Dr Mark Harvey, to the 28th AustralasianTransport Research Forum, 28-30 September 2005, Sofitel Wentworth Hotel, Sydney
Australian Government Department of Infrastructure and Regional DevelopmentA study of the potential for dedicated freight infrastructure in Australia Ernst & Young ÷ 22
priority, the impact of which is that the freight services are unable to operate during peak hours(0700-1000 and 1600-1900).
3.1.4 Port of AdelaideIn Adelaide, the Australian weakness of mixed gauges comes to the rescue, with the standard gaugefreight line on a different gauge to the broad gauge passenger network. But as they share some ofthe same corridor, there are conflict points where they cross over each other. A plan that seeks toaddress this is currently being considered by Infrastructure Australia.
This freight line is mainly used for bulk grain, with only 30,000 containers going on rail to/from theport to regional areas north of Adelaide. If the current plans before Infrastructure Australia result inan unencumbered dedicated freight line, it will be the first such to a major container port in thecountry. Grain would be the main beneficiary with containers just a small by-product on the track.
3.2 International examples of dedicated and priority frightinfrastructure
The international examples of dedicated freight infrastructure detailed in this section involve in themain, separating freight and passenger trains and carrying out large infrastructure investments toreduce interaction with motor vehicles in busy city environs.
The road examples involve two tunnels from port areas to beyond the central business district andtwo examples of truck only lanes, a concept that has found a lot of interest in the United States.They have been chosen because they have direct relevance to Australia and this study. Rail formsan important role at our container ports and is seen by many as having an enhanced role in relievingcongestion by taking trucks off roads.
Road tunnels are one way, albeit an expensive one, to remove vehicles from one congested area toanother less congested area. But they will not be able to pay for themselves without sufficientvolumes. For road tunnels to give preference to freight vehicles either a blanket ban has to be inplace or a toll used to discriminate in favour of trucks. The Dublin Port Tunnel provides a goodexample of use of a toll.
Truck-only or managed lanes are a newer strategy, particularly in the United States. They haverelevance beyond the port context and may be applicable to the heavily congested motorways inSydney and Melbourne.
3.2.1 Port of Dublin - Dublin Port TunnelThe Port of Dublin is Ireland’s largest sea port, servicing approximately two-thirds of the country’sport traffic. Before the GFC, its volumes grew rapidly, but with the sharp contraction in the Irisheconomy, volumes have since declined.23 In 2010, the port handled 554,000 TEU, 28% below its2007 peak of 774,000 TEU. At the end of 2006, near the peak in containers and general tradethough the port, Dublin built a Port tunnel.
The Case for the Port of Dublin Tunnel
Dublin is the country’s premier port based in the very heart of that city, similar to Melbourne. Trafficcongestion in the centre of Dublin became severe in the late 1990’s, for a number of reasons:
► Prior to the tunnel, all traffic travelling between the port of Dublin and the M50 motorway – amotorway that indirectly connects Dublin to the rest of the country – had no choice but to travelthrough the city centre and fifty sets of traffic lights.24
23 Port of Dublin, “Dublin Port Facilities”, http://www.dublinport.ie/about-dublin-port/facilites/, accessed 23 March 201224 Dublin Port Tunnel, “About the Tunnel”, http://www.dublinporttunnel.ie/about/, accessed 21 March 2012
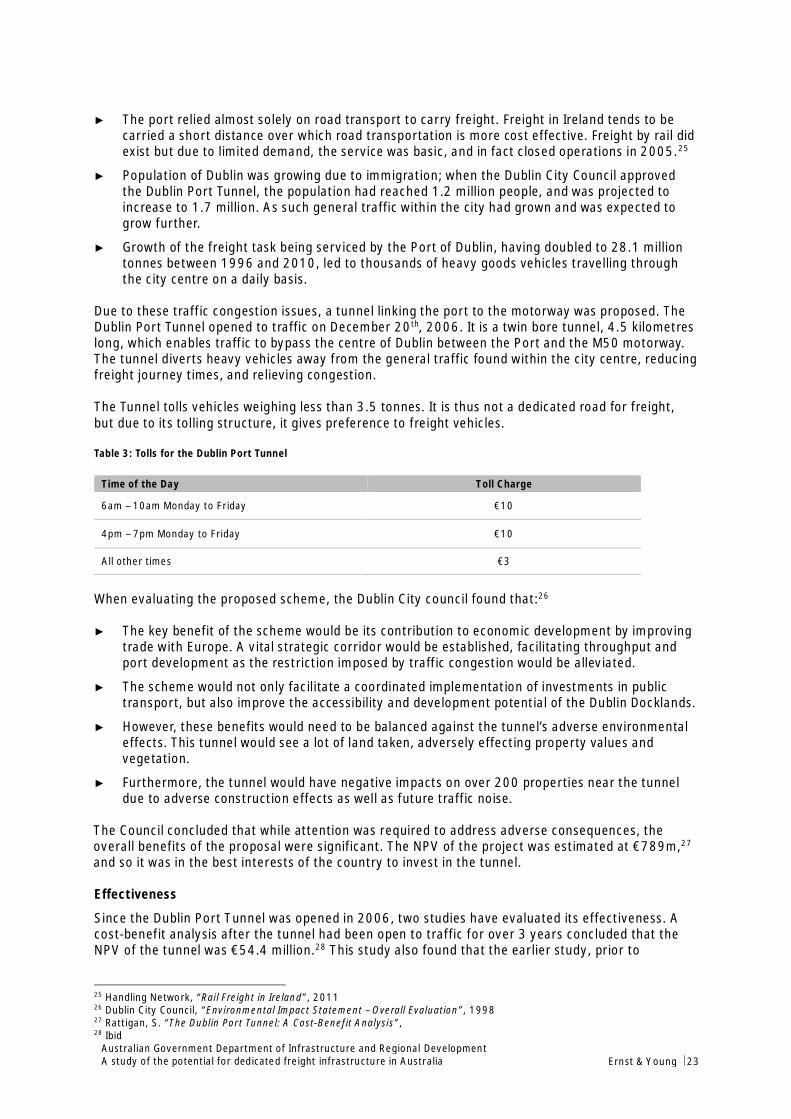
Australian Government Department of Infrastructure and Regional DevelopmentA study of the potential for dedicated freight infrastructure in Australia Ernst & Young ÷ 23
► The port relied almost solely on road transport to carry freight. Freight in Ireland tends to becarried a short distance over which road transportation is more cost effective. Freight by rail didexist but due to limited demand, the service was basic, and in fact closed operations in 2005.25
► Population of Dublin was growing due to immigration; when the Dublin City Council approvedthe Dublin Port Tunnel, the population had reached 1.2 million people, and was projected toincrease to 1.7 million. As such general traffic within the city had grown and was expected togrow further.
► Growth of the freight task being serviced by the Port of Dublin, having doubled to 28.1 milliontonnes between 1996 and 2010, led to thousands of heavy goods vehicles travelling throughthe city centre on a daily basis.
Due to these traffic congestion issues, a tunnel linking the port to the motorway was proposed. TheDublin Port Tunnel opened to traffic on December 20th, 2006. It is a twin bore tunnel, 4.5 kilometreslong, which enables traffic to bypass the centre of Dublin between the Port and the M50 motorway.The tunnel diverts heavy vehicles away from the general traffic found within the city centre, reducingfreight journey times, and relieving congestion.
The Tunnel tolls vehicles weighing less than 3.5 tonnes. It is thus not a dedicated road for freight,but due to its tolling structure, it gives preference to freight vehicles.
Table 3: Tolls for the Dublin Port Tunnel
Time of the Day Toll Charge
6am – 10am Monday to Friday €10
4pm – 7pm Monday to Friday €10
All other times €3
When evaluating the proposed scheme, the Dublin City council found that:26
► The key benefit of the scheme would be its contribution to economic development by improvingtrade with Europe. A vital strategic corridor would be established, facilitating throughput andport development as the restriction imposed by traffic congestion would be alleviated.
► The scheme would not only facilitate a coordinated implementation of investments in publictransport, but also improve the accessibility and development potential of the Dublin Docklands.
► However, these benefits would need to be balanced against the tunnel’s adverse environmentaleffects. This tunnel would see a lot of land taken, adversely effecting property values andvegetation.
► Furthermore, the tunnel would have negative impacts on over 200 properties near the tunneldue to adverse construction effects as well as future traffic noise.
The Council concluded that while attention was required to address adverse consequences, theoverall benefits of the proposal were significant. The NPV of the project was estimated at €789m,27
and so it was in the best interests of the country to invest in the tunnel.
Effectiveness
Since the Dublin Port Tunnel was opened in 2006, two studies have evaluated its effectiveness. Acost-benefit analysis after the tunnel had been open to traffic for over 3 years concluded that theNPV of the tunnel was €54.4 million.28 This study also found that the earlier study, prior to
25 Handling Network, “Rail Freight in Ireland”, 201126 Dublin City Council, “Environmental Impact Statement – Overall Evaluation”, 199827 Rattigan, S. “The Dublin Port Tunnel: A Cost-Benefit Analysis”,28 Ibid

Australian Government Department of Infrastructure and Regional DevelopmentA study of the potential for dedicated freight infrastructure in Australia Ernst & Young ÷ 24
construction had overstated the projects NPV as the cost of the scheme had been underestimatedat €215 million, when it really cost €752 million.
It was recognised that 8200 heavy vehicles use the tunnel daily (one way trips), and 82.4% of heavyvehicles have been removed from the city centre,29 leading to a range of benefits:
► The largest benefit of the project is travel time savings for both users of the tunnel and thoseremaining in the city centre. It was estimated that travel time was reduced by 19%, and that46,100 people saved time. The value of these savings was €25.5 million.
► Reduction in accident rates and costs, as accidents were less likely to occur on the motorway.The cost savings per year were estimated at €12.3 million30 (2002 prices)
► Due to less vehicle braking, vehicle operating costs also fell. As travel times were reduced by19% in the city centre, €20.8 million in vehicle operating costs were saved annually. However,those using the tunnel go around the city and travel an added 11 kilometres relative to usingthe city centre, and the added cost of this is an estimated €5.4 million.
The HGV Management Strategy Review (2009) concluded that by removing heavier vehicles fromthe city centre, the HGV Management strategy has:31
► Reduced noise and pollution levels in the city
► Made city streets safer for vulnerable road users
► Made it possible to reallocate road space to vital public transport
► Removed 97% of 5+ axle vehicles from the East Wall Road.
However, proposals have recently been made to move the port of Dublin away from its currentlocation. The new Port of Drogheda facility proposed for Bremore in north county Dublin nearBalbriggan, about 32 kilometres north of Dublin City is being considered as the new location for theport. The reason for this proposal to move is because it is felt that the existing port does not provideenough space for future operations. Such a change would see the Dublin Port Tunnel’s importanceto the city of Dublin diminish as its use is most likely to fall. However, the port relocation plan hasbeen rejected due to current economic hardships in Ireland.
Funding
The overall project cost was €752 million including €448 million in construction costs.
This project was funded by the Irish government under the National Development Plan andTransport 21 and by the European Union from the Cohesion Fund at 85% aid. This project wasdelivered through the authority’s PPP mechanism.32
In the National Development Plan (NDP) (where the Dublin Port Tunnel was announced), PPP’s wereidentified as being essential in helping to deliver much needed infrastructure required on thenational road network. The NDP planned to spend €1.3 billion to finance PPP projects on nationalroads, which represented 23% of the planned total road investment program under the NDP. Thegovernment felt private finance was vital to remedy Ireland’s infrastructural deficit as quickly aspossible.33
29 Dublin City Council, “HGV Management Strategy Six Month Review”, 2007, Dublin, DCC30 Rattigan, S. “The Dublin Port Tunnel: A Cost-Benefit Analysis”, 200931 Road and Traffic Department, “HGV Management Strategy Review 2009”32 National Roads Authority, “M50 Dublin Port Tunnel”, accessed 26 March 2012,http://www.nra.ie/RoadSchemeActivity/DublinCityCouncil/M50DublinPortTunnel/SchemeName,16534,en.html33 National Roads Authority, “Introduction”, accessed 26 March 2012, http://www.nra.ie/PublicPrivatePartnership/

Australian Government Department of Infrastructure and Regional DevelopmentA study of the potential for dedicated freight infrastructure in Australia Ernst & Young ÷ 25
3.2.2 Ports of LA and Long Beach - Alameda CorridorThe Port of Los Angeles is the busiest container port in the US; servicing 7.8 million TEU a year. Itoccupies 7,500 acres of land and water along 69 kilometres of waterfront.34 It is adjoined by thePort of Long Beach which is the second busiest container port in the US. This port occupies 3,200acres of land across 40 kilometres of waterfront. The seaport boasts approximately USD100 billiondollars in trade and provides more than 316,000 jobs; servicing 3.65 million TEU annually.35 Thesetwo ports, with combined volumes of 11.45 TEU are a vital gateway to US-Asia trade.
The Case for the Alameda Corridor
International trade was growing substantially during the 1980’s and 1990’s, growing at nearly 3% ayear. As such it was expected that cargo serviced by the Ports of Los Angeles and Long Beachwould at least double if not triple between 1998 and 2020.36 Such growth made it critical that portoperations were efficient. However, Southern California already had a congested transportationnetwork with poor intermodal connections, and so improvements to existing infrastructure wereneeded to accommodate the projected increases in freight.37
Prior to the corridor, there were four existing rail lines that were used to transport freight betweenthe port and the national rail system in Los Angeles.
► The tracks had safety concerns, having little more than ‘wigwag’ crossing signals, dating fromthe original construction of the lines. The lines also went through the middle of the city; forcingtrains to travel slowly (limited to 32 km/h).
► A large part of the tracks were shared with passenger services leading to scheduling conflictsand a reduction of freight rail capacity.
► The existing rail lines caused over 200 at-grade railroad crossings, equating to long waitingtimes for vehicles on local roads, and traffic congestion problems in the area.
► In response to these problems, the Alameda Corridor Transportation Authority (ACTA) wascreated in 1989 to fund, construct and operate the Alameda Corridor. The Alameda Corridor isa USD2.4 billion, twenty mile long railway solely dedicated to transporting freight directlybetween the ports and the transcontinental rail lines in downtown Los Angeles. 38 It is a series ofbridges, underpasses, overpasses and street improvements that separate freight trains fromstreet traffic and passenger services in order to improve rail links and alleviate the trafficcongestion at at-grade crossings.
A hurdle presented itself when support from the cities through which the corridor would pass wasneeded. Many mid-corridor cities faced significant adverse effects if the corridor was constructed:
► Adverse effects of construction on local businesses, residents and road congestion
► Increased rail traffic and subsequent noise and air pollution
► Continued negative effects on residents and businesses near the corridor.
Through court proceedings and mitigations to each city, such as employing and training localresidents, and providing funding for local youth; ACTA was eventually able to receive approval toconstruct the corridor.
Effectiveness
The Alameda Corridor has been able to reduce travel times to the national rail network from at least2 hours, to 45 minutes, and increased train reliability. Freight trains no longer go through the city
34 The Port of Los Angeles, http://www.portoflosangeles.org/, accessed 21 March 201235 Port of Long Beach, The Green Port, http://www.polb.com/, accessed 22 March 201236 Agarwai, Giuliano & Redfearn, “The Alameda Corridor: A White Paper”, 200437 Los Angeles County Metropolitan Transportation Authority (2002), “Southern California Freight Management Case Study”,http:www.LACTMA.net/trans_planning/CPD/publications/images/SoCA_FreightStudy.pdf38 Agarwai, Giuliano & Redfearn, “The Alameda Corridor: A White Paper”, 2004
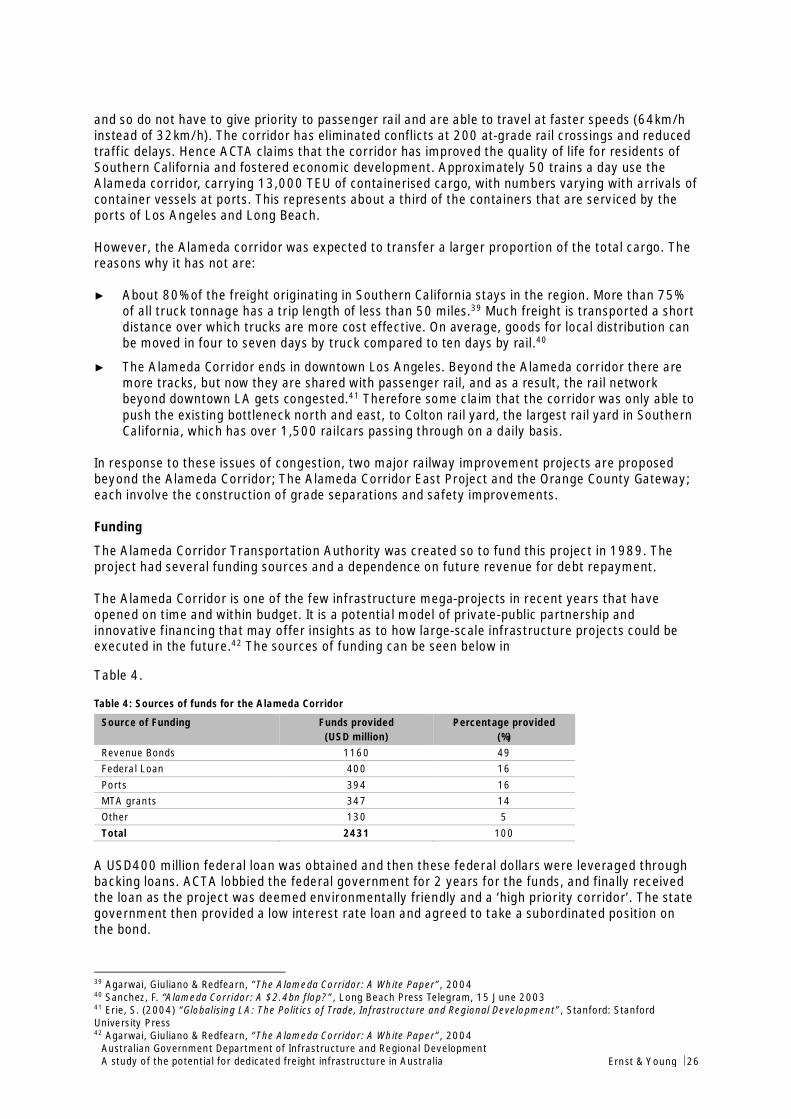
Australian Government Department of Infrastructure and Regional DevelopmentA study of the potential for dedicated freight infrastructure in Australia Ernst & Young ÷ 26
and so do not have to give priority to passenger rail and are able to travel at faster speeds (64km/hinstead of 32km/h). The corridor has eliminated conflicts at 200 at-grade rail crossings and reducedtraffic delays. Hence ACTA claims that the corridor has improved the quality of life for residents ofSouthern California and fostered economic development. Approximately 50 trains a day use theAlameda corridor, carrying 13,000 TEU of containerised cargo, with numbers varying with arrivals ofcontainer vessels at ports. This represents about a third of the containers that are serviced by theports of Los Angeles and Long Beach.
However, the Alameda corridor was expected to transfer a larger proportion of the total cargo. Thereasons why it has not are:
► About 80% of the freight originating in Southern California stays in the region. More than 75%of all truck tonnage has a trip length of less than 50 miles.39 Much freight is transported a shortdistance over which trucks are more cost effective. On average, goods for local distribution canbe moved in four to seven days by truck compared to ten days by rail.40
► The Alameda Corridor ends in downtown Los Angeles. Beyond the Alameda corridor there aremore tracks, but now they are shared with passenger rail, and as a result, the rail networkbeyond downtown LA gets congested.41 Therefore some claim that the corridor was only able topush the existing bottleneck north and east, to Colton rail yard, the largest rail yard in SouthernCalifornia, which has over 1,500 railcars passing through on a daily basis.
In response to these issues of congestion, two major railway improvement projects are proposedbeyond the Alameda Corridor; The Alameda Corridor East Project and the Orange County Gateway;each involve the construction of grade separations and safety improvements.
Funding
The Alameda Corridor Transportation Authority was created so to fund this project in 1989. Theproject had several funding sources and a dependence on future revenue for debt repayment.
The Alameda Corridor is one of the few infrastructure mega-projects in recent years that haveopened on time and within budget. It is a potential model of private-public partnership andinnovative financing that may offer insights as to how large-scale infrastructure projects could beexecuted in the future.42 The sources of funding can be seen below in
Table 4.
Table 4: Sources of funds for the Alameda Corridor
Source of Funding Funds provided(USD million)
Percentage provided(%)
Revenue Bonds 1160 49Federal Loan 400 16Ports 394 16MTA grants 347 14Other 130 5Total 2431 100
A USD400 million federal loan was obtained and then these federal dollars were leveraged throughbacking loans. ACTA lobbied the federal government for 2 years for the funds, and finally receivedthe loan as the project was deemed environmentally friendly and a ‘high priority corridor’. The stategovernment then provided a low interest rate loan and agreed to take a subordinated position onthe bond.
39 Agarwai, Giuliano & Redfearn, “The Alameda Corridor: A White Paper”, 200440 Sanchez, F. “Alameda Corridor: A $2.4bn flop?”, Long Beach Press Telegram, 15 June 200341 Erie, S. (2004) “Globalising LA: The Politics of Trade, Infrastructure and Regional Development”, Stanford: StanfordUniversity Press42 Agarwai, Giuliano & Redfearn, “The Alameda Corridor: A White Paper”, 2004
Australian Government Department of Infrastructure and Regional DevelopmentA study of the potential for dedicated freight infrastructure in Australia Ernst & Young ÷ 27
ACTA issued USD1 billion in senior lien bonds, about half of which was tax exempt, and USD163million in subordinate lien bonds. Relying on future revenue to repay debts made investment in thebonds risky, but an optimistic upbeat economic setting and positive projections of the corridorensured the funds were raised. ACTA also received a grant from the LA County MetropolitanTransportation Authority, in exchange for the inclusion of an LACMTA representative on the ACTAboard.
In 1994, the ports purchased necessary rights-of-way from railroads for USD394 million to assureimpartial dispatching of trains once the corridor was operational and also to get access and controlto the railroad property. The cost of capital of the project was 6.5%.
3.2.3 Port of Rotterdam – The Betuwe RouteThe Port of Rotterdam is the largest port in Europe, and the world’s tenth largest container port interms of TEU handled per year; handling 11.1 million TEU during 2010.It encompasses over 105 square kilometres stretching over 40 kilometres of waterfront.43 It is animportant entry port for Europe wide cargo.
The Case for the Betuwe Route
Currently the Port of Rotterdam is completing a 20% (2000 hectares) extension of the port area.This expansion of the port’s size will represent a major increase in port handling volumes, with aprojected growth of cargo by 5% a year. Therefore additional service frequency and reliability ofroad transport, inland waterways and rail services was required in order for the port to be able toefficiently handle freight and maintain its competitive edge. However, the supporting infrastructureseemed incapable of handling such growth:
► The Port of Rotterdam relied heavily on road transport - although by Australian standards, itsreliance on other modes is exceptional - with 57% of container throughput being taken by roadbefore the Betuwe route was complete (rail - 13%, inland waterways – 30%). However, there weremany congestion problems on the roads in Rotterdam, particularly the A15, which is a crucialtraffic artery for the port.44 A big problem on the A15 was that the numbers of accidents on themotorway were growing (a major incident every few days).
► Passenger trains have priority on the Netherlands rail system, and they were increasingly takingup the networks capacity. It would be common to see freight trains stopping at borders ormaking way for passenger trains due to scheduling issues.
► Freight trains faced multiple bottlenecks such as single track bridges that caused delays whenthe bridge needed to be lifted for shipping.
► If these congestion problems were not relieved, freight flows on the rail network would grow at aslower rate than it potentially could (53% by 2025 instead of 64%), and the flows of transitfreight would move away from Rotterdam.45
The Betuwe route, a 160 kilometre freight dedicated double track rail line between the Port ofRotterdam and the German national rail network; was completed in 2007, at a cost of €4.7 billion.The project allows freight trains free access across Europe and aims to provide an efficientalternative to the congested roads used to transport freight to and from the port. The freight railline will improve travel times – trains can now travel at 100km/h instead of 60km/h46 and reliability,as well as greatly increase the capacity of freight rail up to 200 trains a day can travel along theroute - boosting Rotterdam’s development as a major centre for transport, distribution and
43 Port of Rotterdam Authority, http://www.portofrotterdam.com/en/Pages/default.aspx, accessed 22 March 201244 OECD, “Transcontinental Infrastructure Needs to 2030/2050: Port of Rotterdam Case Study”,45 Koetse, M. J. & Rouwendal, J. “Transport and Welfare consequences of Infrastructure Investment: A case study for theBetuwe Route”,46 Ibid

Australian Government Department of Infrastructure and Regional DevelopmentA study of the potential for dedicated freight infrastructure in Australia Ernst & Young ÷ 28
production.47 This is an important rail line as over 100 million tonnes of cargo throughput (25% ofthe port’s total) travels between Germany and the port.
There was a large amount of public and political opposition to the Betuwe route:
► Rails operational capacity is often determined by other infrastructure and its operationallimitations. For example, the Betuwe route considered by itself may be efficient, but the railnetwork it reaches in Germany may be congested, making rail from Rotterdam less attractive forhaulers.
► Many believed that the project would have a negative economic impact and not repay the initialinvestment, though did not appreciate that the entire project would be funded by thegovernment using their tax dollars.
► There were many concerns about the safety of the route as well as the environmental damagethat the construction and operation of the scheme would cause.
► Doubts arose about whether a new freight rail line would attract demand from other transportroutes. The port authority believed this route could increase rail’s modal share of freighttransportation to 20% by 2035.
In response to some of these worries considerable attention was paid to community impacts of theproposed route, with mitigation including passing the tracks through tunnels, sunken sections, theroofing of the most sensitive sections of the track, and added insulation in 400 homes.48
Furthermore, the Netherlands has amended the national environmental law, reducing the number ofrequired project justification documents to streamline the environmental review process fornationally significant projects such as the Betuwe route.
Effectiveness
The Betuwe route has faced a number of issues since its opening in 2007:
► With a total cost of €4.7 billion, there were substantial cost overruns during construction. Theinitial budgeted cost of the project was €2.3 billion.
► The capacity of the line was expected to be around 200 trains per day. However, during thefirst two years of availability, only 20-30 trains used the rail link per day49 due to signalling andsafety problems as well as other issues.
► Although tolls per unit (€2.33 per train kilometre) are higher than unit variable costs ofoperation and maintenance, toll revenues do not cover the total costs of operation andmaintenance. Together with the substantial costs of investment, the Betuwe route has had anegative economic impact.50
However, project management aims to reach a daily average use of 150 freight trains per day,within the next five years as usage of the line has increased steeply since 2009. During the secondquarter of 2011 approximately 70 trains travelled (one way) over the Betuwe route per day. About78% of all freight trains that travelled between Rotterdam and the German border chose to use theBetuwe Route during 2011.
Funding
The Betuwe Route cost €4.7 billion, and as the project was a Trans-European Networktransportation project, the European Union provided €135 million in funding. The remainder of theproject was entirely funded by the Dutch government. Private financing in the line, promoted by the
47 European Commission, 2005, Trans-European Transport Network: TEN-t Priority Axis and Projects 2005, Brussels48 US Dept of Transportation, “Freight Transportation: The European Market”, June 200249 OECD, “Transcontinental Infrastructure Needs to 2030/2050: Port of Rotterdam Case Study”,50 Koetse, M. J. & Rouwendal, J. “Transport and Welfare consequences of Infrastructure Investment: A case study for theBetuwe Route”, VU University, Dept of Spatial Economics, Amsterdam, The Netherlands.
Australian Government Department of Infrastructure and Regional DevelopmentA study of the potential for dedicated freight infrastructure in Australia Ernst & Young ÷ 29
government in a bid to offset the large and rising costs, never materialised. There was somethought at this time of selling the rail infrastructure to private hands in the future. However, therehas been some public–private cooperation in this project:
► Construction of rail service centres, built with government funds, are being managed by aprivate firm
► The port invested in a railroad bridge as part of a strategy to increase rail access to the port.
3.2.4 The Port of Miami – The Port of Miami Rail-only TunnelThe Port of Miami is a significant transportation and economic hub for South Florida, contributingover USD12 billion to the local economy annually.51 Port terminals handle more than nine milliontonnes of cargo each year, including 0.85 million TEU in 2010, making it the largest container portin Florida and the ninth largest in the US. In addition, the port is considered the cruise capital of theworld, forecast to handle over 3.6 million cruise passengers every year by 2015.
The Case for the Port of Miami Rail-only Tunnel
Due to growth of trade, as well as the Panama Canal expansion and the Port of Miami Deep DredgeProject, the port expects to handle more than 1.5 million TEU of containerised cargo and more than3.6 million cruise passengers annually by 2015. These optimistic forecasts, compounded by theredevelopment occurring in downtown Miami made it necessary that supporting local road and railinfrastructure were efficient and capable of handling an increased task. However, in 2007, whenthis rail-road was being considered:
► Existing rail-roads were single tracked and ran through the city causing at-grade rail crossings.Therefore the service was restricted to off-peak hours due to traffic on local Miami roads. Therailways were used infrequently, servicing 11% of freight throughput, and normally were onlyused to carry heavy machinery. 65% of freight serviced by the port originated from or wasdestined for an area within 50 miles of the port. Over such short distances rail services are notcost competitive relative to road transport.
► The port relied heavily on trucks to transport freight. To move between the interstate (givingthem access to the rest of the country) and the port, they had to travel through the streets ofdowntown Miami which were going through a development boom.52 Consequently the majorityof roads that linked the port of Miami and downtown Miami had a volume to capacity ratio53 of0.7 or above. Many were operating at a ratio of 1.0, meaning the roads were at capacity.
► Nearly 16,000 vehicles travelled to and from the port of Miami through downtown streets eachweekday. Truck traffic made up over 20% of this number.54 By 2025, 24,350 vehicles areforecast to travel to the or from the port daily, making congestion problems through downtownMiami even worse.55
► Existing truck and bus routes presented safety hazards and restricted the port’s ability togrow.56 They also congested and limited redevelopment of the northern portion of Miami’sCentral Business District.57
In response to restricted port access and worsening downtown congestion, local leaders explored arange of improvements that would support both port growth and downtown redevelopment, whilereducing traffic conflicts. A freight rail corridor utilising a combination of tunnelling and open-cut-below-grade techniques to bypass Miami’s CBD was proposed. This service would consist of a 25acre Intermodal Container Transfer Facility (ICTF) on-port property, and frequent short-shuttle
51 The Four Gates Company, “The Economic impact of the Dante Fascell Port of Miami-Dade County”, May 200652 Cambridge Systematics Inc. “Port of Miami Freight Access Study”, February 200753 Volume to Capacity Ratio is the amount of cars on the road relative to the capacity of the road.54 Port of Miami Tunnel, “Project Overview”, accessed 26 March 2012, http://www.portofmiamitunnel.com/project-overview/project-overview-1/55 Ibid56 Robertson, A. (2010) “Miami can’t Afford to have Port of Miami Tunnel Delayed”, Miami Herald57 Ibid

Australian Government Department of Infrastructure and Regional DevelopmentA study of the potential for dedicated freight infrastructure in Australia Ernst & Young ÷ 30
trains would connect the port directly to the Western Miami-Dade county distribution infrastructurevia an expanded Florida East Coast Railway network.58 The proposed scheme aimed to increase rail’scapacity to service freight, reducing the need to use road transport and the number of truckstravelling via downtown Miami.59
► Curfews would cease to effect rail operations, with a 24-hour a day timetable, and there wouldbe 100% turnover of containers at the intermodal container transfer facility. The on-port ICTFhaving three loading and unloading tracks
► By investing in this shuttle service, 90% of all Port of Miami containers would be handled by rail,leaving only 10% to be carried by trucks, and greatly reducing traffic congestion on downtownMiami roads.
For the rail tunnel to be operationally feasible, separation of the freight line from the remainder ofthe Florida East Corridor had to be extended through Miami to a point outside the immediate area ofcongestion, and support track needed be developed to manage train flows and train lengths into andout of the port. However, many of the project’s characteristics lead to low levels of public support:60
► The port was already investing in the Port of Miami Road Tunnel which would also cost overUSD1 billion, in order to achieve the same purpose of reducing traffic congestion. Therefore itwould be difficult to acquire finances for this project.61
► The boring of a tunnel would leave a significant environmental impact on Dodge Island, whichwas already set to be impacted by the boring of the Miami Road tunnel.
► Building shipper support for a rail corridor would be challenging The port had limited acreage touse for the project and 65% of cargo serviced originated within 50 miles of the port, making railuncompetitive with road transport in both cost and service for a large amount of throughput.
Status
At the moment the Port of Miami has not started construction of this project, and instead is waitingfor the completion and opening of the Miami Port Truck Tunnel in 2014. Unfortunately, not enoughdata was available on the road tunnel for us to consider it as a case study.
When the merits of this project were under consideration, and the authors of the study wereproposing their recommendations, Miami was heavily affected by the Global Financial Crisis. Floridareal estate values have been some of the hardest hit in the US. The Global Financial Crisis slowedthe redevelopment of downtown Miami, put a stop to the construction of the Port of Miami RoadTunnel62 (construction resumed in 2009), and adversely affected the growth of the port.
While there were high expectations in regards to growth in both cruise passengers and TEU ofcontainerised cargo serviced by the port, growth since 2008 has been subdued in both categories:63
► In 2007 it was forecast that cruise passengers at the port of Miami would grow to over 5 million.In the year before the GFC, cruise passengers totalled 4.1 million, and had grown 9.2% from theprevious year. However, by the end of 2010, cruise passengers only grew by approximately13,000.
► Forecasts in 2007 indicated that by 2015 the port of Miami would service 1.5 million TEU ofcontainerised cargo per year. In 2007, the port serviced 0.89 million TEU, and by 2010 thisfigure had decreased to 0.85 million.
58 Cambridge Systematics Inc. “Port of Miami Freight Access Study”, February 200759 Tester, H. (2011) “Port of Miami Tunnel Dig to get into High Gear”, NBC Miami60 Ibid61 Gabriel Lopez-Bernal, Port of Miami Container Crisis”, Transit Miami, April 2007, http://www.transitmiami.com/miami/port-of-miami-container-crisis-part-262 Port of Miami Tunnel, “Project History”, Miami-Dade County, http://www.portofmiamitunnel.com/project-overview/project-history/, accessed 27 March 201263 Port of Miami, “Port Statistics”, Miami-Dade County, http://www.miamidade.gov/portofmiami/business-port-statistics.asp,accessed 27 March 2012
Australian Government Department of Infrastructure and Regional DevelopmentA study of the potential for dedicated freight infrastructure in Australia Ernst & Young ÷ 31
The projected steady growth of cruise passengers and container throughput were both used asarguments as to why the port of Miami rail tunnel was needed. As such, the GFC seems to havediminished the immediate need for the project. Furthermore, when the Sub-Prime Crisis began,construction of the Miami Port Road Tunnel was already underway:
► This was an expensive project; budgeted to cost over USD1 billion
► The road tunnel aimed to serve the same purpose as the rail tunnel; reducing traffic congestion.
Therefore it was resolved that, as the road tunnel was already going to be constructed, and at quitea substantial cost, during the GFC, the city could not afford to invest in another expensive projectwith such similar objectives. The project will be considered again in the future.
3.2.5 United States: Dedicated Truck Lanes – i70 – Eastern StatesThe interstate 70 (i-70) is a highway that stretches over 2153 miles in the US. It runs from the I-15near Cove Fort, Utah, to a Park and Ride near Baltimore. The section of this highway underconsideration is an 800 mile stretch of road, 240 miles of which passes through urban areas,starting at the Ohio/West Virginia state line; extending west across Ohio, Indiana, Illinois andMissouri, and ending just west of Kansas City, Missouri. At present, due to over 45,000 vehiclesusing this interstate daily, there is heavy congestion over 53% of the 240 mile segment of the i70that covers urban areas.
Dedicated truck lanes (DTLs) have been proposed in an attempt to alleviate the problem. Theproposal involves using existing infrastructure and segregating it, dedicating 4-lanes, 2-lanes oneach side of the interstate solely for the use of Trucks. The dedicated truck lanes are seen as a wayto reduce congestion, improve safety, and offset the maintenance costs of general purpose lanes.
This example is a non-port related one. However, it is included here because it provides analysis ofdedicated truck lanes on major existing roads.
The Case for Dedicated Truck Lanes
In 2011 a detailed analysis evaluating the current and future problems and needs on the I-70corridor demonstrated that the current conditions of the I-70 corridor warrants investments andimprovements:64
► The average daily traffic throughout the entire corridor is over 45,000 vehicles, with amaximum over 250,000.
► Average daily truck traffic is over 11,000, with a maximum over 26,000. The volume of freightmovement along the I-70 route is growing. Current truck volumes are such that truck traffic is21.5% in urban areas and 28% in rural areas, which is higher than other Interstates.
► Between 2002 and 2008, exports from corridor states nearly doubled, increasing from USD75billion to nearly USD140 billion.
► Over 53% of the 240 mile urban segment was under heavy congestion. This congestion wasseeing truck speeds below posted limits.
► The projected 2035 average daily traffic will be over 100,000, which includes over 25,000trucks.
► By 2045, 70% of the I-70 corridor is expected to be congested if additional improvements arenot made.
► The pavement is in need of improvement and sections of the road have obsolete designfeatures.65
64 Federal Highway, Administration, “Dedicated Truck Lanes: Feasibility Study”, 201165 Federal Highway, Administration, “Dedicated Truck Lanes: Feasibility Study”, 2011
Australian Government Department of Infrastructure and Regional DevelopmentA study of the potential for dedicated freight infrastructure in Australia Ernst & Young ÷ 32
► Crashes on the I-70 are higher than the national average, with 10,444 crashes during 2009,26% involving trucks. By 2045, 30,500 crashes are expected on the road in a no-build scenario.In 2011, the crash rate for trucks in congested areas was 3.5 times greater than that ofpassenger vehicles.
Given the amount of freight trucks using the roads and the degree of congestion, the projectproposes that dedicated and segregated truck lanes are constructed along an 800 mile sectionalong the I-70 from the I-435 beltway on the eastern part of Kansas City, Missouri to the Ohio/WestVirginia border near Bridgeport. The concept proposes segregating the existing infrastructure andusing four lanes, two in each direction as DTLs, with at least one interchange per county providingaccess to the truck lanes.
For this project to be approved it would need both public and political approval. The DTL generatedsignificant initial support among many stakeholder groups who saw potential benefits:66
► Reduce congestion.
► Improve safety.
► Offset the maintenance costs of general purpose lanes.
► They present an opportunity to pilot increased size and weight vehicles on a facility dedicated totrucks.
► They can attract freight movement from other parallel routes (I-80 and I-40).
► Increased highway capacity and improvement in reliability and transport costs.
However, there were also concerns among the I-70 stakeholders with the construction of DTLs dueto uncertainties regarding:
► Access to business and communities along I-70. Limiting truck access to a few locations wouldseverely limit the support of local business communities.
► The cost of infrastructure and how it would be funded.
► DTLs impact on the larger transportation systems within communities.
► High productivity vehicle operations and implementation: will High productivity vehicles beforced to only use DTLs?
► Spikes in fuel prices will lead to discussions about other forms of transportation that are morefuel efficient.
To evaluate whether or not the DTLs should be made, scenarios where the lanes were built and notbuilt were compared, and the ramifications of each scenario were projected and then compared. Inthe study three scenarios were compared:
► No-Build Scenario: Continue with the existing I-70 roadway and its current maintenance,operations and preservation.
► Scenario 1: Develop two dedicated truck lanes in each direction within the existing I-70 corridoralignment. Furthermore, provide 70 truck access points, 21 urban interchanges, and physicallyseparate the DTLs from the general purpose lanes with barriers.
► Scenario 2: Develop two dedicated truck lanes in each direction within the existing I-70 corridoralignment. Furthermore, provide 43 truck access points, 18 urban interchanges, and physicallyseparate the DTLs from the general purpose lanes with barriers.
The following analyses were conducted to evaluate the impact of DTLs:
66 Federal Highway Administration, “CORRIDOR: Interstate 70 (I-70): Dedicated Truck Lanes - Missouri to Ohio”, Indiana DOTin partnership with the Missouri, Illinois and Ohio DOT’s

Australian Government Department of Infrastructure and Regional DevelopmentA study of the potential for dedicated freight infrastructure in Australia Ernst & Young ÷ 33
► Safety: Within 15 years, building DTLs would reduce crashes by 33%, fatalities by 100 to 150,injuries by 4,000 – 4,500, property damage accidents by 8,000-10,000 and will lead to USD1billion in savings. This exists due to the correlation between congestion and safety on the road.Furthermore, DTLs are expected to reduce truck/car conflict crashes by 95%.
► Economic: The total regional economic output benefit through to 2030 is approximately USD36billion in additional output and 258,000 additional jobs due to construction, operation andmaintenance of the DTLs as well as added travel efficiencies.
► Reduction in Congestion: This was evaluated by comparing DTLs to additional general purposelanes. The comparison showed significant improvements in I-70’s operation with DTLs withsignificant reductions in lane density almost throughout the interstate (assuming that 80% oftrucks would use DTLs). In the No-build scenario, 70% of the corridor is anticipated to becongested in 2045. With DTLs, half of the expected congestion in general purpose lanes will beeliminated, while 97% of DTLs will be uncongested.
► Environmental Analysis: The DTLs held no fatal environmental flaws, but could affect noise, airquality, environmental justice and carbon emissions.
► Approximately USD10.6 billion in tolls could be earned if DTLs are constructed and then tolledat a rate of USD0.10 per mile, which was deemed optimal for revenue purposes.
Initial planning cost estimates show the cost to construct, operate and maintain DTLs for 40 yearsat approximately USD50 billion. This is in comparison to USD32 billion to reconstruct, operate andmaintain the I-70 corridor in its existing configuration for the same 40 year period.
Status
Based on the analysis presented, the design and operations scenario that was recommended was:
► Fully separated DTLs inside the passenger lanes.
► DTLs follow beltways in urban areas.
► Truck access provided through either 43 fully separated interchanges or 70 access points with acombination of fully separated interchanges and slip ramps.
► Electronic tolling of all vehicles using the I-70, and allowing high productivity vehicles to use theI-70.
► Uniform regulations and operating approaches across the corridor.
► Design features to allow integration of technologies, alternative fuels and operating scenariosthat may realistically be available in the future.
Given this analysis, these options would provide the best design features to:
► Improve safety and reduce congestion.
► Improve freight productivity.
► Produce the best operating scenario to provide a financial return on investment.
► Result in the best cost avoidance or lowest costs for long term pavement maintenance.
At this stage no formal design standard has been selected and agreed upon for the I-70 dedicatedtruck lane corridor. In the current economic climate in the United States, it may be hard to raise thenecessary capital for the project. In terms of its value or return to society, we could only findreference to a multi-variable analysis covering safety, congestion, cost, environment andeconomics. No NPV was available.
Australian Government Department of Infrastructure and Regional DevelopmentA study of the potential for dedicated freight infrastructure in Australia Ernst & Young ÷ 34
3.2.6 United States Dedicated Truck Lanes – SR 60 - CaliforniaThe Regional Transportation Plan for the Southern California Association of Governments identifiesdedicated truck lanes (DTLs) as a means to:67
► More efficiently keep goods movement flowing smoothly.
► Improve overall mobility along the freeway.
► Improve traffic safety and air quality.
When evaluating whether or not dedicated truck lanes were feasible for the region, high priority wasplaced on the SR-60 corridor. The SR-60 is a state highway in California running from the I-10 nearthe Los Angeles River, east to the I-10 in Riverside County. It runs for 70 miles, serving the citiesand communities on the eastern side of the LA metropolitan area and runs through the industrialsections of the San Gabriel Valley and through the growing warehouse district south of Ontario. Thesection studied was the 38 mile stretch from the I-710 to the I-15. In 1999, the Southern CaliforniaAssociation of Governments commissioned a truck lane feasibility study for the SR-60.
The SR 60 is a very constrained urban corridor with few opportunities for improvements as most ofits centre median is utilised. Consequently, all truck lane improvements would require freewaywidening outside the existing paved roadway and may involve some right of way acquisition.
This example is different to the i-70 considered above in that the additional truck lanes would beconstructed outside the current road.
The Case for Dedicated Truck Lanes
The SR 60 is one of the most heavily truck-trafficked corridors in Southern California; somesegments of the corridor carried 28,000 trucks a day in 2000, which was about 15% of totaltraffic.68
The SR 60 also currently has a few safety issues, having, in the past, nearly 400 accidents per yearinvolving trucks:
► The most crucial safety issue along the SR 60 corridor involved the SR 60 and SR 57 mergesegment. Short distances were provided here for truck weaving even though trucks need extradistance due to their size and operational characteristics.
► California law required trucks to stay in the two right lanes and travel 10mph slower thangeneral traffic. This caused safety concerns when vehicles needed to merge into the stream oftraffic because it led to more interaction between general traffic and trucks. Such interactionintimidated car drivers and caused visibility issues.
Consequently, providing exclusive lanes for trucks would definitely improve the SR 60 corridor’ssafety record, as they would lead to less interaction between trucks and passenger vehicles.
Truck volumes travelling along the SR 60 are projected to grow in the 25 years between 1994 and2020. Truck volume statistics for 1994 and forecasts for the 2020 are given in the table below:
67 Kaku Associates of Santa Monica68 Fischer, M. J. “Planning Truck-Only Lanes: Emerging Lessons from the Southern California Experience”, August 2002
Australian Government Department of Infrastructure and Regional DevelopmentA study of the potential for dedicated freight infrastructure in Australia Ernst & Young ÷ 35
Table 5: Truck volumes per hour per direction on different parts of the SR 60
Location 1994 2020 Growth1994-2020
West End 1,890 2,850 960East of I-605 1,360 2,200 840SR-57 Junction 1,474 2,970 1,500East of SR-71 Junction 1,180 2,310 1,130East End 2,200 4,000 1,800
Source: Southern California Association of Governments
The volume of trucks in the SR 60 freeway combined with the other vehicles utilising the two slowlanes was higher than the capacity provided by those lanes. The SR 60 suffered from congestion inthe morning (5am to 8:45am) and the evening (3:15pm to 7:45pm). With the average travel timesranging from 14 to 32 minutes (22-34mph) in the morning and 7 to 23 minutes (28-43mph) in theafternoon.
This study analysed two scenarios, in order to see the impacts that dedicated truck lanes could haveon the safety and operations of the SR 60:
► No Build scenario: Both trucks and other vehicles remain on the existing ‘mixed-flow’ lanes’.
► Build Scenario: Provide an exclusive truck facility that runs the entire length of the studycorridor (38 miles between the I-710 and the I-15).
This analysis indicated that:
► The total number of mixed flow lanes provided on the SR 60 would not be sufficient to allow theroute to operate at an acceptable level throughout most of the corridor.
► Once the exclusive truck lanes are implemented, it would alleviate some of the burden from themixed flow lanes, but additional mixed flow lanes will still be needed by 2020 for the SR 60 tooperate at ‘Level of Service F(0)’; an acceptable level of service.
► Total number of mixed flow lanes required under the ‘build scenario’ is always smaller thanunder the ‘no build’ scenario.
► With exclusive truck lanes, the weaving activity for the mixed flow traffic is expected to improvecompared to the level of service in the year 2000. However, higher weaving flows are expectedto occur at interchanges containing the truck facility access points. Hence truck interchangesneed to be made in a way that accommodates the exclusive lanes truck weaving activities.
► When large trucks are involved in fatal crashes, there were two vehicles involved in the incident60% of the time. In these multi-vehicle accidents, fatalities were 40 times more likely to occurthan when the crash involved only smaller vehicles. Therefore reducing interactions betweenthe two types of vehicles could enhance safety, and the number of fatal crashes could bereduced.
Consequently, it was recommended that the growth in truck traffic would be ideally accommodatedby dedicated truck lanes to preclude the SR 60 from reaching unacceptable levels of congestion.Since an exclusive truck lane could accommodate approximately 800 trucks per hour, the predictedgrowth in truck traffic would need four exclusive truck lanes (two in each direction).
The Truck Lane Task Force identified three main strategies as sensible to the SR-60 corridor:
► Allowing trucks to share the carpool (High Occupancy Vehicle (HOV)) lanes at limited timeperiods
► Adding truck lanes (2 in each direction) to the freeway at grade outside the existing freewayroadway. These lanes will be separated from the mixed flow lanes by barriers.
Australian Government Department of Infrastructure and Regional DevelopmentA study of the potential for dedicated freight infrastructure in Australia Ernst & Young ÷ 36
► Adding truck lanes (2 in each direction) above the freeway grade, and were proposed to be builtwithin the existing median island of the SR 60.
The evaluation of each of these strategies was based on several criteria including accessibility andmobility, cost-effectiveness, safety impacts, operational characteristics, regulatory concerns,regional benefits and environmental sensitivity.
Based on the characteristics of each alternative for each criteria and on the year 2020 truckvolumes forecast to use the truck facility, the Task Force subsequently decided that the “mix truckswith carpools” alternative would not be ideal for the SR 60:
► It would create safety problems due to the variability of speed between cars and trucks as wellas cars in the carpool lane suffering from blocked visibility.
► It did not allow for passing opportunities or storage space for breakdowns.
► Invoked regulatory issues since state law limits trucks to right lanes, and carpool lanes containusage limitations due to funding sources.
► This option did not really add capacity to the road and based on the forecast 2020 truckvolumes, it was determined that there is demand for four dedicated truck lanes.
Forecast truck volumes indicated that a four-lane facility would be required to accommodate thetruck demand, either at grade or above grade. The alternatives were analysed based on operationalconditions, safety, physical constraints and cost as well as environmental impacts.
Above grade dedicated truck lanes are more likely to provide operational and safety concerns thanDTLs that are at grade:
► Operationally, longer ramps are required in an above grade structure to accommodate truckdeceleration on the exit ramps (due to downgrade) and to accommodate truck acceleration onthe entrance ramps (due to upgrade).
► Safety concerns involve the incident response on above grade sections which are often morechallenging. Security underneath above grade structures is also a concern.
► Furthermore, the construction costs of above grade sections would be much higher than atgrade dedicated truck facilities.
On the other hand, the at-grade widening alternative would require acquisition of new right of wayat various locations along the corridor:
► For 30% of the corridor’s length, adding a lane of capacity would require acquisition of new rightof way on each side of the corridor.
► Adding two lanes in each direction would require new right of way for 50% of the corridor on thenorth side, and for 60& of the corridor on the south side.
This would adversely affect residences, commercial properties and environmentally sensitive areasadjacent to the freeway. Impacts of above grade segments would be of a lesser degree
► Adding an above grade structure in the freeway’s existing right of way would be possible withinexisting paved section for 40% of the SR 60.
► Only 2% of the corridor length would require new right of way.
Status
A recommended alternative was developed combining elements of both analysed alternatives toform a hybrid solution. The main feature of the recommended alternative is to add four dedicatedtruck lanes throughout the corridor. These dedicated truck lanes would be constructed both atgrade and above grade:
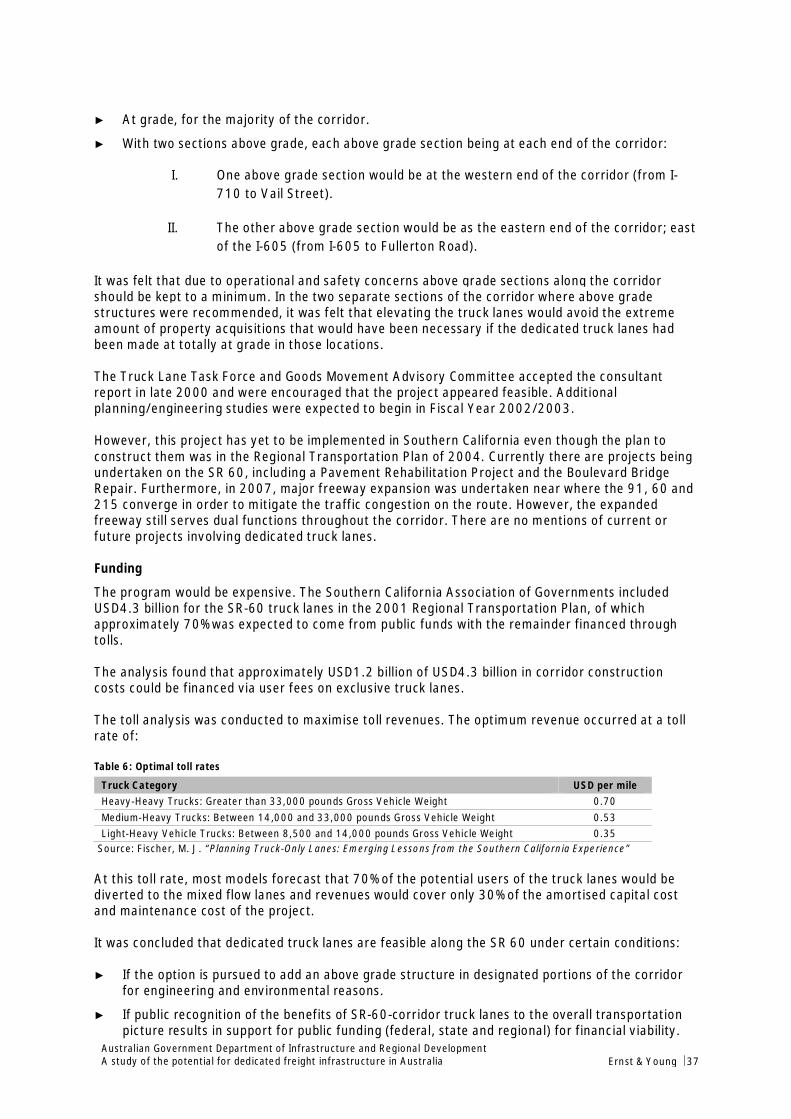
Australian Government Department of Infrastructure and Regional DevelopmentA study of the potential for dedicated freight infrastructure in Australia Ernst & Young ÷ 37
► At grade, for the majority of the corridor.
► With two sections above grade, each above grade section being at each end of the corridor:
I. One above grade section would be at the western end of the corridor (from I-710 to Vail Street).
II. The other above grade section would be as the eastern end of the corridor; eastof the I-605 (from I-605 to Fullerton Road).
It was felt that due to operational and safety concerns above grade sections along the corridorshould be kept to a minimum. In the two separate sections of the corridor where above gradestructures were recommended, it was felt that elevating the truck lanes would avoid the extremeamount of property acquisitions that would have been necessary if the dedicated truck lanes hadbeen made at totally at grade in those locations.
The Truck Lane Task Force and Goods Movement Advisory Committee accepted the consultantreport in late 2000 and were encouraged that the project appeared feasible. Additionalplanning/engineering studies were expected to begin in Fiscal Year 2002/2003.
However, this project has yet to be implemented in Southern California even though the plan toconstruct them was in the Regional Transportation Plan of 2004. Currently there are projects beingundertaken on the SR 60, including a Pavement Rehabilitation Project and the Boulevard BridgeRepair. Furthermore, in 2007, major freeway expansion was undertaken near where the 91, 60 and215 converge in order to mitigate the traffic congestion on the route. However, the expandedfreeway still serves dual functions throughout the corridor. There are no mentions of current orfuture projects involving dedicated truck lanes.
Funding
The program would be expensive. The Southern California Association of Governments includedUSD4.3 billion for the SR-60 truck lanes in the 2001 Regional Transportation Plan, of whichapproximately 70% was expected to come from public funds with the remainder financed throughtolls.
The analysis found that approximately USD1.2 billion of USD4.3 billion in corridor constructioncosts could be financed via user fees on exclusive truck lanes.
The toll analysis was conducted to maximise toll revenues. The optimum revenue occurred at a tollrate of:
Table 6: Optimal toll rates
Truck Category USD per mileHeavy-Heavy Trucks: Greater than 33,000 pounds Gross Vehicle Weight 0.70Medium-Heavy Trucks: Between 14,000 and 33,000 pounds Gross Vehicle Weight 0.53Light-Heavy Vehicle Trucks: Between 8,500 and 14,000 pounds Gross Vehicle Weight 0.35
Source: Fischer, M. J. “Planning Truck-Only Lanes: Emerging Lessons from the Southern California Experience”
At this toll rate, most models forecast that 70% of the potential users of the truck lanes would bediverted to the mixed flow lanes and revenues would cover only 30% of the amortised capital costand maintenance cost of the project.
It was concluded that dedicated truck lanes are feasible along the SR 60 under certain conditions:
► If the option is pursued to add an above grade structure in designated portions of the corridorfor engineering and environmental reasons.
► If public recognition of the benefits of SR-60-corridor truck lanes to the overall transportationpicture results in support for public funding (federal, state and regional) for financial viability.
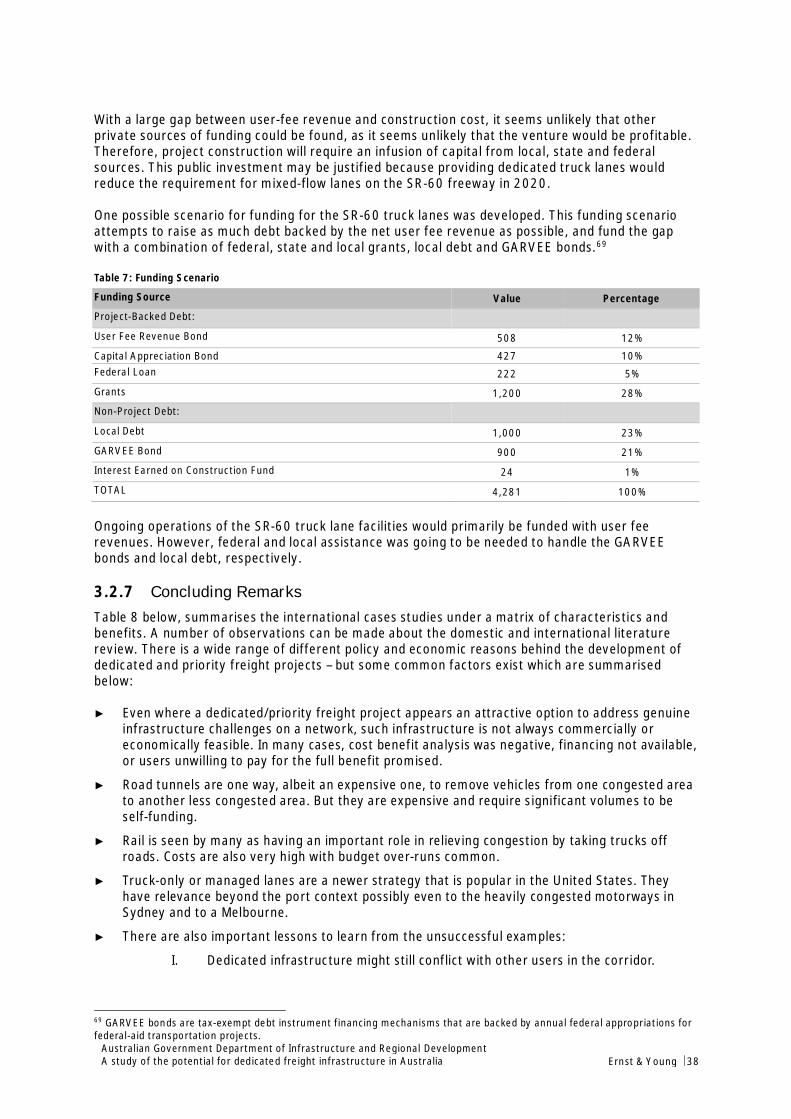
Australian Government Department of Infrastructure and Regional DevelopmentA study of the potential for dedicated freight infrastructure in Australia Ernst & Young ÷ 38
With a large gap between user-fee revenue and construction cost, it seems unlikely that otherprivate sources of funding could be found, as it seems unlikely that the venture would be profitable.Therefore, project construction will require an infusion of capital from local, state and federalsources. This public investment may be justified because providing dedicated truck lanes wouldreduce the requirement for mixed-flow lanes on the SR-60 freeway in 2020.
One possible scenario for funding for the SR-60 truck lanes was developed. This funding scenarioattempts to raise as much debt backed by the net user fee revenue as possible, and fund the gapwith a combination of federal, state and local grants, local debt and GARVEE bonds.69
Table 7: Funding Scenario
Funding Source Value Percentage
Project-Backed Debt:
User Fee Revenue Bond 508 12%
Capital Appreciation Bond 427 10%Federal Loan 222 5%
Grants 1,200 28%
Non-Project Debt:
Local Debt 1,000 23%
GARVEE Bond 900 21%
Interest Earned on Construction Fund 24 1%
TOTAL 4,281 100%
Ongoing operations of the SR-60 truck lane facilities would primarily be funded with user feerevenues. However, federal and local assistance was going to be needed to handle the GARVEEbonds and local debt, respectively.
3.2.7 Concluding RemarksTable 8 below, summarises the international cases studies under a matrix of characteristics andbenefits. A number of observations can be made about the domestic and international literaturereview. There is a wide range of different policy and economic reasons behind the development ofdedicated and priority freight projects – but some common factors exist which are summarisedbelow:
► Even where a dedicated/priority freight project appears an attractive option to address genuineinfrastructure challenges on a network, such infrastructure is not always commercially oreconomically feasible. In many cases, cost benefit analysis was negative, financing not available,or users unwilling to pay for the full benefit promised.
► Road tunnels are one way, albeit an expensive one, to remove vehicles from one congested areato another less congested area. But they are expensive and require significant volumes to beself-funding.
► Rail is seen by many as having an important role in relieving congestion by taking trucks offroads. Costs are also very high with budget over-runs common.
► Truck-only or managed lanes are a newer strategy that is popular in the United States. Theyhave relevance beyond the port context possibly even to the heavily congested motorways inSydney and to a Melbourne.
► There are also important lessons to learn from the unsuccessful examples:
I. Dedicated infrastructure might still conflict with other users in the corridor.
69 GARVEE bonds are tax-exempt debt instrument financing mechanisms that are backed by annual federal appropriations forfederal-aid transportation projects.

Australian Government Department of Infrastructure and Regional DevelopmentA study of the potential for dedicated freight infrastructure in Australia Ernst & Young ÷ 39
II. The clearer the property rights, the more interest from the private sector ininvesting.
III. Dedicated/priority infrastructure is capital intensive – so it is inherently harder tomake the economic case for it – the benefits needs to be much stronger.
IV. This type of infrastructure might not address weak demand – for example, forshort haul rail freight, the benefits of dedicated infrastructure may not be enoughto outweigh the double handling costs of rail compared to road.
Table 8: Overview of international case studies
Port of Dublin Port Miami Betuwe Route US I-70 United States –SR 60
Conflicts √ √ √ √Congestion √ √ √ √ √Rapidly growingdemand
√ √
Productivity/Vehicle Productivity
√ √
Safety √ √Cost Savings √Urban Renewal √Economic or cityDevelopment
√ √ √
Net Benefits √Private financingLand userestrictions

Australian Government Department of Infrastructure and Regional DevelopmentA study of the potential for dedicated freight infrastructure in Australia Ernst & Young ÷ 40
4. Principles for Dedicated or Priority FreightInfrastructure
This chapter builds on the research and analysis in the previous chapters to identfy a set ofprinciples for considering dedicated and priority freight infrastructure. It considers:
► The purpose of the principles and the nature of the market for dedicated and priority freightinfrastructure
► Principles underpinning the demand for dedicated and priority infrastructure
► Principles underpinning the supply for dedicated and priority freight infrasture
Summary of principles for dedicated and priority freight infrastructure
The problems facing Australia’s ports are unique and so are the solutions. Each port has acomplex mix of interactions between several key parameters including congestion levels, portcapacity, trade task, transport links, prices and regulatory and governance frameworks.Furthermore, each type of dedicated and priorty freight infrastructure is associated with aunique stream of costs and benefts. These factors combined mean that it is not possible todevelop a standardised equation or congestion threshold for considering dedicated and priorityfreight infrastructure. Rather, each port and infrastructure proposal must be considered on acase-by-case basis.
There are however, a range of underlying factors that drive the viability of dedicated and prorityfreight infrastructure. These include a mix of supply and demand market factors.
Principles of Demand:
► Conflicts between users► The freight task and volumes► Distance► Congestion► Land use planning► Amenity concerns► Safety concerns► Willingness to pay
Principles of Supply:
► Capacity► Cost effectiveness► Form of infrastructure
As the drivers of supply and demand for dedicated and priority use infrastructure change overtime, so does the viability of such infrastructure. Therefore, it is vital to take a long term anddynamic view of all the factors affecting supply and demand for freight infrastructure toadequately plan for the future transport task.
Australian Government Department of Infrastructure and Regional DevelopmentA study of the potential for dedicated freight infrastructure in Australia Ernst & Young ÷ 41
4.1 Key Considerations in Developing the Principles FrameworkThe objectives of the principles framework are twofold. First, the priciples are applied at a high levelto identify the case studies for further examination in Stage Two of the study. Second, a moredetailed and thorough application of the principles is conducted in Stage Two of the study toestablish the feasibility of dedicated and priority freight infrastructure.
Our research has highlighted the unique nature of ports in Australia and internationlly – thechallenges facing each port are different and so are the solutions. At each port there is a range ofcomplex interactions between key parametres including congestions levels, port capacity, trade task,transport links, prices and regulatory and governance frameworks.
Furthermore, there is a range of different types of dedicated and priority freight infrastructureacross different modes and each type of infrastructure has a unique stream of benefits and costs.
Therefore, there are a number of combinations of key parameters and infrastructure types that maysupport the development of dedicated and priority freight infrastructure however, each port andeach proposal for dedicated and priorty freight infrastructure must be considered on case by casebasis.
Our examination of examples of dedicated and priority freight infrastructure, combined with aresearch on Australia’s ports, has identified several key parameters suggest underlying principles forconsidering dedicated and priority freight infrastructure.
We have taken a market-focused approach to establishing the conditions under which dedicated andpriority freight infrastructure could be justified, identifying a range of factors that influence thesupply of and demand for such infrastructure.
4.2 Factors of DemandExamining the demand for dedicated and priority freight infrastructure is an important step inconsidering the conditions under which dedicated and priority freight infrastructure could bejustified.
4.2.1 Conflicts between usersConflicts between users with competing interests on shared infrastructure is a fundamental driver ofdedicated and priority freight infrastructure. Indeed, separating users on infrastructure was the citedin several international examples including the Port Dublin road tunnel, Port Miami rail tunnel, andthe Port of Rotterdam rail line.
The extent to which this type of infrastructure delivers efficiency gains depends largely on thenature of the development. In some instances, dedicated and priority freight infrastructure maymean that ‘dedicated’ infrastructure is developed in ‘shared’ corridors. This is the case for railservicing Port Botany whereby dedicated freight lines share the transport corridor with priorityfreight trains.
While conflicts are a key determinant of dedicated and priority freight infrastructure, they are notrequired for this type of infrastructure to be viable. For example, dedicated infrastructure beingdeveloped to service Australia’s iron ore and coal fields is not in response to conflicts. Rather, this isin response to demand for large scale freight transportation.
4.2.2 CongestionThere is substantial congestion on many roads surrounding Australia’s major container ports. InSydney, the M5 East is heavily congested with congestion lasting more than 13 hours a day andslowing traffic to 22 kilometres per hour towards the city and 30 kilometres per hour from the city tothe port. Congestion is also a widespread problem in Melbourne with several pinch points around theport including the West Gate Freeway, Docklands Highway and Somerville Road in Yarraville.
Australian Government Department of Infrastructure and Regional DevelopmentA study of the potential for dedicated freight infrastructure in Australia Ernst & Young ÷ 42
As the freight task increases, this congestion will worsen. Road freight has grown rapidly in recentyears and currently carries approximately 91% of the national container trade. Melbourne expectstruck numbers to go from 6,000 journeys a day currently to 12,000 per day in 2035. Sydneyexpects a doubling in only ten years, with numbers going from 2,900 to 6270 by 2021.70
However, while road congestion is increasing, the numbers of vehicles accessing the port are arelatively small share of overall traffic. This is the case in Sydney with freight vehicles accounting foronly 10% of traffic on the M5, or less than 8000 trucks per day. Similarly, freight transport inMelbourne accounts for around 14% of road transport in and around Melbourne, while the portgenerates less than 2% of vehicles on the Metropolitan network.71Hence, road freight is acontributor, but not the key driver of congestion. Therefore, separation of freight and passengertraffic would likely have a significant benefit for freight traffic, without a notable impact oncongestion overall.
Nonetheless, dedicated or priority freight infrastructure has the potential to deliver productivitygains to freight supply chains and alleviate congestion. An example is the Dublin Port Tunnel, whichconnects the port with major highways, bypassing the city centre. The tunnel gives preference totrucks through applying tolls to vehicles weighing less than 3.5 tonnes. Average travel time has beenreduced by 19% delivering time savings valued at more than €25 million as well as benefits in theforms of reduced accident costs and vehicle operating costs.
4.2.3 The freight task and volumesThe volume of the freight task and ability to achieve economies of scale in transportation is criticalto the viability of dedicated and priority freight infrastructure. There are several examples of suchinfrastructure developed to support the coal fields of eastern Australia and the iron ore fields ofWestern Australia. The large volumes of over 50 – 60 million tonnes on each individual system72 arefinancially self-sustaining and return either an adequate regulated profit on third party providedlines in eastern Australia, or contribute to the ultimate high profitability on the vertically integratedcompany owned lines in Western Australia.
Australia’s two largest container ports at Melbourne and Sydney face a freight task of 2.4 millionTEU and 2 million TEU respectively. This is expected to grow significantly reaching 7 million TEU forSydney by 2030 and 8 million TEU for Melbourne by 2035. The critical question is: are the currentand/or forecast volumes of freight sufficient volume to warrant investment in dedicated or priorityfreight infrastructure. The answer to this question must be grounded in analysis of congestion levelsand the capacity of existing infrastructure.
An issue with the major Australian container ports is that freight comes and goes to multipledestinations, albeit predominantly, as shown by origin/destination studies, within a short, 0- 40Kmradius of the port. The lack of consolidation along a single corridor results in a large number of lowvolume vehicles (2 – 3 TEU capacity trucks) required to carry out the freight task. The use ofintermodal terminals, which has developed most extensively in Sydney, is one way to combat thisplethora of vehicles around congested port areas. The theory is that containers are “funnelled” inlarge batches to a location removed from the port area. Rail, with its greater carrying capacity isemployed to move batches of 90 - 100 TEU per shuttle to Enfield, 18 kilometres from the port, withfurther plans to also run in future out to Moorebank, which is around 30 kilometres from the port.Another example of funnelling is in Brisbane, where large capacity trucks, A-doubles, capable ofcarrying four TEU, are used during off-peak times to run empty containers between the stevedore’sterminal and empty container yards within the port confines. These are called block bookings.
While the theory of funnelling is clear and appealing in moving large volumes of containers from acongested area to a less congested area, the economics of it is fraught with difficulty. Rail, thepredominant and only vessel, apart from water borne barges to achieve it is uneconomic over short
70 See Shipping Australia limited, Metropolitan Intermodal Terminal Study, 2011 page 7.71 Victorian Freight and Logistics Council, Freight Transport and Urban Congestion72 In fact one such example of dedicated freight infrastructure, that by GVK Hancock Coal in Queensland’s Galilee Basin,involves dedicated line of 498 kilometres to carry up to 60 million tonnes of coal to port.

Australian Government Department of Infrastructure and Regional DevelopmentA study of the potential for dedicated freight infrastructure in Australia Ernst & Young ÷ 43
distances compared to trucks. It is difficult to find any successful unsubsidised rail intermodalexamples anywhere in the world. In Fremantle the Western Australia Government subsidises rail by$43 per TEU to carry containers from the port to the main freight distribution area at Kewdale, byrail. Despite this only 47,000, less than 10% of the ports TEU, travelled by this mode. Little mentionhas made so far in the extensive analysis of both the Enfield and Moorebank intermodal terminalexpansion projects about the financial viability of them as shuttle operations from the port. At thesame time Patrick Rail closed its rail shuttle service to Camellia in 2010 and earlier in 2007, inMelbourne, CRT similarly closed its port rail shuttle run with German sourced sprinter trains.Queensland Rail Ltd has advised us that they have looked at rail shuttles from Acacia Ridge to thePort of Brisbane for a number of logistics companies but found that the volumes forecast were notsufficient. The costs, particularly in purchasing fast accelerating locomotive engines that couldtraverse the Citytrain network intermingled with passenger trains, were also too high.
4.2.4 DistanceThe distance of freight transportation influences the viability of different types of dedicated andpriority freight infrastructure. Road transport has an inherent advantage over short distancescompared to rail, and conversely for long distances. The reason is that rail has a lower line-haul costper tonne-kilometre or TEU-kilometre travelled but incurs higher terminal costs because it relies ontrucks to deliver freight from the rail siding or intermodal terminal to the customer’s door, with aconsequent doubling of handling costs. Over long distances, the low line-haul costs of rail more thancompensate for the higher terminal costs. Over short distances, the high line-haul costs of roadhaulage are less important and lower terminal costs more important.
In Sydney, approximately 98.5% of container imports are destined for metropolitan Sydney, andonly 14% of the freight task is carried by rail. With the bulk of the freight task destined for nearbymetropolitan areas, it is not surprising that only a small proportion is carried by rail.
4.2.5 Land use planningIntegrated transport and land-use planning gives rise to the possibility of setting aside buffer zonesaround the port and transport corridors to safeguard the use of freight infrastructure.
With most of Australia’s metropolitan ports located on the fringe of rapidly growing cities, urbanencroachment and poor integration between transport and land-use planning is a potential barrier tolong-term freight productivity. Stakeholder consultations highlighted examples in Adelaide whereurban residential developments were established alongside the transport corridor to and from theport. Following this development, curfews were applied to rail freight, which increase the time andcosts associated with freight transport.
4.2.6 Amenity concernsFreight transportation through urban areas gives rise to amenity concerns including pollution, visualimpacts and noise, which can potentially be addressed by dedicated and priority freightinfrastructure. These amenity concerns are pertinent in city ports such as Port Botany that co-existwith communities and urban development.
4.2.7 Safety benefitsProviding dedicated or priority freight infrastructure separates freight vehicles from passengervehicles on the roads. This reduces the risk of accidents associated with passenger vehiclestravelling alongside large trucks with distinctly different braking patterns. Some proposals fordedicated and priority freight infrastructure consider dual access to trucks and buses. Buses andtrucks have similar breaking patterns but there may be problems from buses having to stopfrequently.
Australian Government Department of Infrastructure and Regional DevelopmentA study of the potential for dedicated freight infrastructure in Australia Ernst & Young ÷ 44
4.3 Factors of Supply4.3.1 CapacityThe capacity of existing infrastructure to service the growing freight task is an importantconsideration for dedicated or priority freight infrastructure.
At Port Botany, there is currently capacity on the rail freight network. While there are instanceswhere demand is higher than supply, RailCorp and the Australian Rail Track Corporation (ARTC)report that the Port Botany freight line to Enfield has, on average, 14 trains scheduled in eachdirection each day, out of a total 36 potential train paths each way.73 Reasons for this poor uptake ofrail transport include perceived or actual higher prices for rail freight and poor reliability. In thelonger term, measures to boost long term rail capacity will be necessary to achieve the targeteddoubling in rail mode share and to take freight volumes off the road network74. For instance, a 28%rail share of 7 million TEU a year would require more than 40 trains servicing Port Botany each day,an increase of 12% on current capacity.
4.3.2 CostThe cost of dedicated and priority freight infrastructure is a key determinant of its viability and tomake a compelling case for developing this type of infrastructure, the potential benefits must begreater than the costs.
While dedicated and priority freight infrastructure can take on a number of forms, it is typicallyassociated with large scale capital investments. For example, the cost of developing the Port Dublintunnel was €752 million and the cost of developing the Alameda corridor in L.A. was USD 2.4 billion.The effectiveness of these expensive projects is also an issue. With the exception of the Dublin PortTunnel, none of the dedicated and priority infrastructure projects we have researched have had aclear positive economic impact as measured by NPV.
Dedicated and priority freight infrastructure can be introduced by reform to existing infrastructuresuch as developing priority use on existing or planned infrastructure investments.
The high cost of developing dedicated and priority freight infrastructure makes it more difficult tomake a positive economic case.
4.3.3 Form of infrastructureDedicated and priority freight infrastructure can take on a variety of forms including freight roadtunnels, priority truck lanes and dedicated rail. The form of infrastructure is largely determined bythe unique nature of the challenges facing the port and the distance of freight travel.
The least expensive likely form of dedicated road freight infrastructure makes use of existinginfrastructure, for example, truck lanes (or managed lanes). The lanes need to be clearlydemarcated and enforceable as the Brisbane example of trucks using the left lanes shows (seeSection 3.1.2, page 21).
Without high-volume commodities originating some distance from the port, it is hard to envisagededicated freight rail infrastructure emerging without some government subsidy. The examples ofdedicated rail freight infrastructure showed them all to be underutilised.
73 ARTC advised that there are 14 train paths on an average weekday, but that current capacity is 36 practical paths, or 27saleable paths. Capacity once re-signalling and Enfield staging are complete will be 48 practical paths and 36 saleable paths(calculated as 75% of practical).74 The target from the NSW Government and Sydney Ports Corporations is to double the rail share carried to 40% from thecurrent 20%. See: http://www.sydneyports.com.au/port_development/enfield

Australian Government Department of Infrastructure and Regional DevelopmentA study of the potential for dedicated freight infrastructure in Australia Ernst & Young ÷ 45
4.3.4 Willingness to PayConsultations with stakeholders revealed that industry would be willing to pay for infrastructurewhere there were clear benefits. As such, the ability to measure and showcase user benefits isimportant for attracting investment in infrastructure. Improved freight productivity as well as socialbenefits such as reduced congestion and amenity benefits suggests that there may be a role forboth industry and government in funding infrastructure developments.
There is an important distinction between stated industry demand, whereby industry activelydevelops and funds proposals, and the role of the government in establishing proposals for newinfrastructure developments. Dedicated and priority freight infrastructure servicing Australia’s coaland iron ore sector were industry-lead initiatives grounded in commercial feasibility.
In other cases, where there is overlap between industry and society in terms of the users andbenefits of infrastructure, the role of government and industry is less clear. This will require thecosts and benefits of such infrastructure to be clearly defined and apportioned to those who benefit.
Dedicated road infrastructure for Australia’s container ports is a relatively new concept. Hence, itwould require market development, including introduction of efficient price signals on freightinfrastructure.
Australian Government Department of Infrastructure and Regional DevelopmentA study of the potential for dedicated freight infrastructure in Australia Ernst & Young ÷ 46
5. The Australian Context: Challenges at MajorContainer Ports
This section provides an overview of Australia’s five main container ports including the port facilitiesand examines the key ‘pinch points’ and capacity constraints facing each port.
The Growing Transport Task
The Australia’s main container ports are growing at a rapid rate. Table 9 below details the forecastswe gathered. The number of TEU is forecast to double in the next ten years and then growapproximately 66% during the subsequent ten years.
These trends are creating different issues at each state’s container port, with governments andstakeholders seeking tailored infrastructure and policy changes to meet the challenges. In summary:
► Adelaide has adequate infrastructure, both current and planned to handle its relatively smallvolumes of containers.
► Fremantle has forward planning strategies to address its challenges, through a rail strategyand eventual relocation of some of its container trade to Kwinana.
► Brisbane has benefited from recent large expansions in road capacity on important freightroutes. On rail, however, the Port of Brisbane has identified major deficiencies in its plans togrow trade through the port. It believes there is a need for dedicated rail freightinfrastructure.
► In Sydney, freight congestion issues are caught up with general congestion. Both arebecoming critical and there may be a potential to use dedicated freight infrastructure to helpsolve them.
► In Melbourne, the port’s location at the edge of the CBD means there is a great deal ofmixing with general traffic. There are various directions outlined in the VictorianGovernment’s freight plan to address issues related to freight movements in and out of theport and across the network more generally.
5.1 IntroductionThis section considers whether the factors seen in existing examples of dedicated or priority freightinfrastructure are evident at Australia’s five major container ports. It provides an overview ofAustralia’s five main container ports including the port facilities and examines the key ‘pinch points’and capacity constraints facing each port. Here, we lay the context for dedicated freightinfrastructure at our five main container ports. Despite great variation in the data we could access,we consider the same issues across the five ports. These are:
► A profile of the port
► Current and future levels of trade, and the port’s existing capacity
► The Port’s current landside infrastructure and the modal split between road and rail
► Land transport challenges and the potential for productivity gains
► Actions undertaken to alleviate inefficiencies
► The remaining gaps (or entrenched problems) and the potential for dedicated or priority freightinfrastructure to address these
Australian Government Department of Infrastructure and Regional DevelopmentA study of the potential for dedicated freight infrastructure in Australia Ernst & Young ÷ 47
Australia’s main container ports are growing at a rapid rate. The number of TEU is forecast to doublein the next ten years and then grow approximately 66% in the ten years after that. The gravity of theissues and the seriousness of the response vary with the infrastructure and policy changes each portimplements to meet the challenges.
Table 9: Growing Container Trade: TEU Current and forecast (millions)
2010/11 2020/21 2030/31 % growth overtimeframe
Melbourne 2.39 5.25 8.2 243%
Sydney 2.02 3.6 7 247%
Brisbane 0.95 1.92 3.3 247%
Fremantle 0.6 1.1 1.6 167%
Adelaide 0.3 0.49 0.83 177%
Total All Ports 6.26 12.36 20.93 234%
Note: Melbourne’s forecasts are 2025 and 2035, Brisbane’s 2019 and 2029. Source:various port development studies, with EY compilation.
Ports rely on their hinterland and supply chains to support the movement of trade that travelsthrough them.
The drive to take greater control of their supply chains began with Sydney Port’s purchase of theEnfield intermodal site and continues with the privatised Port of Brisbane plans to make its ownsubstantial investments in transport infrastructure. These trends are a stepping away from the oldlandlord role that our ports undertook after the corporatisation reforms in the 1980s and 1990s.That model is starting to outlive its usefulness as congestion grows and ports need to take moreaction to ensure that hinterland transport links do not constrain their growth. Privatisation isfurther driving the change as new management takes over and focuses on shareholder return andgrowth. The issues raised in our analysis of the transport task at our main container ports show aneed, to address the supply chain challenges surrounding our ports. Dedicated freight infrastructureis one potential solution.
5.2 Port of MelbourneThe Port of Melbourne (‘the PoM’) is currently Australia’s largest international container port,handling approximately 37% of the nation’s container trade.75 The port handled 2.4 million TEUduring the 2010/11 financial year, growing 6.7% from the previous year.76
The PoM has facilities for dry and liquid bulk, break bulk and motor vehicle cargo. The PoM issupported by the ports of Geelong and Hastings, which are configured to handle dry bulk cargoesand petroleum products, and the Port of Portland for timber, grains and bulk liquids. There are alsoplans to increase container freight movements through the Port of Hastings as PoM reaches capacityin the coming decades.
A total of 73% of containers are sourced and destined for metropolitan Melbourne, with theremainder being primarily exports from Victorian regional areas and other parts of southernAustralia. Melbourne is different to other capitals in that it has major industrial areas in severaldifferent directions — to its south east, west, north and east. Hence it is less amenable to efficientfunnelling through dedicated freight infrastructure compared with Sydney with its predominantfreight distribution area to the west and Brisbane with the immediate port environs and AcaciaRidge.
75 “About the Port”, Port of Melbourne Corporation, accessed 21 March 2012, http://www.portofmelbourne.com76 Port of Melbourne, “Port Trade reaches Milestone”, Melbourne, 20 Jan 2012
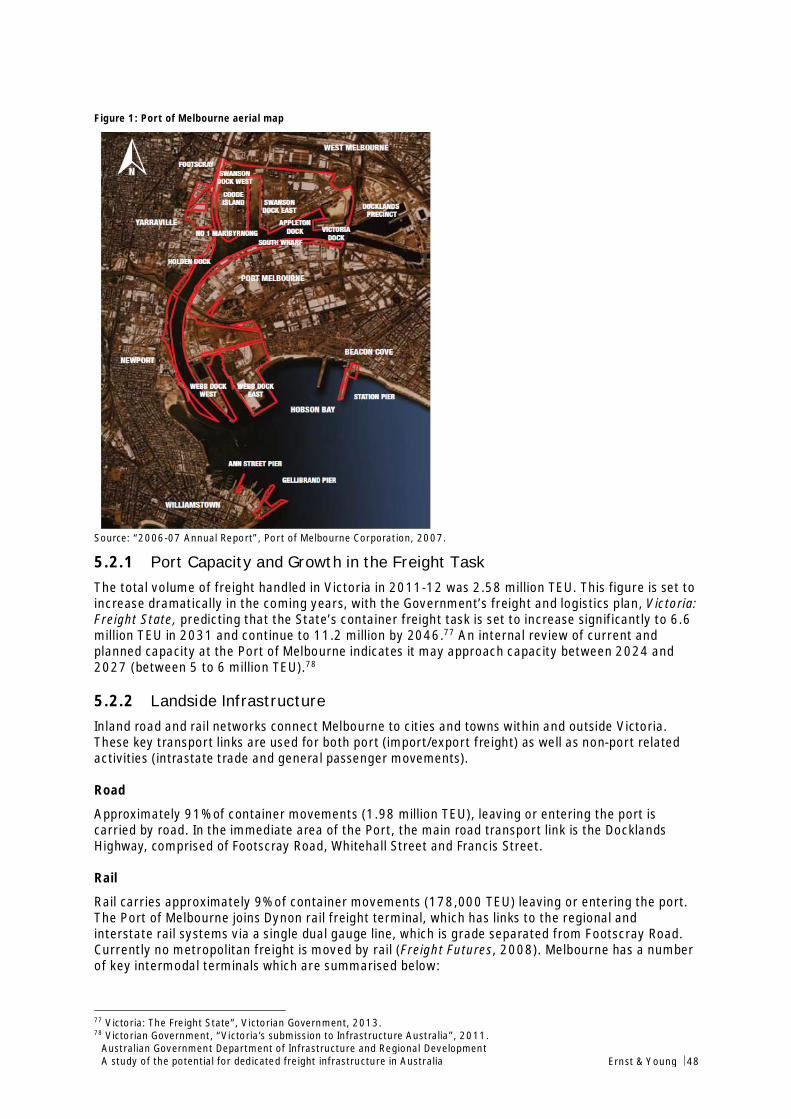
Australian Government Department of Infrastructure and Regional DevelopmentA study of the potential for dedicated freight infrastructure in Australia Ernst & Young ÷ 48
Figure 1: Port of Melbourne aerial map
Source: “2006-07 Annual Report”, Port of Melbourne Corporation, 2007.
5.2.1 Port Capacity and Growth in the Freight TaskThe total volume of freight handled in Victoria in 2011-12 was 2.58 million TEU. This figure is set toincrease dramatically in the coming years, with the Government’s freight and logistics plan, Victoria:Freight State, predicting that the State’s container freight task is set to increase significantly to 6.6million TEU in 2031 and continue to 11.2 million by 2046.77 An internal review of current andplanned capacity at the Port of Melbourne indicates it may approach capacity between 2024 and2027 (between 5 to 6 million TEU).78
5.2.2 Landside InfrastructureInland road and rail networks connect Melbourne to cities and towns within and outside Victoria.These key transport links are used for both port (import/export freight) as well as non-port relatedactivities (intrastate trade and general passenger movements).
Road
Approximately 91% of container movements (1.98 million TEU), leaving or entering the port iscarried by road. In the immediate area of the Port, the main road transport link is the DocklandsHighway, comprised of Footscray Road, Whitehall Street and Francis Street.
Rail
Rail carries approximately 9% of container movements (178,000 TEU) leaving or entering the port.The Port of Melbourne joins Dynon rail freight terminal, which has links to the regional andinterstate rail systems via a single dual gauge line, which is grade separated from Footscray Road.Currently no metropolitan freight is moved by rail (Freight Futures, 2008). Melbourne has a numberof key intermodal terminals which are summarised below:
77 Victoria: The Freight State”, Victorian Government, 2013.78 Victorian Government, “Victoria’s submission to Infrastructure Australia”, 2011.
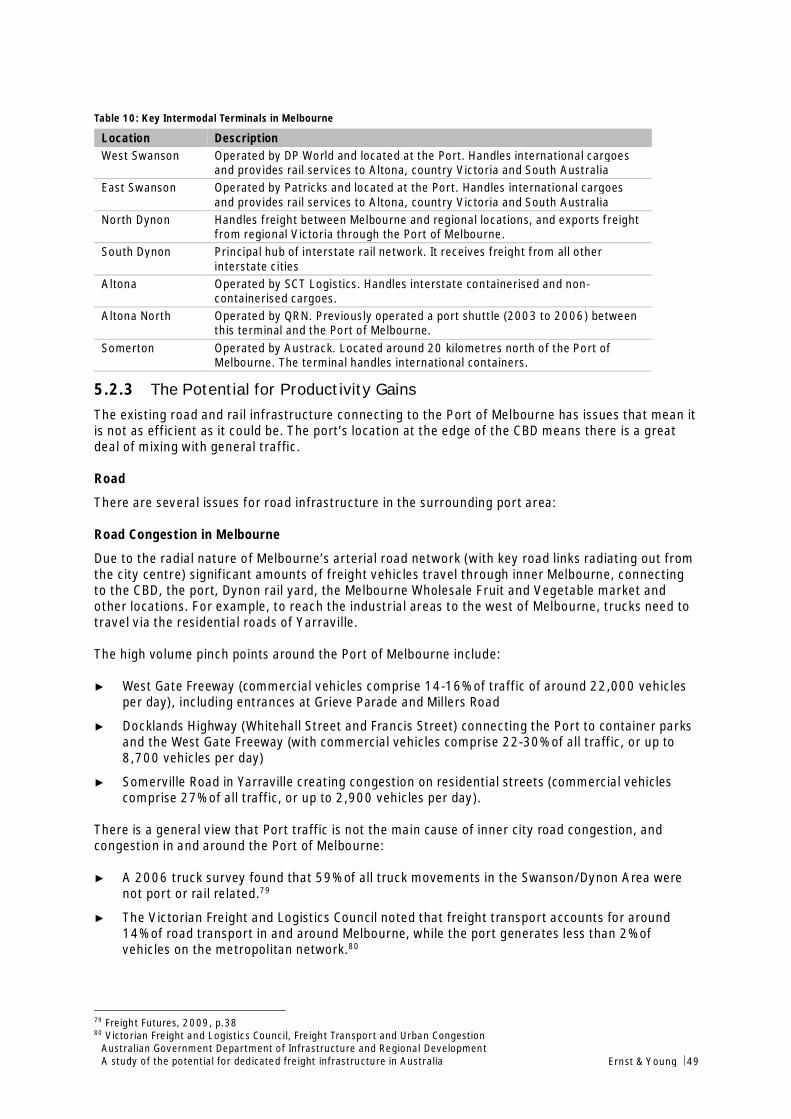
Australian Government Department of Infrastructure and Regional DevelopmentA study of the potential for dedicated freight infrastructure in Australia Ernst & Young ÷ 49
Table 10: Key Intermodal Terminals in Melbourne
Location DescriptionWest Swanson Operated by DP World and located at the Port. Handles international cargoes
and provides rail services to Altona, country Victoria and South AustraliaEast Swanson Operated by Patricks and located at the Port. Handles international cargoes
and provides rail services to Altona, country Victoria and South AustraliaNorth Dynon Handles freight between Melbourne and regional locations, and exports freight
from regional Victoria through the Port of Melbourne.South Dynon Principal hub of interstate rail network. It receives freight from all other
interstate citiesAltona Operated by SCT Logistics. Handles interstate containerised and non-
containerised cargoes.Altona North Operated by QRN. Previously operated a port shuttle (2003 to 2006) between
this terminal and the Port of Melbourne.Somerton Operated by Austrack. Located around 20 kilometres north of the Port of
Melbourne. The terminal handles international containers.
5.2.3 The Potential for Productivity GainsThe existing road and rail infrastructure connecting to the Port of Melbourne has issues that mean itis not as efficient as it could be. The port’s location at the edge of the CBD means there is a greatdeal of mixing with general traffic.
Road
There are several issues for road infrastructure in the surrounding port area:
Road Congestion in Melbourne
Due to the radial nature of Melbourne’s arterial road network (with key road links radiating out fromthe city centre) significant amounts of freight vehicles travel through inner Melbourne, connectingto the CBD, the port, Dynon rail yard, the Melbourne Wholesale Fruit and Vegetable market andother locations. For example, to reach the industrial areas to the west of Melbourne, trucks need totravel via the residential roads of Yarraville.
The high volume pinch points around the Port of Melbourne include:
► West Gate Freeway (commercial vehicles comprise 14-16% of traffic of around 22,000 vehiclesper day), including entrances at Grieve Parade and Millers Road
► Docklands Highway (Whitehall Street and Francis Street) connecting the Port to container parksand the West Gate Freeway (with commercial vehicles comprise 22-30% of all traffic, or up to8,700 vehicles per day)
► Somerville Road in Yarraville creating congestion on residential streets (commercial vehiclescomprise 27% of all traffic, or up to 2,900 vehicles per day).
There is a general view that Port traffic is not the main cause of inner city road congestion, andcongestion in and around the Port of Melbourne:
► A 2006 truck survey found that 59% of all truck movements in the Swanson/Dynon Area werenot port or rail related.79
► The Victorian Freight and Logistics Council noted that freight transport accounts for around14% of road transport in and around Melbourne, while the port generates less than 2% ofvehicles on the metropolitan network.80
79 Freight Futures, 2009, p.3880 Victorian Freight and Logistics Council, Freight Transport and Urban Congestion
Australian Government Department of Infrastructure and Regional DevelopmentA study of the potential for dedicated freight infrastructure in Australia Ernst & Young ÷ 50
Increasing concentration of industrial and residential activities in Melbourne’s west
The growth in employment and businesses in Melbourne’s west will see a greater concentration ofdemand for freight and port related activities from this region. By 2035, 2.4 million containers (TEU)are expected to originate or be destined to Melbourne’s west, compared to 0.5 million in 2007. 81
The increasing concentration of freight activities in Melbourne’s west will place pressures ontransport infrastructure in these areas.
Existing and proposed inner city developments encroaching on the Port
The current issues surrounding the inner-city road freight task include:
► Movements to/from the Port of Melbourne down suburban roads (Footscray Road, WhitehallStreet and Francis Street) to access the West Gate Freeway.
► Conflicts between freight and residential traffic along Buckley Street (north of the port) creatingcongestion along a retail corridor.
► The road network in Yarraville links the main thoroughfares to the port and connects the port tocontainer and industrial parks. However, these roads include residential streets with communityinfrastructure and retail development.
► Roads for port-related activities in the area are constrained by physical infrastructure as well asby strong community opposition.
► Non-port related traffic (both from commuters and trucks) is expected to intensify around thePort of Melbourne. The Fishermans Bend Redevelopment, a new inner city suburb will createtraffic demand around the port area and on Westgate Bridge.
Rail
Studies have found that considerable spare capacity exists on the broad gauge rail network to movecontainers between the port and outer metropolitan terminals. 82 However, barriers exist in achievingthis:
► Road transport is a cheaper option for freight users as the use of rail involves greater handlingcosts (ranging from $50 to $115 more per 20ft container).83
► Melbourne’s metropolitan rail corridors are predominantly used by passenger trains and thereare no freight-only rail lines from the port outwards.
► Significant infrastructure investments would be required on the passenger rail network (such assignalling) to handle a greater amount of freight.
5.2.4 Actions UndertakenRoad
A number of proposals have been put forward to alleviate road congestion in inner city Melbourne,which has implications for port-related traffic.
East West Link
A proposed tunnel and freeway project connecting Footscray Road and Dynon Road in the portprecinct with Paramount Road in West Footscray. It will also connect to the Western Wing Road.This project is part of the larger East West Link project that will link the roads to the EasternFreeway. This tunnel aims to respond to increased transport demand due to population in the west,and improve connectivity between east and west Melbourne while reducing freight traffic on local
81 “Shaping Melbourne’s Freight Future”, Discussion Paper, Department of Transport, April 201082 Booz Allen Hamilton (2006) Improving rail mode share at the port of Melbourne, Department of Infrastructure83 Ibid
Australian Government Department of Infrastructure and Regional DevelopmentA study of the potential for dedicated freight infrastructure in Australia Ernst & Young ÷ 51
streets and provide a critical link in the National Land Transport Network, capable ofaccommodating the expected freight growth.84
Truck Action Plan
Identified by the previous government, this is a proposed truck route between the West GateFreeway and Footscray Road to reduce the amount of trucks passing through the residential streetsin Yarraville and improve freight access from the west to the port of Melbourne.85 The proposalincludes the construction of new ramps connecting the West Gate Freeway and Hyde Street atYarraville, and upgrades of connecting roads. It is projected to cost $380 million and is currentlyunder review.
Rail
The Victorian Government is currently in the process of developing a strategy to grow the amount offreight moved using rail. The objective of the “Growing Freight on Rail” strategy is to reducecongestion and remove bottlenecks at ports and in key regional centres.86 This Plan is expected to becompleted later in 2012.87
5.2.5 Concluding RemarksDue to the PoM’s inner city location, there is limited land capacity to establish new road corridors toand from the Port. There are limited opportunities to provide dedicated lanes on existinginfrastructure without impacting on other road traffic during peak periods.
Capacity exists to expand the role of rail in moving freight to and from the port (thus reducing theamount of freight moved on road). However, there are commercial barriers, including doublehandling costs in moving freight to and from intermodal terminals located at outer metropolitanareas (Somerton and Altona) to the on-port terminals within the Port. Previous ‘port shuttle’attempts have failed.88
Notwithstanding this, the Victorian Government is finalising a new metropolitan planning andtransport strategy for Melbourne. The three key State Government strategies under development,the Metropolitan Planning Strategy, Transport Solutions, and Growing Freight on Rail, are directlyrelevant to the port because they will include the location of freight hubs and intermodal hubs withpotential opportunities for dedicated rail infrastructure to these hubs.
The negative externalities associated with freight traffic in and around residential areas have beendriving consideration for truck-related infrastructure such as the Truck Action Plan89, which is arelatively low cost solution largely aimed at addressing amenity issues by removing trucks fromresidential areas. While the proposed route is built for the purposes of truck traffic, it is not currentlyproposed as a dedicated truck route. We carried out a case study where the route would have someform of prioritised access for trucks.
5.3 Port BotanyAustralia’s second busiest container port, Port Botany handled just over 2 million TEU in the2010/11 financial year, growing 5% from the previous year. It is the major state gateway tointernational markets for containerised agricultural products as well as oil, and bulk liquid and gasproducts.
84 Linking Melbourne Authority, “About Westlink: Project Objectives”, www.linkingmelbourne.vic.gov.au85 VIC Roads, “Truck Action Plan: Project Overview”, www.vicroads.vic.gov.au, accessed 10 April 201286 Premier of Victoria, Press Release, Coalition announces new taskforce for grain freight, 07 September 201187 Victorian Department of Transport (2011) DOT Plan88 There was a shuttle train service up to 2006 run by CRT, a freight forwarder to its intermodal terminal at Altona North,North Melbourne. The service ceased because “the State Government has been unable to provide subsidies to make high railcosts competitive with lower road costs”. See also Chapter 6 of Department of Transport (2010) Shaping Melbourne’s FreightFuture, Proposals for an intermodal solution to service Melbourne’s growing containerised freight task.
89 This project is currently under review.

Australian Government Department of Infrastructure and Regional DevelopmentA study of the potential for dedicated freight infrastructure in Australia Ernst & Young ÷ 52
The port handles roughly 30% of all container trade in Australia. Of this 98.5% of inbound containersare bound for the Sydney metropolitan area, while 38.5% of outbound containers come from non-metropolitan areas,90 making Port Botany a gateway to overseas markets for regional NSW.
Figure 2: Major Roads and Freight infrastructure in Metropolitan Sydney
Source: Transport for NSW
5.3.1 Port Capacity and Growth in the Freight TaskGrowth is expected to continue in the future with container trade through Port Botany estimated tonearly quadruple by 2030, reaching 7 million TEUs. This represents a growth rate of 5 to 7% eachyear for the next 20 years, consistent with the average growth rate since containerised trade beganin 1971 of 7.9%.91
Current planning approval sets the maximum throughput capacity of Port Botany at 3.2 million TEUsper annum subject to further environmental assessment and approval. Based on available land area,berth length and productivity improvements, the port can service 7 million TEUs per annum over thenext 30 years once the third Terminal is operational.92 The effectiveness and efficiency of thesurrounding land infrastructure connections to the port will have a significant bearing on theultimate throughput capable of being serviced by Port Botany.
Botany Bay is relatively well serviced by surrounding road and rail networks. However, the precinctaround the Port is heavily utilised and increasingly congested. In addition to the Port’s transporttask, the surrounding precinct hosts the Kingsford Smith Airport, major arterial roads to the SydneyCBD, and connects to the Metropolitan Freight Network (MFN).
90 Gilfillan (2011)91 Sydney Ports Corporation (2011), Container Movement and Port Task Information, Unpublished Data92 ACCC (2011), Container Stevedoring Monitoring Report no.13 – October 2011

Australian Government Department of Infrastructure and Regional DevelopmentA study of the potential for dedicated freight infrastructure in Australia Ernst & Young ÷ 53
Road
For all non-transhipment containers, 1.5 million TEUs (86%) exited or entered the port by road.Even if the government were to meet their rail share target of 28%, truck traffic is forecast to tripleby 2030.
The road network around Port Botany includes various local and state owned roads. Foreshore Roadand General Holmes Drive provide crucial access for container freight trucks using Port Botany.General Holmes Drive cuts through the suburb of Port Botany while Foreshore Road connects theport with Sydney’s orbital network of motorways for onward distribution to Sydney’s residential andcommercial areas and to major interstate highways.
Rail
The Metropolitan Freight Network (MFN) is a dedicated 80 kilometre freight network that forms partof Sydney’s metropolitan passenger rail network. It serves both inter and intra-state freightcustomers as well as the port. For example, even on the Port Botany to Enfield track port traffic isonly 40% of the total. However, the dedicated freight lines are still restricted by sharing the corridorwith and having to cross major passenger train lines on which the passenger trains have priority. Onother parts of the larger network, freight and passenger trains share the same rail line.
For all non-transhipment containers, 250,000 TEUs (14%) exited or entered the port by rail. Rail’smodal share of 14% is the lowest share rail has had since 1997/98. This is due to the Patrickintermodal terminal at Camellia closing in 2010 due to lack of profitability. 93
There are currently six intermodal terminals servicing Sydney, of which dedicated rail freightconnections exist between the Port and Chullora and Enfield. Around 35% of rail containers(111,000 TEU) moved through regional intermodal terminals in 2009-10, though this figuredeclined in the following financial year.
5.3.2 The Potential for Productivity GainsIn Sydney, freight congestion issues are caught up with general congestion and both are becomingcritical.
Road
There are several challenges for road infrastructure in the surrounding port area:
Heavy Vehicle Restrictions
Heavier vehicles are more productive. However, they need to mingle with general traffic leading tosafety concerns. Therefore there are heavy vehicle restrictions in the corridor, particularly aroundBunnerong Road and Qantas Drive. There are height restrictions on the M5 East tunnel, Cooks RiverTunnel and the airport tunnel. Other network access constraints between the Precinct and WesternSydney restrict the operation of higher productivity vehicles in terms of their height, length and/ormass.
Growing Road Congestion
The precinct is home to four of Sydney’s five most congested roads: the Eastern Distributor, M5, M4and General Holmes Drive. Congestion lasts 11 hours or more each day on all four routes. However,this congestion is caused by commuter traffic, as less than 10% of road trips around the port arefreight related. Nonetheless, freight travel is growing faster than general travel. Morning peakfreight trips on the M5 are forecast to double by 2031.
93 See Rail Express 27 April 2010. It quotes the Port Container Director for Patrick as saying “the short–haul nature of rail toand from Port Botany to metropolitan and NSW rural areas would never be competitive to road, as road is the price setter andthere is a road task at the beginning and end of each rail journey”

Australian Government Department of Infrastructure and Regional DevelopmentA study of the potential for dedicated freight infrastructure in Australia Ernst & Young ÷ 54
One way to alleviate these congestion issues is for freight vehicles to operate outside peak hours. .As shown by BITRE Waterline statistics, Sydney Port has been very successful in recent years atmoving truck loading and unloading to off peak times, particularly weekends. Night operations,however, are more problematic, with many freight operators finding that volumes are insufficient tojustify operating longer hours.
Missing Links on the Road Network
The absence of a direct motorway connection between Port Botany and Western Sydney hassignificant implications for freight vehicles. Trucks either have to access the M4 via King GeorgesRoad/Fairfield Road – aging arterial roads ill-suited to sustained heavy vehicle traffic – or by themuch longer M7 route.
Consideration is underway by Infrastructure NSW for a major motorway project including the M4extension; this is expected to be announced later this year.
Traffic Pinch Points
There are various pinch points in the freight network where small conflicts on shared infrastructurecan lead to widespread congestion on the through transport network:
► The rail level crossing over General Holmes Drive, and the intersection of General Holmes Drivewith Foreshore Road
► Heavy vehicle and height restrictions on Airport Drive. Where truck heights are not measuredprior to the truck leaving the port, higher trucks can cause major delays on the surroundingroad network.
► Monthly maintenance on the M5 East prevents high performance vehicles operating in off-peakhours, and steep grade exit ramps slow them down
► High volume restrictions on bridges on M4, Marsh St, and the rail line at Sydenham
Rail
Sydney’s rail freight network has many issues. Briefly they are:
Underutilisation of the Rail Network
The Port Botany freight line to Enfield has, on average, seven train services each way scheduledeach day, out of 18 return potential train paths. This is due to weak demand for rail caused byunreliable and uncompetitive conditions for rail freight, which has led to road picking up theincrease in the freight task while rail freight has remained relatively static.
Unreliable/Inefficient freight rail operations
Poor alignment between train paths to Port Botany and stevedoring windows mean that smalldelays on the track can cause large delays at the port. Rail operators purchase a stevedore windowin advance and then may need to run the gauntlet of multiple network providers and restrictions,including the Metropolitan Freight Network (MFN), the passenger service and the Hunter Valley CoalChain, to make a narrow window at the port.
Once a train arrives at the port, it may need to be split in the Port Botany Yard across thestevedores, which is an inefficient and time-consuming operation that blocks access to the terminalsfor other trains. It also is logistically complex to align stevedore windows at the same time to get theright containers into the right stevedore. If they do not align, the train will need to leave the Port,park and find an opportunity to re-enter the Port. This can lead to export containers not being sent,or import containers being late to vacate the terminal. As a result, regional trains tend to purchasetwo stevedore windows to manage uncertainty around timing and loads. If the train is late it is thenpenalised for missing the first slot.
Australian Government Department of Infrastructure and Regional DevelopmentA study of the potential for dedicated freight infrastructure in Australia Ernst & Young ÷ 55
Insufficient Train Paths and Passenger Priority
Freight trains cannot operate on shared lines during peak hours. Full curfew applies for 7 hours aday, with restricted operation for all other times except the middle of the night. Trains need to planaround this, which affects their reliability.
5.3.3 Actions UndertakenMeasures are being implemented to improve the landside infrastructure links to Port Botany inorder to drive increased efficiency and alleviate congestion. A new terminal (T3) will commenceoperations in early 2013,94 adding 1,850 meters of additional wharf space, new rail sidings andanother freight terminal with five new berths, bringing total assets to 11 berths.95
Port Botany Landside Improvement Strategy (PBLIS)
In late 2008, the NSW Government responded to the Independent Pricing and Regulatory Tribunal’s(IPART) Report of March 2008 into the efficiency of the landside operations at Port Botany. TheNSW Government’s response described the establishment of the Port Botany Landside ImprovementStrategy (PBLIS) initiative.
The objective of the PBLIS program is to maximise the amount of trade passing through Port Botanyby making the landside supply chain more efficient, transparent, consistent and transitioning to24/7 operations.
The PBLIS reform was designed as a staged approach as follows:
► Stage 1 (2011): included the regulation and implementation of an Operational PerformanceManagement (OPM) framework for road only in Stage 1, and the regulation of rail pricing. Theplan was to monitor activity over the initial 6 to 12 months to determine if the desired change inindustry performance has been achieved.
► Stage 2 (2012 onwards): was to be implemented subject to the results of Stage 1, and wasenvisaged to include a Demand Management System, a review of Empty Container Parks and /or the introduction of rail regulated performance standards. In 2012, Sydney Ports presented arail strategy to the PBLIS Port Botany Rail Team outlining a proposed governance structure aspart of a voluntary approach to coordination. This sought to establish a port Rail OperationsCoordination Centre (ROCC) to drive communication and coordination between the relevantstakeholders as an enabler to increasing consistency and efficiency across the port rail supplychain.
Road
In addition to the PBLIS, the following initiatives were undertaken to alleviate congestion aroundPort Botany:
M5 West Widening Project
This involves the widening of the M5 South West Motorway from two to three lanes in each directionbetween Camden Valley Way and King Georges Road in order to accommodate the significant levelsof traffic (91,000 vehicles use the M5 South West each day96). The project is budgeted to cost $400million, and be complete in late 2014, early 2015. In addition to the extra lanes, the proposal wouldintroduce minor adjustments to road infrastructure and bridges that would enable high productivityvehicle access along the M5 to the port, and noise management measures for affected communities.
94 ACCC (2011), Container Stevedoring Monitoring Report no.13 – October 201195 Sydney Ports, Port Botany Container Terminal Expansion Overview96 Roads & Traffic Authority, “M5 West Widening: Environmental Assessment”, NSW Government, September 2010
Australian Government Department of Infrastructure and Regional DevelopmentA study of the potential for dedicated freight infrastructure in Australia Ernst & Young ÷ 56
Rail
The NSW state government aims to double rail’s modal share from 14% to 28% by 2021, which wouldequate to 1.96 million TEUs serviced by trains in 2030. This could be accommodated by 40 trains aday, which is above the current capacity of the Port Botany freight line (36 trains).
The Southern Sydney Freight Line
Due to finish in 2013, this project installs a bi-directional freight line connecting the MetropolitanFreight Network at Sefton Park to Glenlee and the freight corridor to Melbourne. This will be adedicated freight line, suffering no interference from passenger services, ensuring more train pathsfor freight trains between the Port and south west Sydney, supporting more efficient use of rail, andeasing congestion with passenger services on the southern line.
Enfield Intermodal Logistics Centre
Due to commence in 2013, the facility will almost double Sydney’s intermodal capacity, with anadditional 300,000 TEUs a year. Furthermore, it will provide empty container storage facilities,warehousing, a light industrial/commercial area along Cosgrove Road, a new bridge over the existingmarshalling yard, rail connections and ecological/heritage enhancements.
Moorebank Intermodal Terminal
Currently two proposals exist for Moorebank. The Federal Government has proposed a terminal withpotential capacity of 1 million TEUs per year, with a large interstate component and with thepotential to lower the cost per unit of moving freight on rail through greater economies of scale. Theother proposal, from a private alliance, SIMTA, is for a smaller terminal on other land nearby thatcould offer an early shuttle service to Port Botany. Both the proposed terminals are ideally situatedon the Southern Sydney Freight Line, and close to the intersection of the M5 and M7.
South West Rail Passenger Link and Kingsgrove to Revesby Quadruplication
These will extend the Airport and East Hills Line to service Sydney‘s South West Growth Centre andenable increased rail service frequency to the airport. Both projects are currently underconstruction, set for completion in 2016 and 2013 respectively. Both projects aim to improve thereliability of passenger rail as well as to provide greater rail capacity. Grade separations will reducethe interactions between the two services. Furthermore, these projects will encourage greater use ofpublic transport, and less congestion on the roads.
Northern Sydney Freight Corridor
The Commonwealth and NSW Governments have jointly announced a $1.1 billion project to upgradethe Northern Sydney Freight Corridor, building a rail underpass at North Strathfield, laying a trackbetween Epping and Pennant Hills, installing new passing loops near Gosford and constructing aholding track at Hexham. This will increase the corridor’s freight capacity from 29 to 44 freighttrains a day. The project will disentangle freight and passenger services, reducing their interaction,and providing better freight access to the corridor. However, commuter services still retain priority.

Australian Government Department of Infrastructure and Regional DevelopmentA study of the potential for dedicated freight infrastructure in Australia Ernst & Young ÷ 57
5.3.4 Concluding RemarksThe NSW government has proposed multiple strategies that can assist in ensuring that road and railconnections to the port are able to efficiently handle the growing amounts of containers that theport services.
However, there are still gaps that need to be addressed in order to increase the port’s capacity up toand beyond the 3.2 million TEU cap.
► Growth in Western Sydney and consequent growth in the freight task in that direction meansthat direct links from the port to the west may be warranted.
► High productivity vehicles can carry heavier loads and as such add greatly to productivity ofroad freight. Safety measures are needed so that these vehicles can be used more on the NSWroad network.
► Coinciding peak traffic is a key issue. A large proportion of trucks (59% in 2011) use roadsduring peak hours even though the Port has moved towards 24/7 operations.
► There is a view by some within the industry that rail freight is either priced inequitably orinappropriately for the objective of doubling rail mode share. Both rail and road pay wharfagecosts at the Port, while rail alone pays a crane lift fee. Road users instead pay a Vehicle BookingSystem (VBS) fee for booking a stevedore slot. The regulated price for booking a slot for acontainer lift onto rail is $15, a 50% premium on the cost of a truck lift of $10.The way the PortBotany rail lines are set up with on-dock access, there are no additional lifts or movements toput a container onto a train compared to a truck.97
► The 7 hour curfew on rail freight on lines shared with passenger services decreases the chancesof doubling rail’s modal share.
► Given the complexity of the rail supply chain in and around Port Botany, and the substantialgrowth task ahead, substantial improvements in coordination require strategic top-downinterventions in order to manage the various stakeholders (stevedores, rail operators, ARTC,RailCorp, Intermodal Terminals).
In Sydney, freight congestion issues are caught up with general congestion. Both are becomingcritical and there may be potential to use dedicated or prioritised freight infrastructure to solvethem.
► With dedicated or prioritised truck lanes, the mingling between heavy vehicles and the generaltraffic is vastly reduced. Restrictions on high productivity vehicles would no longer be necessary(as long as there are no height restrictions). Furthermore, it will reduce peak hour congestionbecause a large proportion of trucks use roads during peak hours
► The NSW government has realised the potential of dedicated freight rail and the separation offreight from passenger services. This is shown by their investments in The Southern SydneyFreight Line, which is a dedicated freight line, as well as the Northern Sydney Freight Line whichwill help disentangle passenger and freight services. While these improvements will mainlybenefit inter-state and regional freight navigating around Sydney, they will also have positivespinoffs for the port. Federal Government investment through the ARTC at Enfield intermodalterminal directly benefits the port98. While these projects will improve rail’s performance, theydo not address the essential competitive disadvantage rail has over short hauls. In order tomeet its ambitious aspirational targets for a rail in its Intermodal Terminal Strategy, the NSWGovernment may find it will have to subsidise rail for short-haul operations. Precedent for thisexists in Western Australia, where the State Government funds a $43 subsidy per TEU forcontainers on short-haul rail routes to the Kewdale intermodal terminal.
97 For example, see Access Economics (2010)98 See Joint Media Statement “ Port Botany Rail Upgrade: First Stage Completed” 3 April 2012, by the Federal Minister ofInfrastructure and Transport and Chief Executive of the ARTC
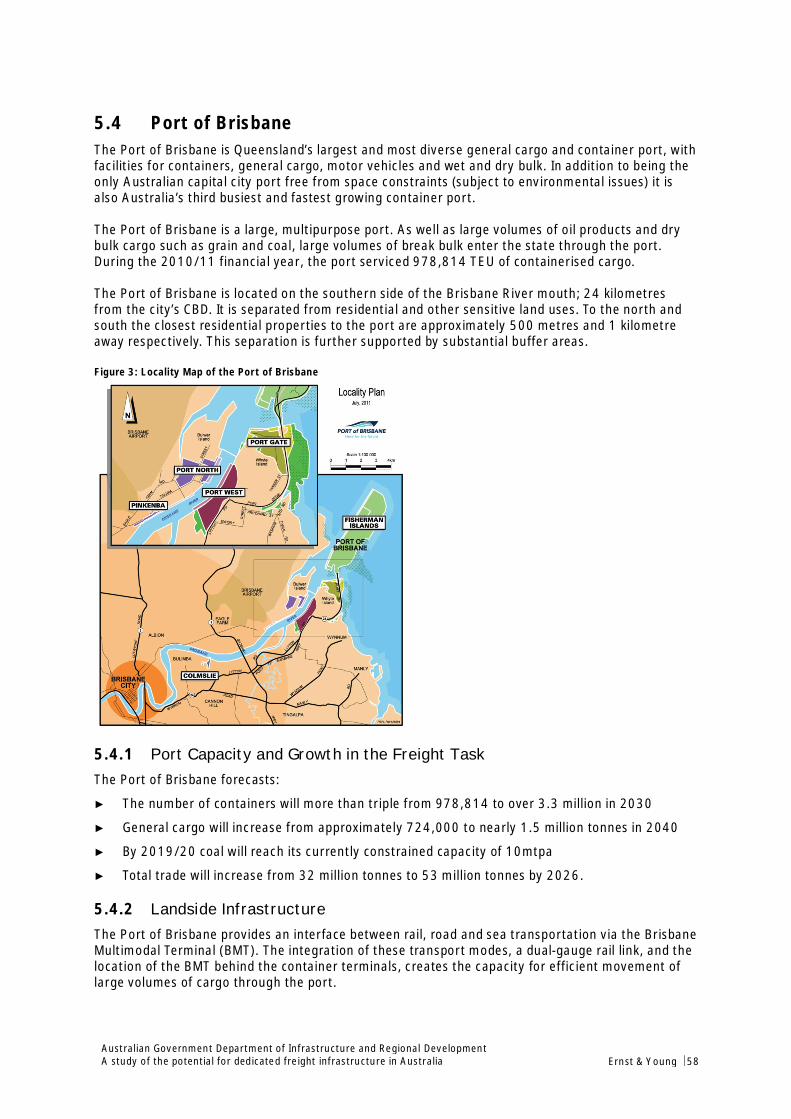
Australian Government Department of Infrastructure and Regional DevelopmentA study of the potential for dedicated freight infrastructure in Australia Ernst & Young ÷ 58
5.4 Port of BrisbaneThe Port of Brisbane is Queensland’s largest and most diverse general cargo and container port, withfacilities for containers, general cargo, motor vehicles and wet and dry bulk. In addition to being theonly Australian capital city port free from space constraints (subject to environmental issues) it isalso Australia’s third busiest and fastest growing container port.
The Port of Brisbane is a large, multipurpose port. As well as large volumes of oil products and drybulk cargo such as grain and coal, large volumes of break bulk enter the state through the port.During the 2010/11 financial year, the port serviced 978,814 TEU of containerised cargo.
The Port of Brisbane is located on the southern side of the Brisbane River mouth; 24 kilometresfrom the city’s CBD. It is separated from residential and other sensitive land uses. To the north andsouth the closest residential properties to the port are approximately 500 metres and 1 kilometreaway respectively. This separation is further supported by substantial buffer areas.
Figure 3: Locality Map of the Port of Brisbane
5.4.1 Port Capacity and Growth in the Freight TaskThe Port of Brisbane forecasts:
► The number of containers will more than triple from 978,814 to over 3.3 million in 2030
► General cargo will increase from approximately 724,000 to nearly 1.5 million tonnes in 2040
► By 2019/20 coal will reach its currently constrained capacity of 10mtpa
► Total trade will increase from 32 million tonnes to 53 million tonnes by 2026.
5.4.2 Landside InfrastructureThe Port of Brisbane provides an interface between rail, road and sea transportation via the BrisbaneMultimodal Terminal (BMT). The integration of these transport modes, a dual-gauge rail link, and thelocation of the BMT behind the container terminals, creates the capacity for efficient movement oflarge volumes of cargo through the port.
Australian Government Department of Infrastructure and Regional DevelopmentA study of the potential for dedicated freight infrastructure in Australia Ernst & Young ÷ 59
Road
Approximately 94% of the port’s container trade is currently handled by road. In the 2010/11financial year this constituted 893,589 TEU. Reflecting its multipurpose nature, 4.9 million tonnesof dry bulk/break bulk cargo also exited or entered the port by road. With approximately 75% ofcontainers delivered within/or from a 20 kilometre radius of the port, the road links are critical.
The road network comprises a single road to and from the port, called the Port of Brisbane Motorwaylinking up with the recently privatised Gateway Motorway at Murarie. The Gateway Motorway haslinks north, south and west to National Highways. It also has many arterial roads off to industrialprecincts close to the port and into Acacia Ridge, to the south west.
Rail
Rail carries the remaining 6% of containers (57,000 in 2010/11). Queensland does not have afreight policy that actively promotes more containers on rail. However, freight trains carryinglivestock and general freight are subsidised by the Queensland Government. There is a dedicatedfreight line connecting the port to the Cleveland suburban line, and the container rail interface is off-dock.
There is a separate dedicated line from the port to the major intermodal terminal in Acacia Ridge, indual gauge (standard gauge and narrow gauge). The narrow gauge part of the dedicated line is usedextensively by intermodal trains, grain trains and coal trains. The intermodal element constitutes twotrains a day from Townsville/Rockhampton predominantly carrying refrigerated beef to the port. Theother service is three times a week from the Goondiwindi region to the west, mainly carrying cottonlint in containers.
5.4.3 The Potential for Productivity GainsBrisbane has benefited from recent large expansions in road capacity on important freight routes.On rail, however, it has identified major deficiencies in its plans to grow trade through the port.
Growth of Coal Exports
Where the rail system imposes serious constraints on the port is in the export of coal, which hasgrown 68% over the last eight years. Given the rail network in place and the forecast growth of coaldemand, the current network does not have the scope to meet the demand the port is nowforecasting.
This impairs the smooth flow of other types of freight traffic, including container freight, althoughthis suffers more from a lack of demand.
Passenger Priority
After navigating the Toowoomba Range, trains enter the Citytrain network near Ipswich. At all timespassenger trains are given priority within the Citytrain network. Even the so-called dedicated trainline adjacent to the Cleveland line does not afford unencumbered access. Non-passenger servicesmay be required to use the Cleveland line to pass other non-passenger services. The line is singletrack with only one short passing loop, which constrains capacity. During the morning and afternoonpeaks the volume of passenger traffic is such that no freight trains can access the network for a totalperiod of five hours.
The issues with the Toowoomba Range and Citytrain network result in the average freight traintaking six hours to travel from the top of the range to the port. If it could travel at the normal speedof 70kph, it would take just over two hours. This is without considering the effect of curfews.
Off-Dock Rail Interface
While the container rail interface at the port is efficient, due to its being off-dock, rail for containershas severe commercial disadvantages for short journeys compared to road.
Australian Government Department of Infrastructure and Regional DevelopmentA study of the potential for dedicated freight infrastructure in Australia Ernst & Young ÷ 60
Western Rail Network
This is the rail network from Brisbane to Toowoomba and then going to Charleville. It represents themajor problem area for the port. As well as the intermodal trains to Goondiwindi, long distancepassenger trains use the track four times a week as well as grain and coal trains, leading toscheduling issues and reducing freight rail’s reliability.
The Toowoomba Range
This is shared between coal, intermodal, passenger and grain trains. The number of grain trains canvary due to seasonal factors and competition from road. Hence, additional coal services can be rundepending on the circumstances at the time. These ad-hoc paths cannot be contracted over thepaths preserved for non-coal services.
Other issues with the Toowoomba Range:
► Small heritage listed tunnels and weight and height limitations for containers, limit the height ofwagons for coal and grain.
► Lack of space for passing loops
► The 15.75 tonne axle-load limit means that coal trains are limited to 670 metres and 200tonnes per train, and not the optimum 2000 metres and 10,000 tonnes.
5.4.4 Actions UndertakenThe state government has been quick to address issues that are currently affecting theeffectiveness of the landside infrastructure that links to the port. It has been especially focused onimproving and widening roads in order to increase their capacity. However, with the privatisation ofthe port, and the boom in the market for coal, more attention is now being given to the capacity ofrail.
Road
Upgrade of Key Motorways
Key motorways have recently been upgraded or are in the process of being upgraded, and due tothese investments it is expected that road capacity for the port will not re-emerge as an issue untilthe late 2020’s. These upgrades include:
► Gateway Motorway Upgrade: This is a $2.36 billion upgrade, which involved a new duplicate sixlane bridge over the Brisbane River and expansion of the then four-lane road to six lanesbetween Nudgee and Miles Platting Road (10 kilometres north and 14 kilometres south of theport respectively). The project aims to reduce the reliance on the Sir Leo Heilscher Bridge andincrease road capacity leading to safer, quicker and easier travel along the motorway andbridges.
► Port of Brisbane Motorway Upgrade: This will upgrade a major portion of the motorway fromtwo to four lanes and allowing trucks to travel north, south or west for 150 kilometres withoutencountering traffic lights. It is expected to cost $385 million and be complete in 2013. Beforethese upgrades, the Port of Brisbane Motorway was a two-lane road, with 900 vehicles per hourper lane using it during peak hours (21% of vehicles were heavy vehicles). With these upgrades,vehicles per hour per lane are expected to halve.
► Pritchard Street/Export Street to Lucinda Drive: The upgrade of the final 3.2 kilometres ofthis public road is expected to cost $200 million. On this road the peak hour traffic volume is664 of which 35% is heavy vehicles. PBPL is funding this major project through a cost recoveryPort Access Charge.
Rail
None of the issues with the Citytrain network are set to improve, rather a recent extension of thepassenger network on the Ipswich line has resulted in more passenger train services, resulting in

Australian Government Department of Infrastructure and Regional DevelopmentA study of the potential for dedicated freight infrastructure in Australia Ernst & Young ÷ 61
greater interaction between passenger and freight services, and more delays. However, actions arebeing taken that may assist rail efficiency, while other proposals to increase the capacity of railbetween the port and the coalmines are under consideration.
Cross River Rail Service
Plans are currently afoot to develop a Cross River Rail service, involving a new tunnel under theBrisbane River and an underground line north to south through the CBD. This will disentanglepassenger and freight lines, reducing their interaction and alleviating some of the constraints facingfreight services.
Expanding Coal Capacity
Due to the issues faced on the rail network, the port is only forecasting a capped 10 million tonnesof coal exports for the future. However, the following investments have been considered to expandcapacity to service coal growth:
► Passing Loop: Capacity on the Citytrain network will be increased by adding a passing loop onthe existing freight line. It could increase rail capacity to 14 million tonnes.
► Western Line / Toowoomba Range Upgrades: This project would cost between $1.3 and $1.7billion.
► Construction of the Southern Freight Rail Corridor Line: This project would cost between $1and $1.2 billion connecting the Western Rail Line near Rosewood to the interstate railway northof Beaudesert. The most rapid growth in freight movement across the state in the next 10 yearsis expected from South East Queensland. The freight corridor will accommodate the futuregrowth of rail freight in South East Queensland.99
► Proposed Eastern Freight Line Bypass: This would cost between $1.2 and $1.6 billion. It wouldlink from Kagura to the existing freight line near Murarie, increasing capacity by bypassing theCitytrain network and being of standard gauge instead of narrow gauge. Plus, it will havesufficient corridor width to enable ample passing loops and also have sufficient height to allowfor double stacking of containers to Acacia Ridge and beyond.
5.4.5 Concluding RemarksIt is most unlikely that the current rail infrastructure and network constraints affect the flow ofcontainers to and from the port. Billions have recently been spent to improve road access, andregulatory and technological changes have led to the development of innovative high productivityvehicles to take advantage of the improved infrastructure.
However, the future lack of capacity of the freight rail network connecting to the Port of Brisbane isindicated by the cap of 10 million tonnes of coal exports per annum that is currently in place. Thereare clearly gaps within the transportation network that need to be amended if the Port is going toprofit to the maximum extent from the current growth of coal demand.
Major deficiencies exist in the Port’s plans to grow trade through the port and a need for dedicatedrail freight infrastructure has been identified. Dedicated rail transport infrastructure is one methodto address capacity, time and service quality issues and also, through allowing for longer trains,double staking and greater economies of scale, reduce the cost differential with road. Brisbane mayprovide the test case for dedicated freight infrastructure, albeit as a by-product to the mainemphasis of moving large volumes of coal to the port. This opens up the issue of whether a purelyintermodal rail network could pay for the required infrastructure. This is a matter we considerfurther in our case study of the Port of Brisbane’s proposal to build dedicated rail transportinfrastructure.
A by-product of this new railway would be that multi-modal trains would have a new dedicatedfreight line to the port. It would be in place around the time in the late 2020’s when the current road
99 Queensland Government, “Southern Freight Rail Corridor”, www.tmr.qld.gov.au, accessed 10 April 2012
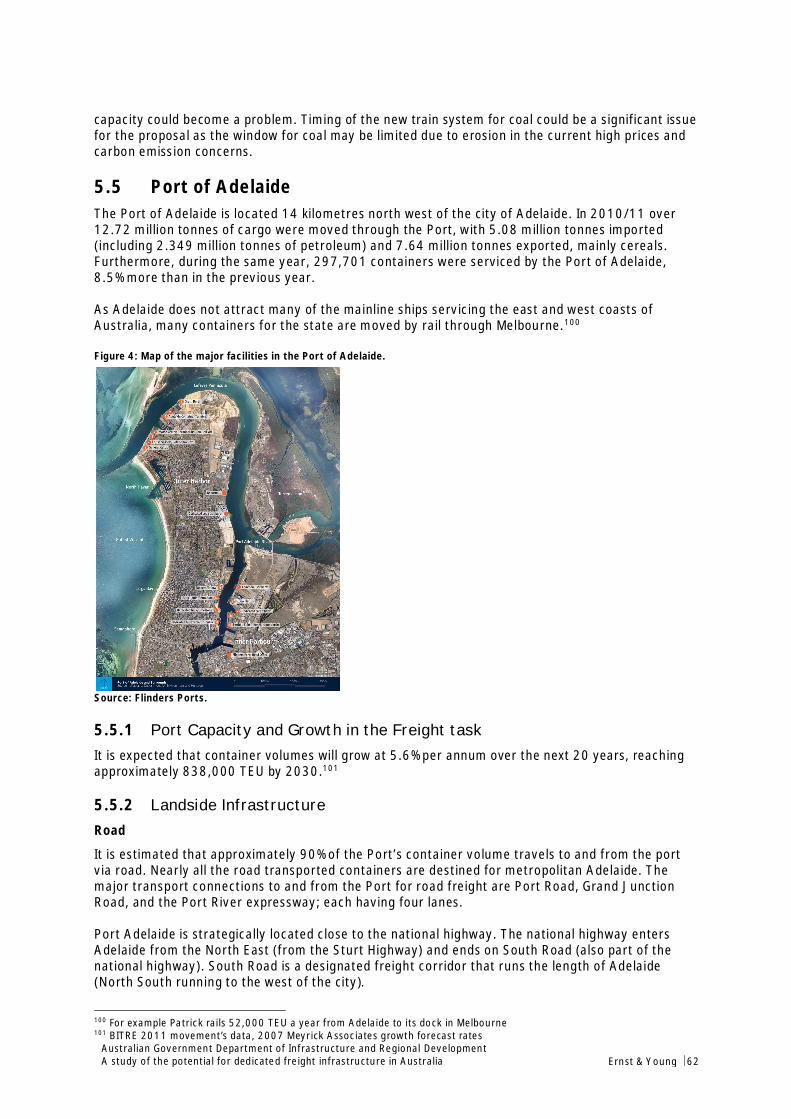
Australian Government Department of Infrastructure and Regional DevelopmentA study of the potential for dedicated freight infrastructure in Australia Ernst & Young ÷ 62
capacity could become a problem. Timing of the new train system for coal could be a significant issuefor the proposal as the window for coal may be limited due to erosion in the current high prices andcarbon emission concerns.
5.5 Port of AdelaideThe Port of Adelaide is located 14 kilometres north west of the city of Adelaide. In 2010/11 over12.72 million tonnes of cargo were moved through the Port, with 5.08 million tonnes imported(including 2.349 million tonnes of petroleum) and 7.64 million tonnes exported, mainly cereals.Furthermore, during the same year, 297,701 containers were serviced by the Port of Adelaide,8.5% more than in the previous year.
As Adelaide does not attract many of the mainline ships servicing the east and west coasts ofAustralia, many containers for the state are moved by rail through Melbourne.100
Figure 4: Map of the major facilities in the Port of Adelaide.
Source: Flinders Ports.
5.5.1 Port Capacity and Growth in the Freight taskIt is expected that container volumes will grow at 5.6% per annum over the next 20 years, reachingapproximately 838,000 TEU by 2030.101
5.5.2 Landside InfrastructureRoad
It is estimated that approximately 90% of the Port’s container volume travels to and from the portvia road. Nearly all the road transported containers are destined for metropolitan Adelaide. Themajor transport connections to and from the Port for road freight are Port Road, Grand JunctionRoad, and the Port River expressway; each having four lanes.
Port Adelaide is strategically located close to the national highway. The national highway entersAdelaide from the North East (from the Sturt Highway) and ends on South Road (also part of thenational highway). South Road is a designated freight corridor that runs the length of Adelaide(North South running to the west of the city).
100 For example Patrick rails 52,000 TEU a year from Adelaide to its dock in Melbourne101 BITRE 2011 movement’s data, 2007 Meyrick Associates growth forecast rates
Australian Government Department of Infrastructure and Regional DevelopmentA study of the potential for dedicated freight infrastructure in Australia Ernst & Young ÷ 63
For road freight access to Port Adelaide (and the surrounding precincts), local regulations allowaccess along dedicated routes (including some local roads) for road trains up to 36.5 metres inlength.
Rail
Approximately 10% of the port’s container volume travels to and from the port via rail. There are nometropolitan rail terminals and no services to intermodal terminals to or from the port. All railfreight originates in the North from Port Pirie and Balaclava and comprises mainly containerisedlead and hay, approximately 30,000 TEU a year. Currently, it comprises two trains a week withempty containers out and full containers in. There are two corridors to the Port through Adelaide.Both lines are connected to wharves in the Inner and Outer Harbour.
For rail-based access to the port there is only limited shared transport infrastructure. The standardgauge freight rail network is currently on a different gauge to the broad gauge commuter network.As such, shared access with city passenger rail is not currently a major issue although conflictpoints do occur where lines cross.
5.5.3 The Potential for Productivity GainsSouth Australian Government representatives have indicated there are no major issues (current orforeseen) that will impact freight access to Port Adelaide. However, they are aware of some minorissues, which they will consider in future planning.
Urban Encroachment
Local and state planning has not been coordinated with transport requirements in the past. Therehave been cases where land use changes were approved in locations that could conflict with portuse. The matter is being addressed through greater coordination between agencies.
Road
Truck Queuing
A minor issue within the outer harbour port area where trucks can be waiting for up to an hour tounload/load.
Rail
Rail Freight Movement Curfews
Close proximity of residents to the main transport road/rail links on the Northern Peninsula maylead to pressure to introduce curfews on port access.
At Grade Railway Crossings
There are minor conflict points where freight rail interrupts road users at 6 at-grade crossings.
5.5.4 Actions UndertakenThe importance of efficient transport links to the Port, along with improved access to the rest ofAdelaide has been the focus of significant local and State planning.
Road
Northern Connector Project
This project is currently being planned and includes a road component which involves a new 15kilometres multi-lane motorway linking the Northern Expressway to the top of South Road and thePort River Expressway. It will link major transport routes and enable unimpeded journeys from PortWakefield, the mid north, the Barossa Valley and the Riverland to the Port of Adelaide or the lengthof the corridor to Old Noarlunga. The Northern Connector project will meet the forecast traffic
Australian Government Department of Infrastructure and Regional DevelopmentA study of the potential for dedicated freight infrastructure in Australia Ernst & Young ÷ 64
volumes from the north currently relying on Port Wakefield Road. The road will serve as a newnational road link to Perth, Sydney and Darwin.102
Vehicle Management System
An enhanced booking system has been introduced to improve truck waiting times. Should truckdemand continue to grow, staged responses such as the construction of a second gate andexpansion of the yards are being considered.
Rail
Northern Connector Project
This project is currently being planned and includes the construction of a new 31 kilometres freightrail line which will connect Dry Link to Waterloo Corner (to the north). It will be used by freight trainsas well as the Ghan and Indian Pacific. Travel times for both road and rail will improve. At-gradecrossing issues will be alleviated with four rail bridges separating rail freight travelling at 115km/hfrom road vehicles. The rail will reduce interaction between freight and passenger services. Theproject will serve as an important link to freight paths between Perth and Melbourne.
Upgrades to Goodwood and Torrens Junctions
The state government has proposed upgrades to the Goodwood and Torrens Junctions whereconflict points currently exist for freight and passenger rail services. This upgrade could involve agrade separation of the two lines in order to resolve the conflict between passenger and freightservices, reducing delays.
5.5.5 Concluding RemarksAdelaide is a small port and the road and rail infrastructure is essentially adequate for the task.Some minor issues remain, but they are being addressed. Projects have been proposed to removeat-grade rail crossings and reduce truck waiting times as well as disentangle freight and passengerrail services. This should ensure that the infrastructure has the ability to handle port-related trafficgrowth.
A remaining issue is the potential for curfews due to poor land use planning in the past which did notconsider freight transportation.
The small size of the Port, the fact that the main roads leading into and out of the Port are dualcarriageway roads and that the rail system is underutilised, together mean that Adelaide does nothave major congestion issues that may lead one to consider dedicated freight Infrastructure.
102 Government of South Australia, “Northern Corridor”, www.infratructure.sa.gov.au, accessed 10 April 2012
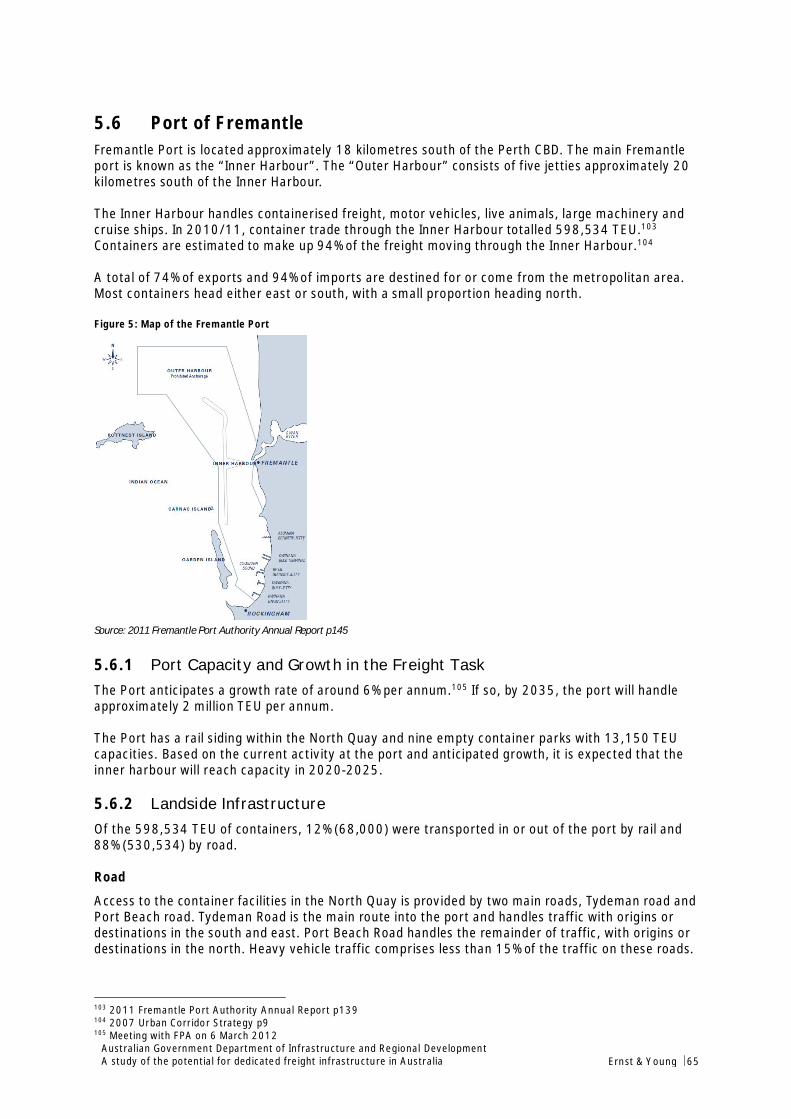
Australian Government Department of Infrastructure and Regional DevelopmentA study of the potential for dedicated freight infrastructure in Australia Ernst & Young ÷ 65
5.6 Port of FremantleFremantle Port is located approximately 18 kilometres south of the Perth CBD. The main Fremantleport is known as the “Inner Harbour”. The “Outer Harbour” consists of five jetties approximately 20kilometres south of the Inner Harbour.
The Inner Harbour handles containerised freight, motor vehicles, live animals, large machinery andcruise ships. In 2010/11, container trade through the Inner Harbour totalled 598,534 TEU.103
Containers are estimated to make up 94% of the freight moving through the Inner Harbour.104
A total of 74% of exports and 94% of imports are destined for or come from the metropolitan area.Most containers head either east or south, with a small proportion heading north.
Figure 5: Map of the Fremantle Port
Source: 2011 Fremantle Port Authority Annual Report p145
5.6.1 Port Capacity and Growth in the Freight TaskThe Port anticipates a growth rate of around 6% per annum.105 If so, by 2035, the port will handleapproximately 2 million TEU per annum.
The Port has a rail siding within the North Quay and nine empty container parks with 13,150 TEUcapacities. Based on the current activity at the port and anticipated growth, it is expected that theinner harbour will reach capacity in 2020-2025.
5.6.2 Landside InfrastructureOf the 598,534 TEU of containers, 12% (68,000) were transported in or out of the port by rail and88% (530,534) by road.
Road
Access to the container facilities in the North Quay is provided by two main roads, Tydeman road andPort Beach road. Tydeman Road is the main route into the port and handles traffic with origins ordestinations in the south and east. Port Beach Road handles the remainder of traffic, with origins ordestinations in the north. Heavy vehicle traffic comprises less than 15% of the traffic on these roads.
103 2011 Fremantle Port Authority Annual Report p139104 2007 Urban Corridor Strategy p9105 Meeting with FPA on 6 March 2012
Australian Government Department of Infrastructure and Regional DevelopmentA study of the potential for dedicated freight infrastructure in Australia Ernst & Young ÷ 66
Rail
The Inner Harbour is connected to a rail freight network. The network runs south to Kwinana andeast to the Kewdale/Canning Vale area. The network is a dedicated freight line, with the exception ofthe Fremantle Rail Bridge, which is shared with passenger rail services. Currently, four services a dayrun into the harbour.
The rail network plays a key role in allowing Fremantle port to grow without putting undue pressureon the road network. At present, there is a $43/TEU subsidy for movements by rail. The price isbased roughly on achieving parity in pricing between the road and rail networks.
There are currently three intermodal terminals servicing the Inner harbour, one each in the keyindustrial areas of Kewdale and Kwinana and an intermodal terminal in the north quay of the innerharbour.
5.6.3 The Potential for Productivity GainsWhile Fremantle is a relatively small port, it has some issues that cause the port’s landsideinfrastructure to be less productive than it could.
Road
Road Congestion
The Inner Harbour operates on a two shift roster, and is moving to a three shift roster (24 houroperation) but the wider supply chain does not. The destinations of containers (the premises ofimporters and exporters), typically operate on standard business hours. As such, the hours in whichtruck movements are concentrated are the standard business hours. Consequently, there is anintermingling of passenger, other business and freight traffic.
Approximately 96% of landside traffic movements in or out of Container Terminals occur onweekdays, concentrated between 0700 and 2100, the same periods when passenger movementsare highest.106
Buffer Zones around Freight Areas
The road network has issues with urban encroachment, particularly around the Stirling Highway andHigh Street intersection. The ability to increase numbers of lanes for key sections of the freightnetwork is limited as it requires resumption of properties. Furthermore, a key project for the porthas been the extension of Roe Highway from the intersection of the Kwinana freeway to Stock Road(Roe Highway Extension 8). There has been significant community opposition to this project as itpasses through environmentally sensitive wetlands.
Productivity of the Road Network
Out of the total number of trucks that leave or enter the port, 45% of them are either empty orcarrying only one TEU. Reducing this will improve road capacity.
Rail
The ability of rail to compete directly with road is exacerbated by several factors:
Train Length, Double Stacking and Number of Lifts
Currently the rail siding at the North Quay terminal is 400 metres long, which limits train length to400 metres or 600 metres if the train is split. Due to height limits on the route from Fremantle toKewdale, trains cannot be double-stacked. Also, movements by rail require a minimum of four liftsas opposed to two for road.
106 Fremantle Ports Landside Container Study , 2011, p5
Australian Government Department of Infrastructure and Regional DevelopmentA study of the potential for dedicated freight infrastructure in Australia Ernst & Young ÷ 67
Buffer Zones around Freight Areas
There are a number of buildings within 50 metres of the freight line, and planned development inthe suburb of Cockburn will be close to the rail corridor. This may limit the ability of trains servingthe port to run after hours.
Shared Rail Transport Infrastructure
The rail freight line is largely dedicated. However, there is a small section of track shared withpassenger trains. Passenger trains take priority over rail freight trains. As a result, freight servicesare unable to operate during peak hours (0700-1000 and 1600-1900).
Single Track Lines / Lack of Passing Loops
The dedicated rail freight line, for the most part, is a single track and there are limited passing loopsin the system. This limits the line’s capacity and achievable service frequency.
Distance of Freight Movements
As indicated above, 74% of exports and 94% of imports are destined for or come from themetropolitan area. Over such short distances, rail is not cost effective.
5.6.4 Actions UndertakenThe state government is attempting to increase the productivity of the landside logistics of the port.There is a long-term plan to cap Inner Harbour container movements at 1.2 million TEU and for railto handle 30% of container movements. The 1.2 million TEU cap is based on the capacity of landsideinfrastructure. The Inner Harbour capacity on the waterside is understood to be substantially higherfollowing dredging of the Inner Harbour.107
Road
Incentives for Back-loading
The Port sought from the Australian Competition and Consumer Commission exemptions from theTrade Practices Act to allow it to give preferential treatment to truck carriers engaging in back-loading. This would enable the same amount of freight to be transported with fewer trucks.However, this proposal did not proceed due to high implementation costs.
Stirling Highway / High Street Intersection
The intersection between the Stirling Highway and High Street is a key intersection for themovement of freight east and southwards. The current layout of the intersection is consideredunsafe. The proposal to upgrade is meant to increase safety and efficiency. However, the projecthas been put on hold, in part due to community opposition as it requires resumption of housing or ofa nearby golf course.
Roe Highway Extension
Together with the Reid Highway, the Roe Highway constitutes a ring road around the inner areas ofPerth that passes through a number of key industrial and freight areas. Without the proposed RoeHighway extension, freight traffic has no option other than to use South Street and the LeachHighway to reach the port. High congestion and stop-start conditions at multiple intersections onboth roads impede freight transport operations. The extension would help accommodate populationgrowth (2.8% per annum in the suburbs of South West Perth, and 1.1% in the remainingmetropolitan areas) as well as industrial, commercial and residential developments that areexpected over the next twenty years.108
107 Meeting with FPA, 6 March 2012108 Main Roads WA, “Roe Highway Strategic Review”, Western Australia, October 2009
Australian Government Department of Infrastructure and Regional DevelopmentA study of the potential for dedicated freight infrastructure in Australia Ernst & Young ÷ 68
Rail
The ability of the rail network to handle 360,000 TEU is dependent on several upgrades to the railinfrastructure.
Increased Rail Siding Length
There are plans to increase the length of the siding to 750 metres, which would allow longer trainsto use the facility. This is expected to be complete by 2014.
Passing Loop in Spearwood
In 2011/12, the construction of a passing loop in Spearwood is expected to commence. This isdesigned to increase the capacity of the line by allowing multiple trains to operate in the sameline.109
New Intermodal Terminal in Kewdale
A second intermodal terminal (T2) is planned for the Kewdale area, which is already connected tothe port by the freight rail network. A second intermodal terminal would increase the capacity of therail network to receive and load trains, increasing the capacity of the overall network. It is plannedfor completion by June 2014, but this is a tight timeline.110
Dedicated Rail Bridge
The Fremantle traffic bridge is the sole section of the freight line shared with the passenger railnetwork. It requires replacement due to age. The replacement infrastructure could incorporate adedicated freight crossing, to remove this interaction between freight and passenger rail. Thiswould allow the port to have a completely dedicated freight rail line. It should be noted that thiswould not be necessary for the rail network to handle the 360,000 TEU goal. If built, this upgradewould enable the rail line to handle in excess of the target.
5.6.5 Concluding RemarksPlans are in place for the current land infrastructure to be able to cope with Fremantle portincreasing its container flow from 0.5 million TEU today to 1.2 million TEU between 2020 and 2025.Then it is anticipated that additional container facilities at the outer harbour at Kwinana will handlegrowth beyond that figure. Modelling has been conducted on the rail transport infrastructure toconfirm that a 30% rail target out of 1.2 million TEU cap is feasible. This equates to 360,000 TEUbeing carried by rail.
A key factor in achieving this target is that fact that, uniquely in the Australian context today, theWA State Government is prepared to subsidise rail by $43 per TEU for short-haul trips. While otheroperational and customer service issues with rail exist, it is significant that the government hasaddressed the key competitive disadvantage of cost. With the current strategies in place, it appearsthe Fremantle is relatively well placed with the infrastructure it currently has.
109 Ibid p6110 Ibid p6
Australian Government Department of Infrastructure and Regional DevelopmentA study of the potential for dedicated freight infrastructure in Australia Ernst & Young ÷ 69
6. Case studies for further investigationUsing the framework together with the literature review, examination of Australian port supplychains and stakeholder consultations, we were able to identify potential case studies to be examinedin stage two.
This section discusses the potential case studies, providing an overview of the potential forproductivity gains as well as the indication of what each potential solution would involve.
Case studies have been identified for the ports that seem to have inadequate infrastructure orplanning in order to efficiently handle the proposed growth in container throughput. The ports ofBrisbane, Sydney and Melbourne all appear to have deficiencies with their landside infrastructure:
► Brisbane has identified major deficiencies in its plans to grow trade through the port,particularly because of the growth in coal exports. It has identified a need for dedicated railfreight infrastructure.
► In Sydney, freight congestion issues are caught up with general congestion. Both are becomingcritical and there may be potential to use dedicated or priority freight infrastructure to helpsolve them.
► In Melbourne, the port’s location at the edge of the CBD means there is a great deal of mixing offreight and passenger traffic, which could be alleviated with dedicated or priority freightinfrastructure.
As such case studies have been identified for each of these ports:
► At the Port of Brisbane, a new and upgraded dedicated freight line from prospective coal fields300 kilometres away to the port has already been proposed by the port. This will also provide afirst class dedicated freight rail line for intermodal trains
► At Port Botany, a range of possibilities has been considered such as using the widened M5 fortruck lanes, double stacking of trains and the Eastern Creek Intermodal Terminal.
► In Melbourne, a proposal for a truck action plan is being reconsidered, and the Port ofMelbourne – West gate Freeway direct freight connection is another option.
6.1 Port of Brisbane Dedicated Rail Freight
6.1.1 IntroductionThe Port of Brisbane was privatised in late 2010 as part of the Queensland Government’s strategyto reduce debt. The port was bought by a consortium of four long-term infrastructure funds.
Its new owners and management have reviewed the growth prospects of the port and haveidentified coal as the commodity most likely to provide the greatest growth prospects. At the sametime, they reviewed all of their infrastructure and operations and found that the greatest risk theyfaced was not on the sea side of their operations, or the on-port operations, but more theirconnectivity with the hinterland that supplies their exports and receives their imports.
The road network between the port and its catchment area is generally excellent, with recent multi-billion dollar investments increasing capacity in all directions. In the short to medium term, the portwill not have any major issues with road transport infrastructure. It was rail where the port saw itsgreatest problem.
Australian Government Department of Infrastructure and Regional DevelopmentA study of the potential for dedicated freight infrastructure in Australia Ernst & Young ÷ 70
Background
The port has identified a possible catchment of 50 to 60 million tonnes of coal per annum, wellabove the capacity of the existing rail infrastructure. The system is in parts antiquated and also hasto compete with passenger trains to gain access where it transits the Brisbane Citytrain network. Onthe Western network, from which the coal originates, the line has to navigate a steep range, theToowoomba Range, which has light 15.75 tonne axle load limits, tight corners and small tunnels.The final 35 kilometres to the port is a dedicated line. But this line has to cross over passenger linesand thus is subject to peak-hour passenger train curfews.
Given these finite capacity constraints, the port is only able to handle around 10 million tonnes ofcoal per annum, which would rise to 14 million tonnes with expenditure of several hundred milliondollars to increase capacity on the line from Acacia Ridge to the port.
Black coal is currently (early 2012) going through a boom in Queensland in reaction to high pricesand high demand from India and China. Multi-billion dollar investments are being considered for thecoalfields of Central Queensland as new areas, such as the Galilee Basin, are opened up and newdedicated rail and port infrastructure is built.
In order to access the higher volumes of up to 60 million tonnes, the Port proposes to fund ormanage the construction of a new and upgraded railway from the prospective coalfields 300kilometres away, to the port. The line would have three sections, for which preliminary analysis hasstarted:
► Western Line/Toowoomba Range upgrades — $1.3 - $1.7 billion
► Southern Freight Rail Corridor line — $1.0 – $1.2 billion
► Eastern Freight Rail Bypass — $1.2 – $1.6 billion
Together these represent a total cost estimate of between $3.5 billion and $4.5 billion. The first twoof these sectors have been studied for a number of years. Toowoomba Range crossings have beenanalysed for over ten years, separately and as part of the Melbourne–Brisbane Inland Rail Line. TheSouthern Freight Rail Corridor is also part of the larger Melbourne–Brisbane project and was studiedin the late 2000s. Currently, the corridor and alignment have been identified and the projectcurrently is recognised in planning schemes.
The Eastern Freight Rail Bypass is a new proposal that connects the point where the southern freightcorridor meets the Sydney – Brisbane line with the existing freight line near Murarie. It would followpart of the Logan and Gateway Motorway corridors. Hence, it would bypass the Citytrain networkcompletely via the southern corridor and the eastern bypass.
The Port sees the project as having positive spin-offs for its container trade. The line will allow forlong trains, double staking and a much improved transit time for rail-borne containers, thusimproving rail’s competitive position in relation to road. The Port will have a connection to theexisting intermodal terminal at Acacia Ridge and also to a proposed terminal at Bromelton,approximately 90 kilometres from the Port. The project is timed to be completed when the roadsused to access the port are likely to approach critical levels of congestion. Hence the rail line shouldprovide access for large proportions of the port’s short haul container trade.
Case Study Proposal
The Port of Brisbane has already undertaken preliminary market demand analysis and engineeringanalysis of its proposal. The proposal does not envisage government funding, but would requireplanning and environmental clearances, which could cover some sensitive issues concerning urbanamenity and protection of wildlife. Haulage of coal will fund the proposal. Particular issues we willfocus on are:
► How will the container trade at the port benefit from the proposal?
Australian Government Department of Infrastructure and Regional DevelopmentA study of the potential for dedicated freight infrastructure in Australia Ernst & Young ÷ 71
► While the infrastructure will be first class, what other constraints need to be overcome to makerail-borne containers commercially competitive for short haul trips to intermodal terminals?
► Is reliance on a large volume bulk commodity, such as coal the only way for first-class new railinfrastructure to be funded without a requirement for government subsidies?
► What governance, regulatory and access issues arise for a private owner of major railinfrastructure in a capital city?
► How do the financial markets view the proposal in terms of bankability and the veracity of theports future market demand forecasts?
The case study will have relevance to the main container ports we have considered, the centralissue being, can a new dedicated railway with or without a major export commodity such as coal befinancially sustainable, or if not, what level of government subsidy is required?
6.2 Port Botany Eastern Creek Intermodal Terminal
Introduction
An intermodal terminal (IMT) is a facility set aside for freight to be transferred between road andrail. Linked to the rail network, it includes a yard and possibly warehouses. Shipping containers arebought to the IMT by rail and stored for short periods, with goods then being taken away by trucksor continuing on by rail for distribution to other locations111.
Sydney has the most extensive urban IMT network in Australia, including four significant terminalswithin a 50km radius of Port Botany. Total capacity provided by these IMT’s per year isapproximately 120,000 TEUs. The IMT at Minto is being developed to cater for 200,000 TEUs perannum while the Yennora terminal is projected to expand its capacity to 200,000 TEU.
In the future, the freight IMT network system in NSW will comprise the super hub IMTs at the Port ofBotany; complemented by a number of IMTs of capacities between 50,000 and 500,000 TEU perannum located along the fringe of Sydney CBD to serve growth areas; IMTs located close to the Portof Botany to serve interstate cargoes; and IMTs in regional NSW to receive local produce for exportand goods for distribution to regional NSW.
Background
Container trade in Sydney is expected to grow to between 3.15 million and 3.81 million TEUs by2020. However, none of the existing facilities has sufficient expansion potential to provide forlonger trains and the anticipated increase in demand112. In Sydney, daily truck trips are expected tomore than double from 2,900 movements in 2010 to 6,270 movements by 2021, which is expectedto significantly increase road congestion issues. It is noteworthy that the road network is alreadyunder pressure due to general traffic, a complex and narrow arterial road network and high urbandensities.
Provided the new and existing IMTs can be effectively designed and operated, they will improve thelandside efficiency of Port Botany and significantly reduce the contribution of container truckmovements to road traffic congestion and environmental impacts.
Around 85% of cargo handled at Port Botany is generated or destined for locations within a 40kmradius from the port.113 The port is serviced by a freight line that includes some dedicated sections.It has the capacity to handle 500,000 TEUs per year, but is currently handling only 50% of thatnumber. The road network currently handles more than 750,000 TEUs per year. Because railfreight needs to be split between stevedores, trains arriving and departing the port need to bebroken in the port yard, causing delays and adding operational complexity.
111 Dept of Finance and Deregulation, “Information Paper: Moorebank Intermodal Terminal Project”, Moorebank, 2011112 Dept of Transport and Regional Services, “North South Rail Corridor Study: Detailed Study Report”, Sydney, 2006113 Gilfillan (2011)
Australian Government Department of Infrastructure and Regional DevelopmentA study of the potential for dedicated freight infrastructure in Australia Ernst & Young ÷ 72
Recognising the significance of rail freight performance in managing road congestion, the NSWgovernment aims to move 28% of containers in and out of Port Botany by 2020114. However, railcurrently only carries 14% of these containers.
Due to the high concentration of freight origins and destinations within metropolitan areas, in orderto achieve the rail target:
► Growth will need to come from short-haul urban train shuttle services.
► There needs to be a growth in imported containers carried by rail, relative to exportedcontainers because Port Botany services twice as many import containers than exportcontainers, yet 70% of containers transported by rail are exports.
If a 28% mode share on rail could be achieved, rail would handle between 0.9 and 1.1 million TEUsby 2020. As the forecast capacity of existing IMT’s by 2020 is 720,000 TEUs, extra capacity ofbetween 180,000 and 380,000 TEUs will be required from new intermodal facilities. The NSWGovernment’s Metropolitan Plan outlines a proposed network of additional IMTs and supportinginfrastructure in the central-west, south-west and west of metropolitan Sydney to meet predicteddemand. Facilities are proposed at Enfield, Moorebank and Eastern Creek.
Case Study Proposal
To service the growing Western Sydney region, a potential IMT in Eastern Creek was identified bythe Freight Infrastructure Advisory Board (FIAB) to cater for at least 500,000 TEUs annually. Theproposed IMT would have a number of elements to meet the required freight logistics task115:
► There would be direct rail links to Port Botany.
► Road transport will provide and deliver containers and goods to destinations within thecatchment area.
► The inclusion of warehousing and freight support services within the site would reduce thenumber of large truck movements within local communities.
However, the remoteness of Eastern Creek puts it at a disadvantage, as it would likely require theconstruction of a new 18km dedicated freight line linking the terminal with the Southern SydneyFreight Line. It would also require significant land acquisition and construction costs. Present raildeficiencies pose threats to service certainty and hence the viability of this terminal116. Anadditional critical factor that would determine its future economic and construction viability iseffective corridor preservation.
6.3 Including Truck Lanes in the Proposed M5 Upgrade
The M5 transport corridor is the main passenger, commercial and freight route between SydneyAirport, Port Botany and South West Sydney. It comprises of two sections;
► M5 West, a 22km tolled surface road with two lanes in each direction between Camden ValleyWay, Prestons, and King Georges Road, Beverly Hills, operated by Interlink Roads.
► M5 East Freeway, a 10km road that connects the M5 South east with General Holmes Drive,close to the port.
The M5 corridor is one of the most heavily constrained roads in Sydney:
► On average 91,000 vehicles use the M5 West Motorway per day.117
114 The previous government target had been 40%115 Sydney ports Corporation, “Port Freight Logistics Plan”, Sydney, June 2008116 Shipping Australia Limited, “Metropolitan Intermodal Terminal Study,2011”, Sydney, 2011117 Roads & Traffic Authority, “M5 West Widening: Environmental Assessment”, NSW Government, September 2010
Australian Government Department of Infrastructure and Regional DevelopmentA study of the potential for dedicated freight infrastructure in Australia Ernst & Young ÷ 73
► Around 7000 vehicles (8%) are heavy vehicles, making the M5 West Motorway one of the mostimportant freight corridors on the Sydney motorway network118.
► During the middle of the day, traffic volumes are almost as high as during peak hours.
► Peak hour vehicle trips are anticipated to increase by 50% by 2036.
► The NSW government’s planning strategies identify land along the M5 West motorway to bedeveloped to intensify employment. The strategic locations along the corridor includeMoorebank, Minto and Campbelltown. As these develop into dense employment areas, they willgenerate more demand for commercial and freight transport in the corridor.
In the absence of additional capacity, travel times will continue to increase as congestion worsens,and more heavy vehicles will be diverted to local roads.
Widening of the M5 West Motorway commenced in August 2012, with the $400m project funded byInterlink Roads. The NSW government also contributed $50m in funding for noise abatementmeasures to address community concerns. The project involves widening 22km of the M5 SouthWest motorway from two to three lanes in each direction, from Camden Valley Way at Prestons toKing Georges Road at Beverly Hills119.
Some consideration was given to including truck only lanes in the M5 West upgrade with the aims ofkeeping goods flowing smoothly, improving overall mobility along the freeway, and improving trafficsafety and air quality.
However, after some consideration, it was decided that they were not warranted for the M5 Westupgrade. The benefits of dedicated truck lanes would be shorter trip times over the length of thelane provided and support for the increased demand of freight movement, while the negativeaspects would include120:
► The truck lanes would be heavily underutilised due to the proportion of heavy vehiclescomprising the overall traffic mix.
► Overall trip times would not reduce substantially as heavy vehicle trips are usually long andthere are other congested links in the arterial and motorway network.
For the M5 East Duplication, planning is still underway on the details and timing of the announcedupgrade.
Current plans are for:
► Widening the M5 East Motorway east of King Georges Road to four lanes in each direction.
► Providing four new lanes in a tunnel(s) next to the existing the M5 East tunnel.
► Providing a new four lane arterial road from the M5 East tunnels to the airport, the port and theindustrial land uses north of the airport.
Case Study Proposal
Our proposal was to look at a form of prioritised truck lanes on the M5 Motorway, including both theM5 East and West, to be incorporated into the proposed M5 East Duplication.
There are two alternative approaches we could take to this case study. Firstly, we could consider theeconomic case for Truck Lanes on the M5 West. Since this was considered by the NSW Government,there is likely to be information available to complete this study and it has the potential to delivervaluable information on situations when dedicated or priority freight infrastructure is not justified.
118 Roads & Traffic Authority, “M5 West Widening: Environmental Assessment”, NSW Government, September 2010119 Roads Australia News, “M5 Widening set to start this year”, Roads Australia, 30 January 2012120 Roads & Traffic Authority, “M5 West Widening; Submissions and Preferred Project Report”, NSW Government, May 2011
Australian Government Department of Infrastructure and Regional DevelopmentA study of the potential for dedicated freight infrastructure in Australia Ernst & Young ÷ 74
Secondly, we could consider introducing truck lanes on the M5 East. In both cases, we could explorethe potential for using high productivity vehicles on the road and into the port, taking into accountthe cost of minor upgrades at key pinch points around Port Botany.
6.4 Double Stacked Trains on Port Botany Freight Line
Double-stacking is where containers are stacked two high on railroad cars so that freight train of agiven length can carry roughly twice as many containers.
On many railroads, special well-cars are used for double stacking to reduce the required verticalclearance and to lower the centre of gravity of a loaded car. In addition, the well-car designsignificantly reduces damage in transit and provides greater cargo security by cradling the lowercontainers so their doors cannot be opened.
Double stack trains operate in Australia between Perth, Adelaide, Darwin and Parkes, NSW121.
Background
Double-stacking increases rail productivity, but it requires at least 6.5 metres of clearance abovethe rail height. Introduction of double-stacking is limited because construction costs to provide suchclearances can be significant. Increasing height clearances has two market drivers:
► Domestic containerised freight has tended to be moved in increasingly tall containers.Small increases in height clearance can allow these taller containers to be moved on abroader range of wagons.
► Increasing single-stack clearances by about 2 metres allows containers to be double-stacked. This offers both efficiency and capacity benefits. Double-stacking and increasingtrain length offer comparable increases in efficiency for an equivalent increase incontainers per day.
► Double stacking makes rail more cost competitive, which shifts more freight from road torail.
The spillovers internalised by increasing rail productivity will not be taken into account by acommercial investment appraisal which strongly suggests investment by government isnecessary122.
The introduction of new IMTs around Sydney could facilitate the introduction of double-stacking outof Port Botany to metropolitan terminals. However, between Port Botany and the Enfield LogisticsCentres there are 26 overhead bridges, which would need to be raised for double-stacking to bepossible. In addition, a recently completed vertical grade structure at the port would need to bemodified to permit the trains to travel underneath. There are also height restrictions because ofproximity to the airport. As a result, introduction of double-stacking would be expensive. Sydneyports representatives have concluded that the rail line between Enfield and Port Botany could notaccommodate double stacking at this time123.
Case Study Proposal
We gave this proposal early consideration, but due to the high potential cost, it would need greatlyincreased volumes to be viable. It would be more appropriate to focus on lifting rail utilisationtowards the NSW Government target of 28% of containers on rail.
121 Australian Railway Industry, “2008-2024 Interstate and Hunter Valley Rail Infrastructure Strategy”, June 2008122 QR Limited, “Australia’s Future Infrastructure Requirements”, Infrastructure Australia, Oct 2008123 Port Botany Neighbourhood Liaison Group, “Draft Minutes”, Sydney ports Operations Centre, Nov 2010
Australian Government Department of Infrastructure and Regional DevelopmentA study of the potential for dedicated freight infrastructure in Australia Ernst & Young ÷ 75
6.5 Sydney Port – Tunnel linking Port Botany to the M4
Introduction
The M4 is a 40 kilometre urban expressway running from Strathfield in the inner-west to Penrith atthe foot of the Blue Mountains. It enables travel between key regions of western Sydney andservices over 100,000 vehicles each day.
In 2010, management of the road was given back to the NSW Government and the toll removedafter the tolls had paid for the road’s construction costs.
Background
An issue with the M4 is that it finishes at Strathfield without continuing on toward the city or portand airport. Recently, the NSW Government considered a number of options to connect the M4 tothe areas closer to the city. Preliminary investigations for the following three tunnel proposals havebeen undertaken:
► North Strathfield to the Anzac Bridge at Pyrmont.
► North Strathfield to Port Botany and Sydney Airport.
► North Strathfield to Victoria Road east of Gladesville Bridge near Drummoyne.
Our interest is in the second of these tunnel options, linking the M4 from Strathfield to Port Botany.This would give the port direct access to the mid-west of Sydney, the major area for the distributionof containers.
Options are at a very preliminary stage. No decision has been made about whether to proceed withfurther planning.
Case Study Proposal
Our case study proposal is to look at the M4 extension to Port Botany as including a dedicated orprioritised truck lane within the tunnel. Various options are available. It could give priority to trucksduring certain times of the day by applying a toll to other traffic, similar to the Dublin Tunneldiscussed in literature search. Or it could be solely for the use of heavy vehicles over a certaintonnage. An important consideration will be the anticipated high cost, as it involves extensivetunnelling in densely populated areas.
6.6 Port of Melbourne – West Gate Freeway Freight Link
Introduction
In discussions with the Port of Melbourne, the idea of a direct link from inside the port, perhaps offCoode Street, linking up with the West Gate Freeway, near the City Link interchange emerged. Theresult would be an elevated spur road connecting the port with a major road handling much of theports freight task.
Background
The proposal has had no detailed consideration. No work on its technical feasibility has beenundertaken nor on industry views on the idea. Technical issues include where in the port environs toput the starting point, the required gradient given the space available, and where and how it wouldconnect with the West Gate Freeway. It would obviate the need for the Truck Action Plan proposal, asboth proposals would have similar benefits to the freight task.
Australian Government Department of Infrastructure and Regional DevelopmentA study of the potential for dedicated freight infrastructure in Australia Ernst & Young ÷ 76
Case Study Proposal
As the Truck Action Plan (the next proposal considered) has received much more analysis andtherefore has more data available, we consider that a more appropriate proposal for seriousconsideration.
6.7 Port of Melbourne –Dedicated Truck Roads through Yarraville
Introduction
The Port of Melbourne (‘POM’) is Victoria’s main container port (with current plans to expandcontainer handling facilities at Port of Hastings) and Australia’s largest international container port.Of particular importance is the Port’s ‘gateway’ function for Tasmanian trade and southeast ofAustralia.
Container trade for the POM is forecast to increase to 3.2 million TEU by 2015, 5.3 million TEU by2025 and 8.2 million TEU by 2035.124 Approximately 85% of this will be international containertrade, which has to be transported on the Victorian and interstate networks.
Development of the Port is limited by its inner-city Melbourne location, west of the CBD. The Port isbound on all sides by medium to high density residential, commercial and community development.A significant portion of container facilities exist in the western suburbs of Melbourne, accessiblefrom the west via Footscray Road using the suburban streets of Yarraville. These streets are notsuited to industrial purposes and heavy truck usage has resulted in strong community opposition.
Significant uncertainty surrounds Victorian port and freight strategy as previous port and freightpolicies have become obsolete with the 2010 change in government. A number of previouslyproposed projects are now under review.
Background
Road links between the Port and the West Gate Freeway have been an ongoing concern for the Portand its surrounding communities, in particular, Francis Street and Whitehall Street, which link thePort to the West Gate Freeway as well as neighbouring container parks. Discontent regarding use ofthese suburban streets has been building over many years and more recently, strong populationgrowth across Yarraville and Footscray has heightened the issue.
A representation of freight volumes on key inner west suburban roads and the existing communityinfrastructure assets are depicted in Figure 6 below.
124 Adapted from “Port Development Strategy: 2035 Vision”, Port of Melbourne Corporation, 2009
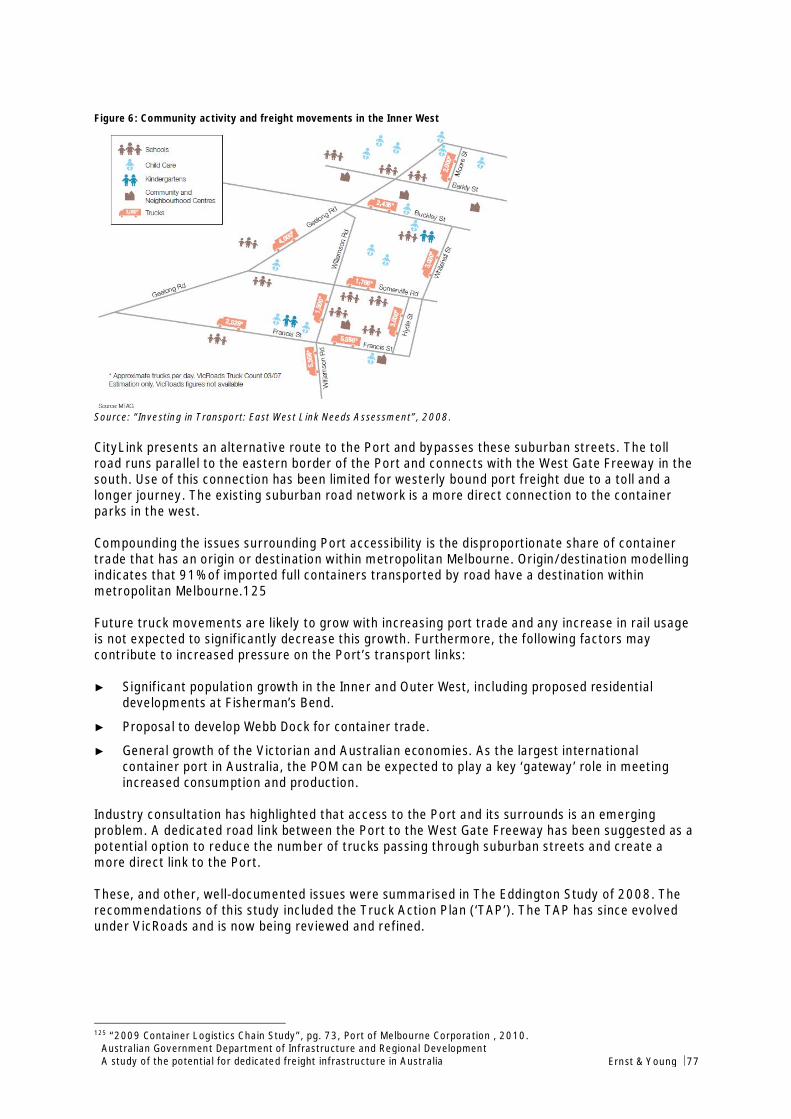
Australian Government Department of Infrastructure and Regional DevelopmentA study of the potential for dedicated freight infrastructure in Australia Ernst & Young ÷ 77
Figure 6: Community activity and freight movements in the Inner West
Source: “Investing in Transport: East West Link Needs Assessment”, 2008.
CityLink presents an alternative route to the Port and bypasses these suburban streets. The tollroad runs parallel to the eastern border of the Port and connects with the West Gate Freeway in thesouth. Use of this connection has been limited for westerly bound port freight due to a toll and alonger journey. The existing suburban road network is a more direct connection to the containerparks in the west.
Compounding the issues surrounding Port accessibility is the disproportionate share of containertrade that has an origin or destination within metropolitan Melbourne. Origin/destination modellingindicates that 91% of imported full containers transported by road have a destination withinmetropolitan Melbourne.125
Future truck movements are likely to grow with increasing port trade and any increase in rail usageis not expected to significantly decrease this growth. Furthermore, the following factors maycontribute to increased pressure on the Port’s transport links:
► Significant population growth in the Inner and Outer West, including proposed residentialdevelopments at Fisherman’s Bend.
► Proposal to develop Webb Dock for container trade.
► General growth of the Victorian and Australian economies. As the largest internationalcontainer port in Australia, the POM can be expected to play a key ‘gateway’ role in meetingincreased consumption and production.
Industry consultation has highlighted that access to the Port and its surrounds is an emergingproblem. A dedicated road link between the Port to the West Gate Freeway has been suggested as apotential option to reduce the number of trucks passing through suburban streets and create amore direct link to the Port.
These, and other, well-documented issues were summarised in The Eddington Study of 2008. Therecommendations of this study included the Truck Action Plan (‘TAP’). The TAP has since evolvedunder VicRoads and is now being reviewed and refined.
125 “2009 Container Logistics Chain Study”, pg. 73, Port of Melbourne Corporation , 2010.

Australian Government Department of Infrastructure and Regional DevelopmentA study of the potential for dedicated freight infrastructure in Australia Ernst & Young ÷ 78
6.8 Case Study Proposal
The TAP includes a proposed project for a new route that aims to increase accessibility to the Portand adjacent Port-related activities and to reduce the number of trucks on residential streets. Themost recent VicRoads concept project includes:
► A new ramp connecting the West Gate and Hyde Street
► Upgrades to Hyde Street, Whitehall Street and sections of Francis Street and Moreland Street
► Strengthening Shepherd Bridge (which carries Footscray Rd across the Maribyrnong River, aproject announced by the previous government in October 2010).
Our proposal is to consider an alteration to the current concept project by making it prioritised insome way for truck traffic only. This could be via several means, such as a curfew or toll for generaltraffic, or banning trucks from other close by routes.
Figure 7 displays the proposed direct link.
Figure 7: Truck Action Plan – VicRoads update (2012)
Source: “Truck Action Plan”, VicRoads,<http://www.vicroads.vic.gov.au/Home/RoadProjects/PlanningAndProposals/Melbourne/TruckActionPlan.htm2012>,Accessed online: 23 March 2012.
Key issues will include:
► How will the container trade at the port benefit from the proposal?
► To what extent would industry be amenable to paying for the benefits it receives?
► Do other constraints exist that will limit the impact of the proposed infrastructure asset?
► Could other existing infrastructure be used instead?
► Is the rationale for Government funding compelling?
► What governance/regulatory/access issues may arise with a private owner of roads in a capitalcity?
► The Port may need to purchase additional land assets to extend its current boundaries. Whatissues arise in terms of models of port ownership and governance in Australia?
► How do the financial markets view the proposal in terms of bankability and the credibility of thePort’s demand forecasts?
Australian Government Department of Infrastructure and Regional DevelopmentA study of the potential for dedicated freight infrastructure in Australia Ernst & Young ÷ 79
As a part of The East West Link Needs Assessment and development of the Truck Action Plan,significant work has been undertaken regarding the costs and benefits of development.Demographic forecasts, expected settlement patterns and public open space needs were weighedagainst financial costs and economic benefits of the development. This and updated informationfrom VicRoads forms our core set of data for the case study.
6.9 Evaluation FrameworkA qualitative evaluation framework was used for the assessment of the case studies. Central to thisevaluation are the principles for dedicated and priority freight infrastructure detailed in Chapter 4.This has been augmented with factors which we have developed specifically for considering whatproposals to take forward for full consideration as a case study. These factors are:
1. Cooperation and support for the study by the relevant stakeholders.
2. Availability of data/information.
3. Fulfilling the defintion of a dedicated freight infrastructure project.
4. Subject to study by others, or more appropriatly studied by others.
5. Geographic spread of case studies.
The proposals have also considered as a complementary mix of road and rail infrastructure casestudies that have the potential to deliver meaningful analysis on the dedicated and priority freightinfrastructure in Australia.
The principles for dedicated and priority freight infrastructure and the criteria above are displayedin Table 11 below.

Australian Government Department of Infrastructure and Regional DevelopmentA study of the potential for dedicated freight infrastructure in Australia Ernst & Young ÷ 80
Table 11: Case Study Assessment Criteria
Case StudyAssessmentCriteria
Key Elements ofthe Criteria Strategic Assessment Issues Considered
Demand Factors Trade volumes,congestion,distance andother demandfactors such asland use, amenityand safety
► The current and projected trade volumes to be transported► Levels of congestion resulting from the transport of the trade
volumes► Relevance of distance as a factor determining modal choice► Relevance and importance of setting aside land corridors and buffer
zones in order to handle future volumes
► Amenity and safety concerns through the interaction of the freighttask and urban communities and passenger transport modes
Supply Factors Capacity tohandle the task,its costeffectiveness,form and whopays and benefits
► The gap between the actual or anticipated freight task the road/railcapacity to meet the task
► At a time of financial constraint by governments at all levels, costbecomes of even greater importance
► Dedicated freight infrastructure can take many forms, from re-apportioning current infrastructure to building new infrastructure.The form it takes can also vary in the level of priority and form ofenforcement
► Proposals should be market led, with identifiable benefits to freightusers and payment for these. There are also wider economic benefitsand direct benefits to other users for which government may have arole in paying for
Cooperation Of the relevantstakeholders
► A necessity for any project, from the political level down togovernment officials and the privates sector participants
Data Availability From sources ► The readiness of relevant data holders to release the necessaryinformation and data in order for us to undertake the analysis.
Clear case ofDedicated FreightInfrastructure
Is this a dedicatedfreight project?
► Some freight issues are best handled by policy changes or forms ofinfrastructure investment that may not be totally freight related ordedicated to freight
Subject to studyby others
Are othersstudying it?
► Are there other parties in a better position to consider this project?
GeographicSpread
Ensuring widecoverage of ports
► Each port has unique characteristics, we want to cover as wide aspread as possible
The evaluation of each of the case studies was undertaken using the three level ranking systemoutlined in Figure 8 below.
Figure 8: Case Study Assessment Rating
Case StudyAssessment Rating Rating Description
1 Unlikely to meet the case study assessment criteria requirements
2 Partially meets the case study assessment criteria requirements
3 Fully meets the case study assessment criteria requirements
This ranking system is based on a qualitative assessment of the ability of the individual case studyproposals to meet the required assessment criteria. The ranking system focuses on identifying thedegree to which each criterion is addressed (being unlikely, partially or fully addressed).
Australian Government Department of Infrastructure and Regional DevelopmentA study of the potential for dedicated freight infrastructure in Australia Ernst & Young ÷ 81
Proposed Case Studies
Using the above evaluation framework, the assessment was undertaken of all the case studyproposals. This strategic assessment is summarised in Figure 9 and resulted in the identification ofthe following two proposals for further development, analysis and consideration:
► Brisbane Dedicated Freight Rail Line: Although specifically aimed at coal exports, will also allowfor intermodal trains. The Port of Brisbane agreed to our making an assessment of theirproposal, providing access to their engineering and market forecasts.
► Melbourne Dedicated Freight Road Link: The concept project outlined in the TAP has beenstudied and so data is available. We studied a change to the previous proposal by consideringvarious forms of prioritised access for trucks only via a toll on other users, a curfew, or otherform of prioritisation.

Australian Government Department of Infrastructure and Regional DevelopmentA study of the potential for dedicated freight infrastructure in Australia Ernst & Young ÷ 82
Figure 9: Case Study Proposal Scorecard and Scores
Case Study Assessment Criteria
Brisbane Sydney - Port Botany Melbourne
Ded
icat
edFr
eigh
tRai
lLi
ne
East
ern
Cre
ekIn
term
odal
Term
inal
M5
Truc
kLa
nes
Dou
ble
Stac
ked
Trai
nsto
Enfie
ld
Tunn
ellin
king
Port
toth
eM
4
Port
-Wes
tG
ate
Frei
ght
Link
Ded
icat
edFr
eigh
tRoa
dLi
nk(T
AP)
Demand FactorsTrade volumes, congestion, distance and other demandfactors such as land use, amenity and safety present 3 2 3 3 3 3 3
Supply FactorsCapacity to handle the task, its cost effectiveness, formand who pays and benefits 3 2 3 3 3 2 3
CooperationOf the relevant stakeholders 3 2 2 2 2 1 2
Data AvailabilityFrom sources (to be confirmed) 3 2 1 1 2 1 2
Clear Case of Dedicated Freight InfrastructureIs this a dedicated freight project? (Yes=3) 3 1 3 1 3 3 3
Subject to study by othersAre others studying it or better suited to study it? (No=3) 2 1 2 1 2 1 2
Geographic SpreadEnsuring wide coverage of ports 3 1 3 3 1 1 3
Overall Ranking 20 11 17 14 16 12 18
Proposal Progress as a Case Study Yes No No No No No Yes
A Study of the potential for dedicated freight infrastructure in Australia Ernst & Young ÷ 83
PART B: Case Studies (2012-2014)

Australian Government Department of Infrastructure and Regional DevelopmentA study of the potential for dedicated freight infrastructure in Australia Ernst & Young ÷ 84
CASE STUDY 1: MELBOURNE

Australian Government Department of Infrastructure and Regional DevelopmentA study of the potential for dedicated freight infrastructure in Australia Ernst & Young ÷ 85
1. Introduction
1.1 Background & PurposeThis case study for Melbourne focuses on a concept project to provide a new road link between thePort of Melbourne (PoM) precinct and the West Gate Freeway.
EY consulted with VicRoads to obtain and analyse data related to the case study. The projectanalysed in this case study is purely conceptual in order to explore issues in providing dedicatedfreight infrastructure between the West Gate Bridge and PoM precinct. And while we have drawn onthe results of previous work undertaken by VicRoads, we stress that the concept project does notconstitute a VicRoads or State Government project.
1.2 Our ApproachThis case study aims to enhance our understanding of the conditions that justify the delivery ofdedicated freight transport infrastructure to serve Australia’s major container ports.
In undertaking the case study, the key tasks included:
► Obtaining relevant project data from VicRoads
► Undertaking an analysis of the potential impacts of the concept project in order to identifyand value the benefits of the case study as an example of a priority freight link
► Undertaking a rapid financial assessment in order to evaluate the potential commercialfeasibility of the project
► Considering potential commercial and governance models that could be deployed to supportthe delivery of the infrastructure project
► Gauge the level of market interest and demand for the project, and in particular with respectto contributing to its commercial delivery
Part A of this Report identified a set of principles for considering dedicated and priority freightinfrastructure. The study found that there is a range of demand and supply factors that drive theviability of dedicated and priority fright infrastructure.
Principles of demand include:
► The presence of conflicts between freight and other users of the transport network► The size of the freight task► Distances that freight movements are required to travel► General network congestion around ports and other key freight centres► Land use planning considerations► Amenity issues► Safety and environmental concerns► Industry demand and willingness to pay for infrastructure
Principles of supply include:
► Capacity constraints around ports and other key freight centres► Cost effectiveness in delivering priority freight infrastructure► Form of infrastructure and design to address freight issues
Australian Government Department of Infrastructure and Regional DevelopmentA study of the potential for dedicated freight infrastructure in Australia Ernst & Young ÷ 86
These principles were used to inform the selection of case studies and to provide the frameworkwithin which to analyse this case study, and to consider whether it is an example of appropriatededicated or priority freight infrastructure in support of the PoM.

Australian Government Department of Infrastructure and Regional DevelopmentA study of the potential for dedicated freight infrastructure in Australia Ernst & Young ÷ 87
2. Overview & strategic context for the casestudy
2.1 IntroductionThe overview of the case study and strategic context highlight the extent to which the project isdesigned to overcome congestion and conflicts on the network, and to enhance nearby amenity, inorder to drive productivity growth to support the freight task. These represent a blend of the keyprinciples of demand for the potential need for dedicated freight infrastructure. On the supply side,capacity constraints were also identified as a key driver.
This chapter sets the scene by establishing the opportunity for the project as a dedicated freight link,which is to be confirmed or rejected through the economic and commercial analyses presented insubsequent chapters. These latter chapters also help us to understand whether the design and/orexpected uses of the project meets the principles or pre-conditions for priority freight infrastructure.
2.2 Overview of the case studyThe concept project in this case study contains a range of measures that were developed as a way ofensuring the sustainable growth of the PoM and for improving the amenity and developmentpotential of the inner west of the city. This would be achieved through the provision of a series ofnetwork improvements and other measures aimed at providing a direct link between the West GateFreeway and the PoM in order to improve the efficiency of vehicle movements and to reduce thenumber of freight and private motor vehicles on residential streets in Yarraville in the inner west ofMelbourne.
While not designed specifically as a dedicated freight link, which is the way we have conceptualisedthe project in this analysis, the project was identified as having the potential to support thecontinued expansion of the PoM from its current task of around 2 million to over 8 million TEUs perannum by 2035. The efficient functioning of the road network accessing the Port has beenconsidered a key factor in ensuring the PoM is able to process much higher volumes of freight as theVictorian and Australian economies continue to expand, driving significant growth in imports andexports.
2.2.1 Infrastructure elements of the concept projectThis case study involves the following major infrastructure elements:
► A new link, comprising new on- and off-ramps, connecting the West Gate Freeway and HydeStreet
► Upgrades to Hyde Street, Whitehall Street and sections of Francis Street and MorelandStreet, as access roads for freight vehicles accessing the PoM
► Strengthening the Shepherd Bridge, which carries Footscray Road traffic across theMaribyrnong River.
This case study considers the possibility of delivering these elements as partly or fully prioritisedfreight infrastructure in order to test the feasibility of such infrastructure in the Australian context.This could be via several means, such as a curfew or toll for general traffic, and banning trucks fromother nearby alternative routes. Figure 10 displays the proposed link.
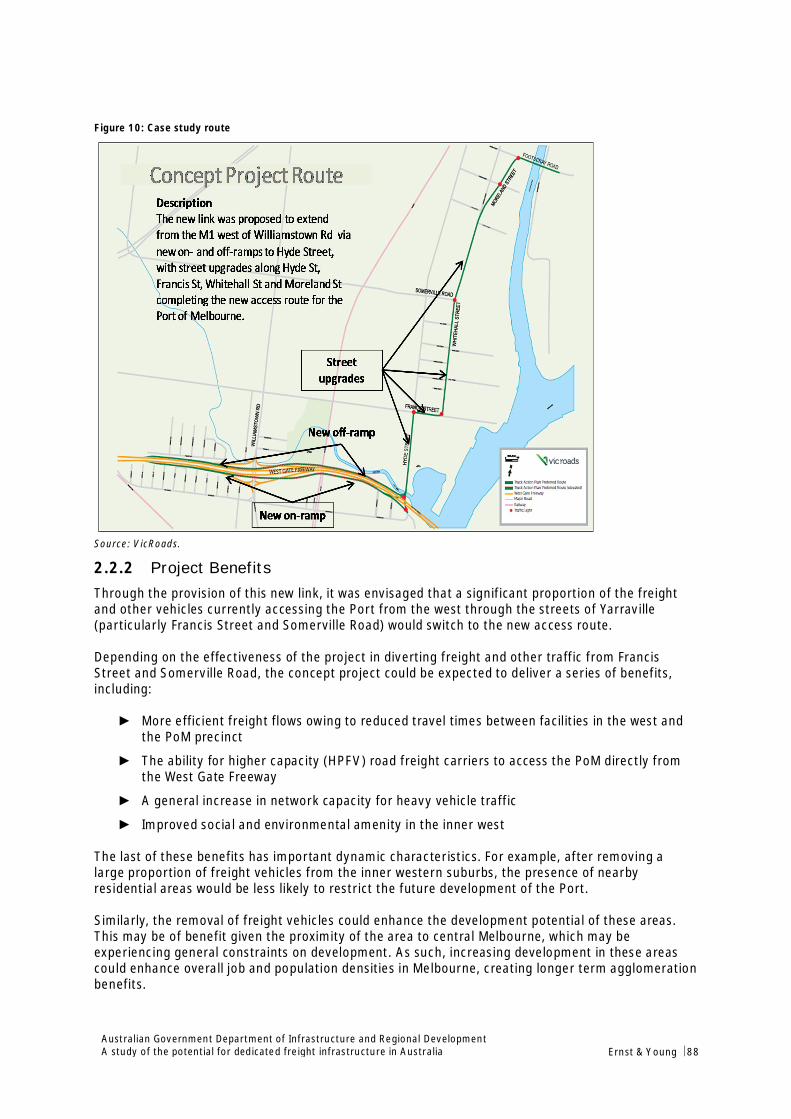
Australian Government Department of Infrastructure and Regional DevelopmentA study of the potential for dedicated freight infrastructure in Australia Ernst & Young ÷ 88
Figure 10: Case study route
Source: VicRoads.
2.2.2 Project BenefitsThrough the provision of this new link, it was envisaged that a significant proportion of the freightand other vehicles currently accessing the Port from the west through the streets of Yarraville(particularly Francis Street and Somerville Road) would switch to the new access route.
Depending on the effectiveness of the project in diverting freight and other traffic from FrancisStreet and Somerville Road, the concept project could be expected to deliver a series of benefits,including:
► More efficient freight flows owing to reduced travel times between facilities in the west andthe PoM precinct
► The ability for higher capacity (HPFV) road freight carriers to access the PoM directly fromthe West Gate Freeway
► A general increase in network capacity for heavy vehicle traffic
► Improved social and environmental amenity in the inner west
The last of these benefits has important dynamic characteristics. For example, after removing alarge proportion of freight vehicles from the inner western suburbs, the presence of nearbyresidential areas would be less likely to restrict the future development of the Port.
Similarly, the removal of freight vehicles could enhance the development potential of these areas.This may be of benefit given the proximity of the area to central Melbourne, which may beexperiencing general constraints on development. As such, increasing development in these areascould enhance overall job and population densities in Melbourne, creating longer term agglomerationbenefits.

Australian Government Department of Infrastructure and Regional DevelopmentA study of the potential for dedicated freight infrastructure in Australia Ernst & Young ÷ 89
A key question for this study is whether the concept project can provide an effective way ofmitigating the conflicts between cars and heavy vehicles, and between residential and commercialland uses, while also promoting growth in port freight activity.
2.3 Current Situation2.3.1 Project contextLocated in the inner-west of Melbourne, the Port covers an area at the mouth of the Yarra River. Atpresent, the Port relies heavily on road access via the surrounding freeways and roads in order totransport containers and other commodities between the Port and other areas of Melbourne andbeyond. For example, one study indicates that 80% of imported full containers transported by roadhave a destination within metropolitan Melbourne.126 Given this reliance on road transportation, highquality truck access is vital in ensuring that growth targets can be met.
Figure 11 shows the access routes to the Port in relation to the Greater Melbourne Area. Theseaccess routes are consistent with the “Principle Freight Networks” that are identified by the VictorianGovernment in Victoria: The Freight state, which is the Government’s vision and a plan for ensuringthat Victoria retains its status as Australia’s freight and logistics capital 127
Figure 11: Access routes to the Port within Greater Melbourne
The Port comprises two key areas: the area north of the Yarra bounded by Footscray Road thatincludes the major facilities at Swanson and Appleton docks, and the area east of the Yarra boundedby Todd Road, which includes Webb Dock.
Figure 12 highlights these areas as well as the principal interface connections, roads and Docks.
126 “Port Development Strategy 2035 Vision”, pg. 30, Port of Melbourne Corporation, 2009.127 “Victoria: The Freight State”, Victorian Government, 2013.

Australian Government Department of Infrastructure and Regional DevelopmentA study of the potential for dedicated freight infrastructure in Australia Ernst & Young ÷ 90
Figure 12: Port of Melbourne area and interface connections
From north of the Port, access is via the CityLink Tollway, with a turn-off point at Footscray Roadleading into Appleton Dock Road (A). Access to Swanson Dock is via Dock Link Road (B) or SimsStreet/Mackenzie Road (C). From east and south of the Port, access is either via Cook Street/ToddRoad (D) for Webb Dock or across the Bolte Bridge to A.
From the west however, access is less clearly defined. Ideally, traffic from the west should cross theWestgate Bridge, turn onto CityLink and cross the Bolte Bridge before turning off at Footscray Roadto reach connection A. These roads are better equipped to handle high volumes of truck traffic.
However, a problem is that in order to take a more direct route, and to avoid traffic congestion andthe Bolte Bridge toll, trucks from the west are using the residential streets of Yarraville such asFrancis Street and Somerville Road to access the Port (at C and B).
According to a VicRoads count, an estimated 20,000 trucks move through the inner-west every day.128 Of this figure, it is estimated that 60%, or 12,000 of these go to or come from the Port. Note thatthis figure represents traffic in both directions, and hence accounts for both imports and exports.
2.3.2 Victoria: The Freight state (2013)This case study has been developed and updated as the Victorian Government developed andreleased its latest freight and logistics plan – Victoria: The Freight state, which was released inAugust 2013.
The Government’s freight and logistics plan has been developed in parallel and as part of a widermetropolitan planning strategy, which was released during early 2014. Victoria: The Freight statehas an overarching goal to maximise the contribution of the freight and logistics sector to Victoria’sproductivity and liveability.
128 http://www.theage.com.au/victoria/boom-port-to-bust-by-2015-20111209-1onu8.html
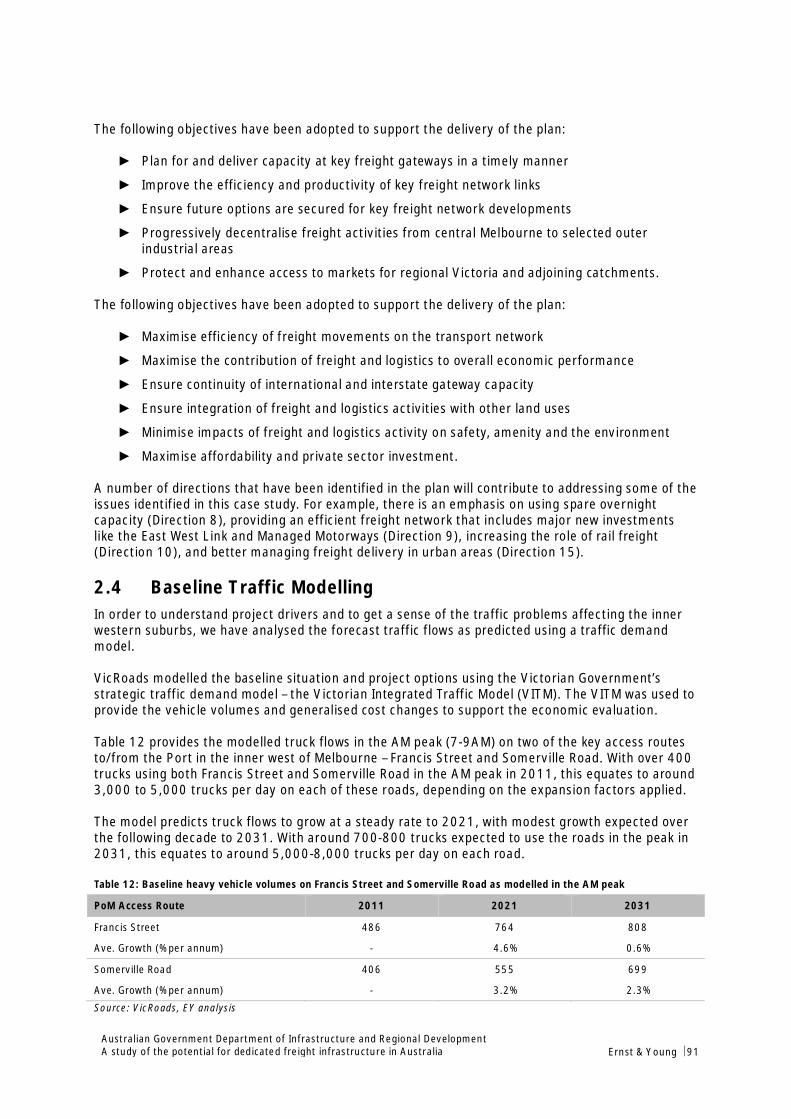
Australian Government Department of Infrastructure and Regional DevelopmentA study of the potential for dedicated freight infrastructure in Australia Ernst & Young ÷ 91
The following objectives have been adopted to support the delivery of the plan:
► Plan for and deliver capacity at key freight gateways in a timely manner
► Improve the efficiency and productivity of key freight network links
► Ensure future options are secured for key freight network developments
► Progressively decentralise freight activities from central Melbourne to selected outerindustrial areas
► Protect and enhance access to markets for regional Victoria and adjoining catchments.
The following objectives have been adopted to support the delivery of the plan:
► Maximise efficiency of freight movements on the transport network
► Maximise the contribution of freight and logistics to overall economic performance
► Ensure continuity of international and interstate gateway capacity
► Ensure integration of freight and logistics activities with other land uses
► Minimise impacts of freight and logistics activity on safety, amenity and the environment
► Maximise affordability and private sector investment.
A number of directions that have been identified in the plan will contribute to addressing some of theissues identified in this case study. For example, there is an emphasis on using spare overnightcapacity (Direction 8), providing an efficient freight network that includes major new investmentslike the East West Link and Managed Motorways (Direction 9), increasing the role of rail freight(Direction 10), and better managing freight delivery in urban areas (Direction 15).
2.4 Baseline Traffic ModellingIn order to understand project drivers and to get a sense of the traffic problems affecting the innerwestern suburbs, we have analysed the forecast traffic flows as predicted using a traffic demandmodel.
VicRoads modelled the baseline situation and project options using the Victorian Government’sstrategic traffic demand model – the Victorian Integrated Traffic Model (VITM). The VITM was used toprovide the vehicle volumes and generalised cost changes to support the economic evaluation.
Table 12 provides the modelled truck flows in the AM peak (7-9AM) on two of the key access routesto/from the Port in the inner west of Melbourne – Francis Street and Somerville Road. With over 400trucks using both Francis Street and Somerville Road in the AM peak in 2011, this equates to around3,000 to 5,000 trucks per day on each of these roads, depending on the expansion factors applied.
The model predicts truck flows to grow at a steady rate to 2021, with modest growth expected overthe following decade to 2031. With around 700-800 trucks expected to use the roads in the peak in2031, this equates to around 5,000-8,000 trucks per day on each road.
Table 12: Baseline heavy vehicle volumes on Francis Street and Somerville Road as modelled in the AM peak
PoM Access Route 2011 2021 2031
Francis Street 486 764 808
Ave. Growth (% per annum) - 4.6% 0.6%
Somerville Road 406 555 699
Ave. Growth (% per annum) - 3.2% 2.3%
Source: VicRoads, EY analysis
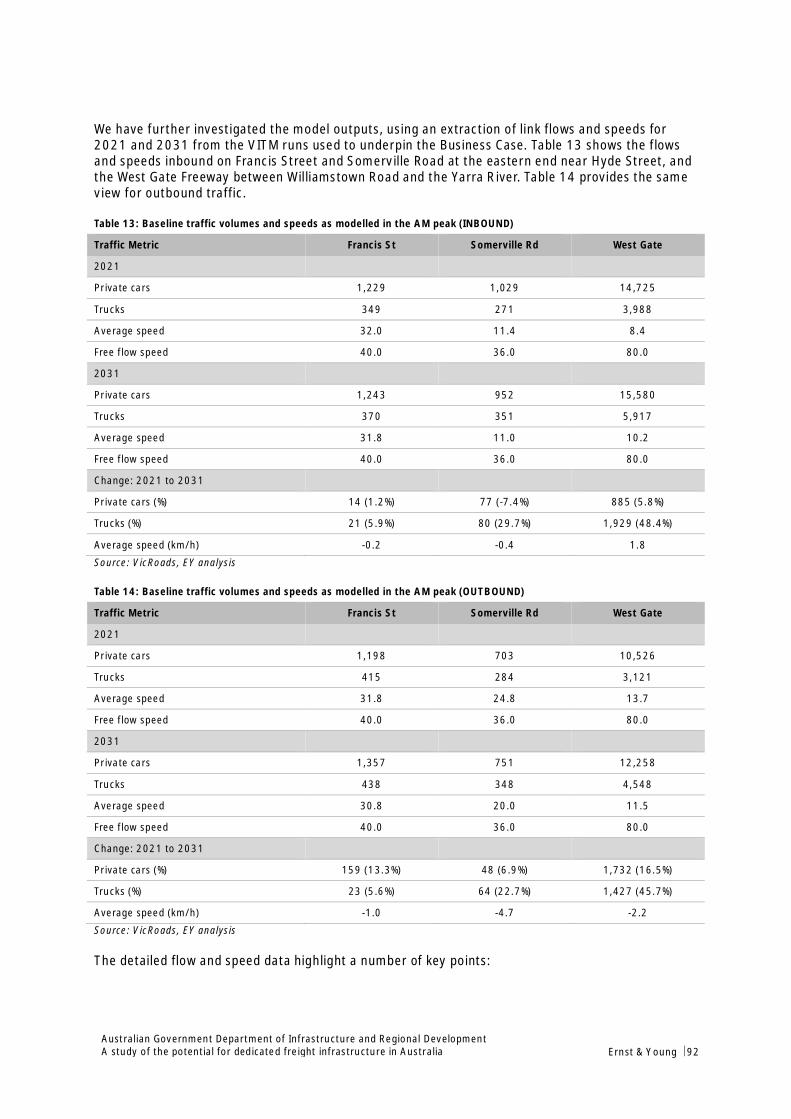
Australian Government Department of Infrastructure and Regional DevelopmentA study of the potential for dedicated freight infrastructure in Australia Ernst & Young ÷ 92
We have further investigated the model outputs, using an extraction of link flows and speeds for2021 and 2031 from the VITM runs used to underpin the Business Case. Table 13 shows the flowsand speeds inbound on Francis Street and Somerville Road at the eastern end near Hyde Street, andthe West Gate Freeway between Williamstown Road and the Yarra River. Table 14 provides the sameview for outbound traffic.
Table 13: Baseline traffic volumes and speeds as modelled in the AM peak (INBOUND)
Traffic Metric Francis St Somerville Rd West Gate
2021
Private cars 1,229 1,029 14,725
Trucks 349 271 3,988
Average speed 32.0 11.4 8.4
Free flow speed 40.0 36.0 80.0
2031
Private cars 1,243 952 15,580
Trucks 370 351 5,917
Average speed 31.8 11.0 10.2
Free flow speed 40.0 36.0 80.0
Change: 2021 to 2031
Private cars (%) 14 (1.2%) 77 (-7.4%) 885 (5.8%)
Trucks (%) 21 (5.9%) 80 (29.7%) 1,929 (48.4%)
Average speed (km/h) -0.2 -0.4 1.8
Source: VicRoads, EY analysis
Table 14: Baseline traffic volumes and speeds as modelled in the AM peak (OUTBOUND)
Traffic Metric Francis St Somerville Rd West Gate
2021
Private cars 1,198 703 10,526
Trucks 415 284 3,121
Average speed 31.8 24.8 13.7
Free flow speed 40.0 36.0 80.0
2031
Private cars 1,357 751 12,258
Trucks 438 348 4,548
Average speed 30.8 20.0 11.5
Free flow speed 40.0 36.0 80.0
Change: 2021 to 2031
Private cars (%) 159 (13.3%) 48 (6.9%) 1,732 (16.5%)
Trucks (%) 23 (5.6%) 64 (22.7%) 1,427 (45.7%)
Average speed (km/h) -1.0 -4.7 -2.2
Source: VicRoads, EY analysis
The detailed flow and speed data highlight a number of key points:

Australian Government Department of Infrastructure and Regional DevelopmentA study of the potential for dedicated freight infrastructure in Australia Ernst & Young ÷ 93
► In addition to trucks, there are a large number of cars that use both Francis Street andSomerville Road in the AM peak, suggesting that it is not just truck traffic that is affectingthe amenity and safety of the inner west
► The volume of traffic that relies on the West Gate is around 10 times as great as the otherroads shown, highlighting the importance of the West Gate in serving east-west flows acrossthe Yarra River
► Average speeds are significantly lower than the free flow speeds, which is particularly thecase for the West Gate and Somerville Road. With such high volumes, any measure thatimproves flow on the West Gate has the potential to drive very large economic benefits (e.g.travel time and vehicle operating cost savings)
► Outbound flows and speeds are comparable to inbound flows and speeds, highlighting theextent of bi-directional flows and congestion in inner Melbourne, which in part is driven bythe capacity of facilities such as the PoM, nearby industrial zones and the CBD to generatetraffic at all times of the day.
Overall, the analysis of the baseline traffic data confirms the problem statements and the presenceof demand-side pre-conditions that warrant consideration of network changes and potentially thedelivery of dedicated freight infrastructure as a way of enhancing access to the Port and removingconflicts that exist between freight vehicles and other road users on heavily congested sections ofMelbourne’s road network.
However, we can also see that these problems are not localised to just one or two road links, butinstead affect much of the road network to the west of the Port, as well as the M1 corridor. We alsounderstand that the spread of development across Yarraville, which is a mix of industrial andresidential uses, creates a complex pattern of mixed freight and private motor vehicle traffic, whichwould pose a challenge for the design of successful dedicated freight infrastructure. For example, itmay be that the share of traffic in the area that actually uses the Port might not constitute enoughof the local transport task to justify the delivery of cost-effective priority links.
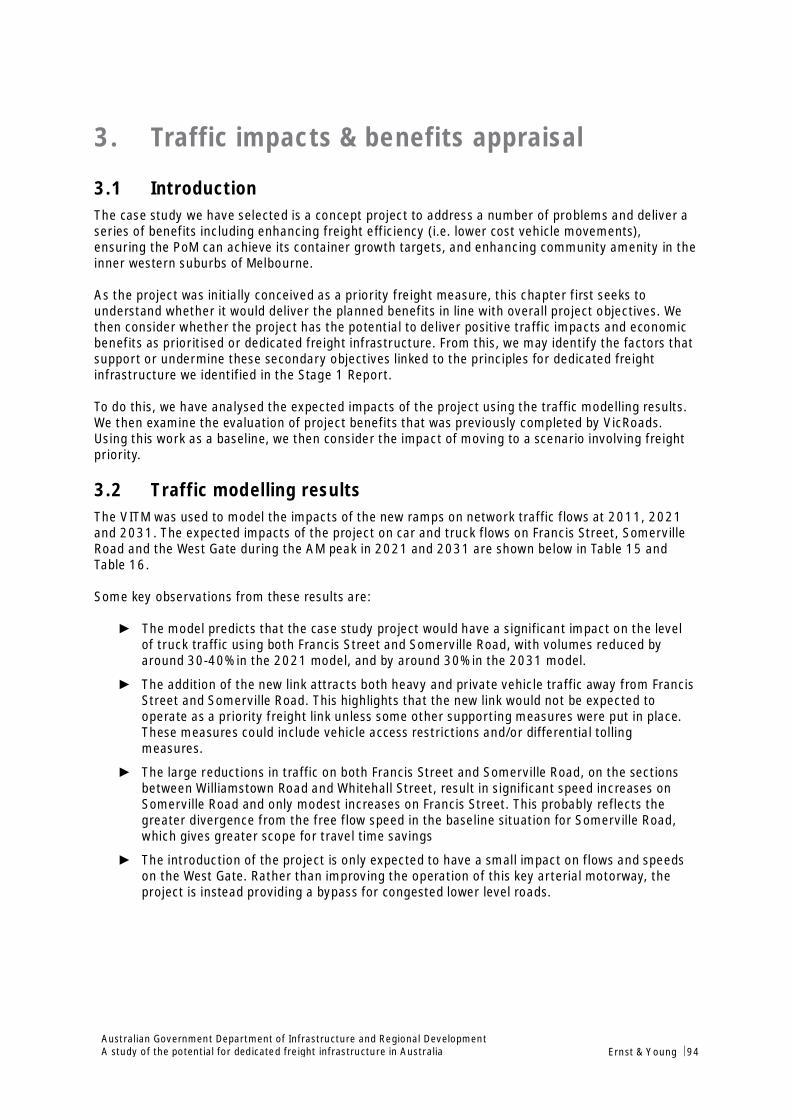
Australian Government Department of Infrastructure and Regional DevelopmentA study of the potential for dedicated freight infrastructure in Australia Ernst & Young ÷ 94
3. Traffic impacts & benefits appraisal
3.1 IntroductionThe case study we have selected is a concept project to address a number of problems and deliver aseries of benefits including enhancing freight efficiency (i.e. lower cost vehicle movements),ensuring the PoM can achieve its container growth targets, and enhancing community amenity in theinner western suburbs of Melbourne.
As the project was initially conceived as a priority freight measure, this chapter first seeks tounderstand whether it would deliver the planned benefits in line with overall project objectives. Wethen consider whether the project has the potential to deliver positive traffic impacts and economicbenefits as prioritised or dedicated freight infrastructure. From this, we may identify the factors thatsupport or undermine these secondary objectives linked to the principles for dedicated freightinfrastructure we identified in the Stage 1 Report.
To do this, we have analysed the expected impacts of the project using the traffic modelling results.We then examine the evaluation of project benefits that was previously completed by VicRoads.Using this work as a baseline, we then consider the impact of moving to a scenario involving freightpriority.
3.2 Traffic modelling resultsThe VITM was used to model the impacts of the new ramps on network traffic flows at 2011, 2021and 2031. The expected impacts of the project on car and truck flows on Francis Street, SomervilleRoad and the West Gate during the AM peak in 2021 and 2031 are shown below in Table 15 andTable 16.
Some key observations from these results are:
► The model predicts that the case study project would have a significant impact on the levelof truck traffic using both Francis Street and Somerville Road, with volumes reduced byaround 30-40% in the 2021 model, and by around 30% in the 2031 model.
► The addition of the new link attracts both heavy and private vehicle traffic away from FrancisStreet and Somerville Road. This highlights that the new link would not be expected tooperate as a priority freight link unless some other supporting measures were put in place.These measures could include vehicle access restrictions and/or differential tollingmeasures.
► The large reductions in traffic on both Francis Street and Somerville Road, on the sectionsbetween Williamstown Road and Whitehall Street, result in significant speed increases onSomerville Road and only modest increases on Francis Street. This probably reflects thegreater divergence from the free flow speed in the baseline situation for Somerville Road,which gives greater scope for travel time savings
► The introduction of the project is only expected to have a small impact on flows and speedson the West Gate. Rather than improving the operation of this key arterial motorway, theproject is instead providing a bypass for congested lower level roads.
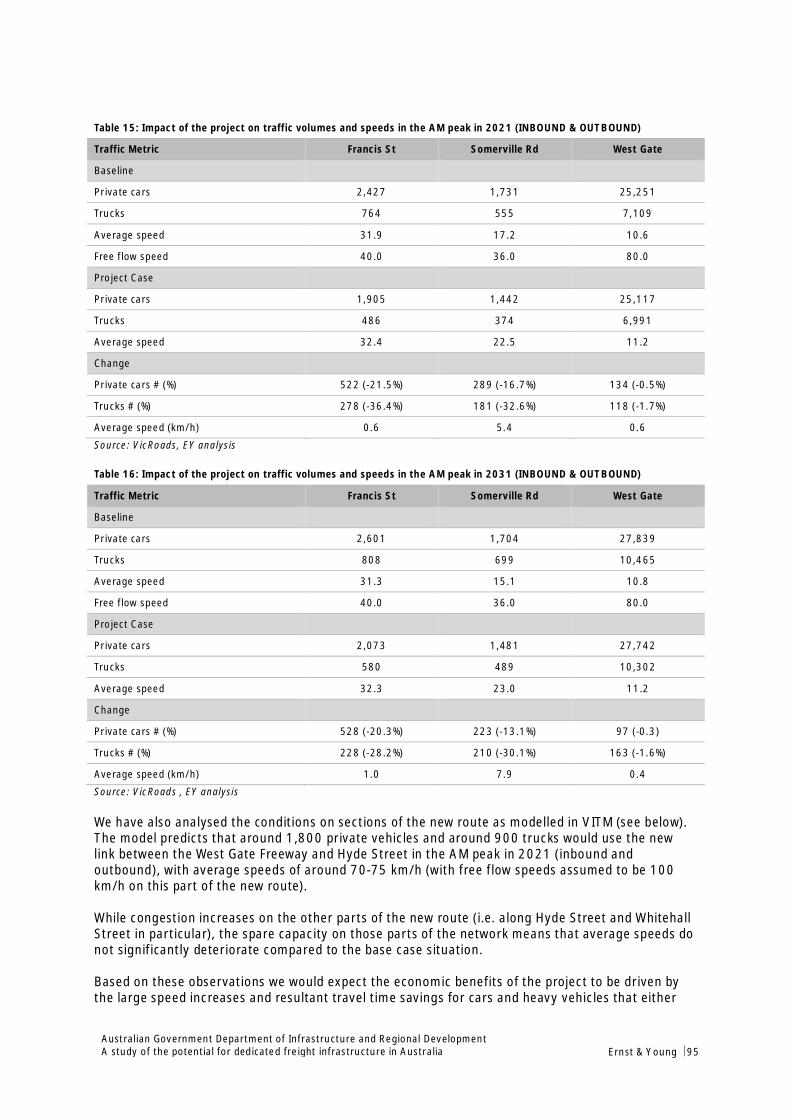
Australian Government Department of Infrastructure and Regional DevelopmentA study of the potential for dedicated freight infrastructure in Australia Ernst & Young ÷ 95
Table 15: Impact of the project on traffic volumes and speeds in the AM peak in 2021 (INBOUND & OUTBOUND)
Traffic Metric Francis St Somerville Rd West Gate
Baseline
Private cars 2,427 1,731 25,251
Trucks 764 555 7,109
Average speed 31.9 17.2 10.6
Free flow speed 40.0 36.0 80.0
Project Case
Private cars 1,905 1,442 25,117
Trucks 486 374 6,991
Average speed 32.4 22.5 11.2
Change
Private cars # (%) 522 (-21.5%) 289 (-16.7%) 134 (-0.5%)
Trucks # (%) 278 (-36.4%) 181 (-32.6%) 118 (-1.7%)
Average speed (km/h) 0.6 5.4 0.6
Source: VicRoads, EY analysis
Table 16: Impact of the project on traffic volumes and speeds in the AM peak in 2031 (INBOUND & OUTBOUND)
Traffic Metric Francis St Somerville Rd West Gate
Baseline
Private cars 2,601 1,704 27,839
Trucks 808 699 10,465
Average speed 31.3 15.1 10.8
Free flow speed 40.0 36.0 80.0
Project Case
Private cars 2,073 1,481 27,742
Trucks 580 489 10,302
Average speed 32.3 23.0 11.2
Change
Private cars # (%) 528 (-20.3%) 223 (-13.1%) 97 (-0.3)
Trucks # (%) 228 (-28.2%) 210 (-30.1%) 163 (-1.6%)
Average speed (km/h) 1.0 7.9 0.4
Source: VicRoads , EY analysis
We have also analysed the conditions on sections of the new route as modelled in VITM (see below).The model predicts that around 1,800 private vehicles and around 900 trucks would use the newlink between the West Gate Freeway and Hyde Street in the AM peak in 2021 (inbound andoutbound), with average speeds of around 70-75 km/h (with free flow speeds assumed to be 100km/h on this part of the new route).
While congestion increases on the other parts of the new route (i.e. along Hyde Street and WhitehallStreet in particular), the spare capacity on those parts of the network means that average speeds donot significantly deteriorate compared to the base case situation.
Based on these observations we would expect the economic benefits of the project to be driven bythe large speed increases and resultant travel time savings for cars and heavy vehicles that either
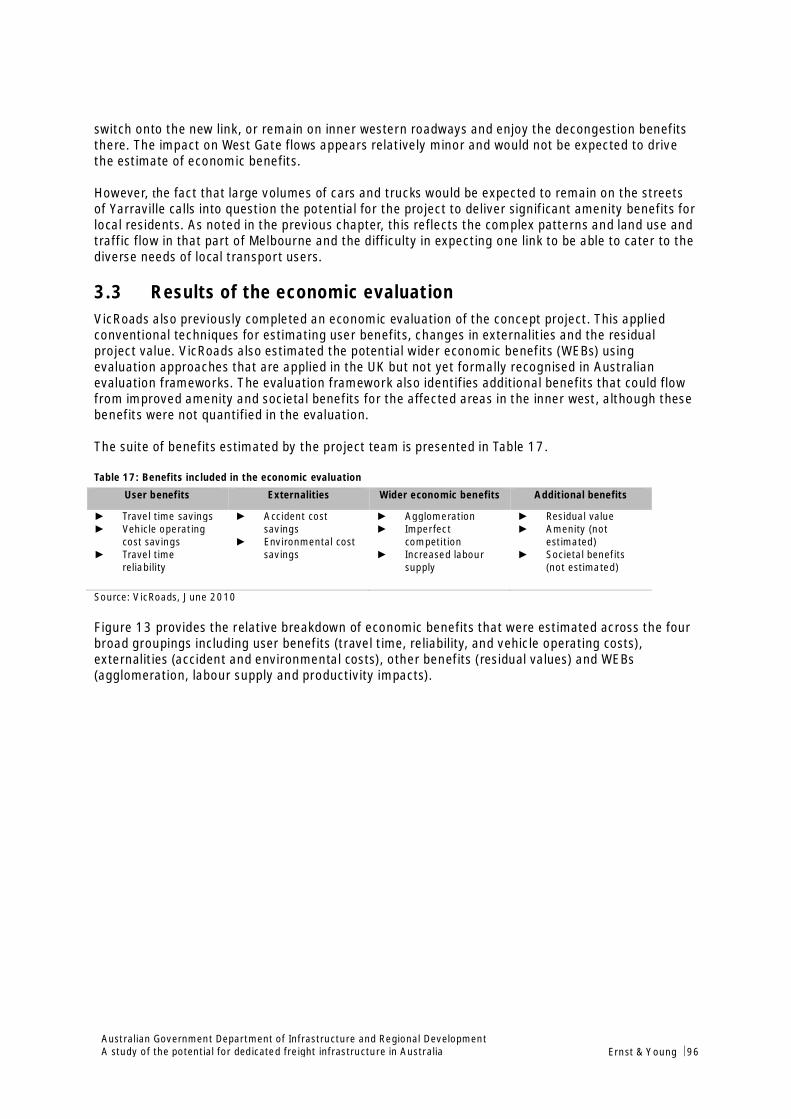
Australian Government Department of Infrastructure and Regional DevelopmentA study of the potential for dedicated freight infrastructure in Australia Ernst & Young ÷ 96
switch onto the new link, or remain on inner western roadways and enjoy the decongestion benefitsthere. The impact on West Gate flows appears relatively minor and would not be expected to drivethe estimate of economic benefits.
However, the fact that large volumes of cars and trucks would be expected to remain on the streetsof Yarraville calls into question the potential for the project to deliver significant amenity benefits forlocal residents. As noted in the previous chapter, this reflects the complex patterns and land use andtraffic flow in that part of Melbourne and the difficulty in expecting one link to be able to cater to thediverse needs of local transport users.
3.3 Results of the economic evaluationVicRoads also previously completed an economic evaluation of the concept project. This appliedconventional techniques for estimating user benefits, changes in externalities and the residualproject value. VicRoads also estimated the potential wider economic benefits (WEBs) usingevaluation approaches that are applied in the UK but not yet formally recognised in Australianevaluation frameworks. The evaluation framework also identifies additional benefits that could flowfrom improved amenity and societal benefits for the affected areas in the inner west, although thesebenefits were not quantified in the evaluation.
The suite of benefits estimated by the project team is presented in Table 17.
Table 17: Benefits included in the economic evaluation
User benefits Externalities Wider economic benefits Additional benefits
► Travel time savings► Vehicle operating
cost savings► Travel time
reliability
► Accident costsavings
► Environmental costsavings
► Agglomeration► Imperfect
competition► Increased labour
supply
► Residual value► Amenity (not
estimated)► Societal benefits
(not estimated)
Source: VicRoads, June 2010
Figure 13 provides the relative breakdown of economic benefits that were estimated across the fourbroad groupings including user benefits (travel time, reliability, and vehicle operating costs),externalities (accident and environmental costs), other benefits (residual values) and WEBs(agglomeration, labour supply and productivity impacts).
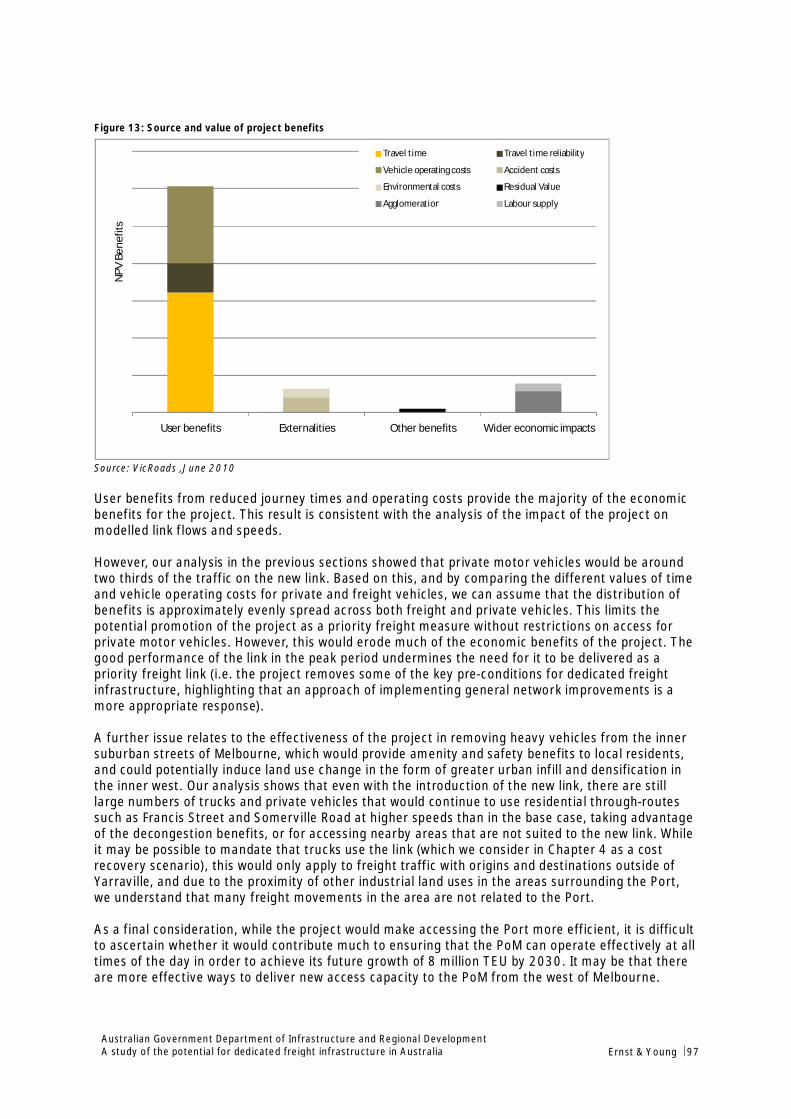
Australian Government Department of Infrastructure and Regional DevelopmentA study of the potential for dedicated freight infrastructure in Australia Ernst & Young ÷ 97
Figure 13: Source and value of project benefits
Source: VicRoads ,June 2010
User benefits from reduced journey times and operating costs provide the majority of the economicbenefits for the project. This result is consistent with the analysis of the impact of the project onmodelled link flows and speeds.
However, our analysis in the previous sections showed that private motor vehicles would be aroundtwo thirds of the traffic on the new link. Based on this, and by comparing the different values of timeand vehicle operating costs for private and freight vehicles, we can assume that the distribution ofbenefits is approximately evenly spread across both freight and private vehicles. This limits thepotential promotion of the project as a priority freight measure without restrictions on access forprivate motor vehicles. However, this would erode much of the economic benefits of the project. Thegood performance of the link in the peak period undermines the need for it to be delivered as apriority freight link (i.e. the project removes some of the key pre-conditions for dedicated freightinfrastructure, highlighting that an approach of implementing general network improvements is amore appropriate response).
A further issue relates to the effectiveness of the project in removing heavy vehicles from the innersuburban streets of Melbourne, which would provide amenity and safety benefits to local residents,and could potentially induce land use change in the form of greater urban infill and densification inthe inner west. Our analysis shows that even with the introduction of the new link, there are stilllarge numbers of trucks and private vehicles that would continue to use residential through-routessuch as Francis Street and Somerville Road at higher speeds than in the base case, taking advantageof the decongestion benefits, or for accessing nearby areas that are not suited to the new link. Whileit may be possible to mandate that trucks use the link (which we consider in Chapter 4 as a costrecovery scenario), this would only apply to freight traffic with origins and destinations outside ofYarraville, and due to the proximity of other industrial land uses in the areas surrounding the Port,we understand that many freight movements in the area are not related to the Port.
As a final consideration, while the project would make accessing the Port more efficient, it is difficultto ascertain whether it would contribute much to ensuring that the PoM can operate effectively at alltimes of the day in order to achieve its future growth of 8 million TEU by 2030. It may be that thereare more effective ways to deliver new access capacity to the PoM from the west of Melbourne.
User benefits Externalities Other benefits Wider economic impacts
NPV
Bene
fits
Travel time Travel time reliability
Vehicle operating costs Accident costs
Environmental costs Residual Value
Agglomeration Labour supply
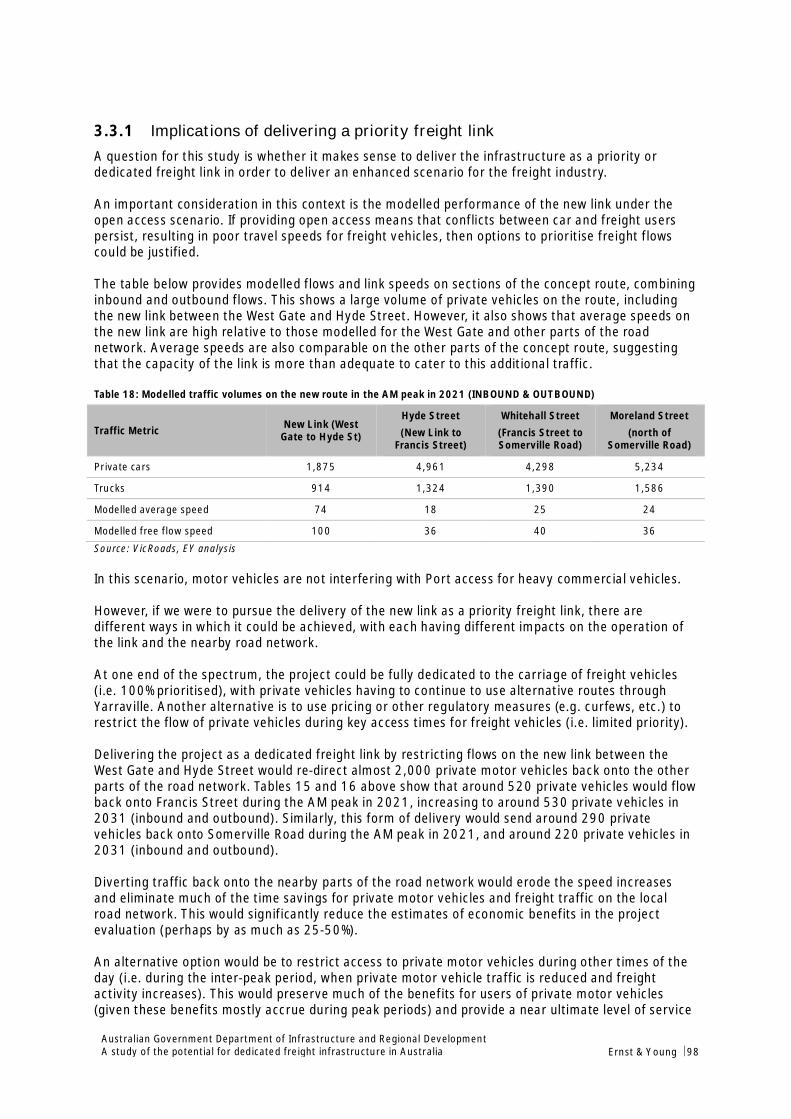
Australian Government Department of Infrastructure and Regional DevelopmentA study of the potential for dedicated freight infrastructure in Australia Ernst & Young ÷ 98
3.3.1 Implications of delivering a priority freight linkA question for this study is whether it makes sense to deliver the infrastructure as a priority ordedicated freight link in order to deliver an enhanced scenario for the freight industry.
An important consideration in this context is the modelled performance of the new link under theopen access scenario. If providing open access means that conflicts between car and freight userspersist, resulting in poor travel speeds for freight vehicles, then options to prioritise freight flowscould be justified.
The table below provides modelled flows and link speeds on sections of the concept route, combininginbound and outbound flows. This shows a large volume of private vehicles on the route, includingthe new link between the West Gate and Hyde Street. However, it also shows that average speeds onthe new link are high relative to those modelled for the West Gate and other parts of the roadnetwork. Average speeds are also comparable on the other parts of the concept route, suggestingthat the capacity of the link is more than adequate to cater to this additional traffic.
Table 18: Modelled traffic volumes on the new route in the AM peak in 2021 (INBOUND & OUTBOUND)
Traffic Metric New Link (WestGate to Hyde St)
Hyde Street(New Link to
Francis Street)
Whitehall Street(Francis Street toSomerville Road)
Moreland Street(north of
Somerville Road)
Private cars 1,875 4,961 4,298 5,234
Trucks 914 1,324 1,390 1,586
Modelled average speed 74 18 25 24
Modelled free flow speed 100 36 40 36
Source: VicRoads, EY analysis
In this scenario, motor vehicles are not interfering with Port access for heavy commercial vehicles.
However, if we were to pursue the delivery of the new link as a priority freight link, there aredifferent ways in which it could be achieved, with each having different impacts on the operation ofthe link and the nearby road network.
At one end of the spectrum, the project could be fully dedicated to the carriage of freight vehicles(i.e. 100% prioritised), with private vehicles having to continue to use alternative routes throughYarraville. Another alternative is to use pricing or other regulatory measures (e.g. curfews, etc.) torestrict the flow of private vehicles during key access times for freight vehicles (i.e. limited priority).
Delivering the project as a dedicated freight link by restricting flows on the new link between theWest Gate and Hyde Street would re-direct almost 2,000 private motor vehicles back onto the otherparts of the road network. Tables 15 and 16 above show that around 520 private vehicles would flowback onto Francis Street during the AM peak in 2021, increasing to around 530 private vehicles in2031 (inbound and outbound). Similarly, this form of delivery would send around 290 privatevehicles back onto Somerville Road during the AM peak in 2021, and around 220 private vehicles in2031 (inbound and outbound).
Diverting traffic back onto the nearby parts of the road network would erode the speed increasesand eliminate much of the time savings for private motor vehicles and freight traffic on the localroad network. This would significantly reduce the estimates of economic benefits in the projectevaluation (perhaps by as much as 25-50%).
An alternative option would be to restrict access to private motor vehicles during other times of theday (i.e. during the inter-peak period, when private motor vehicle traffic is reduced and freightactivity increases). This would preserve much of the benefits for users of private motor vehicles(given these benefits mostly accrue during peak periods) and provide a near ultimate level of service
Australian Government Department of Infrastructure and Regional DevelopmentA study of the potential for dedicated freight infrastructure in Australia Ernst & Young ÷ 99
for the freight sector. However, given the lower levels of car traffic during the inter-peak and off-peakperiods, it is likely that the operational performance of the new link would not be affected byexcessive car traffic, weakening the need for the link to be provided as a priority freight measureduring those times of the day.
These considerations demonstrate that through the implementation of the case study project as anopen access road link, some of the key pre-conditions for dedicated freight infrastructure are beingaddressed. For example, the proposal would:
► Reduce the extent of conflicts between freight and other users of the transport network
► Reduce general network congestion around the Port
► Improve community safety by reducing the number of heavy vehicles that are required totravel through nearby neighbourhoods
► Make the delivery of freight to/from the west of Melbourne more cost effective.
The effectiveness of the new ramps and street upgrades as demonstrated by the modelling resultsand CBA reduces the need for further measures to prioritise the new road link for freight vehicles.
A further consideration in determining the merits of providing the project as a dedicated freight linkis the potential impact on financial cost recovery through tolling or other cost recovery measures.This is explored in Chapter 4.
3.3.2 Relation to other planned major projectsWe have also considered how the case study project relates to the key planned major project for thewest of Melbourne – the East West Link (EWL). This is an important consideration as it may highlightwhether some of the problems to be addressed by the case study project could be addressed by thedelivery of EWL or other projects.
The East West Link is a cross-city road connection extending across Melbourne from the EasternFreeway to the Western Ring Road. The Victorian Government has committed to the delivery of theeastern section of the project (Eastern Freeway to CityLink), with construction due to commence inlate 2014.
The Victorian Government has identified the western section of East West Link as the next priorityproject to improve freight efficiency by providing a new major connection between the Port and keyindustrial centres in the west. This is anticipated to also reduce noise and air pollution in the westernsuburbs by providing a motorway option for trucks, and contribute to urban renewal in the west byproviding a safer environment for pedestrians and cyclists.
The Government has announced that detailed planning for the western section of the East West Linkwill be underway in 2014, with early works expected to be commenced by the end of 2015.

Australian Government Department of Infrastructure and Regional DevelopmentA study of the potential for dedicated freight infrastructure in Australia Ernst & Young ÷ 100
Figure 14: East West Link
Source: Linking Melbourne Authority
Consistent with the general approach to traffic modelling for all major transport projects, model runshave been carried out to test the impact of the case study in combination with East-West Link West.The results are presented in the table below for heavy vehicles.
Table 19: Impact of the project and East West Link West on heavy vehicle traffic in 2011, 2021 and 2031 (INBOUND +OUTBOUND)
PoM Access Route Francis St(between Williamstown & Hyde)
Somerville Road(between Williamstown & Hyde)
Model Option Trucks Change Trucks Change
2011
Base 486 406
Base + Case Study Project 284 -42% 213 -48%
Base + East West Link 316 -35% 215 -47%
Base + Case Study Project& EastWest Link 223 -54% 148 -64%
2021
Base 764 555
Base + Case Study Project 486 -36% 374 -33%
Base + East West Link 342 -55% 314 -43%
Base + Case Study Project& EastWest Link 281 -63% 163 -71%
2031
Base 808 699
Base + Case Study Project 580 -28% 489 -30%
Base + East West Link 321 -60% 311 -56%
Base + Case Study Project& EastWest Link 279 -65% 154 -78%
Source: VicRoads
The model predicts that East West Link West would have a significantly larger impact on truckvolumes in 2021 (45-55%) and 2031 (55-60%) than the case study project. This suggests that if thewestern part of East West Link is pursued by the Government, as current indications suggest wouldoccur over the longer term, then the case for also investing in the case study project and prioritisingthe link for freight vehicles would be further diminished. However, it is also noteworthy that investingin both would lead to a further reduction in truck volumes.
Australian Government Department of Infrastructure and Regional DevelopmentA study of the potential for dedicated freight infrastructure in Australia Ernst & Young ÷ 101
3.4 Summary findingsOur analysis of the traffic model results has shown that:
► The addition of the new link attracts both heavy and private vehicle traffic away from FrancisStreet and Somerville Road. This highlights that the new link would not be expected tooperate as a priority freight link unless some other supporting measures were put in place.These measures could include vehicle restrictions and/or tolling measures
► The large reductions in traffic on both Francis Street and Somerville Road result insignificant speed increases on Somerville Road and only modest increases on Francis Street.
► The introduction of the new link is only expected to have a small impact on flows and speedson the West Gate. Rather than improving the operation of this key arterial motorway, theproject is instead providing a bypass for congested lower level roads.
► We would expect the economic benefits of the project to be driven by the large speedincreases and resultant travel time savings for cars and vehicles that either switch onto thenew link, or remain on inner western roadways and enjoy the decongestion benefits there.The impact on West Gate flows appears relatively minor.
► The fact that, with surrounding land uses and freight movements to service business needs,large volumes of cars and trucks would be expected to remain on the streets of Yarravillecalls into question the potential for the project to deliver significant amenity benefits forlocal residents.
► Analysis of the performance of the new link shows that volumes are low compared tomodelled capacity. As such, the case for making this a dedicated freight link is difficult tojustify and risks eroding the benefits of the project. More moderate restrictions on privatemotor vehicle access could preserve much of the benefits, although they are also notnecessary given the good performance under the open access scenario.
Our analysis of the evaluation completed by VicRoads demonstrates that:
► User benefits from reduced journey times and operating costs provide the majority of theeconomic benefits for the project. This result is consistent with the analysis of the impact ofthe project on modelled link flows and speeds.
► However, the distribution of benefits is approximately evenly spread across both freight andprivate vehicles, reflecting the mixed use of the new link. This limits the potential promotionof the project as a priority freight measure without restrictions on access for private motorvehicles. This could potentially erode much of the economic benefits of the project and thegood performance of the link in the peak period undermines the need for it to be deliveredas a priority freight link.
► Even with the new link, there are still large numbers of trucks and private vehicles that wouldcontinue to use residential through-routes such as Francis Street and Somerville Road,taking advantage of the decongestion benefits that the project would provide, or foraccessing nearby areas that are not suited to the new link. While it may be possible tomandate that trucks use the link (which we consider in Chapter 4 as a cost recoveryscenario), this would only apply to freight traffic with origins and destinations outside ofYarraville, and we know that many freight movements in the area are not related to the Port.
► Given these issues, it is difficult to ascertain whether the project would make a materialcontribution to ensuring that the PoM can operate effectively at all times of the day in orderto achieve its future growth targets of 8 million TEU by 2030. It may be that there are moreeffective ways to deliver new access capacity to the PoM from the west of Melbourne. It isenvisaged that the directions outlined in the Victorian Government’s freight and logisticsplan, supported by national port and freight strategies and investments, will make ameaningful contribution to addressing these needs.
Australian Government Department of Infrastructure and Regional DevelopmentA study of the potential for dedicated freight infrastructure in Australia Ernst & Young ÷ 102
We have considered the potential impacts of delivering the project as a dedicated freight link:
► This would re-direct almost 2,000 private motor vehicles back onto the other parts of theroad network in the AM peak, including around 500 cars on Francis Street and around 300cars on Somerville Road.
► Diverting traffic back onto the nearby parts of the road network would erode the speedincreases and eliminate much of the time savings for private motor vehicles. This wouldsignificantly reduce the estimates of economic benefits in the evaluation (perhaps by asmuch as 25-50%).
► An alternative option would be to restrict access to private motor vehicles during other timesof the day (i.e. during the inter-peak period), when private motor vehicle traffic is reducedand freight activity generally increases across the network. However, it is likely that theoperational performance of the new link would not be significantly diminished during theinter-peak and off-peak periods under open access operating arrangements, furtherweakening the need for the link to be provided as a priority freight measure.
Finally, we considered the relationship of the project to the planned East West Link. This highlightedthat many of the perceived problems could also be addressed by that project, diminishing the needfor the case study project over the longer term.
Overall, while the underlying project could be expected to deliver strong user benefits, it is difficultto see how it could be delivered as a priority freight measure without undermining these benefits.
This could reflect a number of factors:
► The patterns of demand in the inner-west of Melbourne are diverse and involve a number oforigin-destination flows that are not related to the Port, meaning that it is not possible todisentangle these flows and target freight demand.
► The design of the project was not initially conceived to prioritise freight flows, and perhaps adifferent design linked to these objectives could prioritise demand and preserve the widerbenefits of the project.
A further consideration is whether it would be possible to deliver the project with a level of costrecovery from users. This is explored in the next chapter.
Australian Government Department of Infrastructure and Regional DevelopmentA study of the potential for dedicated freight infrastructure in Australia Ernst & Young ÷ 103
4. Financial assessment
4.1 IntroductionThe purpose of this assessment is to provide an indication of the commercial feasibility of the casestudy project. The outputs of this analysis would also inform which types of commercial deliverymodels have the potential to efficiently deliver the project objectives and to align with the State’spreferred risk allocation for this type of project.
This analysis assumes that either the State or a private investor (or investor group) funds the capitalcosts and charges users for road access in order to recover those costs. It is further assumed thatthe project is funded on a standalone basis (i.e. this assessment ignored financing cash flows). Theanalysis does not consider any cash flows or strategic benefits that may derive from integrating theproject with other parts of the wider network.
In order to generate a measurable outcome this assessment is underpinned by a set of assumptionsin relation to costs and revenue.
Cost assumptions are sourced from VicRoads. Revenue assumptions were generated by analysingtraffic modelling data provided to EY for the region immediately surrounding the project.
We have used that data to construct and analyse a hypothetical scenario whereby the project istolled and a curfew on commercial vehicles is applied to the local streets in the Yarraville andFootscray region in order to redirect trucks to the new link or to an alternative route to the north. Wethen take the analysis a step further by considering the implications of restricting access to privatemotor vehicles through the delivery of a dedicated freight scenario.
The cost and revenue projections we have developed are for the purpose of this case study scenarioand carry a number of limitations. The cash flow model has been developed in good faith and in thebelief that the information provided to us was not false or misleading. We have relied upon the inputsand assumptions provided to us. We have not audited or reviewed any of the inputs or assumptionsprovided to us. Accordingly, we express no opinion as to the accuracy, adequacy, completeness orreasonableness of the assumptions upon which the model is based. We note that it is usually thecase that some events and circumstances do not occur as expected or are not anticipated.Therefore, actual results will almost always differ from the forecasts and such differences may bematerial.
4.2 Revenue assumptions4.2.1 IntroductionThe case study project includes the provision of a series of network improvements and othermeasures aimed at reducing the number of freight vehicles on residential streets in Yarraville in theinner west of Melbourne.
The traffic modelling and benefits analysis concluded that the project would benefit both private andcommercial vehicles through travel time and vehicle operating cost savings.
On that basis, the analysis assumes that to recover some (if not all) of the capital expenditure andoperating costs incurred, the users of the new link (i.e. private and commercial vehicles) will becharged. This section describes the revenue assumptions we have applied.
Australian Government Department of Infrastructure and Regional DevelopmentA study of the potential for dedicated freight infrastructure in Australia Ernst & Young ÷ 104
4.2.2 Curfew assumptionThe project route is designed to remove trucks from Yarraville and Footscray. Previous work byVicRoads nominated the extension of the current truck curfew in the inner west to maximise theutilisation of the new route by commercial vehicles (i.e. so that the curfews apply at all times of theday and apply to all heavy vehicles).
The current truck curfew arrangements in Yarraville are as follows:129
► Francis Street: 8PM to 6AM – Monday to Saturday, 1PM to 6AM – Saturday to Monday
► Hyde Street: 24 hours a day, 7 days a week
► Somerville Road (Geelong Road to Hyde Street): 8PM to 6AM – Monday to Saturday, 1PM to6AM – Saturday to Monday
In line with the previous work by VicRoads, we have assumed that these curfews would be extendedacross the whole day in order to test the financial viability of the case study project.
4.2.2.1 Curfew impact
Inbound traffic
Inbound traffic refers to vehicles coming from the west and entering the project route via a rampcoming off the West Gate Freeway and driving towards the PoM precinct.
It is assumed that given the project objectives, the curfew would only apply to non-local commercialvehicles. As such a residual number of trucks will still be circulating on Francis Street and SomervilleRoad (and other local roads) to service local businesses’ needs.
On that basis the inbound traffic assumed in this financial assessment is based on the trafficmodelling for the new link (i.e. without a curfew being applied) plus a proportion of the truck trafficthat model predicts would remain on routes such as Francis Street and Somerville Road.
Table 20 presents the estimated impact that the Curfew would have on inbound traffic volumes onthe new link during the morning peak (7-9 AM). Our assumptions in relation to expansion of demandfrom peak to daily and annual estimates are based on car factors used in recent projects. Weacknowledge that freight movements are different from private vehicle movements and require thedevelopment of unique demand expansion factors. However, for the purpose of this assessment, wethink that the factors that we have applied provide a sufficient daily and annual traffic profile.
129 VicRoads, http://www.vicroads.vic.gov.au/Home/Moreinfoandservices/HeavyVehicles/RouteInformation/TruckCurfews.htm
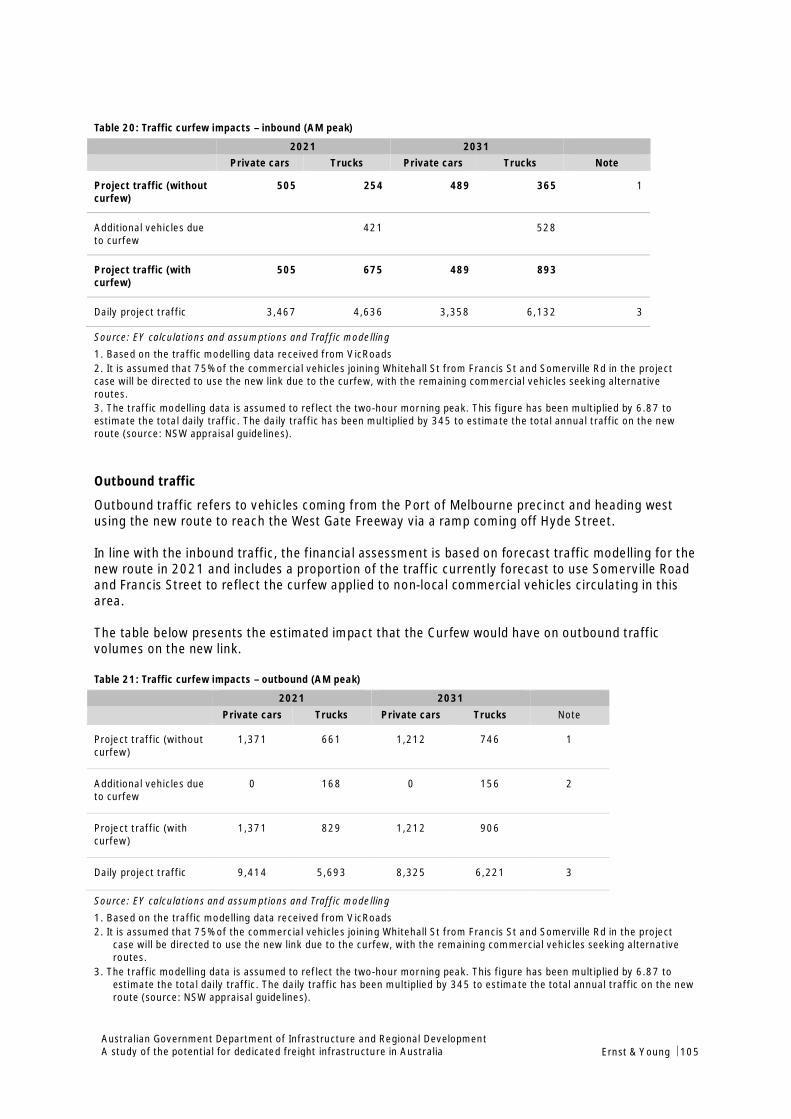
Australian Government Department of Infrastructure and Regional DevelopmentA study of the potential for dedicated freight infrastructure in Australia Ernst & Young ÷ 105
Table 20: Traffic curfew impacts – inbound (AM peak)
2021 2031Private cars Trucks Private cars Trucks Note
Project traffic (withoutcurfew)
505 254 489 365 1
Additional vehicles dueto curfew
421 528
Project traffic (withcurfew)
505 675 489 893
Daily project traffic 3,467 4,636 3,358 6,132 3
Source: EY calculations and assumptions and Traffic modelling1. Based on the traffic modelling data received from VicRoads2. It is assumed that 75% of the commercial vehicles joining Whitehall St from Francis St and Somerville Rd in the projectcase will be directed to use the new link due to the curfew, with the remaining commercial vehicles seeking alternativeroutes.3. The traffic modelling data is assumed to reflect the two-hour morning peak. This figure has been multiplied by 6.87 toestimate the total daily traffic. The daily traffic has been multiplied by 345 to estimate the total annual traffic on the newroute (source: NSW appraisal guidelines).
Outbound traffic
Outbound traffic refers to vehicles coming from the Port of Melbourne precinct and heading westusing the new route to reach the West Gate Freeway via a ramp coming off Hyde Street.
In line with the inbound traffic, the financial assessment is based on forecast traffic modelling for thenew route in 2021 and includes a proportion of the traffic currently forecast to use Somerville Roadand Francis Street to reflect the curfew applied to non-local commercial vehicles circulating in thisarea.
The table below presents the estimated impact that the Curfew would have on outbound trafficvolumes on the new link.
Table 21: Traffic curfew impacts – outbound (AM peak)
2021 2031Private cars Trucks Private cars Trucks Note
Project traffic (withoutcurfew)
1,371 661 1,212 746 1
Additional vehicles dueto curfew
0 168 0 156 2
Project traffic (withcurfew)
1,371 829 1,212 906
Daily project traffic 9,414 5,693 8,325 6,221 3
Source: EY calculations and assumptions and Traffic modelling1. Based on the traffic modelling data received from VicRoads2. It is assumed that 75% of the commercial vehicles joining Whitehall St from Francis St and Somerville Rd in the project
case will be directed to use the new link due to the curfew, with the remaining commercial vehicles seeking alternativeroutes.
3. The traffic modelling data is assumed to reflect the two-hour morning peak. This figure has been multiplied by 6.87 toestimate the total daily traffic. The daily traffic has been multiplied by 345 to estimate the total annual traffic on the newroute (source: NSW appraisal guidelines).

Australian Government Department of Infrastructure and Regional DevelopmentA study of the potential for dedicated freight infrastructure in Australia Ernst & Young ÷ 106
Summary
The enforcement of a curfew has the potential to direct a significant amount of commercial trafficonto the new link.
In the AM peak in 2021, the curfew would add around 420 trucks inbound and around 168 trucksoutbound. In 2031, an additional 528 inbound trucks and 156 outbound trucks are estimated.
This new level of traffic represents the potential market for the new link. The next section considersthe level of tolls that could be applied for private and commercial vehicles.
4.2.3 Tolling assumptions
The project provides improved truck access between the west and the PoM, providing scope forgrowing freight vehicles to access the Port from the west 24 hours a day. Chapter 3 showed howthese benefits would translate into travel time savings and reduction in operating costs for freightoperators and private vehicle owners.
Reflecting the benefits flowing to the users of the project, it is assumed that a toll could be chargedto recover some (if not all) of the capital expenditure and operating costs incurred.
An important consideration in relation to travel time savings and users’ willingness to pay to achievethem is the relativity of the travel time saving to the overall journey time. In the context of a longertrip, a given time saving is less significant than on a shorter trip. Also on a longer trip, smallfluctuations in the reliability of travel time are more easily managed.
A hypothetical toll tipping point value has been calculated based on the time savings achieved on theproject link compared to the best free alternative route.
The table below presents the estimated cost saving (both in time and distance) the project wouldgenerate for commercial motorists. In accordance with industry guidance, an estimated value hasbeen applied both to time and distance savings in order to compare the cost of travel using theproject and the best free alternative route.
Based on this comparison, the hypothetical maximum toll value would be around $5.50 forcommercial vehicles. Due to the uncertainties in estimating accurate marginal toll levels, we havetaken the conservative approach of assuming a toll of $5.00 for commercial vehicles.
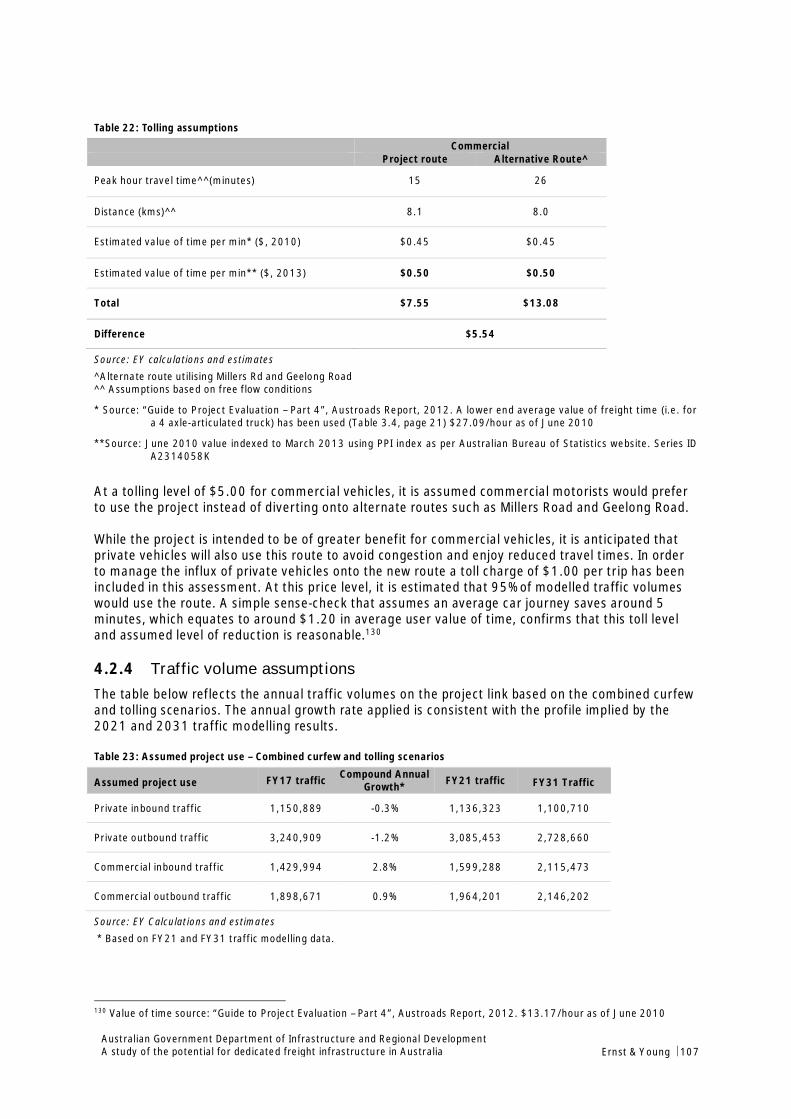
Australian Government Department of Infrastructure and Regional DevelopmentA study of the potential for dedicated freight infrastructure in Australia Ernst & Young ÷ 107
Table 22: Tolling assumptions
CommercialProject route Alternative Route^
Peak hour travel time^^(minutes) 15 26
Distance (kms)^^ 8.1 8.0
Estimated value of time per min* ($, 2010) $0.45 $0.45
Estimated value of time per min** ($, 2013) $0.50 $0.50
Total $7.55 $13.08
Difference $5.54
Source: EY calculations and estimates^Alternate route utilising Millers Rd and Geelong Road^^ Assumptions based on free flow conditions
* Source: “Guide to Project Evaluation – Part 4”, Austroads Report, 2012. A lower end average value of freight time (i.e. fora 4 axle-articulated truck) has been used (Table 3.4, page 21) $27.09/hour as of June 2010
**Source: June 2010 value indexed to March 2013 using PPI index as per Australian Bureau of Statistics website. Series IDA2314058K
At a tolling level of $5.00 for commercial vehicles, it is assumed commercial motorists would preferto use the project instead of diverting onto alternate routes such as Millers Road and Geelong Road.
While the project is intended to be of greater benefit for commercial vehicles, it is anticipated thatprivate vehicles will also use this route to avoid congestion and enjoy reduced travel times. In orderto manage the influx of private vehicles onto the new route a toll charge of $1.00 per trip has beenincluded in this assessment. At this price level, it is estimated that 95% of modelled traffic volumeswould use the route. A simple sense-check that assumes an average car journey saves around 5minutes, which equates to around $1.20 in average user value of time, confirms that this toll leveland assumed level of reduction is reasonable.130
4.2.4 Traffic volume assumptionsThe table below reflects the annual traffic volumes on the project link based on the combined curfewand tolling scenarios. The annual growth rate applied is consistent with the profile implied by the2021 and 2031 traffic modelling results.
Table 23: Assumed project use – Combined curfew and tolling scenarios
Assumed project use FY17 traffic Compound AnnualGrowth* FY21 traffic FY31 Traffic
Private inbound traffic 1,150,889 -0.3% 1,136,323 1,100,710
Private outbound traffic 3,240,909 -1.2% 3,085,453 2,728,660
Commercial inbound traffic 1,429,994 2.8% 1,599,288 2,115,473
Commercial outbound traffic 1,898,671 0.9% 1,964,201 2,146,202
Source: EY Calculations and estimates * Based on FY21 and FY31 traffic modelling data.
130 Value of time source: “Guide to Project Evaluation – Part 4”, Austroads Report, 2012. $13.17/hour as of June 2010
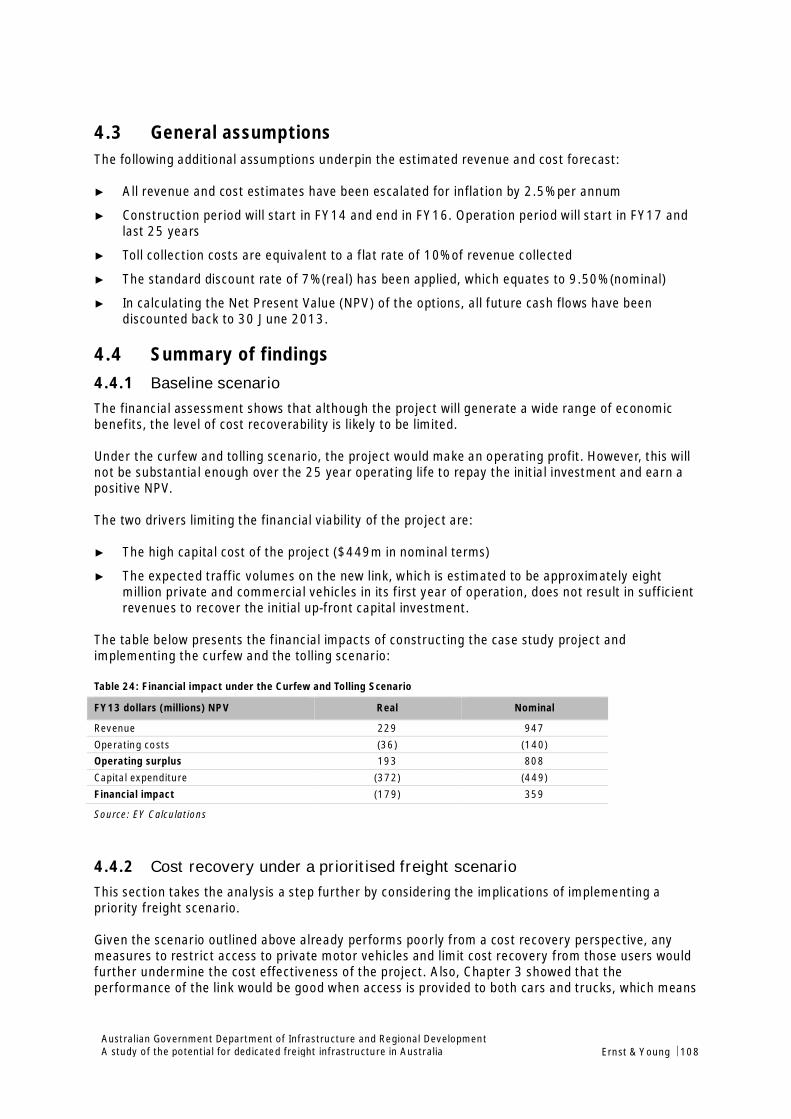
Australian Government Department of Infrastructure and Regional DevelopmentA study of the potential for dedicated freight infrastructure in Australia Ernst & Young ÷ 108
4.3 General assumptionsThe following additional assumptions underpin the estimated revenue and cost forecast:
► All revenue and cost estimates have been escalated for inflation by 2.5% per annum
► Construction period will start in FY14 and end in FY16. Operation period will start in FY17 andlast 25 years
► Toll collection costs are equivalent to a flat rate of 10% of revenue collected
► The standard discount rate of 7% (real) has been applied, which equates to 9.50% (nominal)
► In calculating the Net Present Value (NPV) of the options, all future cash flows have beendiscounted back to 30 June 2013.
4.4 Summary of findings4.4.1 Baseline scenarioThe financial assessment shows that although the project will generate a wide range of economicbenefits, the level of cost recoverability is likely to be limited.
Under the curfew and tolling scenario, the project would make an operating profit. However, this willnot be substantial enough over the 25 year operating life to repay the initial investment and earn apositive NPV.
The two drivers limiting the financial viability of the project are:
► The high capital cost of the project ($449m in nominal terms)
► The expected traffic volumes on the new link, which is estimated to be approximately eightmillion private and commercial vehicles in its first year of operation, does not result in sufficientrevenues to recover the initial up-front capital investment.
The table below presents the financial impacts of constructing the case study project andimplementing the curfew and the tolling scenario:
Table 24: Financial impact under the Curfew and Tolling Scenario
FY13 dollars (millions) NPV Real Nominal
Revenue 229 947Operating costs (36) (140)Operating surplus 193 808Capital expenditure (372) (449)Financial impact (179) 359
Source: EY Calculations
4.4.2 Cost recovery under a prioritised freight scenarioThis section takes the analysis a step further by considering the implications of implementing apriority freight scenario.
Given the scenario outlined above already performs poorly from a cost recovery perspective, anymeasures to restrict access to private motor vehicles and limit cost recovery from those users wouldfurther undermine the cost effectiveness of the project. Also, Chapter 3 showed that theperformance of the link would be good when access is provided to both cars and trucks, which means
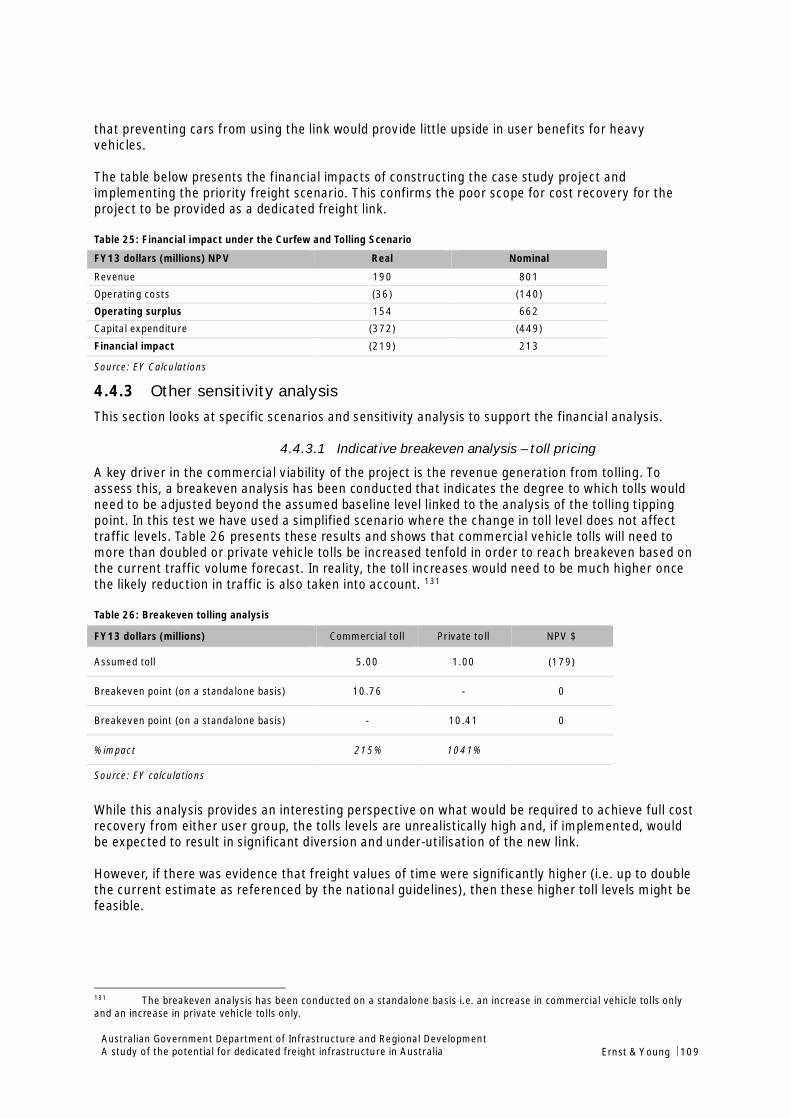
Australian Government Department of Infrastructure and Regional DevelopmentA study of the potential for dedicated freight infrastructure in Australia Ernst & Young ÷ 109
that preventing cars from using the link would provide little upside in user benefits for heavyvehicles.
The table below presents the financial impacts of constructing the case study project andimplementing the priority freight scenario. This confirms the poor scope for cost recovery for theproject to be provided as a dedicated freight link.
Table 25: Financial impact under the Curfew and Tolling Scenario
FY13 dollars (millions) NPV Real Nominal
Revenue 190 801
Operating costs (36) (140)
Operating surplus 154 662
Capital expenditure (372) (449)
Financial impact (219) 213
Source: EY Calculations
4.4.3 Other sensitivity analysisThis section looks at specific scenarios and sensitivity analysis to support the financial analysis.
4.4.3.1 Indicative breakeven analysis – toll pricing
A key driver in the commercial viability of the project is the revenue generation from tolling. Toassess this, a breakeven analysis has been conducted that indicates the degree to which tolls wouldneed to be adjusted beyond the assumed baseline level linked to the analysis of the tolling tippingpoint. In this test we have used a simplified scenario where the change in toll level does not affecttraffic levels. Table 26 presents these results and shows that commercial vehicle tolls will need tomore than doubled or private vehicle tolls be increased tenfold in order to reach breakeven based onthe current traffic volume forecast. In reality, the toll increases would need to be much higher oncethe likely reduction in traffic is also taken into account. 131
Table 26: Breakeven tolling analysis
FY13 dollars (millions) Commercial toll Private toll NPV $
Assumed toll 5.00 1.00 (179)
Breakeven point (on a standalone basis) 10.76 - 0
Breakeven point (on a standalone basis) - 10.41 0
% impact 215% 1041%
Source: EY calculations
While this analysis provides an interesting perspective on what would be required to achieve full costrecovery from either user group, the tolls levels are unrealistically high and, if implemented, wouldbe expected to result in significant diversion and under-utilisation of the new link.
However, if there was evidence that freight values of time were significantly higher (i.e. up to doublethe current estimate as referenced by the national guidelines), then these higher toll levels might befeasible.
131 The breakeven analysis has been conducted on a standalone basis i.e. an increase in commercial vehicle tolls onlyand an increase in private vehicle tolls only.
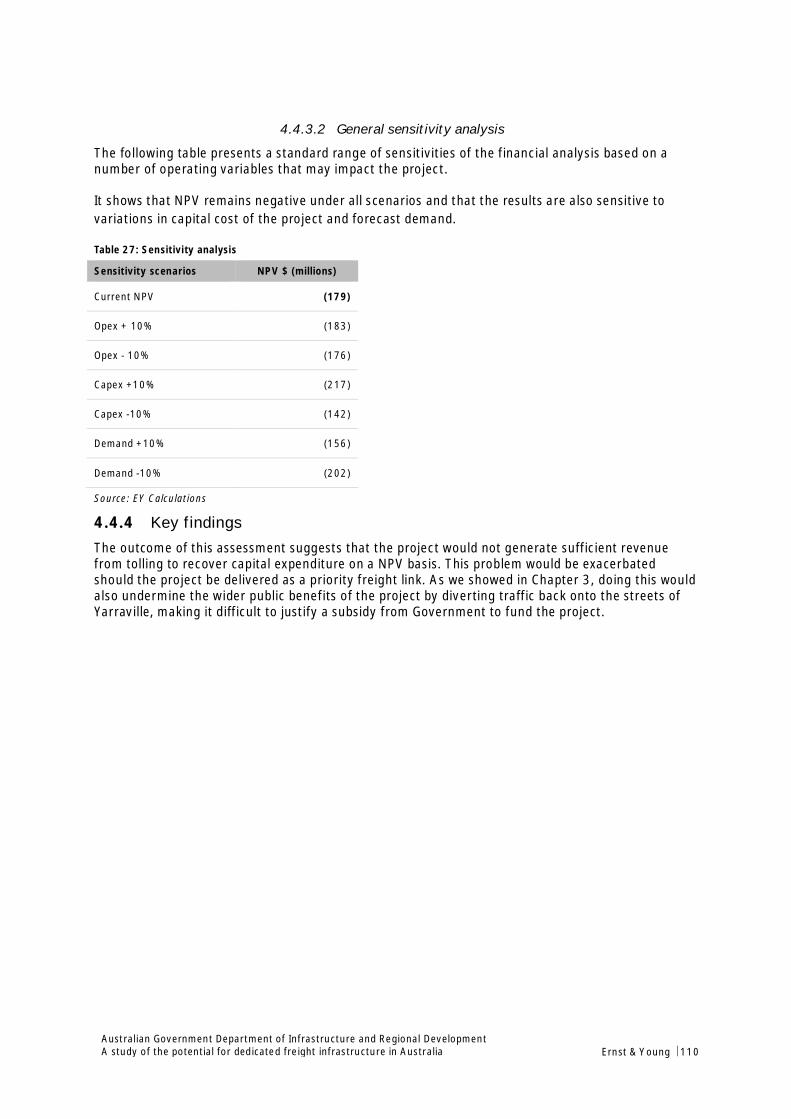
Australian Government Department of Infrastructure and Regional DevelopmentA study of the potential for dedicated freight infrastructure in Australia Ernst & Young ÷ 110
4.4.3.2 General sensitivity analysis
The following table presents a standard range of sensitivities of the financial analysis based on anumber of operating variables that may impact the project.
It shows that NPV remains negative under all scenarios and that the results are also sensitive tovariations in capital cost of the project and forecast demand.
Table 27: Sensitivity analysis
Sensitivity scenarios NPV $ (millions)
Current NPV (179)
Opex + 10% (183)
Opex - 10% (176)
Capex +10% (217)
Capex -10% (142)
Demand +10% (156)
Demand -10% (202)
Source: EY Calculations
4.4.4 Key findingsThe outcome of this assessment suggests that the project would not generate sufficient revenuefrom tolling to recover capital expenditure on a NPV basis. This problem would be exacerbatedshould the project be delivered as a priority freight link. As we showed in Chapter 3, doing this wouldalso undermine the wider public benefits of the project by diverting traffic back onto the streets ofYarraville, making it difficult to justify a subsidy from Government to fund the project.

Australian Government Department of Infrastructure and Regional DevelopmentA study of the potential for dedicated freight infrastructure in Australia Ernst & Young ÷ 111
5. Market views and potential participation
5.1 Introduction and ScopeA key component of this stage of our study on dedicated freight infrastructure involves gauging thepotential level of market interest from the private sector in delivering the project, as well asunderstanding the potential to involve users and other project beneficiaries in funding the project.
Organisations identified as market participants in the supply of infrastructure can be considered asthose that provide goods and services and those that provide finance. The former represent thedesigners, builders and operational and maintenance service providers that contribute to the project.The latter group include debt, potential project sponsors and equity financiers. More traditionalmethods of procurement will often involve a combination of private goods and services, with thepublic sector funding the project. Alternative methods of financing infrastructure projects utiliseprivate sector debt and equity, such as Public Private Partnerships (PPPs).
Other important market participants include the potential customers that will want to use andbenefit from available infrastructure. As we have seen from the analysis above, this includes thefreight sector, and, in particular, those using heavy vehicles in the movement of containers andother freight to/from the PoM. Private vehicle owners are also important market participants iftolling scenarios are to be considered.
Understanding the benefits that a project will provide to its customers is an important considerationwhen evaluating their potential willingness to pay for infrastructure use. For example, if benefits arelow and there are alternative options they can use, then the scope for cost recovery through usercharges would be limited. A further consideration relates to any potential operating restrictions,such as curfews or other measures that restrict the choices of infrastructure users. Unless thebenefits of the project can be demonstrated, the industry may resist or undermine itsimplementation.
Other beneficiaries of the project could also include those that do not actually use the infrastructure.For example, in this case study project, nearby residents would receive the benefit of having fewertrucks on local streets, and the businesses that rely on the efficient and growing operation of thePoM over the longer term could benefit through the connectivity the project would provide and thereduced conflict with residents.
Given the context (above), the scope of our analysis includes:
► a general discussion of the key factors that influence the market’s appetite for participation andinvestment in major transport infrastructure projects;
► the market’s current views and perspectives regarding those key factors based upon EY’sinvolvement in a range of formal and informal market sounding exercises over the last 12 to 24months; and
► how the freight industry may perceive the project and the issues associated with the provisionof funding support to private investors and/or government.
Based on these considerations, we then outline some conclusions for the case study project and itspotential to be delivered through alternative delivery and funding models.
Australian Government Department of Infrastructure and Regional DevelopmentA study of the potential for dedicated freight infrastructure in Australia Ernst & Young ÷ 112
5.2 Private Finance and PPPsA primary consideration for the delivery of priority freight infrastructure is whether there is scopefor it to be provided in full by the market or whether there is a role for PPPs in achieving betteroutcomes in infrastructure delivery.
As we have seen from the previous analysis, the case study would not be something that could beimplemented and funded through user charges alone, and it is difficult to see how the market wouldwant to provide the project on its own. The potential for it to deliver welfare benefits beyond thosethat would accrue to the users of the project suggest that some level of government intervention isjustified, potentially in partnership with the private sector. A further consideration is whetheralternative funding models involving a wider mix of project stakeholders could be found, such as withthe PoM and/or the local community. These could be pursued if those beneficiaries would be willingto pay to receive the benefits the project would deliver.
5.2.1 PPP value driversThe utilisation of private sector finance is suited where the project represents a significant upfrontcost to the State (which may ordinarily be budget constrained), combined with achievableefficiencies, optimal risk allocation and value for money through adopting a whole-of-life approach tocosting. PPP delivery is typically more appropriate for projects that require service delivery thatextends beyond the completion of asset construction.
The Infrastructure Australia National PPP Guidelines provide an outline of the key value for moneydrivers of the PPP model. Projects that may be suitable for delivery incorporating private sectorfinance will typically exhibit value when compared to a public sector delivery of a project via some orall of the following characteristics:
► Complex risk profile and opportunity for risk transfer
► Whole-of-life costing
► Innovation
► Measurable outputs
► Asset utilisation
► Better integration of design, construction and operational requirements
► Competitive process.
Based on the consideration of these value for money drivers, it is difficult to identify the ways inwhich a PPP model would be of significant benefit for the case study. The project does not constitutean overly complex infrastructure investment compared to other transport projects that are deliveredusing the PPP model. There also appears to be little scope for innovation in operations and whole oflife costing.
However, should the government pursue the delivery of the project as a tolled link, then there maybe scope to deliver it through an ‘availability PPP’ where a private entity is compensated for theupfront investment costs through a mix of toll revenue and an availability payment regime providedby government.
5.2.2 Factors affecting market interestThe private sectors’ interest in public transport infrastructure projects will be guided by theirassessment of risk and achievement of an appropriate return commensurate to those risks.
Australian Government Department of Infrastructure and Regional DevelopmentA study of the potential for dedicated freight infrastructure in Australia Ernst & Young ÷ 113
In relation to the interest of the private sector to invest in public transport infrastructure under PPPmodels, EY’s interactions / soundings with the market have identified the following recurrent factorswhich influence the market’s appetite to participate in procurement processes and invest:
► Risk Transfer (Demand)
► Market Capacity
► Financing – Size and Terms
► Quality of Government Interaction and Planning
► Procurement Process Investment (Time and Cost)
► Political Risk.
The remainder of this section provides our high level assessment of market perspectives on thesekey factors.
5.2.2.1 Risk transfer (demand)
The market’s appetite in taking demand risk on toll road projects can only be assessed on a case-by-case basis which will be underpinned by the market’s assessment of traffic forecasts, project cost /complexity, the ability for toll revenue to recover construction, operating and financing costs and theextent of risk sharing offered by the State.
There is a heightened concern at present, amongst financiers and others in the toll roaddevelopment sector, concerning the transfer of traffic risk to the private sector. This concern hasarisen due to the significant financial losses flowing from recent toll roads in Sydney and Brisbanethat have not met traffic expectations.
The financial assessment suggests that toll revenue would not be sufficient to recover all ofconstruction and operating costs. As such full risk transfer based on acceptable toll price would notbe viable under a standard BOOT model. We expect that private sector would seek a more provendemand profile in order to accept some demand risk.
Based on market perspectives, an availability PPP may be more suitable for the case study projectshould the State wish to involve the private sector.
5.2.2.2 Market capacity
We expect the market to have adequate expertise and capacity to construct and maintain thisproject.
The size of project packages has been a key issue in the market in recent years. However, the currentcost estimate for the case study suggests that most of well-established and reputable organisationshave the capacity to undertake this Project.
5.2.2.3 Financing – size and terms
At a construction cost of approximately $449 million (May 2013) the finance market should be ableto raise finance (if the project is deemed to be bankable). However, should the State elect to toll thenew link, the size of financing offered by the private sector would have to be commensurate with thepotential tolling revenue.
5.2.2.4 Quality of Government Interaction and Planning
The Victorian Government and its related road transport agencies have a strong track record ofprocuring complex road infrastructure with the private sector across a range of procurement models.
Australian Government Department of Infrastructure and Regional DevelopmentA study of the potential for dedicated freight infrastructure in Australia Ernst & Young ÷ 114
We expect the market would be interested in a procurement process managed by the VictorianGovernment.
5.2.2.5 Procurement Process Investment (Time and Cost)
We expect potential market participants would request that all (or part) of bidding costs would bereimbursed based on recent projects that have set precedents (e.g. North West Rail Link, NewZealand PPPs).
5.2.2.6 Political Risk
The current Victorian Government has shown a preference for the East West Link project as a meansto relieve congestion in Melbourne and enable improved access to the Port of Melbourne precinct. Assuch the lack of political support for the project may have a negative impact on the market’sperception of this risk.
5.3 Freight industry perspectivesThe relevant participants in the freight industry that would be affected by the implementation ofdedicated road freight infrastructure include the Port of Melbourne Corporation (PoMC), asdeveloper and manager of the Port, and the array of road freight operators that deliver containersbetween the Port, the west of Melbourne and beyond.
5.3.1.1 Port of Melbourne Corporation
PoMC is responsible for the sustainable development and management of the Port. In striving tofulfil its role of growing the economic prosperity and social and environmental wellbeing, the PoMChas identified a series of goals to guide its actions. Their high level goals are to achieve:
► Efficient and high quality facilities and services within a competitive environment
► Integration of the port with land transport systems
► Trade and trade-related business facilitation and expansion
► Sustainable financial performance
► A shared port-city vision for sustainable growth and prosperity.
In line with these goals, the PoMC is taking an increasingly active role in recent years in supportingthe strategic planning and integration of the Port with the planning for the State’s transportnetwork. The Port also played a lead role in the channel deepening project and is responsible formanaging the interfaces with nearby land uses.
Given this, we would anticipate that the PoMC would be supportive of proposals aimed at enhancingaccess to and from the Port gate. A key consideration for the PoMC is the extent to which anyproposal is seen to meet the objective of a better connected Port.
In addition, while the Port is becoming more integrated with State transport planning activities, weare yet to see it take a direct role in identifying and funding landside transport infrastructureproposals such as the proposed concept project. Instead, the Port has been able to share thebenefits of the State’s ongoing program of improvements to the strategic road and rail networks,which is enhanced by the Port’s proximity to the city’s CBD. However, as transport congestioncontinues to grow, we may be reaching the point where the Port takes a more direct role ininfrastructure development so that the Port can continue to exist in its current location withoutexcessive conflict with nearby land uses and complex patterns of transport congestion.
However, for this case study, there are questions around the capacity of the project to deliversufficient value to the Port.

Australian Government Department of Infrastructure and Regional DevelopmentA study of the potential for dedicated freight infrastructure in Australia Ernst & Young ÷ 115
5.3.1.2 Road freight operators
Road freight operators play a critical role in connecting supply chains to/from the PoM. As we haveseen, the majority of freight that is moved through the Port is linked to destinations in and aroundMelbourne, making it highly suited to road haulage instead of rail.
The case study project has the potential to improve the efficiency of freight movements between thePort and the western parts of Melbourne and beyond, which would be of significant value for theindustry.
However, using approaches to delivering and funding the case study project that claw back some ofthat industry value (i.e. through user charges or other funding mechanisms), could risk losing theindustry’s support for the project and, if tolls are excessive, undermine the effectiveness of theproject in meeting its objectives for industry growth.
The example we have provided in this case study includes a toll on heavy and private vehicles, andthe imposition of a curfew on Yarraville streets for heavy vehicles accessing the Port. In doing this,we have attempted to set the tolls at a level commensurate with the user benefits of the project.However, that may not be how the tolls are perceived by users.
5.4 Key findings – Implications for the Case Study ProjectThe market’s interest in delivering this project would be dependent upon how the State structuresand procures the project. Based on our understanding of the market, three procurement modelsappear to be suitable for the Project. These models are as follows:
► State Funded Design and Construct - We consider that the construction market would showstrong interest in this procurement model. We assume a State Government authority such asVicRoads would undertake maintenance.
► Availability Style PPP – While we consider the market would respond positively to the Stateretaining patronage risk under this model, the market’s interest may be tempered by the highbidding costs relative to the value of the project (considered small by comparison to recentlyprocured road PPP projects). In addition, in this instance, a PPP is unlikely to demonstrate valuefor money from the State’s perspective.
► Availability Style PPP followed by a sale of tolling rights – The market’s interest is uncertain atthis stage and would be dependent upon traffic demand and its assessment of risk and likelyreturns. However, this type of model is currently being tested by the Queensland governmentunder the Legacy Way project and recent market sounding processes suggest this model hasthe potential to attract interest from the market.
The views of the freight industry, including the PoMC and road freight forwarders, would depend onthe benefits the project provides, set against the scope of any cost recovery measures such as usertolls or direct contributions. As the benefits of the project are spread across different users and tolandowners in nearby suburbs, the industry would not support fully funding the delivery of theproject. Dedicating the link to heavy vehicles could alter that position to some degree, but as wehave shown, the level of demand for the link would not provide enough toll revenue to pay for itsconstruction.
Australian Government Department of Infrastructure and Regional DevelopmentA study of the potential for dedicated freight infrastructure in Australia Ernst & Young ÷ 116
6. Key findings of this case study
6.1 Our approachThis case study is being developed to enhance our understanding of the conditions that justify thedelivery of dedicated freight transport infrastructure to serve Australia’s major container ports.
The Stage 1 Report identified a set of principles for considering dedicated and priority freightinfrastructure. The study found that there is a range of demand and supply factors that drive theviability of dedicated and priority fright infrastructure.
Principles of demand include:
► The presence of conflicts between freight and other users of the transport network
► The size of the freight task
► Distances that freight movements are required to travel
► General network congestion around ports and other key freight centres
► Land use planning considerations
► Amenity issues
► Safety and environmental concerns
► Industry demand and willingness to pay for infrastructure.
Principles of supply include:
► Capacity constraints around ports and other key freight centres
► Cost effectiveness in delivering priority freight infrastructure
► Form of infrastructure and design to address freight issues.
The case study features a project designed to overcome congestion and conflicts on the network,and to enhance nearby amenity, in order to drive growth in productivity to support the freight task.These project objectives represent a blend of the key principles of demand for the potential need fordedicated freight infrastructure. On the supply side, capacity constraints are also identified as a keydriver for the project.
6.2 Key findings from the analysisThe analysis of the baseline traffic data confirms the problem statements and the presence ofdemand-side pre-conditions that warrant consideration of dedicated freight infrastructure as a wayof enhancing access to the Port and removing conflicts that exist between freight vehicles and otherroad users on heavily congested sections of Melbourne’s road network.
However, we also observe that these problems are not localised to just one or two road links, butinstead affect much of the road network to the west of the Port, as well as the M1 corridor. We alsounderstand that the spread of development across Yarraville, which contains a mix of industrial andresidential land uses, creates a complex pattern of mixed freight and private motor vehicle traffic,which poses a challenge for the design of effective dedicated freight infrastructure. For example, itmay be that the share of traffic in the area that actually uses the Port might not constitute enoughof the local transport task to justify the delivery of cost-effective priority links.
Australian Government Department of Infrastructure and Regional DevelopmentA study of the potential for dedicated freight infrastructure in Australia Ernst & Young ÷ 117
Our analysis of the project shows that the addition of the new link would attract both heavy andprivate vehicle traffic away from Francis Street and Somerville Road. This highlights that the new linkwould not be expected to operate as a priority freight link unless some other supporting measureswere put in place. These measures could include vehicle restrictions and/or tolling measures.
The large reductions in traffic on both Francis Street and Somerville Road result in significant speedincreases on Somerville Road and modest increases on Francis Street. However, the introduction ofthe new link would have a small impact on flows and speeds on the West Gate. Rather than improvingthe operation of this key arterial motorway, the project would instead provide a bypass for congestedlower level roads.
User benefits from reduced journey times and operating costs provide the majority of the economicbenefits for the project. This result is consistent with the analysis of the impact of the project onmodelled link flows and speeds. However, the fact that large volumes of cars and trucks would beexpected to remain on the streets of Yarraville to service surrounding land uses calls into questionthe potential for the project to deliver significant amenity benefits for local residents. It is envisagedthat the directions outlined in the Victorian Government’s freight and logistics plan, supported bynational port and freight strategies and investments, will make a meaningful contribution toaddressing these needs.
Analysis of the performance of the new link shows that volumes are low compared to modelledcapacity. As such, the case for making this a dedicated freight link is difficult to justify and riskseroding the benefits of the project. In effect, the project eliminates many of the pre-conditions fordedicated freight infrastructure when provided with open access to all users.
In any case, we have considered the potential impacts of delivering the project as a dedicated freightlink. This would re-direct almost 2,000 private motor vehicles back onto the other parts of the roadnetwork in the AM peak, including around 500 cars on Francis Street and around 300 cars onSomerville Road.
Diverting traffic back onto the nearby parts of the road network would erode the speed increasesand eliminate much of the time savings for private motor vehicles. This would significantly reducethe estimates of economic benefits in the evaluation (perhaps by as much as 25 to 50%).
An alternative option would be to restrict access to private motor vehicles during other times of theday (i.e. during the inter-peak period), when private motor vehicle traffic is reduced, as a way ofproviding a near-ultimate level of service for the freight sector. However, it is likely that theoperational performance of the new link is even better during the inter-peak and off-peak periodswhen general traffic levels are reduced, further weakening the need for the link to be provided as apriority freight measure.
Our financial and commercial analysis has further underlined the difficulty of delivering the projectas a priority freight link on a commercial and/or cost-effective basis. Tolling scenarios would fallshort of full cost recovery, meaning that the Government would be expected to be a major financialcontributor to the project.
6.3 Overall conclusionWhile a range of demand and supply pre-conditions appear to be in place for a priority freight link tosupport the operation of the PoM and ensure it is better integrated with priority freight links in thewest of Melbourne, the project as defined does not constitute a suitable form of dedicated freightinfrastructure.
This could be due to a number of demand and supply factors, including:

Australian Government Department of Infrastructure and Regional DevelopmentA study of the potential for dedicated freight infrastructure in Australia Ernst & Young ÷ 118
► The size of the freight task, while large, may not justify investment in priority infrastructuregiven the extent of other traffic types in the area (demand).
► The patterns of demand in the inner-west of Melbourne are diverse and involve a number oforigin-destination flows that are not related to the Port, meaning that it is not possible todisentangle these flows and target freight demand through a single infrastructure investment(demand).
► The existence of alternative routes to access the Port from the M1 corridor via CityLink andother strategic connections, reduces the criticality of improving connections to the west.
► The form of design has not been developed with the aim of prioritising freight infrastructure,and if this was an overarching objective, then the design solution might be better targeted ataddressing PoM access issues (supply).
► The nature of the existing road layout and other barriers (natural or otherwise) may limit theopportunity to develop cost effective solutions on the west side of the Port (supply). Thisrecognises that there may be an access problem on the west of the Port, but that there may beinsurmountable barriers to developing suitable dedicated freight infrastructure.
While each of these causes are possible, the case study also highlights that the need for dedicatedfreight infrastructure would be limited when alternative network modifications provide a feasible wayof addressing the perceived problems. It is only when there is a lack of alternative network optionsavailable that the case for investing in dedicated freight infrastructure is strengthened. In thisexample, it might be when congestion on the M1 corridor reaches a certain level and spills over ontothe new route that it becomes imperative to restrict access to private motor vehicles in order toprioritise freight flows.
Should this occur, and as the size of the PoM freight task continues to grow, we may reach a pointwhere the market, including road freight operators and the PoMC, may start to demand and bewilling to pay for a tailored infrastructure solution to strengthen the connection between the Portand key transport links in the west of Melbourne.
Australian Government Department of Infrastructure and Regional DevelopmentA study of the potential for dedicated freight infrastructure in Australia Ernst & Young ÷ 119
CASE STUDY 2: BRISBANE
Australian Government Department of Infrastructure and Regional DevelopmentA study of the potential for dedicated freight infrastructure in Australia Ernst & Young ÷ 120
1. Overview
1.1 Background & PurposeThis case study for Brisbane focuses on a concept project to provide a new rail link between the Portof Brisbane and the Surat Basin to the south west of the city. The details of this project are providedbelow.
This concept project in this case study is derived from preliminary investigations by the Port ofBrisbane for a dedicated freight rail line to the Port. EY consulted with Port of Brisbane Pty Ltdduring 2012 to obtain and analyse data related to the case study. EY also obtained independentanalysis of trade and economic data to support an overall economic assessment of the conceptproject.
Since that time, the Port has carried on the development of the project, and has made formalsubmissions to the Federal Government, including through a submission to Infrastructure Australiafor a Dedicated Freight Rail Corridor project in November 2013.
While the concept project described in this case study is broadly consistent with the project proposalsubmitted to Infrastructure Australia, this case study has not been updated to reflect the differentassumptions and information used in that later submission. The Port of Brisbane has been refiningthe project in consultation with key stakeholders in the development of its submission. The statedaim of the Port is to identify a sustainable and balanced transport solution that, following thecompletion of a pre-feasibility study that is currently underway, will demonstrate the commercial,social and environmental viability of dedicated rail from the Surat Basin to the Port of Brisbane.
In light of these developments, the project analysed in this case study is purely conceptual in orderto explore issues in providing dedicated freight infrastructure between the Port and the region to thesouth west of Brisbane under certain conditions. It is not a comprehensive feasibility assessment ofthe case study project or similar proposals for a dedicated freight rail link connecting the Port withthe Surat Basin. It is important to recognise that the findings of this case study are driven by thedata and assumptions used, and it is acknowledged that a full investigation into the project proposalsreflecting the latest project definition and market conditions could reach different conclusions.
To support the case study, further information is provided on the revised Port of Brisbane proposals.However, recognising the confidential nature of the submission to Infrastructure Australia, thespecific details about the project have not been included.
1.2 Our Approach1.2.1 OverviewThis case study aims to enhance our understanding of the conditions that justify the delivery ofdedicated freight transport infrastructure to serve Australia’s major container ports.
In undertaking this case study, the key tasks we have followed have included:
► Obtaining relevant project data from Port of Brisbane Pty Ltd
► Undertaking an analysis of the potential impacts of the concept project in order to identify andvalue the benefits of the case study as an example of a priority freight link
► Undertaking a rapid financial assessment in order to evaluate the potential commercialfeasibility of the project
► Considering potential commercial and governance models that could be deployed to support thedelivery of the infrastructure project
Australian Government Department of Infrastructure and Regional DevelopmentA study of the potential for dedicated freight infrastructure in Australia Ernst & Young ÷ 121
► Gauge the level of market interest and demand for the project, and in particular with respect tocontributing to its commercial delivery
Part A of this Report identified a set of principles for considering dedicated and priority freightinfrastructure. The study found that there is a range of demand and supply factors that drive theviability of dedicated and priority fright infrastructure.
Principles of demand include:
► The presence of conflicts between freight and other users of the transport network
► The size of the freight task
► Distances that freight movements are required to travel
► General network congestion around ports and other key freight centres
► Land use planning considerations
► Amenity issues
► Safety and environmental concerns
► Industry demand and willingness to pay for infrastructure
Principles of supply include:
► Capacity constraints around ports and other key freight centres
► Cost effectiveness in delivering priority freight infrastructure
► Form of infrastructure and design to address freight issues
These principles were used to inform the selection of case studies and to provide the frameworkwithin which to analyse this case study, and to consider whether it is an example of appropriatededicated or priority freight infrastructure in support of the Port.
1.2.2 Data collectionThis case study was developed in 2012 using the data available at that time. We acknowledge thatPort of Brisbane and its partners have undertaken significant new investigations and data analysis indeveloping its submission to the Federal government. Any findings in this report are not reflective ofthese recent developments.
Australian Government Department of Infrastructure and Regional DevelopmentA study of the potential for dedicated freight infrastructure in Australia Ernst & Young ÷ 122
2. Overview and strategic context for the casestudy
2.1 IntroductionThe Port of Brisbane was privatised in late 2010 as part of the Queensland Government’s strategy toreduce debt. The port was bought by a consortium of four long-term infrastructure funds, givingthem a stable shareholder base and an enhanced ability to plan long-term. The port’s managementhas been radically re-organising with a large reduction in the workforce and extensive repricing ofport services to reflect commercial realities. As a result, a new ethos pervades the management,with an outward focus on maximising the opportunities available to the company.
As part of this process, its new owners and management have reviewed the growth prospects of theport and have identified coal as the commodity that can provide the volume growth that will mostlikely provide the greatest revenue stream to fund a new rail line to the Port. Coal volumes havegrown by 68% from 2002 to 2012, currently approaching 10 mtpa. The port has identified thepotential for 50 mtpa from the Surat Basin, to the west of Brisbane. At the same time they havereviewed all of their infrastructure and operations and found that the greatest risk they faced wasnot on the sea side of their operations, or the on-port operations, but more their connectivity withthe hinterland that supplies their exports and receives their imports. Hence, it is promoting the ideaof building a new dedicated railway from the coal areas to the west of Brisbane to the port. At thisstage, it is proposed that the project be totally private sector funded, with no government fundingrequired. It is upon this basis that we have modelled it. A by-product of the railway is that it wouldalso provide a first-class railway for the movement of containers from the port to intermodalterminals to its south.
The focus on coal by the port reflects its unique character and geographic position. Of the total tradeof 33 million tonnes in 2010/11, only 8.2 million tonnes, or 25% was containerised. If the port canunleash its coal volume potential, this percentage will decline precipitately. The port would becomeone of the top ten export coal ports in the world, a quite remarkable prospect for a major city port.
2.1.1 Road NetworkThe road network between the port and its catchment area is generally excellent, with recent multi-billion dollar investments increasing capacity in all directions. This includes $1.8 billion to expandthe capacity of the Gateway Motorway to three lanes each way for a major portion of its route, andto construct a duplicate bridge across the Brisbane River. Another $380 million of government fundshas been spent on the Port of Brisbane Motorway that links the Gateway Motorway to the port,turning a substantial portion of it from a single lane road to a dual carriageway.
The Queensland and Commonwealth governments have also committed to construct the ToowoombaSecond Range Crossing (TSRC), which will be approximately 41km in length, running from theWarrego Highway at Helidon in the east to the Gore Highway at Athol in the west via Charlton. TheQueensland Government has committed $321.25 million to the project, with the CommonwealthGovernment providing $1.285 billion.
These expenditures are contributing to substantial productivity benefits for the trucking industry. A-double trucks capable of carrying four TEU (or two FEUs) can travel 200km from beyond Toowoombato the port without going through a traffic light. The increase in capacity of the trucks has in partresulted from heavier road/bridge standards and changes in the regulatory regime. The move to aPerformance Based Standard (PBS) for assessing heavy vehicles has resulted in innovations thathave increased the size and carrying capacity of the heavy vehicles. The focus of the change is onhow well the vehicle behaves on the road through a set of nationally agreed safety and infrastructure
Australian Government Department of Infrastructure and Regional DevelopmentA study of the potential for dedicated freight infrastructure in Australia Ernst & Young ÷ 123
protection standards, rather than how big and heavy (length and mass) it is.132 This is combinedwith the Intelligent Access Program (IAP), which gives a GPS fix on the vehicle, giving road managersthe required confidence that the heavy vehicle is travelling on the stipulated road.
A-double trucks with two high mass FEU’s have had a dramatic effect on vehicle productivity. Theytravel from Toowoomba to the port with containerised grain and have resulted in a 50% improvementin capacity, compared with previously, when mass limits restricted grain to one FEU on a semi-trailer.This means a halving of the number of trips to deliver the freight task. Anecdotally, the Port ofBrisbane told us that the number of trucks of this type has gone from 0 – 40 in twelve months.
The combination of large capital expenditure and regulatory reforms has increased road’scompetitive position compared to rail. Rail, with constraints on the Toowoomba range that severelylimit its carrying capacity, is losing market share to road.
The road improvements on the Gateway Motorway are expected to be sufficient until the mid to late2020’s after which a combination of ITS (Intelligent Transport System) initiatives such as variablespeed measures, ramp metering and lane control and further, expensive capital improvements will berequired. But in the short to medium term, the port need not have great concerns with the roadtransport infrastructure it relies on. It was rail where the port saw its greatest problem in accessingits hinterland.
It is this issue that is driving the port to consider a dedicated freight railway, which forms the basis ofthis case study, from the port to the Surat Basin area in south-east Queensland. The rail wouldostensibly be for carrying coal, but also carry containers.
2.1.2 Rail ConstraintsRail currently faces serious constraints for both the carriage of bulk products such as coal and grainand for containers. It currently carries 57,000 TEU (2010/11 figure), mainly made up of boxes fromregional areas to the north and west of Brisbane. Volumes have been stuck around this figure for anumber of years and there are no shuttle services to the main intermodal terminal at Acacia Ridge,37km away. Such services have been looked at by logistics companies, but found to be non-commercial. For the 37 kilometres to the port, the line would be a dedicated freight line. But this linehas to cross over the passenger lines and thus is subject to peak-hour passenger train curfews. Slowfreight trains, with low acceleration capability are not allowed to even traverse the passenger lines atthe peak due to reliability issues and zero tolerance of delays.
Coal and other freight trains originating to the west of Brisbane face more constraints. Firstly theyhave to traverse the shared Citytrain network from near Acacia Ridge to Rosewood on the Ipswichline. Again, curfews apply during the morning and afternoon peaks and, at all other times, thepassenger trains have priority. They then have to travel over the Toowoomba range, a large hurdle,with steep grades, sharp corners, limited passing loops and small tunnels. All rail on this line is ratedat 15.75 tonne axle load. This, combined with small tunnels, limits the capacity of the coal or grainwagons. This is most explicitly shown by the amount of net coal per train on the western network(1,920 tonnes per train), compared with best practice on the central Queensland coalfields (10,000tonnes per train).
Beyond Toowoomba, the western line runs on fairly level ground though the towns of Oakey, Dalby,and Chinchilla to Miles and beyond, in the southern reaches of the Surat Basin. Unfortunately muchof the soil out west is black soil, which is weak structurally and requires large quantities of ballast tosupport the steel rail. Hence at the moment it only supports 15.75 tonne axle load. It would beexpensive to go beyond this in terms of the formation needed.
It is the Citytrain network that is the crucial problem for the port going into the future. Freight willalways be competing for access with passenger trains. In recent years, new Citytrain network
132 Queensland Government Department of Transport and Main Roads, “Information Bulletin “Performance based Standards(PBS) Scheme in Queensland”
Australian Government Department of Infrastructure and Regional DevelopmentA study of the potential for dedicated freight infrastructure in Australia Ernst & Young ÷ 124
extensions such as to Richlands, off the Ipswich line have reduced the amount of utilised space ontrack that was previously available to freight. These trends are set to increase in the future, withmoves afoot to go to a 15 minute off-peak service.
The previous State Government had plans for Cross River Rail, an expensive tunnelling exercise that,as well as providing additional capacity across the Brisbane River to Yeerongpilly, would also providea new underground service through the heart of the city. With the new Government in power sinceMarch 2012, this is being reviewed, and its draft review has recently been published. The project, inorder to save costs has been shortened and whereas the earlier proposed Cross City Rail would havefreed up some capacity for freight services between Yeerongpilly and Dutton Park, It is not clear yetwhether this reduced version of it will provide the same, albeit limited, benefit.
The number of rail paths over the Toowoomba range, combined with restrictions on the Citytrainnetwork, limit the western network to 10 million tonnes per annum (mtpa). In recent years,increasing amounts of this capacity have been taken up by coal trains. At the moment the system isat capacity with the potential to incrementally increase capacity on the Citytrain network by adding apassing loop on the freight line, where it crosses the passenger line. This is awkward but may bepossible as part of a grade separation. No accurate costs are available at this time, but indicationsare that the total project cost would be several hundred million dollars. This has the potential toincrease freight/coal capacity to 14 million tonnes. But there is no scope on the current network, tomeet the demand the port is now forecasting. Without massive expenditure running into manybillions, and involving at the same time a comprehensive reorganisation of the Citytrain network,sufficient capacity could not be created on the current corridor.
2.1.3 The Concept Project ProposalIn order to access the higher volumes of up to 50 million tonnes, the Port proposed to promote andoversee the construction of a new and upgraded railway from the prospective coalfields 400kilometres away, to the port133. At the time of the preliminary proposals, the Port is working on atimeframe of five years of approvals from 2012 to 2017 and then five years of construction till2022, when a service could commence134
The line has four sections, for which preliminary engineering analysis has started:
► Western Line upgrades
► Toowoomba Range
► Construction of the Southern Freight Rail Corridor line
► Proposed Eastern Freight Rail Bypass
A total cost estimate of $7.0 billion, including an allowance for contingencies was provided for theproject. The first two of these sectors have been studied for a number of years. Toowoomba Rangecrossings have been analysed for over ten years, separately and as part of the Melbourne–BrisbaneInland Rail Line. The Southern Freight Rail Corridor is also part of the larger Melbourne–Brisbaneproject and was studied in the late 2000s. Currently, the corridor and alignment have been mappedout and the project currently sits as being identified within planning schemes.
The Eastern Freight Rail Bypass is a new proposal that connects from near where the southernfreight corridor meets the Sydney – Brisbane line to then connect with the existing freight line nearMurarie. It would follow part of the Logan and Gateway Motorway corridors, hence bypassing theCitytrain network completely via the southern corridor and the eastern bypass. It is the most
133 At this early stage, the port advises that while it itself would not be an investor in the railway, some of its shareholderscould. This fits with their focus on long term steady infrastructure investments.134 We have chosen to use a 35 year timeframe for our modelling (till 2057) representing one single depreciation cycle of thatlength (we note that the ATC National Guidelines recommends 50 years for rail projects)

Australian Government Department of Infrastructure and Regional DevelopmentA study of the potential for dedicated freight infrastructure in Australia Ernst & Young ÷ 125
expensive part of the capital cost, at $3 billion, and highlights the fact that this project, with its highcost, will be a challenge financially and economically.135
The Port envisaged the project as having positive spin-offs for its container trade. The line will allowfor double staking and a much improved transit time (unimpaired) for rail borne containers, thusincreasing rail’s competitive position with road. It will have a connection to the existing intermodalterminal at Acacia Ridge and also a proposed terminal at Bromelton, approximately 70 kilometresfrom the Port. The project was timed to be completed in 2022 when the roads used to access theport are likely to approach critical levels of congestion. Hence, the Port considered its rail line asbeing able to access large proportions of its short haul container trade.
The Port of Brisbane undertook preliminary market demand analysis and engineering analysis of itsproposal. The proposal is for dedicated freight infrastructure for a major container port. However,the Port of Brisbane is unique in many respects. It is very much a multi-purpose port with largevolumes of oil products, coal, grain, oil and break bulk products. Its proposal is not considered torequire government funding, but will require planning and environmental clearances, which couldcover some sensitive issues concerning urban amenity and protection of wildlife. Coal will fund theproposal.
2.1.4 The Dedicated Freight Rail Corridor project (November 2013)Since the initial period of consultation with the Port of Brisbane and the development of this conceptproject case study, the Port has continued to develop the project in consultation with keystakeholders, including the Federal and Queensland governments. The ultimate plan is to secure thedelivery of a dedicated freight rail line linking the Port with trade export corridors west ofToowoomba and the proposed Inland Rail Project.
In November 2013, the Port presented a submission to Infrastructure Australia on the DedicatedFreight Rail Corridor (DFRC) project. The proposal is broadly consistent with the scope of the conceptproject, with key components of the corridor including:
► A new Eastern Freight Rail Bypass (EFRB) – extending from the existing Fisherman Islands railline for 37 km to the Interstate Standard Gauge Rail Line (ISGR)
► Upgrading the ISGR for 25 km from Larapinta to Kagaru
► Developing the planned Department of Transport and Main Roads’ Southern Freight Rail Bypass(SFRB), extending for 55 km from Kagaru to Rosewood on the Western Lines
► A new Toowoomba Range crossing of around 97 km
► Upgrading the existing Queensland Rail Western Line, approximately 260 km from Oakey toWandoan.
As part of updating its proposals, the Port of Brisbane has also reworked and refined its estimates ofcapital costs, with a focus on identifying efficiencies and other cost savings. This information iscurrently confidential and forms a critical input to the Port’s discussions with governments and otherstakeholders.
The Port of Brisbane has identified several benefits of the DFRC for the Queensland economy andlocal communities, including:136
► Removal of approximately 4,000 trucks per day from South East Queensland’s road network by2045; which equates to an average saving of 186 million truck kilometres per annum.
135 Unfortunately a map of the proposed rail line could not be obtained.136 http://www.portbris.com.au/news-media/item/?release=/News-and-Media/Momentum-builds-for-dedicated-freight-rail-to-the
Australian Government Department of Infrastructure and Regional DevelopmentA study of the potential for dedicated freight infrastructure in Australia Ernst & Young ÷ 126
► Improvement in air quality, with the project generating an annual reduction of 460 tonnes ofcarbon emissions by 2045.
► A significant reduction in accidents and road maintenance costs
► Better travel times for road users, which are predicted to reduce by an average of 15 minutesfor trips from Toowoomba to Brisbane.
► Removal of all freight trains from Ipswich and Toowoomba city and approximately 60,000 20-foot freight containers from the Brisbane metropolitan passenger rail network each year.
► Creation of 5,000 construction and operational jobs for Queensland.
► Improved amenity for the Brisbane metropolitan rail network.
The Port of Brisbane intends to work closely with government and industry stakeholders to develop adetailed business case by 2015 to demonstrate the commercial, economic, social and environmentalfeasibility of the project.

Australian Government Department of Infrastructure and Regional DevelopmentA study of the potential for dedicated freight infrastructure in Australia Ernst & Young ÷ 127
3. Demand analysis for the concept project
3.1 General approachThis chapter outlines the demand analysis that was undertaken for the concept project that is thefocus of this case study. This demand analysis has not been updated for changes to the projectconcepts that are currently subject to a pre-feasibility study by the Port of Brisbane.
It is expected that the demand for the freight only railway would be made up of five separatecommodity and geographic groupings:
► Coal
► International containers – to/from Acacia Ridge and Bromelton
► Other Western Queensland freight to/from the port
► Inland Rail domestic freight from/to Melbourne/Brisbane on the Inland Railway assumed tobe built for commencement in 2030
► South and Western Australia and Northern Queensland freight travelling on the InlandRailway
The following sections of this chapter outline recent trends and analysis for each market segmentand presents forecasts used for the purpose of this concept project.
3.2 Coal3.2.1 Historical coal exportsCoal exports through the port of Brisbane have grown dramatically in the last decade. The tablebelow shows a rise from 3.1mtpa to 9.6mtpa over 9 years.
Table 28: Coal Exports through the Port of Brisbane: 2003/04 – 2011/12, (millions)
03/04 04/05 05/06 06/07 07/08 08/09 09/10 10/11 11/12*
Exports 3.1 3.7 4.1 4.2 5.2 6.3 6.3 6.6 9.6GrowthRate 19% 11% 2% 24% 21% 0% 5% 45%
* POB Estimate
This ramp-up is part of a wider coal boom affecting Queensland, with multiple proposals to developmines in the Galilee Basin in the north of the state with concomitant rail and port expansions.Further south, planning is well advanced to close the ‘southern missing link” rail line betweenWandoan and Banana to allow coal to exit on the Moura system to a new coal terminal at WigginIsland in the Port of Gladstone. Wandoan is roughly half way between Gladstone and Brisbane portsat 380km and 403km respectively.
3.2.2 Forecast coal exportsThe Port of Brisbane (POB) has had coal consultants Wood McKenzie undertake a study to identifythe prospective coal resources that are significantly closer to their port rather than Gladstone. Thecurrent limit in distance they are working on is Yan Coal’s mine at Cameby Downs 380kms from theport and 583km from Gladstone. The table below contains the Wood McKenzie forecasts anddistances from Brisbane and Gladstone. The Wood McKenzie report also looks at worldwide demandand supply of thermal coal (used to generate electricity) and forecasts that sufficient demand existsfor the 50 mtpa coal resource to be moved through the Port of Brisbane.

Australian Government Department of Infrastructure and Regional DevelopmentA study of the potential for dedicated freight infrastructure in Australia Ernst & Young ÷ 128
Table 29: Coal mines, annual tonnages and port distances of prospective mines
Company Mine Tonnes (mtpa) Distance toBrisbane (km)
Distance toGladstone (km)
Yang Coal Cameby Downs 10 380 496
Peabody Wilkie Creek 10 293 583
New Hope New Acland 10 227 649
New Hope Jeebropilly 0 closed by 2022 82 N/A
New Hope New Oakleigh 3 82 N/A
OGL Ebenezer 2 82 N/A
Other – Metro,Blackwoods,CSE
Various in Wandoanand West MoretonFields
15 250 avg 620 - 750
Total 50Source: Port of Brisbane
At the time this case study was developed, (mid-2012) considerable uncertainty existed as to thehealth of the world economy, with particular issues in Europe and, to a lesser extent, China. Thelatter is of major importance to the Australian economy and its exports of coal and iron ore.
As shown by the ten year price trend as of 2012 in the figure below, (in US dollars) prices forthermal coal fell significantly during the preceding months, but were still at high rates compared toperiods only ten years earlier. However, the cost of production for many coal mines were alsoclimbing perceptively and if prices were to trend below US$45 it was considered that manyAustralian mines would become uneconomic137.
Figure 15: Ten year monthly Australian thermal coal prices in US$
Source: http://www.indexmundi.com/commodities/?commodity=coal-australian&months=60
While acknowledging the high degree of uncertainty involved, for the purposes of this case study EYhas used the forecasts of the Port of Brisbane and their consultants and has not undertaken anyanalysis beyond what they contain.
Work on the Port’s proposal has not advanced to the stage of forecasting the actual ramp up inproduction of the mines it has identified. Therefore the Port and EY have made the assumptions intable 30.
137 See Australian Financial Review, Friday 4 May 2012, page 23, “Plenty of fish in the mining sea”
0
50
100
150
200
250
May
-02
Nov
-02
May
-03
Nov
-03
May
-04
Nov
-04
May
-05
Nov
-05
May
-06
Nov
-06
May
-07
Nov
-07
May
-08
Nov
-08
May
-09
Nov
-09
May
-10
Nov
-10
May
-11
Nov
-11
May
-12
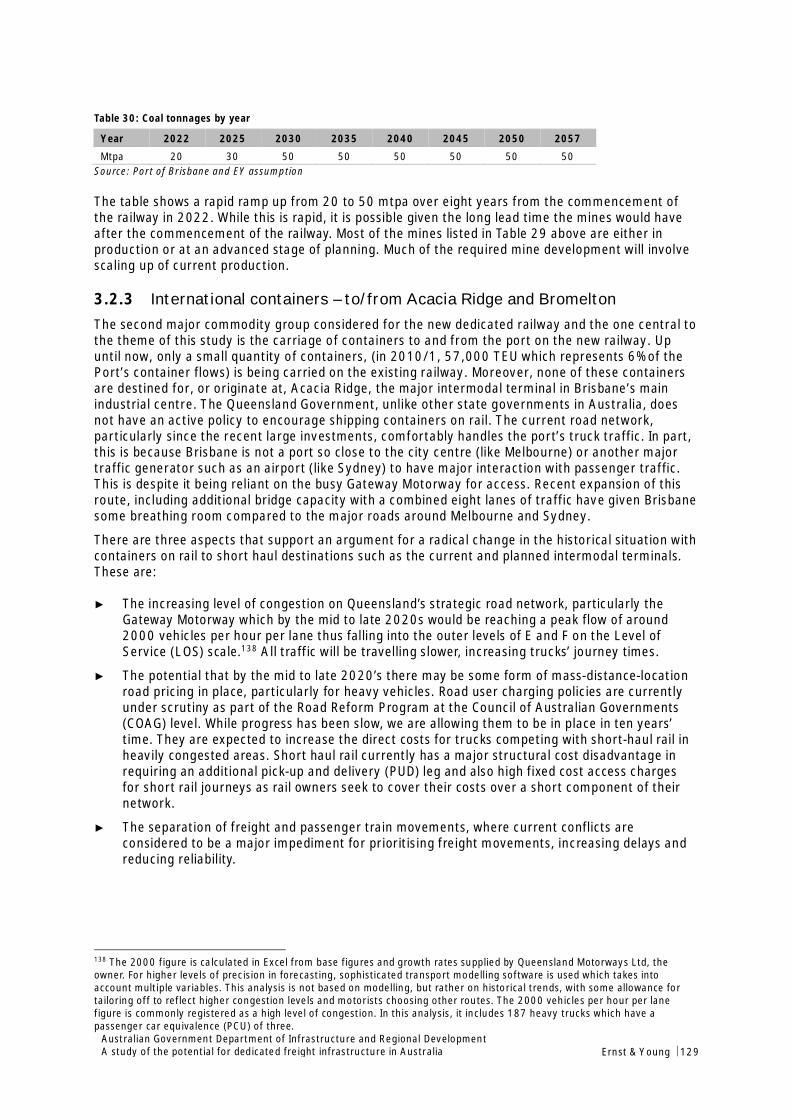
Australian Government Department of Infrastructure and Regional DevelopmentA study of the potential for dedicated freight infrastructure in Australia Ernst & Young ÷ 129
Table 30: Coal tonnages by year
Year 2022 2025 2030 2035 2040 2045 2050 2057
Mtpa 20 30 50 50 50 50 50 50Source: Port of Brisbane and EY assumption
The table shows a rapid ramp up from 20 to 50 mtpa over eight years from the commencement ofthe railway in 2022. While this is rapid, it is possible given the long lead time the mines would haveafter the commencement of the railway. Most of the mines listed in Table 29 above are either inproduction or at an advanced stage of planning. Much of the required mine development will involvescaling up of current production.
3.2.3 International containers – to/from Acacia Ridge and BromeltonThe second major commodity group considered for the new dedicated railway and the one central tothe theme of this study is the carriage of containers to and from the port on the new railway. Upuntil now, only a small quantity of containers, (in 2010/1, 57,000 TEU which represents 6% of thePort’s container flows) is being carried on the existing railway. Moreover, none of these containersare destined for, or originate at, Acacia Ridge, the major intermodal terminal in Brisbane’s mainindustrial centre. The Queensland Government, unlike other state governments in Australia, doesnot have an active policy to encourage shipping containers on rail. The current road network,particularly since the recent large investments, comfortably handles the port’s truck traffic. In part,this is because Brisbane is not a port so close to the city centre (like Melbourne) or another majortraffic generator such as an airport (like Sydney) to have major interaction with passenger traffic.This is despite it being reliant on the busy Gateway Motorway for access. Recent expansion of thisroute, including additional bridge capacity with a combined eight lanes of traffic have given Brisbanesome breathing room compared to the major roads around Melbourne and Sydney.
There are three aspects that support an argument for a radical change in the historical situation withcontainers on rail to short haul destinations such as the current and planned intermodal terminals.These are:
► The increasing level of congestion on Queensland’s strategic road network, particularly theGateway Motorway which by the mid to late 2020s would be reaching a peak flow of around2000 vehicles per hour per lane thus falling into the outer levels of E and F on the Level ofService (LOS) scale.138 All traffic will be travelling slower, increasing trucks’ journey times.
► The potential that by the mid to late 2020’s there may be some form of mass-distance-locationroad pricing in place, particularly for heavy vehicles. Road user charging policies are currentlyunder scrutiny as part of the Road Reform Program at the Council of Australian Governments(COAG) level. While progress has been slow, we are allowing them to be in place in ten years’time. They are expected to increase the direct costs for trucks competing with short-haul rail inheavily congested areas. Short haul rail currently has a major structural cost disadvantage inrequiring an additional pick-up and delivery (PUD) leg and also high fixed cost access chargesfor short rail journeys as rail owners seek to cover their costs over a short component of theirnetwork.
► The separation of freight and passenger train movements, where current conflicts areconsidered to be a major impediment for prioritising freight movements, increasing delays andreducing reliability.
138 The 2000 figure is calculated in Excel from base figures and growth rates supplied by Queensland Motorways Ltd, theowner. For higher levels of precision in forecasting, sophisticated transport modelling software is used which takes intoaccount multiple variables. This analysis is not based on modelling, but rather on historical trends, with some allowance fortailoring off to reflect higher congestion levels and motorists choosing other routes. The 2000 vehicles per hour per lanefigure is commonly registered as a high level of congestion. In this analysis, it includes 187 heavy trucks which have apassenger car equivalence (PCU) of three.
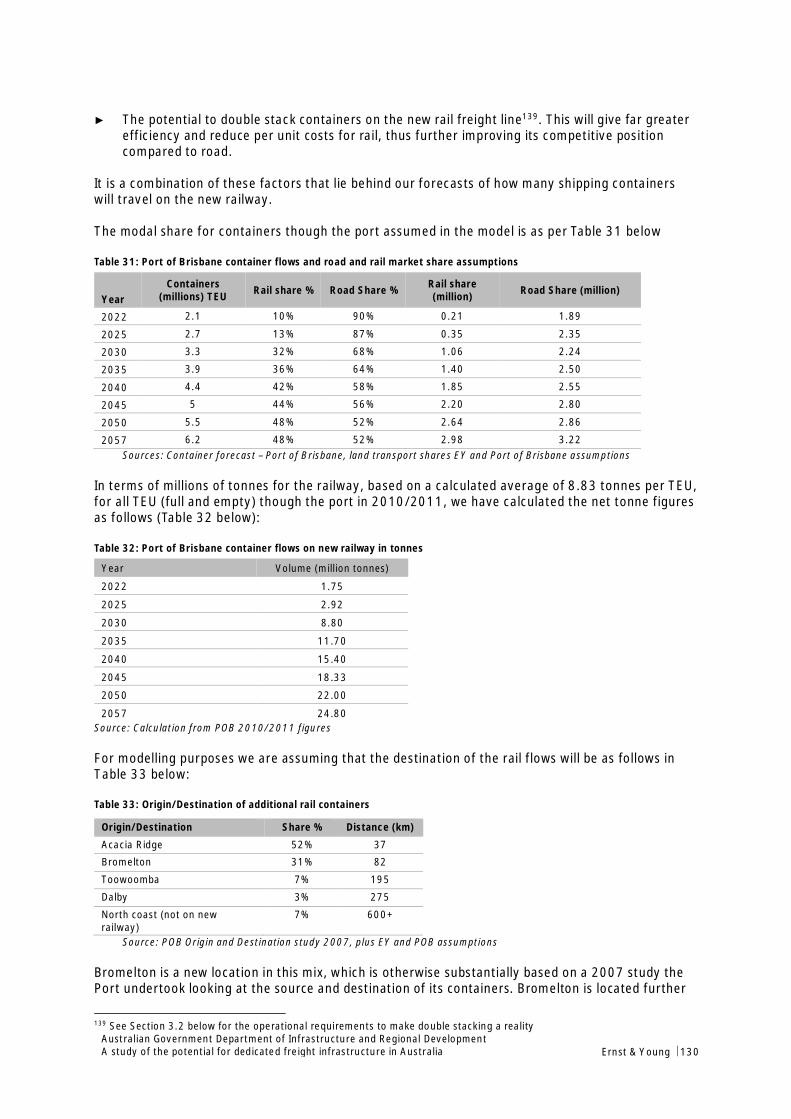
Australian Government Department of Infrastructure and Regional DevelopmentA study of the potential for dedicated freight infrastructure in Australia Ernst & Young ÷ 130
► The potential to double stack containers on the new rail freight line139. This will give far greaterefficiency and reduce per unit costs for rail, thus further improving its competitive positioncompared to road.
It is a combination of these factors that lie behind our forecasts of how many shipping containerswill travel on the new railway.
The modal share for containers though the port assumed in the model is as per Table 31 below
Table 31: Port of Brisbane container flows and road and rail market share assumptions
YearContainers
(millions) TEU Rail share % Road Share % Rail share(million) Road Share (million)
2022 2.1 10% 90% 0.21 1.89
2025 2.7 13% 87% 0.35 2.35
2030 3.3 32% 68% 1.06 2.24
2035 3.9 36% 64% 1.40 2.50
2040 4.4 42% 58% 1.85 2.55
2045 5 44% 56% 2.20 2.80
2050 5.5 48% 52% 2.64 2.86
2057 6.2 48% 52% 2.98 3.22Sources: Container forecast – Port of Brisbane, land transport shares EY and Port of Brisbane assumptions
In terms of millions of tonnes for the railway, based on a calculated average of 8.83 tonnes per TEU,for all TEU (full and empty) though the port in 2010/2011, we have calculated the net tonne figuresas follows (Table 32 below):
Table 32: Port of Brisbane container flows on new railway in tonnes
Year Volume (million tonnes)
2022 1.75
2025 2.92
2030 8.80
2035 11.70
2040 15.40
2045 18.33
2050 22.00
2057 24.80Source: Calculation from POB 2010/2011 figures
For modelling purposes we are assuming that the destination of the rail flows will be as follows inTable 33 below:
Table 33: Origin/Destination of additional rail containers
Origin/Destination Share % Distance (km)
Acacia Ridge 52% 37
Bromelton 31% 82
Toowoomba 7% 195
Dalby 3% 275
North coast (not on newrailway)
7% 600+
Source: POB Origin and Destination study 2007, plus EY and POB assumptions
Bromelton is a new location in this mix, which is otherwise substantially based on a 2007 study thePort undertook looking at the source and destination of its containers. Bromelton is located further
139 See Section 3.2 below for the operational requirements to make double stacking a reality
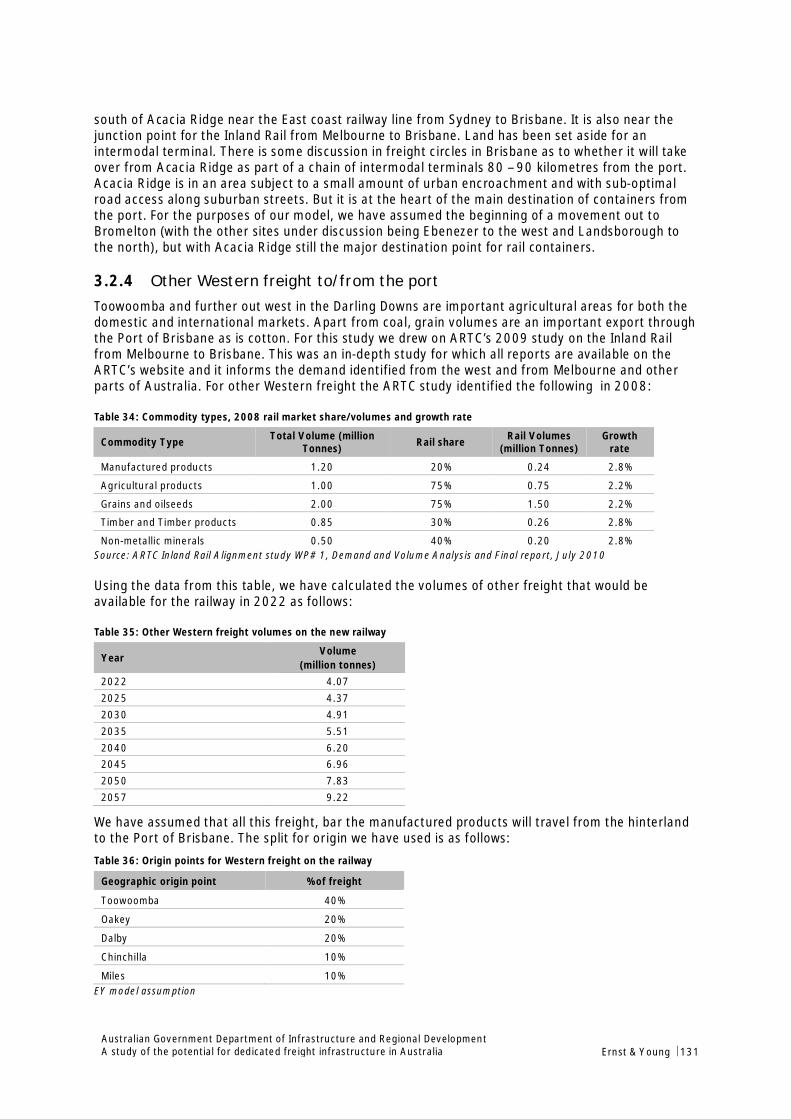
Australian Government Department of Infrastructure and Regional DevelopmentA study of the potential for dedicated freight infrastructure in Australia Ernst & Young ÷ 131
south of Acacia Ridge near the East coast railway line from Sydney to Brisbane. It is also near thejunction point for the Inland Rail from Melbourne to Brisbane. Land has been set aside for anintermodal terminal. There is some discussion in freight circles in Brisbane as to whether it will takeover from Acacia Ridge as part of a chain of intermodal terminals 80 – 90 kilometres from the port.Acacia Ridge is in an area subject to a small amount of urban encroachment and with sub-optimalroad access along suburban streets. But it is at the heart of the main destination of containers fromthe port. For the purposes of our model, we have assumed the beginning of a movement out toBromelton (with the other sites under discussion being Ebenezer to the west and Landsborough tothe north), but with Acacia Ridge still the major destination point for rail containers.
3.2.4 Other Western freight to/from the portToowoomba and further out west in the Darling Downs are important agricultural areas for both thedomestic and international markets. Apart from coal, grain volumes are an important export throughthe Port of Brisbane as is cotton. For this study we drew on ARTC’s 2009 study on the Inland Railfrom Melbourne to Brisbane. This was an in-depth study for which all reports are available on theARTC’s website and it informs the demand identified from the west and from Melbourne and otherparts of Australia. For other Western freight the ARTC study identified the following in 2008:
Table 34: Commodity types, 2008 rail market share/volumes and growth rate
Commodity Type Total Volume (millionTonnes) Rail share Rail Volumes
(million Tonnes)Growth
rate
Manufactured products 1.20 20% 0.24 2.8%
Agricultural products 1.00 75% 0.75 2.2%
Grains and oilseeds 2.00 75% 1.50 2.2%
Timber and Timber products 0.85 30% 0.26 2.8%
Non-metallic minerals 0.50 40% 0.20 2.8%Source: ARTC Inland Rail Alignment study WP# 1, Demand and Volume Analysis and Final report, July 2010
Using the data from this table, we have calculated the volumes of other freight that would beavailable for the railway in 2022 as follows:
Table 35: Other Western freight volumes on the new railway
YearVolume
(million tonnes)2022 4.072025 4.372030 4.912035 5.512040 6.202045 6.962050 7.832057 9.22
We have assumed that all this freight, bar the manufactured products will travel from the hinterlandto the Port of Brisbane. The split for origin we have used is as follows:Table 36: Origin points for Western freight on the railway
Geographic origin point % of freight
Toowoomba 40%
Oakey 20%
Dalby 20%
Chinchilla 10%
Miles 10%EY model assumption
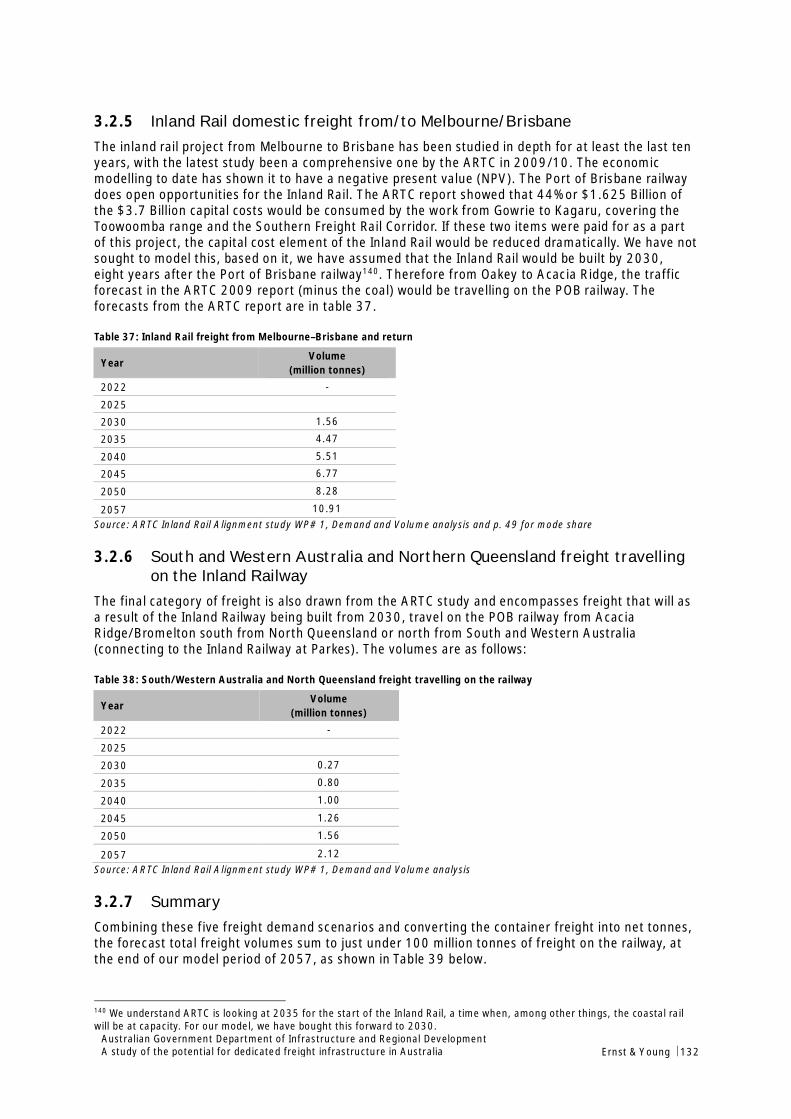
Australian Government Department of Infrastructure and Regional DevelopmentA study of the potential for dedicated freight infrastructure in Australia Ernst & Young ÷ 132
3.2.5 Inland Rail domestic freight from/to Melbourne/BrisbaneThe inland rail project from Melbourne to Brisbane has been studied in depth for at least the last tenyears, with the latest study been a comprehensive one by the ARTC in 2009/10. The economicmodelling to date has shown it to have a negative present value (NPV). The Port of Brisbane railwaydoes open opportunities for the Inland Rail. The ARTC report showed that 44% or $1.625 Billion ofthe $3.7 Billion capital costs would be consumed by the work from Gowrie to Kagaru, covering theToowoomba range and the Southern Freight Rail Corridor. If these two items were paid for as a partof this project, the capital cost element of the Inland Rail would be reduced dramatically. We have notsought to model this, based on it, we have assumed that the Inland Rail would be built by 2030,eight years after the Port of Brisbane railway140. Therefore from Oakey to Acacia Ridge, the trafficforecast in the ARTC 2009 report (minus the coal) would be travelling on the POB railway. Theforecasts from the ARTC report are in table 37.
Table 37: Inland Rail freight from Melbourne–Brisbane and return
YearVolume
(million tonnes)
2022 -
2025
2030 1.56
2035 4.47
2040 5.51
2045 6.77
2050 8.28
2057 10.91Source: ARTC Inland Rail Alignment study WP# 1, Demand and Volume analysis and p. 49 for mode share
3.2.6 South and Western Australia and Northern Queensland freight travellingon the Inland Railway
The final category of freight is also drawn from the ARTC study and encompasses freight that will asa result of the Inland Railway being built from 2030, travel on the POB railway from AcaciaRidge/Bromelton south from North Queensland or north from South and Western Australia(connecting to the Inland Railway at Parkes). The volumes are as follows:
Table 38: South/Western Australia and North Queensland freight travelling on the railway
YearVolume
(million tonnes)
2022 -
2025
2030 0.27
2035 0.80
2040 1.00
2045 1.26
2050 1.56
2057 2.12Source: ARTC Inland Rail Alignment study WP# 1, Demand and Volume analysis
3.2.7 SummaryCombining these five freight demand scenarios and converting the container freight into net tonnes,the forecast total freight volumes sum to just under 100 million tonnes of freight on the railway, atthe end of our model period of 2057, as shown in Table 39 below.
140 We understand ARTC is looking at 2035 for the start of the Inland Rail, a time when, among other things, the coastal railwill be at capacity. For our model, we have bought this forward to 2030.
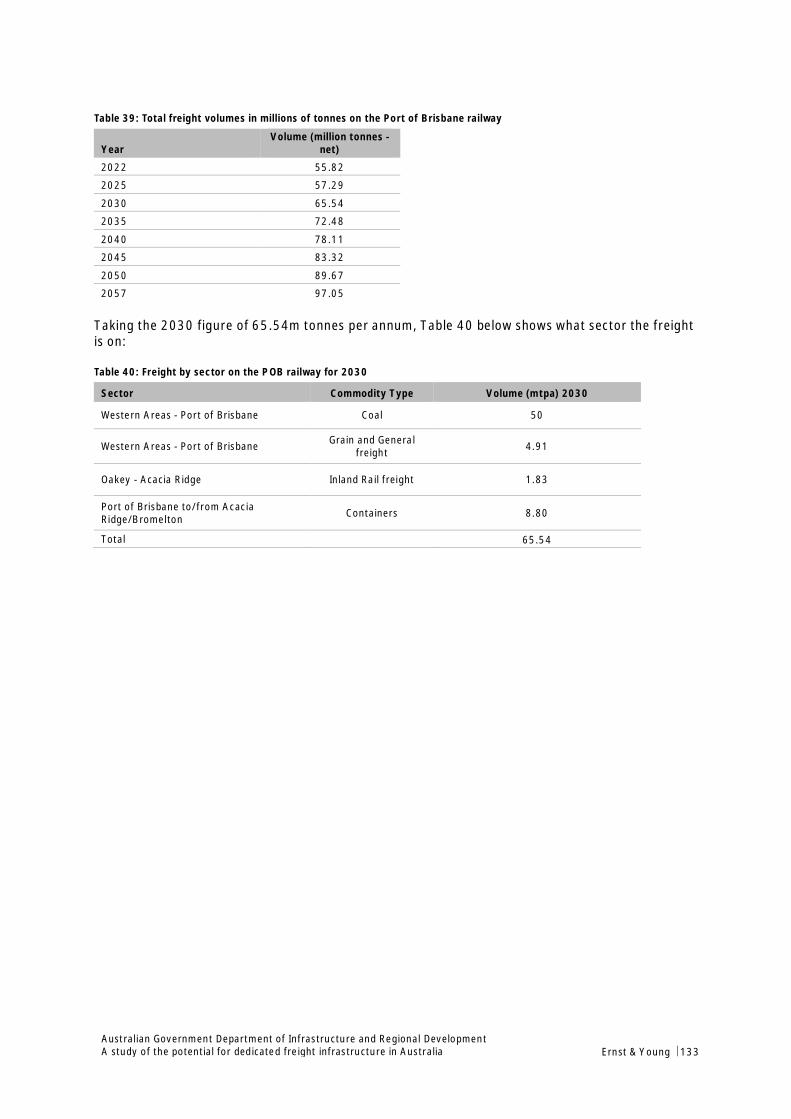
Australian Government Department of Infrastructure and Regional DevelopmentA study of the potential for dedicated freight infrastructure in Australia Ernst & Young ÷ 133
Table 39: Total freight volumes in millions of tonnes on the Port of Brisbane railway
YearVolume (million tonnes -
net)
2022 55.82
2025 57.29
2030 65.54
2035 72.48
2040 78.11
2045 83.32
2050 89.67
2057 97.05
Taking the 2030 figure of 65.54m tonnes per annum, Table 40 below shows what sector the freightis on:
Table 40: Freight by sector on the POB railway for 2030
Sector Commodity Type Volume (mtpa) 2030
Western Areas - Port of Brisbane Coal 50
Western Areas - Port of Brisbane Grain and Generalfreight 4.91
Oakey - Acacia Ridge Inland Rail freight 1.83
Port of Brisbane to/from AcaciaRidge/Bromelton Containers 8.80
Total 65.54
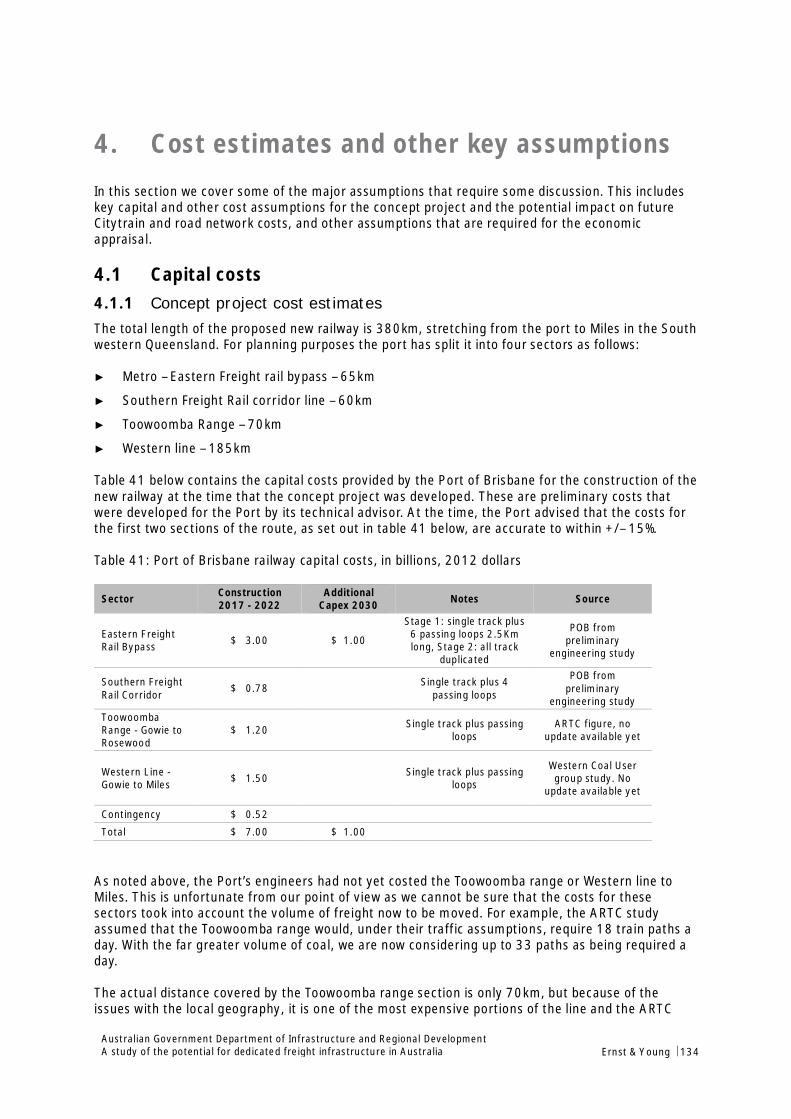
Australian Government Department of Infrastructure and Regional DevelopmentA study of the potential for dedicated freight infrastructure in Australia Ernst & Young ÷ 134
4. Cost estimates and other key assumptionsIn this section we cover some of the major assumptions that require some discussion. This includeskey capital and other cost assumptions for the concept project and the potential impact on futureCitytrain and road network costs, and other assumptions that are required for the economicappraisal.
4.1 Capital costs4.1.1 Concept project cost estimatesThe total length of the proposed new railway is 380km, stretching from the port to Miles in the Southwestern Queensland. For planning purposes the port has split it into four sectors as follows:
► Metro – Eastern Freight rail bypass – 65km
► Southern Freight Rail corridor line – 60km
► Toowoomba Range – 70km
► Western line – 185km
Table 41 below contains the capital costs provided by the Port of Brisbane for the construction of thenew railway at the time that the concept project was developed. These are preliminary costs thatwere developed for the Port by its technical advisor. At the time, the Port advised that the costs forthe first two sections of the route, as set out in table 41 below, are accurate to within +/– 15%.
Table 41: Port of Brisbane railway capital costs, in billions, 2012 dollars
Sector Construction2017 - 2022
AdditionalCapex 2030 Notes Source
Eastern FreightRail Bypass $ 3.00 $ 1.00
Stage 1: single track plus6 passing loops 2.5Kmlong, Stage 2: all track
duplicated
POB frompreliminary
engineering study
Southern FreightRail Corridor $ 0.78 Single track plus 4
passing loops
POB frompreliminary
engineering studyToowoombaRange - Gowie toRosewood
$ 1.20 Single track plus passingloops
ARTC figure, noupdate available yet
Western Line -Gowie to Miles $ 1.50 Single track plus passing
loops
Western Coal Usergroup study. No
update available yet
Contingency $ 0.52
Total $ 7.00 $ 1.00
As noted above, the Port’s engineers had not yet costed the Toowoomba range or Western line toMiles. This is unfortunate from our point of view as we cannot be sure that the costs for thesesectors took into account the volume of freight now to be moved. For example, the ARTC studyassumed that the Toowoomba range would, under their traffic assumptions, require 18 train paths aday. With the far greater volume of coal, we are now considering up to 33 paths as being required aday.
The actual distance covered by the Toowoomba range section is only 70km, but because of theissues with the local geography, it is one of the most expensive portions of the line and the ARTC

Australian Government Department of Infrastructure and Regional DevelopmentA study of the potential for dedicated freight infrastructure in Australia Ernst & Young ÷ 135
costing includes two tunnels of 5km and 500 metres each. A back of the envelope calculation of thenumber of available train paths used by train controllers, suggests that 40 trains could be achievedwith up to one 2.5km passing loop, it is not clear whether this is included in the ARTC costing141.Based on this we have therefore allowed for it in the contingency amount of $0.52 billion. The majorcost is in the bulk earthworks, formation and tunnelling, which would be covered under the originalamount.
The amount set aside for the Western line is $1.5B for 185km of duplicated track. This works out as$8.1m per kilometre, which compares reasonably with estimates EY has cited for duplicated rail inthe Galilee Basin of $7.7M per kilometre. The area is notorious for its black soil, thus requiringsubstantial earthworks and formation. Of note is Surat Basin Railway, a planned 60km railway to fillthe missing link between Wandoan and Theodore, which is costed at $4.7m per kilometre in 2009dollars and runs on similar geology.
For maintenance costs for the new railway, we have relied on costs provided by the ARTC report fornew track at $30,000 per track kilometre for the first 15 years and $35,000 per year per kilometrebeyond that.
4.1.2 Updated DFRC project cost estimatesSince the development of the case study, the Port of Brisbane has continued to review and refine theDFRC project with the support of its technical advisors in consultation with key government andindustry stakeholders.
While this work is ongoing, the Port of Brisbane considers that it has identified various means bywhich to significantly reduce the capital cost estimates for each of the DFRC segments costed above.
4.2 Additional Costs to allow for double stacked containersAs noted in Section 3.1.3, certain other events have to occur before the railway could be used to runefficient double stacked container shuttles between the port and Acacia Ridge and, to a lesserextent, Bromelton. The first section of the POB Railway runs from the port, along the alignment ofthe Gateway and Logan Motorways before turning south to Kagaru where the next sector, theSouthern Freight Rail corridor, commences. At the point where the sector turns south away from theLogan motorway, the East Coast line from Sydney runs 14 km further north to Acacia Ridge. This 14kilometre stretch needs investment in order to allow for double stacking. Most particularly atLearoyd Road, just south of the terminal, the vertical and horizontal clearances would need to belifted in order to allow for double staking.
The cost of this upgrade, plus other works could be paid for as part of a Queensland Governmentplan to run a suburban line from Salisbury, north of Acacia Ridge, to the south. This is along thesame corridor, from Acacia Ridge to Kagaru, as the East Coast railway and the planned POB railway.It then becomes a question of which project occurs first, as the current State Government’s plansinclude the lifting of the vertical clearances to allow for electric overheads and for two separatedfreight lines. The total works are estimated to cost $1.6 billion in 2010 dollars. The basis for theGovernment’s plans is the development of a large new town at Flagstone, just north of Beaudesert.This is planned to have over 125,000 people timed to occur in the next 10 – 20 years. The newsuburban train line would work in with the development. While much needs to happen, for thepurposes of our model, we are assuming that the rail line is built and paid for by Government by2027, 15 years hence. At that date, with the POB railway connected to the upgraded line, double
141 This back of the envelope calculation takes time in a day (1440 minutes), divide it by the time taken to traverse the longestsingle track portion (we have estimated 30 minutes on a 70 km section), multiply it by a redundancy factor (we have allowedby 80% for delays), then divided by the amount of track available as a ratio of the distance (we have allowed for one passingloop of 2.5km plus the track distance of 70km), therefore 72.5/70 = 1.03 This results in 40 train paths a day. This method isused by Queensland Rail Ltd train controllers as an indicator. Further precision would require specialist modelling.

Australian Government Department of Infrastructure and Regional DevelopmentA study of the potential for dedicated freight infrastructure in Australia Ernst & Young ÷ 136
stacking could commence142. In our model, in 2027, containers on rail increase by 100% from 0.39mto 0.78m due to the commencement of double stacking from the port to Acacia Ridge.
As highlighted in Section 3.1, rudimentary calculations of track capacity indicate that the railway, asplanned, will have the capacity required to handle the specified train consists and tonnages. Thisapplies particularly to the Eastern Bypass section that would be duplicated in 2030. This is theportion of track which most containers use.
4.3 Reductions in Queensland Rail Ltd’s Citytrain network capacityrequirements
Building the new dedicated freight line removes freight trains from the Citytrain network releasingcapacity for more suburban trains. Our discussions with QR Ltd, the track manager, have identifiedthe benefits, mainly on the Ipswich line, where the freight and passenger trains compete for spaceon one of the busiest lines in the network. The savings identified here are estimated at up to$1billion as a result of not being required build an additional two tracks from Darra to Ipswich andnot undertake an extensive redevelopment of Ipswich station to accommodate the additional lines.While delays in construction costs would not normally be included in a CBA, these have been takenas a proxy for the decongestion benefits that would be achieved on the Citytrain network due to theremoval of current and planned freight movements.
A related aspect of the removal of the freight trains is impact on maintenance costs. Freight trainsare considerably heavier than passenger trains and so cause extra wear and tear. However, due tothe significantly greater number of passenger train movements compared to freight trainmovements, this potential benefit is considered to be immaterial for this study.
4.4 Reduction in road construction and maintenance costs as aresult of the new railway
One of the promoted benefits of the new railway is that, by reducing the number of trucks on theroad, future needs for capacity enhancements and ongoing maintenance costs would be reduced (orpotentially delayed by a significant period).
The potential to include these benefits depends on a number of factors. In the case of futurecapacity enhancements, any financial benefit associated with a decision to delay an investmentwould likely be offset by a loss in decongestion benefits for users of the road. It would only provide amaterial benefit if the government had been over-investing in the affected section of the roadnetwork. In this case, we have assumed that the Government of Queensland has been investing inthe road network at or near the optimal level.
4.5 Additional port costs to handle up to 50 million tonnes of coalby rail
Table 42 below contains the cost estimates for the additional port infrastructure needed at the portto handle up to 50 million tonnes of coal by rail. The data was provided by the port. In the model wehave assumed that 50% of the money would be spent in 2022 and the additional 50% in 2030.Table 42: Additional port costs for 50 million tonnes of coal
Item Cost ($, millions)
Ship loader 30
142 This point highlights a common finding we have found with this project. That is the intertwined impacts it has with otherprojects. This includes the Inland Rail from Melbourne to Brisbane, this suburban line form Salisbury to Beaudesert andsubstantial impacts and benefits, discussed in Section 3.3 to the Citytrain network as a result of removing freight trains,currently carrying 10m tonnes of freight a year, from it. It also could have impacts on the subsidies the QueenslandGovernment pays to Queensland Rail Ltd through “Train Service Contracts” (TSC) for below rail on the Citytrain network andfor the above and below rail on the Western line.
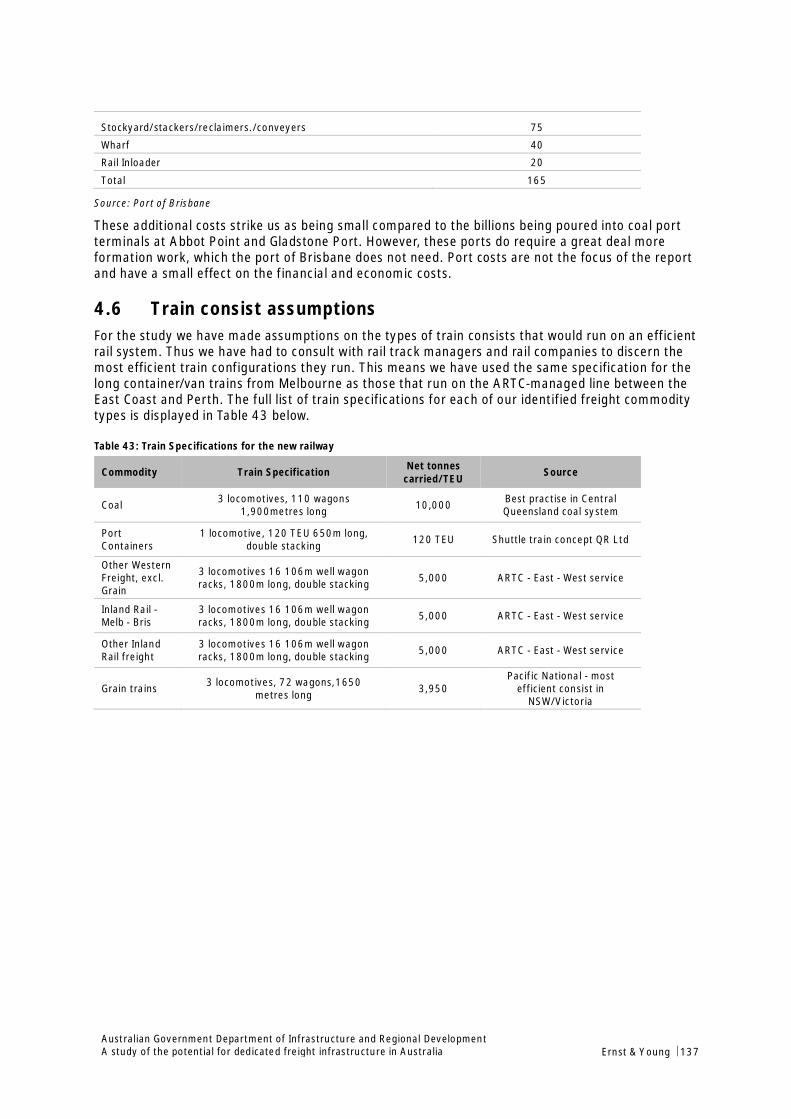
Australian Government Department of Infrastructure and Regional DevelopmentA study of the potential for dedicated freight infrastructure in Australia Ernst & Young ÷ 137
Stockyard/stackers/reclaimers./conveyers 75
Wharf 40
Rail Inloader 20
Total 165
Source: Port of Brisbane
These additional costs strike us as being small compared to the billions being poured into coal portterminals at Abbot Point and Gladstone Port. However, these ports do require a great deal moreformation work, which the port of Brisbane does not need. Port costs are not the focus of the reportand have a small effect on the financial and economic costs.
4.6 Train consist assumptionsFor the study we have made assumptions on the types of train consists that would run on an efficientrail system. Thus we have had to consult with rail track managers and rail companies to discern themost efficient train configurations they run. This means we have used the same specification for thelong container/van trains from Melbourne as those that run on the ARTC-managed line between theEast Coast and Perth. The full list of train specifications for each of our identified freight commoditytypes is displayed in Table 43 below.
Table 43: Train Specifications for the new railway
Commodity Train Specification Net tonnescarried/TEU Source
Coal 3 locomotives, 110 wagons1,900metres long 10,000 Best practise in Central
Queensland coal system
PortContainers
1 locomotive, 120 TEU 650m long,double stacking 120 TEU Shuttle train concept QR Ltd
Other WesternFreight, excl.Grain
3 locomotives 16 106m well wagonracks, 1800m long, double stacking 5,000 ARTC - East - West service
Inland Rail -Melb - Bris
3 locomotives 16 106m well wagonracks, 1800m long, double stacking 5,000 ARTC - East - West service
Other InlandRail freight
3 locomotives 16 106m well wagonracks, 1800m long, double stacking 5,000 ARTC - East - West service
Grain trains 3 locomotives, 72 wagons,1650metres long 3,950
Pacific National - mostefficient consist in
NSW/Victoria
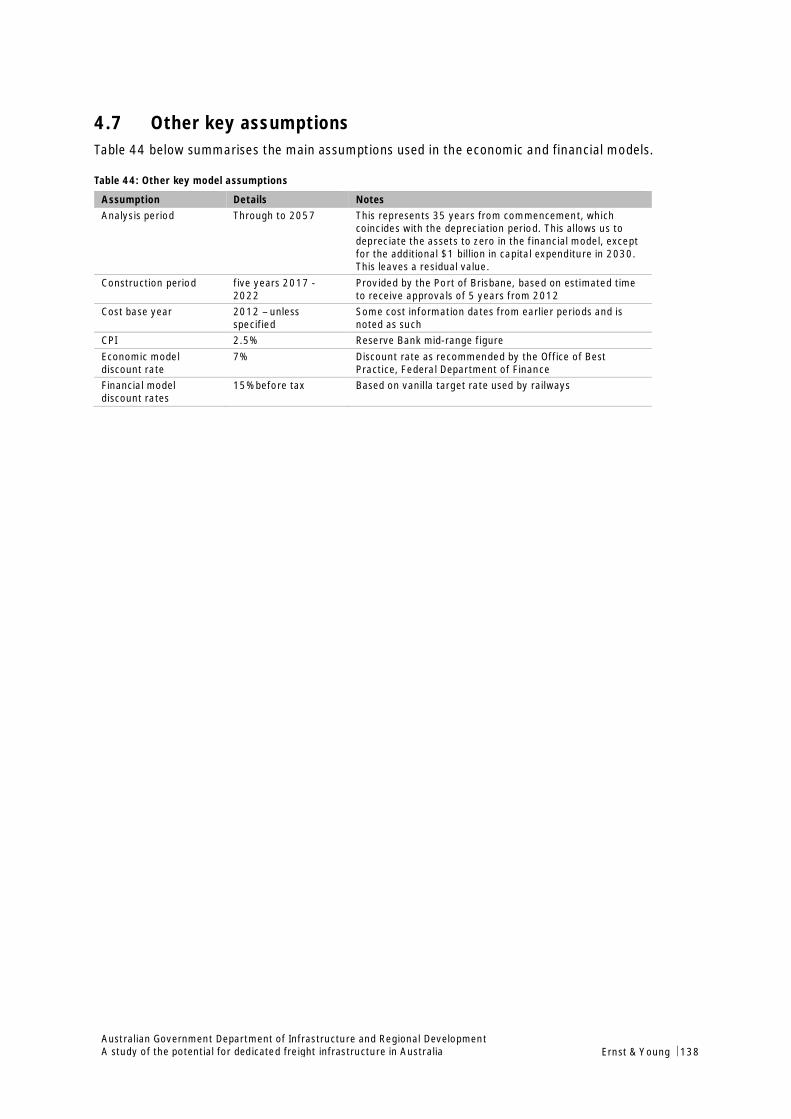
Australian Government Department of Infrastructure and Regional DevelopmentA study of the potential for dedicated freight infrastructure in Australia Ernst & Young ÷ 138
4.7 Other key assumptionsTable 44 below summarises the main assumptions used in the economic and financial models.
Table 44: Other key model assumptions
Assumption Details NotesAnalysis period Through to 2057 This represents 35 years from commencement, which
coincides with the depreciation period. This allows us todepreciate the assets to zero in the financial model, exceptfor the additional $1 billion in capital expenditure in 2030.This leaves a residual value.
Construction period five years 2017 -2022
Provided by the Port of Brisbane, based on estimated timeto receive approvals of 5 years from 2012
Cost base year 2012 – unlessspecified
Some cost information dates from earlier periods and isnoted as such
CPI 2.5% Reserve Bank mid-range figureEconomic modeldiscount rate
7% Discount rate as recommended by the Office of BestPractice, Federal Department of Finance
Financial modeldiscount rates
15% before tax Based on vanilla target rate used by railways
Australian Government Department of Infrastructure and Regional DevelopmentA study of the potential for dedicated freight infrastructure in Australia Ernst & Young ÷ 139
5. Economic appraisal (rapid cost-benefitanalysis)
5.1 IntroductionThis appraisal has been conducted in line with the National Guidelines for Transport SystemManagement as provided by the Australian Transport Council (ATC) in 2006. We have also used thelatest Austroads manual on project evaluation for a number of variables as well as other sourcessuch as the ARTC reports on the Inland Rail from Melbourne to Brisbane, undertaken in 2009/10.
The cost benefit analysis is designed to assess the impacts of the proposed rail line from the point ofview of the Australian community. The costs and benefits analysed in this study include only thequantifiable costs and benefits that can also be monetised using available parameters. We haveemployed a “traditional” cost-benefit approach and have not included Wider Economic benefits(WEB).
The costs and benefits included in the analysis are:
► Delayed and avoided construction costs (i.e. as a proxy for urban rail user benefits)
► Changes in environmental external costs including:
► Changes in greenhouse gas emissions
► Changes in noise pollution costs
► Changes in air pollution costs
► Changes in crash/accident costs
► Changes in maintenance costs
► Changes in vehicle operating costs
► The value of time saved
► The capital costs of the proposed railway.
It should also be noted that this is not an economic impact study and, as such, the potential impactson employment have not been considered.
A limitation of this study is that we have not undertaken detailed modelling of the impacts on thefreight sector and the wider transport network. Detailed modelling is beyond the scope of this studyand would be part of a formal feasibility study and/or business case.
5.2 General assumptionsThe following table shows the general assumptions which have been applied for the economicanalysis. Assumptions related specifically to a certain benefits or costs have been addressed in therelevant section.
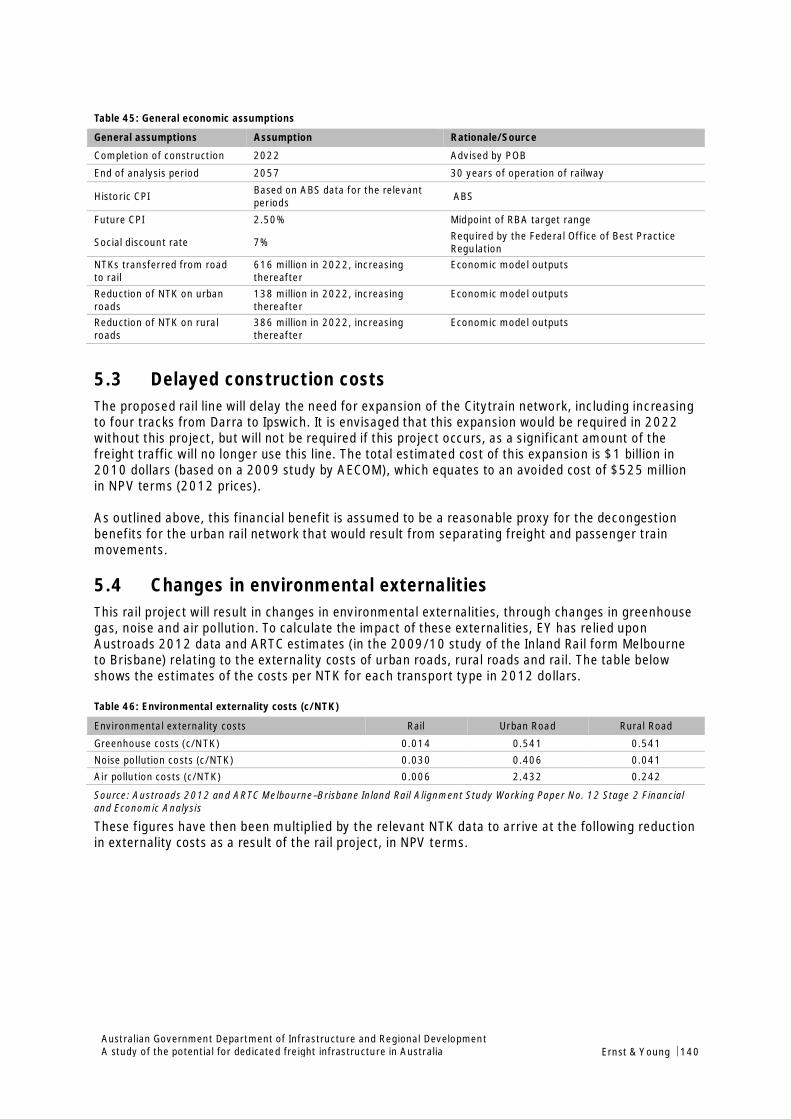
Australian Government Department of Infrastructure and Regional DevelopmentA study of the potential for dedicated freight infrastructure in Australia Ernst & Young ÷ 140
Table 45: General economic assumptions
General assumptions Assumption Rationale/Source
Completion of construction 2022 Advised by POB
End of analysis period 2057 30 years of operation of railway
Historic CPI Based on ABS data for the relevantperiods ABS
Future CPI 2.50% Midpoint of RBA target range
Social discount rate 7% Required by the Federal Office of Best PracticeRegulation
NTKs transferred from roadto rail
616 million in 2022, increasingthereafter
Economic model outputs
Reduction of NTK on urbanroads
138 million in 2022, increasingthereafter
Economic model outputs
Reduction of NTK on ruralroads
386 million in 2022, increasingthereafter
Economic model outputs
5.3 Delayed construction costsThe proposed rail line will delay the need for expansion of the Citytrain network, including increasingto four tracks from Darra to Ipswich. It is envisaged that this expansion would be required in 2022without this project, but will not be required if this project occurs, as a significant amount of thefreight traffic will no longer use this line. The total estimated cost of this expansion is $1 billion in2010 dollars (based on a 2009 study by AECOM), which equates to an avoided cost of $525 millionin NPV terms (2012 prices).
As outlined above, this financial benefit is assumed to be a reasonable proxy for the decongestionbenefits for the urban rail network that would result from separating freight and passenger trainmovements.
5.4 Changes in environmental externalitiesThis rail project will result in changes in environmental externalities, through changes in greenhousegas, noise and air pollution. To calculate the impact of these externalities, EY has relied uponAustroads 2012 data and ARTC estimates (in the 2009/10 study of the Inland Rail form Melbourneto Brisbane) relating to the externality costs of urban roads, rural roads and rail. The table belowshows the estimates of the costs per NTK for each transport type in 2012 dollars.
Table 46: Environmental externality costs (c/NTK)
Environmental externality costs Rail Urban Road Rural Road
Greenhouse costs (c/NTK) 0.014 0.541 0.541Noise pollution costs (c/NTK) 0.030 0.406 0.041Air pollution costs (c/NTK) 0.006 2.432 0.242
Source: Austroads 2012 and ARTC Melbourne–Brisbane Inland Rail Alignment Study Working Paper No. 12 Stage 2 Financialand Economic Analysis
These figures have then been multiplied by the relevant NTK data to arrive at the following reductionin externality costs as a result of the rail project, in NPV terms.

Australian Government Department of Infrastructure and Regional DevelopmentA study of the potential for dedicated freight infrastructure in Australia Ernst & Young ÷ 141
Table 47: Reduction in environmental externality cost (NPV, $ millions, 2012 prices)
Reduction in environmental externality cost NPV ($m)
Reduction in greenhouse costs 40Reduction in noise pollution costs 0.3Reduction in air pollution costs 18Total reduction in environmental externality cost 58.1
Source: EY calculations
5.5 Reduction in crash costsIt has been indicated that there is a lower incidence of crashes on rail as compared to the same NTKtravelling by road. Therefore, as this proposed project would result in a modal shift from road to rail,it will result in lower crash costs. Table 48 below shows the estimates of crash costs on both road andrail in 2012 dollars.
Table 48: Estimates of crash costs per NTK
Crash costs c/NTK
Rail crash costs 0.042Road crash costs 0.442Source: ARTC Melbourne–Brisbane Inland Rail Alignment Study Working Paper No. 12 Stage 2 Financial and Economic Analysis
As for the environmental externalities, these costs per NTK have been multiplied by the relevantNTKs to estimate the reduction in costs as a result of the proposed project. Over the analysis period,this results in a benefit of $29 million in NPV terms (2012 prices).
5.6 Reduction in maintenance costsRail is also estimated to have lower maintenance costs compared to road. To estimate the total costof road maintenance, EY has assumed that the cost is 0.20c/NTK. This figure was derived from theARTC Inland Rail report and discussions with personnel from the Queensland Department ofTransport and Main Roads (TMR). The TMR personnel advised that the ARTC figure of 081c/NTK wassignificantly higher than the road maintenance costs incurred on the impacted road network inQueensland. This cost per NTK was then multiplied by the reduction in NTK as a result of theproposed project to estimate the total avoided road maintenance costs per annum.
The rail maintenance costs were derived by allocating the total rail maintenance costs to rail trafficwhich is assumed to transfer from road and all other rail traffic. This allocation was based on therelative NTKs of each type.
Based on these estimates, the proposed project reduces overall maintenance costs by $9 million overthe life of the project in NPV terms (2012 prices).
5.7 Reduction in vehicle operating costsRail rolling stock and road freight vehicles have different resource operating costs, with rail rollingstick generally being less expensive to operate per unit of freight carried. The different operatingcosts have been sourced from the ARTC 2009 report, and are estimated at approximately 2.4c/NTKfor rail and 5.2c/NTK for road freight in 2012 dollars. Multiplying these figures by the relevant NTKdata, EY estimate that the NPV of the reduced vehicle operating costs is approximately $180 million(2012 prices).
5.8 Value of time savedThe proposed project will result in a modal shift from road to rail for some freight. This leads toreduced congestion on the major arterial roads which the trucks would otherwise use. The reducedcongestion, as well as resulting in delayed expansion costs, creates travel time savings for theremaining users of the road. The travel time savings will only result on congested roads. The Port of

Australian Government Department of Infrastructure and Regional DevelopmentA study of the potential for dedicated freight infrastructure in Australia Ernst & Young ÷ 142
Brisbane Road shows no serious signs of congestion and so the analysis includes only from theGateway Motorway onwards. However, the impact on the overall level of congestion is assumed to beminimal from the Beaudesert Road intersection on the Logan Motorway.
Estimating travel times with and without the project along key freight routes that would competewith the proposed railway can be undertaken using simplified speed-flow formulations. A suitablespeed-flow relationship has been identified by Austroads in a recent research report, which outlinesa function developed by the US Bureau of Public Roads.143
For this study, we have used a simplified formulation obtained from the (then) Bureau of Transportand Regional Economics.144
The levels of congestion at different points on the Gateway Motorway vary, as does the likelyreduction in freight traffic. EY has broken down the impacted road into seven segments, describedby the Gateway Motorway’s intersection with perpendicular streets:
► Port of Brisbane - Wynnum Road
► Wynnum Road - Old Cleveland Road
► Old Cleveland Road - Mt Gravatt-Capalaba Road
► Mt Gravatt-Capalaba Road - Pacific Motorway
► Pacific Motorway - Compton Road
► Compton Road - Logan Motorway
► Logan Motorway - Beaudesert Rd
5.8.1 Estimation of t0
For each of these segments of road, EY has estimated the length of the section of road, the timetaken to travel the segment assuming a 100km/hr speed limit, and then calculated the time taken totraverse each segment with no impediment. This is represented in Table 49 below.
Table 49: Assumptions to estimate time taken to traverse the road with congestion
Segments of Gateway Length (km) Speed limit(km/h)
Time to traverse section of roadwithout impediment (T0) (in
minutes)
Port of Brisbane - Wynnum Road 2.3 100 1.38Wynnum Road - Old Cleveland Road 3.4 100 2.04Old Cleveland Road - Mt Gravatt-Capalaba Road 4.8 100 2.88Mt Gravatt-Capalaba Road - Pacific Motorway 4.3 100 2.58Pacific Motorway - Compton Road 4.4 100 2.64Compton Road - Logan Motorway 4.5 100 2.7Logan Motorway - Beaudesert Rd 2.2 100 1.32
5.8.2 Estimation of VCRThe volume to capacity ratio is simply the estimated volume of traffic divided by the assumedcapacity of the road. In line with the assumptions used in the BTRE paper, capacity is assumed to be2,400 Passenger Car Units (PCU) per lane per hour. The volume of traffic on each segment of roadunder the scenario without the proposed project is calculated by:
143 Austroads Research Report AP-R393-11, Speed-flow Relationships: Implications of Project Appraisal, p.11144 The Economic Efficiency of Lane Differentiation Policies Staff paper given by Dr Mark Harvey to the 28th AustralasianTransport Research Forum, 28-30 September 2005, Sofitel Wentworth Hotel, Sydney. We are here using this formula as proxyas to undertake a full analysis would involve a specialised transport model.
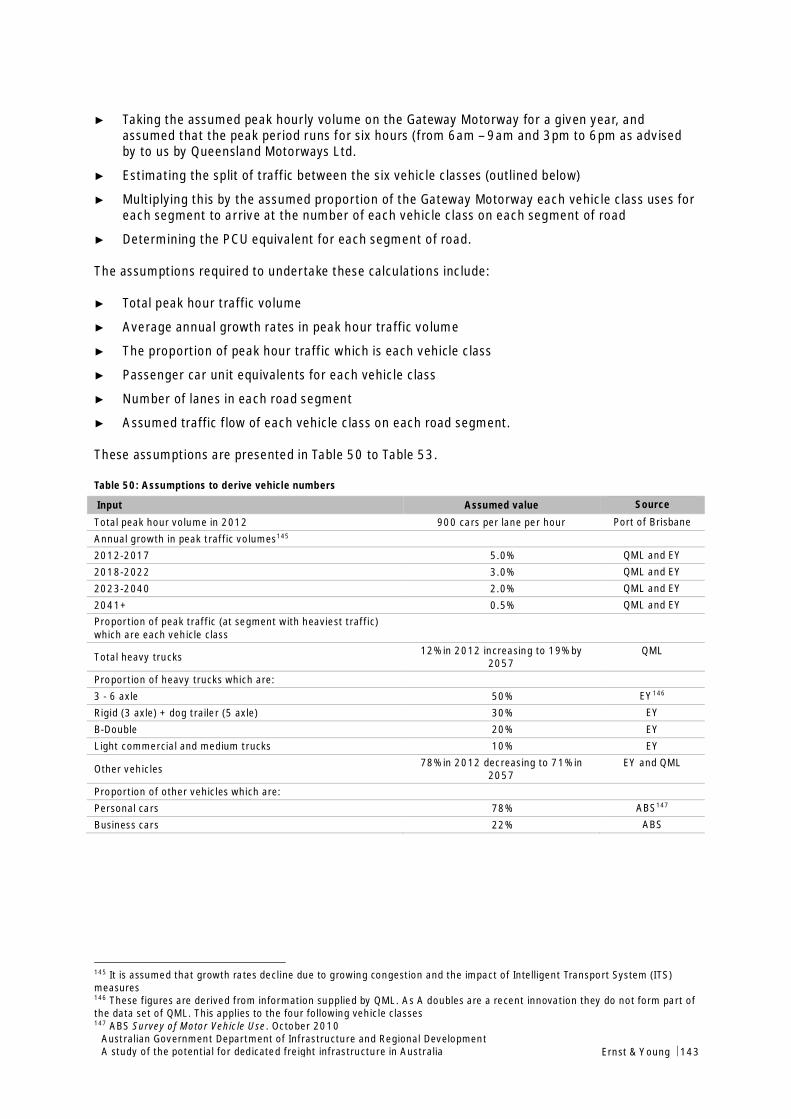
Australian Government Department of Infrastructure and Regional DevelopmentA study of the potential for dedicated freight infrastructure in Australia Ernst & Young ÷ 143
► Taking the assumed peak hourly volume on the Gateway Motorway for a given year, andassumed that the peak period runs for six hours (from 6am – 9am and 3pm to 6pm as advisedby to us by Queensland Motorways Ltd.
► Estimating the split of traffic between the six vehicle classes (outlined below)
► Multiplying this by the assumed proportion of the Gateway Motorway each vehicle class uses foreach segment to arrive at the number of each vehicle class on each segment of road
► Determining the PCU equivalent for each segment of road.
The assumptions required to undertake these calculations include:
► Total peak hour traffic volume
► Average annual growth rates in peak hour traffic volume
► The proportion of peak hour traffic which is each vehicle class
► Passenger car unit equivalents for each vehicle class
► Number of lanes in each road segment
► Assumed traffic flow of each vehicle class on each road segment.
These assumptions are presented in Table 50 to Table 53.
Table 50: Assumptions to derive vehicle numbers
Input Assumed value Source
Total peak hour volume in 2012 900 cars per lane per hour Port of BrisbaneAnnual growth in peak traffic volumes145
2012-2017 5.0% QML and EY2018-2022 3.0% QML and EY2023-2040 2.0% QML and EY2041+ 0.5% QML and EYProportion of peak traffic (at segment with heaviest traffic)which are each vehicle class
Total heavy trucks 12% in 2012 increasing to 19% by2057
QML
Proportion of heavy trucks which are:3 - 6 axle 50% EY146
Rigid (3 axle) + dog trailer (5 axle) 30% EYB-Double 20% EYLight commercial and medium trucks 10% EY
Other vehicles 78% in 2012 decreasing to 71% in2057
EY and QML
Proportion of other vehicles which are:Personal cars 78% ABS147
Business cars 22% ABS
145 It is assumed that growth rates decline due to growing congestion and the impact of Intelligent Transport System (ITS)measures146 These figures are derived from information supplied by QML. As A doubles are a recent innovation they do not form part ofthe data set of QML. This applies to the four following vehicle classes147 ABS Survey of Motor Vehicle Use. October 2010
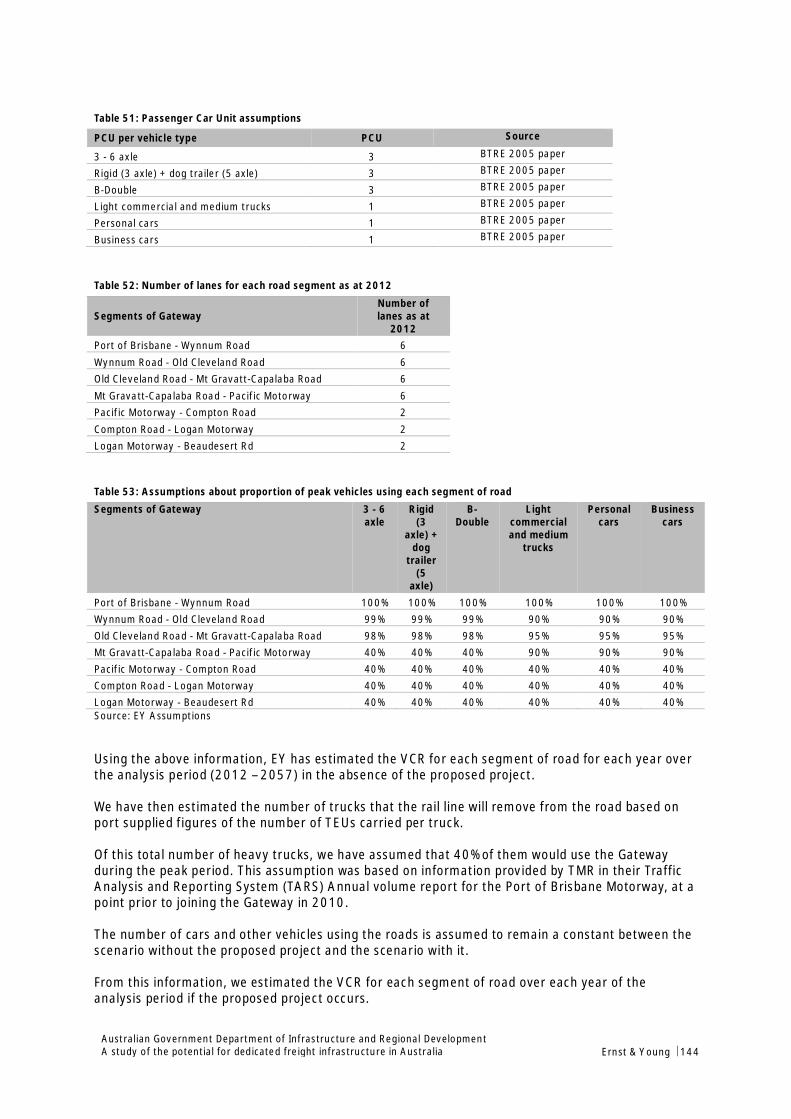
Australian Government Department of Infrastructure and Regional DevelopmentA study of the potential for dedicated freight infrastructure in Australia Ernst & Young ÷ 144
Table 51: Passenger Car Unit assumptions
PCU per vehicle type PCU Source
3 - 6 axle 3 BTRE 2005 paper
Rigid (3 axle) + dog trailer (5 axle) 3 BTRE 2005 paper
B-Double 3 BTRE 2005 paper
Light commercial and medium trucks 1 BTRE 2005 paper
Personal cars 1 BTRE 2005 paper
Business cars 1 BTRE 2005 paper
Table 52: Number of lanes for each road segment as at 2012
Segments of GatewayNumber oflanes as at
2012Port of Brisbane - Wynnum Road 6Wynnum Road - Old Cleveland Road 6Old Cleveland Road - Mt Gravatt-Capalaba Road 6Mt Gravatt-Capalaba Road - Pacific Motorway 6Pacific Motorway - Compton Road 2Compton Road - Logan Motorway 2Logan Motorway - Beaudesert Rd 2
Table 53: Assumptions about proportion of peak vehicles using each segment of road
Segments of Gateway 3 - 6axle
Rigid(3
axle) +dog
trailer(5
axle)
B-Double
Lightcommercialand medium
trucks
Personalcars
Businesscars
Port of Brisbane - Wynnum Road 100% 100% 100% 100% 100% 100%Wynnum Road - Old Cleveland Road 99% 99% 99% 90% 90% 90%Old Cleveland Road - Mt Gravatt-Capalaba Road 98% 98% 98% 95% 95% 95%Mt Gravatt-Capalaba Road - Pacific Motorway 40% 40% 40% 90% 90% 90%Pacific Motorway - Compton Road 40% 40% 40% 40% 40% 40%Compton Road - Logan Motorway 40% 40% 40% 40% 40% 40%Logan Motorway - Beaudesert Rd 40% 40% 40% 40% 40% 40%Source: EY Assumptions
Using the above information, EY has estimated the VCR for each segment of road for each year overthe analysis period (2012 – 2057) in the absence of the proposed project.
We have then estimated the number of trucks that the rail line will remove from the road based onport supplied figures of the number of TEUs carried per truck.
Of this total number of heavy trucks, we have assumed that 40% of them would use the Gatewayduring the peak period. This assumption was based on information provided by TMR in their TrafficAnalysis and Reporting System (TARS) Annual volume report for the Port of Brisbane Motorway, at apoint prior to joining the Gateway in 2010.
The number of cars and other vehicles using the roads is assumed to remain a constant between thescenario without the proposed project and the scenario with it.
From this information, we estimated the VCR for each segment of road over each year of theanalysis period if the proposed project occurs.
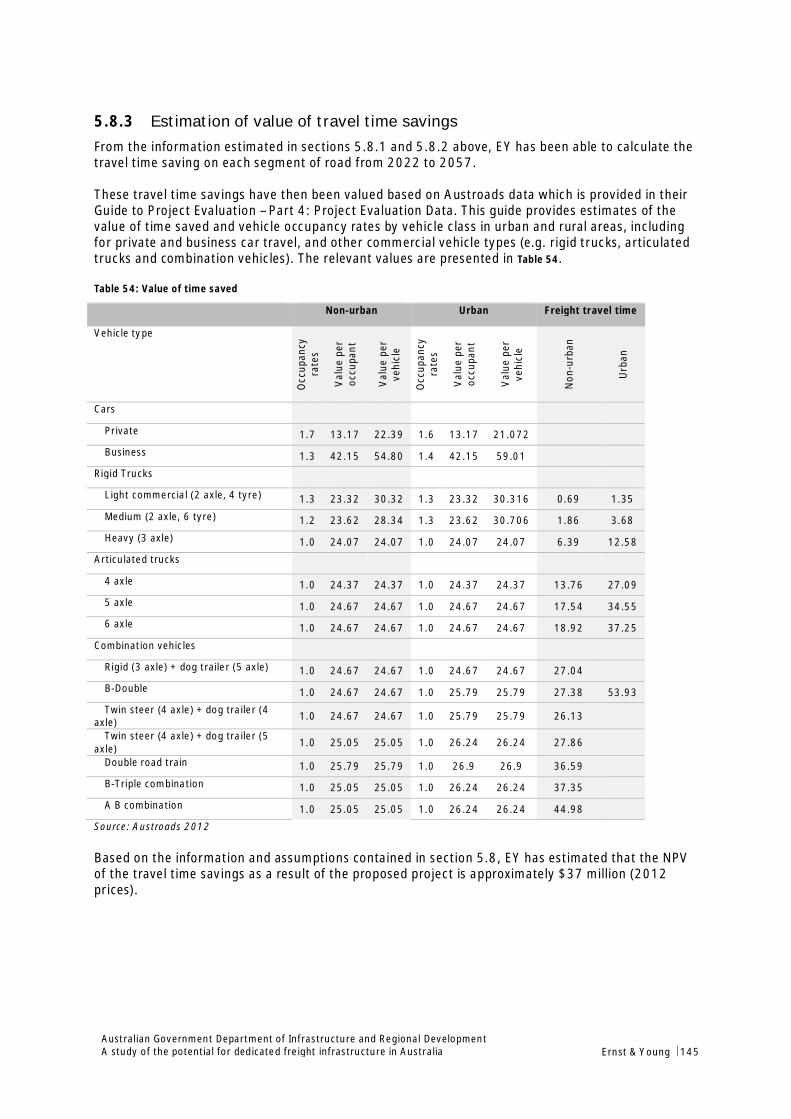
Australian Government Department of Infrastructure and Regional DevelopmentA study of the potential for dedicated freight infrastructure in Australia Ernst & Young ÷ 145
5.8.3 Estimation of value of travel time savingsFrom the information estimated in sections 5.8.1 and 5.8.2 above, EY has been able to calculate thetravel time saving on each segment of road from 2022 to 2057.
These travel time savings have then been valued based on Austroads data which is provided in theirGuide to Project Evaluation – Part 4: Project Evaluation Data. This guide provides estimates of thevalue of time saved and vehicle occupancy rates by vehicle class in urban and rural areas, includingfor private and business car travel, and other commercial vehicle types (e.g. rigid trucks, articulatedtrucks and combination vehicles). The relevant values are presented in Table 54.
Table 54: Value of time saved
Non-urban Urban Freight travel time
Vehicle type
Occ
upan
cyra
tes
Val
uepe
roc
cupa
nt
Val
uepe
rve
hicl
e
Occ
upan
cyra
tes
Val
uepe
roc
cupa
nt
Val
uepe
rve
hicl
e
Non
-urb
an
Urb
an
Cars
Private 1.7 13.17 22.39 1.6 13.17 21.072
Business 1.3 42.15 54.80 1.4 42.15 59.01
Rigid Trucks
Light commercial (2 axle, 4 tyre) 1.3 23.32 30.32 1.3 23.32 30.316 0.69 1.35
Medium (2 axle, 6 tyre) 1.2 23.62 28.34 1.3 23.62 30.706 1.86 3.68
Heavy (3 axle) 1.0 24.07 24.07 1.0 24.07 24.07 6.39 12.58
Articulated trucks
4 axle 1.0 24.37 24.37 1.0 24.37 24.37 13.76 27.09
5 axle 1.0 24.67 24.67 1.0 24.67 24.67 17.54 34.55
6 axle 1.0 24.67 24.67 1.0 24.67 24.67 18.92 37.25
Combination vehicles
Rigid (3 axle) + dog trailer (5 axle) 1.0 24.67 24.67 1.0 24.67 24.67 27.04
B-Double 1.0 24.67 24.67 1.0 25.79 25.79 27.38 53.93
Twin steer (4 axle) + dog trailer (4axle) 1.0 24.67 24.67 1.0 25.79 25.79 26.13
Twin steer (4 axle) + dog trailer (5axle) 1.0 25.05 25.05 1.0 26.24 26.24 27.86
Double road train 1.0 25.79 25.79 1.0 26.9 26.9 36.59
B-Triple combination 1.0 25.05 25.05 1.0 26.24 26.24 37.35
A B combination 1.0 25.05 25.05 1.0 26.24 26.24 44.98
Source: Austroads 2012
Based on the information and assumptions contained in section 5.8, EY has estimated that the NPVof the travel time savings as a result of the proposed project is approximately $37 million (2012prices).

Australian Government Department of Infrastructure and Regional DevelopmentA study of the potential for dedicated freight infrastructure in Australia Ernst & Young ÷ 146
5.9 Summary economic resultsThe economic results for the concept project are summarised in the table below.
The economic benefits presented are ‘net’ benefits, meaning that they represent savings inexternalities, VOCs and time from using rail in the project case instead of road in the base case. Forexample, section 5.7 shows how the difference in operating costs across the two modes have beenused in determining the overall reduction in vehicle operating costs.
Table 55: Summary economic results (NPV, $ millions, 2012 prices)
Economic benefits NPV ($m)
Reduced CityRail construction costs 525Reduction in environmental externality cost (total) 58.1
Reduction in greenhouse costs 40Reduction in noise pollution costs 0.3Reduction in air pollution costs 18
Reduction in maintenance costs 9Reduction in vehicle operating costs 180Value of time saved 37Residual asset value (asset life = 50 years) 268Total economic benefits 1,106Investment costs (discounted from $7 billion) 4,755Economic indicatorsProject NPV -2,811BCR 0.23
Source: EY calculations
The negative NPV figure is substantially driven by the high capital cost of $7 billion (discounted toaround $4.8 billion for comparison with the economic benefits). This suggests that for this conceptproject to be a success, lower cost design solutions may need to be considered.
While this analysis has identified some significant benefits in terms of forgone expenditure on theCitytrain network, plus savings in value of time, vehicle running costs and the normal range ofexternalities, the benefits analysed in this case study fall significantly short of the costs on an NPVbasis. This suggests that considerable effort is required to better define and value the marketopportunities for the Port and railway in order to increase the value for money potential of theconcept project.
Advice from the Port of Brisbane is that lower cost options currently are being investigated as partof its pre-feasibility study. This could have a significant bearing on project feasibility considerations.The Port has also been re-thinking and updating its assessment of market potential for the project,and preliminary findings suggest the railway may delivery greater value potential than what hasbeen modelled in this case study.

Australian Government Department of Infrastructure and Regional DevelopmentA study of the potential for dedicated freight infrastructure in Australia Ernst & Young ÷ 147
6. Financial analysis
6.1 ObjectiveThe objective of our financial analysis is to provide an indication of the commercial feasibility of theconcept project. In doing this, we have assumed that the project can be delivered through a privatesector funding solution. According to the Port of Brisbane, the current market conditions for coalexports provide the opportunity to fund the new infrastructure at no costs to the Government.
In order to attract private sector funding the project must provide investors with a sufficient returnon their investment. Generally, funding is only committed when the cash flows required to providethe targeted returns are secured through long-term contracts. The contract arrangements determinethe costs of below rail access for the rail users and provide the infrastructure owners with therevenue to meet their costs of capital requirements. On the other hand, mining companies and otherrail users would only engage in such arrangements if the access charges for the new railinfrastructure are competitive compared to alternative solution and allow a profitable operation ofthe entire supply chain.
The proposal would only be feasible if it offers users a competitive and affordable rail solution andsimultaneously provides the infrastructure owners with an appropriate return on their investment.On the basis this principle we indicatively calculate the below rail access charges for the potentialuser groups identified and benchmark them against alternative projects (and current commodityprices). It is envisaged that the result will provide a reference to whether the private sector is likelyto fund the project without a government contribution.
6.2 MethodologyOur analysis assumes a private investor or investor group funds the capital costs and charges usersfor below rail access. It is further assumed that the Project is funded on a standalone basis. Thismeans, the analysis does not consider any cash flows or strategic benefits that may derive fromintegrating other parts of the supply chain (e.g. port, mine, above rail). The infrastructure owneronly receives revenues from below rail access charges. Operations and maintenance for below rail isconsidered to be passed through to the user at costs.
Although it is unlikely that the new rail infrastructure will become a regulated asset, it is common touse regulated pricing principles to calculate the capital investor’s required revenue on a preliminarybasis.
The annual revenue requirement is the total amount of access charges an investor must earn tocover its cost of capital (return on capital) and recover its investment over the determinedinvestment period (return of capital).
For pricing purposes it is assumed that the rail asset is depreciated over a period of 35 years on astraight line basis matching the assumed operating period of the Project (2022-2056). The assetsmay have different useful lives for tax and accounting purposes. It is However, noted that there isevidence that infrastructure owners aim to recover capital over a shorter period to reduce the assetstranding risk. It has also been argued that it is challenging to obtain financing for infrastructureprojects of this scale over terms longer than 20 years. As a result proponents price access for newinfrastructure to recover the capital costs over periods of 20 years and less. The QueenslandCompetition Authority has acknowledged these issues by allowing accelerated depreciation forpricing in relation to QR Network’s existing regulated assets148.
148 QRN Access Undertaking
Australian Government Department of Infrastructure and Regional DevelopmentA study of the potential for dedicated freight infrastructure in Australia Ernst & Young ÷ 148
The Project considers a diverse freight mix and is not solely relying on coal from a limited customerbase. Financiers therefore may consider longer capital cycles. A better understanding of the capitalmarket requirements for this particular project would develop from a detailed market sounding at amore advanced stage of the Project.
A detailed market sounding exercise would be particularly useful to approximate the cost of capitalrequirements as financiers consider a range of parameters that cannot be determined at this stageof the Project. Aside from the market condition, the evaluation of the project risk is the keydetermining factor when assessing the required return. In particular, financiers assess commercialarrangements between the infrastructure owner and users documented in the contracts. Forexample, the project risk may significantly vary on the basis of the following parameters:
► Term of contracts
► Characteristics of the contracting parties involved (e.g. financial strength, product and resourceportfolio, customer base)
► Securities guaranteeing contract payments (e.g. bank and/or parent company guarantee)
► Risk allocation (e.g. who bears construction risk?)
Since the Project is a preliminary stage and detailed commercial information is currently unavailablefor the purpose of pricing access as part of this preliminary assessment, we have considered costs ofcapital that range between the following two benchmarks:
► The regulated return as determined by the QRN in the 2010 Access Undertaking of 9.96%(vanilla WACC)
► A 15% pre-tax WACC as proposed by QRN in regards to the Wiggins Island Rail Project.
6.3 Annual revenue requirement (ARR)Following the methodology discussed above we have calculated a band for the investor’s estimatedannual revenue (ARR) requirements. As depicted in figure 16 below it is confined by two lines, whichrepresent the ARR based on benchmark rates of return. The lower bound (grey line) represents therevenue an investor would earn each year under the current regulated pricing regime. The upperbound (yellow line) is calculated on the basis of the 15% pre-tax WACC.
The higher WACC has a large effect on the ARR at the start of the project. As the asset basedecreases, the gap between the two estimates narrows due the lower impact of the return on capitalcomponent. This is because the returns are calculated as fixed WACC percentages against thedepreciated (book) value of the investment.149
As outlined in Section 4.1, it assumed that the Eastern Freight Bypass requires a capacity upgrade in2030 incurring capital cost of $1bn ($ 2012). The capital costs are added to the asset baseresulting in an increased ARR.
149 In theory, you could smooth the revenues to maintain a constant differential between the two over time.

Australian Government Department of Infrastructure and Regional DevelopmentA study of the potential for dedicated freight infrastructure in Australia Ernst & Young ÷ 149
Figure 16: Annual revenue required to service cost of capital
6.4 Below rail access chargesThe ARR must be achieved by charging access to the rail users. Usually, the rail customersnegotiate a fixed fee for a specific capacity on a take-or-pay basis. As discussed above, due to theearly stage of the project there is not sufficient information to model contracted access charges onthe basis of contract arrangements. We have therefore calculated the access charges based on therail freight demand identified in Section 3.2 rather than user-specific contracted tonnage. Hence, the$/t access charges calculated for each specific year are a function of the ARR and the actualtonnage running over the network in the respective period. As depicted in figure 17 below, thisresults in significantly higher access charges during ramp up. Any increase in throughput instantlydecreases the $/t charges as the costs (i.e. ARR) are shared across a higher tonnage.
Figure 17 illustrates the development of $/t access charges on the basis of the assumed tonnageprofile. As documented in Section 3 and 4 we have considered a range of assumption in relation tothe freight demand and calculated price indications for each of the identified freight categories. Theaccess charges depicted in the overview below represent the average access charges for allcategories. The $/t charges are presented as nominal values, i.e. the amount that has to be paid inthe respective year.
Figure 17: Tonnages and access charges over a 35 year period
It has been assumed that the rail network would transport multiple products travelling on differentsegments of the network. The capital cost estimates per rail kilometre are significantly higher forthe Eastern Freight Bypass than for the western segments of the network due to the highercomplexity of the works in a developed urban environment. In order to assess the access chargesspecific to the freight category we first have calculated the required total charges (i.e. ARR) foreach segment individually, meaning the required charges are only shared between the customers
-
500.0
1,000.0
1,500.0
2,000.0
2,500.020
2220
2320
2420
2520
2620
2720
2820
2920
3020
3120
3220
3320
3420
3520
3620
3720
3820
3920
4020
4120
4220
4320
4420
4520
4620
4720
4820
4920
5020
5120
5220
5320
5420
5520
56
$m
Annual Revenue Requirement
Regulated WACC 15% pre-tax WACC
-20.0
40.060.0
80.0100.0120.0
-20.0
40.060.0
80.0100.0120.0
2022 2024 2026 2028 2030 2032 2034 2036 2038 2040 2042 2044 2046 2048 2050 2052 2054 2056
$/t
Average access charges ($/t) based on actual tonnage profile
Coal Port Container Freight
SEQ Freight Inland Rail Freight
Access Charges $/t (Regulated WACC) Access Charges $/t (15% pre-tax WACC)

Australian Government Department of Infrastructure and Regional DevelopmentA study of the potential for dedicated freight infrastructure in Australia Ernst & Young ÷ 150
using the particular segment. As the distance travelled on a certain segments and consists used mayvary between the different products and users, we further allocate the segment costs on the basisof gross tonne kilometres (GTK) and train paths.
By allocating the costs on the basis of GTK instead of simply using tonnage, we acknowledge thedistance a product is transported on the network. GTK also account for the weight of the trains usedfor the transport of the product and any empty return trips required (e.g. coal).
However, a tariff structure solely based on GTK would ignore the fact that a railway’s capacity ismainly limited by the number of train paths available. By also facilitating larger consist that are ableto carry higher quantities of product, overall throughput can be significantly increased. Wetherefore assume that 40% of the costs are allocated based on train paths. However, 60% of thesegment costs will be allocated based on GTK to account for differences in distance travelled andthe fact that some of the capital costs are incurred to build the rail to the specification (40t axleloads) allowing the use of the larger consists.
Table 56 below summarises the indicative access charges by freight category. As discussed above,the access charges generally decrease over time as result of the continuously increasing demand.We have therefore presented access charges in following years of operation:
► 2022 - Start of operation – low utilisation of rail, coal in ramp up, low rail share of containerfreight demand, no freight inland rail
► 2031 - Expansion of Eastern Freight Bypass completed – coal fully ramped up, increasing railshare of container freight demand - addition of freight from inland rail.
► 2050 – Non-coal freight almost matches coal throughput.
In an effort to keep the assessment concise and allow a comparison to public available benchmarks,we have grouped the rail users by product:
► Rail charges for coal are shown for products originating from three defined areas.
► Rail costs for container freight between the Port an Acacia Ridge are presented separately tothe port containers to and from other QLD locations (e.g. Bromelton, Toowoomba)
► All freight generated by the Inland Rail has been aggregated
► SEQ freight is presented for each product category.
Where freight from and to different locations has been aggregated into a single group we havetaken the weighted average of the location specific $/tonne charges.
Corresponding to our indicative calculation of the ARR (Figure 16) and average $4/t accesscharges, we present the access charges a range representing different costs of capital. The lowerfigures being calculated using the regulated WACC and the higher figures considering a 15% pre-taxreturn.
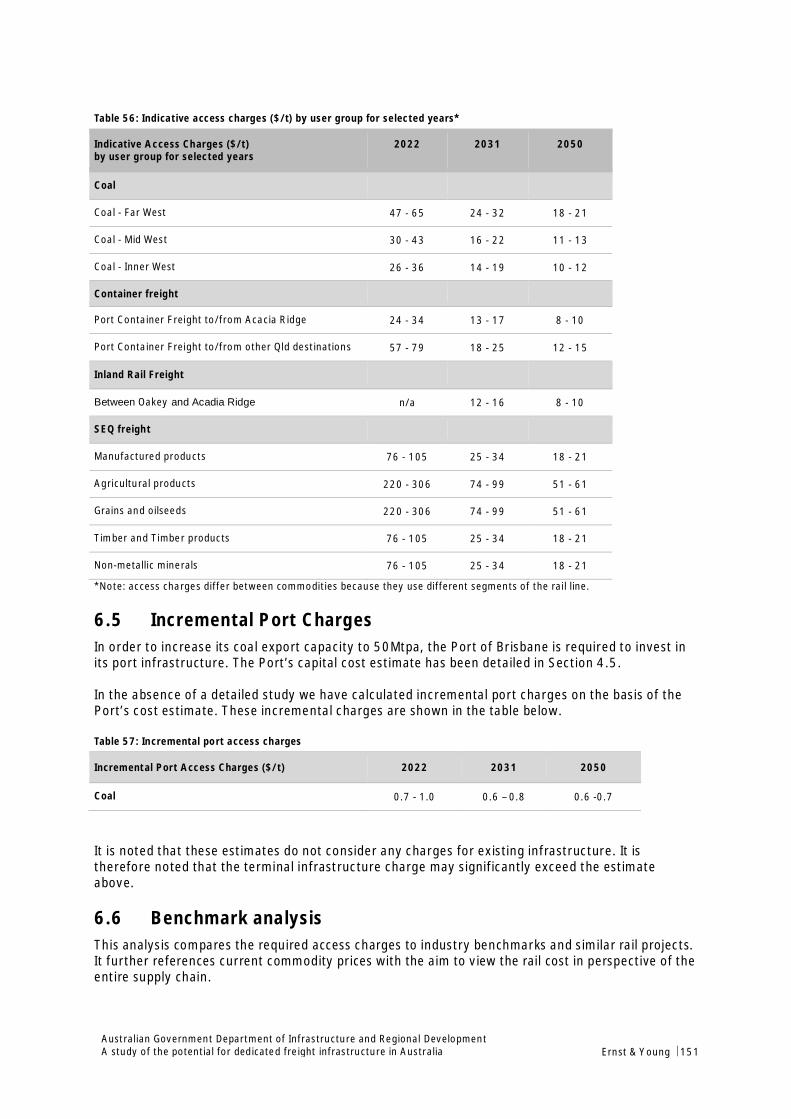
Australian Government Department of Infrastructure and Regional DevelopmentA study of the potential for dedicated freight infrastructure in Australia Ernst & Young ÷ 151
Table 56: Indicative access charges ($/t) by user group for selected years*
Indicative Access Charges ($/t)by user group for selected years
2022 2031 2050
Coal
Coal - Far West 47 - 65 24 - 32 18 - 21
Coal - Mid West 30 - 43 16 - 22 11 - 13
Coal - Inner West 26 - 36 14 - 19 10 - 12
Container freight
Port Container Freight to/from Acacia Ridge 24 - 34 13 - 17 8 - 10
Port Container Freight to/from other Qld destinations 57 - 79 18 - 25 12 - 15
Inland Rail Freight
Between Oakey and Acadia Ridge n/a 12 - 16 8 - 10
SEQ freight
Manufactured products 76 - 105 25 - 34 18 - 21
Agricultural products 220 - 306 74 - 99 51 - 61
Grains and oilseeds 220 - 306 74 - 99 51 - 61
Timber and Timber products 76 - 105 25 - 34 18 - 21
Non-metallic minerals 76 - 105 25 - 34 18 - 21
*Note: access charges differ between commodities because they use different segments of the rail line.
6.5 Incremental Port ChargesIn order to increase its coal export capacity to 50Mtpa, the Port of Brisbane is required to invest inits port infrastructure. The Port’s capital cost estimate has been detailed in Section 4.5.
In the absence of a detailed study we have calculated incremental port charges on the basis of thePort’s cost estimate. These incremental charges are shown in the table below.
Table 57: Incremental port access charges
Incremental Port Access Charges ($/t) 2022 2031 2050
Coal 0.7 - 1.0 0.6 – 0.8 0.6 -0.7
It is noted that these estimates do not consider any charges for existing infrastructure. It istherefore noted that the terminal infrastructure charge may significantly exceed the estimateabove.
6.6 Benchmark analysisThis analysis compares the required access charges to industry benchmarks and similar rail projects.It further references current commodity prices with the aim to view the rail cost in perspective of theentire supply chain.
Australian Government Department of Infrastructure and Regional DevelopmentA study of the potential for dedicated freight infrastructure in Australia Ernst & Young ÷ 152
6.6.1 CoalThe Queensland Competition Authority (QCA) has determined rail tariffs in its decision in relation tothe QRN Access Undertaking. With its 228km the Moura system has a similar size as the averagedistance between the mine sites considered in our analysis and the Port of Brisbane and is thereforeused as reference. On the basis of the 2008 determination, updated for 2012 prices, QRN maycharge approximately $3 per tonne for the Moura system. For comparison purposes, we convert theaccess charges calculated for the Coal Mid-West user group in 2031 into 2012 dollars. Although theaccess charges are calculated on the basis of a fully ramped up tonnage profile for coal, the range of$10-$13 per tonne significantly exceeds the charges for the Moura system.
However, it is noted that the Moura charges are determined for an existing regulated rail line with apartly depreciated asset base. It is therefore more appropriate to compare the charges to current raildevelopment projects in Central and North Queensland.
The availability of publically available information is very limited. As many proponents areapproaching the market and/or are currently in negotiations with potential rail customers, estimatesin relation to rail access charges are mainly treated confidentially. However, we refer to apresentation published by GVK in regards to its Alpha coal project, referencing rail costs of $9-$10per tonnes. In its initial stage the GVK rail line is proposed to transport 60Mtpa over approximately500km from the Galilee Basin to the Port of Abbot Point. Compared to the rail access charges of$15-$20 per tonne we have calculated for the coal from coal users from the Surat Basin (Coal – FarWest; distance of approx. 300-400km; in 2012 dollars) the rail solution to the Port of Brisbane isalmost twice as expansive. On this basis, rail users would have a significant disadvantage over theircompetitors further north and are unlikely to commit to the proposed rail solution.
This is further underlined by the fact that the price for Australian thermal coal has significantlydecreased over the last 18 months from $142/tonne in January 2011 to $91/tonne in June 2012.As a result, resource companies have been more cost conscious and are likely to halt projects due tohigh infrastructure costs. The rail costs calculated above are approximately 20% of the currentmarket price. Given that the coal price also has to cover port access, above rail and most importantlymine development and operating costs, it is unlikely that the rail costs of $15-$20 per tonne wouldallow a profitable operation of the supply chain under the current market conditions.
The analysis indicates that the potential users sign up to the access charges required to provide theinfrastructure owner with the required return. On this basis it can be stated that coal is not able todraw the funds required to finance the Project at it is currently proposed.
6.6.2 Container FreightThe proposal set out that container freight can benefit from the coal volumes as the higherquantities would make the transport of containers to and from the port more viable.
As discussed in Section [6.4] the total rail costs are shared between a range of freight categories.This means container freight is charged for the train paths and GTK travelled over the network. Onthis basis we have calculated that in year 2031 containers will be charged between $13 and $17 pertonne between the port and Acacia Ridge.
The transport of containers on rail faces significant competition from trucks. In order to increase themarket share of rail to the levels assumed in Section 3 the rail option must be competitively priced.The industry-accepted price to transport a TEU on a truck between the port and Acacia Ridge rangesat around $110. Considering that rail would require an additional pick-up and delivery leg totransport the container to/from its actual destination/origin (which is assumed to cost around $50),the rail costs may not exceed the benchmark of $60 per TEU to remain a competitive option.Considering the average weight of a TEU is around ten tonnes, the total rail charge must exceed$6/tonne to be competitive. Our analysis only estimates the below rail costs and does not considerabove rail charges. Assuming that the above rail costs for a shuttle operation between Acacia Ridge
Australian Government Department of Infrastructure and Regional DevelopmentA study of the potential for dedicated freight infrastructure in Australia Ernst & Young ÷ 153
and the Port are approximately as high as the below rail charges, the below charges may not behigher than $3/tonne to attract customers.
In order to compare the benchmark figure to the nominal access charges calculated in the financialanalysis, it is required to escalate the $3/tonne to represent 2031 values. Considering inflation of2.5% the equivalent benchmark in 2031 would be $4.80. This means the assumed rail solution wouldbe approximately three times more expensive than the level of investment that would be considereda viable transport option for containers.
As discussed in Section 6.6.1, the rail solution is already unviable under the current assumptions, sothere is no opportunity to subsidise container freight by allocating more costs to other freightcategories.
6.6.3 SummaryThe benchmark analysis shows that the proposal is not viable for the two key freight categories, coaland container freight. Our financial assessment therefore suggests that it is unlikely that the privatesector will fund the dedicated freight infrastructure project in its current form.

Australian Government Department of Infrastructure and Regional DevelopmentA study of the potential for dedicated freight infrastructure in Australia Ernst & Young ÷ 154
7. Market views and potential participation
7.1 Introduction and ScopeA key component of this stage of our study on dedicated freight infrastructure involves gauging thepotential level of market interest from the private sector in delivering the project, as well asunderstanding the potential to involve users and other project beneficiaries in funding the project.
Organisations identified as market participants in the supply of infrastructure can be considered asthose that provide goods and services and those that provide finance. The former represent thedesigners, builders, operational and maintenance service providers that contribute to the project.The latter group include debt, potential project sponsors and equity financiers. More traditionalmethods of procurement will often involve a combination of private goods and services, with thepublic sector funding the project. Alternative methods of financing infrastructure projects utiliseprivate sector debt and equity, such as Public Private Partnerships (PPPs).
Other important market participants include the potential customers that will want to use andbenefit from available infrastructure. As we have seen from the analysis above, this includes thefreight sector, and in particular those wishing to use heavy rail in the movement of containers andother freight to/from the Port of Brisbane.
Understanding the benefits that a project will provide to its customers is an important considerationwhen evaluating their potential willingness to pay for infrastructure use. For example, if benefits arelow and there are alternative options they can use, then the scope for cost recovery through usercharges would be limited.
Given the context (above), the scope of our analysis includes:
► a general discussion of the key factors that influence the market’s appetite for participation andinvestment in major transport infrastructure projects;
► the market’s current views and perspectives regarding those key factors based upon EY’sinvolvement in a range of formal and informal market sounding exercises over the last 12 to 24months; and
► how the freight industry may perceive the project and the issues associated with the provisionof funding support to private investors and/or government.
Based on these considerations, we then outline some conclusions for the case study project and itspotential to be delivered through alternative delivery and funding models.
7.2 Leveraging the Private Sector (PPPs and Private Rail Projects)7.2.1 PPPsState and federal Governments have frequently used the PPP model to deliver large scale transportprojects, alleviating the need for government to fund the substantial upfront investment. Costs havebeen traditionally recouped via a user pays system – tolls are levied on road users or fares levied onrail users. In both cases, top-up payments are often provided by governments, including theprovision of ‘availability payments’ on an ongoing basis for the life of a PPP.
For example, the Peninsula Link project represents one of the first Australian roads PPPs to deviatefrom this model with the government paying the operator based on a number of key performanceindicators relating to the road availability.
Australian Government Department of Infrastructure and Regional DevelopmentA study of the potential for dedicated freight infrastructure in Australia Ernst & Young ÷ 155
Rail infrastructure projects (currently at pre-procurement stage) which may be procured usingprivate finance (under a PPP model) include the Melbourne Metro (Victoria) and the North West RailLink (NSW).
7.2.2 Private Rail ProjectsWhile the bulk of Australia’s below rail infrastructure is government owned, there are a number ofcases in which lines have been developed, owned and operated by the private sector. A requirementfor the dedicated haulage of commodities to ports has frequently underpinned this investment,supported by the scale of mining operations and export demand for natural resources.
The major ore mines in Pilbara are serviced by owner operated private rail lines extending severalhundred kilometres from mine site to export terminals at Port Hedland, whereas the recentlyprivatised QR National runs an extensive rail network in Queensland that is utilised by miners in theregion. Also in Queensland, miners are looking at integrated mine – rail and port investments in theGalilee basin, in the northern part of the main coal belt in Central Queensland. The following projectsummaries provide examples of privately owned and operated rail assets in Australia.
7.2.2.1 Adelaide-Darwin Railway
The Adelaide-Darwin railway line is a significant transport asset in a transcontinental corridor, withrail along the route initially used in the late nineteenth century. In 2000, modern development ofthe full length of the route began when the Northern Territory and South Australian governmentsawarded a Build, Own, Operate and Transfer style agreement to the Asia Pacific Transport (APT)consortium. The federal government also provided a financial contribution to the project. After thecontract was awarded to the APT consortium, FreightLink was appointed to implement and operatethe line. However, after running into financial troubles, the company was subsequently acquired byGenesee & Wyoming150 (GWA), which remains the current lease owner and operator of the route.
Operations on the line serve both passengers and freight. The corridor is subject to an open accessregime whereby above-rail operators have the opportunity to negotiate use of the railway with theowner. Great Southern Railway operates the passenger train The Ghan along the route via thisarrangement. In addition, GWA operates regular freight services several times a week and maintainsrelationships with a number of mining companies with operations situated along the route.
GWA is technically the track manager between Darwin and Tarcoola, South Australia. The rail line atTarcoola splits into an East/West line, with and the North line to Darwin. The Tarcoola to Adelaidesection of the journey involves the use of railway lines controlled by the Australian Rail TrackCorporation, a company that is wholly owned by the Commonwealth of Australia. Lines under itsgovernance are deemed to be open access, supporting interstate logistics. Access to non-controlledsections is on regular commercial terms.
7.2.2.2 Pilbara iron ore railways
Several railway lines in the Pilbara region in Western Australia are privately owned and operated toservice iron ore mines which can be several hundred kilometres from the main export destinations,such as Port Hedland. BHP Billiton, Rio Tinto and Fortescue Metals Group all run private railnetworks in the region. The miners are owner/operators of the infrastructure and associated fleetof rolling stock.
Use of the railway networks is governed by the State Agreements Act. While third parties aretechnically allowed to apply for access on commercial terms, in practice owners have shownresistance to this. Under legislation, the network owners can argue that doing so would result ininterference with their existing operations. Fortescue unsuccessfully challenged for access to RioTinto and BHP controlled networks before constructing their own.
QR National and Atlas Iron are currently considering the construction of a rail line in the region,owning the under rail infrastructure and likely some above rail stock. The proposed rail networkwould be effectively open access in that while Atlas would be a foundation customer, anyone wouldbe able to apply for access rights. While the Western Australia government has indicated their
150 Genesee & Wyoming also controls a collection of railway lines and spurs in South Australia
Australian Government Department of Infrastructure and Regional DevelopmentA study of the potential for dedicated freight infrastructure in Australia Ernst & Young ÷ 156
support for the project, no public funds have been committed given that it is a private sectorinitiative.
7.2.2.3 Central Queensland Coalfields
With the privatisation of QRN in late 2010, the main rail lines in the coalfields of the Bowen Basinbecame privately owned, but with specific regulated access regimes. Since then, with the opening ofthe Galilee Basin to coal mining, the Queensland Government asked proponents to come forward todevelop mines and rail infrastructure to Abbott Point, the main coal terminal close to the basin. Atthis stage, a number of proposals for integrated mine-rail-port development are being proposed,some from a single company owned mine to one by QRN to link a number of mines with a third partycoal hauler. All projects will be privately funded.
7.3 Factors affecting market interestThe private sectors’ interest in public transport infrastructure projects will be guided by theirassessment of risk and achievement of an appropriate return commensurate to those risks.
In relation to the interest of the private sector to invest in public transport infrastructure under PPPmodels, EY’s interactions / soundings with the market have identified the following recurrent factorswhich influence the market’s appetite to participate in procurement processes and invest:
► Risk Transfer (Demand)
► Market Capacity
► Financing – Size and Terms
► Quality of Government Interaction and Planning
► Procurement Process Investment (Time and Cost)
► Political Risk
The remainder of this section provides our high level assessment of market perspectives on thesekey factors.
7.3.1.1 Risk transfer (demand)
The privately owned Port of Brisbane is the project’s sponsor, which has indicated a willingness toattract finance and management of the proposed project (without Government intervention).
This suggests appetite for patronage / demand risk is strong in the market, although this is yet to betested through any formal financial commitments.
7.3.1.2 Market capacity
Given the significant construction and financing requirement of this project, there is unlikely to beappetite or capacity in the market for a single constructor to deliver the entire project in onepackage.
7.3.1.3 Financing – size and terms
At a construction cost of approximately $7 billion this project’s financing requirement significantlyexceeds the market’s capacity to finance.
Given the significant size and financing requirement of this project, we consider the market wouldexpect its construction to be staged over a range of packages.
Australian Government Department of Infrastructure and Regional DevelopmentA study of the potential for dedicated freight infrastructure in Australia Ernst & Young ÷ 157
7.3.1.4 Quality of Government Interaction and Planning
Any interaction with the Government will be in the form of stakeholder engagement, obtaining thenecessary planning / environmental approvals or negotiating access agreements where interfacesthe public system exist.
7.3.1.5 Procurement Process Investment (Time and Cost)
We expect potential market participants would request that all (or part) of bidding costs would bereimbursed based on recent projects that have set precedents (e.g. North West Rail Link, NewZealand PPPs).
7.3.1.6 Political Risk
Given the size of this project, the long construction time frame and potential impact on thecommunity, this project is likely to attract political risk which may take the form of politicalinterference in project scope.
7.4 Summary findingsGiven the Port of Brisbane has taken a lead role in developing this project, we consider the marketinterest to be strong, despite the project being financially unviable at this stage.
The market (constructors, rail operators and maintainers) should have capacity to deliver thisproject if it is delivered in packages using a staged approach.
Given the significant size of the financing requirement, we consider that any proponent who takes onthis project will need to stage construction and financing over a period of time.
Australian Government Department of Infrastructure and Regional DevelopmentA study of the potential for dedicated freight infrastructure in Australia Ernst & Young ÷ 158
8. Key findings of this case study
8.1 Summary of Key FindingsThe Port of Brisbane case study raises a number of issues pertinent to this study of the potential fordedicated freight infrastructure.
8.1.1 High Capital CostIn considering the potential for dedicated freight infrastructure at Australia’s container ports, a keyissue is whether the problems with congestion on our road and rail networks justify the constructionof such infrastructure. Based on the findings of this case study for the Port of Brisbane, there aresignificant challenges to overcome before such proposals could be justified on economic andcommercial grounds.
A central issue with this case study is the high cost of the project compared to its forecast demandand market capacity to pay access charges that would be sufficient to cover the cost of the project.For example, for the Eastern Bypass portion of railway that is the necessary element for wide-scalecontainer flows on rail, the upfront construction cost is estimated to be around $3 billion, with afurther $1 billion to be spent in the future to fully duplicate that section. For a 65 kilometre stretchof railway, this equates to around $46 million per kilometre, which increases to around $62 millionper kilometre when fully duplicated. This compares with estimates from known coal rail projects incentral Queensland that are costed at $4.5 million per kilometre for single track and $7.7 million perkilometre for duplicated track.
Even with volumes growing to just under 3 million TEU by the end of our model in 2057, accesscharges would need to be so high as to make this uncommercial. This highlights the high costs oftunnelling and land resumption issues in urban areas that affect this case study project. It alsohighlights how governments at all levels have not had much success in safe-guarding land corridorsfor future transport infrastructure.
As part of updating its proposals, the Port of Brisbane has been reworking and refining its estimatesof capital costs, with a focus on identifying efficiencies and other cost savings. This information iscurrently confidential and forms a critical input to the Port’s discussions with governments and otherstakeholders. However, significant cost savings could have a bearing on project feasibilityconsiderations.
8.1.2 Congestion caused by non-freight vehiclesAnother issue that this case study highlights is that, in urban contexts such as Brisbane, afterinvesting in dedicated freight infrastructure to remove trucks from urban roadways, the number oftrucks removed may not be enough to provide significant benefits to the users that remain on theroad network.
It is acknowledged that the results for this analysis are highly sensitive to the data and assumptionsused, and generally require detailed traffic modelling to give confidence to the results. For this casestudy, which did not include detailed traffic modelling, it was estimated that the removal of trucks asa result of the railway would generate travel time savings for continuing users of the network of only$37m151 (NPV). This is a low figure compared to the cost of the project, and highlights that theestimated number of trucks removed as a percentage of total vehicles did not have a large effect onreducing congestion and average travel times.
While Brisbane does experience significant congestion around its container port, it is in the main notcaused by the port related freight itself, but by the commuter and other vehicles using the sameroads.
151 See Section 5.8.3

Australian Government Department of Infrastructure and Regional DevelopmentA study of the potential for dedicated freight infrastructure in Australia Ernst & Young ÷ 159
In light of this, it is unlikely that only focusing on the removal of freight vehicles from our roads willgenerate enough benefits and/or demand to justify and pay for new infrastructure. Under theseconditions, there is likely to be a role for government in supporting (and part-funding) the delivery ofsuch infrastructure.
This also highlights how transport policy could be better focussed on other measures to reducegeneral traffic congestion on key freight routes and port access links. This could include a mix ofdemand and supply measures, such as active demand management (i.e. pricing and technologybased demand management) and targeted road network capacity enhancements.
8.1.3 Lessons drawn on the governance of Australia’s container portsBrisbane was the first major capital city container port that was privatised. Having emerged from theold publically owned model of port governance, it is now in a position to more actively manage itsassets and is realising the need to secure its strategic land transport access links. The port’scontinued growth and survival as a profitable enterprise depends on it. The complicating factor isthat this is an area over which the port has little direct control. Removed from the umbrella of stateownership, the port is exploring other ways to further its interests. This railway proposal can be seenas one follow-through action from this new position. It is focussing its energies on where it sees itsmajor risks in the future and realises it has to lead this process, with, if necessary, some ownershiprole.
The Port of Brisbane’s strategies to manage its assets more efficiently and mitigate its long termrisks to growth bodes well for the further privatisations of Australia’s container ports.
Each port has unique issues with land transport. If they cannot address them adequately, there willbe impacts on their bottom lines.
8.1.4 State government reactionThis proposal also raises a number of questions about State government policy. The Stategovernment over the years has clearly favoured bulk ports such as Gladstone, Hay Point and AbbotPoint as its preferred exit point for bulk coal.
However, there are substantial quantities of coal in the Surat Basin in the south-east of the state.Brisbane is clearly the closest port to these areas at, for example 380km for the Cameby Downsmine near Miles compared to 496km to Gladstone. For mines closer in, such as New Acland, whichthe Port has forecast as having 10mtpa potential, the distance equation is further skewed at 227kmto Brisbane and 649km to Gladstone.
8.1.5 POB railway impact on other rail projectsAs we have seen, this project has the potential to have considerable effects on other rail projects andareas of expenditure. In particular, the potential to benefit the City train network by removing freighttrains from this network, could be a key driver for the project over the longer term. This connectionwith other large scale rail proposals and issues highlights the fact that this proposal could in futurebe considered in combination with them. While the project, in its present state, has been shown to beboth financially and economically unviable, the port is stuck with the problem of securing its landtransport links to its hinterland in the future. Rail capacity as it stands, is constrained and only likelyto get worse with growing demand for more passenger services. With the current higher thanaverage coal prices, coal exporters will seek to utilise as much of the available capacity as they can.If this continues into the future, as truck numbers grow, more and more pressure will be placed onthe Gateway Motorway to deal with the growth in containers.
8.2 Ongoing project development by the Port of BrisbaneThe Port of Brisbane is aware of the issues and challenges that confront the project. Since the initialperiod of consultation with the Port of Brisbane and the development of this concept project case
Australian Government Department of Infrastructure and Regional DevelopmentA study of the potential for dedicated freight infrastructure in Australia Ernst & Young ÷ 160
study, the Port has continued to develop the project in consultation with key stakeholders, includingthe Federal and Queensland governments.
Advice from the Port of Brisbane is that lower cost options currently are being investigated as partof its pre-feasibility study. The Port has also been re-thinking and updating its assessment of marketpotential for the project, and preliminary findings suggest the railway may deliver greater valuepotential than what has been modelled in this case study.
We understand that the Port of Brisbane intends to continue to work closely with government andindustry stakeholders to develop a detailed business case by 2015 to demonstrate the commercial,economic, social and environmental feasibility of the project.
Australian Government Department of Infrastructure and Regional DevelopmentA study of the potential for dedicated freight infrastructure in Australia Ernst & Young ÷ 161
APPENDICES
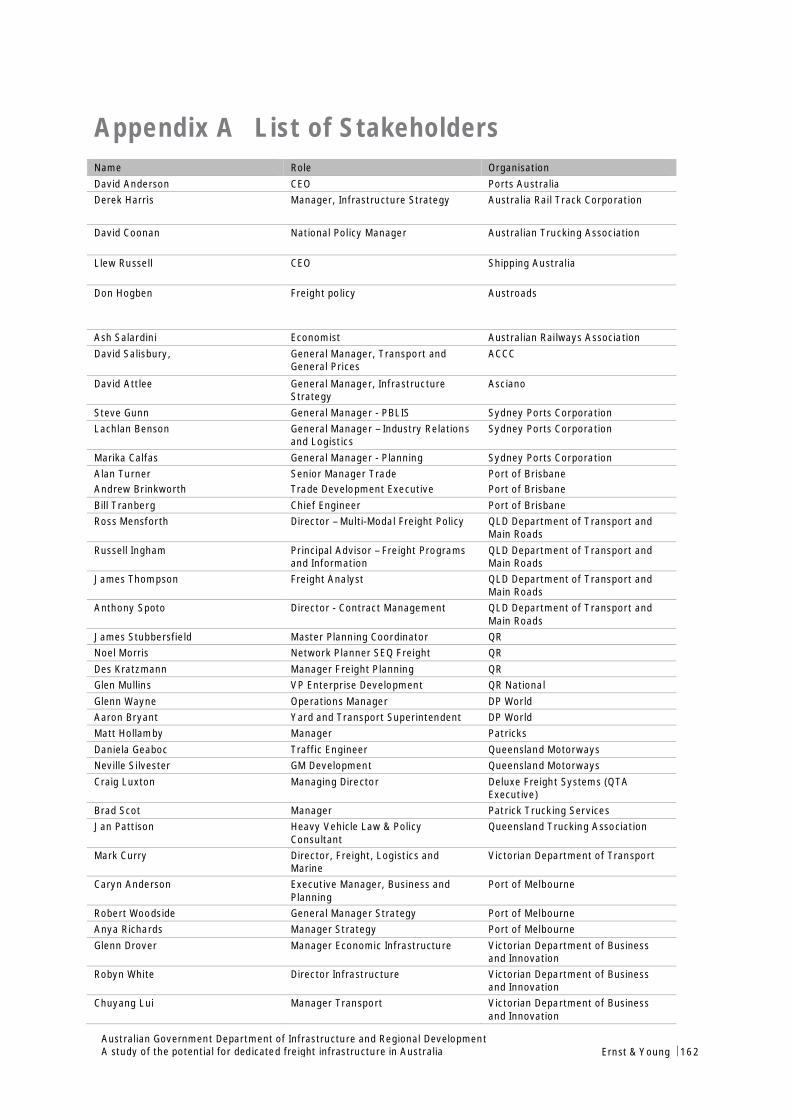
Australian Government Department of Infrastructure and Regional DevelopmentA study of the potential for dedicated freight infrastructure in Australia Ernst & Young ÷ 162
Appendix A List of StakeholdersName Role OrganisationDavid Anderson CEO Ports AustraliaDerek Harris Manager, Infrastructure Strategy Australia Rail Track Corporation
David Coonan National Policy Manager Australian Trucking Association
Llew Russell CEO Shipping Australia
Don Hogben Freight policy Austroads
Ash Salardini Economist Australian Railways AssociationDavid Salisbury, General Manager, Transport and
General PricesACCC
David Attlee General Manager, InfrastructureStrategy
Asciano
Steve Gunn General Manager - PBLIS Sydney Ports CorporationLachlan Benson General Manager – Industry Relations
and LogisticsSydney Ports Corporation
Marika Calfas General Manager - Planning Sydney Ports CorporationAlan Turner Senior Manager Trade Port of BrisbaneAndrew Brinkworth Trade Development Executive Port of BrisbaneBill Tranberg Chief Engineer Port of BrisbaneRoss Mensforth Director – Multi-Modal Freight Policy QLD Department of Transport and
Main RoadsRussell Ingham Principal Advisor – Freight Programs
and InformationQLD Department of Transport andMain Roads
James Thompson Freight Analyst QLD Department of Transport andMain Roads
Anthony Spoto Director - Contract Management QLD Department of Transport andMain Roads
James Stubbersfield Master Planning Coordinator QRNoel Morris Network Planner SEQ Freight QRDes Kratzmann Manager Freight Planning QRGlen Mullins VP Enterprise Development QR NationalGlenn Wayne Operations Manager DP WorldAaron Bryant Yard and Transport Superintendent DP WorldMatt Hollamby Manager PatricksDaniela Geaboc Traffic Engineer Queensland MotorwaysNeville Silvester GM Development Queensland MotorwaysCraig Luxton Managing Director Deluxe Freight Systems (QTA
Executive)Brad Scot Manager Patrick Trucking ServicesJan Pattison Heavy Vehicle Law & Policy
ConsultantQueensland Trucking Association
Mark Curry Director, Freight, Logistics andMarine
Victorian Department of Transport
Caryn Anderson Executive Manager, Business andPlanning
Port of Melbourne
Robert Woodside General Manager Strategy Port of MelbourneAnya Richards Manager Strategy Port of MelbourneGlenn Drover Manager Economic Infrastructure Victorian Department of Business
and InnovationRobyn White Director Infrastructure Victorian Department of Business
and InnovationChuyang Lui Manager Transport Victorian Department of Business
and Innovation
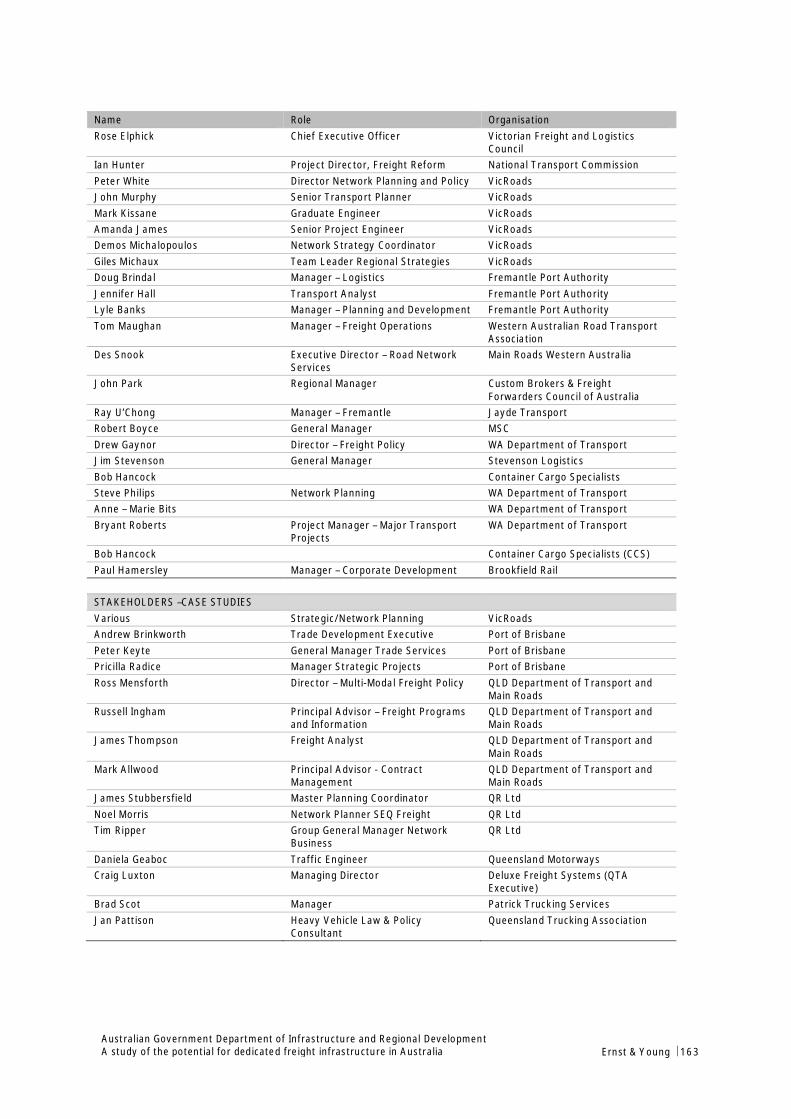
Australian Government Department of Infrastructure and Regional DevelopmentA study of the potential for dedicated freight infrastructure in Australia Ernst & Young ÷ 163
Name Role OrganisationRose Elphick Chief Executive Officer Victorian Freight and Logistics
CouncilIan Hunter Project Director, Freight Reform National Transport CommissionPeter White Director Network Planning and Policy VicRoadsJohn Murphy Senior Transport Planner VicRoadsMark Kissane Graduate Engineer VicRoadsAmanda James Senior Project Engineer VicRoadsDemos Michalopoulos Network Strategy Coordinator VicRoadsGiles Michaux Team Leader Regional Strategies VicRoadsDoug Brindal Manager – Logistics Fremantle Port AuthorityJennifer Hall Transport Analyst Fremantle Port AuthorityLyle Banks Manager – Planning and Development Fremantle Port AuthorityTom Maughan Manager – Freight Operations Western Australian Road Transport
AssociationDes Snook Executive Director – Road Network
ServicesMain Roads Western Australia
John Park Regional Manager Custom Brokers & FreightForwarders Council of Australia
Ray U’Chong Manager – Fremantle Jayde TransportRobert Boyce General Manager MSCDrew Gaynor Director – Freight Policy WA Department of TransportJim Stevenson General Manager Stevenson LogisticsBob Hancock Container Cargo SpecialistsSteve Philips Network Planning WA Department of TransportAnne – Marie Bits WA Department of TransportBryant Roberts Project Manager – Major Transport
ProjectsWA Department of Transport
Bob Hancock Container Cargo Specialists (CCS)Paul Hamersley Manager – Corporate Development Brookfield Rail
STAKEHOLDERS –CASE STUDIESVarious Strategic/Network Planning VicRoadsAndrew Brinkworth Trade Development Executive Port of BrisbanePeter Keyte General Manager Trade Services Port of BrisbanePricilla Radice Manager Strategic Projects Port of BrisbaneRoss Mensforth Director – Multi-Modal Freight Policy QLD Department of Transport and
Main RoadsRussell Ingham Principal Advisor – Freight Programs
and InformationQLD Department of Transport andMain Roads
James Thompson Freight Analyst QLD Department of Transport andMain Roads
Mark Allwood Principal Advisor - ContractManagement
QLD Department of Transport andMain Roads
James Stubbersfield Master Planning Coordinator QR LtdNoel Morris Network Planner SEQ Freight QR LtdTim Ripper Group General Manager Network
BusinessQR Ltd
Daniela Geaboc Traffic Engineer Queensland MotorwaysCraig Luxton Managing Director Deluxe Freight Systems (QTA
Executive)Brad Scot Manager Patrick Trucking ServicesJan Pattison Heavy Vehicle Law & Policy
ConsultantQueensland Trucking Association
Ernst & Young
Assurance | Tax | Transactions | Advisory
About Ernst & YoungErnst & Young is a global leader in assurance, tax, transaction and advisory services. Worldwide, our 167,000 people are unitedby our shared values and an unwavering commitment to quality. We make a difference by helping our people, our clients and ourwider communities achieve their potential.
Ernst & Young refers to the global organization of member firms of Ernst & Young Global Limited, each of which is a separatelegal entity. Ernst & Young Global Limited, a UK company limited by guarantee, does not provide services to clients. For moreinformation about our organization, please visit www.ey.com.
© 2014 Ernst & Young, Australia.All Rights Reserved.
Ernst & Young is a registered trademark. Our report may be relied upon by the Department of Infrastructure and RegionalDevelopment for the purposes only pursuant to the terms of our engagement letter dated 13 April 2012. We disclaim allresponsibility to any other party for any loss or liability that the other party may suffer or incur arising from or relating to or inany way connected with the contents of our report, the provision of our report to other parties or the reliance upon our report byany other party.
Liability limited by a scheme approved under Professional Standards Legislation.