final report 2014.pdf1
TRANSCRIPT

I
PRIMARY BREAKUP OF LIQUID SHEET UTILIZING AIR-
ASSISTED TWIN-FLUID ATOMIZER
A PROJECT REPORT
SUBMITTED BY
by
AVINASH KUMAR RAY – CB.EN.U4MEE10012
SAMMETTA SAMBASIVA RAO – CB.EN.U4MEE10044
L VENAKTESH MUTHURAMAN – CB.EN.U4MEE10056
PUNNAMARAJU V GIRITEJA – CB.EN.U4MEE10233
In partial fulfulment for the award of the degree
of
BACHELOR OF TECHNOLOGY
IN
MECHANICAL ENGINEERING
DEPARTMENT OF MECHANICAL ENGINEERING
AMRITA SCHOOL OF ENGINEERING
AMRITA VISHWA VIDYAPEETHAM COIMBATORE – 641112
II
May, 2014
AMRITA SCHOOL OF ENGINEERING
AMRITA VISHWA VIDYAPEETHAM, COIMBATORE 641112
BONAFIDE CERTIFICATE
This is to certify that the thesis entitled “Experimental characterization of liquid
sheet break up using acoustic perturbations” submitted by AVINASH KUMAR
RAY, SAMMETTA SAMBASIVA RAO, L VENKATESH
MUTHURAMAN, PUNNAMARAJU VENKATA GIRITEJA for the award
of the Degree of Bachelor of Technology in Mechanical Engineering is a bonafide
record of the work carried out under our guidance and supervision at Amrita School of
Engineering, Coimbatore.
Mr. K. Balaji
Project guide
Dept. of Mechanical Engineering,
Amrita School of Engineering.
Dr. V. Sivadas
Project Co - guide
Dept. of Aerospace Engineering,
Amrita School of Engineering.
Dr. S. Thirumalini
Chairman
Dept. of Mechanical Engineering
Amrita School of Engineering
This report was examined and the candidates underwent Viva-Voce examination on
1st May 2014
Internal Examiner External Examiner

III
AMRITA SCHOOL OF ENGINEERING
AMRITA VISHWA VIDYAPEETHAM, COIMBATORE 641112.
DEPARTMENT OF MECHANICAL ENGINEERING
DECLARATION
We, AVINASH KUMAR RAY (CB.EN.U4MEE10012), SAMMETTA
SAMBASIVA RAO (CB.EN.U4MEE10044), L VENKATESH MUTHURAMAN
(CB.EN.U4MEE10056), PUNNAMARAJU VENKATA GIRITEJA
(CB.EN.U4MEE10233) hereby declare that project work entitled “Primary breakup
of liquid sheet utilizing Air-assisted Twin-fluid atomizer”, is the record of the original
work done by us under the guidance of Mr. K. BALAJI, Assistant Professor,
Department of Mechanical Engineering and Dr. V. SIVADAS, Associate
Professor, Department of Aerospace Engineering, Amrita School of Engineering,
Coimbatore. To the best of my knowledge this work has not formed the basis for the award
of any degree/diploma/associateship/ fellowship or a similar award to any candidate in any
University.
AVINASH KUMAR RAY – CB.EN.U4MEE10014
SAMMETTA SAMBASIVA RAO - CB.EN.U4MEE10044
L VENAKATESH MUTHURAMAN – CB. EN.U4MEE10056
PUNNAMARAJU VENKATA GIRITEJA– CB.EN.U4MEE10233
Place: Coimbatore 641112.
Date:
COUNTERSIGNED
Mr. K. BALAJI
Project guide
Dept. of Mechanical Engineering,
Amrita School of Engineering.
Dr. V. SIVADAS
Project Co-guide
Dept. of Aerospace Engineering,
Amrita School of Engineering
4
TABLE OF CONTENTS
ACKNOWLEDGEMENT..................................................................................................5
LIST OF FIGURES..........................................................................................................6
ABSTRACT.....................................................................................................................7
1. INTRODUCTION........................................................................................................8
2. LITERATURE SURVEY................................................................................................10
3.EXPERIMENTAL SETUP AND TECHNIQUES................................................................18
3.1 Experimental setup................................................................................................19
3.2 Air supply system...................................................................................................21
3.3 Fuel supply system.................................................................................................22
3.4 Image acquisition and processing..........................................................................24
3.5 Calibration of Fuel supply system..........................................................................27
3.6 Calibration of Air line.............................................................................................29
3.7 Breakup length and Spray angle measurements...................................................30
4. RESULTS AND DISCUSSIONS.....................................................................................32
4.1 Qualitative Analysis...............................................................................................32
4.2 Quantitative Analysis.............................................................................................36
5. CONCLUSION...........................................................................................................44
6. REFERENCES............................................................................................................45

5
ACKNOWLEDGEMENT
It gives us great pleasure in acknowledging our project guide Mr. K. Balaji, Assistant
Professor, Department of Mechanical Engineering and our co-guide Dr. V. Sivadas,
Associate Professor, Department of Aerospace Engineering for technical guidance, moral
support and friendly discussions throughout this project. Without their support this
project wouldn’t have grown to this extent. A sincere thanks won’t be sufficient to the
discussions and advices that they have contributed over the course of project. Their
aptitude in engineering and research was inspirational and continuously motivating us to
get into the field and contribute to the scientific community.
We thank Dr. S. Thirumalini, Chairperson, Department of Mechanical Engineering for
allowing us to use the facilities in college and Dr. Elangovan, Professor, Department of
Mechanical Engineering for helping in this project.
We would also like to acknowledge with much appreciation, the crucial role of the staff
of Mechanical Department Laboratories and workshops for their selfless help –
Mr. Sundararaman, Mr. Vignesh, and Mr. Venkatesh.

6
LIST OF FIGURES
Figure
number
Title of the figure Page
number
2.1 Stages of liquid sheet break up 8
2.2 Effect of Rayleigh and Ohnesorge number on atomization 8
2.3 Mechanism of break-up of liquid sheet in co-axial air
stream
9
2.4 Break up length and Spray angle of air assisted atomizer 11
3.1 Schematic diagram of Experimental Setup 14
3.2 Air nozzle duct 16
3.3 Liquid sheet generator 17
3.4 Arduino circuit for calibrating liquid line 20
3.5 Liquid line calibration 21
3.6 Air supply line calibration graph 22
4.1,4.2,
4.3,4.4 Spray Images at different liquid and air velocities 23
4.6 Non-dimensional breakup length and Weber number 24
4.7 Break-up length as function of liquid at various air
velocities
25
4.8 Spray angle as a function of liquid velocities at various air
velocities
26
7
ABSTRACT
An exhaustive study on the effect of air in the breakup of a liquid sheet of water flowing
forms the essence of this project. Water at different flow velocities is passed through a
rectangular nozzle that makes a liquid sheet, along with the design of the separate air
columns for it to break the liquid sheet. Initially the calibration of the liquid-line and air-
line is done. Qualitative and quantitative analysis is done with simultaneous passage of
liquid and the air line with the help of image processing and high speed camera with
which a quantitative approach was made and a trend line was obtained for non-
dimentionalised curves. The project shows promising future works which can be
subsequently done with the current one as prime basis.
8
1. INTRODUCTION
1.1 ATOMIZATION
Atomization is a process in which a liquid jet or sheet is disintegrated by the kinetic
energy of the liquid itself or by the exposure to high velocity air or gas or externally
applied kinetic energy into a fine spray.
1.2 SPRAY
A spray is a dynamic collection of liquid drops entrained in surrounding gas. The
transformation of bulk liquid into fine droplets and sprays is of great importance in day to
day life and in a variety of industrial processes, agriculture, meteorology, medicine, paint
spraying, spray drying of wet solids, food processing, cooling of nuclear cores and to
disperse the liquids fuels for combustion in gas turbine combustors.
The current gas turbine combustor technology focuses on the reduction of NOx emissions
in order to meet the growing restrictions regarding emissions. The air -fuel mixture
properties and its injection conditions into the combustor are crucial parameters that
determine the emission from the engine. The better the atomization of the fuel, the lower
the emissions. Thus various types of injection techniques are being experimented on to
try and improve fuel atomization and produce a fine fuel spray.
1.3 ATOMIZERS
Atomizers are the devices used to atomize the fluids. The main types of atomizers are
pressure swirl atomizers, plain orifice atomizers and twin fluid atomizers.
Pressure swirl atomizers have a pre-swirl chamber where the fluid is given a swirl thus
leading to turbulence and this induces the sheet breakup when injected into the chamber.

9
Plain orifice atomizers involve the injection of the fluid into the combustion chamber
through a tiny orifice which causes the fluid sheet to break up into droplets.
Twin fluid atomizers involve the injection of fluid into the chamber at a relatively low
pressure with another fluid, normally air being used to excite the fluid leading to its break
up. Twin fluid atomizers are of two types: air blast and air assist. Basically it is the
momentum of the impinging sheet that causes the fluid to break up into droplets.
M = mv where M is the momentum of the impinging fluid (1)
m is the mass of the fluid and v is the velocity.
Air assist atomizers use a small mass of high velocity air to atomize the liquid. Air blast
atomizers on the other hand use a large quantity of low velocity fluid to cause liquid
breakup.
Air assist atomizers utilize high velocity air to excite the fuel and trigger disturbances
which lead eventually to breakup of the liquid sheet. Two primary types of air assist
atomizers exist: internal mixing type and external mixing type.
Internal mixing atomizers involve the mixing of liquid and air within the atomizer body
itself. In these atomizers the spray cone angle is minimum for maximum airflow and the
spray cone angle increases as the airflow decreases. This is used for high viscosity liquids
that require good atomization at low liquid flow rates.
External mixing atomizers involve the liquid impinging on the air outside the atomizer
body. Thus these are safer as the liquid will not be accidentally forced into the air line at
the exit. However their utilization of air is less efficient and power consumption is high.

10
2. LITERATURE SURVEY
2.1 LIQUID SHEET
The liquid emerging from a twin fluid atomizer may be in the form of liquid sheet or
liquid jets depending upon the geometry of nozzle exit [1]. Liquid sheets are obtained
when the liquid is passed through a thin rectangular orifice of high aspect ratio, where as
a jet is obtained when the liquid is forced out of a circular aperture. Liquid sheet is our
center of interest here. The liquid sheet that is obtained out of the nozzle is unstable and
they break up into drops of a variety of sizes. There are several basic processes that are
associated with atomization including hydraulics of flow inside the atomizer and
turbulence properties of the emerging fuel stream [2]. The development of liquid jet or
sheet and the growth of disturbances which lead to the disintegration of the liquid sheet
into ligaments and then into drops are critical in determining the detailed characteristics
of the spray like breakup length and spray angle. These characteristics are dependent on
the internal geometry of the liquid sheet.
2.2 PHYSICS OF BREAKUP
The cause of atomization is the interaction between the internal pressure of the drops, the
aerodynamic force and the surface tension force acting on the liquid.
stAI p + p = p (2)
Where Ip is the internal pressure of the drop
Ap is the external aerodynamic pressure
And stp is the surface tension pressure

11
When the liquid comes out of the injector at a high speed, the aerodynamic force on the
liquid surface increases. If this can be balanced by an increase in surface tension force,
then the sheet is stable [3]. However when the effect of the aerodynamic force exceeds the
surface tension force, this sheet starts splitting up, in order to increase its overall surface
area until the surface area becomes large enough for the surface tension force to balance
the aerodynamic force.
The disintegration of the sheet begins in the form of a disturbance which propagates
through the fluid, atomizing it. If the disturbance frequency is equal to or greater than the
breakup frequency, atomization occurs [4]. If in an air assisted atomizer high velocity air
is made to impinge on the fuel sheet, it produces a large disturbance which ensures
immediate atomization.
Break-up of the liquid sheet occurs in four stages [8].
Fig 2.1 Stages of liquid sheet breakup
12
1) The first stage of sheet breakup, attributed to the Rayleigh instability mode, is
caused by an axisymmetric disturbance related to the surface-tension force that
leads to the growth of the capillary wavelengths in the sheet. When the
wavelength grows larger than the sheet thickness, the fluid breaks off.
2) An increase in sheet velocity leads to the first wind-induced regime. In this
regime, frictional and pressure forces between the sheet surface and the
surrounding gas cause oscillations which produce a gross twisting effect on the
liquid column that later leads to the formation of droplets with sizes on the order
of the sheet orifice area. The distance from the orifice to the initial breakup point
is less than that produced by the Rayleigh mode.
3) A further increase in sheet velocity leads to the second wind-induced regime,
which forms a wide droplet distribution ranging from small droplets obtained
from surface breakup to large droplets approaching the size of the sheet thickness.
The distance to the onset of liquid breakup continues to decrease as sheet velocity
increases.
4) When the onset of liquid breakup begins to occur at the sheet exit, the atomization
regime is attained. The atomization regime consists of fine droplet sizes, most of
which are produced by surface breakup rather than sheet fracture.

13
Fig 2.2 Effect of Rayleigh and Ohnesorge number on atomization
The disintegration of a liquid sheet in a coaxial airstream occurs in a slightly different
way as described below [5].
1) Rayleigh Breakup: In this type of breakup, the liquid sheet disintegration does not
involve liquid membrane or liquid fiber ligament formation. This occurs for the
condition Wea < 25.
2) Sheet disintegration via membrane type ligaments: This occurs at higher air flow
rates where the sheet develops into a thin liquid sheet which then forms Kevin-
Helmholtz waves and breaks up into drops. The diameter of the drops is less than
the sheet thickness. For this 25 < Wea < 70

14
3) Sheet disintegration via fiber type ligaments. At very high air flow rates, liquid
fibers are formed, they peel off the sheet and breakup via Rayleigh mechanism.
The liquid core accelerates and develops waves. The ligaments formed by
Rayleigh breakup then break into smaller drops or ligaments. The drop diameter
is of a magnitude much smaller than the sheet thickness. 70< Wea <500.
Fig 2.3 Mechanism of breakup of liquid sheet in co-axial airstream
All the three mentioned categories can be sub divided into two sub modes:
Pulsating sheet disruption which is the normal sub- mode of atomization and Super-
pulsating sheet disruption which occurs due to extremely high periodic change between
high and low density regions in the spray [9].
2.3 CHARACTERISTIC PARAMETERS OF LIQUID BREAKUP
The spray angle and the break up length are the two main characteristics of the spray that
determine the quality of atomization.
15
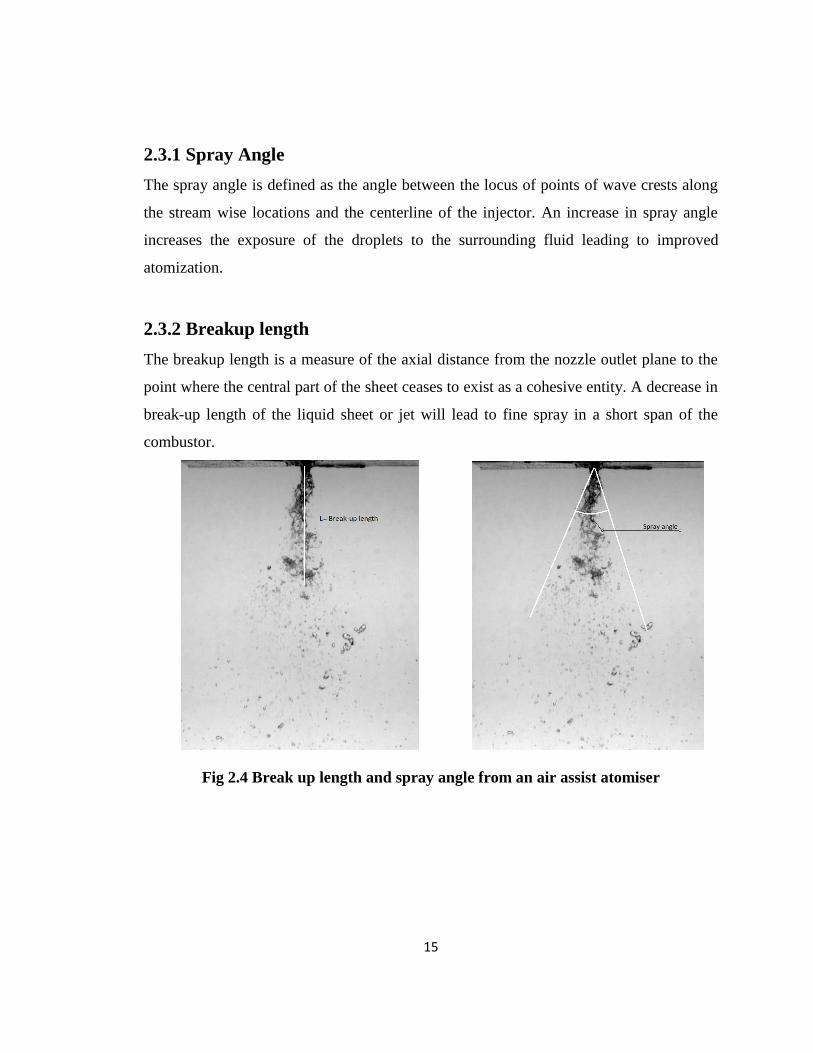
2.3.1 Spray Angle
The spray angle is defined as the angle between the locus of points of wave crests along
the stream wise locations and the centerline of the injector. An increase in spray angle
increases the exposure of the droplets to the surrounding fluid leading to improved
atomization.
2.3.2 Breakup length
The breakup length is a measure of the axial distance from the nozzle outlet plane to the
point where the central part of the sheet ceases to exist as a cohesive entity. A decrease in
break-up length of the liquid sheet or jet will lead to fine spray in a short span of the
combustor.
Fig 2.4 Break up length and spray angle from an air assist atomiser

16
2.4 RELEVANT DIMENSIONLESS NUMBERS
Dimensionless numbers play a major role in the experimental study of twin fluid
atomization. The use of dimensionless numbers likes Weber number and Weber ratio
allows us to easily understand the effect of the liquid and atomizer characteristics on the
break-up mechanism [10].
In low velocity liquids the two parameters that affect the breakup are the surface tension
and aerodynamic force. Thus Weber number which is the ratio of dynamic pressure
(ρAUR2/2) and surface tension force (σ/ d0) is used for this purpose [6].
We =
dva
2
(3)
Where
We - Weber number associated with twin fluid flow in the atomizer
a - Density of air
v - Relative velocity between air and liquid
ts - Sheet thickness
- Surface tension between liquid-air interface
The Weber number describes the likelihood of the liquid to break up, the higher the
Weber number, faster the breakup [7]. Here in order to include the effect of inertial forces
of water a new dimensionless no called weber ratio (Wel/Wea) is used
(4)
Where Wea - Weber number of air
WeL - Weber number of liquid
These dimensionless numbers are used to map the breakup regimes of the liquid sheet.

17
The explanation of weber no and ratios are as follows .The weber ratio is chosen because
aerodynamic weber number alone does not take into account the inertial forces of water
and also the surface tension factor was removed when the ratio was chosen. The weber
ratios are calculated by the following calculation.
Wea =
dva
2
(13)
Where
Wea - Weber number of the air flow
a - Density of air
v - Relative velocity between air and liquid
D - Diameter of jet
- Surface tension between liquid-air interfaces
Wel =
dvll
2
(14)
Where
Wel - Weber number of the air flow
l - Density of the liquid
lv - Velocity of the liquid
ts - Sheet thickness
- Surface tension between liquid-air interfaces

18
3. EXPERIMENTAL SETUP AND MEASUREMENT
TECHNIQUES
The experimental setup of the project comprises of 4 sections: test section, air supply
system, fuel supply system, image capturing and processing section
Fig 3.1 Schematic of the Experimental Setup

19
3.1 EXPERIMENTAL SETUP
The experimental setup includes twin-fluid atomizer, bucket and atomizer holder. The
spray characterization experiments are performed in this test section. The atomizer is
placed in such a way that the spray flows in a vertical fashion into a bucket to collect the
water.
3.1.1 Twin Fluid Atomizer
The twin- fluid atomizer is specially designed and fabricated to provide required liquid
spray at various liquid and air injection pressures. The twin fluid atomizer is made up of
3 parts, air nozzle duct, and packing and liquid sheet generator.
3.1.1.1 Air Nozzle Duct
The air nozzle duct is entirely made of aluminum. It was designed as per ASME
standards and manufactured using CNC machining. The duct is manufactured to contain
and house the liquid sheet generator. It provides the pressurized air parallel to the flow of
water.
20
Fig 3.2 Air nozzle duct
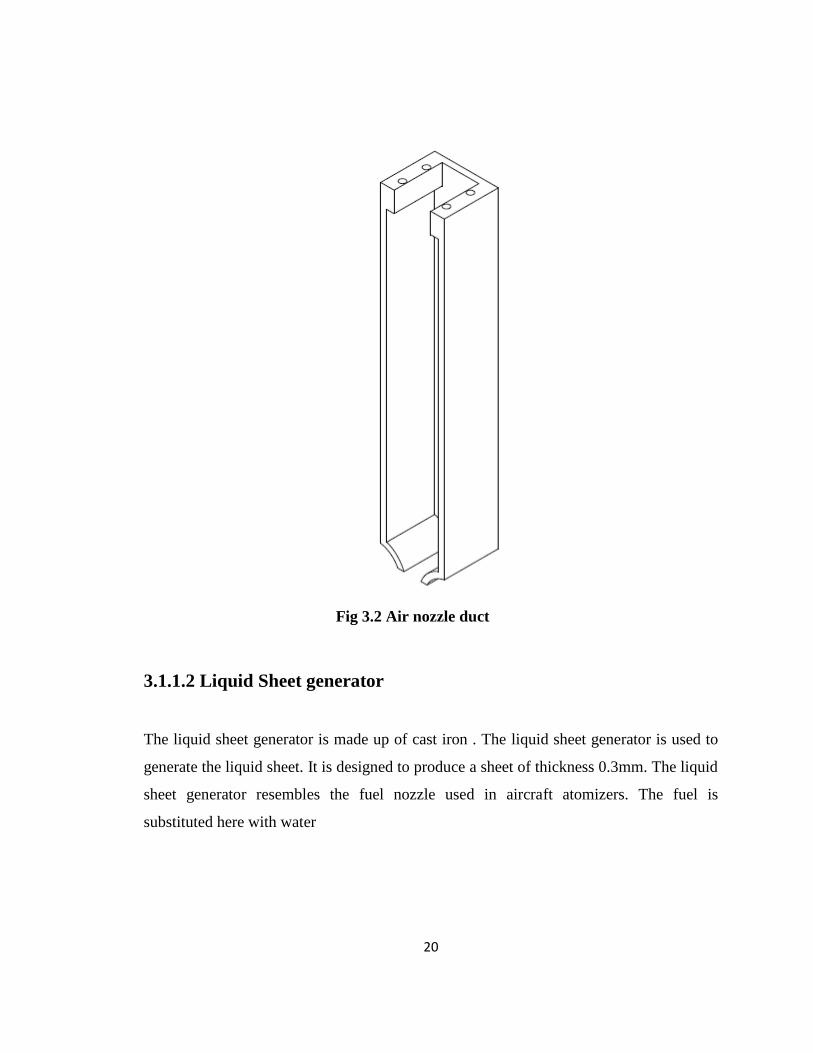
3.1.1.2 Liquid Sheet generator
The liquid sheet generator is made up of cast iron . The liquid sheet generator is used to
generate the liquid sheet. It is designed to produce a sheet of thickness 0.3mm. The liquid
sheet generator resembles the fuel nozzle used in aircraft atomizers. The fuel is
substituted here with water
21
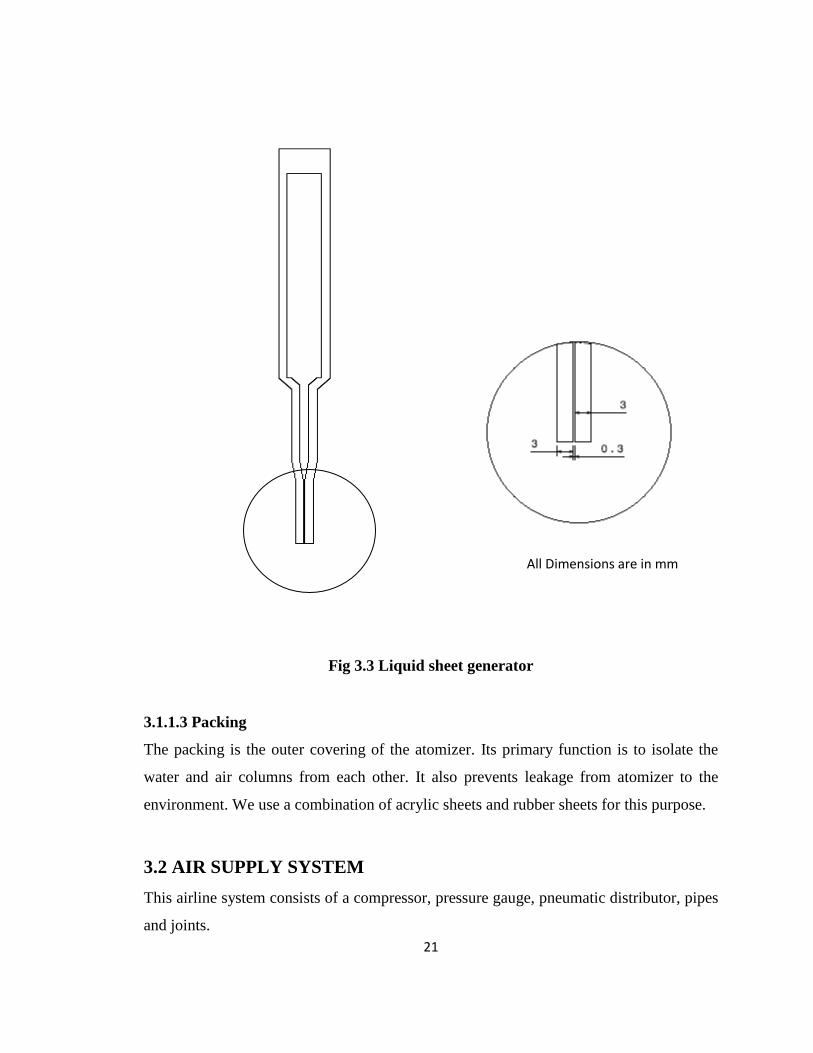
Fig 3.3 Liquid sheet generator
3.1.1.3 Packing
The packing is the outer covering of the atomizer. Its primary function is to isolate the
water and air columns from each other. It also prevents leakage from atomizer to the
environment. We use a combination of acrylic sheets and rubber sheets for this purpose.
3.2 AIR SUPPLY SYSTEM
This airline system consists of a compressor, pressure gauge, pneumatic distributor, pipes
and joints.
All Dimensions are in mm
22
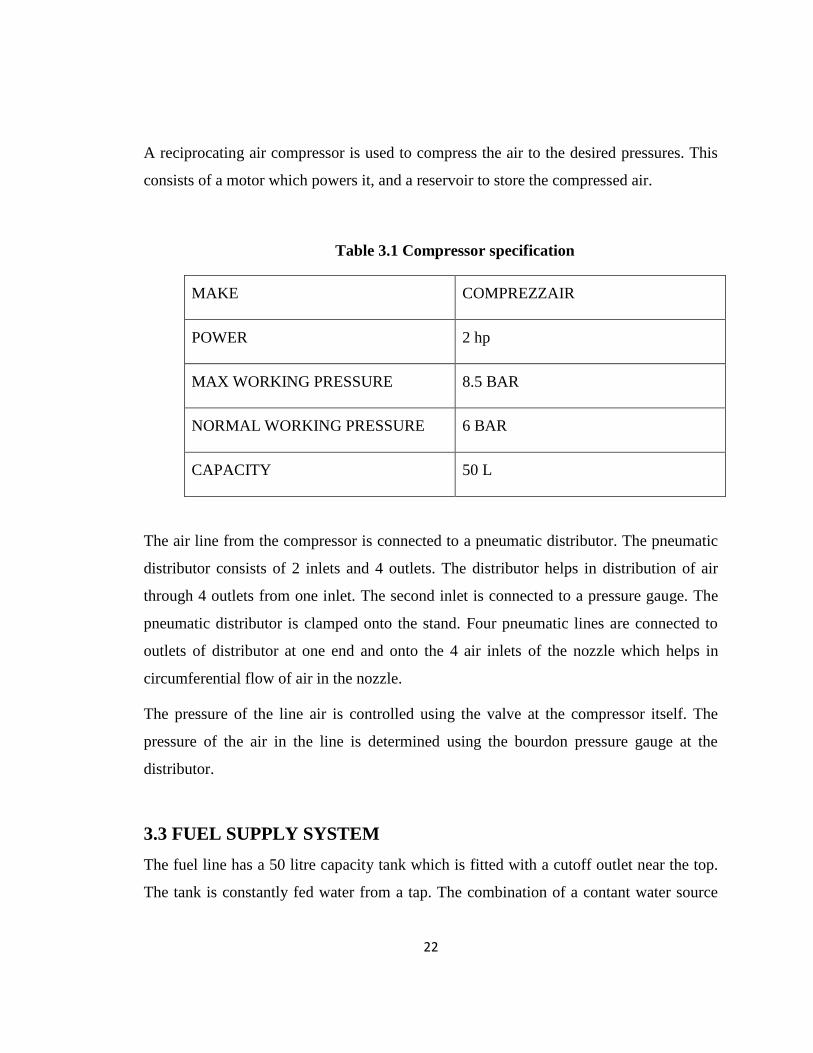
A reciprocating air compressor is used to compress the air to the desired pressures. This
consists of a motor which powers it, and a reservoir to store the compressed air.
Table 3.1 Compressor specification
MAKE COMPREZZAIR
POWER 2 hp
MAX WORKING PRESSURE 8.5 BAR
NORMAL WORKING PRESSURE 6 BAR
CAPACITY 50 L
The air line from the compressor is connected to a pneumatic distributor. The pneumatic
distributor consists of 2 inlets and 4 outlets. The distributor helps in distribution of air
through 4 outlets from one inlet. The second inlet is connected to a pressure gauge. The
pneumatic distributor is clamped onto the stand. Four pneumatic lines are connected to
outlets of distributor at one end and onto the 4 air inlets of the nozzle which helps in
circumferential flow of air in the nozzle.
The pressure of the line air is controlled using the valve at the compressor itself. The
pressure of the air in the line is determined using the bourdon pressure gauge at the
distributor.
3.3 FUEL SUPPLY SYSTEM
The fuel line has a 50 litre capacity tank which is fitted with a cutoff outlet near the top.
The tank is constantly fed water from a tap. The combination of a contant water source
23
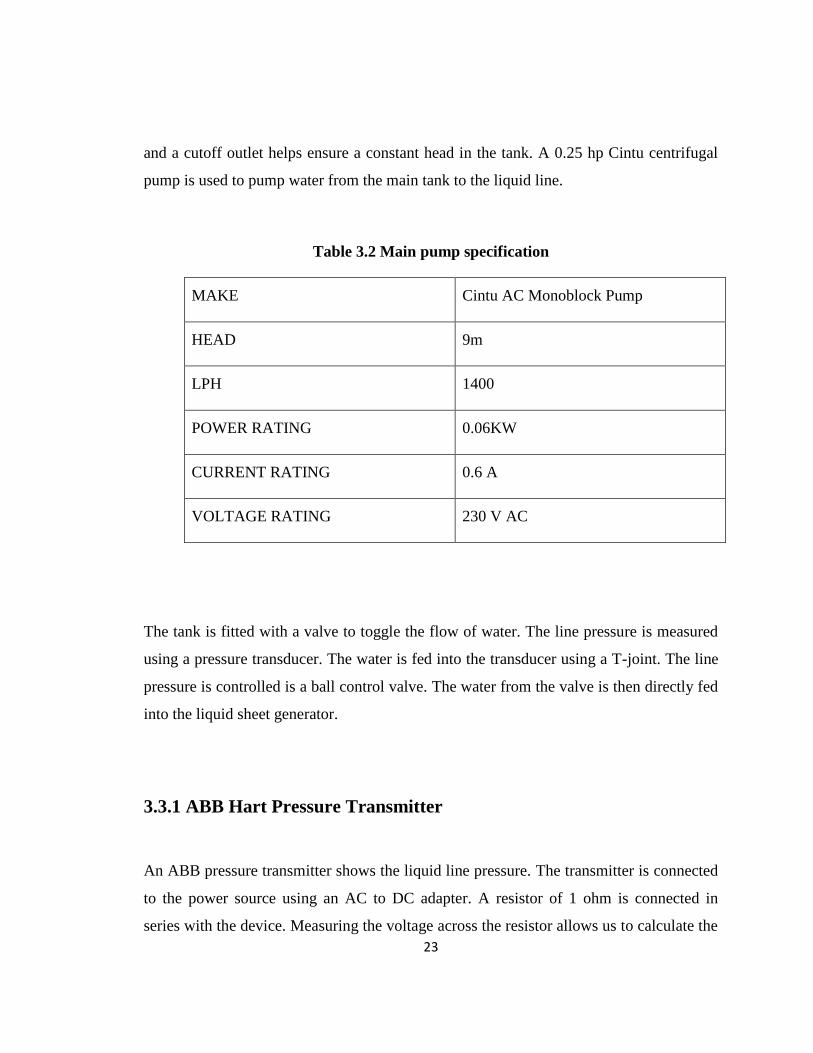
and a cutoff outlet helps ensure a constant head in the tank. A 0.25 hp Cintu centrifugal
pump is used to pump water from the main tank to the liquid line.
Table 3.2 Main pump specification
MAKE Cintu AC Monoblock Pump
HEAD 9m
LPH 1400
POWER RATING 0.06KW
CURRENT RATING 0.6 A
VOLTAGE RATING 230 V AC
The tank is fitted with a valve to toggle the flow of water. The line pressure is measured
using a pressure transducer. The water is fed into the transducer using a T-joint. The line
pressure is controlled is a ball control valve. The water from the valve is then directly fed
into the liquid sheet generator.
3.3.1 ABB Hart Pressure Transmitter
An ABB pressure transmitter shows the liquid line pressure. The transmitter is connected
to the power source using an AC to DC adapter. A resistor of 1 ohm is connected in
series with the device. Measuring the voltage across the resistor allows us to calculate the
24
current in the circuit. The transmitter is calibrated for the desired pressure range so that
the voltmeter shows 4mV for the lowest pressure (LRV) calibrated and 20mV for the
highest pressure (HRV) calibrated. Thus the voltage can be read off the multimeter for
the various valve openings and the corresponding pressures can be obtained by simple
interpolation.
3.3.1.1 Calibration Procedure
To calibrate the transmitter, the pump is switched on and the exit valve is held in the fully
open condition thus giving the lowest attainable pressure in the setup. The zero button,
present on top of the device is pressed thus setting the Lower Range Value at this
pressure. Then the valve is fully closed thus giving the maximum line pressure. Then the
span button is pressed for two minutes and thus the Higher Range Value is also set. Now
the pressures in that range can be easily measured.
3.4 IMAGE ACQUISTION AND PROCESSING
This comprises of 4 parts: - a diffuser plate, a spotlight, a camera and a computer.
The diffuser plate is a milky white screen which is used to provide proper background
illumination and proper contrast during image capturing. This ensures uniform
distribution of light throughout the image. A 1000W spotlight is used for providing
sufficient background lighting.
The camera used is a high speed Sony CCD camera (XCD-X710) with a maximum
acquisition rate of 30 frames per second. The spatial resolution of the camera is 1024 *
768 pixels. The shutter speed chosen is 1/100000 seconds. A standard C- mount lens of
focal length 25 mm was used throughout this study. We use this to capture the spray

25
images. Focus and aperture adjustments are done on the camera to capture high quality
images.
The camera is connected to the computer which helps us to perform an inline testing of
the experiment. All adjustments of the camera except focusing and aperture adjustment is
done using the software IC Capture. This helps us to control the entire functions of the
camera using the software and also help us to store the acquired images in the computer.
The captured images are processed using Image Processing Toolbox in Matlab.
3.4.1 Image Capturing Method
After the working pressure ranges are obtained for both the liquid and air lines, the next
step is the capturing of the images at different pressures. The working liquid and air
pressures and their corresponding velocities are stated below.
Table 3.3 Liquid and Air Working Pressures
Sl.no
LIQUID LINE AIR LINE
PRESSURE(bar) Velocity(m/s) PRESSURE(bar) Velocity(m/s)
1 0.8 2.98 0.3 12.39
2 0.81 2.5 0.4 16.61
3 0.82 1.8 0.6 23.81
4 0.8 27.68
5 0.9 30.32
The images are captured for the above stated liquid and air pressures.
The CCD camera is set on a tripod stand and its position is adjusted so that it is facing the
nozzle. Then the camera is connected to the computer and the software IC capture is
26
opened. Next before the focus an aperture is adjusted, the lighting has to be appropriate.
The normal lighting in the room is switched off and the 1000W special purpose light is
switched on. This is placed parallel to the diffuser plate so that the lighting obtained at
the test section is uniform and of the required intensity. The only light in the room should
be from the background lighting source. Then the resolution, frame rate and shutter speed
are set using the software. Then the focus and aperture opening are manually set so that a
clean focused view of the test section is seen from the computer. The lighting during the
entire process should be the same as is to be used in testing.
First an image of the background is taken using the camera. This acts as a reference
image and when subtracted from the other images using appropriate software gives us a
clear view of the spray.
Then the air line is set for the first air velocity. The liquid then line velocities are then
varied and the images of the spray are obtained at different air velocities and these are
automatically stored in the designated folders. To capture the images, the start button is
clicked on the screen and then after a few seconds, the stop button is clicked. At a frame
rate of 30 frames per second 100 images of the spray at that condition are obtained. Then
the liquid line condition is changed to obtain the next velocity. After all the liquid
velocities are obtained at that air velocity, we move on to the next air velocity. In this
way images for the designated spray conditions are obtained. These are then subjected to
quantitative analysis.
The images that are captured with the help of high speed camera are processed by using
image processing techniques during quantitative analysis. The images are processed in
order to calculate break up length, a parameter of liquid sheet breakup, at different fuel
line pressures and airline pressures.
27
3.5 Calibration of Fuel Supply System
The nozzle geometry and the instantaneous flow rate of the fuel through the nozzle define
the spray properties of the fuel. Since there is no measuring system available that
measures the instantaneous flow rate through the nozzle directly, one usually uses
secondary information that defines this flow rate. Thus calibration is done for flow rate
versus pressure. The velocity can be calculated at different pressures using calibration
chart.
A volume flow rate measurement is used for the velocity calculation. The volume of
liquid collected in a certain time interval is accurately measured and the time for this is
also noted.
V = Volume of collection tank/ time taken for collection
V = volume flow rate of liquid collected
Liquid exit velocity (v) = V/cross sectional area of nozzle exit
3.5.3 Calibration Procedure
Calibration of water line is done by calculating the volume flow rate. Volume flow rate is
obtained by using an arduino circuit. There are two copper rods which are placed at a
difference of 400 ml in a beaker. The arduino is programmed in such a way that it gives
us the time taken for filling that 400 ml. Time starts when the arduino is switched on. The
time at which water comes in contact with the lower rod is called first interrupt and with
the upper rod, it is called second interrupt. The difference between these interrupts the
time taken for filling 400ml. This gives us the volume flow rate. From the density we can
calculate the velocity of water. Thus at a given pressure in the line the corresponding
velocity at the exit of the nozzle is obtained.

28
Fig.3.4. Arduino circuit for calibrating liquid line

29
0
0.5
1
1.5
2
2.5
3
3.5
0.795 0.8 0.805 0.81 0.815 0.82 0.825
Liq
uid
Ve
loci
ty U
l (m
/s)
Pressure P (bar)
Liquid Line Calibration
Fig 3.5 Liquid Calibration Curve
3.6. Calibration of air line
The air supply line is calibrated so that the air velocities at the corresponding line
pressures indicated on the pressure gauge are known thus making testing easier. This is
done using a static pressure tap near the converging section of the nozzle. For this a 1.5
mm diameter hole is drilled near the entrance of the converging section of the nozzle into
which a hypodermic needle is placed. This relays the static pressure at that point by
connecting the U-tube manometer (using water as the manometric fluid) to the needle
using a tube.The difference in the water level in the manometer is noted down and this
gives the difference between the pressure at the converging section of the nozzle and the
atmosphere. As the static pressure at the exit of the nozzle is atmospheric pressure, the
manometer gives the pressure difference between the converging section and the exit.

30
This along with the continuity and Bernoulli’s equation give the inlet and exit velocity.
The exit velocity is plotted with the line pressure, which is measured using the bourdon
pressure gauge. Thus the velocities of the air during testing can now be obtained if the
line pressure is known. The same procedure can be repeated to get different air velocities.
Fig 3.6 Air Supply line Calibration Graph
3.7 Break-Up Length and Spray Angle Measurement
Image Processing Toolbox in MATLAB is used for this purpose. The image is read into
Matlab using the command “imread”. It is then displayed using , imtool (variable
name)”.The distance tool is used to first measure a reference surface whose dimension is
initially known. Then the spray break up length is measured by getting the distance in
pixels between the nozzle exit and the point where perturbation and breakup in the liquid

31
begins. The break up length is then converted into millimeters by using the length of the
reference surface.
The spray angle is similarly obtained by creating a right angle triangle where the
hypotenuse is a straight line from the outlet to the crest of the spray. The corresponding
opposite and adjacent sides are constructed in the image. Using this information the angle
can be measured by simple trigonometry.

32
4. RESULTS AND DISCUSSION
4.1 QUALITATIVE ANALYSIS
The images of the spray at the varied conditions specified are observed and visually
analyzed. It is clearly observed that the liquid sheet when not excited by air breaks up
after penetrating a great distance into ambient air. Only small perturbations are observed
because of the liquid’s inertia and the ambient air’s disturbance. Now as the velocity of
the air is progressively increased for constant liquid velocity, the perturbations in the
liquid sheet are increased because of the increase in the effect of aerodynamic inertia on
the liquid. Thus the break up length of the liquid was seen to increase.
Also at a particular air velocity, it was observed that the droplet size and the break up
length were the smallest and the cone angle over which the liquid is dispersed is the
largest at the smallest liquid velocity. As the liquid velocity increases, the drops become
larger and so does the break up length. Detailed quantitative analysis will reveal the
reasons for such behavior.

33
Fig 4.1 Spray images captured at liquid velocity: 1.7 m/s;
At air velocity: (a)16.81 m/s (b)23.81 m/s (c)27.68 m/s (d)30.32 m/s
(a) (b)
(c) (d)

34
(a) (b)
(c) (d)
Fig.4.3 Spray images captured at liquid velocity: 2.5m/s;
At air velocity: (a) 16.81 m/s (b) 23.81 m/s (c) 27.68 m/s (d) 30.32 m/s

35
(a) (b)
(c) (d)
Fig .4.1 Spray images captured at liquid velocity: 2.98 m/s;
At air velocity: (a) 16.81 m/s (b) 23.81 m/s (c) 27.68 m/s (d) 30.32 m/s

36
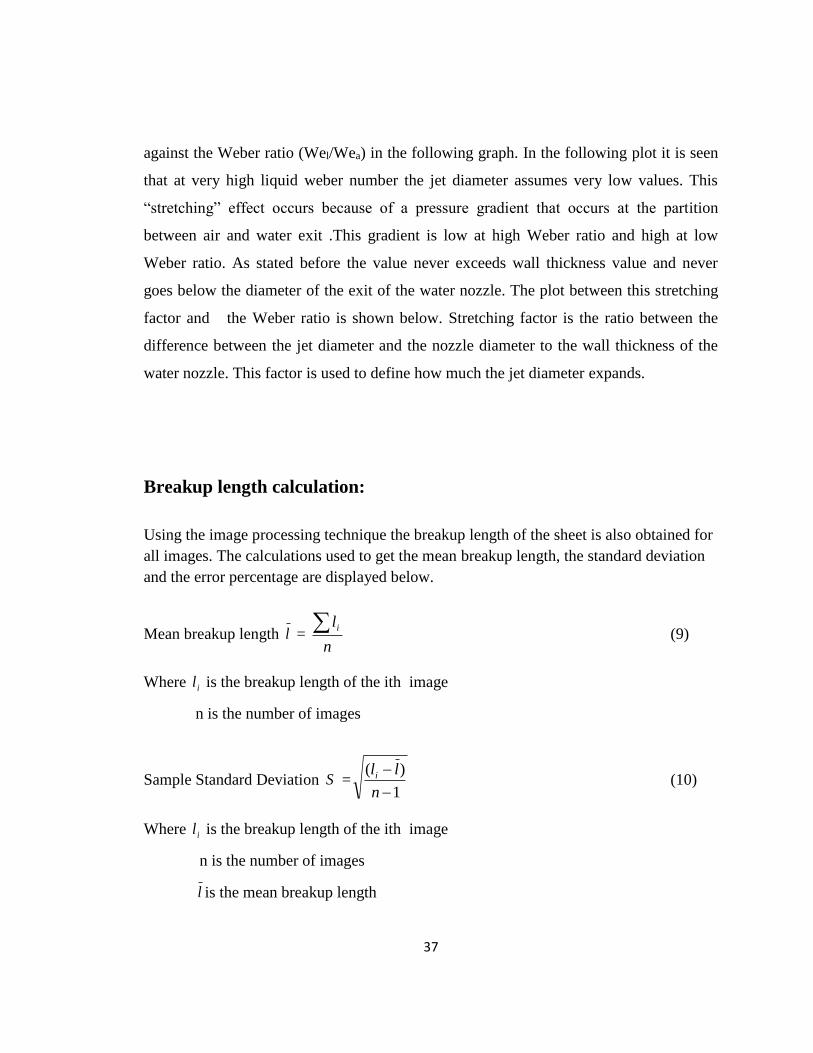
4.2 QUANTITATIVE ANALYSIS
Using MATLAB, the parameters for various conditions was determined. Images of all
liquid velocities corresponding to each air velocity were analyzed.
Fig 4.6. Non Dimensional Break up length and Weber Ratio
It is observed that at every air velocity the jet diameter is maximum for the lowest water
velocity. For each air velocity, as the water velocity increases the jet diameter decreases.
It was observed that the maximum value of jet diameter reaches 9mm which corresponds
to the outer wall diameter of the liquid nozzle.The sudden increase in each curve is
attributed to the change in the mechanism of breakup from Rayleigh break up to
aerodynamic forces. This stretching is caused because of the pressure drop between the
air and water exit. Therefore at high water velocity the phenomenon of diameter
stretching was found negligible. This jet diameter is non-dimensionalised and plotted
37
against the Weber ratio (Wel/Wea) in the following graph. In the following plot it is seen
that at very high liquid weber number the jet diameter assumes very low values. This
“stretching” effect occurs because of a pressure gradient that occurs at the partition
between air and water exit .This gradient is low at high Weber ratio and high at low
Weber ratio. As stated before the value never exceeds wall thickness value and never
goes below the diameter of the exit of the water nozzle. The plot between this stretching
factor and the Weber ratio is shown below. Stretching factor is the ratio between the
difference between the jet diameter and the nozzle diameter to the wall thickness of the
water nozzle. This factor is used to define how much the jet diameter expands.
Breakup length calculation:
Using the image processing technique the breakup length of the sheet is also obtained for
all images. The calculations used to get the mean breakup length, the standard deviation
and the error percentage are displayed below.
Mean breakup length l = n
li (9)
Where il is the breakup length of the ith image
n is the number of images
Sample Standard Deviation S =1
)(
n
lli (10)
Where il is the breakup length of the ith image
n is the number of images
l is the mean breakup length
38
Percentage error = 100l
S (11)
Where S is the Sample Standard Deviation
l is Mean breakup length
The error bar graph between liquid velocity in the x-axis and the mean breakup length in
the y-axis was plotted. We have multiple curves in the graph where each curve
corresponds to a particular constant air velocity. The standard deviation for each point
has also been plotted on that graph as error bar. The maximum error percentage comes
under 20%. This is attributed to the fact that at high air velocities and low liquid
velocities the break up is a highly dynamic process and thus a variation in the break up
length is expected.

39
Table 4.1 Calculated breakup length at liquid velocity 2.98 m/s
Table 4.2 Calculated breakup length at liquid velocity 2.5 m/s
S NO Air Pressure
(bar) Air velocity
(m/s) Mean Breakup Length (mm)
1 0.4 16.81 37.9987
2 0.6 23.81 27.9759
3
4
0.8
0.9
27.68
30.32
23.08981
21.22076
S NO Air Pressure
(bar) Air velocity
(m/s) Mean Breakup Length (mm)
1 0.4 16.81 29.8273
2 0.6 23.81 25.68486
3
4
0.8
0.9
27.68
30.32
21.51499 18.86989
40
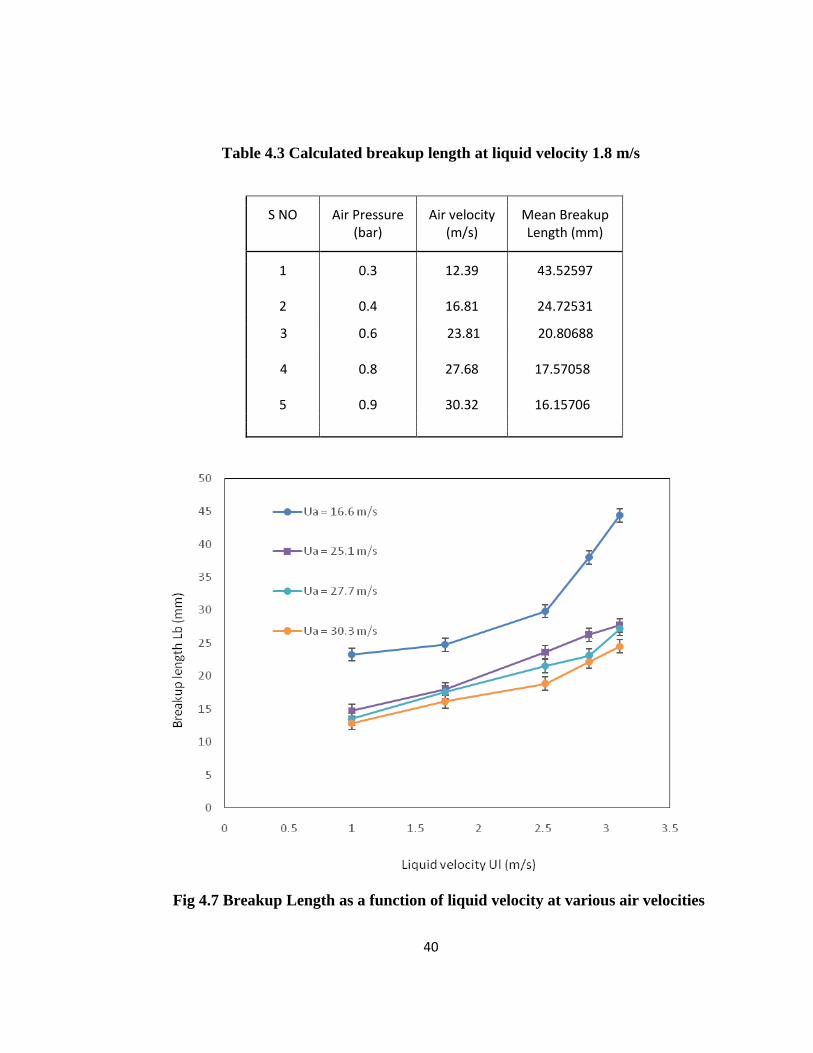
Table 4.3 Calculated breakup length at liquid velocity 1.8 m/s
Fig 4.7 Breakup Length as a function of liquid velocity at various air velocities
S NO Air Pressure
(bar) Air velocity
(m/s) Mean Breakup Length (mm)
1
2
0.3
0.4
12.39
16.81
43.52597
24.72531
3 0.6 23.81 20.80688
4
5
0.8
0.9
27.68
30.32
17.57058 16.15706

41
Spray Angle Calculation:
Using the image processing technique the spray angle of the sheet is also obtained for all
images. The calculations used to get the mean spray angle; the standard deviation and the
error percentage are displayed below.
Mean break up length l = n
li (9)
Where il is the spray angle of the ith image
n is the number of images
Sample Standard Deviation S =1
)(
n
lli (10)
Where il is the spray angle of the ith image
n is the number of images
l is the mean spray angle
Percentage error = 100l
S (11)
Where S is the Sample Standard Deviation
l is Mean spray angle
The error bar graph between liquid velocity in the x-axis and the mean spray angle in the
y-axis was plotted. We have multiple curves in the graph where each curve corresponds
to a particular constant air velocity. The standard deviation for each point has also been
plotted on that graph as error bar. The maximum error percentage comes under 20%. This

42
is attributed to the fact that at high air velocities and low liquid velocities the break up is
a highly dynamic process and thus a variation in the break up length is expected.
Table 4.6 Calculated spray angle at liquid velocity 1.8 m/s
S NO Air Pressure
(bar) Air velocity
(m/s) Mean Spray
angle (degrees)
1
0.4
16.81
30.82324
2 0.6 23.81 33.74066
3 0.8 27.68 40.28074
4 0.9 30.32
41.53691
Table 4.7 Calculated spray angle at liquid velocity 2.5 m/s
S NO Air Pressure
(bar) Air velocity
(m/s) Mean Spray
angle (degrees)
1
0.4
16.81
28.42549
2 0.6 23.81 32.02589
3 0.8 27.68 30.54898
4 0.9 30.32
32.63325

43
Table 4.8 Calculated spray angle at liquid velocity 2.98 m/s
S NO Air Pressure
(bar) Air velocity
(m/s) Mean Spray
angle (degrees)
1
0.4
16.81
17.5102
2 0.6 23.81 26.83547
3 0.8 27.68 21.23606
4 0.9 30.32
24.24812
Fig 4.8 Spray Angle as a function of liquid velocity at various air velocities
44
5. CONCLUSION
The effect of liquid and air velocities on breakup length of the liquid sheet emerging from
a twin fluid atomizer is experimentally characterized. The parameters such as breakup
length and spray angle was thoroughly studied and its effect on atomization was
discussed this study mainly focuses on how the use of an air assisted atomizer can lead to
improved atomization of the fuel. The breakup and spray angle is observed at various
liquid and air velocities.

45
REFERENCES:
1. F.Durst., M. Ismailov., D. Trimis., 1996, “Measurement of instantaneous flow
operating injection systems”, Experiments in Fluids, Springer-Verlag
2. F. Durst., A. Melling., D. Trimis. and P. Volkholz.,1996, “Development of a flow
meter for instantaneous flow rate measurements of anaesthetic liquids”, Flow
Max Instrum., Vol. 7, No. 314, pp. 215-221
3. May. Y. Leong, Vincent. G. McDonell, and G. Scott. Samuelsen., “Mixing of an
Airblast-Atomized Fuel Spray Injected Into a Crossflow of Air”, NASA/CR—
2000-210467
4. Norman Chigier, William Bachalo, Rolf Reitz.,1994, “Spray Technology Short
Course notes”, Department of Mechanical Engineering Carnegie Mellon
University
5. Pipatpong Watanawanyoo, Sumpun Chaitep. and Hiroyuki Hirahara., 2009,
“Development of an Air Assisted Fuel Atomizer (Liquid Siphon Type) for a
Continuous Combustor”, American Journal of Applied Sciences, Science
Publications
6. R. Jeremy Kenny, Nathan B. Walker., May 2010, “Atomization of Shear Coaxial
Liquid Jets”, Applied Physics Research Vol. 2, No. 1
7. S H Jin, M Brear, H Watson, and S Brewster., June 2008, “An experimental study
of the spray from an air-assisted direct fuel injector, Proc. IMechE Vol. 222 Part
D: J. Automobile Engineering, pp 1-4
8. S. P. Lin, R. D. Reitz., 1998, “Drop and spray formation from a liquid jet”, Annu.
Rev. Fluid Mech. 30:85–105
9. V. Sivadas, M. V. Heitor, Rui Fernandes., February 2007, “A Functional
Correlation for the Primary Breakup Processes of Liquid Sheets Emerging From
Air-Assist Atomizers”, Journal of Fluids Engineering, , Vol. 129 / 193 ,pp. 1-2.
10. Zoltan Farago, Hasan Eroglu and Norman Chigier, October 1990, “Coaxial
atomizer liquid intact lengths”, Phys. Fluids A, Vol. 3, No. 2