final report 12 - colmar brunton... · final report issue date: 14 june 2018 project number: ... 3...
TRANSCRIPT

Final Report
Issue Date: 14 June 2018
Project Number: ACCC0007
APPENDIX 12

ACCC0007_Retail Electricity_Final Report_140618 2
Contents 1. Executive Summary ......................................................................................... 6
1.1 Introduction ........................................................................................................................................ 6
1.2 Methodology ........................................................................................................................................ 6
1.3 Key Findings and Conclusions ......................................................................................................... 7
2. Introduction..................................................................................................... 12
2.1 Background ....................................................................................................................................... 12
2.2 Research Objectives ........................................................................................................................ 13
3. Methodology in Brief ...................................................................................... 14
3.1 Overview of Research Approach ................................................................................................... 14
3.2 Interpreting This Report ................................................................................................................. 17
4. Price and Other Billing Data Findings ......................................................... 20
4.1 Price Findings .................................................................................................................................... 21
4.1.1 Effective Unit Charge (Basic) ......................................................................................................... 21
4.1.2 Concession Prices ............................................................................................................................. 25
4.1.3 Switching Price Outcomes .............................................................................................................. 28
4.1.4 Standing Offer Price Outcomes ..................................................................................................... 30
4.1.5 Hardship and Payment Plan Price Outcomes .............................................................................. 32
4.2 Other Billing Findings ...................................................................................................................... 33
4.2.1 Concession Demographics .............................................................................................................. 33
4.2.2 Standing Offer Demographics ....................................................................................................... 37
4.2.3 Hardship and Payment Plan Demographics ................................................................................ 41
5. Survey Findings .............................................................................................. 49
5.1 Moved ................................................................................................................................................. 49
5.2 Switched ............................................................................................................................................ 53
5.3 Factors Affecting Usage .................................................................................................................. 56
5.4 Bill Payments and Decisions .......................................................................................................... 73
5.5 Key Demographics ........................................................................................................................... 86
6. Sample Profiles ............................................................................................... 87
7. Appendix A: Technical Notes ....................................................................... 89
7.1 Research Approach .......................................................................................................................... 89
7.2 Error ................................................................................................................................................... 94
8. Appendix B: Questionnaire .......................................................................... 96

ACCC0007_Retail Electricity_Final Report_140618 3
Index of Figures Figure 1: Completed interviews by subgroups used for tests of statistical significance 16
Figure 2: Definitions 17
Figure 3: Effective Unit Charge (Basic) – Target audiences 21
Figure 4: Effective Unit Charge (Basic) – Age categories 22
Figure 5: Effective Unit Charge (Basic) – Income categories 23
Figure 6: Effective Unit Charge (Basic) – Target audience categories 23
Figure 7: Effective Unit Charge (Basic) – Housing status 24
Figure 8: Effective Unit Charge (Basic) – Payment/Hardship status 24
Figure 9: Billing respondents who received an electricity concession 25
Figure 10: Concession prices 27
Figure 11: Switching Price Outcomes – Categories 28
Figure 12: Switching Price Outcomes – Effective Unit Charge (including Concessions) 29
Figure 13: Standing Offer Price Outcomes – Categories 30
Figure 14: Effective Unit Charge (including Concessions) – Standing Offer customers 31
Figure 15: Effective Unit Charge (including Concessions) – Hardship customers 32
Figure 16: Effective Unit Charge (including Concessions) – Payment plan customers 32
Figure 17: Concessions – Target audiences 33
Figure 18: Concessions – Age categories 34
Figure 19: Concessions – Income categories 34
Figure 20: Concessions – Housing status 35
Figure 21: Concessions – Payment/Hardship status 35
Figure 22: Concessions – Locations 36
Figure 23: Types of government concession cards 36
Figure 24: Standing offers – Target audiences 37
Figure 25: Standing offers – Age categories 38
Figure 26: Standing offers – Income categories 39
Figure 27: Standing offers – Target audience categories 39
Figure 28: Standing offers – Housing status 40
Figure 29: Standing offers – Payment/Hardship status 40
Figure 30: Hardship plan – Target audiences 41
Figure 31: Hardship plan – Age categories 42
Figure 32: Hardship plan – Income categories 43
Figure 33: Hardship plan – Target audience categories 43
Figure 34: Hardship plan – Housing status 44
Figure 35: Hardship plan – Payment/Hardship status 44

ACCC0007_Retail Electricity_Final Report_140618 4
Figure 36: Payment plan – Target audiences 45
Figure 37: Payment plan – Age categories 46
Figure 38: Payment plan – Income categories 47
Figure 39: Payment plan – Target audience categories 47
Figure 40: Payment plan – Housing status 48
Figure 41: Payment plan – Payment/Hardship status 48
Figure 42: Percentage of survey respondents that had moved since December 2016 – Target audiences 49
Figure 43: Percentage of survey respondents that had moved since December 2016 – Housing status 50
Figure 44: Percentage of survey respondents that had moved since December 2016 – Locations 50
Figure 45: Number of moves made since December 2016 – Target audiences 51
Figure 46: Number of moves made since December 2016 – Housing status 51
Figure 47: Number of moves made since December 2016 – Locations 52
Figure 48: Switched Retailers while at current address since December 2016 – Target audiences 53
Figure 49: Switched Retailers while at current address since December 2016 – Housing status 53
Figure 50: Switched Retailers while at current address since December 2016 – Locations 54
Figure 51: Number of switches since December 2016 – Target audiences 54
Figure 52: Number of switches since December 2016 – Housing status 55
Figure 53: Number of switches since December 2016 – Locations 55
Figure 54: Other types of energy used – Target audiences 57
Figure 55: Other types of energy used – Housing status 58
Figure 56: Other types of energy used – Locations 59
Figure 57: Gas usage – Target audiences 60
Figure 58: Gas usage – Housing status 60
Figure 59: Gas usage – Locations 61
Figure 60: Solar PV usage (Inverter) – Target audiences 62
Figure 61: Solar PV usage (Panels) – Target audiences 63
Figure 62: Solar PV usage (Inverter) – Housing status 64
Figure 63: Solar PV usage (Panels) – Housing status 64
Figure 64: Solar PV usage (Inverter) – Locations 65
Figure 65: Solar PV usage (Panels) – Locations 65
Figure 66: Pool usage – Target audiences 66
Figure 67: Pool usage – Housing status 67
Figure 68: Pool usage – Locations 67
Figure 69: Air conditioner usage – Target audiences 68

ACCC0007_Retail Electricity_Final Report_140618 5
Figure 70: Rooms with air conditioning – Target audiences 68
Figure 71: Air conditioner usage – Housing status 69
Figure 72: Rooms with air conditioning – Housing status 69
Figure 73: Air conditioner usage – Locations 70
Figure 74: Rooms with air conditioning – Locations 70
Figure 75: Running a business from home – Target audiences 71
Figure 76: Running a business from home – Housing status 71
Figure 77: Running a business from home – Locations 72
Figure 78: Late Payments – Target audiences 73
Figure 79: Late Payments – Housing status 74
Figure 80: Late Payments – Locations 74
Figure 81: Missed Payments – Target audiences 75
Figure 82: Missed Payments – Housing status 76
Figure 83: Missed Payments – Locations 77
Figure 84: Disconnected – Target audiences 78
Figure 85: Disconnected – Housing status 78
Figure 86: Disconnected – Locations 79
Figure 87: Payment Plan – Target audiences 80
Figure 88: Payment Plan – Housing status 81
Figure 89: Payment Plan – Locations 82
Figure 90: Informed decision making – Target audiences 83
Figure 91: Informed decision making – Housing status 84
Figure 92: Informed decision making – Locations 85
Figure 93: Metro/Regional – Target audiences 86
Figure 94: Metro/Regional – Housing status 86
Figure 95: Sample profile – All billing respondents 87
Figure 96: Sample profile – All survey respondents 88
Figure 97: Statistics used in weighting – All Survey Respondents 92
Figure 98: Statistics used in weighting – All In Scope Billing Respondents 93

ACCC0007_Retail Electricity_Final Report_140618 6
1. Executive Summary
1.1 Introduction
Colmar Brunton Social Research (CBSR) was approached by the Australian Competition and Consumer Commission (ACCC) to conduct research into Australian households in the National Electricity Market (NEM, which includes QLD, NSW, ACT, VIC, SA and TAS).
The requirements of this research project were to:
Assist in determining price outcomes for groups of consumers that are more likely to be vulnerable, to determine if they are experiencing worse price outcomes in relation to the average population;
Undertake research of consumer demographics and behaviours to enable the ACCC to compare price outcomes for groups of consumers that are more likely to be vulnerable with groups of consumers that are less likely to be vulnerable;
Obtain consumer account information to enable the ACCC to obtain billing and consumption data from retailers;
Collate consumer data and electricity data provided by retailers in response to the ACCC’s formal notices and provide the collated data set to the ACCC; and
Produce a report summarising the findings of the research, which will be used to inform the final report of the Retail Electricity Pricing Inquiry.
1.2 Methodology
The research involved a four stage approach which included:
1. Project planning meeting to finalise the research approach, followed by questionnaire development;
2. Quantitative fieldwork preparation, which included the review, refinement and testing of the questionnaire and a pilot of the questionnaire undertaken from Thursday 8th to Monday 12th February 2018;
3. Quantitative data collection via the use of an online and telephone survey undertaken from Monday 12th February to Monday 12th March 2018, which resulted in n=3,815 completed surveys (online n=2,981 and CATI 843). Electricity retailers then provided billing data for n=3,625 survey respondents and in conjunction with the ACC the final number of in scope billing respondents was determined to be n=3,310 (n=2,437 non-solar customers and 873 solar customers). The ACCC also instructed Colmar Brunton to exclude solar customers from all billing calculations and analysis due to the inherent differences between solar and non-solar customer usage and prices. Therefore the final number of in scope respondents which billing analysis in this report is based on reduced to n=2,437. Please note that the ACCC has conducted a separate analysis on solar customers.

ACCC0007_Retail Electricity_Final Report_140618 7
4. Analysis and reporting of both billing and survey results to inform the Retail Electricity Pricing Inquiry.
This report presents the findings of this research.
1.3 Key Findings and Conclusions
What were consumers actually paying?
Colmar Brunton in conjunction with the ACCC sought to examine what consumers were paying (on average) for their electricity over a nine to 13 month period, both at a total level and by particular target audiences. The aim of this approach was to determine if any of the target audiences were experiencing worse outcomes in relation to electricity prices than the average population.
As such, all n=2,437 in scope billing respondent’s charges and usage data (provided by electricity retailers) was used to create an Effective Unit Charge (Basic), this was calculated as:
Total Charges ($) / Total Usage (kWh) = Effective Unit Charge (Basic) (c/kWh)
With total charges including: (Usage Charges + Supply Charges + Demand Charges) – Discounts
The average Effective Unit Charge (Basic) for all billing respondents was found to be $0.31. There were some target audiences that were found to have a significantly higher average Effective Unit Charge (Basic), while other target audiences experienced a significantly lower average Effective Unit Charge (Basic).
Respondents with an annual household income of less than $25,000 ($0.35), those with no or limited internet ($0.34), households that speak a language other than English at home ($0.33) and respondents in private rentals ($0.32) all experienced significantly higher Effective Unit Charges (Basic) when compared to the average for all billing respondents ($0.31).
Interestingly there were some target audiences that actually experienced significantly lower Effective Unit Charges (Basic) when compared to the average for all billing respondents ($0.31). These included respondents paying off a mortgage ($0.30), middle income households ($50,000-$99,999) with 2 or more dependents ($0.29) and those that according to retailer data had been on a payment plan for one or more billing periods ($0.29).
How were concessions impacting prices?
Just over one third (37%) of billing respondents received an electricity concession, according to the data provided by electricity retailers. In order to test whether these respondents were experiencing a higher or lower Effective Unit Charge after the concessions were taken into account, or if there was no difference, two calculations were conducted.
The first was a basic Effective Unit Charge that was computed as:
Total Charges ($) / Total Usage (kWh) = Effective Unit Charge (Basic) (c/kWh)

ACCC0007_Retail Electricity_Final Report_140618 8
In this instance Total Charges was calculated as:
(Usage Charges + Supply Charges + Demand Charges) – Discounts
The second calculation that was conducted was an Effective Unit Charge that took into account concessions – Effective Unit Charge (including Concessions). In this instance Total Charges was calculated as:
(Usage Charges + Supply Charges + Demand Charges) – (Discounts and Concessions)
The results (for the whole NEM) indicated that when their concessions had not been taken out, those who received an electricity concession on average experienced a similar Effective Unit Charge (Basic) ($0.32) to all billing respondents ($0.31). They did however experience a lower Effective Unit Charge ($0.26) when their concessions were included in the calculation.
When looking at the results by locations across the NEM there were some significant differences observed.
Rest of Queensland – Those living in the rest of Queensland experienced a significantly lower Effective Unit Charge with concessions included ($0.25 compared to $0.26 for all concession billing respondents).
New South Wales – Those living in New South Wales experienced a significantly lower Effective Unit Charge with concessions included $0.24 compared to $0.26 for all concession billing respondents).
Victoria – Those living in Victoria experienced a significantly higher Effective Unit Charge with concessions included ($0.27 compared to $0.26 concession billing respondents).
South Australia – Those living in South Australia that did not receive an electricity concession experienced a significantly higher Effective Unit Charge (Basic) ($0.38 compared to $0.31 for all non-concession billing respondents), those that received an electricity concession experienced a significantly higher Effective Unit Charge (Basic) ($0.37 compared to $0.32 for all concession billing respondents) and a significantly higher Effective Unit Charge (including concessions) ($0.32 compared to $0.26 for all concession billing respondents) compared to the averages for all NEM locations.
Tasmania – Those living in Tasmania that did not receive an electricity concession experienced a significantly lower Effective Unit Charge (Basic) ($0.25 compared to $0.31 for all non-concession billing respondents), those that received an electricity concession experienced a significantly lower Effective Unit Charge (Basic) ($0.24 compared to $0.32 for all concession billing respondents) and a significantly lower Effective Unit Charge (including concessions) ($0.18 compared to $0.26 for all concession billing respondents) compared to the averages for all NEM locations.
Australian Capital Territory – Those living in the Australian Capital Territory that did not receive an electricity concession experienced a significantly lower Effective Unit Charge (Basic) ($0.25 compared to $0.31 for all non-concession billing respondents), those that received an electricity concession experienced a significantly lower Effective Unit Charge (Basic) ($0.22 compared to $0.32 for all concession billing respondents) and a significantly lower Effective Unit Charge (including concessions) ($0.14 compared to $0.26 for all concession billing respondents) compared to the averages for all NEM locations.

ACCC0007_Retail Electricity_Final Report_140618 9
How did switching retailers affect price outcomes?
Based on the data provided by electricity retailers, all in scope billing respondents were placed into one of six categories related to whether they had moved address and/or switched retail electricity providers at some point during the nine to 13 month period.
The results showed that the majority (89%) of billing respondents had neither switched electricity retailer nor had they moved during the nine to 13 month period. This was followed by those that had not switched electricity retailer, but had moved (5%) and those that had not moved, but had switched electricity retailer at the same address once (5%). Those that had switched whilst moving made up just 1% of all billing respondents, while those that had switched but not when moving and those that had not moved but had switched at the same address two or more times both made up less than 1% of all billing respondents.
These results were reflected in the findings from the survey where 14% of all survey respondents reported having moved address (i.e. lived at another address apart from their current address) since December 2016. The majority (84%) of these survey respondents that had moved reported having done so only once since December 2016, while a further 12% had moved twice in that time. Similarly, just 14% of all survey respondents reported having switched electricity retailers since December 2016, with again the majority (83%) having switched just once.
When the six categories were analysed in terms of the Effective Unit Charges (including Concessions), there were no statistically significant differences. Three of the six categories created had very small sample sizes and as such the results observed for these categories should be interpreted with caution. It should also be noted that the Effective Unit Charges (including Concessions) were based on the average for all billing periods, not just the Effective Unit Charge (including Concessions) after the switch had occurred.
Who has been on a hardship or payment plan? And what were they paying for their electricity?
Only 3% of all billing respondents had been on a hardship plan for one or more billing periods based on the data provided by electricity retailers. Those who received an electricity concession, those with a disability in the household, those who reported having missed a payment on an electricity bill since December 2016 and those on a payment plan for one or more billing periods were significantly more likely to have been on a hardship plan for one or more billing period (6%, 9%, 17% and 18% respectively compared to 3% for all billing respondents). On the other hand those billing respondents in adult only households were significantly less likely to have been on a hardship plan for at one or more billing period (2% compared to 3% for all billing respondents).
When looking at the Effective Unit Charge (including Concessions) by those that had been on a hardship policy for one or more billing periods there were no statistically significant differences. Those on a hardship plan had an Effective Unit Charge (including Concessions) of $0.28, while non-hardship plan customers had an Effective Unit Charge (including Concessions) of $0.29.
Only 7% of all billing respondents had been on a payment plan for one or more billing periods based on the data provided by the electricity retailers. Those with a disability on the household, those aged 18-34 years, those in a private rental, those who reported having missed a payment on an electricity

ACCC0007_Retail Electricity_Final Report_140618 10
bill since December 2016 and those on a payment plan for one or more billing periods were significantly more likely to have been on a hardship plan for at least one billing periods (10%, 10%, 11%, 33% and 43% respectively compared to 7% for all billing respondents). On the other hand those billing respondents in adult only households or those in households with no disability were significantly less likely to have been on a payment plan for one or more billing period (5% and 6% compared to 7% for all billing respondents).
Those that had been on a payment plan for one or more billing periods ($0.27) experienced a significantly lower Effective Unit Charge (including Concessions) compared to all billing respondents ($0.29).
Who has been on a standing offer? And what were they paying for their electricity?
The majority (84%) of billing respondents had not been on a standing offer for any of the billing periods used in this study, while the remaining 16% had been on standing offer for at least one billing period. This included 14% who had been on a standing offer for all of the billing periods, 1% who had been on a standing offer for one of the billing periods and another 1% had been on a standing offer for more than one, but not all of the billing periods.
Significant differences were seen with those who had been on a standing offer for all of the billing periods. Those earning a household income of less than $25,000, those with a disability in the household, those aged 50-64 years, those who received an electricity concession and those households that only speak English were all significantly more likely to have been on a standing offer for all of the billing periods included in the study (19%, 19%, 18%, 16% and 15% respectively compared to 14% for all billing respondents). Conversely, those households who did not receive an electricity concession and those without a disability in the household were all significantly less likely to have been on a standing offer for all of the billing periods included in the study (12% and 12% respectively compared to 14% for all billing respondents).
When looking at the Effective Unit Charge (including Concessions) for those had been on a standing offer for any of the billing periods used in this study there were no statistically significant differences. Those billing respondents that had not been on a standing offer for any of the billing periods used in this study had an Effective Unit Charge (including Concessions) of $0.29. The Effective Unit Charge (including Concessions) was $0.29 for those on a standing offer for more than one but not all billing periods used in this study and $0.28 for those on were on a standing offer for all billing periods used in this study. The Effective Unit Charge (including Concessions) for those on a standing offer for one billing period used in this study was $0.24, however this result should be interpreted with caution due to the small sample size (n=30 or less).
How confident are consumers in making informed decisions about the best electricity offer for themselves?
All survey respondents were asked to use a five point scale to rate their level of confidence with regards to making informed decisions about the best electricity offer for themselves. Approximately two thirds (66%) indicated that they felt either ‘moderately confident’ (40%) or ‘very confident’ (26%) in

ACCC0007_Retail Electricity_Final Report_140618 11
making informed decisions. One in five indicated that they felt ‘slightly confident’ (20%) and the remaining 15% indicated that they felt either ‘not very confident’ (12%) or ‘not at all confident’ (3%).
Levels of confidence in making informed decisions varied significantly amongst some of the target audiences, housing status types and locations:
Those aged 65 years and over were significantly more likely to have selected that they felt ‘moderately confident’ or ‘very confident’ (74% compared to 65% for all survey respondents).
Those aged 65 years and over and those holding at least one government concession card were significantly less likely to have felt ‘slightly confident’ (14% and 17% respectively compared to 20% for all survey respondents).
Those with an annual household income of less than $25,000 were significantly more likely to feel ‘not very confident’ or ‘not at all confident’ (20% compared to 15% for all survey respondents), as were respondents where one or more persons in the house had either a mental or physical disability (18% compared to 15% for all survey respondents).
Those living in a public rental were significantly less likely to have selected that they felt ‘moderately confident’ or ‘very confident’ (54% compared to 65% for all survey respondents). Conversely they were significantly more likely to have felt ‘not very confident’ or ‘not at all confident’ (23% compared to 15% for all survey respondents).
Those that own their home outright were more significantly more likely to have selected that they felt ‘moderately confident’ or ‘very confident’ (73% compared to 65% for all survey respondents). Conversely they were significantly less likely to have felt ‘slightly confident’ (15% compared to 20% for all survey respondents) or ‘not very confident’ or ‘not at all confident’ (12% compared to 15% for all survey respondents).
Those paying off a mortgage were significantly less likely to have selected that they felt ‘moderately confident’ or ‘very confident’ (62% compared to 65% for all survey respondents) and were more likely to have selected that they felt ‘slightly confident’ (23% compared to 20% for all survey respondents).
Those living in the rest of Queensland were significantly less likely to have felt ‘moderately confident’ (31% compared to 40% for all survey respondents). Conversely they were significantly more likely to have felt ‘not very confident’ (7% compared to 3% for all survey respondents).

ACCC0007_Retail Electricity_Final Report_140618 12
2. Introduction
Colmar Brunton Social Research (CBSR) was approached by the Australian Competition and Consumer Commission (ACCC) to conduct research into Australian households in the National Electricity Market. This report presents the findings of this research.
2.1 Background
Australian households in the National Electricity Market (NEM, which includes QLD, NSW, ACT, VIC, SA and TAS) are paying higher retail electricity prices compared to the majority of households in other Organisation for Economic Co-operation and Development (OECD) countries.1
According to OECD data, Australia has dropped from the 4th cheapest and below the OECD average in 2004 to the 10th cheapest and above the OECD average in 2016.2 Other analysis has suggested that Australia’s prices were close to the most expensive in the world.3
In March 2017, the Government directed the ACCC to conduct an inquiry into the pricing and supply of retail electricity services. The ACCC’s inquiry aims to identify and report on the key cost components of electricity retail pricing and how they affect the retail offers made to customers. The inquiry will examine whether electricity retailers’ margins and profitability are in line with their costs and risks.4
A preliminary report was released by the ACCC in September 2017. The report found that the increases in residential bills were mainly driven by network costs which increased by 9.5 per cent per year from 2010 to 2015.5 Other key factors included insufficient competition in the electricity retail market, recent closures of coal-fired power stations (for example, Hazelwood in Victoria) and the cost of environmental schemes. These factors saw a 44 per cent increase in the average residential bill increasing from $1,177 in 2007-08 to $1,691 in 2016-17.
The report published data showing the electricity retailer margin is at 8%6 which is higher than other retail sectors such as food (6 per cent) and fuel (3 per cent), and higher than the 5-6 per cent margin that regulators traditionally considered fair when setting the retail electricity price.7
The landscape of electricity retailers in Australia is dominated by the ‘Big three’ (or Tier 1 retailers), which consists of Origin Energy, AGL and Energy Australia. Together, these three retailers provide 70 percent of retail electricity to consumers in NEM states.8
1 http://www.afr.com/news/australian-households-pay-highest-power-prices-in-world-20170804-gxp58a 2 ACCC, ACCC Retail Electricity Pricing Inquiry Preliminary Report, September 2017, p. 24 3 CME, The retail electricity market for households and small businesses in Victoria – Analysis of offers and bills, July 2017, p. 36. 4 Joint media release with the Hon Malcolm Turnbull MP Prime Minister, ACCC to review electricity prices, http://sjm.ministers.treasury.gov.au/media-release/022-2017/. Accessed at 31 May 2018 5 ACCC, ACCC Retail Electricity Pricing Inquiry Preliminary Report, September 2017, p. 21 6 ACCC, ACCC Retail Electricity Pricing Inquiry Preliminary Report, September 2017, p. 32 7 https://grattan.edu.au/wp-content/uploads/2017/03/Price-shock-is-the-retail-market-failing-consumers.pdf 8 https://www.aer.gov.au/system/files/AER%20State%20of%20the%20energy%20market%202017%20-%20A4.pdf

ACCC0007_Retail Electricity_Final Report_140618 13
A 2016 report by the Australian Energy Market Commission states that consumers have high awareness of other retailers in the market, it also indicates that 50 per cent of consumers have not switched their energy plan or retailer in the past five years, and 70 per cent do not actively assess their energy options.9
The Federal Government has instigated a number of measures to address the concerns with the market including proposing a number of rule changes. One of these measures includes obtaining commitments from eight retailers to contact consumers on higher priced standing offers and expired benefit offers, directing them to the AER’s Energy Made Easy website to see if they can save by switching energy offers.10
2.2 Research Objectives
On 27 March 2017 the Treasurer, the Hon Scott Morrison MP, directed the ACCC to hold an inquiry into the supply of retail electricity and the competitiveness of retail electricity prices. Following consultation and information requests from industry participants and a range of other interested parties, including consumers, businesses, representative groups and other government and non-government organisations the ACCC finalised its preliminary report in September 2017.
The ACCC then engaged Colmar Brunton to assist with the next stage of analysis, in preparation for the final report which the ACCC was required to provide to the Treasurer by 30 June 2018.
The requirements of this research project were to:
Assist in determining price outcomes for groups of consumers that are more likely to be vulnerable, to determine if they are experiencing worse price outcomes in relation to the average population;
Undertake research of consumer demographics and behaviours to enable the ACCC to compare price outcomes for groups of consumers that are more likely to be vulnerable with groups of consumers that are less likely to be vulnerable;
Obtain consumer account information to enable the ACCC to obtain billing and consumption data from retailers;
Collate consumer data and electricity data provided by retailers in response to the ACCC’s formal notices and provide the collated data set to the ACCC; and
Produce a report summarising the findings of the research, which will be used to inform the final report of the Retail Electricity Pricing Inquiry.
9 http://www.aemc.gov.au/Markets-Reviews-Advice/2017-Retail-Energy-Competition-Review/Final/AEMC-Documents/Final- Report.aspx 10 Prime Minister of Australia, ‘Turnbull government secures better power deal for Australian families’, media release, 30 August 2017.

ACCC0007_Retail Electricity_Final Report_140618 14
3. Methodology in Brief
3.1 Overview of Research Approach
The following approach was used for this research:
Stage 1: Project planning meeting; Stage 2: Quantitative fieldwork preparation; Stage 3: Quantitative data collection; and Stage 4: Data processing, analysis and reporting.
Each of these stages is discussed briefly below. In addition further details of the research approach that was undertaken can be found in Appendix A: Technical Notes.
Stage 1: Project planning meeting
The project planning meeting was held on Tuesday 16th January between members of the Colmar Brunton and ACCC project teams. The project planning meeting allowed a deeper knowledge of the objectives of the research, the ways it was envisaged the research results may be used and finalisation of the research design.
Stage 2: Quantitative fieldwork preparation
Following the project planning meetings, Colmar Brunton developed the draft questionnaire which was provided to the ACCC project team for feedback prior to finalisation. The final questionnaire can be found in Appendix B: Questionnaire.
Fieldwork pilot A pilot of the survey which consisted of n=81 completed surveys (online n=46 and telephone n=35) was conducted from Thursday 8th to Monday 12th February 2018. The pilot confirmed the survey was working well and that respondents had little difficulty either interpreting our questions or in providing a valid response. The interim data file from these first 81 surveys was checked to ensure the programmed survey was capturing data strictly in accordance with the final approved questionnaire. Given there was no problems evident in the pilot sample, these completed interviews were counted as part of our final sample of n=3,815.
ACCC0007_Retail Electricity_Final Report_140618 15
Stage 3: Quantitative data collection
A combined quantitative data collection approach which utilised an online survey for the general public and a supplementary telephone survey for particular target audiences of interest unlikely to be well represented on online consumer panels was used for the survey. The following details the outcomes of the survey:
Fieldwork pilot was undertaken from Thursday 8th to Monday 12th February 2018; Main fieldwork was undertaken from Monday 12th February to Monday 12th March 2018; A total of 3,815 surveys were completed - n=2,981 from the online survey and n=834 from the
telephone survey; The ACCC used the survey results to issue formal information gathering notices to retailers to
obtain billing and consumption data for each respondent; Electricity retailers provided billing data for n=3,625 survey respondents which the ACCC
provide to Colmar Brunton; and In conjunction with the ACCC the final number of in scope billing respondents was determined
to be n=3,310 (n=2,437 non-solar customers and 873 solar customers). The ACCC also instructed Colmar Brunton to exclude solar customers from all billing calculations and analysis due to the inherent differences between solar and non-solar customer usage and prices. Therefore the final number of in scope respondents which billing analysis in this report is based on reduced to n=2,437. Please note that the ACCC has conducted separate analysis on solar customers.
Stage 4: Data processing, analysis and reporting
This report presents the findings from the survey research conducted and subsequent analysis of the customer billing data provided by electricity retailers.
Findings for each respondent group (i.e. billing respondents or survey respondents) are presented at the overall level and key sub-group levels. Sub-group analysis and reporting has been undertaken examining differences in the data by the following factors:
Specific target audiences of interest; Housing status; Payment / Hardship status – generally only billing respondent analysis; and Location – generally only survey respondent analysis.
The final sample achieved for each of these sub-groups of interest by respondent group can be seen in the following table.

ACCC0007_Retail Electricity_Final Report_140618 16
Figure 1: Completed interviews by subgroups used for tests of statistical significance
Subgroup All survey
respondent
(n=3,815)
All in scope billing
respondents, solar & non
solar
(n=3,310)
All in scope billing
respondents, non-solar
(n=2,437)
Target audiences of interest
Respondents aged 65 years and over 1,359 1,255 841 Those respondents with a household income of between $0 and $24,999 493 446 364
Concessions (Survey – Eligible for an electricity concession) (Billing – Received an electricity concession)
1,809 (Survey Question)
1,511 (Billing Data)
1,110 (Billing Data)
Sole parent households (1 aged over 18 and 1 or more aged under 18) 163 125 107
Middle income households ($50,000-$99,999) with 2 or more dependents 182 140 105
Respondents that speak a language other than English at home 399 331 260
Households with no internet access or limited use of the internet to compare/buy goods and services
280 249 192
Households where one or more people have a mental or physical disability 881 745 571
Housing status
Private rental 683 532 506
Public rental 252 199 198
Own outright 1,581 1,438 923
Paying off mortgage 1,263 1,111 793
All other responses 36 30 17
Payment / Hardship status
Missed payments - 279 240
Payment plans - 152 134
Hardship - 67 62
Location
South East Queensland 774 672 440
Rest of Queensland 344 307 201
New South Wales 1,018 865 716
Victoria 976 834 659
South Australia 434 384 230
Tasmania 132 120 93
Australian Capital Territory 137 128 98

ACCC0007_Retail Electricity_Final Report_140618 17
3.2 Interpreting This Report
Definitions
The following terms or abbreviations have been utilised throughout this report.
Figure 2: Definitions
Term of abbreviation Definition
ACCC The Australian Competition and Consumer Commission
65+ Respondents aged 65 years and over
<$25K Those respondents with a household income of between $0 and $24,999
REC Households who received an electricity concession (billing data)
SPH/Sole parent Sole parent households (1 aged over 18 and 1 or more aged under 18)
AOH/Adult only Adult only households (1 or more adults and 0 under 18)
OH/Others Other households (2 or more adults and 1 or more under 18)
MIHW2+D Middle income households ($50,000-$99,999) with 2 or more dependents
NESB Respondents that speak a language other than English at home
NOLI Households with no internet access or limited use of the internet to compare/buy goods and services
DISABILITY Households where one or more people have a mental or physical disability
EEC Households who are eligible for an electricity concession (survey data)
SEQ South East Queensland
Rest of QLD The rest of Queensland
NSW New South Wales
VIC Victoria
SA South Australia
TAS Tasmania
ACT Australian Capital Territory
Missed payments Those that reported having missed an electricity payment because they could not afford to pay the bill
Payment plan Those that according to retailer data had been on a payment plan for one or more billing periods
Hardship Those that according to retailer data had been on a hardship policy for one or more billing periods

ACCC0007_Retail Electricity_Final Report_140618 18
Percentages and Averages
Respondents who completed a survey but did not answer a particular question are excluded from the tabulation of results and calculation of statistics for that question.
Percentages are generally rounded to whole numbers. Some percentages may not add to 100 percent due to rounding.
To make charts easier to read and less cluttered, percentages less than 3% are not displayed.
Sorting of Results
Where appropriate, results in charts and tables have been sorted from the most frequent response to least frequent response.
Tests of Statistical Significance
Tests for statistical significance have been conducted on particular sub-groups of interest in this report. An exception reporting approach has been undertaken in that if no statistical significance is mentioned, there are none associated with these groups.
Tests have been undertaken at a 95% confidence level (please note significance testing could not be undertaken on sample sizes smaller than n=30). If there is a statistically significant difference between the result for a particular group and the result for the wider population, we can be confident that this difference has not occurred by chance, rather that it reflects a genuine difference among that group compared to the wider population.
In tables and graphs, the figures with an upwards arrow (i.e.) and/or coloured blue represent a proportion that is significantly higher than the total for that question (i.e. all survey respondents). Conversely, the figures with a downwards arrow (i.e.) and/or coloured red represent a proportion that is significantly lower than the total for that question (i.e. all survey respondents or all billing analysis respondents).
Reliability
The margin of error associated with this survey is +/- 1.5%, given a 95% confidence level. For example, if 50% of customers surveyed indicated they had experienced a degree of difficulty interpreting electricity billing information over the past 12 months, we could be 95% sure that the true incidence among the broader consumer market would be between 48.5% and 51.5%.
Where sample sizes are low (less than n=30), these are marked by an asterix (*) in this report. These results should be interpreted with caution.

ACCC0007_Retail Electricity_Final Report_140618 19
Verbatim Responses Verbatim responses provided to the partially open ended questions at the code ‘Other (Please specify)’ have also been reviewed and if required back coded to existing codes or coded into new themes. The coding model was tailored to the individual questions and designed based on the obtained data to ensure accuracy and validity. Codes have been created when the number of respondents who provided that response is equal to or greater than 3% of the responses at each individual question.
Weighting
The results of this survey have been weighted according to Australian Bureau of Statistic (ABS) 2016 Census Population and Housing data. Separate weights have been created for billing respondents and survey respondents. For further details about weighting please see Appendix A: Technical Notes.

ACCC0007_Retail Electricity_Final Report_140618 20
4. Price and Other Billing Data Findings
Colmar Brunton, on behalf of the Australian Competition and Consumer Commission (ACCC) conducted a survey with n=3,815 members of the Australian population in relation to their electricity usage. These survey respondents were asked to provide details of their most recent electricity bill, including name on the account, address, account number and national metering identifier (NMI). All survey respondents provided these details and also provided consent for their personal details to be used by the ACCC to gather information on their electricity usage and billing, from both current and previous electricity retailers. The paragraph below was the consent passage that was either displayed to respondents (online) or read verbatim (telephone) during the survey:
Once the survey was complete, Colmar Brunton provided the ACCC with the survey data for all n=3,815 survey respondents, which the ACCC used to obtain data from electricity retailers. In total, electricity retailers were able to provide data for n=3,625 respondents. This data was then checked by Colmar Brunton to ensure that respondents billing data was within the most recent 9 to 13 month period (as agreed to by the ACCC). During this process Colmar Brunton and the ACCC consulted on any data that was out of scope or required clarification and as a result of these checking process the number of in scope billing respondents reduced to n=3,310. Due to the inherent differences between solar and non-solar customer usage and prices, the ACCC also instructed Colmar Brunton to exclude solar customers from all billing calculations and so the final number of in scope billing respondents reduced to n=2,437 (it should be noted that the ACCC has conducted separate analysis on solar customers). All analysis in this section of the report is based on the n=2,437 in scope billing respondents. Where subsets of this population have been examined the labels and bases at the specific chart or table will provide details on this.
This survey is being conducted by Colmar Brunton on behalf of the Australian Competition and Consumer
Commission’s (ACCC) Retail Electricity Pricing Inquiry. This is a voluntary survey. Information you
provide in this survey will be used to obtain information from your current and previous electricity retailers
relating to your usage, tariffs, charges, concessions, discounts and whether or not you have participated
in a hardship program (your electricity information). Your electricity information will be combined with
your survey responses and analysed to understand what consumers in the National Electricity Market are
paying for electricity. Findings from the survey will be published in aggregate and personal details of
participants will not be disclosed as part of the ACCC’s Retail Electricity Pricing Inquiry. By participating in
this survey you are consenting to:
- The ACCC disclosing your personal information to your current or previous electricity retailer for the purpose of obtaining your electricity information
- Your current or previous electricity retailer disclosing your electricity information to the ACCC - Colmar Brunton using your survey response and your electricity information to prepare datasets
and reports, and provide the findings to the ACCC.
Information obtained throughout the research may be made available to the Australian Energy Regulator
(AER) for the purpose of the performance or exercise of its functions or powers.
For general information on how the ACCC and AER handle information please refer the Privacy Policy
and Information Policy on the ACCC website [link was inserted here].

ACCC0007_Retail Electricity_Final Report_140618 21
4.1 Price Findings
Analysis in this section of the report is based on the n=2,437 in scope billing respondents who are not solar customers.
4.1.1 Effective Unit Charge (Basic)
For the n=2,437 respondents with billing data that was in scope an Effective Unit Charge was computed, as per the following calculation:
Total Charges ($) / Total Usage (kWh) = Effective Unit Charge (Basic) (c/kWh)
In this instance Total Charges was calculated as:
(Usage Charges + Supply Charges + Demand Charges) – Discounts
The average Effective Unit Charge (Basic) for all billing respondents was $0.31, with some variation reported amongst the target audiences.
Those with an annual household income of less than $25,000, those with no or limited internet and those households that speak a language other than English at home all experienced significantly higher Effective Unit Charges (Basic) ($0.35, $0.34 and $0.33 respectively compared to $0.31 for all billing respondents).
Conversely, middle income households ($50,000-$99,999) with 2 or more dependents experienced a significantly lower Effective Unit Charge (Basic) ($0.29 compared to $0.31 for all billing respondents).
Figure 3: Effective Unit Charge (Basic) – Target audiences
Base: All in scope respondents with billing data (n=2,437)
$0.31 $0.32 $0.35
$0.32 $0.33 $0.29
$0.33 $0.34 $0.31
$-
$0.10
$0.20
$0.30
$0.40
All billingrespondents
(n=2,437)
65+(n=841)
<$25K(n=364)
REC(n=1,110)
SPH(n=107)
MIHW2+D(n=105)
NESB(n=260)
NOLI(n=192)
DISABILITY(n=571)

ACCC0007_Retail Electricity_Final Report_140618 22
When looking at the results by the target audience categories there were some significant differences.
Those with an annual household income of less than $25,000 and those with an annual household income of between $25,000 and $49,999 experienced significantly higher Effective Unit Charges (Basic) ($0.35 and $0.33 respectively compared to $0.31 for all billing respondents). Conversely, those with an annual household income of between $100,000 and $149,999 and those with an annual household income of $150,000 or more experienced significantly lower Effective Unit Charges (Basic) ($0.30 and $0.29 respectively compared to $0.31 for all billing respondents).
Those in an adult only house experienced a significantly higher Effective Unit Charge (Basic) ($0.33 compared to $0.31 for all billing respondents), while other households experienced a significantly lower Effective Unit Charge (Basic) ($0.29 compared to $0.31 for all billing respondents).
Middle income households ($50,000-$99,999) with 2 or more dependents experienced a significantly lower Effective Unit Charge (Basic) ($0.29 compared to $0.31 for all billing respondents), while all others experienced a significantly higher Effective Unit Charge (Basic) ($0.32 compared to $0.31 for all billing respondents).
Those households that speak a language other than English at home experienced a significantly higher Effective Unit Charge (Basic) ($0.33 compared to $0.31 for all billing respondents).
Those with no or limited internet experienced a significantly higher Effective Unit Charge (Basic) ($0.34 compared to $0.31 for all billing respondents).
There were no statistically significant differences observed by age, concession or disability.
Figure 4: Effective Unit Charge (Basic) – Age categories
Base: All in scope respondents with billing data (n=2,437)
$0.31 $0.32 $0.31 $0.31 $0.32 $0.32
$-
$0.10
$0.20
$0.30
$0.40
All billingrespondents
(n=2,437)
18-34 years(n=363)
35-49 years(n=562)
60-64 years(n=671)
65-74 years(n=628)
75 years plus(n=213)

ACCC0007_Retail Electricity_Final Report_140618 23
Figure 5: Effective Unit Charge (Basic) – Income categories
Base: All in scope respondents with billing data (n=2,437)
Figure 6: Effective Unit Charge (Basic) – Target audience categories
$ Weighted %
Base n=
$ Weighted %
Base n=
Concession Language REC $0.32 37% 1110 NESB $0.33 13% 260 Did not REC $0.31 63% 1327 English only $0.31 87% 2177 Household 1 Internet usage Sole parent $0.33 6% 107 NOLI $0.34 6% 192 Adult only $0.33 63% 1807 Use internet $0.31 94% 2245 Others $0.29 31% 523 Household/Income Disability $0.31 22% 571 MIHW2+D $0.29 7% 105 No disability $0.32 78% 1866 All others $0.32 93% 2332
$0.31 $0.35 $0.33 $0.31 $0.31 $0.30 $0.29
$0.31
$-
$0.10
$0.20
$0.30
$0.40
All billingrespondents
(n=2,437)
Less than$25,000(n=364)
$25,000 -$49,999(n=581)
$50,000 -$74,999(n=367)
$75,000 -$99,999(n=313)
$100,000 -$149,999(n=330)
$150,000 ormore
(n=304)
DK/Noanswer(n=178)

ACCC0007_Retail Electricity_Final Report_140618 24
The Effective Unit Charge (Basic) across the housing status categories was between $0.30 and $0.32, with the average for all billing respondents sitting directly in the middle at $0.31.
Those respondents in private rentals experienced a significantly higher Effective Unit Charge (Basic) ($0.32 compared to $0.31 for all billing respondents).
Those paying off a mortgage experienced a significantly lower Effective Unit Charge (Basic) ($0.30 compared to $0.31 for all billing respondents).
Figure 7: Effective Unit Charge (Basic) – Housing status
Base: All in scope respondents with billing data (n=2,437) Note: *Small sample size, results should be interpreted with caution. In addition, tests for statistical significance were conducted for each housing status sub-group, with only statistical significant variances observed in the specific data sets for those in private rentals and those paying off their mortgage.
The Effective Unit Charge (Basic) across the payment and hardship categories saw just one significant difference.
Those that according to retailer data had been on a payment plan for one or more billing periods experienced a significantly lower Effective Unit Charge (Basic) ($0.29 compared to $0.31 for all billing respondents).
Figure 8: Effective Unit Charge (Basic) – Payment/Hardship status
Base: All in scope respondents with billing data (n=2,437)
$0.31 $0.32 $0.33 $0.32 $0.30 $0.31
$-
$0.10
$0.20
$0.30
$0.40
All billingrespondents
(n=2,437)
Private Rental(n=506)
Public Rental(n=198)
Own outright(n=923)
Paying offmortgage(n=793)
All otherresponses
(n=17*)
$0.31 $0.31 $0.29 $0.31
$-
$0.10
$0.20
$0.30
$0.40
All billing respondents(n=2,437)
Missed payments(n=240)
Payment plan(n=134)
Hardship(n=62)

ACCC0007_Retail Electricity_Final Report_140618 25
4.1.2 Concession Prices
Of the n=2,437 billing respondents 37% (at the whole NEM level) received an electricity concession, according to the data provided by electricity retailers. These results differed by target audiences, housing status, payment/hardship status and location, as shown in section 4.2.1. of this report.
Figure 9: Billing respondents who received an electricity concession
Base: All in scope respondents with billing data (n=2,437)
To look at how concessions affected what consumers were paying two calculations were conducted. The first was a basic Effective Unit Charge that was computed as:
Total Charges ($) / Total Usage (kWh) = Effective Unit Charge (c/kWh)
In this instance Total Charges was calculated as:
(Usage Charges + Supply Charges + Demand Charges) – Discounts
The second calculation that was conducted was an Effective Unit Charge that took into account concessions. In this instance Total Charges was calculated as:
(Usage Charges + Supply Charges + Demand Charges) – (Discounts and Concessions)
Those who received an electricity concession were on average (for the whole NEM) experiencing a similar Effective Unit Charge ($0.32) compared to all billing respondents ($0.31) when their concessions had not been taken out, however they experienced a lower Effective Unit Charge when concessions were included ($0.26 compared to all billing respondents $0.31).
Did not receive an electricity
concession, 63%
Received an electricity
concession, 37%

ACCC0007_Retail Electricity_Final Report_140618 26
When looking at the results by locations across the NEM there were some significant differences observed.
Rest of Queensland – Those living in the rest of Queensland experienced a significantly lower Effective Unit Charge with concessions included ($0.25 compared to $0.26 for all concession billing respondents).
New South Wales – Those living in New South Wales experienced a significantly lower Effective Unit Charge with concessions included ($0.24 compared to $0.26 for all concession billing respondents).
Victoria – Those living in Victoria experienced a significantly higher Effective Unit Charge with concessions included ($0.27 compared to $0.26 concession billing respondents).
South Australia – Those living in South Australia that did not receive an electricity concession experienced a significantly higher Effective Unit Charge (Basic) ($0.38 compared to $0.31 for all non-concession billing respondents), those that received an electricity concession experienced a significantly higher Effective Unit Charge (Basic) ($0.37 compared to $0.32 for all concession billing respondents) and a significantly higher Effective Unit Charge (including concessions) ($0.32 compared to $0.26 for all concession billing respondents) compared to the averages for all NEM locations.
Tasmania – Those living in Tasmania that did not receive an electricity concession experienced a significantly lower Effective Unit Charge (Basic) ($0.25 compared to $0.31 for all non-concession billing respondents), those that received an electricity concession experienced a significantly lower Effective Unit Charge (Basic) ($0.24 compared to $0.32 for all concession billing respondents) and a significantly lower Effective Unit Charge (including concessions) ($0.18 compared to $0.26 for all concession billing respondents) compared to the averages for all NEM locations.
Australian Capital Territory – Those living in the Australian Capital Territory that did not receive an electricity concession experienced a significantly lower Effective Unit Charge (Basic) ($0.25 compared to $0.31 for all non-concession billing respondents), those that received an electricity concession experienced a significantly lower Effective Unit Charge (Basic) ($0.22 compared to $0.32 for all concession billing respondents) and a significantly lower Effective Unit Charge (including concessions) ($0.14 compared to $0.26 for all concession billing respondents) compared to the averages for all NEM locations.

ACCC0007_Retail Electricity_Final Report_140618 27
Figure 10: Concession prices
Base: All in scope respondents with billing data (n=2,437); Non-concession billing respondents all locations combined
(n=1,327), SEQ (n=170), Rest of QLD (n=76), NSW (n=422), VIC (n=389), SA (n=134), TAS (n=53), ACT (n=83); Concession
billing respondents all locations combined (n=1,110), SEQ (n=270), Rest of QLD (n=125), NSW (n=294), VIC (n=270), SA
(n=96), TAS (n=40), ACT (n=15*).
$0.
31
$0.
32
$0.
30
$0.
31
$0.
31
$0.
38
$0.
25
$0.
25
$0.
32
$0.
32
$0.
31
$0.
31
$0.
33
$0.
37
$0.
24
$0.
22
$0.
26
$0.
25
$0.
25
$0.
24
$0.
27 $0.
32
$0.
18
$0.
14
$-
$0.10
$0.20
$0.30
$0.40
All locationscombined
SEQ Rest of QLD NSW VIC SA TAS ACT
Effective unit charge basic - Non-concession billing respondents all locations combined (n=1,327)
Effective unit charge basic - Concession billing respondents all locations combined (n=1,110)
Effective unit charge concessions - Concession billing respondents all locations combined (n=1,110)

ACCC0007_Retail Electricity_Final Report_140618 28
4.1.3 Switching Price Outcomes
Based on their billing data, all billing respondents were placed into one of six categories related to whether they had moved address and/or switched retail electricity providers at some point during the nine to 13 month period.
The pie chart below demonstrates that the majority (89%) of billing respondents had not switched electricity retailer and had not moved during the nine to 13 month period. The next two largest categories were those that had not switched, but had moved (5%) and those that had not moved, but had switched electricity retailer at the same address once (5%). Those that had switched whilst moving made up just 1% of all billing respondents, while those that had switched but not when moving and those that had not moved but had switched at the same address two or more times both made up less than 1%.
Figure 11: Switching Price Outcomes – Categories
Base: All in scope respondents with billing data (n=2,437)
Not switched and not moved,
89%
Not switched but have moved, 5%
Switched when moving, 1%
Switched but NOT when
moving, 0%
Have not moved, but switched at
the same address once,
5%
Have not moved, but switched at
the same address 2 or
more times, 0%

ACCC0007_Retail Electricity_Final Report_140618 29
When looking at the Effective Unit Charge (including Concessions) across the six categories there were no statistically significant differences. Three of the six categories had very small sample sizes and as such the results observed for these categories should be interpreted with caution.
It should be noted that the below Effective Unit Charges (including Concessions) were based on the average for all billing periods, not just the Effective Unit Charge (including Concessions) after the switch had occurred.
Figure 12: Switching Price Outcomes – Effective Unit Charge (including Concessions)
Base: All in scope respondents with billing data (n=2,437) Note: *Small sample size, results should be interpreted with caution.
$0.29 $0.29 $0.31 $0.27
$0.32 $0.29
$0.20
$-
$0.10
$0.20
$0.30
$0.40
All billingrespondents
(n=2,437)
Not switchedand not moved
(n=2,220)
Not switchedbut have moved
(n=76)
Switched whenmoving(n=13*)
Switched butNOT when
moving(n=2*)
Have notmoved, but
switched at thesame address
once(n=120)
Have notmoved, but
switched at thesame address 2or more times
(n=6*)

ACCC0007_Retail Electricity_Final Report_140618 30
4.1.4 Standing Offer Price Outcomes
Based on their billing data, all billing respondents were placed into one of four categories related to whether they had been on a standing offer at some point during the nine to 13 month in scope billing period.
The pie chart below demonstrates that the majority (84%) of billing respondents had not been on a standing offer for any of the billing periods used in this study, while the remaining 16% had been on a standing offer for at least one billing period used in this study. This included 14% who had been on a standing offer for all of the billing period, 1% who had been on a standing offer for one of the billing periods and another 1% had been on a standing offer for more than one, but not all of the billing periods.
Figure 13: Standing Offer Price Outcomes – Categories
Base: All in scope respondents with billing data (n=2,437)
Were not a standing offer
during the billing period, 84%
On a standing offer for ALL
billing periods, 14%
On a standing offer for ONE billing period,
1%
On a standing offer for more than ONE but
NOT ALL billing periods, 1%

ACCC0007_Retail Electricity_Final Report_140618 31
When looking at the Effective Unit Charge (including Concessions) across the four standing offer categories there were no statistically significant differences. Please note the very small size for the category on a standing offer for one billing period and as such the results observed for this category should be interpreted with caution.
Figure 14: Effective Unit Charge (including Concessions) – Standing Offer customers
Base: All in scope respondents with billing data (n=2,437)
$0.29 $0.29 $0.28 $0.24
$0.29
$-
$0.10
$0.20
$0.30
$0.40
All billing respondents(n=2,437)
Were not on a standingoffer during the billing
period(n=1,947)
On a standing offer forALL billing periods
(n=437)
On a standing offer forONE billing period
(n=18*)
On a standing offer formore than ONE but
NOT ALL billingperiods(n=35)

ACCC0007_Retail Electricity_Final Report_140618 32
4.1.5 Hardship and Payment Plan Price Outcomes
The vast majority (97%) of billing respondents had not been on a hardship plan for any of the billing periods used in this study, while 3% had been on a hardship plan for one or more billing periods.
When looking at the Effective Unit Charge (including Concessions) by those had been on a hardship policy (according to retailer data) for one or more billing periods there were no statistically significant differences.
Figure 15: Effective Unit Charge (including Concessions) – Hardship customers
Base: All in scope respondents with billing data (n=2,437)
The majority (94%) of billing respondents had also not been on payment plan for any of the billing periods used in this study, while only 6% had been on a payment plan for one or more billing periods.
Those that had been on a payment plan (according to retailer data) for one or more billing periods ($0.27) experienced a significantly lower Effective Unit Charge (including Concessions) compared to all billing respondents ($0.29).
Figure 16: Effective Unit Charge (including Concessions) – Payment plan customers
Base: All in scope respondents with billing data (n=2,437)
$0.29 $0.28 $0.29
$-
$0.10
$0.20
$0.30
$0.40
All billing respondents(n=2,437)
Hardship(n=62)
NON Hardship(n=2,375)
$0.29 $0.27 $0.29
$-
$0.10
$0.20
$0.30
$0.40
All billing respondents(n=2,437)
Payment plan(n=134)
NON Payment plan(n=2,303)

ACCC0007_Retail Electricity_Final Report_140618 33
4.2 Other Billing Findings
Analysis in this section of the report is based on the n=2,437 in scope billing respondents who are not solar customers.
4.2.1 Concession Demographics
As mentioned previously, 37% of n=2,437 billing respondents (at the whole NEM level) received an electricity concession, according to the data provided by electricity retailers.
When looking at the results by target audiences there were some significant differences observed. Those with an annual household income of less than $25,000, those with a disability in the
household, those aged 65 years and over, those sole parent households, those with no or limited access to the internet and were significantly more likely to have received an electricity concession (81%, 72%, 71%, 70% and 69% respectively compared to 37% for all billing respondents).
Those households that speak a language other than English at home were significantly less likely to have received an electricity concession (25% compared to 37% for all billing respondents).
Figure 17: Concessions – Target audiences
Base: All in scope respondents with billing data (n=2,437)
When looking at the results by the age categories there were some significant differences.
Those aged 75 years plus and those aged 65-74 years and were significantly more likely to have received an electricity concession (84% and 66% compared to 37% for all billing respondents).
Those aged 35-49 years and those aged 18-34 years were significantly less likely to have received an electricity concession (27% and 21% compared to 37% for all billing respondents).
63%
29% ↓ 19% ↓
30% ↓
73% 75% ↑
31% ↓ 28% ↓
37%
71% ↑ 81% ↑ 100% ↑
70% ↑
27% 25% ↓
69% ↑ 72% ↑
0%
20%
40%
60%
80%
100%
All billingrespondents
(n=2,437)
65+(n=841)
<$25K(n=364)
REC(n=1,110)
SPH(n=107)
MIHW2+D(n=105)
NESB(n=260)
NOLI(n=192)
DISABILITY(n=571)
Non-concession billing respondents Concession billing respondents

ACCC0007_Retail Electricity_Final Report_140618 34
Figure 18: Concessions – Age categories
Base: All in scope respondents with billing data (n=2,437)
Significant differences were also observed by income categories. Those with an annual household income of less than $25,000 and those with an annual
household income of between $25,000 and $49,999 were significantly more likely to have received an electricity concession (81% and 73% compared to 37% for all billing respondents).
Those with an annual household income of less between $75,000 and $99,999, those with an annual household income of between $100,000 and $149,999 and those with an annual household income of $150,000 or more were significantly less likely to have received an electricity concession (14%, 6% and 5% respectively compared to 37% for all billing respondents).
Figure 19: Concessions – Income categories
Base: All in scope respondents with billing data (n=2,437)
63% 79% ↑ 73% ↑
62%
34% ↓ 16% ↓
37% 21% ↓ 27% ↓
38%
66% ↑
84% ↑
0%
20%
40%
60%
80%
100%
All billingrespondents
(n=2,437)
18-34 years(n=363)
35-49 years(n=562)
50-64 years(n=671)
65-74 years(n=628)
75 years plus(n=213)
Non-concession billing respondents Concession billing respondents
63%
19% ↓ 27% ↓
64%
86% ↑ 94% ↑ 95% ↑
68%
37%
81% ↑ 73% ↑
36%
14% ↓ 6% ↓ 5% ↓
32%
0%
20%
40%
60%
80%
100%
All billingrespondents
(n=2,437)
Less than$25,000(n=364)
$25,000 -$49,999(n=581)
$50,000 -$74,999(n=367)
$75,000 -$99,999(n=313)
$100,000 -$149,999(n=330)
$150,000 ormore
(n=304)
DK/Noanswer(n=178)
Non-concession billing respondents Concession billing respondents

ACCC0007_Retail Electricity_Final Report_140618 35
Significant differences were also observed by housing status. Those renting publicly, those that owned their home outright and those renting privately were
significantly more likely to have received an electricity concession (62%, 50% and 43% respectively compared to 37% for all billing respondents).
Those paying off a mortgage were significantly less likely to have received an electricity concession (16% compared to 37% for all billing respondents).
Figure 20: Concessions – Housing status
Base: All in scope respondents with billing data (n=2,437)
Those billing respondents on a hardship plan for one or more billing periods and those that had reported having missed a payment on an electricity bill since December 2016 were significantly more likely to have received an electricity concession (75% and 45% compared to 37% for all billing respondents).
Figure 21: Concessions – Payment/Hardship status
Base: All in scope respondents with billing data (n=2,437)
63% 57% ↓ 38% ↓
50% ↓
84% ↑
35%
37% 43% ↑ 62% ↑
50% ↑
16% ↓
65%
0%
20%
40%
60%
80%
100%
All billingrespondents
(n=2,437)
Private Rental(n=506)
Public Rental(n=198)
Own outright(n=923)
Paying offmortgage(n=793)
All otherresponses
(n=17*)
Non-concession billing respondents Concession billing respondents
63% 55% ↓ 60%
25% ↓
37% 45% ↑
40%
75% ↑
0%
20%
40%
60%
80%
100%
All billing respondents(n=2,437)
Missed payments(n=240)
Payment plan(n=134)
Hardship(n=62)
Non-concession billing respondents Concession billing respondents

ACCC0007_Retail Electricity_Final Report_140618 36
When looking at the results by locations some significant differences were observed.
Those living in the rest of Queensland and South East Queensland were significantly more likely to have received an electricity concession (53% and 45% compared to 37% for all billing respondents).
Those living in the ACT were significantly less likely to have received an electricity concession (13% compared to 37% for all billing respondents).
Figure 22: Concessions – Locations
Base: All in scope respondents with billing data (n=2,437)
When asked in the survey what government concession cards they had, the majority of billing respondents who received an electricity concession indicated that they had a DHS pensioner concession card.
Figure 23: Types of government concession cards
Base: All in scope Concession billing respondents with billing data (n=1,100)
63% 55% ↓ 47% ↓
65% 67% 66% 58%
87% ↑
37% 45% ↑ 53% ↑
35% 33% 34% 42%
13% ↓
0%
20%
40%
60%
80%
100%
All billingrespondents
(n=2,437)
SEQ(n=440)
Rest of QLD(n=201)
NSW(n=716)
VIC(n=659)
SA(n=230)
TAS(n=93)
ACT(n=98)
Non-concession billing respondents Concession billing respondents
9%
1%
2%
7%
12%
17%
20%
37%
73%
0% 20% 40% 60% 80% 100%
None of the above
DVA Gold Card (ALL EXCEPT TAS)
DVA Pensioner Concession Card (NSW, TAS AND ACT)
DHS Seniors Health Care Card (SA ONLY)
DHS Low Income Health Care Card (SA AND ACT)
Tasmanian Concession Card (TAS ONLY)
DHS Health Care Card (ALL EXCEPT SA AND ACT)
Queensland Seniors Card (QLD ONLY)
DHS Pensioner Concession Card (ALL LOCATIONS)
ACCC0007_Retail Electricity_Final Report_140618 37
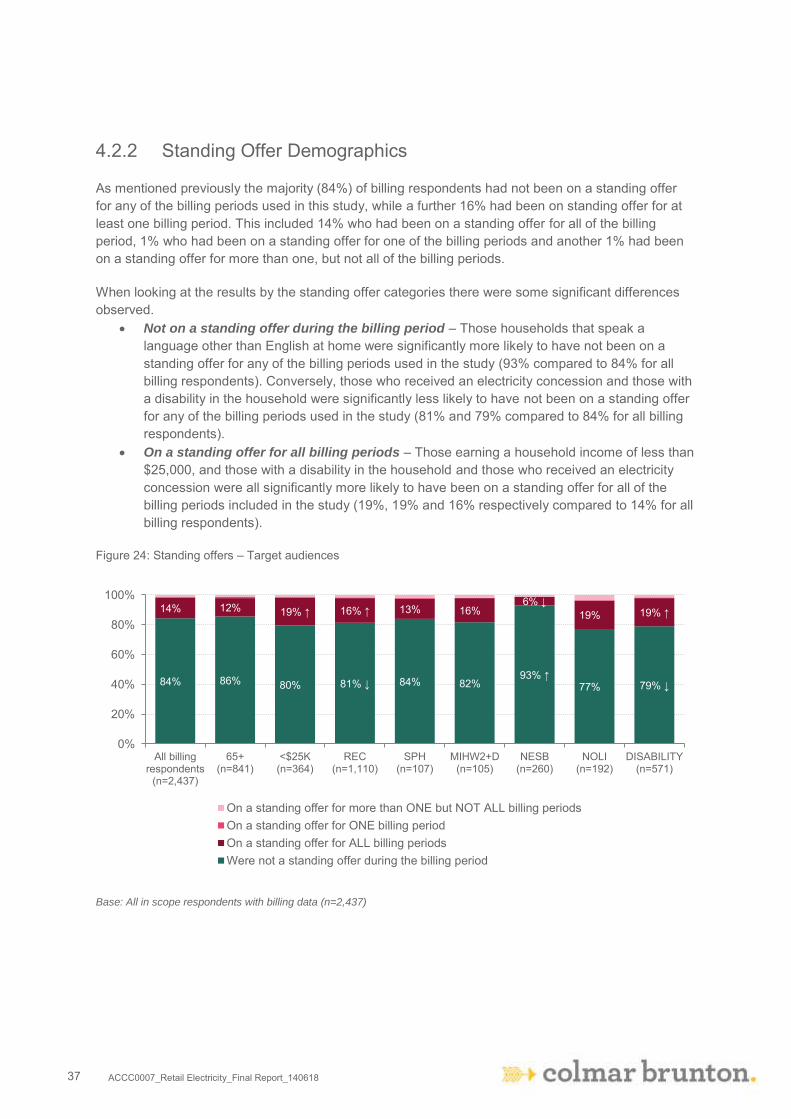
4.2.2 Standing Offer Demographics
As mentioned previously the majority (84%) of billing respondents had not been on a standing offer for any of the billing periods used in this study, while a further 16% had been on standing offer for at least one billing period. This included 14% who had been on a standing offer for all of the billing period, 1% who had been on a standing offer for one of the billing periods and another 1% had been on a standing offer for more than one, but not all of the billing periods.
When looking at the results by the standing offer categories there were some significant differences observed.
Not on a standing offer during the billing period – Those households that speak a language other than English at home were significantly more likely to have not been on a standing offer for any of the billing periods used in the study (93% compared to 84% for all billing respondents). Conversely, those who received an electricity concession and those with a disability in the household were significantly less likely to have not been on a standing offer for any of the billing periods used in the study (81% and 79% compared to 84% for all billing respondents).
On a standing offer for all billing periods – Those earning a household income of less than $25,000, and those with a disability in the household and those who received an electricity concession were all significantly more likely to have been on a standing offer for all of the billing periods included in the study (19%, 19% and 16% respectively compared to 14% for all billing respondents).
Figure 24: Standing offers – Target audiences
Base: All in scope respondents with billing data (n=2,437)
84% 86% 80% 81% ↓ 84% 82% 93% ↑
77% 79% ↓
14% 12% 19% ↑ 16% ↑ 13% 16% 6% ↓
19% 19% ↑
0%
20%
40%
60%
80%
100%
All billingrespondents
(n=2,437)
65+(n=841)
<$25K(n=364)
REC(n=1,110)
SPH(n=107)
MIHW2+D(n=105)
NESB(n=260)
NOLI(n=192)
DISABILITY(n=571)
On a standing offer for more than ONE but NOT ALL billing periodsOn a standing offer for ONE billing periodOn a standing offer for ALL billing periodsWere not a standing offer during the billing period

ACCC0007_Retail Electricity_Final Report_140618 38
When looking at the results by the target audience categories there were some significant differences.
Not on a standing offer during the billing period – Those households that speak a language other than English at home, those who did not receive an electricity concession and those without a disability in the household were significantly more likely to have not been on a standing offer for any of the billing periods used in the study (93%, 86% and 86% respectively compared to 84% for all billing respondents). Conversely, those households that only speak English, those who received an electricity concession and those with a disability in the household were significantly less likely to have not been on a standing offer for any of the billing periods used in the study (83%, 81% and 79% respectively compared to 84% for all billing respondents).
On a standing offer for all billing periods – Those earning a household income of less than $25,000, those with a disability in the household, those aged 50-64 years, those who received an electricity concession and those households that only speak English were all significantly more likely to have been on a standing offer for all of the billing periods included in the study (19%, 19%, 18%, 16% and 15% respectively compared to 14% for all billing respondents). Conversely, those households who did not receive an electricity concession and those without a disability in the household were significantly less likely to have been on a standing offer for all of the billing periods included in the study (12% and 12% respectively compared to 14% for all billing respondents).
There were no statistically significant differences observed by income, household, household/income or internet usage.
Figure 25: Standing offers – Age categories
Base: All in scope respondents with billing data (n=2,437)
84% 87% 84% 80% ↓ 85% 87%
14% 12% 14% 18% ↑ 13% 12%
0%
20%
40%
60%
80%
100%
All billingrespondents
(n=2,437)
18-34 years(n=363)
35-49 years(n=562)
50-64 years(n=671)
65-74 years(n=628)
75 years plus(n=213)
On a standing offer for more than ONE but NOT ALL billing periodsOn a standing offer for ONE billing periodOn a standing offer for ALL billing periodsWere not a standing offer during the billing period

ACCC0007_Retail Electricity_Final Report_140618 39
Figure 26: Standing offers – Income categories
Base: All in scope respondents with billing data (n=2,437)
Figure 27: Standing offers – Target audience categories
Were not on a standing offer
during the billing period %
On a standing offer for ALL
billing periods %
On a standing offer for ONE billing period
%
On a standing offer for more than ONE but
NOT ALL billing periods
%
Base n=
Concession REC 81% 16% 0% 2% 1110 Did not REC 86% 12% 1% 1% 1327 Household 1 Sole parent 84% 13% 1% 2% 107 Adult only 85% 13% 0% 1% 1807 Others 83% 15% 1% 1% 523 Household/Income MIHW2+D 82% 16% 0% 2% 105 All others 85% 14% 1% 1% 2332 Language NESB 93% 6% 0% 1% 260 English only 83% 15% 1% 1% 2177 Internet usage NOLI 77% 19% 0% 3% 192 Use internet 85% 13% 1% 1% 2245 Disability Disability 79% 19% 1% 2% 571 No disability 86% 12% 1% 1% 1866
84% 80% 84% 85% 86% 84% 83% 91%
14% 19% ↑ 14% 13% 12% 15% 16% 7%
0%
20%
40%
60%
80%
100%
All billingrespondents
(n=2,437)
Less than$25,000(n=364)
$25,000 -$49,999(n=581)
$50,000 -$74,999(n=367)
$75,000 -$99,999(n=313)
$100,000 -$149,999(n=330)
$150,000 ormore
(n=304)
DK/Noanswer(n=178)
On a standing offer for more than ONE but NOT ALL billing periodsOn a standing offer for ONE billing periodOn a standing offer for ALL billing periodsNever on a standing offer

ACCC0007_Retail Electricity_Final Report_140618 40
The results for whether or not billing respondents had been on a standing offer during the in scope billing period did not differ significantly by housing status.
Figure 28: Standing offers – Housing status
Base: All in scope respondents with billing data (n=2,437)
Those that reported having missed payments were significantly less likely to have never been on a standing offer (74% compared to 84% for all billing respondents) and were significantly more likely to have been on a standing offer for all of the billing periods (24% compared to 14% for all billing respondents).
Figure 29: Standing offers – Payment/Hardship status
Base: All in scope respondents with billing data (n=2,437)
84% 87% 83% 84% 83% 85%
14% 11% 16% 14% 15% 10% 5%
0%
20%
40%
60%
80%
100%
All billingrespondents
(n=2,437)
Private Rental(n=506)
Public Rental(n=198)
Own outright(n=923)
Paying offmortgage(n=793)
All otherresponses
(n=17*)
On a standing offer for more than ONE but NOT ALL billing periodsOn a standing offer for ONE billing periodOn a standing offer for ALL billing periodsWere not a standing offer during the billing period
84% 74% ↓ 76% 83%
14% 24% ↑ 21% 13% 3% 3%
0%
20%
40%
60%
80%
100%
All billing respondents(n=2,437)
Missed payments(n=240)
Payment plan(n=134)
Hardship(n=62)
On a standing offer for more than ONE but NOT ALL billing periodsOn a standing offer for ONE billing periodOn a standing offer for ALL billing periodsWere not a standing offer during the billing period

ACCC0007_Retail Electricity_Final Report_140618 41
4.2.3 Hardship and Payment Plan Demographics
Only 3% of all billing respondents had been on a hardship plan for one or more billing periods (according the data provided by electricity retailers). This percentage differed by the target audiences, both those who received an electricity concession and those with a disability in the household were significantly more likely to have been on a hardship plan for at least one billing period (6% and 9% respectively).
Figure 30: Hardship plan – Target audiences
Base: All in scope respondents with billing data (n=2,437)
97% 100% ↑ 93% ↓ 94% ↓ 92% ↓ 97% 99% ↑ 94% ↓ 91% ↓
3% 7% 6% ↑ 8% 3% 1% 6% 9% ↑
0%
20%
40%
60%
80%
100%
All billingrespondents
(n=2,437)
65+(n=841)
<$25K(n=364)
REC(n=1,110)
SPH(n=107)
MIHW2+D(n=105)
NESB(n=260)
NOLI(n=192)
DISABILITY(n=571)
NON Hardship Hardship

ACCC0007_Retail Electricity_Final Report_140618 42
When looking at the results by the target audience categories there were some significant differences observed for those on a hardship plan for one or more billing periods.
Those who received an electricity concession were significantly more likely to have been on a hardship plan for one or more of the billing periods (6% compared to 3% for all billing respondents).
Adult only households were significantly less likely to have been on a hardship plan (2% compared to 3% for all billing respondents).
Those with a disability in the household were significantly more likely to have been on a hardship plan (9% compared to 3% for all billing respondents).
There were no statistically significant differences observed for those on a hardship plan for one or more billing periods by age, income, household/income or language.
Figure 31: Hardship plan – Age categories
Base: All in scope respondents with billing data (n=2,437)
97% 96% 96% 97% 100% ↑ 100% ↑
3% 4% 4% 3%
0%
20%
40%
60%
80%
100%
All billingrespondents
(n=2,437)
18-34 years(n=363)
35-49 years(n=562)
60-64 years(n=671)
65-74 years(n=628)
75 years plus(n=213)
NON Hardship Hardship

ACCC0007_Retail Electricity_Final Report_140618 43
Figure 32: Hardship plan – Income categories
Figure 33: Hardship plan – Target audience categories
$ Weighted %
Base n=
$ Weighted %
Base n=
Concession Language REC 6% 94% 1110 NESB 1% 99% 260 Did not REC 1% 99% 1327 English only 3% 97% 2177 Household 1 Internet usage Sole parent 8% 92% 107 NOLI 6% 94% 192 Adult only 2% 98% 1807 Use internet 3% 97% 2245 Others 4% 96% 523 Household/Income Disability 9% 91% 571 MIHW2+D 3% 97% 105 No disability 1% 99% 1866 All others 3% 97% 2332
97% 93% ↓ 94% ↓ 98% 99% ↑ 99% 99% ↑ 99%
3% 7% 6%
0%
20%
40%
60%
80%
100%
All billingrespondents
(n=2,437)
Less than$25,000(n=364)
$25,000 -$49,999(n=581)
$50,000 -$74,999(n=367)
$75,000 -$99,999(n=313)
$100,000 -$149,999(n=330)
$150,000 ormore
(n=304)
DK/Noanswer(n=178)
NON Hardship Hardship

ACCC0007_Retail Electricity_Final Report_140618 44
When looking at the results by housing status there were no significant differences observed for those on a hardship plan.
Figure 34: Hardship plan – Housing status
Base: All in scope respondents with billing data (n=2,437)
Those billing respondents that had reported having missed a payment on an electricity bill since December 2016 and those on a payment plan for one or more billing periods were significantly more likely to have been on a hardship plan for at least one billing period (17% and 18% compared to 3% for all billing respondents).
Figure 35: Hardship plan – Payment/Hardship status
Base: All in scope respondents with billing data (n=2,437)
97% 95% ↓ 88% ↓ 100% ↑ 99% ↑ 91%
3% 5% 12% 0% 1% 9%
0%
20%
40%
60%
80%
100%
All billingrespondents
(n=2,437)
Private Rental(n=506)
Public Rental(n=198)
Own outright(n=923)
Paying offmortgage(n=793)
All otherresponses
(n=17*)NON Hardship Hardship
97% 83% ↓ 82% ↓
3% 17% ↑ 18% ↑
0%
20%
40%
60%
80%
100%
All billing respondents(n=2,437)
Missed payments(n=240)
Payment plan(n=134)
NON Hardship Hardship

ACCC0007_Retail Electricity_Final Report_140618 45
Only 7% of all billing respondents were on a payment plan for one or more billing periods (according the data provided by electricity retailers). This percentage differed by the target audiences, however only those with a disability in the household were significantly more likely to have been on a payment plan for at least one billing period (10% compared to 7% for all billing respondents).
Figure 36: Payment plan – Target audiences
Base: All in scope respondents with billing data (n=2,437)
93% 98% ↑ 90% 93% 85% ↓ 92% 97% ↑ 91% 90% ↓
7% 2% 10% 7% 15% 8% 3% 9% 10% ↑
0%
20%
40%
60%
80%
100%
All billingrespondents
(n=2,437)
65+(n=841)
<$25K(n=364)
REC(n=1,110)
SPH(n=107)
MIHW2+D(n=105)
NESB(n=260)
NOLI(n=192)
DISABILITY(n=571)
Non Payment plan Payment plan

ACCC0007_Retail Electricity_Final Report_140618 46
When looking at the results by the target audience categories there were some significant differences observed for those on a payment plan for one or more billing periods.
Those aged 18 to 34 years were significantly more likely to have been on a payment plan (10% compared to 7% for all billing respondents).
Adult only households were significantly less likely to have been on a payment plan for any of the billing periods (5% compared to 7% for all billing respondents).
Those with a disability in the household were significantly more likely to have been on a payment plan for at least one billing period during the 9 to 13 months (10% compared to 7% for all billing respondents), while those households without a disability were significantly less likely to have been on a payment plan for any of the billing periods (6% compared to 7% for all billing respondents).
There were no statistically significant differences observed for those on a payment plan for one or more billing periods by income, concession, household/income, language and internet usage.
Figure 37: Payment plan – Age categories
Base: All in scope respondents with billing data (n=2,437)
93% 90% ↓ 92% 94% 98% ↑ 99% ↑
7% 10% ↑ 8% 6% 2% 1%
0%
20%
40%
60%
80%
100%
All billingrespondents
(n=2,437)
18-34 years(n=363)
35-49 years(n=562)
60-64 years(n=671)
65-74 years(n=628)
75 years plus(n=213)
Non Payment plan Payment plan

ACCC0007_Retail Electricity_Final Report_140618 47
Figure 38: Payment plan – Income categories
Figure 39: Payment plan – Target audience categories
$ Weighted %
Base n=
$ Weighted %
Base n=
Concession Language REC 7% 93% 1110 NESB 3% 97% 260 Did not REC 6% 94% 1327 English only 7% 93% 2177 Household 1 Internet usage Sole parent 15% 85% 107 NOLI 9% 91% 192 Adult only 5% 95% 1807 Use internet 7% 93% 2245 Others 8% 92% 523 Household/Income Disability 10% 90% 571 MIHW2+D 8% 92% 105 No disability 6% 94% 1866 All others 7% 93% 2332
93% 90% 92% 94% 92% 92% 96% 98% ↑
7% 10% 8% 6% 8% 8% 4% 2%
0%
20%
40%
60%
80%
100%
All billingrespondents
(n=2,437)
Less than$25,000(n=364)
$25,000 -$49,999(n=581)
$50,000 -$74,999(n=367)
$75,000 -$99,999(n=313)
$100,000 -$149,999(n=330)
$150,000 ormore
(n=304)
DK/Noanswer(n=178)
Non Payment plan Payment plan

ACCC0007_Retail Electricity_Final Report_140618 48
This percentage differed by housing status, however only those renting privately were significantly more likely to have been on a payment plan for at least one billing period (11% compared to 7% for all billing respondents).
Figure 40: Payment plan – Housing status
Base: All in scope respondents with billing data (n=2,437)
Note: *Small sample size, results should be interpreted with caution.
Billing respondents that had reported having missed a payment on an electricity bill since December 2016 and those on a hardship plan for one or more billing periods were significantly more likely to have been on a payment plan for one or more bills during the 9 to 13 month billing period (33% and 43% compared to 3% for all billing respondents).
Figure 41: Payment plan – Payment/Hardship status
Base: All in scope respondents with billing data (n=2,437)
93% 89% ↓ 88% ↓ 98% ↑ 93% 91%
7% 11% ↑ 12% 2% 7% 9%
0%
20%
40%
60%
80%
100%
All billingrespondents
(n=2,437)
Private Rental(n=506)
Public Rental(n=198)
Own outright(n=923)
Paying offmortgage(n=793)
All otherresponses
(n=17*)Non Payment plan Payment plan
93%
67% ↓ 57% ↓
7%
33% ↑ 43% ↑
0%
20%
40%
60%
80%
100%
All billing respondents(n=2,437)
Missed payments(n=240)
Hardship(n=62)
Non Payment plan Payment plan

ACCC0007_Retail Electricity_Final Report_140618 49
5. Survey Findings
This section presents the findings of the survey questions of interest for all survey respondents (n=3,815).
5.1 Moved
Just 14% of all survey respondents had moved home (i.e. lived at another address apart from their current address) since December 2016.
Middle income households ($50,000-$99,999) with 2 or more dependents, sole parent households, and those households that speak a language other than English at home were significantly more likely to have moved (25%, 24% and 21% respectively compared to 14% for all survey respondents).
Conversely, respondents aged 65 years and over, those with an annual household income of less than $25,000 and those eligible for an electricity concession were all significantly less likely to have moved (4%, 10% and 12% respectively compared to 14% for all survey respondents).
Figure 42: Percentage of survey respondents that had moved since December 2016 – Target audiences
S5. Have you moved since December 2016 (i.e. lived at another address apart from your current address)? Please note: For
the purpose of this survey please only refer to moves which would relate to your primary address.
Base: All survey respondents (n=3,815)
14%
4% ↓ 10% ↓
12% ↓
24% ↑ 25% ↑ 21% ↑
10% 16%
0%
10%
20%
30%
40%
50%
All surveyrespondents
(n=3,815)
65+(n=1,359)
<$25K(n=493)
EEC(n=1,809)
SPH(n=163)
MIHW2+D(n=182)
NESB(n=399)
NOLI(n=280)
DISABILITY(n=881)

ACCC0007_Retail Electricity_Final Report_140618 50
Unsurprisingly when looking at results for those that had moved since December 2016 by housing status, there were a number of significant differences observed.
Those respondents in private rentals and public rentals were significantly more likely to have moved (32% and 30% respectively compared to 14% for all survey respondents).
While those who owned their homes outright or who were paying off a mortgage were significantly less likely to have moved (4% and 9% respectively compared to 14% for all survey respondents).
Figure 43: Percentage of survey respondents that had moved since December 2016 – Housing status
S5. Have you moved since December 2016 (i.e. lived at another address apart from your current address)? Please note: For
the purpose of this survey please only refer to moves which would relate to your primary address.
Base: All survey respondents (n=3,815)
When looking at the different locations, there was little variation and no statistically significant differences with regards to respondents moving.
Figure 44: Percentage of survey respondents that had moved since December 2016 – Locations
S5. Have you moved since December 2016 (i.e. lived at another address apart from your current address)? Please note: For
the purpose of this survey please only refer to moves which would relate to your primary address. Base: All survey respondents
(n=3,815)
14%
32% ↑ 30% ↑
4% ↓ 9% ↓ 9%
0%
10%
20%
30%
40%
50%
All surveyrespondents
(n=3,815)
Private Rental(n=683)
Public Rental(n=252)
Own outright(n=1,581)
Paying offmortgage(n=1,263)
All otherresponses
(n=36)
14% 17% 18% 14% 13% 13% 12% 14%
0%
10%
20%
30%
40%
50%
All surveyrespondents
(n=3,815)
SEQ(n=774)
Rest of QLD(n=344)
NSW(n=1,018)
VIC(n=976)
SA(n=434)
TAS(n=132)
ACT(n=137)

ACCC0007_Retail Electricity_Final Report_140618 51
Of the respondents that had moved since December 2016 the majority (84%) had only moved once. A further 12% had moved twice in that time, while 3% had moved three times and just under 1% had moved four or more times.
There were no statistically significant differences observed with regards to the target audiences.
Figure 45: Number of moves made since December 2016 – Target audiences
Q3. Previously you indicated that you have moved, how many times have you moved since December 2016?
Base: All respondents that indicated they have moved (n=409)
Note: *Small sample size, results should be interpreted with caution.
Across the five housing status categories the majority of those had moved had only done so once, with no statistically significant differences being observed with regards to housing status.
Figure 46: Number of moves made since December 2016 – Housing status
Q3. Previously you indicated that you have moved, how many times have you moved since December 2016? Base: All respondents that indicated they have moved (n=409) Note: *Small sample size, results should be interpreted with caution.
84% 92% 92% 76% 74%
84% 85% 75% 80%
12% 8% 5%
17% 9%
14% 15% 15%
13% 3% 5%
10% 10% 6% 4% 8%
0%
20%
40%
60%
80%
100%
All that hadmoved(n=409)
65+(n=56)
<$25K(n=37)
EEC(n=159)
SPH(n=32)
MIHW2+D(n=41)
NESB(n=64)
NOLI(n=18*)
DISABILITY(n=105)
Once Twice Three times Four or more times
84% 84% 74%
89% 89%
64%
12% 13% 16%
11% 9% 3% 7% 36%
3%
0%
20%
40%
60%
80%
100%
All that had moved(n=409)
Private Rental(n=182)
Public Rental(n=61)
Own outright(n=61)
Paying offmortgage(n=101)
All otherresponses
(n=4*)
Once Twice Three times Four or more times

ACCC0007_Retail Electricity_Final Report_140618 52
For the respondents that had moved there were no statistically significant differences by location, with all locations seeing the majority having moved only once.
Figure 47: Number of moves made since December 2016 – Locations
Q3. Previously you indicated that you have moved, how many times have you moved since December 2016? Base: All respondents that indicated they have moved (n=409) Note: *Small sample size, results should be interpreted with caution.
84% 90% 83% 79% 89%
79% 82% 90%
12% 6% 17% 17% 8%
17% 9% 10% 3% 4% 9% 3%
0%
20%
40%
60%
80%
100%
All that hadmoved(n=409)
SEQ(n=92)
Rest of QLD(n=49)
NSW(n=102)
VIC(n=97)
SA(n=43)
TAS(n=14*)
ACT(n=12*)
Once Twice Three times Four or more times

ACCC0007_Retail Electricity_Final Report_140618 53
5.2 Switched
Just 14% of all survey respondents had switched electricity retailers since December 2016.
Those aged 65 years and over were significantly less likely to have switched (11%), as were those respondents earning less than $25,000 per year (10%).
Figure 48: Switched Retailers while at current address since December 2016 – Target audiences
Q8. While living at your current address have you switched electricity retailers since December 2016?
Base: All survey respondents (n=3,815)
When looking at switching behaviour by housing status, there were no statistically significant differences, with all five categories sitting between 12% and 15%.
Figure 49: Switched Retailers while at current address since December 2016 – Housing status
Q8. While living at your current address have you switched electricity retailers since December 2016? Base: All survey
respondents (n=3,815)
14% 11% ↓ 10% ↓
14% 19% 19% 18%
10% 16%
0%
10%
20%
30%
40%
50%
All surveyrespondents
(n=3,815)
65+(n=1,359)
<$25K(n=493)
EEC(n=1,809)
SPH(n=163)
MIHW2+D(n=182)
NESB(n=399)
NOLI(n=280)
DISABILITY(n=881)
14% 16% 13% 12% 15% 12%
0%
10%
20%
30%
40%
50%
All surveyrespondents
(n=3,815)
Private Rental(n=683)
Public Rental(n=252)
Own outright(n=1,581)
Paying offmortgage(n=1,263)
All otherresponses
(n=36)
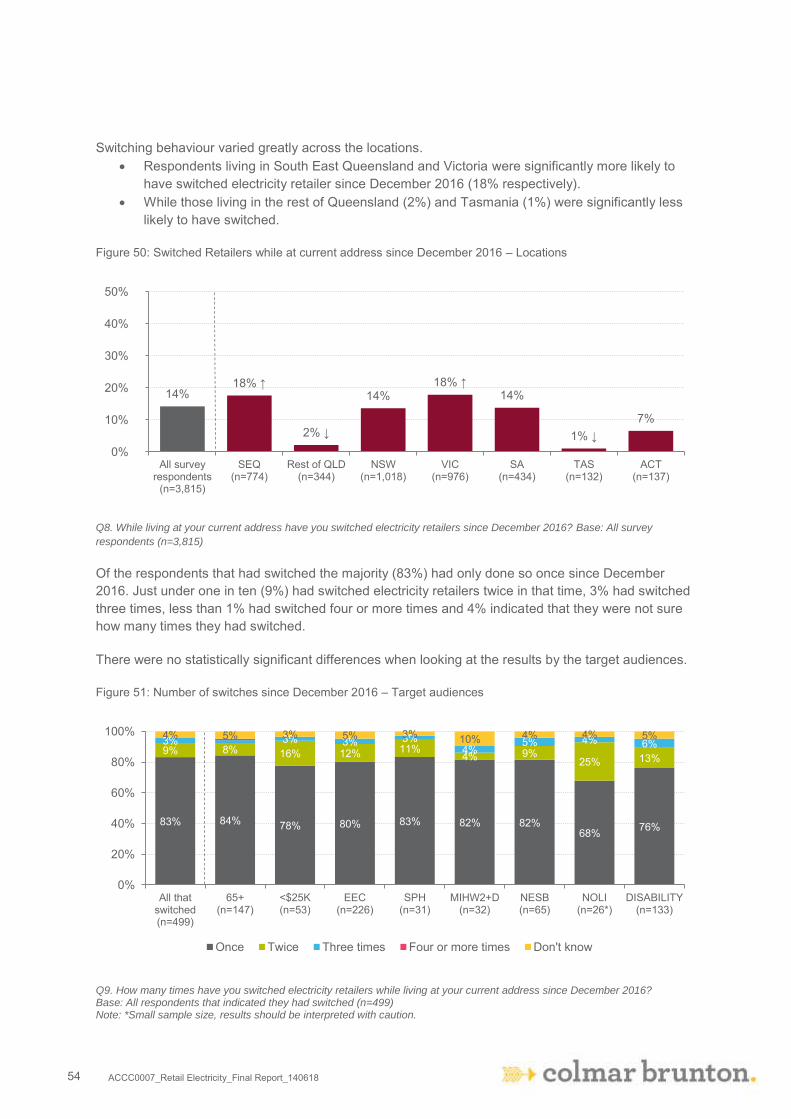
ACCC0007_Retail Electricity_Final Report_140618 54
Switching behaviour varied greatly across the locations. Respondents living in South East Queensland and Victoria were significantly more likely to
have switched electricity retailer since December 2016 (18% respectively). While those living in the rest of Queensland (2%) and Tasmania (1%) were significantly less
likely to have switched.
Figure 50: Switched Retailers while at current address since December 2016 – Locations
Q8. While living at your current address have you switched electricity retailers since December 2016? Base: All survey
respondents (n=3,815)
Of the respondents that had switched the majority (83%) had only done so once since December 2016. Just under one in ten (9%) had switched electricity retailers twice in that time, 3% had switched three times, less than 1% had switched four or more times and 4% indicated that they were not sure how many times they had switched.
There were no statistically significant differences when looking at the results by the target audiences.
Figure 51: Number of switches since December 2016 – Target audiences
Q9. How many times have you switched electricity retailers while living at your current address since December 2016? Base: All respondents that indicated they had switched (n=499) Note: *Small sample size, results should be interpreted with caution.
14% 18% ↑
2% ↓
14% 18% ↑
14%
1% ↓ 7%
0%
10%
20%
30%
40%
50%
All surveyrespondents
(n=3,815)
SEQ(n=774)
Rest of QLD(n=344)
NSW(n=1,018)
VIC(n=976)
SA(n=434)
TAS(n=132)
ACT(n=137)
83% 84% 78% 80% 83% 82% 82% 68% 76%
9% 8% 16% 12% 11% 4% 9%
25% 13% 3% 3% 3% 3%
4% 5% 4% 6%
4% 5% 3% 5% 3% 10% 4% 4% 5%
0%
20%
40%
60%
80%
100%
All thatswitched(n=499)
65+(n=147)
<$25K(n=53)
EEC(n=226)
SPH(n=31)
MIHW2+D(n=32)
NESB(n=65)
NOLI(n=26*)
DISABILITY(n=133)
Once Twice Three times Four or more times Don't know
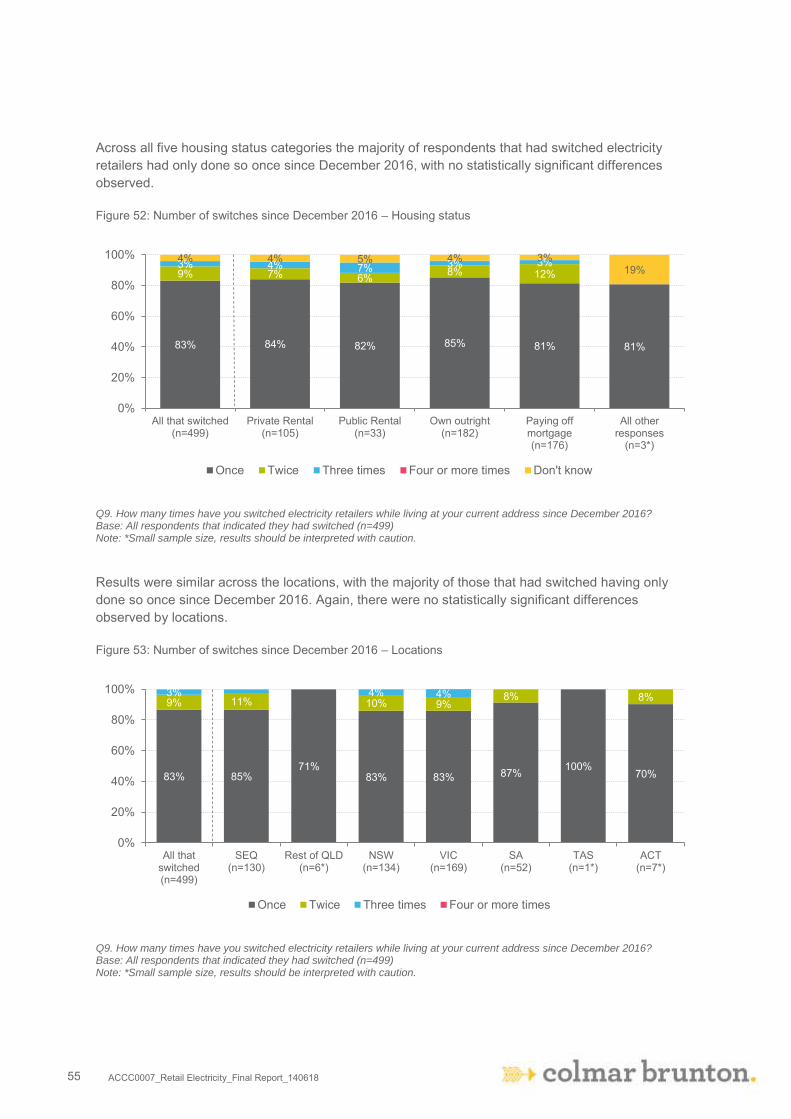
ACCC0007_Retail Electricity_Final Report_140618 55
Across all five housing status categories the majority of respondents that had switched electricity retailers had only done so once since December 2016, with no statistically significant differences observed.
Figure 52: Number of switches since December 2016 – Housing status
Q9. How many times have you switched electricity retailers while living at your current address since December 2016? Base: All respondents that indicated they had switched (n=499) Note: *Small sample size, results should be interpreted with caution.
Results were similar across the locations, with the majority of those that had switched having only done so once since December 2016. Again, there were no statistically significant differences observed by locations.
Figure 53: Number of switches since December 2016 – Locations
Q9. How many times have you switched electricity retailers while living at your current address since December 2016? Base: All respondents that indicated they had switched (n=499) Note: *Small sample size, results should be interpreted with caution.
83% 84% 82% 85% 81% 81%
9% 7% 6% 8% 12% 3% 4% 7% 3% 3% 4% 4% 5% 4% 3%
19%
0%
20%
40%
60%
80%
100%
All that switched(n=499)
Private Rental(n=105)
Public Rental(n=33)
Own outright(n=182)
Paying offmortgage(n=176)
All otherresponses
(n=3*)
Once Twice Three times Four or more times Don't know
83% 85% 71%
83% 83% 87% 100% 70%
9% 11% 10% 9% 8% 8% 3% 4% 4%
0%
20%
40%
60%
80%
100%
All thatswitched(n=499)
SEQ(n=130)
Rest of QLD(n=6*)
NSW(n=134)
VIC(n=169)
SA(n=52)
TAS(n=1*)
ACT(n=7*)
Once Twice Three times Four or more times

ACCC0007_Retail Electricity_Final Report_140618 56
5.3 Factors Affecting Usage
All survey respondents were asked to note the other types of energy that they used in their home. Approximately half (49%) recoded using natural gas, 20% solar PV, 10% liquefied petroleum gas, 8% solar hot water with booster and 2% solar hot water without booster.
Those aged 65 years and over were significantly more likely to have selected solar PV (30% compared to 20% for all survey respondents) and solar hot water (10% compared to 8% for all survey respondents). They were also significantly less likely to have selected ‘none of the
above’ (27% compared to 30% for all survey respondents). Those earning a household income of less than $25,000 were significantly less likely to have
selected using natural gas (41% compared to 49% for all survey respondents) and solar PV (13% compared to 20% for all survey respondents). They were also significantly more likely to have selected ‘none of the above’ (44% compared to 30% for all survey respondents).
Those eligible for an electricity concession were significantly less likely to have selected using natural gas (42% compared to 49% for all survey respondents), while being significantly more likely to not have any of the additional types of energy (34% compared to 30% for all survey respondents).
Those that speak a language other than English at home were significantly more likely to have selected using natural gas (60% compared to 49% for all survey respondents). They were also significantly less likely to have selected using solar PV (15% compared to 20% for all survey respondents).
Those households with no internet access or limited use of the internet were significantly less likely to have selected using natural gas (40% compared to 49% for all survey respondents). They were also significantly more likely to have selected ‘none of the above’ (42% compared to 30% for all survey respondents).
Those households were one or more persons had a disability were significantly less likely to have selected using natural gas (43% compared to 49% for all survey respondents). They were also significantly more likely to have selected ‘none of the above’ (35% compared to 30% for all survey respondents).
No significant differences were observed for sole parent households.

ACCC0007_Retail Electricity_Final Report_140618 57
Figure 54: Other types of energy used – Target audiences
All s
urve
y re
spon
dent
s (n
=3,8
15)
65+
(n=1
,359
)
<$25
K (n
=493
)
EEC
(n
=1,8
09)
SPH
(n
=163
)
MIH
W2+
D
(n=1
82)
NES
B (n
=399
)
NO
LI
(n=2
80)
DIS
ABIL
ITY
(n=8
81)
Natural Gas (mains gas) 49% 47% 41% ↓ 42% ↓ 44% 43% 60% ↑ 40% ↓ 43% ↓
Solar PV (solar panels) - not solar hot water
20% 30% ↑ 13% ↓ 21% 10% 17% 15% ↓ 17% 18%
Liquefied Petroleum Gas (LPG) 10% 10% 7% ↓ 12% 14% 13% 8% 8% 12%
Solar hot water with booster 8% 10% ↑ 3% 8% 3% 6% 8% 6% 7%
Solar hot water without booster 2% 2% 2% 2% 1% 5% 1% 2% 3%
None of the above 30% 27% ↓ 44% ↑ 34% ↑ 38% 31% 25% 42% ↑ 35% ↑
Q14. What other types of energy do you use in your home?
Base: All survey respondents (n=3,815)
There were a variety of significant differences recorded across the different housing status categories for the other types of energy that they used in their home.
Those living in private rentals were significantly less likely to have selected using natural gas (43% compared to 49% for all survey respondents and significantly more likely to not have any of the listed types of energy (44% compared to 30% for all survey respondents).
Those living in public rentals were significantly less likely to have selected using natural gas (39% compared to 49% for all survey respondents and were also significantly more likely to not have any of the listed types of energy (52% compared to 30% for all survey respondents).
Those that own their home outright were significantly more likely to have selected solar PV (32% compared to 20% for all survey respondents) and solar hot water with booster (11% compared to 8% for all survey respondents). They were also significantly less likely to not have any of the additional types of energy (22% compared to 30% for all survey respondents).
Those paying off a mortgage were significantly more likely to have selected natural gas (54% compared to 49% for all survey respondents) and solar PV (23% compared to 20% for all survey respondents). They were also significantly less likely to not have any of the additional types of energy (24% compared to 30% for all survey respondents).

ACCC0007_Retail Electricity_Final Report_140618 58
Figure 55: Other types of energy used – Housing status
All s
urve
y re
spon
dent
s (n
=3,8
15)
Private Rental
(n=683)
Public Rental
(n=252)
Own outright (n=1,581)
Paying off mortgage (n=1,263)
All other responses
(n=36)
Natural Gas (mains gas) 49% 43% ↓ 39% ↓ 51% 54% ↑ 32%
Solar PV (solar panels) - not solar hot water
20% 3% 2% 32% ↑ 23% ↑ 26%
Liquefied Petroleum Gas (LPG) 10% 10% 5% 11% 11% 8%
Solar hot water with booster 8% 3% 3% 11% ↑ 9% 6%
Solar hot water without booster 2% 1% 4% 2% 3% 0%
None of the above 30% 44% ↑ 52% ↑ 22% ↓ 24% ↓ 42%
Q14. What other types of energy do you use in your home?
Base: All survey respondents (n=3,815)
There were also a number of significant differences recorded across the different locations with regards to the other types of energy that they used in their home.
Those living in South East Queensland were significantly less likely to have selected using natural gas (17% compared to 49% for all survey respondents). Conversely they were significantly more likely to have selected solar PV (28% compared to 20% for all survey respondents), liquefied petroleum gas (18% compared to 10% for all survey respondents), solar hot water with booster (11% compared to 8% for all survey respondents) and ‘none of
the above’ (43% compared to 30% for all survey respondents). Those living in the rest of Queensland were significantly less likely to have selected using
natural gas (9% compared to 49% for all survey respondents). They were also significantly more likely to have selected solar PV (29% compared to 20% for all survey respondents) and liquefied petroleum gas (24% compared to 10% for all survey respondents). With results similar to South East Queensland they were also significantly more likely to have selected ‘none of the above’ (45% compared to 30% for all survey respondents).
Those living in the New South Wales were significantly less likely to have selected using natural gas (43% compared to 49% for all survey respondents) and solar PV (15% compared to 20% for all survey respondents). They were also significantly more likely to have selected ‘none of the above’ (37% compared to 30% for all survey respondents).
Those living in Victoria were significantly more likely to have selected using natural gas (80% compared to 49% for all survey respondents) and were significantly less likely to have selected solar PV (16% compared to 20% for all survey respondents), liquefied petroleum gas (4% compared to 10% for all survey respondents) and ‘none of the above’ (14% compared to 30% for all survey respondents).
Those living in South Australia were significantly more likely to have selected using natural gas (67% compared to 49% for all survey respondents) and solar PV (33% compared to 20% for all survey respondents). They were also significantly less likely to have selected ‘none of
the above’ (18% compared to 30% for all survey respondents).

ACCC0007_Retail Electricity_Final Report_140618 59
Those in Tasmania were significantly more likely to have selected ‘none of the above’ (53% compared to 30% for all survey respondents).
Those in the ACT experienced were significantly more likely to have selected using natural gas (77% compared to 49% for all survey respondents) and significantly less likely to have selected ‘none of the above’ (18% compared to 30% for all survey respondents).
Figure 56: Other types of energy used – Locations
All s
urve
y re
spon
dent
s (n
=3,8
15)
SEQ (n=774)
Rest of QLD
(n=344)
NSW (n=1,018)
VIC (n=976)
SA (n=434)
TAS (n=132)
ACT (n=137)
Natural Gas (mains gas) 49% 17% ↓ 9% ↓ 43% ↓ 80% ↑ 67% ↑ 5% 77% ↑
Solar PV (solar panels) - not solar hot water
20% 28% ↑ 29% ↑ 15% ↓ 16% ↓ 33% ↑ 23% 17%
Liquefied Petroleum Gas (LPG)
10% 18% ↑ 24% ↑ 10% 4% ↓ 7% 20% 0%
Solar hot water with booster 8% 11% ↑ 10% 6% 8% 6% 5% 6%
Solar hot water without booster 2% 3% 2% 3% 2% 2% 3% 1%
None of the above 30% 43% ↑ 45% ↑ 37% ↑ 14% ↓ 18% ↓ 53% ↑ 18% ↓
Q14. What other types of energy do you use in your home?
Base: All survey respondents (n=3,815)

ACCC0007_Retail Electricity_Final Report_140618 60
Respondents that noted using gas were asked what they use it for, with the majority (84%) suggesting that they use it for ‘hot water’, this was followed closely by ‘cooking’ (83%) and just over half (56%) said they use it for ‘heating’. There were no statistically significant differences by target audiences.
Figure 57: Gas usage – Target audiences
Al
l tha
t use
ga
s (n
=1,7
96)
65+
(n=1
,359
)
<$25
K (n
=493
)
EEC
(n
=1,8
09)
SPH
(n
=163
)
MIH
W2+
D
(n=1
82)
NES
B (n
=399
)
NO
LI
(n=2
80)
DIS
ABIL
ITY
(n=8
81)
Hot water 84% 85% 88% 87% 89% 86% 86% 80% 87%
Heating 56% 61% 52% 57% 61% 57% 56% 50% 60%
Cooking 83% 81% 81% 80% 76% 89% 87% 86% 79%
Don’t know 1% 0% 0% 1% 4% 0% 0% 0% 1%
Q15. Do you use gas for…?
Base: All respondents that indicated they had gas (n=1,796)
With regards to the housing status categories there were a number of significant differences.
Those in private rentals were significantly less likely to have selected that they use gas for ‘heating’ (47% compared to 56% for all respondents that use gas).
Those that own their home outright were significantly more likely to have selected that they use gas for ‘heating’ (62% compared to 56% for all respondents that use gas).
Those paying off a mortgage were significantly more likely to have selected that they use gas for ‘cooking’ (87% compared to 56% for all respondents that use gas).
Figure 58: Gas usage – Housing status
All t
hat u
se
gas
(n=1
,796
)
Private Rental
(n=683)
Public Rental (n=252)
Own outright (n=1,581)
Paying off mortgage (n=1,263)
All other responses
(n=36)
Hot water 84% 83% 90% 85% 84% 43%
Heating 56% 47% ↓ 43% 62% ↑ 57% 48%
Cooking 83% 79% 90% 82% 87% ↑ 40%
Don’t know 1% 3% 0% 0% 0% 10%
Q15. Do you use gas for…?
Base: All respondents that indicated they had gas (n=1,796)

ACCC0007_Retail Electricity_Final Report_140618 61
Responses varied across the different locations with regards to what gas is used for.
Those living in South East Queensland were significantly less likely to use gas for ‘heating’ (19% compared to 56% for all respondents that use gas).
Those living in the rest of Queensland were also significantly less likely to use gas for ‘heating’ (28% compared to 56% for all respondents that use gas).
Those living in New South Wales were significantly less likely to use gas for ‘hot water’ (78% compared to 84% for all respondents that use gas) and ‘heating’ (19% compared to 56% for all respondents that use gas).
Those living in Victoria were significantly more likely to use gas for ‘hot water’ (87% compared to 84% for all respondents that use gas) and ‘heating’ (74% compared to 56% for all respondents that use gas).
Those living in South Australia were significantly more likely to use gas for ‘hot water’ (90% compared to 84% for all respondents that use gas) and were significantly less likely to use it for ‘heating’ (38% compared to 56% for all respondents that use gas).
Those living in the Australian Capital Territory were significantly less likely to use it for ‘cooking’ (68% compared to 83% for all respondents that use gas).
Figure 59: Gas usage – Locations
All t
hat u
se
gas
(n=1
,796
)
SEQ (n=774)
Rest of QLD
(n=344)
NSW (n=1,018)
VIC (n=976)
SA (n=434)
TAS (n=132)
ACT (n=137)
Hot water 84% 80% 90% 78% ↓ 87% ↑ 90% ↑ 100% 84%
Heating 56% 19% ↓ 28% ↓ 41% ↓ 74% ↑ 38% ↓ 58% 59%
Cooking 83% 81% 72% 83% 85% 85% 73% 68% ↓
Don’t know 1% 0% 0% 1% 1% 0% 0% 0%
Q15. Do you use gas for…?
Base: All respondents that indicated they had gas (n=1,796)

ACCC0007_Retail Electricity_Final Report_140618 62
Respondents that selected that they use solar PV were asked to record the size of the inverter that their system uses. Approximately a third (31%) were not sure or could not remember, 6% selected ‘less than 1.5kW’, 16% selected ‘from 1.5kW up to 2.5kW’, 11% selected ‘more than 2.5kW up to
3.5kW’, just under a quarter (23%) selected ‘more than 3.5kW up to 5kW’ and 12% selected ‘more
than 5kW’.
There were no statistically significant differences observed amongst the target audiences.
Figure 60: Solar PV usage (Inverter) – Target audiences
Q16. Thinking about your solar PV system (not solar hot water), what is the size of the installed solar PV inverter and what is the size of your panels? Base: All respondents that indicated they had solar PV (n=921) Note: *Small sample size, results should be interpreted with caution.
6% 7% 8% 9% 3% 10% 6% 7% 16% 19% 14% 17%
13% 17% 10% 20% 13%
11% 13% 16% 13% 21% 5% 8%
16% 13%
23% 25% 17% 25%
11% 16% 17%
14% 23%
12% 8% 3%
8%
17% 19% 17% 10%
31% 28% 42%
29% 38% 40% 38% 42% 33%
0%
20%
40%
60%
80%
100%
All that useSolar PV(n=921)
65+(n=444)
<$25K(n=82)
EEC(n=469)
SPH(n=21*)
MIHW2+D(n=37)
NESB(n=73)
NOLI(n=55)
DISABILITY(n=193)
Less than 1.5kW From 1.5kW up to 2.5kW More than 2.5kW up to 3.5kW
More than 3.5kW up to 5kW More than 5kW Don’t know/Can’t remember

ACCC0007_Retail Electricity_Final Report_140618 63
Respondents that selected that they use solar PV were also asked to record the size of the panels that their system uses. Just over a quarter (27%) were not sure or could not remember, 8% selected ‘less than 1.5kW’, 17% selected ‘from 1.5kW up to 2.5kW’, 14% selected ‘more than 2.5kW up to
3.5kW’, just under a quarter (23%) selected ‘more than 3.5kW up to 5kW’ and 11% selected ‘more
than 5kW’.
As with the results for the inverter, there were no statistically significant differences amongst the target audiences.
Figure 61: Solar PV usage (Panels) – Target audiences
Q16. Thinking about your solar PV system (not solar hot water), what is the size of the installed solar PV inverter and what is the size of your panels? Base: All respondents that indicated they had solar PV (n=921) Note: *Small sample size, results should be interpreted with caution.
8% 9% 11% 8% 4% 8% 8% 7% 17% 18% 15% 19%
21% 24% 14% 20% 20%
14% 16% 20% 16% 24% 4% 14% 12% 13%
23% 22% 15% 22% 11% 24% 14% 15% 21%
11% 7% 6% 7% 16% 16% 18% 10%
27% 28% 32% 28% 27% 28% 31% 46%
30%
0%
20%
40%
60%
80%
100%
All that useSolar PV(n=921)
65+(n=444)
<$25K(n=82)
EEC(n=469)
SPH(n=21*)
MIHW2+D(n=37)
NESB(n=73)
NOLI(n=55)
DISABILITY(n=193)
Less than 1.5kW From 1.5kW up to 2.5kW More than 2.5kW up to 3.5kW
More than 3.5kW up to 5kW More than 5kW Don’t know/Can’t remember
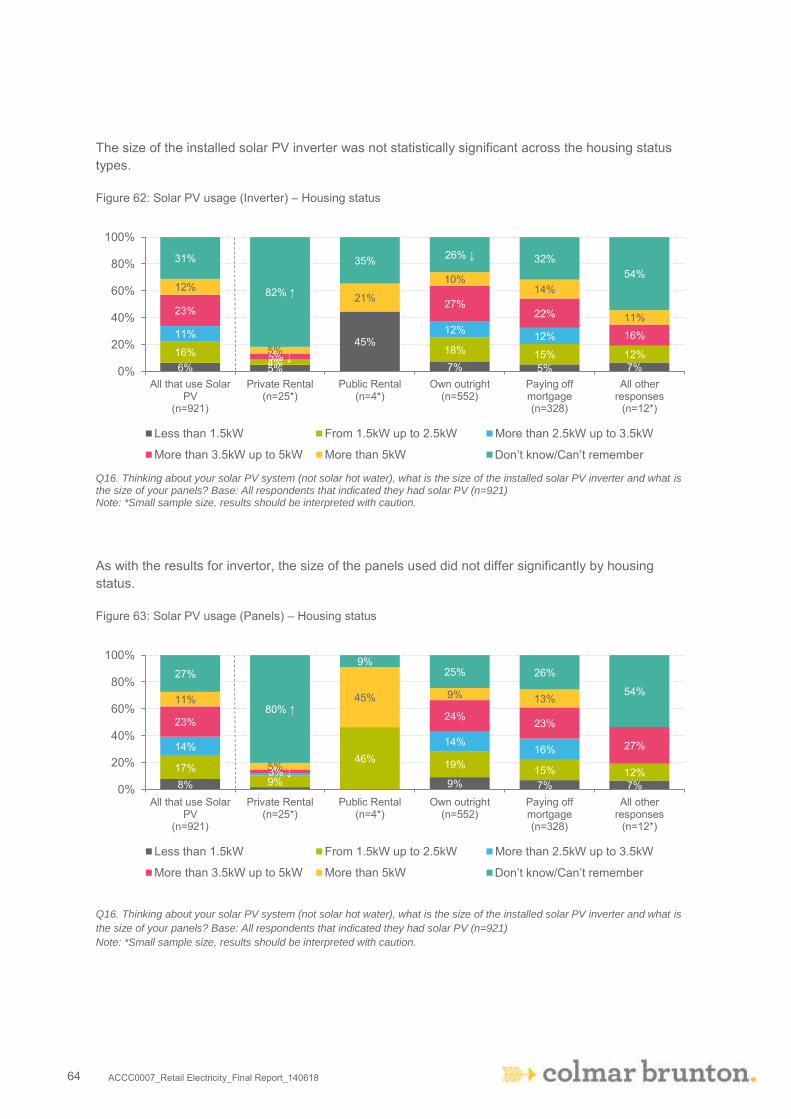
ACCC0007_Retail Electricity_Final Report_140618 64
The size of the installed solar PV inverter was not statistically significant across the housing status types.
Figure 62: Solar PV usage (Inverter) – Housing status
Q16. Thinking about your solar PV system (not solar hot water), what is the size of the installed solar PV inverter and what is the size of your panels? Base: All respondents that indicated they had solar PV (n=921) Note: *Small sample size, results should be interpreted with caution.
As with the results for invertor, the size of the panels used did not differ significantly by housing status.
Figure 63: Solar PV usage (Panels) – Housing status
Q16. Thinking about your solar PV system (not solar hot water), what is the size of the installed solar PV inverter and what is
the size of your panels? Base: All respondents that indicated they had solar PV (n=921)
Note: *Small sample size, results should be interpreted with caution.
6% 5%
45%
7% 5% 7% 16%
4% 18% 15% 12%
11% 12% 12%
23%
5% ↓
27% 22%
16%
12%
5%
21%
10% 14%
11%
31%
82% ↑
35% 26% ↓ 32% 54%
0%
20%
40%
60%
80%
100%
All that use SolarPV
(n=921)
Private Rental(n=25*)
Public Rental(n=4*)
Own outright(n=552)
Paying offmortgage(n=328)
All otherresponses
(n=12*)
Less than 1.5kW From 1.5kW up to 2.5kW More than 2.5kW up to 3.5kW
More than 3.5kW up to 5kW More than 5kW Don’t know/Can’t remember
8% 9% 7% 7% 17%
9%
46% 19% 15% 12%
14% 14% 16%
23%
3% ↓
24% 23%
27%
11%
5%
45% 9% 13%
27%
80% ↑
9% 25% 26%
54%
0%
20%
40%
60%
80%
100%
All that use SolarPV
(n=921)
Private Rental(n=25*)
Public Rental(n=4*)
Own outright(n=552)
Paying offmortgage(n=328)
All otherresponses
(n=12*)
Less than 1.5kW From 1.5kW up to 2.5kW More than 2.5kW up to 3.5kW
More than 3.5kW up to 5kW More than 5kW Don’t know/Can’t remember

ACCC0007_Retail Electricity_Final Report_140618 65
When looking at the results for the inverter size by location there were no statistically significant differences, with all locations following a similar pattern to the overall results for the respondents that use solar PV.
Figure 64: Solar PV usage (Inverter) – Locations
Q16. Thinking about your solar PV system (not solar hot water), what is the size of the installed solar PV inverter and what is the size of your panels? Base: All respondents that indicated they had solar PV (n=921) Note: *Small sample size, results should be interpreted with caution.
Similar to the inverter size results by location there were no statistically significant differences for panel size, with the pattern again similar across the locations when compared to the overall results for the respondents that use solar PV.
Figure 65: Solar PV usage (Panels) – Locations
Q16. Thinking about your solar PV system (not solar hot water), what is the size of the installed solar PV inverter and what is the size of your panels? Base: All respondents that indicated they had solar PV (n=921) Note: *Small sample size, results should be interpreted with caution.
6% 7% 5% 5% 7% 10% 6% 16% 13% 11% 18% 19% 18%
9% 19%
11% 12% 10%
10% 9% 15% 18% 3%
23% 27% 21%
19% 26% 21% 36%
25%
12% 13% 21% 11%
6% 12% 13%
27%
31% 27% 32% 38% 32% 24% 17% 26%
0%
20%
40%
60%
80%
100%
All that useSolar PV(n=921)
SEQ(n=252)
Rest of QLD(n=109)
NSW(n=169)
VIC(n=178)
SA(n=152)
TAS(n=30*)
ACT(n=31*)
Less than 1.5kW From 1.5kW up to 2.5kW More than 2.5kW up to 3.5kW
More than 3.5kW up to 5kW More than 5kW Don’t know/Can’t remember
8% 7% 5% 5% 9% 15% 12% 17% 17%
8% 17% 19%
22% 10%
19%
14% 12% 17%
15% 16%
13% 14%
3%
23% 24% 22% 20%
23% 22% 37%
29%
11% 14% 14% 10%
6% 12% 6%
25%
27% 26% 33% 34% 26% 17% 20% 25%
0%
20%
40%
60%
80%
100%
All that useSolar PV(n=921)
SEQ(n=252)
Rest of QLD(n=109)
NSW(n=169)
VIC(n=178)
SA(n=152)
TAS(n=30*)
ACT(n=31*)
Less than 1.5kW From 1.5kW up to 2.5kW More than 2.5kW up to 3.5kW
More than 3.5kW up to 5kW More than 5kW Don’t know/Can’t remember

ACCC0007_Retail Electricity_Final Report_140618 66
Approximately one out of every ten (12%) respondents recorded having a swimming pool in their home, with some significant differences noted across the target audiences. While the results varied by the target audiences, the only significant differences observed were for those eligible for an electricity concession and those with a disability in the household who were all significantly less likely to have a swimming pool (8% and 9% respectively compared to 12% for all survey respondents).
Figure 66: Pool usage – Target audiences
Q17. Does your home have a swimming pool? Please exclude pools in common areas of unit, apartment or townhouse
complexes.
Base: All survey respondents (n=3,815)
12% 12%
4% 8% ↓ 8%
11% 11% 5%
9% ↓
0%
10%
20%
30%
40%
50%
All surveyrespondents
(n=3,815)
65+(n=1,359)
<$25K(n=493)
EEC(n=1,809)
SPH(n=163)
MIHW2+D(n=182)
NESB(n=399)
NOLI(n=280)
DISABILITY(n=881)

ACCC0007_Retail Electricity_Final Report_140618 67
Perhaps unsurprisingly, the results for this question differed by greatly housing status. Those that own their home outright and those paying of a mortgage were significantly more likely to have a swimming pool (16% and 15% respectively compared to 12% for all survey respondents).
Figure 67: Pool usage – Housing status
Q17. Does your home have a swimming pool? Please exclude pools in common areas of unit, apartment or townhouse
complexes.
Base: All survey respondents (n=3,815)
There were also a number of significant differences observed by location, with regards to having a swimming pool.
Those living in South East Queensland and New South Wales were significantly more likely to have a swimming pool (16% and 16% respectively compared to 12% for all survey respondents).
Those living in Victoria and South Australia were significantly less likely to have a swimming pool (7% and 7% respectively compared to 12% for all survey respondents).
Figure 68: Pool usage – Locations
Q17. Does your home have a swimming pool? Please exclude pools in common areas of unit, apartment or townhouse
complexes.
Base: All survey respondents (n=3,815)
12%
5% 3%
16% ↑ 15% ↑ 10%
0%
10%
20%
30%
40%
50%
All surveyrespondents
(n=3,815)
Private Rental(n=683)
Public Rental(n=252)
Own outright(n=1,581)
Paying offmortgage(n=1,263)
All otherresponses
(n=36)
12% 16% ↑ 15% 16% ↑
7% ↓ 7% ↓ 3%
5%
0%
10%
20%
30%
40%
50%
All surveyrespondents
(n=3,815)
SEQ(n=774)
Rest of QLD(n=344)
NSW(n=1,018)
VIC(n=976)
SA(n=434)
TAS(n=132)
ACT(n=137)

ACCC0007_Retail Electricity_Final Report_140618 68
Approximately three quarters (77%) of all survey respondents recorded having an air conditioner in their home.
Those earning a household income of less than $25,000, those with no or limited internet, those with a disability in the household and those entitled to a concession were all significantly less likely to have an air conditioner (64%, 64%, 73% and 74% respectively compared to 77% for all survey respondents).
Figure 69: Air conditioner usage – Target audiences
Q18. Does your home have an air conditioner?
Base: All survey respondents (n=3,815)
On average those with air conditioning in their home had it in 3 rooms, with some differences observed by the target audiences.
Those earning a household income of less than $25,000, sole parent households, those with no or limited internet, those eligible for an electricity concession and those with a disability in the household all had significantly lower averages with regards to the number of rooms with air conditioning (2.1, 2.2, 2.3, 2.6 and 2.7 respectively compared to 3.0 for all survey respondents).
Figure 70: Rooms with air conditioning – Target audiences
All that have air
conditioning (n=3,016)
65+ (n=1,096)
<$25K (n=327)
EEC (n=1,381)
SPH (n=130)
MIHW2+D (n=148)
NESB (n=317)
NOLI (n=184)
DISABILITY (n=674)
3.0 3.2 2.1 ↓ 2.6 ↓ 2.2 ↓ 2.8 2.8 2.3 ↓ 2.7 ↓
Q19. In how many rooms do you have air conditioning?
77% 80%
64% ↓ 74% ↓ 78% 79% 78%
64% ↓ 73% ↓
0%
20%
40%
60%
80%
100%
All surveyrespondents
(n=3,815)
65+(n=1,359)
<$25K(n=493)
EEC(n=1,809)
SPH(n=163)
MIHW2+D(n=182)
NESB(n=399)
NOLI(n=280)
DISABILITY(n=881)

ACCC0007_Retail Electricity_Final Report_140618 69
When looking at the results by housing status there were again differences between the categories related to renting and those owning or paying of a mortgage.
Those in a public rental or in a private rental were significantly less likely to have air conditioning (66% and 62% respectively compared to 77% for all survey respondents).
Those that own their home outright and those paying of a mortgage were significantly more likely to have air conditioning (80% and 85% respectively compared to 77% for all survey respondents).
Figure 71: Air conditioner usage – Housing status
Q18. Does your home have an air conditioner?
Base: All survey respondents (n=3,815)
The pattern of results for the housing status categories was similar when looking at the average number of rooms with air conditioning.
Those in a public rental or in a private rental had significantly lower averages with regards to the number of rooms with air conditioning (1.8 and 2.1 respectively compared to 3.0 for all survey respondents).
Those that own their home outright and those paying of a mortgage had significantly higher averages with regards to the number of rooms with air conditioning (3.4 and 3.3 respectively compared to 3.0 for all survey respondents).
Figure 72: Rooms with air conditioning – Housing status
All that have air conditioning (n=3,016)
Private Rental (n=461)
Public Rental (n=157)
Own outright (n=1,290)
Paying off mortgage (n=1,081)
All other responses
(n=27*)
3.0 2.1 ↓ 1.8 ↓ 3.4 ↑ 3.3 ↑ 2.8
Q19. In how many rooms do you have air conditioning?
77% 66% ↓ 62% ↓
80% ↑ 85% ↑ 74%
0%
20%
40%
60%
80%
100%
All surveyrespondents
(n=3,815)
Private Rental(n=683)
Public Rental(n=252)
Own outright(n=1,581)
Paying offmortgage(n=1,263)
All otherresponses
(n=36)

ACCC0007_Retail Electricity_Final Report_140618 70
Results for air conditioning usage varied across locations.
Those living in South Australia, the rest of Queensland and South East Queensland were significantly more likely to have air conditioning (95%, 84% and 83% respectively compared to 77% for all survey respondents).
Those living in New South Wales were significantly less likely to have air conditioning (71% compared to 77% for all survey respondents).
Figure 73: Air conditioner usage – Locations
Q18. Does your home have an air conditioner?
Base: All survey respondents (n=3,815)
There were also a variety of differences observed by location with regards to the number of rooms with air conditioning.
Those living in Tasmania, South East Queensland and Victoria had significantly lower averages with regards to the number of rooms with air conditioning (1.7, 2.7 and 2.9 respectively compared to 3.0 for all survey respondents).
Those living in the Australian Capital Territory and South Australia had significantly higher averages with regards to the number of rooms with air conditioning (4.1 and 3.7 respectively compared to 3.0 for all survey respondents).
Figure 74: Rooms with air conditioning – Locations
All that have air
conditioning (n=3,016)
SEQ (n=629)
Rest of QLD
(n=289)
NSW (n=720)
VIC (n=763)
SA (n=412)
TAS (n=91)
ACT (n=112)
3.0 2.7 ↓ 3.1 3.1 2.9 ↓ 3.7 ↑ 1.7 ↓ 4.1 ↑
Q19. In how many rooms do you have air conditioning?
77% 83% ↑ 84% ↑
71% ↓ 76%
95% ↑
69% 82%
0%
20%
40%
60%
80%
100%
All surveyrespondents
(n=3,815)
SEQ(n=774)
Rest of QLD(n=344)
NSW(n=1,018)
VIC(n=976)
SA(n=434)
TAS(n=132)
ACT(n=137)

ACCC0007_Retail Electricity_Final Report_140618 71
Approximately one in ten (9%) survey respondents noted operating a business from home. While percentages varied amongst the target audiences, the only significant difference was for those eligible for an electricity concession who were significantly less likely to operate a business from home (6% compared to 9% for all survey respondents).
Figure 75: Running a business from home – Target audiences
Q20. Do you operate a business from home?
Base: All survey respondents (n=3,815)
The results for those survey respondents that operated a business from home differed by housing status.
Those privately renting were significantly less likely to operate a business from home (6% compared to 9% for all survey respondents).
Those paying off a mortgage significantly more likely to operate a business from home (11% compared to 9% for all survey respondents).
Figure 76: Running a business from home – Housing status
Q20. Do you operate a business from home?
Base: All survey respondents (n=3,815)
9% 9%
2% 6% ↓ 3%
9% 12%
1%
8%
0%
10%
20%
30%
40%
50%
All surveyrespondents
(n=3,815)
65+(n=1,359)
<$25K(n=493)
EEC(n=1,809)
SPH(n=163)
MIHW2+D(n=182)
NESB(n=399)
NOLI(n=280)
DISABILITY(n=881)
9% 6% ↓
2%
10% 11% ↑ 12%
0%
10%
20%
30%
40%
50%
All surveyrespondents
(n=3,815)
Private Rental(n=683)
Public Rental(n=252)
Own outright(n=1,581)
Paying offmortgage(n=1,263)
All otherresponses
(n=36)

ACCC0007_Retail Electricity_Final Report_140618 72
Looking at the results by locations there were no statistically significant differences observed for those that operated a business from home. All locations experienced between 6% and 10% of survey respondents operating a business from home, which was similar to the total of 9%.
Figure 77: Running a business from home – Locations
Q20. Do you operate a business from home?
Base: All survey respondents (n=3,815)
9% 8% 9% 10% 9% 6%
10% 9%
0%
10%
20%
30%
40%
50%
All surveyrespondents
(n=3,815)
SEQ(n=774)
Rest of QLD(n=344)
NSW(n=1,018)
VIC(n=976)
SA(n=434)
TAS(n=132)
ACT(n=137)

ACCC0007_Retail Electricity_Final Report_140618 73
5.4 Bill Payments and Decisions
Overall, 18% of survey respondents recalled paying an electricity bill late (since December 2016).
Those aged 65 years and over were significantly less likely to have paid an electricity bill late since December 2016 (8% compared to 18% for all survey respondents).
Sole parent households, middle income households ($50,000-$99,999) with 2 or more dependents, those with a disability in the household and those earning a household income of less than $25,000 were all significantly more likely to have recalled paying an electricity bill late since December 2016 (40%, 34%, 25% and 23% respectively compared to 18% for all survey respondents).
Figure 78: Late Payments – Target audiences
Q21A. Since December 2016, can you recall paying your electricity bill late?
Base: All survey respondents (n=3,815)
18%
8% ↓
23% ↑ 20%
40% ↑
34% ↑
15% 17%
25% ↑
0%
10%
20%
30%
40%
50%
All surveyrespondents
(n=3,815)
65+(n=1,359)
<$25K(n=493)
EEC(n=1,809)
SPH(n=163)
MIHW2+D(n=182)
NESB(n=399)
NOLI(n=280)
DISABILITY(n=881)

ACCC0007_Retail Electricity_Final Report_140618 74
With regards to paying an electricity bill late since December 2016, there were a number of statistically significant differences observed by housing status.
Those in public rentals and those in private rentals were significantly more likely to have recalled paying a bill late (31% and 28% respectively compared to 18% for all survey respondents).
Conversely, those that owned their home outright were significantly less likely to have recalled paying a bill late (8% compared to 18% for all survey respondents).
Figure 79: Late Payments – Housing status
Q21A. Since December 2016, can you recall paying your electricity bill late?
Base: All survey respondents (n=3,815)
There were few differences observed across the locations in relation to paying a bill late.
Those living in the rest of Queensland (outside of South East Queensland) were significantly more likely to have recalled paying a bill late since December 2016 (31% compared to 18% for all survey respondents).
Figure 80: Late Payments – Locations
Q21A. Since December 2016, can you recall paying your electricity bill late?
Base: All survey respondents (n=3,815)
18%
28% ↑ 31% ↑
8% ↓
17%
10%
0%
10%
20%
30%
40%
50%
All surveyrespondents
(n=3,815)
Private Rental(n=683)
Public Rental(n=252)
Own outright(n=1,581)
Paying offmortgage(n=1,263)
All otherresponses
(n=36)
18% 17%
31% ↑
16% 16% 17%
26%
15%
0%
10%
20%
30%
40%
50%
All surveyrespondents
(n=3,815)
SEQ(n=774)
Rest of QLD(n=344)
NSW(n=1,018)
VIC(n=976)
SA(n=434)
TAS(n=132)
ACT(n=137)

ACCC0007_Retail Electricity_Final Report_140618 75
Just over one in ten (12%) survey respondents noted that since December 2016 they had missed an electricity payment because they could not afford to pay the bill. Similar to paying a bill late there were several significant differences observed across the target audiences for having missed a payment.
Sole parent households, middle income households ($50,000-$99,999) with 2 or more dependents, those with a disability in the household, those earning a household income of less than $25,000 and those eligible for an electricity concession were all significantly more likely to have missed an electricity payment since December 2016 because they could not afford to pay the bill (38%, 26%, 22%, 17% and 15% respectively compared to 12% for all survey respondents).
Figure 81: Missed Payments – Target audiences
Q21B. Since December 2016, have you missed an electricity payment because you could not afford to pay the bill?
Base: All survey respondents (n=3,815)
12%
2%
17% ↑ 15% ↑
38% ↑
26% ↑
10% 8%
22% ↑
0%
10%
20%
30%
40%
50%
All surveyrespondents
(n=3,815)
65+(n=1,359)
<$25K(n=493)
EEC(n=1,809)
SPH(n=163)
MIHW2+D(n=182)
NESB(n=399)
NOLI(n=280)
DISABILITY(n=881)

ACCC0007_Retail Electricity_Final Report_140618 76
Results for having missed an electricity payment since December 2016 because they could not afford to pay the bill by housing status were similar to the results noted for paying an electricity bill late since December 2016.
Those in public rentals and those in private rentals were significantly more likely to have missed a payment (29% and 23% respectively compared to 12% for all survey respondents).
Figure 82: Missed Payments – Housing status
Q21B. Since December 2016, have you missed an electricity payment because you could not afford to pay the bill?
Base: All survey respondents (n=3,815)
12%
23% ↑ 29% ↑
2%
10% 8%
0%
10%
20%
30%
40%
50%
All surveyrespondents
(n=3,815)
Private Rental(n=683)
Public Rental(n=252)
Own outright(n=1,581)
Paying offmortgage(n=1,263)
All otherresponses
(n=36)

ACCC0007_Retail Electricity_Final Report_140618 77
When looking at the results for missed payments by locations, there were two significant differences.
Those living in the rest of Queensland (outside of South East Queensland) were significantly more likely to have recalled missing a payment since December 2016 (19% compared to 12% for all survey respondents).
Those living in Victoria were significantly less likely to have recalled missing an electricity payment because they could not afford it (9% compared to 12% for all survey respondents).
Figure 83: Missed Payments – Locations
Q21B. Since December 2016, have you missed an electricity payment because you could not afford to pay the bill?
Base: All survey respondents (n=3,815)
12% 13% 19% ↑
12% 9% ↓
15% 13% 9%
0%
10%
20%
30%
40%
50%
All surveyrespondents
(n=3,815)
SEQ(n=774)
Rest of QLD(n=344)
NSW(n=1,018)
VIC(n=976)
SA(n=434)
TAS(n=132)
ACT(n=137)

ACCC0007_Retail Electricity_Final Report_140618 78
Overall, just 1% of survey respondents recalled being disconnected (since December 2016) because they were unable to pay an electricity bill, with no statistically significant differences observed by the target audiences.
Figure 84: Disconnected – Target audiences
Q21C. Since December 2016, have you been disconnected for being unable to pay an electricity bill?
Base: All survey respondents (n=3,815)
Results were similar by the housing status types with regards to those that had been disconnected since December 2016, with no statistically significant differences observed by housing status.
Figure 85: Disconnected – Housing status
Q21C. Since December 2016, have you been disconnected for being unable to pay an electricity bill?
Base: All survey respondents (n=3,815)
1% 0% 1% 1% 6%
3% 3% 0% 2% ↑ 0%
10%
20%
30%
40%
50%
All surveyrespondents
(n=3,815)
65+(n=1,359)
<$25K(n=493)
EEC(n=1,809)
SPH(n=163)
MIHW2+D(n=182)
NESB(n=399)
NOLI(n=280)
DISABILITY(n=881)
1% 2% 2% 0% 1% 0% 0%
10%
20%
30%
40%
50%
All surveyrespondents
(n=3,815)
Private Rental(n=683)
Public Rental(n=252)
Own outright(n=1,581)
Paying offmortgage(n=1,263)
All otherresponses
(n=36)

ACCC0007_Retail Electricity_Final Report_140618 79
Results were also similar across all locations with regards to those that had been disconnected since December 2016, with no statistically significant differences observed by locations.
Figure 86: Disconnected – Locations
Q21C. Since December 2016, have you been disconnected for being unable to pay an electricity bill?
Base: All survey respondents (n=3,815)
1% 1% 1% 1% 1% 0% 1% 0% 0%
10%
20%
30%
40%
50%
All surveyrespondents
(n=3,815)
SEQ(n=774)
Rest of QLD(n=344)
NSW(n=1,018)
VIC(n=976)
SA(n=434)
TAS(n=132)
ACT(n=137)

ACCC0007_Retail Electricity_Final Report_140618 80
Since December 2016, 18% of all survey respondents reported having been on a payment plan with an electricity retailer.
Those aged 65 years and over were significantly less likely to have been on a payment plan (13% compared to 18% for all survey respondents).
Sole parent households, those earning a household income of less than $25,000, those with a disability in the household, middle income households ($50,000-$99,999) with 2 or more dependents and those eligible to receive an electricity were all significantly more likely to have been on a payment plan since December 2016 (40%, 32%, 31%, 26% and 25% respectively compared to 18% for all survey respondents).
Figure 87: Payment Plan – Target audiences
Q21D. Since December 2016, have you been on a payment plan with any electricity retailer?
Base: All survey respondents (n=3,815)
18% 13% ↓
31% ↑ 25% ↑
40% ↑
26% ↑
15% 18%
32% ↑
0%
10%
20%
30%
40%
50%
All surveyrespondents
(n=3,815)
65+(n=1,359)
<$25K(n=493)
EEC(n=1,809)
SPH(n=163)
MIHW2+D(n=182)
NESB(n=399)
NOLI(n=280)
DISABILITY(n=881)

ACCC0007_Retail Electricity_Final Report_140618 81
There were several significant differences observed by housing status for those that reported having been on a payment plan since December 2016.
Those renting either publically or privately were significantly more likely to have been on a payment plan (41% and 26% respectively compared to 18% for all survey respondents).
Conversely, those that owned their home outright and those paying off a mortgage were significantly less likely to have been on a payment plan since December 2016 (10% and 14% respectively compared to 18% for all survey respondents).
Figure 88: Payment Plan – Housing status
Q21D. Since December 2016, have you been on a payment plan with any electricity retailer?
Base: All survey respondents (n=3,815)
18%
26% ↑
41% ↑
10% ↓ 14% ↓
20%
0%
10%
20%
30%
40%
50%
All surveyrespondents
(n=3,815)
Private Rental(n=683)
Public Rental(n=252)
Own outright(n=1,581)
Paying offmortgage(n=1,263)
All otherresponses
(n=36)

ACCC0007_Retail Electricity_Final Report_140618 82
There were two significant differences noted for those survey respondents that reported having been on a payment plan when looking at locations, with these again being for the rest of Queensland and Victoria.
Those living in the rest of Queensland (outside of South East Queensland) were significantly more likely to have been on a payment plan since December 2016 (27% compared to 18% for all survey respondents).
Those living in Victoria were significantly less likely to have been on a payment plan (14% compared to 18% for all survey respondents).
Figure 89: Payment Plan – Locations
Q21D. Since December 2016, have you been on a payment plan with any electricity retailer?
Base: All survey respondents (n=3,815)
18% 18%
27% ↑
18% 14% ↓
20% 20% 18%
0%
10%
20%
30%
40%
50%
All surveyrespondents
(n=3,815)
SEQ(n=774)
Rest of QLD(n=344)
NSW(n=1,018)
VIC(n=976)
SA(n=434)
TAS(n=132)
ACT(n=137)

ACCC0007_Retail Electricity_Final Report_140618 83
Approximately two thirds (66%) of survey respondents indicated that they felt either ‘moderately
confident’ (40%) or ‘very confident’ (26%) in making informed decisions about the best electricity offer for themselves. One in five indicated that they felt ‘slightly confident’ (20%) and the remaining 15% indicated that they felt either ‘not very confident’ (12%) or ‘not at all confident’ (3%).
Levels of confidence in making informed decisions varied for those aged 65 years and older, concession card holders, low income households and those with a physical or mental disability in the household:
Those aged 65 years and over were significantly more likely to have selected that they felt ‘moderately confident’ or ‘very confident’ (74% compared to 65% for all survey respondents).
Those aged 65 years and over and those eligible for an electricity concession were significantly less likely to have felt ‘slightly confident’ (14% and 17% respectively compared to 20% for all survey respondents).
Those with an annual household income of less than $25,000 were significantly more likely to feel ‘not very confident’ or ‘not at all confident’ (20% compared to 15% for all survey respondents), as were respondents where one or more persons in the house had either a mental or physical disability (18% compared to 15% for all survey respondents).
Figure 90: Informed decision making – Target audiences
Q22. With regards to making informed decisions about the best electricity offer for you, how confident do you feel?
Base: All survey respondents (n=3,815)
3% 3% 6% ↑ 4% 7% ↑ 3% 7% ↑ 5% ↑ 12% 9% ↓
15% 12% 13% 13%
10% 11% 13%
20% 14% ↓
16% 17% ↓ 20% 22%
22% 18% 18%
40% 41%
33% ↓ 39% 43% 37% 35% 31% ↓ 38%
26% 32% ↑ 30% 28% ↑ 23% 22% 30% 33% ↑ 26%
0%
20%
40%
60%
80%
100%
All surveyrespondents
(n=3,815)
65+(n=1,359)
<$25K(n=493)
EEC(n=1,809)
SPH(n=163)
MIHW2+D(n=182)
NESB(n=399)
NOLI(n=280)
DISABILITY(n=881)
Not at all confident Not very confident Slightly confident Moderately confident Very confident
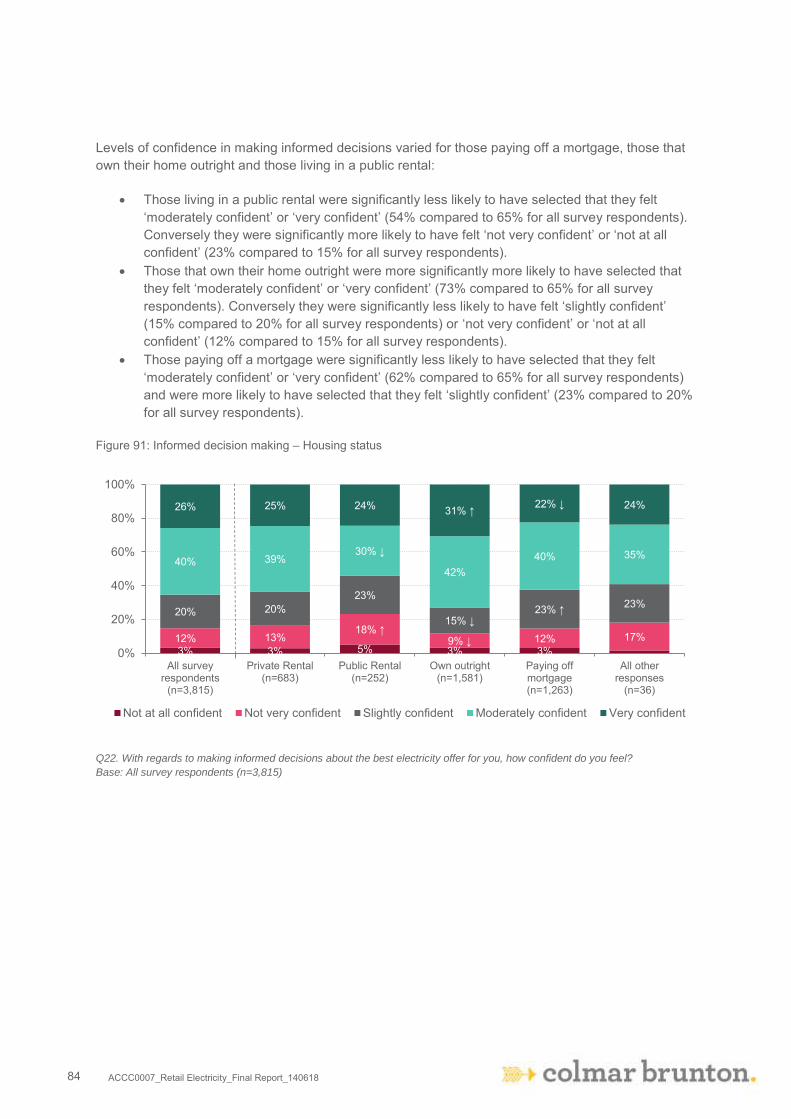
ACCC0007_Retail Electricity_Final Report_140618 84
Levels of confidence in making informed decisions varied for those paying off a mortgage, those that own their home outright and those living in a public rental:
Those living in a public rental were significantly less likely to have selected that they felt ‘moderately confident’ or ‘very confident’ (54% compared to 65% for all survey respondents). Conversely they were significantly more likely to have felt ‘not very confident’ or ‘not at all confident’ (23% compared to 15% for all survey respondents).
Those that own their home outright were more significantly more likely to have selected that they felt ‘moderately confident’ or ‘very confident’ (73% compared to 65% for all survey respondents). Conversely they were significantly less likely to have felt ‘slightly confident’ (15% compared to 20% for all survey respondents) or ‘not very confident’ or ‘not at all confident’ (12% compared to 15% for all survey respondents).
Those paying off a mortgage were significantly less likely to have selected that they felt ‘moderately confident’ or ‘very confident’ (62% compared to 65% for all survey respondents) and were more likely to have selected that they felt ‘slightly confident’ (23% compared to 20% for all survey respondents).
Figure 91: Informed decision making – Housing status
Q22. With regards to making informed decisions about the best electricity offer for you, how confident do you feel?
Base: All survey respondents (n=3,815)
3% 3% 5% 3% 3% 12% 13%
18% ↑ 9% ↓ 12% 17%
20% 20% 23%
15% ↓ 23% ↑ 23%
40% 39% 30% ↓
42% 40% 35%
26% 25% 24% 31% ↑ 22% ↓ 24%
0%
20%
40%
60%
80%
100%
All surveyrespondents
(n=3,815)
Private Rental(n=683)
Public Rental(n=252)
Own outright(n=1,581)
Paying offmortgage(n=1,263)
All otherresponses
(n=36)
Not at all confident Not very confident Slightly confident Moderately confident Very confident
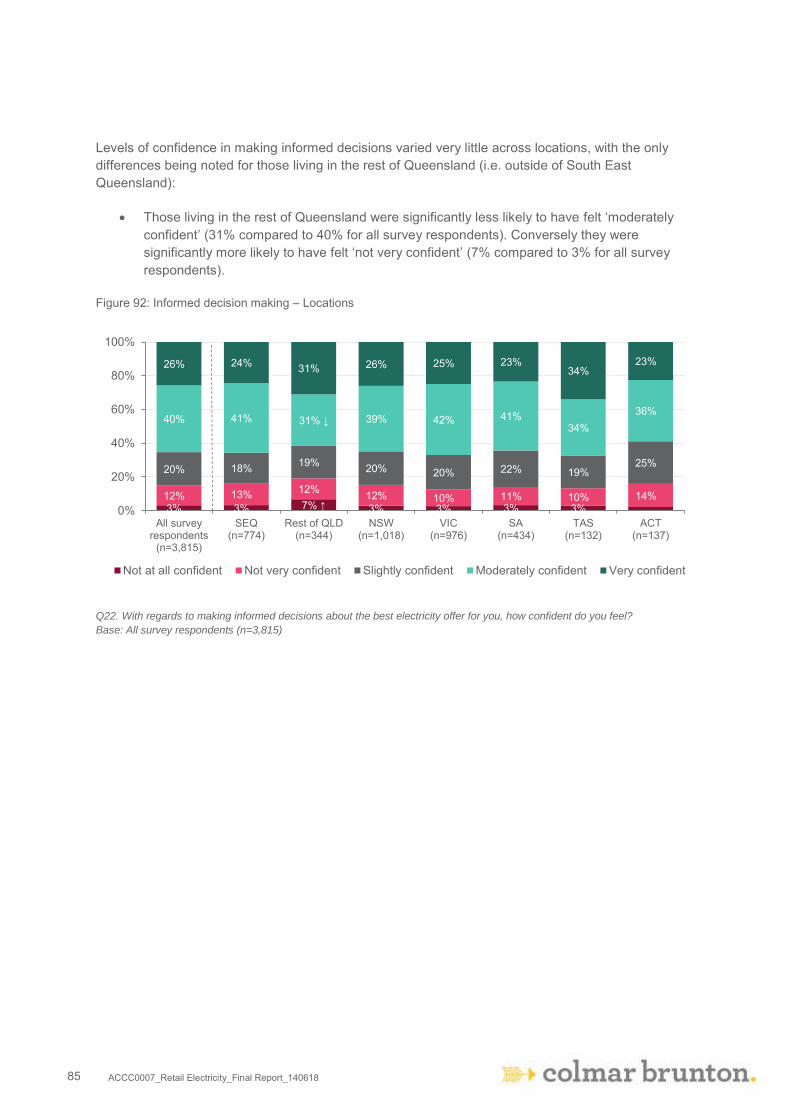
ACCC0007_Retail Electricity_Final Report_140618 85
Levels of confidence in making informed decisions varied very little across locations, with the only differences being noted for those living in the rest of Queensland (i.e. outside of South East Queensland):
Those living in the rest of Queensland were significantly less likely to have felt ‘moderately confident’ (31% compared to 40% for all survey respondents). Conversely they were significantly more likely to have felt ‘not very confident’ (7% compared to 3% for all survey respondents).
Figure 92: Informed decision making – Locations
Q22. With regards to making informed decisions about the best electricity offer for you, how confident do you feel?
Base: All survey respondents (n=3,815)
3% 3% 7% ↑ 3% 3% 3% 3% 12% 13% 12% 12% 10% 11% 10% 14%
20% 18% 19% 20% 20% 22% 19% 25%
40% 41% 31% ↓ 39% 42% 41% 34%
36%
26% 24% 31% 26% 25% 23% 34%
23%
0%
20%
40%
60%
80%
100%
All surveyrespondents
(n=3,815)
SEQ(n=774)
Rest of QLD(n=344)
NSW(n=1,018)
VIC(n=976)
SA(n=434)
TAS(n=132)
ACT(n=137)
Not at all confident Not very confident Slightly confident Moderately confident Very confident

ACCC0007_Retail Electricity_Final Report_140618 86
5.5 Key Demographics
Exactly three quarters of all survey respondents (75%) were located in a metro location, while the remaining 25% were located in a regional location. These percentages differed among the target audiences, with sole parent households, those with an annual household income of less than $25,000, middle income households ($50,000-$99,999) with 2 or more dependents, those eligible for an electricity concession, households with a disability and those aged 65 years and over significantly more likely to be located in a regional area (38%, 36%, 35%, 33%, 30% and 28% respectively compared to 25% for all respondents). Conversely, those households that speak a language other than English were significantly more likely to be located in metro areas (89% compared to 75% for all survey respondents).
Figure 93: Metro/Regional – Target audiences
Base: All survey respondents (n=3,815)
No statistically significant differences across the metro or regional location categories were observed with regards to housing status.
Figure 94: Metro/Regional – Housing status
Base: All survey respondents (n=3,815)
75% 72% ↓ 64% ↓ 67% ↓ 62% ↓ 65% ↓ 89% ↑
75% 70% ↓
25% 28% ↑ 36% ↑ 33% ↑ 38% ↑ 35% ↑ 11% ↓
25% 30% ↑
0%
20%
40%
60%
80%
100%
All surveyrespondents
(n=3,815)
65+(n=1,359)
<$25K(n=493)
EEC(n=1,809)
SPH(n=163)
MIHW2+D(n=182)
NESB(n=399)
NOLI(n=280)
DISABILITY(n=881)
Metro Regional
75% 75% 70% 76% 76% 66%
25% 25% 30% 24% 24% 34%
0%
20%
40%
60%
80%
100%
All surveyrespondents
(n=3,815)
Private Rental(n=683)
Public Rental(n=252)
Own outright(n=1,581)
Paying offmortgage(n=1,263)
All otherresponses
(n=36)
Metro Regional
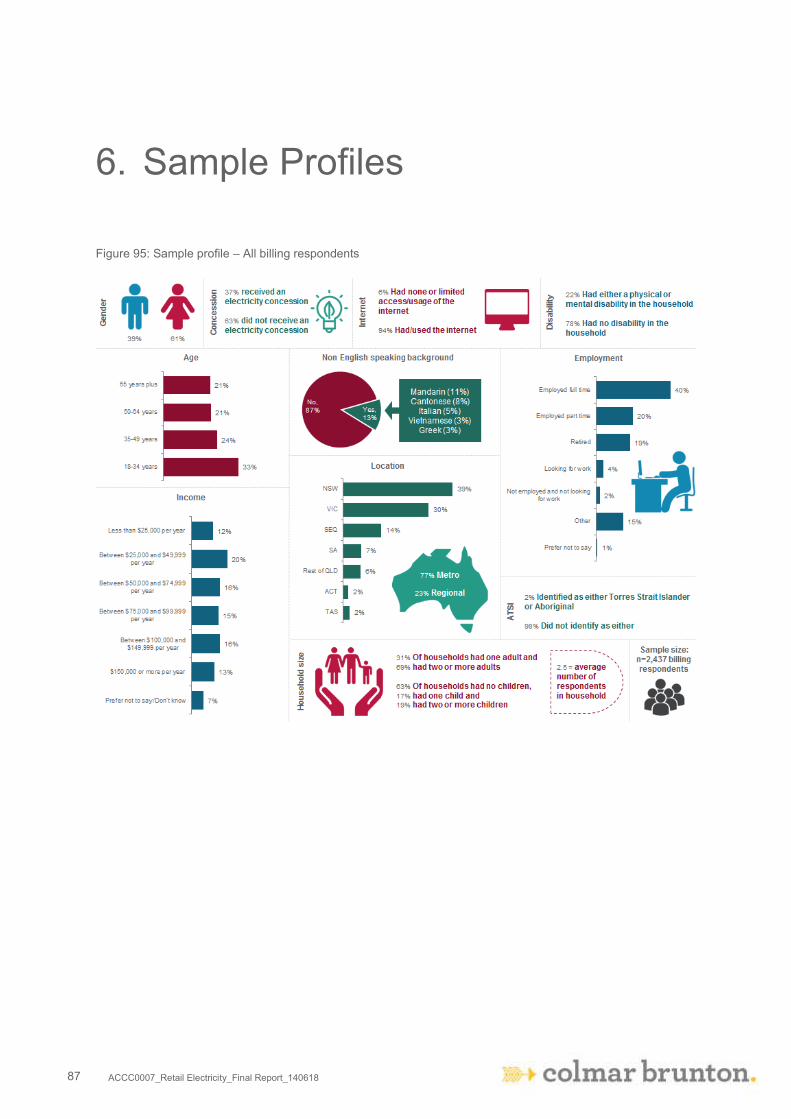
ACCC0007_Retail Electricity_Final Report_140618 87
6. Sample Profiles
Figure 95: Sample profile – All billing respondents

ACCC0007_Retail Electricity_Final Report_140618 88
Figure 96: Sample profile – All survey respondents

ACCC0007_Retail Electricity_Final Report_140618 89
7. Appendix A: Technical Notes
7.1 Research Approach
Colmar Brunton used a four stage approach to undertake the research:
Stage 1: Project planning meeting; Stage 2: Quantitative fieldwork preparation; Stage 3: Quantitative data collection; and Stage 4: Data processing, analysis and reporting.
Stage 1: Project planning meeting
The project planning meeting was held on Tuesday 16th January between members of the Colmar Brunton and ACCC project teams. The project planning meeting allowed a deeper knowledge of the objectives of the research, the ways it was envisaged the research results may be used and finalisation of the research design.
Stage 2: Quantitative fieldwork preparation
Following the project planning meetings, Colmar Brunton developed the draft questionnaire which was provided to the ACCC project team for feedback prior to finalisation. The final questionnaire can be found in Appendix B: Questionnaire.
Fieldwork pilot A pilot of the survey which consisted of n=81 completed surveys (online n=46 and CATI n=35) was conducted from Thursday 8th to Monday 12th February 2018. The pilot confirmed the survey was working well and that respondents had little difficulty either interpreting our questions or in providing a valid response. The interim data file from these first 81 surveys was checked to ensure the programmed survey was capturing data strictly in accordance with the final approved questionnaire. Given there was no problems evident in the pilot sample, these completed interviews were counted as part of our final sample of n=3,815.

ACCC0007_Retail Electricity_Final Report_140618 90
Stage 3: Quantitative data collection
A combined quantitative data collection approach which utilised an online survey for the general public and a supplementary telephone survey for particular target audiences of interest unlikely to be well represented on online consumer panels was used for the survey.
Scope of the survey It is important to note the following about the scope of the survey:
Only Australian households in the National Electricity Market (NEM, comprised of QLD, NSW, ACT, VIC, SA and TAS) were included in this study;
Only persons aged 18 years and over were allowed to respond to the survey; Respondents to the survey were required to provide express and fully informed permission for
their current and previous electricity retailers to disclose their billing information from the past 15 months to the ACCC (and subsequently to Colmar Brunton) for linkage with their survey information; and
In addition to the express permission, the respondents were asked to provide their account name, national meter identifier (NMI) and billing address. This information was then provided to the ACCC. The ACCC then used compulsory information gathering powers under section 95ZK of the Competition and Consumer Act 2010 to obtain up to 15 months of billing and consumption data for each survey respondent. Retailers provided data for n=3,675 survey respondents.
Following data cleansing, the final sample was agreed to be n=3,310 respondents (n=2,437 non-solar customers and 873 solar customers) with between nine and 13 months of billing and consumption data. The ACCC also instructed Colmar Brunton to exclude solar customers from all billing calculations and analysis due to the inherent differences between solar and non-solar customer usage and prices. Therefore the final number of in scope respondents which billing analysis in this report is based on reduced to n=2,437. Please note that the ACCC has conducted separate analysis on solar customers.
Fieldwork Fieldwork for the general consumer component of the survey was conducted by the Online Research Unit’s (ORU), utilising their panel of over 350,000 Australians that have been recruited through both online and offline methods to provide a broad and nationally representative sample. Importantly, this panel has been developed specifically to allow for national and multi-state studies – meaning the panel offered robust coverage across the National Retail Electricity Market (NREM) states of interest.
For the online survey a total sample size of n=3,000 was agreed upon, with special focus on aiming to achieve minimum samples of n=200 for the following groups:
sole parent households; middle income households with 2+ dependents; households where English is not the main language spoken; and different housing statuses: private rental, public rental, own home outright, paying mortgage.
While it was envisaged that the online panel approach would provide adequate coverage of many of the consumer audiences of interest, it was believed that such an approach was unlikely to yield reasonable samples for the following groups:

ACCC0007_Retail Electricity_Final Report_140618 91
older households (65+); households with Concession Cards holders; households with no Internet Access or limited use of the internet to compare/buy goods and
services; and households where one or more persons has a mental or physical disability.
To this end, the respondents from the online survey were supplemented with a targeted phone survey. For the phone component of the study, Colmar Brunton engaged Q&A Research, a specialist phone surveying company based in Brisbane. Q&A had extensive experience conducting similar work for both Federal and state government agencies and like ORU, they have full ISO accreditation for their data collection practices. A briefing, including a practice interview, was held with all interviewers and the field supervisor prior to the commencement of interviewing.
A pilot of the survey which consisted of n=81 completed surveys (online n=46 and telephone n=35) was conducted from Thursday 8th to Monday 12th February 2018. In addition to the survey questions, three follow-up questions were also asked:
How did you feel about the survey overall? Which questions, if any, were difficult to answer? Which questions, if any, made you feel uncomfortable?
The interim data file from these first 81 surveys was checked to ensure the programmed survey was capturing data strictly in accordance with the final approved questionnaire. Colmar Brunton also scrutinised the verbatim responses to the follow-up questions, as well as gathering information from the field teams about how the survey worked. The average survey length was also reviewed as were the sampling procedures. An assessment was then made that no modifications to the survey or sample design were needed for the overall outcomes to be achieved. Given there was no problems evident in the pilot sample, these completed interviews were counted as part of our final sample of n=3,815.
Stage 4: Data processing, analysis and reporting
Weighting The results of this survey have been weighted according to Australian Bureau of Statistic (ABS) 2016 Census Population and Housing data. Separate weights have been created for billing respondents and survey respondents.
When looking at the results, we need to account for the fact we deliberately oversampled some low incidence groups (i.e. specific locations) to allow comparison of findings between these groups and other groups. As this disproportionate sampling by location was undertaken and the sample for 18-34 year olds was exhausted before the target number of interviews was achieved, we account for this by weighting each respondent such that their results influence the overall population result appropriately.
We only need to weight data when our final sample composition is different to that which we would have achieved if drawing a purely random sample. As a result separate weights were calculated for all survey respondents and all billing respondents.

ACCC0007_Retail Electricity_Final Report_140618 92
The following table shows how weights for this survey were calculated and applied for the analysis using all survey respondents. Column A shows how many surveys were achieved in each location specific age group. Column B shows the proportion of the number of completed surveys in each location specific age group. Column C shows the population figures in each location specific age group. Column D shows the proportion of the population represented by each cell. Column E shows the needed weight factor using the following calculation:
Population % n (column D) / completed surveys % n (column B).
Figure 97: Statistics used in weighting – All Survey Respondents
LOCATION A B C D E
Completed surveys n=
Completed surveys % n
Population figure n=
Population figure% n Weight
NSW 18-34 years 163 4.3% 1,738,905 10.8% 2.531
NSW 35-54 years 327 8.6% 1,980,873 12.3% 1.437
NSW 55 years plus 528 13.8% 2,107,413 13.1% 0.947
VIC 18-34 years 151 4.0% 1,452,506 9.0% 2.283
VIC 35-54 years 344 9.0% 1,586,327 9.9% 1.094
VIC 55 years plus 481 12.6% 1,600,039 10.0% 0.789
TAS 18-34 years 24 0.6% 99,995 0.6% 0.989
TAS 35-54 years 52 1.4% 129,868 0.8% 0.593
TAS 55 years plus 56 1.5% 170,900 1.1% 0.724
SA 18-34 years 60 1.6% 367,011 2.3% 1.451
SA 35-54 years 133 3.5% 436,363 2.7% 0.779
SA 55 years plus 241 6.3% 520,506 3.2% 0.512
ACT 18-34 years 24 0.6% 108,740 0.7% 1.075
ACT 35-54 years 53 1.4% 109,411 0.7% 0.490
ACT 55 years plus 60 1.6% 91,465 0.6% 0.362 South East QLD 18-34 years 125 3.3% 762,168 4.7% 1.447
South East QLD 35-54 years 211 5.5% 857,129 5.3% 0.964
South East QLD 55 years plus 438 11.5% 823,334 5.1% 0.446
Rest of QLD 18-34 years 62 1.6% 308,450 1.9% 1.181
Rest of QLD 35-54 years 79 2.1% 391,889 2.4% 1.177
Rest of QLD 55 years plus 203 5.3% 434,084 2.7% 0.507
TOTAL 3815 100% 16,077,376 100% NA

ACCC0007_Retail Electricity_Final Report_140618 93
Using the same weighting approach outlined above for all survey data, a separate set of weights was developed for the billing data analysis respondents. While the population figures remained the same for each location specific age group, the number of completed surveys changed, as billing data was unable to be provided for each survey respondent.
Using the same table included above the weights were calculated on the respondents for which billing data was provided and determined to be in scope. Column A shows how many in scope billing respondents were in each location specific age group. Column B shows the proportion of in scope billing respondents. Column C shows the population figures in each location specific age group. Column D shows the proportion of the population represented by each cell. Column E shows the needed weight factor using the following calculation:
Population % n (column D) / completed surveys % n (column B).
Figure 98: Statistics used in weighting – All In Scope Billing Respondents
LOCATION
A B C D E In scope
billing data n=
Completed surveys % n
Population figure n=
Population figure% n Weight
NSW 18-34 years 104 3.1% 1,738,905 10.8% 3.442
NSW 35-54 years 276 8.3% 1,980,873 12.3% 1.478
NSW 55 years plus 485 14.7% 2,107,413 13.1% 0.895
VIC 18-34 years 104 3.1% 1,452,506 9.0% 2.875
VIC 35-54 years 293 8.9% 1,586,327 9.9% 1.115
VIC 55 years plus 437 13.2% 1,600,039 10.0% 0.754
TAS 18-34 years 17 0.5% 99,995 0.6% 1.211
TAS 35-54 years 49 1.5% 129,868 0.8% 0.546
TAS 55 years plus 54 1.6% 170,900 1.1% 0.652
SA 18-34 years 44 1.3% 367,011 2.3% 1.717
SA 35-54 years 118 3.6% 436,363 2.7% 0.761
SA 55 years plus 222 6.7% 520,506 3.2% 0.483
ACT 18-34 years 21 0.6% 108,740 0.7% 1.066
ACT 35-54 years 51 1.5% 109,411 0.7% 0.442
ACT 55 years plus 56 1.7% 91,465 0.6% 0.336 South East QLD 18-34 years 86 2.6% 762,168 4.7% 1.825
South East QLD 35-54 years 182 5.5% 857,129 5.3% 0.970
South East QLD 55 years plus 404 12.2% 823,334 5.1% 0.420
Rest of QLD 18-34 years 45 1.4% 308,450 1.9% 1.411
Rest of QLD 35-54 years 69 2.1% 391,889 2.4% 1.169
Rest of QLD 55 years plus 193 5.8% 434,084 2.7% 0.463

ACCC0007_Retail Electricity_Final Report_140618 94
TOTAL 3310 100% 16,077,376 100% NA
Why do researchers weight data? The raw data from the survey is biased and therefore it would be misleading to use it as a basis of coming to an understanding about the topic at hand. For example, the sample has a greater proportion of respondents aged 55 and over than the general population. As respondents aged 55 and over may have different views than younger respondents, reporting on raw data would lead to a bias towards what respondents aged 55 and over do or think. Weighting the data overcomes this problem because it ensures that the results are representative of the target population.
The weighting approach adopted by Colmar Brunton Social Research is used by the ABS for its many population surveys and they always publish weighted results rather than raw data.
7.2 Error
All surveys are subject to errors. There are two main types of errors: sampling errors and non-sampling errors.
Sampling error The sampling error is the error that arises because not every single member of the population was included in the survey. If different demographic or attitudinal groups are included in the sample in a different proportion to their incidence rate in the population, the sample can be skewed and unrepresentative. Colmar Brunton randomly samples to minimise the likelihood of this happening.
Naturally it is simply not feasible to survey the whole population to avoid this type of error. One can, however, estimate how big this error component is, using statistical theory. This theory indicates that with a sample of 1,000 people from a population of 100,000 people or more, the maximum margin of sampling error on an estimate of a proportion is 3.1%.
The margin of error associated with this survey is +/- 1.5%, given a 95% confidence level. For example, if 50% of customers surveyed indicated they had experienced a degree of difficulty interpreting electricity billing information over the past 12 months, we could be 95% sure that the true incidence among the broader consumer market would be between 48.5% and 51.5%.
In all tables in this report, groups are compared to the total and where possible, differences are tested for statistical significance at the 95% confidence level.
Non-sampling error All surveys, regardless of whether they are samples or censuses, are subject to other types of error called non-sampling error. Non-sampling error includes things like interviewer keying errors and respondents misunderstanding a question.
Every attempt has been made to minimise the non-sampling error in this study. For example, use of Computer Assisted Telephone Interviewing (CATI) for the particularly target audiences reduces the number of keying errors and ensures interviewers ask the right questions. However, some types of
ACCC0007_Retail Electricity_Final Report_140618 95
error are out of the control of the researcher. In particular, the study is reliant on accurate reporting of behaviours and views by respondents. For example, a respondent may not remember details of bill payments in the 15 months prior to the survey.
ACCC0007_Retail Electricity_Final Report_140618 96
8. Appendix B: Questionnaire
SURVEY EMAIL INVITATION SUBJECT: Have your say on important electricity matters Dear [FIRSTNAME], Colmar Brunton and the Online Research Unit (ORU) have been engaged by the Australian Competition and Consumer Commission (ACCC) to undertake an online survey on their behalf as part of the Retail Electricity Pricing Inquiry. The purpose of collecting this information is to examine what consumers are paying for electricity. The ACCC wants to know what households are paying for electricity and how household experiences with energy retailers may differ. This will help the ACCC identify possible options to improve the day to day experience of households when it comes to choosing and buying electricity services. You have been randomly selected and invited to undertake this 15 minute survey. If you choose to participate, please be assured that the information and opinions you provide will be used only for research purposes. Results will be aggregated in the report and you will not be identified in any way. You will need to have a recent electricity bill from your current address with you, as you will need to locate and enter details from this into the survey. This includes the electricity company name, account name, supply address, the national metering identifier (NMI) and the account number or customer number. How do you know the survey is legitimate? You can check the survey is genuine by consulting the privacy and information policies page of the ACCC website [link was inserted here] or by calling the ACCC project contact [ACCC contact name and phone number inserted here]. Although we are conducting this survey on the ACCC’s behalf, you can be assured we are legally bound by the same privacy and secrecy obligations that apply to the ACCC. We are also bound by the Code of Professional Behaviour of the Australian Market and Social Research Society. To access the survey, click on the link below, or copy and paste this into your browser. [INSERT SURVEY LINK] The survey will remain open for completion until midnight on Wednesday, 14 March. If you have any technical difficulties in accessing the survey, please contact the ORU at [email protected]. Thanks in advance for your contribution to this important study. Regards, Colmar Brunton & the Online Research Unit

ACCC0007_Retail Electricity_Final Report_140618 97
SURVEY INTRODUCTION – THIS IS THE FIRST PAGE OF THE SCRIPTED SURVEY Thank you for agreeing to participate in this online survey. The survey will take about 15 minutes of your time to complete and is completely confidential and anonymous. Please read each question and follow the instructions to record your reply. You will need to have a recent electricity bill from your current address with you, as you will need to locate and enter details from this into the survey. This includes the electricity company name, account name, supply address, the national metering identifier (NMI) and the account number or customer number. Please DO NOT USE the ‘Back’ and ‘Forward’ buttons in the browser. Please use the button(s) at the bottom of each screen. If you would like to pause the survey to return to it later, simply close the window and click on the original link to return. You will return to where you were up to. SECTION A. SCREENER QUESTIONS (DO NOT DISPLAY) Firstly, a few questions to check if you qualify for the survey. S1 ACCT HOLDER (DO NOT DISPLAY) S1. Is your name on the electricity bill your household receives? Please select one. Please note: We are referring to your primary residence for the purpose of this survey.
CODE SELECT ONE RESPONSE ONLY SEQUENCE INSTRUCTION
01 Yes CONTINUE, GO TO S4
02 No CONTINUE, GO
TO S2 99 Don’t know ASK IF S1 = CODES 02 OR 99: S2 ALT ACCT HOLDER (DO NOT DISPLAY) S2. We need to conduct the survey with someone in the household who has their name on the electricity bill that the household receives. Would it be possible for this person to complete the survey? Please select one.
CODE SELECT ONE RESPONSE ONLY SEQUENCE INSTRUCTION
01 Yes CONTINUE, GO TO S3
02 No TERMINATE
99 Don’t know

ACCC0007_Retail Electricity_Final Report_140618 98
ASK IF S2 = CODE 01 S3 CONFIRM ACCT HOLDER (DO NOT DISPLAY) S3. Thank you for your interest in this survey. Colmar Brunton and the Online Research Unit (ORU) have been engaged by the Australian Competition and Consumer Commission (ACCC) to undertake an online survey on their behalf as part of the Retail Electricity Pricing Inquiry. The purpose of collecting this information is to examine what consumers are paying for electricity. Can I please confirm that your name is on the electricity bill your household receives? Please select one.
CODE SELECT ONE RESPONSE ONLY SEQUENCE INSTRUCTION
01 Yes CONTINUE, GO TO S4
02 No TERMINATE
99 Don’t know ASK IF S3 = CODE 01 S4 ELEC BILL (DO NOT DISPLAY) S4. Do you have a bill from an electricity retailer for your current address? Please note: We are referring to your primary residence for the purpose of this survey.
CODE SELECT ONE RESPONSE ONLY SEQUENCE INSTRUCTION
01 Yes CONTINUE, GO TO S5
02 No TERMINATE
99 Don’t know ASK IF S4 = CODE 01 S5 MOVED (DO NOT DISPLAY) S5. Have you moved since December 2016 (i.e. lived at another address apart from your current address)? Please note: For the purpose of this survey please only refer to moves which would relate to your primary address.
CODE SELECT ONE RESPONSE ONLY SEQUENCE INSTRUCTION
01 Yes CONTINUE, GO TO S6
02 No CONTINUE, GO TO S7
99 Don’t know TERMINATE

ACCC0007_Retail Electricity_Final Report_140618 99
ASK IF S5 = CODE 01 S6 INTERSTATE (DO NOT DISPLAY) S6. Did you move interstate?
CODE SELECT ONE RESPONSE ONLY SEQUENCE INSTRUCTION
01 Yes TERMINATE
02 No CONTINUE, GO TO S7
99 Don’t know TERMINATE ASK IF S5 = CODE 02 S7 CONSENT (DO NOT DISPLAY) S7. This survey is being conducted by Colmar Brunton on behalf of the Australian Competition and Consumer Commission’s (ACCC) Retail Electricity Pricing Inquiry. This is a voluntary survey. Information you provide in this survey will be used to obtain information from your current and previous electricity retailers relating to your usage, tariffs, charges, concessions, discounts and whether or not you have participated in a hardship program (your electricity information). Your electricity information will be combined with your survey responses and analysed to understand what consumers in the National Electricity Market are paying for electricity. Findings from the survey will be published in aggregate and personal details of participants will not be disclosed as part of the ACCC’s Retail Electricity Pricing Inquiry. By participating in this survey you are consenting to:
- The ACCC disclosing your personal information to your current or previous electricity retailer for the purpose of obtaining your electricity information
- Your current or previous electricity retailer disclosing your electricity information to the ACCC - Colmar Brunton using your survey response and your electricity information to prepare datasets
and reports, and provide the findings to the ACCC. Information obtained throughout the research may be made available to the Australian Energy Regulator (AER) for the purpose of the performance or exercise of its functions or powers. For general information on how the ACCC and AER handle information please refer the Privacy Policy and Information Policy on the ACCC website [link was inserted here].
CODE SELECT ONE RESPONSE ONLY SEQUENCE INSTRUCTION
01 Yes, I agree CONTINUE
02 No, I do not agree TERMINATE S8 GENDER (DO NOT DISPLAY) S8. Please indicate your gender. Please select one.
CODE SELECT ONE RESPONSE ONLY SEQUENCE INSTRUCTION
01 Male CONTINUE,
CHECK QUOTAS 02 Female

ACCC0007_Retail Electricity_Final Report_140618 100
S9 AGE (DO NOT DISPLAY) S9. Please indicate which of the following age groups you fall into. Please select one.
CODE SELECT ONE RESPONSE ONLY SEQUENCE INSTRUCTION
01 Under 18 years TERMINATE
02 18-24 years
CONTINUE, CHECK QUOTAS
03 25-29 years
04 30-34 years
05 35-39 years
06 40-44 years
07 45-49 years
08 50-54 years
09 55-59 years
10 60-64 years
11 65-74 years
12 75 years plus
S10A POSTCODE (DO NOT DISPLAY) S10A. Please indicate your current address postcode below. CHECK QUOTAS __________ FIELDWORK PROVIDER WILL THEN MATCH POSTCODE TO REGIONAL STATUS AND STATE S10B. REGION (DO NOT DISPLAY) S10B. FIELDWORK PROVIDER TO FILL OUT TABLE BELOW BASED ON POSTCODE
CODE SELECT ONE RESPONSE ONLY SEQUENCE INSTRUCTION
01 Metro
CONTINUE 02 Inner regional
03 Outer regional
04 Remote

ACCC0007_Retail Electricity_Final Report_140618 101
S10C. STATE (DO NOT DISPLAY) S10C. FIELDWORK PROVIDER TO FILL OUT TABLE BELOW BASED ON POSTCODE
CODE SELECT ONE RESPONSE ONLY SEQUENCE INSTRUCTION
01 Queensland
CONTINUE, CHECK QUOTAS
02 New South Wales
03 Victoria
04 Tasmania
05 South Australia
06 ACT
07 Western Australia
TERMINATE 08 Northern Territory
95 Outside of Australia

ACCC0007_Retail Electricity_Final Report_140618 102
To answer the following questions you will need to have a copy of a bill from your current electricity retailer at your current address. Q1 CURRENT RETAILER (DO NOT DISPLAY) Q1. What is the name of the company on the bill from your current electricity retailer at your current address? Please select one. PROGRAMMING INSTRUCTIONS: ONLY DISPLAY COMPANIES THAT ARE AVAILABLE IN EACH STATE. IF PARTICIPANT IS IN QLD (QS10 = CODE 01) DISPLAY CODES 01, 03, 04, 06, 08, 09, 10, 11, 12, 14, 15, 16, 17, 18, 19, 21, 23, 24, 25, 26, 27, 28, 29, 30 AND 96. IF PARTICIPANT IS IN NSW (QS10 = CODE 02) DISPLAY CODES 01, 02, 03, 04, 06, 07, 08, 09, 10, 12, 14, 15, 17, 18, 19, 21, 23, 24, 25, 26, 27, 28 AND 96. IF PARTICIPANT IS IN VIC (QS10 = CODE 03) DISPLAY CODES 01, 03, 04, 06, 07, 08, 09, 10, 12, 13, 15, 18, 19, 20, 21, 22, 23, 24, 25, 26, 27, 30, 31 AND 96. IF PARTICIPANT IS IN TAS (QS10 = CODE 04) DISPLAY CODES 05 AND 96. IF PARTICIPANT IS IN SA (QS10 = CODE 05) DISPLAY CODES 03, 04, 06, 08, 09, 10, 12, 15, 18, 19, 21, 22, 23, 24, 26, 27, 28, 29, 30 AND 96. IF PARTICIPANT IS IN ACT (QS10 = CODE 06) DISPLAY CODES 02, 10, 12, 18, 19, 21, 24, 27, 30 AND 96.
CODE SELECT ONE RESPONSE ONLY SEQUENCE INSTRUCTION
01 1st Energy
CONTINUE
02 ActewAGL
03 AGL
04 Alinta Energy
05 Aurora Energy
06 Click Energy
07 CovaU
08 Diamond Energy
09 Dodo & Commander (M2 Energy)
10 EnergyAustralia
11 Ergon Energy
12 ERM Business Energy/Power Retail
13 Globird
14 Locality Planning Energy
15 Lumo Energy
16 Metered Energy Holdings
17 Mojo
18 Momentum Energy
19 Next Business Energy
20 Online Power and Gas
21 Origin Energy
22 Pacific Hydro (Tango Energy)

ACCC0007_Retail Electricity_Final Report_140618 103
23 People Energy
24 Powerdirect
25 Powershop Australia
26 QEnergy
27 Red Energy
28 Sanctuary Energy
29 Savant Energy Power Networks
30 Simply Energy
31 Sumo Power
96 Other (Please specify) Q2 CURRENT BILL DETAILS (DO NOT DISPLAY) Q2. Looking at the bill from your current electricity retailer can you please provide the following information… The image on this screen provides assistance on where this information can be found. PROGRAMMING INSTRUCTION: THERE ARE 23 VARIATIONS OF THIS QUESTION BASED ON THE PDF DOCUMENTS THAT NEED TO BE IMBEDDED IN THE SURVEY SCRIPT. THE PDF IMAGES ARE LABELLED WITH THE RETAILERS NAME, IF THERE IS NO BILL FOR A PARTICULAR RETAILER PLEASE USE THE GENERIC BILL LABELLED ERM. PLEASE ALSO INCLUDE A LINK LABELLED ‘CLICK HERE TO VIEW THE IMAGE ON A NEW SCREEN’ WHICH ALLOWS RESPONDENTS TO VIEW THE BILL ON A SEPARATE SCREEN. Q2A ACC NAME (DO NOT DISPLAY) Q2A. The account name as stated on the bill
OPEN ENDED TEXT Q2B ADDRESS (DO NOT DISPLAY) Q2B. The supply address as stated on the bill PROGRAMMING INSTRUCTION: OPEN ENDED TEXT FIELDS AS FOLLOWS
ADDRESS LINE 1
ADDRESS LINE 2
ADDRESS LINE 3
SUBURB
STATE
POSTCODE [PROGRAMMING INSTRUCTION: FIELD REQUIRES 4 DIGITS]

ACCC0007_Retail Electricity_Final Report_140618 104
Q2C NMI (DO NOT DISPLAY) Q2C. The NMI / national metering identifier as stated on the bill. This is a 10 or 11 digit number. PROGRAMMING INSTRUCTION: THIS IS A 10 OR 11 DIGIT FIELD. PLEASE LIMIT FIELD TO 11 DIGITS.
OPEN ENDED TEXT Q2D CUSTOMER NO (DO NOT DISPLAY) Q2D. The account number / customer number as stated on the bill. PROGRAMMING INSTRUCTION: PLEASE LIMIT FIELD TO 15 DIGITS.
OPEN ENDED TEXT Q2E DOB (DO NOT DISPLAY) Q2E. Your date of birth in the format dd/mm/yyyy. PROGRAMMING INSTRUCTION: DOB NEEDS TO BE PROVIDED IN THE FORMAT DD/MM/YYYY. ALSO INCLUDE PREFER NOT TO PROVIDE MY DATE OF BIRTH OPTION.
OPEN ENDED TEXT PROGRAMMING INSTRUCTION: INCLUDE A ‘I DO NOT WISH TO PROVIDE THIS INFORMATION’ BUTTON AND THE FOLLOWING TEXT AT THE BOTTOM OF THE PAGE: Please note: This information forms an important part of the research the ACCC is undertaking as part of the Retail Electricity Pricing Inquiry. By selecting this option you will no longer be able to continue with the survey. Q2F RECONFIRM (DO NOT DISPLAY) Q2F. Can you please review the details you entered at the previous page and confirm that they are correct? ACCOUNT NAME: PROGRAMMING INSTRUCTION: DISPLAY ACCOUNT NAME PROVIDED AT Q2A SUPPLY ADDRESS: PROGRAMMING INSTRUCTION: DISPLAY ADDDRESS DETAILS IN THE FORMAT PROVIDED AT Q2B NATIONAL METERING IDENTIFIER (NMI): PROGRAMMING INSTRUCTION: DISPLAY NMI PROVIDED AT Q2C ACCOUNT NUMBER OR CUSTOMER NUMBER: PROGRAMMING INSTRUCTION: DISPLAY ACCOUNT NUMBER OR CUSTOMER NUMBER PROVIDED AT Q2D
CODE SELECT ONE RESPONSE ONLY SEQUENCE INSTRUCTION
01 Yes – all details are correct CONTINUE, GO TO S11
02 No – details are incorrect RETURN TO Q2

ACCC0007_Retail Electricity_Final Report_140618 105
S11 CONCESSIONS (DO NOT DISPLAY) S11. Do you have any of the following government concession cards? Please select all that apply. PROGRAMMING INSTRUCTIONS: ONLY DISPLAY CONCESSION TYPES THAT ARE AVAILABLE IN EACH STATE. IF PARTICIPANT IS IN QLD (QS10 = CODE 01) DISPLAY CODES 01, 02, 06 AND 07. IF PARTICIPANT IS IN NSW (QS10 = CODE 02) DISPLAY CODES 01, 02, 03 AND 06. IF PARTICIPANT IS IN VIC (QS10 = CODE 03) DISPLAY CODES 01, 02 AND 06. IF PARTICIPANT IS IN TAS (QS10 = CODE 04) DISPLAY CODES 01, 03, 06 AND 08. IF PARTICIPANT IS IN SA (QS10 = CODE 05) DISPLAY CODES 01, 02, 04 AND 05. IF PARTICIPANT IS IN ACT (QS10 = CODE 06) DISPLAY CODES 01, 02, 03 AND 05.
CODE SELECT ALL THAT APPLY SEQUENCE INSTRUCTION
01 Department of Human Services (DHS) Pensioner Concession Card
CONTINUE, CHECK QUOTAS
02 Department of Veterans' Affairs (DVA) Gold Card
03 Department of Veterans' Affairs (DVA) Pensioner Concession Card
04 DHS Seniors Health Care Card
05 DHS Low Income Health Care Card
06 DHS Health Care Card
07 Queensland Seniors Card
08 Tasmanian Concession Card
98 None of the above S12 INTERNET ACCESS (DO NOT DISPLAY) S12. Do you have access to the internet at home or on your telephone?
CODE SELECT ONE RESPONSE ONLY SEQUENCE INSTRUCTION
01 Yes CONTINUE,
CHECK QUOTAS 02 No S13 INTERNET USAGE (DO NOT DISPLAY) S13. Do you use the internet to… Please select all that apply.
CODE SELECT ALL THAT APPLY SEQUENCE INSTRUCTION
01 Compare goods and services
CONTINUE, CHECK QUOTAS
02 Purchase goods and services
03 Pay bills and/or do online banking
98 None of the above

ACCC0007_Retail Electricity_Final Report_140618 106
S14. PHYSICAL DISABILITY (DO NOT DISPLAY) S14. Do you personally or does anyone in your household have a physical disability? Please select all that apply.
CODE SELECT ALL THAT APPLY SEQUENCE INSTRUCTION
01 Yes – myself
CONTINUE, CHECK QUOTAS
02 Yes – someone else in the household
03 No
97 Prefer not to say S15. MENTALDISABILITY (DO NOT DISPLAY) S15. Do you personally or does anyone in your household have a mental disability? Please select all that apply.
CODE SELECT ALL THAT APPLY SEQUENCE INSTRUCTION
01 Yes – myself
CONTINUE, CHECK QUOTAS
02 Yes – someone else in the household
03 No
97 Prefer not to say S16. NO IN HOUSEHOLD (DO NOT DISPLAY) PROGRAMMING INSTRUCTION: ALLOW TWO DIGIT RESPONSE. PLEASE INCLUDE A TOTAL NUMBER OF PEOPLE IN HOUSEHOLD AND DO NOT ALLOW A 0 FOR THIS. ALSO DO NOT ALLOW A 0 FOR NUMBER OF PEOPLE IN HOUSEHOLD WHO ARE AGED 18 YEARS OR OVER.
ENTER NUMBER
A Including you, how many people live in your household who are aged 18 years or over?
B And how many people aged under 18 years live in your household?
TOTAL NUMBER OF PEOPLE IN THE HOUSEHOLD

ACCC0007_Retail Electricity_Final Report_140618 107
S17 HOUSEHOLD INCOME (DO NOT DISPLAY) S17. In which of the following ranges does your combined annual household income before tax fall? Please select one.
CODE SELECT ONE RESPONSE ONLY SEQUENCE INSTRUCTION
01 Less than $25,000 per year
CONTINUE, CHECK QUOTAS
02 Between $25,000 and $49,999 per year
03 Between $50,000 and $74,999 per year
04 Between $75,000 and $99,999 per year
05 Between $100,000 and $149,999 per year
06 $150,000 or more per year
97 Prefer not to say
99 Don’t know S18 HOUSING STATUS (DO NOT DISPLAY) S18. Which of the following applies to the home where you currently live? Please select one.
CODE SELECT ONE RESPONSE ONLY SEQUENCE INSTRUCTION
01 Private Rental
CONTINUE, CHECK QUOTAS
02 Public Rental
03 Own outright
04 Paying off mortgage
05 Living with friends or relatives in their property
96 Other (Please specify) S19 NESB (DO NOT DISPLAY) S19. Do you usually speak a language other than English at home? Please select one.
CODE SELECT ONE RESPONSE ONLY SEQUENCE INSTRUCTION
01 Yes CONTINUE,
CHECK QUOTAS AND GO TO S20
02 No CONTINUE, GO
TO S21 97 Prefer not to say

ACCC0007_Retail Electricity_Final Report_140618 108
S20 NESB LANGUAGE (DO NOT DISPLAY) S20. What is the main language, other than English, that you speak at home? Please select one.
CODE SELECT ONE RESPONSE ONLY SEQUENCE INSTRUCTION
01 Italian
CONTINUE
02 Greek
03 Cantonese
04 Arabic
05 Mandarin
06 Vietnamese
96 Other (Please specify)
97 Prefer not to say S21 ATSI (DO NOT DISPLAY) S21. Do you identify as Aboriginal or Torres Strait Islander? Please select one.
CODE SELECT ONE RESPONSE ONLY SEQUENCE INSTRUCTION
01 Yes - Aboriginal
CONTINUE 02 Yes - Torres Strait Islander
03 No
97 Prefer not to say IF UNSUCCESSFUL: Thank you for your patience in answering these questions. Unfortunately, we do not need you to participate in our research this time, but we sincerely appreciate your time and assistance. IF SUCCESSFUL, CONTINUE

ACCC0007_Retail Electricity_Final Report_140618 109
SECTION B. BODY OF THE QUESTIONNAIRE PREVIOUS PROPERTIES ASK IF S5 = CODE 01 Q3 NO OF MOVES (DO NOT DISPLAY) Q3. Previously you indicated that you have moved, how many times have you moved since December 2016?
CODE SELECT ONE RESPONSE ONLY SEQUENCE INSTRUCTION
01 Once
CONTINUE, GO TO Q3A
02 Twice
03 Three times
04 Four or more times Q3A ADDRESSES OF MOVES (DO NOT DISPLAY) Q3A. Please specify your previous [address/addresses]. PROGRAMMING INSTRUCTION: IF Q3 = CODE 01 SHOW TERM “ADDRESS” AND ONLY DISPLAY ONE ADDRESS FIELD AS PER BELOW. IF Q3 = CODES 02, 03 OR 04 SHOW TERM “ADDRESSES” AND DISPLAY APPROPRIATE NUMBER OF ADDRESS FIELDS (I.E. TWO ADDRESS FIELDS FOR CODE 02). Q3A-1. PREVIOUS ADDRESS 1 (DO NOT DISPLAY)
ADDRESS LINE 1
ADDRESS LINE 2
ADDRESS LINE 3
SUBURB
STATE
POSTCODE [PROGRAMMING INSTRUCTION: FIELD REQUIRES 4 DIGITS] And the address before that? Q3A-2. PREVIOUS ADDRESS 2 (DO NOT DISPLAY)
ADDRESS LINE 1
ADDRESS LINE 2
ADDRESS LINE 3
SUBURB
STATE
POSTCODE [PROGRAMMING INSTRUCTION: FIELD REQUIRES 4 DIGITS]

ACCC0007_Retail Electricity_Final Report_140618 110
And the address before that? Q3A-3.PREVIOUS ADDRESS 3 (DO NOT DISPLAY)
ADDRESS LINE 1
ADDRESS LINE 2
ADDRESS LINE 3
SUBURB
STATE
POSTCODE [PROGRAMMING INSTRUCTION: FIELD REQUIRES 4 DIGITS] And the address before that? Q3A-4. PREVIOUS ADDRESS 4 (DO NOT DISPLAY)
ADDRESS LINE 1
ADDRESS LINE 2
ADDRESS LINE 3
SUBURB
STATE
POSTCODE [PROGRAMMING INSTRUCTION: FIELD REQUIRES 4 DIGITS] Q4A REMOVED

ACCC0007_Retail Electricity_Final Report_140618 111
ASK IF Q3A-1 CONTAINS ADDRESS DETAILS Q4B PREVIOUS RETAILER 1 (DO NOT DISPLAY) Q4B. What is the name of the electricity retailer you used at your [INSERT ADDRESS LINE 1, ADDRESS LINE 2 AND ADDRESS LINE 3 FROM PREVIOUS ADDRESS Q3A-1] address? Please select one. PROGRAMMING INSTRUCTIONS: ONLY DISPLAY COMPANIES THAT ARE AVAILABLE IN EACH STATE. IF PARTICIPANT IS IN QLD (QS10 = CODE 01) DISPLAY CODES 01, 03, 04, 06, 08, 09, 10, 11, 12, 14, 15, 16, 17, 18, 19, 21, 23, 24, 25, 26, 27, 28, 29, 30 AND 96. IF PARTICIPANT IS IN NSW (QS10 = CODE 02) DISPLAY CODES 01, 02, 03, 04, 06, 07, 08, 09, 10, 12, 14, 15, 17, 18, 19, 21, 23, 24, 25, 26, 27, 28 AND 96. IF PARTICIPANT IS IN VIC (QS10 = CODE 03) DISPLAY CODES 01, 03, 04, 06, 07, 08, 09, 10, 12, 13, 15, 18, 19, 20, 21, 22, 23, 24, 25, 26, 27, 30, 31 AND 96. IF PARTICIPANT IS IN TAS (QS10 = CODE 04) DISPLAY CODES 05 AND 96. IF PARTICIPANT IS IN SA (QS10 = CODE 05) DISPLAY CODES 03, 04, 06, 08, 09, 10, 12, 15, 18, 19, 21, 22, 23, 24, 26, 27, 28, 29, 30 AND 96. IF PARTICIPANT IS IN ACT (QS10 = CODE 06) DISPLAY CODES 02, 10, 12, 18, 19, 21, 24, 27, 30 AND 96.
CODE SELECT ONE RESPONSE ONLY SEQUENCE INSTRUCTION
01 1st Energy
CONTINUE
02 ActewAGL
03 AGL
04 Alinta Energy
05 Aurora Energy
06 Click Energy
07 CovaU
08 Diamond Energy
09 Dodo & Commander (M2 Energy)
10 EnergyAustralia
11 Ergon Energy
12 ERM Business Energy/Power Retail
13 Globird
14 Locality Planning Energy
15 Lumo Energy
16 Metered Energy Holdings
17 Mojo
18 Momentum Energy
19 Next Business Energy
20 Online Power and Gas
21 Origin Energy
22 Pacific Hydro (Tango Energy)
23 People Energy
24 Powerdirect

ACCC0007_Retail Electricity_Final Report_140618 112
25 Powershop Australia
26 QEnergy
27 Red Energy
28 Sanctuary Energy
29 Savant Energy Power Networks
30 Simply Energy
31 Sumo Power
96 Other (Please specify)
99 Don’t know ASK IF Q3A-1 CONTAINS ADDRESS DETAILS Q4C PREVIOUS ACC HOLDER 1 (DO NOT DISPLAY) Q4C. Were you the account holder at this address? Please select one.
CODE SELECT ONE RESPONSE ONLY SEQUENCE INSTRUCTION
01 Yes CONTINUE, GO TO Q4E
02 No CONTINUE, GO
TO Q5B 99 Don’t know Q4D REMOVED ASK IF Q4C = CODE 01 Q4E PREVIOUS NMI 1 (DO NOT DISPLAY) Q4E. Can you provide the NMI / national metering identifier for this address? PROGRAMMING INSTRUCTION: THIS IS A 10 OR 11 DIGIT FIELD. PLEASE LIMIT FIELD TO 11 DIGITS. ALSO INCLUDE A DON’T KNOW OPTION.
OPEN ENDED TEXT ASK IF Q4C = CODE 01 Q4F PREVIOUS CUSTOMER NO 1 (DO NOT DISPLAY) Q4F. Can you provide the account number / customer number for this address? PROGRAMMING INSTRUCTION: PLEASE LIMIT FIELD TO 15 DIGITS. ALSO INCLUDE A DON’T KNOW OPTION.
OPEN ENDED TEXT Q5A REMOVED

ACCC0007_Retail Electricity_Final Report_140618 113
ASK IF Q3A-2 CONTAINS ADDRESS DETAILS Q5B PREVIOUS RETAILER 2 (DO NOT DISPLAY) Q5B. What is the name of the electricity retailer you used at your [INSERT ADDRESS LINE 1, ADDRESS LINE 2 AND ADDRESS LINE 3 FROM PREVIOUS ADDRESS AT Q3A-2] address? Please select one. PROGRAMMING INSTRUCTIONS: ONLY DISPLAY COMPANIES THAT ARE AVAILABLE IN EACH STATE. IF PARTICIPANT IS IN QLD (QS10 = CODE 01) DISPLAY CODES 01, 03, 04, 06, 08, 09, 10, 11, 12, 14, 15, 16, 17, 18, 19, 21, 23, 24, 25, 26, 27, 28, 29, 30 AND 96. IF PARTICIPANT IS IN NSW (QS10 = CODE 02) DISPLAY CODES 01, 02, 03, 04, 06, 07, 08, 09, 10, 12, 14, 15, 17, 18, 19, 21, 23, 24, 25, 26, 27, 28 AND 96. IF PARTICIPANT IS IN VIC (QS10 = CODE 03) DISPLAY CODES 01, 03, 04, 06, 07, 08, 09, 10, 12, 13, 15, 18, 19, 20, 21, 22, 23, 24, 25, 26, 27, 30, 31 AND 96. IF PARTICIPANT IS IN TAS (QS10 = CODE 04) DISPLAY CODES 05 AND 96. IF PARTICIPANT IS IN SA (QS10 = CODE 05) DISPLAY CODES 03, 04, 06, 08, 09, 10, 12, 15, 18, 19, 21, 22, 23, 24, 26, 27, 28, 29, 30 AND 96. IF PARTICIPANT IS IN ACT (QS10 = CODE 06) DISPLAY CODES 02, 10, 12, 18, 19, 21, 24, 27, 30 AND 96.
CODE SELECT ONE RESPONSE ONLY SEQUENCE INSTRUCTION
01 1st Energy
CONTINUE
02 ActewAGL
03 AGL
04 Alinta Energy
05 Aurora Energy
06 Click Energy
07 CovaU
08 Diamond Energy
09 Dodo & Commander (M2 Energy)
10 EnergyAustralia
11 Ergon Energy
12 ERM Business Energy/Power Retail
13 Globird
14 Locality Planning Energy
15 Lumo Energy
16 Metered Energy Holdings
17 Mojo
18 Momentum Energy
19 Next Business Energy
20 Online Power and Gas
21 Origin Energy
22 Pacific Hydro (Tango Energy)
23 People Energy
24 Powerdirect

ACCC0007_Retail Electricity_Final Report_140618 114
25 Powershop Australia
26 QEnergy
27 Red Energy
28 Sanctuary Energy
29 Savant Energy Power Networks
30 Simply Energy
31 Sumo Power
96 Other (Please specify)
99 Don’t know ASK IF Q3A-2 CONTAINS ADDRESS DETAILS Q5C PREVIOUS ACC HOLDER 2 (DO NOT DISPLAY) Q5C. Were you the account holder at this address? Please select one.
CODE SELECT ONE RESPONSE ONLY SEQUENCE INSTRUCTION
01 Yes CONTINUE, GO TO Q5E
02 No CONTINUE, GO
TO Q6B 99 Don’t know Q5D REMOVED ASK IF Q5C = CODE 01 Q5E PREVIOUS NMI 2 (DO NOT DISPLAY) Q5E. Can you provide the NMI / national metering identifier for this previous address? PROGRAMMING INSTRUCTION: THIS IS A 10 OR 11 DIGIT FIELD. PLEASE LIMIT FIELD TO 11 DIGITS. ALSO INCLUDE A DON’T KNOW OPTION.
OPEN ENDED TEXT ASK IF Q5C = CODE 01 Q5F PREVIOUS CUSTOMER NO 2 (DO NOT DISPLAY) Q5F. Can you provide the account number / customer number for this previous address? PROGRAMMING INSTRUCTION: PLEASE LIMIT FIELD TO 15 DIGITS. ALSO INCLUDE A DON’T KNOW OPTION.
OPEN ENDED TEXT Q6A REMOVED

ACCC0007_Retail Electricity_Final Report_140618 115
ASK IF Q3A-3 CONTAINS ADDRESS DETAILS Q6B PREVIOUS RETAILER 3 (DO NOT DISPLAY) Q6B. What is the name of the electricity retailer you used at your [INSERT ADDRESS LINE 1, ADDRESS LINE 2 AND ADDRESS LINE 3 FROM PREVIOUS ADDRESS Q3A-3] address? Please select one. PROGRAMMING INSTRUCTIONS: ONLY DISPLAY COMPANIES THAT ARE AVAILABLE IN EACH STATE. IF PARTICIPANT IS IN QLD (QS10 = CODE 01) DISPLAY CODES 01, 03, 04, 06, 08, 09, 10, 11, 12, 14, 15, 16, 17, 18, 19, 21, 23, 24, 25, 26, 27, 28, 29, 30 AND 96. IF PARTICIPANT IS IN NSW (QS10 = CODE 02) DISPLAY CODES 01, 02, 03, 04, 06, 07, 08, 09, 10, 12, 14, 15, 17, 18, 19, 21, 23, 24, 25, 26, 27, 28 AND 96. IF PARTICIPANT IS IN VIC (QS10 = CODE 03) DISPLAY CODES 01, 03, 04, 06, 07, 08, 09, 10, 12, 13, 15, 18, 19, 20, 21, 22, 23, 24, 25, 26, 27, 30, 31 AND 96. IF PARTICIPANT IS IN TAS (QS10 = CODE 04) DISPLAY CODES 05 AND 96. IF PARTICIPANT IS IN SA (QS10 = CODE 05) DISPLAY CODES 03, 04, 06, 08, 09, 10, 12, 15, 18, 19, 21, 22, 23, 24, 26, 27, 28, 29, 30 AND 96. IF PARTICIPANT IS IN ACT (QS10 = CODE 06) DISPLAY CODES 02, 10, 12, 18, 19, 21, 24, 27, 30 AND 96.
CODE SELECT ONE RESPONSE ONLY SEQUENCE INSTRUCTION
01 1st Energy
CONTINUE
02 ActewAGL
03 AGL
04 Alinta Energy
05 Aurora Energy
06 Click Energy
07 CovaU
08 Diamond Energy
09 Dodo & Commander (M2 Energy)
10 EnergyAustralia
11 Ergon Energy
12 ERM Business Energy/Power Retail
13 Globird
14 Locality Planning Energy
15 Lumo Energy
16 Metered Energy Holdings
17 Mojo
18 Momentum Energy
19 Next Business Energy
20 Online Power and Gas
21 Origin Energy
22 Pacific Hydro (Tango Energy)
23 People Energy
24 Powerdirect

ACCC0007_Retail Electricity_Final Report_140618 116
25 Powershop Australia
26 QEnergy
27 Red Energy
28 Sanctuary Energy
29 Savant Energy Power Networks
30 Simply Energy
31 Sumo Power
96 Other (Please specify)
99 Don’t know ASK IF Q3A-3 CONTAINS ADDRESS DETAILS Q6C PREVIOUS ACC HOLDER 3 (DO NOT DISPLAY) Q6C. Were you the account holder at this previous address? Please select one.
CODE SELECT ONE RESPONSE ONLY SEQUENCE INSTRUCTION
01 Yes CONTINUE, GO TO Q6E
02 No CONTINUE, GO
TO Q7A 99 Don’t know Q6D REMOVED ASK IF Q6C = CODE 01 Q6E PREVIOUS NMI 3 (DO NOT DISPLAY) Q6E. Can you provide the NMI / national metering identifier for this previous address? PROGRAMMING INSTRUCTION: THIS IS A 10 OR 11 DIGIT FIELD. PLEASE LIMIT FIELD TO 11 DIGITS. ALSO INCLUDE A DON’T KNOW OPTION.
OPEN ENDED TEXT ASK IF Q6C = CODE 01 Q6F PREVIOUS CUSTOMER NO 3 (DO NOT DISPLAY) Q6F. Can you provide the account number / customer number for this previous address? PROGRAMMING INSTRUCTION: PLEASE LIMIT FIELD TO 15 DIGITS. ALSO INCLUDE A DON’T KNOW OPTION.
OPEN ENDED TEXT Q7A REMOVED

ACCC0007_Retail Electricity_Final Report_140618 117
ASK IF Q3A-4 CONTAINS ADDRESS DETAILS Q7B PREVIOUS RETAILER 4 (DO NOT DISPLAY) Q7B. What is the name of the electricity retailer you used at your [INSERT ADDRESS LINE 1, ADDRESS LINE 2 AND ADDRESS LINE 3 FROM PREVIOUS ADDRESS Q3A-4] address? Please select one. PROGRAMMING INSTRUCTIONS: ONLY DISPLAY COMPANIES THAT ARE AVAILABLE IN EACH STATE. IF PARTICIPANT IS IN QLD (QS10 = CODE 01) DISPLAY CODES 01, 03, 04, 06, 08, 09, 10, 11, 12, 14, 15, 16, 17, 18, 19, 21, 23, 24, 25, 26, 27, 28, 29, 30 AND 96. IF PARTICIPANT IS IN NSW (QS10 = CODE 02) DISPLAY CODES 01, 02, 03, 04, 06, 07, 08, 09, 10, 12, 14, 15, 17, 18, 19, 21, 23, 24, 25, 26, 27, 28 AND 96. IF PARTICIPANT IS IN VIC (QS10 = CODE 03) DISPLAY CODES 01, 03, 04, 06, 07, 08, 09, 10, 12, 13, 15, 18, 19, 20, 21, 22, 23, 24, 25, 26, 27, 30, 31 AND 96. IF PARTICIPANT IS IN TAS (QS10 = CODE 04) DISPLAY CODES 05 AND 96. IF PARTICIPANT IS IN SA (QS10 = CODE 05) DISPLAY CODES 03, 04, 06, 08, 09, 10, 12, 15, 18, 19, 21, 22, 23, 24, 26, 27, 28, 29, 30 AND 96. IF PARTICIPANT IS IN ACT (QS10 = CODE 06) DISPLAY CODES 02, 10, 12, 18, 19, 21, 24, 27, 30 AND 96.
CODE SELECT ONE RESPONSE ONLY SEQUENCE INSTRUCTION
01 1st Energy
CONTINUE
02 ActewAGL
03 AGL
04 Alinta Energy
05 Aurora Energy
06 Click Energy
07 CovaU
08 Diamond Energy
09 Dodo & Commander (M2 Energy)
10 EnergyAustralia
11 Ergon Energy
12 ERM Business Energy/Power Retail
13 Globird
14 Locality Planning Energy
15 Lumo Energy
16 Metered Energy Holdings
17 Mojo
18 Momentum Energy
19 Next Business Energy
20 Online Power and Gas
21 Origin Energy
22 Pacific Hydro (Tango Energy)
23 People Energy
24 Powerdirect

ACCC0007_Retail Electricity_Final Report_140618 118
25 Powershop Australia
26 QEnergy
27 Red Energy
28 Sanctuary Energy
29 Savant Energy Power Networks
30 Simply Energy
31 Sumo Power
96 Other (Please specify)
99 Don’t know ASK IF Q3A-3 CONTAINS ADDRESS DETAILS Q7C PREVIOUS ACC HOLDER 4 (DO NOT DISPLAY) Q7C. Were you the account holder at this previous address? Please select one.
CODE SELECT ONE RESPONSE ONLY SEQUENCE INSTRUCTION
01 Yes CONTINUE, GO TO Q7E
02 No CONTINUE, GO
TO Q8 99 Don’t know Q7D REMOVED ASK IF Q7C = CODE 01 Q7E PREVIOUS NMI 4 (DO NOT DISPLAY) Q7E. Can you provide the NMI / national metering identifier for this previous address? PROGRAMMING INSTRUCTION: THIS IS A 10 OR 11 DIGIT FIELD. PLEASE LIMIT FIELD TO 11 DIGITS. ALSO INCLUDE A DON’T KNOW OPTION.
OPEN ENDED TEXT ASK IF Q7C = CODE 01 Q7F PREVIOUS CUSTOMER NO 4 (DO NOT DISPLAY) Q7F. Can you provide the account number / customer number for this previous address? PROGRAMMING INSTRUCTION: PLEASE LIMIT FIELD TO 15 DIGITS. ALSO INCLUDE A DON’T KNOW OPTION.
OPEN ENDED TEXT

ACCC0007_Retail Electricity_Final Report_140618 119
SWITCHING Q8 SWITCHING Q8. While living at your current address have you switched electricity retailers since December 2016? Please select one. Please note: We are referring to your primary residence for the purpose of this survey
CODE SELECT ONE RESPONSE ONLY SEQUENCE INSTRUCTION
01 Yes CONTINUE, GO TO Q9
02 No CONTINUE, GO
TO Q14 99 Don’t know Q9. How many times have you switched electricity retailers while living at your current address since December 2016? Please select one.
CODE SELECT ONE RESPONSE ONLY SEQUENCE
INSTRUCTION 01 Once
CONTINUE, GO TO Q10A
02 Twice
03 Three times
04 Four or more times
99 Don’t know CONTINUE, GO TO Q14
ASK IF Q3 = CODES 01, 02, 03 OR 04 Q10A SWITCH 1 Q10A. Can you recall the name of the previous electricity retailer? Please select one.
CODE SELECT ONE RESPONSE ONLY SEQUENCE INSTRUCTION
01 Yes CONTINUE, GO TO Q10B
02 No CONTINUE, GO
TO Q11A 99 Don’t know

ACCC0007_Retail Electricity_Final Report_140618 120
ASK IF Q10A = CODE 01 Q10B PREVIOUS RETAILER 1 (DO NOT DISPLAY) Q10B. What is the name of the previous electricity retailer? Please select one. PROGRAMMING INSTRUCTIONS: ONLY DISPLAY COMPANIES THAT ARE AVAILABLE IN EACH STATE. IF PARTICIPANT IS IN QLD (QS10 = CODE 01) DISPLAY CODES 01, 03, 04, 06, 08, 09, 10, 11, 12, 14, 15, 16, 17, 18, 19, 21, 23, 24, 25, 26, 27, 28, 29, 30 AND 96. IF PARTICIPANT IS IN NSW (QS10 = CODE 02) DISPLAY CODES 01, 02, 03, 04, 06, 07, 08, 09, 10, 12, 14, 15, 17, 18, 19, 21, 23, 24, 25, 26, 27, 28 AND 96. IF PARTICIPANT IS IN VIC (QS10 = CODE 03) DISPLAY CODES 01, 03, 04, 06, 07, 08, 09, 10, 12, 13, 15, 18, 19, 20, 21, 22, 23, 24, 25, 26, 27, 30, 31 AND 96. IF PARTICIPANT IS IN TAS (QS10 = CODE 04) DISPLAY CODES 05 AND 96. IF PARTICIPANT IS IN SA (QS10 = CODE 05) DISPLAY CODES 03, 04, 06, 08, 09, 10, 12, 15, 18, 19, 21, 22, 23, 24, 26, 27, 28, 29, 30 AND 96. IF PARTICIPANT IS IN ACT (QS10 = CODE 06) DISPLAY CODES 02, 10, 12, 18, 19, 21, 24, 27, 30 AND 96.
CODE SELECT ONE RESPONSE ONLY SEQUENCE INSTRUCTION
01 1st Energy
CONTINUE
02 ActewAGL
03 AGL
04 Alinta Energy
05 Aurora Energy
06 Click Energy
07 CovaU
08 Diamond Energy
09 Dodo & Commander (M2 Energy)
10 EnergyAustralia
11 Ergon Energy
12 ERM Business Energy/Power Retail
13 Globird
14 Locality Planning Energy
15 Lumo Energy
16 Metered Energy Holdings
17 Mojo
18 Momentum Energy
19 Next Business Energy
20 Online Power and Gas
21 Origin Energy
22 Pacific Hydro (Tango Energy)
23 People Energy
24 Powerdirect
25 Powershop Australia

ACCC0007_Retail Electricity_Final Report_140618 121
26 QEnergy
27 Red Energy
28 Sanctuary Energy
29 Savant Energy Power Networks
30 Simply Energy
31 Sumo Power
96 Other (Please specify)
99 Don’t know ASK IF Q10A = CODE 01 Q10C SWITCH ACC HOLDER 1 (DO NOT DISPLAY) Q10C. Were you the account holder with this previous electricity retailer? Please select one.
CODE SELECT ONE RESPONSE ONLY SEQUENCE INSTRUCTION
01 Yes CONTINUE, GO
TO Q11A 02 No
99 Don’t know ASK IF Q9 = CODES 02, 03 OR 04 Q11A SWITCH 2 Q11A. Can you recall the name of the electricity retailer before that? Please select one.
CODE SELECT ONE RESPONSE ONLY SEQUENCE INSTRUCTION
01 Yes CONTINUE, GO TO Q11B
02 No CONTINUE, GO
TO Q12A 99 Don’t know
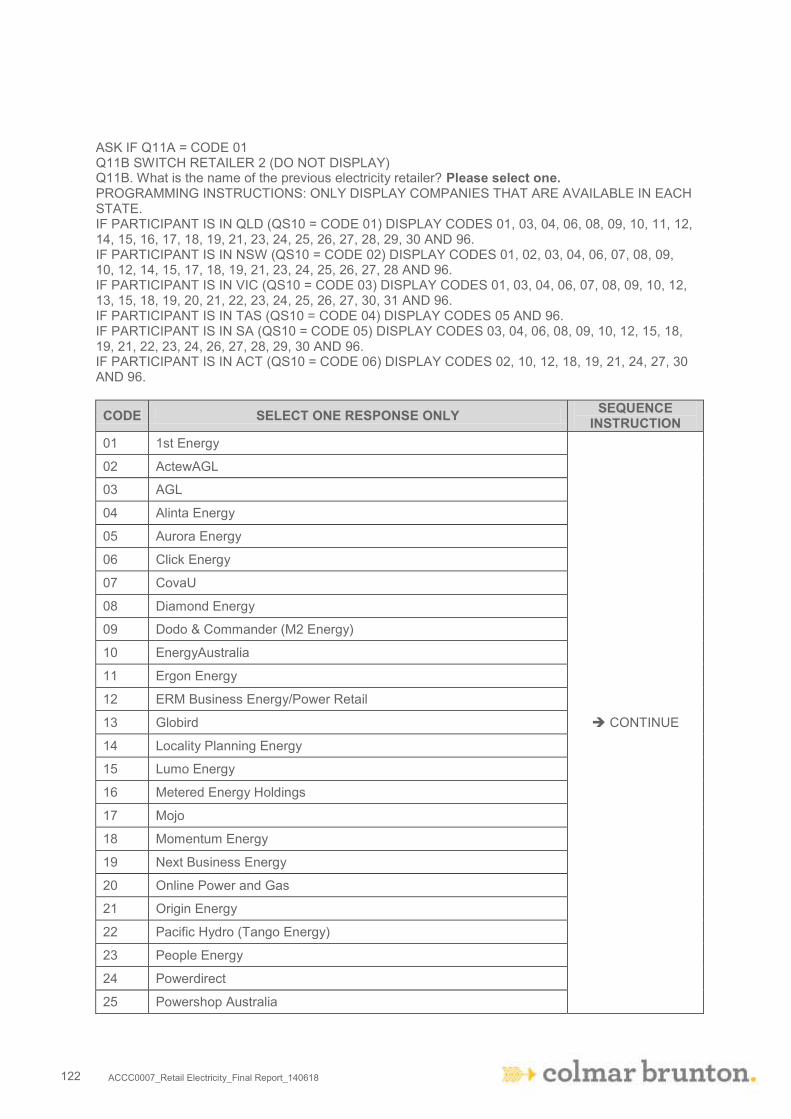
ACCC0007_Retail Electricity_Final Report_140618 122
ASK IF Q11A = CODE 01 Q11B SWITCH RETAILER 2 (DO NOT DISPLAY) Q11B. What is the name of the previous electricity retailer? Please select one. PROGRAMMING INSTRUCTIONS: ONLY DISPLAY COMPANIES THAT ARE AVAILABLE IN EACH STATE. IF PARTICIPANT IS IN QLD (QS10 = CODE 01) DISPLAY CODES 01, 03, 04, 06, 08, 09, 10, 11, 12, 14, 15, 16, 17, 18, 19, 21, 23, 24, 25, 26, 27, 28, 29, 30 AND 96. IF PARTICIPANT IS IN NSW (QS10 = CODE 02) DISPLAY CODES 01, 02, 03, 04, 06, 07, 08, 09, 10, 12, 14, 15, 17, 18, 19, 21, 23, 24, 25, 26, 27, 28 AND 96. IF PARTICIPANT IS IN VIC (QS10 = CODE 03) DISPLAY CODES 01, 03, 04, 06, 07, 08, 09, 10, 12, 13, 15, 18, 19, 20, 21, 22, 23, 24, 25, 26, 27, 30, 31 AND 96. IF PARTICIPANT IS IN TAS (QS10 = CODE 04) DISPLAY CODES 05 AND 96. IF PARTICIPANT IS IN SA (QS10 = CODE 05) DISPLAY CODES 03, 04, 06, 08, 09, 10, 12, 15, 18, 19, 21, 22, 23, 24, 26, 27, 28, 29, 30 AND 96. IF PARTICIPANT IS IN ACT (QS10 = CODE 06) DISPLAY CODES 02, 10, 12, 18, 19, 21, 24, 27, 30 AND 96.
CODE SELECT ONE RESPONSE ONLY SEQUENCE INSTRUCTION
01 1st Energy
CONTINUE
02 ActewAGL
03 AGL
04 Alinta Energy
05 Aurora Energy
06 Click Energy
07 CovaU
08 Diamond Energy
09 Dodo & Commander (M2 Energy)
10 EnergyAustralia
11 Ergon Energy
12 ERM Business Energy/Power Retail
13 Globird
14 Locality Planning Energy
15 Lumo Energy
16 Metered Energy Holdings
17 Mojo
18 Momentum Energy
19 Next Business Energy
20 Online Power and Gas
21 Origin Energy
22 Pacific Hydro (Tango Energy)
23 People Energy
24 Powerdirect
25 Powershop Australia

ACCC0007_Retail Electricity_Final Report_140618 123
26 QEnergy
27 Red Energy
28 Sanctuary Energy
29 Savant Energy Power Networks
30 Simply Energy
31 Sumo Power
96 Other (Please specify)
99 Don’t know ASK IF Q11A = CODE 01 Q11C SWITCH ACC HOLDER 2 (DO NOT DISPLAY) Q11C. Were you the account holder with this previous electricity retailer? Please select one.
CODE SELECT ONE RESPONSE ONLY SEQUENCE INSTRUCTION
01 Yes CONTINUE, GO
TO Q12A 02 No
99 Don’t know ASK IF Q9 = CODES 03 OR 04 Q12A SWITCH 3 Q12A. Can you recall the name of the electricity retailer before that? Please select one.
CODE SELECT ONE RESPONSE ONLY SEQUENCE INSTRUCTION
01 Yes CONTINUE, GO TO Q12B
02 No CONTINUE, GO
TO Q13A 99 Don’t know

ACCC0007_Retail Electricity_Final Report_140618 124
ASK IF Q12A = CODE 01 Q12B SWITCH RETAILER 3 (DO NOT DISPLAY) Q12B. What is the name of the previous electricity retailer? Please select one. PROGRAMMING INSTRUCTIONS: ONLY DISPLAY COMPANIES THAT ARE AVAILABLE IN EACH STATE. IF PARTICIPANT IS IN QLD (QS10 = CODE 01) DISPLAY CODES 01, 03, 04, 06, 08, 09, 10, 11, 12, 14, 15, 16, 17, 18, 19, 21, 23, 24, 25, 26, 27, 28, 29, 30 AND 96. IF PARTICIPANT IS IN NSW (QS10 = CODE 02) DISPLAY CODES 01, 02, 03, 04, 06, 07, 08, 09, 10, 12, 14, 15, 17, 18, 19, 21, 23, 24, 25, 26, 27, 28 AND 96. IF PARTICIPANT IS IN VIC (QS10 = CODE 03) DISPLAY CODES 01, 03, 04, 06, 07, 08, 09, 10, 12, 13, 15, 18, 19, 20, 21, 22, 23, 24, 25, 26, 27, 30, 31 AND 96. IF PARTICIPANT IS IN TAS (QS10 = CODE 04) DISPLAY CODES 05 AND 96. IF PARTICIPANT IS IN SA (QS10 = CODE 05) DISPLAY CODES 03, 04, 06, 08, 09, 10, 12, 15, 18, 19, 21, 22, 23, 24, 26, 27, 28, 29, 30 AND 96. IF PARTICIPANT IS IN ACT (QS10 = CODE 06) DISPLAY CODES 02, 10, 12, 18, 19, 21, 24, 27, 30 AND 96.
CODE SELECT ONE RESPONSE ONLY SEQUENCE INSTRUCTION
01 1st Energy
CONTINUE
02 ActewAGL
03 AGL
04 Alinta Energy
05 Aurora Energy
06 Click Energy
07 CovaU
08 Diamond Energy
09 Dodo & Commander (M2 Energy)
10 EnergyAustralia
11 Ergon Energy
12 ERM Business Energy/Power Retail
13 Globird
14 Locality Planning Energy
15 Lumo Energy
16 Metered Energy Holdings
17 Mojo
18 Momentum Energy
19 Next Business Energy
20 Online Power and Gas
21 Origin Energy
22 Pacific Hydro (Tango Energy)
23 People Energy
24 Powerdirect
25 Powershop Australia

ACCC0007_Retail Electricity_Final Report_140618 125
26 QEnergy
27 Red Energy
28 Sanctuary Energy
29 Savant Energy Power Networks
30 Simply Energy
31 Sumo Power
96 Other (Please specify)
99 Don’t know ASK IF Q12A = CODE 01 Q12C SWITCH ACC HOLDER 3(DO NOT DISPLAY) Q12C. Were you the account holder with this previous electricity retailer? Please select one.
CODE SELECT ONE RESPONSE ONLY SEQUENCE INSTRUCTION
01 Yes CONTINUE, GO
TO Q13A 02 No
99 Don’t know ASK IF Q9 = CODES 04 Q13A SWITCH 4 Q13A. Can you recall the name of the electricity retailer before that? Please select one.
CODE SELECT ONE RESPONSE ONLY SEQUENCE INSTRUCTION
01 Yes CONTINUE, GO TO Q13B
02 No CONTINUE, GO
TO Q14 99 Don’t know

ACCC0007_Retail Electricity_Final Report_140618 126
ASK IF Q13A = CODE 01 Q13B SWITCH RETAILER 4 (DO NOT DISPLAY) Q13B. What is the name of the previous electricity retailer? Please select one. PROGRAMMING INSTRUCTIONS: ONLY DISPLAY COMPANIES THAT ARE AVAILABLE IN EACH STATE. IF PARTICIPANT IS IN QLD (QS10 = CODE 01) DISPLAY CODES 01, 03, 04, 06, 08, 09, 10, 11, 12, 14, 15, 16, 17, 18, 19, 21, 23, 24, 25, 26, 27, 28, 29, 30 AND 96. IF PARTICIPANT IS IN NSW (QS10 = CODE 02) DISPLAY CODES 01, 02, 03, 04, 06, 07, 08, 09, 10, 12, 14, 15, 17, 18, 19, 21, 23, 24, 25, 26, 27, 28 AND 96. IF PARTICIPANT IS IN VIC (QS10 = CODE 03) DISPLAY CODES 01, 03, 04, 06, 07, 08, 09, 10, 12, 13, 15, 18, 19, 20, 21, 22, 23, 24, 25, 26, 27, 30, 31 AND 96. IF PARTICIPANT IS IN TAS (QS10 = CODE 04) DISPLAY CODES 05 AND 96. IF PARTICIPANT IS IN SA (QS10 = CODE 05) DISPLAY CODES 03, 04, 06, 08, 09, 10, 12, 15, 18, 19, 21, 22, 23, 24, 26, 27, 28, 29, 30 AND 96. IF PARTICIPANT IS IN ACT (QS10 = CODE 06) DISPLAY CODES 02, 10, 12, 18, 19, 21, 24, 27, 30 AND 96.
CODE SELECT ONE RESPONSE ONLY SEQUENCE INSTRUCTION
01 1st Energy
CONTINUE
02 ActewAGL
03 AGL
04 Alinta Energy
05 Aurora Energy
06 Click Energy
07 CovaU
08 Diamond Energy
09 Dodo & Commander (M2 Energy)
10 EnergyAustralia
11 Ergon Energy
12 ERM Business Energy/Power Retail
13 Globird
14 Locality Planning Energy
15 Lumo Energy
16 Metered Energy Holdings
17 Mojo
18 Momentum Energy
19 Next Business Energy
20 Online Power and Gas
21 Origin Energy
22 Pacific Hydro (Tango Energy)
23 People Energy
24 Powerdirect
25 Powershop Australia

ACCC0007_Retail Electricity_Final Report_140618 127
26 QEnergy
27 Red Energy
28 Sanctuary Energy
29 Savant Energy Power Networks
30 Simply Energy
31 Sumo Power
96 Other (Please specify)
99 Don’t know ASK IF Q13A = CODE 01 Q13C SWITCH ACC HOLDER 4 (DO NOT DISPLAY) Q13C. Were you the account holder with this previous electricity retailer? Please select one.
CODE SELECT ONE RESPONSE ONLY SEQUENCE INSTRUCTION
01 Yes CONTINUE, GO
TO Q14 02 No
99 Don’t know FACTORS AFFECTING USAGE Q14 OTHER TYPES OF ENERGY (DO NOT DISPLAY) Q14. What other types of energy do you use in your home? Please select all that apply. Please note: Natural gas includes plumbed (mains/natural) gas for internal cooking, hot water or heating. Liquefied petroleum gas (LPG) includes continuous supply or bottled (45kg) LPG for internal cooking or hot water. It does not include a gas bottle for a BBQ. A solar PV system is made up of an inverter and solar panels. It is usually located on the roof of your house to generate and supply electricity to your premises during the day. Solar PV does not include solar hot water. Also, please do not select solar PV if you have purchased, but are still waiting for the solar panels to be installed. Solar hot water with a booster allows the water to be heated using an electrically charged booster element, whereas a solar hot water without a booster does not have this component.
CODE SELECT ALL THAT APPLY SEQUENCE INSTRUCTION
01 Natural Gas (mains gas) CONTINUE, GO TO Q15
02 Liquefied Petroleum Gas (LPG) CONTINUE, GO TO Q17
03 Solar PV (solar panels) - not solar hot water CONTINUE, GO TO Q16
04 Solar hot water with booster CONTINUE, GO TO Q17
05 Solar hot water without booster CONTINUE, GO TO Q17
98 None of the above CONTINUE, GO TO Q17

ACCC0007_Retail Electricity_Final Report_140618 128
ASK IF Q14 = CODE 01 Q15 GAS USAGE (DO NOT DISPLAY) Q15. Do you use gas for…? Please select all that apply.
CODE SELECT ALL THAT APPLY SEQUENCE INSTRUCTION
01 Hot water
CONTINUE, GO TO Q16
02 Heating
03 Cooking
99 Don’t know ASK IF Q14 = CODE 03 (Solar PV (solar panels) - not solar hot water) Q16 SOLAR PV (DO NOT DISPLAY) Q16. Thinking about your solar PV system (not solar hot water), what is the size of the installed solar PV inverter and what is the size of your panels? Please select one response in each column. Inverter Solar Panels A Less than 1.5kW 01 01
B From 1.5kW up to 2.5kW 02 02
C More than 2.5kW up to 3.5kW 03 03
D More than 3.5kW up to 5kW 04 04
E More than 5kW 05 05
F Don’t know/Can’t remember 97 97 Q17 POOL (DO NOT DISPLAY) Q17. Does your home have a swimming pool? Please exclude pools in common areas of unit, apartment or townhouse complexes. Please select one.
CODE SELECT ONE RESPONSE ONLY SEQUENCE INSTRUCTION
01 Yes CONTINUE, GO
TO Q18 02 No
99 Don’t know Q18 AIR CONDITIONER (DO NOT DISPLAY) Q18. Does your home have an air conditioner? Please select one.
CODE SELECT ONE RESPONSE ONLY SEQUENCE INSTRUCTION
01 Yes CONTINUE, GO TO Q19
02 No CONTINUE, GO
TO Q20 99 Don’t know

ACCC0007_Retail Electricity_Final Report_140618 129
Q19 NO OF ROOMS (DO NOT DISPLAY) Q19. In how many rooms do you have air conditioning? PROGRAMMING INSTRUCTION: ALLOW A ONE OR TWO DIGIT RESPONSE
TEXT – ONE OR TWO DIGITS Q20 BUSINESS FROM HOME (DO NOT DISPLAY) Q20. Do you operate a business from home? Please select one.
CODE SELECT ONE RESPONSE ONLY SEQUENCE INSTRUCTION
01 Yes CONTINUE, GO
TO Q21A 02 No
99 Don’t know Q21 REMOVED Q22 REMOVED BILL PAYMENTS AND DECISIONS Q21A LATE PAYMENT (DO NOT DISPLAY) Q21A. Since December 2016, can you recall paying your electricity bill late? Please select one.
CODE SELECT ONE RESPONSE ONLY SEQUENCE INSTRUCTION
01 Yes CONTINUE, GO
TO Q21B 02 No
99 Don’t know Q21B MISSED PAYMENT (DO NOT DISPLAY) Q21B. Since December 2016, have you missed an electricity payment because you could not afford to pay the bill? Please select one.
CODE SELECT ONE RESPONSE ONLY SEQUENCE INSTRUCTION
01 Yes CONTINUE, GO
TO Q21C 02 No
99 Don’t know

ACCC0007_Retail Electricity_Final Report_140618 130
Q21C DISCONNECTED (DO NOT DISPLAY) Q21C. Since December 2016, have you been disconnected for being unable to pay an electricity bill? Please select one.
CODE SELECT ONE RESPONSE ONLY SEQUENCE INSTRUCTION
01 Yes CONTINUE, GO
TO Q21D 02 No
99 Don’t know Q21D PAYMENT PLAN (DO NOT DISPLAY) Q21D. Since December 2016, have you been on a payment plan with any electricity retailer? Please select one.
CODE SELECT ONE RESPONSE ONLY SEQUENCE INSTRUCTION
01 Yes CONTINUE, GO
TO Q22 02 No
99 Don’t know Q22 INFORMED DECISION MAKING (DO NOT DISPLAY) Q22. With regards to making informed decisions about the best electricity offer for you, how confident do you feel? Please select one.
CODE SELECT ONE RESPONSE ONLY SEQUENCE INSTRUCTION
01 Very confident
CONTINUE, GO TO Q23
02 Moderately confident
03 Slightly confident
04 Not very confident
05 Not at all confident

ACCC0007_Retail Electricity_Final Report_140618 131
DEMOGRAPHICS (DO NOT DISPLAY) Finally a few questions about you and your household. These are for analysis purposes only. Q23 EMPLOYMENT 1 Q23. Which of the following best describes your current employment status? Please select one.
CODE SELECT ONE RESPONSE ONLY SEQUENCE INSTRUCTION
01 Employed, working full-time (more than 35 hours a week)
02 Self Employed, working Full-time (more than 35 hours a week)
03 Employed, working Part-time (less than 35 hours a week)
04 Self Employed, working Part-time (less than 35 hours a week)
05 Unemployed, looking for Full-time work (more than 35 hours a week)
06 Unemployed, looking for Part-time work (less than 35 hours a week)
07 Not employed and not looking for work
08 Student/Apprentice
09 Beneficiary/Welfare
10 Retired
11 Full-time carer
12 Home duties (i.e. stay at home parent)
97 Prefer not to say

ACCC0007_Retail Electricity_Final Report_140618 132
ASK IF S16A IS 2 OR MORE Q24 EMPLOYMENT 2i Q24. Previously you indicated there are [xx] adults living in the household. What is the employment status for each adult? Please select one response in each column. PROGRAMMING INSTRUCTION: REPLACE [XX] WITH RESPONSE PROVIDED AT S16A. INCLUDE THIS NUMBER OF COLUMNS LABELLED AS SECOND ADULT, THIRD ADULT, FOURTH ADULT, ETC.
CODE SELECT ONE RESPONSE ONLY SEQUENCE INSTRUCTION
01 Employed, working full-time (more than 35 hours a week)
02 Self Employed, working Full-time (more than 35 hours a week)
03 Employed, working Part-time (less than 35 hours a week)
04 Self Employed, working Part-time (less than 35 hours a week)
05 Unemployed, looking for Full-time work (more than 35 hours a week)
06 Unemployed, looking for Part-time work (less than 35 hours a week)
07 Not employed and not looking for work
08 Student/Apprentice
09 Beneficiary/Welfare
10 Retired
11 Full-time carer
12 Home duties (i.e. stay at home parent)
97 Prefer not to say
Q25 REMOVED ONLINE ONLY Q26 BILL UPLOAD (DO NOT DISPLAY) Q26. Lastly, could you please take a photo of the front page of the bill you used earlier in this survey and upload it? Please note: This is optional, however it would greatly assist us with our analysis to be able to see a variety of physical bills. Colmar Brunton may pass on copies of the bills uploaded to the ACCC for analysis purposes. If this occurs the bills would be transferred through a secure system and would be used only for research purposes. UPLOAD INSTRUCTIONS: To provide us with a photo of your bill please upload the photo using the link provided below. Please note that this needs to be an image file and must not be more than 200kb in size.
UPLOAD LINK If you do not wish to provide a copy of your bill, please click on the “next” button to proceed.

ACCC0007_Retail Electricity_Final Report_140618 133
SECTION C: ADDITIONAL QUESTIONS ONLY FOR THE PILOT (DO NOT DISPLAY) P1 PILOT1 (DO NOT DISPLAY) P1. How did you feel about the survey overall?
OPEN ENDED TEXT P2 PILOT2 (DO NOT DISPLAY) P2. Which questions, if any, were difficult to answer?
OPEN ENDED TEXT P3 PILOT3 (DO NOT DISPLAY) P3 Which questions, if any, made you feel uncomfortable?
OPEN ENDED TEXT SECTION D: MANDATORY QMS REQUIREMENTS (DO NOT DISPLAY) CONCLUSION (DO NOT DISPLAY) Thank you, you have completed the survey. As this is market research, it is carried out in compliance with the Privacy Act and the information you provided will be used only for research purposes. The research project is being conducted on behalf of the Australian Competition and Consumer Commission Thank you for sharing your views. Please click “SUBMIT” to send your responses.
ACCC0007_Retail Electricity_Final Report_140618 134
Colmar Brunton PO Box 3313
MANUKA ACT 2603
Ph. (02) 6249 8566
ACN NO: 003 748 981
ABN NO: 22 003 748 981
This document takes into account the particular instructions and requirements of our Client. It is not
intended for and should not be relied upon by any third party and no responsibility is undertaken to
any third party.