final project - upcommons · me a great deal of practical and theoretical knowledge on this ......
TRANSCRIPT

Continues Improvement and search of flexibility in the production plant
1 Beatriz Ferrer-Bonsoms / Danone
Non- Confidential
Final Project
School year: 2012 -2013
Continues improvement and search of flexibility
in the production plant
Non- confidential
Author: Beatriz Ferrer-Bonsoms Promotion: 2013
Tutor ENSTA ParisTech: Didier Lebert Tutor Danone: Marc-François Vilain
Internship Executed from the 11/03/2013 to the 27/09/2013
Name of the host organization: DANONE
Direction: 17 bd Haussman, 75009 Paris

Continues Improvement and search of flexibility in the production plant
2 Beatriz Ferrer-Bonsoms / Danone
Non- Confidential

Continues Improvement and search of flexibility in the production plant
3 Beatriz Ferrer-Bonsoms / Danone
Non- Confidential
Abstract
The objective of this paper is to explain the culture of the company, based on workers'
personal development, and see how this approach produces positive results of continuous
improvement. In addition to this, I would like to expose how the union of objectives among
the different areas of the production process, is a key factor to achieve flexibility, as well as
to reach the main goals of the plant.
Keywords: Lean management, operators, flexibility, improvement, performance, supply,
production, bottles.
Continues Improvement and search of flexibility in the production plant
4 Beatriz Ferrer-Bonsoms / Danone
Non- Confidential
Acknowledgments
First and foremost, my utmost gratitude to thank Marc-François VILAIN, WWBU
Performance Operations Manager in Danone Waters, and my direct tutor during this
internship. He gave me the opportunity to discover a world I ignored everything about:
Operations performance in bottled water plants. He guided me through the complexity
of FORCE project, giving me necessary responsibilities and autonomy, being always
careful to share his great experience.
My special thanks also go to Carlos Romero, Performance and DaMaWay Director at
Danone Spain; Javier Guerra, Industrial Director at Danone Spain; Victor Giné and Jordi
Llopis, middle-managers at FONT VELLA Sacalm; Xavi Auric, Production Director at
FONT VELLA Sacalm; Pilar Brugueda, Controler Gestioner and Injection Manager at
FONT VELLA Sacalm; Jesús Moiron y Alex Sabaté, from the logistic department; Sergio
Moreno, from the finance department, for their availability, and for accepting to teach
me a great deal of practical and theoretical knowledge on this issue of flexibility and
methodology of work in Danone Waters Spain.
I would also like to thank the School ENSTA for giving me the opportunity of writing this
paper.
I would also like to thank Aminata FIRMESSE and Gaëlle NOGUES for their kindness and
precious help.
I will not like to forget to thanks my family and friends always disposed to help me.
Continues Improvement and search of flexibility in the production plant
5 Beatriz Ferrer-Bonsoms / Danone
Non- Confidential
INDEX
1. Introduction ..................................................................................................................................... 6
2. Group Organization ......................................................................................................................... 8
3. FIRST PART: METHODOLOGY OF WORK ...................................................................................... 10
3.1. Lean Manufacturing .................................................................................................................. 10
3.1.1. PERFORMANCE WAR ......................................................................................................... 10
3.1.2. DEFINITION ........................................................................................................................ 12
3.1.3. ORGANIZATIONAL ROLS AND UNION ................................................................................ 13
3.1.4. PULL SYSTEM: Just In Time production JIT ........................................................................ 15
3.1.5. CONTINUES IMPROVEMENT AT ALL LEVELS ...................................................................... 16
3.2. DaMaWay Tools and Procedures .............................................................................................. 18
3.2.1. ZONNING ........................................................................................................................... 18
3.2.2. AIC: Animation Court Interval ........................................................................................... 19
3.2.3. SMED: Single Minute Exchange of Die .............................................................................. 22
3.3. FORCE: OPPORTUNITES ............................................................................................................. 24
4. PART 2: FLEXIBILITY IN THE FABRIC .............................................................................................. 26
4.1. FLEXIBILITY ................................................................................................................................. 26
4.2. TRIATHLON: CUSTOMERS/INDUSTRIAL/SUPPLY ....................................................................... 27
4.3. Supply Optimization. ................................................................................................................. 29
4.3.1. Inventory Level .................................................................................................................. 29
4.3.2. Stocks Types ...................................................................................................................... 31
4.3.3. 2013 STOCK VOLUME IN FONT VELLA Sacalm .................................................................. 34
4.4. Industrial Optimization. ............................................................................................................. 36
4.4.1. Distribution of the calendar time. ..................................................................................... 36
4.4.2. Calculation of the indicators.............................................................................................. 38
4.4. Practic case line I and H. ............................................................................................................ 40
5. CONCLUSION: ................................................................................................................................ 45
6. ANEXES .......................................................................................................................................... 46

Continues Improvement and search of flexibility in the production plant
6 Beatriz Ferrer-Bonsoms / Danone
Non- Confidential
1. Introduction
FONT VELLA Sacalm, is one of the 95 plants of Danone Waters Division and one of the
4 Danone Waters plants located in Spain. The plant has a production forecast of 342 Million
bottles for 2.013, with 100% sold in the Spanish market.
The objective of this paper is to explain the culture of the company, based on workers'
personal development, and see how this approach produces positive results of continuous
improvement. In addition to this, I would like to expose how the union of objectives among
the different areas of the production process, is a key factor to achieve flexibility, as well as
to reach the main goals of the plant.
To elaborate this paper, I worked seven months at Danone’s headquarters in Paris,
developing a comprehensive global performance analysis on the bottled water industry from
the production point of view, and how to improve productivity and reduce costs. In addition,
I developed a two weeks field work in FontVella’s plant in Sant Hilari, Girona, Spain.
This experience in the plant has helped me to have a real contact with the mission of the
company: to produce water bottled with the highest quality and service to the customer.
Moreover, having been immersed in the plant, and considering the new Danone working
mentality focused on the continuous improvement, has allowed me to identify actions to
improve the production process.
The paper has two parts. First is focused on explaining the mentality of work of the
operators and workers in the production plant. This part will show, on a day to day basis,
how is the work in a plant which targets the continuous improvement culture.
In order to summarize this culture, I will center my studies on the Lean Manufacturing
philosophy, which is the base of DaMaWay (Danone Managment Way). I will focus on the
main aspects that have changed the way to face performance improvements. In addition, I
will explain the practices and tools of this new methodology used in the plant of FONT VELLA
Sacalm.
The new DaMaWay (Danone Management Way) to achieve production excellence, is based
on the idea that personal and professional development of all those involved in the
production process, is the best way to achieve continuous improvement in the plant. This
project is a research job on the practical results of DaMaWay process in a particular Danone
plant in Spain.
The second part of the project is called flexibility in the production plant. Firstly, I will explain
the reason why the flexibility is a crucial factor of the Lean Manufacturing philosophy, and
secondly I will take into account a practical example of one production line.

Continues Improvement and search of flexibility in the production plant
7 Beatriz Ferrer-Bonsoms / Danone
Non- Confidential
With these two parts of the paper, I hope I have been able to expose, both from the practice
and the results points of view, the DaMaWay culture reflected in one of the more than 95
plants of Danone Waters. The benefits of this, has an important positive influence into the
global economic opportunities of the group.

Continues Improvement and search of flexibility in the production plant
8 Beatriz Ferrer-Bonsoms / Danone
Non- Confidential
2. Group Organization
The Central Office, the Country Business Unit (CBU) and the factory are the three structures
that work together in order to reach the vision of the Water Division. Each structure has a
different role. The division of roles is going to be synthesized in the following paragraphs.
Central office at Paris:
The central office, located in Paris, is the point that unifies the work developed by all group
plants. The performance, economic situation, investments projects, etc. of the local CBU is
reported to the central office every certain period of time, by the Management Control, the
Finance Department and others local departments.
Overall results are transferred to the Central Office which is the responsible of determining
the global vision of the company, and its strategic global and local plan.
There are different departments in the central office, each of them focus on a different area
of the production process or on any other added value area of the group. The Operational
Department, in which I worked, has not only the mission of defining the strategy plan for
each CBU office, but also to adapt it to each CBU situation.
Moreover, having a global vision of the company and working for all CBU allows the Central
Office to compare the results of each of them, and to assess the good practices. For this
reason, the Operational Department has also the role of challenging CBUs developing
benchmarking comparisons, offering examples of others CBUs.
Finally, the unity and commitment of all the people of Danone is an essential part of the
culture of the company. The Central Office, that has the overall vision, is responsible for
defining this commitment strategy and makes sure that reach to all employees of the
corporation.
Country Business Unit, CBU:
In DANONE Waters Division there are 12 CBU. Each CBU has a certain number of plants and
volume of production.
Danone’s Business Unit in Spain is called ADE (Aguas Danone España), and produces Font Vella
and Lanjaron brands. Both, Aguas de Lanjaron S.A and Fontvella S.A, became part of Danone
Waters in 1974. They are considered long-term brands of the group.
The four plants of ADE are the following:

Continues Improvement and search of flexibility in the production plant
9 Beatriz Ferrer-Bonsoms / Danone
Non- Confidential
- Sacalm, Placed in Sant Hilari, provincial
de Cataluña
- Siguenza, Placed in Siguenza, provincia
de Guadalajara
- Lanjaron, Placed in Lanjaron, provincia
de Andalucia
- Fonter/Viviaris, Placed in Amer,
provincial de Cataluña.
The central office of ADE is located in Barcelona. Supply chain, sales, finance and master
data, human resources, IT etc. departments, have the mission of supporting the four
production plants and make them competitive.
For instance, logistics department provides the transportation of the water bottles from the
plant to the client. The SSD (Sourcing & Supplier development) department would provide
the material resources for the production of the bottles. All the functions of ADE central
office supply the necessary resources to produce the bottles water in the plant and to
delivery them to the client, with the appropriate service level and quality product.
Plant:
The last stage of the production chain is the fabric. This structure is physically essential for
the production of water bottles. The resources provided by the social office and the
challenge given it by the central office have it results in the performance and improvement
of the production plant.
There exist four different levels in the organization of the plant:
1. Operators
2. Middle Managers
3. Managers
4. Director Plant
The improvement of the results in the plant is the consequence of the development and
promotion of the capacities of each organization level.
Factories and Sales influence areas

Continues Improvement and search of flexibility in the production plant
10 Beatriz Ferrer-Bonsoms / Danone
Non- Confidential
3. FIRST PART: Methodology of work
3.1. Lean Manufacturing
3.1.1. PERFORMANCE WAR
“Preserving value with less work” is the goal of DaMaWay (Danone Management Way) in all
Danone Water Plants now a days. In other words, obtain the same value with less cost:
reducing time and resources in order to decrease the production cost for finish products.
The importance of reducing cost in our current more global and competitive market seems
very logical. In fact, reducing cost is the “driving force” that leads companies to innovate,
grow, and improve its performance.
But this mentality is not so old. Before, production and industrial companies were focused
on adding value with less costs and the price of the products were calculated according with
the formula:
Production Cost + Margin benefit = Product Price
The price was calculated by the accounting department based on real production cost and
the “standard” margin benefit of the company. There was no real competitiveness as we
understand it today. In this scenario, the main focus was to product more and more without
losing quality. It was understood that sales was not a problem, and with this price structure,
the more you sale the more you gain. Another symptom of this situation was that marketing
departments did not exist or were irrelevant.
This formula for price calculation is no longer valid. Customers have become more powerful
because of their easy access to information, huge increase of choices they can make and the
permanent improve of quality at similar prices. Actually, the formula is as follows:
Prices (fixes or reduce) – Cost = Margin benefit
For industries to increase benefit and therefore grow up, they have the need to reduce costs
and maybe prices. At this point, the production industry started to ask how to reduce cost.
“The great challenge of the twenty-one century is not information technology. It is cost
reduction.”1
1 Pascal Dennis. “Lean Production Simplified: A Plain Language Guide to the World's Most Powerful
Production System.”

Continues Improvement and search of flexibility in the production plant
11 Beatriz Ferrer-Bonsoms / Danone
Non- Confidential
The Production of Waters in Spain is getting more and more competitive. The constant
decrease of water bottle consumption since 2006 cause by the economic crisis; the
distribution market gaining margin and the increase of top water quality supported by the
organizations, are provoking a decrease in the bottle volume market in Spain.
“With Spain still very much immersed in the economic crisis, consumers continued to make
adjustments to their spending habits. They cut down on their leisure activities, including
visits to bars and restaurants. “2
The economic crisis has reduced the water bottled market in Spain in the last seven years.
Aguas FontVella and Lanjaron, although it maintain its leadership position with 16% of
market share in 2012, has reduce its production from 516 Million bottles in 2008 to a
forecast of 351 Million in 2013. The challenge now is to keep its strong market image of
quality and reduce cost to increase the margin and compensate the volume reduction.
Spain now is a country in which the market of bottle production has become a price war
and therefore a productivity war. There are several ways to reduce cost in a plant: reduce
wage cost, buying cheaper row materials, slow down non urgent projects, etc. This aspects
might reduce cost in the short term, but does not make the plant more efficient and flexible
for new and future situations.
In order to transform its own situation into a challenge for all Danone Water Plants in Spain,
the methodology of Danone Group called DaMaWay has impulse a transformation in the
way operators and all Danone workers in the plant face their daily work. It has also
encouraged the plants to be more flexible, less speeding and more efficient.
2 Euromonitor.com Bottled water in Spain Report – June 2012

Continues Improvement and search of flexibility in the production plant
12 Beatriz Ferrer-Bonsoms / Danone
Non- Confidential
3.1.2. DEFINITION
As said, in a short term strategy probably the best and easy way to reduce costs is to directly
cut resources: reduce preventive maintenance costs, cut operators and machines conditions,
In the following figure, the right column illustrates the logical order of the issues that might
be used to optimize cost. The first four aspects are directly related to cost production and
the last three (Simplification of flows and tasks, Ergonomic work conditions and Operators)
are related to the workers attitude and mentality of their work.
The logical business model will give more importance to the aspects that directly save
money, and will barely use time improving workers attitude aspects that apparently not
provide any direct benefit to the company. I wrote in the right side of the table the logic
DaMaWay management, based on Lean Manufacturing System, that focus on the workers
and operators which are in direct contact with the production process.
€’S
Save of time and cost
Quality Product Improvement
Better Productivity of the work
Eliminated “Non Added Value”
Workers Attitude & Mentality
Simplification of flows and tasks
Ergonomic
Operators
DaMaWay is a mentality and a manufacturing methodology of the Danone Group based on
Lean Manufacturing System originally designed by Toyota that pursues a continuous
improvement of the results, making all levels of the organization increase/enhance/obtain
the each level capacities. It represents a change in the daily work of all employers of the
organization, including suppliers with the objective of reaching the final vision of the group.
DaMaWay was “designed” in Mexico during a congress by representatives of each country
and Middle Management coming from different factories. During 3 weeks, DaMaWay was
defined in a process to implant concrete tools and procedures adapted to the structure and
functionality of the plants.
Continues Improvement and search of flexibility in the production plant
13 Beatriz Ferrer-Bonsoms / Danone
Non- Confidential
3.1.3. ORGANIZATIONAL ROLS AND UNION
The actions and attitude of the operators is an essential factor for the performance of the
plant, and their motivation and positive attitude a key factor for the improvement. Before it
was thought that the best and fast way to improve and reduce cost was to attack directly the
“non value actions”, mechanic problems or, for example, any possible issue of the
production line. This change of mentality supposes an important change in the methodology
of work at all organizational levels.
Implementing this idea, a middle manager in the plant of FONT VELLA Sacalm explains that
one of the first planed DaMaWay actions was to ask each operator, about the aspects he
thinks should change in his specific area in order to make his work more efficient. In
addition, he include any tool that the operator said he needed to be change or added to
facilitate their work. The main objective of this action was to make understand the operator
that he/she is the final responsible of his work area and give them the tools to perform the
improvements determined.
For the company, all money spent on these action plans was invested. The objective was to
transmit the new culture of the company focus on the operator: excellent work conditions,
continues training and skills development.
Managers and middle-managers have to convey operators that the machine lines belong to
them and they have the authority to implement the needed changes. The more authority
and motivation of the operators, the more they are moved to improve the performance of
the lines.
Leaders of the lines should transmit to operators that they have the authority to stop the
production line whenever they believe it is necessary, regardless of the origin of the
problem. They should know that they have complete authority in their work area; this is a
critical task for managers.
“Companies often introduce new schemes for raising productivity and quality. But they
rarely stick with demanding regiments unless required to do so. Even inefficient companies
can get by when business condition are good” 3. This sentence can make us understand that
the changes proposed by the top management asking for a high commitment of all
employers are critical for a long term success. For this reason, top management should have
a strong and visible commitment to the system. They should be closed to the production line
and the operators, not only to be find out possible problems, but also to be in permanent
3 J. Temple Back, “Lean Manufacturing Systems and Cell Design”

Continues Improvement and search of flexibility in the production plant
14 Beatriz Ferrer-Bonsoms / Danone
Non- Confidential
and easy contact with middle manager and operators. It is also very important to develop
the mutual trust between labor and management.
Top and Middle managers in Sant Hilari plant had their office in the middle of the factory
since 2008, as we can see in the following figure. It is important to underline that the
transparent walls, the high vision and the easy access from the lines helps the contact with
the operators and help them to understand that their work is crucial for the well running of
the whole plant. It creates junction among all workers.
Employees must participate 100%, be committed and not just involved in their role. For
example, the well running of one machine in a production line because it’s good mechanical
preventive actions, allows the good performance results for the following machine in the
line, not stopping causing works pills. The spirit of team work helps the well coordination
and better results.
I would like to mention, at this point, an anecdote that happened in the plant of Sant Hilari
during the start of the implantation of the DaMaWay System. A new blower machine was
installed in one production line, causing problems of undefined mechanic problem. No result
was found after a first analysis of the machine. The General Manager of the plant and the
Suppliers that sold the machine met during a day in order to detect the problem and give a
possible solution. As the inversion of the machine was significant, this issue was directly
managed by the director of the plant.
The director asked one middle manager to assist at the meeting and participated to give his
personal experience of the blower machine mechanical problems. The discussion with the
supplier’s directors developed as normally analyzing the performance results of the
machine.
At one moment, the middle manager proposed the director to ask one the operator in
charge of the blowing area to assist the meeting and he accepts the proposal. The operator
Figure 3.1.3. Picture of the plant of FONT VELLA Sacalm with the Managers office in the center.

Continues Improvement and search of flexibility in the production plant
15 Beatriz Ferrer-Bonsoms / Danone
Non- Confidential
explained in a simple way to the directors that the blower machine was making a strange
noise at one specific point but no solution or cause was found.
After this comment they started making question to the operator: type of noise, frequency,
logger of the stopped, etc. aspects that only operators can correctly determine for their
continued contact and experience in the line. Finally the managers identify the problems of
the machine. Operators have a key position in the performance of the plant.
The fact is that the operators working in the production line are the ones that have more
information about the running of the machines: the most frequent problems, the more
delicate areas in the machine, etc. They are the best persons to detect problems and
therefore to solve them. This is one of the reasons why DaMaWay looks forward to improve
the operators’ skills in the maintenance and quality domain: they are the right person to
solve the problems.
3.1.4. PULL SYSTEM: Just In Time production JIT
Just in time production is a way of working that make employer produce what is needed,
when needed and in the quantity needed and asked by the customers.
Before JIT industries were focused on producing goods and, afterwards, try to find buyers for
those products. This way of working called push system has dramatically changed buy the JIT
production, which primary focus on client needs and then performed and adapt the
production process and raw and middle inventory according to their needs: pull system.
Working with a pull system it is much easier to reduce inventories and costs. The objective is
to only produce the goods that are going to be sold by the costumer at the time they are
declared finish goods. “Items should proceed one at time through the entire production
sequence in order to minimize the amount of material process at all stages of the
production.” 4
Two factors are needed to be integrated in the plant in order to make JIT possible and
effective:
1. Integration of the team members, plant and systems
2. Continues improvement and therefore an increase of the flexibility in the plant.
The production starts by the inventories created by the planning department and finish
when the finish good is given to customers. Each employer action can add or not value to
the production chain. For this reason, the communication and integration between stages is
crucial because changes and problems may have a repercussion to the following stage.
4 J. Temple Back, “Lean Manufacturing Systems and Cell Design”

Continues Improvement and search of flexibility in the production plant
16 Beatriz Ferrer-Bonsoms / Danone
Non- Confidential
Behind the production of a bottle, there is not only the work of the operators and machines
that are in a direct contact, there is also the sales people that contact the client, the
purchase workers that buy to the suppliers the PET, caps, labels, films, cartons, etc. and
make sure they are just in time in the plant. Production manager and the expedition
managers determine the quantity and SKU to be produced in each line, in order to not
exceed in a specific product in the warehouse.
FOTO
These activities might be organized and joint to reduce the inventory and therefore the
production cost.
The second point is the continuous improvement in the plant, it is also necessary the spirit of
continues improvement at all levels . This means that there are no limits or barriers that can
stop the improvement and the reduction the cost in the long term.
Continues improvement make the plant accomplish more flexibility to adapt to new
situations in the market place, the integration of new products, etc. The mentality of
workers for acquiring new skills in maintenance and quality, the reduction time in their
operations and many other improvements makes the plant more efficient and flexible.
3.1.5. CONTINUES IMPROVEMENT AT ALL LEVELS
Measure, identify, analyze and implement is the procedure followed by all Danone workers
with the goal of having continues improvement. For this reason, it is important to quantify
the results with indicators that quantify the performance of the production line in numbers.
There are 6 aspects to cover the perimeter of work in the plant in the following order of
importance:
1. Safety
2. Quality
3. Cost
4. Delivery
5. Motivation
6. Environment
It is necessary to study the six to have a global vision of the performance of the plant. For
each of them, there are indicators to measure its performance area.
Each action developed in the plant needs to be qualify in the 6 aspects. Every production
line, for instance, has its visual panel with the 6 aspects results quantified in indicators.

Continues Improvement and search of flexibility in the production plant
17 Beatriz Ferrer-Bonsoms / Danone
Non- Confidential
Moreover, the results are marked by the operators in red or green to show the level of
accomplishment of the objective.
The indicators are adapted to each situation or level of proximity to the production and
global vision of the plant. In the following picture I show the pyramided of indicators for
each level in the plant. This picture was posted in the board of the plant so that every worker
can have access to it. It shows the objectives to reach in the whole plant for each one of the
SQCDME aspects, and the translation of these objectives into indicators, adapted to each
level: operators, middle managers, comafas (plant managers) and plant director of the plant.
Plant director works with global indicators of the plant considering its overall performance.
Figure 3.1.5. Line Panel E with the 6 indicators
Figure 3.1.5.b. Objective indicators for each one of the levels in the organization.

Continues Improvement and search of flexibility in the production plant
18 Beatriz Ferrer-Bonsoms / Danone
Non- Confidential
3.2. DaMaWay Tools and Procedures
Procedures and tools to put in practice the DaMaWay culture of work. Zonning, AIC and
SMED are going to be describe in the followings points.
3.2.1. ZONNING
Zonning is a methodology to create and organize the place of work. Its goal is to avoid
excessive movements with a complex design of the line. In order to make the work easier
and more ergonomic it is important to determine the actions that are necessary and the
unneeded ones. The observation of the production line is the first step to be done.
The optimum efficiency comes when each operator knows the area of responsibility and
takes its responsibility. The area of work of each operator delimits its responsibility in the
production line. It is “his territory”. He is in charge of production, quality, security, cleaning
and order of his area.
Thus, the isolation of each set of production and the limitation of his area of responsibility is
an important tool of the operator. It is necessary to physically draw a visible line to isolate
his isle. Everything that operator needs to perform his work is inside his area. The operator,
then, is autonomous to develop the flow control.
The aisles are the result of isolation: they are defined by islets. It is therefore important to
consider the corridors to facilitate the flow of workers and make their work more visible on
the ground. This also improves job security while avoiding obstacles and facilitating line
control.
Figure 3.2.1. Work area of the workers delimited by a yellow line
Continues Improvement and search of flexibility in the production plant
19 Beatriz Ferrer-Bonsoms / Danone
Non- Confidential
Workers should be involved from the early design stage of work cells. They are the ones who
have to identify their areas of work, since then will be they who are working on I Standards
are essential to provide continuous improvement on the ground.
3.2.2. AIC: Animation Court Interval
Description
Once workplaces are isolated, and operators have received the necessary tools, it is easy to
work in a synchronized way among departments and levels, even though they might have
different objectives. For this reason, AIC is a structure focused on what it takes to serve the
customer working with an organization synchronized. That is, put the plant in an effective
position to maintain and consistently improve the level of results.
AIC is operated through a series of events to facilitate feedback between the operator, its
supervisor, and workers of the support functions. This will allow to focus on key priorities,
and solve potential problems. There are three types of meetings, in order to follow up all
possible problems, and to analyze the SQCDME result of the production line.
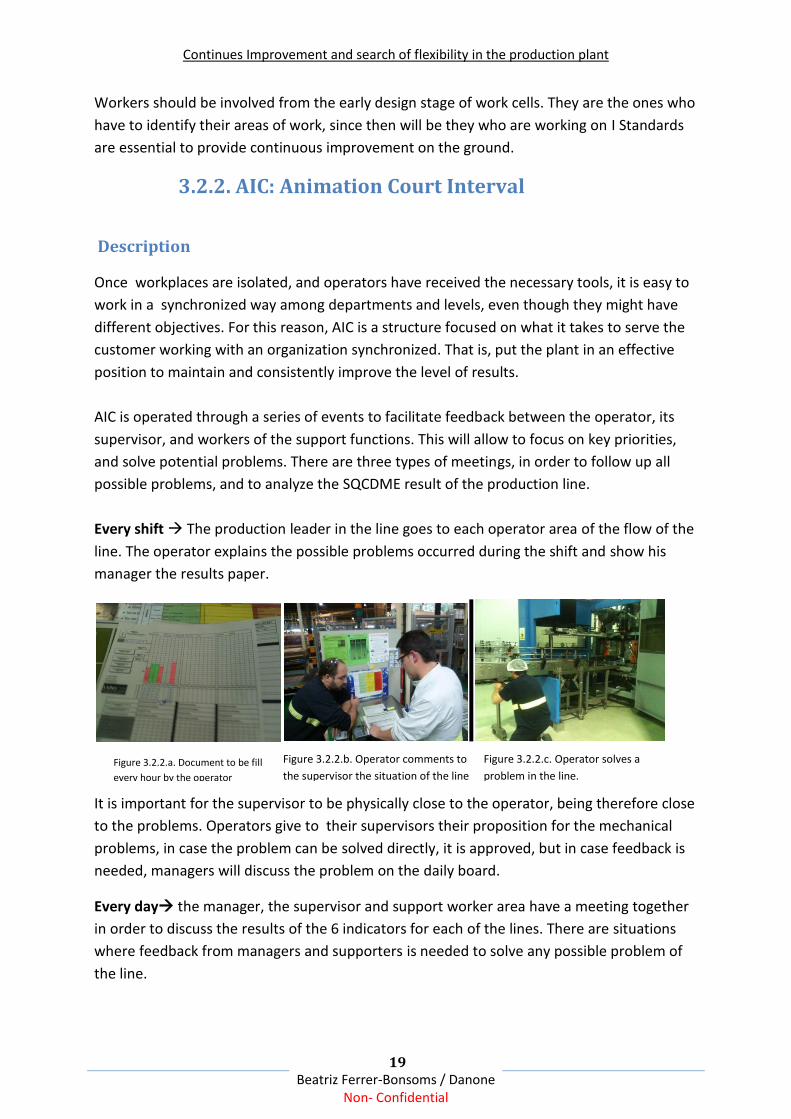
Every shift The production leader in the line goes to each operator area of the flow of the
line. The operator explains the possible problems occurred during the shift and show his
manager the results paper.
It is important for the supervisor to be physically close to the operator, being therefore close
to the problems. Operators give to their supervisors their proposition for the mechanical
problems, in case the problem can be solved directly, it is approved, but in case feedback is
needed, managers will discuss the problem on the daily board.
Every day the manager, the supervisor and support worker area have a meeting together
in order to discuss the results of the 6 indicators for each of the lines. There are situations
where feedback from managers and supporters is needed to solve any possible problem of
the line.
Figure 3.2.2.a. Document to be fill
every hour by the operator
Figure 3.2.2.b. Operator comments to
the supervisor the situation of the line
Figure 3.2.2.c. Operator solves a
problem in the line.

Continues Improvement and search of flexibility in the production plant
20 Beatriz Ferrer-Bonsoms / Danone
Non- Confidential
Line supervisors discuss the results of the previous day with quantitative indicators. They
also explain the reasons of the performance of the line according with the facts and
problems that have arisen on the lines.
This half an hour is also a key time to solve any problems and conduct quality projects,
security, and mechanical ... in sync across all work areas
Every week The supervisors along with the operators of each line or group of lines meet
in front of the blackboard and discuss indicators for each of the 6 indicators.
The purpose of these meetings is to cut the time between measures of indicators and faster
time to identify a problem and solve the situation. In the event that the problem cannot be
solved at the first level it is up-scaled until it is solved.
The escalation policy, established with the AIC, allows to take a proactive position to see,
analyze, and solve problems through a standardized methodology.
COMMOM LANGUAGE AND VISIBILITY
To represent the results in the most easy way to visually
understand them, we have chosen the colors green and red
to indicate if the results are above or below the targets set.
Figure 3.2.2.d. Document to be fill
by the supervisor every day
Figure 3.2.2.e. Dairy meeting AIC Figure 3.2.2.f. Dairy meeting AIC
Figure 3.2.2.g. Panel with of the
line E with the results of the week
Figure 3.2.2.h. Meeting at the end of the
week with operators and supervisor
Figure 3.2.2.i. Document with the
red and green language

Continues Improvement and search of flexibility in the production plant
21 Beatriz Ferrer-Bonsoms / Danone
Non- Confidential
Thus, all levels of the organization can have a quick overview of the latest results translated
into indicators. Each production line contains a panel that shows the results SQCDME
graphically and visually:
It is also important that all workers can distinguish between the stages of work that
contribute to the process of manufacturing the product and those that have barely add
value to the customer.
Aggregate Value Directly contributes to the production process. The customer wants to
pay to have it. Activity that transforms the product for the customer's benefit.
Non Aggregate Value Consumption of resources but does not contribute directly to the
product nor helps to achieve customer requirements for product.
The identification of actions that does not bring added value are one of the key points to
"preserve value with less work," goal of the Lean Manufacturing System.
Working with red and green makes all levels of the organization be aware all activities and
resources that do not add value to the product. In addition, reduces costs, eliminates
potential problems, and remove operators of doing unproductive tasks, allowing them to
spend more time on activities that add value to the product, such as training or development
in other areas.
Figure 3.2.2.j. Analyze of the Quality and
Delivery areas in one line

Continues Improvement and search of flexibility in the production plant
22 Beatriz Ferrer-Bonsoms / Danone
Non- Confidential
3.2.3. SMED: Single Minute Exchange of Die
SMED is the method followed in Danone to make the change to multi-line format. A multi-
line is one that produces more than one format. In this case the SMED method is used to
change the volume of the bottles and therefore mold of the bottles in lines producing more
than a measure of bottles.
During set up, line production must be stopped. Therefore, reducing this time, should be the
main objective of the chosen method for changing the mold.
Reducing the time to make formatting changes, makes the plant gain efficiency by increasing
the production capacity of the lines. The lower production time will take longer available to
produce and therefore the efficiency of the lines will be greater.
In addition, the SMED method got to be more flexible and reactive to customer orders. We
are better able to produce what the customer asks us in the format required and ordered
quantity, thereby reducing the level of production and thus the costs of stock.
Stages:
SMED methodology follows four stages to be followed by the operators and supervisors in
order to reduce the time reformatting:
1. Identification: It is necessary to observe the operations performed during the
reformatting and distinguish between:
a. Internal operations (machine should be stopped)
b. External operations (might be performed with the machine running)
Figure 3.2.3.a. Reduction of the batches with the SMED method

Continues Improvement and search of flexibility in the production plant
23 Beatriz Ferrer-Bonsoms / Danone
Non- Confidential
2. Extract: External operations must be extracted from the change in format and be
made before the machine will stop.
3. Convert: Internal operations that can be performed before the machines stop using
technical solutions
At this point it is important to analyze all the tools used by operators, and minimize
the necessary elements that must be replaced in change, standardizing each operator
actions.
4. Reduce: Reduce first the time of the internal actions, and then of the external ones.
Actions such as functional connections, mold changes, cleanings, displacement.
Relation with AIC and Zonning:
DaMaWay AIC and ZONNING tools have a clear influence on the methodology followed in
SMED:
AIC for the good performance of procedures necessary that operators, supervisors along
with service areas (quality and maintenance) work jointly. All standardized actions to change
formats should be aligned with the requirements in quality and maintenance. Thus, all areas
work for the same goal in a transversely way.
ZONNING the provision of tools, the ergonomics of operations, standardization of actions,
etc. have an essential role in the realization of the format change.
Figure 3.2.3. b. Shelf with the tools to make the
change of format

Continues Improvement and search of flexibility in the production plant
24 Beatriz Ferrer-Bonsoms / Danone
Non- Confidential
3.3. FORCE:
From the performance department headquarters in Paris, is held every year a draft analysis
of the opportunities in every factory performance division and CBU. This analysis is done at
all levels of the Department of Operations: Supply Chain, Procurement and Industrial.
To search for potential opportunities the central office has the benchmarking of all plants
and CBU. Each plant receives the benchmarking information, and from that performance
indicator results in local barriers and adapts them to their own business. Thus, this tool helps
plants to create their vision to 5 or more years away knowing that they can reach a given
performance and cost reduction.
The role of central office for the right focus of the project is essential. They are not only
responsible for determining the benchmarking between all results, but also to customize it
to each production plant and adapt it to each local conditions. Having an overview of good
practices of all CBU is extremely important.
Indicators:
In order to compare performances it is necessary to translated it to indicators such as HMO /
Kilo bottle, kbottles / hour, etc.. Where it does not take into account the cost but the
resources used in the plant. The quantification of the results can not only compare the
results, but also continuous improvement in plant.
These indicators are calculated taking into account the conditions of the plants in size,
number of references produced, production volume, etc.. In order for these to be the
translation of reality in a more forthcoming. The more clear impact factors in performance
are taken into account, the indicator will be more adapted to the reality of the plant.
Therefore, when comparing indicators we must also consider the case loads of each case.
For example, to compare the performance of a production line would not be fair if we did
not take into account the number of formats that are produced on the line, or if they are
glass bottles or plastic. You cannot compare the performance of a line just that only makes
one change of format per month with a line that performs twice a week.
Stages:
FORCE Project have 3 different stages/functions:
1. Updated benchmarking accumulated for each of the areas of operations.
2. Work of the CBU and plants along with support from headquarters: own calculation
of indicators and benchmarking adaptation considering local barriers that difficult
reach to the business.

Continues Improvement and search of flexibility in the production plant
25 Beatriz Ferrer-Bonsoms / Danone
Non- Confidential
3. Analysis of economical performance opportunities for each CBU/plant/area.
DaMaWay tool:
FORCE is a tool for the decision of the group's vision locally and for plants and CBU. It is an
analysis of the gap between the current situation and the reference to where we could get
to each of the areas. The translation of this distance in economic opportunities allows to
define the long term situation sought.
DaMaWay pursues that all levels of the organization working for the same goal. Thereby
determining the view factor is to be worked from the actions nearest the output to the
directors.
Analysis areas:
The project FORCE analyzes the controllable costs in the three areas of work. To do it, the
different areas of work are divided by their different sections in order to analyze the
performance of each of the resources that represents a cost in the production line.
Figure 3.3. Opportunity areas in the FORCE project

Continues Improvement and search of flexibility in the production plant
26 Beatriz Ferrer-Bonsoms / Danone
Non- Confidential
4. PART 2: FLEXIBILITY IN THE FABRIC
4.1. FLEXIBILITY
Once explained the practical cases of implementation of DaMaWay and the objectives
pursued, the second part of the project is to analyze the results of the production plant,
looking for cost reduction through the analysis of indicators. This section explains the
flexibility to be sought at the production and sale of bottled water.
Flexibility in plant production is a key factor for the correct implementation of Lean
Manufacturing:
“Flexibility is a premier design feature for lean production and cellular manufacturing
systems. Once implemented, cellular systems can react quickly to changes in customer
demand, product design, or product mix.”5
Flexibility can be defined as the agility of a plant to be faster, to reduce costs and to satisfy
customers with better quality. In short, be more productive and agile to absorb the possible
changes in the plant.
Existen 3 tipos de flexibilidad:
1. Volume flexibility: A measure of the capacity of the system to be operated profitably
at different volumes.
2. Mix flexibility: The capacity of the system to operated profitably at different part
types.
3. Manufacturing flexibility: A measure of how fast the company converts its process
from making an old line of production schedule, to modify a part, or to hand multiple
parts.
5 J. Temple Back, “Lean Manufacturing Systems and Cell Design”
Continues Improvement and search of flexibility in the production plant
27 Beatriz Ferrer-Bonsoms / Danone
Non- Confidential
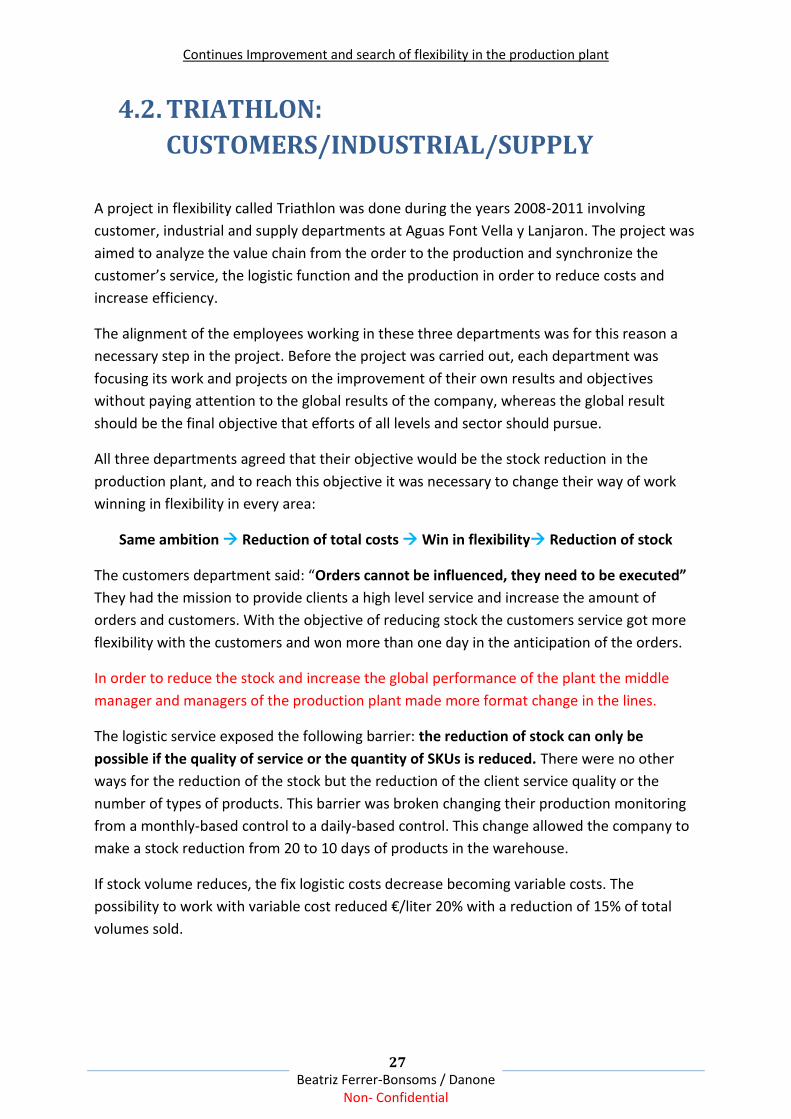
4.2. TRIATHLON:
CUSTOMERS/INDUSTRIAL/SUPPLY
A project in flexibility called Triathlon was done during the years 2008-2011 involving
customer, industrial and supply departments at Aguas Font Vella y Lanjaron. The project was
aimed to analyze the value chain from the order to the production and synchronize the
customer’s service, the logistic function and the production in order to reduce costs and
increase efficiency.
The alignment of the employees working in these three departments was for this reason a
necessary step in the project. Before the project was carried out, each department was
focusing its work and projects on the improvement of their own results and objectives
without paying attention to the global results of the company, whereas the global result
should be the final objective that efforts of all levels and sector should pursue.
All three departments agreed that their objective would be the stock reduction in the
production plant, and to reach this objective it was necessary to change their way of work
winning in flexibility in every area:
Same ambition Reduction of total costs Win in flexibility Reduction of stock
The customers department said: “Orders cannot be influenced, they need to be executed”
They had the mission to provide clients a high level service and increase the amount of
orders and customers. With the objective of reducing stock the customers service got more
flexibility with the customers and won more than one day in the anticipation of the orders.
In order to reduce the stock and increase the global performance of the plant the middle
manager and managers of the production plant made more format change in the lines.
The logistic service exposed the following barrier: the reduction of stock can only be
possible if the quality of service or the quantity of SKUs is reduced. There were no other
ways for the reduction of the stock but the reduction of the client service quality or the
number of types of products. This barrier was broken changing their production monitoring
from a monthly-based control to a daily-based control. This change allowed the company to
make a stock reduction from 20 to 10 days of products in the warehouse.
If stock volume reduces, the fix logistic costs decrease becoming variable costs. The
possibility to work with variable cost reduced €/liter 20% with a reduction of 15% of total
volumes sold.

Continues Improvement and search of flexibility in the production plant
28 Beatriz Ferrer-Bonsoms / Danone
Non- Confidential
The cost and value add optimization between the area of Supply Chain and Industrial is
analyzed in the followings points. As we have seen the reduction in cost in the warehouse
and reduction of stock leads to a decrease in the level of production of the lines. The
reduction of inventories leads to reduction in time of the batches and lots and the reduction
of batches lead to an increase of change over in the multiformat production lines.
The increase of number of change per day or week means on one hand the increase of dead
time, where the production is null and on the other hand, it permits the adaptation of the
customer’s needs to the production reducing the quantity of stock in the warehouse and
production lines.
The balance between the industrial and supply chain performance is a question that needs
to be analyzed in each factory in order to reduce the total cost of the company. The
following points describe the relation between both areas with more detail through the
utilization of indicators. Moreover, there is disclosed a practical case of a production line.
Figure 3.3.a Representation of three big stages in the Order to Delivery chain
Figure 3.3.b. Balance between Industrial and Supply

Continues Improvement and search of flexibility in the production plant
29 Beatriz Ferrer-Bonsoms / Danone
Non- Confidential
4.3. Supply Optimization:
The reduction of inventories in the warehouse is one aspect that can help the plant to
reduce costs. The warehouse has a limited space for stock and when it is full the stock is
carried to a provisional warehouse close to the factory, whereas if there is available space
less stock or no stock needs to be carried to the provisional warehouse.
Sant Hilary plant has a Warehouse in the Factory and a Regulator Warehouse in Moragas.
The first warehouse has a capacity of 6000 pallets and is rented APORTA group, who offers
Font Vella the service to manage all the pallets since they enter into the warehouse to their
expedition by trucks. The group Font Vella pays for every pallet managed by Aporta.
The regulator warehouse located in Moragas is only used in case of over stock in the
warehouse of the factory. The more pallets are sent to the that warehouse the more the
company must pay to APORTA for pallets transportation and space rental. All costs
associated to APORTA’s warehouse are called External Logistic Costs.
The stock reduction is a continuous challenge of the factory as it means a reduction in cost.
The first way to optimize costs is to reduce stock in the factory warehouse in order to not
need to use the regulator warehouse. The second way is the reduction of inventory in the
Factory Warehouse to reduce the time that batches and lots are the plant.
The Delivery indicator calculated to measure the performance of the plant is DPD, Direct
Product Delivery:
The pallets that are not directly sent to client are the ones that were sent to the Regulator
Warehouse (inbound transport). This indicator reflects the first objective of reducing in stock
explained in the paragraph above.
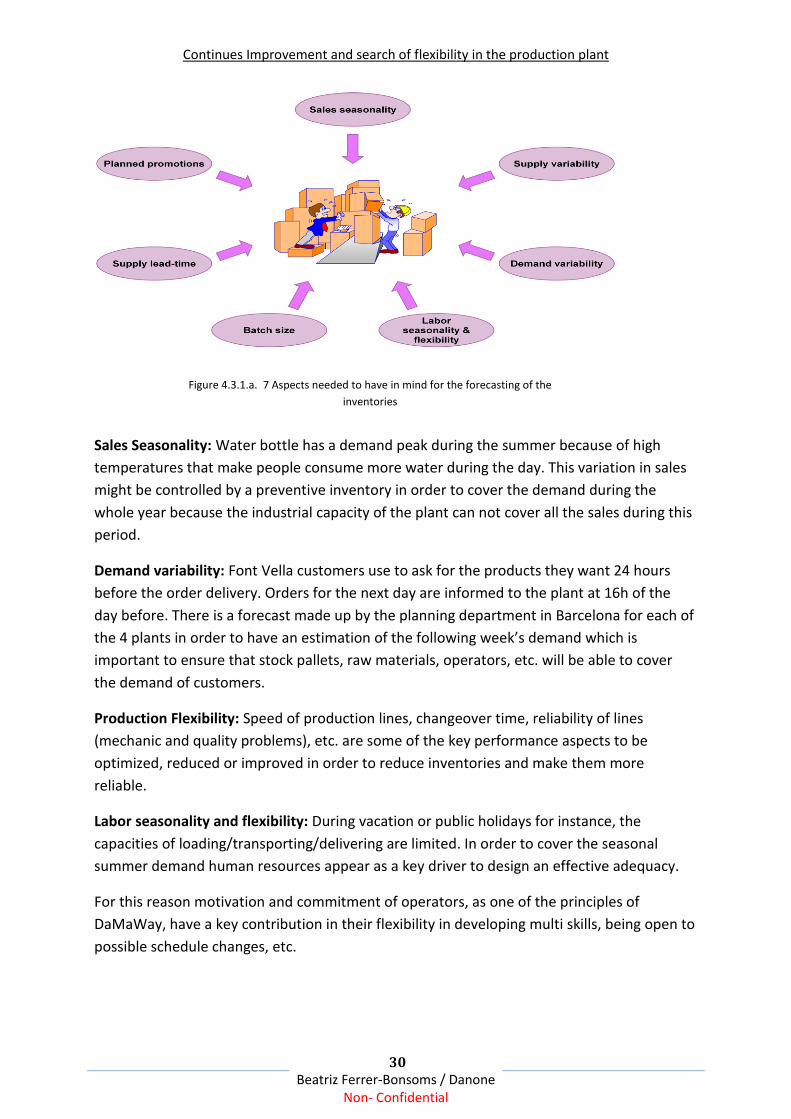
4.3.1. Inventory Level
There is a stock classification in order to make sure that all variable factors that have a
repercussion in the production line are covered. In order to understand the importance of
the inventory in production time there are explained the factors that should be taken into
account:
Continues Improvement and search of flexibility in the production plant
30 Beatriz Ferrer-Bonsoms / Danone
Non- Confidential
Sales Seasonality: Water bottle has a demand peak during the summer because of high
temperatures that make people consume more water during the day. This variation in sales
might be controlled by a preventive inventory in order to cover the demand during the
whole year because the industrial capacity of the plant can not cover all the sales during this
period.
Demand variability: Font Vella customers use to ask for the products they want 24 hours
before the order delivery. Orders for the next day are informed to the plant at 16h of the
day before. There is a forecast made up by the planning department in Barcelona for each of
the 4 plants in order to have an estimation of the following week’s demand which is
important to ensure that stock pallets, raw materials, operators, etc. will be able to cover
the demand of customers.
Production Flexibility: Speed of production lines, changeover time, reliability of lines
(mechanic and quality problems), etc. are some of the key performance aspects to be
optimized, reduced or improved in order to reduce inventories and make them more
reliable.
Labor seasonality and flexibility: During vacation or public holidays for instance, the
capacities of loading/transporting/delivering are limited. In order to cover the seasonal
summer demand human resources appear as a key driver to design an effective adequacy.
For this reason motivation and commitment of operators, as one of the principles of
DaMaWay, have a key contribution in their flexibility in developing multi skills, being open to
possible schedule changes, etc.
Figure 4.3.1.a. 7 Aspects needed to have in mind for the forecasting of the
inventories

Continues Improvement and search of flexibility in the production plant
31 Beatriz Ferrer-Bonsoms / Danone
Non- Confidential
Batch size: It is a fact that the variation of the batch size of orders has a lot of repercussion
for determining the production of lots in the multiformat production lines. The amount that
might be produced for each format needs to be determined taking into account this aspect.
Supply lean-time: Font Vella has clients in all the territory of Spain. The transport time to
deliver the order is distributed between Font Vella Sacalm (with a 70% of the total
distribution), Font Vella Sigüenza (with a 30% of the total distribution) Factories are as
shown in the following figure. The plant of Lanjaron in Granada takes the territories of
Andalucía for the distribution.
The time of delivery, the mean of transport, etc are factors that affect the total supply chain
cost that should be considered for planning the inventories.
Planned promotions: Promotions for a specific period in the year can make changes in the
planned inventory. It is very important the good coordination between the central office
that manages the deadlines of the promotions and the industrial plant and supply chain in
order to sell all products within the period indicated and not have over stock at the end of
the period.
4.3.2. Stocks Types:
Inventories are made to hide or control these operational issues in order to have a good
quality of service. In case of a high inventory level bad quality of forecast could be masked,
Figure 4.3.1.b. Factories and FONT VELLA influences in Spain

Continues Improvement and search of flexibility in the production plant
32 Beatriz Ferrer-Bonsoms / Danone
Non- Confidential
but because a lot of factors cannot be controlled 100% it is possible that the bad quality of
forecast appear.
The best way to reduce the inventory is to decompose the stock in components and
functions. Each stock component has the function of covering one or more operational
issues in the plant distribution, demand variability, etc.
In the plant of Sant Hilary, for the distribution of water bottles we can find the following
types of stock:
TYPE WHY? DRIVERS PATTERN
SE
CU
RIT
Y Planned buffer inventory
to protect against stock outs due to unexpected variation in demand and/or supply.
Lead times
Supply uncertainty
Forecasting accuracy
Service levels
AN
TIC
IPA
TIO
N Stock to prevent possible
issue if the is no enough finished product for a planned event in the time when it is needed.
Availability of raw materials and production resources.
Sales seasonality
Promotions
CY
CL
IC
Inventory that is procured produced and replenished in regular quantities to meet expected demand.
Supplier economics
Production economics
Transportation economics
Figure 4.3.2.a. High inventory level enables to mask the problems
Figure 4.3.2.b. Tables with the types of stocks and their properties
Continues Improvement and search of flexibility in the production plant
33 Beatriz Ferrer-Bonsoms / Danone
Non- Confidential
All the possible operational issues in the plant are covered by these three inventories. As we
can see the security stock is stable and do not have variability during the year. Nevertheless
every 3 and half months the security stock need to be sold as it cannot be sold after.
The cyclic and anticipation stock have a direct dependence with the production in lines.
Continues Improvement and search of flexibility in the production plant
34 Beatriz Ferrer-Bonsoms / Danone
Non- Confidential
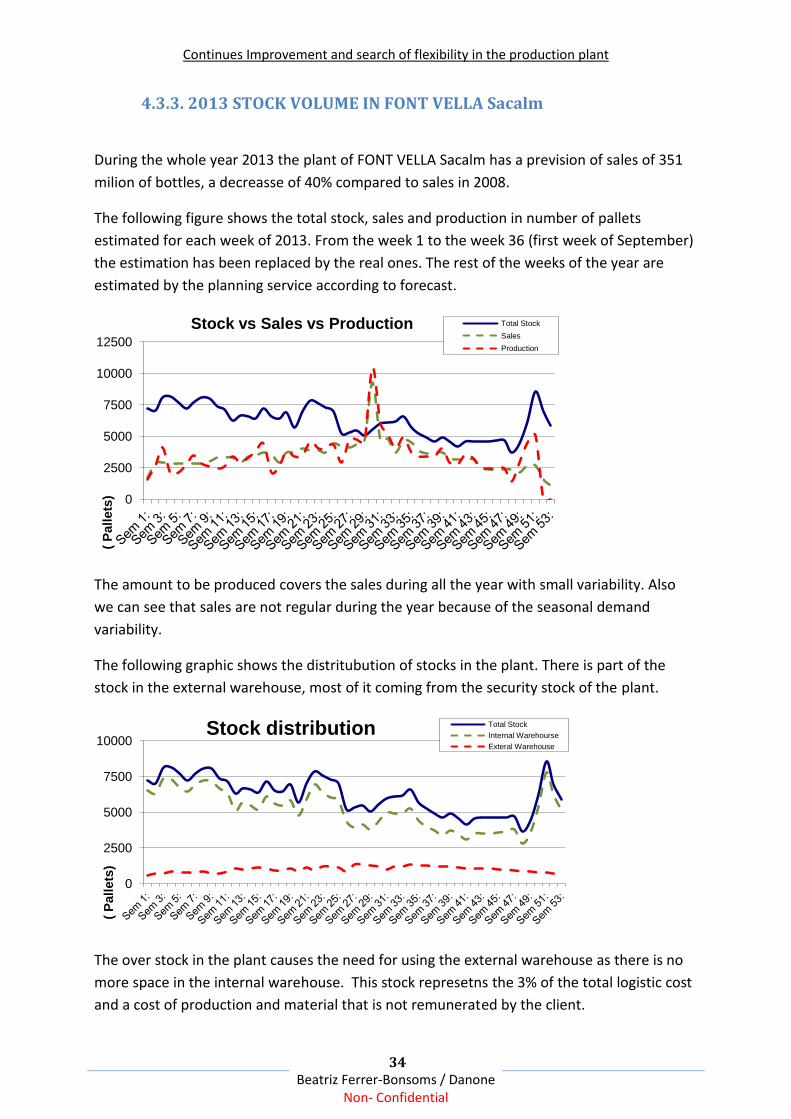
4.3.3. 2013 STOCK VOLUME IN FONT VELLA Sacalm
During the whole year 2013 the plant of FONT VELLA Sacalm has a prevision of sales of 351
milion of bottles, a decreasse of 40% compared to sales in 2008.
The following figure shows the total stock, sales and production in number of pallets
estimated for each week of 2013. From the week 1 to the week 36 (first week of September)
the estimation has been replaced by the real ones. The rest of the weeks of the year are
estimated by the planning service according to forecast.
The amount to be produced covers the sales during all the year with small variability. Also
we can see that sales are not regular during the year because of the seasonal demand
variability.
The following graphic shows the distritubution of stocks in the plant. There is part of the
stock in the external warehouse, most of it coming from the security stock of the plant.
The over stock in the plant causes the need for using the external warehouse as there is no
more space in the internal warehouse. This stock represetns the 3% of the total logistic cost
and a cost of production and material that is not remunerated by the client.
0
2500
5000
7500
10000
12500
( P
all
ets
)
Stock vs Sales vs Production Total Stock
Sales
Production
0
2500
5000
7500
10000
( P
all
ets
)
Stock distribution Total Stock
Internal Warehourse
Exteral Warehouse

Continues Improvement and search of flexibility in the production plant
35 Beatriz Ferrer-Bonsoms / Danone
Non- Confidential
The optimal situation is represented in the following graphic where the production have the
same level of the sales:
In this case the stock could be zero because every volume produced would directly be sent
to the client, but there are lots of aspects that have an impact in the amount that is really
sold to the client. There is a need for balancing production capacity and forecasting to
reduce stock and production level.
0
2500
5000
7500
10000
( P
all
ets
)
Optimal Situation Sales
Production

Continues Improvement and search of flexibility in the production plant
36 Beatriz Ferrer-Bonsoms / Danone
Non- Confidential
4.4. Industrial Optimization:
In the following point of the study I will focus on the optimization of the performance
efficiency of the lines in order to reduce the inventory level. The final objetive is to reduce
total production costs making balance between the industrial and supply chain areas.
All operators and managers in the plant target their work in the production line. The
production of bottles is the final mision of the plant and every action, they performe have a
direct influence, and a meassure of added value to the production. The situation is very
diferent from working in the siege in Barcelona where the production is not visual and their
work have a long term positive effect on it.
“Regarless of the product or production type, all plants are integrated. Each of the functional
groups , such as purchasing, maintenance, and production, depend on other functions.
Without an integrated, coordinted effort of all functional groups, reasonable levels of
performance cannot be achive.” 6
Along the day, production operators and middle managers are continually working to solve
mechanical problems in production line. It is mandatory the total implication and well
coordination among functional groups in order to achieve more efficiency.
4.4.1. Division of the calendar time:
Following the clasification of the inventory’s types for the analysis of the factors that cause
variations in the sales and production volumnes, the factors that affect the efficiency of
bottle production is classificated according to its nature by the following division of the
calendar annual time:
The total calendar time of 24h 365 days of the whole year, is reduced to an available time by
the holidays days (christmas day, first day of the year, local holidays, etc) giving to the
company a total of 349 days of legally available time to run the line.
6 R. Keith Mobley, “Total Plant Performance Management”
Figure 4.4.1.a. Division of the calendar time

Continues Improvement and search of flexibility in the production plant
37 Beatriz Ferrer-Bonsoms / Danone
Non- Confidential
The available time is reduced to the called disposable time, time in which the equipment
could be used, but production is not scheduled because there are no production orders
planned. This time can be used for machine-up-grade or overhauls. The volumens decres
had reduced the disposable time to week days working in Sant Hilari. Taking out the 104
week-end days the plant produced 245 days.
For the maintenance and cleaning of the machines and equipment, the plant needs to stop
the production. This time is called Planned non operational time and in the plant needs:
6 days of trials non productive,
11 planned maintenance and
1 factory quality stop.
Finally the time expected where the equipments are planned to be operated for production
purposes, called operational time, is 227 days, 5544 hours/year.
Division of the operational time:
In order to prepare the started of the production with an equipment changover, sanitation
and rution cleaning within the week, etc. the lines are stoped, this time is called rutin
production activites and depends on each of the lines.
The production time is the time in which the line is producing bottles, the line is running.
There exist unexpected stoppages: time when the machine is unexpectedly stopped by
identifiable and non-routin events. It is classified under the 4 categories:
1. Technical downtimes
2. Technological downtimes
3. Organizational downtimes
4. Time and waste adjustments
As mentioned above, the production lines have continuous mechanical problems that can
make the machine stop for a certain time. Also problems in the quality results of the bottles
is a factour that the operators controlled and stoped the line if necessary.
“Operators in the assembly cell can stop the production flow whenever they note anything
suspicious. Mechanical and human autonomation prevent defective items from progressing
into subsequent stages of production, prevent the waste that would result form production a
series of defective items, and prevent overproduction.” (lean p 320)
The net production time is then the time in which the line is producing at it’s normal speed
certain quantity of finish products. In the plant of FONT VELLA Sant Hilari this time is reduced
to 188 days provided from Agost for the 2013 year.
188 net production days 50% total calendar time

Continues Improvement and search of flexibility in the production plant
38 Beatriz Ferrer-Bonsoms / Danone
Non- Confidential
The machines, the human resources, etc. of all the year amortization and cost need to be
compensated by the production of the bottles during this production time. For this reason,
the more the production line produced and solds the more balance will be between the total
cost and the gain coming from the customers purchases.
At this point, I would like to show that the manufacturing and in our case, the production of
bottle waters, requiers a lot of performance from managers and operators in order to
produced at nominal speed the more time possible in order to exploit the inversion and
resources of the plant. The measure of the profit of time and resources of the plant is
meassured by some of the indicators that are shown in the following point.
4.4.2. Calculation of the indicators
There exists 3 indicators used tu define the distribution of the total calendar time in a plant
and each one measures the diferences between two sections of time:
The Operational Utilisation OU is calculated by the following formula:
The results of each line performance is measured by the indicator OE, Operatinal Efficiency.
It is measure by the following formulle:
Nominal Speed Speed expected of the line
Result for the 2013 (January to Agost): 80%
Figure 4.4.2. Division of the calendar time for the calculation of the indicators

Continues Improvement and search of flexibility in the production plant
39 Beatriz Ferrer-Bonsoms / Danone
Non- Confidential
The production efficiency is the indicator that take into account all the unexpected
stoppages during the operational time:
Middle Time Between Failures, is an indicator that measures the middle time of the stops in
the line production during a certain period of time
Indicators are the measure of operators, middle managers and managers of the plant for the
continuous improvement in the delivery of the product. Each day the OE is calculated for
each one of the lines and comented during the AIC meetings to find out the reasons why of
the improvements or worsening of the results.

Continues Improvement and search of flexibility in the production plant
40 Beatriz Ferrer-Bonsoms / Danone
Non- Confidential
4.4. Practic case line I and H:
Formats 2,5 L and 6,25 L
The formats of 2,5 L and 6,25 L are produced in the plant of FONT VELLA as a big a middle format of
bottles. The format of 2,5 L was introduced recently as a middle Family format, between the 1,5 L
and 6,26 L.
The line I produces bottles of 6,25 L and 2,5L, the high
demand of the 6,25L requires another line production for
this format having the line H that produced only 6,25L. The
production planning of the line I, as the rest of the lines
multi formats, is a critical factor in order to quantify the
production of each volume bottles.
This practice case has the objective of planning one week
production of the line I during the high period summer
demand, last week of August.
Demand of the two formats:
The planning of the two bottles formats depend on the demand of each one of the formats. The
following graph shows the demand prediction for the two bottles formats during the year 2013.
The week that is going to be represented is the 35 of the year, from the 26th to the 30th of August.
As we can see the prediction of the demand for the 6,25 liters is 250 kilo bottles higher during the
first half of the year with a peak in the 30th week for each of the volumes. From the week 30th to the
0
100
200
300
400
500
600
700
800
900
( k
Bo
ttle
s)
Demand forecast Sales 6,25
Total Sales 2,5
Figure 4.4. FONT VELLA bottles of
6,25 L and 2,5 L

Continues Improvement and search of flexibility in the production plant
41 Beatriz Ferrer-Bonsoms / Danone
Non- Confidential
end of the year, we can see that there is a slow reduction of the volumes demanded for each one of
the volumes.
Capacity of lines production:
For each one of the lines, it has been calculated the performance of the lines measured in speed
production of bottles in each week with the productioin results of August. This is a simple way to
represent the production capacity for the observation of the demand.
Line H Speed of production 319 kilo bottles/week
The production of the line I needs to cover the production of the
264 kbotles aren’t possible to be covered by the production in the 30th week of the year. As seen, the
lines are not over charged a cause of the reduction of the demand. The capacity of production of the
lines is higher than the demand.
0
100
200
300
400
500
600
700
800
900
( k
Bo
ttle
s)
Volumen covered by line H Sales 6,25
Total Sales 2,5
Production max 6,25 H
-100
0
100
200
300
400
500
600
700
( k
Bo
ttle
s)
Volume to be covered by line I
Volume to be covered by line I
Production max I (2,5 and 6,25 L)

Continues Improvement and search of flexibility in the production plant
42 Beatriz Ferrer-Bonsoms / Danone
Non- Confidential
Capacity of the line15800 kilo bottles
in the whole year. Taking into account
the OU (Operational Utilization) and the
performance of the line, in final the PE
(Performance Efficiency) of the line.
Production needed 5262 kilo bottles,
only the 30 % of the total capacity of the
line.
The ressources provided for the production of the bottles of 2,5 L and 6,25 L need to be reduced in a
70% as the same time of the volumen in order to decreasse the cost of production of one bottle.
Industrial cost:
The industrial cost that are associated to the production of one bottles water the following ones:
Labor cost: cost of the operators and the technicians.
Useful cost: Energy in electricity and combustible
Machine cost: amortization, spare parts and project investment.
Overhead cost: labor indirect, not directly working into the line production.
The labor cost and utility cost are the ones that are variable. This costs can be reduced or increased
depending on the production volumen, and therefore influence the performance of the plant.
Instead, the machine and overhead cost are fixed, they can not be reduced acording to the
performance or volume of the plant.
It is important to point that this calculation is not 100% real. It is rather an aproximation of the reality
in order to compare values.
0,00%
10,00%
20,00%
30,00%
40,00%
50,00%
60,00%
LABOR cost USEFUL rate MACHIN cost OVERHEAD cost
0
5.000
10.000
15.000
20.000
Production Line I
5.262
10.538
Max Capacity
Production needed

Continues Improvement and search of flexibility in the production plant
43 Beatriz Ferrer-Bonsoms / Danone
Non- Confidential
Variable costs are the ones that can be atributable to the Operational Efficiency of the production
line: How much the variable cost is reduced by an improvement of the OE?
An increase of the OE means an improvement of the performance and speed of the production lines,
produciong more bottles during the total operatinal time. These improvement suppose a reduction
of the total operatinal time and therefore the labor hours of the operators:
*To make more simple the calcul the “Total labour hours” has been considered constant
A decrease of the OE have an indirect relation with the total labor hours and the labor cost. As
mencioned, the increase of change overs produce can reduce the OE result and therefore an increase
in the industrial cost.
The results of the 36th week of the year in the line I has been the following ones:
26 27 28 29 30
T. NET 20,86 21,28 14,37 13,48 13,48
T. OPER. 23,00 23,00 24,00 16,00 16,00
OE 90,70% 92,52% 59,88% 84,25% 84,25%
The only day that there was a change of format was the Thursday 28th. The time of change over was
3,5 hours stoped mor 1,5 hours in which the line runned with continues stoppes and need of
ajustments.
Logistic cost:
The variable cost of the logistic area is going to be reduced to the Expedictions, Inbound,
Warehousing and Handling cost: total 29 % of the total Supply Chain cost.
0,00% 10,00% 20,00% 30,00% 40,00% 50,00% 60,00%
% weight vs total supply chain

Continues Improvement and search of flexibility in the production plant
44 Beatriz Ferrer-Bonsoms / Danone
Non- Confidential
The cost has been simplified in order to give a realtion between them and the performance
indicators.
The relation between this cost and the indicator DPD, Direct Product Delivery, is the following one:
Number of pallets inbound = Total number of transports – Number of pallets outbound
Results of DPD of the 36th week of the year with the quantities of stocks expressed in pallets:
TOTAL 26 27 28 29 30
W Ext. W W Ext. W W Ext. W W Ext. W W Ext. W
Initial 5731 13087 5753 13586 5619 14508 6750 15075 6750 15103
In 1564 598 1424 985 2643 665 1095 92 1208 80
Out 1542 99 1558 63 1512 98 1095 64 1095 76
End 5753 13586 5619 14508 6750 15075 6750 15103 6863 15107
DPD 72,06% 61,27% 69,45% 92,25% 93,19%
Relation between both areas and conclusion:
It has been calcuted that increasing the number of changer over during the week from 1 to 3 the OE
of would decrease to 60 % aprox (see calcul in annexe). This decrease can increase the industrial cost
in a 0,01% of the total labour cost.
Nevertheless the level of the cicle stock would decrease during the days 27, 28, 29 and 30
consideratly for this two volumens bottles. This disminution can decrease the supply chain in a 0,1%
aproximatly because the number of pallets needs to be send to the Regulator can be reudced in 100
pallets.
This example show that the disiminution of the level demand can be also seen like an oporntunity to
decrease the level of the cicle stock by increasing the number of change overs. The sum of the
variable cost of both industrial and loggistic area are reduced.
Finally, the procedure of DaMaWay called SMED is also a way to win in flexibility as it suppose a
reducion of the OE and therefore a balance between the industrial and supply that suppose a
reduction of stock and cost more considerable.

Continues Improvement and search of flexibility in the production plant
45 Beatriz Ferrer-Bonsoms / Danone
Non- Confidential
5. CONCLUSION:
In the every day more competitive market it is necessary to integrate a culture of continues
improvement in the production plant. Lean Manfacturing System aims to follow this idea with a
methodology or work base in the elimation of every acction or ressource that doesn’t added value to
the final product. DaMaWay, Danone Management Way, integrate this methodology with a culture
based in the devellopement at all levels of the organization.
AIC, ZONNING and SMED are three DaMaWay tools used by all employers in the fabric. The first one
have the main objective of sincronizing the action of all funtions and the second put in practice the
ergonomi in the work and facilite the authonomy of the operator in his post of work. Finally, when
both the AIC and ZONNING are integrated in the plant, the procedure SMED can be applied in order
to reduce the time in change overs.
The sincronization of all departments that are involved in the order to delivery process of the bottles
production is the first step to get to the flexibility. The second step could be breaking the barriers to
continues improvement and finally the “sacrification” of the performance in an area to reduce cost
might be necessary.
The reduction of the volume demand in FONT VELLA has been seen like an oportunity to focus into a
reduction of the actions and ressources that not give value to the product and therefore grow in
performance.
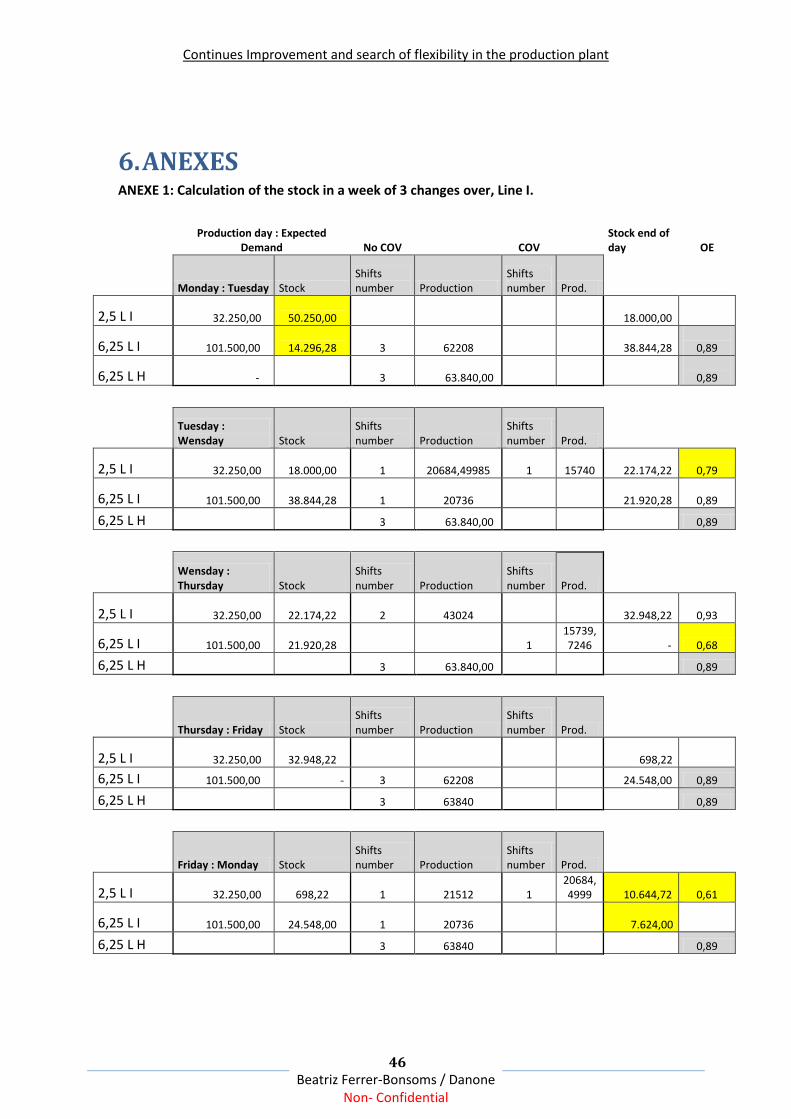
Continues Improvement and search of flexibility in the production plant
46 Beatriz Ferrer-Bonsoms / Danone
Non- Confidential
6. ANEXES ANEXE 1: Calculation of the stock in a week of 3 changes over, Line I.
Production day : Expected Demand No COV
COV
Stock end of day OE
Monday : Tuesday Stock
Shifts number Production
Shifts number Prod.
2,5 L I 32.250,00
50.250,00 18.000,00
6,25 L I 101.500,00
14.296,28 3 62208 38.844,28
0,89
6,25 L H - 3 63.840,00
0,89
Tuesday : Wensday Stock
Shifts number Production
Shifts number Prod.
2,5 L I 32.250,00
18.000,00 1 20684,49985 1 15740 22.174,22 0,79
6,25 L I 101.500,00
38.844,28 1 20736 21.920,28 0,89
6,25 L H 3 63.840,00 0,89
Wensday : Thursday Stock
Shifts number Production
Shifts number Prod.
2,5 L I 32.250,00
22.174,22 2 43024 32.948,22 0,93
6,25 L I 101.500,00
21.920,28 1 15739,7246 - 0,68
6,25 L H 3 63.840,00 0,89
Thursday : Friday Stock
Shifts number Production
Shifts number Prod.
2,5 L I 32.250,00
32.948,22 698,22
6,25 L I 101.500,00 - 3 62208 24.548,00 0,89
6,25 L H 3 63840 0,89
Friday : Monday Stock
Shifts number Production
Shifts number Prod.
2,5 L I 32.250,00
698,22 1 21512 1
20684,4999 10.644,72 0,61
6,25 L I 101.500,00
24.548,00 1 20736 7.624,00
6,25 L H 3 63840 0,89
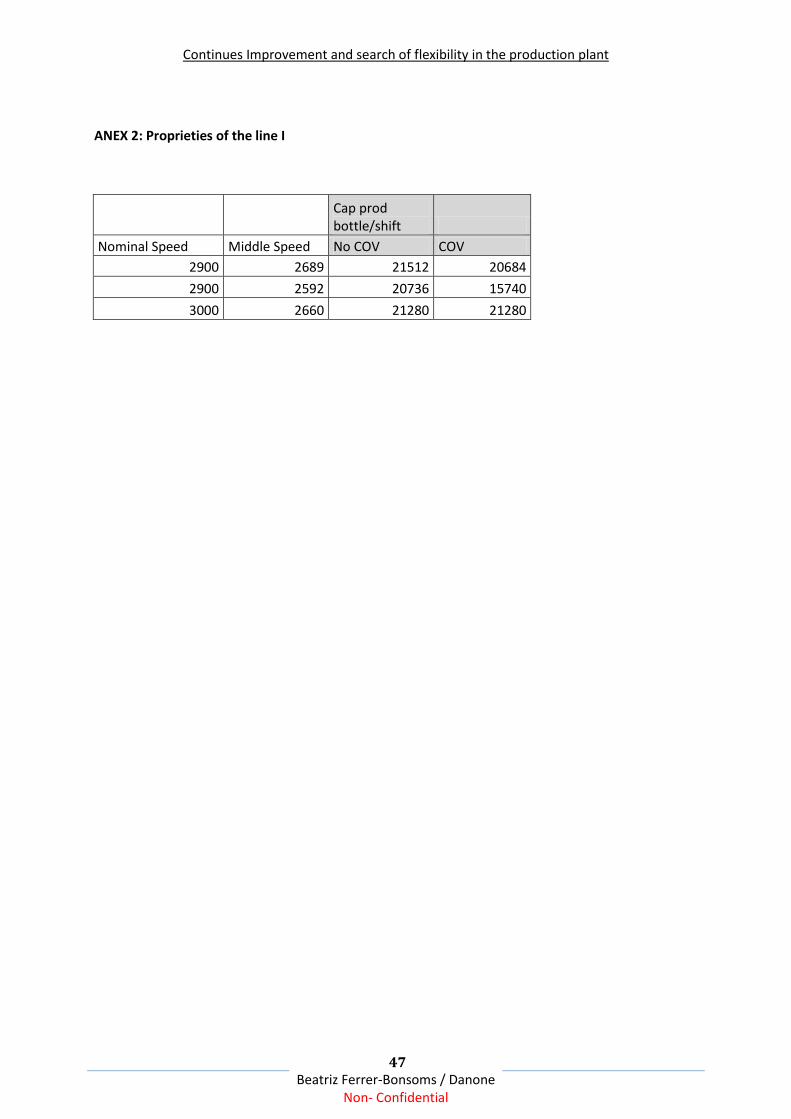
Continues Improvement and search of flexibility in the production plant
47 Beatriz Ferrer-Bonsoms / Danone
Non- Confidential
ANEX 2: Proprieties of the line I
Cap prod bottle/shift
Nominal Speed Middle Speed No COV COV
2900 2689 21512 20684
2900 2592 20736 15740
3000 2660 21280 21280

Continues Improvement and search of flexibility in the production plant
48 Beatriz Ferrer-Bonsoms / Danone
Non- Confidential