final project report - university of kansas · pdf filefinal project report ... 4.4 vane shear...
TRANSCRIPT
CE788: Geotechnical Engineering Testing (Spring 2015)
FINAL PROJECT REPORT
Submitted By
Al – Naddaf, Mahdi Abbas Mahdi
Jiang, Yan
Mohammed, Hemim Jalal
Neupane, Madan
Submitted to
Jie Han, Professor
Due Date 05/12/2015
Group 2: Final Project Work - Report
1
Table of Contents
Table of Contents ............................................................................................................................ 1
1. Acknowledgments ................................................................................................................... 6
2. Executive Summary ................................................................................................................. 6
3. Introduction ............................................................................................................................. 6
4. Physical Conditions ................................................................................................................. 8
3.1. Climate ............................................................................................................................. 8
3.2. Topography and Drainage ................................................................................................ 9
3.3. Regional Geology and Seismicity .................................................................................. 10
3.4. Soil Survey Mapping ...................................................................................................... 11
3.5. Sub-surface Conditions .................................................................................................. 13
5. Field Exploration ................................................................................................................... 14
4.1 Bore Hole Preparation .................................................................................................... 14
4.2 Drilling and Sampling .................................................................................................... 15
4.3 Standard Penetration Test (SPT) .................................................................................... 16
4.4 Vane Shear Test ............................................................................................................. 18
4.5 Pressure Meter Test ........................................................................................................ 18
Group 2: Final Project Work - Report
2
4.6 Direct Push Bull Sampling ............................................................................................. 20
6. Laboratory Testing ................................................................................................................ 21
5.1 Specific Gravity Determination ..................................................................................... 21
5.2 Grain Size Distribution of Soil ....................................................................................... 21
5.3 Atterberg Limit Determination....................................................................................... 22
5.4 Consolidation of Sample ................................................................................................ 22
5.5 Unconfined Compression Test ....................................................................................... 24
5.6 Consolidated Undrained Test ......................................................................................... 25
7. Foundation Recommendations .............................................................................................. 28
6.1 Foundation Design Recommendation ............................................................................ 28
6.2 Foundation Construction Considerations ....................................................................... 30
8. Conclusions and comments ................................................................................................... 30
9. References ............................................................................................................................. 31
10. Appendix B: Boring log Sheet ........................................................................................... 37
11. Appendix C: Field Test Data Sheet ................................................................................... 39
12. Appendix D: Lab Test Data Sheet ..................................................................................... 43
13. Appendix F: The Calculation of Vertical Bearing Capacity of a Single Pile .................... 47
Group 2: Final Project Work - Report
3
14. Appendix G: The Calculation of settlement of a Single Pile ............................................. 50
List of Tables
Table 3-1 Lawrence Climate. (Places, 2015) .............................................................................. 8
Table 3-2 Subsurface Conditions ............................................................................................... 13
Table 4-1 Location of Boreholes, Types of Digging and Activities Performed ..................... 15
Table 4-2 SPT Measured and Corrected N Values and Other Outcomes ............................. 17
Table 4-3 Vane Shear Test Results ............................................................................................ 18
Table 4-4 Result from Pressuremeter Test ............................................................................... 20
Table 5-1 Results from 1-D Consolidation Test ....................................................................... 22
Table 5-2 Results from CU Test ................................................................................................ 26
Table 6-1Recommended pile foundation .................................................................................. 28

Group 2: Final Project Work - Report
4
List of Figures
Figure 3-1 Lawrence Climate (Places, 2015) .............................................................................. 9
Figure 3-2 Boreholes locations ................................................................................................... 10
Figure 3-3. Micro-earthquakes (*) and faults (/) in Kansas (Burchett, Luza, Van Eck, &
Wilson, 1983) ............................................................................................................................... 11
Figure 3-4. Pattern of Soils in Martin-Sogn-Vinland Association in Douglas County, KS
(Deckey, Zimmerman, Plinsky, & Davis, 1977) ....................................................................... 12
Figure 4-1: Test Site Location and Demarcation ..................................................................... 14
Figure 4-2: Drill Hole Preparation by Removing Top Paved Part ........................................ 15
Figure 4-3 Location of Shelby Tube Sampling ......................................................................... 16
Figure 4-4 Location of Standard Penetration Test at Different Boreholes ........................... 17
Figure 4-5 Volume and Pressure Calibration of Pressuremeter ............................................ 19
Figure 4-6 Corrected Pressuremeter Curve Showing Elastic Range and Plastic Range ..... 19
Figure 5-1 Gradation Curve of the Sampled Soil .................................................................... 21
Figure 5-2 Void Ratio versus Pressure Curve (Log Scale) ...................................................... 23
Figure 5-3 Taylor`s root time method ....................................................................................... 23
Group 2: Final Project Work - Report
5
Figure 5-4 Casagrande's log t Method ...................................................................................... 24
Figure 5-5 Stress versus Strain Curve of Unconfined Compression Test.............................. 25
Figure 5-6 Deviator Stress versus Strain Curve of CU Test ................................................... 26
Figure 5-7 Normal Stress versus Axial Strain Curve .............................................................. 27
Figure 5-8 Mohr Column Failure Envelope ............................................................................. 27
Figure 6-1 Soil profile for the design of the piled foundation ................................................. 29
Figure 9-1. KU Central District Plan (dcm.ku.edu) ................................................................ 33
Figure 9-2. Site Location Plan.................................................................................................... 35
Figure 9-3. Borings Location plan ............................................................................................. 35
Figure 9-4. Topography map of Test Location (3) ................................................................... 36
Figure 10-1. Subsurface Exploration and Sampling Sheet (˂19 feet depth) ......................... 37
Figure 10-2. Subsurface Exploration and Sampling Sheet (>19 feet depth) ......................... 38
Group 2: Final Project Work - Report
6
1. Acknowledgments
Thanks to Kansas department of transportation (KDOT) for providing the necessary equipment
for the tests were conducted for this report. Thanks to CEAE department also for the facilities
they provided for this report.
2. Executive Summary
A geotechnical investigation has been conducted for a two-storey building close to Burge Union.
Based on the information from the subsurface exploration, field in-situ tests, and lab tests, the
following geotechnical summaries were given:
From the field test, the undrained shear strength of the foundation soil was very high. The
undrained shear strength were an average of 72 kPa from SPT test, 92.4 kPa from Vane shear
test (undisturbed) and 71 kPa from pressruemeter test.
This result was supported by the laboratory test as the unconfined compressive gives the
undrained shear strength of 94.8 kPa. So, the foundation is strong enough to support probable
foundation. Also, from consolidation test, it was found that the filed was over consolidated. Also,
the permeability of the soil is very small.
3. Introduction
This report presents the results of the subsurface exploration and geotechnical engineering
services performed for a new construction planned to be located at the Child Care Drive, west of
Burge Union, at the campus of University of Kansas (KU), Lawrence, Kansas, as shown in
Group 2: Final Project Work - Report
7
Appendix A-Figure 7 and Figure 8. The purpose of these exploration and geotechnical
engineering services is to provide information and geotechnical engineering recommendations
relative to:
Subsurface soil conditions
Groundwater conditions
Foundation design and construction
Estimated seismic site class
Earthwork
Construction considerations
Lateral earth pressures
The geotechnical scope of work for this project included the advancement of five boreholes,
only three of them were conducted to a depth about 17½ ft below the existing grade in the area of
the proposed new construction, as shown in Appendix A-Figure 9 The boreholes were conducted
by a geotechnical group of KDOT using their advanced equipment for testing and analyzing a
geotechnical characteristics of the soil at that location.
In this context, the graduate students at CE 788 class in the school of engineering at KU
conducted a laboratory tests on the Shelby tube samples were extracted from the boreholes. The
students were divided into three groups. Group 2 performed four types of geotechnical tests:
Atterberg limit test, hydrometer test, one dimensional consolidation test, and Consolidation
undrained triaxial test on the samples were pulled out from the borehole number 4 by Shelby
tube number 2 and 5.

Group 2: Final Project Work - Report
8
4. Physical Conditions
3.1. Climate
The climate of Lawrence, where the exploration and geotechnical engineering services were
conducted, gets more than 39 inches of rain per year, while the US average is 37 (Data, n.d.).
Snowfall is 13 inches, while the average US city gets 25 inches of snow per year, as shown in the
Table 1 and Figure 1.
On average, there are 211 sunny days per year in Lawrence. The highest temperature in
July is around 90 degrees. The January low is 18. Comfort index, which is based on humidity
during the hot months, is a 30 out of 100, where higher is more comfortable. The US average on
the comfort index is 44 (Places, 2015).
Table 4-1 Lawrence Climate. (Places, 2015)
Climate\Month Jan Feb Mar Apr May Jun Jul Aug Sep Oct Nov Dec Annual
Avg.
Average high
(°F) 38 44 55 65 74 83 89 88 79 67 54 41 64.8
Average
low (°F) 18 22 31 43 54 64 68 66 57 45 33 22 43.6
Avg.
Precipitation
(inch)
1 1.4 2.7 4.1 5.4 5.9 4.1 4.1 4.2 3.4 2.2 1.6 39.92
Average
snowfall (inch) 4 4 1 0 0 0 0 0 0 0 1 3 13

Group 2: Final Project Work - Report
9
Figure 4-1 Lawrence Climate (Places, 2015)
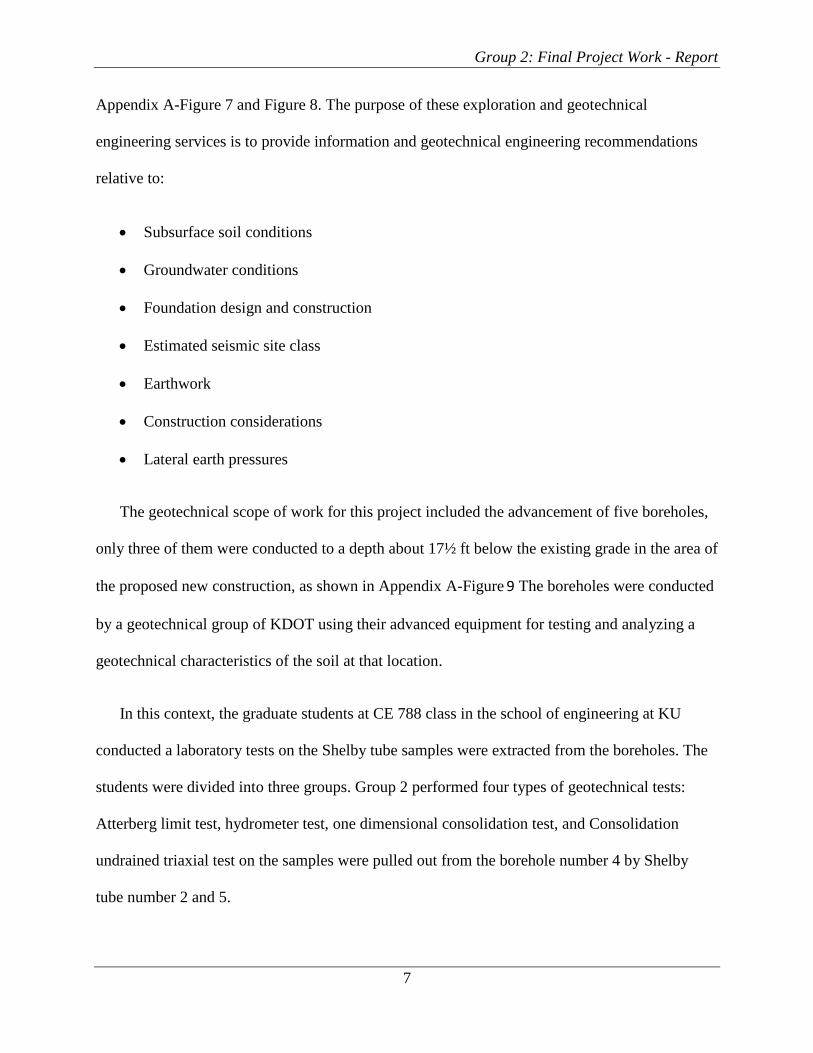
3.2. Topography and Drainage
The test location is located at 880 to 890 ft above sea level (pickatrail, n.d.), as shown in
Appendix A-Figure 10. The area, where the borings were conducted, was almost level. The
borings were in the park lot, which is paved by a 5.75 inches flexible pavement, as shown in
Figure 2. The boring area has a good drainage through the drain pipes were transfer the rainfall
water to the nearby opened drain channel.
Group 2: Final Project Work - Report
10
Figure 4-2 Boreholes locations
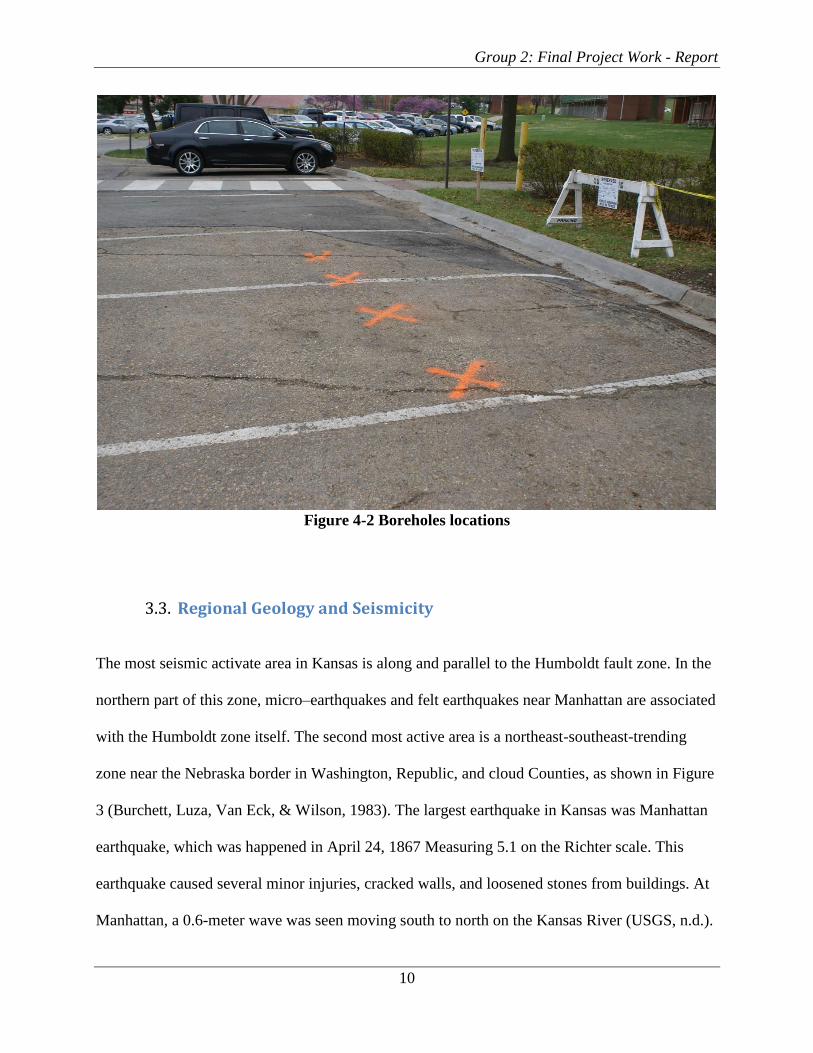
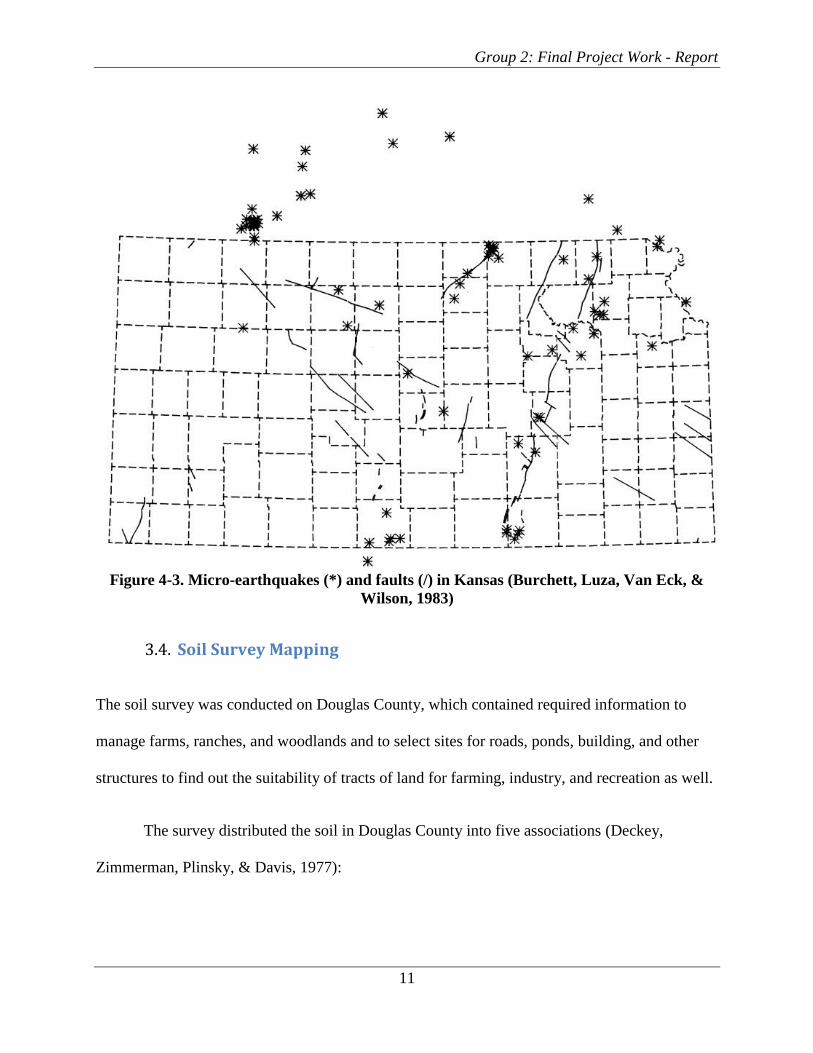
3.3. Regional Geology and Seismicity
The most seismic activate area in Kansas is along and parallel to the Humboldt fault zone. In the
northern part of this zone, micro–earthquakes and felt earthquakes near Manhattan are associated
with the Humboldt zone itself. The second most active area is a northeast-southeast-trending
zone near the Nebraska border in Washington, Republic, and cloud Counties, as shown in Figure
3 (Burchett, Luza, Van Eck, & Wilson, 1983). The largest earthquake in Kansas was Manhattan
earthquake, which was happened in April 24, 1867 Measuring 5.1 on the Richter scale. This
earthquake caused several minor injuries, cracked walls, and loosened stones from buildings. At
Manhattan, a 0.6-meter wave was seen moving south to north on the Kansas River (USGS, n.d.).
Group 2: Final Project Work - Report
11
Figure 4-3. Micro-earthquakes (*) and faults (/) in Kansas (Burchett, Luza, Van Eck, &
Wilson, 1983)
3.4. Soil Survey Mapping
The soil survey was conducted on Douglas County, which contained required information to
manage farms, ranches, and woodlands and to select sites for roads, ponds, building, and other
structures to find out the suitability of tracts of land for farming, industry, and recreation as well.
The survey distributed the soil in Douglas County into five associations (Deckey,
Zimmerman, Plinsky, & Davis, 1977):
Group 2: Final Project Work - Report
12
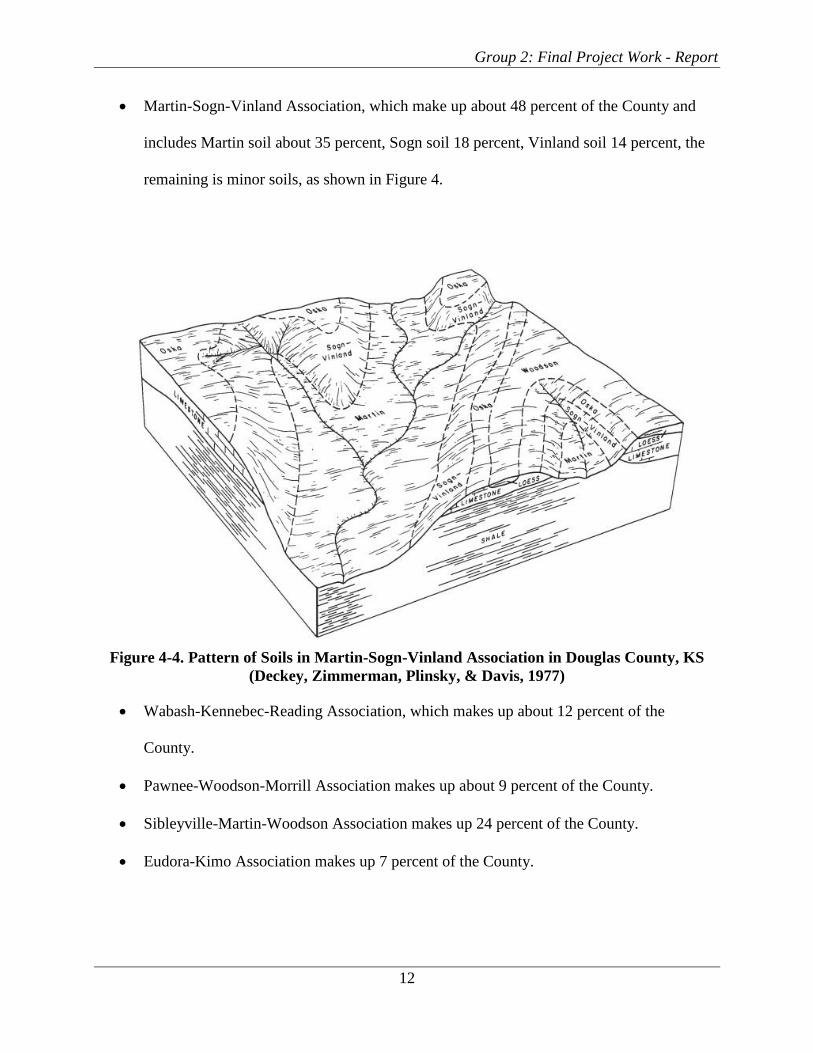
Martin-Sogn-Vinland Association, which make up about 48 percent of the County and
includes Martin soil about 35 percent, Sogn soil 18 percent, Vinland soil 14 percent, the
remaining is minor soils, as shown in Figure 4.
Figure 4-4. Pattern of Soils in Martin-Sogn-Vinland Association in Douglas County, KS
(Deckey, Zimmerman, Plinsky, & Davis, 1977)
Wabash-Kennebec-Reading Association, which makes up about 12 percent of the
County.
Pawnee-Woodson-Morrill Association makes up about 9 percent of the County.
Sibleyville-Martin-Woodson Association makes up 24 percent of the County.
Eudora-Kimo Association makes up 7 percent of the County.

Group 2: Final Project Work - Report
13
For dwelling and small commercial buildings, the survey recommend to build structures with
a foundation loads have a foundation load not more than three stories high on undisturbed soil.
For such structures, soil should be sufficiently stable that neither cracking (or subsidence from
settling) nor shear failure of the foundation occur. Soil wetness and depth to a seasonal high
water table indicate potential difficulty in providing accurate drainage for basements and gardens
(Deckey, Zimmerman, Plinsky, & Davis, 1977).
3.5. Sub-surface Conditions
Subsurface exploration and sampling at the boring locations are indicated on Appendix B
Stratification boundaries on the boring log in the data sheet represent the approximate location of
changes in material types. The transition between materials may be gradual or abrupt
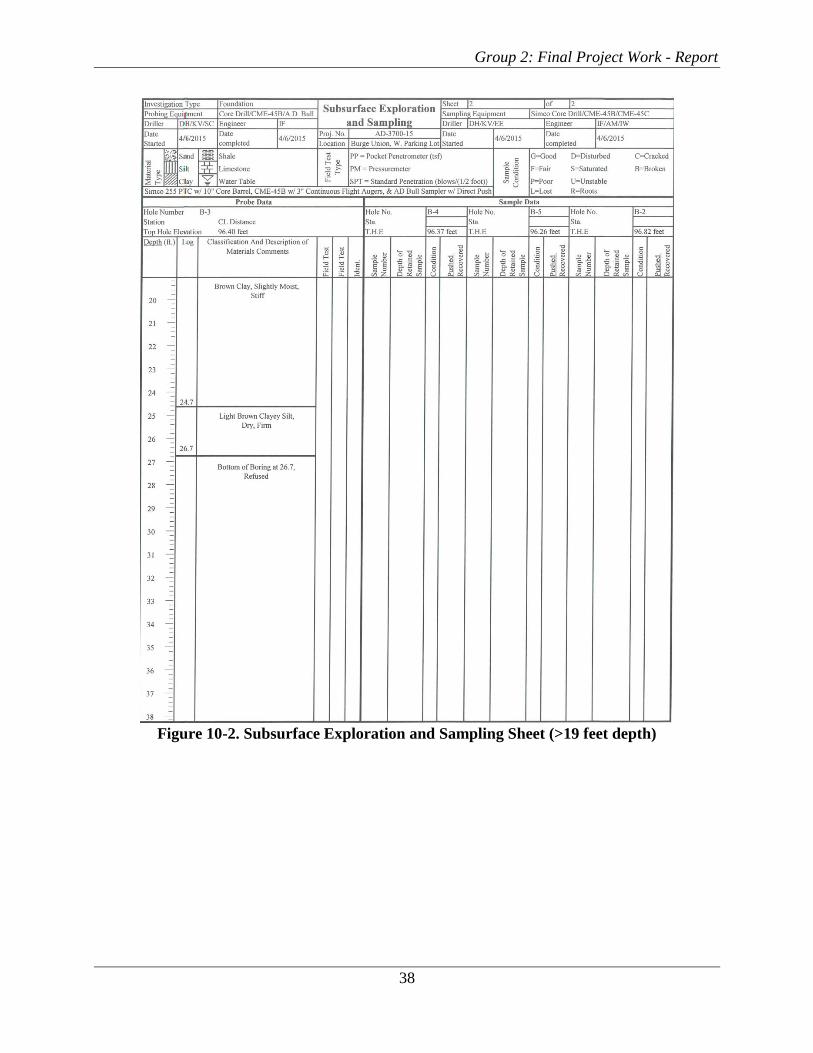
horizontally and vertically in-situ. Based on the results of the boreholes, subsurface conditions of
the project site can be generalized, as shown in the Table 2. After fourth stratum the hard layer of
soil was encountered. Therefore, bottom of boring at 26.7 feet refused.
Table 4-2 Subsurface Conditions
Stratum
Thickness
of Stratum
(feet)
Material Description Moisture Density
Surficial 0.6 Asphalt Pavement N/A N/A
1st Stratum 2.4 Dark brown and gray clay Very moist Stiff
2nd Stratum 13.5 Brown clay Moist, less moist
with depth Stiff
3rd Stratum 8.2 Brown clay Slightly moist Stiff
4th Stratum 2 Light brown clayey silt Dry Firm
Group 2: Final Project Work - Report
14
5. Field Exploration
4.1 Bore Hole Preparation
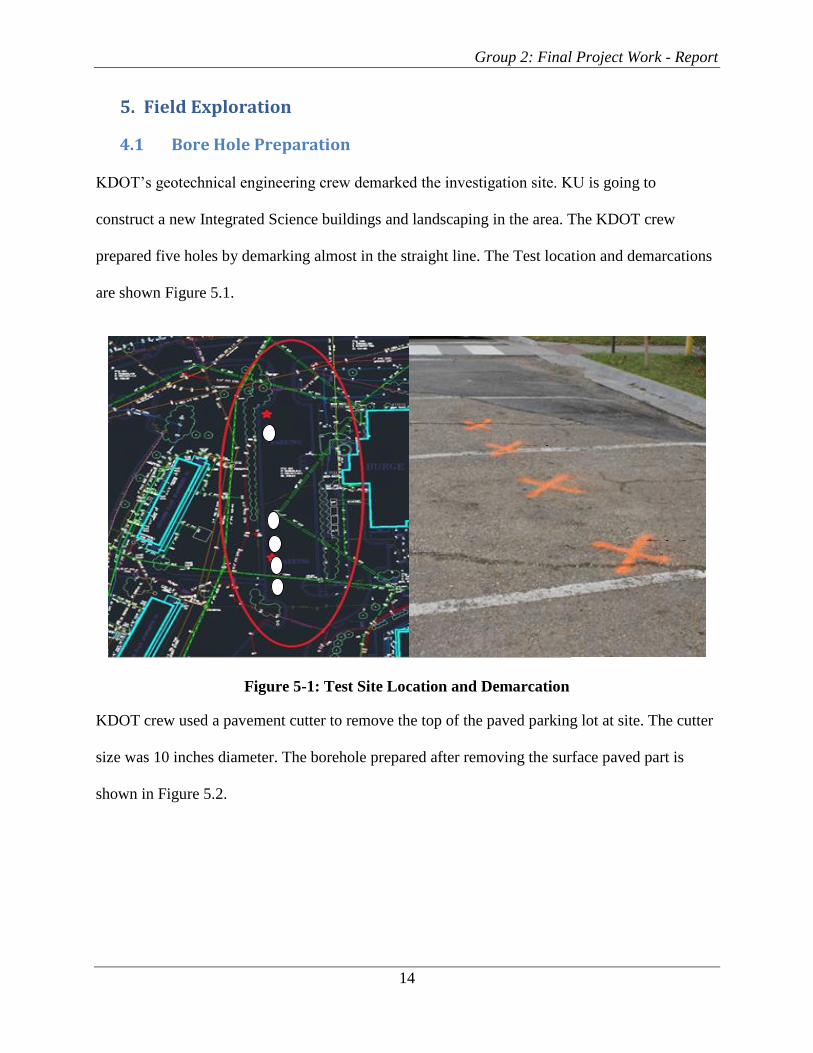
KDOT’s geotechnical engineering crew demarked the investigation site. KU is going to
construct a new Integrated Science buildings and landscaping in the area. The KDOT crew
prepared five holes by demarking almost in the straight line. The Test location and demarcations
are shown Figure 5.1.
Figure 5-1: Test Site Location and Demarcation
KDOT crew used a pavement cutter to remove the top of the paved parking lot at site. The cutter
size was 10 inches diameter. The borehole prepared after removing the surface paved part is
shown in Figure 5.2.
Hole
Hole
Hole 3
Hole 2
Hole 1
Group 2: Final Project Work - Report
15
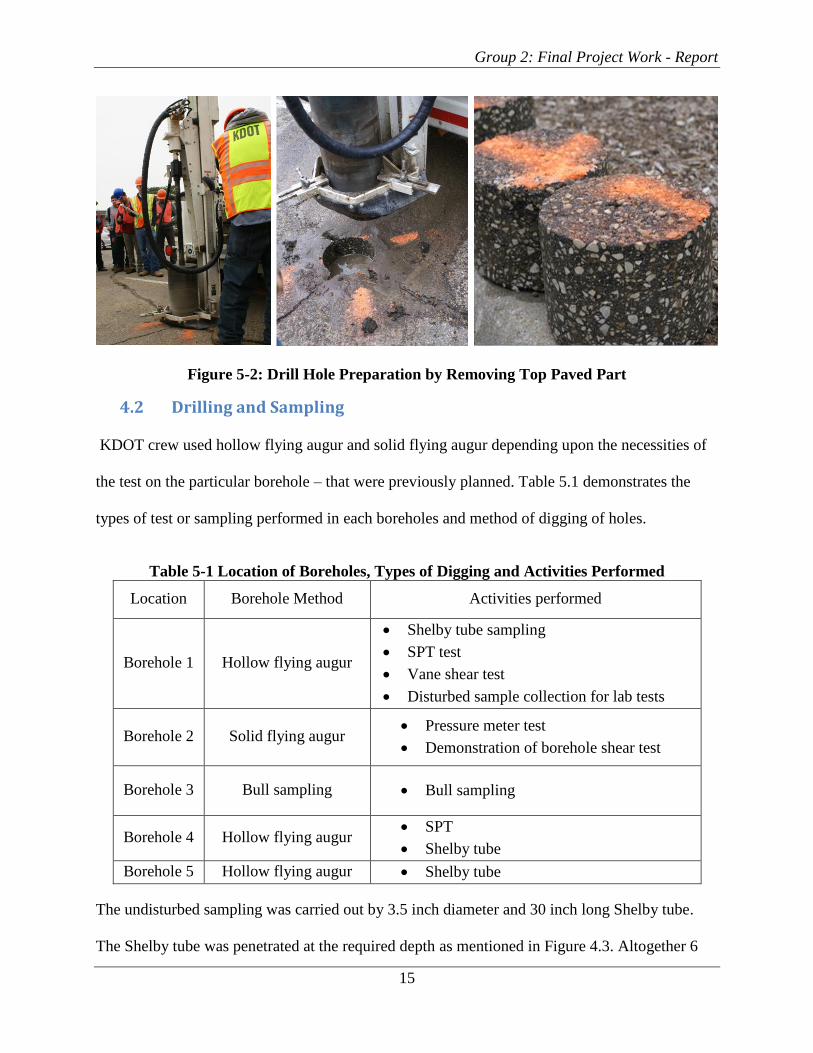
Figure 5-2: Drill Hole Preparation by Removing Top Paved Part
4.2 Drilling and Sampling
KDOT crew used hollow flying augur and solid flying augur depending upon the necessities of
the test on the particular borehole – that were previously planned. Table 5.1 demonstrates the
types of test or sampling performed in each boreholes and method of digging of holes.
Table 5-1 Location of Boreholes, Types of Digging and Activities Performed
Location Borehole Method Activities performed
Borehole 1 Hollow flying augur
Shelby tube sampling
SPT test
Vane shear test
Disturbed sample collection for lab tests
Borehole 2 Solid flying augur Pressure meter test
Demonstration of borehole shear test
Borehole 3 Bull sampling Bull sampling
Borehole 4 Hollow flying augur SPT
Shelby tube
Borehole 5 Hollow flying augur Shelby tube
The undisturbed sampling was carried out by 3.5 inch diameter and 30 inch long Shelby tube.
The Shelby tube was penetrated at the required depth as mentioned in Figure 4.3. Altogether 6

Group 2: Final Project Work - Report
16
sampling were carried out in Shelby tube. The locations (depth and area) of the Shelby tubes
sampling are given in Figure 5.3 and Figure 5.1.
Figure 5-3 Location of Shelby Tube Sampling
Some photographs regarding the boring and sampling are presented in Appendix C.
4.3 Standard Penetration Test (SPT)
Standard Penetration Test was carried out at borehole 1 and borehole 4 by inserting 2 inch
diameter split-spoon sampler at the different depth. The location of the SPT tests are shown in
Figure 5.4.
Borehole 1 Borehole 4 Borehole 5
7-8.5 ft
16-17.5 ft
Shelby tube 1 Shelby
tube 2
Shelby
tube 3
Shelby
tube 4
Shelby
tube 5 Shelby
tube 6
4.5-6.3 ft
ft
Group 2: Final Project Work - Report
17
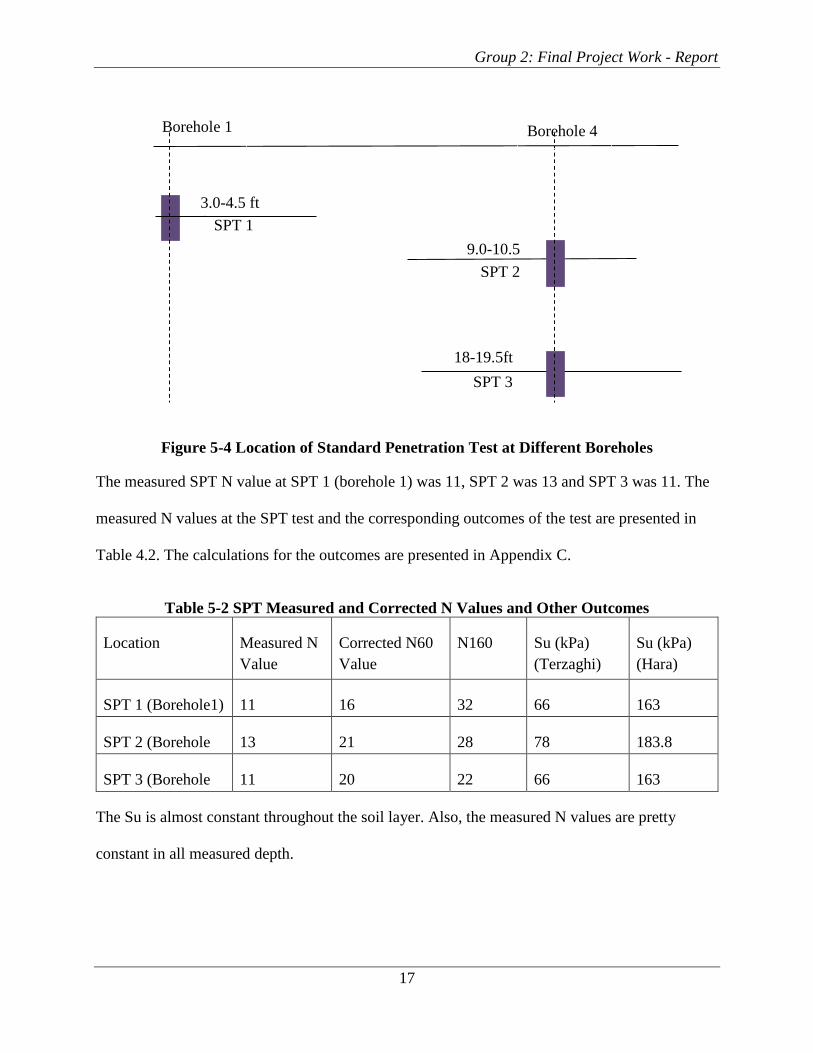
Figure 5-4 Location of Standard Penetration Test at Different Boreholes
The measured SPT N value at SPT 1 (borehole 1) was 11, SPT 2 was 13 and SPT 3 was 11. The
measured N values at the SPT test and the corresponding outcomes of the test are presented in
Table 4.2. The calculations for the outcomes are presented in Appendix C.
Table 5-2 SPT Measured and Corrected N Values and Other Outcomes
Location Measured N
Value
Corrected N60
Value
N160 Su (kPa)
(Terzaghi)
Su (kPa)
(Hara)
SPT 1 (Borehole1) 11 16 32 66 163
SPT 2 (Borehole
2)
13 21 28 78 183.8
SPT 3 (Borehole
2)
11 20 22 66 163
The Su is almost constant throughout the soil layer. Also, the measured N values are pretty
constant in all measured depth.
Borehole 1 Borehole 4
9.0-10.5
18-19.5ft
SPT 1
SPT 2
SPT 3
3.0-4.5 ft
ft
Group 2: Final Project Work - Report
18
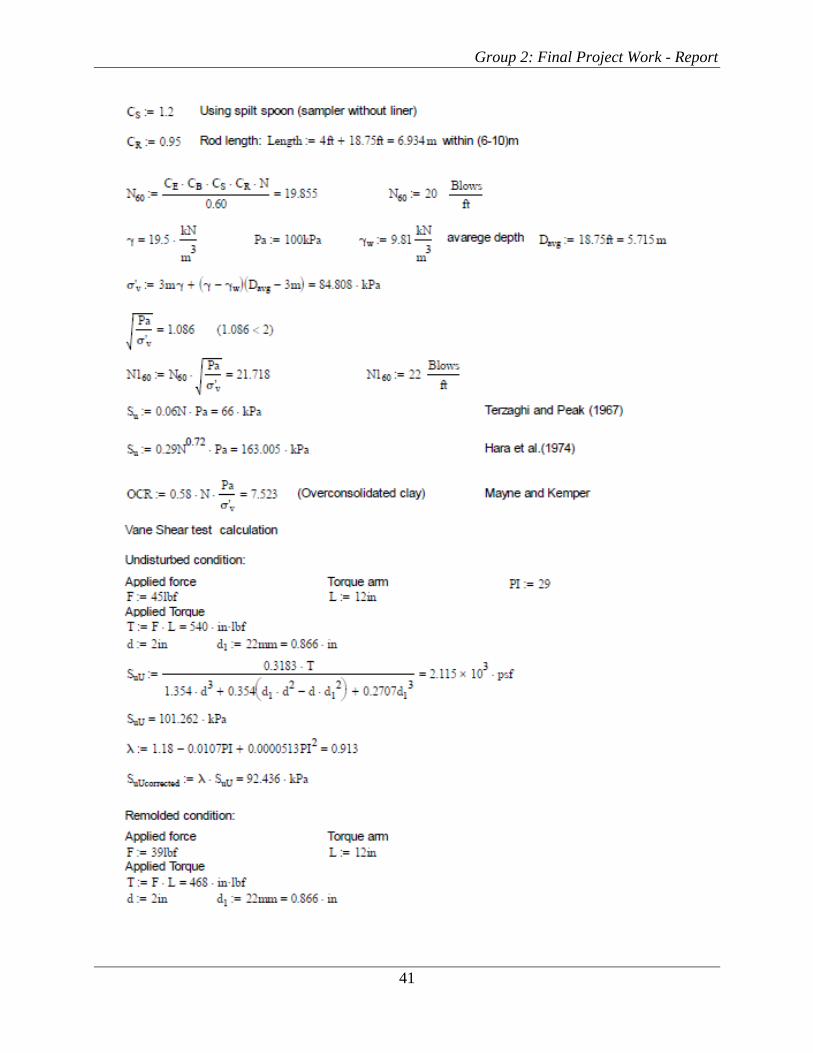
4.4 Vane Shear Test
The KDOT crew conducted vane shear test at borehole 1 at the depth of 9 ft by using 2 inch
diameter tapered vane shear apparatus due to stiffer nature of the clay soil at site. The torque arm
length of the vane shear apparatus was 12 inches and the vane shear constant of 5.17. The critical
(failure state) field data and the results are presented in Table 4.3
Table 5-3 Vane Shear Test Results
Conditions Failure State applied
force (lbf)
Undrained shear
strength (kPa) Soil Sensitivity
Undisturbed 45 92.44 Insensitive
Remolded 39 80.11
The detail calculation of the test results are given in Appendix C and corresponding photographs
to vane shear test are given in Appendix C.
4.5 Pressure Meter Test
Pressure meter test was carried out at borehole 2 at the depth of 8.0 feet based on ASTM 4719. A
borehole was drilled with solid continuous auger having 3 inches. The diameter of the
pressuremeter probe was 66 mm (2.6 inches).
KDOT engineers carried out the calibration of the pressurementer at KDOT lab. Based on the
provided data, the calibration curves are presented in Figure 4.5

Group 2: Final Project Work - Report
19
Figure 5-5 Volume and Pressure Calibration of Pressuremeter
Based on the corrected pressuremeter data, the corrected pressuremeter curve is plotted in Figure
5.6.
Figure 5-6 Corrected Pressuremeter Curve Showing Elastic Range and Plastic Range
0
100
200
300
400
500
600
700
0 0.5 1 1.5 2 2.5 3 3.5
volu
me
(cm
3)
pressure (bar)
Volume calibration curve Pressure calibration curve
0
1
2
3
4
5
6
0 100 200 300 400 500 600 700 800 900 1000
Co
rrec
ted
pre
ssu
re (
bar
)
Corrected volume (cm3)
Group 2: Final Project Work - Report
20
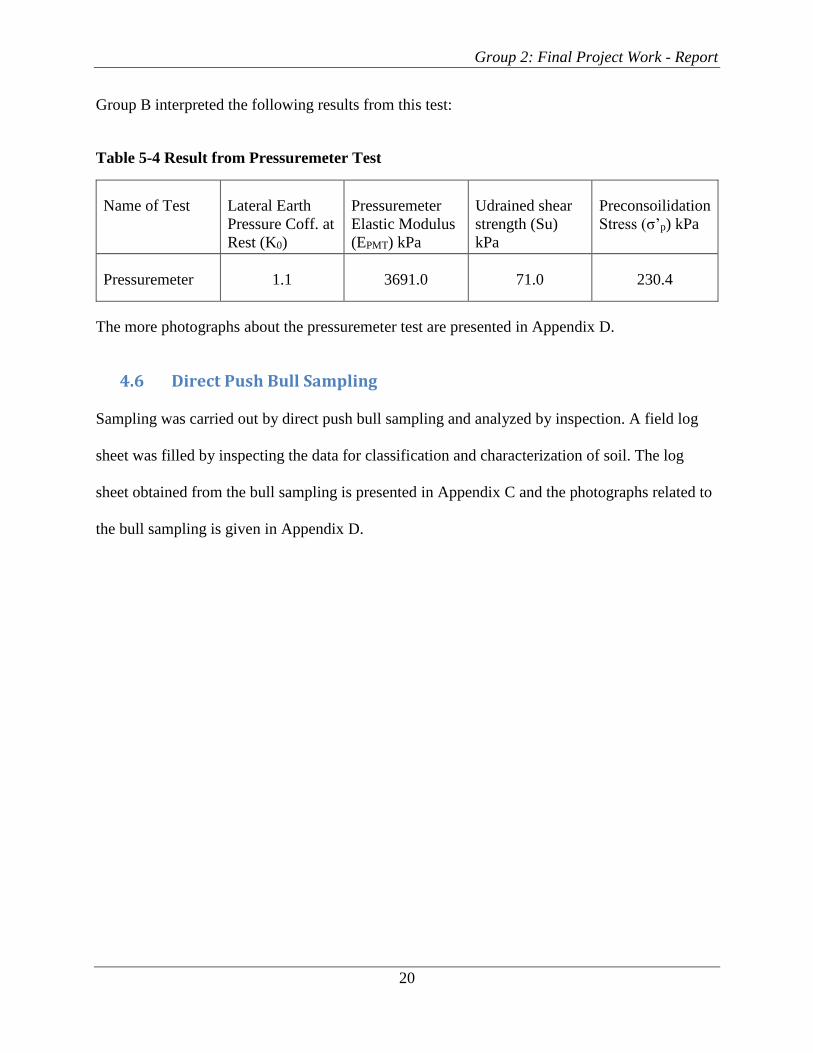
Group B interpreted the following results from this test:
Table 5-4 Result from Pressuremeter Test
Name of Test Lateral Earth
Pressure Coff. at
Rest (K0)
Pressuremeter
Elastic Modulus
(EPMT) kPa
Udrained shear
strength (Su)
kPa
Preconsoilidation
Stress (σ’p) kPa
Pressuremeter 1.1 3691.0 71.0 230.4
The more photographs about the pressuremeter test are presented in Appendix D.
4.6 Direct Push Bull Sampling
Sampling was carried out by direct push bull sampling and analyzed by inspection. A field log
sheet was filled by inspecting the data for classification and characterization of soil. The log
sheet obtained from the bull sampling is presented in Appendix C and the photographs related to
the bull sampling is given in Appendix D.

Group 2: Final Project Work - Report
21
6. Laboratory Testing
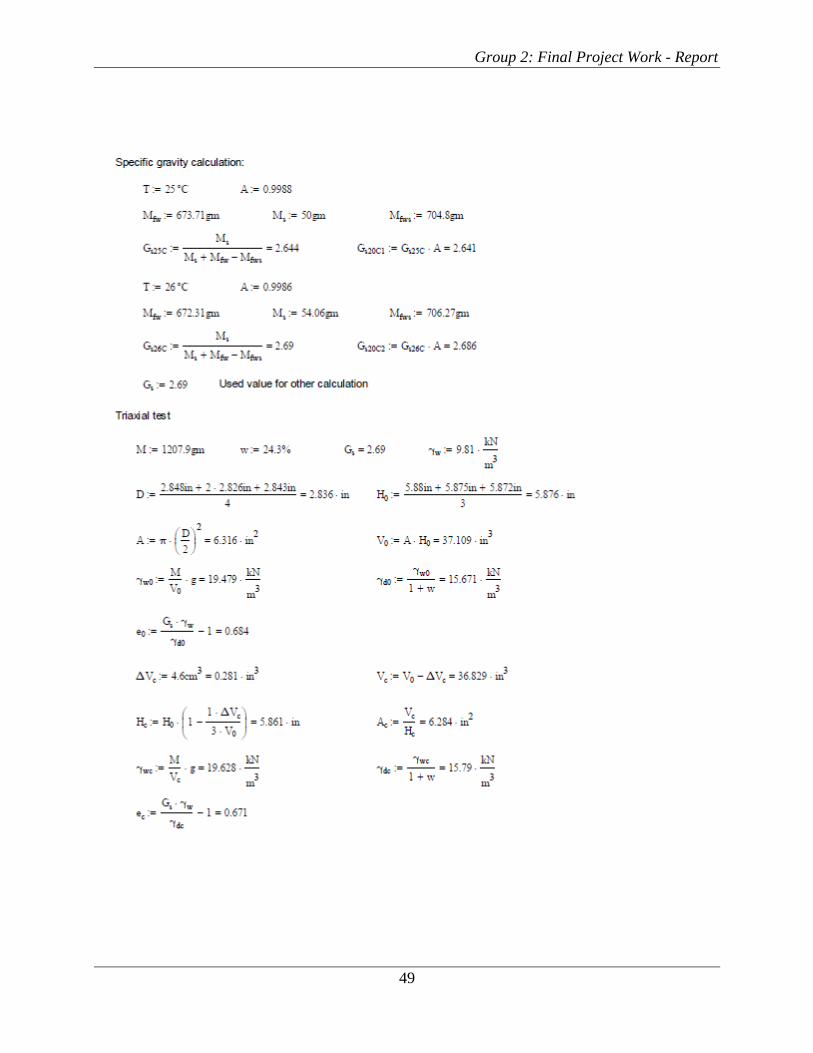
5.1 Specific Gravity Determination
Group two tested the specific gravity of the sample following by ASTM D854 - 14. We took this
sample from Shelby tube. The sample contains all particles less than sieve size 4 and more
specifically almost all clay particles. Group two found the specific gravity of 2.69 for the
sampled soil. Calculation is presented in Appendix D.
5.2 Grain Size Distribution of Soil
Group 2 conducted the standard test for particle size analysis of fine soil based on D422 – 63.
From this laboratory test, we found 6.3% of particle retained on sieve size 200 ( <15%). The
particle size distribution graph is in Figure 5.1. We found that coefficient of uniformity (Cu) and
coefficient of curvature (Cc) are 10 and 0.63 respectively.
Figure 6-1 Gradation Curve of the Sampled Soil
0.0%
20.0%
40.0%
60.0%
80.0%
100.0%
0.001 0.010 0.100 1.000
% p
assi
ng
Diamter in mm

Group 2: Final Project Work - Report
22
5.3 Atterberg Limit Determination
We determined the plastic limit and liquid limit based on D4318 - 10. The sampled soil have the
plastic limit of 24 and the liquid limit of 54. The plasticity index is 30. We found that the soil fall
above A-Line in the plasticity chart. And the soil is considered to be CH soil from USCS
classification. The laboratory data sheet for the Atterberg limit calculation are presented in
Appnendix D.
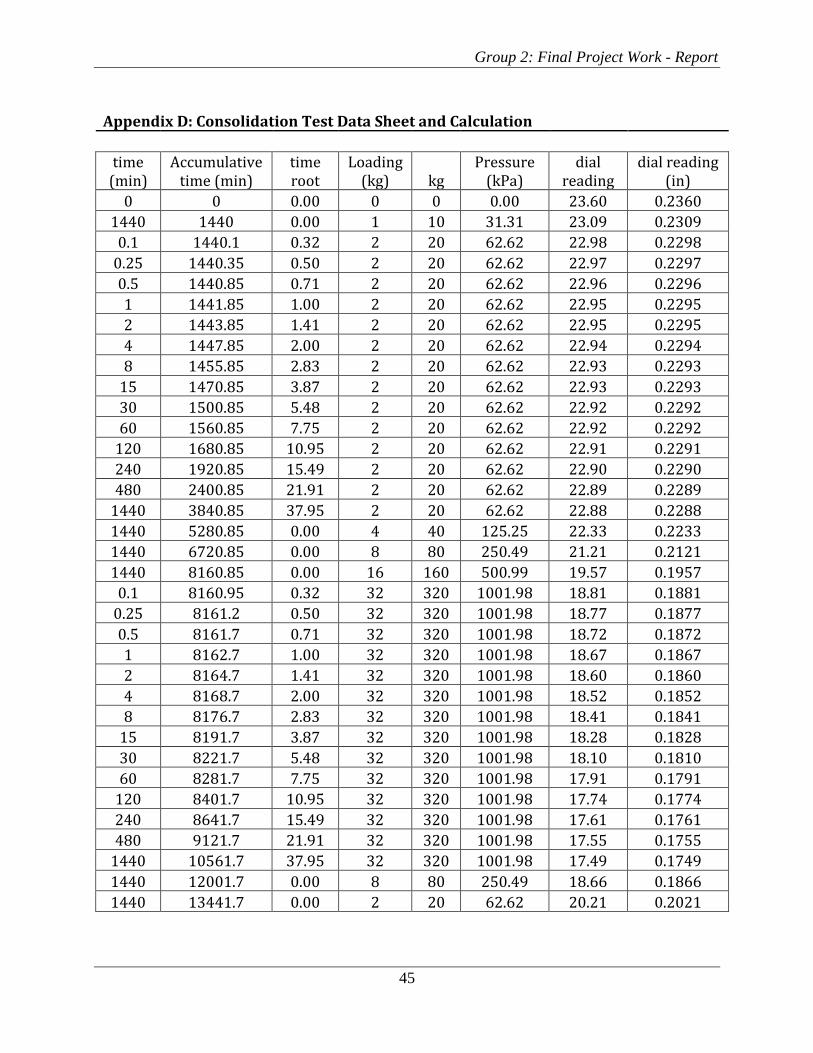
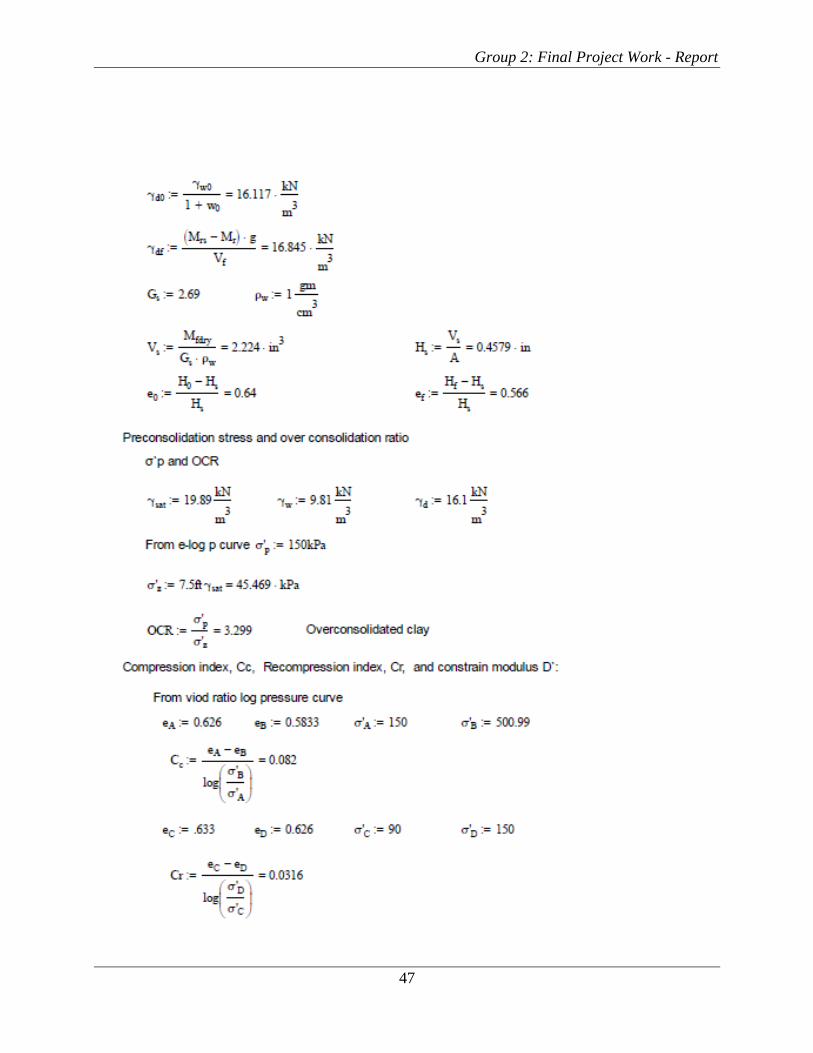
5.4 Consolidation of Sample
Group two performed the 1-D Consolidation Test based on ASTM D2435-96 at civil engineering
lab at KU. This sample was taken from the top part of the Selby tube no 2. The initial void rato
of the sample was 0.64. The overconsolidation (OCR) of the sample was 3.3. The coefficient of
consolidation was found as 0.021 cm2/min from Taylor’s Square Root Method. Also, we
calculated recompression index (Cr) of 0.0316 and compression index (Cc) of 0.082. The results
obtained from 1-D consolidation test are given in Table 5.1:
Table 6-1 Results from 1-D Consolidation Test
Preconsolidation
stress (σp’)
D’ (MPa) Cv by
Casagrande’s
Method
Cv by Taylor’s
Square root
method
K by
Casagrande's
kPa MPa cm2/min cm2/min cm/min
150 12.615 0.01 0.018 7.776 x 10⁻⁸
Group 2 select the Casagrande’s Method to calculate the permeability since Cv of Casagrande’s
method was lower as compared to Taylor’s method. The applied pressure versus void ratio curve,
Taylor’s square root method and Casagrande’s log t method are presented in Figure 5.2, Figure
5.3 and Figure 5.4 respectively.

Group 2: Final Project Work - Report
23
Figure 6-2 Void Ratio versus Pressure Curve (Log Scale)
Figure 6-3 Taylor`s root time method
0.5400
0.5600
0.5800
0.6000
0.6200
0.6400
0.6600
0.1 1 10 100 1000
Vo
id r
atio
, e
Pressure, p (kPa)
0.045
0.049
0.053
0.057
0.061
0.065
0 5 10 15 20 25 30 35 40
Dia
l rea
din
g (i
n)
Square root time
t50

Group 2: Final Project Work - Report
24
Figure 6-4 Casagrande's log t Method
5.5 Unconfined Compression Test
This unconfined compression test was carried out by Zachary Aaron Brady (TA) for
undergraduate class and he provided the data of this test. The unconfined compression stress
versus the axial strain graph is shown in Figure 6.6. The sample failed at 27.5 psi (189.6 kPa).
0.045
0.049
0.053
0.057
0.061
0.065
0.1 1 10 100 1000
Dia
l Rea
din
g (i
n)
Time, (min)t90

Group 2: Final Project Work - Report
25
Figure 6-5 Stress versus Strain Curve of Unconfined Compression Test
The undrained shear strength is evaluated as 13.75 psi (94.8 kPa).
5.6 Consolidated Undrained Test
The consolidated undrained triaxial test was carried out from Shelby tube 2 of borehole 4. The
sample was extracted by vertical extractor at geotechnical laboratory at KU. Then the sample
was cut in average of 2.8 inches diameter and almost 5.8 inches height. The exact dimensions of
the sample before placing the triaxial set were 7.2cm (2.836 inches) diameter and 14.92 cm
(5.876 inches) height. The field unit weight of the sample was 19.5 kN/m3.
The sample was left for saturation under cell pressure of 448 kPa (65 psi), the inlet back pressure
of 427 kPa (62 psi) and outlet pressure of 414 kPa (60 psi). After saturation, we allowed the
sample for consolidation for 48 hours with cell pressure of 522 kPa (75.7 psi) and back pressure
of 425 kPa (61.7 psi). After 48 hours of consolidation, the sample was assumed to be
consolidated perfectly. Then the sample was sheared. The deviator stress versus strain curve,
normal stress versus strain curve and Mohr Column failure envelope are presented in Figure 5.8 .
0
5
10
15
20
25
30
0 1 2 3 4 5 6 7
Un
con
fin
ed c
om
pre
ssio
n s
tres
s, p
si
Axial Strain, %
Stress strain curve for unconfined compression test
Group 2: Final Project Work - Report
26
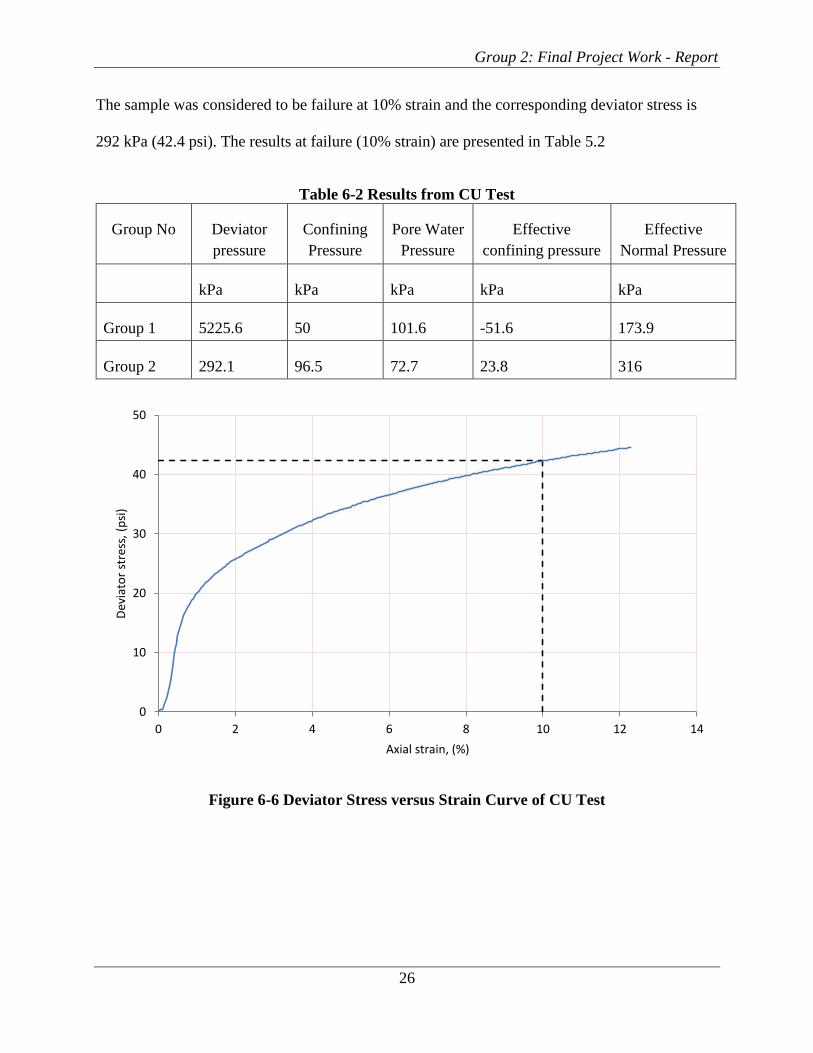
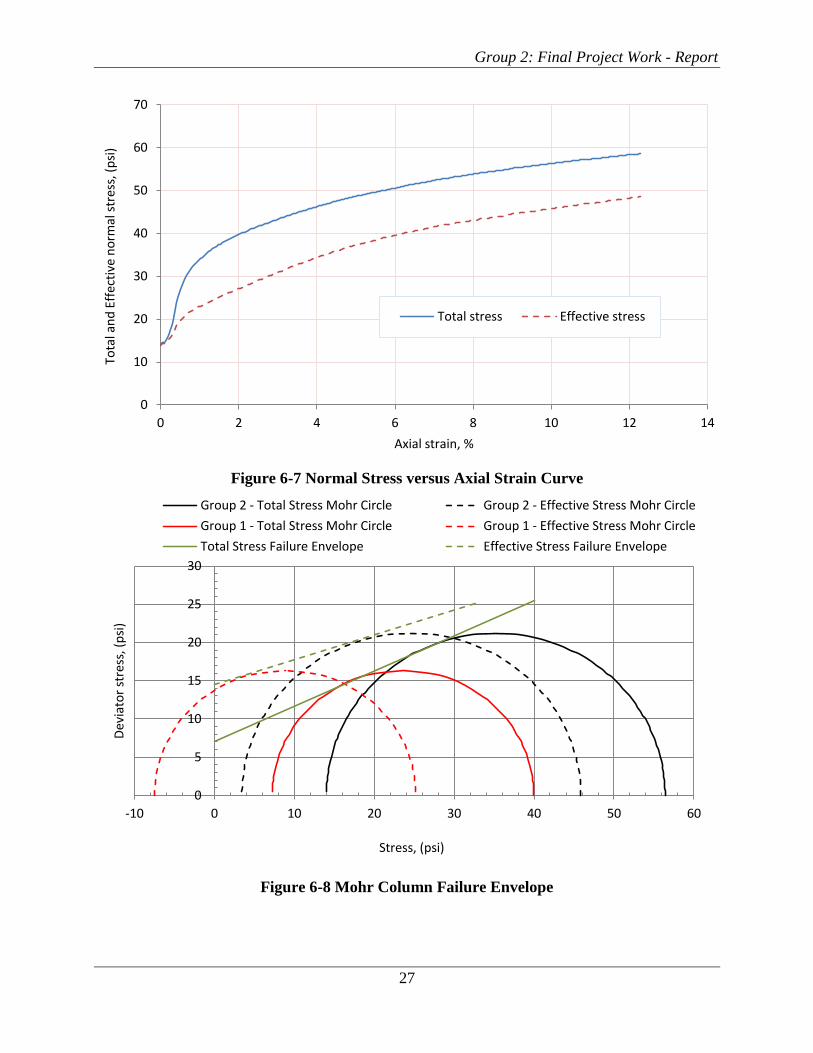
The sample was considered to be failure at 10% strain and the corresponding deviator stress is
292 kPa (42.4 psi). The results at failure (10% strain) are presented in Table 5.2
Table 6-2 Results from CU Test
Group No Deviator
pressure
Confining
Pressure
Pore Water
Pressure
Effective
confining pressure
Effective
Normal Pressure
kPa kPa kPa kPa kPa
Group 1 5225.6 50 101.6 -51.6 173.9
Group 2 292.1 96.5 72.7 23.8 316
Figure 6-6 Deviator Stress versus Strain Curve of CU Test
0
10
20
30
40
50
0 2 4 6 8 10 12 14
Dev
iato
r st
ress
, (p
si)
Axial strain, (%)
Group 2: Final Project Work - Report
27
Figure 6-7 Normal Stress versus Axial Strain Curve
Figure 6-8 Mohr Column Failure Envelope
0
10
20
30
40
50
60
70
0 2 4 6 8 10 12 14
Tota
l an
d E
ffec
tive
no
rmal
str
ess,
(p
si)
Axial strain, %
Total stress Effective stress
0
5
10
15
20
25
30
-10 0 10 20 30 40 50 60
Dev
iato
r st
ress
, (p
si)
Stress, (psi)
Group 2 - Total Stress Mohr Circle Group 2 - Effective Stress Mohr Circle
Group 1 - Total Stress Mohr Circle Group 1 - Effective Stress Mohr Circle
Total Stress Failure Envelope Effective Stress Failure Envelope
Group 2: Final Project Work - Report
28
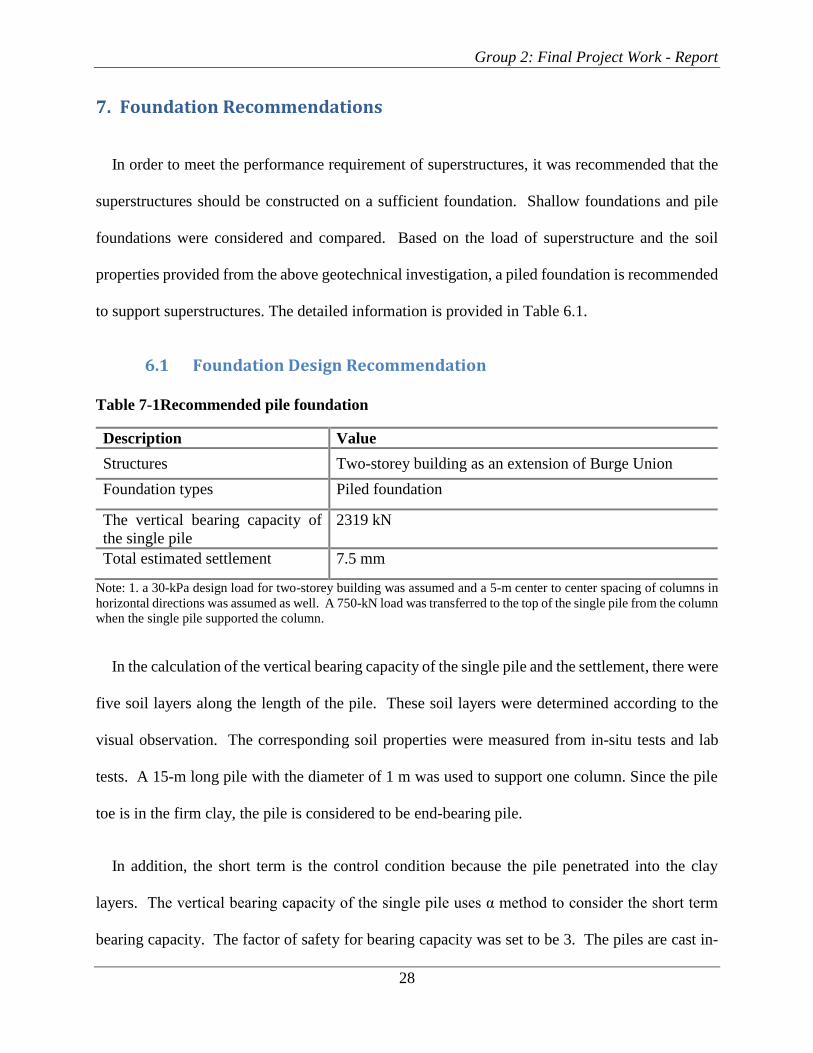
7. Foundation Recommendations
In order to meet the performance requirement of superstructures, it was recommended that the
superstructures should be constructed on a sufficient foundation. Shallow foundations and pile
foundations were considered and compared. Based on the load of superstructure and the soil
properties provided from the above geotechnical investigation, a piled foundation is recommended
to support superstructures. The detailed information is provided in Table 6.1.
6.1 Foundation Design Recommendation
Table 7-1Recommended pile foundation
Description Value
Structures Two-storey building as an extension of Burge Union
Foundation types Piled foundation
The vertical bearing capacity of
the single pile
2319 kN
Total estimated settlement 7.5 mm
Note: 1. a 30-kPa design load for two-storey building was assumed and a 5-m center to center spacing of columns in
horizontal directions was assumed as well. A 750-kN load was transferred to the top of the single pile from the column
when the single pile supported the column.
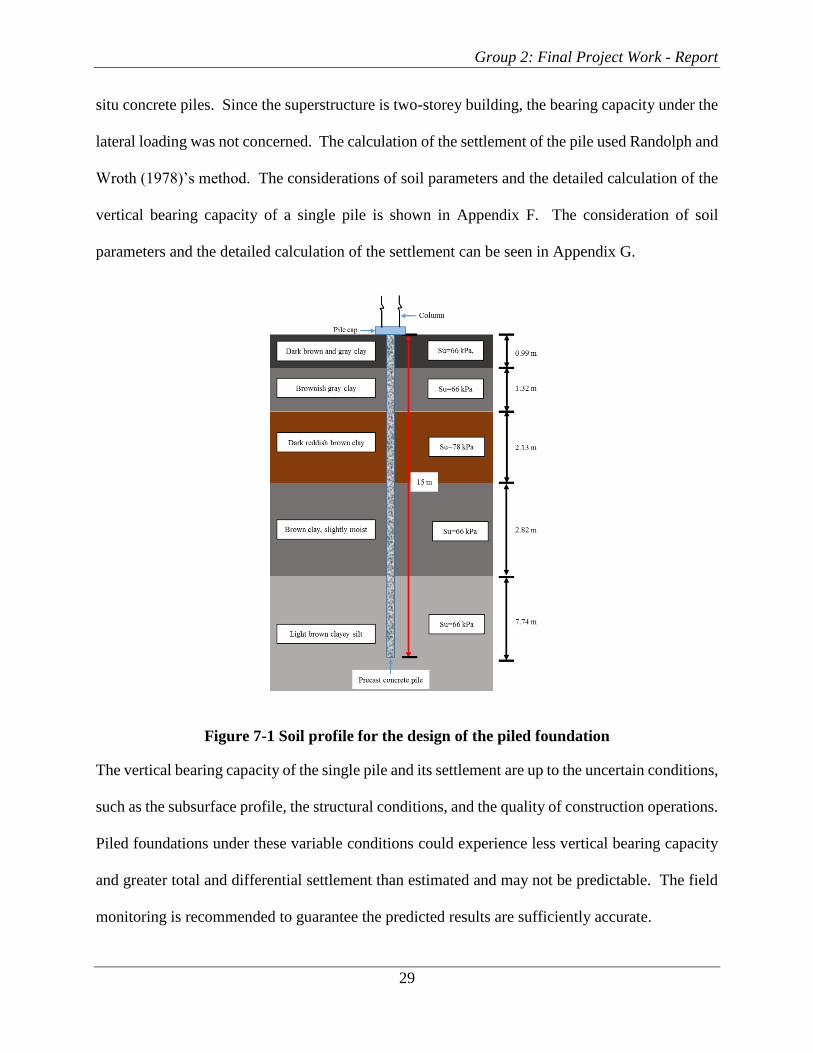
In the calculation of the vertical bearing capacity of the single pile and the settlement, there were
five soil layers along the length of the pile. These soil layers were determined according to the
visual observation. The corresponding soil properties were measured from in-situ tests and lab
tests. A 15-m long pile with the diameter of 1 m was used to support one column. Since the pile
toe is in the firm clay, the pile is considered to be end-bearing pile.
In addition, the short term is the control condition because the pile penetrated into the clay
layers. The vertical bearing capacity of the single pile uses α method to consider the short term
bearing capacity. The factor of safety for bearing capacity was set to be 3. The piles are cast in-
Group 2: Final Project Work - Report
29
situ concrete piles. Since the superstructure is two-storey building, the bearing capacity under the
lateral loading was not concerned. The calculation of the settlement of the pile used Randolph and
Wroth (1978)’s method. The considerations of soil parameters and the detailed calculation of the
vertical bearing capacity of a single pile is shown in Appendix F. The consideration of soil
parameters and the detailed calculation of the settlement can be seen in Appendix G.
Figure 7-1 Soil profile for the design of the piled foundation
The vertical bearing capacity of the single pile and its settlement are up to the uncertain conditions,
such as the subsurface profile, the structural conditions, and the quality of construction operations.
Piled foundations under these variable conditions could experience less vertical bearing capacity
and greater total and differential settlement than estimated and may not be predictable. The field
monitoring is recommended to guarantee the predicted results are sufficiently accurate.

Group 2: Final Project Work - Report
30
6.2 Foundation Construction Considerations
The cast in-situ concrete piles will be installed into the soil. The soil properties may change due
to the disturbance resulting from boring. The disturbed soil may reduce the vertical bearing
capacity of the single pile and increase the settlement.
In addition, the pile integrity tests are suggested to check the quality of installed piles. A pile cap
has to be cast in situ on the top of the pile to connect a column.
8. Conclusions and comments
From the field test, the undrained shear strength of the foundation soil was very high. The
undrained shear strength were an average of 72 kPa from SPT test, 92.4 kPa from Vane shear test
(undisturbed) and 71 kPa from pressruemeter test.
This result was supported by the laboratory test as the unconfined compressive gives the undrained
shear strength of 94.8 kPa. So, the foundation is strong enough to support probable foundation.
Also, from consolidation test, it was found that the filed was over consolidated. Also, the
permeability of the soil is very small.
The piled foundation is recommended to support the two-storey building. The calculated vertical
bearing capacity and the settlement of the single pile were 2391 kN and 7.5 mm, respectively. The
calculated vertical bearing capacity of the single pile may reduce and the settlement of the single
pile may increase due to variation of the subsurface profile, the structural conditions, and the
quality of construction operations.
Group 2: Final Project Work - Report
31
9. References
Burchett, R. R., Luza, K. V., Van Eck, O. J., & Wilson, F. W. (1983). Seismicity and tectonic
relationships of the Nemaha Uplift and Midcontinent geophysical anomaly. Final project
summary. Lincoln,Norman,Iowa city, Lawrence: Nebraska University ; Oklahoma
Geological Survey; Iowa Geological Survey; Kansas Geological Survey.
Data, U. C. (n.d.). Climate Lawrence - Kansas. Retrieved 05 09, 2015, from
http://www.usclimatedata.com/:
http://www.usclimatedata.com/climate/lawrence/kansas/united-states/usks0319
Deckey, H. P., Zimmerman, J. L., Plinsky, R. O., & Davis, R. D. (1977). Soil Survey of Douglas
County. Kansas.
pickatrail. (n.d.). Lawrence East, Kansas 7.5 Minute Topo Map. Retrieved 05 09, 2015, from
http://www.pickatrail.com/: http://www.pickatrail.com/topo-map/l/7.5x7.5/lawrence-east-
ks.html
Places, S. B. (2015, 05 08). Climate in Lawrence, Kansas. Retrieved from
http://www.bestplaces.net/: http://www.bestplaces.net/climate/city/kansas/lawrence
USGS. (n.d.). Kansas Earthquake Information. Retrieved 05 09, 2015, from
earthquake.usgs.gov/: http://earthquake.usgs.gov/earthquakes/states/?region=Kansas
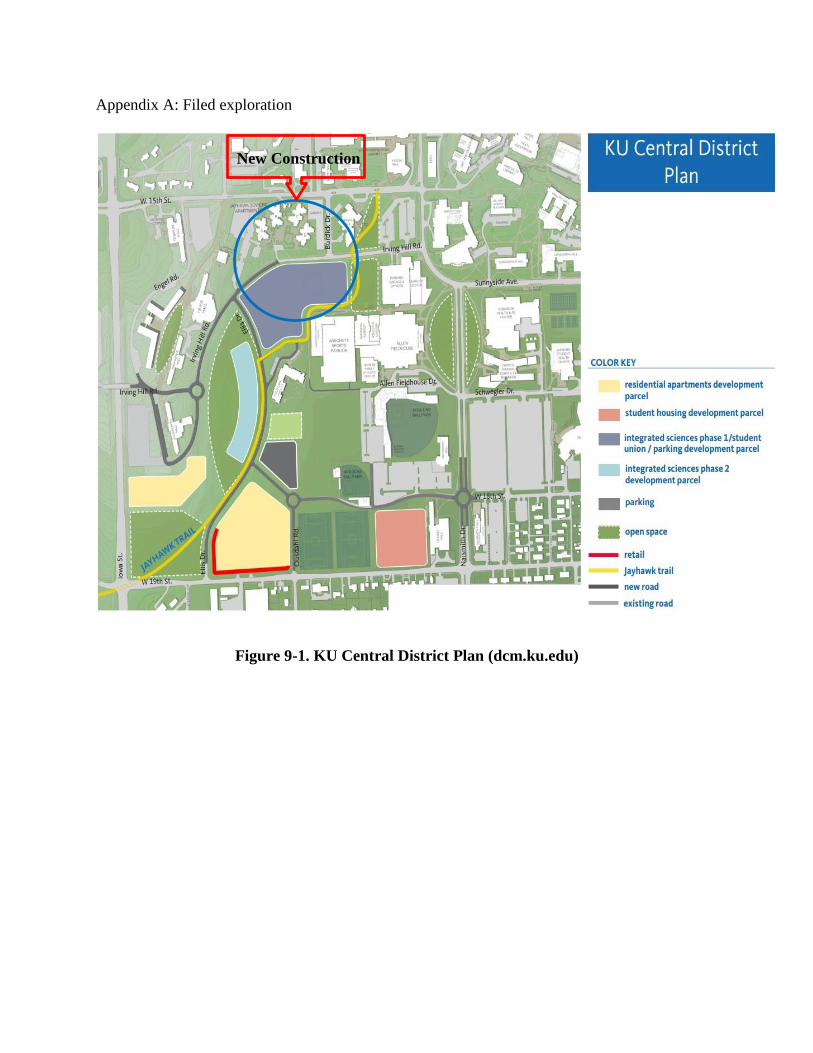
Appendix A: Filed exploration
Figure 9-1. KU Central District Plan (dcm.ku.edu)
New Construction

Group 2: Final Project Work - Report
34
Test Location

Group 2: Final Project Work - Report
35
Figure 9-2. Site Location Plan
Figure 9-3. Borings Location plan
Boring 1
Boring 5
Boring 4
Boring 3
Boring 2

Group 2: Final Project Work - Report
36
Figure 9-4. Topography map of Test Location (3)
Test Location

Group 2: Final Project Work - Report
37
10. Appendix B: Boring log Sheet
Figure 10-1. Subsurface Exploration and Sampling Sheet (˂19 feet depth)
Group 2: Final Project Work - Report
38
Figure 10-2. Subsurface Exploration and Sampling Sheet (>19 feet depth)

Group 2: Final Project Work - Report
39
11. Appendix C: Field Test Data Sheet

Group 2: Final Project Work - Report
40
Group 2: Final Project Work - Report
41

Group 2: Final Project Work - Report
42

Group 2: Final Project Work - Report
43
12. Appendix D: Lab Test Data Sheet
Appendix D: Field Moisture Content Determination
Nos of Sample
Container Name
Empty Wt. of Container
Container + Wet Weight
of Soil
Container + Dry Weight
of Soil
Moisture Content of
Smaple
1 1 32.71 66.49 59.89 0.242826
2 L3AJ 29.52 66.16 58.98 0.24372
Average MC 24.3%
Appendix D: Specific Gravity Test Data
Wt. of empty
flask wt. of
flask+Water wt. of
flask+water+soil Mass of dry
soil Temperature
gm gm gm Degree C
174.06 672.31 706.27 54.06 26
Appendix D: Liquid Limit Determination
No. of blow
Can Identification
Empty wt. of Can
Can + Moist Soil Wt.
Can+ Dry soil Wt.
MC
45
Hall 17.13 32.75 27.5 50.6%
50.3% 10 15.92 30.89 25.9 50.0%
38
EAGS 15.54 22.69 20.3 50.2%
51.5% 8 15.96 23.51 20.9 52.8%
26
M42 15.48 30.01 24.9 54.2%
54.0% I# 16.16 32.05 26.5 53.7%
19
CBM2 21.5 37.5 32 52.4%
53.0% DM41 22.22 31.1 28 53.6%
16
16.26 34.99 28.1 58.2%
58.2% mv1 16.2 37.24 29.5 58.2%
So, from graph, liquid limit is 54

Group 2: Final Project Work - Report
44
Appendix D: Plastic Limit Determination
Can Identification Empty wt.
of Can Can + Moist
Soil Wt. Can+ Dry soil Wt.
MC Average MC
E12 9.9 11 10.79 0.235955 24.3% FR13 9.9 11.2 10.94 0.25
Appendix D
Gradation by Hydrometer Analysis
General Data
Tested By: Group 2 Moisture content Date: 4/27/2015 M of Container 0 gm
Mass of air dry, M
Mass of Soil + Container - Wet 50
Specific Gravity, Gs 2.69
Mass of Soil + Container - Dry 0
Hydrometer: 152H Dry mass of Soil 0 Meniscus correction,
Fm 0.5 w 0.00% mass of
soilds, Ms 50 Dry mass of soil 50 g
α correction: 1.005 gm
Time,
T(min) Zero
Correction Hydrometer
Reading Corrected Reading
% Finer K
Diameter (mm)
93.7% 0.075
27.6 0.5 7 51 44.5 89.4% 0.0127 0.050
27.6 1 7 48 41.5 83.4% 0.0127 0.037
27.6 2 7 44 37.5 75.4% 0.0127 0.027
27.6 4 7 42 35.5 71.4% 0.0127 0.019
27.6 8 7 40 33.5 67.3% 0.0127 0.014
27.6 15 7 32 25.5 51.3% 0.0127 0.011
27.6 30 7 30 23.5 47.2% 0.0127 0.008
27.6 60 7 27.5 21 42.2% 0.0127 0.006
27.6 120 7 24 17.5 35.2% 0.0127 0.004
28 240 7 21 14.5 29.1% 0.0126 0.003
27.5 480 7 16 9.5 19.1% 0.0127 0.002
27.5 720 7 14 7.5 15.1% 0.0127 0.002
27.5 1440 7 11.5 5 10.1% 0.0127 0.001
Group 2: Final Project Work - Report
45
Appendix D: Consolidation Test Data Sheet and Calculation
time
(min) Accumulative
time (min) time root
Loading (kg) kg
Pressure (kPa)
dial reading
dial reading (in)
0 0 0.00 0 0 0.00 23.60 0.2360
1440 1440 0.00 1 10 31.31 23.09 0.2309
0.1 1440.1 0.32 2 20 62.62 22.98 0.2298
0.25 1440.35 0.50 2 20 62.62 22.97 0.2297
0.5 1440.85 0.71 2 20 62.62 22.96 0.2296
1 1441.85 1.00 2 20 62.62 22.95 0.2295
2 1443.85 1.41 2 20 62.62 22.95 0.2295
4 1447.85 2.00 2 20 62.62 22.94 0.2294
8 1455.85 2.83 2 20 62.62 22.93 0.2293
15 1470.85 3.87 2 20 62.62 22.93 0.2293
30 1500.85 5.48 2 20 62.62 22.92 0.2292
60 1560.85 7.75 2 20 62.62 22.92 0.2292
120 1680.85 10.95 2 20 62.62 22.91 0.2291
240 1920.85 15.49 2 20 62.62 22.90 0.2290
480 2400.85 21.91 2 20 62.62 22.89 0.2289
1440 3840.85 37.95 2 20 62.62 22.88 0.2288
1440 5280.85 0.00 4 40 125.25 22.33 0.2233
1440 6720.85 0.00 8 80 250.49 21.21 0.2121
1440 8160.85 0.00 16 160 500.99 19.57 0.1957
0.1 8160.95 0.32 32 320 1001.98 18.81 0.1881
0.25 8161.2 0.50 32 320 1001.98 18.77 0.1877
0.5 8161.7 0.71 32 320 1001.98 18.72 0.1872
1 8162.7 1.00 32 320 1001.98 18.67 0.1867
2 8164.7 1.41 32 320 1001.98 18.60 0.1860
4 8168.7 2.00 32 320 1001.98 18.52 0.1852
8 8176.7 2.83 32 320 1001.98 18.41 0.1841
15 8191.7 3.87 32 320 1001.98 18.28 0.1828
30 8221.7 5.48 32 320 1001.98 18.10 0.1810
60 8281.7 7.75 32 320 1001.98 17.91 0.1791
120 8401.7 10.95 32 320 1001.98 17.74 0.1774
240 8641.7 15.49 32 320 1001.98 17.61 0.1761
480 9121.7 21.91 32 320 1001.98 17.55 0.1755
1440 10561.7 37.95 32 320 1001.98 17.49 0.1749
1440 12001.7 0.00 8 80 250.49 18.66 0.1866
1440 13441.7 0.00 2 20 62.62 20.21 0.2021

Group 2: Final Project Work - Report
46
Appendix D: Consolidation Test Calculation
Group 2: Final Project Work - Report
47

Group 2: Final Project Work - Report
48
Group 2: Final Project Work - Report
49
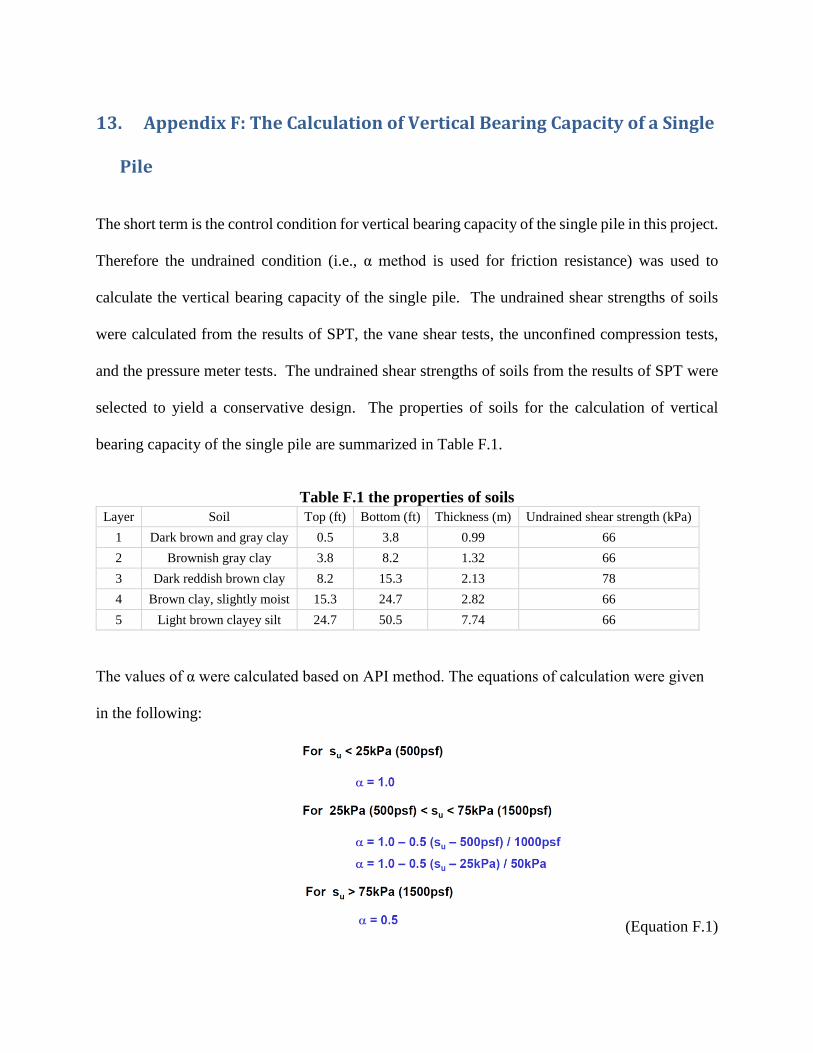
13. Appendix F: The Calculation of Vertical Bearing Capacity of a Single
Pile
The short term is the control condition for vertical bearing capacity of the single pile in this project.
Therefore the undrained condition (i.e., α method is used for friction resistance) was used to
calculate the vertical bearing capacity of the single pile. The undrained shear strengths of soils
were calculated from the results of SPT, the vane shear tests, the unconfined compression tests,
and the pressure meter tests. The undrained shear strengths of soils from the results of SPT were
selected to yield a conservative design. The properties of soils for the calculation of vertical
bearing capacity of the single pile are summarized in Table F.1.
Table F.1 the properties of soils
Layer Soil Top (ft) Bottom (ft) Thickness (m) Undrained shear strength (kPa)
1 Dark brown and gray clay 0.5 3.8 0.99 66
2 Brownish gray clay 3.8 8.2 1.32 66
3 Dark reddish brown clay 8.2 15.3 2.13 78
4 Brown clay, slightly moist 15.3 24.7 2.82 66
5 Light brown clayey silt 24.7 50.5 7.74 66
The values of α were calculated based on API method. The equations of calculation were given
in the following:
(Equation F.1)
Group 2: Final Project Work - Report
48
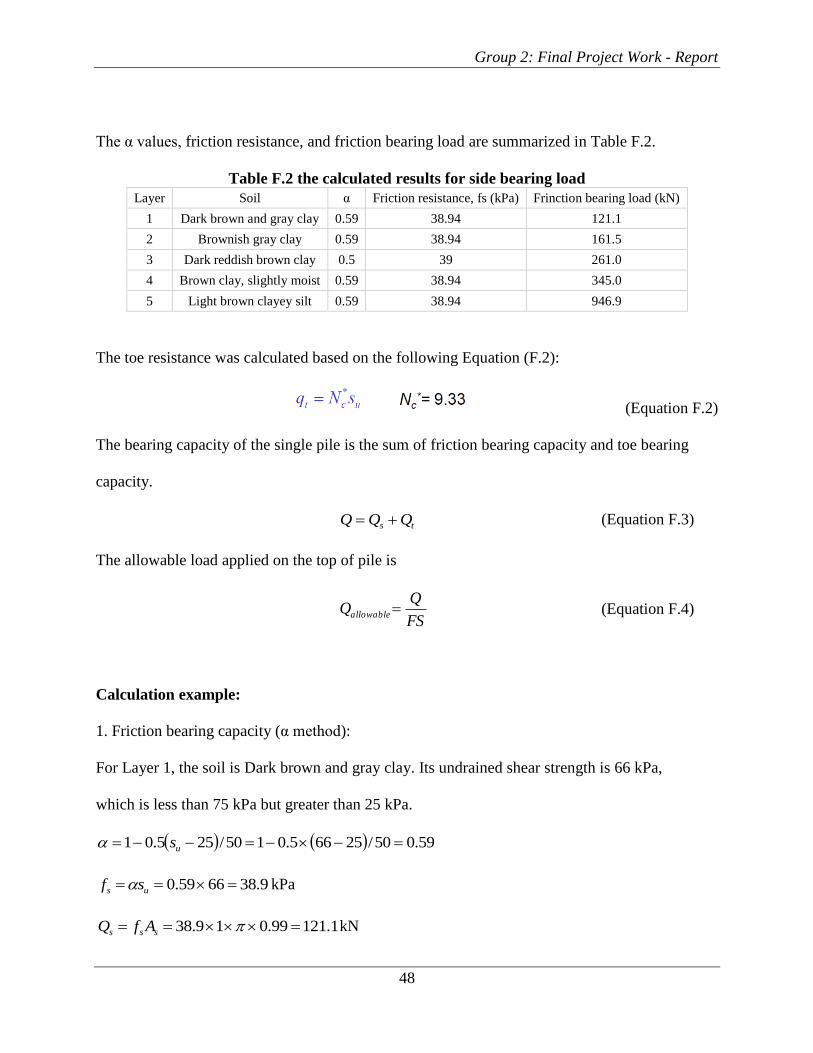
The α values, friction resistance, and friction bearing load are summarized in Table F.2.
Table F.2 the calculated results for side bearing load
Layer Soil α Friction resistance, fs (kPa) Frinction bearing load (kN)
1 Dark brown and gray clay 0.59 38.94 121.1
2 Brownish gray clay 0.59 38.94 161.5
3 Dark reddish brown clay 0.5 39 261.0
4 Brown clay, slightly moist 0.59 38.94 345.0
5 Light brown clayey silt 0.59 38.94 946.9
The toe resistance was calculated based on the following Equation (F.2):
(Equation F.2)
The bearing capacity of the single pile is the sum of friction bearing capacity and toe bearing
capacity.
ts QQQ (Equation F.3)
The allowable load applied on the top of pile is
FS
QQallowable (Equation F.4)
Calculation example:
1. Friction bearing capacity (α method):
For Layer 1, the soil is Dark brown and gray clay. Its undrained shear strength is 66 kPa,
which is less than 75 kPa but greater than 25 kPa.
59.050/25665.0150/255.01 us
9.386659.0 us sf kPa
1.12199.019.38 sss AfQ kN
Group 2: Final Project Work - Report
49
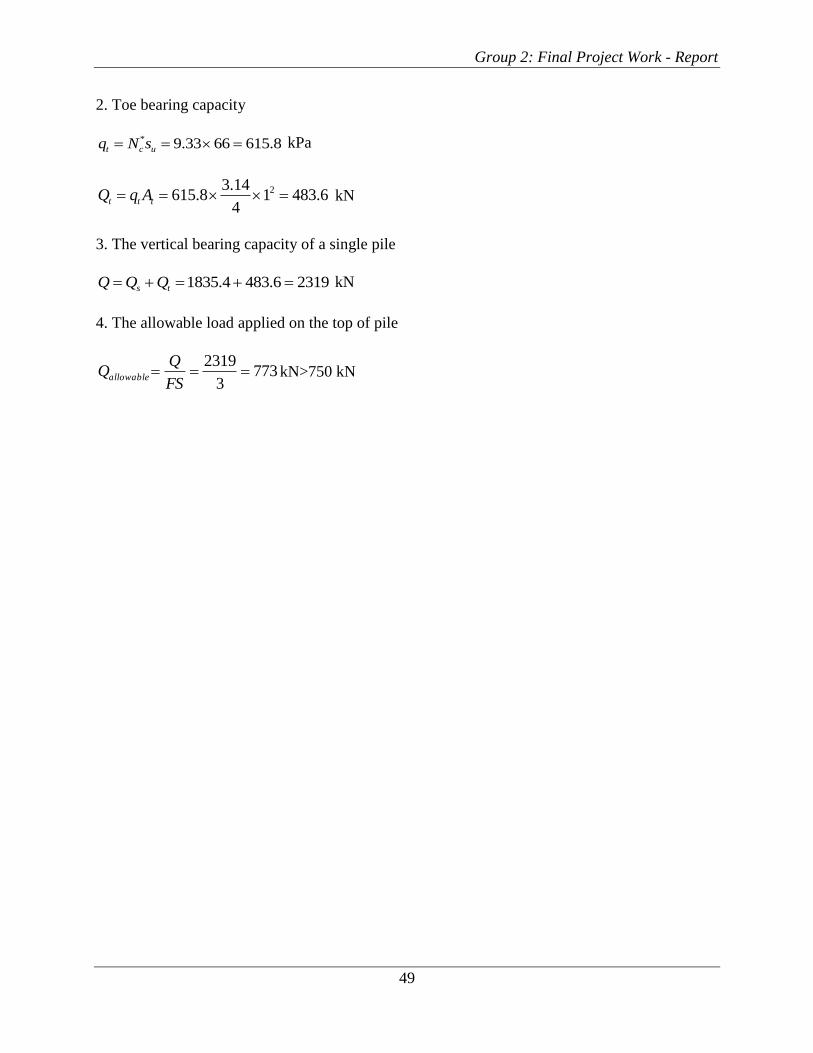
2. Toe bearing capacity
8.6156633.9* uct sNq kPa
6.48314
14.38.615 2 ttt AqQ kN
3. The vertical bearing capacity of a single pile
23196.4834.1835 ts QQQ kN
4. The allowable load applied on the top of pile
7733
2319
FS
QQallowable kN>750 kN

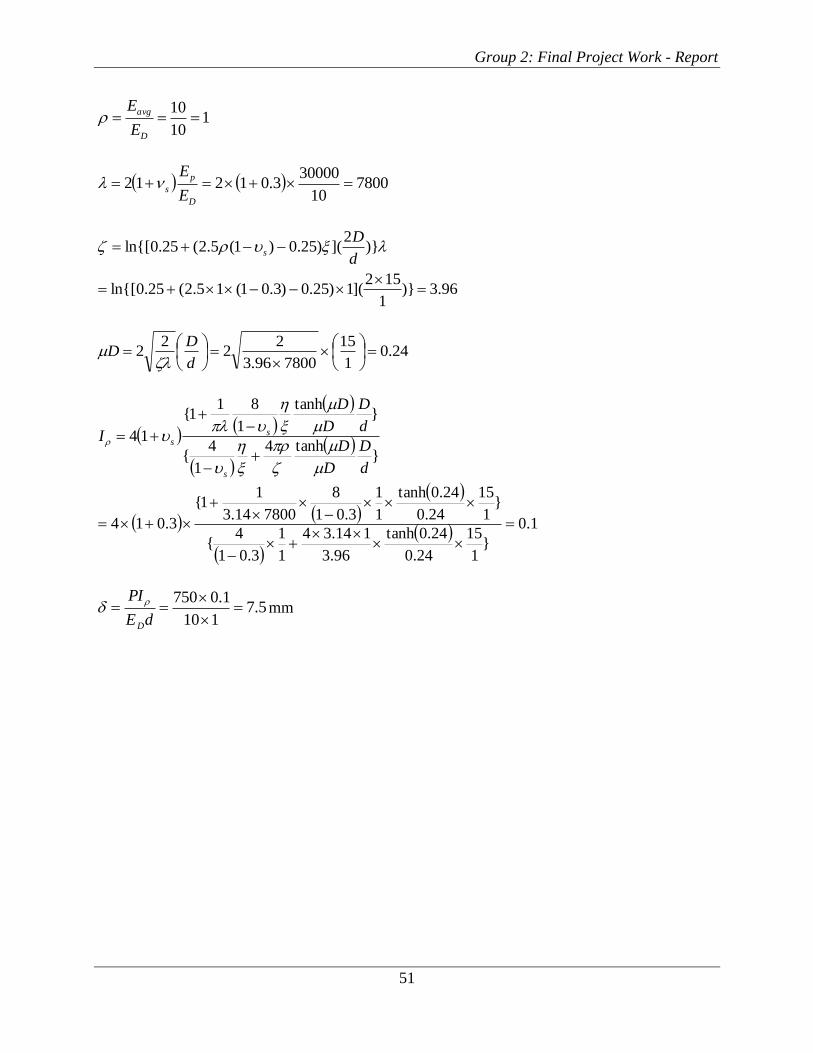
14. Appendix G: The Calculation of settlement of a Single Pile
The calculation of settlement of a single pile used Randolph and Wroth (1978)’s method.
dE
PI
D
(Equation G.1)
Where P is the axial load at the top of the pile, I is the influence factor, DE is the soil
modulus at the toe, and d is the diameter of the pile.
The axial load transfers to the top of pile 750P kN, and the diameter of pile 1d m. The
moduli of soils for different layers were estimated using the results from triaxial tests, one-
dimensional consolidation tests, vane shear tests, and pressure meter tests. The comparison of
these results was conducted to determine the design value used in the calculation. The moduli of
clays at the pile toe and below the pile toe were 10 MPa (i.e., 10DE MPa, 10bE MPa). The
average modulus of clays was also 10 MPa (i.e., 10avgE MPa). Poisson’s ratio of clays were 0.3.
In addition, the modulus of the pile was 30 GPa.
Calculation example:
The pile length, 15D m
11
1
d
db
110
10
b
D
E
E
Group 2: Final Project Work - Report
51
110
10
D
avg
E
E
780010
300003.01212
D
p
sE
E
96.3)}1
152](1)25.0)3.01(15.2(25.0ln{[
)}2
]()25.0)1(5.2(25.0ln{[
d
Ds
24.01
15
780096.3
22
22
d
DD
1.0
}1
15
24.0
24.0tanh
96.3
114.34
1
1
3.01
4{
}1
15
24.0
24.0tanh
1
1
3.01
8
780014.3
11{
3.014
}tanh4
1
4{
}tanh
1
811{
14
d
D
D
D
d
D
D
D
I
s
ss
5.7110
1.0750
dE
PI
D
mm