final project assessment report - charlton area v1 5 1. network demography the region including...
TRANSCRIPT
Disclaimer
While care was taken in preparation of the information in this document, and it is provided in good faith, Ergon Energy Corporation Limited accepts no responsibility or liability for any loss or damage that may be incurred by any person acting in reliance on this information or assumptions drawn from it. This document has been prepared for the purpose of inviting information, comment and discussion from interested parties. The document has been prepared using information provided by a number of third parties. It contains assumptions regarding, among other things, economic growth and load forecasts which may or may not prove to be correct. All information should be independently verified to the extent possible before assessing any investment proposal.
Regulatory Investment
Test – Distribution
Final Project Assessment
Report (FPAR)
Charlton Area v1
16 September 2015
page 1
Disclaimer
The purpose of this document is to inform customers, Interested Parties, Registered Participants and solution providers of the outcome of investigations into the capacity and voltage constraints occurring and emerging in the Charlton, Wellcamp, Kingsthorpe and Cotswold Hills area, west of Toowoomba. This document is not intended to be used for other purposes, such as making decisions to invest in generation, transmission or distribution capacity.
While care was taken in preparation of the information in this document, and it is provided in good faith, Ergon Energy Corporation Limited accepts no responsibility or liability for any loss or damage that may be incurred by any person acting in reliance on this information or assumptions drawn from it. This document has been prepared for the purpose of inviting information, comment and discussion from interested parties. The document has been prepared using information provided by a number of third parties. It contains assumptions regarding, among other things, economic growth and load forecasts which may or may not prove to be correct. All information should be independently verified to the extent possible before assessing any investment proposal.
page 2
GLOSSARY
Term Meaning
AEMO Australian Energy Market Operator
MD Maximum Demand. The highest power (MW) or apparent power (MVA) demand of plant or some group of plant. May be qualified as the power demand of specific plant at the time of state or area MD.
NC or NCC Normal Cyclic Capacity (rating). Normal usage rating of plant, usually above nominal because of the cyclic nature of normal load patterns. For transformers, assumed to be 110% of the transformer nominal rating if no calculated NC rating available.
OH Overhead
POE Probability of exceedance.
50POE refers to a 1 in 2 year event
10POE refers to a 1 in 10 year event
SD Summer Day (9am – 5pm)
SE Summer Evening (5pm – 10pm)
SNM Summer Night Morning (10pm – 9am)
UG Underground
VCR Value of Customer Reliability
WD Winter Day (9am – 5pm)
WE Winter Evening (5pm – 10pm)
WNM Winter Night Morning (10pm – 9am)

page 3
Executive Summary
Ergon Energy is responsible (under its Distribution Authority) for electricity supply to the Charlton, Wellcamp, Kingsthorpe and Westbrook areas, west of Toowoomba in South West Queensland. We have identified emerging limitations in the electricity distribution network supplying the area. Torrington 110/33/11kV Substation currently supplies the loads in these areas. The load on this substation has been steadily increasing due to increasing numbers of residential, commercial and industrial loads.
The region is poised for significant growth attributable to the Brisbane West Wellcamp Airport, Toowoomba Second Range Crossing and Inland Rail Corridor along with local government promotion of the area. Should additional works not be completed in this region, it is likely that significant voltage and capacity constraints could present when additional customers begin to connect.
This Final Project Assessment Report (FPAR) has been prepared in accordance with the RIT-D procedures prescribed in clause 5.17.4 of the National Electricity Rules. Ergon Energy has determined that there will not be a non-network option that is a potential credible option, or that forms a significant part of a potential credible option, for the RIT-D project to address the identified need.
As per the “Screening for non-network options report”, Ergon Energy determined the most appropriate technical and economic network solution to the network constraint was the establishment of a 33/11kV, 10MVA Skid Substation on the corner of Meehan and Wirth Roads, Charlton. Ergon Energy has taken a two staged approach to ensure that all feasible non-network options have been considered and critically assessed.
The first stage was the use of Ergon Energy’s Channel Partnerships team which appraised the study area to determine what demand management and demand response options existed or were likely to exist. The Channel Partnerships’ appraisal stated that there were no suitable non-network options that would fully mitigate the existing and emerging constraints, nor would they form a significant part of the solution. Their assessment concluded that the demand management and demand response options would not meet the technical requirements to be considered a credible solution.
The second stage was the release of the Screening for Non-Network Options report. This report detailed the emerging constraints and provided all Registered Participants with the opportunity to provide comments and suggest solutions. Ergon Energy received one formal response. This response did not meet all technical or economic requirements presented in the Screening Report. Subsequently, Ergon Energy met with the proponent and discussed the details of the response. This meeting allowed Ergon Energy to fully understand the proponent’s proposal and ensure no misunderstanding whilst allowing the proponent to question conclusions Ergon Energy had made. The proponent was formally advised of the determination and the specific technical and economic reasons for the determination.
As there are no non-network options that are potential credible options, or that form a significant part of a potential credible option and the project cost is less than $10million, Ergon Energy is not required to publish a non-network options report or draft project assessment report for the works. Ergon Energy, in fulfilment of clause 5.17.4 of the National Electricity Rules, publishes this Final Project Assessment Report as the final stage of the Regulatory Investment Test for Distribution.

page 4
Table of Contents
Disclaimer...................................................................................................................................... 1
GLOSSARY .................................................................................................................................... 2
Executive Summary ...................................................................................................................... 3
1. Network Demography ...................................................................................................................... 5
2. Network Configuration and Capability .................................................................................... 7
2.1 Network Forecast .................................................................................................................. 8
2.2 Network Capacity .................................................................................................................. 8
3. Emerging Distribution Network Limitations .......................................................................... 11
3.1 Network Capacity ................................................................................................................ 11
3.2 Network Voltage .................................................................................................................. 12
3.3 Do Nothing Option ............................................................................................................... 13
4. Proposed Network Option ...................................................................................................... 14
4.1 Scope of Works ................................................................................................................... 14
4.2 Cost Estimates .................................................................................................................... 14
4.3 Value of Customer Reliability ............................................................................................... 14
4.4 Net Present Value ............................................................................................................... 15
4.5 Expected date of completion ............................................................................................... 15
5. Alternative Network Options .................................................................................................. 16
6. Non-Network Options Analysis .............................................................................................. 17
6.1 Non-network Opportunities – Internal .................................................................................. 17
6.2 Non-Network Opportunities Analysis - Internal .................................................................... 17
6.3 Non-Network Opportunities – External ................................................................................. 18
6.4 Non-Network Opportunities Analysis – External .................................................................. 18
6.5 Non-Network Opportunities Conclusion ............................................................................... 19
7. Next Steps ............................................................................................................................... 20
8. NER clause compliance for the FPAR ................................................................................... 21
Tables and Figures
Figure 1 - Known existing/proposed developments and current zoning ........................................... 6
Figure 2 - Torrington 11kV Distribution Area Geographic ................................................................ 7
Figure 3 - Torrington 11kV Summer Day – Actual, POE Adjusted Peak and Forecast .................... 8
Figure 4 - Torrington Substation Peak Summer Day Load Profile (11kV) - 06/01/2014 ................... 9
Figure 5 - Torrington Substation Peak Winter Day Load Profile (11kV) - 24/07/2014 ...................... 9
Figure 6 - Torrington 11kV Feeder Load Duration Curves ............................................................. 10
Figure 7 - TORR 11kV network voltage profile .............................................................................. 12
Table 1 - Customer breakdown and IES Information ....................................................................... 5
Table 2 - Torrington 11kV Forecast ................................................................................................. 8
Table 3 - Torrington 11kV Feeder 2013/2014 maximum demand .................................................... 8
Table 4 - Prospective loads and associated feeder ratings ........................................................... 11

page 5
1. Network Demography
The region including Cotswold Hills, Westbrook, Charlton, Gowrie Junction, Kingsthorpe and Glenvale are all supplied by Torrington 110/33/11kV Substation. There are approximately 6225 customers fed from the 11kV feeders of TORR Torrington 33/11kV Substation. The breakdown of customers per feeder and the customer type is shown in Table 1. This table also details the number of IES installations per feeder, the IES capacity and the connected distribution transformer capacity.
It can be seen through this customer type breakdown that the majority of the customers fed via the 11kV networks are domestic. TORR contains 84% domestic, 14% commercial/industrial and 2% irrigation (Rural). Table 1 also shows that the average penetration rate of IES customers is 19% for TORR 11kV feeders. This equates to a total connected IES capacity of 5.2MW.
Feeder Name
Cust Count (March 2014)
Customer Type Breakdown
IES Count
IES Capacity
(kW)
Distribution Trans
Capacity (kVA)
%PV Capacity to Distribution Transformer
Capacity Dom
Com + Indust
Rural
COTSWOLD HILLS 1392 93.2% 6.0% 0.8% 384 1413 12358 11.4%
CHARLTON 1259 77.8% 18.6% 3.6% 268 1113 22520 4.9%
CARROLL STREET 211 11.4% 88.6% 0.0% 2 9 16445 0.1%
GLENVALE 887 83.3% 13.0% 3.7% 244 942 17607 5.4%
MCDOUGALL STREET 1117 84.5% 15.5% 0.0% 126 431 14823 2.9%
WESTBROOK 1359 93.6% 4.6% 1.8% 357 1307 12497 10.5%
Table 1 - Customer breakdown and IES Information
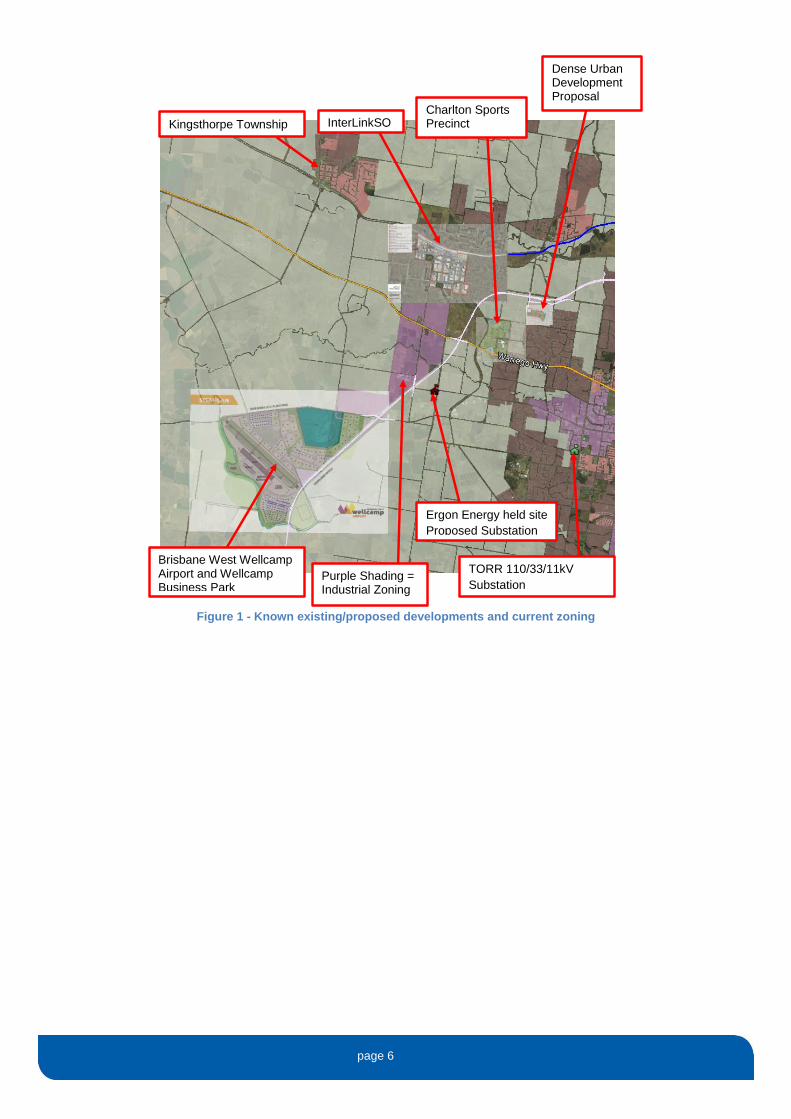
Within the study area, significant national and state infrastructure projects have been in progress or are due to commence in the coming years such as the privately funded “Brisbane West Wellcamp Airport” and associated business park, the Toowoomba Second Range Crossing and the Inland Rail Corridor. These significant infrastructure expenditures, along with the availability of industrial and commercial land and local government promotion of the area has resulted in and is expected to continue resulting in the development of commercial and industrial property in Charlton and Wellcamp and increase in residential development in areas of Westbrook, Cotswold Hills and Kingsthorpe. Figure 1 shows these developments relative to Torrington Substation and the preferred future Charlton Substation. Loads and associated timings have been included in subsequent sections.
page 6
Figure 1 - Known existing/proposed developments and current zoning
InterLinkSQ Charlton Sports Precinct
Dense Urban Development Proposal
Ergon Energy held site
Proposed Substation
Kingsthorpe Township
TORR 110/33/11kV
Substation Purple Shading = Industrial Zoning
Brisbane West Wellcamp Airport and Wellcamp Business Park
page 7
2. Network Configuration and Capability
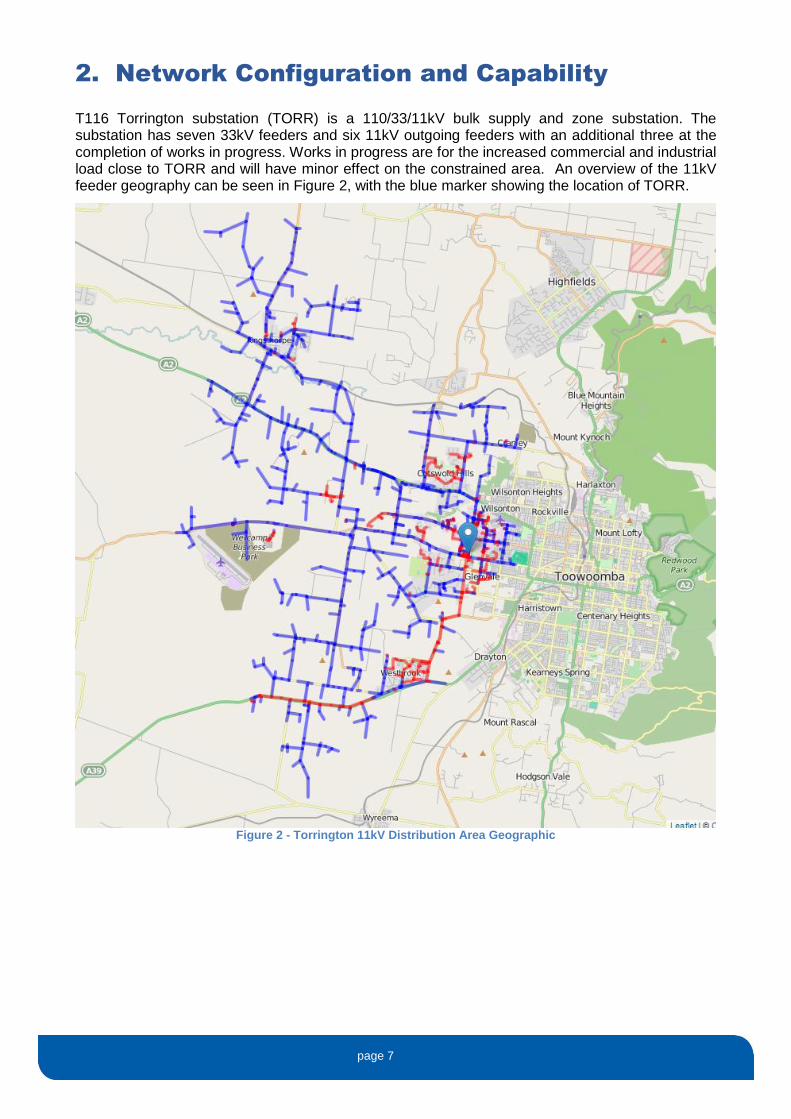
T116 Torrington substation (TORR) is a 110/33/11kV bulk supply and zone substation. The substation has seven 33kV feeders and six 11kV outgoing feeders with an additional three at the completion of works in progress. Works in progress are for the increased commercial and industrial load close to TORR and will have minor effect on the constrained area. An overview of the 11kV feeder geography can be seen in Figure 2, with the blue marker showing the location of TORR.
Figure 2 - Torrington 11kV Distribution Area Geographic

page 8
2.1 Network Forecast
Table 2 outlines the forecasted growth (summer) for Torrington 11kV. A simplified 1-5 year and 5-10 growth rates have also been shown.
2015 2016 2017 2018 2019 2020 2021 2022 2023 2024 Simplified 1-5 Year Growth
Simplified 5-10 Year Growth
2.50% 2.50% 2.40% 2.30% 2.30% 2.20% 2.20% 2.10% 2.10% 2.10% 2.42% 2.17%
Table 2 - Torrington 11kV Forecast
For Summer Day 2013/14, Torrington 33/11kV Substation experienced an 11kV peak load of 21.78MVA on 6 January 2014. This peak is only slightly lower than the 2012/13 Summer Day peak of 22.48MVA. Assessing the 2013/2014 peak against Ergon Energy’s forecast tool; 21.78MVA was less than both the 50POE and 10POE forecast days. The adjusted 50POE value is 22.35MVA (+2.60%) and 10POE value was 23.51MVA (+7.92%). The largest Summer Day peak in recent years was recorded in 2009/10 with 24.66MVA (well above 50POE and 10POE). This is represented graphically in Figure 3.
Figure 3 - Torrington 11kV Summer Day – Actual, POE Adjusted Peak and Forecast
2.2 Network Capacity
Table 3 indicates the maximum demands (2013/2014) along with the annual growth rates for all TORR 11kV feeders except Carroll Street which shows the 2012-2013 maximum demand.
Feeder Op Num
Feeder NAME
2013/2014 Peak load kVA (A)
Annual Growth Rate
SD SE SN WD WE WN 1-5 Year 5-10 Year
F2452 COTSWOLD HILLS 5854 (307)
4946 (260)
5726 (301)
5963 (313)
5517 (290)
6549 (344)
1.5% 2.1%
F2491 CHARLTON 4815 (253)
3967 (208)
3957 (208)
4075 (214)
3589 (188)
4398 (231)
1.3% 1.8%
F2638 CARROLL STREET 7208 (378)
3516 (185)
6040 (317)
5298 (278)
3181 (167)
5128 (269)
2.0% 2.0%
F2968 GLENVALE 6513 (342)
4951 (260)
6337 (333)
4103 (215)
3979 (209)
4107 (216)
1.0% 1.8%
F3472 MCDOUGALL STREET 4219 (221)
3175 (167)
4047 (212)
4147 (218)
3148 (165)
4232 (222)
2.5% 3.0%
F4610 WESTBROOK 1771 (93)
2472 (130)
2230 (117)
2904 (152)
3095 (162)
2843 (149)
2.0% 2.0%
Table 3 - Torrington 11kV Feeder 2013/2014 maximum demand
page 9
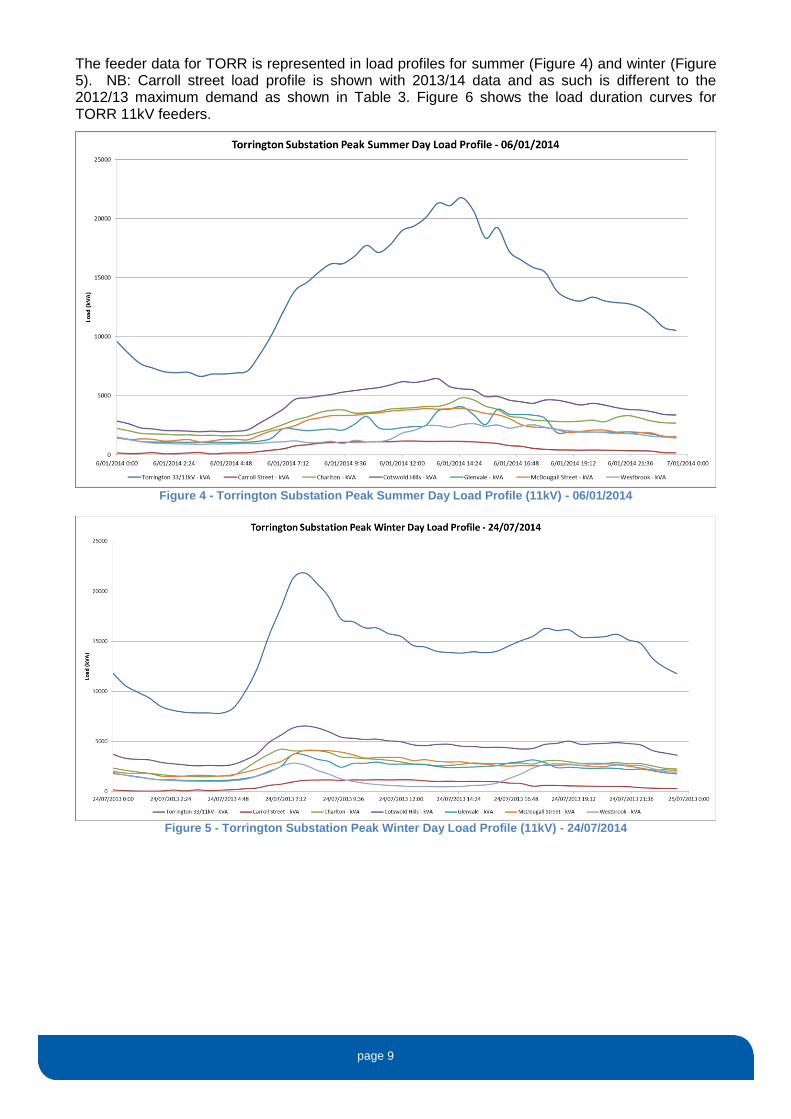
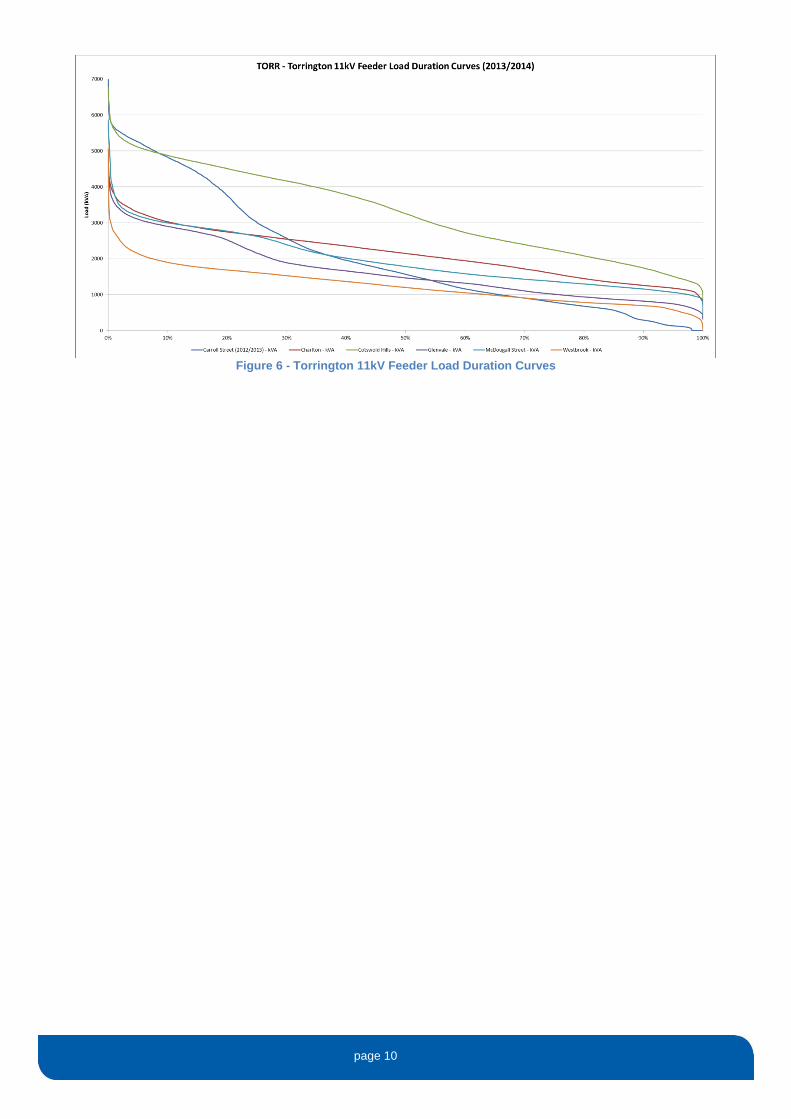
The feeder data for TORR is represented in load profiles for summer (Figure 4) and winter (Figure 5). NB: Carroll street load profile is shown with 2013/14 data and as such is different to the 2012/13 maximum demand as shown in Table 3. Figure 6 shows the load duration curves for TORR 11kV feeders.
Figure 4 - Torrington Substation Peak Summer Day Load Profile (11kV) - 06/01/2014
Figure 5 - Torrington Substation Peak Winter Day Load Profile (11kV) - 24/07/2014
page 10
Figure 6 - Torrington 11kV Feeder Load Duration Curves

page 11
3. Emerging Distribution Network Limitations
3.1 Network Capacity
At the conclusion of works in progress, loads will be shifted and feeders servicing the study area will be renamed to Troy’s Road (formerly Charlton) and Glenvale West (formerly Glenvale). Glenvale and Charlton 11kV feeders will still exist but service loads close-in to TORR substation.
Table 4 shows the 11kV feeders associated with the study area and the feeder ratings along with the expected growth rates and subsequent loads. Yellow indicates load relative to rating greater than 50%, Red greater than 75% and black greater than feeder limiting rating.
NB: Cotswold Hills 11kV feeder has had some load shifted to an alternative substation to reduce the risk of peak load exceeding the OH conductor rating. This was completed late in 2014 and is not represented in the load profiles previously. However the scaled peaks are shown below.
Table 4 - Prospective loads and associated feeder ratings
It can be seen that within the review window of ten years, Troy’s Rd, Glenvale West and Cotswold Hills are predicted to exceed the planning criteria. Troy’s Rd and Glenvale West feeders are limited in their tie capability to other distribution feeders. The factors influencing this are; topography of feeders and associated tie points, loading and voltage constraints when feeders are tied or when considering prospective ties and the lack of discrete feeders in the study region. As there are only two feeders in the region the planning criteria is effectively reduced to 50% (2 into 1). Feeders that are exceeding the 50% criteria are shown as yellow in Table 4 and indicate a planning risk (ie in a contingency on a peak day, the load from a faulted feeder cannot be fully transferred to adjacent feeders/s).
Current
1-5yrs 6-10yrs Season SectionRating
(A)
N-1 (75%
utilisation)
2013 /
2014
2014 /
2015
2015 /
2016
2016 /
2017
2017 /
2018
2018 /
2019
2019 /
2020
2020 /
2021
2021 /
2022
2022 /
2023
2023 /
2024
UG 421 316
OH 347 260
UG 421 316
OH 437 328
UG 421 316
OH 486 365
UG 421 316
OH 461 346
UG 421 316
OH 505 379
UG 421 316
OH 507 380
UG 421 316
OH 617 463
UG 421 316
OH 704 528
UG 421 316
OH 736 552
UG 421 316
OH 700 525
UG 421 316
OH 757 568
UG 421 316
OH 768 576
UG 300 225
OH 617 463
UG 300 225
OH 704 528
UG 300 225
OH 736 552
UG 300 225
OH 700 525
UG 300 225
OH 757 568
UG 300 225
OH 768 576
UG 421 316
OH 617 463
UG 421 316
OH 704 528
UG 421 316
OH 736 552
UG 421 316
OH 700 525
UG 421 316
OH 757 568
UG 421 316
OH 768 576
UG 421 316
OH 617 463
UG 421 316
OH 704 528
UG 421 316
OH 736 552
UG 421 316
OH 700 525
UG 421 316
OH 757 568
UG 421 316
OH 768 576
System Configuration
184 212
236 265
236 239 242 247 251 256 260 265
309
SNM
WD
WNM
WE
WD
SD
SE
212
SE 127 129
151SD
254
148 150 176
151 175 198 223 265 270
296 302204 231 260 290 309
302
222 230
360346
291
297
266
315
315
249 259
302
308 315 321 328241 270
218
154 156 302
227
187 190 192 195 197 200 203 207
169
207 210
171 202
207
142 144
169
250
205
94 96
210
256253
WE
WNM
290 296
213 215 218
215 218SNM
196 222 249
205 222 226
230 233
215
211 214 218
234226
264
281
284
338
286271 276
278
233
259 263
239
213
332 353
247220 223 226 230
230
234
239
111 113
155 158
139 142
181
Growth Rates Rating Forecast 10Yrs
F2452 COTSWOLD HILLS 1.50% 2.10%
153 180 208 296 322
F2491 CHARLTON 1.30% 1.80%
239 243
234
255 312 316 345
FUTURE TROYS ROAD FDR (NEW FDR 2) 1.30% 1.80%
SD
SE
SNM
WD
WE
WNM
217 265 269 293 319
93 98 100 102 104 106 108
F4610 WESTBROOK 2.00% 2.00%
SD
SE
SNM
WD
WE
WNM
117 119 121 124 126 129 131 134 137
130 132 135 138 140 143 146 149 152
149 152 155 158 161 165 168 171 175
185
162 165 169 172 175 179 182 186 190 194 197
152 155 158 161 164 168 171 174 178
178 182
209 256 259 283 308 332 357 400 407 415 422
375 405 435 488 497 506 515
209 256 259 283 308 332 357 400 407 415 422
396 444 452 460 468
344 370 415 422 430 438
379 386191
FUTURE GLENVALE WEST (NEW FDR 3) 1.30% 1.80%
SD 280 364 369 374
WNM 255 338 343 347
SNM 230 313 317 321 325
232 284 288
234 237 259 281 304 326 366 373
314 341 369
SE 230 313 317 321 325 330 335 341 348 354 360
378 383 390 397 404 412 419
WD 238 321 326 330 334 338 345 351 357 364 370
330 335 341 348 354 360
WE 210 293 297 301 305 309 314 320 326 331 337
352 356 363 369 376 383 390
page 12
3.2 Network Voltage
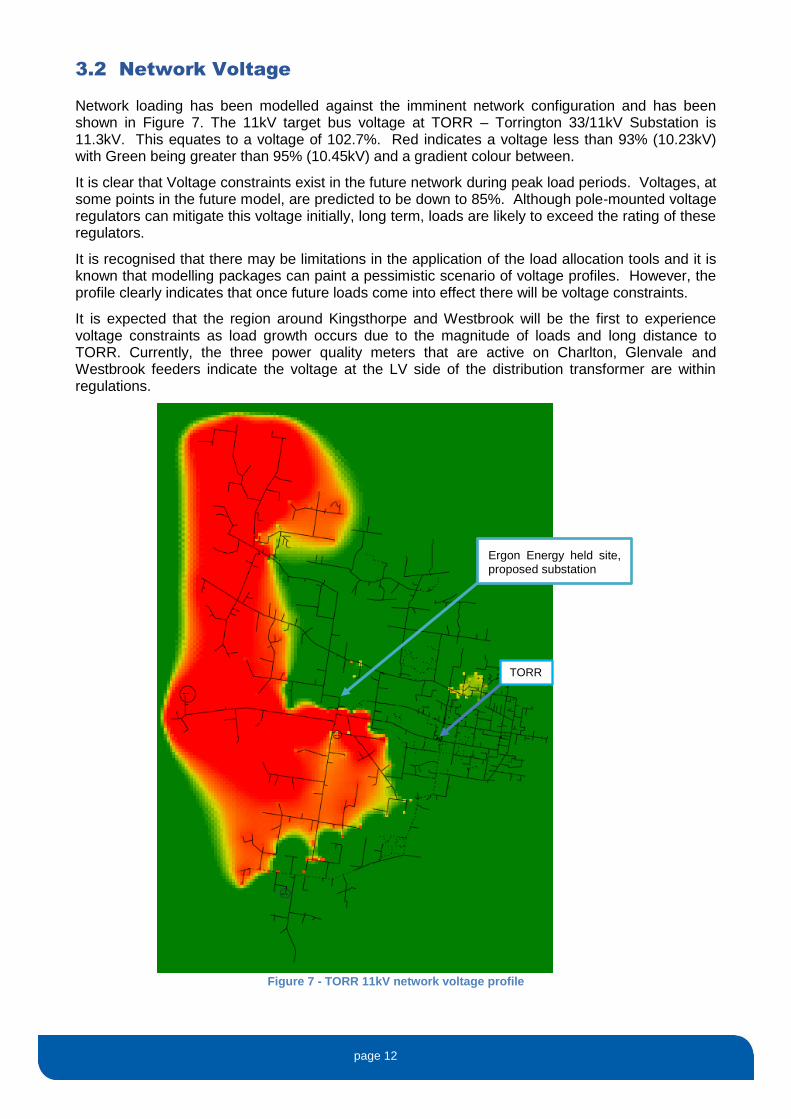
Network loading has been modelled against the imminent network configuration and has been shown in Figure 7. The 11kV target bus voltage at TORR – Torrington 33/11kV Substation is 11.3kV. This equates to a voltage of 102.7%. Red indicates a voltage less than 93% (10.23kV) with Green being greater than 95% (10.45kV) and a gradient colour between.
It is clear that Voltage constraints exist in the future network during peak load periods. Voltages, at some points in the future model, are predicted to be down to 85%. Although pole-mounted voltage regulators can mitigate this voltage initially, long term, loads are likely to exceed the rating of these regulators.
It is recognised that there may be limitations in the application of the load allocation tools and it is known that modelling packages can paint a pessimistic scenario of voltage profiles. However, the profile clearly indicates that once future loads come into effect there will be voltage constraints.
It is expected that the region around Kingsthorpe and Westbrook will be the first to experience voltage constraints as load growth occurs due to the magnitude of loads and long distance to TORR. Currently, the three power quality meters that are active on Charlton, Glenvale and Westbrook feeders indicate the voltage at the LV side of the distribution transformer are within regulations.
Figure 7 - TORR 11kV network voltage profile
TORR
Ergon Energy held site, proposed substation

page 13
3.3 Do Nothing Option
Ergon Energy believes that “Do Nothing” is not acceptable for the following reasons:
It is expected that Troy’s Rd Feeder may exceed NCC within the ten year study period. It is also clear that Cotswold Hills, Carroll Street and Glenvale West feeders will exceed the 75% planning criteria during the period. Although it is possible to balance some loads, full load balance will not be possible due to the load profiles and load locations on these feeders.
Voltage is a significant issue on the Glenvale West and Troy’s Rd feeders. This issue is some part due to the increase in loads at the extremities of the feeders.
In addition to network constraints, there is an aspect of sudden Customer Initiated Capital Works risk. The region is poised for sudden growth attributable to the Brisbane West Wellcamp Airport, Toowoomba Second Range Crossing and Inland Rail Corridor along with local government promotion of the area. Should additional works not be completed in this region, it is likely that significant voltage and capacity constraints could present when additional customers begin to connect.
The “Do Nothing” option is not considered technically viable at this time.
page 14
4. Proposed Network Option
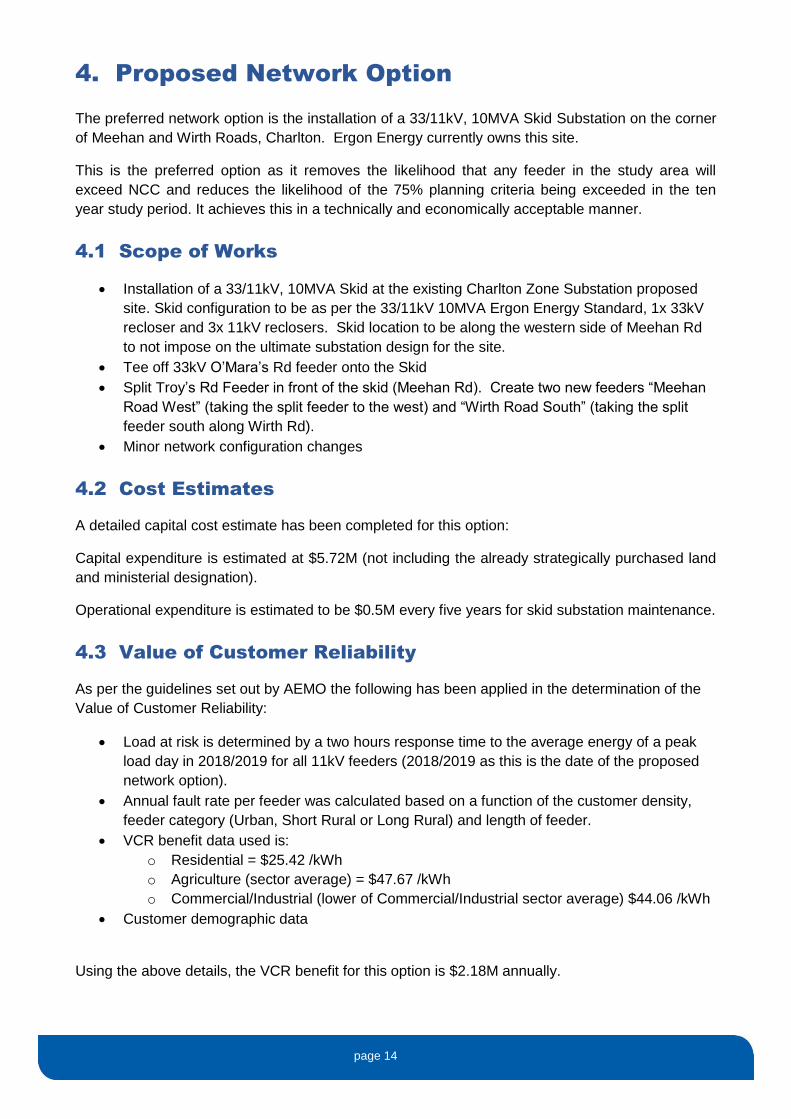
The preferred network option is the installation of a 33/11kV, 10MVA Skid Substation on the corner
of Meehan and Wirth Roads, Charlton. Ergon Energy currently owns this site.
This is the preferred option as it removes the likelihood that any feeder in the study area will
exceed NCC and reduces the likelihood of the 75% planning criteria being exceeded in the ten
year study period. It achieves this in a technically and economically acceptable manner.
4.1 Scope of Works
Installation of a 33/11kV, 10MVA Skid at the existing Charlton Zone Substation proposed
site. Skid configuration to be as per the 33/11kV 10MVA Ergon Energy Standard, 1x 33kV
recloser and 3x 11kV reclosers. Skid location to be along the western side of Meehan Rd
to not impose on the ultimate substation design for the site.
Tee off 33kV O’Mara’s Rd feeder onto the Skid
Split Troy’s Rd Feeder in front of the skid (Meehan Rd). Create two new feeders “Meehan
Road West” (taking the split feeder to the west) and “Wirth Road South” (taking the split
feeder south along Wirth Rd).
Minor network configuration changes
4.2 Cost Estimates
A detailed capital cost estimate has been completed for this option:
Capital expenditure is estimated at $5.72M (not including the already strategically purchased land
and ministerial designation).
Operational expenditure is estimated to be $0.5M every five years for skid substation maintenance.
4.3 Value of Customer Reliability
As per the guidelines set out by AEMO the following has been applied in the determination of the
Value of Customer Reliability:
Load at risk is determined by a two hours response time to the average energy of a peak
load day in 2018/2019 for all 11kV feeders (2018/2019 as this is the date of the proposed
network option).
Annual fault rate per feeder was calculated based on a function of the customer density,
feeder category (Urban, Short Rural or Long Rural) and length of feeder.
VCR benefit data used is:
o Residential = $25.42 /kWh
o Agriculture (sector average) = $47.67 /kWh
o Commercial/Industrial (lower of Commercial/Industrial sector average) $44.06 /kWh
Customer demographic data
Using the above details, the VCR benefit for this option is $2.18M annually.

page 15
4.4 Net Present Value
Using the values presented in the previous sections a NPV can be developed.
Component of NPV Cost Timeframe
Contract Value of Skid Substation $5.0M between 2015/16 and 2016/17
Maintenance Cost of Skid Substation $0.5M every 5 years
Value of Customer Reliability (VCR) $2.176M annually applied from 2017/18 for 10 years
In development of the NPV, Ergon Energy has determined that a Skid substation is a capital deferment tool and not a permanent solution. It is expected that a Skid substation will remain technically viable at the Charlton site within the 10 year study window and at that time additional capacity may be required. Before that time, full planning reviews and further Regulatory Investment Tests will be required to determine the most effective solution to the emerging constraints at that time. However to develop an effective NPV analysis, Ergon Energy has used the value of an effectively staged modular substation at year 10 of the 20 year evaluation period. The strategic estimate of a Modular Zone Substation is $20M (spread across 2023/24 and 2024/25).
In development of the NPV, Ergon Energy has used the following conditions:
Pre-tax nominal WACC (as at 01/07/2015): 8.10%
CPI: 2.50%
Evaluation Period: 20 years
The Net Present Value for the proposed network option equates to $4.58M.
4.5 Expected date of completion
The target completion date for an option or options to address the identified need is 30 June 2017. Ergon Energy is on track to achieve this target date for the proposed network option including construction and commissioning.

page 16
5. Alternative Network Options
The preferred network option is the installation of a 33/11kV, 10MVA Skid Substation on the corner
of Meehan and Wirth Roads, Charlton. This is the preferred option as it removes the likelihood that
any feeder in the study area will exceed NCC and reduces the likelihood of the 75% planning
criteria being exceeded in the ten year study period.
As part of the network planning process several alternative network options were considered.
These alternative network options were disregarded for various technical and economic reasons
and thus not considered credible:
Installation of a 2x20MVA Zone Substation at the proposed Charlton skid site.
This option was technically viable, but provided an excessive capacity increase into the
area. Therefore this option was ruled as economically unviable compared to the
economically viable Skid substation.
Installation of a 2x20MVA Modular Zone Substation (constructed in stages) at the proposed
Charlton skid site.
This option was technically viable, but provided an excessive capacity increase into the
area. Therefore this option was ruled as economically unviable compared to the
economically viable Skid substation.
Installation of an “express” or “high capacity” 11kV feeder from Torrington 110/33/11kV
Substation into the study area.
This option was not technically viable as it only delivered a minor increase in capacity and a
minor improvement in voltage. This option did not fully remove the voltage constraints and
did not provide capacity to support the short term forecast growth.

page 17
6. Non-Network Options Analysis
Ergon Energy is committed to an “Effective Market and Efficient Service”. A key way that Ergon Energy delivers on this commitment is through the integration of non-network solutions to mitigate constraints and emerging constraints in the network. To facilitate this commitment, Ergon Energy has a dedicated team, Channel Partnerships, which specialise in Non-network solution integration. This team works closely with Ergon Energy’s Network Planning teams to ensure that products, concepts and opportunities are realised.
Channel Partnerships, in consultation with the Network Planning Teams, works to ensure that products, concepts and opportunities meet the following minimum requirements when dealing with existing or emerging constraints:
Able to address the identified need
Economically feasible
Technically feasible
Able to be implemented in sufficient time to meet the identified need
6.1 Non-network Opportunities – Internal
The first step in analysing the study area is to determine, in consultation with Channel Partnerships, what viable solutions (both network and non-network) exist to mitigate the constraints and emerging constraints. As such, Channel Partnerships conducted an appraisal of the review area to identify and evaluate any non-network opportunities. The reviewed opportunities represent energy that could be removed from the peak periods. The assessment covered both Torrington 110/33/11kV Substation (TORR) and West Toowoomba 33/11kV Substation (WETO) distribution areas. Deferment or shifting of load within WETO distribution area will have minimal effect on the distribution area of TORR and no effect to the study area.
The appraisal summary identified that there is approximately 300-400kVA of brownfield Commercial & Industrial and 30-40kVA brownfield Residential demand management opportunities. The report also concludes that there are limited 11kV Greenfield Commercial & Industrial opportunities and 300-400kVA Greenfield Residential opportunities. There are some 33kV Greenfield opportunities of between 250-500kVA. In total there is between 350-450kVA of brownfield and 300-400kVA Greenfield non-network opportunities in the distribution area of TORR substation.
Channel Partnerships concluded that there was no suitable generation demand response at this time.
Using $500/kVA approximation for realisation of non-network opportunities, the opportunities identified would cost between $450,000 and $500,000 to implement.
6.2 Non-Network Opportunities Analysis - Internal
At the completion of existing works (in 2015/2016), there will be one feeder that is 1MVA above the 4 into 3 (75%) planning criteria. By 2019/20 one feeder’s rating will be exceeded by 260kVA and there will be approximately (combined) 2MVA above the planning criteria of the other 11kV feeders. This is based on the current forecasts and the expected loads.
If the non-network opportunities were to be 100% outworked (ie the full 850kVA) this would form approximately 1/3 of the Load at Risk or load above planning criteria in 2019/2020. To resolve the remaining 2/3 of Load at Risk or exceedance of planning criteria, network solutions are likely to be required.
page 18
Based on Channel Partnership’s assessment, Ergon Energy has determined that demand management and demand response will not fully mitigate the existing and emerging constraints and therefore does not meet the technical requirements. In addition, the cost of realising the non-network opportunities would be between $450,000 and $500,000. In fully mitigating the constraints, the network solution will satisfy the full load at risk and load above planning criteria. Therefore the non-network solution component would be ineffective and add additional cost to the project with no benefit or value and is subsequently not economically viable.
The internal non-network assessment is not considered as a viable option, as it is not technically able to fully mitigate all constraints.
6.3 Non-Network Opportunities – External
The second step was to validate Channel Partnership’s findings of no technical or economically viable non-network solutions that would either fully or partially mitigate the emerging constraints. To facilitate this, Ergon Energy released the “Screening for non-network options report” in April 2015. The purpose of the report was to provide an opportunity for registered participants and interested parties to give comments on the emerging constraints and suggest solutions or products to mitigate the emerging constraints.
Ergon Energy received one formal response. The response detailed a staged 3x 1.2MVA Diesel Generation solution located at the Ergon Energy owned proposed substation site.
Due to the commercial sensitivity of the response, the network support charges will not be detailed in this report.
6.4 Non-Network Opportunities Analysis – External
Respondents to the “screening for non-network options report” were required to satisfy the four categories; ability to address the identified need, economically feasible, technically feasible and be able to be implemented in sufficient time to meet the identified need.
Ergon Energy received one formal response to the “screening for non-network options report”. The proposal was reviewed to determine the effectiveness of meeting the said criteria and a detailed response was provided to the proponent. The below summarises Ergon Energy’s response to the proponent addressing each category.
Able to address the identified need:
For various reasons, the proponent had assumed a low run time requirement for the plant. Ergon Energy believes that this is not likely to be true due to the requirements of future block loads increasing the duration of exceedance but not necessarily the peak magnitude. Ergon Energy also does not believe that the proponent had considered the run time requirements for voltage constraints. Voltage constraints do not always correlate with peak periods and hence are likely increase generator runtimes outside of peak periods.
Commercial Feasibility:
Ergon Energy believes that the run time annual cost is expected to be in excess of $0.5M per annum by the end of the 10 year period. This figure was based on no volatility price for diesel. Over the 10 year period, the change in cost of diesel may have a significant impact on the feasibility of the project due to the change in runtime costs. This will be dependent on market conditions and has a significant impact on Operational Costs of the project.
Excluding the Value of Customer Reliability (VCR) the Skid solution has the better NPV outcome over a ten year period. If VCR is included, the benefits for a solution are limited to the capacity of the solution, the tie points available and the speed in which switching can occur. The Skid solution has at least 10MVA capacity, whereas the proponent’s solution has a maximum of 3.6MVA
page 19
capacity, with this difference, the VCR difference is substantial and thus favours investment into a Skid solution over the proponent’s solution.
Technically Feasible:
Ergon Energy recognised the proponent’s experience in the use of generation for network support. As such, the technical feasibility of proponent’s ability to manage generators to meet peak demand constraints is accepted. However, due to the complexity of constraints in the study area including feeder ratings (linked to peak demand), low voltage (and high voltage in some locations due to PV) and increasing customer numbers, Ergon Energy determined that diesel generators do not satisfactorily resolve these constraints. As such, Ergon Energy believes that Diesel generators are not technically viable at this time.
Implementable by 30 June 2017:
Ergon Energy recognised the proponent’s experience in the design, construction and commissioning of generation for network support. As such, the ability for the proponent to meet the design and construction target deadline was not in question.
Technology Acceptance:
The site that the proponent proposed currently has a Ministerial Designation for the use as electrical infrastructure, specifically a 33/11kV substation. If the proponent’s proposal was accepted, it would be dependent on the Minister approving a variation to the Ministerial Designation for the storage of bulk fuel and the continual use of generation plant. It is unknown what the timeframe for this request would be and there is a risk of the change not being approved. Alternatively, Ergon Energy could elect to forgo the Ministerial Designation and conduct a Material Change of Use (MCU). This will be a lengthy process and will increase the measures required to limit impact on neighbours.
Conclusion to the proponent’s proposal:
Ergon Energy has a strong understanding and significant experience with the use of diesel generation in base load, peak lopping and outage management scenarios. Ergon Energy recognises and utilises Diesel generation as a peak lopping option and also as a capital investment deferment tool where appropriate. However, based on the data presented by the proponent and analysis by Ergon Energy, the Net Present Value (NPV) of generation versus a Skid solution does not prove to be a wise investment decision at this time. The Skid solution is further reinforced when the Value of Customer reliability (VCR) is considered, as the capacity for the skid to provide long term support in most distribution contingencies is greater than the generation units.
This response did not meet all technical or economic requirements presented in the Screening report. Subsequently, Ergon Energy met with the proponent who was advised of this determination along with the specific technical and economic reasons for the determination.
6.5 Non-Network Opportunities Conclusion
Ergon Energy believes through the Network Planning process, Channel Partnership’s group investigation and then finally through a “screening for non-network options report” that all opportunities for non-network alternatives have been exhausted. The conclusion of Ergon Energy is that there is no non-network option that is, or forms a significant part of, a credible option for the solution to the constraints and emerging constraints identified in the study area.
page 20
7. Next Steps
This Final Project Assessment Report is the final step of the RiT-D process for Charlton/Wellcamp. As the non-network assessment has determined there are no credible non-network solutions, Ergon Energy plans to proceed with the proposed network solution of a 10MVA 33/11kV Skid Substation at the Charlton site.
As per 5.17.5 (a) of the National Electricity Rules;
(a) Registered Participants, the AEMC, Connection Applicants, Intending Participants, AEMO, interested parties, and non-network providers may, by notice to the AER, dispute conclusions made by the RIT-D proponent (Ergon Energy) in the final project assessment report on the grounds that:
(1) the RIT-D proponent (Ergon Energy) has not applied the regulatory investment test for distribution in accordance with the Rules; or
(2) there was a manifest error in the calculations performed by the RIT-D proponent (Ergon Energy) in applying the regulatory investment test for distribution.
A disputing party has 30 days from the publish date of this FPAR (as per 5.17.5 (c)) on the Ergon Energy “Regulatory Investment Test for Distribution (RIT-D) Partner Portal”. The portal is available at:
https://www.ergon.com.au/network/network-management/network-infrastructure/regulatory-test-consultations
Although Ergon Energy is confident that the proposed network option presents the most prudent and efficient solution to the existing and emerging constraints and has met all regulatory investment test requirements, the proposed solution may alter due to changing power system conditions or other circumstances beyond the control of Ergon Energy.
If decisions regarding this project affect timelines, but don’t represent a significant scope change, then this will be communicated in the DAPR published in September/October each year. Should significant scope changes be required then it is likely that Ergon Energy will reengage in the RiT-D process.

page 21
8. NER clause compliance for the FPAR
To ensure that Ergon Energy fulfils its obligations with regard to completion of the Final Project Assessment Report, the following table has been provided. This table sets out Ergon Energy’s requirements and how they have been achieved in this document as per clause 5.17.4(r) of the National Electricity Rules. NER Clause Number
Summary of requirements Relevant section in FPAR or Ergon Energy comments
5.17.4 (o) (p) Publish the FPAR in a timely manner. Ergon Energy, as listed in the Screening for Non-Network options report, indicated a publish date before 30 September 2015.
5.17.4 (q) Notify persons on the demand side register. Ergon Energy posts the FPAR on the Partner Portal.
5.17.4 (r)(2) Complete a FPAR covering items specified in 5.17.4 (j).
See below.
5.17.4 (j)(1) A description of the identified need for investment.
Section 2. Section 3.
5.17.4 (j)(2) The assumptions used in identifying the need.
Section 3.
5.17.4 (j)(3) Summary of, and commentary on, the submissions on the Non-Network Options Report.
Section 6.
5.17.4 (j)(4) A description of each credible option. Section 4.
5.17.4 (j)(5) A quantification of each applicable market benefit for each credible option.
Section 4.
5.17.4(j)(6) A quantification of each applicable cost for each credible option, including breakdown of operating and capital expenditure.
Section 4.
5.17.4(j)(7) A detailed description of methodologies used in quantifying each class of market benefit.
Not Applicable
5.17.4(j)(8)
Where relevant, the reasons why the proponent determined that a class or classes of market benefits do not apply to a credible option.
Not Applicable
5.17.4(j)(9) The results of a net present value analysis for each option and accompanying explanatory statements regarding the results.
Section 4.4
5.17.4(j)(10) The identification of the proposed preferred option.
Section 4.
5.17.4(j)(11)
Technical characteristics, construction timetable and commissioning timetable, indicative costs, statement and detail about how the proposed option satisfies the RiT-D.
Section 4. Section 6.5 Section 7.
5.17.4(j)(12) Contact details to comment on the FPAR.
The FPAR has been released through Ergon Energy’s partner portal. All communication is coordinated through the portal.
5.17.4 (s) Option for <$20m project to have FPAR executed via the DAPR.
Ergon Energy has decided to place key information in the DAPR 2015, but still complete this FPAR.