final progress report - sawislibrary.co.za · final progress report programme & project leader...
TRANSCRIPT

Progress report 1
CFPA Canning Fruit Producers’ Assoc.
Submit to: Wiehahn Victor
PO Box 426 Paarl, 7620
Tel: +27 (0)21 872 1501
DFPT Deciduous Fruit Producers’ Trust
Submit to: Louise Kotzé
Suite 275, Postnet X5061 Stellenbosch, 7599
Tel: +27 (0)21 882 8470/1
DFTS Dried Fruit Technical Services
Submit to: Dappie Smit
PO Box 426 Paarl, 7620
Tel: +27 (0)21 872 1501
Winetech
Submit to: Jan Booysen
PO Box 825 Paarl, 7624
Tel: +27 (0)21 807 3324
����
Indicate (�) client(s) to whom this progress report is submitted. Replace any of these with other relevant clients if required.
FINAL PROGRESS REPORT
PROGRAMME & PROJECT LEADER INFORMATION
Programme leader Project leader Title, initials, surname Dr O Augustyn Dr M du Toit Present position Research Leader Senior Lecturer Address ARC Infruitec-Nietvoorbij
Post-Harvest and Wine Technology Private Bag X5026 7599 Stellenbosch
Institute for Wine Biotechnology, Department of Viticulture and Oenology Stellenbosch University 7600 Stellenbosch
Tel. / Cell no. 021-8093126 021-8083772
Fax 021-8093002 021-8083771 E-mail [email protected] [email protected]
PROJECT INFORMATION
Project number WW 10/14 and IWBT 5/11
Project title The role of microorganisms in the formation of bitterness in wines
CFPA DFPT
DFTS Winetech Oenology: Microbiology
Industry programme
Other
Fruit kind(s)
Start date (dd/mm/yyyy) 01/01/2001 End date (dd/mm/yyyy) 31/03/2006
FOR OFFICE USE ONLY
Industry programme leader
Specialist committee
Meeting date
Amount awarded

Progress report 2
SUMMARY OF FINAL REPORT
PROGRAMME & PROJECT LEADER INFORMATION
Programme leader Project leader Title, initials, surname Dr O Augustyn Dr M du Toit Institution ARC Infruitec-Nietvoorbij
Post-Harvest and Wine Technology
Institute for Wine Biotechnology, Department of Viticulture and Oenology Stellenbosch University
Tel. / Cell no. 021-8093126 021-8083772 E-mail [email protected] [email protected]
PROJECT INFORMATION
Project number WW 10/14 and IWBT 5/11 Project title The role of microorganisms in the formation of bitterness in wines
Fruit kind(s)
Start date (dd/mm/yyyy) 01/01/2001 End date (dd/mm/yyyy) 31/03/2006
Certain yeast/grape must combinations can lead to glycerol:glucose ratios that may place the wines at risk for subsequent bitter spoilage by bacteria. In this project the yeasts WE 372, WE 14, NT 112, BM 45 and L2323 appeared to be implicated under certain circumstances. These yeasts should be investigated further.
It was found that there are definite differences between the LAB ecology of Pinotage, Merlot and Cabernet Sauvignon. Cabernet Sauvignon had a higher LAB population, while Pinotage, a unique South African variety, had the most diverse population. Wines made with different yeasts and then inoculated with the GD-possessing LAB have been submitted to the analytical unit for the analysis of phenol profile changes and acrolein (see comments Task 3). No significant differences were seen over a two month period with regard to glycerol concentrations.
Literature indicates that the key inducers of astringency and bitter taste in wine are still unclear and research results are sometime contradictory. It is recommended that a multi-disciplinary study be initiated to quantify the sensory active non-volatile compounds in wine. The results emerging from a study such as this, should clarify the uncertainty between the sensory perception of red wine and the chemical compounds corresponding with taste stimuli.

Progress report 3
PROGRESS REPORT
1. Problem identification and objectives Shortly state the problem being addressed and the ultimate aim of the project.
State the objectives for the current year and for the following year.
The winemaking process is a complex ecological niche where the biochemistry and interaction of yeasts and bacteria play a pivotal role in determining the final quality of the end product. It is therefore crucial to understand the conditions under which a specific microorganism can cause spoilage, such as bitterness. Most evidence with respect of bitterness is of anecdotal nature. Chemical, physical (temperature) and biological causes have been proposed.
Glycerol, next to ethanol and CO2, is the third major product of yeast metabolism during the fermentation of grape must. Acrolein is produced during bacterial degradation of glycerol and as a single component is not problematic. However, when it reacts with the hydroxyl groups of phenolic compounds in wine it produces wine with an unpleasant bitterness. Pasteur associated this defect in red wines with rod-shaped bacteria and reduced levels of glycerol. This problem is usually associated with red wines rather than white wines due to their higher phenolic content. Acrolein formation has been associated with species of the genera Lactobacillus, Leuconostoc, Oenococcus and Pediococcus, but it is definitely strain dependent. Strains possessing a glycerol dehydratase (GD) enzyme convert glycerol into 3-hydroxypropionaldehyde. The fate of 3-hydroxypropionaldehyde is dependent on the conditions prevailing in the wine (i) spontaneous dehydration due to heat or storage under acidic conditions yielding acrolein; (ii) heterofermentative lactobacilli, such as L. brevis, assisting in maintaining the redox balance of the 6-phosphogluconate pathway by the production of 1,3-propandiol by a dehydrogenase enzyme (This will only occur in the presence of glucose); (iii) the aldehyde is oxidised to 3-hydroxypropionic acid in the absence of glucose; (iv) acrolein, apart from its bitterness, can also be reduced to an allyl alcohol in the presence of NADH.
Certain South African red wines are more prone to possess unacceptable levels of bitterness and have led to great economical losses, as these wines have to be disposed. The objective of this project is therefore to determine whether bitterness in red wines is due to certain bacteria or yeasts or if these microorganisms are partly responsible for this defect in wine. However, to make any conclusions with regard to the role these microorganisms play in and the analysis of bitter wines, analytic methods have to be developed to determine bitter complexes and possible changes in the different phenolic compounds present in red wines. 2. Amended workplan (materials & methods) Give the proposed workplan for continuation if changes are proposed to the original workplan.
For all the tasks it is important to identify possible partners from the wine industry that have experienced bitterness previously and to collect bitter samples, as well as control samples of red wines where bitterness is not problematic. It is important from a microbiological perspective to obtain yeasts and bacteria for characterization with regard to their potential to cause bitterness and to start a database with the analytical tools that will be developed.
Glycerol 3-HPA 1, 3- Propanediol
Acrolein BBiitttteerrnneessss
H2O H2O
NADH+H+ NAD+
GD enzyme
Anthocyanins
Phenols

Progress report 4
TASK 1: The influence of yeasts on bitterness in wine (N Jolly)
2003-2004:
Milestone 1: Create database correlating bitter wines with yeast used for production, cultivar, vintage area and style of wine. Expand wine database by the inclusion of 2004 Young Wine and Veritas wines.
Milestone 2: Liaison with dried yeast manufacturers to obtain information regarding yeasts recommended for red wine production in South Africa.
Milestone 3: Laboratory-scale wine fermentation utilising yeasts used by the South African wine industry and/or yeasts identified by the data base that are used for production of wines that become bitter.
Milestone 4: A chemical analysis of above wines to determine glycerol content.
Milestone 5: Small-scale wine production with yeasts with ability to produce elevated levels of glycerol.
Milestone 6: Submit high glycerol wines to the bacteria group (M du Toit) for inoculation with bacteria identified as playing a role in bitterness formation.
Milestone 7: Submit all wines to analytical group (Task 3; P Minnaar) for the analyses of bitter compounds.
TASK 2: An investigation into lactic acid bacteria as a possible cause of bitterness in wine (M du Toit)
2003-2004:
Milestone 1: Isolation of LAB occurring on Pinotage, Merlot and Cabernet Sauvignon grapes and during the fermentation process. The bacterial diversity and cell numbers between the different red cultivars might provide us with an answer as to why certain cultivars are more inclined to become bitter.
Milestone 2: Identification of these LAB isolates.
Milestone 3: Determining the presence of the glycerol dehydratase enzyme in LAB isolates, and their ability to form acrolein.
Milestone 4: Analysis of LAB in small-scale wine fermentations for their ability to produce bitterness. Analysis of the wines with the developed analytical tools.
TASK 3: Development of the analytical tools to measure bitterness (P Minnaar)
2002-2004:
Milestone 1: Optimisation of the method that was developed for liquid chromatography according to the method of Waterhouse et al. (1999). Standards will be used that show good results in the development of the method, such as catechin for flavan-3-ols at 280 nm, gallic acid for benzoic acids at 280 nm, caffeic acid for hydroxycinnamic acids at 316 nm, rutin for flavonols at 360 nm and malvin for anthocyanins and their derivates at 520 nm.
Milestone 2: Synthesis of the precursor to acrolein, namely 3-hydroxypropionaldehyde, according to the methods described by Hall & Stern (1950) and Talarico & Dobrogosz (1989).
Milestone 3: Development of the technique described by Breckenridge et al. (1997) using a GC-MS-MS for detection of 3- hydroxypropionaldehyde and acrolein in bitter wines and experiments conducted with the yeasts and bacteria to determine their potential in causing bitterness.
Progress report 5
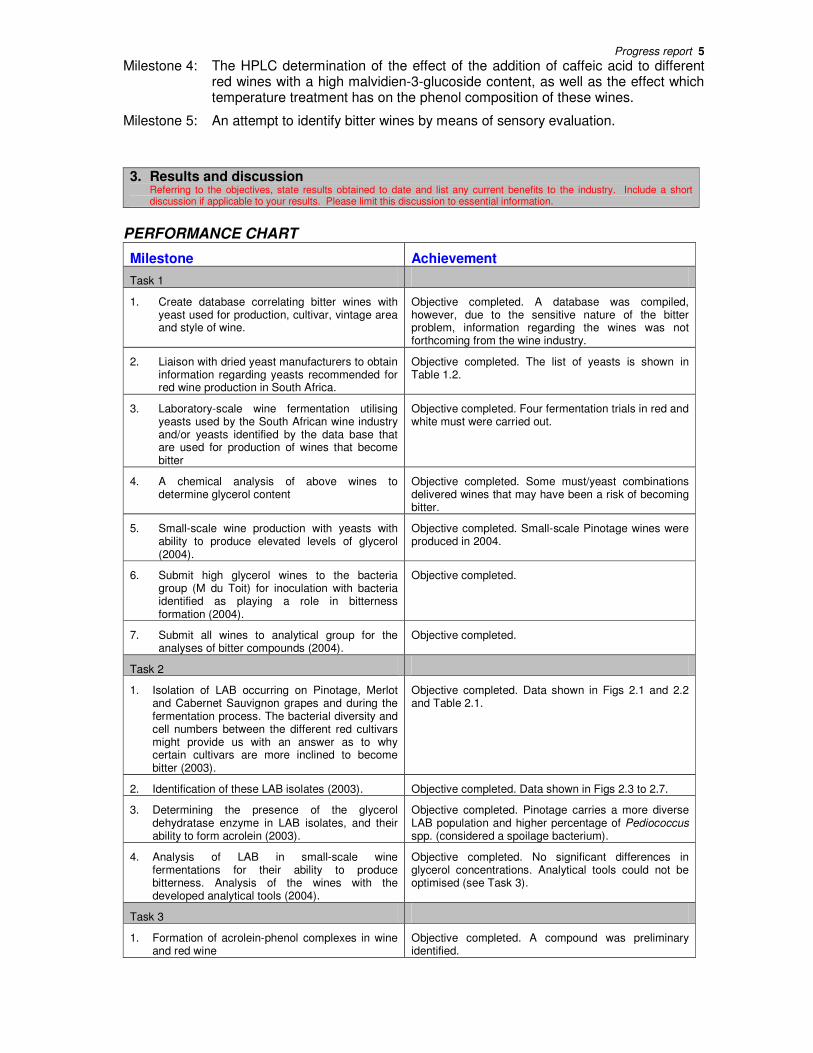
Milestone 4: The HPLC determination of the effect of the addition of caffeic acid to different red wines with a high malvidien-3-glucoside content, as well as the effect which temperature treatment has on the phenol composition of these wines.
Milestone 5: An attempt to identify bitter wines by means of sensory evaluation.
3. Results and discussion Referring to the objectives, state results obtained to date and list any current benefits to the industry. Include a short
discussion if applicable to your results. Please limit this discussion to essential information.
PERFORMANCE CHART
Milestone Achievement
Task 1
1. Create database correlating bitter wines with yeast used for production, cultivar, vintage area and style of wine.
Objective completed. A database was compiled, however, due to the sensitive nature of the bitter problem, information regarding the wines was not forthcoming from the wine industry.
2. Liaison with dried yeast manufacturers to obtain information regarding yeasts recommended for red wine production in South Africa.
Objective completed. The list of yeasts is shown in Table 1.2.
3. Laboratory-scale wine fermentation utilising yeasts used by the South African wine industry and/or yeasts identified by the data base that are used for production of wines that become bitter
Objective completed. Four fermentation trials in red and white must were carried out.
4. A chemical analysis of above wines to determine glycerol content
Objective completed. Some must/yeast combinations delivered wines that may have been a risk of becoming bitter.
5. Small-scale wine production with yeasts with ability to produce elevated levels of glycerol (2004).
Objective completed. Small-scale Pinotage wines were produced in 2004.
6. Submit high glycerol wines to the bacteria group (M du Toit) for inoculation with bacteria identified as playing a role in bitterness formation (2004).
Objective completed.
7. Submit all wines to analytical group for the analyses of bitter compounds (2004).
Objective completed.
Task 2
1. Isolation of LAB occurring on Pinotage, Merlot and Cabernet Sauvignon grapes and during the fermentation process. The bacterial diversity and cell numbers between the different red cultivars might provide us with an answer as to why certain cultivars are more inclined to become bitter (2003).
Objective completed. Data shown in Figs 2.1 and 2.2 and Table 2.1.
2. Identification of these LAB isolates (2003). Objective completed. Data shown in Figs 2.3 to 2.7.
3. Determining the presence of the glycerol dehydratase enzyme in LAB isolates, and their ability to form acrolein (2003).
Objective completed. Pinotage carries a more diverse LAB population and higher percentage of Pediococcus spp. (considered a spoilage bacterium).
4. Analysis of LAB in small-scale wine fermentations for their ability to produce bitterness. Analysis of the wines with the developed analytical tools (2004).
Objective completed. No significant differences in glycerol concentrations. Analytical tools could not be optimised (see Task 3).
Task 3
1. Formation of acrolein-phenol complexes in wine and red wine
Objective completed. A compound was preliminary identified.

Progress report 6
2. Analysis of the phenolic composition of bitter and non-bitter wines by liquid chromatography
Objective completed. Data shown in Tables 3.1 and 3.2.
3. Development of the technique described by Breckenridge et al. (1997) using a GC-MS-MS for detection of 3- hydroxypropionaldehyde and acrolein in bitter wines and experiments conducted with the yeasts and bacteria to determine their potential in causing bitterness
Objective not completed due to lack of man power and availability of instrumentation.
4. The HPLC determination of the effect of the addition of caffeic acid to red wines with a high malvidien-3-glucoside content, as well as the effect which temperature treatment has on the phenolic composition of these wines.
Objective not completed due to malfunctioning of instrumentation.
5. An attempt to identify bitter wines by means of a sensory evaluating panel
Objective completed. Pinotage had a slightly higher percentage of bitter wines than Cabernet Sauvignon.
TASK 1: The influence of yeasts on bitterness in wine (N Jolly)
It is surmised that bitterness in wines is caused by bacteria utilising glycerol in the wine to form acrolein that subsequently leads to the formation of bitter compounds. The bacterial growth is also affected by the glycerol:glucose ratio in the wine. According to Sauvageot et al. (2000), an optimum ratio of glycerol:glucose of 3:1 leads to the conversion of glycerol to 3-hydroxypropioaldehyde, a precursor of acrolein. Ratios above and below this optimum, lead to lower levels of 3-hydroxypropioaldehyde. From a perusal of the data presented by Sauvageot et al. (2000), a range of ratios can be arbitrarily chosen around the optimum e.g. between 2:1 and 11:1, where higher levels of 3-hydroxypropioaldehyde are formed. This range of ratios could then be used to determine whether wines have the potential for 3-hydroxypropioaldehyde formation by bacteria and therefore to become bitter.
Milestone 1: Create database correlating bitter wines with yeast used for production, cultivar, vintage area and style of wine.
Young and Veritas Wine Show wines for 2002 were obtained and tasted for bitterness by an experienced in-house wine tasting panel. Very few wines were judged to be bitter (as determined by at least at least two thirds of the panel) (Table 1.1). This was to be expected, as the entered wines would have been screened for faults by the submitting wine producers. Chemical analyses of glycerol and glucose on these wines and subsequent calculation of the Glycerol:glucose ratios showed that none fell within the arbitrarily chosen 2:1 to 11:1 range. However, should bacterial bitter spoilage have already occurred, then a different ratio will be expected. This will be especially applicable to the Veritas wines that are already bottled. The young wines can, however, be already affected or could still be at risk.
There was no evident correlation between the bitter wines (as judged by the panel) and the glycerol:glucose ratios (Table 1.1). However, this may be due to too few wines analysed. As information on the yeasts used for fermentation was not available, no link between bitter wines and yeasts could be obtained.

Progress report 7
Table 1.1 Glycerol:glucose ratios of Young Wine and Veritas Show red wines judged to be bitter.
Young Wine Show Veritas wine Show Glycerol:Glucose ratio range (x:1 to y:1)
No. of wines analysed
Wines judged to be bitter1
No. of wines analysed
Wines judged to be bitter1
2-11 12 – 100 18 4 3 0 101 – 200 4 2 201 – 300 3 1 301 – 400 1 1 401 – 500 1 0 501 – 600 1 0 601 – 700 1 1 701 – 800 1 0 801 – 900 5 0 1 0 901 – 1000 21 5 4 2 1001 – 1100 23 4 18 3 1101 – 1200 27 11 16 4 1201 – 1300 13 6 7 1 1301 – 1400 3 0 1 0 1401 - 1500 3 0 1 1 Total no. of wines 125 35 51 11 1By at least two thirds of an in-house Nietvoorbij wine tasting panel.
A database, utilising MS Access software, was created by Ms Magriet Treurnicht (University of Stellenbosch). The results of the sensory and chemical evaluation (see Task 3, Milestone 2) of Young Wine Show and Veritas Wine Show wines (2002 and 2003 vintages) were captured. Wines for 2004 vintage were also obtained, however, the voluntary supplying of information on the wines was not successful. This may have been due to the sensitive nature of the bitter problem. As a result, the database could not be developed further.
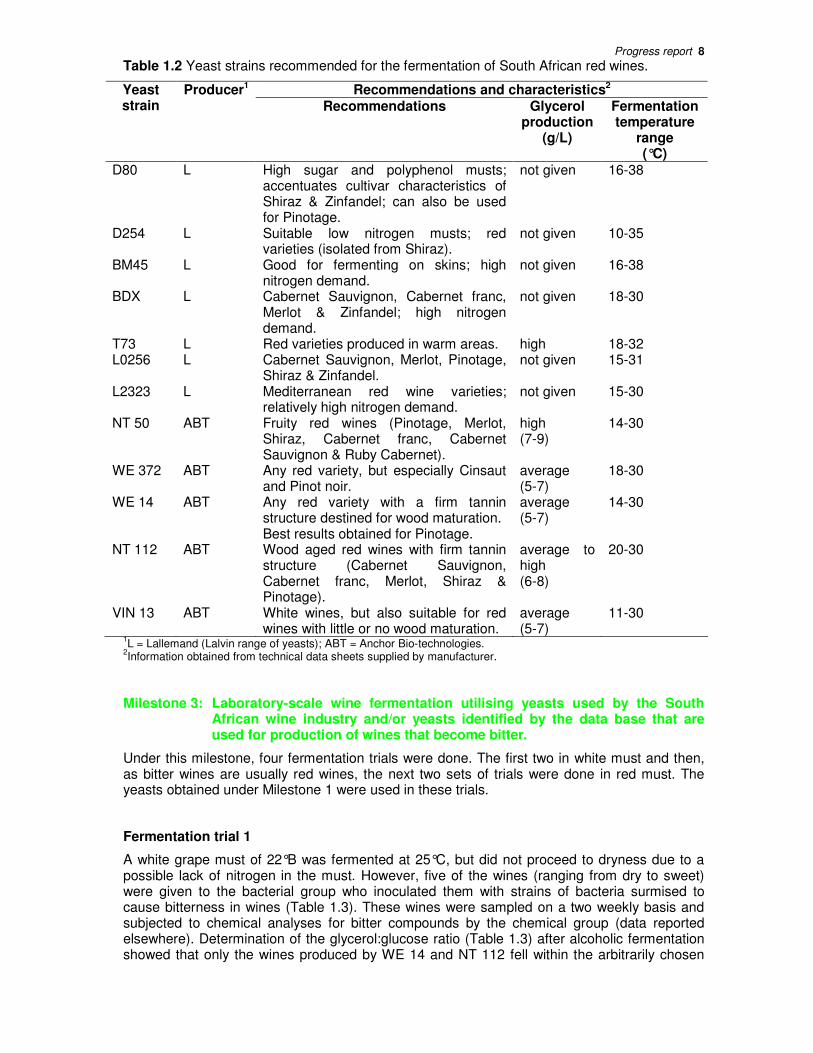
Milestone 2: Liaison with dried yeast manufacturers to obtain information regarding yeasts recommended for red wine production in South Africa.
Glycerol, next to ethanol and CO2, is the third major product of S. cerevisiae yeast metabolism during the fermentation of grape must. However, the amount produced can vary and this can therefore contribute indirectly to the formation of bitter components in wines. As the problem is largely limited to red wines, this investigation was limited to red wine yeasts.
As a large number of commercial yeast strains are available for wine production, two major yeast manufacturers were approached and asked for strains generally recommended for and/or used for production of red wine in South Africa (Table 1.2). These strains were subsequently purchased.
Progress report 8
Table 1.2 Yeast strains recommended for the fermentation of South African red wines.
Recommendations and characteristics2 Yeast strain
Producer1 Recommendations Glycerol
production (g/L)
Fermentation temperature
range (°C)
D80 L High sugar and polyphenol musts; accentuates cultivar characteristics of Shiraz & Zinfandel; can also be used for Pinotage.
not given 16-38
D254 L Suitable low nitrogen musts; red varieties (isolated from Shiraz).
not given 10-35
BM45 L Good for fermenting on skins; high nitrogen demand.
not given 16-38
BDX L Cabernet Sauvignon, Cabernet franc, Merlot & Zinfandel; high nitrogen demand.
not given 18-30
T73 L Red varieties produced in warm areas. high 18-32 L0256 L Cabernet Sauvignon, Merlot, Pinotage,
Shiraz & Zinfandel. not given 15-31
L2323 L Mediterranean red wine varieties; relatively high nitrogen demand.
not given 15-30
NT 50 ABT Fruity red wines (Pinotage, Merlot, Shiraz, Cabernet franc, Cabernet Sauvignon & Ruby Cabernet).
high (7-9)
14-30
WE 372 ABT Any red variety, but especially Cinsaut and Pinot noir.
average (5-7)
18-30
WE 14 ABT Any red variety with a firm tannin structure destined for wood maturation. Best results obtained for Pinotage.
average (5-7)
14-30
NT 112 ABT Wood aged red wines with firm tannin structure (Cabernet Sauvignon, Cabernet franc, Merlot, Shiraz & Pinotage).
average to high (6-8)
20-30
VIN 13 ABT White wines, but also suitable for red wines with little or no wood maturation.
average (5-7)
11-30
1L = Lallemand (Lalvin range of yeasts); ABT = Anchor Bio-technologies.
2Information obtained from technical data sheets supplied by manufacturer.
Milestone 3: Laboratory-scale wine fermentation utilising yeasts used by the South African wine industry and/or yeasts identified by the data base that are used for production of wines that become bitter.
Under this milestone, four fermentation trials were done. The first two in white must and then, as bitter wines are usually red wines, the next two sets of trials were done in red must. The yeasts obtained under Milestone 1 were used in these trials.
Fermentation trial 1
A white grape must of 22°B was fermented at 25°C, but did not proceed to dryness due to a possible lack of nitrogen in the must. However, five of the wines (ranging from dry to sweet) were given to the bacterial group who inoculated them with strains of bacteria surmised to cause bitterness in wines (Table 1.3). These wines were sampled on a two weekly basis and subjected to chemical analyses for bitter compounds by the chemical group (data reported elsewhere). Determination of the glycerol:glucose ratio (Table 1.3) after alcoholic fermentation showed that only the wines produced by WE 14 and NT 112 fell within the arbitrarily chosen

Progress report 9
range of ratios i.e. 2:1 to 11:1 and BM45 and L2323 lay close by. These wines could therefore have the potential to develop bitter compounds. The analyses by the chemical group will be able to confirm or disprove this hypothesis.
Table 1.3 Chemical analyses of wines inoculated with bacteria surmised to cause bitterness in wines (first fermentation trial).
Analyses1 Residual sugar
Yeast strain
Bacterial strain2
Glucose fraction3
(g/L)
Fruc-tose
fraction3 (g/L)
Total g/L)
Glycerol3 (g/L)
Alcohol3 (% v/v)
Total SO24
(mg/L)
Glycerol:glucose
ratio4
BM45 1 0.54 11.00 11.54 6.79 12.96 23 13:1 L2323 2 0.40 5.90 6.30 6.46 13.03 15 16:1 WE 14 3 2.21 20.57 22.78 7.05 12.26 19 3:1 NT 112 4 0.96 10.85 11.81 7.05 12.92 38 7:1 VIN 13 5 0.10 6.03 6.13 6.77 13.24 19 68:1
1Value for single fermentation only. Fermentation temperature = 25°C; Initial sugar = 22°B.
21 = Lactobacillus plantarum 76; 2 = L. collinoides 18850; 3 = L. paracasia; 4 = L. hilgardii 58; & 5 = L. hilgardii 58
3Winescan, Institute for Wine Biotechnology, University of Stellenbosch.
4Ripper method.
4Glycerol:glucose ratio that could lead to bacterial derived bitter wines indicated in bold (between 2 and 11).
Fermentation trial 2
The fermentation trials were repeated in a different white must (22°B adjusted to 24°B with sucrose addition) at 25°C. From the average values given in Table 1.4 can be seen that none of the wines fell within the arbitrarily chosen glycerol:glucose ratio of 2:1 to 11:1. However, the wines produced by BM45, WE 372, WE 14 and NT 112 were the closest. Furthermore, some of the values of the individual wines resulted in ratios within the 2:1 to 11:1 range. This is a possible indication that wines produced by the above-mentioned yeasts may be at risk for bacterial conversion of glycerol to acrolein, especially if SO2 levels are not adequate or sterile filtering has not been practised. The yeasts WE 14 and WE 372 are nearly exclusively used by some producers for red wines, especially Pinotage. Furthermore, Pinotage from certain cellars and particular vintages in the past has been linked to bitterness. These are often premium wines that undergo the minimum of filtering, and whose SO2 levels are kept at a minimum.
Concentrations of residual glucose and glycerol formed will differ between different types of musts, but it is not known if the ratios of glycerol:glucose will remain constant for a particular yeast strain irrespective of the must used. For these reasons, no recommendations can be made regarding yeast usage for red wine production in South Africa, before these preliminary findings have been confirmed in a variety of musts, including red musts.

Progress report 10
Table 1.4 Chemical analyses of wines of the second fermentation trial. Analyses1
Residual sugar Yeast strain
Glucose fraction2
(g/L)
Fructose fraction2
(g/L)
Total (g/L)
Glycerol2 (g/L)
Glycerol: glucose
ratio4
D80 0.39 2.33 2.86 7.67 20:1 D254 0.26 3.23 3.60 7.76 30:1 BM45 0.50 9.90 10.70 7.97 16:1 BDX 0.14 6.37 6.58 8.58 63:1 T73 0.20 5.33 5.61 8.11 40:1 L0256 0.26 2.22 2.58 8.35 32:1 L2323 0.23 2.14 2.51 8.05 35:1 NT 50 0.15 3.03 3.24 8.52 58:1 WE 372 0.56 2.11 2.92 8.43 15:1 WE 14 0.42 4.58 5.26 7.38 17:1 NT 112 0.59 2.26 3.18 7.95 13:1 VIN 13 0.15 1.77 2.00 8.21 56:1 1Average of triplicate fermentations. Fermentation temperature = 25°C; Initial sugar = 24°B.
2Winescan, Institute for Wine Biotechnology, University of Stellenbosch.
4Glycerol:glucose ratio that could lead to bacterial derived bitter wines indicated in bold (between 2 and 11).
Fermentation trial 3 Merlot grapes (23.5°B, pH 3.71) from the 2003 harvest (stored at –20°C for approximately four months) were used for the third fermentation trial. After thawing, the grapes were crushed and the juice separated from the skins. The juice and skins were divided equally and recombined for laboratory-scale fermentations at 25°C. The yeasts used were those previously identified as possibly playing a role in wine bitterness by producing glycerol:glucose ratios beneficial to bacterial spoilage. Chemical analyses of the resultant wines are shown in Table 1.1.
Table 1.5 Chemical analyses of Merlot wines of the third fermentation trial
Analyses1 Residual sugar
Yeast strain
Glucose fraction2
(g/L)
Fructose fraction2
(g/L)
Total
(g/L)
Glycerol2 (g/L)
Glycerol: glucose
ratio3
BM45 0.01 0.94 0.95 15.93 1593:1 WE 372 0.10 0.57 0.67 15.49 808:1 WE 14 0.01 0.93 0.94 12.91 1291:1 NT 112 0.01 0.72 0.73 14.55 1455:1 VIN 13 0.01 0.65 0.66 14.22 1422:1 BDX 0.01 0.68 0.69 13.84 1384:1 W2 0.01 0.71 0.72 15.38 1538:1 WBN39/NT 239 0.01 0.92 0.92 13.78 1378:1 NT 202 0.07 1.69 1.76 13.76 736:1 Spontaneous 0.61 3.05 3.66 15.78 26:1 1Average of duplicate fermentations. Fermentation temperature = 25°C; Initial sugar = 23.5°B.
2Winescan, Institute for Wine Biotechnology, University of Stellenbosch.
3Glycerol:glucose ratios that could lead to bacterial derived bitter wines lie between 2 and 11.
Progress report 11
All the wines fermented dry and as can be seen from the glycerol:glucose ratio (Table 1.5), it appears that none of the wines were at risk for bacterial derived bitterness. However, the spontaneous fermented wine is the closest to the 2-11 ratio range and might become bitter if bacterial growth occurs. After completion of alcoholic fermentation the wines were all inoculated with Lactobacillus plantarum (strain #14), a bacterium that is surmised to cause bitterness in red wine. The bacteria inoculated wines were subsequently sampled over a period of six months. Samples were conserved at –20°C but could not be analysed as the necessary techniques could not be developed.
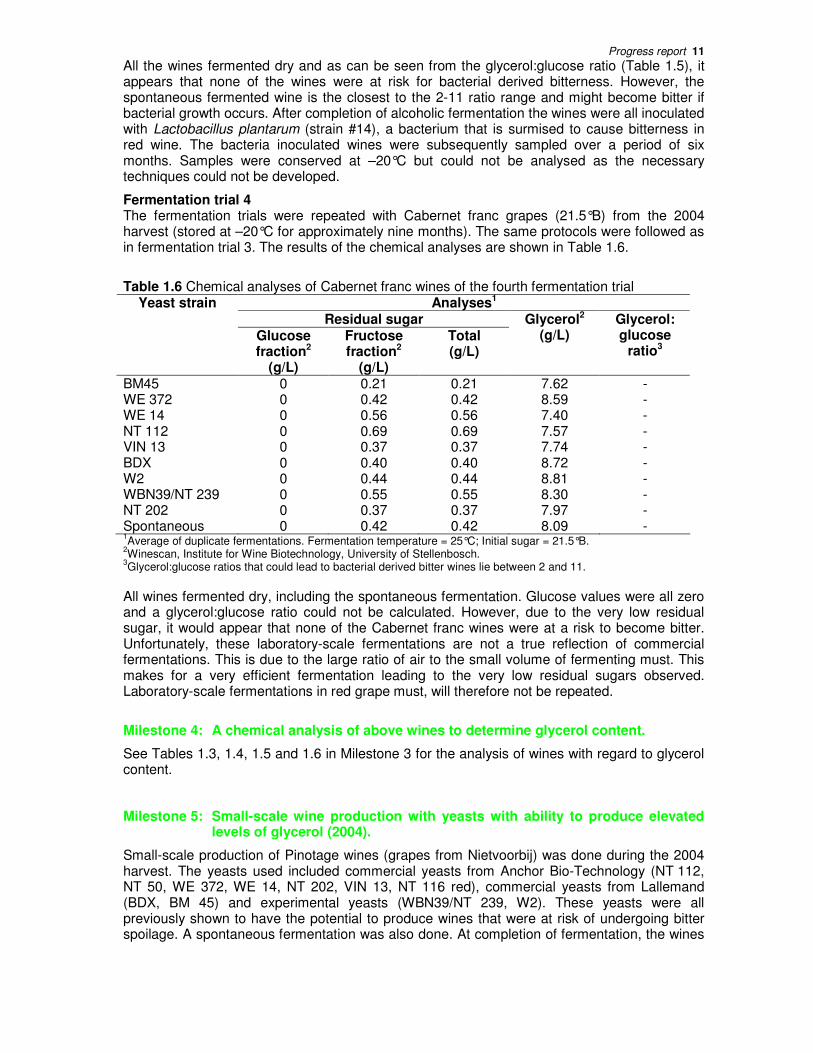
Fermentation trial 4 The fermentation trials were repeated with Cabernet franc grapes (21.5°B) from the 2004 harvest (stored at –20°C for approximately nine months). The same protocols were followed as in fermentation trial 3. The results of the chemical analyses are shown in Table 1.6.
Table 1.6 Chemical analyses of Cabernet franc wines of the fourth fermentation trial
Analyses1 Residual sugar
Yeast strain
Glucose fraction2
(g/L)
Fructose fraction2
(g/L)
Total (g/L)
Glycerol2 (g/L)
Glycerol: glucose
ratio3
BM45 0 0.21 0.21 7.62 - WE 372 0 0.42 0.42 8.59 - WE 14 0 0.56 0.56 7.40 - NT 112 0 0.69 0.69 7.57 - VIN 13 0 0.37 0.37 7.74 - BDX 0 0.40 0.40 8.72 - W2 0 0.44 0.44 8.81 - WBN39/NT 239 0 0.55 0.55 8.30 - NT 202 0 0.37 0.37 7.97 - Spontaneous 0 0.42 0.42 8.09 - 1Average of duplicate fermentations. Fermentation temperature = 25°C; Initial sugar = 21.5°B.
2Winescan, Institute for Wine Biotechnology, University of Stellenbosch.
3Glycerol:glucose ratios that could lead to bacterial derived bitter wines lie between 2 and 11.
All wines fermented dry, including the spontaneous fermentation. Glucose values were all zero and a glycerol:glucose ratio could not be calculated. However, due to the very low residual sugar, it would appear that none of the Cabernet franc wines were at a risk to become bitter. Unfortunately, these laboratory-scale fermentations are not a true reflection of commercial fermentations. This is due to the large ratio of air to the small volume of fermenting must. This makes for a very efficient fermentation leading to the very low residual sugars observed. Laboratory-scale fermentations in red grape must, will therefore not be repeated.
Milestone 4: A chemical analysis of above wines to determine glycerol content.
See Tables 1.3, 1.4, 1.5 and 1.6 in Milestone 3 for the analysis of wines with regard to glycerol content.
Milestone 5: Small-scale wine production with yeasts with ability to produce elevated levels of glycerol (2004).
Small-scale production of Pinotage wines (grapes from Nietvoorbij) was done during the 2004 harvest. The yeasts used included commercial yeasts from Anchor Bio-Technology (NT 112, NT 50, WE 372, WE 14, NT 202, VIN 13, NT 116 red), commercial yeasts from Lallemand (BDX, BM 45) and experimental yeasts (WBN39/NT 239, W2). These yeasts were all previously shown to have the potential to produce wines that were at risk of undergoing bitter spoilage. A spontaneous fermentation was also done. At completion of fermentation, the wines
Progress report 12
were split in two and one lot was given to the bacterial group for further investigation (Task 2, Milestone 4). The remainder of the wine was bottled at Nietvoorbij for reference purposes.
Milestone 6: Submit high glycerol wines to the bacteria group (M du Toit) for inoculation with bacteria identified as playing a role in bitterness formation (2004).
Laboratory-scale wines from fermentation trial 3 were inoculated with L. plantarum (Milestone 3). Small-scale Pinotage wines made at Nietvoorbij were given to the bacterial group (see Milestone 5 above).
Milestone 7: Submit all wines to analytical group for the analyses of bitter compounds (2004).
All relevant samples were submitted. Discussion The determination of the role of the yeast in promoting the bitterness potential of a wine based on a arbitrarily chosen range of glycerol:glucose ratios appears to be dependant on the actual grape must/wine yeast combinations. Some grape must appear to be more inclined to deliver wines with a problematic glycerol:glucose ratio and a few of the tested yeast appear to be more associated with these ratios than other yeasts. These yeasts i.e. WE 372, WE 14, NT 112, BM 45 and L2323 should be investigated further in this regard.
TASK 2: An investigation into lactic acid bacteria as a possible cause of bitterness in wine (M du Toit)
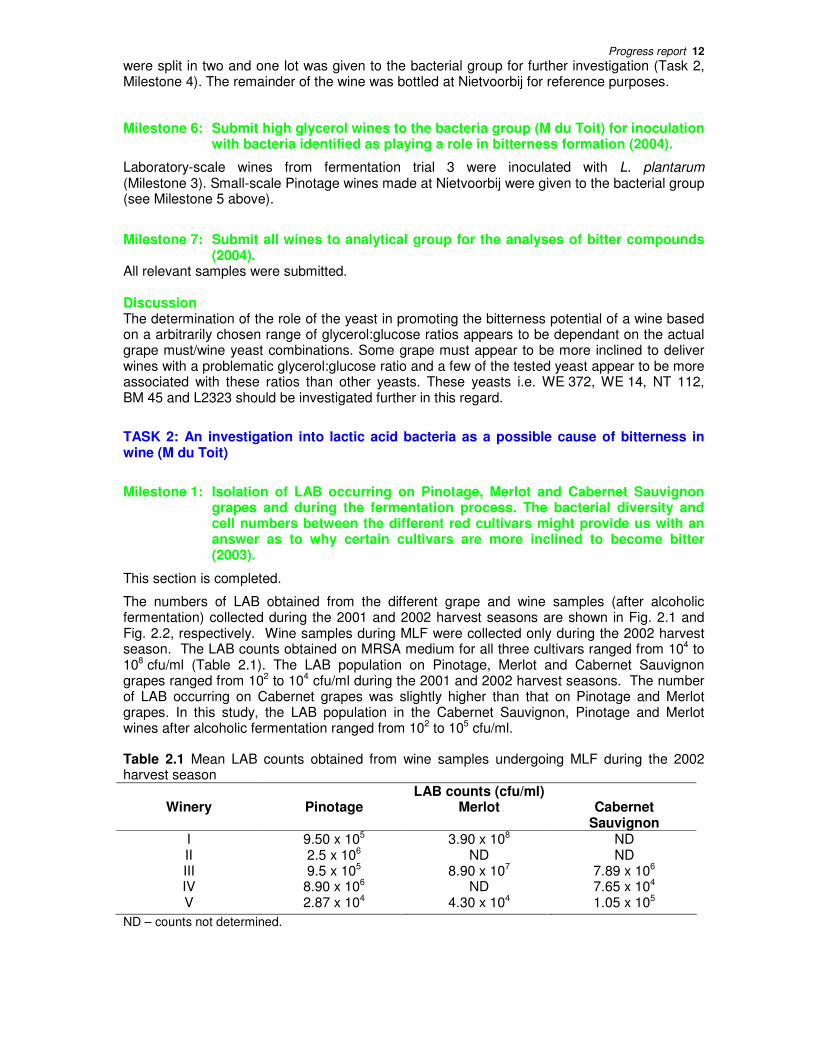
Milestone 1: Isolation of LAB occurring on Pinotage, Merlot and Cabernet Sauvignon grapes and during the fermentation process. The bacterial diversity and cell numbers between the different red cultivars might provide us with an answer as to why certain cultivars are more inclined to become bitter (2003).
This section is completed.
The numbers of LAB obtained from the different grape and wine samples (after alcoholic fermentation) collected during the 2001 and 2002 harvest seasons are shown in Fig. 2.1 and Fig. 2.2, respectively. Wine samples during MLF were collected only during the 2002 harvest season. The LAB counts obtained on MRSA medium for all three cultivars ranged from 104 to 108 cfu/ml (Table 2.1). The LAB population on Pinotage, Merlot and Cabernet Sauvignon grapes ranged from 102 to 104 cfu/ml during the 2001 and 2002 harvest seasons. The number of LAB occurring on Cabernet grapes was slightly higher than that on Pinotage and Merlot grapes. In this study, the LAB population in the Cabernet Sauvignon, Pinotage and Merlot wines after alcoholic fermentation ranged from 102 to 105 cfu/ml.
Table 2.1 Mean LAB counts obtained from wine samples undergoing MLF during the 2002 harvest season
LAB counts (cfu/ml) Winery Pinotage Merlot Cabernet
Sauvignon I 9.50 x 10⁵ 3.90 x 10⁸ ND II 2.5 x 10⁶ ND ND III 9.5 x 10⁵ 8.90 x 10⁷ 7.89 x 10⁶
IV 8.90 x 10⁶ ND 7.65 x 10⁴ V 2.87 x 10⁴ 4.30 x 10⁴ 1.05 x 10⁵
ND – counts not determined.

Progress report 13
Milestone 2: Identification of these LAB isolates (2003).
This section is completed.
The 32 coccobacilli strains of the obligatory heterofermentative group were screened with species-specific primers for Leuc. mesenteroides and O. oeni, respectively. Twenty-eight of these strains generated a 1 025 bp fragment with the O. oeni-specific primers and were identified as O. oeni (Fig. 2.3). The PCR reaction with the Leuc. mesenteroides-specific primers generated a 1 150 bp fragment for four of the strains.
The 30 rods of the obligatory heterofermentative group were screened with species-specific primers for Lb. brevis and Lb. hilgardii. Fifteen of these strains produced a 1 340 bp fragment with the primers for Lb. brevis (Fig. 2.4). A fragment of approximately 2 642 bp was generated by the remaining 15 strains with the primers for Lb. hilgardii (Fig. 2.5).
A multiplex PCR assay using species-specific primers for Lb. plantarum (318 bp), Lb. pentosus (218 bp) and Lb. paraplantarum (107 bp) was used to screen the strains in the facultative heterofermentative group. A 318 bp fragment was generated by 98 strains (Fig. 2.6), three strains generated a 107 bp fragment and 12 strains generated a 218 bp fragment.
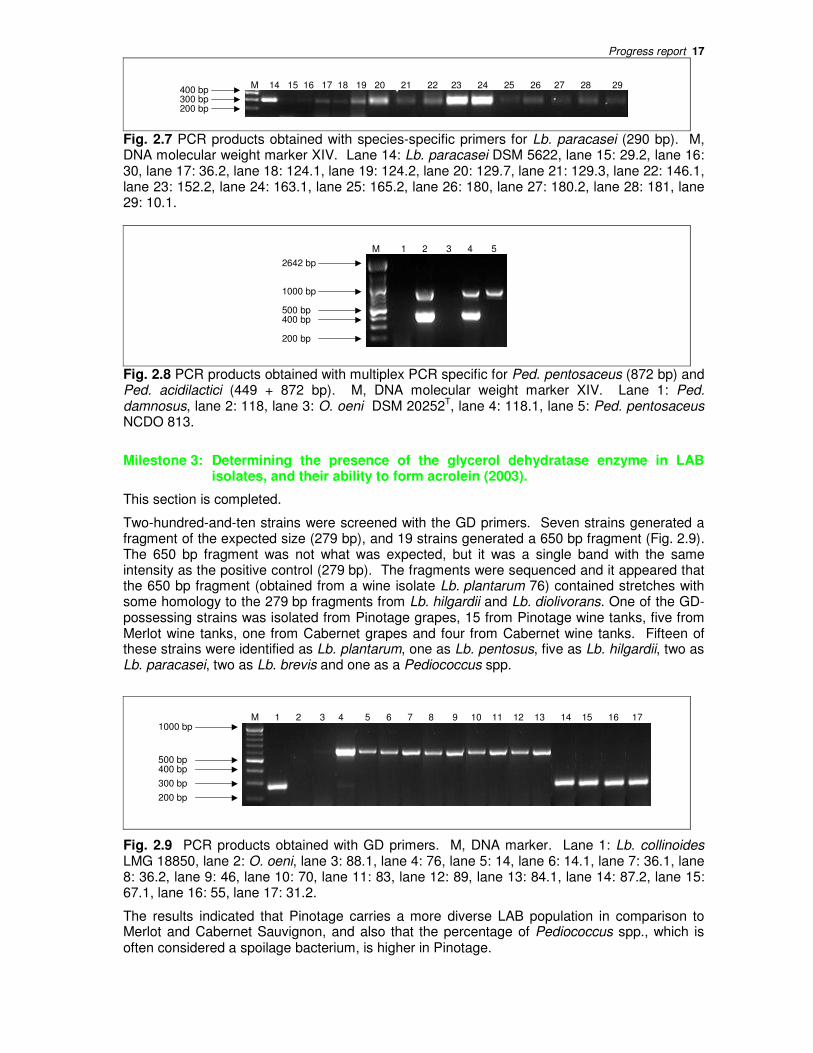
The remaining 28 strains of the facultative heterofermentative group generated a 290 bp fragment with the species-specific primers for Lb. paracasei (Fig. 2.7).
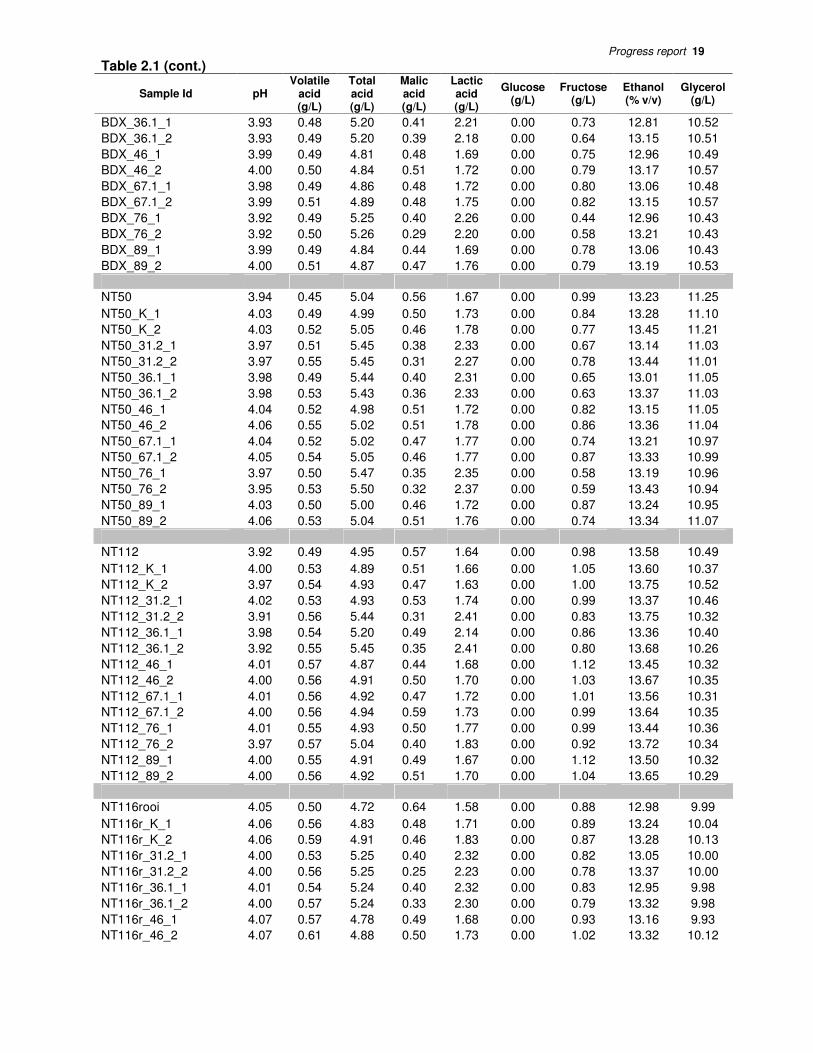
Two strains of the obligatory homofermentative group generated two fragments of 449 bp and 872 bp in the multiplex PCR assay with species-specific primers for Ped. pentosaceus (872 bp) and Ped. acidilactici (449 bp + 872 bp) (Fig. 2.8).

Progress report 14
1.00E+00
1.00E+01
1.00E+02
1.00E+03
1.00E+04
LA
B N
um
be
rs
(cfu
/ml)
I II III IV V
Wineries
A
Pinotage 2001
Merlot 2001
Cabernet 2001
1.00E+00
1.00E+01
1.00E+02
1.00E+03
1.00E+04
LA
B N
um
be
rs
(cfu
/ml)
I II III IV V
Wineries
B
Pinotage 2002
Merlot 2002
Cabernet 2002
Fig. 2.1 LAB numbers found on Pinotage, Merlot and Cabernet Sauvignon grapes during the 2001 (A) and 2002 (B) harvest seasons.

Progress report 15
1.00E+00
1.00E+01
1.00E+02
1.00E+03
1.00E+04
1.00E+05
LA
B N
um
be
rs
(cfu
/ml)
I II III IV V
Wineries
A
Pinotage 2001
Merlot 2001
Cabernet 2001
1.00E+00
1.00E+01
1.00E+02
1.00E+03
1.00E+04
1.00E+05
LA
B N
um
bers
(cfu
/ml)
I II III IV V
Wineries
B
Pinotage 2002
Merlot 2002
Cabernet 2002
Fig. 2.2 LAB numbers found in Pinotage, Merlot and Cabernet Sauvignon wine after alcoholic fermentation in 2001 (A) and 2002 (B).

Progress report 16
2642 bp
1000 bp
500 bp
M 1 2 3 4 5 6 7 8 9 10 11 12 13 14 15 16 17 18 19 20 21 22 23 24 25 26 27 28 29
Fig. 2.3 PCR products obtained with species-specific primers for O. oeni (1 025 bp). M, DNA marker. Lane 1: O. oeni DSM 20252T, lane 2: 76.1, lane 3: 170.2, lane 4: 164.3, lane 5: 164.2, lane 6: 126.2, lane 7: 169, lane 8: 135.1, lane 9 192.1, lane 10: 192, lane 11: 192.3, lane 12: 190.2, lane 13: 192.2, lane 14: 155.1, lane 15: 126, lane 16: 172.5, lane 17: 172.4, lane 18: 172.6, lane 19: 167, lane 20: 165.2, lane 21: 182.3, lane 22: 180, lane 23: 180.1, lane 24: 180.3, lane 25: 180.2, lane 26: 152, lane 27: 152.1, lane 28: 152.2, lane 29: 151.
2642 bp
1000 bp
500 bp
M 1 2 3 4 5 6 7 8 9 10 11 12 13 14 15 16
Fig. 2.4 PCR products obtained with species-specific primers for Lb. brevis (1 340 bp). M, DNA molecular weight marker XIV. Lane 1: Lb. brevis ATCC 14869T, lane 2: 81.1, lane 3: 3.3, lane 4: 111, lane 5: 116, lane 6: 116.2, lane 7: 117.1, lane 8: 130.2, lane 9: 117, lane 10: 130.6, lane 11: 108.2, lane 12: 89, lane 13: 117.2, lane 14: 130.3, lane 15: 130.4, lane 16: 116.3.
M 1 2 3 4 5 6 7 8 9 10 11 12 13 14 15 16
2642 bp
1000 bp
Fig. 2.5 PCR products obtained with species-specific primers for Lb. hilgardii (2 642 bp). M, DNA marker. Lane 1: Lb. hilgardii DSM 20176, lane 2: 58, lane 3: 67.1, lane 4: 87, lane 5: 81, lane 6: 89.3, lane 7: 89.1, lane 8: 89.2, lane 9: 87.2, lane 10: 87.1, lane 11: 3, lane 12: 16.1, lane 13: 17, lane 14: 51, lane 15: 51.2, lane 16: W4.
400 bp300 bp200 bp
100 bp
M 1 2 3 4 5 6 7 8 9 10 11 12 13 14 15 16 17 18 19 20 21 22
Fig. 2.6 PCR products obtained with multiplex PCR specific for Lb. plantarum (318 bp), Lb. paraplantarum (107 bp) and Lb. pentosus (218 bp). M, DNA marker. Lane 1: Lb. plantarum DSM 20174, lane 2: Lb. paraplantarum DSM 10667, lane 3: Lb. pentosus DSM 20314, lane 4: 81.2, lane 5: 82.1, lane 6: 82.2, lane 7: 82, lane 8: 6.1, lane 9: 75, lane 10: 100, lane 11: 100.1, lane 12: 69.1, lane 13: 69, lane 14: 50, lane 15: 14, lane 16: 14.1, lane 17: 68, lane 18: 83, lane 19: 43.1, lane 20: 43, lane 21: 55, lane 22: 55.1.
Progress report 17
400 bp300 bp200 bp
M 14 15 16 17 18 19 20 21 22 23 24 25 26 27 28 29
Fig. 2.7 PCR products obtained with species-specific primers for Lb. paracasei (290 bp). M, DNA molecular weight marker XIV. Lane 14: Lb. paracasei DSM 5622, lane 15: 29.2, lane 16: 30, lane 17: 36.2, lane 18: 124.1, lane 19: 124.2, lane 20: 129.7, lane 21: 129.3, lane 22: 146.1, lane 23: 152.2, lane 24: 163.1, lane 25: 165.2, lane 26: 180, lane 27: 180.2, lane 28: 181, lane 29: 10.1.
2642 bp
1000 bp
500 bp400 bp
200 bp
M 1 2 3 4 5
Fig. 2.8 PCR products obtained with multiplex PCR specific for Ped. pentosaceus (872 bp) and Ped. acidilactici (449 + 872 bp). M, DNA molecular weight marker XIV. Lane 1: Ped. damnosus, lane 2: 118, lane 3: O. oeni DSM 20252T, lane 4: 118.1, lane 5: Ped. pentosaceus NCDO 813.
Milestone 3: Determining the presence of the glycerol dehydratase enzyme in LAB isolates, and their ability to form acrolein (2003).
This section is completed.
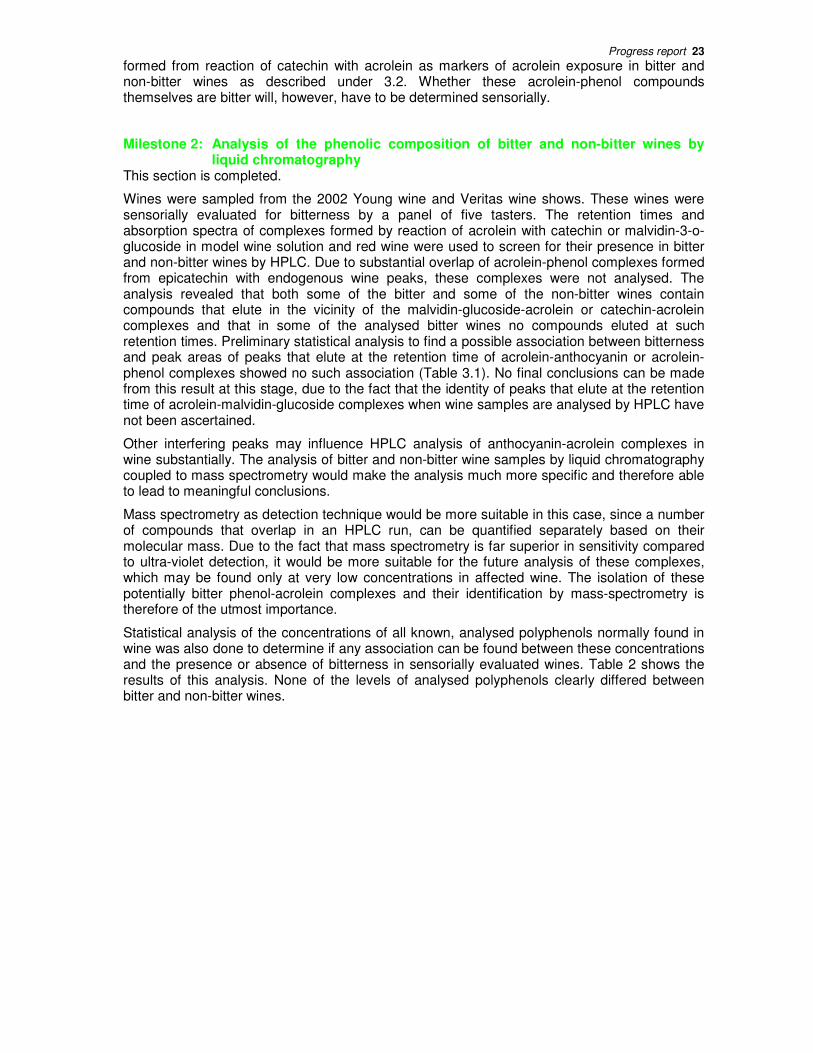
Two-hundred-and-ten strains were screened with the GD primers. Seven strains generated a fragment of the expected size (279 bp), and 19 strains generated a 650 bp fragment (Fig. 2.9). The 650 bp fragment was not what was expected, but it was a single band with the same intensity as the positive control (279 bp). The fragments were sequenced and it appeared that the 650 bp fragment (obtained from a wine isolate Lb. plantarum 76) contained stretches with some homology to the 279 bp fragments from Lb. hilgardii and Lb. diolivorans. One of the GD-possessing strains was isolated from Pinotage grapes, 15 from Pinotage wine tanks, five from Merlot wine tanks, one from Cabernet grapes and four from Cabernet wine tanks. Fifteen of these strains were identified as Lb. plantarum, one as Lb. pentosus, five as Lb. hilgardii, two as Lb. paracasei, two as Lb. brevis and one as a Pediococcus spp.
1000 bp
500 bp400 bp
300 bp
200 bp
M 1 2 3 4 5 6 7 8 9 10 11 12 13 14 15 16 17
Fig. 2.9 PCR products obtained with GD primers. M, DNA marker. Lane 1: Lb. collinoides LMG 18850, lane 2: O. oeni, lane 3: 88.1, lane 4: 76, lane 5: 14, lane 6: 14.1, lane 7: 36.1, lane 8: 36.2, lane 9: 46, lane 10: 70, lane 11: 83, lane 12: 89, lane 13: 84.1, lane 14: 87.2, lane 15: 67.1, lane 16: 55, lane 17: 31.2.
The results indicated that Pinotage carries a more diverse LAB population in comparison to Merlot and Cabernet Sauvignon, and also that the percentage of Pediococcus spp., which is often considered a spoilage bacterium, is higher in Pinotage.

Progress report 18
The formation of acrolein of the GD-possessing LAB strains was not performed as the methodology was not yet optimised when the MSc student finished her project and will thus be performed as soon as possible.
Milestone 4: Analysis of LAB in small-scale wine fermentations for their ability to produce bitterness. Analysis of the wines with the developed analytical tools (2004).
Wines made in Task 1 were inoculated with GD-producing LAB and the routine wine analysis is presented in Table 2.1. The wines were submitted for analysis within Task 3, but due to problems no results have been obtained for this part of the work. It can be seen from the results that after two months there was no significant differences in glycerol concentrations.
Table 2.1 Routine wine analysis of wine fermented with different wine yeasts and then inoculated with different GD-producing LAB.
Sample Id pH Volatile
acid (g/L)
Total acid (g/L)
Malic acid (g/L)
Lactic acid (g/L)
Glucose (g/L)
Fructose (g/L)
Ethanol (% v/v)
Glycerol (g/L)
Sp 3.93 0.44 4.85 0.49 1.65 0.00 1.05 13.10 10.22
Sp_K_1 4.01 0.48 4.78 0.51 1.66 0.00 0.85 13.26 10.11
Sp_K_2 4.01 0.53 4.86 0.43 1.69 0.00 0.93 13.41 10.23
Sp_31.2_1 3.95 0.49 5.22 0.37 2.25 0.00 0.79 13.08 9.92
Sp_31.2_2 3.95 0.53 5.25 0.29 2.22 0.00 0.78 13.36 9.91
Sp_36.1_1 3.97 0.49 5.25 0.43 2.32 0.00 0.86 12.97 10.00
Sp_36.1_2 3.96 0.52 5.26 0.35 2.26 0.00 0.77 13.31 9.94
Sp_46_1 4.03 0.51 4.76 0.43 1.65 0.00 0.94 13.05 9.96
Sp_46_2 4.04 0.52 4.81 0.52 1.68 0.00 0.92 13.25 10.14
Sp_67.1_1 4.03 0.50 4.78 0.50 1.67 0.00 0.93 13.19 9.92
Sp_67.1_2 4.03 0.53 4.83 0.40 1.68 0.00 1.04 13.28 10.06
Sp_76_1 3.94 0.48 5.31 0.34 2.36 0.00 0.57 13.05 9.95
Sp_76_2 3.93 0.51 5.31 0.28 2.34 0.00 0.76 13.33 9.90
Sp_89_1 4.03 0.50 4.77 0.43 1.66 0.00 0.96 13.12 9.85
Sp_89_2 4.03 0.53 4.82 0.48 1.74 0.00 0.94 13.21 10.03
BM45 4.02 0.51 5.04 0.72 1.88 0.00 0.89 13.13 9.90
BM45_K_1 4.06 0.55 4.91 0.54 1.86 0.00 0.86 13.04 9.64
BM45_K_2 4.07 0.59 5.01 0.56 1.91 0.00 0.87 13.16 9.69
BM45_31.2_1 4.03 0.54 5.30 0.48 2.40 0.00 0.64 12.79 9.56
BM45_31.2_2 4.00 0.61 5.33 0.31 2.43 0.00 0.83 13.10 9.55
BM45_36.1_1 4.02 0.55 5.32 0.47 2.42 0.00 0.82 12.67 9.58
BM45_36.1_2 4.02 0.59 5.32 0.45 2.39 0.00 0.85 13.05 9.51
BM45_46_1 4.06 0.55 4.90 0.50 1.83 0.00 0.83 12.91 9.65
BM45_46_2 4.08 0.60 4.96 0.52 1.91 0.00 0.74 13.03 9.73
BM45_67.1_1 4.06 0.56 4.95 0.51 1.93 0.00 0.70 12.93 9.50
BM45_67.1_2 4.07 0.59 4.98 0.57 1.90 0.00 0.92 12.94 9.60
BM45_76_1 4.00 0.60 5.41 0.47 2.49 0.00 0.58 12.84 9.48
BM45_76_2 3.99 0.59 5.41 0.35 2.51 0.00 0.75 13.09 9.50
BM45_89_1 4.06 0.57 4.93 0.53 1.95 0.00 0.89 12.93 9.48
BM45_89_2 4.09 0.60 4.97 0.46 1.95 0.00 0.92 13.09 9.60
BDX 3.92 0.44 4.94 0.56 1.70 0.00 0.85 13.23 10.70
BDX_K_1 3.98 0.48 4.84 0.51 1.73 0.00 0.83 13.09 10.53
BDX_K_2 3.97 0.51 4.91 0.48 1.74 0.00 0.81 13.28 10.72
BDX_31.2_1 3.95 0.48 5.16 0.41 2.16 0.00 0.76 12.88 10.44
BDX_31.2_2 3.93 0.51 5.22 0.32 2.13 0.00 0.69 13.24 10.55
Progress report 19
Table 2.1 (cont.)
Sample Id pH Volatile
acid (g/L)
Total acid (g/L)
Malic acid (g/L)
Lactic acid (g/L)
Glucose (g/L)
Fructose (g/L)
Ethanol (% v/v)
Glycerol (g/L)
BDX_36.1_1 3.93 0.48 5.20 0.41 2.21 0.00 0.73 12.81 10.52
BDX_36.1_2 3.93 0.49 5.20 0.39 2.18 0.00 0.64 13.15 10.51
BDX_46_1 3.99 0.49 4.81 0.48 1.69 0.00 0.75 12.96 10.49
BDX_46_2 4.00 0.50 4.84 0.51 1.72 0.00 0.79 13.17 10.57
BDX_67.1_1 3.98 0.49 4.86 0.48 1.72 0.00 0.80 13.06 10.48
BDX_67.1_2 3.99 0.51 4.89 0.48 1.75 0.00 0.82 13.15 10.57
BDX_76_1 3.92 0.49 5.25 0.40 2.26 0.00 0.44 12.96 10.43
BDX_76_2 3.92 0.50 5.26 0.29 2.20 0.00 0.58 13.21 10.43
BDX_89_1 3.99 0.49 4.84 0.44 1.69 0.00 0.78 13.06 10.43
BDX_89_2 4.00 0.51 4.87 0.47 1.76 0.00 0.79 13.19 10.53
NT50 3.94 0.45 5.04 0.56 1.67 0.00 0.99 13.23 11.25
NT50_K_1 4.03 0.49 4.99 0.50 1.73 0.00 0.84 13.28 11.10
NT50_K_2 4.03 0.52 5.05 0.46 1.78 0.00 0.77 13.45 11.21
NT50_31.2_1 3.97 0.51 5.45 0.38 2.33 0.00 0.67 13.14 11.03
NT50_31.2_2 3.97 0.55 5.45 0.31 2.27 0.00 0.78 13.44 11.01
NT50_36.1_1 3.98 0.49 5.44 0.40 2.31 0.00 0.65 13.01 11.05
NT50_36.1_2 3.98 0.53 5.43 0.36 2.33 0.00 0.63 13.37 11.03
NT50_46_1 4.04 0.52 4.98 0.51 1.72 0.00 0.82 13.15 11.05
NT50_46_2 4.06 0.55 5.02 0.51 1.78 0.00 0.86 13.36 11.04
NT50_67.1_1 4.04 0.52 5.02 0.47 1.77 0.00 0.74 13.21 10.97
NT50_67.1_2 4.05 0.54 5.05 0.46 1.77 0.00 0.87 13.33 10.99
NT50_76_1 3.97 0.50 5.47 0.35 2.35 0.00 0.58 13.19 10.96
NT50_76_2 3.95 0.53 5.50 0.32 2.37 0.00 0.59 13.43 10.94
NT50_89_1 4.03 0.50 5.00 0.46 1.72 0.00 0.87 13.24 10.95
NT50_89_2 4.06 0.53 5.04 0.51 1.76 0.00 0.74 13.34 11.07
NT112 3.92 0.49 4.95 0.57 1.64 0.00 0.98 13.58 10.49
NT112_K_1 4.00 0.53 4.89 0.51 1.66 0.00 1.05 13.60 10.37
NT112_K_2 3.97 0.54 4.93 0.47 1.63 0.00 1.00 13.75 10.52
NT112_31.2_1 4.02 0.53 4.93 0.53 1.74 0.00 0.99 13.37 10.46
NT112_31.2_2 3.91 0.56 5.44 0.31 2.41 0.00 0.83 13.75 10.32
NT112_36.1_1 3.98 0.54 5.20 0.49 2.14 0.00 0.86 13.36 10.40
NT112_36.1_2 3.92 0.55 5.45 0.35 2.41 0.00 0.80 13.68 10.26
NT112_46_1 4.01 0.57 4.87 0.44 1.68 0.00 1.12 13.45 10.32
NT112_46_2 4.00 0.56 4.91 0.50 1.70 0.00 1.03 13.67 10.35
NT112_67.1_1 4.01 0.56 4.92 0.47 1.72 0.00 1.01 13.56 10.31
NT112_67.1_2 4.00 0.56 4.94 0.59 1.73 0.00 0.99 13.64 10.35
NT112_76_1 4.01 0.55 4.93 0.50 1.77 0.00 0.99 13.44 10.36
NT112_76_2 3.97 0.57 5.04 0.40 1.83 0.00 0.92 13.72 10.34
NT112_89_1 4.00 0.55 4.91 0.49 1.67 0.00 1.12 13.50 10.32
NT112_89_2 4.00 0.56 4.92 0.51 1.70 0.00 1.04 13.65 10.29
NT116rooi 4.05 0.50 4.72 0.64 1.58 0.00 0.88 12.98 9.99
NT116r_K_1 4.06 0.56 4.83 0.48 1.71 0.00 0.89 13.24 10.04
NT116r_K_2 4.06 0.59 4.91 0.46 1.83 0.00 0.87 13.28 10.13
NT116r_31.2_1 4.00 0.53 5.25 0.40 2.32 0.00 0.82 13.05 10.00
NT116r_31.2_2 4.00 0.56 5.25 0.25 2.23 0.00 0.78 13.37 10.00
NT116r_36.1_1 4.01 0.54 5.24 0.40 2.32 0.00 0.83 12.95 9.98
NT116r_36.1_2 4.00 0.57 5.24 0.33 2.30 0.00 0.79 13.32 9.98
NT116r_46_1 4.07 0.57 4.78 0.49 1.68 0.00 0.93 13.16 9.93
NT116r_46_2 4.07 0.61 4.88 0.50 1.73 0.00 1.02 13.32 10.12

Progress report 20
Table 2.1 (cont.)
Sample Id pH Volatile
acid (g/L)
Total acid (g/L)
Malic acid (g/L)
Lactic acid (g/L)
Glucose (g/L)
Fructose (g/L)
Ethanol (% v/v)
Glycerol (g/L)
NT116r_67.1_1 4.07 0.55 4.83 0.49 1.77 0.00 0.86 13.13 9.93
NT116r_67.1_2 4.07 0.61 4.90 0.45 1.77 0.00 0.92 13.27 10.03
NT116r_76_1 3.99 0.53 5.29 0.34 2.40 0.00 0.71 13.09 9.90
NT116r_76_2 3.98 0.55 5.31 0.26 2.37 0.00 0.74 13.31 10.02
NT116r_89_1 4.07 0.56 4.81 0.43 1.75 0.00 0.91 13.16 9.98
NT116r_89_2 4.08 0.60 4.89 0.47 1.78 0.00 0.92 13.32 10.08
NT202 4.13 0.51 4.54 0.54 1.57 0.00 1.05 13.42 10.95
NT202_K_1 4.18 0.53 4.47 0.45 1.55 0.00 1.01 13.42 10.90
NT202_K_2 4.16 0.60 4.59 0.30 1.64 0.00 0.91 13.60 11.00
NT202_31.2_1 4.13 0.52 4.90 0.32 2.15 0.00 0.76 13.30 10.74
NT202_31.2_2 4.12 0.57 4.91 0.20 2.13 0.00 0.79 13.65 10.80
NT202_36.1_1 4.12 0.54 4.89 0.29 2.18 0.00 0.78 13.24 10.78
NT202_36.1_2 4.13 0.58 4.89 0.27 2.17 0.00 0.75 13.59 10.79
NT202_46_1 4.19 0.56 4.43 0.39 1.48 0.00 0.98 13.40 10.83
NT202_46_2 4.21 0.59 4.51 0.38 1.62 0.00 0.94 13.61 10.89
NT202_67.1_1 4.18 0.55 4.47 0.39 1.59 0.00 0.84 13.45 10.82
NT202_67.1_2 4.19 0.62 4.59 0.38 1.66 0.00 0.86 13.52 10.87
NT202_76_1 4.12 0.54 4.95 0.25 2.21 0.00 0.69 13.29 10.68
NT202_76_2 4.11 0.56 4.96 0.22 2.25 0.00 0.68 13.61 10.75
NT202_89_1 4.20 0.55 4.45 0.37 1.58 0.00 0.96 13.48 10.80
NT202_89_2 4.20 0.59 4.51 0.34 1.64 0.00 0.96 13.59 10.84
VIN13 4.12 0.46 4.76 0.75 1.76 0.00 0.96 13.66 10.01
VIN13_K_1 4.16 0.47 4.63 0.66 1.76 0.00 0.99 13.55 9.82
VIN13_K_2 4.15 0.50 4.67 0.57 1.77 0.00 0.93 13.67 9.88
VIN13_31.2_1 4.10 0.48 5.11 0.50 2.39 0.00 0.80 13.26 9.70
VIN13_31.2_2 4.09 0.53 5.12 0.35 2.37 0.00 0.78 13.71 9.75
VIN13_36.1_1 4.10 0.48 5.11 0.50 2.43 0.00 0.65 13.23 9.76
VIN13_36.1_2 4.11 0.51 5.10 0.46 2.42 0.00 0.76 13.62 9.57
VIN13_46_1 4.18 0.51 4.61 0.65 1.75 0.00 0.86 13.44 9.71
VIN13_46_2 4.18 0.52 4.68 0.59 1.79 0.00 0.90 13.59 9.74
VIN13_67.1_1 4.18 0.51 4.64 0.57 1.81 0.00 0.80 13.53 9.62
VIN13_67.1_2 4.18 0.52 4.66 0.57 1.81 0.00 0.87 13.60 9.71
VIN13_76_1 4.09 0.49 5.15 0.49 2.48 0.00 0.58 13.39 9.59
VIN13_76_2 4.08 0.50 5.18 0.48 2.51 0.00 0.64 13.66 9.62
VIN13_89_1 4.17 0.50 4.62 0.63 1.83 0.00 0.94 13.50 9.73
VIN13_89_2 4.18 0.54 4.69 0.63 1.85 0.00 0.85 13.60 9.70
W2 4.18 0.48 4.77 0.67 1.65 0.00 0.89 13.32 10.87
W2_K_1 4.23 0.50 4.74 0.59 1.79 0.00 0.83 13.38 10.89
W2_K_2 4.23 0.56 4.84 0.51 1.85 0.00 0.79 13.55 11.03
W2_31.2_1 4.17 0.51 5.22 0.49 2.44 0.00 0.66 13.23 10.84
W2_31.2_2 4.17 0.55 5.25 0.42 2.33 0.00 0.57 13.58 10.83
W2_36.1_1 4.17 0.52 5.22 0.43 2.39 0.00 0.75 13.22 10.82
W2_36.1_2 4.18 0.54 5.23 0.41 2.37 0.00 0.55 13.54 10.77
W2_46_1 4.24 0.54 4.71 0.56 1.77 0.00 0.78 13.29 10.78
W2_46_2 4.24 0.58 4.83 0.57 1.81 0.00 0.87 13.51 10.89
W2_67.1_1 4.24 0.55 4.75 0.51 1.83 0.00 0.87 13.36 10.73
W2_67.1_2 4.25 0.58 4.84 0.53 1.84 0.00 0.85 13.48 10.81
W2_76_1 4.15 0.52 5.27 0.37 2.49 0.00 0.40 13.26 10.73
W2_76_2 4.15 0.55 5.29 0.39 2.51 0.00 0.53 13.54 10.78
W2_89_1 4.24 0.52 4.73 0.56 1.81 0.00 0.83 13.34 10.78

Progress report 21
Table 2.1 (cont.)
Sample Id pH Volatile
acid (g/L)
Total acid (g/L)
Malic acid (g/L)
Lactic acid (g/L)
Glucose (g/L)
Fructose (g/L)
Ethanol (% v/v)
Glycerol (g/L)
W2_89_2 4.25 0.56 4.81 0.54 1.85 0.00 0.87 13.52 10.83
WE14 3.98 0.41 4.45 0.54 1.79 0.00 0.81 13.39 9.63
WE14_K_1 4.07 0.44 4.41 0.44 1.87 0.00 0.76 13.40 9.50
WE14_K_2 4.07 0.49 4.45 0.37 1.88 0.00 0.81 13.62 9.62
WE14_31.2_1 4.08 0.46 4.47 0.48 1.96 0.00 0.85 13.24 9.58
WE14_31.2_2 4.01 0.51 4.86 0.33 2.38 0.00 0.62 13.61 9.51
WE14_36.1_1 4.02 0.46 4.84 0.38 2.43 0.00 0.70 13.09 9.55
WE14_36.1_2 4.02 0.51 4.87 0.27 2.36 0.00 0.46 13.59 9.48
WE14_46_1 4.08 0.49 4.39 0.42 1.78 0.00 0.81 13.37 9.50
WE14_46_2 4.09 0.51 4.46 0.40 1.89 0.00 0.83 13.53 9.53
WE14_67.1_1 4.09 0.48 4.42 0.44 1.83 0.00 0.84 13.41 9.38
WE14_67.1_2 4.10 0.50 4.45 0.42 1.86 0.00 0.83 13.52 9.47
WE14_76_1 4.02 0.48 4.88 0.32 2.49 0.00 0.51 13.36 9.35
WE14_76_2 4.01 0.50 4.90 0.29 2.50 0.00 0.53 13.59 9.41
WE14_89_1 4.08 0.47 4.42 0.40 1.89 0.00 0.79 13.45 9.44
WE14_89_2 4.09 0.51 4.47 0.41 1.88 0.00 0.80 13.55 9.51
WE372 3.83 0.52 5.37 0.48 1.79 0.00 0.88 13.45 11.68
WE372_K_1 3.91 0.54 5.32 0.53 1.85 0.00 0.85 13.32 11.54
WE372_K_2 3.90 0.58 5.36 0.46 1.86 0.00 0.79 13.52 11.58
WE372_31.2_1 3.93 0.57 5.35 0.48 1.93 0.00 0.84 13.16 11.50
WE372_31.2_2 3.86 0.61 5.78 0.38 2.38 0.00 0.77 13.54 11.43
WE372_36.1_1 3.88 0.55 5.66 0.43 2.29 0.00 0.74 13.01 11.48
WE372_36.1_2 3.85 0.62 5.81 0.34 2.38 0.00 0.66 13.46 11.37
WE372_46_1 3.92 0.58 5.28 0.47 1.78 0.00 0.81 13.17 11.46
WE372_46_2 3.94 0.61 5.37 0.44 1.85 0.00 0.93 13.42 11.50
WE372_67.1_1 3.93 0.57 5.31 0.46 1.86 0.00 0.79 13.35 11.36
WE372_67.1_2 3.93 0.59 5.34 0.49 1.91 0.00 0.89 13.44 11.42
WE372_76_1 3.85 0.56 5.82 0.34 2.50 0.00 0.60 13.21 11.34
WE372_76_2 3.84 0.58 5.85 0.31 2.45 0.00 0.48 13.48 11.45
WE372_89_1 3.93 0.56 5.31 0.46 1.81 0.00 0.80 13.24 11.39
WE372_89_2 3.93 0.63 5.40 0.42 1.86 0.00 0.75 13.41 11.53
WBN39/NT239 4.05 0.51 4.61 0.54 1.72 0.00 0.89 13.56 10.54
WBN39/NT239_K_1 4.14 0.56 4.57 0.52 1.74 0.00 0.90 13.48 10.43
WBN39/NT239_K_2 4.14 0.60 4.63 0.45 1.77 0.00 0.83 13.68 10.59
WBN39/NT239_31.2_1 4.09 0.56 4.95 0.46 2.18 0.00 0.69 13.42 10.48
WBN39/NT239_31.2_2 4.09 0.61 4.96 0.42 2.19 0.00 0.73 13.73 10.40
WBN39/NT239_36.1_1 4.10 0.57 4.95 0.46 2.25 0.00 0.71 13.19 10.42
WBN39/NT239_36.1_2 4.09 0.61 4.96 0.38 2.21 0.00 0.75 13.64 10.40
WBN39/NT239_46_1 4.15 0.59 4.53 0.47 1.69 0.00 0.87 13.34 10.37
WBN39/NT239_46_2 4.16 0.62 4.61 0.44 1.74 0.00 0.98 13.60 10.49
WBN39/NT239_67.1_1 4.15 0.59 4.57 0.47 1.75 0.00 0.79 13.46 10.33
WBN39/NT239_67.1_2 4.15 0.61 4.63 0.43 1.76 0.00 0.88 13.61 10.41
WBN39/NT239_76_1 4.08 0.57 5.03 0.39 2.35 0.00 0.50 13.37 10.29
WBN39/NT239_76_2 4.08 0.61 5.04 0.22 2.24 0.00 0.78 13.60 10.41
WBN39/NT239_89_1 4.15 0.57 4.56 0.54 1.74 0.00 0.72 13.46 10.40
WBN39/NT239_89_2 4.16 0.62 4.62 0.48 1.74 0.00 0.92 13.59 10.40
Progress report 22
TASK 3: Development of the analytical tools to measure bitterness (M Rossouw/P Minnaar)
Milestone 1: Formation of acrolein-phenol complexes in wine and red wine This section is completed.
The 2001-2002 report described preliminary experiments conducted in white wine. Acrolein was added to white wine that contained supplements of various phenols, including catechin, epicatechin, gallic acid, caffeic acid, and p-coumaric acid. These experiments showed that of the tested phenols only catechin and epicatechin seemed to form complexes with acrolein in white wine.
In follow-up experiments during the 2002-2003 season, epicatechin and catechin were therefore reacted with acrolein in a model wine solution consisting of 10 % ethanol set to pH 3 using 0.1 M phosphate-citrate buffer. In addition, the main anthocyanin found in red wine, namely malvidin-3-o-glucoside, was also reacted with acrolein in a similar model wine solution. Catechin at 200 mg/L, epicatechin at 200 mg/L and malvidin-3-o-glucoside at 100 mg/L were reacted with acrolein at 100 mg/L. Solutions of the three phenols at the specified concentrations without acrolein addition in a similar model wine solution served as controls.
The reaction mixtures and controls were incubated at 15 °C for 1 month. Figure 3.1 (Appendix A) shows potentially bitter complexes formed in the catechin-acrolein reaction. Figure 3.2 (Appendix A) shows potentially bitter complexes formed during the epicatechin-acrolein reaction.
Figure 3.3 (Appendix A) shows potentially bitter complexes formed during the reaction of malvidin-3-o-glucoside with acrolein. The fact that these reactions were not conducted in wine but in a watery solution should facilitate their isolation in pure form and in turn also their identification by GC-MS and LC-MS. An initial attempt to identify these compounds by GC-MS did not succeed due to background interference from the phosphate buffer, which forms part of the model wine solution. Liquid-liquid extraction of these complexes by ethyl acetate followed by GC-MS analysis did not succeed either due to the fact that these compounds extract very poorly with ethyl acetate or polymerise during extraction. An alternative approach to make GC-MS analysis of these compounds possible would be to use solid-phase extraction or conduct the initial reaction in ammonium-acetate buffer rather than phosphate buffer. The buffer salts need to be volatile, such as ammonium-acetate, in order to limit interferences during GC-MS analysis. These approaches will be investigated in future.
These reactions were repeated in red wine as well to determine whether the above-mentioned potentially bitter complexes could be detected by HPLC analysis of polyphenols in red wine. Red wine containing 100 mg/L acrolein, the same red wine containing both 200 mg/L catechin and 100 mg/L acrolein and the same red wine containing both 200 mg/L epicatechin and 100 mg/L acrolein were incubated at 15 °C for 1 month. The same three solutions without acrolein addition were also incubated as controls. Figure 3.4 (Appendix A) shows the effect of 100 mg/L acrolein additions to red wine. Figure 3.5 (Appendix A) shows the effect of 100 mg/L acrolein and 200 mg/L catechin addition to red wine. Figure 3.6 (Appendix A) shows the effect of 100 mg/L acrolein and 200 mg/L epicatechin addition to red wine. It is clear from these data that changes take place in the phenol composition of red wine in reaction to acrolein addition. Peaks for the complexes formed from the reaction of catechin and epicatechin with acrolein in red wine, overlap to a large extend with other phenol peaks in red wine. Therefore, screening for these compounds as a measure of acrolein exposure of red wine might be difficult.
The most clearly discernable change observed in red wine exposed to acrolein are the appearance of an unidentified anthocyanin peak at a retention time of 39.07 min. Figure 3.7 (Appendix A) shows the absorption spectrum of this unidentified anthocyanin.
This compound has the same absorption spectrum and retention time as the complex formed when acrolein and malvidin-3-o-glucoside react and is most probably the same component. Although this compound peak is not completely resolved from that of vitisin A under the present HPLC conditions, its resolution is sufficient for it to be used as a marker of acrolein exposure of red wine. However a small peak also elutes at the retention time of this compound in red wine. Although this complicating factor exists, an attempt was made to use this compound and those
Progress report 23
formed from reaction of catechin with acrolein as markers of acrolein exposure in bitter and non-bitter wines as described under 3.2. Whether these acrolein-phenol compounds themselves are bitter will, however, have to be determined sensorially.
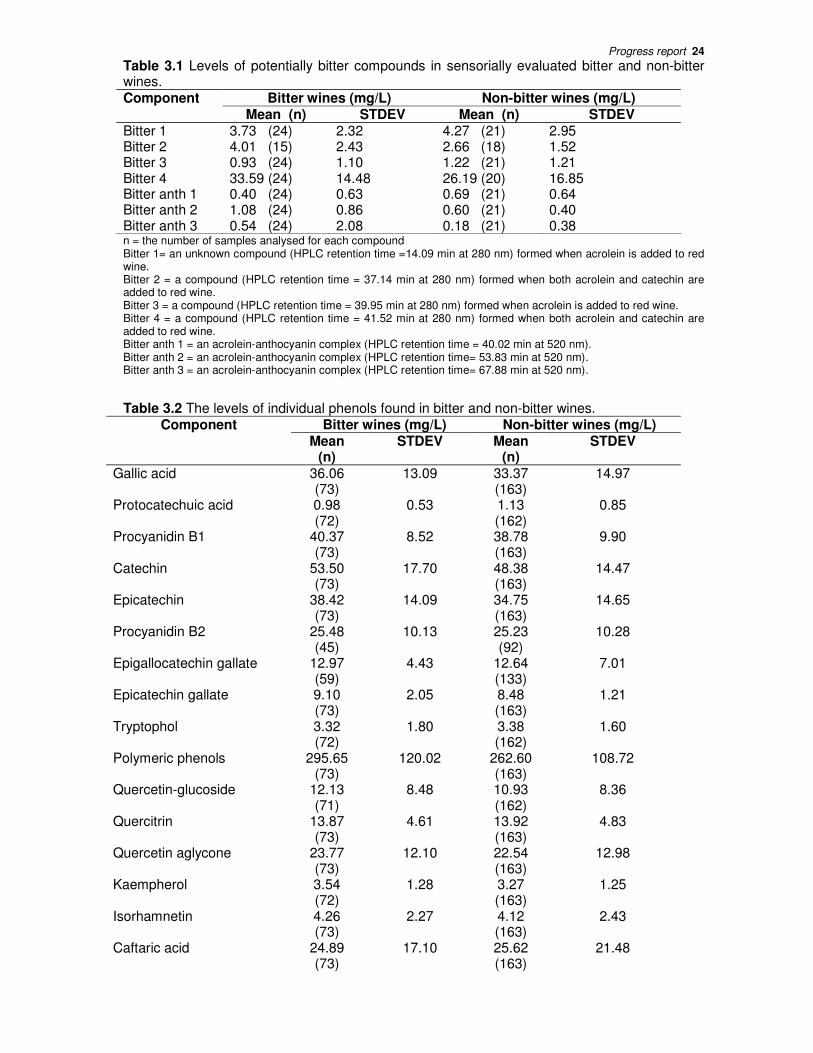
Milestone 2: Analysis of the phenolic composition of bitter and non-bitter wines by liquid chromatography
This section is completed.
Wines were sampled from the 2002 Young wine and Veritas wine shows. These wines were sensorially evaluated for bitterness by a panel of five tasters. The retention times and absorption spectra of complexes formed by reaction of acrolein with catechin or malvidin-3-o-glucoside in model wine solution and red wine were used to screen for their presence in bitter and non-bitter wines by HPLC. Due to substantial overlap of acrolein-phenol complexes formed from epicatechin with endogenous wine peaks, these complexes were not analysed. The analysis revealed that both some of the bitter and some of the non-bitter wines contain compounds that elute in the vicinity of the malvidin-glucoside-acrolein or catechin-acrolein complexes and that in some of the analysed bitter wines no compounds eluted at such retention times. Preliminary statistical analysis to find a possible association between bitterness and peak areas of peaks that elute at the retention time of acrolein-anthocyanin or acrolein-phenol complexes showed no such association (Table 3.1). No final conclusions can be made from this result at this stage, due to the fact that the identity of peaks that elute at the retention time of acrolein-malvidin-glucoside complexes when wine samples are analysed by HPLC have not been ascertained.
Other interfering peaks may influence HPLC analysis of anthocyanin-acrolein complexes in wine substantially. The analysis of bitter and non-bitter wine samples by liquid chromatography coupled to mass spectrometry would make the analysis much more specific and therefore able to lead to meaningful conclusions.
Mass spectrometry as detection technique would be more suitable in this case, since a number of compounds that overlap in an HPLC run, can be quantified separately based on their molecular mass. Due to the fact that mass spectrometry is far superior in sensitivity compared to ultra-violet detection, it would be more suitable for the future analysis of these complexes, which may be found only at very low concentrations in affected wine. The isolation of these potentially bitter phenol-acrolein complexes and their identification by mass-spectrometry is therefore of the utmost importance.
Statistical analysis of the concentrations of all known, analysed polyphenols normally found in wine was also done to determine if any association can be found between these concentrations and the presence or absence of bitterness in sensorially evaluated wines. Table 2 shows the results of this analysis. None of the levels of analysed polyphenols clearly differed between bitter and non-bitter wines.
Progress report 24
Table 3.1 Levels of potentially bitter compounds in sensorially evaluated bitter and non-bitter wines. Component Bitter wines (mg/L) Non-bitter wines (mg/L) Mean (n) STDEV Mean (n) STDEV Bitter 1 3.73 (24) 2.32 4.27 (21) 2.95 Bitter 2 4.01 (15) 2.43 2.66 (18) 1.52 Bitter 3 0.93 (24) 1.10 1.22 (21) 1.21 Bitter 4 33.59 (24) 14.48 26.19 (20) 16.85 Bitter anth 1 0.40 (24) 0.63 0.69 (21) 0.64 Bitter anth 2 1.08 (24) 0.86 0.60 (21) 0.40 Bitter anth 3 0.54 (24) 2.08 0.18 (21) 0.38 n = the number of samples analysed for each compound Bitter 1= an unknown compound (HPLC retention time =14.09 min at 280 nm) formed when acrolein is added to red wine. Bitter 2 = a compound (HPLC retention time = 37.14 min at 280 nm) formed when both acrolein and catechin are added to red wine. Bitter 3 = a compound (HPLC retention time = 39.95 min at 280 nm) formed when acrolein is added to red wine. Bitter 4 = a compound (HPLC retention time = 41.52 min at 280 nm) formed when both acrolein and catechin are added to red wine. Bitter anth 1 = an acrolein-anthocyanin complex (HPLC retention time = 40.02 min at 520 nm). Bitter anth 2 = an acrolein-anthocyanin complex (HPLC retention time= 53.83 min at 520 nm). Bitter anth 3 = an acrolein-anthocyanin complex (HPLC retention time= 67.88 min at 520 nm).
Table 3.2 The levels of individual phenols found in bitter and non-bitter wines. Component Bitter wines (mg/L) Non-bitter wines (mg/L)
Mean (n)
STDEV Mean (n)
STDEV
Gallic acid 36.06 (73)
13.09 33.37 (163)
14.97
Protocatechuic acid 0.98 (72)
0.53 1.13 (162)
0.85
Procyanidin B1 40.37 (73)
8.52 38.78 (163)
9.90
Catechin 53.50 (73)
17.70 48.38 (163)
14.47
Epicatechin 38.42 (73)
14.09 34.75 (163)
14.65
Procyanidin B2 25.48 (45)
10.13 25.23 (92)
10.28
Epigallocatechin gallate 12.97 (59)
4.43 12.64 (133)
7.01
Epicatechin gallate 9.10 (73)
2.05 8.48 (163)
1.21
Tryptophol 3.32 (72)
1.80 3.38 (162)
1.60
Polymeric phenols 295.65 (73)
120.02 262.60 (163)
108.72
Quercetin-glucoside 12.13 (71)
8.48 10.93 (162)
8.36
Quercitrin 13.87 (73)
4.61 13.92 (163)
4.83
Quercetin aglycone 23.77 (73)
12.10 22.54 (163)
12.98
Kaempherol 3.54 (72)
1.28 3.27 (163)
1.25
Isorhamnetin 4.26 (73)
2.27 4.12 (163)
2.43
Caftaric acid 24.89 (73)
17.10 25.62 (163)
21.48

Progress report 25
Table 3.2 (cont.) Component Bitter wines (mg/L) Non-bitter wines (mg/L)
Mean (n)
STDEV Mean (n)
STDEV
Caffeic acid 25.11 (73)
17.56 21.69 (163)
18.29
Coutaric acid 12.23 (72)
7.42 11.56 (163)
7.75
p-Coumaric acid 9.83 (73)
5.41 9.07 (163)
5.68
Delph-glucoside* 10.83 (73)
6.98 10.33 (163)
6.98
Cyanidin-glucoside 1.51 (70)
0.80 1.41 (163)
0.62
Petunidin-glucoside 14.21 (73)
8.26 13.67 (163)
8.30
Peonidin-glucoside 7.96 (73)
5.25 7.52 (163)
4.72
Malvidin-glucoside 106.55 (73)
59.00 110.27 (163)
60.05
Delph-gluc-acetate* 3.91 (73)
2.61 3.56 (161)
2.37
Vitisin A 3.38 (73)
1.32 3.35 (163)
1.42
Pet-gluc-acetate* 5.56 (73)
2.68 5.25 (163)
2.61
Peo-gluc-acetate* 4.70 (73)
3.51 4.30 (163)
2.92
Malv-gluc-acetate* 35.03 (73)
24.35 35.84 (163)
23.85
Delph-gluc-p-coum* 2.08 (73)
1.21 2.09 (163)
1.13
Pet-gluc-p-coum * 3.63 (71)
2.29 3.63 (163)
2.18
Malv-gluc-p-coum* 15.31 (73)
10.60 16.10 (162)
11.07
Polymeric pigments 23.05 (73)
9.06 21.09 (163)
7.74
n = The amount of samples analysed for each individual compound. * Delph = delphinidin; gluc = glucoside; Pet = petunidin; Peo = peonidin; Malv = malvidin; coum = coumarate.
Milestone 3: Development of the technique described by Breckenridge et al. (1997) using a GC-MS-MS for detection of 3- hydroxypropionaldehyde and acrolein in bitter wines and experiments conducted with the yeasts and bacteria to determine their potential in causing bitterness.
This section is completed.
Since acrolein is an aldehyde, which is formed via 3-hydroxypropionaldehyde from glycerol by lactic acid bacteria, a method needed to be standardized for the quantification of these aldehydes in bitter and non-bitter wines. Aldehyde standards were extracted from model wine solutions, consisting of the aldehyde in a 10 % ethanol solution in water, using the method described by de Revel & Bertrand (1993). This method derivatizes aldehydes with pentafluorobenzylhydroxylamine (PFBHA) in order to form their respective benzyloximes followed by liquid-liquid extraction and their analysis using GC-MS. Appendix B contains the mass spectra of some of the analysed aldehyde standards including acrolein, propionaldehyde, and the internal standard, cyclopentanone. It is clear from this data that the spectra of all

Progress report 26
aldehydes derivatised with PFBHA contain the characteristic 181 ion. In addition the spectra of all unsaturated aldehydes, such as acrolein, contain the characteristic 250 ion.
Appendix C shows the GC-MS chromatogram of a wine sample prepared according to this method. Both the 181 ion and 250 ion traces are shown. Optimisation of wine derivatization by PFBHA will be continued in order to determine the correct amount of PFBHA necessary to derivatize all aldehydes in a wine sample.
This is essential due to the fact that wine samples contain high concentrations of acetaldehyde relative to that of other aldehydes which could lead to only partial derivatization of these other aldehydes.
Development of the technique described by Breckenridge et al. (1997) using a GC-MS-MS for detection of 3-hydroxypropionaldehyde and acrolein in bitter wines has not been addressed due to lack of manpower and availability of the GC-MS.
Milestone 4: The HPLC determination of the effect of the addition of caffeic acid to red wines with a high malvidien-3-glucoside content, as well as the effect which temperature treatment has on the phenolic composition of these wines.
The HPLC determination of the effect of the addition of caffeic acid to different red wines with a high malvidien-3-glucoside content, as well as the effect temperature treatment has on the phenol composition of these wines, has not being evaluated due to the malfunctioning of the HPLC between November 2004 and May 2005. The HPLC has been repaired and analysis can continue.
Milestone 5: An attempt to identify bitter wines by means of a sensory evaluating panel
This section is completed. A total of one hundred and fifty young red wines (50 Pinotage, 50 Shiraz and 50 Cabernet Sauvignon) representative of the South African wine industry, were sensorially evaluated by ten tasters for bitterness. The tasters were not specifically trained to evaluate bitterness. These wines were collected during 2003 from the Young Wine Show. Sensory evaluation occurred on a daily basis, where the tasters evaluated a maximum of ten wines per day. The tasting panel consisted of an average of five tasters for the entire duration of the evaluation, which took place over 30 days. All 150 wines were also subjected to chemical analysis (Classic oenological parameters, as well as phenolic composition). It was found that Pinotage had slightly higher percentage of bitter wines (58.7%) than Cabernet Sauvignon (50%) and Shiraz (45%) (Fig.3.1). Due to lack of time and personnel capacity, further progress in this respect of the project could not be made.
Bitter wines
0
10
20
30
40
50
60
70
Pinotage Cabernet Sauvignon Shiraz
Grape cultivars
Pe
rce
nta
ge
(%
)
Fig. 3.1 Percentage bitter wines of grape cultivars

Progress report 27
Discussion Astringency and bitterness are elicited by polyphenolic compounds such as flavonoids and terpenes in wine and these attributes have been reviewed extensively by Singleton & Noble, (19760; Noble (1990; 1998); Nobel et al, (2002). Other compounds contributing to bitterness in foods are amino acids and peptides, esters and lactones, caffeine, sulfimides and organic and inorganic salts (Drewnowski, 2001). The key inducers of astringency and bitter taste in red wines are still unclear on a molecular level despite sensorial knowledge of the bitterness of wines (Hufnagel, et al., 2008). The sensorial data available on bitter taste compounds in wines are rather inconsistent (Nobel, 2002). Although numerous attempts have been made to correlate analytical data of distinct wine components with sensory data obtained from a panel of tasters, the results on the chemical compounds imparting the bitter taste of red wines are somewhat contradictory (Haslam, et al., 1988; Luck, et al., 1994; de Freitas, et al., 2001; Gawel, et al., 2001). Ethanol was reported to enhance the bitter intensity perceived in red wines (Noble, 1994, 1998). In addition, terpene glycosides were reported to contribute to the bitter taste of Muscat wines (Noble, 1998). Studies aimed to correlate chemical and sensorial data of red wines were unsuccessful in generating a predictive model for bitterness in wines (Boselli, et al., 2004). Numerous investigations suggest that procyanidins are bitter stimuli in wines (Noble, 1998, 2002). The literature suggests that the elucidation to isolate the chemical compounds responsible for the bitter taste in red wines has been extensively studied but with limited success. It is recommended that a multi-disciplinary study be initiated to quantify the sensory active non-volatile compounds in wine. The results emerging from a study such as this, should clarify the uncertainty between the sensory perception of red wine and the chemical compounds corresponding with taste stimuli.
References Boselli, E., Boulton, R. B., Thorngate, J. H. & Frega, N. G., 2004. Chemical and sensory characterisation of red wines from Marche (Italy) related to vintage and grape cultivars. J Agric. Food Chem. 52, 3843 – 3854. De Freitas, V. & Mateus, N., 2001. Structural features of procyanidin interactions with salivary proteins. J. Agric. Food Chem. 49, 940 – 945. De Revel, G. & Bertrand, A., 1993. A method for the detection of carbonyl compounds in wine: Glyoxal and methylglyoxal. J. Sci. Food Agric. 61, 267-272.
Drewnowski, A., 2001. Lead Review Article. The Science and Complexity of Bitter Taste. Nutrion Reviews, 59 (6), 163 – 169. Gawel, R., Iland, G. G. & Francis, I. L., 2001. Characterising the astringency of red wine: a case study. Food Qual. Pref. 12, 83 – 94. Haslam, E. & Lilley, T. H., 1988. Natural astringency in foodstuffs-a molecular interpretation. Crit. Rev. Food Sci. Nutr. 27, 1- 41. Hufnagel, J. C. & Hofmann, T., 2008. Orosensory-Directed Identification of Astringent Mouthfeel and Bitter-Tasting Compounds in Red Wine. J. Agric. Food Chem., 56, 1376 – 1386. Luck, G., Hua, L., Murray, N. J., Grimmer, H. R., Warminski, E. E., Williamson, M. P., Lilley, T. H. & Haslam, E., 1994. Polyphenols, astringency and praline-rich proteins. Phytochemistry. 37, 357 – 371. Noble, A. C., 1990. Bitterness and Astringency in Wine. In: Bitterness in Foods and Beverages; Rousseff, R. L., ed. Elsvier Sciences: New York, 145 – 158.
Progress report 28
Noble, A. C., 1994. Bitterness in wine. Physiol. Behav. 56, 1251 – 1255. Noble, A. C., 1998. Why do wines taste bitter and feel astringent? In: Chemistry of Wine Flavor, Waterhouse, H. L., Ebeler, S. E., Eds. ACS Symposium Series 714; Am. Cem. Soc: Washington, DC, 1998, 156 – 165. Nobel, A. C., 2002. Astringency and Bitterness of flavonoid phenols. In: Chemistry of Taste; Given, P., Paredes, D., Eds. ACS Symposium Series 825; Am. Chem. Soc.; Washington, DC, 193 – 201. Sauvageot, N., Gouffi. K., Laplace, J-M. and Auffray, Y., 2000. Glycerol metabolism in Lactobacillus collinoides: production of 3-hydroxypropionaldehyde, a precursor of acrolein. Int. J. Food Microbiol. 55, 167 - 170. Singleton, V. L. & Noble, A. C., 1976. Wine Flavour and Phenolic substances. In: Phenolic, Sulphur and Nitrogen Compounds in Food Flavours: Charalambous, G., Katz, A., Eds.: ACS Symposium Series 26; Am. Chem. Soc.: Washington, DC, 47 – 70. Waterhouse, A. L., Price, S. F. & McCord, J. D., 1999. Revered-phase high-performance liquid chromatography methods of analysis of wine polyphenols. Meth. Enzym. 299, 113 – 121.
4. Accumulated outputs Indicate the year actioned.
Technology developed
• Analytical tools will be developed that can be used on routine basis to assess fermentations for the development of bitterness.
• Understanding the influence of yeast or bacteria in the development of bitterness in wine. Human resources developed/trained
Postgraduate students at Stellenbosch University will be involved in the research programme, and will progress towards higher degrees, as well as being trained for the South African scientific workforce. Undergraduate students will be exposed to practical work related to the project, which will demonstrate to them the concepts behind research, which have real industrial applications. Patents
None Publications (popular, press releases, semi-scientific, scientific)
• One paper is envisaged in peer reviewed international scientific journals. Presentations/papers delivered
International:
1. Krieling, S.J., I.S. Pretorius & M. du Toit. 2003. Isolation, identification and characterisation of glycerol-degrading lactic acid bacteria from South African red wines. 1st FEMS Congress of European Microbiologists, Ljubljana, Slovenia.
2. Krieling, S.J., Pretorius, I.S. & Du Toit. M. 2004. Wine lactic acid bacteria and their glycerol degradation ability. 12th Australian Wine Industry Technical Conference, Melbourne.
National:
1. Krieling, S.J., M. du Toit, M.G. Lambrechts & I.S. Pretorius. 2002. An investigation into lactic acid bacteria as a possible cause of bitterness in wine. Twelfth Biennial Congress of the South African Society for Microbiology, Bloemfontein.

Progress report 29
2. Krieling, S.J., M. du Toit & I.S. Pretorius. 2002. An investigation into lactic acid bacteria as a possible cause of bitterness in wine. 26th Conference of the SA Society for Oenology and Viticulture, Somerset West.
3. Du Toit, M. 2003. Bitterness in red wine. Anchor Bio-Technologies 7th Technical Symposium, Spier Wine Estate, Stellenbosch.