final ppt - 128061 lh
TRANSCRIPT

Prevalence of Established Nutritional
and Behavioral Risk Factors of Breast
Cancer among Apparently Healthy
Women
R.Shobana
Department of Applied Nutrition
Faculty of Livestock, Fisheries and Nutrition
Wayamba University of Sri Lanka
Background
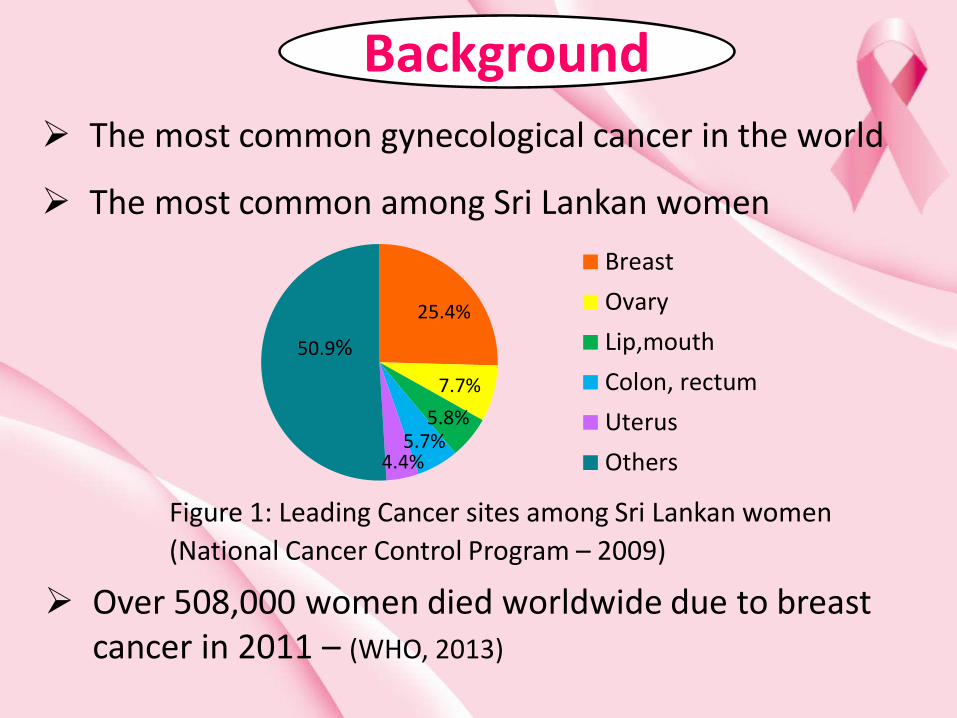
25.4%
7.7%
5.8%5.7%
4.4%
50.9%
Breast
Ovary
Lip,mouth
Colon, rectum
Uterus
Others
Figure 1: Leading Cancer sites among Sri Lankan women
(National Cancer Control Program – 2009)
The most common gynecological cancer in the world
The most common among Sri Lankan women
Over 508,000 women died worldwide due to breast cancer in 2011 – (WHO, 2013)

Identification of risk factors, their distribution among population and risk assessment in healthy women promote screening
Number of deaths due to breast cancer is increasing
majority of cases are diagnosed at late stage
Routine screening is important for early detection
reduce the burden of breast cancer
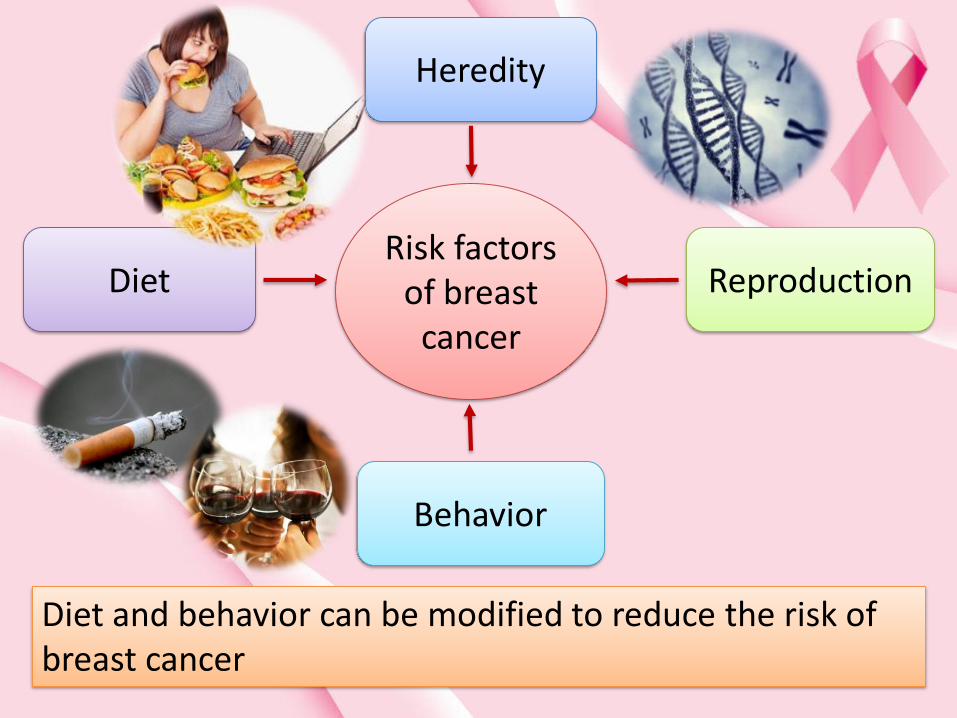
Risk factors of breast
cancer
Heredity
Reproduction
Behavior
Diet
Diet and behavior can be modified to reduce the risk of breast cancer
Objectives
To determine the prevalence of established risk factors
of breast cancer among apparently healthy women
To identify the difference in the presence of risk factors
between two geographical locations
To estimate the lifetime breast cancer risk of apparently
healthy women in two geographical locations
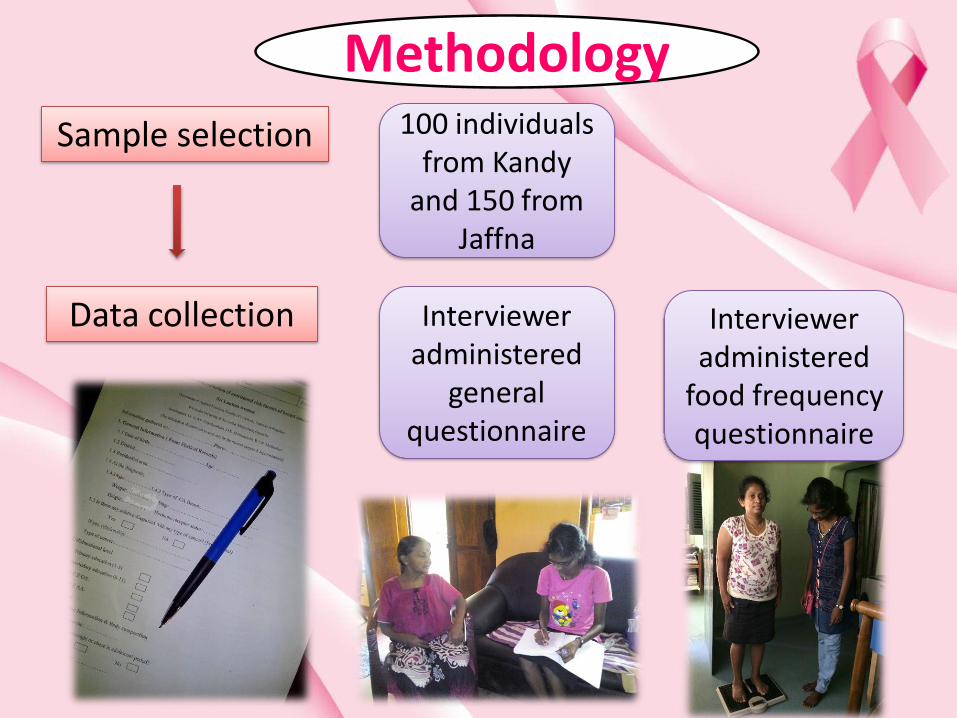
Methodology
Sample selection
Data collection
100 individuals from Kandy
and 150 from Jaffna
Interviewer administered
general questionnaire
Interviewer administered
food frequency questionnaire

Data analysis Physical Activity Level (PAL) –
General Practice Physical Activity Questionnaire
Statistical analysis Descriptive statistics Chi-square tests and independent t-
tests – identify the difference in the presence of risk factors in selected two geographical locations
Breast cancer risk assessment
– Gail breast cancer risk
assessment tool

ResultsTable 1: Reproductive and anthropometric characteristics of individuals in Kandy and Jaffna
*significantly different at 95% confident
Reproductive characteristics Kandy Jaffna p value
Mean SD Mean SD
Age at menarche 12.7 ±1.2 13.8 ±1.6 0.030*
Parity 2.27 ±0.9 2.82 ±1.3 0.000*
Cumulative time duration of breast feeding (months)
69.9 ±35.8 47.5 ±28.3 0.003*
Mean time duration of breast feeding (months)
31.3 ±13.0 17.6 ±8.1 0.000*
BMI (kgm-2) 24.9 ±3.7 24.0 ±4.8 0.040*

Table 2: Dietary and behavioral factors affecting breast cancer
*significantly different at 95% confident
Dietary risk factors Dietary protective factors Behavioral factors
Consumption of Processed meat Cheese Butter/margarine Coconut oil Carbonated beverage
High frequencyconsumption of Egg Milk
Consumption of Sesame oil
High Frequency consumption of Fish Soya meat Cruciferous vegetables
Night shift workingPassive smokingPhysical Activity Level
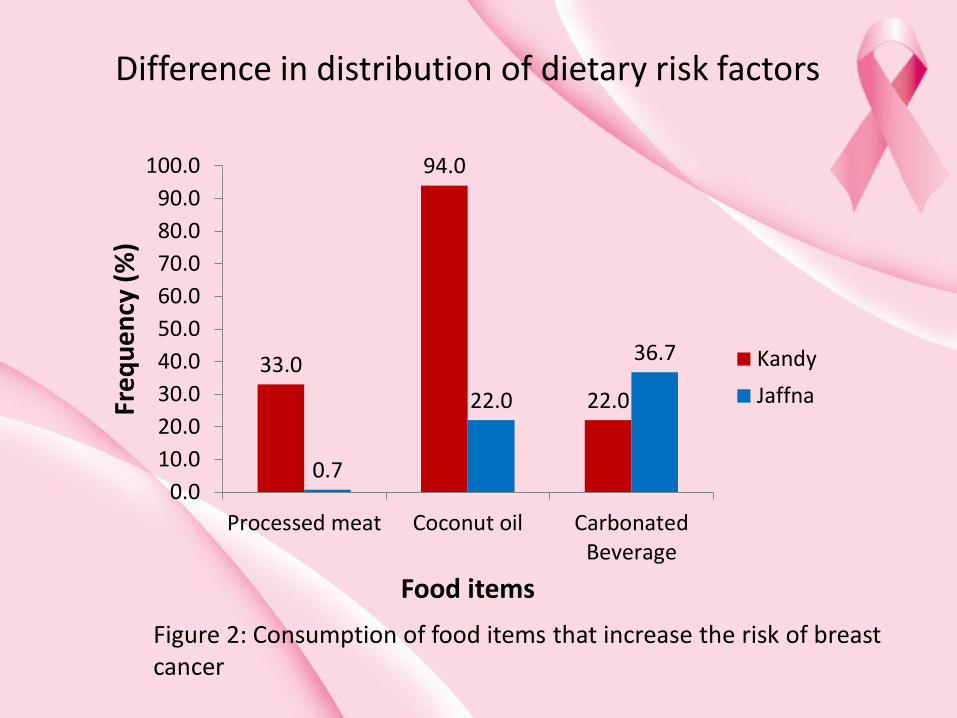
Difference in distribution of dietary risk factors
33.0
94.0
22.0
0.7
22.0
36.7
0.0
10.0
20.0
30.0
40.0
50.0
60.0
70.0
80.0
90.0
100.0
Processed meat Coconut oil CarbonatedBeverage
Freq
uen
cy (
%)
Food items
Kandy
Jaffna
Figure 2: Consumption of food items that increase the risk of breast cancer
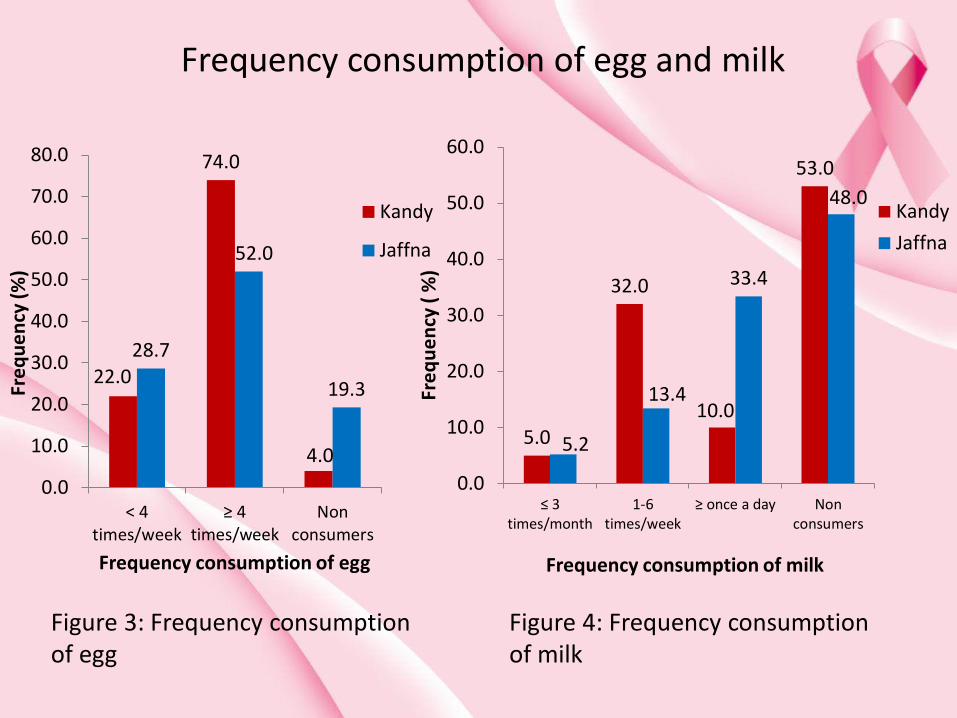
Frequency consumption of egg and milk
Figure 3: Frequency consumption of egg
22.0
74.0
4.0
28.7
52.0
19.3
0.0
10.0
20.0
30.0
40.0
50.0
60.0
70.0
80.0
< 4times/week
≥ 4 times/week
Nonconsumers
Fre
qu
en
cy (
%)
Frequency consumption of egg
Kandy
Jaffna
5.0
32.0
10.0
53.0
5.2
13.4
33.4
48.0
0.0
10.0
20.0
30.0
40.0
50.0
60.0
≤ 3 times/month
1-6times/week
≥ once a day Nonconsumers
Fre
qu
en
cy (
%)
Frequency consumption of milk
Kandy
Jaffna
Figure 4: Frequency consumption of milk

Frequency consumption of protective dietary factors
29.0
39.0 40.0 41.0 41.0
58.0
18.0
56.060.7
26.0
50.0
40.0
0.0
10.0
20.0
30.0
40.0
50.0
60.0
70.0
≤ 4 times/week
> 4times/week
< 4times/week
≥ 4 times/week
≤ 4 times/week
4times/week
Fre
qu
en
cy (
%)
Food consumption frequency
Kandy
Jaffna
>
Figure 5: Frequency consumption of food items that reduce the risk of breast cancer
Fish Cruciferous vegetablesSoya meat
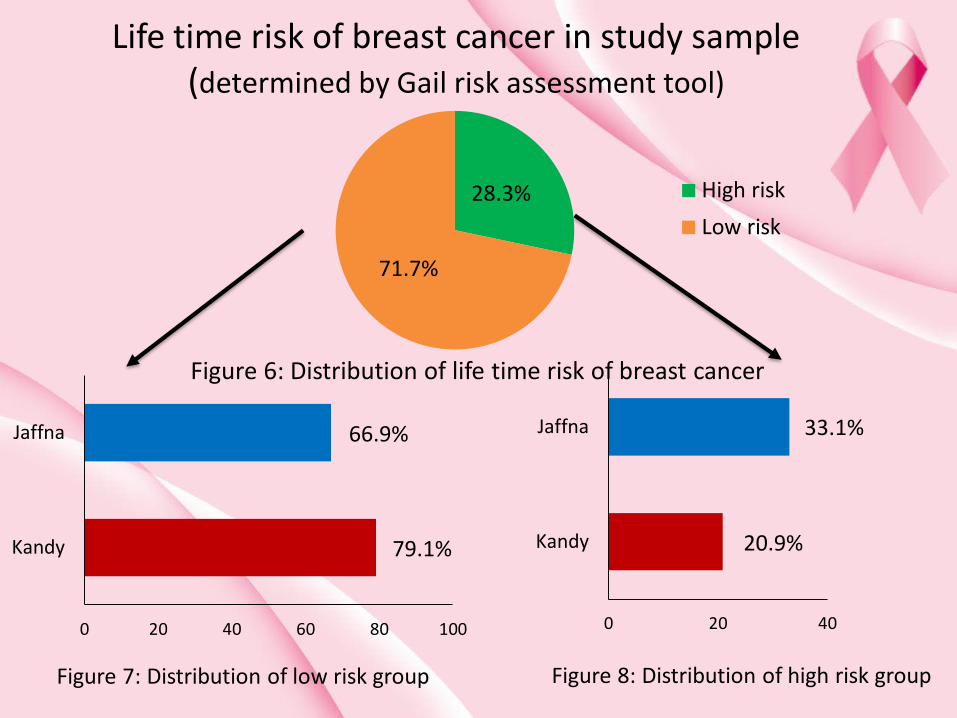
Life time risk of breast cancer in study sample (determined by Gail risk assessment tool)
28.3%
71.7%
High risk
Low risk
0 20 40 60 80 100
Kandy
Jaffna 66.9%
79.1%
0 20 40
Kandy
Jaffna 33.1%
20.9%
Figure 7: Distribution of low risk group
Figure 6: Distribution of life time risk of breast cancer
Figure 8: Distribution of high risk group
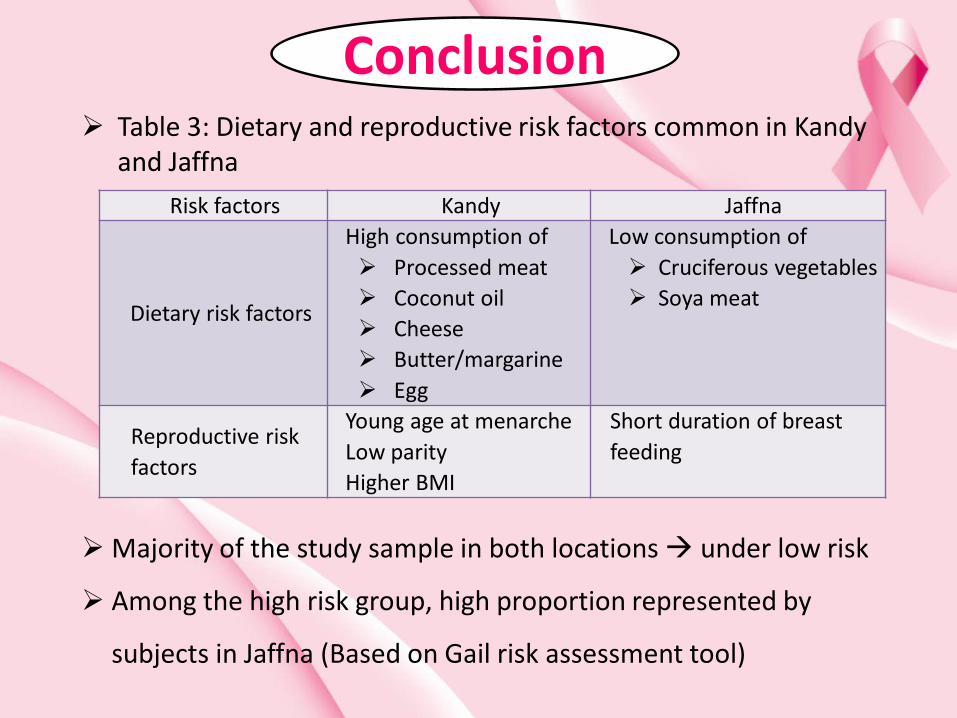
Conclusion
Risk factors Kandy Jaffna
Dietary risk factors
High consumption of
Processed meat
Coconut oil
Cheese
Butter/margarine
Egg
Low consumption of
Cruciferous vegetables
Soya meat
Reproductive risk
factors
Young age at menarche
Low parity
Higher BMI
Short duration of breast
feeding
Majority of the study sample in both locations under low risk
Among the high risk group, high proportion represented by
subjects in Jaffna (Based on Gail risk assessment tool)
Table 3: Dietary and reproductive risk factors common in Kandy and Jaffna

Acknowledgement
I would like to extend my sincere gratitude to
my principal supervisor and co-supervisor
all study participants in Kandy and Jaffna
all my colleagues
References
National Cancer Control Program. (2009) Cancer Incidence Data: Sri Lanka year 2001-2005. Cancer Registry, 7th publication. Colombo: National Cancer Control program.
World Health Organization (2013) Breast cancer: prevention and control [online] Available from: http://www.who.int/cancer/detection/breastcancer/en/index1.html [accessed on 02/04/2016].
Thiebaut, A. C. M., Kipnis, V., Chang, S.-C., Subar, A. F., Thompson, F. E., Rosenberg, P. S., … Schatzkin, A. (2007). Dietary fat and postmenopausal invasive breast cancer in the National Institutes of Health-AARP Diet and Health Study cohort. Journal of the National Cancer Institute, 99(6), 451–62. http://doi.org/10.1093/jnci/djk094 [accessed on 10/04/2016].
Friedenreich, C. M., Courneya, K. S., & Bryant, H. E. (2001). Influence of physical activity in different age and life periods on the risk of breast cancer. Epidemiology (Cambridge, Mass.), 12(6), 604–12. Retrieved from http://www.ncbi.nlm.nih.gov/pubmed/11679785[accessed on 11/04/2016].


CharacteristicsKandy (%) Jaffna (%)
p value
Educational level
Primary 2.0 4.7
Secondary 8.0 22.7
G.C.E O/L 40.0 36.0 0.01*
G.C.E A/L 40.0 32.0
Higher 10.0 4.7
Employment status
Yes 33.0 22.0
No 67.0 78.0 0.050
Table 3: Distribution of selected demographic characteristics in study sample
*significantly different at 95% confident interval
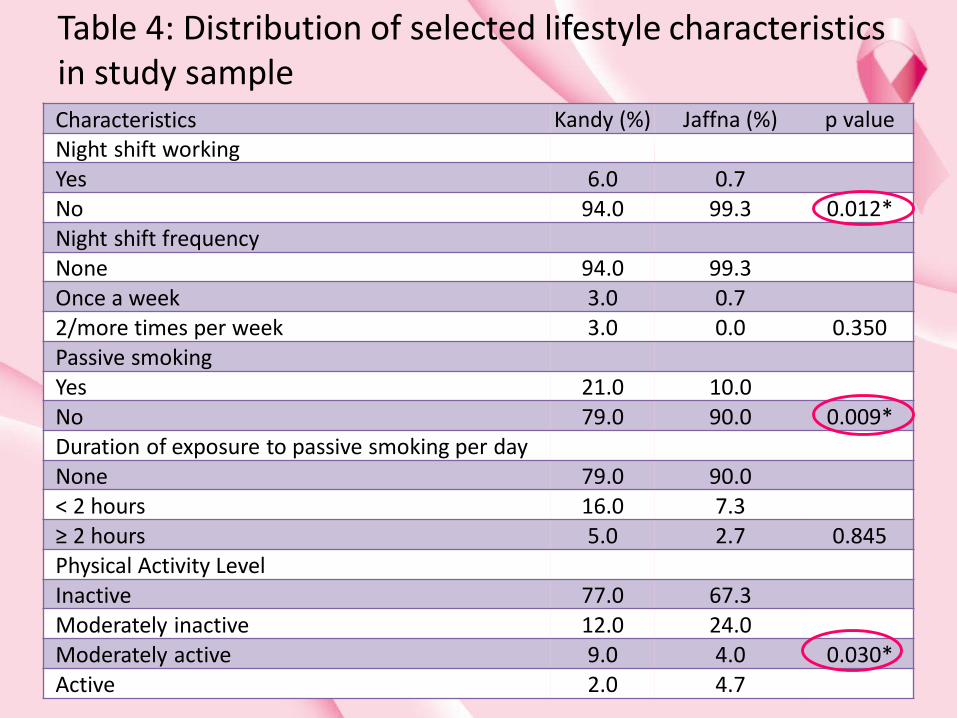
Characteristics Kandy (%) Jaffna (%) p valueNight shift workingYes 6.0 0.7No 94.0 99.3 0.012*Night shift frequencyNone 94.0 99.3Once a week 3.0 0.72/more times per week 3.0 0.0 0.350Passive smokingYes 21.0 10.0No 79.0 90.0 0.009*Duration of exposure to passive smoking per dayNone 79.0 90.0< 2 hours 16.0 7.3≥ 2 hours 5.0 2.7 0.845Physical Activity LevelInactive 77.0 67.3Moderately inactive 12.0 24.0Moderately active 9.0 4.0 0.030*Active 2.0 4.7
Table 4: Distribution of selected lifestyle characteristics in study sample

Table 5: Distribution of selected reproductive characteristics in study sample
Characteristics Kandy (%) Jaffna (%) p valueOverweight/obese at adolescentYes 33.0 29.3No 67.0 70.7 0.534 Irregular periodsAmenorrhoea 6.0 5.3 0.822Polymenorrhoea 6.0 4.7 0.642Pregnant historyEver become pregnant 90.0 89.3Never become pregnant 10.0 10.7 0.866Abortion historyYes 14.0 14.7No 86.0 85.3 0.883 Contraceptive usageYes 35.0 27.3No 65.0 72.7 0.197

Table 6: Distribution of selected disease history in study sample
Diseases Kandy (%) Jaffna (%) p value
Diabetes
Yes 13.0 16.7
No 87.0 83.3 0.429
Gestational diabetes
Yes 2.0 4.0
No 98.0 96.0 0.379
Hypertension
Yes 21.0 17.3
No 79.0 82.7 0.467
Gestational hypertension
Yes 8.0 4.7
No 92.0 95.3 0.277

Characteristics Kandy (%) Jaffna (%) p valueCumulative time duration of breast cancer (months)0-12 months 12.0 16.013-24 months 8.0 12.025-36 months 5.0 13.337-48 months 14.0 22.7≥ 49 months 61.0 36.0 0.003*cumulative time duration of breast feeding≥ 24 monthsYes 80.0 72.0No 10.0 17.3 0.151Mean time duration of breast feeding < 24 months 33.0 78.0≥ 24 months 67.0 22.0 0.000*
Table 7:Distribution of characteristic of breast feeding time duration in study sample
*significantly different at 95% confident interval

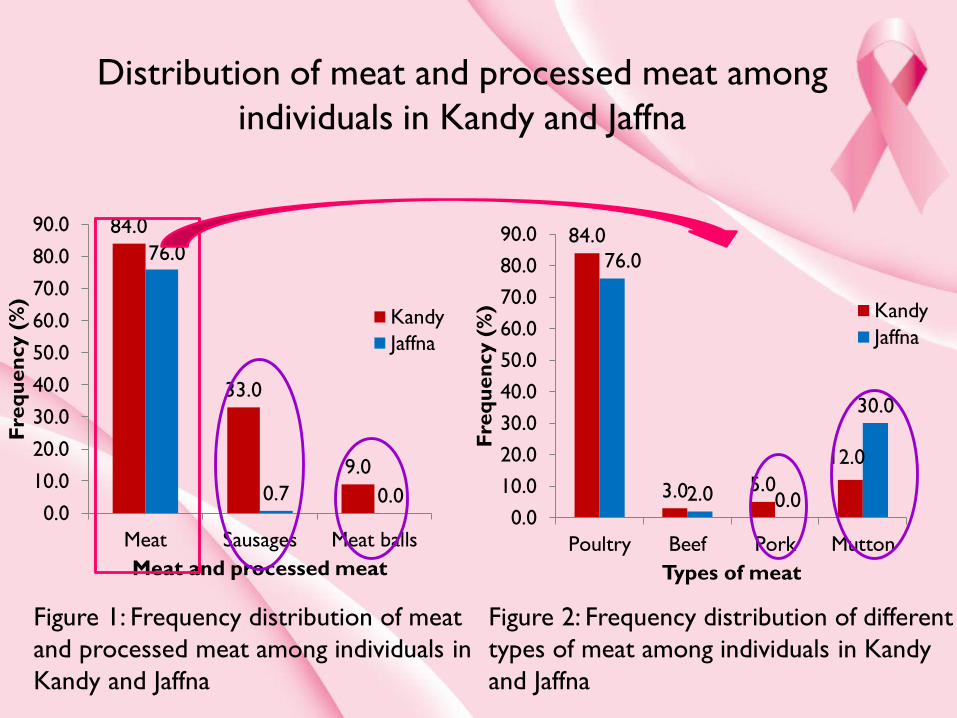
Characteristics Kandy (%) Jaffna (%) p value
Pork 5.0 0.0 0.006*
Mutton 12.0 30.0 0.001*
Sausages
Consumers 33.0 0.7
Non consumers 67.0 99.3 0.000*
Meat balls
Consumers 9.0 0.0
Non consumers 91.0 100.0 0.000*
Meat an processed meat
84.0
33.0
9.0
76.0
0.7 0.00.0
10.0
20.0
30.0
40.0
50.0
60.0
70.0
80.0
90.0
Meat Sausages Meat balls
Fre
qu
en
cy (
%)
Meat and processed meat
Kandy
Jaffna
84.0
3.0 5.0
12.0
76.0
2.0 0.0
30.0
0.0
10.0
20.0
30.0
40.0
50.0
60.0
70.0
80.0
90.0
Poultry Beef Pork Mutton
Fre
qu
en
cy (
%)
Types of meat
Kandy
Jaffna
Figure 1: Frequency distribution of meat
and processed meat among individuals in
Kandy and Jaffna
Figure 2: Frequency distribution of different
types of meat among individuals in Kandy
and Jaffna
Distribution of meat and processed meat among
individuals in Kandy and Jaffna

47.0
84.0
77.0
68.0
30.0
52.0
32.0
76.0
70.0
5.3
0.0
10.0
20.0
30.0
40.0
50.0
60.0
70.0
80.0
90.0
Milk Yogurt Ice cream Curd Cheese
Fre
qu
en
cy (
%)
Milk and milk products
Kandy
Jaffna33.0
25.0
92.0
29.0
11.0
96.0
81.0
63.3
38.0
60.764.0
58.7
81.386.7
0.0
10.0
20.0
30.0
40.0
50.0
60.0
70.0
80.0
90.0
100.0
Shark Salmon Dried fish Prawns Crabs Egg (Hen) Soya meat
Fre
qu
en
cy (
%)
Protein sources
Kandy
Jaffna
Distribution of protein sources among individuals in
Kandy and Jaffna
Figure 3: Protein source consumption frequency among individuals in
Kandy and Jaffna
Figure 4: Milk and milk products consumption frequency among
individuals in Kandy and Jaffna
Distribution of milk and milk products among
individuals in Kandy and Jaffna

94.0
40.0
75.0
22.0
81.3
28.7
0.0
10.0
20.0
30.0
40.0
50.0
60.0
70.0
80.0
90.0
100.0
Coconut oil Vegetable oil Butter/Margarine
Fre
qu
en
cy (
%)
Types of fat
Kandy
Jaffna
Figure 5 : Different types of fat consumption frequency among
individuals in Kandy and Jaffna
Distribution of different types of oil among individuals
in Kandy and Jaffna
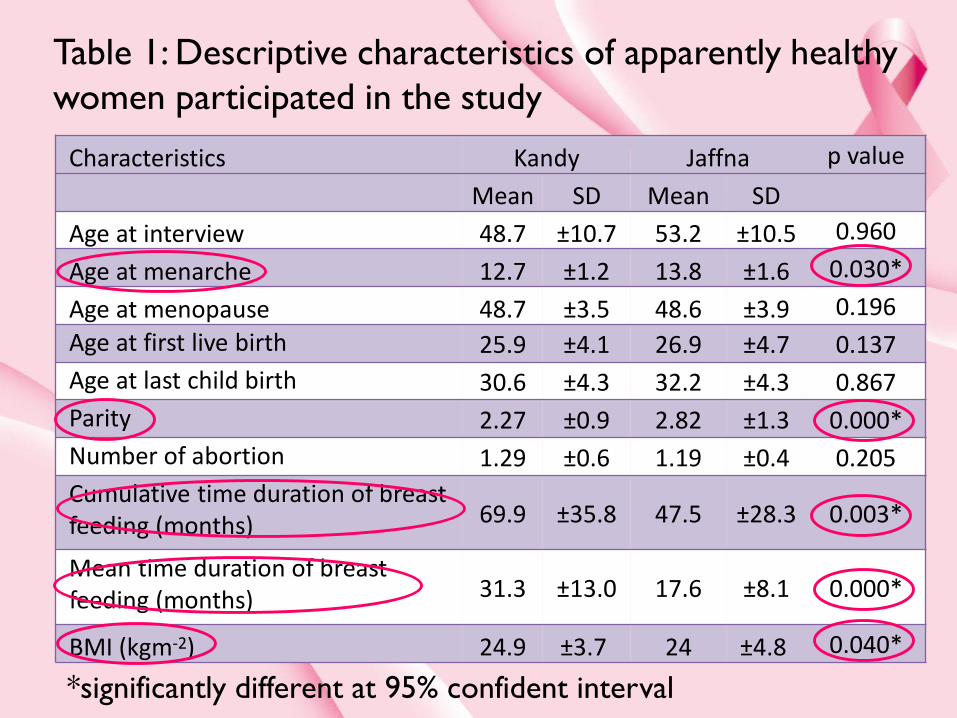
Characteristics Kandy Jaffna p value
Mean SD Mean SD
Age at interview 48.7 ±10.7 53.2 ±10.5 0.960
Age at menarche 12.7 ±1.2 13.8 ±1.6 0.030*
Age at menopause 48.7 ±3.5 48.6 ±3.9 0.196
Age at first live birth 25.9 ±4.1 26.9 ±4.7 0.137
Age at last child birth 30.6 ±4.3 32.2 ±4.3 0.867
Parity 2.27 ±0.9 2.82 ±1.3 0.000*
Number of abortion 1.29 ±0.6 1.19 ±0.4 0.205
Cumulative time duration of breast feeding (months) 69.9 ±35.8 47.5 ±28.3 0.003*
Mean time duration of breast feeding (months) 31.3 ±13.0 17.6 ±8.1 0.000*
BMI (kgm-2) 24.9 ±3.7 24 ±4.8 0.040*
*significantly different at 95% confident interval
Table 1: Descriptive characteristics of apparently healthy
women participated in the study

Distribution of frequency consumption of significantly different dietary risk factors
22.0
74.0
28.7
52.0
0.0
10.0
20.0
30.0
40.0
50.0
60.0
70.0
80.0
< 4 times/week ≥ 4 times/week
Fre
qu
en
cy (
%)
Egg consumption frequency
Kandy
Jaffna
5.0
32.0
10.0
3.2
13.3
33.3
0.0
5.0
10.0
15.0
20.0
25.0
30.0
35.0
≤ 3 times/month
1-6 times/week ≥ Once a day
Fre
qu
en
cy (
%)
Milk consumption frequency
Kandy
Jaffna
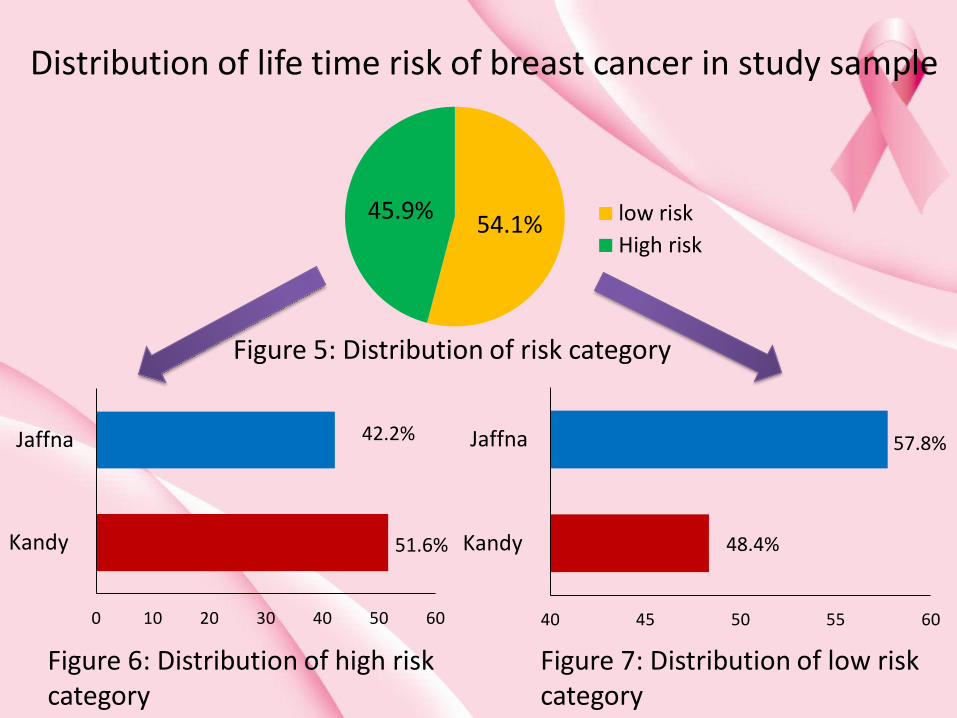
Distribution of life time risk of breast cancer in study sample
54.1%45.9% low risk
High risk
40 45 50 55 60
Kandy
Jaffna 57.8%
48.4%
0 10 20 30 40 50 60
Kandy
Jaffna 42.2%
51.6%
Figure 5: Distribution of risk category
Figure 6: Distribution of high risk category
Figure 7: Distribution of low risk category