final pdf csml 2014 - imperial sugar limitedimperialsugars.com/upload/financial accounts sep...
TRANSCRIPT


Contents
Corporate Information...................................................................................................................02
Vision & Mission Statement.................................................................................................................03
Notice of the Annual General Meeting..................................................................................................04
Directors’ Report to the Members...........................................................................................05-07
Statement of Compliance with Code of Corporate Governance..................................................08-09
Review Report to the Members on Statement of Compliance
with Best Practices of Code of Corporate Governance............................................................................10
Auditors’ Report to the Members............................................................................................................................11
Balance Sheet........................................................................................................................................12-13
Profit and Loss Account and Statement of Comprehensive Income......................................................14
Cash Flow Statement...........................................................................................................................................15
Statement of Changes in Equity....................................................................................................16
Notes to the Accounts............................................................................................................17-40
Financial Highlights...........................................................................................................................................41
Pattern of Shareholding......................................................................................................................42-44
Form of Proxy
01 | Annual Report 2014

Mr. Naveed M. SheikhMr. Waqar Ibn Zahoor BandeyMian Muhammad AliMr. Muhammad Asghar Mr. Ahmed Haji Mussa
Mr. Abdul Sammee
Mr. Muhammad AsgharMian Muhammad Ali
Mr. Muhammad Asghar
Mr. Abdul Sammee
National Bank of PakistanFaysal Bank LimitedKASB Bank LimitedThe Bank of PunjabAl-Baraka Bank (Pakistan) LimitedPak Oman Investment Company Limited
Naveed Zafar Ashfaq Jaffery & Co.Chartered Accountants
Ground Floor, Ismail Aiwan-e-ScienceBuilding, 205 Ferozepur Road
+92 (42) 3575-8970+92 (42) 3575-1308+92 (42) 3576-3247
Hameed Majeed Associates (Pvt.) LimitedH.M. House, 7-Bank Square, Lahore
+92 (42) 3723-5081-2
Karmanwala, Tehsil Phalia Distt. Mandi Bahauddin
+92 (546) 541-151/54+92 (546) 541-162
- Chairman- Director/CEO- Director- Director- Director- Director- Director
- Chairman- Member- Member
- Chairman- Member- Member
Mian Chanu ProjectChak # 84/15L, 15 KM Vehari Road Kacha KhooTehsil Mian ChanuDistt. Khanewal Ph # +92 (0652) 553-182Fax # +92 (0652) 660-452
+92 (42) 3735-8817
Board of Directors
Company Secretary
Audit Committee
HR & Remuneration Committee
Financial Institutions
Auditors
Legal Advisors
Registered Office
Shares Registrar
Production Facilities
Corporate Information
Mr. Asad Ali
Mr. Mubashar Asif
Mr. Asad Ali
Mr. Asad Ali
Ms. Aniqua SheikhAdvocate
Lahore-54600Ph #
Fax #
Ph #
Phalia Project
Ph #Fax #
Fax #
Annual Report 2014 | 02

03 | Annual Report 2014
Vision StatementTo exploit our company's potential by diversifying
into the entire range of industrial and consumer
products that can be derived from Sugar Cane
Mission StatementTo exceed our customers' expectations in quality
and delivery on one hand and maximize profit for
the stakeholders of our company on the other
hand by continuous cost reduction through
identifying and deploying latest technologies in
process and monitoring control systems

Notice of Annual General Meeting
Annual Report 2014 | 04
thNOTICE is hereby given that the 8 Annual General Meeting of the shareholders of Colony Sugar Mills Limited will be held on Saturday, January 31, 2015, at 10:00 a.m. at the Registered Office at Ismail Aiwan-e-Science Building, 205 Ferozepur Road, Lahore to transact the following business:
1. To receive, consider and adopt the Audited Accounts of the Company for the year ended September 30, 2014 together with the Directors' and Auditors' Reports thereon.
2. To appoint Auditors for the year 2014-15 and to fix their remuneration.
3. Any other business with the permission of the Chair.
By Order of the Board
Company Secretary Lahore January 08, 2015
Notes:-
i. The Share Transfer Books of the Company will remain closed from January 24, 2015 to January 31, 2015 (both days inclusive).
ii. A member entitled to attend and vote in the meeting may appoint another member as his/her proxy to attend and vote on his/her behalf. The proxy, in order to be effective, must be received at the registered office of the Company duly signed and stamped not later than 48 hours before the meeting.
iii. The shareholders are requested to bring their Folio / Account details (participant ID and sub-account) and original CNIC for identification purpose at the time of meeting. In case of corporate entity, the Board of Director's Resolution or Power of Attorney with specimen signatures of the nominee should be produced.
iv. Securities and Exchange Commission of Pakistan (SECP) vide its S.R.O. 787(I) / 2014 has facilitated the Companies to circulate Audited Financial Statements and Notices through e-mail. The members who intend to receive the Audited Accounts through email are therefore, requested to kindly send their written consent to company (specimen available at Company's website at www.colonysugar.com).
v. Government of Pakistan through Finance Act 2014 has prescribed different rates of Withholding Tax to be deducted from amounts of dividends paid by the companies as follows:
a) For filers of income tax returns : 10%b) For non-filers of income tax returns: 15%
Filers of Tax Returns are requested to send the information in this respect, ensuring that their respective names have been entered into the Active Tax Payers List available at website of Federal Board of Revenue to benefit the reduced Tax Rates.
vi. Shareholders are requested: a. to notify the change of address immediately, if any.b. to provide the copies of their valid CNIC's if not provided earlier.c. Shareholders desirous to avail the option of direct credit of entitlement(s) are requested to send
duly filled in Dividend Mandate Form available at website of the company.

05 | Annual Report 2014
DIRECTORS’ REPORT TO THE MEMBERS
On behalf of the Directors of the company, I am pleased to present Company's Annual Report for the year ended September 30, 2014 along with the Financial Statements and Auditors' Report thereon.
FINANCIAL PERFORMANCE
Turnover for the year under review reduced to Rupees 5,299 Million (2013: Rupees 7,235 Million) while the cost of sales stood at Rupees 5,049 Million (2013: Rupees 6,617 Million). The year under review posts gross profit of Rupees 250 Million (2013: Rupees 618 Million). Loss after taxation for the year is Rupees 126 Million against after tax profit of Rupees 262 Million during last year. Loss per share is Rupees 1.33 per share as compared with profit of Rupees 2.65 per share for the last year.
The major reason for loss is wide gap between sale price of sugar and cost of its production. Sugar sale price did not move favourably in the domestic as well as international market due to world over surplus sugar production/stock. Government's permission to export limited quantity of sugar also did not bring fruits. Distillery, however, contributed profits despite decrease in selling price as compared to last year. The management of the Company saved financial cost by Rupees 66.155 Million, through timely repayments of its financial obligations and efficient fund management, despite financial constraints. Financial position of the Company is expected to further improve in subsequent period with elimination of majority of long term loans.
OPERATIONAL PERFORMANCE
The Company crushed 836,931 Tons of sugarcane during the year as compared to 1,057,447 Tons during previous crushing season. Distillery produced 21,260,418 litres as compared to production of 26,936,431 litres last year.
FUTURE OUTLOOK
Introduction of modern technology has been hallmark of the management of your company. Currently, the Company has implementing a major BMR plan to introduce most modern energy efficient technology at its both facilities. The BMR project is expected to start repaying return on investment during current crushing season.
In view of the current estimates of sugarcane crop, sugar production seems to be surplus during the current year, as well.
However, the Government has indicated its permission for export of surplus sugar stocks, along with certain incentives. Price of sugar is expected to adjust itself favourably on export of surplus sugar stocks.
DIVIDEND
No dividend was announced during the year due to the squeezed cash flows for the year ended September 30, 2014.
STATEMENT OF ETHICS AND BUSINESS PRACTICES
Honesty, integrity and strong commitment to high standards of ethical, moral and lawful conducts are among the most important traditions of Colony Sugar Mills Limited. This dedication is critical to meet our commitment to our shareholders, customers, suppliers and employees.
CORPORATE SOCIAL RESPONSIBILITY
We actively seek opportunities to contribute to the communities in which we do business, and to improve the environment that sustains us all. Our main CSR focuses are Education, health care and community building.
AUDIT COMMITTEE
The Board of Directors, in compliance with the Code of Corporate Governance, has established an Audit Committee. This step has ensured the strict compliance of internal controls so as to safeguard the interests of the company. The committee reviews the final and interim financial statements.

Annual Report 2014 | 06
STATEMENT ON CORPORATE AND FINANCIAL REPORTING FRAMEWORK
As required under the Code of Corporate Governance, Directors are pleased to report that:
·The financial statements prepared by the management of the company present fairly its state of affairs,
the results of its operations, cash flows and changes in equity.
·The company has maintained proper books of accounts as per statutory requirements.
·Appropriate accounting policies have been consistently applied in preparation of financial statements and
accounting estimates are based on reasonable and prudent judgment.
·The Company has prepared a “Code of Conduct” and has ensured that appropriate steps have been taken
to disseminate it throughout the company along with its supporting policies and procedures.
·The International Accounting/Financial Reporting Standards, as applicable in Pakistan, have been
followed in preparation of financial statements.
·The system of internal control is sound in design and has been effectively implemented and monitored.
·There are no significant doubts upon the company's ability to continue as a going concern.
·There has been no departure from the best practices of corporate governance, as detailed in the listing
regulations.
·Key operating and financial data for past five years is annexed.
·Directors have not recommended dividend in view of current year's results and cash flows.
·Information about outstanding taxes and other government levies are given in related note(s) to the
accounts.
·The company operates a gratuity fund scheme for all employees. The net value of investment in their
respective accounts is given in related note(s) to the accounts.
·All material information, as described in clause (xx) of the Code is disseminated to the Stock Exchange and
Securities and Exchange Commission of Pakistan in a timely fashion.
·The company has complied with requirements as stipulated in clause 35 (x) relating to related party
transactions.
·The Directors are aware of their fiduciary responsibilities and in-house orientation courses were arranged
for management.
·The directors, CEO, CFO, Company Secretary and their spouses and minor children have made no trading
in the company's share during the year. The number of shares, if any, held by them is annexed.
BOARD MEETINGS
During the year under review five (05) meetings of the Board of Directors were held. Participation of Directors is as
follows: -
Names of Directors
Mr. Naveed M. Sheikh 3 Mr. Waqar Ibn Zahoor Bandey 5 Mr. Ahmed Haji Mussa 4
Mr. Muhammad Asghar 5
Mr. Asad Ali 5
Mian Muhammad Ali 5
Ms. Samina Gul
Mr. Abdul Sammee
3*
2*
Attendance
The Board granted leave of absence to the directors who could not attend the Meeting.
*Meetings attended during the tenure

07 | Annual Report 2014
During the year under review four (04) meetings of the Audit Committee were held. Participation of Members is as follows: -
Names of Members
Names of Members
Attendance
Attendance
Mr. Muhammad Asghar 4 Mian Muhammad Ali 4
Mr. Asad Ali 4
During the year under review two (02) meetings of the Human Resource & Remuneration Committee were held. Participation of Members is as follows: -
EXTERNAL AUDITOR
The retiring auditors M/s Naveed Zafar Ashfaq Jaffery & Co Chartered Accountants, being eligible, offer themselves for re-appointment. The audit committee has recommended M/s Naveed Zafar Ashfaq Jaffery & Co, as auditors of the company for the ensuing financial year subject to fulfilment of CCG requirements.
The external auditors have been given satisfactory rating under the Quality Control Review Program of the Institute of Chartered Accountants of Pakistan (ICAP). They have further confirmed that their firm is in compliance with International Federation of Accountants' (IFAC) guidelines on the Code of Ethics as adopted by the ICAP. The external auditors have not been appointed to provide other services except in accordance with the listing regulations and they have confirmed that they have observed IFAC guidelines in this respect.
PATTERN OF SHAREHOLDING
The pattern of shareholding under section 236 (d) and information under clause XVI (J) of the Code of Corporate Governance as on September 30, 2014 are annexed.
ACKNOWLEDGEMENT
The Board places on record its appreciation for the dedication and hard work of its all work force, as well as for the support of its all stakeholders.
For and on behalf of the Board
Waqar Ibn Zahoor BandeyDirector / CEO
LahoreJanuary 08, 2015
Mr. Muhammad Asghar 2
Mr. Asad Ali 2
Ms. Samina Gul
Mr. Abdul Sammee
*Meetings attended during the tenure
1*
1*

Statement of Compliance with the Code ofCorporate Governance For The Year Ended September 30, 2014
Annual Report 2014 | 08
The statement is being presented to comply with the Code of Corporate Governance contained in the Regulation # 35 of the listing regulation of Karachi Stock Exchange Limited for the purpose of establishing a framework of good governance, whereby a listed company is managed in compliance with the best practices of corporate governance.
The company has applied the principles contained in the Code in the following manner:
1. The company encourages representation of independent non-executive directors and directors representing minority interest on its Board of Directors. At present, the Board includes:
Non-Executive DirectorMr. Naveed M. Sheikh - ChairmanMian Muhammad AliMr. Ahmed Haji MussaMr. Asad Ali
Independent DirectorMr. Muhammad Ashgar
Executive DirectorMr. Waqar Ibn Zahoor Bandey Mr. Abdul Sammee
The independent director meet the Criteria of Independence under Clause i (b) of the CCG.
2. The directors have confirmed that none of them is serving as a director on more than seven listed companies, including this company.
3. All the resident directors of the company are registered as tax payers and none of them has defaulted in payment of any loan to a banking company, a DFI, or an NBFI or, being a member of a stock exchange, has been declared as a defaulter by that stock exchange.
4. Casual vacancies occurred during the year and were filled within the stipulated time frame.
5. The company has prepared a “Code of Conduct” and has ensured that appropriate steps have been taken to disseminate it throughout the company along with its supporting policies and procedures.
6. The Board has developed a vision/mission statement. Overall corporate strategy and significant policies of the company have been developed and maintaining a complete record of particulars of significant policies.
7. All the powers of the Board have been duly exercised and decisions on material transactions, including appointment and determination of remuneration and terms and conditions of the employment of the CEO and other directors have been taken by the Board.
8. The meetings of the Board were presided over by the Chairman and, in his absence, by a director elected by the Board for this purpose and the Board met at least once in every quarter. Written notices of the board meetings, along with agenda and working papers, were circulated at least seven days before the meetings. The minutes of the meetings were appropriately recorded and circulated.
9. In house orientation courses were arranged for the directors and key personnel during the year to equip and familiarize them with the changes in law to discharge their duties efficiently. The company is arranging Directors Training Program for its directors to get certified all the board members before deadline of Code.
10.The Board has approved the appointment of CFO, Company Secretary and Internal Auditor, including their remuneration and terms and conditions of the employment.

09 | Annual Report 2014
11. The directors' report for the year has been prepared in compliance with the requirements of the code and fully describes the salient matters required to be disclosed.
12. The financial statements of the company were duly endorsed by CEO and CFO before approval of the board.
13. The directors, CEO and executives don't hold any interest in the shares of the company other than that disclosed in the pattern of shareholding.
14. The company has complied with the corporate and financial reporting requirements of the code.
15. The Board has formed an audit committee. It comprises of three members, two of them are non-executive Directors and the Chairman of the Committee is an independent Director.
16. The meetings of the audit committee were held, prior to the approval of interim and final results of the company as required by the code. The terms of reference of the committee have been formed and advised to the committee for compliance.
17. The Board has formed an HR & Remuneration Committee, It comprises of three members i.e. one Non-Executive Director, one Executive Director, and one Independent Director and the Chairman of the Committee is an independent Director.
18. The Board has set up an internal audit function and taking appropriate measures to make it effective.
19. The statutory auditors of the company have confirmed that they have been given a satisfactory rating under the Quality Control Review program of The Institute of Chartered Accountants of Pakistan, that they or any of the partners of the firm, their spouses and minor children do not hold shares of the company and that the firm and all its partners are in compliance with International Federation of Accountants ( IFAC) guidelines on the code of ethics as adopted by The Institute of Chartered Accountants of Pakistan.
20. The statutory auditors or the persons associated with them have not been appointed to provide other services except in accordance with the listing regulations and the auditors have confirmed that they have observed IFAC guidelines in this regard.
21. The 'Closed Period', prior to the announcement of interim/final results, and business decisions, which may materially affect the market price of the company's securities, was determined and intimated to directors, employees and the stock exchange.
22. Material/Price sensitive information has been disseminated among all market participants at once through Stock Exchange.
23. The company has complied with requirements as stipulated in Code relating to related party transactions.
24. We confirm that all other material principles and enshrined contained in the code have been complied with.
For and on behalf of the Board
Waqar Ibn Zahoor BandeyChief Executive OfficerLahoreJanuary 08, 2015

Annual Report 2014 | 10

11 | Annual Report 2014

Annual Report 2014 | 12
Balance SheetAs at September 30, 2014
Chief Executive Officer
EQUITY AND LIABILITIES
SHARE CAPITAL AND RESERVES
Authorized Capital
Issued, subscribed and paid up capital
Unappropriated profit
Total equity
NON-CURRENT LIABILITIES
Long term finances
Long term deposits
Liabilities against assets subject to
Deferred liabilities
CURRENT LIABILITIES
Trade and other payables
Accrued finance cost
Short term borrowings - securedCurrent portion of long term liabilities
Liabilities directly associated with non-current
assets - held for sale
CONTINGENCIES AND COMMITMENTS
The annexed notes from 1 to 36 form an integral part of these financial statements.
100,000,000 (2013: 100,000,000) ordinary shares
of Rupees 10/- each
Note 2014 2013
(Restated)
1,000,000 1,000,000
3 990,200 990,200
819,386 951,376
1,809,586 1,941,576
4 285,400 387,583
5 80,000 -
7 57,242 38,115
424,512 425,698
8 1,255,395 911,161
9 49,646 50,191
10 885,963 842,158
11 58,624 179,557
2,249,628 1,983,067
4 143,750
137,348
2,393,378
2,120,415
12 -
-
4,627,476
4,487,689
( Rupees in thousand )
diminishing musharaka finance 6 1,870 -

13 | Annual Report 2014
Balance SheetAs at September 30, 2014
Director
PROPERTY AND ASSETS
NON-CURRENT ASSETS
Property, plant and equipment
CURRENT ASSETS
Stores, spares and loose tools
Stocks in trade
Trade debts
Advances, deposits, prepayments and
other receivablesCash and bank balances
Non-current assets - held for sale
Note 2014 2013
13 3,374,303 3,111,713
14 269,997 201,637
15 179,045 572,728
16 126,598 -
17 471,007 441,487
18 54,702 8,300
1,101,349 1,224,152
19 151,824 151,824
1,253,173 1,375,976
4,627,476 4,487,689
( Rupees in thousand )

Annual Report 2014 | 14
Profit and Loss Account and Statement
For the year ended September 30, 2014
Chief Executive Officer Director
Sales - net
Cost of sales
Gross profit
Administrative expenses
Distribution and marketing expenses
Other operating income
Operating profit
Finance cost
Worker's profit participation fund
(Loss)/Profit before taxation
Provision for taxation
(Loss)/Profit after taxation
OTHER COMPREHENSIVE INCOME
Other comprehensive income-net of tax
Total comprehensive (loss)/income for the year
Earnings per share - basic & diluted
The annexed notes from 1 to 36 form an integral part of these financial statements.
Note 2014 2013
20 5,298,805 7,234,928
21 5,048,675 6,617,139
250,130 617,789
22 146,134 124,963 23 49,554 41,000
195,688 165,963 24 2,641 41,460
57,083
493,286
25 183,618
249,773
-
11,596
(126,535)
231,917
26 (80) 30,204
(126,615)
262,121
(5,375)
-
(131,990)
262,121
Rupees Rupees
27 (1.33) 2.65
( Rupees in thousand )
of Comprehensive Income

15 | Annual Report 2014
Chief Executive Officer Director
Cash Flow StatementFor the year ended September 30, 2014
2014 2013
CASH FLOWS FROM OPERATING ACTIVITIES
(Loss)/Profit before taxation (126,535) 231,917
Adjustments for non-cash and other items:
Finance cost 183,618 249,773
Depreciation of Property, plant and equipment 142,754 147,955
Provision for staff retirement benefits - gratuity 19,043 14,659
Provision for contribution to workers' profit participation fund - 11,596
Forefeited securities - (31,218)
Foreign exchange loss/ (gain) 1,608 (3,758)
Gain on sale of operating fixed assets (2,584) -
344,439 389,007
Cash generated from operating activities before working capital changes 217,904 620,924
Adjustments for working capital changes:
(Increase)/decrease in current assets:
Stores, spares and loose tools (68,360) (24,248)
Stocks-in-trade 393,683 653,562
Trade debts (126,598) 207,732
Advances, deposits, prepayments and other receivables (5,642) (114,873)
Increase/ (decrease) in current liabilities:
Trade and other payables 354,222 183,329
Net working capital changes 547,305 905,502
Finance cost paid (184,163) (300,977)
Staff retirement benefits - gratuity paid (5,291) (4,313)
Workers' profit participation fund paid (11,596) (6,676)
Income tax paid (23,956) (68,458)
(225,006) (380,424)
Net cash generated from operating activities 540,203 1,146,002
CASH FLOWS FROM INVESTING ACTIVITIES
Fixed capital expenditure (8,366) (19,794)
Capital work in progress (410,946) (10,799)
Sale proceeds from sale of property, plant and equipment 16,550 -
Net cash used in investing activities (402,762) (30,593)
CASH FLOWS FROM FINANCING ACTIVITIES
Long term finances-net (217,213) (295,888)
Long term deposits 80,000 -
Liabilities against assets subject to diminishing musharaka finance 2,369 -
Short term borrowings 43,805 (822,994)
Net cash used in financing activities (91,039) (1,118,882)
NET INCREASE/(DECREASE) IN CASH AND CASH EQUIVALENTS 46,402 (3,473)
CASH AND CASH EQUIVALENTS AT THE BEGINNING OF THE YEAR 8,300 11,773
CASH AND CASH EQUIVALENTS AT THE END OF THE YEAR 54,702 8,300
The annexed notes from 1 to 36 form an integral part of these financial statements.
( Rupees in thousand )

Annual Report 2014 | 16
Statement of Changes in EquityFor the year ended September 30, 2014
Chief Executive Officer Director
SHARE
CAPITAL
UNAPPROPRIATED
PROFIT
TOTAL
EQUITY
Balance as on September 30, 2012 990,200 694,490 1,684,690
Total comprehensive income for the year -
262,121
262,121
Balance as on September 30, 2013 990,200 956,611 1,946,811
Effect of restatement of gratuity payable under IAS-19 (5,235) (5,235)
Balance as on September 30, 2013-restated 990,200 951,376 1,941,576
Total comprehensive loss for the year -
(131,990)
(131,990)
Balance as on September 30, 2014 990,200
819,386
1,809,586
The annexed notes from 1 to 36 form an integral part of these financial statements.
PARTICULARS
(Rupees in thousand)

17 | Annual Report 2014
1 LEGAL STATUS AND NATURE OF BUSINESS
1.1
1.2
2 SUMMARY OF SIGNIFICANT ACCOUNTING POLICIES
2.1 BASIS OF PREPARATION
a) STATEMENT OF COMPLIANCE
b) Accounting convention
c) Critical accounting estimates and judgments
The Company is inter-alia, engaged in manufacturing of sugar for which the season begins in
November and ends in April. Therefore, majority of expenses are incurred and production
activities are undertaken in first half of the company's financial year.
Colony Sugar Mills Limited ("the Company") was incorporated in Pakistan on May 09, 2007 under
the Companies Ordinance, 1984. The shares of the Company are quoted on Karachi Stock
Exchange Limited. The Company's registered office is situated in Lahore and its manufacturing
facilities are located at Tehsil Phalia, District Mandi Bahauddin and Tehsil Mian Channu, District
Khanewal. The Company is engaged in manufacturing and sale of white refined sugar and ethanol and by products
Seasonality of operation
The significant accounting policies adopted in the preparation of these financial statements are
set out hereunder. These policies have been consistently applied to year presented, unless
otherwise stated.
These financial statements have been prepared in accordance with the requirements of the
Companies Ordinance, 1984 (the Ordinance) and the directives issued by the Securities and
Exchange Commission of Pakistan (SECP) and approved accounting standards as applicable in
Pakistan. Approved accounting standards comprise of such International Accounting Standards
(IASs) / International Financial Reporting Standards (IFRSs) as notified under the provisions of the
Ordinance. Wherever, the requirements of the Ordinance or the directives issued by the SECP
differ with the requirements of these standards, the requirements of the Ordinance or the
requirements of the said directives take precedence.
These financial statements have been prepared under the "historical cost convention" using,
except for cash flow statement, accrual basis of accounting.
The preparation of financial statements in conformity with International Accounting Standards/
International Financial Reporting Standards requires management to make judgments, estimates
and assumptions that affect the application of policies and reported amounts of assets and
liabilities, income and expenses. The estimates and associated assumptions are based on
historical experience and various other factors that are believed to be reasonable under the
circumstances, the results of which form the basis of making judgments about carrying values of
assets and liabilities that are not readily apparent from other sources. Actual results may differfrom these estimates.
The estimates and underlying assumptions are reviewed on an ongoing basis. Revisions to
accounting estimates are recognized in the period in which the estimates are revised.
Notes to the Financial StatementsFor the year ended September 30, 2014

Annual Report 2014 | 18
d)
e)
f)
Standards, interpretation and amendments to published approved standards that are effective
in current year but not relevant to the Company
Amendments to published approved standards that are effective in current year and are
relevant to the Company
Significant areas requiring the use of management estimates in these financial statements relate
to the useful life of depreciable assets, taxation, provision for doubtful receivables and slow
moving inventory. However, assumptions and judgments made by management in the
application of accounting policies that have significant effect on the financial statements are not
expected to result in material adjustment to the carrying amounts of assets and liabilities in thenext year.
The following amendments to published approved standards are mandatory for the Company's
accounting periods beginning on or after 01 October 2013:
IFRS 7 (Amendment) ‘Financial Instruments: Disclosures' (effective for annual periods beginning
on or after 01 January 2013). The International Accounting Standards Board (IASB) has amended
the accounting requirements and disclosures related to offsetting of financial assets and financial
liabilities by issuing amendments to IAS 32 ‘Financial Instruments: Presentation' and IFRS 7.
These amendments are the result of IASB and US Financial Accounting Standard Board
undertaking a joint project to address the differences in their respective accounting standards
regarding offsetting of financial instruments. The application of the amendments does not result
in any impact on profit or loss, other comprehensive income and total comprehensive income.
On 17 May 2012, IASB issued Annual Improvements to IFRS: 2009 – 2011 Cycle, incorporating
amendments to five IFRS more specifically in IAS 1 ‘Presentation of Financial Statements' and IAS
32 ‘Financial instruments: Presentation' that are considered relevant to the Company’s financial
statements. These amendments are effective for annual periods beginning on or after 01
October 2013. The application of the amendments does not result in any impact on profit or loss,
other comprehensive income and total comprehensive income.
There are other standards, new interpretation and amendments to published standards that are
mandatory for accounting periods beginning on or after 01 October 2013 but are considered not
to be relevant or do not have any significant impact on the Company's financial statements and
are therefore not detailed in these financial statements.
Standards, interpretation and amendments to published standards that are not yet effective
but relevant to the Company
IFRS 9 'Financial Instruments' (effective for annual periods beginning on or after 01 January
2018). A finalized version of IFRS 9 which contains accounting requirements for financial
instruments, replacing IAS 39 ‘Financial Instruments: Recognition and Measurement'. Financial
assets are classified by reference to the business model within which they are held and their
contractual cash flow characteristics. The 2014 version of IFRS 9 introduces a 'fair value through
other comprehensive income' category for certain debt instruments. Financial liabilities are
classified in a similar manner to under IAS 39, however there are differences in the requirements
applying to the measurement of an entity's own credit risk. The 2014 version of IFRS 9 introduces
an 'expected credit loss' model for the measurement of the impairment of financial assets, so it is
no longer necessary for a credit event to have occurred before a credit loss is recognized. It
Following standards, interpretation and amendments to existing standards have been published
and are mandatory for the Company's accounting periods beginning on or after 01 October 2014
or later periods:

19 | Annual Report 2014
management hedging
exposures. The requirements for the derecognition of financial assets and liabilities are carried
forward from IAS 39. The management of the Company is in the process of evaluating the
impacts of the aforesaid standard on the Company’s financial statements.
introduces a new hedge accounting model that is designed to be more closely aligned with how
entities undertake risk activities when financial and non-financial risk
IAS 36 (Amendments) ‘Impairment of Assets' (effective for annual periods beginning on or after
01 January 2014). Amendments have been made in IAS 36 to reduce the circumstances in which
the recoverable amount of assets or cash- generating units is required to be disclosed, clarify the
disclosures required and to introduce an explicit requirement to disclose the discount rate used
in determining impairment (or reversals) where recoverable amount (based on fair value less
costs of disposal) is determined using a present value technique. However, the amendments are
not expected to have a material impact on the Company’s financial statements.
IAS 32 (Amendments) 'Financial Instruments: Presentation' (effective for annual periods
beginning on or after 01 January 2014). Amendments have been made to clarify certain aspects
because of diversity in application of the requirements on offsetting, focused on four main areas:
the meaning of 'currently has a legally enforceable right of set-off'; the application of
simultaneous realization and settlement; the offsetting of collateral amounts and the unit of
account for applying the offsetting requirements. However, the amendments are not expected to
have a material impact on the Company’s financial statements.
IAS 16 (Amendments) 'Property, Plant and Equipment' (effective for annual periods beginning on
or after 01 January 2016). The amendments clarify that a depreciation method that is based on
revenue that is generated by an activity that includes the use of an asset is not appropriate for
property, plant and equipment; and add guidance that expected future reductions in the selling
price of an item that was produced using an asset could indicate the expectation of technological
or commercial obsolescence of the asset, which, in turn, might reflect a reduction of the futureeconomic benefits in bodied in the asset. However, the amendments are not expected to have a material impact on the company’s financial statements.
IFRS 15 ‘Revenue from Contracts with Customers' (effective for annual periods beginning on or
after 01 January 2017). IFRS 15 provides a single, principles based five-step model to be applied
to all contracts with customers. The five steps in the model are: identify the contract with the
customer; identify the performance obligations in the contract; determine the transaction price;
allocate the transaction price to the performance obligations in the contracts; and recognize
revenue when (or as) the entity satisfies a performance obligation. Guidance is provided on
topics such as the point in which revenue is recognized, accounting for variable consideration,
costs of fulfilling and obtaining a contract and various related matters. New disclosures about
revenue are also introduced. The management of the Company is in the process of evaluating the
impacts of the aforesaid standard on the Company’s financial statements.
IFRS 13 ‘Fair value Measurement' (effective for annual periods beginning on or after 01 January
2015). This standard aims to improve consistency and reduce complexity by providing a precise
definition of fair value and a single source of fair value measurement and disclosure
requirements for use across IFRSs. The requirements, which are largely aligned between IFRSs
and US GAAP, do not extend the use of fair value accounting but provide guidance on how it
should be applied where its use is already required or permitted by other standards within IFRSs
or US GAAP. This standard is not expected to have a material impact on the Company’s financial
statements.

Annual Report 2014 | 20
g)
h) Functional and presentation currency
2.2 Staff retirement benefits
The financial statements are presented in Pak Rupees, which is the Company's functional and
presentation currency.
The Company operates an un-funded gratuity scheme for all employees with qualifying service period
of two years. Provisions are made annually to cover the obligations under the scheme on the basis of
an actuarial valuation. The most recent valuation was carried out as at 30th September 2014 using the
"Projected unit credit method".
The amount recognized in balance sheet represents the present value of the defined benefit obligation
as on 30th September, 2014 as adjusted for unrecognized actuarial gains and losses.
The company has applied IAS 19 (as revised in 2011) retrospectively in accordance with IAS 8
"Accounting policies, Changes in Estimates and Errors". The change has resulted in an increase in Staff
retirement benefits and deferred tax asset by amounts mentioned below.
The amendments in IAS 19 require the recognition of changes in defined benefit obligation and fair
value of plan asset when they occur thus eliminating 'Corridor Approach' permitted under previous
version of IAS 19 thus accelerating recognition of past service cost. All actuarial gains and losses are
recognized immediately through 'Other Comprehensive Income'.
There are other standards and amendments to published approved standards that are
mandatory for accounting periods beginning on or after 01 October 2014 but are considered not
to be relevant or do not have any significant impact on the Company's financial statements and
are therefore not detailed in these financial statements.
Standards and amendments to published approved standards that are not yet effective and not
considered relevant to the Company
IFRIC 21 'Levies' (effective for annual periods beginning on or after 01 January 2014). The
interpretation provides guidance on when to recognize a liability for a levy imposed by a
government, both for levies that are accounted for in accordance with IAS 37 'Provisions,
Contingent Liabilities and Contingent Assets' and those where the timing and amount of the levy
is certain. The interpretation identifies the obligating event for the recognition of a liability as the
activity that triggers the payment of the levy in accordance with the relevant legislation.
However, the interpretation is not expected to have a material impact on the Company’s
financial statements.
On 12 December 2013, IASB issued Annual Improvements to IFRSs: 2011 – 2013 Cycle,
incorporating amendments to four IFRSs more specifically in IFRS 13 ‘Fair Value Measurement',
that is considered relevant to the Company's financial statements. These amendments are
effective for annual periods beginning on or after 01 October 2014. These amendments are
unlikely to have a significant impact on the Company's financial statements and have therefore
not been analyzed in detail.
On 12 December 2013, IASB issued Annual Improvements to IFRSs: 2010 – 2012 Cycle,
incorporating amendments to seven IFRSs more specifically in IFRS 8 'Operating Segments', IFRS
13 ‘Fair Value Measurement' and IAS 16 ‘Property, Plant and Equipment', which are considered
relevant to the Company's financial statements. These amendments are effective for annual
periods beginning on or after 01 October 2014. These amendments are unlikely to have a
significant impact on the Company's financial statements and have therefore not been analyzed
in detail.

21 | Annual Report 2014
2.3
2.4
September 30,
2013
32,880
5,235
38,115
Taxation
Current
Deferred
Property, plant and equipment
Staff retirement benefit payable- restated (Note 7.2)
Staff retirement benefit payable as previously reported
Effect of change in accounting policy
Net effect of change in accounting policy recognized in unappropriated profit is Rs.5.235 million.
Further the change in accounting policy has resulted in recognition of experience adjustment in OCI of
Rs.5.375 million.
The net deferred tax asset is increased by amount Rs.1.832 million however the Company does not
recognize deferred tax asset as matter of prudence. (Note 7.1)
Provision for taxation is based on taxable income for the year determined in accordance with the
prevailing law for taxation of income. The charge for current tax is calculated using prevailing tax rates
or tax rates expected to apply the profit for the year if enacted. The charge for the current tax also
includes tax credits and tax rebates available, if any.
Deferred tax liability is accounted for using the balance sheet liability method in respect of all taxable
temporary differences at the balance sheet date arising from difference between the carrying amount
of the assets and liabilities in the financial statements and corresponding tax bases used in the
computation of taxable profit. Deferred tax assets are generally recognized for all deductible
temporary differences, unused tax losses and tax credits to that extent it is probable that taxable profit
will be available in future against which the deductible temporary differences, unused tax losses and
tax credits can be utilized.
Deferred tax is calculated at the rates that are expected to apply to the period when the differences
reverse based on tax rates that have been enacted or substantively enacted by balance sheet date.
Deferred tax is charged or credited in the income statement, except in the case of items credited or
charged to equity in which case it is included in other comprehensive income.
Property, plant and equipment except freehold land are stated at cost less accumulated depreciation
and impairment loss, if any. Freehold land is stated at cost.
Depreciation is charged by applying the reducing balance method over its estimated useful life at the
rates specified in note 13.
Depreciation is charged on additions during the year from the month in which assets become available
for use while no depreciation is charged from the month of deletion/disposal.
The assets residual value and useful lives are reviewed to ensure that the methods and period of
depreciation charged during the year are consistent with the expected pattern of economic benefits
from the assets. Appropriate adjustments are made if the impact of depreciation is significant.
Normal repairs are charged to income as and when incurred. Major overhauling, renovations,
rehabilitation, renewals and improvements are capitalized and assets so replaced, if any, are retired.
Gains and losses on disposal of fixed assets are taken to profit and loss account.

Annual Report 2014 | 22
2.5 Capital work in progress
2.6 Stores, spares and loose tools
2.7 Stocks-in-trade
2.8
a) Trade debts and other receivables
b) Cash and cash equivalents
c) Borrowings
Capital work in progress is stated at cost less any identified impairment loss. All expenditure connected
with specific assets incurred during installation and construction period are carried under capital work
in progress. These are transferred to specific assets as and when these assets are available for use.
Financial Instruments
All the financial assets and financial liabilities are recognized at the time when the Company becomes a
party to the contractual provisions of the instruments and are remeasured at fair value. Any gain/loss
on de-recognition and on remeasurement of such financial instruments other than investments
available for sale, is included in the profit/loss for the period in which it arises.
Trade debts and other receivables are carried at original invoice amount less an estimate made
for doubtful debt balances based on review of all outstanding amounts at the year end. Bad
debts are written off when identified.
Cash and cash equivalents comprise of cash in hand and at banks on current, saving and deposit
accounts and other short term highly liquid instruments that are readily convertible into known
amount of cash and which are subject to insignificant risk of changes in values.
Loans and borrowings are recorded at the proceeds received. Financial cost is accounted for on
the accrual basis and is reported under accrued finance cost to the extent of unpaid. Borrowing
costs directly attributable to the acquisition, construction or production of qualifying assets,
which are assets that necessarily take a substantial period of time to get ready for their intended
use or sale, are added to the cost of those assets, until such time as the assets are substantially
ready for their intended use or sale. All other borrowing costs are charged to income in the
period in which these are incurred.
These are valued at lower of cost and net realizable value. Cost is calculated using moving average
method except for items in transit which are valued at cost comprising invoice value plus other charges
paid thereon till the balance sheet date. Provision is made against obsolete items and slow moving
stores and spares based on management's estimate.
Stock of raw materials, work-in-process and finished goods, except for those in transit, are valued
principally at the lower of weighted average cost and net realizable value. Cost of work-in-process and
finished goods comprises cost of direct materials, labour and appropriate manufacturing overheads.
Cost of own produced molasses, a by product, is determined on the basis of monthly average cost of
molasses purchased from third parties.
Stock of raw material and finished goods purchased for sale/process are valued at weighted average cost.
Materials in transit are stated at cost comprising invoice values plus other charges paid thereon.
Net realizable value signifies the estimated selling price in the ordinary course of business less costs
necessary to be incurred in order to make a sale. Provision is made in the financial statements for
obsolete and slow moving stock in trade based on management's estimate.

23 | Annual Report 2014
d) Trade and other payables
e) Provisions
2.9 Impairment
a)
b)
2.10 Off Setting of financial assets and financial liabilities
2.11 Revenue recognition
2.12 Related party transactions
Liabilities for trade and other amounts payable are carried at cost which is the fair value of the
consideration to be paid in the future for goods and services.
The carrying amounts of the Company's assets are reviewed at each balance sheet date to
determine whether there is any indication of impairment. If such indication exists, the
recoverable amount of such asset is estimated. An impairment loss is recognized wherever the
carrying amount of the asset exceeds its recoverable amount. Impairment losses are recognized
in profit and loss account. A previously recognized impairment loss is reversed only if there has
been a change in the estimates used to determine the asset's recoverable amount since the last
impairment loss was recognized. If that is the case, the carrying amount of the asset is increased
to its recoverable amount. That increased amount cannot exceed the carrying amount that
would have been determined, net of depreciation, had no impairment loss been recognized for
the assets in prior years. Such reversal is recognized in profit and loss account.
Financial assets and financial liabilities are offset and the net amount is reported in the balance sheet,
when there is a legally enforceable right to set off the recognized amounts and the Company intends
to either settle on net basis or to realize the asset and settle the liability simultaneously.
Corresponding income on assets and charge on liability is also offset.
Revenue from sales is recognized when significant risks and rewards of ownership have been to the customer such as dispatch/delivery of goods at fair consideration received or receivable.
transferred
Return on deposits is accrued on a time proportion basis by reference to the principal outstanding and
the applicable rate of return.
Provisions are recognized when the Company has a legal and constructive obligation as a result
of past events and it is probable that an outflow of resources will be required to settle these
obligations and a reliable estimate of the amounts can be made.
Financial assets
A financial asset is considered to be impaired if objective evidence indicates that one or more
events had a negative effect on the estimated future cash flow of that asset.
An impairment loss in respect of a financial asset measured at amortized cost is calculated as a
difference between its carrying amount and the present value of estimated future cash flows
discounted at the original effective interest rate. An impairment loss in respect of available for
sale financial asset is calculated by reference to its current fair value.
Individually significant financial assets are tested for impairment on an individual basis. The
remaining financial assets are assessed collectively in groups that share similar credit risks
characteristics.
Non-Financial assets
Transactions between the Company and a related party are measured at arm’s length rates
determined in accordance with the Comparable Uncontrolled Price Method.
Annual Report 2014 | 24
2.13 Foreign currency translations
2.14 Segment reporting
2.15 Contingencies
2.16 Allocation of segment expenses
2.17 Dividends and other appropriations
The Company has disclosed contingent liabilities for the pending litigation and claims against the
company based on its judgment and the advice of the legal advisors for the estimated financial
outcome. The actual outcome of these litigations and claims can have an effect on the carrying
amounts of the liabilities recognized at the balance sheet date. However, based on the best judgment
of the Company and its legal advisors, the likely outcome of these litigations and claims is remote and
there is no need to recognize any liability at the balance sheet date.
All identifiable expenses are directly attributed to the respective segments. The jointly incurred
expenses of sugar and allied segments are allocated on the basis of segment revenues.
Dividend distribution to the Company's shareholders is recognized in the company's financial
statements in the period in which the dividends are declared and other appropriations are recognized
in the period in which these are approved by the Board of Directors.
Segment reporting is based on the operating (business) segments of the Company. An operating
segment is a component of the Company that engages in business activities from which it may earn
revenues and incur expenses, including revenues and expenses that relates to the transactions with any
of the Company's other components. An operating segment's operating results are reviewed regularly
by the Chief Executive Officer to make decisions about resources to be allocated to the segment and
assess its performance, and for which discrete financial information is available.
Segment results that are directly attributable to a segment as well as those that can be allocated on a
reasonable basis. Those income, expenses, assets, liabilities and other balances which can not be
allocated to a particular segment on a reasonable basis are reported as unallocated.
The Company has two reportable business segments. Sugar (white refine sugar), ethanol and its by
products.
Transaction among the business segments are recorded at arm's length prices using admissible
valuation methods. Inter segment sales and purchases are eliminated from the total figures.
Transactions in foreign currency are accounted for in Pak rupees at the rates of exchange prevailing at
the date of transaction. Monetary assets and liabilities in foreign currencies are translated at rates of
exchange prevailing at the balance sheet date and in case of forward exchange contracts at the
committed rates. Gains or losses on exchange are charged to income.

25 | Annual Report 2014
Note 2014 2013
3 ISSUED, SUBSCRIBED AND PAID UP CAPITAL
64,020,000 (2013: 64,020,000) Ordinary shares of Rupees 10
each fully paid in cash 640,200 640,200
35,000,000 (2013: 35,000,000) Ordinary shares of Rupees 10
each issued as fully paid for consideration other than cash 350,000 350,000
990,200
990,2004 LONG TERM FINANCES
Long term finance from commercial banks - secured
The Bank of Punjab 4.1 143,750 191,667
Faysal Bank Limited 4.2 - 37,500 KASB Bank Limited - DF II 4.3 39,375 91,875 Pak Oman Investment Company Limited 4.4 18,750 43,750 The Bank of Punjab 4.5 -
86,696
201,875 451,488 Loan from related parties
Sponsors' loan-Unsecured 4.6
11
285,400
253,000
487,275 704,488Less:
Current portion shown under current liabilities (58,125)
(179,557)Liabilities directly associated with non-current assets - held for sale 4.7 (143,750)
(137,348)
(201,875)
(316,905)
285,400
387,583
4.1
4.2
4.3
4.4
4.5
( Rupees in thousand )
This represents term finance facility obtained from the Bank of Punjab, as of 30 September 2014 only three
semi annual installments remained outstanding. It carries mark up at the rate of average 3 month KIBOR
plus 195 bps (2013: 3 month KIBOR plus 195 bps) per annum, with 11% floor and no cap. It is secured by
way of 1st exclusive charge over present and future current and fixed assets of the Company (Phalia
project) with 25% margin and personal guarantee of a sponsor director.
This represents term finance facility of Rupees 250 Million obtained from Faysal Bank Limited. As of 30
September 2014 the loan has been fully repaid . It was carrying mark up at the rate of 6 month
KIBOR plus 300 bps (2013: 6 month KIBOR plus 300 bps) per annum. It was secured by way of 1st
pari passu charge on all present and future fixed assets of the Company and personal guarantee of a
sponsor director.
This represents demand finance facility (DF-II) of Rupees 210 million obtained from KASB Bank Limited, as of
30 September 2014 only three quarterly installments remained outstanding. It carries mark up at the rate of
6 month KIBOR plus 2.5% (2013: 6 month Kibor plus 2.5%) per annum. It is secured by way of ranking
charge over fixed assets of the Company with other senior creditors and personal guarantee of a sponsor
director.
This represents term finance facility of Rupees 100 Million obtained from PAK Oman Investment Company
Limited, as of 30 September 2014 only three quarterly installments remained outstanding. It carries mark
up at the rate of 3 months KIBOR plus 3.25% (2013: 3 month KIBOR plus 3.25%) per
annum. It is secured by way of personal guarantee and property located at Mouza Theter, Lahore of a
sponsor director.
This represents the last installment of loan of Rupees 247 million extended by Bank of Punjab which has
been fully repaid during the year. It was carrying mark up at the rate of average 3 month KIBOR plus 300
bps (2013: 3 month Kibor plus 300 bps) per annum. It was secured against existing charges as stated in note
4.1.

Annual Report 2014 | 26
4.7
Note 2014 2013
5
6 LIABILITIES AGAINST ASSETS SUBJECT TO DIMINISHING MUSHARAKA FINANCE
Balance as at October 01 - -
Obtained during the year 2,494 - Repayment during the year (125) -
2,369 - Payable within one year shown under current liabilities (499) -
1,870 -
ThisAs at September 30, 2014 thirty three monthly installments remained outstanding. Mark up will be charged at 6 month Kibor plus 3.5 percent per annum. These are secured against diminishing musharaka finance assetsand personal guarantee of a director. The Company has option to purchase the asset after expiry of diminishing musharaka finance period.
represents diminishing musharaka finance agreement with First Habib Modaraba for a term of three years.
This represents proportionate finances associated with assets held for sale/disposal acquired at the time of
purchase of those assets.
( Rupees in thousand )
Reconciliation of minimum payments under diminishing musharaka and their present value is given blow:
LONG TERM DEPOSITS - INTEREST FREE AND UNSECURED
This represents dealership advance and is to be adjusted at the time of cancellation/surrendering of
dealership.
Note 2014 2013
(Restated)7
7.1 - -
7.2 57,242 38,115
57,242 38,115
( Rupees in thousand )
Deferred income tax
Staff retirement benefits-Gratuity
DEFERRED LIABILITIES
Present value of
minimum
diminishingmusharaka
financepayments
musharakafinance
diminishing
Charges
allocated to
future periods
Minimum
diminishingmusharaka
financepayments
Present value of
minimum
diminishingmusharaka
financepayments
musharakafinance
diminishing
Charges
allocated to
future periods
Minimum
diminishingmusharaka
financepayments
Not later than one year 499
156
655
-
-
-
Later than one year but not later 1,870
109
1,979
-
-
-
than five years2,369 265 2,634 - - -
2014 2013
-----------------------(Rupees in thousand)-----------------------
4.6 This represents a loan extended by a commercial bank to sponsors of Rupees 175 million (2013: Rs.145
million) and the loan amount was re-lent to the Company at same mark up rate of 3 month Kibor plus 1.5
% (2013: 3 month Kibor plus 1.5%) per annum charged by the lending bank. The same loan has been
transferred in the name of the Company in the period subsequent to current balance sheet date and
carries profit at 1.5% per annum above respective KIBOR.The loan is scheduled to be repaid on December
31, 2015 and secured by ranking charge on current assets of the Company and personal guarantee of a
director. The amount includes a second loan extended by sponsor of Rs. 110.4 million (2013: Rs. 108
million). This loan is interest free and its repayment is not due in foreseeable future.
11

27 | Annual Report 2014
Note 2014 2013
7.2.3
Discount rate per annum for charge of interest cost in profit and loss account 11.5% 11.5%
Discount rate per annum for year end obligation 13.5% 11.5%
Expected rate of eligible salary increase per annum 12.5% 10.5%
Expected average remaining working life of employees 9 Years 11 Years
7.2.4 Charge to Profit & Loss Account for the year is as follows:
Current service cost 14,660 10,385Interest cost 4,383 3,305Actuarial loss - 155Liability charged due to amortization of transitional liability - 814
19,043 14,659
The principal assumption used in the actuarial valuation are as follows:
7.1 DEFERRED INCOME TAX
Deferred income tax comprises of the following temporary differences:
Deferred tax liability on taxable temporary
difference in respect of:
Accelerated tax depreciation 299,954 385,322
Deferred tax on deductible temporary
difference in respect of:
Available tax losses (1,200,993)
(971,284)
Provision for staff retirement benefits - gratuity (13,670)
(10,049)
(1,214,663)
(981,333)
(914,709) (596,011)Less:
Deferred tax asset not recognized 914,709 596,011
- -
7.2 STAFF RETIREMENT BENEFITS - Gratuity
Staff gratuity payable 7.2.1 57,242
38,115
57,242
38,115
7.2.1 Reconciliation of payable to defined benefit plan:
The amounts recognized in the balance sheet are as follows:
Present value of defined benefit obligation (PVDBO) 7.2.2 57,242
38,115
7.2.2 Movement in Present value of defined benefit obligation:
Opening balance of PVDBO as at October 01 38,115
28,738
Add:
Service cost recognized during the year 14,660
10,385
Interest cost for the year 4,383
3,305
Experience adjustments 5,375
-
62,533
42,428Less:
Benefits paid during the year (5,291)
(4,313)
Closing balance of PVDBO as at September 30 57,242
38,115
Deferred tax asset has not been recognized as a matter of prudence as its recoverability is not expected in
near future with reasonable certainty
( Rupees in thousand )

Annual Report 2014 | 28
7.2.5 Total remeasurement chargeable in Other Comprehensive Income is as follows:
Experience adjustments 5,375 -
5,375 -
8 TRADE AND OTHER PAYABLES
Creditors 864,750 671,099Advances from customers 317,458 183,854Accrued liabilities 29,639 32,439Income tax payable 24,672 7,847Sales tax payable 1,605 2,151Security deposits 372 526
Workers' profit participation fund 8.1 - 11,596Other payables 16,899 1,649
1,255,395 911,161
8.1 Workers' profit participation fund (WPPF)
Balance as on October 01 11,596 6,676Add: Allocation for the year - 11,596
11,596 18,272Less: Amount paid during the year (11,596) (6,676)
Balance as on September 30 - 11,596
9 ACCRUED FINANCE COST
Accrued finance cost on: - Long term finances 15,851 19,539
- Short term borrowings 33,795 30,652
49,646 50,191
10 SHORT TERM BORROWINGS - SECURED
From commercial banks 885,963 842,158
10.1 These represent cash finance, running finance, export refinance, bai-salam obtained from various banking
companies and are subject to mark up ranging from 7.5 % to 14.18 % per annum (2013: 9.20 % to 13.53 %
per annum). These are secured against pledge/hypothecation of stock-in-trade, charge on current assets,
demand promisory note, Company's performance guarantee and personal guarantee of a sponsor director.
Note 2014 2013( Rupees in thousand )
10.2
11 CURRENT PORTION OF LONG TERM LIABILITIES
12 CONTINGENCIES AND COMMITMENTS
12.1 Contingencies
12.2 Commitments
Under letter of credit partially secured against
charge on fixed assets of the Company
Liabilities against assets subject to diminishing musharaka finance
The aggregated amount of unavailed credit limits as at September 30,
Rupees 932.842 million).
Guarantees given to Sui Northern Gas Pipelines Limited by bank on behalf
at September 30, 2014 were for Rupees 46.4 million ( 2013: Rupees
imports issued to Director Excise and Taxation, Karachi were for
million)
Long term finances 58,125
499
58,624
-
2014 is Rupees 939.037
of the Company is outstanding
46.4 million) and Sindh Excise
Rupees 1.8 million (2013:
179,557
-
179,557
125,126
million (2013:
as
Duty on
Rupees 1.8

29 | Annual Report 2014
Operating fixed assets
At October 01, 2012
Cost 337,226
1,468,466
2,270,219
34,042
38,416 -
4,148,369
Accumulated depreciation -
323,864
411,377
11,301
20,929
-
767,471
Net book value 337,226 1,144,602 1,858,842 22,741 17,487 3,380,898
Year ended September 30, 2013
Opening net book value 337,226
1,144,602
1,858,842
22,741
17,487
-
3,380,898
Additions -
- - 547 19,247 - 19,794
Disposals/adjustment:
Cost -
-
196,211
-
-
-
196,211
Accumulated depreciation -
-
(44,387)
-
-
-
(44,387)
- - 151,824 - - - 151,824
Depreciation charge - 57,230 83,132 2,286 5,307 - 147,955
Closing net book value 337,226 1,087,372 1,623,886 21,002 31,428 - 3,100,914
13.1
At September 30, 2013
Cost 337,226 1,468,466 2,074,008 34,589 57,663 - 3,971,952
Accumulated depreciation -
381,094 450,122 13,587 26,235 - 871,038
Net book value 337,226
1,087,372
1,623,886
21,002
31,428
-
3,100,914
Year ended September 30, 2014
Opening net book value 337,226
1,087,372
1,623,886
21,002
31,428
- 3,100,914
Additions - 93 568 3,262 1,796 2,647 8,366
Disposals/adjustment:
Cost -
-
-
-
18,303
-
18,303
Accumulated depreciation -
- -
- -
- -
- (4,337)
-
(4,337)
13,966 - 13,966
Depreciation charge -
54,369 81,206 2,198 4,893 88 142,754
Closing net book value 337,226
1,033,096
1,543,248
22,066
14,365
2,559
2,952,560
At September 30, 2014
Cost 337,226
1,468,559
2,074,576
37,850
41,155
2,647
3,962,013
Accumulated depreciation - 435,463 531,328 15,785 26,791 88 1,009,455
Net book value 337,226 1,033,096 1,543,248 22,065 14,364 2,559 2,952,558
Annual rate of depreciation (%) - 5 5 10 20 20
13 PROPERTY, PLANT AND EQUIPMENT
Operating fixed assets
Capital work in progress
13.1
13.2
2,952,558
421,745
3,374,303
3,100,914
10,799
3,111,713
Note 2014
( Rupees in thousand )
2013
Owned Musharaka
----------------------------------------------(Rupees in thousand)-------------------------------------------------
Vehicles Particulars
Freehold
land
Building on
freehold land
Plant and
machinery
Furniture, fixture and equipment
Total
operating assets

Annual Report 2014 | 30
Note 2014 2013
13.1.1 The depreciation charge for the year has been allocated as follows:
Cost of sales 135,575 140,362
Administrative expenses 7,179 7,593
142,754 147,955
13.2 Capital work in progress
( Rupees in thousand )
Civil WorkPlant and
machineryTotal Civil Work
Plant and
machineryTotal
Opening as at October 01 - 10,799 10,799 - - -Additions during the year 3,902 407,044 410,946 - 10,799 10,799
Transferred to operating assets -
--
-
- - Closing balance 3,902
417,843
421,745
-
10,799
10,799
2014 2013
-----------------------(Rupees in thousand)-----------------------
13.3 Detail of disposal of properties, plant and equipment
CostAccumulated
depreciation
Written Down
Value
Sale
proceeds
Land cruiser (YW-414) 16,147 3,552 12,595 14,801 Negtiation Ch.Muhammad Saleem (Canal Bank Road, Faisalabad)
Honda Civic (LEA-12-4114) 2,156 785 1,371 1,750 Negtiation Honda City Sales (Kalima Chowk, Lahore)
2014 18,303
4,337
13,966
16,551 2013 -
-
-
-
(Rupees in thousands)
Particulars PurchaserMode of
disposal
Note 2014 2013
14 STORE, SPARES AND LOOSE TOOLS
Stores 158,513 117,519Spares 98,684 69,735Loose tools 12,800 14,383
269,997 201,637
14.1 The Company does not hold any stores for specific capitalization.
14.2 There are no stores, spares and loose tools in transit as at September 30, 2014 (2013: Nil).
15 STOCKS IN TRADE
Raw materials - molasses - 35,707
Work in process
-Sugar 2,184 1,803-Molasses 152 16,700
2,336 18,503
Finished goods-Sugar 112,397 339,568
-Ethanol 28,405 178,950
140,802 518,518
By-products 35,907 -
179,045 572,728
( Rupees in thousand )

31 | Annual Report 2014
15.1
16 TRADE DEBTS comprise of the followings:Unsecured
Local- Considered good 13,110
-
Secured
Foreign-letter of credits 113,488
-
126,598
-
-
17 ADVANCES, DEPOSITS, PREPAYMENTS AND OTHER RECEIVABLES
Advances - considered good 17.1 253,914
274,613
Advance income tax 17.2 102,877
79,001
Security deposits 25,611
4,810
Guarantee/LC margin deposits 13,090
8,553
Other receivables 17.3 75,515
74,510
471,007
441,487
17.1
17.2 Advance Income Tax is made up as follows:
Opening balance 79,001 47,889
Add: Tax deducted during the year 23,956 68,458
117,518 116,347 Less: Transferred to profit and loss account (14,641) (37,346)
102,877 79,001
17.3
18 CASH AND BANK BALANCES
Cash with banks:
- current accounts 46,315 8,283- saving accounts 8,387 17
54,702 8,300
18.1
19
151,824 151,824
NON-CURRENT ASSETS - HELD FOR SALE
Assets at written down value
Stocks amounting to Rupees 179.045 million (2013: Rupees 572.728 million) are pledged with lenders assecurity against short term borrowings as referred to in note 9.
It includes advances given to sugarcane growers of Rupees 29.677million (2013: Rupees 12.810 million)which are recoverable from growers against supplies to be made in the subsequent period and to suppliersand contractors of Rupees 34.056 million (2013: Rupees 31.734 million). It also includes Rupees 100 millionpaid for purchase of property after obtaining court s’ consent decree which is presently under executionwith the same court. The property shall be disposed off after it is taken over.
These also include L/C margin deposited with banks against letter of credit for import of machinery andspare parts of Rupees 82.245 million (2013: Rupees 122.909 million).
These include income tax rebate receivable of Rs. 67.550 million available under the Income Tax Ordinance,
2001 for companies acquiring new plant and machinery.
It includes foreign currency accounts with balances of US Dollars 866.75 equivalent to Pak Rupees 88,971.89
(2013: US Dollars 866.75)
This represents assets held for sale/disposal. These assets are being replaced by more advanced energy
efficient technology. The assets are carried at lower of their carrying amount and fair value less cost to sell.realizable value of held for sale assets is higher than their carrying value.
Note 2014 2013( Rupees in thousand )
Add: Prior year adjustment - excess provision reversed 14,561
13.1

20 SALES-net
Annual Report 2014 | 32
Sugar Ethanol Total Sugar Ethanol Total
Gross Sales
Local 4,054,754
100,375
4,155,129
5,304,801
301,757
5,606,558
Export -
1,464,107
1,464,107
-
2,069,524
2,069,524
Inter-segment 424,154
- - 639,280 - -
4,478,908
1,564,482
5,619,236
5,944,081
2,371,281
7,676,082
Less: Sales tax and federal excise duty 300,559
14,643
315,202
393,172
42,241
435,413
Commission to selling agents 5,229
-
5,229
5,590
151
5,741
305,788
14,643
320,431
398,762
42,392
441,154
Net Sales 4,173,120
1,549,839
5,298,805
5,545,319 2,328,889 7,234,928
For the year ended
September 30, 2014
For the year ended
September 30, 2013
Note
(Rupees in thousand) (Rupees in thousand)
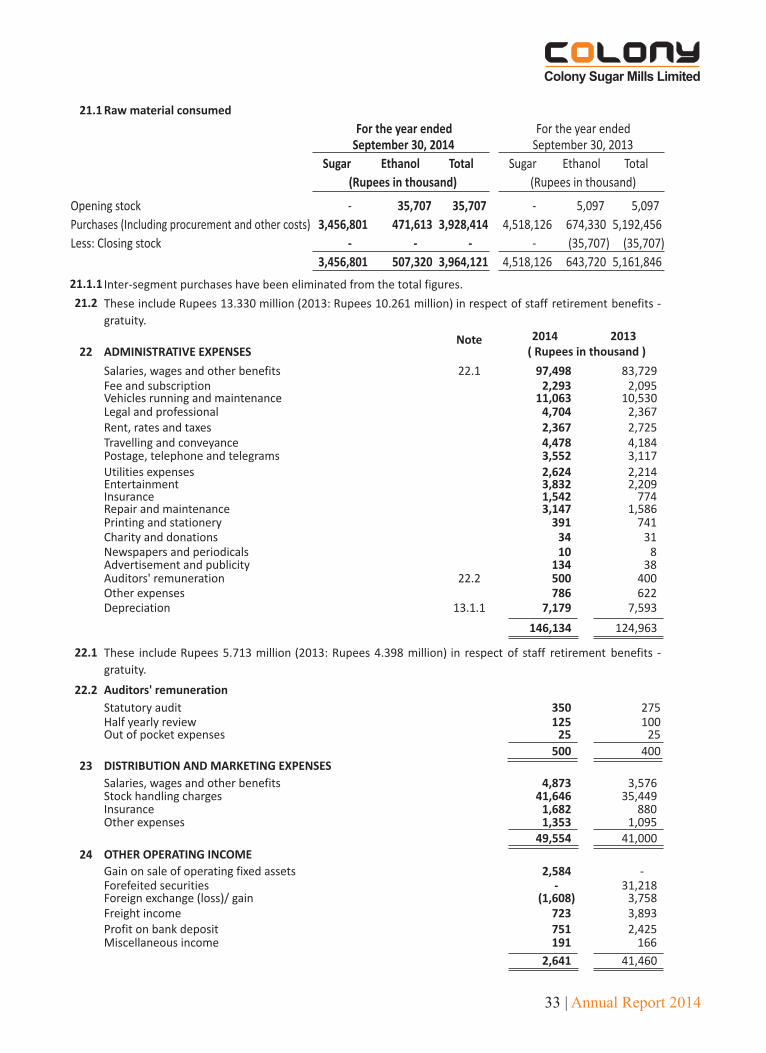
Raw Material consumed 21.1 3,456,801
507,320
3,964,121
4,518,126
643,720
5,161,846
Inter-segment transfers - 424,154 - - 639,280 -
3,456,801 931,474 3,964,121 4,518,126 1,283,000 5,161,846
Salaries, wages and other benefits 21.2 139,825
33,397
173,222
138,784
28,865
167,649
Fuel and power 25,921
91,068
116,989
16,830
128,038
144,868
Chemicals consumed 23,117
29,625
52,742
24,487
50,659
75,146
Packing material consumed 37,572
-
37,572
40,004
-
40,004
Oil and lubricants 11,329
14,930
26,259
17,773
1,418
19,191
Stores and spares consumed 87,269
57,191
144,460
106,428
52,775
159,203
Repair and maintenance 9,053
5,255
14,308
6,992
1,628
8,620
Insurance 14,286 3,604 17,890 6,139 1,489 7,628
Vehicles running and maintenance 5,816
1,117
6,933
5,446
2,331
7,777
Other manufacturing expenses 628
-
628
673
-
673
Depreciation 13.1.1 81,345
54,230 135,575 97,237 43,125 140,362
3,892,962
1,221,891 4,690,699 4,978,919 1,593,328 5,932,967
Work In Process
Opening Stock 1,803
16,700
18,503
1,957
-
1,957
Closing Stock (2,336)
- (2,336) (1,803) (16,700) (18,503)
(533) 16,700 16,167 154 (16,700) (16,546)
Cost of goods produced 3,892,429 1,238,591 4,706,866 4,979,073 1,576,628 5,916,421
Finished Goods
Opening Stock 339,568 178,950 518,518 641,667 577,569 1,219,236
Closing stock (148,304) (28,405) (176,709) (339,568) (178,950) (518,518)
191,264 150,545 341,809 302,099 398,619 700,718
4,083,693 1,389,136 5,048,675 5,281,172 1,975,247 6,617,139
20.1 Intersegment sales have been eliminated from the total figures.
21 COST OF SALES
33 | Annual Report 2014
21.1.1 Inter-segment purchases have been eliminated from the total figures.
21.2
Note 2014 201322
Salaries, wages and other benefits 22.1 97,498 83,729Fee and subscription 2,293 2,095Vehicles running and maintenance 11,063 10,530Legal and professional 4,704 2,367Rent, rates and taxes 2,367 2,725Travelling and conveyance 4,478 4,184Postage, telephone and telegrams 3,552 3,117Utilities expenses 2,624 2,214Entertainment 3,832 2,209Insurance 1,542 774Repair and maintenance 3,147 1,586Printing and stationery 391 741Charity and donations 34 31Newspapers and periodicals 10 8Advertisement and publicity 134 38Auditors' remuneration 22.2 500 400Other expenses 786 622Depreciation 13.1.1 7,179 7,593
146,134 124,963
22.1
22.2 Auditors' remuneration
Statutory audit 350 275Half yearly review 125 100Out of pocket expenses 25 25
500 40023 DISTRIBUTION AND MARKETING EXPENSES
Salaries, wages and other benefits 4,873 3,576Stock handling charges 41,646 35,449Insurance 1,682 880Other expenses 1,353 1,095
49,554 41,00024 OTHER OPERATING INCOME
Gain on sale of operating fixed assets 2,584 -
Forefeited securities - 31,218Foreign exchange (loss)/ gain (1,608) 3,758Freight income 723 3,893Profit on bank deposit 751 2,425Miscellaneous income 191 166
2,641 41,460
These include Rupees 5.713 million (2013: Rupees 4.398 million) in respect of staff retirement benefits -
gratuity.
These include Rupees 13.330 million (2013: Rupees 10.261 million) in respect of staff retirement benefits -
gratuity.
( Rupees in thousand )ADMINISTRATIVE EXPENSES
Sugar Ethanol Total Sugar Ethanol Total
Opening stock - 35,707 35,707 - 5,097 5,097
Purchases (Including procurement and other costs) 3,456,801 471,613
3,928,414
4,518,126
674,330
5,192,456
Less: Closing stock - - - - (35,707) (35,707)
3,456,801 507,320 3,964,121 4,518,126 643,720 5,161,846
For the year ended September 30, 2014
For the year ended September 30, 2013
(Rupees in thousand) (Rupees in thousand)
21.1 Raw material consumed

Annual Report 2014 | 34
Chief Executive
Officer
Director Executives TotalChief
Executive
Officer
Director Executives Total
Managerial remuneration 2,182 955 13,717 16,854 1,789 712 6,850 9,351Rent and utilities - 334 5,936 6,270 - 285 3,492 3,777Medical 218
143
1,525
1,886
179
71
685
935
2,400
1,432 21,178 25,010 1,968 1,068 11,027 14,063
Number of Persons 1 1 18 20 1 1 10 12
For the year ended September 30, 2013For the year ended September 30, 2014
Particulars
------------------(Rupees in thousand)--------------
Note 2014 2013
25 FINANCE COST
Financial charges on:
- Long term finances 54,457 97,534
- Diminishing musharaka finance 50 -
- Short term borrowings 126,378 151,022
Bank charges, commission and excise duty 2,733 1,217
183,618 249,773
26 PROVISION FOR TAXATION
Provision for taxation comprises of:
Current tax:
- Current year 26.117.2
7.1
(14,641) (37,346)
- Prior year - excess provision reversed 14,561 -
(80) (37,346)
Deferred tax:
- Current year - -
Income tax rebate - 67,550
(80) 30,204
26.1
26.2
27 EARNINGS PER SHARE
27.1 Basic earnings per share
(Loss) / Profit after taxation Rupees (131,990) 262,121
Weighted average number of ordinary shares Numbers 99,020 99,020
Earning per share - Basic Rupees (1.33) 2.65
27.2 Diluted earnings per share
There is no dilution effect on the basic earnings per share as the Company has no such commitments.
( Rupees in thousand )
Current year's provision of Income tax has been made under section 154 of the income tax ordinance 2001on export sales.
No numeric tax rate reconciliation is given in these financial statements as provisions made during the
current and preceding years represent final tax on export sales under section 154 of the Income Tax
Ordinance, 2001.
28 REMUNERATION OF CHIEF EXECUTIVE OFFICER, DIRECTORS AND EXECUTIVES

35 | Annual Report 2014
28.1
29
In addition to the above, certain executives are also provided with Company maintained cars in accordance
with their entitlements.
TRANSACTIONS WITH RELATED PARTIES
The Company in the normal course of business carries out transactions with related parties which comprise
of directors and key management personnel. Remuneration of Chief Executive Officer is disclosed in Note
No. 28. Other significant transactions with related parties is as follows: 2014 2013
35,600 5,000
68,000 108,000
285,400 253,000
Loan from Sponsors Loan repaid
Loan received
Outstanding balance
( Rupees in thousand )
PARTICULARS NATURE OF TRANSACTION
Sugar Ethanol Total Sugar Ethanol Total
Revenue
Local and export 17 3,748,966
1,549,839
5,298,805
4,906,039
2,328,889
7,234,928
Inter-segment 17 424,154
-
-
639,280
-
-
4,173,120 1,549,839 5,298,805 5,545,319 2,328,889 7,234,928
Segment expenses
Cost of sales - Intersegment 18 - 424,154 - - 639,280 -
- External 18 4,083,693
964,982
5,048,675
5,281,172
1,335,967 6,617,139
4,083,693
1,389,136
5,048,675
5,281,172
1,975,247
6,617,139
Gross profit 89,427
160,703
250,130
264,147
353,642
617,789
Administrative expenses 19 (131,521)
(14,613) (146,134) (113,360) (11,603) (124,963)
Distribution and marketing expenses 20 (44,599)
(4,955) (49,554) (12,529) (28,471) (41,000)
Other operating income 3,526 (885) 2,641 2,591 38,869 41,460
Operating profit (83,167) 140,250 57,083 140,849 352,437 493,286
For the year ended
September 30, 2014
For the year ended
September 30, 2013 Note
( Rupees in thousand ) ( Rupees in thousand )
30 BUSINESS SEGMENT INFORMATION
Sugar Ethanol Total Sugar Ethanol Total
Segment assets 3,239,233 1,388,243 4,627,476 3,487,700 999,989 4,487,689
Segment liabilities 1,972,523 845,367 2,817,890 1,964,041 576,837 2,540,878
Capital expenditures 8,366
-
8,366
19,794
-
19,794
Capital work in progress 402,863
18,882
421,745
10,799
-
10,799
Depreciation on property, plant and equipment 86,292 56,463 142,755 102,537 45,418 147,955
September 30, 2014 September 30, 2013
( Rupees in thousand ) ( Rupees in thousand )
30.1 Inter-segment sales and purchasesInter-segment sales and purchases have been eliminated from total figures.
30.2 Reconciliation of reportable segment assets and liabilities

Annual Report 2014 | 36
31 FINANCIAL INSTRUMENTS AND RELATED DISCLOSURES
31.1 Financial risk factors
(a) Market risk
(i)
(ii) Other price risk
(iii)
The Company's activities expose it to a variety of financial risks: market risk (including currency risk, other
price risk and interest rate risk), credit risk and liquidity risk. The Company's overall risk management
programme focuses on the unpredictability of financial markets and seeks to minimize potential adverse
effects on the financial performance.
Risk Management is carried out by the Board of Directors (the Board). The Board provides principles for
overall risk management, as well as policies covering specific areas such as currency risk, other price risk
credit risk and liquidity risk.
The Company has no significant long-term interest bearing assets. The Company's interest rate risk
arises from long term finances and short term borrowings. Borrowings obtained at variable rates
expose the Company to cash flow interest rate risk. Borrowings obtained at fixed rate expose the
Company to fair value interest rate risk. The Company has no fixed interest rate borrowings.
Currency risk
Currency risk is the risk that the fair value or future cash flows of a financial instrument will fluctuate
because of the changes in foreign exchange rates. Currency risk arises mainly from future
commercial transactions or receivables and payables that exist due to transactions in foreign
currencies.
The Company is exposed to currency risk arising from various currency exposures, primarily with
respect to the United States Dollar (USD). The Company's foreign exchange risk exposure is
restricted to the amounts receivable/payable from/to foreign entities. However, there is no
exposure to currency risk at the year end.
Other price risk represents the risk that the fair value of future cash flows of a financial instrument
will fluctuate because of changes in market prices (other than those arising from interest rate risk or
currency risk), whether those changes are caused by factors specific to the individual financial
instruments or its issuer, or factors affecting all similar financial instruments traded in the market.
The Company is not exposed to commodity price risk.
Interest rate risk
This represents the risk that the fair value or future cash flows of a financial instrument will fluctuate
because of changes in market interest rates.

37 | Annual Report 2014
2014 2013
Fixed rate instruments
Financial assets
8,387 17
Fair value sensitivity analysis for fixed rate instruments
Floating rate instruments
Financial liabilities
Long term finances 489,644 704,488
Short term borrowings 885,963 842,158
(b) Credit risk
Trade debts 126,598 -
Advances, deposits, prepayments and other receivables 217,093 168,739
Bank balances 54,702 8,300
Sensitivity analysis
The trade debtors of the Company comprise of local debtors of white refine sugar and allied
products and foreign debtors of ethanol. The majority of the sales to customers are made on
advance receipt mechanism i.e. value of goods is received in advance. Credit sales are only made to
trusted parties/dealers and credit risk for each customer is established based on past experience
with the customer. Exports sales are secured through letter of credits.
At the balance sheet date the interest rate profile of the Company's interest bearing financial
instruments was:
( Rupees in thousand )
Bank balances-saving accounts
The Company does not account for any fixed rate financial liabilities at fair value through profit or
loss. Financial assets represent saving accounts as detailed above. A change in interest rate at the
balance sheet date would not materially affect profit or loss of the Company.
Credit risk represents the risk that one party to a financial instrument will cause a financial loss for
the other party by failing to discharge an obligation. The carrying amount of financial assets
represents the maximum credit exposure. The maximum exposure to credit risk at the reporting
date was as follows:

Annual Report 2014 | 38
(c) Liquidity risk
Contractual maturities of financial liabilities as at 30th September, 2014
Carrying
Amount
Contractual
Values
Less than
One Year
One to
Five Years
More than
Five Years
Non derivate financial liabilities
Long term deposits 80,000 80,000 80,000 --
Short term borrowings 885,963 998,693 998,693 - -
Trade and other payables 937,937 937,937 937,937 - -
Accrued finance cost 49,646
49,646
49,646
-
-
2,363,190 2,601,608 2,213,664 387,944 -
Contractual maturities of financial liabilities as at 30th September, 2013
Carrying
Amount
Contractual
Values
Less than
One Year
One to
Five Years
More than
Five Years
Non derivate financial liabilities
Long term finances 704,488 840,388 354,966 485,422 -
Short term borrowings 842,158 1,069,785 1,069,785 - -
Trade and other payables 727,307 727,307 727,307 - -
Accrued finance cost 50,191
50,191 50,191
-
-
2,324,144 2,687,671 2,202,249 485,422 -
Liquidity risk is the risk that the Company will not be able to meet its financial obligations as they fall
due. Management closely monitors the Company's liquidity and cash flow position. This includes
maintenance of balance sheet liquidity ratios, debtors and creditors concentration both in terms of
the overall funding mix and avoidance of undue reliance on large individual customer.
The Company manages liquidity risk by maintaining adequate reserves and borrowing facilities, by
continously monitoring forecast and actual cash flows and matching the maturity profiles of financial
assets and liabilities.
The Company has at its disposal unavailed credit facilities of Rs. 939.037 million (2013: Rs. 932.842
million) and cash and cash equivalents of Rs. 54.702 million (2013: Rs. 8.300 million) to further reduce
its liquidity risk.
-----------------------(Rupees in thousand)-----------------------
-----------------------(Rupees in thousand)-----------------------
Long term finances 489,644 535,332 227,388 307,944 -

39 | Annual Report 2014
Debt-to-adjusted capital ratio
31.2 Fair values of financial assets and liabilities
2014 2013
31.3 Financial instruments by categories
As at September 30
Assets as per balance sheetTrade debts 126,598 -
-
Advances, deposits, prepayments and other receivables 217,093 168,739
Cash and bank balances 54,702 8,300
Liabilities as per balance sheet
Long term deposits 80,000
Deferred liabilities 57,242 38,115
Short term borrowings 885,963 842,158
Trade and other payables 937,937 727,307
Accrued finance cost 49,646
50,191
31.4 Capital risk management
The debt to adjusted capital ratio as at year ended 30th September 2014 and 30th September 2013 is as follows:
2014 2013
Borrowings 1,375,607 1,546,646
Less: Cash and cash equivalents 54,702 8,300
Net debt 1,320,905 1,538,346
Total equity 1,809,586 1,941,576
Adjusted capital 3,130,491 3,479,922
42% 44%
The Company is not subject to any externally imposed capital requirements.
The Company's objectives when managing capital are to safeguard the Company's ability to continue as a
going concern in order to provide returns for shareholders and benefits for other stakeholders and to
maintain in optimal capital structure to reduce the cost of capital.
Consistently with others in industry and the requirements of the lenders, the Company monitors the capital
structure on the basis of debt to adjusted capital ratio. The ratio is calculated as net debt divided by
adjusted capital. Net debt is calculated as total debt (as shown in the balance sheet) less cash and cash
equivalents. Adjusted capital comprises all components of equity (i.e share capital and reserves) plus net
debt.
( Rupees in thousand )
The carrying values of all financial assets and liabilities reflected in financial statements approximate their
fair values. Fair value is determined on the basis of objective evidence at each reporting date.
Loans and Advances
( Rupees in thousand )
Financial liabilities at amortized cost
The contractual cash flows relating to the above financial liabilities have been determined on the
basis of interest rates/mark up rates effective as at 30th September. The rates of interest /markup
have been disclosed in Note 4, 7 and 9 to these financial statements.
Long term finances 487,275 704,488
-Liabilities against assets subject to diminishing musharaka finance 2,369

Annual Report 2014 | 40
34 DATE OF AUTHORIZATION OF ISSUE
35 GENERAL
36 CORRESPONDING FIGURES
Figures have been rounded off to the nearest thousand unless otherwise stated.
Previous year's figures have been rearranged, wherever necessary for the purpose of comparison. However,
no significant re-arrangement has been made in these financial statements.
These financial statements were authorized for issue on January 08, 2015 by the Board of Directors of the
Company.
32 CAPACITY AND PRODUCTION2014 2013
Sugar
Plant capacity on the basis of operating days M. Tons 1,297,500 1,414,500
Actual Crushing M. Tons 836,931 1,057,447Actual Production M. Tons 78,273 101,063
Ethanol
Liters 31,000,000 33,875,000
Liters 21,260,418 26,936,431
The low production was due to limited availability of raw material and routine plant maintenance.
Phalia 735,000 M.Tons (2013: 825,000 M.Tons) and Mian Channu
562,500 M.Tons (2013: 589,500 M.Tons)
Rated capacity on the basis of operating working
Actual production (E.N.A., E.N.A. Anhydrous & B-Grade)
days (E.N.A., E.N.A. Anhydrous & B-Grade)
Chief Executive Officer Director
33 NUMBER OF EMPLOYEES
Number of employees at year end 983 821
Average number of employees during the year 902 870

41 | Annual Report 2014
Financial Highlights
Share capital
Unappropriated profit
Non current liabilities
Current liabilities
Non current assets
Current assets
Turnover
Gross profit
Operating profit
(Loss) / Profit before taxation
(Loss) / Profit after taxation
Production Data
Cane crushed (M.Tons)
Sugar Produced (M.Tons)
Ethanol produced (Litres)
2014
(Rupees in Thousand)
990,200
694,490
752,148
2,795,196
3,380,898
1,851,136
5,940,236
638,638
503,260
126,848
159,747
1,073,317
101,147
35,739,986
990,200
534,743
1,115,471
2,446,480
3,515,925
1,570,969
5,483,297
661,232
528,268
120,312
65,711
732,910
63,873
25,356,131
990,200
469,032
1,225,243
2,050,349
3,343,051
1,391,773
4,749,066
653,905
547,011
132,172
118,051
640,547
55,269
23,646,464
990,200
350,981
1,510,347
1,983,804
3,344,118
1,491,214
4,009,320
1,086,249
945,159
353,575
309,105
688,030
64,736
13,522,468
2013 2012 2011 2010 2009
990,200
951,376
425,698
2,120,415
3,111,713
1,375,976
7,234,928
617,789
493,286
231,917
262,121
1,057,447
101,063
26,936,431
990,200
819,386
424,512
2,393,378
3,374,303
1,253,173
5,298,805
250,130
57,083
(126,535)
(126,615)
836,931
78,273
21,260,418

Annual Report 2014 | 42
Pattern of ShareholdingAs at September 30, 2014
388568257399972826167854451231112111112111111111
1211111
1,854
1101501
10015001
10001150012000125001300013500140001450015000155001600016500170001800019000195001
100001105001120001135001180001185001200001255001270001295001345001375001420001475001
1435001
489500149000017910001921500197100019890001
15435001
100500
10005000
10000150002000025000300003500040000450005000055000600006500070000750008500095000
100000105000110000125000140000185000190000205000260000275000300000350000380000425000480000
1440000
490000049050007915000922000097150009895000
15440000
15,059153,292202,499981,346792,639351,369474,273382,721194,501259,514186,175179,324200,000265,642
57,500127,585199,361
75,00083,00093,000
200,000101,000109,500125,000138,176181,491375,989201,500257,912271,203300,000350,000378,000423,550477,654
1,436,148
4,900,0009,801,6407,911,4399,219,6179,714,0769,890,098
15,439,41199,020,000
Number ofShareholders From To
Shareholdings Total Shares held
2 1850001 1855000 3,707,7041 2370001 2375000 2,374,2651 3010001 3015000 3,010,4131 3805001 3810000 3,810,0001 1810001 3815000 3,810,0511 4830001 4835000 4,830,363

INDIVIDUALS
FINANCIAL INSTITUTIONS / MODARABAS /
INSURANCE COMPANIES
JOINT STOCK COMPANIES
MUTUAL FUNDS
OTHERS
TOTAL
Categorial Pattern of ShareholdingAs at September 30, 2014
1,791
6
32
1
5
1,854
Categories ofShareholders
Number ofShareholders
PENSION FUNDS ETC. 18
INVESTMENT COMPANIES 1
79,757,859
86,526
18,486,880
378,000
4,639
99,020,000
80.55
0.09
18.67
0.38
0.00
100.00
Number ofShares Held Percentage
305,900 0.31
196 0.00
43 | Annual Report 2014

Pattern of Shareholding (Additional Information)
Under Code of Corporate Governance as at September 30, 2014
Directors, CEO, and their spouses and minor children:
Mr. Naveed M. SheikhMr. Waqar Ibn Zahoor BandeyMs. Samina GulMr. Muhammad AsgharMian Muhamamd AliMr. Ahmed Haji MussaMr. Asad AliMrs. Aasiya Naveed SheikhIbrahim Naveed Sheikh
Executives
Associated Compaines, Undertakings & related parties
Mutual Funds 378,000 0.38
Joint Stock Companies
Banks, Finance Institutions, Insurance Companies,Modarabas and Pension Funds etc.
Others
Public
Total:
Shareholding 5% and More
M/s. Colony Mills LimitedMr. Mashal Kamran KhanMs. Eesha Naveed SheikhMs. Noreen M. SheikhMs. Izza Naveed Sheikh
65,861 10,252
1,000 1,000 1,000 1,000 1,000
3,810,413 3,010,413
9,714,076
-
392,622
4,639
63,141,844
99,020,000
15,862,961 9,219,617 9,714,076 9,890,098 7,911,439
0.07 0.01 0.00 0.00 0.00 0.00 0.00 3.85 3.04
9.81
-
0.40
0.00
63,77
100.00
16.02 9.31 9.81 9.99 7.99
Shareholding Percentage
There has been no trading of shares by CEO, Directors, CFO and Company Secretary, their spouse andminor children.
18,486,880 18.67
Public Sector Companies & Corporation - -
Annual Report 2014 | 44
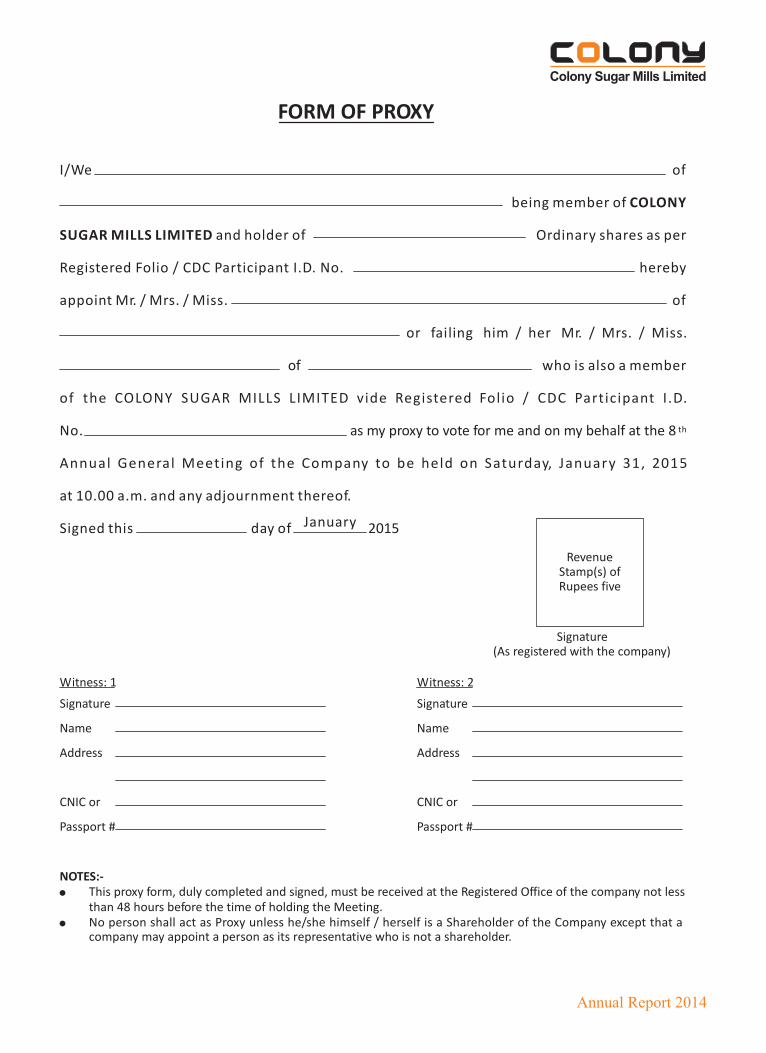
Annual Report 2014
I/We
SUGAR MILLS LIMITED and holder of
Registered Folio / CDC Participant I.D. No.
appoint Mr. / Mrs. / Miss.
NOTES:-This proxy form, duly completed and signed, must be received at the Registered Office of the company not less than 48 hours before the time of holding the Meeting.No person shall act as Proxy unless he/she himself / herself is a Shareholder of the Company except that a
Signature
Name
Address
CNIC or
Passport #
Witness: 1
Signature
Name
Address
CNIC or
Passport #
Witness: 2
Signature(As registered with the company)
RevenueStamp(s) ofRupees five
FORM OF PROXY
of
being member of COLONY
Ordinary shares as per
hereby
of
or failing him / her Mr. / Mrs. / Miss.
who is also a member
of the COLONY SUGAR MILLS LIMITED vide Registered Folio / CDC Participant I .D.
No.
Annual General Meeting of the Company to be held on Saturday, January 31, 2015
at 10.00 a.m. and any adjournment thereof.
Signed this
of
as my proxy to vote for me and on my behalf at the 8 th
day of 2015
company may appoint a person as its representative who is not a shareholder.
January
