final may 2012 sigle pages - crieff expressed in the state bank of india monthly review are not...
TRANSCRIPT

hlreview
May 2012
SBI
THE BANKER TO EVERY INDIAN
GOLD Consumption
and its Impact on
Indian
Economy
GOLD Consumption
and its Impact on
Indian
Economy

Highlights of Previous IssuesFebruary 2012
THE BANKER TO EVERY INDIAN
Livestock Dairy Animal Sector - Retrospects and Prospects
Dr. C. L. Dadhich
Shri P. C MeenaHon. Secretary, Indian Society of Agricultural Economics, Mumbai
Scientist, National Academy of Agricultural Research Management, Hyderabad
Litigation Managementin Banks Some Positive Thoughts
Shri Syamjith. PLaw Officer, SBI, SARB, Chennai
Book Review: Hacking Work (Breaking Simple Rules for Smart Results) by Bill Jensen and Josh Klein
Reviewed by Shri Sandeep BhardwajManager (Research) State Bank Academy, Gurgaon
Extent of Price and Production Risk in Crop Gross Revenue Risk
Shri Sumit JainResearch Associate (Finance) National Institute of Bank Management, Pune
Low-Carbon Growth in a Fragile Decade for the World Economy
Prof. Nicholas SternIG Patel Professor & Director India Observatory, LSEChair of the Grantham Research Institute on Climate Change and the Environment London School of Economics and Political Science
Ensuring Food Security through the 'Right to Food'
Dr. Yogesh SuriAdviser (Development Policy), Planning Commission, Government of India
Legal Decisions on Banking Shri M.ManoharanManager (Law), Law Department, SBI, LHO, Chennai
Europe's Crisis can Hurt India Dr. Brinda JagirdarGeneral Manager & Head Economic Research Dept, State Bank of India Mumbai
Union Budget 2012-13 Prepared by Economic Research DepartmentState Bank of India, Corporate Centre Mumbai
March 2012
April 2012Inclusive FinancialInnovation Shri Krishna Kumar
Managing Director & Group Executive (National Banking) State Bank of India
Shri D.SubramaniAssistant General Manager, CPC State Bank of India, Bangalore (LHO)
Legal Decisions on Banking Shri J. VenugopalAGM (Law), Law Department, SBI, CC, Mumbai
FY 2011, FY 2012 and FY 2013 Economic Outlook
Book Review - Growth with Financial Stability : Central Banking in an Emerging Market by Rakesh MohanOxford University Press pp: liii+500
Review by
Dy. Manager (Economist), ERD, SBI, MumbaiShri Sumit Jain
End to End Approach in Reshaping Operating Models in Banking
Shri Yasuo YamamotoSenior Economist, Mizuho Research Institute Limited

State Bank of India Monthly Review May 2012
SBI Monthly Review Editorial Committee
Views expressed in the State Bank of India Monthly Review are not necessarily those of the State Bank of India or its Associates.
1. Dr.Brinda Jagirdar GM, ERD, SBI, CC, Mumbai
2. Shri S.D.Kelkar DGM, Law Dept, SBI, CC, Mumbai
3. Shri Atul Kumar DGM, Vigilance Dept, SBI, CC
4. Dr.A.R.Chansarkar AGM (Economist), ERD, SBI, CC, Mumbai
5. Shri V.S. Dikshit Chief Manager, ERD, SBI, CC, Mumbai
6. Shri Bharat B Sharma Chief Manager, ERD, SBI, CC, Mumbai
7. Shri M.Ramachandran Asst.Manager (Systems), ERD, SBI, CC, Mumbai
8. Shri Sumit Jain Dy. Manager (Economist), ERD, SBI, CC, Mumbai
From the Chairman's Desk Shri Pratip ChaudhuriChairmanState Bank of India, Mumbai
India, Russia & China: A Comparative Analysis from the Field
Mr. Morten DyrmosePh.D. Candidate in Economics School of Economics & Finance University of St Andrews United Kingdom
Legal Decisions on Banking Shri Syamjith PLaw OfficerState Bank of India, SARB, Chennai
Gold Consumption and its Impact on Indian Economy
03
09
19
25
Dr. Brinda Jagirdar
Shri Sumit Jain
General Manager & Head Economic Research Dept. State Bank of India Mumbai
Dy. Manager (Economist), ERD, SBI, Mumbai
THE BANKER TO EVERY INDIAN

Owner - State Bank of India
Economic Research Department
Corporate Centre, State Bank Bhavan
Madame Cama Road, Post Box No. 12
Mumbai - 400 021
Printer and Publisher
Mr. Milind Yalsangikar
For Angle Advertising
41/3, ‘Shanti Sadan’, Tarte Colony, Erandwane
Opp. Jivanjyot Mandal School, Karve Road, Pune-411 004
Phone : 020 2542 0001 / 2, Mobile: 09850986560,
Email : [email protected]
THE BANKER TO EVERY INDIAN

Monthly Review I May 2012
03
Dear Shareholders,
It gives me great pleasure to place before you the
highlights of your Bank's performance during the
financial year 2011-12. Details of the achievements and
initiatives taken by your Bank are provided in the Annual
Report for the year.
Economic Overview
The global growth environment has remained challenging due
to the Euro zone sovereign debt crisis, volatile oil prices and fragile
growth in most countries. Though India's GDP growth in FY’12 was
one of the best in the world, there are concerns about the state of the
economy. Inflation has moderated but remains above tolerance levels and
growth has slowed perceptibly. The high twin deficits namely current account
deficit and fiscal deficit, combined with elevated inflation, particularly food
inflation, pose risks to growth. In this milieu, India's GDP has slowed to 6.5% in
FY'12 after growing at 8.4% in FY'11.
From the Chairman's Desk
Shri Pratip ChaudhuriChairmanState Bank of India, Mumbai
State Bank of India
04
Bank's Financial Performance
Against the backdrop of a challenging environment, I am happy to announce that Net
Profit of your Bank increased by 41.66% from ` 8,265 crores in FY'11 to
` 11,707 crores in FY'12, one of the highest net profits earned by any corporate in the
country. Operating Profit for your Bank crossed ` 30,000 crores mark, rising by
24.62% to ` 31,574 crores in FY'12 from ` 25,336 crores in FY'11, indicating that
core operations remain robust.
Your Bank consolidated gains on the income side by recording a robust increase in
Net Interest Income. In particular, Interest Income on Advances rose by 35.18%
from ̀ 59,976 crores in FY'11 to Rs 81,078 crores in FY'12. Interest income of your
Bank increased by 30.87% in FY'12 against a growth of 14.65% in FY'11 while
growth in interest expenses stood at 29.39% in FY'12. Fee income also recorded a
rise of 4.56% in FY'12. Consequently, Net Interest Income increased by 33.10% to
` 43,291 crores in FY'12. However, reflecting market conditions, non-interest
income showed a decline of 9.31% due to the loss of ̀ 920 crores on account of sale
of domestic equity and bonds.
On the other hand, with lower reliance on bulk deposits, interest paid on deposits
showed a smaller increase of 28.70% from ` 43,235 crores in FY'11 to ` 55,644
crores in FY'12. More importantly, the quarterly movement in income parameters
shows that the last year has witnessed a constant and consistent up trend, leading to
enduring results.
Due to a prudent and market driven approach, your Bank is able to lend profitably
and borrow at a reasonable cost which is clearly shown by the strong Net Interest
Margin (NIM) of 3.85% in FY'12, up from 3.32% in FY'11. This performance is
remarkable because your Bank has the lowest Base Rate in the industry, so, clearly
we have the trust of the people as we strive to be 'The Banker to Every Indian'. I can
proudly say that not only have we outperformed our guidance but also your Bank's
domestic NIM at 4.17% is remarkable as it ranks at the very top among its peers.
You will be happy to see that revenue growth has significantly outstripped growth in
expenses. Staff expenses, which have largely been contained after full provisions for
current wages and superannuation expenses, rose by 11.59% from ̀ 15,213 crores in
FY'11 to ̀ 16,974 crores in FY'12. Due to consolidated improvement all round, total
provisions also increased by only 16.37% from ` 17,071 crores in FY'11 to
` 19,866 crores in FY'12.
Asset Quality
Along with robust growth, your Bank has ensured that asset quality is maintained. As
of end-March'12, Gross NPAs of your Bank stood at 4.44%. Net NPAs, that had
risen to 2.22% in December'11 also fell below the psychological threshold of 2% to
Monthly Review I May 2012
05
1.82%. What adds to our strength is that your Bank's Provision Coverage Ratio
improved to 68.10% in March'12 from 64.95% in March'11, reflecting our abundant
prudence and caution.
Further, out of total Restructured Standard Assets of ̀ 37,168 crores outstanding on
the books of your Bank as on 31st March 2012, only ` 6,010 crores are in the NPA
category, so the risk is well contained.
Our improved performance in respect of NPAs has been possible due to our
committed and focused efforts. You will be happy to see that we have reduced our
NPAs but increased provisioning as a prudent measure. One reason for the low level
NPAs is all-out efforts made by your Bank to step up recovery. This has also been
helped by the fact that your Bank has revived the modular structure and posted
DGMs at modules for closer supervision and monitoring. Going forward, our
endeavour is to keep the NPA levels as low as possible.
Capital structure
I am happy to announce that the Capital Adequacy Ratio for your Bank increased
from 11.98% in March'11 to 13.86% in March'12. Specifically, the Tier-1 Capital
Adequacy Ratio, which is the bedrock of a bank's strength, rose from 7.77% to
9.79% during this period.
This turnaround has been helped firstly, by improved internal generation and plough
back of profits. A second reason is the ` 7,900 crores capital infusion by the
Government at the end of March 2012. Finally, the huge effort made by your Bank in
terms of optimising capital has paid off.
Let me point out here that while capital infusion happens only once in 3-4 years, as a
good corporate citizen, your Bank discharges its duties diligently and is among the
highest tax payers in the country every year. Including income tax and service tax,
the total tax paid by your Bank rose from ̀ 7,329 crores in FY'10 to ̀ 7,647 crores in
FY'12.
Deposits and Advances
You will be glad to see that deposits of your Bank rose from ` 9,33,933 crores in
March'11 to ` 10,43,647 crores in March'12, a growth of 11.75%. I would like to
draw your attention to the fact that not only have we grown our deposits, but the
quality of your Bank's deposit growth is very good. In time deposits, we have
stopped taking bulk deposits and CDs and instead focused on increasing our stable
term deposits portfolio. In a scenario where other banks offer higher interest on
savings bank deposits, your Bank's Savings Bank deposits increased by 11.27%
from ̀ 3,23,394 crores in March 2011 to ̀ 3,59,847 crores in March 2012.

State Bank of India
06
This was made possible through our efforts to deliver value to all our Savings Bank
customers through multi-city cheques, doing away with minimum balance
requirement, large number of ATMs and providing accident insurance for savings
bank account holders.
Let me point out that overall CASA ratio declined from 48.52% in March'11 to
46.64% in March'12, a decrease of 188 bps, but this is still well above the CASA
ratios other banks strive to achieve.
Gross Advances of your Bank recorded a yoy growth of 15.78% from ` 7,71,802
crores in March'11 to ̀ 8,93,613 crores in March'12. Credit deposit ratio (domestic)
at 78.5% as at the end of March'12 was 220 bps higher than 76.3% at the end of
March'11.
Your Bank's advances remain well distributed across all verticals. Large Corporate
advances have grown from ` 1, 08,741 crores in March'11 to ` 1,25,023 crores in
March'12, registering a growth of 15%. Mid-Corporate Advances increased from
` 1, 57,566 crores to ̀ 1,67,639 crores, growing by 6.4%. In fact, I am happy to place
on record that your Bank has crossed a milestone of ` 1 lakh crore in agricultural
advances.
Retail advances grew 10.9% from ̀ 1,64,576 crores in March'11 to ̀ 1,82,427 crores
in March'12. Your Bank continues to be the No. 1 Home Loan provider with a 26%
market share. It also maintains its retail market leadership in car loan financing and
enjoys a market share of 17.51% as on March 2012.
Your Bank is also conscious of its responsibility towards the MSME segment which
provides employment to large numbers and contributes substantially to India's GDP
and exports. Advances under the SME Business Unit grew 17.40% from `1,39,470
crores in March'11 to ̀ 1,63,745 crores in March'12.
Dividend
I am happy to announce that the Board of Directors of your Bank has declared a
dividend of ̀ 35 per share (350%) for the year ended 31st March 2012.
New Initiatives
Ÿ The new product, 'Unfixed Deposits', introduced by your Bank for deposits of
7-180 days, with option to break the deposit any time without penalty, has been a
great success. With interest rate of 8-9%, this product is uniquely positioned to
attract short term funds and compete with liquid mutual funds, which offer
returns ranging from 8.8% to 9.5%.
Ÿ To promote trade finance, in March'11 your Bank launched a web-based portal,
e-Trade SBI, to provide access to trade finance services with speed and
efficiency. Presently, the e-trade platform has been introduced in all 6 CAG

Monthly Review I May 2012
07
Branches and 63 MCG Branches. As on 31st March'12, 393 corporates have
registered under e-Trade SBI.
Ÿ Your Bank is the market leader (market share around 25.55% as on March'11) in
SHG-Bank Credit Linkage programme having credit linked so far 20.65 lakh
SHGs and disbursed loans to the extent of ` 17,600 crores (cumulative) up to
March'12.
Ÿ To support the growing demand from the retail segment and tap the huge
potential available in the market, your Bank moved aggressively to create a
comprehensive electronic payment infrastructure to activate our 108 million
debit cards and has entered into Merchant Acquiring Business (MAB). It has, so
far, approved deployment of more than 28,000 POS terminals. The number of
transactions from these terminals rose from 2.62 lakh in March'11 to 10.19 lakh
in March'12.
Associates and Subsidiaries
Your Bank's footprints cover every facet of financial services through its Associates
and Subsidiaries, and I am happy to point out that all of your Bank's Associates and
Subsidiaries continued to show robust growth. During the year, gross premium of
SBI Life crossed the `13,000-crore mark and the company recorded a profit of
` 556 crores in FY'12, clocking an impressive YoY growth of 52% with the market
share of 19.9%. SBI Life received the NDTV Profit Business Leadership award for
organisational excellence for the second consecutive year. SBI Capital Markets Ltd.
ranked No. 1 Mandated Lead Arranger - Global Project Finance Loans by Dealogic
and posted a PAT of ` 251 crores during FY'12. SBI cards and Payment Services
reported after tax profit of ̀ 38 crores, up by a record 434%.
Your Bank has retained its leadership as Mandated Lead Arranger and Book Runner
for syndicated loans in Asia Pacific (excluding Japan but including Australia) in
FY'12 also. Remarkably, even in a competitive and challenging environment, your
Bank successfully completed 14 high value transactions during the year for
financing ECB requirements as well as acquisition related financing requirements
of Indian corporates aggregating USD 4,758 million.
You will be glad to see that the Operating Profit of Associate Banks increased from
` 7,569 crores in FY'11 to ̀ 8,214 crores in FY'12. I am happy to announce that all of
our subsidiaries are profitable and well capitalised.
Accolades
It is heartening that all our all efforts have received wide attention and appreciation.
SBI has been awarded the "Best Trade Finance Bank in India" Award for 2012 by
The Asian Banker.
State Bank of India
08
The year 2011-12 saw the CSR activities of the Bank scaling new heights of
achievement and glory with your Bank winning the prestigious Golden Peacock
Award for Corporate Social Responsibility 2012, awarded in Dubai by the Institute
of Directors, New Delhi.
Looking Ahead
The global economy remains fragile, but we hope the situation will improve. Though
the Euro zone sovereign debt crisis continues to dominate the financial landscape,
we are optimistic the global political leaders and regulators will be able to stem the
downslide. However, we need to be alert as in today's integrated world, global
shocks can get transmitted to the Indian economy. Twin deficits (current account
deficit and fiscal deficit) along with low growth and high inflation are the major
challenges for Indian economy in the year ahead.
The Indian banking scenario is encouraging and positive. Your Bank is expecting a
loan growth of 16% and a deposit growth of 20%. In the coming years, your Bank's
main thrust will be on retail, and, as shown by our achievements, we are well
positioned to meet the competition. Overall, your Bank will remain vigilant to the
new opportunities and challenges as the current economic environment warrants
greater prudence.
As we go forward, the Indian and global economic environment could remain
challenging for the next few years. Let me assure you that while remaining vigilant
to the new opportunities in this milieu, your Bank will act with the necessary
prudence as required.
With warm regards,
Yours sincerely,
(PRATIP CHAUDHURI)

Monthly Review I May 2012
09
Gold Consumption and its Impact on Indian Economy
Introduction
Indians have always had a yearning for gold and, according to the World Gold
Council, India is the world's largest consumer of gold. Importantly, India's gold
production continues to be minimal and almost all of India's demand for gold is
met by imports. Gold demand has not only remained high but has shown a sharp
rise in the recent period especially since 2001 as reflected in the increase in the
volume of imports. The demand has shown no signs of abating despite the
incessant price rise. Given that fact that much of this held as idle asset, one can
only quote Lord John Maynard Keynes who famously commented that India's
gold consumption reflects the 'ruinous love of a barbaric relic'.
Investment in Gold: Gold as a Safe Haven
Investment in gold has been perceived as 'safe haven' especially during periods of
financial and economic stress particularly inflation. A 'safe haven' can broadly be
defined as an asset that protects investors' wealth against financial turmoil.
Therefore, an asset with a stable real value or, at least a stable nominal value is an
uncontroversial safe haven, as it allows its holder to resell it without loss at any time
(Coudert & Raymond, 2010). Viewed from this aspect, gold possess almost all
characteristics essential to be classified as a safe haven.
1Dr. Brinda Jagirdar, GM & Head, and Shri Sumit Jain, Dy. Manager (Economist), Economic Research Department, State Bank of India, Corporate Centre, Mumbai.
Dr. Brinda Jagirdar General Manager & Head Economic Research Dept. State Bank of India Mumbai
1Shri Sumit JainDy. Manager (Economist), ERD, SBI, Mumbai
State Bank of India
10
During the last decade, volatility of gold prices has been higher than that of
sovereign bond markets but lower than riskier assets like equities and other
commodities (Mishra & Mohan, 2012). Over the years, the process of
financialisation of commodities has led to a far greater interest in gold as an
alternative asset. Investors take confidence from high liquidity through daily trading
in gold, which exceeds that of any sovereign's bond market with the exception of US
Treasuries. The rising share of bars and coins and gold ETFs (Exchange Traded
Funds) in total demand for gold is a sign of the financialisation of the commodity.
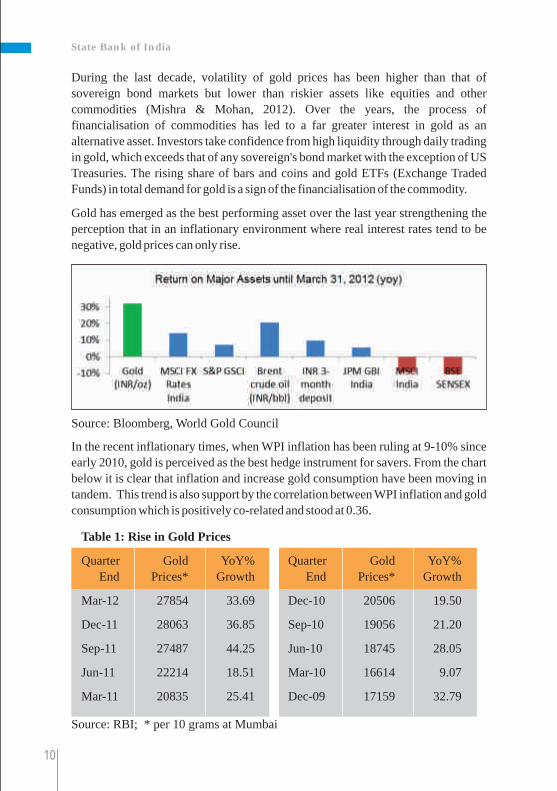
Gold has emerged as the best performing asset over the last year strengthening the
perception that in an inflationary environment where real interest rates tend to be
negative, gold prices can only rise.
Source: Bloomberg, World Gold Council
In the recent inflationary times, when WPI inflation has been ruling at 9-10% since
early 2010, gold is perceived as the best hedge instrument for savers. From the chart
below it is clear that inflation and increase gold consumption have been moving in
tandem. This trend is also support by the correlation between WPI inflation and gold
consumption which is positively co-related and stood at 0.36.
Table 1: Rise in Gold Prices
Quarter Gold YoY% Quarter Gold YoY%
End Prices* Growth End Prices* Growth
Mar-12 27854 33.69 Dec-10 20506 19.50
Dec-11 28063 36.85 Sep-10 19056 21.20
Sep-11 27487 44.25 Jun-10 18745 28.05
Jun-11 22214 18.51 Mar-10 16614 9.07
Mar-11 20835 25.41 Dec-09 17159 32.79
Source: RBI; * per 10 grams at Mumbai

Monthly Review I May 2012
11
Gold prices in India have seen a sharp spurt from ̀ 17,159 per 10 grams in December
2009 to ̀ 27,854 per 10 grams in March 2012. Incidentally, inflation, which stood at
7.15% in Dec09, started trending up persistently from here on towards 9-10%
levels. The spectacular rise in gold prices in the recent period can be attributed to
several factors (Mishra & Mohan 2012):
Ÿ During periods of geopolitical risks, commodities have a great appeal as safe
haven. The unrest in Libya and Middle East provided the initial impetus for its
rise in 2011.
Ÿ Measures like quantitative easing have weakened fiat money vis-a-vis
commodities in general and gold in particular. With US recovery remaining
fragile and European economies clearly slipping into a recession, there is
speculation of a third round of quantitative easing and fears over further
debasement of the US dollar, which further enhances the appeal of gold as a safe
haven.
Ÿ Gold has come to represent a safe haven in times of fall in risk appetite when
sovereign debt sustainability on both sides of the Atlantic is being questioned.
The political disagreement over how to address the large and growing
government debt particularly preventing the sovereign debt crisis in Europe
from escalating and breaking up the Euro zone, the resultant downgrade of USA,
Japan and several European countries by rating agencies has quickened the pace
of appreciation of gold. Some analysts and investors feel that in the current
muddled political and economic scenario, gold is the only "hard currency" left.

State Bank of India
12
Table 2: Composition of household savings in financial and physical assets
Period Financial Savings Physical Savings
1950s 24.7% 75.3%
1960s 33.4% 66.6%
1970s 37.6% 62.4%
1980s 49.9% 50.1%
1990s 54.9% 45.1%
2000s 47.2% 52.8%
2010-11 43.9% 56.1%
Source: RBI Handbook of Statistics on Indian Economy
As financial markets have developed, savings of the household sector in India have
come to be held in various financial instruments issued by intermediaries like banks,
financial institutions and the Government. However, besides savings in financial
instruments, households continue to have significant savings in physical assets like
gold, housing, real estate, etc.
With increasing financial intermediation and development of new institutions and
new products, there has been a decline in the share of savings in physical assets in the
total savings of the household sector from 75.3% in the 1950s to 52.3% in the 2000s.
However, this increased to 56.1% by 2010-11 due to poor performance of financial
assets in that year.
Gold consumption in India is around 20% of the physical savings in the country. In
India, households have traditionally purchased gold for marriages, social customs,
meeting unexpected exigencies, etc. In the national income accounting, such
purchases of gold are not treated as part of savings but are treated as consumption.
From the consumer's point of view, gold is seen as a highly liquid asset and even
though it does not earn any return to the holder it protects the wealth of the saver as
seen by the persistent and sharp upward movement in gold price. The drawback,
however, is that such purchases of gold result in savings remaining idle and not
available for productive investment.
Gold Consumption in India
According to the World Gold Council, India accounted for over a quarter of the
global gold purchase in 2011, lower than under one third in 2010. In calendar year
2011, Indians bought a total of 933.4 tonnes of gold worth $ 46.4 bn against 1006.3
India: Gold as a Savings Instrument

Monthly Review I May 2012
13
tonnes worth $ 39.9 bn in 2010 (Table 2). Hence, in value terms, Indians bought
16.3% more gold in 2011 despite of the fact that average price of gold in India was 230.7% higher in 2011 compared to 2010 .
Table 3: Gold Consumption in India
2010 2011 % Q1 Q1 %
Change 2011 2012 Change
Jewellery (in Tonnes) 657.4 567.4 -13.7 187.6 152.0 -19.0
Bars/Coins (in Tonnes) 348.9 366.0 4.9 103 55.6 -46.0
Total (in Tonnes) 1006.3 933.4 -7.2 290.6 207.6 -28.6
Total Value (in $ bn) 39.9 46.4 16.3 12.9 11.3 -12.4
Share in Global Purchase 31.3% 26.7% - 30.2% 24.2% -
Source: World Gold Council (Quarterly Reports)
Table 4: Gold Imports and CAD (in $ mn)
Year Gold Current Gold Import
Import Account Deficit as % of CAD
2001-02 4170 3400 82%
2002-03 3845 6345 165%
2003-04 6517 14083 216%
2004-05 10538 2470 23%
2005-06 10831 1102 10%
2006-07 14462 9565 66%
2007-08 16724 15737 94%
2008-09 20726 27914 135%
2009-10 28640 38383 134%
2010-11 33876 44281 131%
2011-12* 45500 53716 84%
Source: RBI * till Q3 (Apr-Dec 2011)
2 As per RBI data (Handbook of Statistics on Indian Economy), average price of gold per 10 grams in Mumbai stood at 23,872 in 2011 compared to 18,268 in 2010, higher by 30.7%.` `

State Bank of India
14
Rising gold imports to meet domestic demand saw a doubling in gold imports in four
years between FY09 and FY12 (Table). Interestingly, the sharp spike in gold imports
in FY11 and FY12 was against average inflation of 9.6% in FY11 and 8.8% in FY12,
suggesting that gold was seen as a hedge against inflation. After oil, gold is the
second largest item of imports. In fact, if gold imports are eliminated, the entire
current account deficit can be wiped out.
India's current account deficit which stood at 2.7% in FY'11 is expected to widen to
3.5% in FY'12 and one of the reasons is the sharp increase in gold imports which is
likely to be around $58 billion in FY'12 against $34 billion a year ago.
To curb the import of gold and contain the current account deficit, the Union Budget
2012-13 raised the basic customs duty on standard gold bars, gold coins and
platinum from 2% to 4% and on non-standard gold from 5% to 10%. Excise duty on
refined gold was also increased in from1.5% to 3%.
Following a national strike among jewellers, demand in both the jewellery and
investment sectors was affected as consumers and traders protested against the
implications of a change in the tax treatment of gold. Currency weakness and
volatility in the imported price of gold in rupee terms added to consumers' reluctance
to increase gold purchases, resulting in a significant decline in gold consumption in
Q1 2012.
Going forward, the second quarter could see a normalisation of investment demand
as consumers adjust to higher import taxes and bullion dealers rebuild their stocks.
Overall, India will continue to generate a significant proportion of consumer
demand given its strong cultural link with the metal but lower number of auspicious
days in the 2012 Hindu calendar could temper gold demand to some degree.
Impact of Gold Consumption on Household Savings and GDP
As discussed earlier, purchase of gold is treated as consumption not savings. In this
study we examine the impact of shifting gold out from physical savings and bringing
this into financial savings of households and its impact on domestic savings and
GDP. In this context, we have also examined the income elasticity of demand for
gold in India.

Monthly Review I May 2012
15
Table 5: Gold Consumption in India (Amount in $ bn)
Item 2010-11 2011-12
Q1 6.329 12.905
Q2 10.408 11.125
Q3 13.121 9.389
Q4 12.952 11.284
Fiscal Year 42.810 44.073
`/$ Exchange rate (End of Year) 44.60 50.88
Total Gold Consumption in Rs Cr 1,90,936 2,44,243
(=42.810* (=44.073*
44.60*100) 50.88*100)
Total Gold Consumption (% of GDP) 2.48% 2.53%
Gross Domestic Savings in ` Cr 2,481,931 2,673,653
of which: savings in financial assets 7,67,691 8,28,925
savings in physical assets 9,81,620 1,069,581
Share of gold in physical savings 19.9% 20.0%
GDP at current market prices in ` Cr 7,674,148 8,855,797
Gross Domestic Savings (% of GDP) 32.3% 30.0%
Source: World Gold Council and RBI
The table shows that total gold consumption in India (jewellery plus investment in
bars/coins) stood at 2.54% of GDP in 2010-11 and 2.40% of GDP in 2011-12. This is
investment in an idle asset. Therefore, if this could instead be channelized into
productive investment, we believe the positive impact on growth would be very
beneficial for the economy.
Scenario 1: If 100% of gold consumption in India can be moved into financial
savings, then gross domestic savings will increase to 34.8% of GDP (32.3% + 2.5%)
for 2010-11 and 32.53% (30% + 2.53%) in 2011-12. But this scenario is very
unrealistic since total consumption of gold comprises jewellery and investment in
bars/coins and given the strong affinity for gold jewellery it is not possible to convert
the entire consumption into investment.
Trends in household savings, gold consumption and GDP at current market price for
2010-11 and 2011-12 are given below:
State Bank of India
16
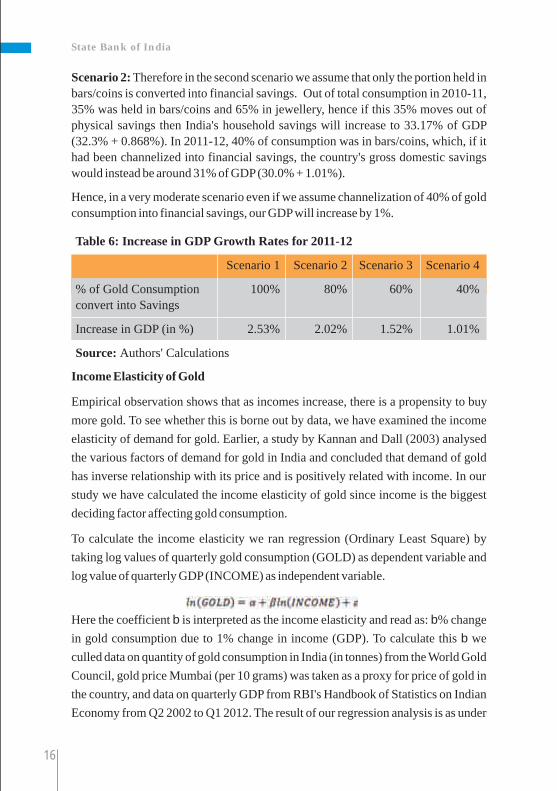
Scenario 2: Therefore in the second scenario we assume that only the portion held in
bars/coins is converted into financial savings. Out of total consumption in 2010-11,
35% was held in bars/coins and 65% in jewellery, hence if this 35% moves out of
physical savings then India's household savings will increase to 33.17% of GDP
(32.3% + 0.868%). In 2011-12, 40% of consumption was in bars/coins, which, if it
had been channelized into financial savings, the country's gross domestic savings
would instead be around 31% of GDP (30.0% + 1.01%).
Hence, in a very moderate scenario even if we assume channelization of 40% of gold
consumption into financial savings, our GDP will increase by 1%.
Table 6: Increase in GDP Growth Rates for 2011-12
Scenario 1 Scenario 2 Scenario 3 Scenario 4
% of Gold Consumption 100% 80% 60% 40%
convert into Savings
Increase in GDP (in %) 2.53% 2.02% 1.52% 1.01%
Source: Authors' Calculations
Income Elasticity of Gold
Empirical observation shows that as incomes increase, there is a propensity to buy
more gold. To see whether this is borne out by data, we have examined the income
elasticity of demand for gold. Earlier, a study by Kannan and Dall (2003) analysed
the various factors of demand for gold in India and concluded that demand of gold
has inverse relationship with its price and is positively related with income. In our
study we have calculated the income elasticity of gold since income is the biggest
deciding factor affecting gold consumption.
To calculate the income elasticity we ran regression (Ordinary Least Square) by
taking log values of quarterly gold consumption (GOLD) as dependent variable and
log value of quarterly GDP (INCOME) as independent variable.
Here the coefficient b is interpreted as the income elasticity and read as: b% change
in gold consumption due to 1% change in income (GDP). To calculate this b we
culled data on quantity of gold consumption in India (in tonnes) from the World Gold
Council, gold price Mumbai (per 10 grams) was taken as a proxy for price of gold in
the country, and data on quarterly GDP from RBI's Handbook of Statistics on Indian
Economy from Q2 2002 to Q1 2012. The result of our regression analysis is as under
Monthly Review I May 2012
17
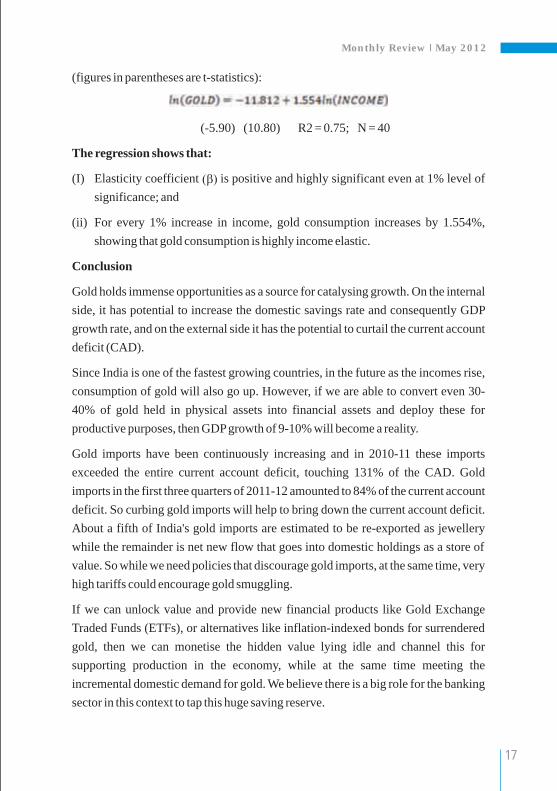
(figures in parentheses are t-statistics):
(-5.90) (10.80) R2 = 0.75; N = 40
The regression shows that:
(I) Elasticity coefficient (b) is positive and highly significant even at 1% level of
significance; and
(ii) For every 1% increase in income, gold consumption increases by 1.554%,
showing that gold consumption is highly income elastic.
Conclusion
Gold holds immense opportunities as a source for catalysing growth. On the internal
side, it has potential to increase the domestic savings rate and consequently GDP
growth rate, and on the external side it has the potential to curtail the current account
deficit (CAD).
Since India is one of the fastest growing countries, in the future as the incomes rise,
consumption of gold will also go up. However, if we are able to convert even 30-
40% of gold held in physical assets into financial assets and deploy these for
productive purposes, then GDP growth of 9-10% will become a reality.
Gold imports have been continuously increasing and in 2010-11 these imports
exceeded the entire current account deficit, touching 131% of the CAD. Gold
imports in the first three quarters of 2011-12 amounted to 84% of the current account
deficit. So curbing gold imports will help to bring down the current account deficit.
About a fifth of India's gold imports are estimated to be re-exported as jewellery
while the remainder is net new flow that goes into domestic holdings as a store of
value. So while we need policies that discourage gold imports, at the same time, very
high tariffs could encourage gold smuggling.
If we can unlock value and provide new financial products like Gold Exchange
Traded Funds (ETFs), or alternatives like inflation-indexed bonds for surrendered
gold, then we can monetise the hidden value lying idle and channel this for
supporting production in the economy, while at the same time meeting the
incremental domestic demand for gold. We believe there is a big role for the banking
sector in this context to tap this huge saving reserve.
State Bank of India
References
[1] Coudert, Virginie and Raymond-Feingold, Hélène (2010), "Gold and financial
assets: Are there any safe havens in bear markets?", CEPII.
[2] Handbook of Statistics on Indian Economy, Reserve Bank of India.
[3] K. Kanagasabapathy (2001), "A Technical Note on Savings and Savers as
Stakeholders", Reserve Bank of India.
[4] Kannan and Dall (2003), "India's demand for Gold: Some Issues for Economic
Development and macroeconomic policy", Indian Journal of Economics and
Business.
[5] Mishra and Mohan (2012), "Gold Prices and Financial Stability in India", RBI
Working Paper.
[6] World Gold Council, Reports on "Quarterly Gold Demand Trends"
(http:www.gold.org).
18

Monthly Review I May 2012
India, Russia & China: A Comparative Analysis from the Field
19
3Mr. Morten DyrmosePh.D. Candidate in EconomicsSchool of Economics & FinanceUniversity of St Andrews United Kingdom
India, Russia and China have in recent years undergone a remarkable transformation
through financial reforms and their increased emphasis on playing an active role on
the global political stage. Moreover, together with Brazil, they of course constitute
the much talked about BRIC group.
This comparative analysis is a product of my fieldwork in the above mentioned
countries. My research, at the University of St Andrews, Scotland, centres on the
globalisation of financial markets and took me from early August to mid-November
2011 to Russia (Moscow), India (Mumbai) and China (Shanghai) to meet experts
and opinion formers who could help me to understand better the functioning and
efficacy of financial markets in these countries.
I visited each country for two weeks and complemented my trips with further
conversations with local observers before and after each journey. Between the three
countries I had conversation with a total of 54 individuals who were kind enough to
share their in-depth knowledge with me.
This article touches upon some of the key findings that arose from my visits. For
comparison purposes, this brief overview will focus on Board Composition,
Information Flows, the Judicial Systems, the Stock Exchanges and the local
Financial Regulators.
3 The views expressed are personal

State Bank of India
20
Board composition
All three countries are increasingly recognising the importance of appointing
independent directors to boards.
In Russia the government is currently replacing state officials with independent
directors on the boards of state controlled companies, in an endeavour to improve
corporate governance. In many cases it may be questionable whether they are
actually independent. The nominees are often informally tied to the government.
However, it is a step in the right direction.
India’s Clause 49 (Sarbanes-Oxley Act inspired), which was introduced in 2001 by
the Securities and Exchange Board of India (SEBI), significantly raised the
corporate governance standards expected and required of Indian companies. It, for
example, stipulates that at least 50 percent of the board of directors should consist of
independent members, if the chairperson is a non-executive director. However, this
figure drops to one-third if the chairperson is a non-executive director. Such clear
requirements certainly represent a positive development and should help form future
norms in the board rooms.
In China independent directors are becoming more common in, but of the three
countries visited, it would seem China is currently the least proactive in this area.
Information flows
In India, information has been made almost completely freely available since the
liberalisation of the media in the 1990s. China and Russia, to some extent, have also
made significant progress in this regard, although on their own very specific terms.
Russian censorship of the press is evident in all their media; especially any medium
that reaches the wider population. As a result, TV news programmes are seen by the
public as listing the policy objectives of the Kremlin and not transmitting actual
impartial news i.e. it is a modern propaganda tool. However, the two main business
papers (Vedomosti and Kommersant) have a reputation for being quite independent
and objective. There are also some minor intellectual news sources that have
remained independent of governance influence. The Internet is also not censured and
is used by mainly one activist (Alexei Navalny) to publically highlight shortcomings
corporate governance practices. As noted by one interviewee, Russians have the
tools to become well informed but they have been very passive.
In China all types of media are heavily controlled and censored by the state; to the
extent that the Internet is policed and micro-managed by the state. However, the
Internet is increasingly becoming a forum for discussing corruption and poor
business ethics. Although key terms and phrases are banned/blocked on-line, locals
have been inventive in working around these general rules. When scandals are

Monthly Review I May 2012
21
widely disseminated on the Internet, the state normally takes action against the
alleged offenders. Although the Internet is subject to the "Great Firewall of China"
(the State filters all information flow to outside countries) it is possible to
circumvent this instrument by using software (fairly common among the younger
generations). Foreign companies can also access blocked sites from their offices
(using proxy servers) and mobile phones is instrument to access restricted material.
Despite the obvious restrictions on information flows, China has slowly become
more open in terms of allowing domestic Chinese news reach the foreign
community. For example, Shanghai now has the longest Metro network in the
world; it is clean, fast, with very affordable ticket prices and each station is listed and
announced in both Mandarin and English. However, during my stay there was an
accident in one of the railway lines. I read about the accident the following day
online (in an English newspaper). Only a few years ago, such an incident on a
prestige project would have taken weeks to reach international sources.
The Indian media is no longer restricted and there are currently a significant number
of political and corporate corruption scandals being widely published there. As
several interviewees noted, it is a healthy sign that these issues are coming to the
surface and being dealt with publically. The Right to Information Act of 2005, where
public authorities are required to release information requested by the public within
30 days, is widely praised for improving accountability and transparency in India.
Judicial system
In India, legal processes can be burdensome and at times subject to influence,
whereas in China compliance might be incomplete, but the rule of law is
unchallenged. By contrast, in Russia rapid transition, whilst conferring many
benefits, has resulted in an erosion of the primacy accorded to rule of law.
The India judiciary system is overstretched but it might be improving. There is a
considerable backlog of cases and the process is slow (a large number of frivolous
cases may have contributed to the current inertia). It has also been suggested that
corruption is a problem within the system.
In China the effectiveness and fairness of the judicial system, interestingly, varies
across the country. For example, one international company stated that they choose
Shanghai to base their China office over Beijing mainly due to the more business
friendly and fairer count system in Shanghai. You will find that almost all the
financial entities in mainland China are based in Shanghai. They seek to be at arm
length from the Government. On the other hand, industries dependent on political
goodwill (e.g. infrastructure firms) are based in Beijing. Notwithstanding this,
corruption is still a general problem within the Chinese judicial system.

State Bank of India
22
Legal accountability is a major concern in Russia. It permeates all aspects of
corporate activity and corporate governance; including minority shareholder rights.
Russian courts are notoriously unreliable (one high profile case has been IKEA's
struggle to circumvent extortion and corruption in Russia). One lawyer in Moscow
noted that allegedly all judges in Russia can be either bought or influence through
politicians. As a result, people who invest into Russia often use sale and purchase
agreements that are almost invariably under the English law structure and go through
London courts and Stockholm arbitration if required. President Medvedev is
credited by interviewees for 'saying all the right things'. However, they noted that no
action as such had been taken to mitigate the issues. Interviewees were also
concerned that if Prime Minister Putin were to be re-elected as President in March
2012 that political reforms would be either halted or reversed e.g. further
privatisation of State Enterprises. It later became clear that Medvedev and Putin had
agreed in private that Putin would in effect regain control of the Presidency in March
2012. Putin officially assumed the Presidency again on May 7, 2012.
Stock exchanges
Russia proactively merged its two main stock exchanges in December 2012, which
is seen as a positive development. China's government fully controls the flow of
companies listing and adjusts accordingly. In India the NSE has overtaken the BSE
in terms of credibility and momentum.
The merger of the MICEX and RTS stock exchanges is a part of Russia's endeavour
to turn Moscow into a world financial centre. Another link in this strategy is The
Moscow International Business Center (also known as 'the City'), which is an
impressive area of skyscrapers, reminiscent of Canary Wharf in London. Dubai,
Istanbul and Moscow are all competing for dominance as the financial centre in their
time zone.
In China the stock exchange listings are under the direct control of the government,
through the Chinese Security Regulatory Committee (CSRC). As such, they are used
to adjust economic growth. The government adjusts the flow of capital into the
financial markets according to their overall plan. The Shanghai and Shenzhen Stock
Exchanges are seen as quite credible entities. However, it has been suggested that
some companies bought their way onto the exchanges and subsequently closed
down, with individual shares holders losing their investments. There are some
positive signs of improvements; in 2010 a company got approval from CSRC and the
stock exchange to list. They received money from the investors, but the media
discovered a problem with the IPO. As a result, the listing was stopped and the
money was returned to the investors. It was the first time in China that investors had
been shielded from such financial irregularities.

Monthly Review I May 2012
23
The two dominant stock exchanges in India are the Bombay Stock Exchange (BSE)
and the National Stock Exchange (NSE). The BSE can trace its history back to the
1830s but it has really developed over the part 15 to 20 years. Scams were uncovered
from time to time at the BSE and the NSE has now over taken the BSE in terms of
importance. Interviewees noted that the NSE is making use of high-tech trading
solutions and has a robust settlement system. The regional stock exchanges have
almost disappeared and are now mostly agents for the NSE. The retail equity
participation has great potential for expansion. Today only around 4 percent of retail
investors participate in mutual funds or equity, compared with around 20 percent in
the early 1990s. Repeated crises and high market volatility due to the influx of
institutional investors after the opening of the Indian stock market to international
participation drove retail investors away from equity.
Financial regulators
Amongst Russia's main financial regulators, the Central Bank (regulates retail
banks) may be the most effective entity, although the Bank is ultimately controlled
by the Kremlin. China's regulators have a strong direct influence on the markets and
its participants. In India, the markets are regulated by the Securities and Exchange
Board of India (SEBI) and Reserve Bank of India (RBI) is the banking regulator and
both are held in high esteem.
The Indian regulators have a strong direct influence on market participants and the
financial markets are closely and well regulated. Notwithstanding this, market
participants seem generally happy with the level of regulations and their
implementation. The Indian government has set up a super-regulator, the Financial
Stability and Development Council (FSDC), which is tasked with coordinating the
activities of different regulatory bodies.
Chinese regulators have a strong influence on the markets and its participants.
Currently they are trying to reduce inflation (a significant concern at the moment) by
reducing lending. The cut in lending is achieved by setting quotas and by literately
calling up banks to tell them to stop all lending. This is in contrast the 11th five year
plan (2006 -2010) which focused on infrastructure investments. At that stage banks
were forced to lend funds to infrastructure related companies and, as a result, there
are now a considerable amount of bad loans on their balance sheets.
In Russia, the financial regulators are controlled by the government. They are still
developing and are operating in a somewhat challenging and hostile environment.
They recently introduced the Insider Trading Law, which is a milestone. However,
market participants see the law as being too encompassing (in terms of classifying
'insiders') but it was considered a necessary initiative.
State Bank of India
24
Concluding remarks
Russia is still in a transition period moving from a planned economy to a more
market orientated economy. It has made significant progress over the past ten years,
but interviewees note that there is still a long way to go. Russia has undoubtedly
great potential. As one interviewee mentioned, Russia should be a bit like Canada &
Australia - they all have relatively small populations, great wealth & significant
resources at their disposal.
Although China has taken enthusiastically to Western brands and it is keen to learn
from foreign companies both in terms of know-how/skills but also in terms of best
management practices, it is still distinctly Chinese. Some observers aggregate
Mainland China financial markets performance with Hong Kong; this may not be
appropriate.
The India financial sector has clearly developed significantly over the past decade
and there is still potential for considerable growth. India also has a significant
agricultural sector that plays a central role in the domestic economy. "Inclusive
growth" and "corporate social responsibility" have in recent years become buzz
words in India. It will be interesting to see over the coming years how the strong
growth of the Indian economy will get translated into further benefits for the wider
society.
Among Russia, India and China, it appears that India has made most progress in
increasing openness and accountability, on the basis of my fieldwork findings.
Analyses of this nature raise complex issues of comparability, and this brief
overview is not meant to provide a definitive answer. There remain considerable
advantages to investing and doing business in all three countries - indeed the BRIC
economies as whole offer substantial and attractive alternatives to opportunities in
G7 economies.

Monthly Review I May 2012
25
Legal Decisions on BankingLegal Decisions on Banking
Shri Syamjith PLaw OfficerState Bank of India SARB, Chennai
Publication of photograph of default borrower in newspapers cannot be stated
as coercive step to collect the loan
S.T. Tamil Selvi Vs.
SBI,SARB,Chennai
W.P.No.199 of 2012
M.P.No.1 of 2012
Of late, the Banks/FI's are adopting newer and newer methods for recovery of its
dues from the default borrowers. Publication of photograph of default borrowers in
widely circulated newspaper is one of such innovative method adopted by the
Bank's/FI's. However, on number of occasions, in order to thwart the attempt of the
Bank/FI to publish the photograph, the borrowers used to approach the Court of Law
by invoking the writ jurisdiction. The borrowers would plead that publication of
their photograph will violate their fundamental rights enshrined in the Constitution
of India.
The right of privacy of borrowers' vis-à-vis the right of the Bank's/FI's to recovery
public money were discussed in detail by the Hon'ble High Court of Chennai in 4Mr.K.J.Doraisamy vs The Assistant General Manager, SBI . The Hon'ble Lordship
4 Reported in Indian Kanoon - http://indiankanoon.org/doc/251249/ 9-decided on 22 November, 2006).

State Bank of India
26
held that from the point of view of the individual, his right to privacy is not absolute
and from the point of view of the Bank, the duty to maintain secrecy is superseded by
a larger public interest as well as by the Bank's own interest under certain
circumstances. The Hon'ble Court further held that if borrowers could find newer
and newer methods to avoid repayment of the loans, the Banks are also entitled to
invent novel methods to recover their dues.
One of our Branch borrowers - S.Tamil Selvi, aggrieved by the notice issued by our
Branch, intimating for the publication of the photograph in newspaper, approached
the Hon'ble High Court of Chennai by filing the writ petition of Certiorari. The
borrower/petitioner alleged before the Hon'ble High Court that publication of
photograph is a coercive measure to recover the dues. The borrower petitioner
further alleged that if the photograph of the petitioner is published in the newspaper
giving her name, it will spoil her reputation and calls this mode as a coercive
recovery mode. Our Branch has contended that the loan was obtained in the year
2006. Our Branch further contended that in spite of granting so many demands, the
petitioner has not chosen to repay the loan amount. In fact demands have been made
time and again, even now the bank is not eager to publish the name or print the
photographs if she undertakes to repay within some time limit. Our Branch further
submitted that the writ petition is pre-mature and there is no coercive action and
hence the petition is not sustainable.
The Hon'ble Court held that the mode of publication of photograph of default
borrower adopted by the Bank cannot be called as a coercive mode. The Hon'ble
Court observed that if at all, taking into consideration that the loan is granted in 2006
and till 2012, it is not settled and having now only called upon to pay and only
thereafter if she fails to do so, intend publishing, cannot be stated as coercive step to
collect the loan. Accordingly, the Hon'ble High Court dismissed the Writ Petition.
Hope, this judgement will add momentum in our Bank's endeavour to publish the
photographs of default borrowers so as to step up recovery proceedings.

Notes

Notes

02
Monthly Review December 2011
02
SBI Monthly Review is brought out by the State Bank of India, Economic
Research Department, Corporate Centre, State Bank Bhavan, Madam Cama
Road, Mumbai - 400 021
Disclaimer: The SBI Monthly Review is not a priced publication. Data and
information is based on press and other reports and no responsibility is accepted for
the accuracy of facts and figures contained therein. The opinions expressed do not
necessarily reflect those of the Bank or its subsidiaries. This document and its
contents are proprietary information of State Bank of India and may not be
reproduced or otherwise disseminated in whole or in part without obtaining written
permission from the Economic Research Department.
Articles are invited from both staff members and others for publication in the SBI
Monthly Review. The size of the
The article can be on a topic
concerning the economy, agriculture, industry, banking, finance, the monetary or
external sector, international economic developments, management, including
human resources management, or any topic of particular relevance and interest to
bankers.
To encourage quality writing honorarium has been increased from 1st April 2011.
Selected original article for the Monthly Review will be paid an honorarium of
3,000 to non-staff writer and 2,500 to one from among the staff. A lump sum
payment of 1,500/- is made for an article based on a paper presented at a
seminar/conference or published elsewhere, earlier.
Ordinarily, no correspondence is entertained in respect of articles sent for
publication.
Please send your contributions to the
It has been decided by the Bank to make all payments by direct credit to the account
through electronic payment systems instead of issuing Banker's Cheques.
Therefore, authors are requested to furnish the following particulars/information
along with their papers for effecting electronic payment of honorarium:
(a) Account Number (Author's)
(b) Bank's Name
(c) IFSC Code
(d) Provident Fund Account Number in case of Staff
(e) Address with telephone or mobile number
article should be about 2,500 to 3,000 words and
should be sent in soft version and also a hard copy.

Registered with the Registrar of Newspaper for India under No. 11490/62
Prepared in Economic Research Department, State Bank of India