final- guk lesson learning report - gukbd.net · lesson learning report: ... household basic...
TRANSCRIPT

Gana Unnayan Kendra(GUK)
2014
shiree
Lesson Learning Report:
Reducing Extreme Poor by Skills Development
on Garments
Lesson Learning Report: GUK 2014
1 | P a g e
Table of Contents
Summary Lessons ................................................................................................................................... 3-5
Introduction ................................................................................................................................................ 5
ECONOMIC EMPOWERMENT OF THE POOREST (EEP/SHIREE) .............................. 5
INNOVATION ROUND THREE......................................................................................................... 5
THE LESSON LEARNING REPORTS ................................................................................................ 6
THE PROCESS LEADING TO THE REPORT ................................................................................... 6
Chapter One: Project Summary 2011-2013 ............................................................................................. 7
DOCUMENTS CITED ....................................................................................................................... 7
INTRODUCTION ............................................................................................................................ 7-9
NATIONAL CONTEXT .................................................................................................................... 9
INCEPTION CHALLANGES .................................................................................................... 9-10
EXTERNAL RELATIONS .............................................................................................................. 10-12
PERCEPTION OF THE PROJECT AND RELOCATION…………………………………………12
THE ROLE OF SECONDARY INCOME GENERATING ACTIVITIES…………………………13
MONITORING & EVALUATION……………………………………………………………..13-15
RANA PLAZA & THE FUTURE………………………………………………………………...15-16
CONCLUSION .................................................................................................................................. 16
Chapter Two: Endline to Baseline Findings .................................................................................... 17-20
HOUSEHOLD BASIC DEMOGRAPHIC CHARACTERSTICS .................................... 20-21
OCCUPATION .................................................................................................................................. 21
INCOME ......................................................................................................................................... 21-22
CHANGE IN POVERTY THRESHOLDS.................................................................................. 23
EXPENDITURE ............................................................................................................................ 24-25
ASSETS ................................................................................................................................................. 25
HOUSEHOLD SAVINGS AND LOAN ..................................................................................... 26
HOUSING CONDITION AND ACCESS TO WATER SUPPLY, SANITATION AND
ELECTRICITY ............................................................................................................................... 27-29
FOOD SECURITY AND DIVERSITY .................................................................................... 29-30
WOMEN’S EMPOWERMENT ................................................................................................. 30-31

Lesson Learning Report: GUK 2014
2 | P a g e
GRADUATION ................................................................................................................................. 31
CONCLUSION .................................................................................................................................. 31
Conclusion: Progress against Log Frame ........................................................................................ 32-36
Annex 1: Exit Strategy ........................................................................................................................ 36-38
Annex 2: Financial Overview ................................................................................................................. 39
Annex 3: Inovation Revisions ............................................................................................................ 40-41
Lesson Learning Report: GUK 2014
3 | P a g e
Summary Lessons
1. Community Mobilization: - Ready Made Garments (RMG) trade is an increasingly growing sector in Bangladesh that needs to be further utilized through NGO’s and aid projects. The project saw an immediate need in extending the geographical location of its training centres and factories in order to have a greater impact on the extreme poor communities. - In the initial stages of the project, rumours spread within the local community of human trafficking as the project’s model required training participants (often young women) and facilitating their relocation 300km away to a factory in Dhaka. Households became reluctant in allowing their family members to partake in the project. Although bringing UP Chairmen and Imams on-board proved vital in winning the goodwill and support families, the late response resulted in missed opportunities for some. - The project saw a significant change in lifestyle and prospects for young and unemployed men and women who received garments training and a job placement in Dhaka. These beneficiaries acquired skills which make them highly favorable to the RMG sector– and as a result, are meeting the economic labor demand. Beneficiaries who were involved with the project were able to progress to better paid employment and working conditions as skilled workers.
2. Secondary Income Generating Activity: - In order to increase support to beneficiary family members who remain in the village, and strengthen household support/goodwill for the primary intervention, it is beneficial to increase the value of the secondary IGA transfer to 7,000-10,000 Tk. and need to provide IGA training in order to further support the household needs.
3. Savings: - Endline indicates that 96.9% of households have savings, among which over 25% have savings between 5,000-10,000 Tk. - Specifically through awareness training sessions which included ‘savings attitudes’ to encourage households to save money, almost all the BHH’s have some savings. The average of households savings is 9,784 Tk. and came directly from the beneficiary and not livestock or IGA.
4. Graduation:
- Endline findings indicate a considerable change in household income. The mean per capita per-day regular income in baseline was 18.35 Tk., which increased to 65.13 Tk. during endline. About 84.4% of households crossed the extreme poverty line and their per capita, per day income is greater than 32.5 Tk. - The mean house-size increased by approximately 60sqft by the end of the project

Lesson Learning Report: GUK 2014
4 | P a g e
- There has been a positive shift in defecation practices within the beneficiary household upon endline. All households indicate using ring/slab latrines/pit latrines/sanitary latrines as opposed to open space.
5. Beneficiary Drop Out:
- Early dropouts were exhibited in the project due to either a lack of interest among beneficiaries or a conflict of priorities where beneficiaries had later decided to pursue other livelihood strategies. - In comparison to Apex, other partners who pay less generous stipends continue to face problems with the level of staff dropout- also problems with living conditions resulting in significant additional expenses for beneficiaries who had to find and pay for alternative fuels. - Women in particular saw a high dropout rate due to marriage. After participating in the training and working for some time to save money, many of the beneficiaries could not continue to work after entering marriage due to their household arrangements with their family. - Many beneficiaries faced difficulties in adjusting to the urban life of living in Dhaka as part of the project. Increased support and pre and post arrival is crucial for the beneficiary to transition accordingly while away from their family and home. - As working conditions vary from factory to factory, addressing the needs of the extreme poor beneficiaries will not be inclusive for all. The negotiations with factory owners prove to be challenging in terms of pay and working conditions; 2 main contributors to beneficiary drop outs. - The project should implement a process in place to ensure the health and safety of beneficiaries in order to reduce number of drop outs. - A small number of beneficiaries returned to their homes as a result of family pressure during their internship period at the factories. Cultural norms and pressure by the family for the beneficiary to marry and have a family prove to be a challenge in drop out numbers.
Lesson Learning Report: GUK 2014
5 | P a g e
Introduction
ECONOMIC EMPOWERMENT OF THE POOREST (SHIREE)
The Economic Empowerment of the Poorest (EEP) Project is a partnership between UKAID
from the Department for International Development, Swiss Agency for Development and
Cooperation and the Government of Bangladesh that aims to take one million people out of
extreme poverty by 2015. The programme has adopted the name shiree meaning steps in Bangla,
reflecting the approach towards helping people to progress out of poverty. There are two Shiree
challenge funds, the Scale Fund and the Innovation Fund. Both are distributed to NGO
implementing partners via a competitive process with selection made by an Independent
Assessment Panel. The Scale Fund supports proven approaches to addressing extreme poverty
while the Innovation Fund enables innovative approaches to be tested and enhanced in
implementation. Scale Fund grants are typically of the order of £3million, covering around
10,000 direct beneficiary households each. Innovation Fund grants are also substantial,
averaging £300,000 and up to 2,000 HH (households). There are currently 36 active sub projects,
15 Scale Fund and 21 Innovation Fund working with approximately 300,000 HH.
Inherent in an Innovation Fund’s programme design is the objective that these projects will be
closely and continuously monitored and evaluated with successes scaled up, either by directly
utilising available Shiree’s resources, or indirectly through other funding routes or by
influencing the design of other projects and programmes.
The Shiree programme also has a mandate to research the dynamics of extreme poverty and of
the effectiveness of interventions designed to address extreme poverty. This research and the
learning from Shiree projects feed a growing stream of pro-extreme poor advocacy activities,
including the development of a Manifesto for the Extreme Poor1. This comprehensive effort is
contributing towards the eradication of extreme poverty in Bangladesh by 2022.
INNOVATION ROUND THREE
The Innovation Fund is distributed via themed bidding rounds. Round One focussed on
peripheral or marginalised regions exhibiting a high incidence of extreme poverty. The theme
for Round Two was innovative approaches towards addressing seasonal hunger (Monga).
Round Three focused on marginalised groups, a theme that was identified from Shiree’s
experience working with the extreme poor and evidence that marginalised groups make up a
disproportionate number of the extreme poor. These groups include elderly people, the
physically challenged, religious or ethnic minorities, who have been largely failed by state and
non-state interventions. 7 NGO projects were selected of which the total value of contracts was
£1,893,069 with 7,160 beneficiaries.
1 See: http://www.manifestofortheextremepoor.com
Lesson Learning Report: GUK 2014
6 | P a g e
THE LESSON LEARNING REPORTS
12 Lesson Learning reports were produced in 2012 for Innovation Rounds One and Two. This
report is focused on the Gana Unnayan Kendra (GUK) project learning, and forms part of the
Innovation Round Three Lesson Learning reports. The reports have been produced for three
main reasons: firstly to capture and to make available the significant learning from each
individual project, secondly to provide an impact assessment that can inform decisions
regarding the potential scale up of project activities, and thirdly, to provide an instrument for
interaction, reflection and appreciative dialogue between the Shiree team, NGO project staff
members and beneficiaries. Each report follows a similar structure that reflects the key elements
of this intensive and interactive process.
THE PROCESS LEADING TO THE REPORT
A similar process has been followed during the preparation of each report. Chapter One
summarises the narrative of the project from design and inception through to completion. This
chapter draws on the initial Project Memoranda as well as the output of several independent
(SILPA) reviews conducted during the course of the project. GUK was asked to submit relevant
documents to support the finding of this chapter and the chapter was reviewed and endorsed
by the NGO project staff prior to finalisation. Chapter Two outlines the output of an Impact
Survey conducted according to a standard methodology for all 12 projects. This survey was
undertaken by trained enumerators adopting a similar methodology to that used for the Scale
Fund CMS3 instrument.2 The baseline census (CMS1) is used for comparisons. The Conclusion
is a comparison between final project achievements and the original logical framework. The
Annex includes a summary of the project exit strategy, a brief sub project financial profile and
any innovation revisions to the project.
In all cases the report has been shared in draft, at several stages, with the concerned NGO,
feedback has been received and appropriate adjustments made.
2 See: http://www.shiree.org/extreme-poverty-monitor/#.UGp4U03A-a8

Lesson Learning Report: GUK 2014
7 | P a g e
Chapter One: Project Summary 2011-2013
DOCUMENTS CITED
• Project Memorandum
• Inception Report
• Project Activities Log
• Quarterly Change Reports and Self Review Reports
• SILPA 2012
• GUK Annual Reports
• Field Reports (shiree)
• Monthly and Annual Progress Reports
• CMS 2 Reports
• CMS 4 Reports
• CMS 6 Reports
INTRODUCTION
CMS 6: Summary of GUK Interventions
Beneficiary Information 2011 2012 2013 Cumulative
Target (according
to log frame)
BHH selection complete 411 804 537 1,752 1160
BHH profiles (CMS 1) complete 259 509 392 1,160 1160
BHH who dropped out or migrated 152 295 117 592 -
BHHs receiving skill training/capacity building (for garments jobs)
192 521 447 1,160 BHHs 1160
BHHs receiving IGA/skill training/other capacity building training
259 509 392 1,160 BHHs 1160
BHHs receiving asset transfer - 643 517 1,160 BHHS 1160
Total value of assets/cash distributed (BDT)
- 1,286,000 1,034,000 2,320,000 -
Social safety net support 36 105 128 269 BHHs -
Temporary access to khas land (1 year lease) 51 18 15 84BHHs -
Goal
The goal of the Gana Unnayan Kendra (GUK) project is to create employment opportunities by enhancing the skills of individuals in making garments in the proposed working area. The project will contribute to the British and Bangladeshi Governments’ commitments to fulfil the

Lesson Learning Report: GUK 2014
8 | P a g e
UN Millennium Development Goals, and specifically to contribute to Shiree’s Logical Framework Goal 1 (eradicate extreme poverty & hunger) by 2015.
Purpose
The GUK project sets out to work with extreme poor households in ten Unions of the monga
(seasonal hunger) prone Gaibandha District in north-western Bangladesh, a region nearly
entirely dependent on an agrarian economy. This project purpose is twofold- 1 is for the
economic empowerment of the household and 2 is to provide training and employments
opportunities to the beneficiary The project innovation was to provide 1,160 unemployed rural
youths (50% women) from extreme poor households with one month long paid skills training in
garments production and to link trainees with a two month paid internships subsidized by the
NGO, (and subsequent job opportunities), with garments factories located in the thriving
industrial belt surrounding Dhaka. Additionally, the project was to provide livelihoods support
and a small (2,000 Tk.) asset transfer to household members remaining in rural Gaibandha,
bringing the total number of beneficiaries (direct and indirect) to approximately 6,000 persons.
Project Outputs and Activities
The project has 3 main outputs and the following activities under each output:
Output 1: 1,160 extreme poor marginalized persons (min 50% women) have been trained in
skilled machine operation of woven garments
• 1,160 extreme poor BHHs selected based on the approved beneficiary selection criteria
(Female-514, Male-646)
• 100% of beneficiaries have received skill development training on oven and footwear
machine operation
• 100% of beneficiaries have received awareness sessions on 14 different social and
development issues
• Field facilitator visited 1,160 persons for the 1st week of the project and subsequently
every month
• Ten inception workshops conducted with all relevant stakeholders
Output 2: 1,160 extreme poor persons (minimum 50% women) secure employment in woven
garments factories
• Organized sharing meeting with BGMEA
• Memorandum of Understanding (MOU) has been signed with Apax Adelchi Footwear
Limited and 4 other garments factories
• BGMEA opened a skill development training center in Uttara and Dhaka, while also
implementing this type of initiative at Gaibandha through a partnership with Youth
Development Department

Lesson Learning Report: GUK 2014
9 | P a g e
• 21 news publications of different project activities covered in 5 local and 7 national
newspapers, and 13 news pieces including a short video footage broadcasted in 9 TV
channels
• 1,155 participants (646 males and 509 females) attended a two-month long internship
programme in Apex and garments and after successfully completion of internship, 1,084
participants (622 male and 462 females) are now continuing their jobs at 108 garments
and 4 footwear factories including Apex in Dhaka, Gazipur, Narayangonj & Chittagong
district
Output 3: 1,160 BHHs improved food intake through small IGAs & access to public services
• 1,160 families have developed and practicing their Family Development Plan (FDP)
• Income generating assets (goats, sheep, poultry and plants) have been transferred to
1,160 families
• 1,160 BHHs have received awareness session on 14 different social and development
issues and need based Guardians meetings held with the 1950 participants
• 438 children from 426 families have been admitted to schools and are continuing their
studies
• 100% of households consume three meals a day in the project area
• 100% of households adopted at least two income earning opportunities in each BHH
• 269 BHHs have been included in the Government’s safety net program
• 204 BHHs have installed latrine and 152 BHHs have installed tub-well
NATIONAL CONTEXT
The project design was astute and took advantage of a number of growing socio-economic
trends, targeting the rapidly growing RMG (Ready-Made Garments) sector which is responsible
for around 78% of foreign exchange earnings but currently suffers a shortfall of skilled workers.
The Bangladesh Garment Manufacturers and Exporters Association (BGMEA) president
estimating that there is a 25% shortage in the availability of skilled labour. The project seeked to
exploit this labour gap by providing skills training and facilitating paid employment for
extreme poor families. The project also tapped into the growing availability and cultural
acceptance of work opportunities for young women in the RMG sector; arguably the first
occupational field in Bangladesh to become permeable to women, the industry is playing a
pivotal role in empowering hundreds of thousands of women as skilled income earners and
independent workers.
INCEPTION CHALLENGES
Commencing operations at the end of 2010, the project got off to a slow start with
implementation hampered by several issues. A 2012 SILPA (EEP facilitated ‘simultaneous
impact learning and process audit’) and a number of field reports highlighted several reasons
Lesson Learning Report: GUK 2014
10 | P a g e
for this delay. Firstly, staff recruitment was slow, which had rolling effects for implementation.
Secondly, there were delays in the procurement and the import of commercial sewing machines
for use in the newly established training centre. Furthermore, GUK faced initial difficulties in
selecting beneficiaries that met the selection criteria that had been mutually agreed with EEP – it
was challenging to find households who were both extreme poor (productive assets worth less
than 2,000 Tk.) who also had available and willing members to participate in the proposed
training programme.
The project also initially saw a high number of dropouts post-selection; an issue which has in
fact affected the project throughout implementation. GUK attributed these early dropouts to
either a lack of interest among beneficiaries or, in some cases, a conflict of priorities where
beneficiaries who had agreed to participate later decided to pursue other livelihood strategies.
This issue, perhaps more than other teething problems, might have been averted by better
communication and motivation of beneficiaries about the aims and objectives of projects during
household recruitment. Though since the project concept was new to both the NGO and
selected households, it is perhaps not surprising that some level of dropout was seen to begin
with. The project made good progress in meeting their target of recruiting at least 50% women
into training but ultimately fell slightly short of this goal achieving a proportion of 44% female
beneficiaries.
EXTERNAL RELATIONS
BGMEA Engagement
The BGMESA is the main administrative body of the Bangladesh RMG industry. The
association is considered a powerful trade body and holds significant influence with its
members and the Government of Bangladesh. The project sought to engage with BGMEA and
gain their support. Initially, the BGMEA lent informal support to the project with
representatives visiting the project site, training centre and attending a ‘Project Sharing Event’,
however, official endorsement or further development of the relationship did not transpire.
Notably, the BGMEA are engaged in similar activities and have established training centres
where individuals can pay to undertake a certified course – similar to those which GUK were
providing freely. This may be one reason why further partnership did not evolve. However, the
BGMEA have voiced some interest in working together with GUK in the future, specifically
regarding training. Currently, the BGMEA can offer training capacity for 80 trainees at a time,
but they see this expending based on the growing demand in the garment industry.
Rumours of Trafficking & Role of Local Government
Although GUK is well established in the Gaibandha area, the intervention faced a number of
difficulties in convincing potential beneficiaries to participate in the project. The project’s model
of training participants (often young women) and facilitating their relocation 300km South to a

Lesson Learning Report: GUK 2014
11 | P a g e
factory in Dhaka proved contentious. Rumours spread among the local community that the
project was involved in human trafficking, provoking fear among households and reluctance
among families to allow their young women join the project.
The initial project memorandum and budget lacked provision for a Union Level meeting to
raise the awareness of local government. Furthermore, the absence of widespread local
Government support and awareness became problematic in the face of trafficking rumours.
GUK was quick to recognise the damaging impact of the rumours and their potential to
severely handicap the project. In response, the NGO acted to better orientate local leaders and
elites, bringing UP Chairmen and Imams on-board, which was to prove vital in winning the
goodwill and support of sceptical families.
Sectors
Initially the project focused on placing trainees with garments manufacturers, however, this
scope subsequently broadened to include footwear factories, and in particular the footwear
manufacturer Apex, with whom the project developed their most fruitful relationship. Initially,
the GUK project signed MoUs with four garments factories and subsequently the Apex
footwear producer. Currently, the project has agreements with around 50 factories. Staff
mentioned that as the project has become better known, increasing numbers of factories having
been making contact with the team and expressing interest to work with GUK. For example,
one large Dutch buyer and garments manufacturer ‘Eurotex’ has informally agreed to provide
jobs to GUK trainees as and when they become available. Furthermore, the company is actively
exploring the possibility of establishing a garments factory adjacent to the GUK training
campus in Gaibanda. This possibility highlights the huge potential of the project for drawing
investment from CSR conscious Western manufacturers. The prospect of establishing
production facilities in Gaibanda would in turn deal with a number of the challenges faced by
the project in relocating trainees from rural Gaibanda to Dhaka. Additionally, this would
present a huge economic opportunity for a relatively deprived rural area reliant on agriculture
and manual labour, devoid of industry. GUK aspire to continue forming agreements with more
organizations, they identify the booming garments sector as their main target and noting that
although one successful relationship has been developed with APEX footwear, the footwear
sector does not demonstrate strong growth in comparison with the RMG trade.
GUK are eager to expand their operations in this field and are looking at geographical
expansion and engaging with new donors while maintaining the focus on extreme poor
families. Given the success of the project EEP should actively help to facilitate this. High
turnover of trained beneficiaries placed with Apex and other private sector partners has been an
issue throughout the project and staff members acknowledge that at times, this has placed a
strain on relations.

Lesson Learning Report: GUK 2014
12 | P a g e
However, private sector partners have come to view their engagement with the project as part
of their CSR obligations and so relations have since eased. APEX has increased the stipend
provided during the initial three month internship to 6,000-7,000 Tk. per month. This has
helped to stem turnover of trainee. However, other partners who pay less generous stipends
continue to face problems with the level of staff dropout- if conditions and pay were to be
improved, we can predict turn-over to be less frequent and lead to long-term sustainability of
employers within a factory.
PERCEPTIONS OF THE PROJECT AND RELOCATION
Unemployment to Factory Living
One of the most significant challenges for the project and a contributor to some of the high
levels of drop-out seen has been the challenge for beneficiaries of adjusting from a rural
environment and unemployment to an urban setting with regimented and intensive working
hours. A number of specific issues have been identified in this regard, for example: several
beneficiaries found it difficult to work with APEX due to the strong odours in the factory,
associated with tanned leather. Additionally, the conditions of supplied living accommodation
were also problematic, with APEX accommodation lacking cooking gas, an issue which was
both inconvenient and resulted in significant additional expenses for beneficiaries who had to
find and pay for alternative fuels (kerosene, wood etc).
For some beneficiaries, the adjustment to their new lifestyle has not been possible and 76 have
dropped out from the project at some point and remained in the Gaibanda region. Another
‘common’ reason for dropping out from the project, particularly for young women, is marriage.
One woman who worked happily for 1.5 years in a Dhaka factory returned from Dhaka to
marry in an arranged marriage, she spent 15,000 Tk. from her savings on dowry costs payable
to her husband’s family, (despite dowry being illegal in Bangladesh). Her husband works as a
roofer for 8 months of the year and is able to make 10,000-12,000 Tk. per month for this time.
The woman spent the remaining bulk of her savings on mortgaging a parcel of land (10
decimals) which provides a small supplementary income.
GUK staff expressed that in the future, if the intervention were to continue, they would like to
invest more time and resources in improved training and sensitization of garments factory
management to enhance understanding of the project aims and the challenges that extreme
poor are likely to face in relocating / adjusting to Dhaka.
From a total beneficiary number of 1,160, GUK reports that 1,155 people completed training and
the two month internship with a private sector partner, while 1,084 (93%) are continuing in
garments or footwear related paid work at the end of the project at over 108 factories –
reflecting beneficiary success in securing more lucrative and attractive jobs.

Lesson Learning Report: GUK 2014
13 | P a g e
THE ROLE OF SECONDARY INCOME GENERATING ACTIVITIES
Secondary Income Generating Activities (IGAs) were provided to families once participants had
completed their garments training – so as to avoid families simply securing an asset without
committing to the project. The purpose of the IGAs was to support the family in buying poultry
and vegetables during the training period as no other support mechanism exists in place. Staff
members believe that the project and objectives could feasibly have been met without the
additional secondary IGA (most commonly a goat). The project highlights that beneficiaries
selected for training were nearly always unemployed prior to engaging with the project and so
secondary transfers were not perceived as compensation for lost earnings. Additionally, while
secondary IGA transfers of 2,000 Tk. are not insignificant, staff cited that average monthly
remittances to families from GUK trained factory workers were around 1,000-2,000 Tk. per
month – far in excess of short and medium term gains from secondary IGAs. However, it was
discussed that secondary IGAs can be an important cache of resilience in the event that a trainee
is unable to secure or continue working at a factory job. For example, in several instances
trained women have left skilled positions in Dhaka to return to their village to marry. In these
cases, the secondary IGA has often proved a more important source of income. Equally,
although most families receive remittances from trained sons/daughters (in some cases
facilitated by the project), others have not been in receipt of regular income. Project staff
suggested as a lesson learned, that they would retain and increase the value of the secondary
IGA transfer to 7,000-10,000 Tk. – they argued that this would be a greater support for family
members who remain in the village and possibly strengthen household support/goodwill for
the primary intervention (garments training, relocation and job linkages).
MONITORING AND EVALUATION
Mobility and Tracking Mechanism
Tracking the progress of beneficiaries following project facilitated skill training and job
placement has proved to be challenging to the GUK project. In many instances, beneficiaries left
the GUK facilitated job placement within a short time, often to secure higher paid jobs in other
factories. Reflecting the mobile and competitive job market for skilled apparel workers, indeed
the BGMEA suggest that there is a shortfall of skilled workers, meaning that demand is
considerably higher than supply.
While the project is quick to acknowledge the ‘loss’ of beneficiaries to higher paid jobs as a
success, this trend has posed several challenges in monitoring the progress of beneficiaries and
overall outcomes of the project. Furthermore, at times this has also created tensions between the
project and the private sector partners (factories) that the project has placed trainees with.
As far as tracking is concerned, the project staff maintained regular phone contact with
beneficiaries- many of whom purchased mobile phones to communicate with family members
or to remit money via the emerging B-Kash mobile money service. Staff visited Dhaka and

Lesson Learning Report: GUK 2014
14 | P a g e
placement factories on a bimonthly basis and sought to maintain a database of contact details,
working location, phone numbers etc. The information tracking is important for the project as
the beneficiary contributes and supports his/her household’s income and livelihood. The
monitoring of the beneficiary also ensures for their smooth transition into the work-force by
providing support and assistance with mental adaptation to the urban setting. In terms of
tracking remittances and the impact of secondary IGAs, the project employed a household level
tracking system which is conducted during monthly household visits. Project staff suggested
that the project should continue or receive further funding as they would like to establish an
‘Information Centre’ in Dhaka to further empower the beneficiaries. Such a centre would offer a
hub for networking among beneficiaries, enabling them to share concerns with villagers from
the same area – perhaps creating localized associations, swap job tips and vacancy information.
The staffs anticipates that the increased peer- support of such a facility could help beneficiaries
to better settle into a new urban environment and full time work, and may have the potential to
reduce dropout rates.
Long Term Impact
Like many EEP/Shiree projects, GUK has participated and embraced the portfolio wide change
monitoring system. This chapter of the Lesson Learning report is accompanied by endline
findings based on the gains of beneficiary households as observed in CMS tools and a separate
quantitative endline survey. However, it is important to recognize that much of the change that
the GUK project sets out to achieve is not measurable using M&E tools that are aligned to the
project cycle. Although GUK state in their final log frame reports that 100% of households have
doubled their income over baseline and that the average value of household assets has
increased 80%, perhaps the greatest impact of the project is not seen at household level in rural
Gaibanda, but in the changes seen to beneficiary trainees now residing in Dhaka.
Most trainees, having secured employment, remit money to their families who are also
benefiting from the asset transfer supplied to rural households (mostly frequently a goat). At its
final count, GUK estimates that a total of more than 16m TK. (£127,000) has been remitted to
rural families by Dhaka based beneficiaries. However, perhaps the most profound impact of the
project is the dramatic change in lifestyle and prospects for the young and unemployed men
and women who receive garments training and a facilitated job placement in Dhaka. These
beneficiaries acquire skills which make them highly desirable to the country’s burgeoning RMG
sector– many complete a short GUK facilitated project before quickly moving to better paid
employment, accessing and exploiting a highly competitive sector where factories compete for
the most skilled workers. Project staff point to anecdotal evidence that rural workers trained
and placed in Dhaka with vastly increased earnings quickly buy into an aspirational urban
lifestyle, dressing in fashionable styles, purchasing mobile phones (716 beneficiaries) and
televisions (47 families).

Lesson Learning Report: GUK 2014
15 | P a g e
Whilst difficult to quantify, it is likely that many of these workers, as they become more skilled
and experienced, will play a bigger role in the RMG job market in Dhaka, gradually increasing
their earnings. It is likely that for many of these beneficiaries, the movement from rural
labouring to skilled urban jobs will be permanent – transforming their lives and the future of
the new generation. Many will go on to marry and have children who will enjoy the security of
a family member working in a skilled and relatively well paid profession. There is a sense of
excitement at both EEP and GUK that, perhaps more so than other models, this project offers
one of the clearest routes to breaking the intergenerational cycle of poverty which has
historically plagued the disenfranchised rural extreme poor- they are taking steps up the socio-
economic ladder. It is crucial to remember that bringing in the extreme poor to the garment
industry won’t work every time as negotiations with the factory owners in terms of pay and
working conditions are challenging – particularly for women.
Spill over Effects
The GUK project has demonstrated significant positive spillover effects. For example, project
staff cite 15 cases where trained beneficiaries have persuaded siblings to migrate to Dhaka
where they too have also secured employment in garments factories, significantly increasing
overall family incomes. Additionally, there are several instances where remittances from
garments employed GUK trainees have either supplemented family incomes or enabled family
members remaining in rural Gaibanda to establish new income generating activities. For
example, one father of a beneficiary named Alamgir has established a small grocery shop
adjacent to a main road after his son had secured a job (following GUK training) with APEX
lingerie and remitted 15,000 Tk. over the course of 5-months. Previously, Alamgir earned only
100-150 Tk. per day as a labourer for part of the month, his shop now has a monthly turnover of
7,000 Tk. per month and a profit of 3,000 Tk. per month. Combined with continuing remittances
from his son, this gives Alamgir and his family a regular monthly income of around 5,500 Tk.
GUK staff have tracked 56 other examples of spillover from the intervention that have resulted
in new micro-business initiatives, 33 instances of land purchased and 190 instances of land
mortgage stemming from project related remittances. These effects underline the potentially
transformative effect of the GUK intervention for beneficiaries, family members and future
generations.
RANA PLAZA & THE FUTURE
The garments industry in Bangladesh is notoriously under regulated, workers are often
exploited, working long hours for poor pay in bad conditions within structurally unsound
buildings in an environment where health and safety considerations come secondary to
productivity and profit. This tragically came to a head in May 2013, when the Rana Plaza
building (housing several garments factories) collapsed killing over 1,000 workers. Blame was
quickly pinned on the building’s owner with little focus on the role of the government and
protocols lacking building regulation enforcement. The event brought the garments industry

Lesson Learning Report: GUK 2014
16 | P a g e
front and centre internationally and has resulted in significant dialogue between Western
buyers, brands and suppliers. With the threat of some buyers withdrawing production from
Bangladesh, there is a sense that a window of opportunity for reform and regulation is opening.
Several international pacts have been signed between Western brands and Bangladeshi
suppliers and the future outlook is positive. Following the disaster and the media attention it
gained, GUK staff report that a small number of beneficiaries chose to leave their work in
Dhaka and return to their families in rural Gaibanda– however, the majority remained in
employment.
The industry remains a vital source of jobs and in the wake of the Rana Plaza tragedy,
campaigners have capitalised on momentum to secure endorsement from the GoB wage board
for a 77% rise in minimum wage. Combined with the current shortfall in numbers of skilled
garments workers (200,000 by one estimate), conditions are uniquely favourable for
interventions such as GUK’s Shiree project. However, there are many willing applicants for jobs
in the formal sector– the garments workplace is still very competitive.
GUK had no audit process in place to ensure the health and safety of beneficiaries, though they
mentioned that they selected private sector partners carefully with these issues in mind. They
principally selected and pursued partners based on those that were receptive (a challenge!),
who understood how NGOs operate and their culture, demonstrated potential and were able to
supply appropriate salaries and accommodation for newly trained GUK participants. The
project cross-checked prospective partners against the BGMEA blacklist which identifies
garments factories that do not meet minimum standards.
CONCLUSIONS
Here then is a genuine innovation, an intelligent intervention that follows the fault lines of
natural migration and urbanization. With huge potential that is already being recognized by
others, this is a project which EEP and UKaid can proudly hold to acclaim – we should be
taking every step to support GUK and their private sector partners to scale this approach. As
the RMG (and leather) sector continues to grow, this project skewed this growth in a pro-
extreme poor direction by including this group in the social-ladder trickledown effect. GUK are
ready and waiting for further investment. Perhaps the biggest question posed by these positive
findings is who should be investing in such models? With Shiree and UKaid’s funding having
proven the model to be successful, the ideal outcome now may be for large scale investment
from the private sector. The garment industry will always prefer a semi-skilled worker as
opposed to an unskilled worker. This in turn benefits the project, as the private sector can
commit to taking a certain number of workers from GUK in the future. In the post Rana Plaza
environment, there is now a unique opportunity to leverage goodwill and investment from
Western brands and buyers to support such interventions. One role that EEP should certainly
continue to play is in advocating for and supporting GUK to target funding opportunities from
the private sector and other donors.
Lesson Learning Report: GUK 2014
17 | P a g e
Chapter Two: Endline to Baseline Findings
A total of seven projects received funding during Innovation Fund Round 3, with the GUK project period ending in November 2013. The present section seeks to establish the efficiency and effectiveness of these innovation modalities in uplifting people from extreme poverty in the given communities and regions by comparing socio-economic conditions towards the end of the intervention (November 2013) with baseline information (2011-2012) using a specific set of indicators.
Endline: The endline survey is conducted to establish the efficiency and effectiveness of these innovative modalities in uplifting people from extreme poverty in the given communities and regions by comparing socio-economic conditions towards the end of the project intervention with baseline information using specific indicators. Objective: The objective of the endline study is to assess the change in socio-economic status of the project beneficiary households since the 2011 baseline prior to any project intervention.
Specifies Objective:
• To assess the changes in socio-economic status of beneficiary households over the duration of the project and to quantify variation in cash, loans, household assets, income and expenditure.
• To examine the inter-relationships between changes in socio-economic status and improvement of food security and food diversify nutrition wise.
• To examine whether households have exited from extreme poverty or graduated using agreed upon graduation threshold.
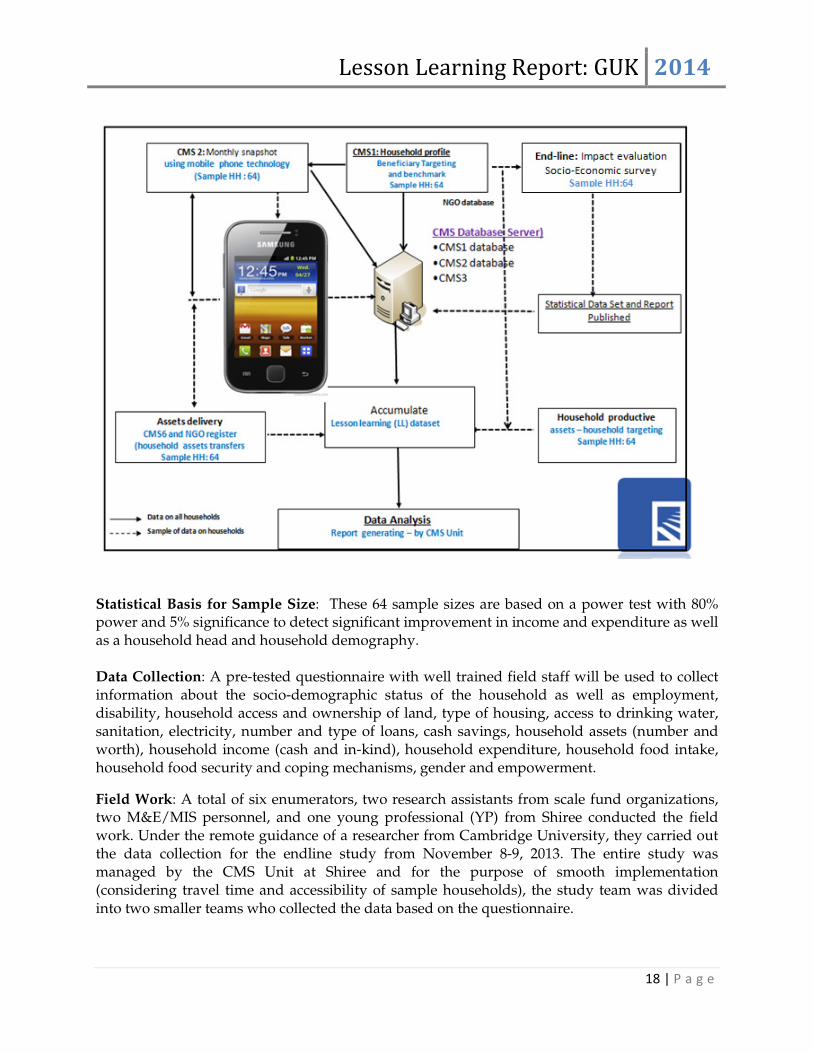
Study Design: A formal survey through (baseline to endline) is conducted to collect standardised and comparable information from 64 randomly selected households. The endline survey seeks to establish the efficiency and effectiveness of these innovative modalities in uplifting people from extreme poverty in the given communities and regions by comparing and assessing the changes in socio-economic status of the project beneficiaries towards the end of the intervention with baseline studies in 2012-2013 using specific indicators. Taking advantage of the uniqueness of the household identities, the same 64 households were selected from the baseline database and also from the Change Monitoring System (CMS), CMS2 monthly snapshots & CMS6 assets delivery which had been compiled as a census of all beneficiaries - to analyze change over time. The paradigm below outlines Shiree’s various CMS instruments and accumulated lesson learning dataset.
Lesson Learning Report: GUK 2014
18 | P a g e
Statistical Basis for Sample Size: These 64 sample sizes are based on a power test with 80% power and 5% significance to detect significant improvement in income and expenditure as well as a household head and household demography. Data Collection: A pre-tested questionnaire with well trained field staff will be used to collect information about the socio-demographic status of the household as well as employment, disability, household access and ownership of land, type of housing, access to drinking water, sanitation, electricity, number and type of loans, cash savings, household assets (number and worth), household income (cash and in-kind), household expenditure, household food intake, household food security and coping mechanisms, gender and empowerment.
Field Work: A total of six enumerators, two research assistants from scale fund organizations, two M&E/MIS personnel, and one young professional (YP) from Shiree conducted the field work. Under the remote guidance of a researcher from Cambridge University, they carried out the data collection for the endline study from November 8-9, 2013. The entire study was managed by the CMS Unit at Shiree and for the purpose of smooth implementation (considering travel time and accessibility of sample households), the study team was divided into two smaller teams who collected the data based on the questionnaire.

Lesson Learning Report: GUK 2014
19 | P a g e
Trained enumerators carried out interviews primarily of household heads on their current socio-economic conditions using a pre-tested, semi-structured questionnaire, focusing on the following indicators:
• Demographic characteristics
• Household Assets
• Household income
• Household expenditure
• Loan and savings status
• Access to safe water, sanitation, electricity
• Housing condition
• Food security
• Access to safety nets
• Women’s empowerment
Questionnaires Design: The endline questionnaire was developed by a faculty member of Cambridge University and revised by the CMS unit. It closely follows the format used for the CMS3 panel survey instrument applied to Shiree scale fund projects. As the baseline questionnaire is to some extent different from the endline study questionnaire, data analysis has been done only on the common indicators existing in both of the questionnaires. EEP/Shiree working approaches is a household approach. In fact, Shiree has never done any sort of impact evaluation to the individual beneficiary. As per the GUK project, the survey was administered strictly in the Gaibandha District to the households and not specifically to the beneficiaries training/working in Dhaka as their contribution goes towards their household.
Data Interpretation: Based on its longitudinal design, the study aims to examine the household
changes in income, expenditure, cash savings, loans, productive assets, non-productive assets,
food coping strategies, dietary diversity, and gender empowerment. As well as food coping
strategies and food diversity of household in order the determined food intake and nutritional
status.
Statistical Analysis: The study will use a mixture of statistical tests including chi-square when
making categorical comparisons and t-tests comparing continuous variables by gender of
household head and one-way analysis of variance when comparing a continuous variable by
NGO. Multivariate data analysis refers to any statistical technique used to analyze data that
arises from more than one variable. Univariate analysis will be applied only for quantitative
and descriptive (statistical) analysis. Repeated measures analysis of variance will be used to
study the baseline to endline changes.
Utilization of Results: The results are published as they document changes in living standards
(e.g. income, expenditure, cash savings, productive assets) as well as food security (e.g. going
without meals) and food diversity (how many different food groups are eaten in the last 7
days). The nutrition component is part of a very comprehensive study of the changes in lifestyle
of extreme poor households living in both rural and urban areas and covering much of the
country.

Lesson Learning Report: GUK 2014
20 | P a g e
Constraints: It should be noted that the data for the endline study for all households was collected during the same time period, but the baseline data was collected phase-by-phase at different times and different seasons. Moreover, data collection for the endline study was conducted by more trained enumerators in comparison to baseline study data collection. Therefore, the data may contain seasonal variations particularly related to economic activities in the rural context, where agriculture is the single largest employment sector. It may also contain some variation due to the different levels of understanding and experience of the data collectors. Finally, political unrest was a constraint in the implementation of the study, but fortunately, caused no major impact on the data collection.
Organization of the Chapter: This report does not aim to compare the effectiveness of innovation projects to one another, but rather, the socio-economic changes in the BHHs of specific projects since baseline. Therefore, a separate analysis of each project has been done, keeping in mind each project’s unique modalities, locality, and targeted communities. Findings from the GUK project are presented in the following section.
HOUSEHOLD BASIC DEMOGRAPHIC CHARACTERSTICS
Table1.1: Basic socio-demographic characteristics according to sex of HH head.
Category CMS1 (Baseline) CMS3 (Endline) CMS2 (Monthly snapshot)
N % N % N %
Male headed household 58 90.6 54 84.4 54 84.4
Female headed household 6 6.4 10 15.6 10 15.6
Both 64 100 64 100 64 100
Endline findings indicate change in the sex of household head since baseline. At baseline, 6.4% household heads were female and 90.6% were male, while in the endline survey (November 2013) and CMS2 monthly snapshot (Flow up: November 2013), female-headed households increase to 15.6% and male-headed households fall to 84.4%.3
Table 1.2: Distribution of HH average size according to sex of HH head.
CMS1 - Baseline CMS3 – End line CMS2 (Monthly snapshot)
Male Female Both Male Female Both Male Female Both
M SD M SD M SD M SD M SD M SD M SD M SD M SD
4.09
1.20
2.17
0.75
3.91
1.30
4.59
1.28
3.90
1.00
4.48
1.26
4.59
1.28
3.90
1.00
4.48
1.26
NB: M – Mean; SD – Standard Deviation
There is a marked difference in regards to baseline and endline household size. Among the male-headed households, the mean household size increased to 4.59 (endline, November 2013) from the baseline mean household size of 4.09. In contrast, the mean household size of female-headed households increased from 2.17 (baseline) to 3.90 (endline) and 3.90 (CMS2).
3This is consistent with research across the shire programme which shows that economic empowerment may lead to the ‘recombination’ of families. A similar explanation can be given for the reduction in FHHs seen in Table 1.2 (i.e. families come back together with economic gains).
Lesson Learning Report: GUK 2014
21 | P a g e
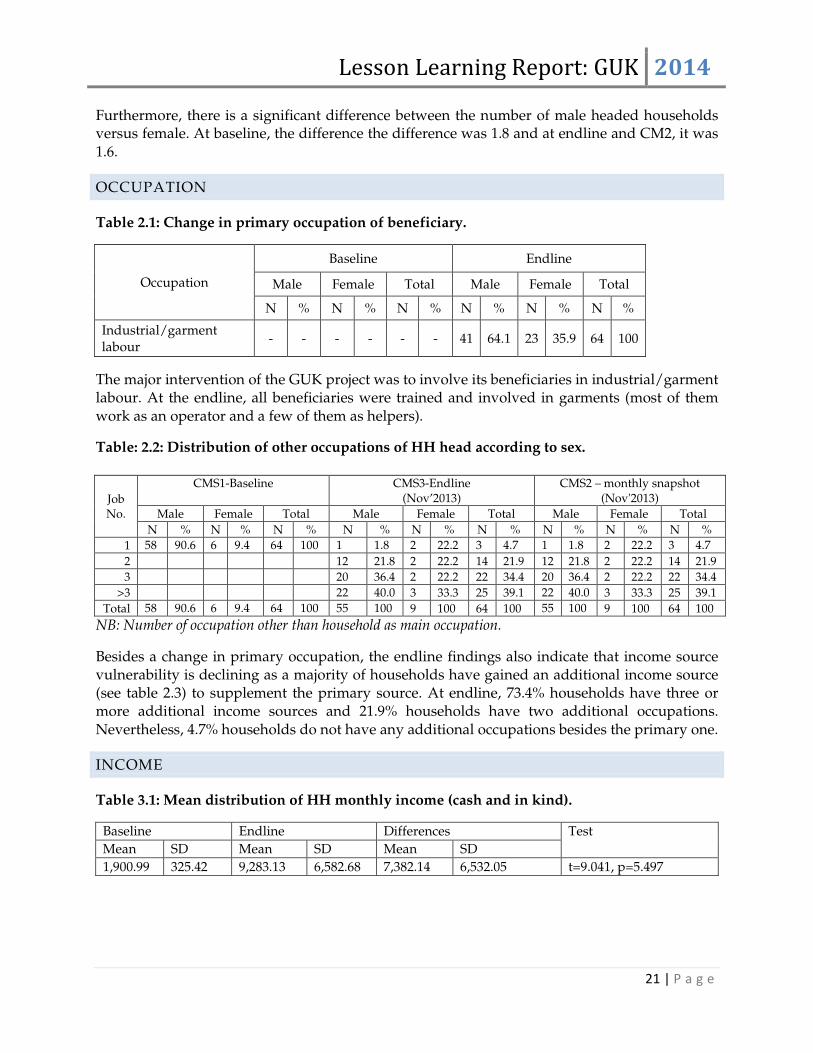
Furthermore, there is a significant difference between the number of male headed households versus female. At baseline, the difference the difference was 1.8 and at endline and CM2, it was 1.6.
OCCUPATION
Table 2.1: Change in primary occupation of beneficiary.
Occupation
Baseline Endline
Male Female Total Male Female Total
N % N % N % N % N % N %
Industrial/garment labour
- - - - - - 41 64.1 23 35.9 64 100
The major intervention of the GUK project was to involve its beneficiaries in industrial/garment labour. At the endline, all beneficiaries were trained and involved in garments (most of them work as an operator and a few of them as helpers).
Table: 2.2: Distribution of other occupations of HH head according to sex.
NB: Number of occupation other than household as main occupation.
Besides a change in primary occupation, the endline findings also indicate that income source vulnerability is declining as a majority of households have gained an additional income source (see table 2.3) to supplement the primary source. At endline, 73.4% households have three or more additional income sources and 21.9% households have two additional occupations. Nevertheless, 4.7% households do not have any additional occupations besides the primary one.
INCOME
Table 3.1: Mean distribution of HH monthly income (cash and in kind).
Baseline Endline Differences Test
Mean SD Mean SD Mean SD
1,900.99 325.42 9,283.13 6,582.68 7,382.14 6,532.05 t=9.041, p=5.497
Job No.
CMS1-Baseline CMS3-Endline (Nov’2013)
CMS2 – monthly snapshot (Nov'2013)
Male Female Total Male Female Total Male Female Total
N % N % N % N % N % N % N % N % N %
1 58 90.6 6 9.4 64 100 1 1.8 2 22.2 3 4.7 1 1.8 2 22.2 3 4.7
2 12 21.8 2 22.2 14 21.9 12 21.8 2 22.2 14 21.9
3 20 36.4 2 22.2 22 34.4 20 36.4 2 22.2 22 34.4
>3 22 40.0 3 33.3 25 39.1 22 40.0 3 33.3 25 39.1
Total 58 90.6 6 9.4 64 100 55 100 9 100 64 100 55 100 9 100 64 100

Lesson Learning Report: GUK 2014
22 | P a g e
Endline findings indicate a considerable change in household income. The mean income at baseline was 1,900.99 Tk., with a standard deviation of 325.42 Tk., while at endline, the mean income was 9,283.13 Tk., with a standard deviation of 6,582.68 Tk.* The mean increase in income is 7,382.14 Tk. Here, income includes both cash and in-kind.
Note: *Higher expected standard deviation indicates due to more variability was observed in the data set (one or more outliers as a single outlying value shift the mean and substantially increase the standard deviation). Main reasons for the income variability - type of beneficiaries’ occupation.
Table 3.2: Separates information about cash and in-kind income. The mean monthly household cash income in baseline was 1,892.01 TK., which increased to 8,515.97 TK. in endline. Similarly, change is also observed in in-kind income. The mean in-kind income in baseline was 8.98 TK., while in endline, it is 767.16 Tk. Increased involvements in agriculture-related activities may be responsible for the considerable increase of in-kind income, though further investigation is needed.
Table 3.2: Mean distribution of HH monthly income
Variables /Categories
Baseline Endline Differences Test
Mean SD Mean SD Mean SD
Cash income 1892.01 323.12 8515.97 6279.21 6623.96 6233.21 t=8.502, p=4.751
Kind income 8.98 40.62 767.16 1302.53 758.17 1302.71 t=4.656, p=1.711
Moreover, the per capita per-day mean income also increased considerably between baseline and endline. The mean per capita per-day regular income in baseline was 18.35 Tk., which increased to 65.13 Tk. during endline.
Table 3.3: Mean distribution of HH monthly regular income per capita/day
Variables /Categories
Baseline Endline Differences Test
Mean SD Mean SD Mean SD
Cash income 18.35 8.92 65.13 43.60 46.78 43.48 t=8.607, p=3.117
Kind income 0.07 0.33 5.96 9.56 5.89 9.57 t=4.922, p=6.473
Total 18.42 8.90 71.09 46.21 52.67 46.16 t=9.129, p=3.883
Lesson Learning Report: GUK 2014
23 | P a g e
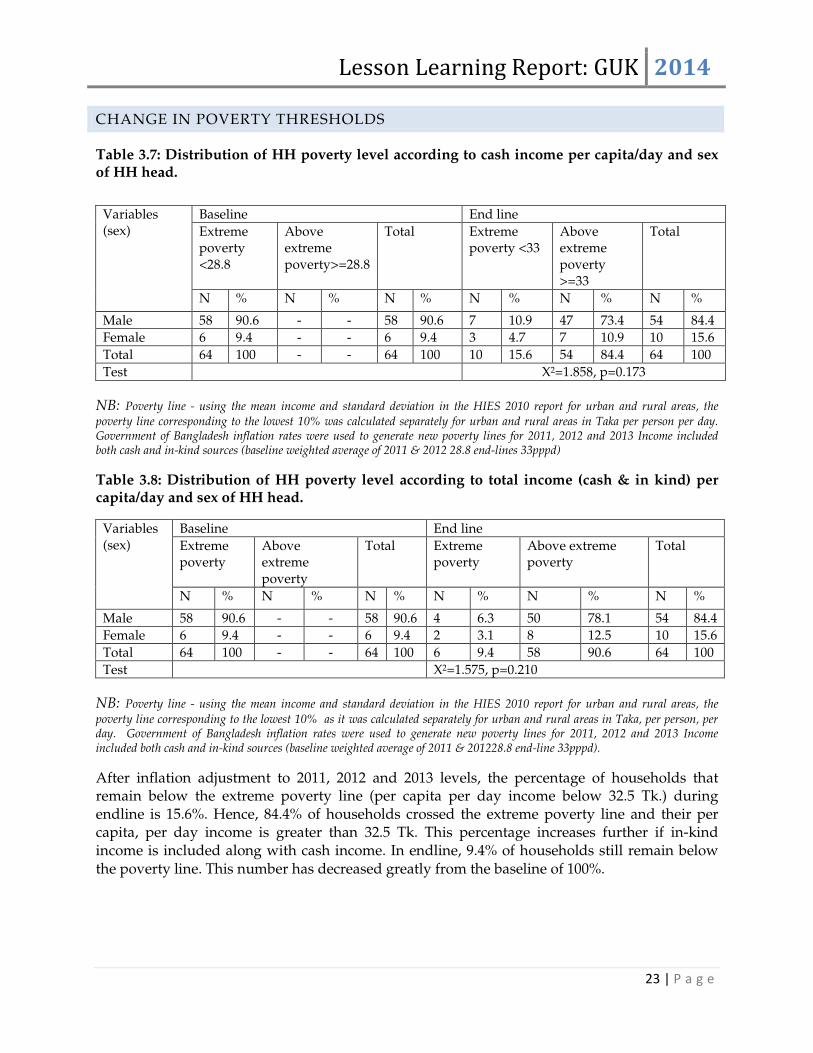
CHANGE IN POVERTY THRESHOLDS
Table 3.7: Distribution of HH poverty level according to cash income per capita/day and sex of HH head.
NB: Poverty line - using the mean income and standard deviation in the HIES 2010 report for urban and rural areas, the
poverty line corresponding to the lowest 10% was calculated separately for urban and rural areas in Taka per person per day. Government of Bangladesh inflation rates were used to generate new poverty lines for 2011, 2012 and 2013 Income included both cash and in-kind sources (baseline weighted average of 2011 & 2012 28.8 end-lines 33pppd)
Table 3.8: Distribution of HH poverty level according to total income (cash & in kind) per capita/day and sex of HH head.
Variables (sex)
Baseline End line
Extreme poverty
Above extreme poverty
Total Extreme poverty
Above extreme poverty
Total
N % N % N % N % N % N %
Male 58 90.6 - - 58 90.6 4 6.3 50 78.1 54 84.4
Female 6 9.4 - - 6 9.4 2 3.1 8 12.5 10 15.6
Total 64 100 - - 64 100 6 9.4 58 90.6 64 100
Test Χ2=1.575, p=0.210
NB: Poverty line - using the mean income and standard deviation in the HIES 2010 report for urban and rural areas, the
poverty line corresponding to the lowest 10% as it was calculated separately for urban and rural areas in Taka, per person, per day. Government of Bangladesh inflation rates were used to generate new poverty lines for 2011, 2012 and 2013 Income included both cash and in-kind sources (baseline weighted average of 2011 & 201228.8 end-line 33pppd).
After inflation adjustment to 2011, 2012 and 2013 levels, the percentage of households that remain below the extreme poverty line (per capita per day income below 32.5 Tk.) during endline is 15.6%. Hence, 84.4% of households crossed the extreme poverty line and their per capita, per day income is greater than 32.5 Tk. This percentage increases further if in-kind income is included along with cash income. In endline, 9.4% of households still remain below the poverty line. This number has decreased greatly from the baseline of 100%.
Variables (sex)
Baseline End line
Extreme poverty <28.8
Above extreme poverty>=28.8
Total Extreme poverty <33
Above extreme poverty >=33
Total
N % N % N % N % N % N %
Male 58 90.6 - - 58 90.6 7 10.9 47 73.4 54 84.4
Female 6 9.4 - - 6 9.4 3 4.7 7 10.9 10 15.6
Total 64 100 - - 64 100 10 15.6 54 84.4 64 100
Test Χ2=1.858, p=0.173

Lesson Learning Report: GUK 2014
24 | P a g e
EXPENDITURE
Table 4.1: Mean distribution of HH monthly total expenditures
Baseline Endline Differences Paired t-Test
Mean SD Mean SD Mean SD
2551.51 873.43 7482.08 5871.11 4930.57 5895.37 t=6.691, p=6.892
The mean monthly expenditure in baseline was 2551.51 Tk., while in endline, mean expenditure is 7482.08 Tk. The mean increase in monthly expenditure is 4930.57 Tk. The per capita, per day regular expenditure in endline is 52.33 TK., while in baseline, it was 22.74 Tk.
Table 4.3: Mean distribution of HH monthly total expenditures per capita /day
Table 4.5: Mean differences between income and expenditure
Table 4.7: Change in poverty thresholds (total-expenditure)
NB: Poverty line - using the mean income and standard deviation in the HIES 2010 report for urban and rural areas, the
poverty line corresponding to the lowest 10% as it was calculated separately for urban and rural areas in Taka, per person, per day. Government of Bangladesh inflation rates were used to generate new poverty lines for 2011, 2012 and 2013 Income included both cash and in-kind sources (baseline weighted average of 2011 & 201228.8 end-line 33pppd).
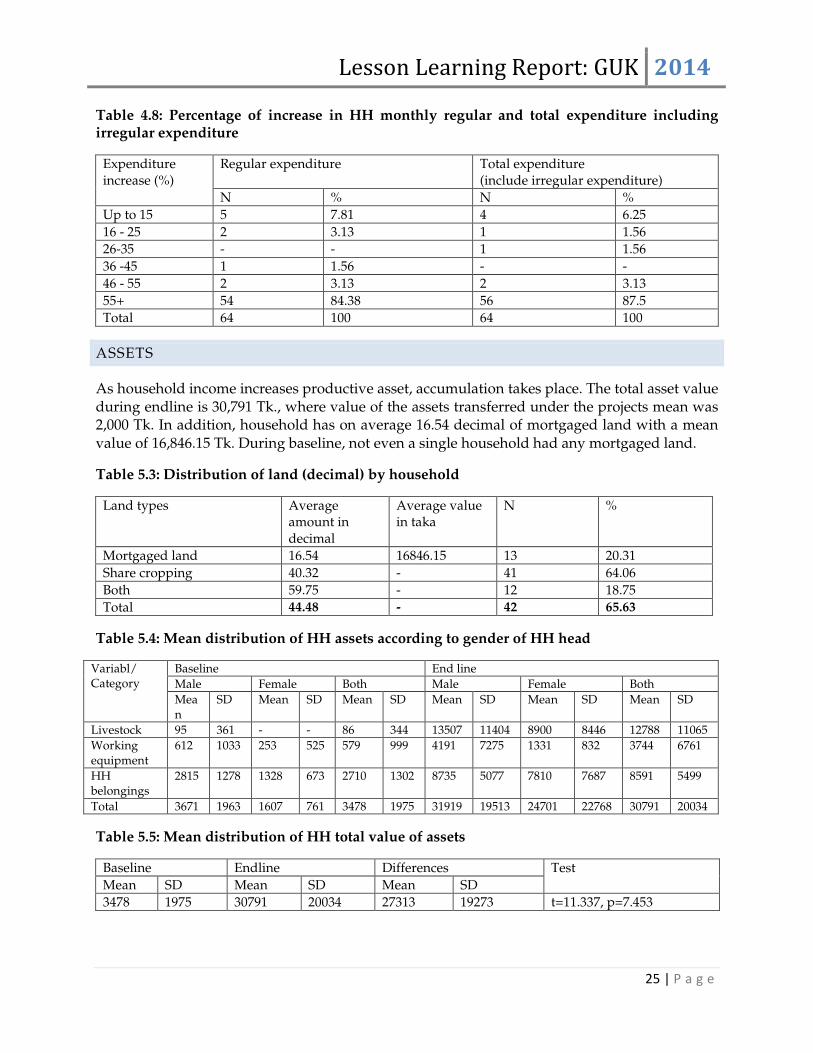
PERCENTAGE INCREASE IN EXPENDITURE
The endline findings indicate that total monthly expenditure, including irregular expenditures, of nearly 87.5% households increased more than 55% in comparison to baseline. However, the increase in total monthly expenditure of 6.25% households remains within 15%.
Baseline Endline Differences Test
Mean SD Mean SD Mean SD
23.07 8.20 56.89 38.46 33.82 39.75 t=6.807, p=4.335
Baseline differences End line differences
Mean SD Mean SD
-651 906 1801 3229
t=-5.74, p=2.908 t=4.463, p=3.416
Variables (sex)
Baseline Endline
Extreme poverty
Above extreme poverty
Total Extreme poverty
Above extreme poverty
Total
N % N % N % N % N % N %
Male 58 90.6 - - 58 90.6 5 7.8 49 76.6 54 84.4
Female 6 9.4 - - 6 9.4 4 6.3 6 9.4 10 15.6
Total 64 100 - - 64 100 9 14.1 55 85.9 64 100
Test Χ2=6.598, p=0.010
Lesson Learning Report: GUK 2014
25 | P a g e
Table 4.8: Percentage of increase in HH monthly regular and total expenditure including irregular expenditure
Expenditure increase (%)
Regular expenditure Total expenditure (include irregular expenditure)
N % N %
Up to 15 5 7.81 4 6.25
16 - 25 2 3.13 1 1.56
26-35 - - 1 1.56
36 -45 1 1.56 - -
46 - 55 2 3.13 2 3.13
55+ 54 84.38 56 87.5
Total 64 100 64 100
ASSETS
As household income increases productive asset, accumulation takes place. The total asset value during endline is 30,791 Tk., where value of the assets transferred under the projects mean was 2,000 Tk. In addition, household has on average 16.54 decimal of mortgaged land with a mean value of 16,846.15 Tk. During baseline, not even a single household had any mortgaged land.
Table 5.3: Distribution of land (decimal) by household
Land types Average amount in decimal
Average value in taka
N %
Mortgaged land 16.54 16846.15 13 20.31
Share cropping 40.32 - 41 64.06
Both 59.75 - 12 18.75
Total 44.48 - 42 65.63
Table 5.4: Mean distribution of HH assets according to gender of HH head
Variabl/ Category
Baseline End line
Male Female Both Male Female Both
Mean
SD Mean SD Mean SD Mean SD Mean SD Mean SD
Livestock 95 361 - - 86 344 13507 11404 8900 8446 12788 11065
Working equipment
612 1033 253 525 579 999 4191 7275 1331 832 3744 6761
HH belongings
2815 1278 1328 673 2710 1302 8735 5077 7810 7687 8591 5499
Total 3671 1963 1607 761 3478 1975 31919 19513 24701 22768 30791 20034
Table 5.5: Mean distribution of HH total value of assets
Baseline Endline Differences Test
Mean SD Mean SD Mean SD
3478 1975 30791 20034 27313 19273 t=11.337, p=7.453

Lesson Learning Report: GUK 2014
26 | P a g e
HOUSEHOLD SAVINGS AND LOAN
During baseline, not a single household had any savings. However in endline, 96.9% of households have some savings, among which 43.8% and 28.1%, have savings between 1,000-5,000 Tk. and 5,000-10,000 Tk. respectively. Total mean value of households is 9,784 Tk. This increase is as a result of awareness training sessions which included ‘savings attitudes’ to encourage households to save money.
Table 6.1: Distribution of HHs reporting to have savings
Category (TK.)
Baseline End line
Male Female Both Male Female Both
N % N % N % N Mean % N Mean % N Mean %
0 58 100 6 100 64 100 2 - 3.7 2 - 3.1
1-1000 - - - - - - 3 733 5.6 1 650 10 4 713 6.3
1001-5000 - - - - - - 22 3077 40.7 6 3050 60 28 3071 43.8
5001-10000 - - - - - - 17 7653 31.5 1 6000 10 18 7561 28.1
10001-15000
- - - - - - 4 14000 7.4 - - - 4 14000 6.3
15001-20000
- - - - - - 2 17000 3.7 1 15400 10 3 16467 4.7
20001+ - - - - - - 4 57700 7.4 1 65000 10 5 59160 7.8
Total 58 100 6 100 64 100 54 9645 100 10 10535 100 64 9784 100
Test Χ2=9.820, p=0.002 Χ2=48.071, p=0.086
Table 6.2: Places of savings
Places of Savings
Baseline Endline
N % N %
Bank 17 26.6
Relatives 5 7.8
Self 1 1.6 57 89.1
Group 4 6.3
Others 7 10.9

Lesson Learning Report: GUK 2014
27 | P a g e
HOUSING CONDITION AND ACCESS TO WATER SUPPLY, SANITATION AND ELECTRICITY
CHANGE IN WALL AND ROOF MATERIAL OF HOUSE
Table 7.1 Distribution of HHs according to wall construction materials and sex of HH heads.
Materials (walls)
Baseline End line
Male Female Both Male Female Both
N % N % N % N % N % N %
Grass/jute stick/ leaves/plastic
7 12.1 2 33.3 9 14.1 4 7.4 2 20 6 9.4
Bamboo 10 17.2 1 16.7 11 17.2 4 7.4 1 10 5 7.8
Wood - - - - - - - - - - - -
Mud - - - - - - - - - - - -
Tiles 39 67.2 3 50 42 65.6 - - - - - -
Tin/CI sheets 1 1.7 - - 1 1.6 45 83.3 7 70 52 81.3
Cement/brick 1 1.7 - - 1 1.6 1 1.9 - - 1 1.6
Others - - - - - - - - - - - -
Total 58 100 6 100 64 100 54 100 10 100 64 100
Test Χ2=2.203, p=0.699 Χ2=1.870, p=0.600
The baseline survey was conducted in April 2011 and the endline in the majority of the households. During baseline, almost all house walls were made of tiles (65.6%) and the rest was made of grass/bamboo/mud/tin. In endline, 81.3% of households reported walls made of tin. During baseline 93.8% households' house had a roof made of tiles, while in endline, 100% of households reported roofs made of tin.
The mean house-size increased considerably by the endline in comparison to the baseline. During baseline, the mean house size was 209sqft while in endline, it is 268sqft.
Table 7.3: Mean distribution for size of house and per capita housing space according to sex of HH head.
The mean house size has increased from a mean of 208.98 sqft to 267.68.
Categories Mean of house size (sqft) Mean of per capital floor space (sqft)
Mean SD Mean SD
Baseline 208.98 62.54 58.55 24.15
Endline 267.68 97.56 64.55 29.64
ACCESS TO SAFE WATER
The endline findings in regards to improved access to a water source show improvement. According to endline, 100% households reported that they collect drinking water from hand tubewell, while during baseline its numbers remained the same.

Lesson Learning Report: GUK 2014
28 | P a g e
OWNERSHIP OF PROTECTED SOURCE
During baseline, only 70.3% of households owned any protected source of water and other households collected water from public sources, government-owned sources, or sources owned by others. However, endline findings indicate that a majority of the beneficiary households (76.6%) use water sources owned by them, or share ownership of a water source (14.1%). Table 7.6: Distribution of HHs according to ownership of hand tube wells and sex of HH heads.
Sources of drinking water
Baseline Endline
Male Female Both Male Female Both
N % N % N % N % N % N %
Owned by household
41 70.7 4 66.7 45 70.3 45 83.3 4 40 49 76.6
Shared ownership 9 15.5 1 16.7 10 15.6 6 11.1 3 30 9 14.1
Own by others 1 1.7 - - 1 1.6 3 5.6 3 30 6 9.4
Not applicable - - - - - - - - - - - -
Public (Government)
7 12.1 1 16.7 8 12.5 - - - - - -
NGO Supplied - - - - - - - - - - - -
Others - - - - - - - - - - - -
Total 58 100 6 100 64 100 54 100 10 100 64 100
Test Χ2=1.684, p=0.794 Χ2=9.588, p=0.008
SANITATION
The endline findings indicate a positive shift in defecation practices since baseline. During baseline, nearly 39.1% households defecated in open space. The rest (51.6%), had ring/slab latrines and (4.7) pit latrines. In contrast, endline findings indicate that 100% of the households defecate in ring/slab latrines/pit latrines/sanitary latrines.
Table 7.7: Distribution of HH according to place of defecation and sex of HH heads.
Place of defecation
Baseline Endline Monthly snapshot
Male Female Both Male Female Both Male Female Both
N % N % N % N % N % N % N % N % N %
Open spaces
22 37.9 3 50 25 39.1 - - - - - - - - - - - -
Hanging latrine
- - - - - - - - - - - - - - - - - -
Pit latrine 3 5.2 - - 3 4.7 1 1.9 - - 1 1.6 1 1.9 - - 1 1.6
Ring/slab latrine
30 51.7 3 50 33 51.6 51 94.4 9 90 60 93.8 51 94.4 9 90 60 93.8
Complete Sanitary
- - - - - - 2 3.7 1 10 3 4.7 2 3.7 1 10 3 4.7
Others 3 5.2 - - 3 4.7 - - - - - - - - - - - -
Total 58 100 6 100 64 100 54 100 10 100 64 100 54 100 10 100 64 100
Test Χ2=0.827, p=0.843 Χ2=0.917 , p=0.632 Χ2=0.917 , p=0.632
Lesson Learning Report: GUK 2014
29 | P a g e
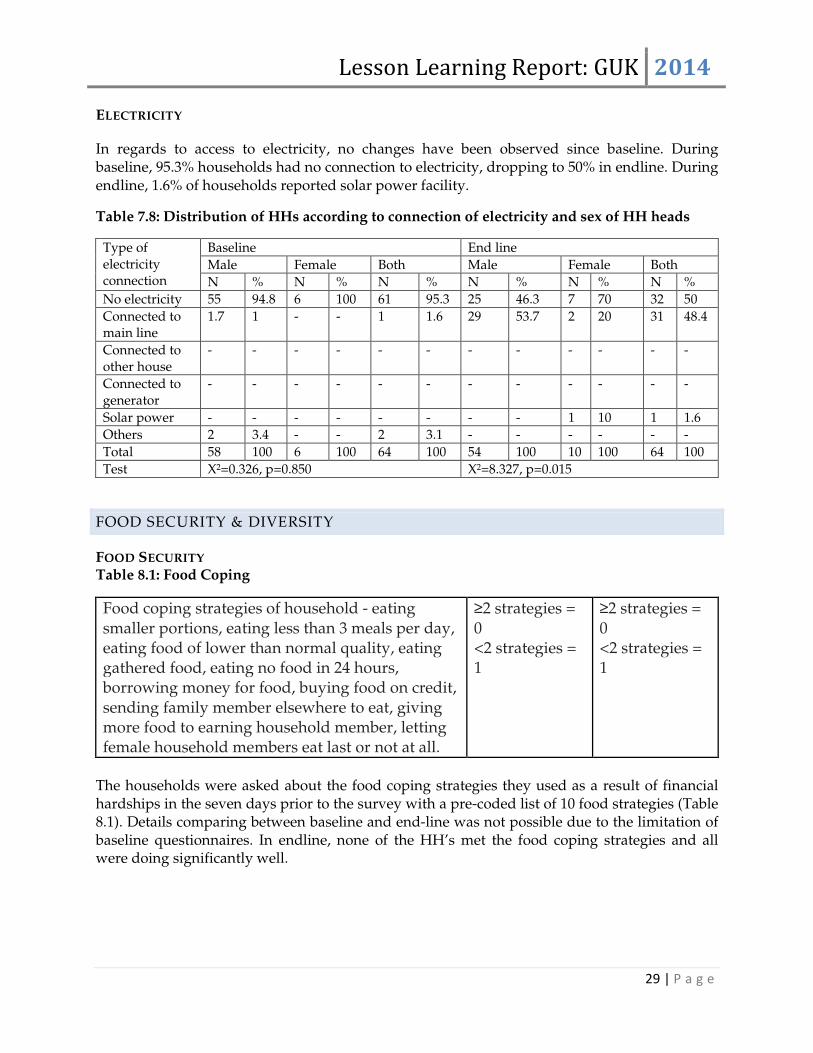
ELECTRICITY
In regards to access to electricity, no changes have been observed since baseline. During baseline, 95.3% households had no connection to electricity, dropping to 50% in endline. During endline, 1.6% of households reported solar power facility.
Table 7.8: Distribution of HHs according to connection of electricity and sex of HH heads
Type of electricity connection
Baseline End line
Male Female Both Male Female Both
N % N % N % N % N % N %
No electricity 55 94.8 6 100 61 95.3 25 46.3 7 70 32 50
Connected to main line
1.7 1 - - 1 1.6 29 53.7 2 20 31 48.4
Connected to other house
- - - - - - - - - - - -
Connected to generator
- - - - - - - - - - - -
Solar power - - - - - - - - 1 10 1 1.6
Others 2 3.4 - - 2 3.1 - - - - - -
Total 58 100 6 100 64 100 54 100 10 100 64 100
Test Χ2=0.326, p=0.850 Χ2=8.327, p=0.015
FOOD SECURITY & DIVERSITY
FOOD SECURITY Table 8.1: Food Coping
Food coping strategies of household - eating smaller portions, eating less than 3 meals per day, eating food of lower than normal quality, eating gathered food, eating no food in 24 hours, borrowing money for food, buying food on credit, sending family member elsewhere to eat, giving more food to earning household member, letting female household members eat last or not at all.
≥2 strategies = 0 <2 strategies = 1
≥2 strategies = 0 <2 strategies = 1
The households were asked about the food coping strategies they used as a result of financial hardships in the seven days prior to the survey with a pre-coded list of 10 food strategies (Table 8.1). Details comparing between baseline and end-line was not possible due to the limitation of baseline questionnaires. In endline, none of the HH’s met the food coping strategies and all were doing significantly well.
Lesson Learning Report: GUK 2014
30 | P a g e
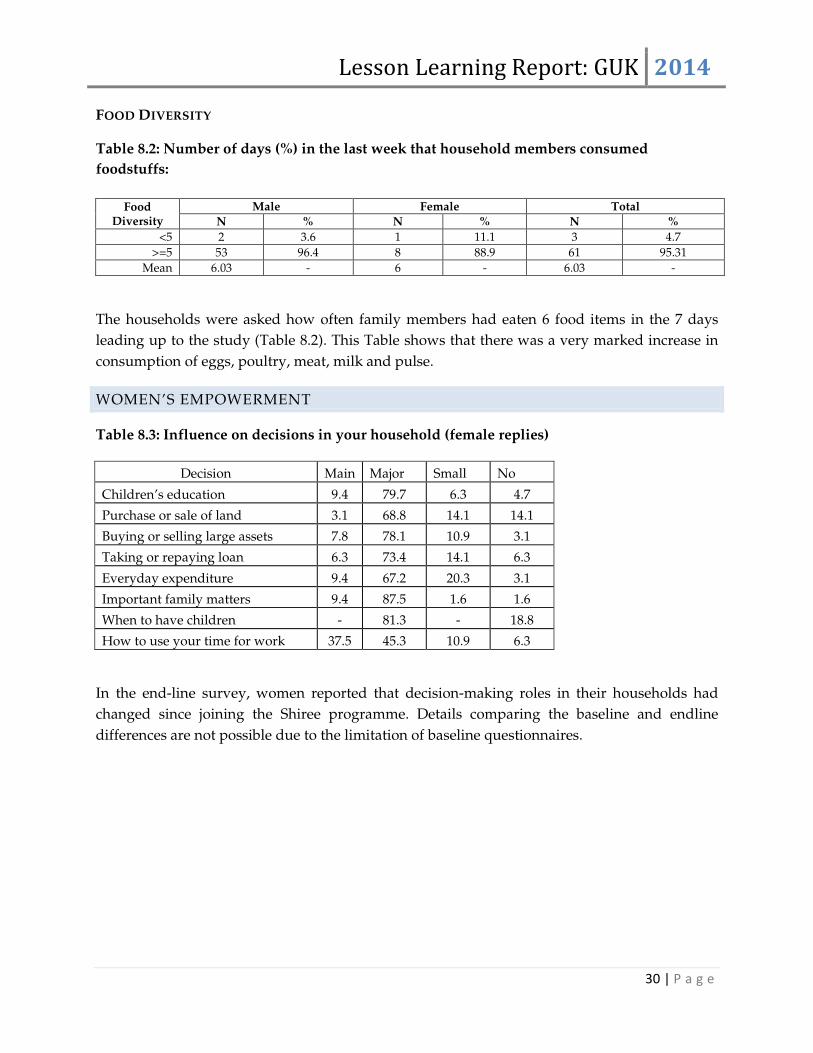
FOOD DIVERSITY
Table 8.2: Number of days (%) in the last week that household members consumed
foodstuffs:
The households were asked how often family members had eaten 6 food items in the 7 days
leading up to the study (Table 8.2). This Table shows that there was a very marked increase in
consumption of eggs, poultry, meat, milk and pulse.
WOMEN’S EMPOWERMENT
Table 8.3: Influence on decisions in your household (female replies)
Decision Main Major Small No
Children’s education 9.4 79.7 6.3 4.7
Purchase or sale of land 3.1 68.8 14.1 14.1
Buying or selling large assets 7.8 78.1 10.9 3.1
Taking or repaying loan 6.3 73.4 14.1 6.3
Everyday expenditure 9.4 67.2 20.3 3.1
Important family matters 9.4 87.5 1.6 1.6
When to have children - 81.3 - 18.8
How to use your time for work 37.5 45.3 10.9 6.3
In the end-line survey, women reported that decision-making roles in their households had
changed since joining the Shiree programme. Details comparing the baseline and endline
differences are not possible due to the limitation of baseline questionnaires.
Food Diversity
Male Female Total
N % N % N %
<5 2 3.6 1 11.1 3 4.7
>=5 53 96.4 8 88.9 61 95.31
Mean 6.03 - 6 - 6.03 -
Lesson Learning Report: GUK 2014
31 | P a g e
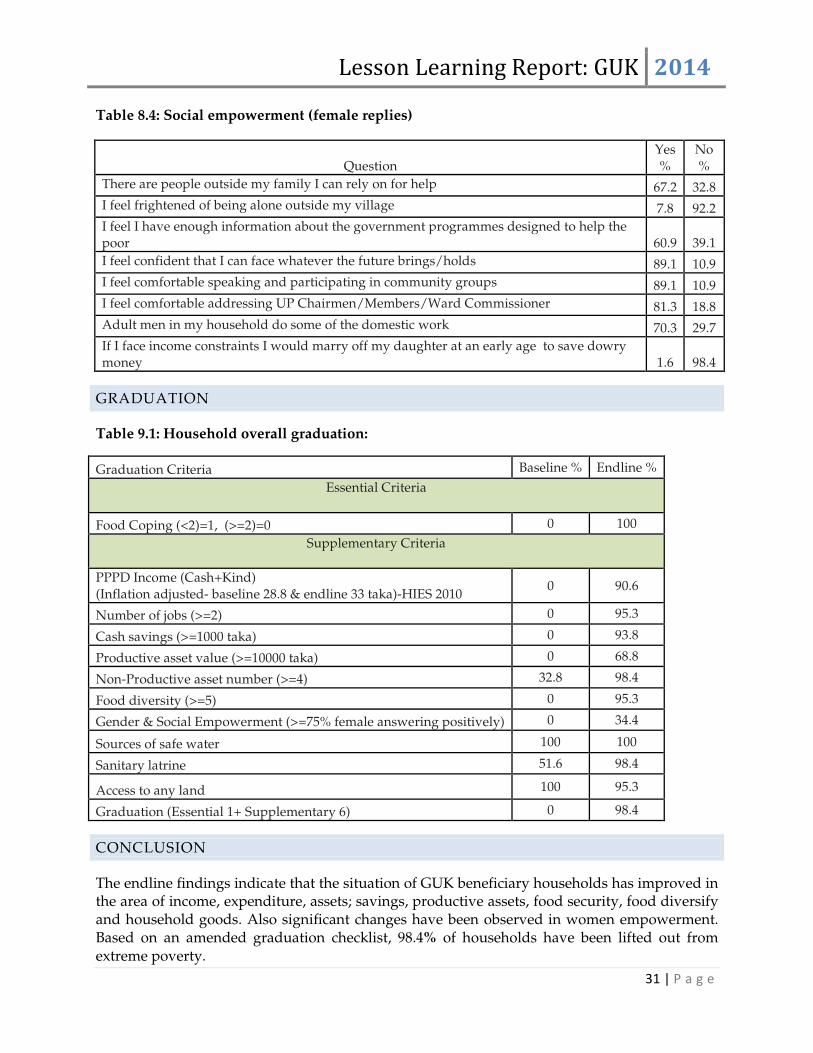
Table 8.4: Social empowerment (female replies)
Question Yes %
No %
There are people outside my family I can rely on for help 67.2 32.8 I feel frightened of being alone outside my village 7.8 92.2 I feel I have enough information about the government programmes designed to help the poor 60.9 39.1 I feel confident that I can face whatever the future brings/holds 89.1 10.9 I feel comfortable speaking and participating in community groups 89.1 10.9 I feel comfortable addressing UP Chairmen/Members/Ward Commissioner 81.3 18.8 Adult men in my household do some of the domestic work 70.3 29.7 If I face income constraints I would marry off my daughter at an early age to save dowry money 1.6 98.4
GRADUATION
Table 9.1: Household overall graduation:
Graduation Criteria Baseline % Endline %
Essential Criteria
Food Coping (<2)=1, (>=2)=0 0 100
Supplementary Criteria
PPPD Income (Cash+Kind) (Inflation adjusted- baseline 28.8 & endline 33 taka)-HIES 2010
0 90.6
Number of jobs (>=2) 0 95.3
Cash savings (>=1000 taka) 0 93.8
Productive asset value (>=10000 taka) 0 68.8
Non-Productive asset number (>=4) 32.8 98.4
Food diversity (>=5) 0 95.3
Gender & Social Empowerment (>=75% female answering positively) 0 34.4
Sources of safe water 100 100
Sanitary latrine 51.6 98.4
Access to any land 100 95.3
Graduation (Essential 1+ Supplementary 6) 0 98.4
CONCLUSION
The endline findings indicate that the situation of GUK beneficiary households has improved in the area of income, expenditure, assets; savings, productive assets, food security, food diversify and household goods. Also significant changes have been observed in women empowerment. Based on an amended graduation checklist, 98.4% of households have been lifted out from extreme poverty.

Lesson Learning Report: GUK 2014
32 | P a g e
Conclusion: Progress against Log Frame
Hierarchy of Objectives
Verifiable Indicators
Means of Verification
Achievement Assumptions
Government of Bangladesh MDG targets 1 and 2 on income poverty reduction and hunger achieved by 2015
Reduction in the proportion of people living in extreme poverty from 28% in 1991-1992 to 9.5% by 2015 (in line with PRSP targets)
Government of Bangladesh, National MDG-Report, UNDP and World Bank statistics
Purpose: 1,160 extreme poor BHHs (minimum 50% women) lifted out of poverty by 2013 Immediate objective: - Develop skills of interested young women (minimum 50%) and men of extreme poor families on sewing machine operation of woven garments factories. - Facilitate regular job opportunities for targeted beneficiaries in established garments factories with particular emphasis on maintaining intensive communication/ supervision at preliminary stage.
- All BHHs doubled their income assets - Target HHs have average amount of savings BDT 6,000 - All of BHHs report an increase in their ability to make effective livelihoods choices
- Baseline survey - Shiree CMS - Periodical reports of project - Mid-term external evaluation reports - Endline survey - Lesson learning reports
- All BHHs have doubled their income (minimum income of each HHs is BDT 4,500) - Average value of household assets increased more than 80% in the project area. - 1,110 BHHs (96%) have an average amount of savings of BDT 4,794 and growing - 337 beneficiaries/ BHHs (29%) opened DPS/bank accounts with scheduled bank and deposit savings - The net amount of beneficiary level savings so far for 276 participants is BDT 472,010 (4 lac,, 72 thousand and 10) and this is growing
- Global economic factors do not significantly affect the garment sector of Bangladesh - Workers issues dealt with systematically through upholding rule of law by all

Lesson Learning Report: GUK 2014
33 | P a g e
Output 1: 1,160 extreme poor marginalized persons (min 50% women) have been trained in skilled machine operation of woven garments
- 1,160 extreme poor BHHs selected - 1,160 extreme poor BHHs trained and certified in skilled machine operation of woven garments - Field facilitator visited 1,160 persons everyday for 1st week and subsequently every month
- Project records - Periodic progress report - Shiree CMS - Mid-term evaluation report - Endline survey report of the project
- All 10 inception workshops conducted with all relevant stakeholders - Conducted 416 PRA session at different villages for beneficiaries selection - 1,160 extreme poor BHHs selected considering the approved beneficiary selection criteria (Female: 514/ Male: 646) - All beneficiaries have received skill development training on oven and footwear machine operation - All beneficiaries have received awareness sessions on 14 different social and development issues - Field facilitator has visited 1,160 persons everyday for the 1st week and subsequently every month
No major natural calamities occur during project period
Output 2: 1,160 extreme poor persons (minimum 50% women) secure employment in woven garments factories
- 1,160 persons secure employment - BGMEA formally adopts policy to encourage members to develop similar programmes - National level conference with BGMEA - MoU signed with
- Project records - Periodic progress reports - Shiree CMS - Mid-term evaluation report - Endline survey report of the project
- Have organized sharing meeting with BGMEA - Memorandum of Understanding (MOU) has been signed with Apax Adelchi Footwear Limited and 4 others garments factories - BGMEA open a skill development training center at Uttara, Dhaka and implementing this
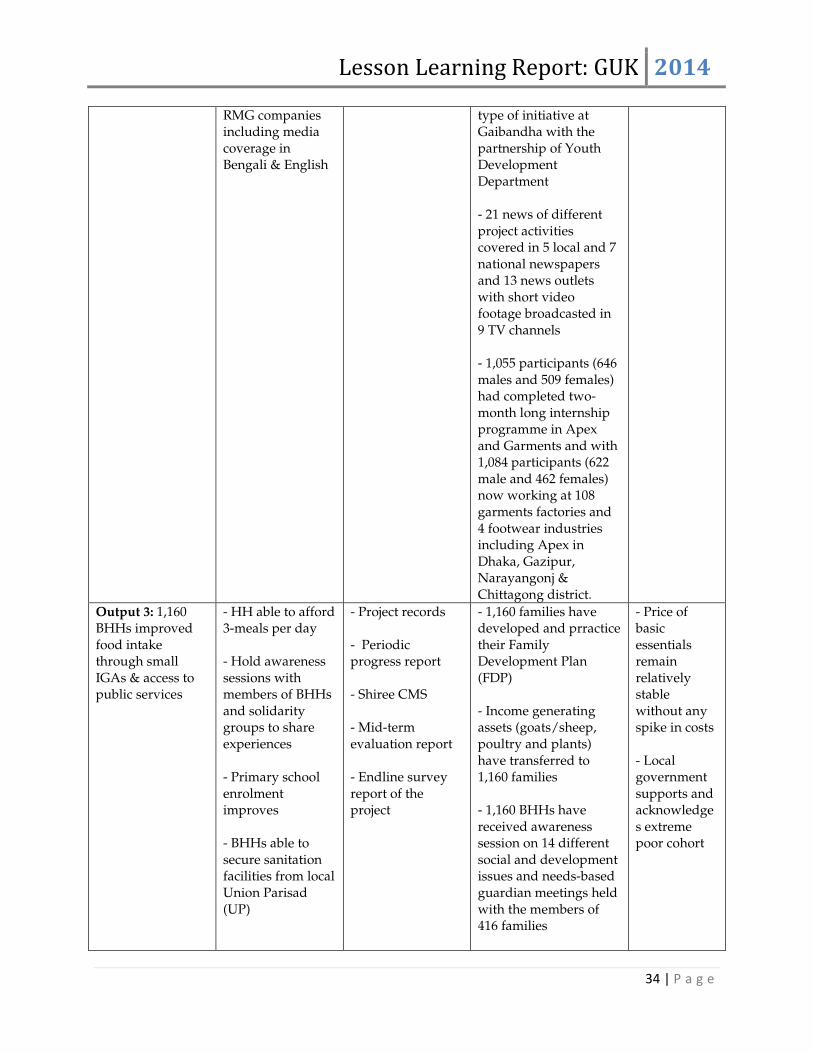
Lesson Learning Report: GUK 2014
34 | P a g e
RMG companies including media coverage in Bengali & English
type of initiative at Gaibandha with the partnership of Youth Development Department - 21 news of different project activities covered in 5 local and 7 national newspapers and 13 news outlets with short video footage broadcasted in 9 TV channels - 1,055 participants (646 males and 509 females) had completed two-month long internship programme in Apex and Garments and with 1,084 participants (622 male and 462 females) now working at 108 garments factories and 4 footwear industries including Apex in Dhaka, Gazipur, Narayangonj & Chittagong district.
Output 3: 1,160 BHHs improved food intake through small IGAs & access to public services
- HH able to afford 3-meals per day - Hold awareness sessions with members of BHHs and solidarity groups to share experiences - Primary school enrolment improves - BHHs able to secure sanitation facilities from local Union Parisad (UP)
- Project records - Periodic progress report - Shiree CMS - Mid-term evaluation report - Endline survey report of the project
- 1,160 families have developed and prractice their Family Development Plan (FDP) - Income generating assets (goats/sheep, poultry and plants) have transferred to 1,160 families - 1,160 BHHs have received awareness session on 14 different social and development issues and needs-based guardian meetings held with the members of 416 families
- Price of basic essentials remain relatively stable without any spike in costs - Local government supports and acknowledges extreme poor cohort
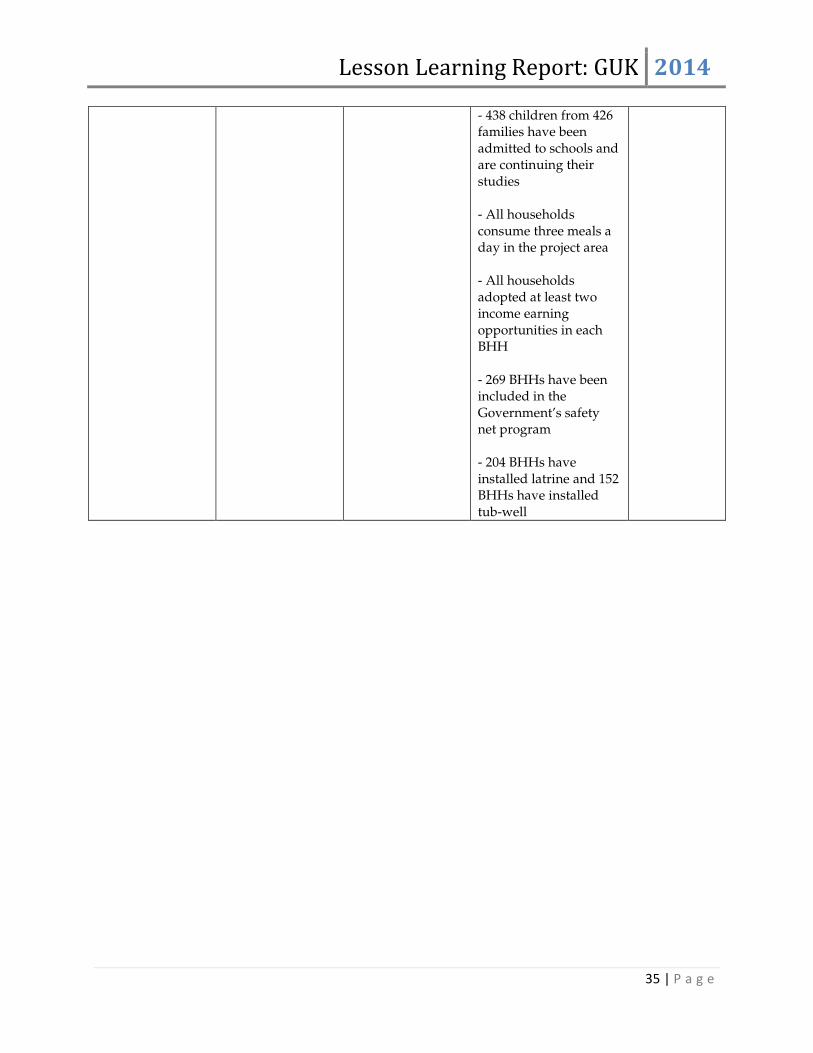
Lesson Learning Report: GUK 2014
35 | P a g e
- 438 children from 426 families have been admitted to schools and are continuing their studies - All households consume three meals a day in the project area - All households adopted at least two income earning opportunities in each BHH - 269 BHHs have been included in the Government’s safety net program - 204 BHHs have installed latrine and 152 BHHs have installed tub-well
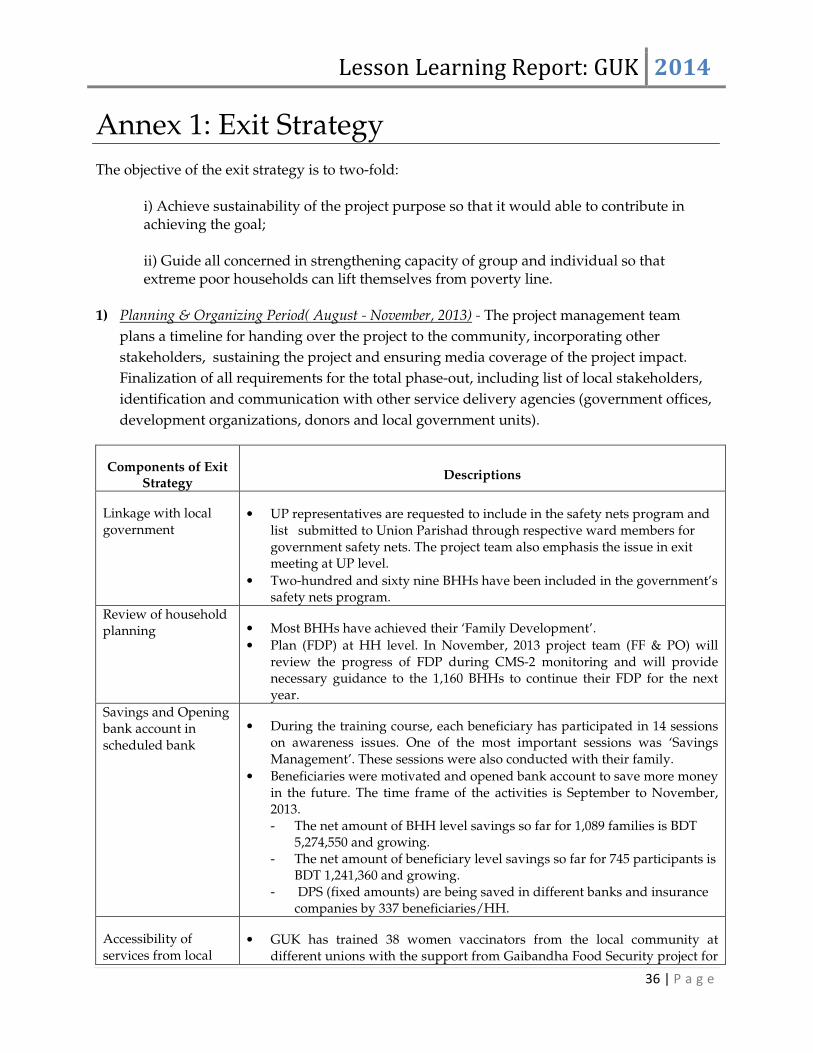
Lesson Learning Report: GUK 2014
36 | P a g e
Annex 1: Exit Strategy The objective of the exit strategy is to two-fold:
i) Achieve sustainability of the project purpose so that it would able to contribute in achieving the goal; ii) Guide all concerned in strengthening capacity of group and individual so that extreme poor households can lift themselves from poverty line.
1) Planning & Organizing Period( August - November, 2013) - The project management team
plans a timeline for handing over the project to the community, incorporating other
stakeholders, sustaining the project and ensuring media coverage of the project impact.
Finalization of all requirements for the total phase-out, including list of local stakeholders,
identification and communication with other service delivery agencies (government offices,
development organizations, donors and local government units).
Components of Exit Strategy
Descriptions
Linkage with local government
• UP representatives are requested to include in the safety nets program and list submitted to Union Parishad through respective ward members for government safety nets. The project team also emphasis the issue in exit meeting at UP level.
• Two-hundred and sixty nine BHHs have been included in the government’s safety nets program.
Review of household planning • Most BHHs have achieved their ‘Family Development’.
• Plan (FDP) at HH level. In November, 2013 project team (FF & PO) will review the progress of FDP during CMS-2 monitoring and will provide necessary guidance to the 1,160 BHHs to continue their FDP for the next year.
Savings and Opening bank account in scheduled bank
• During the training course, each beneficiary has participated in 14 sessions on awareness issues. One of the most important sessions was ‘Savings Management’. These sessions were also conducted with their family.
• Beneficiaries were motivated and opened bank account to save more money in the future. The time frame of the activities is September to November, 2013. - The net amount of BHH level savings so far for 1,089 families is BDT
5,274,550 and growing. - The net amount of beneficiary level savings so far for 745 participants is
BDT 1,241,360 and growing. - DPS (fixed amounts) are being saved in different banks and insurance
companies by 337 beneficiaries/HH.
Accessibility of services from local
• GUK has trained 38 women vaccinators from the local community at different unions with the support from Gaibandha Food Security project for
Lesson Learning Report: GUK 2014
37 | P a g e
vaccinators
ultra poor women. They will work with project beneficiaries HH by providing de-worming, vaccinations, and treatments of their cattle with payment.
The Innovation Fund project model are being replicated or scaled up
• During the implementation of the Shiree funded project (IF-3), many visitors from donor agencies and research organization visited the site and became interested in the project. Throughout the project, we will share our achievements and learning with them. Through on-going discussion we will try to jointly design and replicate/scaled up the project with their funding support. After completion of this innovation project, at least one project will be implemented using this model and we are hopeful that some impact research will be implement with this project beneficiaries’
• In some cases, we will submit our idea and project to the donors. We are currently searching for donors to replicate the project in other areas.
2) Full Phase out (November 2013): During this period, the project management team will organize 10 exit meetings with 10 working unions of the project and will organize one press conference event, and invite project stakeholders, local service delivery agencies, local elected bodies, local government authorities, local and national media.
Components of Exit Strategy
Descriptions
Exit meeting at union level with joint collaboration of UP (10 meetings in 10 working unions)
• We will organize exit meetings at the union level with joint collaboration of UP. The meeting will be organized on regular monthly basis. UP representatives, local elite, respective service providers from GoB, extreme poor HHs and media will attend the meeting.
• Concern project officer of GUK-REPSDG project will act as the facilitators for the event. Venue: Union parished hall room of respective union. Meeting will be finalized with the consultation of UP Chairman.
Tentative Agenda for the Exit Meeting:
1. Field facilitators will share knowledge, experience and constraints they faced during this project implementation.
2. Project officers will read success stories. 3. Direct beneficiaries and their family members will share their
experiences and success stories. 4. List of beneficiaries and project documents will be given to the
Union Parished and local service providers.
• Vote of thanks to concerned stakeholders who provided their cooperation.
Organize a press conference at Gaibandha
• GUK will organize a press conference with the journalist of print and electronic media outlets. The Chief Executive of GUK will act as the facilitators of the event. Project Manager of GUK-REPSDG project will present the overall activities, achievements, and learning’s of the project. A question and answer session will be organized at the last stage of the event. Approximately 40 journalists from print, electronic and online media outlets will participate in the event. Venue: GUK Conference Room, Gaibandha, Date: November 07, 2013.

Lesson Learning Report: GUK 2014
38 | P a g e
Outcomes:
1. Journalists aware of the progress status of the project and positive changes of BHH level
2. The media presents the project to the public and will play an advocacy role for including those BHHs in government safety nets program
Submission of BHHs list and asset distribution documents to Union Parishad
• GUK-REPSGD project team will hand over the BHHs list and asset distribution documents to Union Parishad to ensure the progress of monitoring and other services to the BHHs during exit meeting at UP level.
Link BHHs with GUK‟s other on-going activities
• The graduated BHHs of this project will be linked with other ongoing activities like food security, sanitation, technical support on agriculture, etc.
• GUK management give decision to concerned Project managers in the respective area to include these BHHs with their existing services and continue follow up on them in order to ensure sustainable graduation.

Lesson Learning Report: GUK 2014
39 | P a g e
Annex 2: Financial Overview The table below represents the financial overview of the project’s spendings:
Budget Line Original Budget (BDT)
Revised Budget (BDT)
Actual Expenditure
(BDT)
Expenditure for only the
month of Jan 2014 (BDT)
Variance with
Original Budget (BDT)
Variance with
Revised Budget (BDT)
Human Recourses costs
6,176,630 5,709,674 5,689,824 53,240 486,806 19,850
Travelling 416,000 630,153 609,796 - 193,796 20,357
Vehicle , Motorcycle & Equipments
713,000 632,834 632,834 - 80,166 -
Office rent & Utilities
433,000 315,183 282,601 3,400 150,399 32,582
Administration cost
711,900 536,976 455,430 - 256,470 81,546
Operational cost 381,650 538,971 490,871 220,338 109,221 48,100
Direct Delivery 21,162,350 21,383,148 20,474,073 627,260 688,277 909,075
Management cost 5%
1,499,727 1,490,835 1,431,771 14,881 67,956 59,064
Contingency 1,499,727 1,756,159 - - 1,499,727 1,756,159
Grand Total (BDT)
32,993,983 32,993,933 30,067,200 335,401 2,926,783 2,926,733

Lesson Learning Report: GUK 2014
40 | P a g e
Annex 3: Innovation Revisions The table below compares the initial innovation and project activities to the revised innovation:
Innovation Revisions
Output 1: 1,160 extreme poor marginalized persons (min 50% women) have been trained in skilled machine operation of woven garments
• 1,160 extreme poor BHHs selected based on the approved beneficiary selection criteria (Female-514, Male-646)
• 100% of beneficiaries have received skill development training on oven and footwear machine operation
• 100% of beneficiaries have received awareness sessions on 14 different social and development issues
• Field facilitator visited 1,160 persons for the 1st week of the project and subsequently every month
• 10 inception workshops conducted with all relevant stakeholders
N/A
Output 2: 1,160 extreme poor persons (minimum 50% women) secure employment in woven garments factories
• Organized sharing meeting with BGMEA
• Memorandum of Understanding (MOU) has been signed with Apax Adelchi Footwear Limited and 4 other garments factories
• BGMEA opened a skill development training center in Uttara and Dhaka, while also implementing this type of initiative at Gaibandha through a partnership with Youth Development Department
• 21 news publications of different project activities covered in 5 local and 7 national newspapers, and 13 news pieces including a short video footage broadcasted in 9 TV channels
• 1,055 participants (646 males and 509 females) attended a two-month long internship programme in Apex and garments and after successfully completion of internship, 1,084 participants (622 male and 462 females) are now continuing their jobs at 108 garments and 4 footwear factories including Apex in Dhaka, Gazipur, Narayangonj & Chittagong district
N/A
Output 3: 1,160 BHHs improved food intake through small IGAs & access to public services
• 1,160 families have developed and practicing their Family Development Plan (FDP)
• Income generating assets (goats, sheep, poultry and plants) have been transferred to 1,160 families
• 1,160 BHHs have received awareness session on 14 different social and development issues and need based Guardians meetings held with the members of 416 families
• 438 children from 426 families have been admitted to schools and are continuing their studies
• 100% of households consume three meals a day in the project area
• 100% of households adopted at least two income earning opportunities in each BHH
• 244 BHHs have been included in the Government’s safety net program
• 198 BHHs have installed latrine and 135 BHHs have installed tub-well
N/A