final feasibility report
DESCRIPTION
mineral water projectTRANSCRIPT
FEASIBILTY REPORT
PURIFIED AND MINERALIZED
BOTTELED WATERPrepared by :- Hammad Mirza(58186)
Wisha Sohail(58224)
Harris Bin Shabbir Khan(58065)
Syed Qaim Ali Moosvi(57512)

TABLE OF CONTENTS

PERSONAL INFORMATIONWe are a group of 4 business graduates and doing our bachelors in business administration. We chose entrepreneurship as our career opportunity and decided to inject our investment in a pool of mutually acceptable business in order to start our professional career.
After a close market survey we chose to start business of purified and mineralized bottle water due to the increasing demand and growth potential in this business.
The business ideaBottled water often called drinking water is usually bottled at the source and sealed in safe drinking containers. Bottled water is a food product that considerably depends on the environment from which it originates not only at the place where it is produced but predominately on the conditions in the recharge area of the wells captured for bottling water is initial for life, human beings can only survive for a few minutes as 75 percent of body fluid is made up of water. Ordinarily, water is subjected to varying degree of pollution, depending on the source. Therefore water meant for human consumption must be treated in order to remove all the unwanted parameters.
Potential and opportunity to grow
The market for mineral water has been showing a mushroom growth trends over the last few years. The country’s market is very small on a global scale and was estimated at 33 million liters a year by the end of 1998. The last three years have shown more growth and the market has been estimated to grow 70 million liters and the per capita consumption is 0.5 liters. The annual growth rate for bottled water is 45%. According to the study conducted in 2004, Pakistan registered the highest growth of 140% in 2003 amongst the countries in Asia and middle east region.
The potential market for bottled consist of foreign tourist and foreigners working in Pakistan, hotel industry, patients (bottled water is also used to avoid the possible consumption of contaminated water for patients) and travelers. Moreover the bottled water has been emerging as a daily preference of the elite class. Karachi being the biggest city of Pakistan has been facing the problem of drinking water shortage. This further integrates the demand for pure drinking water in Karachi.
Project Brief
This proposed project presents an investment opportunity for establishing a bottled water plant for providing pure drinking water. The proposed product line will consist of bottles of 19 liters. In the initial phase of the project only 19 liters and 1.5 liters bottle will be introduced in the local market. After successful introduction of the new brand of bottled water the product line may be extended to 0.5 and 1 liters bottle.
Process
Ground water will be used as a source of supply which will be tested to know the quantity of minerals and deposits contained in water, water will then be passed into the reverse osmosis plant known as RO plant which will filter and purify that water and then it is further passed to add essential minerals and then it will be filled in 19 liters of bottles and sealed. Below is a diagrammatic process chart.
Critical Factors
Before making any investment decision, it is advisable to evaluate the associated risk factors by taking into consideration certain key elements. For establishing water purification plant critical factors that should be considered before launching are described below.
Compliance of the water quality standards of Pakistan Standards & Quality Control Authority (PSQCA) and license from the authority.
The market for purified bottled / mineral water is a growing market, but offers tough competition.
Perception / positioning of the new brand. Usually the top target market for bottled mineral water follows the
perception. If the perception is positive, the results will be higher sales. The positive perception for distributors and final customers may result from direct consumer experience, awareness, direct promotional activities, print media and TV advertising. Distribution is very important for the success of new brand. The stronger the distribution the more successful will be the new brand. The distribution strategy should be designed after a careful study of the market for going for regional distribution or for nation wide distribution.
Pre-launch advertising is vital for positive perception of the product, which will result in higher product acceptance
Legal requirements
The assessment of the suitability of water for human consumption shall be based on consideration of its physical, chemical and microbiological requirements and limits for toxic substances. The water should be free from all chemical and bacteriological contaminations which are hazardous to health.
The general requirements for establishing a bottled / mineral water plant as developed by Pakistan Standard Quality Control Authority are as following:-

REQUIREMENTS UNITSPh range 7.0-8Total dissolve solids 200mg/litNitrate 0.020mg/litChloride 40mg/litsulphate 10mg/litSodium 20mg/litpotassium 10mg/lit
Market analysisProposed location
We will be choosing federal B area installing our plant as Rental cost is low as compared to other areas, the quality of ground water is much better compared to other areas. Moreover it’s a residential areas which faces severe shortage of water so demand for local consumption is high. There are no plants nearby.
Market size and segment
Our market is divided into 3 segments which consist of Households for domestic consumption, offices and other local distributors.
Market trends
The market and demand for purified water is increasing day by day with some variations. In summer demand is quite high and it is often observed that the distributors face serious challenges to meet the demand. Secondly during rainy seasons demand increases and people who don’t consume bottle water start consuming it due to contaminated water supply during rains. A decline is seen in winter seasons due to fall in consumption of water in winters. Overall the demand is growing throughout the year.

Competition
Below is a list of brands which are supplying there water in the chosen area.
Niagra Nestle Pure AVA Sparklets Masafi Aqua Safe
The price range for 19 liter category is from Rs.80-90 for available brands.
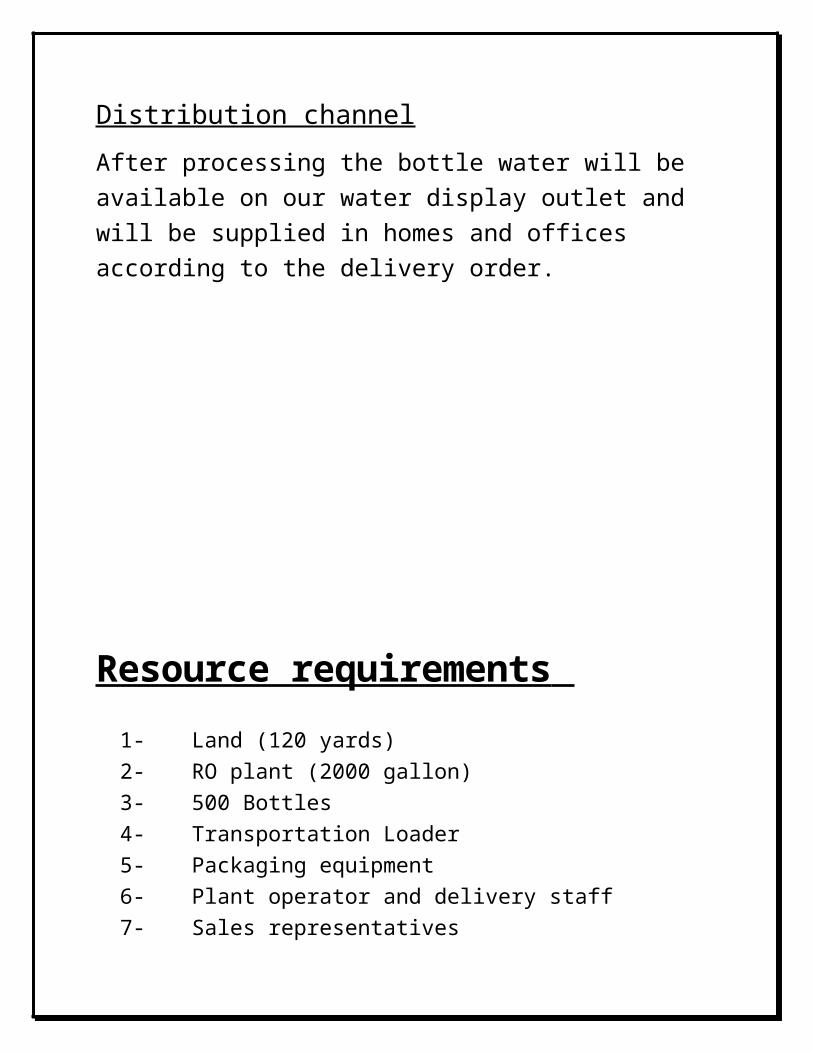
Distribution channel
After processing the bottle water will be available on our water display outlet and will be supplied in homes and offices according to the delivery order.

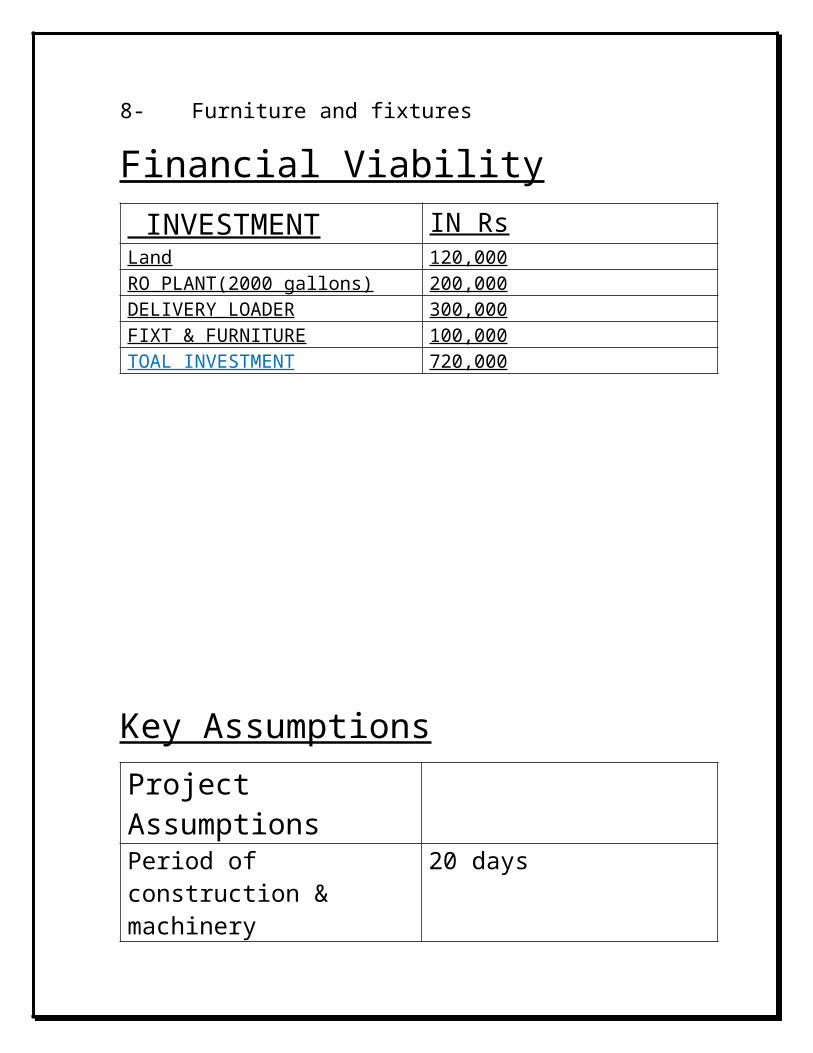
Resource requirements 1- Land (120 yards)2- RO plant (2000 gallon)3- 500 Bottles4- Transportation Loader5- Packaging equipment6- Plant operator and delivery staff 7- Sales representatives 8- Furniture and fixtures
Financial Viability INVESTMENT IN RsLand 120,000RO PLANT(2000 gallons) 200,000DELIVERY LOADER 300,000FIXT & FURNITURE 100,000TOAL INVESTMENT 720,000

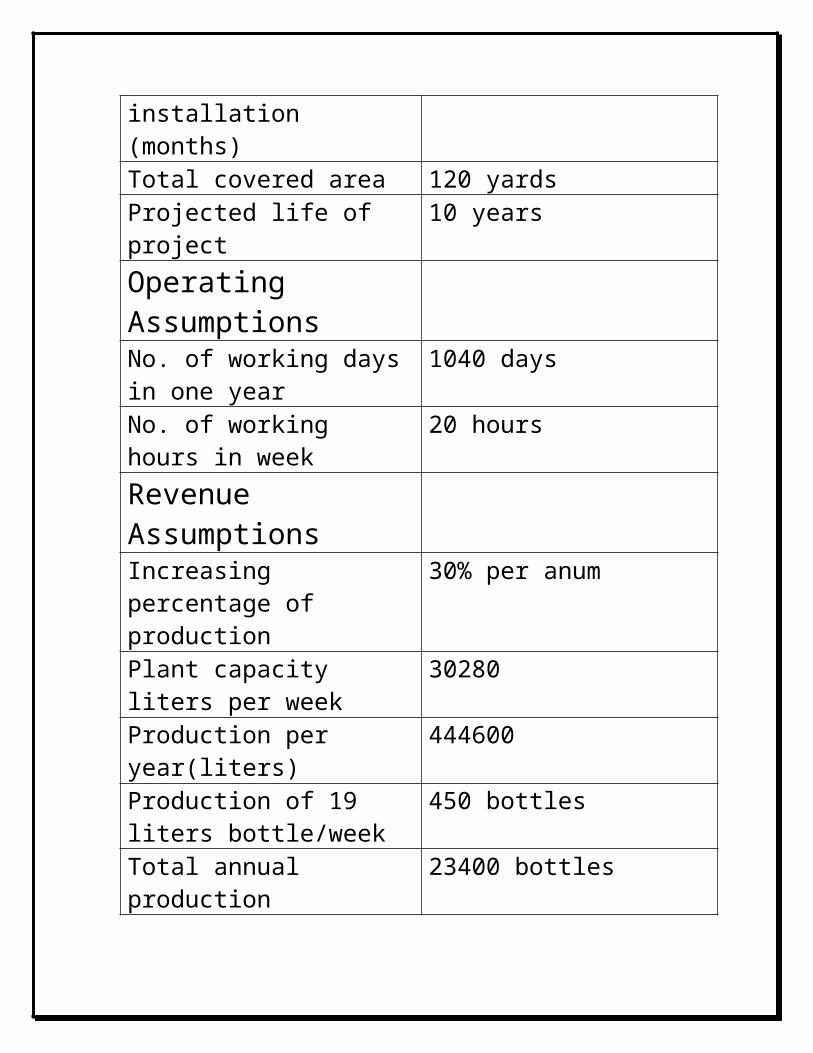
Key AssumptionsProject AssumptionsPeriod of construction & machinery installation (months)
20 days
Total covered area 120 yardsProjected life of project 10 yearsOperating AssumptionsNo. of working days in one year
1040 days
No. of working hours in week 20 hoursRevenue AssumptionsIncreasing percentage of production
30% per anum
Plant capacity liters per week 30280Production per year(liters) 444600Production of 19 liters bottle/week
450 bottles
Total annual production 23400 bottlesSales price of 19 liter bottle 80 rsAnnual sales turnover 1872000
Total Annual CostIncrease in yearly cost 30%Rent 20,000 per month (year)(fixed)
240,000 rs
Transportation cost (year) 72000 rs

(variable)Electricity cost (year)(variable)
120,000 rs
Labour (year)(variable) 360,000 rsDepreciation expense 10,000Maintenance per year 10,000 rsRaw material consumed/year 10,000
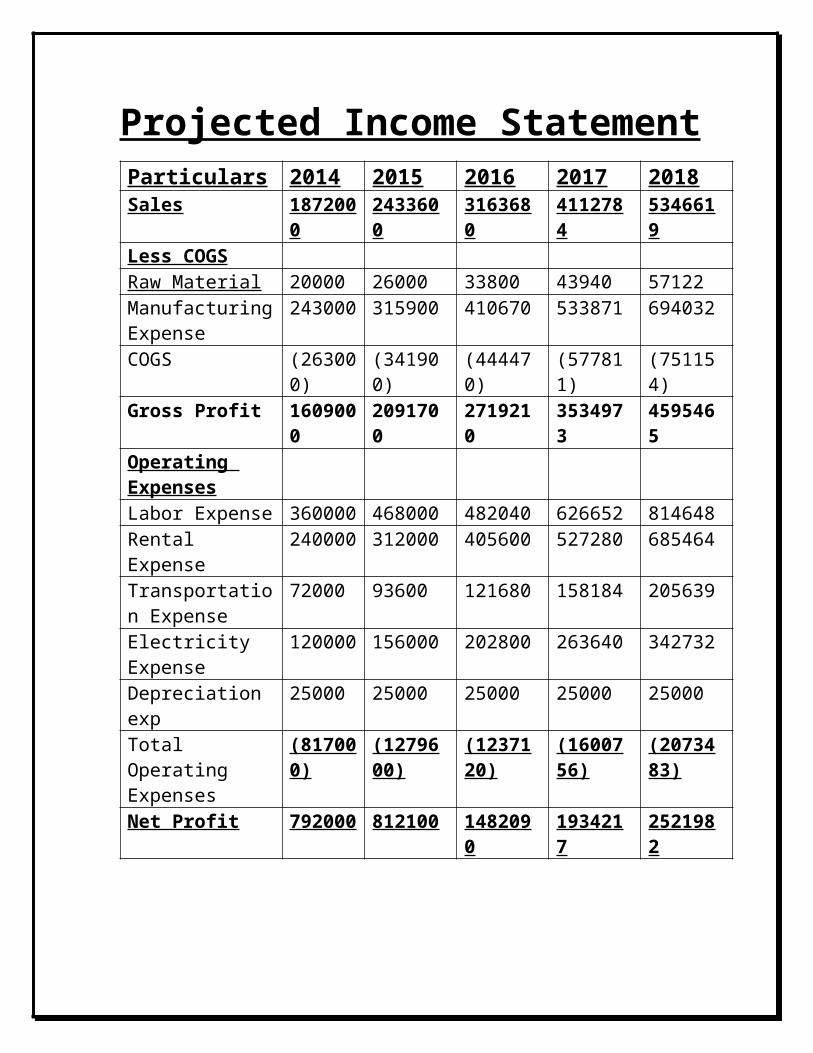
Projected Income StatementParticulars 2014 2015 2016 2017 2018Sales 1872000 2433600 3163680 4112784 5346619Less COGSRaw Material 20000 26000 33800 43940 57122Manufacturing Expense
243000 315900 410670 533871 694032
COGS (263000) (341900) (444470) (577811) (751154)Gross Profit 1609000 2091700 2719210 3534973 4595465Operating ExpensesLabor Expense 360000 468000 482040 626652 814648Rental Expense 240000 312000 405600 527280 685464Transportation Expense
72000 93600 121680 158184 205639
Electricity Expense 120000 156000 202800 263640 342732Depreciation exp 25000 25000 25000 25000 25000Total Operating Expenses
(817000) (1279600) (1237120) (1600756)
(2073483)
Net Profit 792000 812100 1482090 1934217 2521982
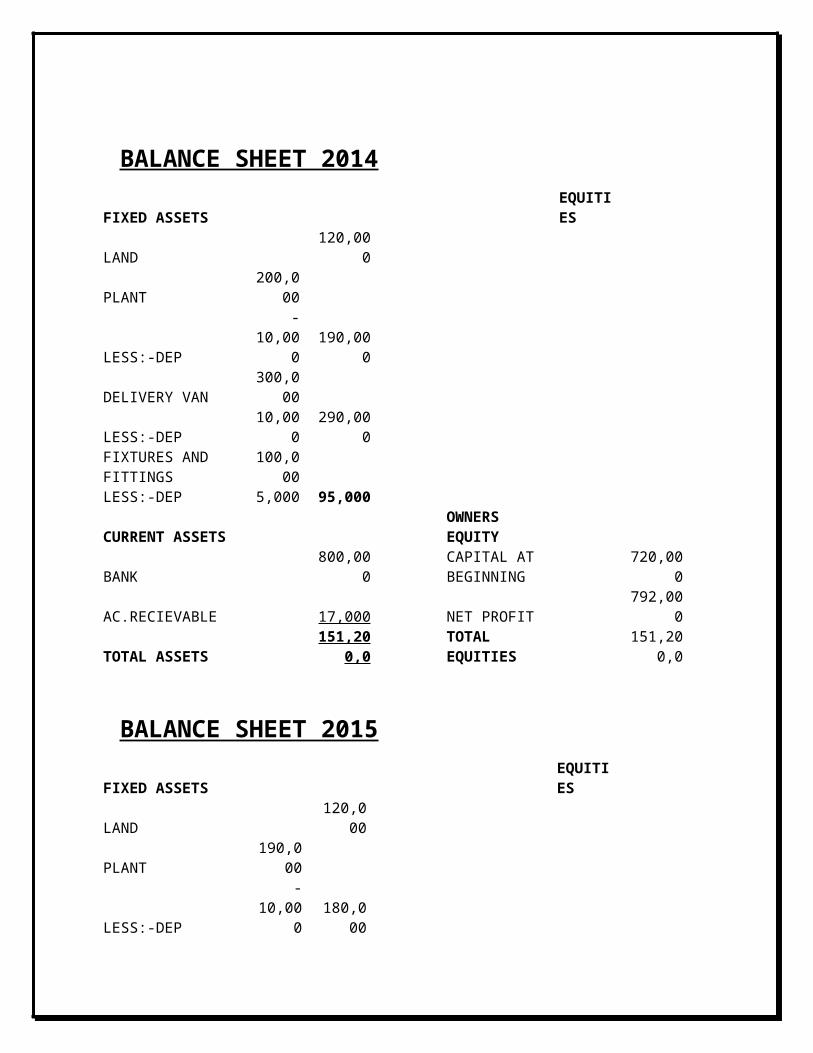
BALANCE SHEET 2014
FIXED ASSETSEQUITIES
LAND 120,000
PLANT200,00
0LESS:-DEP -10,000 190,000
DELIVERY VAN300,00
0LESS:-DEP 10,000 290,000FIXTURES AND FITTINGS
100,000
LESS:-DEP 5,000 95,000
CURRENT ASSETSOWNERS EQUITY
BANK 800,000 CAPITAL AT BEGINNING 720,000AC.RECIEVABLE 17,000 NET PROFIT 792,000
TOTAL ASSETS151,200,
0TOTAL EQUITIES
151,200,0
BALANCE SHEET 2015
FIXED ASSETSEQUITIES
LAND 120,000
PLANT190,00
0LESS:-DEP -10,000 180,000DELIVERY VAN 290000LESS:-DEP -10,000 280,000FIXTURES AND FITTINGS 95,000LESS:-DEP 5,000 90000
CURRENT ASSETSOWNERS EQUITY
BANK 860,000 CAPITAL AT BEGINNING 720,000AC.RECIEVABLE 21,00 NET PROFIT 812,100
TOTAL ASSETS153210
0 TOTAL EQUITIES153,210,
0
BALANCE SHEET 2016
FIXED ASSETSEQUITIES
LAND 120000
PLANT180,00
0LESS:-DEP -10000 170000
DELIVERY VAN280,00
0LESS:-DEP 10,000 270,000FIXTURES AND FITTINGS 90,000LESS:-DEP 5,000 85000
CURRENT ASSETSOWNERS EQUITY
BANK 153,7090 CAPITAL AT BEGINNING 720,000
AC.RECIEVABLE 20,000 NET PROFIT148,209,
0
TOTAL ASSETS220,209,
0TOTAL EQUITIES
220,209,0
BALANCE SHEET 2017
FIXED ASSETSEQUITIES
LAND 120000
PLANT170,00
0LESS:-DEP -10000 160000
DELIVERY VAN270,00
0LESS:-DEP 10,000 260,000FIXTURES AND FITTINGS 85,000LESS:-DEP 5,000 80,000
CURRENT ASSETSOWNERS EQUITY
BANK 1999,217 CAPITAL AT BEGINNING 720,000
AC.RECIEVABLE 35,000 NET PROFIT193,421,
7
TOTAL ASSETS265,421,
7TOTAL EQUITIES
265,421,7
BALANCE SHEET 2018
FIXED ASSETSEQUITIES
LAND 120000
PLANT160,00
0LESS:-DEP -10000 150000
DELIVERY VAN260,00
0LESS:-DEP 10,000 250,000FIXTURES AND FITTINGS 80,000LESS:-DEP 5,000 75,000
CURRENT ASSETSOWNERS EQUITY
BANK259,698,
2 CAPITAL AT BEGINNING 720,000
AC.RECIEVABLE 50,000 NET PROFIT252,198,
2
TOTAL ASSETS324,198,
2TOTAL EQUITIES
324,198,2

(Aqua Pure)Statement of Cash FlowsFor the year ended December31,2014 $Cash flow from operating activities Receipts from customers 1855000Payments to suppliers (270,000)-Payments to employees (360,000)Interest payments - 0Interest received 0Taxes paid - 0Net cash flow from operating activities 1225000 Cash flow from investing activities Purchases of equipment (200000)Deposits on rental premises (120,000)Proceeds from sale of equipment 0Proceeds from sale of property 0Net cash flow from investing activities (320,000)
Cash flow from financing activities Proceeds from borrowings 0Payments of borrowings (repayment of principal) - 0Investment into business 0Drawings from business investment - 0Net cash flow from financing activities 0 Net increase (decrease) in cash held 905000Cash at beginning of period 100000Cash at end of period 105000
(Aqua Pure)Statement of Cash FlowsFor the year ended December31,2015 $Cash flow from operating activities Receipts from customers 2431500Payments to suppliers (351000)Payments to employees (468000)Interest payments - 0Interest received 0Taxes paid - 0Net cash flow from operating activities 1612500 Cash flow from investing activities Purchases of equipment 0Deposits on rental premises 0aaaProceeds from sale of equipment 0Proceeds from sale of property 0Net cash flow from investing activities 0 Cash flow from financing activities Proceeds from borrowings 0Payments of borrowings (repayment of principal) - 0Investment into business 0Drawings from business investment - 0
Net cash flow from financing activities 0 Net increase (decrease) in cash held 1612500Cash at beginning of period 200000Cash at end of period 1812500
(Aqua Pure)Statement of Cash FlowsFor the year ended December31,2016 $Cash flow from operating activities Receipts from customers 3143680Payments to suppliers (456300)Payments to employees (482040)Interest payments - 0Interest received 0Taxes paid - 0Net cash flow from operating activities 1482090 Cash flow from investing activities Purchases of equipment 0Deposits on rental premises 0Proceeds from sale of equipment 0Proceeds from sale of property 0Net cash flow from investing activities 0 Cash flow from financing activities Proceeds from borrowings 0Payments of borrowings (repayment of principal) - 0Investment into business 0Drawings from business investment - 0Net cash flow from financing activities 0

Net increase (decrease) in cash held 1482090Cash at beginning of period 50000Cash at end of period 1532090
(Aqua Pure)Statement of Cash FlowsFor the year ended December31,2017 $Cash flow from operating activities Receipts from customers 4077784Payments to suppliers (593190)Payments to employees (626652)Interest payments - 0Interest received 0Taxes paid - 0Net cash flow from operating activities 1934217 Cash flow from investing activities Purchases of equipment 0Deposits on rental premises 0Proceeds from sale of equipment 0Proceeds from sale of property 0Net cash flow from investing activities 0 Cash flow from financing activities Proceeds from borrowings 0Payments of borrowings (repayment of principal) - 0Investment into business 0Drawings from business investment - 0Net cash flow from financing activities 0

Net increase (decrease) in cash held 1934217Cash at beginning of period 300000Cash at end of period 2234217
(Aqua Pure)Statement of Cash FlowsFor the year ended December31,2018 $Cash flow from operating activities Receipts from customers 5296619Payments to suppliers (771147)Payments to employees (814648)Interest payments - 0Interest received 0Taxes paid - 0Net cash flow from operating activities 2521982 Cash flow from investing activities Purchases of equipment 0Deposits on rental premises 0Proceeds from sale of equipment 0Proceeds from sale of property 0Net cash flow from investing activities 0 Cash flow from financing activities Proceeds from borrowings 0Payments of borrowings (repayment of principal) - 0Investment into business 0Drawings from business investment - 0Net cash flow from financing activities 0 Net increase (decrease) in cash held 2521982Cash at beginning of period 400000Cash at end of period 25612982
