final exam 1. complete the sentence with the...
TRANSCRIPT

Final Exam
1. Complete the sentence with the correct word or phrase.
2. Fill in blanks in a source table with the correct formuli
for df, MS, and F.
3. Identify the graphic form and nature of the source table
for each design.
4. Identify the most appropriate design from a description
of a research study.
5. Fill in blanks in a source table with the actual numerical
values for df, MS, and F, given the Sums of Squares .
6. Interpret the results on printouts for all designs.
One-way ANOVA
Planned and post hoc
Two-way ANOVA
Three-way ANOVA
Simple linear regression
Multiple linear regression
Randomized blocks
Repeated
Nested
Split plot
Analysis of covariance (ANCOVA)
Canonical correlation
Discriminant Analysis
Multivariate Analysis of Variance (MANOVA)
measures
Designs
comparisons

1. Complete the sentence with the correct word or phrase.
The factors to consider in determining the number of
blocks in a randomized block design are
2. Fill in blanks in a source table with the correct formuli
for df, MS, and F.
Two-way ANOVA
Source SS df MS F
A (fixedB (random)AxBWithin
Total
Randomized blocks (n=1)
Source SS df MS F R
blockstreatmentsblocks x treatments
Total
2


Source table: A x B design
Source df
Source table: Split plot design
Source df
Source table: Nested design (B nested within A)
Source df


Nested Design
blocks orsub j cts
A
A
A
A1
2 3 4 Source
Split Plot Design
Source df F
J-1 AB within A
n A
J(K-1) B within A
B JK(n-1)
withinB
df F
between blocks (nested)B
K-1 Bblocks within
K(n-1) Bblocks withinBwithin blocks (crossed)
A
J-1 AA x
blockswithin B
(J- WK- 1)
AxBA x blockswithin B
A x blocks
K(n-1 1)(J-1)
within B
AxB
block(Plot 1)
B 1 block
block
(Plot 2) block
B2 block
block
Method Class 1 A
1 Class 2B withi
Method Class 3within
2Class 4

4. Identify the most appropriate design from a description
of a research study.
1. A researcher wants to test the effectiveness of the
"new math" vs. the "old math." Six 4th grade classes
are provided for study. Three are using the new
math and three are using the old math.
2. A researcher wants to test the effects of hours of
training (10 and 20) and type of media (film, slides)
on achievement. The researcher, however, first
blocks on IQ then randomly assigns blocks to the two
types of media. The researcher's primary interest is
in finding out if differences exist between number of
hours of training.
3. A researcher gives four tests of math achievement
at a single time, each measuring a different facet of
math achievement, at the end of a year long
instructional program. Half the subjects in the
instructional program were given tutorial assistance
and half were not. The researcher wants to know if
the tutorial assistance made a difference in math
achievement.

4. A researcher wants to study the effects of a
participatory management program in hospital
settings on the attitudes of nurses. She convinces
one hospital to use the program for six months and,
then, finds a similar hospital which is not using theyprogram to use as a "control." She completes the
study and is just about to analyze the data when a
colleague working in the "control" hospital informs
her that a large number of the nurses at that
hospital have had experience with a participatory
management plan in the past.
S .
A researcher measures "attitude toward teaching" of
thirty-two recently trained teachers at three
different intervals: at graduation, six months after
graduation, and one year after graduation. The
researcher hypothesizes that attitudes will become
more negative over time.

6. A researcher wants to find out why some students
complete their Ph.D. degrees and others do not. He
gets from university records the names and
transcripts of one hundred students who completed
their degrees in the last five years and one hundred
who did not. He then gets from the transcripts their
(a) GRE scores, (b) undergraduate GPA, (c) amount
of financial aid received, if any, and (d) occupation of
father and/or mother, scaled 5 (professional) to 1
(unemployed).
7. A researcher wants to study the long term effects of
exercise on heart rate. He devises a "heavy" and
"light" exercise program. He realizes before the
study begins, however, that body weight varies
tremendously for the subjects in each of his
treatments and that body weight is highly
correlated with heart rate. He would like to
eliminate the possibility that no significant
differences will be found simply due to this variable,
especially in light of the fact that he expects only
small between groups differences.

8. A researcher wants to study the achievement level
of undergraduates under four conditions: high
stress, low motivation; high stress, high motivation;
low stress, low motivation; low stress, high
motivation. She gives a pretest and a posttest to
each of the four groups.
9. What if the above researcher had a well reasoned
hypothesis that high stress, high motivation was
significantly different than low stress, low
motivation and that high stress, low motivation was significantly different than low stress, high
motivation, and this was all the researcher
hypothesized prior to the experiment.

5. Fill in blanks in a source table with the actual numerical
values.
Source SS df MS F
A 100 2
B
56 4
AxB 18 18
Within
Total 200 44
P

Randomized Blocks
How many blocks are there?
How much of the variance is explained by blocks?
Is TRT significant?
SOURCE OF VARIATION SUM OF SQUARES DF MEAN SQUARE
RESIDUAL ERROR 4.83333 6 .80556sLK 4.50000 2 2.25000TRT 12.16667 3 4.22222
(MODEL) 17.16667 5 3.43333
(TOTAL) 22.00000 11 2.00000
R-SQUARED = .78030
ADJUSTED R-SQUARED = .59722

Repeated Measures
How many levels of TRT are there?
How many subjects within a single level of TRT?
What does "R-Squared" mean?
SOURCE OF VARIATION SUM OF SQUARES DF MEAN SQUARE
RESIDUAL 3.83333 6 .63889SUB 8.91667 3 2.97222TRT 31.50000 2 15.75000
40.41667 5 8.08333(MODEL)
(TOTAL) 44.25000 11 4.02273
R-SQUARED = .91337
ADJUSTED R-SQUARED = .84118

NESTED DESIGN
R-SQUARED =
.50194ADJUSTED R-SQUARED =.16990
How many levels of religion?
How many churches within religion?
SOURCE OF VARIATION SUM OF SQUARES DF M S F p
WITHIN CELLS 580.66667 12 48.38CHURCH W RELIC (ERROR 1) 420.16667 3 140.05 2.89 .07
(MODEL) 420.16667 3 140.05(TOTAL) 1000.83333 15 66.72
R-SQUARED = .41982ADJUSTED R-SQUARED = .27477
ERROR 1 420.16667 3 140.05RELIC 423.44444 2 211.72 1.51 .35
(MODEL) 423.44444 2 211.72(TOTAL) 843.61111 5 168.72

SPLIT-PLOT REPEATED MEASURES
R-SQUARED =
.71667ADJUSTED R-SQUARED =.57500
How many plots?
How many subjects (or blocks) within a single level of B?
SOURCE OF VARIATION SUM OF SQUARES DF M S F P
ERROR 1 Subjects within B .22222 4 .22222B (blocks) 21.11111 1 5.27778 .04 .84
(MODEL) .22222 1 .22222(TOTAL) 21.33333 5 4.26667
R-SQUARED = .01042ADJUSTED R-SQUARED = 0
ERROR 2 A x Subjects within B 18.88889 8 2.36111A (blocks) 44.33333 2 22.16667 9.38 .00A by B 3.44444 2 1.72222 .72 .51
(MODEL) 47.77778 4 11.94444(TOTAL) 66.66667 12 5.55556

How many covariates?How many subjects?
Analysis of Covariance
SOURCE OF VARIATION SUM OFSQUARES
DF MEANSQUARE
F SIGNIFOF F
COVARIATES 169.191 1 169.191 27.348 .003X 169.191 1 169.191 27.348 .003
MAIN EFFECTS 15.876 1 15.876 2.566 .170A 15.876 1 15.876 2.566 .170
EXPLAINED 185.067 2 92.532 14.857 .008
RESIDUAL (ERROR) 30.333 5 6.18
(TOTAL) 216.000 7 30.857

Test of Homogeneity of Group Regressions
Was the homogeneity of group regressions assumption met?
What is the significance of Y regressed on X?
ENTEREDVARIABLE
REMOVEDF TO
ENTER OR REMOVE SIGNIFICANCE MULTIPLE R
1 X Covariate X 21.86875 .003 .88504
2 Z1 Groups A 2.56621 .170 .92563
3 Z2 Interaction A by X .84256 .411 .93395
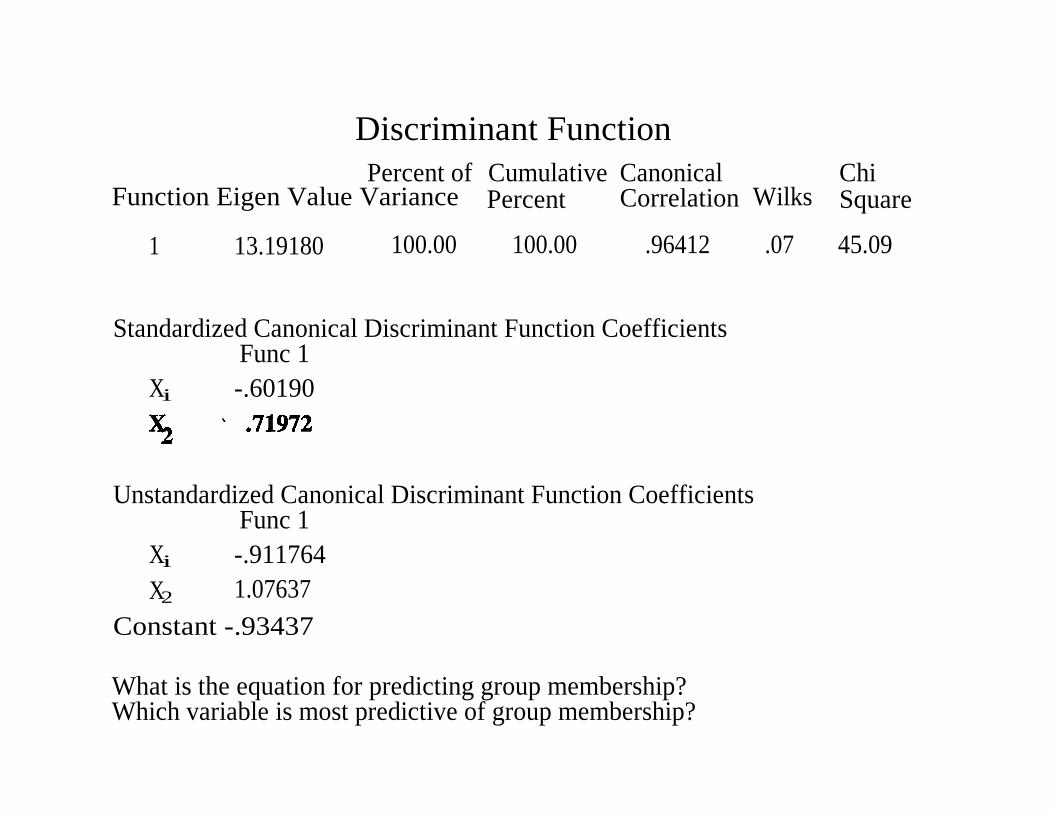
Percent of Cumulative Canonical
ChiFunction Eigen Value Variance
Percent
Correlation Wilks
Square
1 13.19180 100.00 100.00 .96412 .07 45.09
Standardized Canonical Discriminant Function CoefficientsFunc 1
Xi -.60190
Discriminant Function
Unstandardized Canonical Discriminant Function CoefficientsFunc 1
Xi -.911764X2 1.07637
Constant -.93437
What is the equation for predicting group membership?Which variable is most predictive of group membership?