final environmental statement · a natural draft cooling tower, rather than the once-through...
TRANSCRIPT

NUREG-1085
Final Environmental Statementrelated to the operation ofNine Mile Point Nuclear Station,Unit No. 2Docket No. 50-410
Niagara Mohawk Power CorporationRochester Gas and Electric CorporationCentral Hudson Gas and Electric CorporationNew York State Electric and Gas CorporationLong Island. Lighting Company
U.S. Nuclear RegulatoryCommission
Office of Nuclear Reactor Regulation
May 1985
,gREG(, Docket* # 3 c6
FL___ DOCKETUz
UGJATORY
j , 3
,-~ J

NOTICE
Availability of Reference Materials Cited in NRC Publications
Most documents cited in NRC publications will be available from one of the following sources:
1. The NRC Public Document Room, 1717 H Street, N.W.Washington, DC 20555
2. The Superintendent of Documents, U.S. Government Printing Office, Post Office Box 37082,Washington, DC 20013-7982
3. The National Technical Information Service, Springfield, VA 22161
Although the listing that follows representsfthe majority of documents cited in NRC publications,it is not intended to be exhaustive.
Referenced documents available for inspection and copying for a fee from the NRC Public Docu-ment Room include NRC correspondence and internal NRC memoranda; NRC Office of Inspectionand Enforcement bulletins, circulars, information notices, inspection and investigation notices;Licensee Event Reports; vendor reports and correspondence; Commission papers; and applicant andlicensee documents and correspondence.
The following documents in the NUREG series are available for purchase from the NRC/GPO SalesProgram: formal NRC staff and contractor reports, NRC-sponsored conference proceedings, andNRC booklets and brochures. Also available are Regulatory Guides, NRC regulations in the Code ofFederal Regulations, and Nuclear Regulatory Commission Issuances.
Documents available from the National Technical Information Service include NUREG seriesreports and technical reports prepared by other federal agencies and reports prepared by the AtomicEnergy Commission, forerunner agency to the.,Nuclear Regulatory Commission.
Documents available from public and specia? technical libraries include all open literature items,such as books, journal and periodical articles i•aind transactions. Federal Register notices, federal andstate legislation, and congressional reports can usually be obtained from these libraries.
Documents such as theses, dissertations, foreign reports and translations, and non-N RC conferenceproceedings are available for purchase from the organization sponsoring the publication cited.
Single copies of NRC draft reports are available free, to the extent of supply, upon written requestto the Division of Technical Information and Document Control, U.S. Nuclear Regulatory Com-mission, Washington, DC 20555.
Copies of industry codes and standards used in a substantive manner in the NRC regulatory processare maintained at the NRC Library, 7920 Norfolk Avenue, Bethesda, Maryland, and are availablethere for reference use by the public. Codes and standards are usually copyrighted and may bepurchased from the originating organization or,'if they are American National Standards, from theAmerican National Standards Institute, 1430 Broadway, New York, NY 10018.

NUREG-1085
Final Environmental Statementrelated to the operation ofNine Mile Point Nuclear Station,Unit No. 2Docket No. 50-410
Niagara Mohawk Power CorporationRochester Gas and Electric CorporationCentral Hudson Gas and Electric CorporationNew York State Electric and Gas CorporationLong Island Lighting Company
U.S. Nuclear Regulatory
Commission
Office of Nuclear Reactor Regulation
May 1985


ABSTRACT
This Final Environmental Statement contains the assessment of the environmentalimpact associated with the operation of the Nine Mile Point Nuclear Station,Unit 2, pursuant to the National Environmental Policy Act of 1969 (NEPA) andTitle 10 of the Code of Federal Regulations, Part 51, as amended, of theNuclear Regulatory Commission regulations. This statement examines the environ-ment, environmental consequences and mitigating actions, and environmental andeconomic benefits and costs.
NMP-2 FES ii i


SUMMARY AND CONCLUSIONS
This Final Environmental Statement (FES) was prepared by the U.S. Nuclear
Regulatory Commission, Office of Nuclear Reactor Regulation (staff).
(1) This action is administrative.
(2) The proposed action is the issuance of an operating license to NiagaraMohawk Power Corporation (hereinafter referred to as the applicant)acting as agent and representati~ve for the owners (Niagara Mohawk PowerCorporation, Central Hudson Gas and Electric Corporation, New York StateElectric and Gas Corporation, Long Island Lighting Company, and RochesterGas and Electric Corporation) for the operation of the Nine Mile PointNuclear Station Unit 2 (NMP-2) (Docket No. 50-410). Nine Mile PointNuclear Station Unit 2 is located in the Town of Scriba, County of Oswego,State of New York. Unit 2 will share the site with the applicant'soperating Nine Mile Point Nuclear Station Unit 1.. The Nine Mile PointNuclear Station site is contiguous to the James A. FitzPatrick NuclearPower Plant site. The James A. FitzPatrick Nuclear Power Plant is ownedand operated by the New York Power Authority.
(3) The Nine Mile Point Nuclear Station Unit 2 will employ a boiling waterreactor (BWR) that has a plant-rated core thermal power level of 3323 MWt,corresponding to an electrical output of approximately 1,100 MWe. Allcooling water required for Unit 2 will come from and be discharged toLake Ontario. The closed-loop circulating water system employs a single-cell, wet-evaporative, natural-draft cooling tower that uses a counterflowdesign. The lake intake system conveys required cooling water from LakeOntario through two submerged intake structures that are independentlyconnected to the screenwell by intake pipes in separate tunnels below thelake bottom.
(4) The information in this statement represents the second assessment of theenvironmental impacts pursuant to the Commission's regulations in Title 10of the Code of Federal Regulations, Part 51 (10 CFR 51), which implementsthe requirements of the National Environmental Policy Act of 1969 (NEPA).The Niagara Mohawk Power Corporation tenderedfan application for a con-struction permit (CP) on March 8, 1972. Because more information wasneeded for the initial filing, the application for a CP was not officiallydocketed for review until June 15, 1972. After the application for a CPwas docketed, the staff reviewed impacts that would occur during stationconstruction and operation. That evaluation was issued as a Final Environ-mental Statement - Construction Permit Phase (FES-CP) in June 1973. Afterthis environmental review, a safety review, an evaluation by the AdvisoryCommittee on Reactor Safeguards (ACRS), and a hearing before an AtomicSafety and Licensing Board (ASLB), the CP for Nine Mile Point NuclearStation Unit 2 was issued on June 24, 1974.
NMP-2 FES V

The Niagara Mohawk Power Corporation acting as agent and representativefor the owners, tendered an application for an operating license (OL) byletter dated January 31, 1983. The staff conducted a predocketingacceptance review and determined that sufficient information was avail-able to begin the detailed environmental and safety reviews. The appli-cant's Environmental Report-Operating License stage (ER-OL) and FinalSafety Analysis Report (FSAR) were docketed on April 12, 1983.
(5) The NRC staff has reviewed the activities associated with the proposedoperation of the plant and the potential impacts, both beneficial andadverse. The NRC staff's conclusions are summarized as follows:
(a) NMP-2 will utilize state-of-the-art cooling system design to minimizethe impacts to Lake Ontario aquatic biological resources as a resultof the withdrawal of water and the discharge of effluents. Thedesign will include: low intake volume and velocity; offshoresubmerged intake structures with velocity capped-horizontal inflow;a diversion and return system for entrapped fishes; and an offshorebenthic diffuser discharge system. The fish diversion system willcollect and return some fishes that will be impinged on the travel-ing screens; however, for certain size classes of some species(notably alewife and rainbow smelt), the reduction in impingementmortality may be low. Thermal and chemical effluent effects shouldbe limited to a small area in the vicinity of the diffuser discharge.Impacts resulting from interactions between NMP-2 and either the.Nine Mile Point Unit 1 or FitzPatrick power plants should be insig-nificant. The conclusions of the 1981 NRC study of environmentalimpacts resulting from the conversion from once-through cooling toclosed-cycle cooling remain valid (Section 5.5.2 and Appendix G ofthis report.
(b) The operation of NMP-2 will have no impact on terrestrial or aquaticthreatened or endangered species, because none occur within theproject area (Section 5.6).
(c) Operation of NMP-2 is expected to have a negligible effect on wateruse and quality in Lake Ontario. On an annual basis, consumptivelosses from station operation will represent, respectively, approxi-mately 0.001% and 0.009% of the volume of and flow through the lake.Water used from the Oswego City water supply will increase the demandon that supply by demand less than 0.4%.
The concentration of dissolved solids in the discharge from thestation will have been increased by evaporation and by water treat-ment and corrosion. The water in Lake Ontario already exceeds thestate standard for dissolved solids, but the station discharge willaggravate this condition very slightly. The lake water will quicklydilute other water quality constituents (e.g., zinc, copper, chlorine)to acceptable concentrations.
(d) The total land area of the NMP site is approximately 364 ha (900 acres).Unit 2 will occupy about 9.3 ha (22.9 acres); construction activitieshave disturbed about 46.7 ha (116 acres). This is an increase overthe acreage anticipated in the FES-CP because of the change to a
NMP-2 FES vi

natural draft cooling system, construction of the cooling tower, andadditional land required for construction laydown, spoil material,and parking. Operational impacts to land use onsite are insignificant(Sections 4.2.2 and.5.2.1).
Impacts from construction of the transmission line are less thanexpected in the FES-CP because of the design change from a 765-KVto a 345-KV line from Unit 2 to the Volney Station. Because noadditional right-of-way was necessary for the 345-KV line, lessclearing was required. About 33 ha (80 acres) in the existingright-of-way will be disturbed; 90% of this will be maintained asbrushland after construction (Sections 4.2.7 and 5.2.2).
(e) There is no serious potential for impacts on climate (Sections 4.3.3and 5.4) or terrestrial ecosystems (Sections 4.3.4.1 and 5.5.1.1)from salt drift as a result of operation of the cooling tower. Thethreat to bird populations as a result of collisions with the coolingtower and transmission lines are insignificant (Sections 4.3.4.1 and5.5.1), and environmental impacts as a result of operation of thetransmission line are not expected (Section 5.1.2).
(6) This statement assesses various impacts associated with the operation ofthe facility in terms of annual impacts, and balances these impactsagainst the anticipated annual energy production benefits. Thus, theoverall assessment and conclusion would not be dependent on specificoperating life. Where appropriate, however, a specific operating life of40 years was assumed.
(7) The Draft Environmental Statement (DES) made available to the public,to the Environmental Protection Agency, and to other agencies, as specifiedin Section 8. Comment letters received are reproduced in Appendix A, andthe staff responses to the comments are in Section 9.
(8) The personnel who participated in the preparation of this statement andtheir areas of responsibility are identified in Section 7.
(9) On the basis of the analyses and evaluations in this statement, and afterweighing the environmental, economic, technical, and other benefitsagainst environmental and economic costs at the operating license stage,the NRC staff concludes that the action called for under NEPA and10 CFR 51 is the issuance of an operating license for NMP-2 subject tothe following conditions for the protection of the environment.(Section 6.1):
(a) Before engaging in additional construction or operational activitiesthat may result in a significant adverse impact that was not evalu-ated or that is significantly greater than that evaluated in thisstatement, the applicant shall provide written notification of suchactivities to the Director of the Office of Nuclear Reactor Regula-tion and shall receive written approval from that office beforeproceeding with such activities.
(b) The applicant shall carry out the environmental monitoring programsoutlined in Section 5 of this statement, as modified and approved bythe NRC staff, and implemented in the Environmental Protection Planand Technical Specifications that will be incorporated in the operating
NMP-2 FES vii

license for NMP-2. Monitoring of the aquatic environment shall beas specified in the New York State Pollutant Discharge EliminationSystem (SPDES) permit.
(c) If adverse environmental effects or evidence of irreversibleenvironmental damage develops during the operating life of the plant,the applicant shall provide the NRC staff with an analysis of theproblem and a proposed course of action to alleviate it.
NMP-2 FES viii

TABLE OF CONTENTS
Page
ABSTRACT ........................................................... iiiSUMMARY AND CONCLUSIONS ......................... ..................... vLIST OF FIGURES ..................................................... xiiiLIST OF TABLES ................................................ ...... xvFOREWORD ................................................................ xvii
1 INTRODUCTION ..................................................... 1-1
1.1 Administrative History ....................................... 1-11.2 Permits and Licenses ......................................... 1-2
2 PURPOSE AND NEED FOR THE ACTION .................................. 2-1
3 ALTERNATIVES TO THE PROPOSED ACTION .............................. 3-1
4 PROJECT DESCRIPTION AND AFFECTED ENVIRONMENT ..................... 4-1
4.1 Rqsumý .................................................... 4-14.2 Facility Description ........................................ 4-1
4.2.1 External Appearance-and Plant Layout ................. 4-14.2.2 Land Use ............................................. 4-14.2.3 Water Use and Treatment .............................. 4-24.2.4 Cooling System .. ..................................... 4-34.2.5 Radioactive Waste Management Systems ................. 4-54.2.6 Nonradioactive Waste Management Systems .............. 4-64.2.7 Power Transmission System ............................ 4-7
4.3 Project Related Environmental Descriptions .................. 4-8
4.3.1 Hydrology ............................................ 4-84.3.2 Water Quality ........................................ 4-124.3.3 Meteorology .......................................... 4-134.3.4 Terrestrial and Aquatic Resources .................... 4-134.3.5 Endangered and Threatened Species .................... 4-164.3.6 Community Characteristics ............................ 4-174.3.7 Historic and Archeologic Sites ....................... 4-18
4.4 References ................ ; ................................. 4-18
5 ENVIRONMENTAL CONSEQUENCES AND MITIGATING ACTIONS ................ 5-1
5.1 R0 sume ...................................................... 5-15.2 Land Use .................................................... 5-1
5.2.1 Plant Site ........................................... 5-1
NMP-2 FES ix

TABLE OF CONTENTS (continued)
Page
5.2.2 Transmission Lines ................................... 5-2
5.3 Water ....................................................... 5-2
5.3.1 Water Use ............................................ 5-25.3.2 Water Quality ........................................ 5-35.3.3 Hydrologic Alterations and Plant Water Supply ......... 5-35.3.4 Water Use Impacts ..................................... 5-55.3.5 Floodplain Aspects .................................... 5-6
5.4 Air Quality ................................................. 5-6
5.4.1 Fog and Ice ......................................... 5-65.4.2 Other Emissions ...................................... 5-7
5.5 Terrestrial and Aquatic Resources ........................... 5-7
5.5.1 Terrestrial Resources ................................. 5-75.5.2 Aquatic Resources .................................... 5-8
5.6 Threatened and Endangered Species ............................ 5-12
5.6.1 Terrestrial .......................................... 5-125.6.2 Aquatic ............................................. 5-12
5.7 Historic and Archeologic Impacts ............................. 5-125.8 Socioeconomic Impacts ........................................ 5-125.9 Radiological Impacts ........................................ 5-13
5.9.1 Regulatory Requirements .............................. 5-135.9.2 Operational Overview ................................. 5-145.9.3 Radiological Impacts from Routine Operations ......... 5-155.9.4 Environmental Impacts of Postulated Accidents ......... 5-24
5.10 Impacts from the Uranium Fuel Cycle......................... 5-545.11 Decommissioning ............................................. 5-555.12 Noise .................... ................................. 5-555.13 Emergency Planning Impacts .................................. 5-565.14 Environmental Monitoring ..................................... 5-56
5.14.1 Terrestrial Monitoring ............................... 5-565.14.2 Aquatic Monitoring .................................. 5-565.14.3 Atmospheric Monitoring .............................. 5-57
5.15 References .................................................. 5-57
6 EVALUATION OF THE PROPOSED ACTION ................................ 6-1
6.1 Unavoidable Adverse Impacts ........................ ......... 6-16.2 Irreversible and Irretrievable Commitments of Resources ..... 6-1
NMP-2 FES X

TABLE OF CONTENTS (continued)
Page
6.3 Relationship Between Short-Term Use andLong-Term Productivity ...................................... 6-2
6.4 Benefit-Cost Summary ........................................ 6-2
6.4.1 Benefits .............................................. 6-26.4.2 Economic Costs ........................................ 6-26.4.3 Socioeconomic Costs ................................... 6-2
6.5 Conclusion ................................................. 6-26.6 References .................................................. 6-3
7 LIST OF CONTRIBUTORS ............................................. . 7-18 LIST OF AGENCIES, ORGANIZATIONS, AND PERSONS TO WHOM COPIES
OF THEDRAFT ENVIRONMENTAL STATEMENT WERE SENT ................... 8-19 STAFF RESPONSE TO COMMENTS ON THE DRAFT ENVIRONMENTAL
STATEMENT ........................................................ 9-1
9.1 Abstract, Summary and Conclusions, Foreword, and
Introduction .... ............................................ 9-1
9.1.2 Permits and Licenses .................................. 9-2
9.4 Project Description and Affected Environment.... ............. .9-3
9.4.2 Facility Description ................................. 9-39.4.3 Project-Related Environmental Descriptions ............. 9-6
9.5 Environmental Consequences and Mitigating Actions ............ 9-7
9.5.3 Water ................... ............................ 9-79.5.4 Air Quality ........................................... 9-99.5.5 Terrestrial and Aquatic Resources ..................... 9-109.5.8 Socioeconomic Impacts ................................. 9-109.5.9 Radiological Impacts.................................. 9-119.5.11 Decommissioning ....................................... 9-139.5.13 Emergency Planning Impacts .............. .............. 9-149.5.14 Environmental Monitoring .............................. 9-14
9.6 Evaluation of the Proposed Action ............................ 9-14
9.6.2 Irreversible and Irretrievable Commitments ofResources ................. .......................... 9-14
9.6.4 Benefit-Cost Summary .................................. 9-14
9.10 Appendices ...................... ............... ........... 9-15
9.10.4 Appendix D - Examples of Site-Specific DoseCalculations ....................................... 9-15
NMP-2 FES xi

TABLE OF CONTENTS (continued)
I APPENDIXAPPENDIXAPPENDIXAPPENDIXAPPENDIXAPPENDIXAPPENDIX
ABCDEFG
COMMENTS ON THE DRAFT ENVIRONMENTAL STATEMENTNEPA POPULATION-DOSE ASSESSMENTIMPACTS OF THE URANIUM FUEL CYCLEEXAMPLES OF SITE-SPECIFIC DOSE ASSESSMENT CALCULATIONSSPDES PERMITHISTORIC AND ARCHEOLOGIC SITESEVALUATION OF THE ENVIRONMENTAL EFFECTS DUE TO THE CHANGEIN COOLING SYSTEMS AT NINE MILE POINT UNIT 2 FROM A ONCE-.THROUGH SYSTEM TO A CLOSED CYCLE SYSTEM UTILIZING A NATURALDRAFT COOLING TOWERNINE MILE POINT 2 RELEASE CATEGORIES USED IN CONSEQUENCEANALYSISCONSEQUENCE MODELING CONSIDERATIONSFISHERY HARVEST ESTIMATES FOR LAKE ONTARION (NINE MILE POINT)LETTER FROM NIAGARA MOHAWK POWER CORPORATION ONCURRENT FINANCIAL COMMITMENT FOR NINE MILE POINT UNIT 2LETTER FROM STATE OF NEW YORK DEPARTMENT OF-STATE CERTIFYINGCOMPLIANCE WITH THE STATE COASTAL MANAGEMENT PROGRAM
APPENDIX H
APPENDIXAPPENDIXAPPENDIX
IJK
APPENDIX L
NMP-2 FES xii

TABLE OF CONTENTS (continued)
Page
FIGURES
4.1 Site layout . .................................................... 4-214.2 Water use diagram ................................................ 4-224.3 Details of intake structure ...................................... 4-23
5.1 100-year floodplain, pre-construction ............................ 5-635.2 100-year floodplain, post-construction ........................... 5-645.3 Potentially meaningful exposure pathways to individuals.......... 5-655.4 Schematic outline of atmospheric pathway consequence model ....... 5-665.5 Probability distributions of individual dose impacts ............. 5-675.6 Probability distributions of population exposures ................ 5-685.7 Probability distributions of cancer fatalities ................... 5-695.8 Probability distribution of early fatalities ..................... 5-705.9 Probability distribution of mitigation measures cost ............. 5-715.10 Risk of individual dose (to those downwind) versus distance ...... 5-725.11 Lines of equal risk per reactor-year of early fatality to
an individual .................................................... 5-735.12 Lines of equal risk per reactor-year of latent cancer fatality
to an individual ................................................. .5-745.13 Estimated early fatality risk with supportive medical treat-
ment (persons) from severe reactor accidents for severalnuclear power plants either operating or receiving conside-ration for issuance of a license to operate ...................... 5-75
5.14 Estimated early fatality risk with supportive medical treat-ment (persons) from severe reactor accidents for nuclear powerplants having plant-specific PRAs ................................ 5-76
5.15 Estimated early fatality risk with supportive medical treat-ment (persons) from severe reactor accidents for severalnuclear power plants either operating or receiving conside-ration for issuance of a license to operate for which site-specific applications of NUREG-0773 accident releases havebeen used to calculate offsite consequences ....................... 5-77
5.16 Estimated latent cancer fatality risk, excluding thyroid(persons), from severe reactor accidents for several nuclearpower plants either operating or receiving consideration forissuance of a license to operate ................................. 5-78
5.17 Estimated latent cancer fatality risk, excluding thyroid(persons.), from severe reactor accidents for nuclear powerplants having plant-specific PRAs ................................ 5-79
5.18 Estimated latent cancer fatality risk, exluding thyroid(persons), from severe reactor accidents for several-nuclearpower plants either operating or receiving consideration forissuance of a license to operate for which site-specificapplications of NUREG-0773 accident releases have been usedto calculate offsite consequence ................................. 5-80
5.19 Estimated latent thyroid cancer fatality risk (persons) fromsevere reactor accidents for several nuclear power plantseither operating or receiving consideration for issuance ofa license to operate ............................................. 5-81
NMP-2 FES xiii

TABLE OF CONTENTS (continued)Page
5.20 Estimated latent thyroid cancer fatality risk (persons)from severe reactor accidents for nuclear powerplants, having plant-specific PRAs ................................ 5-82
5.21 Estimated. latent thyroid cancer fatality risk (persons)from severe reactor accidents for several nuclear powerplants either operating or receiving consideration forissuance of a license to operate for which site-specificapplications of NUREG-0773 accident releases have been usedto calculate offsite consequences ................................ 5-83
NMP-2 FES xiv

TABLE OF CONTENTS (continued)
Page
TABLES
4.1 Land use within the site boundary ................................4.2 Differences in water use and flow rates ..........................4.3 Comparison of constituent concentrations anticipated in the
combined discharge ....................... ........................4.4 Existing and pre-construction land uses within the transmission
line corridor for NMP-2 ..........................................4.5 Comparison of water quality in Lake Ontario ......................4.6 New York State species of special concern listed by the
applicant as "likely to occur" on the NMP-2 site or environs .....
5.1 Monthly water use data for NMP-2 .......... ......................5.2 Total plant efficiency for returning alivecommonly impinged
fish at Oswego Steam Station Unit 6 ..............................5.3 Incidence of job-related mortalities .............................5.4 (Summary Table S-4) Environmental impact of transportation
of fuel and waste to and from one light-water coolednuclear power reactor ............................................
5.5 Preoperational radiological environmental monitoring program .summary ...........................................................
5.6 Activity of radionuclides in the NMP-2 reactor core at 3466 MWT..5.7 Approximate doses during a 2-hour exposure at the EAB ............5.8 Summary of theatmospheric release specifications used in
consequence analysis for NMP-2 ...................................5.9 Annual average wind-direction probabilities for the NMP-2
site based on data for 1975 .....................................5.10 Summary of emergency response assumptions for NMP-2 ..............5.11 Summary of environmental impacts and probabilities ...............5.12 Estimated values of societal risks from severe accidents,
per reactor-year . ....... .........................................5.13 Regional economic impacts of output and employment ...............5.14 (Summary Table S-3) Uranium fuel cycle data ......................
6.1 Benefit-cost summary for NMP-2 ....................................
9.1 Cross-reference of comments on the DES and sections of thisreport in which they are addressed ...............................
4-244-25
4-25
4-264-26
4-27
5-85
5-865-87
5-88
5-895-935-94
5-95
5-965-975-98
5-995-1005-101
6-4
9-16
NMP-2 FES XV


FOREWORD
This Final Environmental Statement was prepared by the U.S. Nuclear RegulatoryCommission (NRC), Office of Nuclear Reactor Regulation (the staff), in accor-dance with the Commission's regulations in Title 10 of the Code of FederalRegulations, Part 51 (10 CFR 51), which implements the requirements of theNational Environmental Policy Act of 1969 (NEPA).
This environmental review deals with the impacts of operation of the Nine MilePoint Nuclear Station Unit 2 (NMP-2). Assessments relating to operation thatare presented in this statement augment and update those described in theFinal Environmental Statement-Construction Phase (FES-CP) that was issued inJune 1973 in support of issuance of the construction permit for NMP-2.
The information in this statement updates the FES-CP in four ways by
(1) evaluating changes in facility design and operation that will result inenvironmental effects of operation (including those that would enhance aswell as degrade the environment) different from those projected duringthe preconstruction review
(2) reporting the results of relevant new information that has becomeavailable since the issuance of the FES-CP
(3) factoring into the statement new environmental policies and statutes thathave a bearing on the licensing action
(4) identifying unresolved environmental issues or surveillance needs thatare to be resolved by license conditions
Introductions (r~sum6s) in appropriate sections of this statement summarizeboth the extent of updating and the staff's assessment of the impacts.
Copies of this statement and the FES-CP are available for inspection at theCommission's Public Document Room, 1717 H Street NW, Washington, D.C., and atthe Penfield Library, State University College, Oswego, New York 13126. Thedocuments may be reproduced for a fee at either location. Copies of thisstatement may also be obtained as described on the inside front cover of thisreport.
Ms. Mary F. Haughey is the NRC Project Manager for the environmental review ofthis project. Should there be any questions regarding the content of thisstatement, Ms. Haughey may be contacted by telephone at (301)492-7000 or bywriting to the following address:
Ms. Mary F. HaugheyDivision of LicensingU.S. Nuclear Regulatory CommissionWashington, DC 20555
NMP-2 FES xvi i


1 INTRODUCTION
The proposed action is the issuance of an operating license (OL) to the NiagaraMohawk Power Corporation (the applicant), acting as agent and representativefor the owners (Niagara Mohawk Power Corporation, New York State Electric andGas Corporation, Long Island Lighting Company,* Central Hudson Gas and ElectricCompany, and Rochester Gas and Electric Corporation), for startup and operationof Nine Mile Point Nuclear Station Unit 2 (NMP-2) in the town of Scriba, Countyof Oswego, State of New York.
NMP-2 employs a nuclear steam supply system (NSSS) consisting of a single-cycle,forced circulating boiling water reactor (BWR). The plant-rated core thermalpower level is 3323 MWt, corresponding to an electrical output of approximately1100 MWe.
The NSSS supplier is General Electric Company, Nuclear Energy Group. Stone &Webster Engineering Corporation, the architect-engineer, is responsible forthe design and construction-management of the plant.
The containment design for NMP-2 employs the BWR Mark II concept of over-underpressure suppression with multiple downcomers connecting the reactor drywell tothe water-filled pressure suppression chamber. The primary containment is asteel-lined, reinforced-concrete enclosure housing the reactor and suppressionpool. The reactor building completely encloses the primary containment. Thisstructure provides secondary containment when the primary containment is closedand primary containment when the primary containment is open, as during refueling.
All cooling water required for Unit 2 will come from and be discharged to LakeOntario. The closed-loop circulating water system employs a single, wet-evaporative, natural draft cooling tower.
1.1 Administrative History
On March 8, 1972, Niagara Mohawk Power Corporation filed an application with theAtomic Energy Commission (AEC), now the Nuclear Regulatory Commission (NRC), fora permit to construct NMP-2. After the application was docketed on June 15, 1972,the AEC staff reviewed the environmental impacts that would occur during construc-tion and operation. The conclusions resulting from this environmental reviewwere issued as a Final Environmental Statement-Construction Phase (FES-CP) inJune 1973. Following a public hearing before an Atomic Safety and LicensingBoard (ASLB), the construction permit (CP) for NMP-2 was issued on June 24, 1974.
On January 31, 1983, the OL application for NMP-2 was submitted. It was dock-eted April 12, 1983. The applicant's Environmental Report-Operating LicenseStage (ER-OL) and Final Safety Analysis Report (FSAR) were also docketed then.**
*See Appendix K*"These documents are cited in this report as ER-OL or FSAR, followed by a sec-
tion, table, or figure number. They are available for review at the NRCPublic Document Room, 1717 H Street, NW, Washington, DC and at the PenfieldLibrary, State University College, Oswego, New York.
NMP-2 FES 1-1

The applicant estimates that NMP-2 will be ready for fuel loading in March 1986.
This statement augments and updates the environmental impacts described in theFES-CP. R~sum~s in Sections 4 and 5 summarize the extent of updating and thestaff's assessment of any impacts.
A draft of this statement was issued for comment in July 1984. Copies weremade available to the public, to the Environmental Protection Agency, and toother specified agencies, as noted in Section 8. Comment letters received arereproduced in Appendix A, and the staff responses to the comments are discussedin Section 9. Changes made to the text or tables since the draft statement wasissued are indicated by a vertical line in the margin next to the change.
Appendix B contains the population radiation dose assessment according to theNational Environmental Policy Act; Appendix C discussed the effects of the ura-nium fuel, cycle; and Appendix D gives examples of the site-specific dose as-sessment calculations. The pollutant discharge elimination system permitissued by the State of New York (SPDES) is reproduced in Appendix E, and corre-spondence relating to historic and archeologic sites in the NMP-2 area is inAppendix F. Appendix G is a copy of a report assessing the effects of changesin the design of the cooling system.. Appendices H and I relate to release cat-egories used in the consequence analysis and consequence modeling considera-tions, and Appendix J presents fish harvest estimates for Lake Ontario in theplant vicinity.
1.2 Permits and Licenses
In ER-OL Section 1.2 the applicant has provided a listing of the status of en-vironmentally related permits, licenses, and approvals from Federal and stateagencies in connection with the proposed project. Pursuant to Section 401 ofthe Federal Clean Water Act, the issuance of a water quality certification bythe State of New York is a necessary prerequisite to the issuance of an operat-ing license by the NRC. This certification was issued on February 23, 1977 andis included as Appendix 1B to ER-OL Section 1.2.
The SPDES permit was issued to the applicant by the State of New York on June 6,1983. It became effective on July 1, 1983 and will expire on July 1, 1988.The permit is discussed in ER-OL Section 1.2 and, as noted above, is reproducedin Appendix E of this statement.
In September 1982, the State of New York received authority to administer therequirements of the Federal Coastal Zone Management Act within New York. OnJuly 26, 1984 the applicant certified to the State of New York that operationof NMP-2 will be in compliance with the state's Coastal Management Program.After the DES was published, the New York Department of State evaluated theapplication. The State found that the proposed activity complies with New YorkState's approved Coastal Management Program and that it will be conducted in amanner consistent with this program. The State Letter of Certification, datedJanuary 30, 1985, is in Appendix L.
NMP-2 FES 1-2

2 PURPOSE AND NEED FOR THE ACTION
The Commission amended 10 CFR 51 effective April 26, 1982, to provide thatneed for power issues will not be considered in ongoing and future OL pro-ceedings for nuclear power plants unless a showing of special circumstances ismade under 10 CFR 2.758 or the Commission otherwise so requires (47 FR 12940,March 26, 1982). Need for power issues need not be addressed by OL applicantsin environmental reports to the NRC, nor by the NRC staff in environmentalimpact statements prepared in connection with OL applications (10 CFR 51.53,51.95, and 51.106(c)).
This policy has been determined by the Commission to be justified even insituations where, because of reduced capacity requirements on the applicant'ssystem, the additional capacity to be provided by the nuclear facility is notneeded to meet the applicant's load responsibility. The Commission has takenthis action because the issue of need for power is correctly considered at theCP stage of the regulatory review where a finding of insufficient need couldfactor into denial of issuance of a license. At the OL review stage, the pro-posed plant is substantially constructed and a finding of insufficient needwould not, in itself, result in denial of the OL.
Substantial information exists that supports the argument that nuclear plantsare lower in operating costs than conventional fossil-fueled plants. If con-servation or other factors lower anticipated demand, utilities remove gener-ating facilities from service according to their costs of operation, with themost expensive facilities removed first. Thus, a completed nuclear plantwould serve to substitute for less economical generating capacity (46 FR 39440,August 3, 1981, and 47 FR 12940, March 26, 1982).
Accordingly, this statement does not consider "need for power." Section 6does, however, consider the savings associated with the operation of thenuclear plant.
NMP-2 FES 2-1


3 ALTERNATIVES TO THE PROPOSED ACTION
The Commission amended its regulations in 10 CFR 51 effective April 26, 1982,to prov-ide that issues related to alternative energy sources will not be con-sidered in OL proceedings for nuclear power plants unless a showing of specialcircumstances is made under 10 CFR 2.758 or the Commission otherwise so requires(47 FR 12940,.March 26, 1982). In addition, these issues need not be addressedby OL applicants in environmental reports to the NRC, nor by the NRC staff inenvironmental impact statements prepared in connection with OL applications(.10 CFR 51.53, 51.95, and 51.106(c) and (d)).
The Commission has concluded that alternative energy source issues are resolvedat the CP stage, and the CP is granted only after a finding that, on balance,no superior alternative to the proposed nuclear facility exists. By earlieramendment (46 FR 28630, May 28, 1981), the Commission also stated that alterna-tive sites will not be considered at the OL stage, except under special circum-stances, in accordance with 10 CFR 2.758. Accordingly, this statement does notconsider alternative energy sources or alternative sites.
NMP-2 FES 3-1

"3.-

4 PROJECT DESCRIPTION AND AFFECTED ENVIRONMENT
4.1 R~sum4
This r~sum4 highlights changes in the plant operating characteristics anddesign as well as new information on the local environment obtained since theFES-CP was issued in 1974.
The major change to the general description of the plant layout is the addi-tion of a cooling tower 165 m (541 feet) high, with a bottom diameter of 123 m(405 feet) and a top diameter of approximately 83 m (273.2 feet). The additionof the cooling tower and the environmental effects of the change from a once-through to a closed-cycle cooling sJstem were evaluated by the staff in 1981.The results of that evaluation are in a report that is included as Appendix Gto this statement.
The total land area disturbed by construction activities is about 46.7 ha(116 acres). This is an increase in acreage over that anticipated in theFES-CP, a result in part of the change in the cooling system. Impacts fromconstruction of the transmission line are less than expected at the FES-CPstage.
The temperature and precipitation extremes for the Nine Mile Point site havechanged slightly from those used to evaluate the meteorology at the site in theFES-CP. These new values are discussed in Section 4.3.3 of this report. Thediscussion of the general climatology in Section 2.6 of the FES-CP remainsvalid.
4.2 Facility Description
4.2.1 External Appearance and Plant Layout
A general description of the plant layout and external appearance is in theFES-CP (Section 3). The revised plant layout showing the location of thesignificant structures is contained in Figure 4.1. The major changes reflectedin the figure are additions of the Energy Information Center and the coolingtower; a new training center is being build just west of the Energy Informa-tion Center. The Energy Information Center is located in the northwest cornerof the site and is used for public education and as a tourist attraction. Thecooling tower is.165 m (541 feet) above ground and is located to the south ofthe containment building.
4.2.2. Land Use
4.2.2.1 Plant Site
The Nine Mile Point site encompasses approximately 364 ha (900 acres). NMP-2and its support facilities occupy 9.3 ha (22.3 acres) between Nine Mile PointUnit 1, which has been in operation since 1969, and the James A. FitzPatrick
NMP-2 FES 4-1

I Nuclear Power Plant, which is owned by the New York Power Authority and islocated on about 283 ha (700 acres) immediately east of the. site. The NMP-2site was cleared and graded in 1965. Before 1965, much of the land in thevicinity of the site was farmed; however, at the time of construction, the sitewas covered with second growth trees and brush (FES-CP Section 2.7.1). Basedon the results of a soil survey for Oswego County (USDA, 1981), the site is inan area of Scriba, Ira, and Ira-Sodus soil mapping units. Sodus is classifiedas prime farmland by the U.S. Soil Conservation Service, and all these areasare classified as farmland of statewide importance. This land is essentiallyirreversibly committed, because it is not likely to be returned to agriculturaluse at the end of the project. Additional Sodus, Scriba, Ira, and Ira-Sodusmapping units are on the property, in the transmission right-of-way south ofLake Road. However, because agriculture is.not an incompatible use alongtransmission line rights-of-way, this land is not irreversibly committed.
FES-CP Section 4.1 estimated that about 6 ha (15 acres) of land would be dis-turbed for NMP-2 buildings and an additional 10 ha (25 acres) used for con-struction laydown area and parking facilities. NMP-2 structures and the cool-ing tower occupy 9.3 ha (23 acres), and about 46.7 ha (116 acres) are used forconstruction support facilities (ER-OL Section 5.1). Thus, 40 more hectares(99 acres) of land are disturbed than anticipated in the FES-CP, a result,in part, of changes in the cooling system that resulted in construction of acooling tower on 1.5 ha (3.7 acres) . Land uses within the site boundary arelisted in Table 4.1.
4.2.2.2 Cooling.Tower
Since the FES-CP was issued, the proposed once-through cooling system has beenchanged to a closed-cycle cooling system with a natural draft cooling tower.The applicant submitted more information on natural draft cooling towers, andthe staff reevaluated the impacts of the cooling system (Appendix G). Thisassessment herein is based on that evaluation and on the ER-OL. However, theER-OL and the 1981 NRC evaluation differ on the location of maximum salt depo-sition. This difference arises because-the NRC evaluation was based on bestavailable generic meterological and cooling tower information in the applicant's1976 report (Niagara Mohawk, 1976). Subsequently, specific information on thecooling tower and site meteorology was used in the applicant's model, and theinformation in the ER-OL is drawn from these updated results.
4.2.2.3 Training Center
Since the FES-CP was issued, a nuclear training center was constructed on thesite just west of the Energy Information Center (Figure 4.1). This facility,which required clearing approximately 26 ha (65 acres), is a two-story steeland masonry structure; it has a parking area capable of supporting 162 vehicles.
4.2.'3 Water Use and Treatment
4.2.3.1 Water use
When the FES-CP was issued, NMP-2 was to use once-through cooling, with anintake flow from Lake Ontario of 34,000 L/sec (535,000 gpm) (FES-CP Section 3.4).Of this flow, the only consumption (i'gnoring increased evaporation from the
NMP-2 FES .4-2

lake) would have been an estimated 0.6 L/sec (10 gpm) (FES-CP Section 3.3). TheNMP-2 applicant has since changed to a closed-cycle design with a natural draftcooling tower (Section 4.2.4). As a result, the maximum anticipated intake flowfrom the lake for service water and fish diversion has been reduced by 89%, to3759 L/sec (59,586 gpm). The average intake flow will be 3380 L/sec (53,600 gpm)(ER-OL Section 5.2.1.1). However, consumptive use within the station will beconsiderably greater than in the once-through design: evaporation from the cool-ing tower will average 625 L/sec (9920 gpm), with a maximum of 870 L/sec(13,800 gpm) in July and August (ER-OL Section 3.3.1 and Table 3.3-1). Duringnormal shutdown, the service water intake flow increases from an average of2440 L/sec (38,675 gpm) to a maximum of 3150 L/sec (49,938 gpm); during a loss-of-coolant accident (LOCA) without loss of offsite power, the service waterintake flow increases to a maximum of 3387 L/sec (53,687 gpm) (ER-OL Table 3.4-1).
In addition to the water from Lake Ontario used for cooling, service water,and other station operations, water from the Oswego City Water Supply will beused for the sanitary system, personnel safety and decontamination, emergencywater supplies, and humidifiers. This water use will be a maximum of 83,000 L/day(22,000 gpd) during normal operations (Mangan, 1984).
As noted above, in 1981 the NRC staff evaluated the effects of the designchange from once-through to closed-cycle cooling (Appendix G). The slight-changes in water use from that evaluated in Appendix G are given in Table 4.2.The current anticipated water use of the station, under average conditions, isshown in Figure 4.2.
4.2.3.2 Water Treatment
Water treatment of the circulating water consists of the addition of sulfuric*acid (to control scaling in piping, the cooling tower, and the condenser) andsodium hypochlorite (to control fouling of the condenser and cooling tower byalgae, fungi, and bacteria). Approximately 0.06 L/sec (1 gpm) of 93% sulfuricacid is added continuously, with manual control, to the circulating water sys-tem at the discharge side of each condenser (ER-OL Section 3.3.2.1). Sodiumhypochlorite, generated on the site, is added to the circulating water systemdirectly ahead of the condenser and is controlled automatically by a continuouschlorine analyzer (ER-OL Section 3.3.2.1). Chlorination is limited by theSPDES permit (Appendix E) to 2 hours/day (ER-OL Section 3.3.2.1), with a totalresidual chlorine level of 0.2 mg/L the daily average and 0.5 mg/L the dailymaximum. Estimated maximum use rate of 93% sulfuric acid and sodium hypochlo-rite is 9957 kg/day (21,951 lb/day) and 907 kg/day (2000 lb/day), respectively(ER-OL Table 3.3-5). The once-through cooling system evaluation in FES-CPSection 3.6 did not involve treatment of the circulating water.
Makeup water for plant use in the turbine, reactor, and radwaste buildings isfiltered (through anthracite and activated carbon) and demineralized (ER-OLSection 3.3.2.2).
4.2.4 Cooling System
As noted elsewhere, the NMP-2 design uses a closed-cycle cooling system witha natural draft cooling tower, rather than the once-through cooling systemassessed in the FES-CP. The 1981 NRC study of this design change is includedin this report as Appendix G. The following paragraphs address those features
NMP-2 FES 4-3

of the cooling system that have changed since or that were not described in the1981 study.
4.2.4.1 Intake System
The current design of the two velocity cap intake structures is shown inFigure 4.3. This design is virtually identical to that of the intake struc-tures considered in the 1981 study (Appendix G, Figure 3.5). The velocity inthe intake pipes leading from the intake structures to the screenbays will beapproximately 0.9 m/sec (3 fps) (ER-OL Section 3.4.2.1), which is similar tothe 0.8 to 1.4 m/sec (2.5 to 4.5 fps) velocity described in the 1981 study.Although the applicant has installed a fish diversion system to reduce thenumber of fish impinged on the traveling screens (ER-OL Section 3.4.2.1), awater spray on the traveling screens will collect any undiverted fish (alongwith debris not stopped upstream at the intake structure bar racks or at thetrash rack) for disposal off the site.
4.2.4.2 Cooling Tower
The applicant has constructed a wet-evaporative, natural draft cooling towerof a counterflow design. The tower is 165 m (541 feet) high, with a bottomdiameter of 132 m (433.6 feet)* and a top diameter of 83 m (273 feet) (ER-OLSection 3.4.2.3). The circulating water flow is 36,590 L/sec (580,000 gpm)(ER-OL Section 3.4.1.1.2); evaporation averages 625 L/sec (9920 gpm) (ER-OLSection 3.3.1), ranging from 290 to 870 L/sec (4560 to 13,800 gpm) (ER-OLSection 3.4.1.1.4). Drift is estimated to be no more than 0.005% of the cir-culating water flow (ER-OL Section 3.4.1.1.4). As shown in Table 4.2, theaverage evaporation is slightly less than--and the maximum evaporationslightly more than--the corresponding rates evaluated in the 1981 NRC cool-ing tower study.
4.2.4.3 Discharge System
Blowdown from the cooling system will be discharged to Lake Ontario along withdischarge from the service water system, the chemical waste treatment system(see Section 4.2.6), and the liquid radwaste system (see Section 4.2.5) (Fig-ure 4.2). Blowdown will average 955 L/sec (15,080 gpm) (ER-OL Section 3.3.1),ranging from 530 to 1290 L/sec (8445 to 20,440 gpm) (ER-OL Section 3.4.1.1.4).As shown in Table 4.2, the average total discharge flow now anticipated isslightly greater than--and the maximum flow slightly less than--the corres-ponding rates evaluated in the 1981 NRC cooling tower study. Because thedimensions of the diffuser have not changed from those described in the 1981study, the average discharge velocity is expected to be slightly greater thanthe earlier estimate: 5.5 m/sec (18 fps) versus 4.8 m/sec (15.8 fps). Themaximum difference in temperature between the intake and the discharge (AT) isnow anticipated to be 15.6C0 (27.99F0 ) (ER-OL Table 3.3-1), less than the17C' (30.6F°) AT evaluated in the 1981 NRC study. During a normal shutdown,discharge temperatures drop as much as 0.7C0 an hour (1.3F' an hour) for thefirst 12 hours, remain constant for the next 2 hours, then abruptly rise asmuch as 5.6C' (1OF 0 ) at 14 hours, remain at 11.7C0 (21F0 ) above ambient until
*ER.OL Amendment 7
NMP-2 FES 4-4

16.5 hours, and then slowly.decrease to 2.7C0 (5F 0 ) above ambient (ER-OL Sec-tion 3.4.1.3.5). Reactor scram and other shutdown situations also alter thethermal discharge pattern.
4.2.5 Radioactive Waste Management Systems,
10 CFR 50.34a requires an OL applicant to include a description of the designof equipment to be installed for keeping levels of radioactive materials ineffluents to unrestricted areas as low as is reasonably achievable (ALARA).ALARA means as low as reasonably achievable taking into account the stateof technology and the economics of improvement in relation to benefits to thepublic health and safety and other societal and socioeconomic considerations
and in relation to the utilization of atomic energy in the public interest.Appendix I to 10 CFR 50 provides numerical guidance on design objectives forlight-water-cooled nuclear power reactors to meet the requirements that theradioactive materials in effluents released to unrestricted areas be kept aslow as is reasonably achievable.
To meet 10 CFR 50.34a, the applicant has provided final designs of radwastesystems and effluent control measures for keeping levels of radioactive materialsin effluents to unrestricted areas within the design objectives of Appendix Ito 10 CFR 50. The applicant has performed a cost-benefit analysis, as requiredby Section I.D of Appendix I, for NMP-2 to show conformance with Appendix Ito 10 CFR 50. In addition, the applicant has provided an estimate of thequantity of each principal radionuclide expected to be released annually tounrestricted areas in liquid and gaseous effluents produced during normaloperation, including anticipated operational occurrences.
The staff's detailed evaluation of the liquid and gaseous radwaste systems andthe capability of these systems to meet the requirements of Appendix I will bein Chapter 11 of the safety evaluation report (SER). The quantities of radio-active material calculated by the staff to be released from the plant are inAppendix D of this environmental statement, along with the calculated doses toindividuals'and to the population that will result from these effluent quanti-ties. The staff's evaluation concludes that the final designs of radwaste sys-tems and effluent control measures are capable of meeting the design objectivesof Sections II.A, II.B, and II.C of Appendix I to 10 CFR 50, so that radioactivematerials in effluents released to unrestricted areas can be kept ALARA. Thestaff also concludes that there are no cost-effective design augments that wouldreduce the cumulative population dose at a favorable cost-benefit ratio, and,therefore, the final design of gaseous and liquid radwaste systems meets therequirements of Section I1.D of Appendix I to 10 CFR 50.
When an OL is issued, the applicant will be required to submit Technical Speci-fications that will establish release rates for radioactive material in liquidand gaseous effluents. These specifications will also provide for the routinemonitoring and measurement of all principal release points to ensure thatfacility operation is in conformance with the requirements of Appendix I to10 CFR 50.
NMP-2 FES 4-5

4.2.6 Nonradioactive Waste Management Systems
4.2.6.1 Aqueous Discharges
Discharges to Lake Ontario consist of (1) a combined discharge comprising cool-* ing tower blowdown and discharges from the service water, treated liquid rad-
waste, filter backwash, and chemical waste treatment systems; (2) a dischargefrom the sanitary waste treatment system; and (3) a discharge of stormwater andfloor, equipment, and building drainage (Figure 4.2). Discussion of the treatedliquid radwaste component of the combined discharge is in Section 4.2.5. Wastewaters from regeneration of ion exchange resins used in the makeup demineraliza-tion water treatment system are treated by self-neutralization of the acid andcaustic components in a 227,000-L (60,000-gallon) tank to pH 6.5 to 8.5. Furtherneutralization is achieved by the addition of sulfuric acid or sodium hydroxide,
* if necessary (ER-OL Section 3.6.1.1.1). (The SPDES permit requires a ph of6.0 to 9.0 for outfall 041, which includes filter backwash, floor drains, andtreated radioactive wastes.) Blowdown from the cooling tower is discharged tolimit the buildup of dissolved solids in the circulating water. On an annualaverage, dissolved solids in the cooling water will be concentrated by evapora-tion to 1.67 times the level in ambient lake water, with a maximum monthlyconcentration factor of 2.23 in July and August (ER-OL Section 3.6.1.1.4). Theaverage concentration factor now anticipated is considerably less than the 2.5factor assumed in the 1981 NRC study; this change results in a more diluteblowdown--and consequently a more dilute combined discharge--than that evaluatedin the 1981 study.
Table 4.3 compares concentrations of constituents in the discharge that wereanticipated at the time of the 1981 NRC study (Appendix G) with those now pre-dicted by the applicant. For most of these constituents, the maximum concen-trations are now predicted to be lower than the average concentrations pre-dicted in 1981; for all the listed constituents, the mean concentration isnow estimated to be lower than in the 1981 study. In addition to the constit-uents addressed in the 1981 study, the NMP-2 will introduce copper and zinc(from corrosion) into the discharged water at a maximum concentration of 0.105and 0.437 mg/L, respectively, and a mean concentration of <0.027 and <0.065 mg/L,respectively (ER-OL Table 3.6-1). If total residual chlorine (TRC) is dischargedin the blowdown at the regulated maximum concentration of 0.5 mg/L for 2 hoursper day, the maximum TRC at the point of the effluent release to Lake Ontariomay be estimated by multiplying this concentration by the maximum ratio ofblowdown flow to total discharge flow, taken from flow data in ER-OL Table 3.3.1.This ratio is 0.86 (in February), yielding a concentration-at the point of dis-charge of 0.43 mg/L TRC. This conservative estimate of the extreme volume alsodoes not take into account chlorine demand in the nonblowdown portion of thedischarge. Other constituents in the intake water would be concentrated as aresult of evaporation from the cooling tower.
The-SPDES permit (Appendix E) regulates discharge temperature, intake-dischargetemperature difference, heat addition, total residual chlorine, and pH in the.cooling tower blowdown (outfall 040). Oil and grease, suspended solids, andpH are regulated in the effluent from the filter backwash and demineralizerregeneration waste treatment system (contributors to outfall 041).
The combined sanitary wastes from Units 1 and 2 are to be treated in a proposedsecondary treatment facility with maximum average design flow and peak flow of
NMP-2 FES 4-6

450,000 L/day (120,000 gpd) and 900,000 L/day (240,000 gpd), respectively, thatwill discharge to Lake Ontario (ER-OL Section 3.6.2, Supplement 6). The SPDESpermit limits the effluent (outfall 030) to a flow of 450,000 L/day (120,000 gpd)and regulates biochemical oxygen demand (BOD), suspended and settleable solids,fecal coliform bacteria, pH, and chlorine. Storm water and uncontaminateddrainage is discharged without treatment via the storm water outfalls at thelake shoreline (ER-OL Section 3.6.3.3) (outfalls 001-006), for which the SPDESpermit does not impose limits. Drainage from areas potentially contaminatedwith oil (diesel generator building, transfer pit) flows through oil-waterseparators before joining the storm water discharge (ER-OL Section 3.6.3.3).Floor and equipment drainage (outfall 007) is regulated by the SPDES permitwith respect to oil and grease, suspended solids, and pH.
4.2.6.2 Solid Discharges
The primary nonradioactive solid wastes from NMP-2 will be cooling tower sludge,sanitary waste sludge, and debris from the trash racks and traveling screens.The applicant estimates that 1668 m3 (58,900 ft 3 ) of cooling tower sludge willbe disposed each 5 years at an offsite, state-licensed disposal facility (ER-OLSection 3.6.1.2). The applicant will have a contractor dispose of sanitarywaste sludge in accordance with state regulations (ER-OL Section 3.6.2).Debris collected in the intake system will be sent to a state-approved land-fill (ER-OL Section 3.4.2.1).
4.2.6.3 Gaseous Effluents
Nonradioactive gaseous emissions from operation of the plant will be negli-gible because the two auxiliary boilers will be heated electrically (that is,there will be no emissions) (ER-OL Section 3.6.3.4), and the three fossil-fueleddiesel generators and the fire pump will be operated infrequently. The dieselgenerators are tested for about 2 hours a month, and the fire pump is testedfor about 1/2 hour a week. Exhausts are discharged to the atmosphere throughstacks. There are no Federal new-source performance standards or preventionof significant deterioration (PSD) requirements because the generators areemergency standby units. There is a New York State opacity limit, which willbe achieved through proper operation and maintenance of the units (ER-OLSection 5.5.2.2). Diesel generators and fire pump emissions are listed inER-OL Table 3.6-4. Predicted suspended particulate concentrations resultingfrom cooling tower drift emissions are well below Federal and state standards,Therefore, PSD requirements do not apply (ER-OL Section 5.5.2.2).
4.2.7 Power Transmission System
The power transmission system (ER-OL Section 3.7) requires construction of anew 345-kV transmission line (instead of the 765-kV line projected in theFES-CP) from Unit 2 to the Volney Station (ER-OL 3.7-1). The new line paral-lels existing transmission lines in a 152.4-m (500-foot) wide right-of-way(ROW)* The new Scriba substation will also be located within this ROW, justsouth of the site. As a result of the change to the 345-kV line, the antici-pated purchase and clearance of additional land along the existing ROW (FES-CPSection 3.9) were not necessary (ER-OL Section 2.2.2). Instead of the lattticesteel tower proposed in FES-CP Section 3.8, the supporting structures of thetransmission line between the Scriba and Volney Stations will be wood-pole,
NMP-2 FES 4-7

H-frame structures with tubular steel poles at angle locations (ER-OL Sec-tion 3.7.2). Between Scriba Station and Unit 2, tubular steel poles will beused. Construction of the new line requires clearing of an additional 23-mby 15.1-m (75-foot by 9.4-mile) strip within the ROW. Present and post-construction land uses within the area to be cleared for the NMP-2 line areshown in Table 4.4. The applicant estimates that there are 2.2 h (5.5 acres)of prime farmland and 0.2 ha (0.5 acre) of unique farmland in the ROW. Theapplication for a state Certificate of Environmental Compatibility and PublicNeed (Article VII of the Public Service Law) requires that information be pro-vided about the environmental impact of construction, restoration, and manage-ment of the transmission facility. This information is in the EnvironmentalManagement and Construction Plan and is outlined in ER-OL Section 5.6.1.3.
4.3 Project-Related Environmental Descriptions
4.3.1 Hydrology
4.3.1.1 Site and Facilities
NMP-2 is on the western portion of the Nine Mile Point promontory on the south-eastern shore of Lake Ontario in Oswego County, New York. All elevations inthis report refer to the U.S. Lake Survey 1935 datum, which is almost equiva-lent to mean sea level (msl) at this location, the difference being only0.366 cm (0.144 inch). To convert elevations to 1955 International Great LakesDatum, subtract 0.375 m (1.23 foot).
The natural grade elevation of the Nine Mile Point site varies between elevation78.03 m (256 feet) and elevation 80.77 m (265 feet). There are no perennialstreams on the site. Precipitation is carried to Lake Ontario via drainageditches, storm sewers, and groundwater flow.
A revetment ditch system was constructed along the lake shore in front of NMP-2.The top of the revetment is at elevation 80.16 m (263 feet) and prevents possi-ble plant flooding as a result of lake wave action (FSAR Section 2.4.5). Aditch located immediately south of the revetment collects rainfall runoff flow-ing north toward the lake and conveys the flow to both ends of the revetment.The east and west berms, Lake Road berm, and the southeast berm were constructedas shown on Figure 4.1 to protect the Unit 1 and Unit 2 complex from flooding.All personnel entrances to seismic Category I structures are at elevation 79.55 m(261 feet) or higher. A detailed description of the water level (flood) designis in FSAR Section 3.4.
4.3.1.2 Hydrosphere
4.3.1.2.1 Surface Water
Lake Ontario, which is the easternmost of the Great Lakes, is an internationalbody of water forming part of the border between the U.S. and Canada. Thelake is 310.6 km (193 miles) long and 85.3 km (53 miles) wide at its largestpoints, and has a surface area of 19,010.6 km2 (7340 mi2 ), or 1.901 million ha(4.7 million acres). It has a maximum depth of 244.4 m (802 feet), an averagedepth of approximately 86.3 m (283 feet), and a volume of 1.638 km3 (393 mi3 )or 0.164 billion ha-m (1.34 billion acre-feet).
NMP-2 FES 4-8
I

Inflow into the western end of Lake Ontario averages approximately 5806 m3 /sec(205,000 ft 3/sec). Runoff directly into Lake Ontario from 70,707 km2 (27,300 mi2 )of watershed in New York State and the Province of Ontario amounts to an addi-tional 1020 m3/sec (36,000 ft 3 /sec). The main feeder is the Niagara River;other large rivers draining into the lake are the Genesee and Oswego Rivers fromthe south shore, the Black River from the east shore, and the Trent River fromthe north shore. The outflow from the lake into the St. Lawrence River averagesabout 6824 m3 /sec (241,000 ft 3/sec).
During the winter, ice cover forms in the slack water bays, but the lake itselfis seldom more than 25% ice-covered. Lake Ontario's outflow river, theSt. Lawrence, is ice-covered from late December until the end of March, allthe way from the lake to the international boundary at Massena, New York.
Before the start of flow regulation, the elevation of the lake surface was con-trolled by a natural rock weir located about 6.4 km (4 miles) downstream fromOgdensburg, New York, in the Galop Rapids reach of the .St. Lawrence River. The111-year record of the U.S. Lake Survey (1860 through 1970) indicates a meanlake surface elevation of 75 m (246 feet). Over this period, the maximumlake surface elevation was 75.98 m (249.29 feet), and the minimum was 73.97 m(242.68 feet), a range of 2.01 m (6.61 feet). The annual range of elevationsvaries between 1.09 and 0.21 m (3.58 and 0.69 feet).
Dams on the St. Lawrence River, under the authority of the InternationalSt. Lawrence River Board of Control, are now used to regulate the lake level.The low limit is set for elevation 74.37 m (244 feet) on April 1 and is main-tained at or above that elevation during the entire navigation season (April 1to November 30).
Water surface set-up and seiche are produced by winds and atmospheric pressuregradients. These short-term lake fluctuations are generally less than 0.6 m(2 feet) in amplitude. Winds are directly related to the formation of surfacewaves, the magnitude of which varies between 0 and 4.6 m (15 feet) in heightduring a given year. Tides are less than 2.5 cm (1 inch) in magnitude.
The average annual precipitation in the site area is about 92 cm (36 inches).It is estimated that approximately 46 cm (18 inches) are lost as runoff intostream flow. Of the remaining 46 cm (18 inches), approximately 41 cm(16 inches) are lost via evaporation from land and water surfaces and trans-piration by plants, referred to~together as "evapotranspiration." The remain-ing 5 cm (2 inches) is available for groundwater recharge. The relatively highrunoff can be attributed to the low permeability of the glacial soils and rockformations.
Seasonal Temperature Structure of Lake Ontario
Lake Ontario is a large, temperate lake that experiences seasonal changes inits thermal structure that, in turn, alter its circulation patterns. Thechanges in stratification result from atmospheric heat exchange and wind-induced mixing.
Natural warming of the lake begins in mid-March and continues until mid-September.At the onset of warming, the surface water temperature in the shallow littoralzone rises more rapidly than in regions just offshore. The summer season starts
NMP-2 FES 4-9

in late June when the offshore surface temperature stays above 4'C (39.2*F).In general, vertical stratification over the entire basin is established atthis time by the combined effects of lake warming and the advection of thewarmer, near-shore water. The lake's mean surface temperature reaches 21'C(69.8'F), and the temperature of the hypolimnion (the bottom layer) varieswith depth, ranging between 3.8 0 C and 4.0°C (38.8 0 F and 39.2 0 F), (New York,1971).
In late September, the warming process ends. The lake's mean surface tempera-ture drops rapidly to below 170 C (62.6'F), and the thermocline begins toweaken. The vertical temperature gradient decreases as the surface layer anddeeper water effectively mix. (Mixing is the consequence of convection causedby cooling at the surface and is enhanced by the weakening of the thermocline,which permits wind-induced turbulence to extend to greater depths.) The fallcooling process resembles spring warming but in reverse. The breakdown oftemperature stratification throughout the lake marks the onset of the winterseason. The date of overturn differs from year to year, depending on the occur-rence of storms. The lake surface is cooled below 40C (39°F), and surface iso-therms tend to be parallel to the shore. With continued cooling, ice forms inthe near-shore region.
Water Circulation in Lake Ontario
The annual average large-scale circulation pattern of Lake Ontario is counter-clockwise (cyclonic flow), with flow to the east along the south shore in arelatively narrow band and a somewhat less pronounced flow to the west alongthe north shore. The conceptual model explaining this general circulationpattern is presented in detail in the James A. FitzPatrick Nuclear Power Plant316(a) Demonstration (ibid).
The general circulation described above has been documented by observationscollected over long periods (months). The circulation patterns that areobserved at a specific time, however, are more complex as a result of thelake's response to the shifting winds. At times, a major shift in wind distri-bution can alter the currents in a matter of hours, while at other times, somefeatures of the current pattern can continue even with an opposing wind(Csanady, 1972).
Two important examples of wind-induced changes in the general circulationpattern are upwelling and internal oscillation. Upwelling is characterizedby the rising of colder, heavier, bottom water toward the surface. A varietyof mechanisms have been proposed to account for the observed oscillations ofthe thermocline. The most direct explanation is that an upwelling displacesthe thermocline from equilibrium by converting kinetic energy of the wind topotential energy of the thermocline position. When the wind stress is removed,internal waves are set in motion and contribute to the dissipation of thisenergy. Internal waves increase in amplitude after storms, and, in LakeOntario, the oscillations have a period of nearly 17.5 hours, roughly threecomplete oscillations every 2 days. These oscillations are a common featureof lake temperature records and are prominent in intake temperature recordssuch as those of NMP-1 and the FitzPatrick plant.
NMP-2 FES 4-10

Geomorphology at Nine Mile Point
Nine Mile Point is a slight promonotory along the south shore of Lake Ontario.The offshore slope at the plant is steep ( 5% to 10% grade) at the beach. Itflattens to a 2% to 3% grade to the 5-m (15-foot) depth, then steepens to a 4%slope lakeward. The slope at the 6-m (20-foot) depth contour is steeper atthe plant than to the east or west of the plant.
A number of observations of the bottom sediments along the south shore of LakeOntario have been made. Sutton et al. (1970) examined near-shore bottom sedi-ments (0 to 33 m (0 to 108 feet)) in 1968 and 1969 between Rochester and StonyPoint, and stated several conclusions relevant to the Nine Mile Point site:
(1) There is generally a west-to-east transport of sediment.
(2) Sites of sediment accumulation occur in near-shore shallow areas where theshoreline is irregular and where there are local deviations from theabove transport pattern.
(3) In general, the coarser sands, boulders, pebbles, and cobbles lie in thebeach or near-shore area, and finer sediments are found lakeward.
(4) Several small patches of sand occur offshore between Oswego and MexicoBay, and it is hypothesized that these originate from the Oswego River.
Visual observations made in the Nine Mile Point vicinity during the 1973-1976aquatic programs (ER Section 6.5.2.1.2.7) corroborate the earlier observationsof Sutton et al.
Currents at Nine Mile Point
Current measurements were made off the Nine Mile Point promonotory from May toOctober 1969 and from July to October 1970 (New York, 1971; Gunwaldsen, 1970).Two fixed underwater towers were placed in the lake, one in 7.3 m (24 feet) ofwater and one in 14.0 m (46 feet) of water, and provided average hourly currentspeed and direction data. In addition, two drogue surveys were conducted in1969 to obtain the overall current pattern at the site. Results from thesestudies are presented in the FitzPatrick 316(a) demonstration (New York, 1971)and are summarized in the paragraphs below. The methods used in these studiesare described in ER Section 6.3.1.
The wind speed-frequency data indicate that over the year winds in excess of9 m/sec (20 mph) occur 21.6% of the time, based on readings averaged over a6-hour period. From June through September, winds in excess of 9 m/sec (20 mph)occur 13.9% of the time. The current speed of 6-hour duration exceeded withcomparable frequency (June-September) at the 6-m (19-foot) depth is about0.06 m/sec (0.2 fps).
The predominant current direction in the preceding studies is along the shore.On those occasions when onshore or offshore currents were observed, their mag-nitudes were substantially less than those of along-shore currents. Based onthis near-field data, along-shore currents from the east are just slightlymore likely to occur than are those from the west. Overall lake circulationpatterns are typically west to east along the south shore of Lake Ontario
NMP-2 FES 4-11

(ER Section 2.3.1.1.3). Onshore and offshore currents each account for onlyabout 5% of the observations. Approximatly 30% of the observations were belowthe meter threshold, 0.03 m/sec (0.08 fps).
4.3.1.2.2 Groundwater
Beneath the Nine Mile Point site, the hydrologic units in descending order are:Unlithifield Sediments, Oswego Sandstone, Pulaski Formation, and WhetstoneGulf Formation (NMP-2 FSAR). Groundwater is available from an unconfinedaquifer and deep confined aquifers. The unconfined aquifer is composed ofglacial till and fill material (Unlithified Sediments) and the upper portionof the Oswego Sandstone beneath the soil. The unconsolidated deposits rest ona permeable fractured zone at the top of the Oswego Sandstone. As the depthincreases in the sandstone, the number of fractures decreases, with the forma-tion becoming relatively impermeable within approximately 6 m (20 feet). Thelocal water table varies from about 255 feet msl near the plant to about244 feet msl (lake level) near the lake, with annual variations of approxi-mately 0.6 m (2 feet). The average gradient is approximately 0.71 to thenorth-northwest.
The transition zone between the Oswego Sandstone and Unit A of the PulaskiFormation (FSAR Section 2.5.1.2) is a more permeable zone than the overlyingand underlying strata (Nevin, 1929). It appears to have a higher piezometrichead (based on boring measurements) than the unconfined water table (NiagaraMohawk, 1980). Flow in this zone is confined. Another confined zone ofrelatively high permeability occurs in the Pulaski Unit B. The overlyingUnit A may be acting as an aquitard. Below, the Unit C zone has a very lowpermeability and separates the confined Unit B zone of the Pulaski Formationfrom the Whetstone Gulf Formation. All of the deep aquifers are confined andare charactized by artesian pressure.
4.3.2 Water Quality
This section addresses the water quality of Lake Ontario, which is (1) thesource of water used at NMP-2 (in addition to a relatively minor use from theOswego City Water Supply), as described in Section 4.2.3, and (2) the receiv-ing water for aqueous discharges, as described in Section 4.2.6.
The 1981 NRC cooling system study (Appendix G, page 2-1) found that, through1977, the water quality of Lake Ontario was similar to that described in theFES-CP. As shown in Table 4.5, data reported for 1978 (the most recent datareported in the ER-OL for water quality characteristics other than temperatureand dissolved oxygen) are similar to those considered in the 1981 NRC study.
Copper and zinc, which will be discharged as a result of corrosion (see Sec-tion 4.2.6), are also of interest in terms of ambient water quality. Forboth elements, measured mean concentrations in 1978 were well below the statestandards (ER-OL Table 2.3-15): for copper, <19 versus 200 pg/L and for zinc,<48 versus 300 pg/L, although the maximum zinc concentration, 675 pg/L, ex-ceeded the standard (ER-OL Table 2.3-13).
Total dissolved solids .(TDS) concentrations in Lake Ontario are above the NewYork State Water Quality Standard of 200 mg/L (ER-OL Section 2.3.3.3 and2.3.3.5). High maximum pH values, attributable to photosynthetic activity,
NMP-2 FES 4-12

generally exceed the upper limit of the state standard (pH 8.5) (ER-OL Sec-tion 2.3.3.5). Natural water temperatures for the vicinity of the station,measured from April through December 1976 at a depth of 6 m (20 feet) at acontrol transect 32 km (20 miles) east of the station, range from 1.10 C(34.0 0 F) to 23.2 0 C (73.8 0 F) (ER-OL Section 2.3.1.1.5). During the winter, iceforms in near-shore areas (ER-OL Section 2.3.1.1.1). The existing NMP-1 andFitzPatrick power plants, each with once-through cooling, elevate surfacewater temperatures in the vicinity of the station (ER-OL Section 2.3.3.5).
Although mirex (a chemical used in pesticides, flame retardants, and plasti-cizers) is of concern in Lake Ontario from the standpoint of bioaccumulationin food webs, availability and transport from the former sources appears tobe via sediments rather than water. Measured sediment concentrations in thelake have exceeded 10 pg/L near-Oswego, but no detectable concentrations ofmirex have been found in the water column (New York, 1978). There are nowno known active sources of mirex input to the lake, and it has.-been estimatedthat the mirex now in Lake Ontario will be flushed from the ecosystem in 10to 100 years (ibid).
4.3.3 Meteorology
The discussion of the general climatology in FES-CP Section 2.6 is still appro-priate, although the temperature and precipitation extremes have changedslightly. The extreme temperature values now are maximum 37'C (98'F) and mini-mum -32'C (-26'F), observed at the National Weather Service Office in Syracuse,New York through 1980. Total precipitation averages are 925 mm (36.4 inches)a year, with a range of from 55 mm (0.21 inch) to 312 mm (12.3 inches) formonthly extremes. Snowfall averages 2831 m (111.5 inches) a year, with a maxi-mum monthly amount of 1844 mm (72.6 inches) in February. The greatest 24-hoursnowfall measured through 1976--622 mm (24.5 inches)--occurred in January 1966.Precipitation is evenly distributed throughout the year, with about 76 mm(3 inches) a month on the average.
Winds are measured at the site at the 10- and 61-m levels. These wind measure-ments reflect the effects of the proximity of the site to Lake Ontario and theexistence of small-scale air circulations as a result of thermal differencesbetween the land and water temperatures (lake-land breeze circulations). Theprevailing winds are from the west.
Extreme winds in the site area result from thunderstorms and intense low pres-sure storm systems that move over the Great Lakes and the St. Lawrence RiverValley.
The highest winds observed in the area were 31 m/sec (69 mph); the average wind
speed is 4 m/sec (10 mph) from the west.
4.3.4 Terrestrial and Aquatic Resources
4.3.4.1 Terrestrial Resources
The review of the terrestrial resources of the site and the transmission corri-dor is based on (1) 1979 aerial photographs, (2) a 1979 terrestrial field survey,and (3) review of pertinent literature (ER-OL Sections 2.4.1 and 6.5.1). Thecharacterization of the transmission corridor was also based on consultation
NMP-2 FES 4-13

with local specialists, a field survey in October 1981, and information in theArticle VII application for a Certificate of Environmental Compatibilityand Public Need (New York State Public Service Law), which authorizes construc-tion and operation of the line. Tables 4.1 and 4.4 summarize the terrestrialhabitats of the site and the transmission corridor.
Clearing of land in the past has altered the structure of the terrestrialcommunities on the site and transmission corridor. Presently, much of thearea is in varying stages of.succession (e.g., old field communities andsecond-growth hardwoods), following use as crop land, pasture land, or orchards.Vegetative types in the transmission corridor and in the vicinity of the siteare shown on Figure ER-OL 2.4-2. The wildlife species found on and near thesite are typical of disturbed areas in the northeastern United States (FES-CPSection 2.7.1). The most common mammals trapped in the 1979 survey (ER-OLSection 2.4.1.1.3.1) were the white-footed mouse (Peromyscus leucopus) and thedeer mouse (P. maniculatus). Two woodchucks (Marmota monax) and tracks ofwhite-tailed deer (Odocoileus virginianus) were also observed during thesurvey.
The lake area bordering the site is part of the waterfowl winter concentrationarea identified by the New York State Department of Environmental Conservationas significant habitat (ER-OL Section 2.4.1.1.4). The closest wildlife manage-ment area is an Audubon bird sanctuary 3 km (1.9 miles) east of the site on theLake Ontario shore (ER-OL Section 2.4.1.1.1). Numerous bird species breed inthe area of the site (ER-OL Tables 2.4.8, -9, -11, and -12) and many other spe-cies are transient (ER-OL Table 2.4.8) during the spring and fall migrations.Raptors migrate along the shore of Lake Ontario inthe spring and turn northalong the eastern end of the lake east of Nine Mile Point (ER-OL Sec-tion 2.4.1.1.3.2). No wildlife concentration areas or refuges are traversedby the ROW.
4.3.4.2 Aquatic
The aquatic resources of Lake Ontario that potentially will be affected byoperation of NMP-2 were reviewed in the FES-CP and in the staff's 1981evaluation of the conversion to closed-cycle cooling. This latter document(Appendix G) forms the aquatic resource information base that will be updatedin this statement.
This section updates the discussion on lake biota and fisheries. ER-OL Sec-tion 2.4.2 describes the ecology of the lake, and Section 4.6.5.2 describesthe sampling program. Additionally,.there is much information in the annualreports of ecological studies at both NMP-1 and the FitzPatrick power plants;this information is used where appropriate. Data.on fishery harvests are inER-OL Section 2.3.2.3 and in a study done for NRC by Oak Ridge National Labora-tory (Appendix J of this statement).
4.3.4.2.1 Biota
On the basis of data collected in the Nine Mile Point area through 1976, the1981 NRC study (Appendix G) focused on the potential effects of the coolingsystem on Lake Ontario fish and ichthyoplankton, particularly alewife (Alosapseudoharengus) and rainbow smelt (Osmerus mordax). Data through 1982 are now
NMP-2 FES 4-14

available. This section summarizes the most current information on fish commu-nity composition and ichthyoplankton abundance and distribution in the vicinity.
Of 74 identified fish species (including sub-species and hybrids), only brassyminnow (Hybognathus hankinsoni), bloater (Coregonus hoyi), and chain pickerel(Esox niger) represent taxa taken in recent samplings (1977, 1981, and 1982,respectively) in the Nine Mile Point area that had not been taken through 1976(Lawler, Matusky, and Skelly, 1983, and Ecological Analysts, 1983).
The 1981 NRC study (Appendix G, pages 5-1 to 5-3) found that the fish speciesthat were most abundant in the impingement samples at NMP-1 and FitzPatrickwere also the most abundant in the lake in the site vicinity. At NMP-1 (1973-1976) and at FitzPatrick (1976), alewife, rainbow smelt, spottail shiner(Notropis hudsonius), and mottled sculpin (Cottus bairdi) accounted for 80% to97%, 2% to 7%, 0.01% to 0.36%, and 0.06% to 0.31%, respectively, of the totalestimated impinged fish. These four species accounted for 88% to 99% of thetotal estimated number of impinged fish. During April to December 1982 gillnetting in the Nine Mile Point vicinity, alewife, spottail shiner, and rainbowsmelt (81%, 12%, and 3%, respectively) accounted for 96% of the total numberof fish sampled. During that same year, these three species represented 80%and 97% of the total number of impinged fish at the NMP-1 and FitzPatrickpower plants, respectively (Ecological Analysts, 1983).
As had been the case from 1974 through 1976, alewife and rainbow smelt werethe dominant ichthyoplankters in 1977 and 1978 (Lawler, Matusky, and Skelly,1983). These two species accounted for the majority of entrained ichthyo-plankton in 1975 and 1976 (Appendix G, pages 5 to 10). The 1981 NRC study(ibid) found that ichthyoplankton abundance was highest at the approximatedepth of the intake structures (6 m). However, although larval alewife weresomewhat greater in abundance at 6 m than at 12 to 30 m in 1977, this differ-ence was not apparent in 1978, nor was it apparent for rainbow smelt in eitheryear (Lawler, Matusky, and Skelly, 1983).
In summary, based on more recent data, the fish and ichthyoplankton communityin the vicinity of the station appears to be similar to that considered in the1981 NRC study: alewife and rainbow smelt, the dominant species in terms ofboth impingement and larval entrainment at the adjacent power plants, representthe most abundant fish and larvae in the Nine Mile Point area.
Samples of the macroinvertebrates of the Nine Mile Point area from 1973 to1978 did not indicate the presence of the Asiatic clam (Corbicula sp.), whichis of interest because of its potential for fouling cooling systems of powerplants. A 1981 survey for Corbicula near the site and at the NMP-1 intake anddischarge structures also produced negative results (Niagara Mohawk, 1981).Corbicula has been reported from western Lake Erie and may spread eastward(NUREG-0884), although it may already be at the final limit of its northerndistribution, based on sensitivity to minimum winter temperatures (McMahon,1982).
4.3.4.2.2 Fisheries
Total annual commercial fish harvest from Lake Ontario from 1976 to 1980ranged from 58,000 to 94,000 kg (129,000 to 207,000 lb) for U.S. waters and
NMP-2 FES 4-15

from 835,000 to 1,233,000 kg (1,841,000 to 2,719,000 lb) for Canadian dis-tricts 3, 4, 5, and 6 (central and eastern Lake Ontario) (ER-OL Tables 2.3-7and 2.3-16 and Figure 2.3-15). The U. S. catch was dominated by eel (Anguillarostrata), yellow perch (Perca flavescens), bullhead and catfish (Ictalurusspp.), and smelt, with the composition percentages varying from year to year(ER-OL Table 2.3-7).
These fish, plus white perch (Morone americana) and carp (Cyprinus carpio),dominated the Canadian harvest (ER-OL Table 2.3-16). These dominant fish aresimilar to those listed in the FES-CP Section 2.7.2, and, as reported in theFES-CP, the U.S. commercial catch was much smaller than the Canadian catch.The U.S. Lake Ontario sport fishery, estimated at almost 5 million fish for1976-1977, comprised 35% yellow perch, 28% panfish, 15% black bass (Micropterusspp.), 14% bullhead and catfish, and 8% others (ER-OL Table 2.3-8). Similarly,yellow perch accounted for 31% (by number) of the 1980 angling harvest in theCanadian waters of Lake Ontario between Salmon Point and Kingston, Ontario(ER-OL Table 2.3-9).
In the site vicinity, fishing occurs in the lake, in the creeks and rivers,and at the creek mouths. The areas with the most fishing pressure are OswegoHarbor, Salmon River, Sandy Pond, and the Nine Mile Point vicinity (Storr,1977). Fishing occurs seasonally by boat anglers in the thermal dischargeplumes at Nine Mile Point, where predator fishes are seeking prey speciesattracted to the warm water (Storr and Schlenker, 1974).
4.3.5 Endangered and Threatened Species
4.3.5.1 Terrestrial
No plant species listed as endangered or threatened by the U.S. Fish and Wild-life Service (FWS, Sections 2.4.1.1.2 and 5.6.1.1) occurs on the site or alongthe transmission corridor right-of-way (ROW). Several plants listed as pro-tected by the New York State Department of Environmental Conservation havebeen identified at the site (ER-OL Section 2.4.1.1.2). They are: runningpine (Lycopodium complanatum), Christmas fern (Polystichum archostichoides),New York fern (Thelypteris noveboracensis), and triliium (Trillium sp.).These plants are listed because they are attractive, but they are not con-sidered endangered or threatened in New York State. Under the state Environ-mental Conservation Law (Section 9-1503), these plants may not be picked,plucked, severed, removed, or carried away without consent of the propertyowner.
Except for occasional transient species, no Federally (Hamilton, 1983) orstate-listed (Bouton, 1984) endangered or threatened wildlife species areknown to exist on the site or within the transmission ROW. Possible transientFederally protected species include the Indiana bat (Myotis sodalis), baldeagle (Haliaeetus leucocephalus), and peregrine falcon (Falco perearinus).Transient species occurring in the area (ER-OL Tables 2.4-8 and 2.4-10) andlisted as endangered by the state include the golden eagle (Aquila chrysaetos)and loggerhead shrike (Lanius ludovicianus). Species listed by the state asthreatened that breed in the area (ER-OL Table 2.4-8) include the northernharrier or marsh hawk (Circus cyaneus) and the common tern (Sterna hirundo).Migrant species occurring in the area and listed as threatened by the stateinclude the osprey (Pandion haliaetus), red-shouldered hawk (Buteo lineatus),
NMP-2 FES 4-16

and piping plover (Charadrius melodus). The timber rattlesnake (Crotalushorridus) is listed by the state as threatened and was listed in the ER-OL asTlikely to occur on the Unit 2 site or environs." More recent references,however, indicate that the timber rattlesnake is not likely to occur in theOswego County coastal zone area (Bieber et al., 1976; Behler and King, 1979).
In addition, based on Bieber et al. (1976), there are a number of speciesdescribed by the applicant as "likely to occur" on the site or environs(Table 4.6) that are listed by the state as "special concern species." Theseare species that are not yet recognized as endangered or threatened, but forwhich there is documented concern for their continued welfare in New York.
4.3.5.2 Aquatic
No Federally listed endangered or threatened aquatic species were found from1972 to 1982 in the Nine Mile Point vicinity, either in lake sampling or inimpingement sampling at the NMP-1, FitzPatrick, or Oswego power plants (Lawler,Matusky, and Skelly-, 1983, and Ecological Analysis, 1983). The U.S. Fish andWildlife Service does not know of any Federally listed or proposed endangeredor threatened species occurring in the vicinity of the station, except foroccasional transients (Hamilton, 1983). The blue pike (Stizostedion vitreumglaucum) had been classified as endangered in the 1983 publication of theU.S. list of endangered and threatened species (FWS, 1983a). However, thisfish, whose historic range included Lake Ontario, is now considered extinct(no confirmed specimens having been taken since the 1960s) and hasbeen removedfrom the list. The U.S. Fish and Wildlife Service announced in 1982 (FWS, 1982)that it was considering listing as endangered or 'threatened the short-nosecisco (Coregonus reighardi), whose distribution includes Lake Ontario; thisfish has not been collected in the Nine Mile Point vicinity, according to theaforementioned sampling data.
One state-listed threatened fish, the lake chubsucker (Erimyzon sucetta) (NewYork, 1984), was taken in a 1975 sample in the Nine Mile Point vicinity (Lawler,Matusky, and Skelly, 1983). That collection was of a single specimen that wastaken during the summer in a seine haul at the mouth of the Salmon River (ER-OLSupplement 6 Section 5.3), a site about 13 km (8 miles) east-northeast of thestation. Lake Ontario represents the northeastern limit of the distribution'of the species, which is found in the central and southeastern U.S. (Pfleiger,1975).
4.3.6 Community Characteristics
The socioeconomic descriptions of the area--including demography, land use,and community characteristics in general--in FES-CP Chapters 2, 4, 5, and 10.The Nine Mile Point site is about 10 km (6.25 miles) northeast of Oswego,New York (1980 population 19,793) and about 20 km (12.4 miles) north-northeastof Fulton, New York (13,312). Syracuse, New York (170,105), the largest cityin the area, is about 53 km (33 miles) south-southeast of the site.
The applicant estimates the 1980 population within 16 km (10 miles) of theplant to have been 35,467. The staff has reviewed the applicant's demographydata within 16 km (10 miles) and found it compares favorably with independentdata sources.
NMP-2 FES 4-17

The transient population of the area is composed of individuals associated withindustrial, institutional, and recreational facilities. The major employerswithin 16 km (10 miles) of the site are Alcan Aluminum Corporation (1000 em-ployees), Niagara Mohawk Power Corporation (450 employees), and four otherfirms, each with between 100 to 200 employees. Nearby institutions includeeducational and health care facilities. The majority of students within10 miles of the site are residents of the area and do not add to the population.However, the State University College at Oswego is about 13.7 km (8.5 miles)southwest of the plant; it has an enrollment of less than 8000 students. The.nearest hospital is the 132-bed Oswego Hospital in Oswego.
There area also five nursing home/extended care facilities in Oswego, having atotal of 438 certified beds. With respect to recreational activity, there isthe 12-acre Ontario Bible Campground 1.5 km (0.9 mile) west-southwest of thesite. The camp is used by groups of about 500 people throughout the summerand by up to 1500 attendees for short periods on Sundays throughout the warmseason. Selkirk Shores, a 980-acre state park, is located-16 km (10 miles)northeast of the site and has the capacity to handle about 3600 people.
There are no other significant changes in these areas from the descriptionsin the FES-CP.
4.3.7 Historic and Archelogic Sites
FES-CP Section 2.3 describes historic and archeologic sites. New informationdeveloped since the issuance of the FES-CP consists of the issuance of areport documenting the results of cultural resource studies of the NMP-2Volney transmission line right-of-way. The report concluded that there wereno properties listed or eligible for listing on the National Register ofHistoric Places in or near the project area. Appendix F of this statementcontains a revised list of sites included or eligible for inclusion in theNational Register.
4.4 References
Behler, J. L. and F. W. King, The Audubon Society Field Guide to North AmericanReptiles and Amphibians, Albert A. Knupf, New York, 1979.
Bieber, A., M. K. Bollenbacker, J. D. Brown, T. A. Dillon, D. Dosch, C. J.Elliott, A. Giordano, P. T. Meier, and G. A. Smith, "Habitat and WildlifeInventory: Guide to Coastal Zone Lands, Oswego County, New York," Rice'CreekBiological Field Station, Bulletin No. 4, 1976.
Bouton, D., New York Department of Environmental Conservation, letter toR. Cushman, Oak Ridge National Laboratory, January 23, 1984.
Csanady, G. T., "The Coastal Boundary Layer in Lake Ontario," Chapter II, "TheSummer-Fall Regime," in Journal of Physical Oceanography, Vol 2, 1972
Ecological Analysis, Inc., "1982 Nine Mile Point Aquatic Ecology Studies,"Middletown, NY, 1983.
NMP-2 FES 4-18

Gunwaldsen, R. W., B. Brodfeld, and G. E. Hecker, "Current and TemperatureSurveys in Lake Ontario for James A. FitzPatrick Nuclear Power Plant," inProceedings of the 13th Conference on Great Lakes Resources, 1970.
Hamilton, P., U.S. Fish and Wildlife Service, letter to B. J. Youngblood, NRC,March 2, 1983.
Lawler, Matusky, and Skelly Engineers, "Nine Mile Point Aquatic Ecology Summary(1973-1981)," Pearl River, NY, 1983.
Mangan, C. V., Niagara Mohawk Power Corporation, letter to D. G. Eisenhut, NRC,October 1, 1984.
McMahon, R. F., "The Occurrence and Spread of the Introduced Asiatic FreshwaterClam, Corbicula fluminea (MUller), in North America: 1924-1982, in The Nautilus,96:134-141, 1982.
Nevin, C. M. "The Sand and Gravel Resources of New York State," New York StateMuseum Bulletin No. 282, The University of the State of New York, Albany,June 1929.
New York State Department of Environmental Conservation, "Endangered, Threatened,and Special Concern Species of New York State," transmitted by the EndangeredSpecies Unit, Wildlife Resources Center, Delmar, NY, to Oak Ridge NationalLaboratory, January 23, 1984.
--- "The Problem of Mirex in Lake Ontario," Status Report, Toxic SubstancesCoordinating Unit, Bureau of Water Research, Division of Pure Water, Albany,New York, 1978.
New York State, Power Authority, "James A. FitzPatrick Nuclear Power Plant316(a) Demonstration Submission," prepared for the U.S. Atomic Energy Commis-sion, 1971.
Niagara Mohawk Power Corporation, "Geologic Investigation: Radwaste ThrustStructure, Vol III, Unit 2, Nine Mile Point Nuclear Station," 1980.
--- , "Report on Circulating Water Cooling System Employing a Natural Draft Cool-ing Tower, Nine Mile Point Nuclear Station Unit 2," NRC Docket No. 50-410, 1976.
--- "Response to IE Bulletin 81-03, Flow Blockage of Cooling Water to SafetySystem Components by Corbicula sp. (Asiatic clam) and Mytilus sp. (mussel),Syracuse, NY,,1981.
Pflieger, W. L., "The Fishes of Missouri," Missouri Department of Conservation,Jefferson City, MO, 1975.
Storr, J. F., "Lake Ontario Fish Tag Report Summary, 1972-1976," prepared forNiagara Mohawk Power Corporation, 1977.
Storr, J. F. and G. Schlenker, "Response of Perch and their Forage to ThermalDischarges in Lake Ontario, in Gibbons, J. W. and R. R. Scharitz (eds).,"Thermal Ecology," U.S. Atomic Energy Commission, Oak Ridge, TN, 1974.
NMP-2 FES 4-19

Sutton, R. G., T. L. Lewis, and 0. L. Woodrow, "Near Shore Sediments inSouthern Lake Ontario, Their Dispersal Patterns and Economic Potential," inProceedings of the 13th Conference on Great Lakes Resources, 1970.
U.S. Department of Agriculture (USDA), "Soil Survey of Oswego County, NewYork," Soil Conservation Service in cooperation with Cornell UniversityAgricultural Experiment Station, 1981.
U.S. Fish and Wildlife Service, "Endangered and Threatened Wildlife and Plants;Review of Vertebrate Wildlife for Listing as Endangered or Threatened Species,"in Federal Register, December 30, 1982.
--- , "Endangered and Threatened Wildlife and Plants," Federal Register, July 27,1983a..
", 'Two Fishes Removed from Endangered Species List," in Endangered SpeciesTechnical Bulletin, 8(10):3, 1983b.
U.S. Nuclear Regulatory Commission, NUREG-0884, "Final Environmental StatementRelated to the Operation of Perry Nuclear Power Plant, Units 1 and 2, 1982.
NMP-2 FES 4-20

01114 IUOE
(
.7.•
->j
1• C.-, i1,w ,
Figure 4.1 Site layout
Source: ER-OL Figure 3.1-1

11 $11. 5IVICI WATER SYSTEM DISCHAR
/H•9ý,2o (AVG]
IN4,A 2 E COOLING TOWE
FL OW E VG I I GPM
•l AIIW/sc. 1-11,W|L All $| SISI MITI| I..' SEALS
3.41. E$YASOhALS
OPTERMAI GG A EIV R
STIVC WAAER AA
t •.IMIN ls ALZ|1 All. S104,4.1 E A
OPoERATINGLFLOW FRAgur 3AB3
FLOW RATESWINGP
EM~moININ. LAN? [
WAtIT TREAT-INT I'l 1"...POIC~O
MAJNIINANCl TANK
PERONT NEL SAETOOAIO
1AFlT, $Ho)WEi$
ETjWA$Kf$
Figure 4.2 Water use diagramSource: ER-OL Figure 3.3-1
A

28'-6"
"I7
TOP OF WALL EL229-3" INTAKE 2TOP OF WALL EL 229'-I" INTAKE I
(WALL TO BE POURED AFTER, INTAKE PIPE IS GROUTED IN)
I L1 II• A
TYP RACK ASSEMBLY
SEE B-B
MANHOLE- \EL 229-I" INTAKE *1IEL229-3-INTAkE-2 ELEC PULL BOX (TYP)
Si TYPI60oTYPICAL
INTAKE SHAFTA A
Figure 4.3 Details of intake structure

Table 4.1 Land use within the site boundary
AreaLand usecategory Hectares Acres % of site*
Industrial
Power plant facilities 76 188 21
Woodlands
Forest 58 143 16Brushland 101 249 28
Wetlands
Shrub wetlands, bogs,marshes 10- 25 3Wooded wetlands 14 35 4
Active agriculture
Orchards <1 2.5 <1
Recreation
Nine Mile Point EnergyInformation Center 7 17 2
Communications
Electric power andtelephone lines, micro-wave stations, telephoneand radio towers 54 133 15
Inactive agricultural lands 43 106 12
TOTAL 364 898.5 101
*Does not equal 100% because of rounding.
Source: ER-OL Table 2.2-1
NMP-2 FES 4-24

Table 4.2 Differences in water use and flow ratesbetween the 1981 NRC study (Appendix G)and the ER-OL
1981 NRC Study ER-OLUse L/sec gpm L/sec gpm
Water intake averageTotal 3110 49,400 3380 53,600*Service water 2270 36,000 2440 38,675**Fish diversion 845 13,400'** 940 14,925
Water discharge
Average 1590 25,200 1810 28,755tMaximum 2260 35,900 2210 35,040tt
Evaporation
Average 695 11,000 625 9,920c**Maximum 755 12,000 870 13 , 8 0 0 ett
*ER-OL Section 5.2.1.1.**ER-OL Section 3.3.1.
***For lake water temperatures
tFigure 3.3.1.tfTable 3.3.1.
less than 26*C (78'F).
Table 4.3 Comparison of constituent concentra-tions anticipated in the combineddischarge, mg/L
ER-OL**
Constituent 1981 NRC Study* Maximum Mean
Na*** 42.9 42 23
Ca 110.0 73 56
Mg 22.2 14 11
Mn 0.025 0.061 0.024
Cl 103.0 82 48S04** 152.8 147 99
PO4 0.48 0.028 <0.009
NO3 0.35 0.50 <0.24
TDS*** 582.7 413 272
*Appendix G, Table 5.7.**ER-OL Table 3.6-1.
***Added during ion exchange resin regeneration,
chlorination, or scale control.
NMP-2 FES 4-25

Table 4.4 Existing and post-construction land uses within thetransmission line corridor for NMP-2
Exist
Land use Hectarescategory (acres)
Forest brushland 19.3 (47.0)
Brushland 7.1 (17.2)
Mature forest 3.0 (7.2)
Agriculture 2.0 (4.8)
Forest wetland 1.0 (2.4)
Plantation 0.5 (1.3)
Wetland 0
Transmissionline ROW 0.1 (0.2)
Transportation 0.1 (0.2)
TOTAL 33.1 (80.3)
*Rounding of some of the values
Source: ER-OL Table 2.2-6
ing
Percentof total
59.0
21.6
9.0
6.0
3.0
1.6
0
Post-construction
Hectares Percent(acres) of total
0 0
30.0 (72.6) 90.6
0 0
2.0 (4.8) 6.0
0 0
0 0
1.0 (2.4) 3.0
0.1 (0.2) 0.2
0.1 (0.2) 0.2
33.2 (80.2) 100.00
n a total of 100.6%.
0.2
0.2
100. 6*
results
Table 4.5 Comparison between water quality inLake Ontario as described in the 1981NRC study and in the ER-OL for 1978 data,mg/L
Constituent 1981 NRC Study*
Ca 44.0Na 17.0Mg 8.9K 1.6Mn 0. 01Cl 30.0SO4 30.0NO 3 0.14
TDS 233.0
*Appendix G, Table 5.7**Mean value from ER-OL Table 2.3-13
ER-OL**
41.716.07.951.61
<0.01835.430.5<0. 18
202
NMP-2 FES 4-26

Table 4.6 New York State species of special concern listed bythe applicant as "likely to occur" on the NMP-2 site orenvirons
*Common Name
Jefferson salamander
Blue-spotted salamander
Spotted salamander
Spotted turtle
Wood turtle
Common loon
Least bittern
Copper's hawk
Upland sandpiper
Black tern
Common nighthawk
Common raven
Eastern bluebird
Henslow's sparrow
Grasshopper sparrow
Vesper sparrow
Small-footed bat
*ER-OL Table 2.4-13**ER-OL Table 2.4-8
***ER-OL Table 2.4-10tER-OL Table 2.4-6
Scientific Name
Ambystoma jeffersonianum*
A. laterale*
A. maculatum*
Clemmys guttata*
C. insculpta*
Gavia immer*****
Ixobrycus exilis**'***
Accipiter cooperii**'***
Bartramia longicauda**'***
Chilidonias niger**'***
Chordeiles minor**'***
Corvus corax**
Sialia sialis**'***
Ammodramus henslowii**'***
A. savannarum**'***
Pooecetes gramineus**'***
Myotis leibiit.
I
I
NMP-2 FES 4-27


5 ENVIRONMENTAL CONSEQUENCES AND MITIGATING ACTIONS
5.1 Regum6
This section evaluates changes in predicted environmental impacts since theFES-CP was issued in June 1973. Additional impacts to land use at the siteinclude the construction of the closed-cycle cooling system and the revetmentditch as described in Section 5.2.1. Section 5.3.2 discusses the effect ofthe cooling system on the water quality of Lake Ontario. Other water useimpacts are discussed in Section 5.3.3, and air quality is discussed in Sec-tion 5.4. Section 5.5 addresses impacts of operation on terrestrial andaquatic resources, including the impacts from operation of the cooling tower.
Section 5.5.2 presents the staff's updated assessment of the impacts of NMP-2on the aquatic resources of Lake Ontario since the 1981 study on the environ-mental effects resulting from the change to the closed-cycle cooling system(Appendix G).
Changes in the predicted socioeconomic impacts of station operation since theFES-CP was issued include an increase in the estimated operating work force,as discussed in Section 5.8.
Information in Section 5.9 on radiological impacts has been revised co reflectknowledge gained since the FES-CP was issued. The material on plant accidentsincludes actual experience with nuclear power plant accidents and their observedhealth effects and other societal impacts.
Impacts from the uranium fuel cycle, decommissioning, emergency planning impacts,and environmental monitoring are covered in Sections 5.10, 5.11, 5.13, and 5.14respectively.
5.2 Land Use
5.2.1 Plant Site
Impacts of NMP-2 construction on land use at the site were evaluated in FES-.CPSection 4.1. Additional impacts to land use since the FES-CP was issued includethe construction of the plant cooling system (see Appendix G) and the revetmentditch system (ER-OL Sections 4 and 5.2.1.1), as well as construction of theNuclear Training Center (Mangan, November 1984). Construction of the train-ing center required the clearing of approximately 26 ha (65 .acres) of earlysecond-growth cover (ER-OL Section 2.4.1.1.2). The area around the trainingcenter has been landscaped. Thus the loss of wildlife habitat is small. Therehas been a small loss (1.5 ha, 3.7 acres) of secondary-growth brush, trees, andwildlife on site as a result of construction of the cooling tower. None of theNMP-2 structures -is built on the 100-year flood plain (ER-OL Figure 2.3-12).The major topographic alteration in the 100-year flood plain is the addition ofthe revetment ditch system on the shoreline of Lake Ontario to protect thepower plant from flooding and protect the shoreline from erosion (ER-OL Sec-tion 2.3.1.1.7). The impacts of construction on the NMP-2 site are minor and
NMP-2 FES 5-1

generally as predicted. After construction, unoccupied site areas are to begraded and seeded; in areas not planted with trees or shrubs, ground cover ofeither lawn or crushed stone will be used (ER-OL Section 3.1.1). Managementof the grassy areas around the power plant will result in an old field communitythat is useful habitat for raptors, field-dwelling birds, small mammals, andherpetofauna (ER-OL Section 2.4.1.1.5).
The impacts of NMP-2 operation relate to utilities, transportation, and commu-nication activities and are not expected to affect the land use of the site orvicinity. The size and operation of the natural draft cooling tower and manage-ment and operation of the transmission line may affect the local terrestrialecology. These potential impacts are evaluated in Section 5.5 below.
5..2.2 Transmission Lines
Transmission line impacts on land use as a result of operation are minimalbecause the line is located adjacent to an existing corridor and withinexisting rights of way (ER-OL Section 5.6). About 33 ha (80 acres) extending15 km (9.4 miles) will be disturbed. The predominant plant community lost isforest brushland (59% of the total). It is anticipated that brushland willoccupy about 90% of the total land disturbed after construction. The applicantstates that 1 ha (2.4 acres) of forest wetland will be lost,.but it will bereplaced by an equal area of wetland. This means that management practiceswill remove trees and large shrubs and maintain the area as shrub swamps.Agricultural uses (about 6% of the area),can continue in the transmissioncorridor with only small areas around poles unavailable for farming.
5.3 Water
5.3.1 Water Use
NMP-2 will have no significant impacts on water use, whether from evaporativeconsumption, effects on water quality, or effects on aquatic resources. Thelatter two issues are addressed in Sections 5.3.2 and 5.5.2, respectively.
Consumptive use of water by NMP-2--a result of evaporative (and drift) lossesfrom the natural draft cooling tower--will average 625 L/sec (9920 gpm) with amaximum of 870 L/sec (13,800 gpm) (Section 4.2.3). The total volume of LakeOntario is 1.6 x 10¹² m3 (390 mi 3 ) (FES-CP Section 2.5.2), and the averageflow through the lake is more than 6.9 x 10 6 L/sec (1.1 x 10⁸ gpm) (ER-OLSection 5.2.1.1). On an annual basis, consumptive 16 sses from the operationof NMP-2 will represent approximately 0..001% of the lake's volume; the evapora-tion rate will represent 0.009% of the average flow through the lake. Thus,even with the change in cooling design from once through to closed cycle andthe consequent increased evaporation, consumptive water use will have anegligible quantitative effect on Lake Ontario water.
NMP-2 will use a maximum of 83,000 L/day (22,000 gpd) of water from the OswegoCity water supply (Section 4.2.3). The average daily demand on that source is2.12 x 10i L/day (5.6 x 10⁶ gpd) (ER-OL Section 5.2.1.2); thus the NMP-2 demandrepresents a negligible (<0.4%) increased demand on that supply.
NMP-2 FES 5-2

5.3.2 Water Quality
The 1981 NRC study found that the cooling system discharge would "pose nosignificant threat to the water quality of Lake Ontario" (Appendix G,page 5-16). More recent information supports the data underlying this con-clusionas follows:
(1) Ambient water quality, measured most recently in 1978, is similar to thatmeasured earlier, as reported in the 1981 study (see Section 4.3.2).
(2) The aqueous discharge is now expected to be more dilute than that charac-terized in the 1981 study (see Section 4.2.6), although the dischargeflow'will be slightly larger than that anticipated in the 1981 study(Section 4.2.3).
Total dissolved solids (TDS) in the discharge (maximum 413 mg/L, mean 272 mg/L;Table 4.3) will exceed the state ambient standard of 200 mg/L; ambient TDS con-centrations in the lake already exceed the standard (Section 4.3.2). In addi-tion to returning dissolved solids to the lake, NMP-2 will discharge dissolvedsolids as a result of water treatment (Section 4.2.3) and corrosion (Sec-tion 4.2.6.). At the point of release, zinc concentrations will, at times,exceed the ambient criterion for zinc (0.437 mg/L versus 0.3 mg/L), althoughzinc concentrations in the discharge will average <0.65 mg/L (ER-OLTable 3.6-1). After 10-fold dilution by the receiving water, ambient zincconcentrations, even at maximum effluent concentrations, would meet the am-bient criterion (ER-OL Table 3.6-1). The receiving water could not, ofcourse, dilute the discharge TDS levels to within the standard.
Hydrologic modeling by the applicant (Section 5.5.2) shows that, even with nolake current (worst case), the travel time of water from the discharge to theintake would be at least 20 hours. With a west-to-east current of 0.15 m/sec(0.5 fps), there would be no movement of water from discharge to intake (ER-OLSection 5.3.1.1.3). These results suggest little or no significant recircula-tion of discharged water back into the cooling water intake.
*The effluent from the sanitary waste treatment facility (Section 4.2.6) would,at its maximum permitted flow rate, represent <0.3 % of the average stationdischarge. This effluent is regulated with respect to water quality variablesof concern (BOD, solids, fecal coliform bacteria, pH, and chlorine). Itshould have no significant effect on ambient water quality.
This analysis supports the statement in the 1981 NRC study and suggests thatthere could be, at most, a slight effect on ambient water quality on a local-ized basis. NMP-2 will represent an incremental source of dissolved solids tothe lake, which already is not in conformance with the state goals for surfacewater quality (Section 4.3.2).
5.3.3 Hydrological Alterations and Plant Water Supply
5.3.3.1 Hydrological Alterations
Operation of NMP-2 will not significantly alter the hydrological characteristicsof Lake Ontario. Water will be supplied from an intake structure in Lake
NMP-2 FES 5-3

Ontario to the station service water system and cooling water system. Theaverage rate of water withdrawal from the lake will be 3380 L/sec (53,600 gpm),and the maximum rate is 3759 L/sec (59,586 gpm). The approach velocity atthe intake structure is 0.15 m/sec (0.5 fps). The induced velocity in thewater around the intake is estimated to be reduced to 0.03 m/sec (0.1 fps)within 3 m (10 feet) of the structure. Water will be returned to.Lake Ontariovia a discharge structure.. The average discharge flowrate is approximately1817 L/sec (28,800 gpm), and the maximum discharge flow rate is approximately2210 L/sec (35,040 gpm). Because the amounts of water withdrawn and dischargedare extremely small compared to the size of the lake, there is no significantalteration to the circulation pattern of the lake.
Consumptive water use, principallythe result of evaporative losses from thecooling tower, will also have a negligible effect on Lake Ontario because ofthe ,size of the lake (approximately 1.6 x 10¹² m3 (390 mi 3 ) and the flowthrough the Great Lakes system. The average and maximum evaporative lossesfrom the station will be approximately 625 and 870 L/sec (9900 and 13,800 gpm),respectively, while the average flow through Lake Ontario and the St. LawrenceRiver is greater than 6.94 x 10⁶ L/sec 1.1 x 10⁸ gpm).
The revetment ditch system, which protects the statio'n from flooding as aresult of wave activity (including the effects of a probable maximum windstorm),also protects the shoreline from erosion. The structure follows the existingshoreline and, therefore, will not alter current patterns, significantlyaffect the littoral zone, or cause sedimentation.
Drainage paths for site runoff have been modified as a result of the plant drain-age system, the revetment ditch system, and the flood protection berms. In theimmediate vicinity of the plant, the grade is sloped to a series of collectionditches and a storm drain system. Runoff collected by this system is carriedby a drainage ditch to the point where it is discharged to the lake at theeastern edge of the site. Overland runoff reaching the revetment ditch systemflows in the ditch to the east and-is discharged to the lake at the easternedge of the structure.
Groundwater will not be used during station operation. However, groundwaterwill be drawn down in the vicinity of the plant structures by a permanentdewatering system. No offsite effects are expected from station dewatering.
5.3.3.2 Plant Water Needs and Available Water Supplies
The majority of station water is used for the service water system and thecooling water system. Average and maximum combined service water and.coolingwater requirements are approximately 2440 and 2735 L/sec (38,675 and 43,350 gpm),respectively. Average and maximum fish diversion system water requirementsare 940 and 1028 L/sec (14,925 and'16,300 gpm), respectively. The circulatingwater system uses the service water system as a source for the makeup require-ment of approximately 1580 L/sec (25,000 gpm). Because these requirements aremet by drawing water from Lake Ontario's large volume of water, no impact toother Lake Ontario water users will occur.
Potable water requirements for drinking and sanitary purposes are estimated tobe a maximum of 83,000 L/day (22,000 gpd). There is no planned expansion thatwould increase this value over the expected lifetime of the plant. This water
NMP-2 FES 5-4

is obtained from the City of Oswego water supply, whose average daily demandis 2.12 x 10⁷ L/day (5.6 x 10⁶ gpd). Because the requirements for NMP-2 aresmall compared to this value, there are no impacts upon the Oswego watersupply.
5.3.4 Water Use Impacts
5.3.4.1 Analysis of the Hydrologic Alterations Posing Potential Impacts toWater Use and Availability
5.3.4.1.1 Surface Water
Operation of NMP-2 will not have a significant impact on the use of water orits availability to the Nine Mile Point region. The plant uses Lake Ontariowater, mainly for cooling, at a rate of 0.03% of the average flow through thelake. Table 5.1 details the evaporative losses associated with plant coolingwater use (a maximum of 0.871 m3 /sec (13,800 gpm), a minimum of 0.246 m3 /sec(3900 gpm)) and lists the maximum, average, and minimum monthly flow rates forthe service water and fish diversion systems.
Lake Ontario water is used for drinking, industry, agriculture, commercial fish-ing, sportfishing, swimming, boating, and commercial shipping, as discussed inER-OL Section 2.3.2. The operation of NMP-2 will not impact the availabilityof drinking, agricultural, and industrial water supplies, considering the lowrate of consumption of Lake Ontario water. Moreover, no impact on swimming,recreational boating, or commercial shipping will occur as a result of NMP-2operation. The facility intake structures--located approximately 290 and320 m (950 and 1050 feet) offshore and approximately 167 and 137 m (550 and450 feet) closer to shore than the discharge structure--are well removed fromany swimming recreational use. The intake structures--located at a lesserdepth than the discharge structure--are submerged 3.05 m (10 feet) below themean low surface water elevation. Station operation will not change surfacewater elevations, and no significant alteration of circulation patterns isexpected; thus recreational boating will not be affected by station operation.Commercial shipping vessels pass no closer than 11.3 km (7 miles) from theintake and discharge structures and will not be affected by station operation.
Commercial and sportfishing water uses will be minimally affected by hydrologicalterations resulting from NMP-2 operation, with the impacts restricted to thedilution zone of the thermal plume and localized regions of the intake structures.
5.3.4.1.2 Groundwater
Groundwater is used for public and private water supplies by several communi-ties in Oswego County (ER-OL Section 2.3.2), and no other groundwater use, suchas irrigation or industrial use, has been identified. No station effluents willbe discharged to groundwater.
An ongoing groundwater dewatering program for the reactor containment founda-tion will produce a minor cone of depression.
NMP-2 FES 5-5

Because all groundwater use occurs upgradient of the site and groundwater dis-charge onsite is toward the lake, no present or anticipated groundwater useswill be affected by station operation.
5.3.5 Floodplain Aspects
The objective of the Executive Order 11988, Floodplain Management, is "...toavoid to the extent possible the long and short term adverse impacts associatedwith the occupancy and modification of floodplains and to avoid direct andindirect support of floodplain development wherever there is a practicablealternative....'!
Before the start of plant construction, the shoreline of Lake Ontario in thearea of the NMP-2 site was mildly sloping to the elevation of the water levelduring the 100-year flood. The 100-year floodplain consisted of bare tolightly vegetated glacial fill. Figure 5.1 shows the shoreline area in theplant vicinity flooded during the 100-year flood before the start ofconstruction.
Since the start of construction, site grading in the 100-year floodplain issomewhat less mildly sloping than before construction. The major feature atthe shoreline in the 100-year floodplain is the revetment ditch system builtto protect the plant from flooding and protect the shoreline from erosion. The100-year flood elevation follows this dike in the site area after plant con-struction, as shown in Figure 5.2. The other structures in the 100-yearfloodplain are the submerged intake and discharge structures.
The 100-year flood elevation of 249.4 feet was taken from the Flood InsuranceStudy (FEMA, 1981).
Because the lakeshore in the plant vicinity is very wide in comparison to therevetment, the revetment will not cause any appreciable increase in stage dur-ing the high water conditions. The buried intake and discharge facilitiesare not considered flow impediments during a. flood or high water. Thus, thestaff concludes that NMP-2 will not have any measurable offsite impactson flood conditions for events up to the severity of the 100-year flood.
5.4 Air Quality
Air quality in the site area has been monitored for ozone and oxides of sulfur(SO 2 ) and nitrogen (NO2 ) and total suspended particulates (TSP) to provide abasis for compliance with Clear Air Act requirements. This monitoring wasbegun in 1976 and generally continued. The monitoring results indicate that airquality has been within state and Federal air quality limits, except that thesecondary TSP levels (24-hour average) have been exceeded in 2 years out of5 years of measurement at two monitoring sites out of nine in the area. Theexceedances were in the vicinity of two industrial facilities and were localizedrather than area wide.
5.4.1 Fog and Ice
Heavy fog and visibility less than 400 m (1/4 mile) is observed about 9 days ayear at Syracuse. More frequent fog at the site is possible because of the
NMP-2 FES 5-6

proximity of the Lake Ontario shore, making movement of offshore fogs onto theland likely. The operation of the approximately 165-m (541-foot) naturaldraft cooling tower is not expected to result in any fog or ice formulation inthe site area.
5.4.2 Other Emissions
Testing of standby diesel generators, high pressure core spray diesel generator,and the fire pump will result in infrequent emissions of the normal products ofthe operation of internal combustion engines. Emissions of carbon monoxide,nitrogen, and sulfur oxides and particulates will result from this minimal use(total of 18 hours a month) and should not result in any significant impact onoffsite air quality.
5.5 Terrestrial and Aquatic Resources
5.5.1 Terrestrial Resources
With the measures and controls to limit operational impacts (ER-OL Section 5.10),unavoidable impacts on terrestrial resources will be small. These impacts includeminimal effects of cooling tower drift, impacts of transmission line maintenancepractices on plants and animals, and the loss of some birds as a result of colli-sions with transmission poles, transmission lines, the cooling tower, the radia-tion offgas stack, and plant buildings (ER-OL Section 5 and Table 10.1-1).
5.5.1.1 Cooling Tower Operation
Operation of natural draft cooling towers can result in impacts on terrestrialresources. These impacts include deposition of salt drift on soil and vegeta-tion, bird impaction, and weather modification (ER-OL Section 5.3.3). As notedabove, the staff evaluated the possible impacts of the change in cooling systemsin 1981, and the results are in the report reproduced as Appendix G. This studyfound that the estimated effects on terrestrial resources were negligible andthat the use of a natural'draft cooling tower was acceptable. Although the cool-ing tower does present a potential hazard to migratory birds, based on bird col-lisions with cooling towers at other nuclear stations (ER-OL Section 5.3.3.2.3),the hazard is small compared to the numbers of birds harvested during annual hunt-ing seasons. Moreover, the birds that die at cooling towers are mostly passerines,seldom waterfowl or hawks. In its 1981 study (Appendix G), the staff analyzeddata on bird impacts at operating plants located on or along migratory flywaysand found that cooling towers and meteorological structures do not present ahazard to bird populations.
5.5.1.2 Transmission System Operation
Because the new transmission line will be located within the existing transmis-sion line ROW, the effects of audible (approximate 6% increase in intermittentnoise at a distance of 38 m (125 feet)) and visible corona discharge, ozonedischarge, and electromagnetic and electrostatic fields are not new impacts tothe terrestrial resource of the area (ER-OL Section 5.6.4., Lee et al., 1982).The applicant has had no significant problems in these areas and expects nosignificant effects to the environment from operation of the NMP-2 transmissionline. No serious problems have been experienced with power line operation inthe United States, even at 500-kV.
NMP-2 FES 5-7

In accordance with the New York State Public Service Commission-approvedsystem-wide ROW management program prepared by the applicant, the ROW isassessed within 4 years after the last treatment. Maintenance includesselective cutting and controlled herbicide application (stump, basal, orfoliar spray). Only those herbicides approved by the U.S. Environmental Pro-tection Agency, and the New York State Department of Environmental Conservationwill be used; mixtures, rates, and volumes will be in accordance with labelinstructions. Treatments will occur at intervals of 5 to 8 years, dependingon the ROW assessment, throughout the life of the facility. These practicesfoster development of an old field shrub community, which is useful habitatfor deer, small mammals, and song birds. However, population numbers of wild-life species may fluctuate with the treatment cycles. Protective vegetativebuffers will be retained at stream and wetland areas, and herbicide use willbe restricted in these areas. Traffic for maintenance will be limited toexisting access roads on the ROW and an.existing road crossing a stream unde'rwhich a new culvert is to be installed (ER-OL).
Bird mortality will result from collisions with towers and conductors. Therate of this mortality cannot be accurately quantified, although Stout andCornwell (1976) estimated that only 0.07% of the nonhunting mortality resultedfrom collision. At NMP-2, waterfowl are generally congregated north of the siteand the transmission lines are south of the plant.
5.5.2 Aquatic Resources
This section presents the staff's updated assessment of the impacts of NMP-2on the aquatic resources of Lake Ontario since the 1981 study (Appendix G),based on recent information on NMP-2 design specifications and Lake Ontarioresources.
Potential effects of station operation may be divided into (1) effects ofwater intake, (2) effects of the thermal component of the aqueous discharge,(3) effects of the chemical component of the aqueous discharge, and (4) inter-actions between the NMP-2 fish return system discharge and cooling water intakes,and between NMP-2 and the adjacent power plants. These categories are discussedseparately below.
The applicant's models for predicting water velocities induced by station in-take and discharge and~thermal/chemical dilution of discharges from the sta-tion (ER-OL Section 5.3) have been evaluated by the staff and are consideredreasonably conservative for the purpose of assessing potential impacts.
5.5.2.1 Intake Effects
The 1981 NRC study concluded that fish impingement on the traveling screens"should result in minimal impact to the fish species affected." That studyalso found that entrainment of phytoplankton and zooplankton would have "nosignificant adverse effects" and that entrainment of fish eggs and larvae is"expected to be localized in the Nine Mile Point-area only." The report citedthe following design changes (compared with the earlier once-through coolingdesign) as minimizing potential intake impacts: (1) a >93% reduction in intakevolume, (2) a 50% reduction in intake velocity, and (3) a fish diversion andreturn system. Although the reduction in intake volume now appears to be 90%if the fish diversion intake is added to the service water intake, the overallconclusion concerning the effect of reducing intake volume is unchanged.
NMP-2 FES .5-8

When the 1981 NRC study was issued, it was not possible to evaluate the poten-tial of the fish diversion system to reduce impingement mortality. A 1979study (Cannon et al., 1979) of fish protection devices reported that "angledscreens provide a potentially effective means of salvaging fish from cooling-water intakes," but recommended site-specific studies, particularly in situinvestigations rather than test-flume experiments. A fish diversion systemsimilar but not identical to that at NMP-2 has been installed at the nearbyOswego Steam Station Unit 6 (12 km west of Nine Mile Point) and tested (fromApril 1981 to March 1983) (Lawler, Matusky, and Skelley, 1984).
The entrapped fish at Oswego are similar in species composition (primarilyalewife and rainbow smelt) to the fish that have been impinged at NMP-1 andFitzPatrick. Oswego Unit 6 has a once-through cooling system with a flow of20.48 m3 /s (325,000 gpm)..By measuring the proportion of fish diverted andsubsequent survival through 96 hours, the study estimated total plant effi-ciency (TPE) for returning entrapped fish alive, which was found to vary byspecies, length of fish, and month. For the commonly impinged fish at theNMP-1 and FitzPatrick plants (Section 4.3.4), the TPE ranged as shown inTable 5.2.
Over the period of study, 8.4% and 12.6% of juvenile and adult alewife, respec-tively, and 10.0% and 54.3% of juvenile and adult rainbow smelt, respectively,were diverted and survived (ibid).
Although these data suggest the potential for reducing impingement mortality,they cannot be used directly to quantitatively estimate the effectiveness atNMP-2 for several reasons as follows:
(1) The NMP-2 fish diversion system is much smaller than the Oswego system.
(2) The NMP-2 system does not employ a secondary traveling screen and diver-sion, while the Oswego system does.
(3) Mortality as a result of transport during return to the lake from thescreenwell must be considered, as must the possible attraction of preda-tory fish to the fish discharge, where relatively large densities of prey(diverted fish) are available (Cannon et al., 1979). Sampling at theOswego station from April through November 1982 did not indicate that theabundance of predator fish--primarily lake trout (Salvelinus namaycush),smallmouth bass (Micropterus dolomieui), and brown trout (Salmo trutta)--was greater near the fish discharge than in a control location. Duringthose same months, sampling of fish discharged into the lake demonstratedthat additional mortality could occur over that observed in the estimatesof TPE; the magnitude of this added mortality varied among species (Lawler,Matusky, and Skelley, 1984).
The water for operation of the fish diversion system is more than 25% of thetotal intake flow. During periods of the year when entrainment of larvae isof more concern than impingement of adult fish, or when the concentrations ofyoung-of-the-year or adult fish are low, the additional intake water necessaryto. operate the fish diversion system may cause moremortality than is saved.The applicant has indicated (during an NRC staff site visit on February 7, 1984)a willingness to consider suspending operation of the fish diversion system at
NMP-2 FES 5-9

such times, subject to approval by the New York State Department of Environ-mental Conservation.
5.5.2.2 Thermal Effects
The 1981 NRC study reiterated the FES-CP conclusion that "thermal dischargeeffects will be insignificant in terms of ecological relationships in the lakeas a whole," adding that reduction in discharge flow and intake/discharge tem-perature difference (compared with the earlier once-through cooling design)would "further minimize any potential for impact." The 1981 study emphasizedthe role of high exit velocity, low discharge flow, andrapid mixing of theeffluent in minimizing impacts. As noted in Section 4.2.4 above, the averagedischarge flow is slightly greater (14%) than that evaluated in the 1981study, and the maximum flow is slightly less (2%). The average exit velocityis also now expected to be slightly greater (14%) than that anticipated in the1981 study. Finally, maximum intake/discharge temperature differences are nowexpected to be slightly (1.4C0 or 2.6F°) less than those anticipated in theearlier study. The conclusions of the 1981 NRC study remain valid.
Modeling by the applicant shows that, under worst case conditions, the 1.4C0
(2.5F0 ) isotherm is located approximately 19 to 20 m (62 to 66 ft) from thedischarge nozzle (ER-OL Figures 5.3.6 and 5.3.7), and that the maximum differ-
*ence in surface temperature is less than 1.3C0 (2.3F') (ER-OL Section 5.3.2.1.3).This rise in surface temperature is within the New York State standard of1.7C0 (3F 0 ) (ER-OL Section 3.4.1.3.5).
5.5.2.3 Chemical Effects
Because chemical discharges from the station will cause, at most, slight effectson ambient water quality on a localized basis (Section'5.3.2), no significantchemical effects on aquatic biota would be anticipated. High exit velocity,low discharge flow, and rapid mixing (cited above as reducing the exposure oforganisms to thermal stresses) will similarly reduce the exposure of organismsto chemical stresses.
The 1981 NRC study stated that "potentially toxic" concentrations of chlorinecould exist at times of maximum discharge, but that dilution and reduction tochloride would reduce concentrations to "well below toxic levels." Modelingby the applicant predicts that the discharge will be diluted by 5.6:1 within11 m (36 feet). One can calculate an approximate (conservative) velocity fororganisms that might be entrained in the plume at the point of discharge bytaking the plume velocity at 11 m (36 feet) from the discharge to be 0.8 m/sec(2.6 fps) (from the applicant's model, ER-OL Section 5.3.2.1.3 and Table 5.3-9).These organisms will have reached that point in less than 14 seconds. Thehighest concentration of total residual chlorine (TRC) at the point of dischargeis estimated to be 0.43 mg/L (Section 4.2.6). Even if an organism were exposedto 0.43 mg/L TRC for the entire 14 seconds (i.e., no dilution or chlorinedemand), no acute mortality would be expected based on the concentration-duration-mortality relationship for freshwater species presented graphicallyby Mattice (1977). At a concentration of 0.43 mg/L TRC, organisms would haveto be exposed for approximately 3 minutes to reach the "acute mortality thresh-
old." This analysis is clearly conservative in that it overestimates theexposure of the organisms to TRC; this reinforces the earlier conclusion thatchemical effects would not be expected, even for the chemical constituent con-sidered potentially most troublesome in the 1981 NRC study.
NMP-2 FES 5-10

5.5.2.4 Interactions
The overall usefulness of the fish diversion system would be questionable ifreturned fish were likely to be taken into the cooling water intake (a secondtime, re-entrapped) while stunned or disoriented. Based on the applicant'sestimate of maximum inducted velocity toward the tunnel 2 intake from the south(0.011 m/sec or 0.036 fps, ER-OL Figure 5.3.2) and the distance between thefish discharge and the nearest intake (46 m, or 150 feet) (ER-OL Figure 3.4-2),a calculated minimum travel time would be greater than 1 hour (see Appendix G,Figure 3.4). This analysis is also conservative in that it ignores the factthat fish are discharged with an easterly velocity, away from the intake(ER-OL Section 3.4.2.1). These results suggest that fish released to LakeOntario from the diversion system are unlikely to be taken back into thecooling water.
There is a potential for slight interaction between the NMP-2 discharge and thedischarges from the NMP-1 or FitzPatrick power plants (ER-OL Section 5.3.2.1.4).The NMP-1 discharge is approximately 360 m (1200 feet) southwest of the NMP-2discharge; the FitzPatrick discharge is more remote (ER-OL Figure 3.4.2).Because of the relatively small discharge flow from NMP-2 compared with thedischarges from the other two power plants, both of which have once-throughcooling systems, this interaction may be viewed as a discharge from NMP-2encountering an already slightly warmed ambient water (the result of thermaldischarges from the other two plants).
As noted by the applicant (ER-OL Section 5.3.2.1.4), because the station isbetween the other two plants and prevailing lake currents are generally fromthe east or west, it is unlikely that the thermal plumes from both plantswould affect the NMP-2 discharge area simultaneously. Surface temperatureelevation from the station should not exceed 1.3C0 (2.3F') (Section 5.5.2).Maximum surface temperature elevation from NMP-1 is 6.0C' (11.0F0 ) (ER-OLSection 5.3.2.1.4), and from FitzPatrick is 3.6C' (6.6F') (ER-OL Sec-tion 2.3.1.1.6.2). The thermal regime of the lake should continue to bedominated by the two existing power plants, with interaction among the plantsrelatively slight.
5.5.2.5 Aquatic Resource Impact Summary
NMP-2 will utilize a state-of-the-art cooling system design to minimize theimpacts of water withdrawal and thermal effluent discharges to Lake Ontarioaquatic biological and fisheries resources. This design includes: low intakevolume; low intake velocity and horizontal inflow at the intakes due to-velo-city caps; submerged offshore intake structures; diversion and return systemfor entrapped fishes; and an offshore benthic high velocity diffuser dischargesystem. The fish diversion system will collect and return most entrappedfishes that would otherwise be impinged on the traveling screens. The reduc-tion in impingement mortality may be low, however, for certain size classes ofsome sensitive species (notably alewife and smelt). Thermal and chemical ef-fluent effects are expected to be limited to a small area in the vicinity ofthe diffuser discharge. Impacts from interactions between NMP-2 and either theNMP-1 or FitzPatrick power plant should be insignificant.
The 1981 NRC study of environmental impact resulting from the conversion fromonce-through to closed-cycle cooling found the impacts to be minimal. On the
NMP-2 FES 5-11

basis of this current update of resources and impacts, the staff finds thatthose conclusions remain valid.
5.6 Threatened and Endangered Species
5.6.1 Terrestrial
No endangered or threatened species of plants or animals listed by the U.S.Fish and Wildlife Service is known to be present within the plant site ortransmission corridor. Transient species potentially occurring in the regionand protected by the Federal or state government are listed in Section 4.3.5.1.These species do not regularly occur at the site or in the transmission cor-ridor. Thus potential impacts on these species are not expected to be signi-ficant.
5.6.2 Aquatic
The only threatened (New York State-listed) species reported for the Nine MilePoint area is the lake chubsucker, of which a single specimen was taken in1975 at the mouth of the Salmon River (Section 4.3.5). No other threatened orendangered species, whether listed by the Federal or state government, hasbeen taken near the station in 11 years of sampling. Because any effects ofstation operation on aquatic biota would be minor and localized'(Section 5.5.2),adverse effects on threatened or endangered species are highly improbable.
5.7 Historic and Archeologic Impacts
The NRC staff concludes that. the operation and maintenance of NMP-2 will haveno significant impacts on sites listed or eligible for listing in the NationalRegister of Historic Places. The State Historic Presertation Officer's opinionis consistent with the staff finding. (Copies of relevant correspondence canbe found in Appendix F.)
5.8 Socioeconomic Impacts
The socioeconomic impacts of station operation are analyzed in FES-CP Sections5.6 and 10. Changes that have occurred since that report was issued include anincrease in the estimated operating work force to a total of 635 employeesonce the plant is in normal operation. The plant. payroll is estimated to be$18 million (1982. dollars) per year. The staff does not expect the operatingworkers or their families to have any significant impact on public or privatefacilities in the area.
The applicant estimated annual local purchases. of goods and servicesrequiredfor the operation of NMP-2 to be about $1 millon within an 80-km (50-mile)radius of the site. Tax payments are considered as indirect benefits of thestation's operation because they are transfer payments. The applicant esti-mates the annual NMP-2 property taxes will range from $15.1 million in 1986 to$29.1 million in 1995 (1982 dollars). The staff anticipates no other signifi-cant socioeconomic impacts from NMP-2 operation.
NMP-2 FES 5-12

5.9 Radiological Impacts
5.9.1 Regulatory Requirements
Nuclear power reactors in the United States must comply with certain regula-tory requirements in order to operate. The permissible levels of radiation inunrestricted areas and of radioactivity in effluents to unrestricted areas arerecorded in 10 CFR 20, Standards for Protection Against Radiation. These regu-lations specify limits on levels of radiation and limits on concentrations ofradionuclides in the facility's effluent releases to the air and water (abovenatural background) under which the reactor must operate. These regulationsstate that no member of the general public in unrestricted areas shall receivea radiation dose, as a result of facility operation, of more than 0.5 rem in1 calendar year, or if an individual were continuously present in an area,2 mrems in any 1 hour or 100 mrems in any 7 consecutive days to the total body.These radiation-dose limits are established to be consistent with considera-tions of the health and safety of the public.
In addition to the Radiation Protection Standards of 10 CFR 20, there are re-corded in 10 CFR 50.36a license requirements that are to be imposed on licen-sees in the form of Technical Specifications on Effluents from Nuclear PowerReactors to keep releases of radioactive materials to unrestricted areas dur-ing normal operations, including expected operational occurrences, as low asreasonably achievable (ALARA). Appendix I of 10 CFR 50 provides numericalguidance on dose-design objectives for light-water reactor (LWRs) to meet thisALARA requirement. Applicants for permits to construct and for licenses tooperate an LWR shall provide reasonable assurance that the following calculateddose-design objectives will be met for all unrestricted areas: 3 mrems/yearto the total body or 10 mrems/year to any organ from all pathways of exposurefrom liquid effluents, 10 mrads/year gamma radiation or 20 mrads/ year betaradiation air dose from gaseous effluents near ground level--and/or 5 mrems/year to the total body or 15 mrems/year to the skin from gaseous effluents;and 15 mrems/yr to any organ from all pathways of exposure from airborneeffluents that include the radioiodines, carbon-14, tritium, and theparticulates.
Experience with the design, construction, and operation of nuclear power reac-tors indicates that compliance with these design objectives will keep averageannual releases of radioactive material in effluents at small percentages ofthe limits specified in 10 CFR 20 and, in fact, will result in doses generallybelow the dose-design objective values of Appendix I. At the same time, thelicensee is permitted the flexibility of operation, compatible with considera-tions of health and safety, to ensure that the public is provided a dependablesource of power, even under unusual operating conditions that may temporarilyresult in releases higher than such small percentages but still well withinthe limits specified in 10 CFR 20.
In addition to the impact created by facility radioactive effluents as discussedabove, within the NRC policy and procedures for environmental protection des-cribed in 10 CFR 51 there are generic treatments of environmental effects ofall aspects of the uranium fuel cycle. These environmental data have been sum-marized in Table S-3 and are discussed later in this report in Section 5.10.In the same manner the environmental impact of transportation of fuel and waste
NMP-2 FES 5-13

to and from an LWR is summarized in Table S-4 and presented in Section 5.9.3of this report.
Recently an additional operational requirement for uranium fuel cycle facilitiesincluding nuclear power plants was established by the Environmental ProtectionAgency in 40 CFR 190. This regulation limits annual doses (excluding radon anddaughters) for members of the public to 25 mrems total body, 75 mrems thyroid,and 25 mrems other organs from all fuel-cycle facility contributions that mayimpact a specific individual in the public.
5.9.2 Operational Overview
During normal operations of NMP-2, small quantities of radioactivity (fission,corrosion, and activation products) will be released to the environment. Asrequired by NEPA, the staff has determined the estimated dose to members ofthe public outside of the plant boundaries as a result of the radiation fromthese radioisotope releases and relative to natural-background-radiation doselevels.
These facility-generated environmental dose levels are estimated to be verysmall because of both the plant design and the development of a program thatwill be implemented at the facility to contain and control all radioactiveemissions and effluents. Radioactive-waste management systems are incorpor-ated into the plant and are designed to remove most of the fission-productradioactivity that is assumed to leak from the fuel, as well as most of theactivation and corrosion-product radioactivity produced by neutrons in thereactor-core vicinity. The effectiveness of these systems will be measured byprocess and effluent radiological monitoring systems that permanently recordthe amounts of radioactive constituents remaining in the various airborne andwaterborne process and effluent streams. The amounts of radioactivity releasedthrough vents and discharge points to areas outside the plant boundaries areto be recorded and published semiannually in the Radioactive Effluent ReleaseReports for the facility.
Airborne effluents will diffuse in the atmosphere in a fashion determined bythe meteorological conditions existing at the time of release, and theseeffluents are generally dispersed and diluted by the time they reach unre-stricted areas that are open to the public.
Radioisotopes in the facility's effluents that enter unrestricted areas willproduce doses through their radiations to members of the general public in amanner similar to the way doses are produced from background radiations (thatis, cosmic, terrestrial, and internal radiations), which also include radiationfrom nuclear-weapons fallout. These radiation doses can be calculated for themany potential radiological-exposure pathways specific to the environmentaround the facility, such as direct-radiation doses from the gaseous plume orliquid effluent stream outside of the plant boundaries, or internal-radiation-dose commitments from radioactive contaminants that might have been depositedon vegetation or in meat and fish products eaten by people, or that might bepresent in drinking water outside the plant or incorporated into milk fromcows at nearby farms.
These doses, calculated for the "maximally exposed" individual (that is, thehypothetical individual potentially subject 'to maximum exposure), form the
NMP-2 FES 5-14

basis of the NRC staff's evaluation of impacts. Actually, these estimates arefor a fictitious person because assumptions are made that tend to overestimatethe dose that would accrue to members of the public outside the plant boundaries.For example, if this "maximally exposed" individual were to receive the totalbody dose calculated at the plant boundary~as a result of external exposure tothe gaseous plume, he/she is assumed to be physically exposed to gamma radia-tion at that boundary for 70% of the year, an unlikely occurrence.
Site-specific values for various parameters involved in each dose pathway areused in the calculations. These include calculated or observed values for theamounts of radioisotopes released in the gaseous and liquid effluents, mete-orological information (for example, wind speed and direction) specific to thesite topography and effluent release points, and hydrological information per-taining to dilution of the liquid effluents as they are discharged.
An annual land census will identify changes in the use of unrestricted areasto permit modifications in the programs for evaluating doses to individualsfrom principal pathways of exposure. This census specification will be incor-porated into the Radiological Effluent Technical Specifications and satisfiesthe requirements of Section IV.B.3 of Appendix I to 10 CFR 50. As use of theland surrounding the site boundary changes, revised calculations will be madeto ensure that the dose estimate for gaseous effluents always represents thehighest dose that might possibly occur for any individual member of the publicfor each applicable foodchain pathway. The estimate considers, for example,where people live, where vegetable gardens are located, and where cows arepastured.
An extensive radiological environmental monitoring program, designed specific-ally for the environs of NMP-2, provides measurements of radiation and radio-active contamination levels that exist outside of the facility boundaries bothbefore and after operations begin. In this program, offsite radiation levelsare continuously monitored with thermoluminescent dosimeters (TLDs). In addi-tion, measurements are made on a number of types of samples from the surround-ing area to determine the possible presence of radioactive contaminants thatmight, for example, be deposited on vegetation be present in drinking wateroutside the plant, or be incorporated into cow's milk from nearby farms. Theresults for all radiological environmental samples measured during a calendaryear of operation are recorded and published in the Annual Radiological Environ-mental Operating Report for the facility. The specifics of the final opera-tional-monitoring program and the requirement for annual publication of themonitoring results will be incorporated into the operating license Radiologi-cal Technical Specifications for the NMP-2 facility.
5.9.3- Radiological Impacts from Routine Operations
5.9.3.1 Radiation Exposure Pathways: Dose Commitments
The potential environmental pathways through which persons may be exposed toradiation originating in a nuclear power reactor are shown schematically inFigure 5.3. When an individual is exposed through one of these pathways, thedose is determined in part by the amount of time he/she is in the vicinity ofthe source, or the amount of time the radioactivity inhaled or ingested is
NMP-2 FES 5-15

retained in his/her body. The actual effect of the radiation or radioactivityis determined by calculating the dose commitment. The annual dose commitmentis calculated to be the total dose that would be received over a 50-yearperiod, following the intake of radioactivity for 1 year under the conditionsexisting 20 years after the station begins operation. (Calculation for the20th year, or midpoint of station operation, represents an average exposureover the life of the plant.) However, with few exceptions, most of the internaldose commitment for each nuclide is given during the first few years afterexposure because of the turnover of the nuclide by physiological processes andradioactive decay.
There are a number of possible exposure pathways to humans that are appropriateto be studied to determine the impact of routine releases from the NMP-2facility on members of the general public living and working outside thesite boundaries, and whether the releases projected at this point in thelicensing process will in fact meet regulatory requirements. A detailedlisting of these exposure pathways would include external radiation exposurefrom the gaseous effluents, inhalation of iodines and particulate contaminantsin the air, drinking milk from a cow or eating meat from an animal that feedson open pasture near the site on which iodines or particulates may have depos-ited, eating vegetables from a garden near the site that may be contaminatedby similar deposits, and drinking water or eating fish caught near the pointof discharge of liquid effluents.
Other less important pathways include: external irradiation from radionuclidesdeposited on the ground surface; eating animals and food crops raised near thesite using irrigation water that may contain liquid effluents; shoreline,boating, and swimming activities near lakes or streams that may be contaminatedby effluents; drinking potentially contaminated water; and direct radiationfrom within the plant itself.
Calculations of the effects for most pathways are limited to a radius of 80 km(50 miles). This limitation is based on several facts. Experience, as demon-strated by calculations, has shown that all individual dose commitments(>0.1 mrem/year) for radioactive effluents are accounted for within a radiusof 80 km from the plant. Beyond 80 km the doses to individuals are smallerthan 0.1 mrem/year, which is far below natural-background doses, and the dosesare subject to substantial uncertainty because of limitations of predictivemathematical models.
The NRC staff has made a detailed study of all of the above important pathwaysand has evaluated the radiation-dose commitments both to the plant workers andthe general public for these pathways resulting from routine operation of thefacility. A discussion of these evaluations follows.
5.9.3.1.1 Occupational Radiation Exposure for Boiling Water Reactors (BWRs)
Most of the dose to nuclear plant workers results from external exposure toradiation coming from radioactive materials outside of the body rather thanfrom internal exposure from-inhaled or ingested radioactive materials. Exper-ience shows that the dose to nuclear plant workers varies from reactor toreactor and from year to year. For environmental-impact purposes, it can beprojected by using the experience to date with modern BWRs. Recently licensed
NMP-2 FES 5-16

1000-MWe BWRs are operated in accordance with the post-1975 regulatory require-ments and guidance that place increased emphasis on maintaining occupationalexposure at nuclear power plants ALARA. These requirements and guidance areoutlined primarily in 10 CFR 20, Standard Review Plan Chapter 12 (NUREG-0800),and RG 8.8, "Information Relevant to Ensuring that Occupational RadiationExposures at Nuclear Power Stations Will Be as Low as Is Reasonably Achievable."
The applicant's proposed implementation of these requirements and guidelinesis reviewed by the NRC staff during the licensing process, and the results ofthat review are reported in the staff's SERs. The license is granted onlyafter the review indicates that an ALARA program can be implemented. Inaddition, regular reviews of operating plants are performed to determinewhether the ALARA requirements are being met.
Average collective occupational dose information for 177 BWR reactor years ofoperation is available for those plants operating between 1974 and 1981. (Theyear 1974 was chosen as a starting date because the dose data for years priorto 1974 are primarily from reactors with average rated capacities below 500 MWe.)These data indicate that the average reactor annual collective dose at BWRshas been about 790 person-rems, although some plants have experienced annualcollective doses averaging as high as 1660 person-rems/year over their oper-ating lifetime (NUREG-0713, Vol 3). These dose averages are based on widelyvarying yearly doses at BWRs. For example, for the period mentioned above,annual collective doses for BWRs have ranged from 44 to 3626 person-rems perreactor. However, the average annual dose per nuclear plant worker of about0.8 rem (ibid) has not varied significantly during this period. The workerdose limit, established by 10 CFR 20, is 3 rems/quarter (if the average doseover the worker lifetime is being controlled to 5 rems/year) or 1.25 rems/quarterif it is not.
The wide range of annual collective doses experienced at BWRs in the UnitedStates results from a number of factors such as the amount of required maint-enance and the amount of reactor operations and inplant surveillance. Becausethese factors can vary widely and unpredictably, it is impossible to determinein advance a specific year-to-year annual occupational radiation dose for aparticular plant over its operating lifetime. There may on occasion.be a needfor relatively high collective occupational doses, even at plants with radiationprotection programs designed to ensure that occupational radiation doses will.be kept ALARA.
In recognition of the factors mentioned above, staff occupational dose estimatesfor environmental impact purposes for NMP-2 are based on the assumption thatthe facility will experience the annual average occupational dose for BWRs todate. Thus the staff has projected that the collective occupational doses forNMP-2 will be 790 person-rems, but annual collective doses could average as muchas twice this value over the life of the plant.
The average annual dose of about 0.8 rem per nuclear-plant worker at operatingBWRs and PWRs has been well within the limits of 10 CFR 20. However, forimpact evaluation, the NRC staff has estimated the risk to nuclear-power-plantworkers and compared it in Table 5.3 to published risks for other occupations.Based on these comparisons, the staff concludes that the risk to nuclear-plantworkers from plant operation is comparable to the risks associated with otheroccupations.
NMP-2 FES 5-17

In estimating the health effects from both offsite (see Section 5.9.3.2) andoccupational radiation exposures as a result of normal operation of this facil-ity, the NRC staff used somatic (cancer) and genetic risk estimators that arebased on widely accepted scientific information. Specifically, the staff'sestimates are based on information compiled by the National Academy of SciencesAdvisory Committee on. the Biological Effects of Ionizing Radiation (BEIR I).Theestimates of the risks to workers and the general public are based on con-servative assumptions (that is, the estimates are probably higher than theactual number). The following risk estimators were used to estimate healtheffects: 135 potential deaths.from cancer per million person-rems and258 potential cases of all forms of genetic disorders per million person-rems.
The cancer-mortality risk estimates are based on the "absolute risk" modeldescribed in BEIR I. Higher estimates can be developed by use of the "relativerisk" model along with the assumption that risk prevails for the duration oflife. Use of the "relative risk" model would produce risk values up to aboutfour times greater than those used in this report. The staff regards the useof the "relative risk" model values as a reasonable upper limit of the rangeof uncertainty. The lower limit of the range would be zero because healtheffects have not been detected at doses in this dose-rate range. The numberof potential nonfatal cancers would be approximately 1.5 to 2 times the numberof potential cancers, according to the 1980 report of the National Academy-ofSciences Advisory Committee in the Biological Effects of Ionizing Radiation(BEIR III).
Values for genetic risk estimators range from 60 to 1500 potential cases ofall forms of genetic disorders per million person-rems (BEIR 1). The value of258 potential cases of all forms of genetic disorders is equal to the sum ofthe geometric means of the risk of specific genetic defects and the risk ofdefects with complex etiology.
The preceding values for risk estimators are consistent with the recommendationsof a number of recognized radiation-protection organizations, such as theInternational Commission on Radiological Protection (ICRP, 1977), the NationalCouncil on Radiation Protection and Measurement (NCRP, 1975), the NationalAcademy of Sciences (BEIR III) and the United Nations Scientific Committee onthe Effects of Atomic Radiation (UNSCEAR, 1982).
The risk of potential fatal cancers in the exposed work-force population atthe NMP-2 facility is estimated as follows: multiplying the annual plant-worker-population dose (about 790 person-rems) by the somatic risk estimator,the staff estimates that about 0.12 cancer death may occur in the total exposedpopulation. The value of 0.12 cancer death means that the probability of 1cancer death over the lifetime of the entire work force as a result of 1 yearof facility operation is about 12 chances in 100. The risk of potentialgenetic disorders attributable to exposure of the work force is a risk borneby the progeny of the entire population and is thus properly considered aspart of the risk to the general public.
5.9.3.1.2 Public Radiation Exposure.
Transportation of Radioactive'Materials
The transportation of "cold" (unirradiated) nuclear fuel to the reactor, ofspent irradiated fuel from'the reactor to a fuel reprocessing plant, and of
NMP-2 FES 5-18

solid radioactive wastes from the reactor to waste burial grounds is consideredin 10 CFR 51.52. The contribution of the environmental effects of such trans-portation to the environmental costs of licensing the nuclear power reactor isset forth in Summary Table S-4 from 10 CFR 51.52, reproduced herein as Table 5.4.The cumulative dose to the exposed population as summarized in Table S-4 isvery small when compared to the annual collective dose of about 60,000 person-rems to this same population or 26,000,000 person-rems to the U.S. populationfrom background radiation.
Direct Radiation for BWRs
Radiation fields are produced around nuclear plants as a result of radioactiv-ity within the reactor and its associated components, as well as a result ofradioactive-effluent releases. Although the components are shielded, doserates observed around BWR plants from these plant components have varied fromundetectable levels to values on the order of 100 mrems/year at onsite locationswhere members of the general public were allowed. For newer BWR plants with astandardized design, dose rates have been estimated using special calculationalmodeling techniques. The calculated cumulative dose to the exposed populationfrom such a facility would be much less than 1 person-rem/year per unit,insignificant when compared with the natural background dose.
Low-level radioactivity storage containers outside the plant are estimated tomake a dose contribution at the site boundary of less than 0.1%o of that due tothe direct radiation described above.
Radioactive-Effluent Releases: Air and Water
Limited quantities of radioactive effluents will be released to the atmosphereand to the hydrosphere during normal operations. Plant-specific radioisotope-release rates were developed on the basis of estimates regarding fuel performanceand descriptions of the operation of radwaste systems in the applicant's FSAR,and by using the calculative models and parameters described in NUREG-0016.
These-radioactive effluents are then diluted by the air and water into whichthey are released before they reach areas accessible to the general public.
Radioactive effluents can be divided into several groups. Among the airborneeffluents, the radioisotopes of the fission product noble gases, krypton andxenon, as well as the radioactivated gas argon, do not deposit on the groundnor are they absorbed and accumulated within living organisms; therefore, thenoble gas effluents act primarily as a source of direct external radiationemanating from the effluent plume. Dose calculations are performed for the siteboundary where the highest external-radiation doses to a member of the generalpublic as a result of gaseous effluents have been estimated to occur; theseinclude the total body and skin doses as well as the annual beta and gamma airdoses from the plume at that boundary location.
Another group of airborne radioactive effluents--the fission product radioiodines,as well as carbon-14 and tritium--are also gaseous but these tend to be depositedon the ground and/or inhaled into the body during breathing. For this class ofeffluents, estimates are made of direct external-radiation doses from depositson the ground, and of internal radiation doses to total body, thyroid, bone, and
NMP-2 FES 5-19

other organs from inhalation and from vegetable, milk, and meat consumption aremade. Concentrations of iodine in the thyroid and of carbon-14 in bone are ofparticular significance here.
A third group of airborne effluents, consisting of particulates that remainafter filtration of airborne effluents in the plant prior to release, includesfission products such as cesium and strontium and activated corrosion productssuch as cobalt and chromium. The calculational model determines the directexternal radiation dose and the internal radiation doses for these contaminantsthrough the same pathways as described above for the radioiodines, carbon-14,and tritium. Doses from the particulates are combined with those of the radio-iodines, carbon-14, and tritium for comparison to one of the design objectivesof Appendix I to 10 CFR 50.
The waterborne-radioactive-effluent constituents could include fission productssuch as nuclides of strontium and iodine; activation and corrosion products,such as nuclides of sodium, iron, and cobalt; and tritium as tritiated water.Calculations estimate the internal doses (if any) from fish consumption, fromwater ingestion (as drinking water), and from eating of meat or vegetables raisednear the site on irrigation water, as well as any direct external radiationfrom recreational use of the water near the point of discharge.
The release rates for each group of effluents, along with site-specific meteor-ological and hydrological data, serve as input to computerized radiation-dosemodels that estimate the maximum radiation dose that would be received outsidethe facility via a number of pathways for individual members of the public,and for the general public as a whole. These models and the radiation-dosecalculations are discussed in the October 1977 Revision 1 of RG 1.109,"Calculation of Annual Doses to Man from Routine Releases of Reactor Effluentsfor the Purpose of Evaluating Compliance with 10 CFR Part 50, Appendix I," andin Appendix B of this statement.
Examples of site-specific dose assessment calculations and discussions of para-meters involved are given in Appendix D. Doses from all airborne effluentsexcept the noble gases are calculated for individuals at the location (for example.the site boundary, garden, residence, milk cow, and meat animal where the highestradiation dose to a member of the public has been established from all applicablepathways (such as ground deposition, inhalation, vegetable consumption, cowmilk consumption, or meat consumption.) Only those pathways associated withairborne effluents that are known to exist at a single location are combinedto calculate the total maximum exposure to an exposed individual. Pathway dosesassociated with liquid effluents are combined without regard to any singlelocation, but they are assumed to be associated with maximum exposure of anindividual through other than gaseous-effluent pathways.
5.9.3.2 Radiological Impact on Humans
Although the doses calculated in Appendix D are based primarily on radioactive-waste treatment system capability and are below the Appendix I design objectivevalues, the actual radiological impact associated with the operation of thefacility will depend, in part, on the manner in which the radioactive-wastetreatment system is operated., Based on its evaluation of the potentialperformance of the ventilation and radwaste treatment systems, the NRC staff
NMP-2 FES 5-20

has concluded that the'systems as now proposed are capable of controllingeffluent releases to meet the dose-design objectives of Appendix I to 10 CFR 50.
Operation of the NMP-2 facility will be governed by operating license TechnicalSpecifications that will be based on the dose-design objectives of Appendix Ito 10 CFR 50. Because these design-objective values were chosen to permitflexibility of operation while still ensuring that plant operations are ALARA,the actual radiological impact of plant operation may result in doses close tothe dose-design objectives. Even if this situation exists, the individual dosesfor the member of the public subject to maximum exposure will still be verysmall when compared to natural background doses (-100 mrems/year) or the doselimits (500 mrems/year - total body) specified in 10 CFR 20 as consistent withconsiderations of the health and safety of the public. As a result, the staffconcludes that there will be no measurable radiological impact on any memberof the public from routine operation of the NMP-2 facility.
Operating standards. of 40 CFR 190, the Environmental Protection Agency's Environ-mental Radiation Protection Standards for Nuclear Power-Operations, specifythat the annual dose equivalent must not exceed 25 mrems to the whole body,75 mrems to the thyroid, and 25 mrems to any other organ of any member of thepublic as the result of exposures to planned discharges of radioactive materials(radon and its daughters excepted) to the general environment from all uranium-fuel-cycle operations and radiation from these operations that can be expectedto affect a given individual. The NRC staff concludes that under normal opera-tions the NMP-2 facility is capable of operating within these standards.
The radiological doses and dose commitments resulting from a nuclear power plantare well known and documented. Accurate measurements of radiation and radioactivecontaminants can be made with very high sensitivity so that much smaller amountsof radioisotopes can be recorded than can be associated with and possible observ-able ill effects. Furthermore, the effects of radiation on living systems havefor decades been subject to intensive investigation and consideration by individualscientists as well as by select committees that have occasionally been constitutedto objectively and independently assess radiation dose effects. Although, asin the case of chemical contaminants, there is debate about the exact extentof the effects of very low levels of radiation that result from nuclear-power-plant effluents, upper bound limits of deleterious effects are well establishedand amenable to standard methods of risk analysis. Thus the risks to the maxi-mally exposed member of the public outside the site boundaries or to the totalpopulation outside the boundaries can be readily calculated and recorded. Theserisk estimates for the NMP-2 facility are presented below.
The risk to the maximally exposed individual is estimated by multiplying therisk estimators presented in Section 5.9.3.1.1 by the annual dose-design object-ives for total-body radiation in 10 CFR 50, Appendix I. This calculation resultsin a risk of potential premature death from cancer to that individual from expo-sure to radioactive effluents (gaseous or liquid) from 1 year of reactor opera-tions of less than one chance in one million.* The risk of potential premature
*The risk of potential premature death from cancer to themaximally exposed
individual from exposure to radioiodines and particulates would be in thesame range as the risk from exposure to the other types of effluents.
NMP-2 FES 5-21

death from cancer to the average individual within 80 km (50 miles) of thereactors from exposure to radioactive effluents from the reactors is much lessthan the risk to the maximally exposed individual. These risksare very smallin comparison to natural cancer incidence from causes unrelated to the operationof the NMP-2 facility.
Mul.ti.plying the annual U.S. general public population dose from exposure toradioactive effluents and transportation of fuel and waste from the operationof this facility (that is, 35 person-rems) by the preceding somatic riskestimator, the staff estimates that about 0.005 cancer death may occur in theexposed population. The significance of this ri.sk can be determined by com-paring it to the natural incidence of cancer death in the U.S. population.Multiplying the estimated U.S. population for the year 2000 (^.260 millionpersons) by the current incidence of actual cancer fatalities ("20%), about52 million cancer deaths are expected (American Cancer Society, 1978).
For purposes of evaluating the potential genetic risks, the progeny of workersare considered members of the general public. Multiplying the sum of the U.S.population dose from exposure to radioactivity attributable to the normalannual operation of the plant (that is, 35 person-rems), and the estimated dosefrom occupational exposure (that is, 790 person-rems) by the preceding geneticrisk estimators, the staff estimates that about 0.22 potential genetic disordermay occur in all future generations of the exposed population. Because BEIR IIIindicates that the mean persistence of the two major types of genetic disordersis about 5 generations and 10 generations, in the following analysis the riskof potential genetic disorders from the normal annual operation of the plantis conservatively compared with the risk of actual genetic ill health in thefirst 5 generations, rather than the first 10 generations. Multiplying theestimated population within 80 km of the plant (-121,000 persons in the year2010) by the current incidence of actual genetic ill health in each generation(-11%), about 67,000 genetic abnormalities areexpected in the first 5 genera-tions of the 80-km population (BEIR III).
The risks to the general public from exposure to radioactive effluents andtransportation of fuel and wastes from the annual operation of the facilityare very small, fractions of the estimated normal incidence of cancer fatalitiesand genetic abnormalities. On the basis of the preceding comparison, the staffconcludes that the risk to the public health and safety from exposure to radio-activity associated with the normal operation of the facility will be very small.
5.9.3.3 Radiological Impacts on Biota Other Than Humans
Depending on the pathway and the radiation source, terrestrial and aquatic biotawill receive doses that are approximately the same or somewhat higher than humansreceive. Although guidelines have not been established for acceptable limitsfor radiation exposure to species other than humans, it is generally agreedthat the limits established for humans are sufficiently protective for otherspecies.
Although the existence of extremely radiosensitive biota is possible and increasedradiosensitivity in organisms may result from environmental interactions withother stresses (for example, heat or biocides), no biota have yet been discoveredthat show a sensitivity (in terms of increased morbidity or mortality) to radi-ation exposures as low as those expected in the area surrounding the facility.Furthermore, at all nuclear plants for which radiation exposure to biota other
NMP-2 FES 5-22

than humans has been analyzed (Blaylock, 1976), there have been no cases ofexposure that can be considered significant in terms of harm to the species,or that approach the limits for exposure to members of the public that arepermitted by 10 CFR 20. Inasmuch as the. 1972 BEIR Report (BEIR I) concludedthat evidence to date indicated that no other living organisms are very muchmore radiosensitive than humans, no measurable radiological impact on popula-tions of biota is expected as a result of the routine operation of this facility.
5.9.3.4 Radiological Monitoring
Radiological environmental monitoring programs are established to. provide datawhere there are measurable levels of radiation and radioactive materials inthe site environs and to show that in many cases no detectable levels exist.Such monitoring programs are conducted to verify the effectiveness of inplantsystems used to control the release of radioactive materials and to ensure thatunanticipated buildups of radioactivity will not occur in the environment.Secondarily, the environmental monitoring programs could identify the highlyunlikely existence of releases of radioactivity from unanticipated release pointsthat are not monitored. An annual surveillance (land census) program will beestablished to identify changes in the use of unrestricted areas to provide abasis for modifications of the monitoring programs or of the TechnicalSpecifications conditions that relate to the control of doses to individuals..
These programs are discussed generically in greater detail in RG 4.1, Revision 1,"Programs for Monitoring Radioactivity in the Environs of Nuclear Power Plants,"and in the Radiological Assessment Branch Technical Position, Revision 1,November 1979, "An Acceptable Radiological Environmental Monitoring Program."*
5.9.3.4.1 Preoperational
The preoperational phase of the monitoring program should provide for themeasurement of background levels of radioactivity and radiation and theirvariations along the anticipated important pathways in the areas surroundingthe facility, the training of personnel, and the evaluation of procedures,equipment, and techniques. The applicant proposed a radiological environmental-monitoring program to meet these objectives in the ER-CP, and it was discussedin the FES-CP. This early program has been updated and expanded; it is sum-marized in Table 5.5.
The applicant states that the preoperational program will have been implementedat least 2 years before initial criticality of NMP-2 to document backgroundlevels of direct radiation and concentrations of radionuclides that exist inthe environment. The preoperational program will continue up to initialcriticality of NMP-2, at which time the operational radiological monitoringprogram will commence.
The staff has reviewed the preoperational environmental monitoring plan of theapplicant and finds that it is generally acceptable as presented.
*Available from the Radiological Assessment Branch, Office of Nuclear Reactor
Regulation, U.S. Nuclear Regulatory Commission, Washington, D.C. 20555.
NMP-2 FES 5-23

5.9.3.4.2 Operational
The operational, offsite radiological-monitoring program is conducted toprovide data on measurable levels of radiation and radioactive materials inthe site environs in accordance with 10 CFR 20 and 50. It assists and providesbackup support to the effluent-monitoring program recommended in RG 1.21,"Measuring, Evaluating and Reporting Radioactivity in Solid Wastes and Releasesof Radioactive Materials in Liquid and Gaseous Effluents from.Light-WaterCooled Nuclear Power Plants."
The applicant states that the operational program will in essence be a contin-uation of the preoperational program described above, with some periodicadjustment of sampling frequencies in expected critical exposure pathways.The proposed operational program will be reviewed prior to plant operation.Modification will be based upon anomalies and/or exposure pathway variationsobserved during the preoperational program.
The final operational-monitoring program proposed bv the applicant will bereviewed in detail by the NRC staff, and the specifics of the required moni-toring program will be incorporated into the operating license RadiologicalTechnical Specifications.
5.9.4 Environmental Impacts of Postulated Accidents
5.9.4.1 Plant Accidents
The staff has considered the potential radiological impacts on the environmentof possible accidents at NMP-2 in accordance with a Statement of InterimPolicy published by the NRC on June 13, 1980 (45 FR 40101-40104). The followingsections discuss the staff's considerations and conclusions.
Section 5.9.4.2 deals with general characteristics of nuclear power plant acci-dents, including a brief summary of safety measures provided to minimize theprobability of their occurrence and to mitigate their consequences if theyshould occur. Also described are the important properties of radioactivematerials and the pathways by which they could be transported to become environ-mental hazards.. Potential adverse health effects and impacts on society asso-ciated with actions to avoid such health effects also are identified.
Next, Section 5.9.4.3 describes actual experience with nuclear power plantaccidents and their observed health effects and other societal impacts. Thisis followed by a summary review in Section 5.9.4.4 of safety features of NMP-2and of the site that act.to mitigate the consequences of accidents.
The results of calculations of the potential consequences of accidents thathave been postulated in the design basis are then given in Section 5.9.4.5.
Also described are the results of calculations for the NMP-2 site using contem-porary probabilistic methods, with an explanation of their inherent uncertain-ties, to estimate the possible impacts and the risks associated with severeaccident sequences of low probability of occurrence.
NMP-2 FES 5-24

5.9.4.2 General Characteristics of Accidents
The term "accident," as used in this section, refers to any unintentional eventnot addressed in Section 5.9.3 that results in a-release of radioactive materialsinto the environment. The predominant focus, therefore, is on events that canlead to releases substantially in excess of permissible limits for normal opera-tion. Normal release limits are specified in the Commission's regulations in10 CFR 20 and 10 CFR 50, Appendix I.
There are several features that combine to reduce the risk associated with acci-dents at nuclear power plants. Safety features provided for in design, construc-tion, and operation comprise the first line of defense and are to a very largeextent devoted to the prevention of the release of radioactive materials fromtheir normal places of confinement within the plant. There are also a numberof additional lines of defense that are designed to mitigate the consequencesof failures in the first line. These safety features are designed taking intoconsideration the specific locations of radioactive materials within the plant;their amounts; their nuclear, physical, and chemical properties, and their re-lative tendency for being transported into and for creating biological hazardsin the environment. Descriptions of these features for NMP-2 may be found inthe applicant's Final Safety Analysis Report and in the staff's Safety Evalua-tion Report (SER), which is scheduled for publication in December 1984. Themost important mitigative features are described in Section 5. 9.4. 4(l) below.
(1) Fission Product Characteristics
By far the largest inventory of radi'oactive material in a nuclear power plantis produced as a byproduct of the fission process and is located in the uraniumoxide fuel pellets in the reactor core in the form of fission products. Duringperiodic refueling shutdowns, some of the assembli 'es containing these fuelpellets are transferred to a spent-fuel storage pool to create in this storagearea the second largest inventory of radioactive material at the plant. Muchsmaller inventories of radioactive materials also are normally present in thewater that circulates in the reactor coolant system and, in the systems used toprocess gaseous and liquid radioactive wastes in the plant.
All these *radioactive materials exist in a variety of physical and chemicalforms. Their potential for dispersion into the environment depends not onlyon mechanical forces that might physically transport them, but also upon theirinherent properties, particularly, their volatility. The majority of thesematerials exist as nonvolatile solids over a wide range of temperatures. Some,however, are relatively volatile solids, and a few are gaseous in nature.Such characteristics have a significant bearing upon the assessment of theenvironmental radiological impact of accidents.
The gaseous materials include radioactive forms of the chemically inert noblegases krypton and xenon. These gases have the highest potential for release intothe atmosphere. If a reactor accident were to occur involving degradation ofthe fuel cladding, the release of substantial quantities of these radioactivegases from the fuel is a virtual certainty. Such accidents are of low frequency,but are considered credible events (see Section 5.9.4.3). For this reason, thesafety analysis of each nuclear power plant incorporates a hypothetical design-basis accident that postulates the release of the entire inventory of radioactive
NMP-2 FES 525-25

noble gases from the fuel in the reactor vessel into the containment structure.If these gases were further released to the environment as a possible result offailure of safety features, the hazard to individuals from these noble gaseswould arise predominantly through the external gamma radiation from the airborneplume. The reactor containment structure and other features are designed tominimize this type of release.
Radioactive forms of iodine are formed in substantial quantities in the fuelby the fission process and may be quite volatile in some chemical forms. Forthese reasons, they have traditionally been regarded as having a relativelyhigh potential for release (1) from the fuel at higher than normal tempera-tures, or (2) from defects in fuel pins. For design-basis accident analysis,it is assumed that up to 25% of the iodines are released to the containmentatmosphere. If radioiodines are released to the environment, the principalradiological hazard associated with the radioiodines is incorporation into thehuman body and subsequent concentration in the thyroid gland. Because of thishazard, the potential for release of radioiodines to the atmosphere is reducedby the use of special structures, components, and systems designed to retainthe iodine. The chemical forms in which the fission product radioiodines arefound are generally solid materials at room temperatures, so they have a strongtendency to condense (or plate out) on cooler surfaces. In addition, most ofthe iodine compounds are quite soluble in or chemically reactive with water.Although these properties do not inhibit the release of radioiodines fromdegraded fuel, they do act to mitigate the release both to and from containmentstructures that have large internal surface areas and that contain large quan-tities of water as a result of an accident. The same properties affect thebehavior of radioiodines that may "escape" into the atmosphere. Thus, if rain-fall occurs during a release, or if there is moisture on exposed surfaces (forexample, dew), the radioiodines will show a strong tendency to be absorbed bythe moisture. Although less volatile than many iodine compounds, virtually allcesium and rubidium (alkali metals) compounds are soluble in or react stronglywith water, and would behave similarly in the presence of moisture. In addi-tion, the more volatile iodine compounds are capable of reacting with vegetationand traces of organic gases and pollen normally present in air, and many alkalimetal compounds are capable of reacting with siliceous materials such as con-crete, glass and soil.
Other radioactive materials formed during the operation of a nuclear powerplant have lower volatilities and--by comparison with the noble gases, iodine,and alkali metals--have a much smaller tendency to escape from degraded fuelunless the temperature of the fuel becomes very high. By the same token, ifsuch materials escape by volatilization from the fuel, they tend (1) to con-dense quite rapidly to solid form again when they are transported to a regionof lower temperature and/or (2) to dissolve in water when it is present. Theformer mechanism can have the result of producing some solid particles ofsufficiently small size to be carried some distance by a moving stream of gasor air. If such particulate materials are dispersed into the atmosphere as aresult of failure of the containment barrier, they will tend to be carrieddownwind and deposit on surfaces by gravitational settling (fallout) or byprecipitation (washout or rainout), where they will become "contamination"hazards in the environment.
NMP-2 FES 5-26

All of these radioactive materials exhibit the property of radioactive decaywith characteristic half-lives ranging from fractions of a second to many daysor years (see Table 5.6). Many of them decay through a sequence or chain ofdecay processes, and all eventually become stable (nonradioactive) materials.The radiation emitted during these decay processes is the reason that they arehazardous materials. As a result of radioactive decay, most fission productstransmute into other elements. Iodines transmute into noble gases, forexample, while the noble gases transmute into alkali metals. Because of thisproperty, fission products that escape into the environment as one elementmay later become a contamination hazard as a different element.
(2) Exposure Pathways
The radiation exposure (hazard) to individuals is determined by their proximityto the radioactive materials, the duration of exposure, and factors that actto shield the individual from the radiation. Pathways that lead to radiationexposure hazards to humans are generally the same for accidental as for "normal"releases. These are depicted in Figure 5.3. There are two additional possiblepathways that could be significant for accident releases that are not shown inFigure 5.3. One pathway is the fallout onto open bodies of water, or onto landand eventual runoff into open water bodies, of radioactivity initially carriedin the air. The second pathway, which is unique to an accident, is createdwhen sufficiently high temperatures inside the reactor core cause uncontrolledor unmitigated melting and subsequent penetration of the basemat underlyingthe reactor by the molten core debris. This situation could create the potentialfor the release of radioactive material into the hydrosphere through contactwith groundwater, and may lead to external exposure to radiation and to internalexposures if radioactive material is inhaled or ingested from contaminated foodor water.
It is characteristic of the transport of radioactive material by wind or bywater that the material tends to spread and disperse, like a plume of smokefrom a smokestack, becoming less concentrated in larger volumes of air orwater. The results of these natural processes are to lessen the intensity ofexposure to individuals downwind or downstream of the point of release, but toincrease the number who may be exposed. The bulk of radioactive releases ismore likely to reach the atmosphere than to reach streams or groundwater. Fora release into the atmosphere, the degree to which dispersion reduces theconcentration in the plume at any.downwind point is governed by the turbulencecharacteristics of the atmosphere, which vary considerably with time and fromplace to place. This fact, taken in conjunction with the variability of winddirection and the presence or absence of precipitation, means that accidentconsequences are very much dependent upon the weather conditions existing atthe time of the accident.
(3) Health Effects
The cause-and-effect relationships between radiation exposure and adversehealth effects are quite complex (National Research Council, 1979; Land, 1980),but they have been studied exhaustively in comparison with the health effectsfrom many other environmental contaminants.
NMP-2 FES 5-27

Whole-body radiation exposure resulting in a dose greater than about 10 remsfor a few persons and about 25 rems for nearly all people over a short periodof time (hours.) is necessary before any physiological effects to an individualare clinically detectable. Doses about 7 or more times larger than the latterdose, also received over a relatively short period of time (hours to a fewdays), can be expected to cause some fatal injuries. At the severe butextremely low probability end of the accident spectrum, exposures of thesemagnitudes are theoretically possible for persons in close proximity to suchaccidents if measures are not or cannot be taken to provide protection, suchas sheltering or evacuation.
Lower levels of exposures also may constitute a health risk, but the abilityto define a direct cause-and-effect relationship between a known exposure toradiation and any given health effect is difficult, given the backdrop ofthe many other possible reasons why a particular effect is observed in aspecific individual. For this reason, it is necesary to assess such effectson a statistical basis. Such effects include randomly occurring cancer in theexposed population and genetic changes in future generations after exposure ofa prospective parent. The occurrence of cancer itself will not necessarilycause death, however. Occurrences of cancer in the exposed population maybegin to develop only after a lapse of 1 to 15 years (latent period) from thetime of exposure and then continue over the lifetime of the individual (plateauperiod). However, in the case of exposure to fetuses (in utero), occurrencesof cancer may begin to develop at birth (no latent period) and end at age 10(that is, the plateau period is 10 years). The health consequences model usedwas based on the 1972 BEIR I Report of the National Academy of Sciences (BEIR I).
Most authorities agree that a reasonable, and probably conservative, estimateof the randomly occurring number of health effects of low levels of radiationexposure to a large number of people is within the range of about 10 to 500potential cancer deaths per million person-rems (although for low doses toindividuals, zero is not excluded by the data). The range comes from the latestNAS BEIR III Report (1980), which also indicates a probable value of about 150.This value is virtually identical to the value of about 140 used in the NRChealth-effects models. In addition, approximately 220 genetic changes permillion person-rems would be projected over succeeding generations by modelssuggested in the BEIR III report. This also compares well with the value ofabout 260 per million person-rems used by the NRC staff, which was computed asthe sum of the risk of specific genetic defects and the risk of defects withcomplex etiology (causes).
(4) Health Effects Avoidance
Radiation hazards in the environment tend to disappear bythe natural processesof radioactive decay and weathering. However, where the decay process isslow, and where the material becomes relatively fixed in its location as anenvironmental contaminant (such as in soil), the hazard can continue to existfor a relatively long period of time--months, years, or even decades. Thus, apossible consequential environmental societal impact of severe accidents isthe avoidance of the health hazard rather than the health hazard itself, byrestrictions on the use of the contaminated property or contaminated food-stuffs, milk, and drinking water. The potential economic impacts that thisavoidance can cause are discussed below.
NMP-2 FES 5-28

5.9.4.3 Accident Experience and Observed Impacts
As of April 1984, there were 79 commercial nuclear power reactor unitslicensed for operation in the United States at 52 sites, with power-generatingcapacities ranging from 50 to 1180 megawatts electric (MWe) (NMP-2 is designedfor approximately 1100 MWe). The combined experience with all these unitsrepresents approximately 700 reactor-years of operation over an elapsed timeof about 23 years. Accidents have occurred at several of these facilities(Oak Ridge, 1980; NUREG-0651). Some of these have resulted in releases ofradioactive material to the environment ranging from very small fractions of acurie to a few million curies. None is known to have caused any radiationinjury or fatality to any specific member of the public, nor any significantindividual or collective public radiation exposure, nor any significant con-tamination of the environment. This experience base is not large enough topermit reliable statistical predictions of accident probabilities. It does,however, suggest that significant environmental impacts caused by accidentsare very unlikely to occur over time periods of a few decades.
Melting or severe degradation of reactor fuel has occurred in only one ofthese units, during the accident at Three Mile Island Unit 2 (TMI-2) onMarch 28, 1979. In addition to the release to the environment of a few mil-lion curies of noble gases, mostly xenon-133, it has been estimated thatapproximately 15 curies of radioiodine also were released to the environmentat TMI-2 (NUREG/CR-1250). This amount represents a minute fraction of thetotal radioiodine inventory present in the reactor at the time of the accident.No other radioactive fission products were released to the environment inmeasurable quantity. It has been estimated that the maximum cumulative off-site radiation dose to an individual was less than 100 mrems (NUREG/CR-1250;President's Commission, 1979). The total population exposure has been esti-mated to be in the range from about 1000 to 5300 person-rems (NUREG-0558).This exposure could produce between none and one additional fatal cancer overthe lifetime of the population. The population within 80 km (50 miles) of TMI-2receives each year from natural background radiation about 240,000 person-rems.Approximately a half-million cancers are expected to develop in this group overtheir lifetimes (NUREG/CR-1250; President's Commission, 1979), primarily fromcauses other than radiation.
Trace quantities (barely above the limit of detectability) of radioiodine werefound in a few samples of milk produced in the area. No other food or watersupplies were affected.
Accidents at nuclear power plants also have caused occupational injuries and afew fatalities, but none attributed to radiation exposure. Individual workerexposures have ranged up. to about 5 rems as a direct consequence of reactoraccidents (although there have been higher exposures to individual workers asa result of other unusual occurrences). However, the collective worker exposurelevels (person-rems) from accidents are a small fraction of the exposuresexperienced during normal routine operations that average about 440 to 1300person-rems in a PWR and 790 to 1660 person-rems in a BWR per reactor-year.
Accidents also have occurred at other nuclear reactor facilities in the UnitedStates and in other countries (Oak Ridge, 1980; Thompson and Beckerley, 1964).Because of inherent differences in design, construction, operation, and purpose
NMP-2 FES 5-29

of most of these other facilities, their accident record has only indirectrelevance to current nuclear power plants. Melting of reactor fuel occurredin at least seven of these accidents, including the one in 1966 at the EnricoFermi Atomic Power Plant, Unit 1. Fermi Unit 1 was a sodium-cooled fastbreeder demonstration reactor designed to generate 61 MWe. This accident didnot release any radioactivity to the environment. The damages were repairedand the reactor reached full power 4 years following the accident. It operatedsuccessfully and completed its mission in 1973.
A reactor accident in 1957 at Windscale, England, released a significant quan-tity of radioiodine, approximately 20,000 curies, to the environment (UnitedKingdom Atomic Energy Office, 1957). This reactor, which was not operated togenerate electricity, used air rather than water to cool the uranium fuel.During a special operation to heat the large amount of graphite in this reactor(characteristic of a.graphite-moderated reactor), the fuel overheated andradioiodine and noble gases were released directly to the atmosphere from a123-m (405-foot) stack. Milk produced in a 518-km2 (200-mi 2 ) area around thefacility was impounded for up to 44 days. The United Kingdom National Radio-logical Protection Board estimated that the releases may have caused about260 cases of thyroid cancer, about 13 of them fatal, and about 7 deaths fromother cancers or hereditary diseases (Crick and Linsley, 1982). This kind ofaccident cannot occur in a water-moderated and -cooled reactor like NMP-2,however.
5.9.4.4 Mitigation of Accident Consequences
Pursuant to the Atomic Energy Act of 1954, the NRC is conducting a safetyevaluation of the application to operate NMP-2. The results of this revieware in the staff SER, published in February 1985. This report contains detailedinformation on the plant design. The following section, however, is providedto outline the principal design features.
(1) Design Features
NMP-2 contains features designed to prevent accidental release of fissionproducts from the fuel and to lessen the consequences should such a releaseoccur. These accident-preventive and mitigative features are referred tocollectively as engineered safety features (ESF). To establish design andoperating specifications for ESFs, postulated events referred to as design-basisaccidents are analyzed.
An emergency core cooling system (ECCS) is provided to supply cooling water tothe reactor core during an accident to prevent or minimize fuel damage. Meansof removing heat energy from the containment to mitigate its overpressurizationfollowing an accident are also provided. The containment system itself is apassive ESF, designed to prevent direct escape of released fission products tothe environment.
The NMP-2 containment structures consist of an inner primary containment andan outer secondary containment. The primary containment is designed to with-stand internal pressures resulting from reactor accidents. The secondarycontainment surrounds the primary containment and includes all equipment out-side primary containment that could handle fission products in the event of an
NMP-2 FES 5-30

accident. The secondary containment is designed to collect, delay, and filterany leakage from the primary containment before its release to the environmentfor all events of design-basis severity and for some accidents of greaterseverity.
The secondary containment encloses plant areas that are accessible and, there-fore, ventilated during normal operation. When a release of radioactivity isdetected, normal ventilation is automatically isolated, and an ESF, the standbygas treatment system (SGTS), assumes control of air flow within and from thesecondary containment. The SGTS filters the secondary containment atmosphereand exhausts sufficient filtered air to establish and maintain an internalpressure less than the outside atmospheric pressure. The system is designedso that this negative pressure is sufficient to prevent unfiltered air leakagefrom the building. Radioactive iodine and particulate fission products wouldbe substantially removed from the SGTS flow by safety-grade activated charcoaland high-efficiency particulate air filters.
The mechanical systems mentioned above are designed to perform their functionsgiven single failures, are qualified for their anticipated accident environments,and are supplied with emergency power from onsite diesel generators if normaloffsite and station power is interrupted.
A more extensive discussion of these and other design features is the applicant's.FSAR. In addition, the implementation of the lessons learned from the TMI-2accident--in the form of improvements in design, procedures, and operatortraining--will reduce the likelihood of a degraded core accident that couldresult in large releases of fission products to the containment. The appli-cant will be required to meet the TMI-related requirements specified inNUREG-0737. As noted in Section 5.9.4.5(7), the relative improvement insafety from these actions has not been quantified in this statement.
(2) Site Features
The NRC Reactor Site Criteria, in 10 CFR 100, require that the site for everypower reactor have certain characteristics that tend to reduce the risk andpotential impact of accidents. The discussion that follows briefly describesthe NMP-2 site characteristics and how they meet these requirements.
First, the site has an exclusion area, as required by 10 CFR 100. The NMPsite and the James A. FitzPatrick site, which are immediately adjacent to eachother, share a common exclusion area. The irregularly shaped exclusion areais formed by the combined property lines of the Niagara Mohawk Power Co. (NMPC),owner of the NMP site, and the Power Authority of the State of New York (PASNY),owner of the FitzPatrick site. These companies own the surface and mineralrights of the respective land areas. By formal agreement executed in 1970between NMPC and PASNY, which calls for reciprocal inclusion of each party'sproperty within the exclusion area, NMPC has the authority to control all acti-vity within the exclusion area. This authority complies with 10 CFR 100.There are no residents living within the exclusion area. Activities unrelatedto NMP-2 operations that occur within the exclusion area include activity asso-ciated with the operation of NMP-1 and FitzPatrick, visitors to the EnergyInformation Center and its associated picnic and playground area and nature
NMP-2 FES 5-31

trails, and water-related activities on Lake Ontario. There are no commercialshipping lanes, highways, or railways traversing the exclusion area. Arrange-ments have been made with local- authorities to limit access and to control theactivity and evacuation of everyone in the exclusion area. NMPC owns about364 ha (900 acres) of the total 647 ha (1600 acres) of land in the combinedexclusion area.
Second, beyond and surrounding the exclusion area is a low population zone(LPZ), also required by 10 CFR 100. The LPZ for the NMP site is a circulararea with a 6.4-km (4-mile) radius measured from the NMP-1 stack. Except forLake Ontario, the LPZ consists mostly of wooded and agricultural land. Thereis some limited recreational activity on the lake. Within the LPZ the appli-cant must ensure that there is a reasonable probability that appropriateprotective measures could be taken on behalf of the residents and other mem-bers of the public in the event of a serious accident. The applicant hasindicated that there were about 2093 persons residing in the LPZ in 1980, andprojects the population to increase to about 4372 by the year 2030. In caseof a radiological emergency, the applicant has made arrangements to carry outprotective actions, including evacuation of personnel in the vicinity of theNMP station. For further details, see the following section on EmergencyPreparedness.
Third, 10 CFR 100 also requires that the distance from the reactor to the near-est boundary of a densely populated area containing more than about 25,000residents be at least one and one-third times the distance from the reactor tothe outer boundary of the LPZ. Because accidents of greater potential hazardthan those commonly postulated as representing an upper limit are conceivable,although highly improbable, it was considered desirable to add the populationcenter distance requirements in 10 CFR 100 to provide for protection againstexcessive doses to people in large centers. The City of Syracuse, New York,with its closest boundary about 44.8 km (28 miles) south-southeast of the site,is the most densely populated center near the plant. The population of Syracusewas 170,105 in 1980. The distance from the site to Syracuse is at least oneand one-third times the distance to the outer boundary of the LPZ. The closestpolitical boundary of Oswego is about 7.2 km (4.5 miles) southwest of thesite, but the closest residential area is about 8.8 km (5.5 miles) away. Thearea between 7.2 and 8.5 km from the site is used for industrial purposes, andresidential expansion in this area is unlikely. In addition, the populationof Oswego decreased from 22,155 in 1960 to 19,793 in 1980. The largest citywithin 120 km (75 miles) of the site, other than Syracuse, is Rochester, NewYork. In 1980, Rochester, which is about 104 km (65 miles) west-southwest ofthe site, had a population of 241,741. The population density within 48 km(30 miles) of the site when the plant is scheduled to go into operation (about1986) is projected to be 62 persons per km2 (160 persons per square mile), andis not expected to exceed 118 persons per km2 (305 persons per square mile)during the life of the plant.
The safety evaluation of the NMP-2 site has also included a review of potentialexternal hazards (activities off the site that might adversely affect the opera-tion of the plant and cause an accident). The review encompassed nearby indus-trial, transportation, and military facilities that might create explosive,missile, toxic gas, or similar hazards. The risk to NMP-2 from such hazardshas been foundto be negligibly small. Compliance with the Commission's siting
NMP-2 FES 5-32

criteria with respect to both natural (e.g., earthquakes and floods) and hazardsresulting from industrial transportation, and military activities in the areaare discussed in more detail in the SER.
(3) Emergency Preparedness
Emergency preparedness plans including protective action measures forNMP-2have been developed by the applicant and, for offsite areas, by state andlocal authorities. The onsite plans are being reviewed by the NRC, while theFederal Emergency Management Agency (FEMA) is reviewing the offsite plans. Inaccordance with the provisions of 10 CFR 50.47, effective November 3, 1980, anoperating license will not be issued to the applicant unless a finding is madeby the NRC that the state of onsite and offsite emergency preparedness providesreasonable assurance that adequate protective measures can and will be takenin the event of a radiological emergency. Among the standards that must bemet by these plans are provisions for two emergency planning zones (EPZs). Aplume exposure pathway EPZ of about 16 km (10 miles) in radius and an ingestionexposure pathway EPZ of about 80 km (50 miles) in radius are required. Otherstandards include appropriate ranges of protective actions for each of thesezones, provisions for dissemination to the public of basic emergency planninginformation, provisions for rapid notification of the public during a seriousreactor emergency, and methods, systems, and equipment for assessing andmonitoring actual or potential offsite consequences in the EPZs of an acci-dental radiological release. The onsite and offsite facilities, services, andpersonnel that would be used or contacted during a radiological accident andtheir coordination responsibilities are described in the Nine Mile Point 2Emergency Plan and the Emergency Plan Implementing Procedures. The vcapacityof the road network in the NMP-2 area to accommodate evacuation traffic,including the effects of potential bottlenecks, is discussed in "EvacuationTravel Time Estimates for the James A. FitzPatrick/Nine Mile Point EmergencyPlanning Zone" (Parsons, Brinckerhoff, Quade, and Douglas, Inc., 1980, 1984).
NMP-2 is adjacent to a licensed commercial power reactor, NMP-1, which isoperated by the applicant. The offsite plans and much of the onsite plans arecommon to both units.
NRC and FEMA have agreed that FEMA will make a finding and determination as tothe adequacy of state and local government emergency response plans. NRC willdetermine the adequacy of the applicant's emergency response plans with respectto the standards listed in 10 CFR 50.47(b), the requirements of Appendix E to10 CFR 50, and the guidance in NUREG-0654, Revision 1, "Criteria for Prepara-tion and Evaluation of Radiological Emergency Response Plans and Preparednessin Support of Nuclear Power Plants," dated November 1980. After the abovedeterminations by NRC and FEMA, the NRC will make a finding in the licensingprocess as to the overall and integrated state of preparedness. The NRC stafffindings are reported in the SER.
5.9.4.5 Accident Risk and Impact Assessment
(1) Design-Basis Accidents
As a means of ensuring that certain features important to safety of the NMP-2facility meet acceptable design and performance criteria, both the applicant
NMP-2 FES 5-33

and the staff have analyzed the potential consequences of a number of postu-lated accidents. Some of these could lead to significant releases of radio-active materials to the environment, and calculations have been performed toestimate the potential radiological consequences to persons off site. Foreach postulated initiating event, the potential radiological consequencescover a considerable range of values, depending upon the particular coursetaken by the accident and related conditions, including wind direction andweather, prevalent during the accident
In the NMP-2 safety analysis and evaluation, three categories of accidentshave been considered by the applicant and the staff. These categories arebased on probability of occurrence and include (1) incidents of moderate fre-quency (events that can reasonably be expected to occur during any year ofoperation); (2) infrequent accidents (events that might occur once during thelifetime of the plant; and (3) limiting faults (accidents that are not expectedto occur, but that have the potential for significant releases of radioactivity).The radiological consequences of incidents in the first category, also calledanticipated operational occurrences, are similar to the consequences fromnormal operation that are discussed in Section 5..9.3. Some of the accidentspostulated in the second and third categories for NMP-2 are shown in Table 5.7.These events are designated design-basis accidents in that specific design andoperating features such as described in Section 5.9.4.4(1) are provided tolimit their potential radiological consequences. Approximate radiation dosesthat might be received by a person at the exclusion area boundary are alsoshown in the table, along with a characterization of the duration of thereleases. The results shown in the table reflect a realistic estimate of thepotential individual radiation exposures from the initiating accidents inTable 5.7. These estimates are only small fractions of the yearly dose guide-line of 0.5 rem specified in 10 CFR 20. The applicant also made realisticcalculations of the radiological doses at the exclusion area boundary (ER-OL),which yielded lower estimated doses than shown in Table 5.7.
None of the calculations of the impacts of design-basis accidents described inthis section take into consideration possible reductions in individual orpopulation exposures as a result of any protective actions.
_(2) Probabilistic Assessment of Severe Accidents
In this and the following three sections, there is a discussion of the proba-•bilities and consequences of accidents of greater severity than the design-basis accidents discussed in the previous section. As a class, they areconsidered less likely to occur, but their consequences could be more severefor both the plant itself and for the environment. These severe accidents aredifferent from design-basis accidents in two primary respects: they allinvolve substantial physical deterioration of the fuel in the reactor core tothe point of melting, and they involve deterioration of the capability of thecontainment structure to perform its intended function of limiting the releaseof radioactive materials to the environment. It should be understood thateven the very severe reactor accidents, unlike weapons, would not result inblast and in high pressure- and high temperature-related consequences to thepublic or to the environment.
The assessment methodology employed is essentially as described in the reactorsafety study (RSS, WASH-1400), which was published in 1975 (NUREG-75/014), butincludes improvements in the assessment methodology after publication of the
NMP-2 FES 5-34

RSS* (such as thermal-hydraulic models, core melt phenomenology, and containmentresponse analysis).
Accident sequences initiated by internal causes that are used in the staffanalysis are described in Appendix H to this report; they based on a review ofa similar plant (Limerick) and consideration of recent design improvements atNMP-2 to reduce the probability of anticipated transients without scram. Exter-nal events that might initiate severe accidents were not considered, except forloss of offsite power. For those sites for which externally initiated eventswere considered, the early fatality risk from externally initiated accidentsranged from 0.2 to 30 times more than internally initiated accidents, but forother risks were comparable or less. Accident sequences are grouped into re-lease categories based upon similarities of the sequences regarding core-meltaccident progression, containment failure characteristics, and the parametersof atmospheric release of radionuclides required for consequence analysis.
Table 5.8 provides information used in the staff's consequence assessment foreach specific release category and summarizes the staff analysis described inAppendix H. The information includes time estimates from termination of thefission process during the accident until the beginning of release to theenvironment (release time), duration of the atmospheric release, warning timefor offsite evacuation, estimates of the energy associated with each release,height of the release location above the ground level, and fractions of thecore inventory (see Table 5.6) of eight groups of radionuclides in each release.The radionuclide release fractions shown in Table 5.8 were derived usingWASH-1400 radiochemistry assumptions of fission product releases from fuel andtheir attenuation through various elements of the primary system and containment(such as the suppression pool), and the methods of this derivation are outlinedin Appendix H. The staff's estimate of the probability associated with eachrelease category used in the staff analysis is also shown in Table 5.8. Asdescribed in the RSS, there are substantial uncertainties in these probabili-ties. This is due, in part, to difficulties associated with the quantifica-tion of human error and to inadequacies in the data base on failure rates ofindividual plant components (NUREG/CR-0400). These uncertainties are discussedin Section 5.9.4.5(7).
The magnitudes (curies) of radioactivity released to the atmosphere for eachaccident sequence or release category are obtained by multiplying the releasefractions shown in Table 5.8 by the maximum amounts predicted to be in theNMP-2 core, and by a factor accounting for decay prior to release. The coreinventory of radionuclides is shown in Table 5.6 for NMP-2 at a core thermalpower level of 3466 MWt. This is the power level used in the FSAR for analysisof radiological consequences and is used here instead of the 3323 MWt expectedmaximum power to account for power density variations and instrument error inmeasurement of power levels normally present in operating reactors. The 54nuclides shown in the table represent those (of the hundreds actually expected
*However, there are large uncertainties in the assessment methodology and the
results derived from its application. A discussion of the uncertainties isprovided in Section 5.9.4.5(7) of this statement. Large uncertainties in eventfrequencies and other areas of risk analysis arise, in part, from similarcauses in all plant and site assessments; hence the results are better usedin carefully constructed comparisons rather than as absolute values.
NMP-2 FES 5-35

to be present in the operating plant) that are potentially major contributors tothe health and economic effects of severe accidents. They were selected on. thebasis of the half-life of the nuclide, consideration of the health effects ofdaughter products, and the approximate relative offsite dose contribution.
The potential radiological consequences of these releases have been calculatedby the computer code CRAC, based on the consequence model used in the RSS (seealso, NUREG-0340 and NUREG/CR-2300), adapted and modified as described below toapply to a specific site. The essential elements. are shown in schematic formin Figure 5.4. Environmental parameters specific to the NMP-2 site have beenused and include
(1) meteorological data for the site representing a full year (1975) of con-secutive hourly measurements and seasonal variations with good datarecovery characteristics (annual average probabilities of wind blowinginto 16 directions of the compass are shown in Table 5.9)
(2) projected population for the year 2010 extending throughout. regions of80-km (50-mile) and 563-km (350-mile) radius from the site
(3) the habitable land fraction within a 563-km (350-mile) radius
(4) land-use statistics on a statewide basis, including farm land values,farm product values including dairy production, and growing season infor-mation, for the State of New York and each surrounding state within the563-km (350-mile) region
For the region beyond 563 km (350 miles), the U.S. average population densitywas assumed.
The calculation was extended out to 3200 km (2000 miles) from the site toaccount for the residual radionuclides that would remain in the atmosphere atlarge distances, with rain assumed in the interval between 563 km and 3200 kmto deplete the plume of all non-noble-gas inventory. To obtain a probabilitydistribution of consequences, calculations were performed assuming the occur-rence of each release category at each of 91 different "start" times distrib-uted throughout a 1-year period. Each calculation used site-specific hourlymeteorological data and seasonal information for the period following eachstart time.
The consequence model was also used to evaluate the consequence reductionbenefits of offsite emergency response such as evacuation, relocation, andother protective actions. Early evacuation and relocation of people wouldconsiderably reduce the exposure from the radioactive cloud and the contami-nated ground in the wake of the cloud passage. The evacuation model used (seeAppendix I) has been revised from that used in the RSS for'better site-specificapplication. The quantitative characteristics of the evacuation model used forthe NMP-2 site are estimates made by the staff (see Table 5.10 for a summaryof emergency response assumptions). *There may be some people near a site whocannot be notified or who may choose not to evacuate. Also, there normallywould be some facilities near a plant, such as schools or hospitals, wherespecial equipment or personnel may be required to effect evacuation. There-fore, actual evacuation effectiveness could be greater or less than thatcharacterized, but it would not be expected to be very much less, because
NMP-2 FES 5-36

special consideration will be given in emergency planning.to any unique aspectsof dealing with special facilities in the area around NMP-1 and NMP-2 and theadjacent FitzPatrick units.
The other protective actions include (1) either complete denial of use (inter-diction) or denial of use until there has been appropriate decontamination offood stuffs such as crops and milk, (2) decontamination of severely contaminatedenvironment (land and property) when it is considered to be economically feas-ible to lower the levels of contamination to protective action guide (PAG)*levels, and (3) denial of use (interdiction) of severely contaminated land andproperty for varying periods of time until the co.ntamination levels are reducedto such values by radioactive decay and weathering that land and property canbe economically decontaminated as in (2) above. These actions would reduce theradiological exposure to the people from immediate and/or subsequent use of,or living in, the contaminated environment, but would also result in costs ofimplementation. Lowering the PAG levels would lower the delayed health effectsbut would increase costs.
Early evacuation within and early relocation of people from outside the plumeexposure pathway zone (see Appendix I) and other protective actions as men-tioned above are considered essential sequels to serious nuclear reactoraccidents involving significant release of radioactivity to the atmosphere.Therefore, the results shown for NMP-2 include the benefits of these protec-tive actions.
There are also uncertainties in each facet of the estimates of consequencesand the error bounds may be as large as they are for the probabilities (seeFigure 5.4).
The results of the calculations using this consequence model are radiologicaldoses to individuals and to populations, health effects that might result fromthese exposures, costs of implementing protective actions, and costs associatedwith property damage by radioactive contamination.
(3) Dose and Health Impacts of Atmospheric Releases
The results of the staff calculations of the environmental dispersion ofradioactive releases to the atmosphere and the radiological dose to people andhealth impacts performed for NMP-2 are presented in the form of probabilitydistributions in Figures 5.5 through 5.8 and are included in the impact sum-mary table Table 5.11. The graphs in Figures 5.5 through 5.8 display a type ofprobability distribution called a complementary cumulative distribution func-tion (CCDF). CCDFs show the relationship between the probability of a type of
*The PAG levels used in the CRAC analyses are different than those drafted by
the U.S. Environmental Protection Agency (EPA-520/1-75-001, September 1975) orby the U.S. Department of Health and Human Services (47 FR 47073, October 22,1982) for reactor accidents. The PAG levels used are defined in Table VI 11-6of WASH-1400, and were based on the recommendations of the former U.S. FederalRadiation Council and the British Medical Research Council. However, for con-
trol of long-term external irradiation, the staff used the PAG level for urban
areas in WASH-1400 Table VI 11-6 for both urban and rural areas.
NMP-2 FES 5-37

accident consequence being equaled or exceeded, and the magnitude of theconsequence. These graphs are useful in visualizing the degree to which theprobability of occurrence of consequences decreases as the magnitude of theconsequence increases. Probability per reactor-year* is the chance that agiven event would occur or a given consequence magnitude would be exceeded in1 year of operation for one reactor. Different accident releases and atmo-spheric dispersion conditions, source-term magnitudes, and dose effects resultin wide ranges of calculated magnitudes of consequences. Similarly, probabili-ties of equaling or exceeding a given consequence magnitude would also varyover a wide range because of varying probabilities of accidents and dispersionconditions." Therefore, the CCDFs are presented as logarithmic plots inwhich numbers varying over a large range can be conveniently shown on a graphscaled in powers of 10. For example, a consequence magnitude of 106 means aconsequence magnitude of one million (1 followed by six zeroes); a probabilityof 10-6 per reactor-year means a chance of 1 in one million or one millionth(0.000001) per reactor-year. All release categories shown in Table 5.8 con-tribute to the results; the consequences of each are weighted by its asso-ciated probability.
Figure 5.5 shows the probability distribution for the number of persons whomight receive whole-body doses equal to or greater than 25 rems, total bonemarrow doses equal to or greater than 200 rems, and thyroid doses equal to orgreater than 300 rems from early exposure,*** all on a per reactor-year basis.The 200-rem total bone marrow dose figure corresponds, approximately, to athreshold value for which hospitalization would be indicated for the treatmentof radiation injury. The 25-rem whole-body dose (which has been identifiedearlier as the lower limit for a clinically observable physiological effect innearly all people) and the 300-rem thyroid dose figures correspond to theCommission's guideline values for reactor siting in 10 CFR 100.
Figure 5.5 shows in the left-hand portion that there are, approximately,35 chances in 1 million (3.5 x 10-s) per reactor-year that one or more personsmay receive doses equal to or greater than any of the doses specified. Thefact that the three curves run almost parallel inhorizontal lines initiallyshows that if one person were to receive such doses, the chances are about thesame that up to 30 would be so exposed. The chances of larger numbers ofpersons being exposed at those levels are seen to be considerably smaller.For example, the chances are less than 1 in 10 million (10-7) that 10,000 ormore people might receive bone marrow doses of 200 rems or greater. Virtuallyall the doses reflected in this figure would be expected to occur to personswithin a 80-km (50-mile) radius of the plant.
Figure 5.6 shows the probability distribution for the total population exposurein person-rems; that is, the probability per reactor-year that the total
*ry in the plots means reactor-year.
**See (7) below for further discussion of areas of uncertainty.
***Early exposure to an individual includes external doses from the radioactivecloud and the contaminated ground, and the dose from internally depositedradionuclides from inhalation of contaminated air during the cloud passage.Other pathways of exposures are excluded.
NMP-2 FES 5-38

population exposure will equal or exceed the values given. Most of the popula-tion exposure up to 500,000 person-rems would occur within 80 km (50 miles), butvery severe releases would result in exposure to persons beyond the 80-km(50-mile) range, as shown.
For perspective, population doses shown in Figure 5.6 may be compared with theannual average dose to the population within 80 km (50 miles) of the NMP-2site resulting from natural background radiation of about 120,000 person-rems,and to the anticipated annual population dose to the general public (totalU.S.) from normal plant operation of about 35 person-rems (Appendix D,Tables D.8 and D.9).
Figure 5.7 represents the statistical relationship between population exposureand the induction of fatal cancers that might appear over a period of manyyears following accidental exposure. The impacts on the total population andthe population within 80 km (50 miles) are shown separately. Further, thefatal latent cancer estimates have been subdivided into those attributable toexposures of the thyroid and all other organs. Less than one-third of thelatent cancer (including thyroid) fatalities would occur within 80 km (50 miles)of the plant.
Figure 5.8 shows the probability distribution of early fatalities. Thiscalculated distribution reflects the assumption of severely exposed peoplebenefiting from supportive medical treatment. All early fatalities would beexpected to be within 16 km (10 miles) of the plant. As discussed in Appen-dix I, because it is possible that for very severe but low probability acci-dents some of the people requiring supportive medical treatment may notreceive it, the consequences at the low-probability end of the spectrum may besomewhat higher than shown.
An additional potential pathway for doses resulting from atmospheric releaseis from fallout onto open bodies of water. This pathway has been investigatedin the NRC analysis of the Fermi Unit 2 plant, which is located on Lake Erieand for which appreciable fractions of radionuclides in the plume could bedeposited in the Great Lakes (NUREG-0769). It was found that for the Fermisite, the computed individual and societal doses from this pathway weresmaller than the interdicted doses from other pathways. Further, the indi-vidual and societal liquid pathway doses could be substantially eliminated bythe interdiction of the aquatic food pathway in a manner comparable to inter-diction of the terrestrial foodpathway in the present analysis. Radioactivematerial accidentally released from NMP-2 would, depending on the wind direc-tion, fall out onto Lake Ontario, other lakes or reservoirs, or on land andeventually run off. The staff has also considered fallout onto, and runoffand leaching into, water bodies in connection with a study of severe accidentsat the Indian Point reactors in southeastern New York (Codell, 1982-1983). Inthis study, empirical models were developed based upon considerations ofradionuclide data from samples collected after fallout from atmospheric weaponstests. As with the Fermi study, the Indian Point evaluation indicated thatthe uninterdicted risks from this pathway were fractions of the interdictedrisks from other pathways. Further, if interdicted in a manner similar tointerdiction assumed for other pathways, the liquid pathway risk from falloutwould be a very small fraction of the risks from other pathways. Consideringthe regional meteorology and hydrology, the staff sees nothing to indicate
NMP-2 FES 5-39

that the liquid pathway contribution to the total accident risk from NMP-2 issignificantly greater than found for Fermi 2 and Indian Point. Therefore, the*staff concludes that the water pathway would be of small importance comparedto the results presented here for fallout onto land.
(4) Economic and Societal Impacts
As noted in Section 5.9.4.2, the various measures for avoiding adverse healtheffects, including those resulting from residual radioactive contamination in.the environment, are possible consequential impacts of severe accidents.Calculations of the probabilities and magnitudes of such impacts for the NMP-2and environs also have been made (NUREG-0340 describes the model used).Unlike the radiation exposure and health effect impacts discussed above,impacts associated with avoiding adverse health effects are more readilytransformed into economic impacts.
The results are shown as the probability distribution for cost of offsitemitigating actions in Figure 5.9 and are included in the impact summaryTable 5.11. The factors contributing to these estimated costs include thefollowing:
evacuation costsvalue of crops contaminated and condemnedvalue of milk contaminated and condemnedcosts of decontamination of property where practicalindirect costs resulting from the loss of use of property and incomesderived therefrom
The last-named costs would derive from the necessity for interdiction to pre-vent the use of property until it is either free of contamination or can beeconomically decontaminated.
Figure 5.9 shows that at the extreme end of the accident spectrum these costscould exceed billions of dollars, but that the probability that this wouldoccur is exceedingly small (about one chance in 1 million per reactor-year).
Additional economic impacts that can be considered include costs of relatedhealth effects, cost of regional industrial impacts, costs of decontaminationof the facility itself, and the costs of replacement power. Probabilitydistributions for these impacts have not been calculated, but they areincluded in the discussion of risk considerations in Section 5.9.4.5(6) below.
The geographical extent of the kinds of impacts discussed above, as well asmany other types of impacts, is a function of several factors. For example,the dispersion conditions and wind direction following a reactor accident, thetype of accident, and the magnitude of the release of radioactive material areall important in determining the geographical extent of such impacts. Becauseof these large inherent uncertainties, the values presented herein are meanvalues of the important types of risk based upon the methodoiogy employed inthe accident consequence model (NUREG-0340; NUREG/CR-2300) and do not indicatespecific geographical areas.
NMP-2 FES 5-40

(5) Releases to Groundwater
A pathway for public radiation exposure and environmental contamination thatwould be unique for severe reactor accidents was identified above. Considera-tion has been given to the potential environmental impacts of this pathway forNMP-2. The principal contributors to the risk are core melt accidents such asthose shown in Table 5.8, some of which will result in the core slumping outof the vessel and attacking the basemat. The penetration of the basemat ofthe containment building can release molten core debris to the strata beneaththe plant. The soluble radionuclides in this debris can be leached and trans-ported with groundwater to downgradient domestic wells used for drinking wateror to surface water bodies used for drinking water, aquatic food, and recreation.Releases of radioactivity to the groundwater underlying the site could alsooccur via depressurization of the containment atmosphere or via leakage ofradioactive ECCS and sump water through the failed containment.
An analysis of the potential consequences of a liquid pathway release ofradioactivity for generic sites was presented in the liquid pathway genericstudy (LPGS.). The LPGS compares the risk of accidents involving the liquidpathway (drinking water, aquatic food, swimming, and shoreline usage) for fiveconventional, generic land-based nuclear plants and a floating nuclear plant(for which the nuclear reactors would be mounted on a barge and moored in awater body). Parameters for the land-based sites were chosen to representaverages for a wide range of real sites and are thus typical, but represent noreal site in particular.
Doses to individuals and populations were calculated in the LPGS without con-sideration of interdiction methods such as isolating the contaminated ground-water or denying use of the water. In the event of surface water contamina-tion, alternative sources of water for drinking, irrigation, and industrialuses would be expected to be found, if necessary. Commercial and sport fish-ing as well as many other water-related activities would be restricted. Theconsequences would, therefore, be largely economic or social, rather thanradiological.. In any event, the individual and population doses for theliquid pathway range from fractions to very small fractions of those that canarise from the airborne pathways.
The discussion in this section is a summary of an analysis performed to comparethe liquid pathway consequences of a postulated core-melt accident at NineMile Point with that of the generic Great Lakes land-based site considered inthe LPGS. The method consists of a direct scaling of LPGS population dosesbased on the relative values of key parameters characterizing the LPGS GreatLakes land-based site and the Nine Mile Point site. The parameters that wereevaluated includethe amounts of radioactive materials entering the ground,groundwater travel time, and sorption on geological media. For this site, itwas not necessary to make comparisons past the lake boundary, because the longgroundwater travel time will reduce the source term to essentially zero atthat boundary, as explained below.
Beneath the Nine Mile Point site the hydrogeologic units in descending orderare: Unlithified Sediments, Oswego Sandstone, Pulaski Formation, and WhetstoneGulf Formation. Groundwater is available from an unconfined aquifer and deepconfined aquifers. The unconfined aquifer is composed of glacial till and
NMP-2 FES 5-41

fill material (Unlithified Sediments), and the upper portion of the OswegoSandstone beneath the soil. The unconsolidated deposits rest on a permeablefractured zone at the top of the Oswego Sandstone. As the depth increases inthe sandstone, the number of fractures decreases, with the formation becomingrelatively impermeable within approximately 20 feet. The local water tablevaries from 261 feet msl to the lake level (244 feet msl), with an annual varia-tion of about 2 feet. The average gradient is north-northwest toward LakeOntario. The deep confined aquifers are within the Pulaski and Whetstone GulfFormations. The local groundwater systems are more fully described in FSARSection 2.4.13.
At the site, the top of bedrock is about elevation 245 feet msl and ground ele-vation is about 260 feet msl. The containment basemat, at about elevation
163 feet msl, is in the Pulaski Formation. The RSS (NUREG-75/014), using bound-ing heat transfer calculations, estimated that the core-soil mass from a postu-lated core melt release would form a cylinder about 15 m (50 feet) high, witha diameter of about 21 m (70 feet). The core-soil mass would thus be expectedto penetrate to about elevation 113 feet msl, which is about the top of theWhetstone Gulf Formation. Because the Whetstone Gulf Formation is somewhatless permeable than the Pulaski Formation, the staff used parameters from thelatter to evaluate radionuclide migration times.
NMP-2 has a permanent dewatering system that is not safety related. That is,the structural design does not take any credit for the dewatering system. Theplant dewatering system consists of perimeter drains and two sumps locatedbelow the reactor building. Pumping from these sumps will be continuousduring plant operation, and the groundwater table in the reactor building areawill be maintained below the reactor mat elevation. The two sump pumps dis-charge groundwater at the rate of 0.013 m3 /sec (200 gpm) to maintain the coneof depression. This water is then discharged to Lake Ontario through a stormdrain system. In the event of a core-melt release, the dewatering systemcould either be shut off or used to collect and process radioactivity leachedfrom the residual core-soil mass. The staff analysis assumes that the pumpswould be shut off, with no credit taken for the cone of depression that wouldexist and delay nuclide migration.
The staff also considered possible pathways from the confined to unconfinedaquifers. The space between the reactor building walls and the excavated rockwalls is backfilled with concrete from the basemat elevation (175.0 feet) totop of rock, about elevation 246.0 feet. The top 20 feet of the Oswego Sand-stone (down to about elevation 226.0 feet) is permeable, but below elevation226.0 feet the sandstone is virtually impermeable. Thus, there is no pathwayalong the building walls from the confined to unconfined aquifers. The dewater-ing system, which is below elevation 175.0 feet, directs collected groundwaterto two sumps outside the reactor building walls. Each sump is connected tothe surface by a 1-m (3.0-foot)-diameter steel and concrete pipe. If the de-watering system pumps are shut off following a core-melt accident, water fromthe confined aquifer could rise in the 1-m (3.0-foot)-diameter pipe to a staticlevel of about elevation 250.0 feet, but could not reach the surface or theunconfined aquifer. The staff concludes that there is no credible direct path-way from the confined aquifer to the unconfined aquifer. Any contaminated waterfrom a postulated core-melt release into the confined aquifer would thus remain
NMP-2 FES 5-42

in that aquifer and migrate through it in a downgradient direction toward LakeOntario.
The surface water body of interest is Lake Ontario, the easternmost of theGreat Lakes. NMP-2 is located on the western portion of the Nine Mile Pointpromontory, approximately 180 m (600 feet) from the southeastern shore of LakeOntario. The groundwater travel time for the 183-m (600-foot) distance to thelake is estimated to be 6.3 years. This groundwater travel time is based onan average permeability of 63 m (207 feet) per year, a gradient of 0.0183, andan effective porosity of 4%.
The LPGS demonstrated (NUREG-0440) that for travel times on the order of yearsvirtually all of the population dose from the liquid pathway in an assumedcore-melt accident would result from Sr-90 and Cs-137. These chemicallyactive nuclides would, however, travel through the groundwater pathway at amuch slower rate because of the process of sorption onto the soil and rockmedia. The degree of retardation is governed by the various physical proper-ties, such as bulk density, aquifer porosity, and species equilibrium distribu-tion coefficient. The retardation factors were calculated using equilibriumdistribution coefficients (Kd) of 8.3 cm3 /gm for Sr-90 and 309 cm3 /gm forCs-137.
These equilibrium distribution coefficients were derived from an extensiveliterature search and are at the low end of the range of values given byIsherwood (NUREG/CR-0912). The calculated retardation factors for Cs-137 andSr-90 are 9065 and 245, respectively.
The effective radionuclide travel time to Lake Ontario is determined by multi-plying the groundwater travel time by the retardation factor. The radio-nuclide travel times for Cs-137 and Sr-90 are 57,110 years and 1,540 years,respectively.
As a result of radioactive decay during these long travel times, virtuallynone of the Cs-137 and Sr-90 would reach the lake. This compares to 0.87 and0.31 for the fractions of Cs-137 and Sr-90 that would reach the lake in theLPGS Great Lakes case. Thus, without further analysis of actual drinkingwater populations, aquatic food consumption, and shoreline usage, the staffcan conclude that the liquid pathway consequences of an' assumed core-meltaccident at NMP-2 would be considerably less than that calculated in the LPGS.The staff therefore concludes that NMP-2 is not unusual in its liquid pathwaycontribution to risk when compared to other land-based sites in the LPGS.
Finally, there are measures that could be taken to further minimize the impactof the liquid pathway. The staff has conservatively estimated that the minimumgroundwater travel time from the containment building to the nearest siteboundary, which is Lake Ontario, would be about 6.3 years. This would allowample time for engineering measures such as well point dewatering to isolatethe radioactive contamination near the source and to establish a groundwatermonitoring program that would ensure early detection if any contaminantsshould escape the immediate plant area. A comprehensive discussion of theseand other mitigation methods potentially applicable to Nine Mile Point is inHarris 1982a and b.
NMP-2 FES 5-43

(6) Risk Considerations
The foregoing discussions have dealt with both the probability, per year. ofoperation, of accidents and their impacts (or consequences). Because theranges of both factors are quite broad, it also is useful to combine them toobtain average measures of environmental risks. Such averages can permit auseful comparison of the impact on the public from radiological risks fromaccidental releases, both to the impact from normal operational releases, andto the impact from other forms of risk. Any comparison, however, should betempered with consideration of the uncertainties in estimated values (see (7)below).
A common way in which this combination of factors is used to estimate risk isto multiply probabilities by.the consequences. The resultant risk is thenexpressed as a measure of consequences per unit of time. Such a quantifica-tion of risk does not mean that there is universal agreement that peoples'attitudes about risks, or what constitutes an acceptable risk, can or shouldbe governed solely by such a measure. However, it can be a contributingfactor to a risk judgment, although not necessarily a decisive factor.
Table 5.12 shows societal risk estimates associated with population dose,early fatalities with supportive medical treatment, early fatalities withminimal medical treatment, early injuries, latent cancer fatalities, totalperson-rems, costs for evacuation and other protective actions, regionalindustrial impacts, plant costs, and land area for long-term interdiction.These risk values are obtained by multiplying the probabilities by the conse-quences, then summing this product over the entire range of consequences.Because the probabilities are on a per-reactor-year basis, the risks shownalso are on a per-reactor-year basis.
The population exposures and latent cancer fatality risks may be comparedwiththose from normal operation shown in Appendix D and Section 5.9.3.2 of thisstatement. The comparison (excluding exposure to station personnel) showsthat the accident. risks are about 9 times higher. For a different perspective,the latent cancer (including thyroid) fatality risks of 7 x 10⁻³ persons perreactor-year within the 80 km (50-mile) region (from Table 5.12) may be com-pared with such risks from causes other than reactor accidents. The calcula-tions were based on the projection that 1.2 million persons will live withinthe 80-km region in the year 2010. The average background cancer mortalityrate is 1.9 x 10⁻³ cancer fatality per person per year in the U.S (AmericanCancer Society, 1981). Therefore, at this rate, about 2300 background cancerfatalities per year are expected in the population within the 80-km region inthe year 2010. Thus, the risk of cancer fatality from reactor accidents atNMP-2 is small compared to the risk of normal occurrence of such fatality.
After the accident consequence calculations for the DES were completed, thestaff revised the NMP-2 population growth projections downward, reducing theprojected site area. population for the plant's mid-life year. The consequencecalculations were not redone using the new population figures, which showedabout 900,000 people living within 80 km (50 miles), about a third less thanused in the consequence calculations. Were the staff to recalculate theconsequences, smaller risks of both early and late health effects would becalculated. This change would not affect either the comparison between
NMP-2 FES 5-44

nuclear accident-caused cancer risk and non-nuclear accident-caused cancer risk,or the comparison of risk of early fatalities from nuclear accidents to the riskof other accident fatalities.
There are no early fatality, early injury, long-term land interdiction, oreconomic risks associated with protective actions and decontamination fornormal releases, but these risks can be associated with large accidentalreleases. For perspective and understanding of the meaning of the earlyfatality risk of 2 x 10⁻⁴ persons per reactor-year with supportive medicaltreatment and 4 x 10⁻⁴ persons per reactor-year with minimal medical treatment(from Table 5.11), the staff notes that occurrences of early fatalities withsupportive and minimal medical treatments would be contained, approximately,within the 16-km (10-mile) and 48-km (30-mile) regions, respectively. Thecalculations were based on the projections that the numbers of persons livingwithin these regions in the year 2010 will be 56,000 and 280,000, respectively.The risk from non-nuclear accidents for the average individual in the U.S. is5 x 10-1 accidental death per year (NUREG/CR-1916). Therefore, the expected.number of non-NMP-2 accidental fatalities per year within the 16-km (10-mile)and 48-km (30-mile) regions are 28 and 140, respectively, in the year 2010.Thus, the risk of early fatality with supportive orminimal medical treatmentfrom reactor accidents at NMP-2 is extremely small compared with that fromnon-NMP-2 accidents. Again, the reduced projected population would reduce thecalculated risks.
Figure 5.10 shows the calculated risk expressed as whole-body dose to an indi-vidual from early exposure as a function of the downwind distance from theplant within 80 km of the plant. The values are on a per-reactor-year basis,and all accident sequences and release categories contributed to the dose,weighted by their associated probabilities.
Evacuation and other protective actions can reduce the risk to an individualof early fatality or of latent cancer fatality. Figure 5.11 shows lines ofconstant risk, per reactor-year, to an individual living within the emergencyplanning zone of the NMP-2 site, of early fatality (as functions of distance)resulting from potential accidents in the reactor. The calculated risk ofearly fatality outside the 16-km radius is zero. Figure 5.12 shows curves ofconstant risk of latent cancer fatality. Directional variations in theseplots reflect the variation in the average fraction of the year the wind wouldbe blowing in different directions from the plant. For comparison, the follow-ing risks of fatality per year to an individual living in the United Statesmay be noted (Nat'l Research Council, 1979, page 577): automobile accident2.2 x 10-4, falls, 7.7 x 10-S; drowning, 3.1 x 10-S; burning, 2.9 x 10-S; andfirearms, 1.2 x 10-s. For comparison to the estimated latent cancer fatalityrisk to an individual from NMP-2 reactor accidents, note that the non-nuclear-*related risk of cancer fatality in the U.S. is 0.0019 per year (AmericanCancer Society, 1981).
A severe accident that requires the interdiction and/or decontamination ofland areas will force numerous businesses to temporarily or permanently close.These closures would have additional economic effects beyond the contaminatedareas through the disruption of regional markets and sources of supplies. Thefollowing paragraphs provide estimates of these impacts that were made using:(1) the RSS consequence model discussed elsewhere in this section, and (2) theRegional Input-Output Modeling System (RIMS II) developed by the Bureau ofEconomic Analysis (BEA).
NMP-2 FES 5-45

The industrial impact model developed by BEA takes into account contaminationlevels of a physically affected area defined by the RSS consequence model.Contamination levels define an interdicted area immediately surrounding theplant, followed by an area of decontamination, -an area of crop interdiction,and finally an area of milk interdiction. (The industry-specific impacts areestimated for areas representative of the accident sequences listed inTable 5.8.)
Assumptions used in the analysis include.
In the interdicted area, all industries would lose total production formore than a year.
In the decontamination zone, there would be a 3-month loss in nonagri-cultural output; a 1-year loss in all crop output (except no loss ingreeenhouse, nursery, and forestry output); a 3-month loss in dairyoutput; and a 6-month loss in livestock and poultry output.
In the crop-interdiction area, there would be no loss in nonagriculturaloutput; a 1-year loss in agricultural output, except no loss in green-house, nursery, and forestry output; no loss in livestock and poultryoutput; and a 2-month loss of dairy output.
In the milk-interdiction zone, there would be only a 2-month loss indairy output.
The estimates of industrial impacts are made for an economic study area thatconsists of a physically affected area and a physically unaffected area. Anaccident which causes an adverse impact in the physically affected area (forexample, the loss of agricultural output) could also adversely affect output inthe physically unaffected area (for example, food processing). In addition tothe direct impacts in the physically affected area, the following additionalimpacts would occur in the physically unaffected area:
decreased demand (in the physically affected area) for output produced inthe physically unaffected area
decreased availability of production inputs purchased from the physicallyaffected area
Only the impacts occurring during the first year following an accident are con-sidered. The longer term consequences are not considered because they willvary widely depending on the level and nature of efforts to mitigate the acci-dent consequences and to decontaminate the physically affected areas. Theestimates assume no compensating effects such as the use of unused capacity i-nthe physically unaffected area to offset the initial lost production in thephysically unaffected area or income payments to individuals displaced fromtheir jobs that would enable them to maintain their spending habits. Thesecompensating effects would reduce the industrial impacts. Realistically,these compensating effects would occur over a lengthy period. The estimatesusing no compensating effects are the best measures of first-year economicimpacts.
NMP-2 FES 5-46

Table 5.13 presents the regional economic output and employment impacts andcorresponding expected risks associated with the different release categories.The estimated overall risk values using output losses as the measure of acci-dent consequences, expressed in a per-reactor-year basis, is $3600. Thisnumber is composed of direct impacts of $1300 in the nonagricultural sectorand $1900 in the agricultural sector, and indirect impacts of $400 fromdecreased export and supply constraints. The corresponding expected employ-ment loss per reactor year is about one-third of a job.
It should be noted that about 20% of the expected losses or $694 results fromreleases occurring toward the south-southeast. On an absolute basis, theimpacts from the series IV (IV-T/DW, etc.) category releases to the west-south- .
west are the greatest and would result in a loss of $2.8 billion and 120,000jobs. The corresponding per-reactor-year risk is $350. Releases from the westthrough the north-northeast along Lake Ontario contribute nothing to the totalexpected loss.
The staff has also considered the health care costs resulting from hypotheticalaccidents in a generic model developed by Pacific Northwest Laboratory (Nieves,1983). Based on this generic model, the staff concludes that such costs may bea fraction of the offsite costs evaluated herein, but that the model is notsufficiently constituted for application to a specific reactor site.
There are other risks that can be expressed pecuniarily that are not includedin the cost calculations discussed earlier. These are accident impacts to thefacility itself that result in added costs to the public. These costs wouldderive from decontamination and repair of the facility as well as from increasedexpenditures for replacement power while the unit is out of service. Experiencewith such costs is currently being accumulated as a result of the TMI-2 accident.
If an accident occurs during the first full year of operation of NMP-2, theassociated economic penalty is estimated to total approximately $1900 million(1987 dollars) for decontamination and repair of the facility. This estimateis based on a conservative (high cost) 10% annual escalation of the $950 mil-lion (1980 dollars) repair cost estimate for TMI-2 (Comptroller General, 1981).Although insurance would cover $300 million or more of the repair costs, theinsurance is not credited against this cost because the $300 million times therisk probability should theoretically balance the insurance premium. Increasedannual production expenses will also be incurred by the New York Power Poolafter a plant accident.
The staff requested the applicant to prepare a system cost analysis that showsthe impact on production expenses resulting from the unavailability of NMP-2(see the applicant's response to staff question No. 320.1, which was submittedunder separate cover September 9, 1983). The staff's view is that the applicant'sanalysis provides a reasonable estimate of the Pool's increased annual productioncost if NMP-2 is not available for service. The study indicates this increasedcost will total approximately $160 million (1987 dollars) per year. The esti-mate assumes a conservatively high capacity factor of approximately 70% forNMP-2. The: analysis also assumes replacement power will come primarily fromcoal-fueled units and interstate purchases. If it is assumed that the nuclearunit is unavailable for service for an 8-year period, replacement power costswill total about $1300 million (constant 1987 dollars).
NMP-2 FES 5-47

The probability of a core melt or severe reactor damage is assumed to be about1.1 x 10-1 per reactor-year. (This accident probability is intended to accountfor all severe core damage accidents leading to large economic consequencesfor the owner, not just those leading to significant offsit.e consequences.)Multiplying the sum of the previously estimated repair and replacement powercosts of approximately $3100 million for an accident to the unit during theinitial year of its operation by the above 1.1 x 10⁻⁴ probability results inan economic risk of approximately $350,000 during the first full year (1987dollars, or, for the purpose of comparison with other costs presented in thissection, $180,000 in 1980 dollars). This is also the approximate economicrisk (in 1987 dollars) to NMP-2 during each subsequent year of operation,although this amount will gradually decrease as the nuclear unit depreciatesin value and operates at a reduced annual capacity factor.
(7) Uncertainties
The probabilistic risk assessment discussed above has been based mostly on themethodology in the RSS, which was published in 1975. Although substantialimprovements have been made in various facets of the RSS methodology sincethis publication was issued, there are still large uncertainties in the resultsof the analysis presented above because of the uncertainties associated withthe likelihoods of the accident sequences and containment failure modes leadingto the release categories, the source terms for the release categories, andthe estimates of environmental consequences.
Relatively more important contributors to uncertainties in the results pre-sented in this supplement are as follows:
Probability of Occurrence of Accident
If the probability of a release category were to be changed by a certainfactor, the probabilities of various types of consequences from that re-lease category would also change exactly by the same factor. Thus, anorder of magnitude uncertainty in the probability of a release categorywould result in an order of magnitude uncertainty in both societal andindividual risks stemming from the release category. As in the RSS,there are substantial uncertainties in the probabilities of the releasecategories. This is due, in part, to difficulties associated with thequantification of human error and to inadequacies in (1) the data base onfailure rates of individual plant components, and (2) the data base onexternal events and their effects on plant systems and components thatare used to calculate the probabilities.
Quantity and Chemical Form of Radioactivity Released
The models used in these calculations contain approximations to describethe physical behavior of the radionuclides, which affects the transportwithin the reactor vessel and other plant structures and the amounts ofrelease. This relates to the quantity and chemical form of each radio-nuclide species that would be released from a reactor unit during aparticular accident sequence. Such releases would originate in the fueland would be attenuated. by physical and chemical processes enroute to theenvironment. Depending on the accident sequence, immobilization or holdupof radionuclides in the reactor vessel, the primary cooling system, the
NMP-2 FES 5-48

containment, and adjacent buildings would influence both the magnitude andchemical form of radioactive releases. The releases of radionuclides to theenvironment, called source terms, used in the staff analysis were based onthose determined from the staff's review of Limerick (see Appendix H), aBWR of very similar design. This analysis used RSS methodology. Informa-tion available in NUREG-0772 indicates that best-estimate source terms can-not be much greater than the larger source terms used in this analysis(release categories IV-T/DW and IV-T/WW of Table 5.8), but they could besubstantially lower (except for noble gases) than the release categoriesused here for.the same types of initiating accident sequences. On theother hand, some of the lower release fractions shown in Table 5.8 couldbe revised upward after further analysis, primarily because of the mannerin which the source term was evaluated for early releases using the RSSmethodology. The impact of smaller source terms would be substantiallylower estimates of health effects, particularly early fatalities andinjuries.
Atmospheric Dispersion Modeling for the Radioactive Plume Transport,Including the Physical and Chemical Behavior of Radionuclides inParticulate Form in the Atmosphere
This uncertainty is due to differences between the modeling of the atmo-spheric transport of radioactivity in gaseous and particulate states inthe CRAC code and the actual transport, diffusion, and deposition orfallout that would occur during an accident (including the effects ofprecipitation). The phenomenon of plume rise because of heat that isassociated with the atmospheric release, effects of precipitation on theplume, and fallout of particulate matter from the plume all have consider-able impact on both the magnitude of early health consequences and thedistance from the reactor to which these consequences would occur. Thestaff judgment is that these factors can result in substantial overesti-mates or underestimates of both early and later effects (health andeconomic).
Errors of Completeness, Modeling, Arithmetic, and Omission
This area of lumped uncertainty includes such topics as the omission of amodel of sabotage, consideration of externally initiated accidents (exceptloss of offsite power), common cause failures, improvements in design oroperating criteria undertaken or to be undertaken by the applicant,potential errors in the different models used to assess risks, errorsassociated with applying analyses from Limerick to NMP-2 (see Appendix H),statistical errors, and arithmetic errors. The impact on risk estimatesof this class of uncertainty could be large, but is unknown and virtuallyimpossible to quantify. accurately (Rowsome, 1982). Uncertainties of thistype are expected to be larger than for other reactors for which compre-hensive probabilistic risk assessments were performed.
Other areas that have substantial but relatively less effect on uncertaintythan the preceding items are
NMP-2 FES 5-49

Duration and Energy of Release, Warning Time, and Inplant RadionuclideDecay Time
The assumed release duration, energy of release, and the warning and theinpiant radioactivity decay times may differ from those that would actu-ally occur duri~ng a rea~l accident.
For a relatively long duration atmospheric release (greater than a half-hour), the actual cross-wind spread (the width) of the radioactive plumethat would develop would be likely to be larger than the width calculatedby the dispersion model in CRAG. However, the effective width of theplume is calculated in the code using a plume expansion factor that isdetermined by the release duration. For a given quantity of radionuclidesin a release, the plume and, therefore, the area that would come underits cover would become wider if the release duration were made longer.In effect, this would result in lower air and ground concentrations ofradioactivity but a greater area *of contamination.
The thermal energy associated with the release affects plume rise. Largerthermal energy results in relatively lower air and ground concentrationsin the closer regions and relatively higher concentrations 'as a resultof fallout in the more dista -nt regions. Therefore, if a large amount ofthermal energy were associated with a release containing large fractionsof the core inventory of radionuclides, the distance from the reactorover which early health effects may occur is likely to be increased.
Warning time before evacuation has considerable impact on the effective-ness of offsite emergency response. Longer warning times would improvethe effectiveness of the response.
The time from reactor shutdown until the beginning of the release to theenvironment (atmosphere), known as the time of release, is used to calcu-late the depletion of radionuclides by radioactive decay within the plantbefore release. The depletion factor for each radionuclide (determined.by the radioactive decay constant and the time of release) multiplied bythe release fraction of the radionuclide and its core inventory deter-mines the actual quantity of the radionuclide released to the environment.Longer release times would result in release of fewer curies to theenvironment for given values of release fractions.
The first three of the parameters discussed above can have significantimpacts on accident consequences, particularly early consequences. Thestaff judgment is that the estimates of early consequences and risksco'uld be substantial underestimates or substantial overestimates, becauseof uncertainties in the first three parameters.
Meteorological Sampling Scheme Used
The meteorological sequences used with the selected 91 start times(sampling) in the CRAG code may not adequately represent all meteorological.variations that may occur over the life of the-plant. This factor isjudged to produce greater uncertainties for early effects and less forlatent effects.
NMP-2 FES 555-50

Emergency Response Effectiveness
The modeling assumptions of the emergency response of the people residingaround the NMP-2 site may not correspond to what would happen during anactual severe reactor accident. Included in these considerations aresuch subjects as evacuation effectiveness under different circumstances,possible sheltering and its effectiveness,' and the effectiveness ofpopulation relocation. The staff judgment is that the uncertaintiesassociated with emergency response effectiveness could cause large uncer-tainties in estimates of early health consequences. The uncertainties inestimates of latent health consequences and costs are considered smallerthan those of early health consequences. A limited sensitivity analysisin this area is presented in Appendix I.
Dose Conversion Factors and Dose Response Relationships for Early HealthConsequences, Including Benefits of Medical Treatment
There are many uncertainties associated with estimates of dose and earlyhealth effects on individuals exposed to high levels of radiation.Included are the uncertainties associated with the conversion of contami-nation levels to doses, relationships of doses to health effects, andconsiderations of the availability of what was described in the RSS assupportive medical treatment (a specialized medical treatment program oflimited availability that would help minimize the early health effectconsequences of high levels of radiation exposure following a severereactor accident). The staff analysis shows that the variation in esti-mates of early fatality risks stemming from considerations of supportivemedical treatment alone is about a factor of 3 for the NMP-2 site.
Dose Conversion Factors and Dose Response Relationships for Latent HealthConsequences
In comparison to early health effects, there are even larger uncertaintiesassociated with dose estimates and latent (delayed and long-term) healtheffects on individuals exposed to lower levels of radiation and the effectson their succeeding generations. Included are the uncertainties associatedwith conversion of contamination levels to doses and doses to health effects.The staff judgment is that this category has a large uncertainty. Theuncertainty could result in relatively small underestimates of conse-quences, or 'it could result in substantial overestimates of consequences.
Chronic Exposure Pathways, Including Environmental Decontamination and theFate of Deposited Radionuclides
Uncertainties are associated with chronic exposure pathways to peoplefrom long-term use of the contaminated environment. Uncertainty alsoarises from the possibility that the protective action guide levels that.may actually be used for interdiction or decontamination of the exposurepathways may differ from those assumed in the staff analysis. Further,uncertainty arises as a result of the lack of precise knowledge about thefate of the radionuclides in the environment as influenced by such naturalprocesses as runoff, weathering, etc. The staff's qualitative judgmentis that the uncertainty from these considerations is substantial.
NMP-2 FES 555-51

Economic Data and Modelinq
There are uncertainties in the economic parameters and economic modeling,such as costs of evacuation, relocation, medical treatment, cost ofdecontamination of properties, and other costs of property damage.Uncertainty in this area could be substantial.
Fission Product Inventory
The fission product inventory presented in Table 5.6 is an approximationof that that would be present after extended operation at maximum power.The amount of each isotope listed will, in fact, vary with time in amanner dependent upon the fuel management scheme and the power history ofthe core. The actual inventory at the time of an accident could not bemuch larger for any isotope than the amount in Table 5.6, but, especiallyfor long-lived fission products, it couldbe substantially smaller.
The means for quantitative evaluation of the uncertainties in a probabilisticrisk analysis such as the type presented here are not well developed. Thestaff, however, has attempted to identify all sources of uncertainty, and toassess the net effect upon the uncertainty of the risk estimates. The riskestimates are equal to the integrals of the corresponding probability distribu-tions of the consequences (CCDFs). As a result, errors in probabilities andconsequences are partially offset. Because of the magnitude of uncertainties,the staff has concluded that estimates of the probabilities, consequences, andrisks do not provide an accident perspective unless the uncertainties are alsoconsidered. It follows, therefore, that conclusions relating to the estimatedvalue of a particular risk or consequence (e.g., the per-reactor-year chanceof early fatality, or the number of early fatalities expected for a particularaccident sequence, respectively) should be based also on the uncertaintiesassociated with the estimates. Overall, it is the judgment of the staff thatthe risk uncertainty bounds could be well over a factor of 10 but not as largeas a factor of 100.
When the-accident at TMI-2 occurred in March 1979, the accumulated experiencerecord was about 400 reactor-years. It is of interest to note that one per400 reactor-years was within the range of frequencies estimated by the RSS foran accident of this severity (Nat'l Research Council, 1979, page 553).
It should also be noted that the TMI-2 accident has resulted in a very compre-hensive evaluation of similar reactor accidents by a number of investigativegroups both within and outside of the NRC. Actions to improve the safety ofnuclear power plants have resulted from these investigations, including thePresident's Commission on the Accident at Three Mile Island, and from NRC staffinvestigations and task forces. A comprehensive "NRC Action Plan Developed asa Result of the TMI-2 Accident" (NUREG-0660, Vol I) collects the various recom-mendations of these groups and describes them under the subject areas of: Opera-tional Safety; Siting and Design; Emergency Preparedness and Radiation Effects;Practices and Procedures; and NRC Policy, Organization, and Management. NUREG-0737, "Clarification of TMI Action Plan Requirements," and Supplement 1 toNUREG-0737 identified those requirements that were approved for implementation.The action plan presents a sequence of actions, some already taken, that resultsin gradually improving safety as individual actions are completed. NMP-2 is
NMP-2 FES 5-52

receiving and will receive the benefit of these actions on the schedule to bediscussed in the SER. The improvement in safety from these actions has notbeen quantified, however.
(8) Comparison of NMP-2 Risks with Other Plants
To provide a perspective as to how NMP-2 compares in terms of risks fromsevere accidents with some of the other nuclear power plants that are eitheroperating or that are being reviewed by the staff for possible issuance of alicense to operate, the estimated risks from severe accidents for severalnuclear power plants (including those for NMP-2) are shown i.n Figures 5.13through 5.21 for three important categories of risk. The values for individualplants are based upon three types of estimates: from the RSS (labeledWASH-1400 Average Plant), from independent staff reviews of contemporaryprobabilistic risk assessments (Indian Point 2 and 3, Zion, and Limerick), andfrom generic applications of RSS methodology to reactor sites for environmentalstatements by the staff (for 25 nuclear power plants). Figure 5.13 indicatesthat the calculated risk of early fatality at NMP-2 is about at the median ofthe plants evaluated. Figures 5.16 and 5.19 show that the calculated risk oflatent cancer fatalities and person-rems at NMP-2 is slightly higher than themedian of the plants evaluated. Figures 5.14, 5.15, 5.17, 5.18, 5.20, and 5.21explicitly show the ranges of estimateduncertainties for the three measuresof risk.
5.9.4.6 Conclusions
The foregoing sections consider the potential environmental impacts from acci-dents at the NMP-2 station,. These impacts have covered a broad spectrum ofpossible accidental releases of radioactive materials into the environment byatmospheric and liquid pathways. Included in the considerations are postulateddesign-basis accidents and more severe accident sequences that lead to a severelydamaged reactor core or core melt. The applicant also considered similar acci-dents in the ER-OL. The staff, however, did not make use of'the applicant'sanalysis.
The environmental impacts that have been considered include potential radia-tion exposures to individuals and to the population as a whole, the estimatedlikelihood of core-melt accidents, the risk of near- and long-term adversehealth effects that such exposures could entail, and the potential economicand societal consequences of accidental contamination of the environment.These impacts could be severe, but the likelihood of their occurrence isjudged to be small and the resulting risks are comparable to that of otherreactors. This conclusion is based on (1) the fact that considerable experi-ence has been gained with the operation of similar facilities without signifi-cant degradation of the environment; (2) the fact that, to obtain a license tooperate, the NMP-2 station must comply with the applicable Commission regula-tions and requirements; (3) a comparison with the estimated core-melt probabili-ties of other reactors; and (4) a probabilistic assessment of the risk basedupon the methodology developed in the RSS, improvements to the RSS methodology,and a sensitivity analysis of offsite emergency response modeling. The overallassessment of environmental risk of accidents, assuming protective actions,shows that the risks of population exposure and latent cancer fatality arewithin a factor of 9 of those from normal operation. Accidents have a poten-tial for early fatalities and economic costs that cannot arise from normal
NMP-2 FES 5-53

operations; however, the risks of early fatality from potential accidents atthe site are small in comparison with risks of early fatality from other humanactivities in a comparably sized population, and the accident risk will notadd significantly to population exposure and cancer risks. Accident risksfrom NMP-2 are expected to be a small fraction of the risks the general publicincurs from other sources. Further, the best estimate calculations show thatthe risks of potential reactor accidents at NMP-2 are within the range of suchrisks from other nuclear power plants. Lastly, the projected population forthe NMP-2 mid-life year was reduced after accident consequence estimates weremade. The staff did not revise the consequence calculations on this basis,but had it done so, the predicted early and late health effects would havedecreased noticeably. The staff's conclusion that the accident risks fromNMP-2 are small fractions of risks the general public incurs from othersources remains unchanged.
Based on the foregoing considerations of environmental impacts of accidents,which have not been found to be significant, the staff has concluded that thereare no special or unique circumstances about the NMP-2 site and environs thatwould warrant consideration of alternatives for NMP-2.
5.10 Impacts from the Uranium Fuel Cycle
The uranium fuel cycle rule, 10 CFR 51.51 (49 FR 9352) reflects the latest infor-mation relative to the reprocessing of spent fuel and to radioactive wastemanagement, as discussed in NUREG-0116, "Environmental Survey of the Reprocess-ing and Waste Management Portions of the LWR Fuel Cycle," and NUREG-0216, whichpresents the staff responses to comments on NUREG-0116. The rule also considersother environmental factors of the uranium fuel cycle, including aspects ofmining and milling, isotopic enrichment, fuel fabrication, and management oflow- and high-level wastes. These are described in the AEC report WASH-1248,"Environmental Survey of the Uranium Fuel Cycle." The NRC staff was alsodirected to develop an explanatory narrative that would convey in understand-able terms the significance of releases in the table. The narrative was alsoto address such important fuel cycle impacts as environmental dose commitmentsand health effects, socioeconomic impacts, and cumulative impacts, where theseare appropriate for generic treatment. A proposed explanatory narrative waspublished jn the Federal Register on March 4, 1981 (46 FR 15154-15175). Appen-dix C to this report contains a number of sections that address those impactsof the LWR-supporting fuel cycle that reasonably appear to have significancefor individual reactor licensing sufficient to warrant attention for NEPApurposes.
Table S-3 of the final rule is reproduced in its entirety as Table 5.14 herein.*Specific categories of natural resource use included in the table relate toland use, water consumption and thermal effluents, radioactive releases, burialof transuranic and high- and low-level wastes, and radiation doses from trans-portation and occupational exposures. The contributions in the table for
*The U.S. Supreme Court has upheld the validity of the S-3 rule in Baltimore Gas
& Electric Co., et al. v. Natural Resources Defense Council, Inc., No. 82-524,issued June 6, 1983, 51 U.S. Law Week 4678.
NMP-2 FES 5-54

reprocessing, waste management, and transportation of wastes are maximized foreither of the two fuel cycles (uranium only and no recycle); that is, the cyclethat results in the greater impact is used.
Appendix C to this report contains a description of the environmental impactassessment of the uranium fuel cycle as related to the operation of NMP-2. Theenvironmental impacts are based on the values given in Table S-3, and on ananalysis of the radiological impact for radon-222 and technetium-99 releases.
The NRC staff has determined that the environmental impact of this facility onthe U.S. population from radioactive gaseous and liquid releases (includingradon and technetium) due to the uranium fuel cycle is very small when comparedwith the impact of natural background radiation. In addition, the nonradio-logical impacts of the uranium fuel cycle have been found to be acceptable.
5.11 Decommissioning
The purposes of decommissioning are (1) to safely remove nuclear facilitiesfrom service and (2) to remove or isolate the associated radioactivity fromthe environment so that the part of the facility site is not permanently com-mited can be released for other uses. Alternative methods of accomplishingthese purposes and the environmental impacts of each method are discussed inNUREG-0586.
Since 1960, 68 nuclear reactors--including 5 licensed reactors that had beenused for the generation of electricity--have been or are in the process ofbeing decommissioned. Although, to date, no large commercial reactor hasundergone decommissioning, the broad base of experience gained from smallerfacilities is generally relevant to the decommissioning of any type of .nuclearfacility.
Radiation doses to the public as a result of end-of-life decommissioningactivities should be small; they will come primarily from the transportationof waste to appropriate repositories. Radiation doses to decommissioningworkers should be well within the occupational exposure limits imposed byregulatory requirements.
The NRC is currently conducting rulemaking proceedings that will develop amore explicit overall policy for decommissioning commercial nuclear facilities.Specific licensing requirements are being considered that include the develop-ment of decommissioning plans and financial arrangements for decommissioningnuclear facilities.
The applicant's estimate of decommissioning costs is in Section 6.4.3.
5.12 Noise
An evaluation of the impact of noise from NMP-2 was included in the 1981report on the environmental effects from the change in cooling systems.(Appendix G). The conclusions of that assessment remain valid.
NMP-2 FES 5-55

5.13 Emergency Planning Impacts
In connection with the promulgation of the Commission's upgraded emergencyplanning requirements, the NRC staff issued NUREG-0658, "Environmental Assess-ment for Effective Changes to 10 CFR Part 50 and Appendix E to 10 CFR Part 50;Emergency Planning Requirements for Nuclear Power Plants." The staff believesthe only noteworthy potential source of impacts to the public from emergencyplanning would be associated with the testing of the early notification system.
The test requirements and noise levels will be consistent with those used forexisting alert systems; therefore, the NRC staff concludes that the noiseimpacts from the system will be infrequent and insignificant.
5.14 Environmental Monitoring
5.14.1 Terrestrial Monitoring
In the analysis of the effects of changing the cooling system to a natural draftcooling tower (Appendix G), the staff concluded that no unacceptable botanicalinjury would result from the operation of the cooling tower (Appendix G, Sec-tion 5.1.3). The staff, nevertheless, believed it prudent to monitor for veri-fication of the analysis (ibid). With 3 more years of experience in analyzingeffects of cooling tower drift, the staff no longer believes it is necessary tomonitor for possible damage when the drift deposition is as low as predicted forNMP-2. Should damage to vegetation occur, the applicant is still required toinform the NRC and provide an analysis of the problem, as well as to propose acourse of action to alleviate the problem. This requirement will be specifiedin the Environmental Protection Plan (EPP) that will be included as an appendixto the operating license.
5.14.2 Aquatic Monitoring
The certification and permits required under the Clean Water Act provide themechanisms for protection of water quality and aquatic biological resources inthe vicinity of NMP-2. Aquatic monitoring will be required by the SPDESpermi't issued June 6, 1983 by the New York State Department of EnvironmentalConservation (Appendix E). The following are major provisions of that permitrelated to environmental monitoring at NMP-2:
(1) Effluent monitoring will be required for floor and equipment drains,cooling tower blowdown, and wastewater, including demineralizer regenera-tion wastes, filter backwash, floor drains, and treated radioactive waste(Appendix E, page 3).
(2) Effluent monitoring will be required for the discharge from the sanitarywaste treatment plant (Appendix E, page 4).
(3) Water use and intake/discharge temperatures will be monitored (Appendix E,page 7).
(4) The applicant shall submit to the state a plan of study to verify theextent of the thermal plume in Lake Ontario (Appendix E, page 9).
NMP-2 FES 5-56

(5) The applicant shall continue any biological studies in Lake Ontariorequired by regulatory agencies to monitor the effects of the station(Appendix E, page 9).
The NRC will rely on the decisions made by the State of New York, under theauthority of the Clean Water Act, for any aquatic monitoring or power plantdesign modification should that become necessary. An EPP that will be includedas an appendix to the operating license for NMP-.2 will contain requirementsfor prompt reporting to NRC by the licensee of any important or unusual eventsthat potentially could result in significant environmental impact causallyrelated to station operation. Examples of such events include fish kills;mortality of any species protected by the Endangered Species Act, as amended;increase in nuisance organisms or conditions; or any unanticipated or emer-gency discharge of waste water or chemical substances.
5.14.3 Atmospheric Monitoring
The pre-operational meteorological monitoring program described in the FSARhas provided wind speed and wind direction information measured at the 9-, 30-,and 61-m (30-, 100-, and 200-foot) levels.
Vertical temperature differences between the 8-m (27-foot) and 30-m (100-foot)level and the 8-m (27-foot) and 61-m (200-foot) level were also measured as anindicator of atmospheric stability to characterize gaseous effluent dispersion.In addition, dew point measurements were made on the tower at 8 m (25 feet),with precipitation and atmospheric pressure measured at ground level near thetower.
The operational meteorology program will utilize the primary 61-m (200-foot)tower used for pre-operational measurements with the addition of new sensorsat the same levels. To satisfy requirements for emergency preparednessmeteorological monitoring, a 27-m (90-foot) utility pole near the adjacentFitzPatrick plant provides backup wind-direction and speed measurements.Finally, an inland 10-m (33-foot) tower at the Oswego Airport provides windspeed and direction and the lateral change in wind direction (sigma-theta, abackup stability indicator).
5.15 References
American Cancer Society, "Cancer Facts and Figures," 1978.
--- , "Cancer Facts and Figures," 1981.
American National Standards Institute/American Nuclear Society, ANSI/ANS-5.1,"Decay Heat Power in Light Water Reactors," August 1979.
Blaylock, B. G., and J. P. Witherspoon, "Radiation Doses and Effects Estimatedfor Aquatic Biota Exposed to Radioactive Releases from LWR Fuel-Cycle Facil-ities," in Nuclear Safety, 17:351, 1976.
Bureau of Economic Analysis (BEA), "Regional Input-Output Modeling System(RIMS II)": see NUREG/CR-2591.
NMP-2 FES 5-57

Burian, R. J. and P. Cybulskis, "CORRAL 2 User's Manual," Battelle ColumbusLaboratories BCL report, January 1977.
Cannon, J. B., G. F. Cada, K. K. Campbell, D. W. Lee, and A. T. Szluha, "FishProtection at Steam-Electric Power Plants: Alternative Screening Devices,"ORNL/TM-6472, Oak Ridge National Laboratory, Oak Ridge, Tennessee, 1979.
Cartwright: see NUREG/CR-2591.
Codell, Richard, NRC, written staff testimony on Commission Question 1,Section Il1.D, on Liquid Pathway Considerations, for the Atomic Safety andLicensing Board Special Hearing on Indian Point June 1982 - April 1983.
Comptroller General of.the U.S., "Report to the Congress," Office of the Comp-troller General, EMD-81-106, August 26, 1981.
Crick, M. J., and G. S. Linsley, "An Assessment of the Radiological Impact ofthe Windscale Reactor Fire," National Radiological Protection Board NRPB-R135,1982.
Elliot, D. A., Andrulis Research Corp., Task 5 letter report to Ms. A. Chu,NRC, on Technical Assistance Contract NRC-03-82-128, December 13, 1982.
Federal Emergency Management Agency, "Flood Insurance Study Town of Scriba,New York, Oswego County," 1981.
Harris, V. A., et al., "Accident Mitigation: Alternative Methods forIsolating Contaminated Groundwater," Argonne National Laboratory, September1982b.
'"Accident Mitigation: Slurry Wall Barriers," Argonne National Laboratory,May 1982a.
International Commission on Radiological Protection (ICRP), "Recommendationsof the International Commission on Radiological Protection," ICRP Publica-tion 26., January 1977.
Isherwood, Dana, "Geosciences Data Base Handbook for Modeling a Nuclear WasteRepository," Lawrence Livermore Laboratory, NUREG/CR-0912, January 1981.
Land, C. E., Science, 209:1197, September 12, 1980.
Lawler, Matusky, and Skelly Engineers, "Evaluation of the Angled Screen FishDiversion System at Oswego Steam Station Unit 6," Research Project No. EC 104,Pearl River, New York, 1984.
--- , "Oswego Steam Station SPDES Aquatic Monitoring Program, April 1981 -March 1983," Pearl River, New York, 1983.
Lee, J. M., Jr., J. H. Brunke,-G. E. Lee, G. L. Reiner, F. L. Shon, "Electricaland Biological Effects of Transmission Lines: A Review," U.S. Department ofEnergy, Portland, Oregon, 1982.
NMP-2 FES 5-58

Mangan, C. V., Niagara Mohawk Power Corporati.on, letter to D. G. Eisenhut, NRC,November 20, 1984.
Mattice, J. S., "Power Plant Discharges: Toward More Reasonable EffluentLimits on Chlorine," in Nuclear Safety, 18:802-819, 1977.
National Academy of Sciences/National Research Council, Committee on theBiological Effects of Ionizing Radiations, BEIR I, "The Effects on Populationsof Exposure to Low Levels of Ionizing Radiation," November 1972.
--- , BEIR III, "The Effects on Populations of Exposure to Low Levels of Ioniz-ing Radiation," July 1980.
National Council on Radiation Protection (NCRP), "Review of the Current Stateof Radiation Protection Philosophy," NCRP Report 43, January 1975.
National Research Council, "Energy in Transition 1975 - 2010, Final Report ofthe Committee on Nuclear and Alternative Energy Systems," 1979.
Nieves, L.A., et al., "Estimating the Economic Costs of Radiation-InducedHealth Effects," Battelle Pacific Northwest Laboratories, PNL-4664, November1983.
Parsons, Brinckerhoff, Quade, and Douglas, Inc., "Evacuation Time Estimates forAreas Near the Site of James A. FitzPatrick and Nine Mile Point Plants," reportprepared for Niagara Mohawk Power Corporation, December 1980.
--- , "Evacuation Travel Time Estimates for the James A. FitzPatrick/Nine MilePoint Emergency Planning Zone," report prepared for Niagara Mohawk Power Corpora-tion, May 1984.
President's Commission on the Accident at Three Mile Island, "Report of thePresident's Commission on the Accident at Three Mile Island," CommissionFindings B, Health Effects, October 1979.
Oak Ridge National Laboratory, "Descriptions of Selected Accidents thatOccurred at Nuclear Reactor Facilities," ORNL/NSIC-176, April 1980.
Rowsome, Frank H., NRC, direct testimony before the Atomic Safety and LicensingBoard in the matter of Consolidated Edison of New York and the Power Authorityof the State of New York on the accuracy of the risk assessment for Indian Point,Units 2 and 3, Commission Question 1, February 18, 1983.
--- , and Roger Blond, NRC, direct testimony before the Atomic Safety and Licens-ing Board in the matter of Consolidated Edision of New York and the PowerAuthority of the State of New York on comparative risk of Indian Point Units 2and 3, Commission Question 5, April 5-8, 1983.
Sandia Laboratories, "A Model of Public Evacuation for Atmospheric RadiologicalReleases," SAND-78-0092, June 1978.
Stout, I. J. and G. W. Cornwell, "Nonhunting Mortality of Fledged North AmericanWaterfowl," in Journal of Wildlife Management, 40:681-693, 1976.
NMP-2 FES 5-59

Thompson, T. J., and J. G. Beckerley, The Technology of Nuclear Reactor Safety,Vol 1, The MIT Press, Cambridge, Massachusetts, 1964.
United Kingdom Atomic Energy Office, "Accident at Windscale," 1957.
United Nations Scientific Committee on the Effects of Atomic Radiation (UNSCEAR),"Ionizing Radiation: Sources andBiological Effects," 1982.
U.S. Atomic Energy Commission, WASH-1248, "Environmental Survey of the UraniumFuel Cycle," April 1974.
U.S. Department of Health and Human Services, "Accidental Radioactive Contamina-tion of Human Food and Animal Feeds: Recommendations for State and LocalAgencies,".in Federal Register, 47 FR 47073,.October 22, 1982.
U.S. Environmental Protection Agency, "Manual of Protective Action Guides andProtective Actions for Nuclear Incidents," EPA-520/1-75-O01, September 1975.
U.S. Nuclear Regulatory Commission, "Nuclear Power Plant Accident Considera-tions Under the National Environmental Policy Act of 1979," in Federal Register,45 FR 40101-40104, June 13, 1980.
--- , NUREG-75/014, "Reactor Safety Study--An Assessment of Accident Risks inU.S. Commercial Nuclear Power Plants," October 1975 (formerly WASH-1400).
--- , NUREG-0016, F. P. Cardile and R. R. Bellamy (editors), "Calculation ofRadioactive Materials in Gaseous and Liquid Effluents from Boiling WaterReactors," Revision 1, January 1979.
--- , NUREG-0116 (Supplement 1 to WASH-1248), "Environmental Survey of theReprocessing and Waste Management Portions of the LWR Fuel Cycle," October 1976.
--- , NUREG-0216 (Supplement 2 to WASH-1248), "Public Comments and Task ForceResponses Regarding the Environmenta.l Survey of the Reprocessing and WasteManagement Portions of the LWR Fuel Cycle," March 1977.
--- , NUREG-0340, "Overview of the Reactor Safety Study Consequences Model,"October 1977.
--- , NUREG-0440, "Liquid Pathway Generic Study," February 1978.
--- , NUREG-0558, "Population Dose and Health Impact of the Accident at theThree Mile Island Nuclear Station," May 1979.
--- , NUREG-0586, "Draft Generic Environmental Impact Statement on DecommissioningNuclear Facilities," January 1981.
NUREG-0651, "Evaluation of Steam Generator Tube Rupture Accidents," March1980.
--- , NUREG-0654, Revision 1, "Criteria for Preparation and Evaluation ofRadiological Emergency Response Plans and Preparedness in Support of NuclearPower Plants," November 1980 (also issued as FEMA-REP-1).
NMP-2 FES 5-60

--- , NUREG-0658, "Environmental Assessment for Effective Changes to 10 CFR 50and Appendix E to 10 CFR 50: Emergency Planning Requirements for Nuclear PowerPlants," August 1980.
--- , NUREG-0660, "NRC Action Plan Developed as a Result of the TMI-2 Accident,"Vol I, May 1980.
--- NUREG-0713, B. G. Brooks, "Occupational Radiation Exposure at CommercialNuclear Power Reactors 1981," Vol 3, November 1982.
198,.NUREG-0737, "Clarification of TMI Action Plan Requirements," November1980.
--- NUREG-0769, "Final Environmental Statement Related to the Operation ofEnrico Fermi Atomic Power Plant, Unit No. 2," Addendum No. 1, March 1982.
--- NUREG-0772, "Technical Bases for Estimated Fission Product BehaviorDuring LWR Accidents," June 1981.
--- , NUREG-0773, "The Development of Severe Reactor Accident Source Terms:
1957-1981," R. Blond et al., November 1982.
--- , NUREG-0800, "Standard Review Plan," July 1981 (formerly NUREG-75/087).
--- , NUREG-0974, "Final Environmental Statement Related to the Operation ofLimerick Generating Station, Units 1 and 2," April 1984.
--- , NUREG/CR-0400, H. Lewis et al., "Risk Assessment Review Group Report tothe U.S. Nuclear Regulatory Commission," September 1978.
--- , NUREG/CR-0912: see Isherwood.
--- , NUREG/CR-1250, Special Inquiry Group, "Three Mile Island - A Report tothe Commissioners and the Public," Vol I, Summary Section 9, Mitchell Rogovin,Director, January 1980.
NUREG/CR-1711, "MARCH Code Description and User's Manual," R. 0. Wootenand H. I. Avci, Battelle Columbus Laboratories, October 1980.
, NUREG/CR-1916, "A Risk Comparison," A. Coppola and R. E. Hall, BrookhavenNational Laboratory, February 1981.
--- , NUREG/CR-2300, "PRA Procedures Guide," Final Report, American NuclearSociety and the Institute for Electrical and Electronics Engineers, January1983.
--- , NUREG/CR-2591, "Estimated Potential Industrial Impacts of a NuclearReactor Accident: Methodology and Case Studies," J. V. Cartwright, et al.,April 1982.
--- , NUREG/CR-3185, "Critical Review of the Reactor Safety Study RadiologicalHealth Effects Model," Sandia National Laboratories, March 1983 (also issued asSAND-82-7081).
NMP-2 FES 5-61

--- , RG 1.21, "Measuring, Evaluating and Reporting Radioactivity in SolidWastes and Releases of Radioactive Materials in Liquid and Gaseous Effluentsfrom Light-Water-Cooled Nuclear Power Plants," Revision 1, June 1974.
--- , RG 1.109, "Calculation of Annual Doses to Man from Routine Releases ofReactor Effluents for the Purpose of Evaluating Compliance with 10 CFR Part 50,Appendix I," Revision 1, October 1977.
--- , RG 4.1, "Programs for Monitoring Radioactivity in the Environs of NuclearPower Plants," Revision 1, April 1975.
--- , RG 8.8, "Information Relevant to Ensuring that Occupational RadiationExposures at Nuclear Power Stations Will Be as Low as Is Reasonably Achievable,"Revision 3, June 1978.
NMP-2 FES 5-62

j%,31 260 i1
11 NORMAL-SHORE LINEm
~2-60'7
LrI 260
2600
210 - ~~~~LEGEND OEP ~ AC LC
0RNLGROUND CONTOUR
270LII(294F.NV
200 200 400 600
,,280- SCALE FEET
Figure 5.1 100-year floodplain, pre-construction

L 4.
DIKE ON2AR0O
nNORMAL SHORE LINE -
O-RG
m
UU
2 6 0 ' ~ 2 2 ~ ( \
200
0 20260 60
N\ONE PERCEN CHANCE FLOC
LIMIT (249.4 FT. NGVD
RNEW GROUND CONTOUR
Figure 5.2 100-year floodplain, post construction

Figure 5.3 Potentially meaningful exposure pathways to individuals
NMP-2 FES 5-65

Figure 5.4 Schematic outline of atmospheric pathway consequence model
NMP-2 FES5-66

z10d 1010 10 106 107 10 ;
IU T .1 Ti7 TI--1- ---'' I 1 TI TI - 7- r- 1 . .11 - 1 1 .T... -I I- F TTI- 1. 1 I I1- -T -T 1|0
01010 --
01Q).
0
n Whole Body Dose > 25 r emnT•rldDs 300 ren- ,_' I .Dm , I_ II
• " " "N
Bon e lMr lDs le >120 1e 10X - Number of individuals
Figure 5.5 Probability distributions of individual dose impacts
NOTE: See Section 5.9.4.5(7) for a discussion of uncertainties.

10-3 10-106 601 11- I I Il 1 0I I 1 I K I I I I I I'I 1 I I I I !1 n I I I I III I I IlI I I I I 111 1 0
A -- ____1__11_14_
m '
X
A 104_I
0
-0:~ ............. __ ___ __ __ 10_
0
3 46
S10 10
Figur xpo ed5. P op robaiti t ditiuin ofpplainexoue
1 - - --- --- --- --- --- --
1o 10 . 101- 11 d
X-oa-e-o -rmW oeBd
Fiuel. rbbliydsrbtoso pplto xoue
NOTE: See Section 5.9.4.5(7) for a discussion of uncertainties.

.10l 101 12 103 le 16' 6d 10
~1~
(A
U,
1U F
X
A(f)
Q)
Q)
09
r)4-
D0
"0-
I I I I I II I I I I 'I l l ! I I I I I I I I I I I I I I I I I I I I I I • II • I i • I P I I I I L I I I I I I I I I I I I I I I I I I I I I I I I I I
10-4
o-5
_ 10-6
510
10-6I ' .1 -4
10
Ent Ie Po P. - FEx C r.iVEntire Poc. - Thyroid On!ýy-Within 50 Cm-1 L- , 1,Týý - "I~ r'od
V~tt50..- Th y . ,id -O
L 1 1
1-810-I
109-i Cl I I I I1II I I I I l II I ( I I I I )I I I I I I I I
1 0•l .1 KJ 10e 10 10i 10lX- Latent Cancer Fatolifies
10 10 -l
Figure 5.7 Probability distributions of cancer fatalities
NOTE: See Section 5.9.4.5(7) for a discussion of uncertainties.

X
I1
m
X
(A
L)-4-D
0CJ0
>--
=00~
-510
-6
-7
10 -108:
10 j-
f 10 102 10, 10, id lOe 10 10d- I IV I II I I I MT1 1 I I I IT I I I I I---- ----- I I III _ 10-5
-610
+ -710
IC- 8
U,
1,- 9
10 ° I I I I I I I I I I I I I II I I I I I I I I I I L I iI l1 I I I I i ii I I I 1 1111 i I I I II l -1011111111 L IllIllIl L.ILJL.I.LLLL £ ''''''1 _________________ £
l0 101 le• 1c3 1 e
X -- Early Fatcifitiesle le 10 10,
Figure 5.8 Probability distribution of early fatalities
NOTE: See Section 5.9.4.5(7) for a discussion of uncertainties.

0 io4 0 10b6,. 106 Idi ,i 10 4
x" 10-•0-
-~ I I I IIII I I -i--l- -l -. I-t-;---i.-..r-I --I -- v -i-----I --i--I --III I I I Ii 1 i II I1 I I I II 1 0
rn,
A
010
(n
00
101 1 10 1_ 10 1
I--
10 __ _ __ _ _
3:! 7 891
> , 1 0-1-01 0 01 1 1 0 -
X =Total Cosf in 1980 Dollars
Figure 5.9 Probability distribution of mitigation measures cost
NOTE: See Section 5.9.4.5(7) for a discussion of uncertainties.

IP\
-'
0 5 10 6 2M 25 30 35 40 46 50
DISTANCE IN MILES
Figure 5.10 Risk of individual dose (to those downwind) versus distance
NOTE: See Section 5.9.4.5(7) for discussion of uncertainties. Also notethat the 16-km (10-mile) distance marks the approximate limit of theplume exposure pathway Emergency Planning Zone. Within this radius,evacuation is assumed to begin after a 1.77-hour delay, but outsidethis'radius, persons are assumed to receive 12 hours of ground expo-sure before they move to an uncontaminated area. This accounts forthe sharp increase at 16 km, followed by a gradual decrease withdistance.
NMP-2 FES r_-4-I /

L.A KE
ONTA RIO
l.OxlO-7_ NMP 21.0x10⁷ SITE
10 mileradi us* city of
......COUNTY IPE.kFF SON ~ -
BoylstonSandy Creek
_ - ------ ' Redfield
I Orwell II SALMONPR, 0
Albionli co
E
Parish
L1
/
'A
LAKE .
"\.,0 3 .6 9
I I ISCALE-MILES
0 5 10 15
SCALE-KILOM ETERS
Figure 5.11 Lines of equal risk (isopleths) per reactor-yearof early fatality to an individual
*The calculated risk outside 16 km is zero.
NOTES: See Section 5.9.4.5(7) for discussion of uncertainties.To change miles to km, multiply the value shown by 1.6.
NMP-2 FES 5-73

5
LA KE 1.0x10_8
1.Oxl
5.OxI
10 miradiu
E/ V A Y- U ReaOtlld I >-1 -7 z•'.- _;
0.I Orwell DSITE -J I LLM ONR/VERI o".~~~ • , L•IE VOIR
le /
1-. OX ..
osI ois - 5. ro ep0eL __- I P rs
'0 V Ine /9 "_I""
I /~~il Hastings ""•.•
X1 - "" " I West I
a•'nnibal It, ''" Mo nroe/
by I S •,roe ppe I I / Const antio I
I I
ONONDAGA ONEIDA # L-
•- LAKE I
o 3 6 9I I I I
SCALE - MILES
0 5 1O 15I I
SCALE-KILOM ETERS
Figure 5.12 Lines of equal risk (isopleths) per reactor-year
of latent cancer fatality to an individual
*This 16-km radius marks the approximate boundary of the plumeexposure pathway Emergency Planning Zone. Evacuation is assumedto begin after a 1.77-hour delay within this radius, but outsidethis radius, persons are assumed to receive 12 hours of groundexposure. Therefore, the calculated risk increases just outside16 km, then continues to decrease with distance.
NOTES: See Section 5.9.4.5(7).for discussion of uncertainties.To change miles to km, multiply the value shown by 1.6.
NMP-2 FES 5-74

10-1
LEGEND:
* Plant-specific PRA* RSS methodology, NUREG-0773
+ Average of surrogate plantsa
10.2
a
a
10.3 0
0
0LuI.-C~t.,o
LM•"104
IU0.
z0
0.
.~U
0 0
0
000
0 0 0
0 00
a 0
0
0
0
00
10.6
I I I I I I I I I I I I I I I I I I I I I I I' I I L I I I
0 0 0 0
0.
0=
0
II
0.
000
0-
> . = 0mM U Q U
II
0z
N
LA.
C,*0
0
C,
C q.
0 ~ ~ 0 0
MJ ES.2 E
0 0X ~Z0. CfLUcfl Ml Ci
CLZ0
3: 3
C.,
Figure 5.13 Estimated early fatality risk with supportive medical treatment(persons) from severe reactor accidents for several nuclear powerplants either operating or receiving consideration for issuanceof a license to operate. See footnotes following Figure 5.21.
NMP-2 FES 5-75

10-1
w
0I,-
x
0.UL
z0
C,,0.
10-6
710 6 -
10.17
Figure 5.14
C Cn
C C
C
C0
F4
E
Estimated early fatality risk with supportive medical treatment(persons) from severe reactor accidents for nuclear power plantshaving plant-specific PRAs, showing estimated range of uncertain-ties. See footnotes at the end of Figure 5.21.
NMP-2 FES5-76

10-1
10,2
0l--
.Uj
0.
z0U,
C.
10-4
10-5
4
4
10.6
II. I10-
7 I I I I I I I I I I I I I I I I I I I I
II fI1::
II
00
Figure 5.15
0000
CNC 00--
0 c
C (O U U U. U.
C,
C0
C,
2,
0
0DC0
X.
0.0
0
C
2
0
.2
Ci
C 0
CL Cd CA)
NC40
-j
E
E
C M
0 Z C.,
z
Estimated early fatality risk with supportive medical treatment(persons) from severe reactor accidents, for several nuclear powerplants either operating or receiving conmdderation for issuanceof a license to operate for which site-specific applications ofNUREG-0773 accident releases have been used to calculate off-site consequences. Bars are drawn to illustrate effect ofuncertainty range discussed in text. See foot.iotes followingFigure 5.21.
5-77NMP-2 FES

in-IU
LEGEND:= Plant-specific PRA* RSS.methodology, NUREG-0773
+4- Average of surrogate plants
1.0
10-1
w
0
LM
C 10-2
z0r•IL
a
EagU
U 0
0U 0.0
00
0N 0 0
0 0 9 0 00 00
S -0
00
10.3
10-4
I I I I I I I I* I I I I I I I I I I I I I I I ~I I I I I -I_L_C.
0.HI 11 11 1cc Cu Mu C
05 '0
15 0'a "0 0
E E .2
Cu
E
CL
00
a 0 >u
cc M CO 3 0 0 Cu
C,
CCu
C,
=- .~=01
CuI
.2MCu
Cu0C0(4
CuC
Cu 0 Cu (Cu z. zC
Cua.
Figure 5.16 Estimated latent cancer fatality risk, excluding thyroid (persons),from severe reactor accidents for several nuclear power plantseither operating or receiving consideration for issuance of alicense to operate. See footnotes at the end of Figure 5.21.
NMP-2 FES 5-78

10
1.0
10-1
7 n
0 4
Cr.4
0CAccLUIL
4
10.2
10'3
10-4
10.5
Figure 5.17
I I
CL
C
(2
C
.0N~
co
E
Estimated latent cancer fatality risk, excluding thyroid (persons),from severe reactor accidents for nuclear power plants havingplant-specific PRAs, showing estimated range of uncertainties.See footnotes at the end of Figure 5.21.
NMP-2 FES 5'-79

10
1.0
T ~0I-
C-
0.U)z0(AMWCL
10"1
10.2
10.3
4-4
4I 4 4
4
I10'4
10-5I I I I I I I I I I I I I I I I I I I I I I I I
0.
C 0
0 a~ C N0 a
2 = E.a aCO MCO U U U u.
75
r
N
.~ 0.> a
0 1 00. * "C -
aaz
0V0
N
al
Ma C
E
z
Figure 5.18 Estimated latent cancer fatality risk, excluding thyroid (persons)from severe reactor accidents for several nuclear power plants
either operating or receiving consideration for issuance of a
license to operate for which site-specific applications of
NUREG-0773 accident releases have been used to calculate off-
site consequences. Bars are drawn to illustrate effect of
uncertainty range discussed in text. See footnotes at the endof Figure 5.21.
NMP-2 FES 5-80

1.0
10-1
10.2
LEGEND:
a Plant-specific PRA
0 RSS methodology, NUREG-0773
+ Average of surrogate plants
U
EuU U
a 0 0
0
0U-4W
C,,z
0-
U
U0 0 0
00
0 0a
0 0 00
a0 09 1
0
10.4
0e -
10.5
10-6 I I I I I I I I I I I I I I I I I I I I I I I I i I I I I I. . . . . . . . . .
t ii I I1 l11. 0 M M 0
CLC'
N 00
) CC
V V0 0 EE E i7 :
M
Ca
'00
C;0
0
0U
0.0
00
U
0
X
.0U
N
0.
V5C,
U)
,0 O, >
2t .C0z
.00.0
N0U2..1
U)
0SS2
CO
0
Q
2
CO
M.
t00:
N
z
C.)0.2
Figure 5.19 Estimated latent thyroid cancer fatality risk (persons) fromsevere reactor accidents for several nuclear power plants eitheroperating or receiving consideration for issuance of a licenseto ope'ate. See footnotes at the end of Figure 5.21.
NMP-2 FES 5-81

1.0
10-1
10-2
10.3
0I-
M.
z0
0.
10.5
10.6
Figure 5.20
I I 1I IICCrd
0. 0.
C C-C CNAc M
_Y.
E
Estimated latent thyroid cancer fatality risk (persons) fromsevere reactor accidents for nuclear power plants havingplant-specific PRAs, showing estimated range of uncertainties.See footnotes at the end of Figure 5.21.
NMP-2 FES 5-82

1.0
10.1
10-2
0
I-.(J
U.
LU0-
0U)
0.
10-3
10-4
10-6 1
Figure 5.21
ID M
- C "
- 0 * t -
operating or reevnaosdrto for isuac of a lens t
*a~_ CLC CLo O-J 0cc a0 aD A 0 . 0 0 ZZ
U U U. 00 U. W X X U) Z: 0.0 3: ;tu cl
Estimated latent thyroid cancer fatality risk (persons) fromsevere reactor accidents for several nuclear power plants eitheroperating or receiving consideration for issuance of a license tooperate for which site-specific applications of NUREG-0773 acci-dent releases have been used to calculate offsite consequences.Bars are drawn to illustrate effect of uncertainty range dis-cussed in text. See footnotes on following page.
NMP-2 FES 5-83

Notes for Figures 5.13 through 5.21
Except for Indian Point, Zion, Limerick, Braidwood, Hope Creek, NMP-2, andWNP-3, risk analyses for other plants in these figures are based onWASH-1400 generic source terms and probabilities for severe accidents anddo not include external event analyses. The staff and the applicantextensively reviewed Indian Point 2 and 3, Zion, and Limerick, includingexternally initiated accidents. The staff briefly reviewed Braidwood,Hope Creek, NMP-2, and WNP-3 to determine plant-specific release categoryprobabilities considering internal events only. Any or all of the valuescould be under- or over-estimates of the true risks.
t1 With evacuation within 16 km (10 miles) and relocation from 16 to 40 km(10 to 25 miles).
aExcluding severe earthquakes and hurricanes.
NOTE: See Section 5.9.4.5(7) for discussion of uncertainties.
NMP-2 FES 5-84

U) wet BulbTempera-ture I
0F)
Month
January 41.0(Max)21.5 (Avg)
-16.0 (Min|
February 43.0 (Max)23.0 (Avg)
-15.0 (Min)
March 57.0(Max)29.4 (Avg)-4.0(Min)
April 63.0(Max)41.5 (Avg)16.0 (Min)
May 76.0(Max)59.0(Avg)28.0 (Min)
June 71.0(Max)59.0 (Avq)36.0 (Min)
July 79.0(Max)63. 4(AVg)41.0 (Min)
August 79.0(max)62.4 (Avg)43.0 (Min)
September 76.0 (Max)56.2 (Avg)30.0 (Min)
October 71.0(Max)67.1 (Avg)25.0 (Min)
November 60.0(Max)37.4 (Avg)
9.0 (Min)
December 52.0(Max)25.9 (Avg)-7.0 (Min)
RelativeHumidity
(0)
47.0 (Min)78. 3 (Avg)
100.0 (Max)
33.0 (Min)78.4 (Avg)
100.0 (Max)
37.0 (Min)75.0 (Avg)
100. 0 (Max)
24.0 (Min)69.9 (Avg)
100.0 (Max)
28.0 (Min)66.9 (Avg)
100.0 (Max)
29.0 (Min)67.6 (Avg)
100.0 (Max)
28.0 (Min)68.9 (Avg)
100.0 (Max)
27.0 (Min)72.4 (Avg)
100.0 (Max)
27.0 (Min)73.7 (Avg)
100. 0 (Max)
33.0 (Min)72.8 (Avg)100.0 (Max)
3 8. 0 (Min)76. I (Avg)
100.0 (Max)
46.0 (Min)78.3 (Avg)
100.0 (Max)
Lake(2 )Tempera-ture (OF)
32.0 (Min)35.0 (Avg)42.0 (Max)
32.0(Min)33.0 (Avg)91.0(Max)
32.0 (Min)34 • 0 (Avg)42.0 (Max)
34.0 (Min)38.0 (Avg)42.0 (Max)
40.0(Min)43.0(Avg)52.0 (Max)
62.0 (Min)56.0 (Avg)63.0 (Max)
46.0 (Mini)69.0 (Avg)78.0 (Max)
48.0(Min)70.0 (Avg)74.0(Max)
45.0(Min)63.0 (Avg)72.0 (Max)
42.0 (Min)54.0 (Avg)63.0 (Max)
38.0(Mini45.0 (Avg)52.0 (Max)
35.0 (Min)38.0 (Avg)43.0(Max)
Table 5.1
Est.AverageService
Lake WaterLevel Flow(ftl (gpm)
244.63 39,600244.63 39,600244.63 39,600
244.63 39,600244.63 39,600244.63 39,600
244.73 39,610244.73 39,610244.73 39,610
245.43 39.682245.43 39,682245.43 39,682
246.13 39,754246.13 39,754246.13 39,754
246.43 39,784246.63 39,784246.93 39,760
246.43 39,784246.43 39,784246.43 43,316
246.13 39,754246.13 39,754246.13 39,754
245.63 39,702245.63 39,702245.63 39,702
245.13 39i651245.13 39,651245.13 39,651
249.83 39,620296.83 39,620244.83 39,620
244.83 39,620244.83 39,620264.83 39,620
FishSystemFlow(gpm)
14,92514,92514,925
14,92514,92519.925
14,92514,92514,925
14,92514,92514,925
14,92514,92514,925
14,92514,92514,925
14,92514,92514,925
14, 92519,92514,925
16,92519,925
14,92514,92514,925
14,92514,92514,925
14,92514,92514.925
Temper-ingWaterFlow(gpm)
4,9603,210
5,0509,885
4,3053,830
2,730
2,340
coolingTowerEvaporation
(gpm)
10,550 (Max)7,800 (Avqg4,560 (Min)
11,200 (Max)8.000(Avq)4,731 (Min)
12,250 (Max)8,650(Avg)3,928(Min)
13,150(Max)9,950(Avg)7,508(Min)
13,700 (Wax)10,850(Avg)
8,100(Min)
13,9000(Max)11,500(Ave)
8.750(Min)
13,800 (Max)11,750(Avg)9,100(Mini)
13,800(Max)11,550(Avg)9,300(Min)
13,700(Max)11,100(Avg)8,200(Min)
13,300(Max)10,350(Avg)7,800(Min)
12, 600 (Max)9,300(Avg)6,816(Min)
11, 550 (Max)8,250(Avg)5,586(Min)
TotalLakeIntake(gpm)
49.56551,31554,525
49,64049,37554,525
50,23050,70554,535
51,87754,60754,607
54,67954,67954,679
54,70954,70954,709
54,70954,70959,586
54,67954,67954,679
54,62754,62754,627
54,57654,57654,576
54,54554,56554,545
52,20554,54554,545
Monthly water use data for NMP-2
Service Water Coolin.Discharge Blo,
Flow AT Flow"I(qpm) (0 ) (gpm)
14,600 17.35 9,49014,600 14.35 13,99014,600 11.35 20,440
14,600 17.35 8,91514,600 16.35 11,95014.600 11.35 20,269
14,610 17.35 8,44516,610 15.35 12,52014,610 11.35 19,072
14,682 15.33 9,12016,682 11.33 15,05014,682 11.33 17,992
14,754 11.31 11,30014,759 11.31 19,15014,754 11.31 16,900
14,784 11.30 11,60014,786 11.30 13,50014,784 11.30 16.250
14,780 11.30 11,20014,784 11.30 13,25018,316 10.38 15,900
14,754 11.31 11,20016,754 11.31 13,45014,754 11.31 15,700
14,702 81.32 11,30016,702 11.32 13,90014,702 11.32 16,800
14,651 11.34 11,70014,651 11.34 14,65014,651 11.34 17,200
19,620 11.35 12,00014,620 11.35 15,70019,620 11.35 18,184
14,620 14.35 11,11014,620 11.35 16,75016,620 11.35 19,414
9 Tower Combined.down Plant
)IT(' Flow(s) (T'I-(CF) (qpm) (o7)
35.824.010.6
37.227.012.0
46.430.011.0
46.432.011.7
47.233.010.0
46.125.0
3.0
45.01.0-9.0
39.612.0-4.0
36.016.0-8.0
34.519.0-2.0
37.323.0
1.0
34.223.013.5
24,09028,59035,040
23,51526,55034,869
23,05527,13033,682
23,80229,73232,174
26,05428,90431,654
26,38428,28431,034
25,98428,03434,216
25,95428,20430,454
26,00028,60231,502
26,35129,30131,851
27,02030,32032,804
25,73031,37034,034
24.6219.0710.56
24.9021.1411.15
27.9922.1111.73
27.2321.7911.69
26.8821.9310.61
26.6017.866.95
25.8312.58
1.37
23.5211.643.92
22.0513.59
1.02
21.6215,.174.14
23.2617.385.61
22.9217.5712.58
U,I0"
(z)Based on data from 1972 Nine Mile Point Unit 1 for maximum and minimum temperatures and Unit 2 Environmental ReportConstruction Permit Stage Figure 2.5-1 for average temperature.
(3)Average and maximum cooling tower blowdown flows are based on Rochester, New York, weather data from 1955 to 1964.Cooling tower blowdown flows for maximum AT are based on Rochester, New York, weather data for 1955.Maximum discharge flow will not be exceeded during normal operation.
(4)6T is the difference between discharge temperature and lake temperature. Maximum AT will be exceededless than 51 of the time. Maximum IT could occur during the month of May, resulting in a maximumblowdown AT of 49OF and a combined plant IT of 27.660F.
("sThese flows are associated with normal plant operation. The maximum combined plant discharge flow will occurduring a normal plant shutdown.
Source: ER-OL Table 3.3-1

Table 5.2 Total plant efficiencycommonly impinged fishStation Unit 6
for returning aliveat Oswego Steam
Species Size TPE
Alewife <10 cm 0 - 16.1%%>10 cm 0 - 55.8%
Rainbow smelt <10 cm 3.1 - 23.8%>10 cm 0 - 64.6%
Spottail shiner 67.2 - 76.4%
Mottled sculpin 38.0 - 54.8%
Source: Lawler, Matusky, and Skelley (1983)
NMP-2 FES 5-86

Table 5.3 Incidence of job-related mortalities
Mortality rates,premature deaths per
Occupational Group I0- person-years
Underground metalminers* 1300
Uranium miners* 420
Smelter workers* 190
Mining** 61
Agriculture, forestry, and fisheries** 35
Contract construction** 33
Transportation and public utilities** 24
Nuclear-plant worker*** 23
Manufacturing**. 7
Wholesale and retail trade** 6
Finance, insurance, and real estate** 3
Services** 3
Total private sector** 10
*The President's Report on Occupational Safety and Health.
"Report on Occupational Safety and Health by the U.S. Depart-ment of Health, Education, and Welfare," E. L. Richardson,Secretary, May 1972.
**U.S. Bureau of Labor Statistics, "Occupational Injuries and
Illness in the United States by Industry, 1975," Bulletin 1981,1978.
**'The nuclear-plant workers' risk is equal to the sum of the
radiation-related risk and the nonradiation-related risk.The estimated occupational risk associated with theindustry-wide average radiation dose of 0.8 rem is about11 potential premature deaths per 105 person-years due tocancer, based on the risk estimators described in thetext. The average non-radiation-related risk for sevenU.S. electrical utilities over the period 1970-1979 is about12 actual premature deaths per 105 person-years as shown inFigure 5 of the paper by R. Wilson and E. S. Koehl, "Occupa-tional Risks of Ontario Hydro's Atomic Radiation Workers inPerspective," presented at Nuclear Radiation Risks, AUtility-Medical Dialog, sponsored by the InternationalInstitute of Safety and Health in Washington, D.C.,September 22-23, 1980. (Note that the estimate of 11radiation-related premature cancer deaths describes apotential risk rather than an observed statistic.)
I
NMP-2 FES 5-87

Table 5.4 (Summary Table S-4) Environmental impact of transportationof fuel and waste to and from one light-water-coolednuclear power reactor'
MORMAL CONDITIONS OF TRANSPORT
Environmental impact
Heat (per irradiated fuel cask in transit) .................................................W eight (governed by Federal or State restrictions) .............................Traffic density:
Truck ...................................................................................................Rail .......................................................................................................
250,000 Btu/Mr.73,000 lbs. per truck; 100 tons per cask per rail car.
Less than I per clay.Less than 3 per month
Estimated • Cumulative dose to
Exposed population number of Range of doses to exposed exposed populaton (perpersons individuals I (per reactor year) reactor year)exposed
Transportation workers ................................................. 200 0.01 to 300 mdlirem .......................... A man-rem.
General public:Onlookers ............................................................. 1 100 0.003 to 1.3 rilliram , ....................... I 3 man-rem.Along Route ............ ......................................... ] 600.0001 00001 to 006 millirem ...........
ACCJIDENTS IN TRANSPORT
Environmental risk
Radiological effects ........... .......... ................................................... Small t'.Common (nonradiological) causes ................ ..... I fatal inlury in 100 reactor years; I nonfatal injury in 10
reactor years; $475 property damage per reactor year.
Data supporting this table are gven in the Commion's "Environmental Survey of Transportation of Radioactive Materialsto and from Nuclear Power Plants," WASH-1238. December 1972. and Supp. I, NUREG-75/038 April 1975. Both documentsare available for inspection and copying at the Commission's Public Document Room. 1717 H St NW. Wasrington. D.C.. andmay be obtained from National Technical Information Service. Springfield. Va. 22161. WASH-1238 is available from NTIS at acost of S5.45 fmicrofiche. $2.25) and NUREG-75/038 is available at a cost of $325 (microficne. $2.25),
'The Federal Radiation Council has recommended that the radiation doses from all sources of radiation other than naturalbackground and medical exposures should be limited to 5,000 milliream per year for individuals as a result of occupationalexposure and should be limited to 500 millireri per year for individuals in the general population. The dose to individuals dueto average natural background radiation is about 130 nrllteem per year.
'Man-rem is an expression for the summation of whole body doses to individuals in a group. Thus. ,each member of apopulation group of 1.000 people were to receive a dose of 0.001 rem (1 millirem). or if 2 people were to receive a dose of0.5 rem 1500 millirem) each, the total man-remn dose in each case would be 1 man-rem.
'Although the envronmental risk of radiological effects stemming from transportation accidents is currently incapable ofbeing numerically quantified. the risk remains smatl regardless of whether it as being applied to a single reactor or amultireactor site.
NMP-2 FES 5-88

Table 5.5 Preoperational radiological environmental monitoring program summary
r,,)
-n"
Exposure Pathwayand/or Sample
Hadiolodine &Particulates
Number of Samples(a)
and Locations
Samples from 5 locations:
1) 3 samples from off-sitelocations in differentsectors of the highestcalculated site averageD/Q (based on all, sitelicensed reactors)
2) 1 sample from the vicinityof an established year roundcominunity having the highestcalculated site average D/Q(based on all site licensedreactors)
3) 1 sample from a controlIbcation 10-17 miles distantand in a least mrvalentwind direction
32 stations with two or moredosimeters to be placed asfollows: an inner ring ofstations in the general areaof the sitet bonndary and anouter ring in the 4 to 5 milerange from the site with astation in each land basedsector.* The balance of thestations should be placed inspecial Interest areas such aspopulation centers, nearbyresidences, schools and in 2or 3 areas to serve as controlstations.
Sampling and CollectionFrequency (a)
Continuous sampler operationwith sample collection weeklyor as required by dustloading, whichever is morefrequent
Type of Analysisand Frequency
Radiolodine Canistersanalyze once/week for1-131.-
Particulate SamplersGross beta radio-activity followingfilter change,Mbcomposite (by loca-tion) for gammaisotopic analysis (c)once per 3 months, (asa minimum)
L,Cý'
Direct Radiation (e) Once per 3 months Gamma dose once per3 months
* At this distance, 8 wind rose sectors are over [ake Ontario.
Source: Amendment 66 4 Facility Operating License No. OPR-63 for Nine Mile Point Unit 1.

z
InCrr
Table 5.5 (continued).i :josure Pathwayand/or Sample
Number of Samples(d)and Locations Sampling and Collc,-t ionFreq,,ency (a) ,, . Type o' Analysis
and Frequecqcy
.: .. ERBORNE
Surface Mf) I)2)
I sample upstreamI sample from the site'sdownstream cooling waterintake
Composite samoli over Imonth period 19)
Twice per year
Gamma isgtypicanalysis iC) once/month.Composite for onceper 3 months tritiumanalysis.
Gamma IsNtpicanalysis cl
Sediment from Shoreline I sample from a downstreamarea with existirfg or potentialrecreational value
INGESTION
MilkLn
C)
1) Samples from milk sdmplinglocations in 3 locations within3.5 miles distance having thehighest calculated siteaverage D/Q. If there arenone, then I sample from milk-Ing animals in each of 3 areas3.5-5.0 miles distant havingthe highest calculated siteaverage D/Q (based on all sitelicensed reactors)
2) 1 sample from a milk samplinglocation at a control location(9-20 miles distant and in aleast prevyidnt winddirection) d
1) 2 samples of comwiercially orrecreatlonally importantspecies in the vicinityof a site discharge point(h)
Twice per month, April-December(samples will be collected inJanuary-March if 1-131 isdetected In November andDecember of the precedingyear)
Gamma isotopic(c) and1-131 analysistwice per month whenanlmals are onpasture (April-December); once/month at other times(January-March) 'frequired
Twice per yearFish Gamma Is 9tpIcanalysis1C onedible portionstwice per year

Table 5.5 (continued)
-'L F'noijtre Pathway Numher at Samiiltý(Ja) Sampling and Collection Type of Analysis
- Aqid/or Sample and LoctLions Frequency(a) and Frequencyrrn
2) 1 sample each of. the samespecies (or of a specieswith similar feeding habits)from an area at leastdistant from the site. d
Food Products 1) 6 samples total (utilizing Once per year during Gamma Isotopicat least 2 sectors) of fruits harvest season analysis of edibleand/or vegetables will be portions (isotopiccollected from available off- to include 1-131)site locations of highest Once during, thecalculated site average D/Q harvest season(based on all licensed sitereactors)
U, 2) 1 sample of each of similarvegetation grown 9-20 milesdistant in a less prevalentwind direction
(a) It is recognized that, at times, it may not be possible or practical to obtain samples of the media of choice atthe iik)st desired location or time. In these instances, suitable alternative media and locations may be chosen forthe particular pathway in question and may be substituted. Actual locations (distance and directions) from thesite shall be provided in the Annual Radiological Environmental Operating Report. Highest D/Q locations are basedon historical meteorological data for all site licensed reactors.
(b) Particulate sample filters should be analyzed for gross beta 24 hours or more after sampling to allow for radonand thoron daughter decay. If the gross beta activity In air Is greater than 10 times a historical yearly mean ofcontrol samples, gamma isotopic analysis. shall be performed o"n the Individual sampls-. .
(c) Gamma Isotopic analysis means the identification and quantification of gamma emitting radionuclides that may beattributable to the effluents from the facility.
(d) Ihe r,',rpose of these samples is to obtain background information. If it is not practical to establish controlloca.ions in accordance with the distance and wind direction criteria, other sites, such as historical controllocations which provide valid background data may be substituted.

Table 5.5 (continued)
•o (e) One or more Instruments, such as a pressurized ion chamber, for measuring and recording dose rate continuously may- be used in place of, or in addition to, integrating dosineters. For the purpose of this table, aV) thermoluminescent dosimeter may be considered to be one phosphor and two or more phosphors In a packet may be
considered as two or more dosimeters. Film badges shall not be used for measuring direct radiation.
(f) The "upstream sample" should be taken at a distance beyond significant Influence of the dischage. The "downstreamsample" should be taken in an area beyond but near the mixing zone, if possible.
(g) Composite samples should be collected with equipment (or equivalent) which is capable of collecting an aliquot attime intervals which are very short (e.g. hourly) relative to the compositLing period (e.g. monthly) in order toassure obtaining a representative sample.
(h) In the event convnercial or recreational important species are not available as a result of three attempts, thenother species may be utilized as available.
Ln
1.0

Table 5.6 Activity ofat 3466 MWt
radionuclides in the NMP-2 reactor core
Radioactive inventory,Group/radionuclide millions of curies Half-life, days
A. NOBLE GASESKrypton-85Krypton-85mKrypton-87Krypton-88Xenon-133Xenon-135
B. IODINESlodine-131lodine-132Iodine-133lodine-134lodine-135
C. ALKALI METALSRubidium-86Cesium-134Cesium-136Cesium-137
D. TELLURIUM-ANTIMONYTel1urium-127Tellurium-127mTell urim- 129Tellurim-129mTellurium-131mTellurium-132Antimony-127Antimony-129
E. ALKALINE EARTHSStrontium-89Strontium-90Strontium-91Barium-140
F. COBALT AND NOBLE METALSCobalt-58Cobalt-60Molybdenum-99Technetium-99mRuthenium-103Ruthenium-105Ruthenium-106Rhodium-105
0.630.50.70.
200.40.
3,950.0.1830.05280.1175.280.384
90.100.200.200.200.
8.050.09580.8750.03660.280
0.038.3.5.
18.7750.
13.011,000.
6.1.
30.6.
10.100.
7.40.
100.4.
100.200.
0.391109.
0.04834.0
1.253.253.880.179
0.80.3
200.200.100.80.30.50.
52.111,030.
0.40312.8
71.01,920.
2.80.25
39.50. 185
366.1.50
NMP-2 FES 5-93

Table 5.6 (Continued)
Radioactive inventory,Group/radionuclide millions of Ci Half-life, days
G. RARE EARTHS, REFRACTORYOXIDES, AND TRANSURANICSYttrium-90 4. 2.67Yttrium-91 100. 59.0Zirconium-95 200. 65.2Zirconium-97 200. 0.71Niobium-95 200. 35.0Lanthanum-140 200. 1.67Cerium-141 200. 32.3Cerium-143 100. 1.38Cerium-144 90. 284.Praseodymium-143 100. 13.7Neodymium-147 60. 11.1Neptunium-239 2000. 2.35Plutonium-238 0.06 32,500.Plutonium-239 0.02 8.9 x 10⁶Plutonium-240 0.02 2.4 x 10⁶
Plutonium-241 4. 5,350.Americium-241 0.002 1.5 x 10⁵Curium-242 0.5 163.Curium-244 0.02 6,630.
Note: The above grouping ofTable 5.8.
radionuclides corresponds to that in
Table 5.7 Approximate doses during a 2-hour exposure at the EAB*•**
Duration Whole-bodyAccidents and faults of release dose, rems**
INFREQUENT ACCIDENTSCategory 2
Fuel-handling accident <2 hours 0.02(fuel cask drop)
LIMITING FAULTSCategory 3
Main steamline break <2 hours 0.002
Small-break LOCA hours-days <0.005
Large-break LOCA hours-days 0.0005
*1381 m (4531 feet) from the center of the reactor building.*"Estimated by the staff for the NMP-2 FES-CP'**The calculated whole-body dose, or the equivalent dose to
an organ.
NMP-2 FES 5-94

N,
m
U,
U,
Table 5.8 Summary of the atmospheric release specifications used in consequence analysis for NMP-2
Evacua- Energy Fractions of core inventory releasedProba- Release Release tion release
Release bility time duration warning (lO 6 Btu/ Orga- Inorgan- c dCatgeory per r-y (hr) (hr) time (hr) hr) Xe-Kr ic I ic I Cs-Rb Te-Sb Ba-Sr 'Ru La
I-T/DW 4(-5) 5 0.5 4 100 1 7(-3)* 2(-3) 2(-2) 8(-2) i(-3) 5(-3) 1(-3)I-T/WW 2(-5) 5 0.5 4 100 1 7(-3) 1(-4) 3(-4) 1(-3) 2(-5) 7(-5) 1(-5)I-T/WW 2(-6) 5 0.5 4 100 1 7(-3) 2(-4) 9(-4) 2(-3) 8(-5) 1(-4) 3(-5)IT/HB 8(-7) 2 0.5 1 100 1 -- 2(-1) 6(-2) 1(-1) 7(-3) 8(-2) 1(-5)I-T/DW 4(-8) 5 0.5 4 100 1 7(-3) 3(-3) 5(-.3) 3(-3) 6(-4) 3(-4) 4(-4)I-T/LGT 2(-5) 2 3 0 1 0.7 -- 2(-2) 1(-1) 5(-2) 2(-3) 3(-3) 6(-4)II-T/WW 2(-6) 20 4 5 1 1 7(-3) 7(-1) 3(-1) 2(-1) 4(-2) 4(-2) 3(-3)III-T/WW 4(-6) 3 1 2 100 1 7(-3) 8(-2) 2(-1) 6(-1) 2(-2) 4(-2) 7(-3)III-T/HB 9(-8) 2 0.5 1 100 1 -- 2(-1) 6(-2) 1(-1) 7(-3) 8(-2) 1(-5)III-T/LGT 2(-5) 0.5 4 0 1 0.7 -- 3(-3) 1(-4) 5(-4) 2(-5) 3(-5). 6(-6)III-T/LýT 2(-6) 0.5 4 0 1 0.7 -- 2(-2) 1(-1) 5(-2) 2(-3) 3(-3) 6(-4)IV-T/DW 5(-7) 1 3 0.5 1 1 7(-3) 5(-l) 5(-l) 5(-l) 6(-2) 9(-2) 7(-3)IV-T/WWf 4(-7) 1 3 0.5 1 1 7(-3) 5(-1) 5(-1) 5(-l) 6(-2) 8(-2) 6(-3)S-H20/W' 1(-8) 0.5 4 0.5 1 1 7(-3) 2(-1) 4(-1) 3(-1) 4(-2) 5(-2) 4(-3)S-ii2/Ww 1(-8) 0.5 3 0.5 1 1 7(-3) 5(-2) 3(-1) 4(-1) 3(-2) 7(-2) 6(-3)
Notes: See Section 5. 9.4.5(7) for discussion of uncertainties. Estimated numbers were rounded to one significant digit
only.for the purpose of this table.
7(-3) = 7 x 10⁻³ 0.007.
Release height = 30 m.aSee Appendix H for designations'and descriptions of the release categories.borganic iodine is added to inorganic iodine for consequence calculations because organic iodine is likely to be converted
to inorganic or particulate forms during environmental transport.clncludes Ru, Rh, Co, Mo, Tc.dIncludes Y, La, Zr, Nb, Ce, Pr, Nd, Np, Pu, Am, Cm.eBecause of their similarity, IV-T/DW, IV-T/W, and IV-A/DW were grouped together.fThese release categories represent slight corrections made since the publication of the Limerick FES, from which thisinformation was taken.

Table 5.9 Annual average wind-directionprobabilities for the NMP-2site based on data for 1975
ProbabilityWind blowing toward (fraction ofthe direction the year)
N 0.0982NNE 0.0428NE 0.0406ENE 0.0907E 0.1095ESE 0.0648SE 0.0852SSE 0.0349S 0.0283SSW 0.0277SW 0.0472WSW 0.0202W 0.0334WNW 0.0737NW 0.1236NNW 0.0792
Total 1.00
NMP-2 FES 5-96

Table 5.10 Summary of emergency response assumptions for NMP-2
Emergency response Value used incharacteristic CRAC analysis Comments
Evacuation distance
Delay time
Effective evacuationspeed
Effective downwinddistance moved
10 miles
1.8 hour
1.1 mph
15 miles
To convert to km, multiply by 1.609.
Same as 0.47 m/sec.
Relocation zone All areas morethan 10 milesfrom the plant
12 hours
An artificial parameter used onlyto represent a realistic pathlength over which radiationexposure to each evacuee iscalculated in the CRAC code.
The area outside the 10-mileplume exposure pathway emergencyplanning zone.
A separate calculation, with arelocation time of 24 hours, wasalso performed; see Appendix I.
Relocation time,after plume passage
Relocation dosecriterion (7-dayprojected bonemarrow dose fromgroundshine)
Factors by whichunshielded exposuresare multiplied tocorrect for shielding
Plume exposureduring evacuation
Groundshine exposureduring evacuation
Plume exposure,other times
Groundshine exposure,other times
200 rems
1.
0.5
See Footnote 1.
See Footnote 1.
See Footnote 2.
See Footnote 2.
0.75
0. 33
'During evacuation, automobiles are assumed to provide essentially noshielding to gamma rays from the plume and some shielding to gamma raysfrom the contaminated ground. The selected values of shielding protectionfactors for the plume and the ground during evacuation are taken fromTable VI, 11-13 of Appendix VI of WASH-1400.
2 At other times than during evacuation, shielding protection factors are theaverage values representative of normal activities of the people duringwhich some people are indoors and some are outdoors. The selected valuesof the shielding protection factors for the plume and the ground for thissituation are taken from Table VI, 11-13, of Appendix VI of WASH-1400.
NMP-2 FES 5-97

Table 5.11 Summary of environmental impacts and probabilities
I
Population Cost ofPersons Persons exposure, offsite
Probability exposed exposed Early millions of Latent mitigatingof impact over over fatali- person-rems,* cancers, actions,per r-y 200 rems 25 rems ties 80 km/total 80 km/total $ millions
I0-4 0 0 0 0/.03 0/2 0.003
10-5 0 2,000 0 2/8 160/580 200
5 x 10⁻⁶ 0 5,000 0 3/15 290/1,100 350
10-6 250 28,000 0 10/34 920/2,800 1,300
10-7 3,000 200,000 500 25/69 3,100/6,100 2,500
10-8 19,000 300,000 2,000 40/150 4,900/10,000 4,700
Relatedfigure 5.5 5.5 5.8 5.6 5.7 5.9
*About 260 cases of genetic effects may occur in the succeeding generations per
million person-rems to the exposed generation.
Note: See Section 5.9.4.5(7) for discussion of uncertainties.
I
NMP-2 FES 5-98

Table 5.12 Estimated values of societal risks fromsevere accidents, per reactor-year
Estimated risk within EstimatedConsequence type the 80-km region total risk
1. Early fatalities with 2.E-4* 2.E-4supportive medicaltreatment (persons)
2. Early fatalities with 4. E-4 4. E-4minimal medical treat-ment (persons)
3. Early injuries (persons)" 0.002 0.002
4_.Latent-c -er-fatal i ties 0.006 0.02(excluding thyroid)(persons)
5. Latent thyroid cancer 0.001 0.003fatalities (persons)
6. Total person-rems 70. 300.
7a. Cost of offsite mitiga- 6000. 8000.tion measures (1980 $)
7b. Regional industrial 4000. 4000.*impact costs (1980 $)
7c. Plant costs (1980 $) 200,000. 200,000.
8. Land area for long-term 20,000. 200,000.interdiction (m2 )•***
*2.E-4 = 2 x 10-4 = 0.0002.**See WASH-1400, Appendix VI, 9-11 to 9-20, for a discussion of
"early morbidity" (injury).***Excludes costs of crop and milk interdiction, which are included
in 7a.""*About 2.6 million m2 equals 1 mi2 . This would be the long-term
interdiction area if the contamination criteria for milk and cropswere exceeded.
NOTE: See Section 5.9.4.5(7) for discussion of uncertainties.Estimated numbers were rounded to one significant digit onlyfor the purpose of this table.
I
NMP-2 FES 5-99

TablIe 5.13 Regional economic impacts of output and employment
ExpectedDirect losses** Loss in loss in
Release employment, output/specifi- Wind Nonagri- Agri- Indirect Total annualized r-y,cation* direction cultural cultural losses losses** jobs $ 1980
Maximum losses
1 WSW 2200 250 310 2800 120,000 532 SSE 1500 170 200 1800 95,000 4083 SW 40 90 16 140 42,000 1164 SW 40 90 16 140 42,000 277
Minimum losses
W-
All NNE 0 0 0 0 0 0
Expected losses per reactor-year
1 All 230 74 38 350 <12 All 690 360 130 1200 <13 All 160 550 87 800 <14 All 270 920 150 1300 <1
All All 1300 1900 400 3600 0.3
*Release specifications include:
1. IV-T/DW, and all other IV category releases
2. II-T/WW, III-T/WW, S-H20/WW, S-H20/WW
3. I-T/LGT, III-T/LGT
4. I-T/DW, I-T/HB, III-T/HB
**1980 $ millions.***Not applicable, because the expected loss is in the "Total" column for this portion
of the table.
Source: NUREG/CR-2519
NMP-2 FES 5-100

Table 5.14 (Summary Table S-3) Uranium fuel cycle environmental data1
[iarmalued to mode LWR annual fuet requirement (WASH-1248] or reference reactor year fNUREG-1 16]1
E 1acrs aos oa Mastum effect per Snual tuet requarement orEnvirornmental considerations ITotal I relrence reacctor ye~ar 0mdel 00UW e_ _ _ _ _nce reactor Pear of model 1,000 MWeLWR
NATURAL RESOURCES USELand (acres):
Temporanly commitled ............ ...............Undisturbed area ......................................................................DisturOed area ...........................................................................
Permanently commitled ..................................................................Overburden moved (mnthons of T .............................................
Water (millions of gallons):Diso•arged to ................... ... ...................................................
Discharged to water bodie ............................................s........Discharged to ground ......................................
T o ta l ....................................................................... ............
Fossil fuel:Electncal energy (thousands of MW-hour ........................Equrvalent coal (thousands of MT) .............. ........................
Natural gas (mallions of sc)............................................
EFFLUENTS--CIEMICAL ("T)
1007922
132.8
160
11,090127
11.377
IO
Gases (including entrainment): 3so ......................... . ..................................................NO4 ........................... -....................................................................
H oarbo ns ...............................................................................CO ........................ ............... .. .......... ....................Particulates .................................. .......................................... .
Other gases:F .......................................................................................................
HCI ...............................................................................................LiQiads:
so , ... ...........................................................................................NO , ............ ..................................... .............. . . . ..........
Ca'o .. ...........................................................................................C1-. .................................................................................................
Nal ................................................................................................NHý ...............................................................................................Fe ..............................................................................................
Tagings solutions (thousand• of MT) ......................... ....
323118
135
4,4001.190
1429.6
1.154
.67
.014
9.925.812.95.48.5
12.1.10.0
.4
240
91.000
Equivalenr to a 110 UWe coal-fired powerplant.
Equivalent to 95 MWe coal-fIed power plant.
-2 percent of model 1.000 MWe LWR witcooling tower
<4 percent of model 1.000 MWe LWR withonce-through cooling
<5 percent of model r.D00 MWe LWR outputEquivalent to the consumption of a 45 MWe
coal-.hred power plant.<0.4 percent o0 model 1.000 MWe energy
output.
Equivalent to emissoins from 45 MWe coal-fired plant for a year.
Princpally from UF. production,. enrichment.and reprocessing Concentration withinrange of state standards-below level thathas effects on human health.
From enrinchment fuel fabrication. and reproc-easing steps. Components that constitutea potential for adverse environmental effectare present in dilute concentrations and re-ceive additionat dilution by receiving bodiesof water to levels below permissible stand-ards. The constituents that require dilutionard the flow of dilution water are:
NH-6.00 c$s.NO1-20 cfs.Fluoride- 70 cfS.From mnlls only-,no significant effluents to
environmentPrincitaly from nulls-no significant efuents
tonvrnmn
NMP-2 FES 5-101

Table 5.14 (Continued)
(NoVrnaizsed to model LWR annirual fuel refusinent [WASH-1248] or reference reactor year [NUREG-01 16])
fdam a effect per annual lust reuirement orEnvaronmental considerations Total reference reactor yea of model 1.000 MWe
LWR
EFFLUENTS-RADIOL.OGICA (CUPIES)
Gases (wicluding entrainment):Rn222 ....................................... .... .............................................. .................... Presently under reconsideration bIy the Com-
Ra-226 ....................................................................................... . .02Th-230 .......................................................................................... . .02Uranium ................ ....................... ...... . ................. . .034
C. 14______ ........... . ... ... 24Kr-85 (thousands) .......................... . ..... 400Ru-106 ........................................... ...................... .. ...................... .14 Principalty from fuel reprocessing plants.1-129 .......................................................................................... .... 1.3
1-131 8..... . ................ . 3Tc.99 ............................ ................................................................................... Presently under consideration by the Com n s.
SeonFission products and transuranics .............................................. .203
Lquids:Uranium and daughters .... ............................................................... 1 P rinc i ron r llng-included tailings liquor
arid returned to ground-no effluents: thlere-fore, no effect on envioroment.
Ra-226 .................................................... 0..................................... . 0034 From UF. production.T h-230 ........... : .................................. 0.0. . .......................................... . 0 15 iTh-234 ................................... 01................................................ . 01 From fuel tabrication plants--concentration 10
percent of 10 CFR 20 for total processing26 annual fuel requirements for model LWR
Fission and acttvation products ................................................. 5.9. 10""Solids (buried on sife):
Dther than high level lallow) ....................................... .... 11.300 9.100 Ca comes from low level reactor wastesand t .500 Ci comes from reactor decontami.nation and decommissioning-burned at landbIl faclities 600 Cc comes from mils-included in tailings refumed to ground. AjP-proximately 60 Ci comes from conversionand spent fuel storage No significant efflu-ent to the environment.
TRU and HLW deep) ...........l........ .: ........................................... 1.1 x 10 Bu e at Federal RepositoryEffluents-therrmal (billions of British thermal units) ........................... 4.063 <5 percent of model 1.000 MWe LWR.Transportation (person4ern):
Exposure of workers and general pubhc ................................. 2.5Occupational exposure (persocn-reinl ............ .... 22.6 From reprocessing and waste management.
itIn some cases where no entry appears it I clear from the background documents that the matter was addressed and that.in effect, the Table should be read as if a specific zero entry had been made However. tere are other areas that are notaddressed at all in the Table. Table S-3 does not include health effects from the effluents described in the Table. or estimatesof releases of Radon-222 from the uranium fuel cycle or estinates of Technetium-99 released from waste management orreprocessing aclrvities. These issues may be the subtect of litition in the individual licensing proceedings.
Data supporting this table are given in the "Environmental Survey of the Uranrum Fuel Cycle." WASH-1248. Aprl 1974: the"Enwvonmental Survey of the Reprocessing and Waste Management Portion of the LWR Fuel Cycle, NUREG-01 16 (Supp. Ito WASH-t248); the "Public Comments and Task Force Responses Regarding the Envwonmental Survey of the Reprocessingand Waste Managerment Portions of the LWR Fuel Cycle." NUREG-0216 (Supp. 2 to WASH-1248). and in the record of tefioal rulemaking pertaining to Uranium Fuel Cycle Impacts from Spent Fuel Reprocessing and Radioactive Waste Management.Docket RM-50-3. The contributions from reprocessing, waste management and transportation of wastes are maximized foreither of the two fuel cycles (uranium only and no recycle). The contribution from transportation exctudes transportation of Coldfuel to a reactor ard of Irradiated fuel and radioactive wastes from a reactor which are considered in Table S-4 of § 51.20(g).The contributions from the other steps of the fuel cycle are grien in columns A-E of Table S-3A of WASH-1248.
v The contriutions to trmporsany committed Lend from reprocessing are not prorated ovem 30 years, since the completetetort. pacac regardless of whether the plant services one reactor for one year or 57 reactors for 30 years.
2E ated euents based upon combustion of equivalent coal for power generation.S1.2 percetm from natural gas use arid proon&.
NMP-2 FES 5-102

6 EVALUATION OF THE PROPOSED ACTION
6.1 Unavoidable Adverse Impacts
The staff has reassessed the physical, social, biological, and economic impactsthat can be attributed to the operation of NMP-2. These impacts are summarizedin Table 6.1.
The FES-CP required several modifications to the aquatic biological monitoringprogram at both Nine Mile Point 1 (NMP-1) and FitzPatrick Nuclear Stations forthe purpose of impact assessment for NMP-2. These modifications have been made,and the results of the studies conducted at both facilities are evaluated inSections 4.3.4 and 5.5.2 and Appendix G of this report.
The radiological impacts from the operation of NMP-2 have been re-evaluated andare discussed in.Section 5.9 of this report.
The applicant is required to adhere to the following conditions for the protec-tion of the environment:
(1) Before engaging in any additional construction or operational activitiesthat may result in any significant adverse environmental impact that wasnot evaluated or that is significantly greater than that evaluated in thisstatement, the applicant will provide written notification of such activi-ties to the Director of the Office of Nuclear Reactor Regulation and willreceive written approval from that office before proceeding with suchactivities.
(2) The applicant will carry out the environmental monitoring programs out-lined in Section 5 of this statement, as modified and approved by thestaff and implemented in the Environmental Protection Plan and TechnicalSpecifications that will be incorporated in the operating licenses.
(3) If an adverse environmental effect or evidence of irreversible environ-mental damage is detected during the operating life of the plant, theapplicant will provide the staff with an analysis of the problem and aproposed course of action to alleviate it.
6.2 Irreversible and Irretrievable Commitments of Resources
Construction activities at NMP-2 disturbed more land than was anticipated inthe FES-CP. This change in land use is discussed in Sections 4.2.2 and 5.2.1of this report. Impacts from construction of the transmission lines are lessthan expected because of the design change from 765 kV to 345 kV.
The FES-CP required monitoring of fish kills at NMP-1 and FitzPatrick so poten-tial fish kills at NMP-2 could be better monitored. This monitoring wasperformed as part of the aquatic biological monitoring program discussed inSection 6.1 above.
NMP-2 FES 6-1

6.3 Relationship Between Short-Term Use and Long-Term Productivity
There have been no significant changes in the staff's evaluation for NMP-2 since
the construction permit stage environmental review.
6.4 Benefit-Cost Summary
6.4.1 Benefits
A major benefit to be derived from the operation of NMP-2 is the lower produc-tion cost for approximately 5.2 billion kWh of baseload electrical energy thatwill be produced annually. (This projection conservatively assumes that theunit will operate at an annual average capacity factor of 55%.) The additionof the unit will also improve the applicant's ability to supply system loadrequirements by contributing 1080 MW of capacity (design electric rating, net)to the New York Power Pool's bulk power supply system.
The staff estimates that production costs avoided on existing fossil-firedgenerating units will be approximately 24.7 mills per kWh on 5.2 billion kWh,resulting in a total avoided cost per year on existing generation facilitiesof $128 million (constant 1987 dollars).
6.4.2 Economic Costs
The economic costs associated with station operation include fuel costs andoperation and maintenance costs (O&M), which are expected, to average approxi-mately 6.7 mills per kWh and 12.2 mills per kWh, respectively. Total produc-tion costs for the 5.2 billion kWh per year produced by the nuclear unit wouldbe $98 million per year (constant 1987 dollars). The estimate for fuel isderived from applicant's 'response to staff question 320.2, which was submittedunder separate cover September 9, 1983. The estimate of O&M cost is based on a3% annual escalation of the 1982 average cost for nuclear plants in the north-east region of the U.S. (DOE, 1983).
The applicant e.stimates that decommissioning costs will total $123 million
(1982 dollars).
6.4.3 Socioeconomic Costs
No significant socioeconomic costs are expected from either the operation ofNMP-2 or from the number of station personnel and their families living in thearea. The socioeconomic impacts of a severe accident could be large; however,the probability of such an accident is small.
6.5 Conclusion
As a result of its analysis and review of potential environmental, technical,and social impacts, the NRC staff has prepared an updated forecast of theeffects of operation of NMP-2. The NRC staff has determined that NMP-2 can beoperated with minimal environmental impact.ý To date, no new information hasbeen obtained that alters the overall favorable balancing of the benefits ofstation operation versus the environmental costs that resulted from evaluationsmade at the construction permit stage.
NMP-2 FES 6-2

6.6 Reference
U.S. Department of Energy, "DOE Update, April-June 1983:Program Information and Data," DOE/NE0048/3, August 1983.
Nuclear Power Plant
NMP-2 FES 6-3

Table 6.1 Benefit-cost summary for NMP-2
Primary impact and effect Quantityon population or resources (Section)* Impacts**
BENEFITS
Direct
Additional generating capacity
Operating cost avoided onexisting system generation
1080 MWe Large
5.2 billion kWh/yr@ 24.7 mills/kWh or$128 million/yr
Moderate
COSTS
Economic
!FuelOperation and maintenanceTotalDecommissioning
6.7 mills/kWhf12.2 mills/kWht$98 million/yrt$123 milliontt
SmallModerateModerateSmall-Moderate
Adverse socioeconomic effects
Loss of historic orarcheologic resources
Increased demands on publicfacilities and services
Increased demand on privatefacilities or services
Adverse nonradiological healtheffects
(Section 5.7)
(Section 5.8)
(Section 5.8)
None
Small
Small
Water quality changesAir quality changes
(Section 4.3.2)(Section 5.4)
Adverse radiological health effects
Routine operationPostulated accidentsUranium fuel cycle
Environmental
Damages suffered by otherwater users
Surface water consumptionSurface water contaminationGroundwater consumptionGroundwater contamination
(Section(Section(Section
5.9.3)5.9.4)5. 10)
Small
Small
I(Section(Secti on(Section(Section
5.3)5.3, 4.3.2)5.3)5.3, 4.3.2)
SmallSmallNoneNone
NMP-2 FES 6-4

Table 6.1 (continued)
Primary impact and effect Quantityon population or resources (Section)* Impacts**
Damage to aquatic resources
Impingement and entrainment (Section 5.5.2) SmallThermal effects (Section 5.5.2) SmallChemical discharges (Section 5.5.2) Small
Damage to terrestrial resources
Station operations (Section 5.5) SmallTransmission line maintenance (Section 5.5.1.2) SmallCooling tower operation (Section 5.5.1.1) Small
*Where a particular unit of measure for a benefit/cost category has not been
specified in this statement or where an estimate of the magnitude of thebenefit/cost under consideration has not been made, the reader is directedto the appropriate section of this report for further information.
**A subjective measure of costs and benefits is assigned by reviewers where
quantification is not possible: "Small"=impacts that, in the reviewer'sjudgment, are of such minor nature, based on currently available information,that they do not warrant detailed investigation or consideration of mitiga-tive actions; "Moderate"=impacts that, in the reviewer's judgment, are likelyto be clearly evident (mitigation alternatives are usually considered formoderate impacts); ."Large"=impacts that in the reviewer's judgment, repre-sent either a severe penalty or a major benefit. Acceptance requires thatlarge negative impacts should be more than offset by other overridingproject considerations.
tConstant 1987 dollars
ttConstant 1982 dollars
'4
NMP-2 FES 6-5


7 LIST OF CONTRIBUTORS
The following persons were major contributors to this environmental statement.
U.S. Nuclear Regulatory Commission
M. F. Haughey
E. N. Fields
J. Lee
M. Wangler
C. R. Hickey, Jr.
J. Levine
A. Brauner
R. Samworth
G. LaRoche
P. Easley
G. Staley
B. Richter
R. Wescott
Licensing Project Manager; B.S. (Mechanical Engineering/Material Science) 1977; Mechanical/Nuclear Engineering,7 years experience
Electrical Engineer; B.S. (Electrical Engineering) 1969;15 years experience
Senior Nuclear Engineer; Ph..D. (Nuclear Engineering) 1980;Radioactive Waste Management, 20 years experience
Health Physicist; M.S. (Physics) 1972; Environmental HealthPhysics, 10 years experience
Senior Fishery Biologist; M.S. (Marine Science) 1971;Marine/Fisheries Science, 13 years experience;AFS Certified Fisheries Scientist
Meteorologist; M.S. (Meteorology) 1968; Meteorology,22 years experience
Site Analyst; B.S. (Electrical Engineering) 1950;Nuclear-Related Engineering, 33 years experience
Leader, Environmental Engineering Section;Ph.D. (Environmental Engineering) 1968; Water Qualityand Pollution Control, 17 years experience
Senior Land Use. Analyst; Ph.D. (Botany/Ecology) 1969;Land Use and Terrestrial Ecology, 27 years experience
Nuclear Engineer; M.S. (Chemical Engineering) 1980;Environmental Transport and Radiological Consequences,6 years experience
Hydraulic Engineer; B.S. (Civil Engineering) 1960;Hydraulic Engineering, 23 years experience
Cost-Benefit Economist; M.A. (Economics) 1970;Socioeconomics, 13 years experience
Hydraulic Engineer; M.S. (Engineering Science) 1974;Hydraulic Engineering; 10 years experience
NMP-2 FES 7-1

A. Singh Auxiliary Systems Engineer, P.E.; B.S. (NuclearEngineering); B.A. (Business Administration); 15 yearsexperience
Oak Ridge National Laboratory
Robert M. Cushman
Lorene L. Sigal
Richard B. McLean
Aquatic Ecologist; M.S. (Ecology) 1975; AquaticEcology/Invertebrate Biology and Impact Assessment,9 years experience
Terrestrial Ecologist; Ph.D. (Botany) 1979;Terrestrial Ecology/Botany and Impact Assessment,9 years experience
Aquatic Ecologist; Ph.D. (Marine Biology) 1975;10 years experience
NMP-2 FES 7-2

8 LIST OF AGENCIES, ORGANIZATIONS, AND PERSONS TO WHOM COPIES OF THE DRAFTENVIRONMENTAL STATEMENT WERE SENT
Advisory Council on Historic PreservationBrookhaven National LaboratoryCentral New York Regional Planning and Development Board ClearinghouseDirector, Canadian Atomic Energy Control BoardFederal Emergency Management AgencyFederal Energy Regulatory CommissionNew York State Attorney GeneralNew York State ClearinghouseNew York State Department of Environmental ConservationNew York State Department of StateNew York State Technical Development ProgramsSupervisor, Town of ScribaU.S. Army Corps of Engineers, District 1U.S. Department of AgricultureU.S. Department of CommerceU.S. Department of EnergyU.S. Department of Health and Human ServicesU.S. Department of Housing and Urban Development, Region 2U.S. Department of InteriorU.S. Department of TransportationU.S. Environmental Protection Agency
NMP-2 FES 8-1


9 STAFF RESPONSES TO COMMENTS ON THE DRAFT ENVIRONMENTAL STATEMENT
Pursuant to 10 CFR 51, the "Draft Environmental Statement Related to the Opera-tion of Nine Mile Point Nuclear Station Unit 2" (DES) was transmitted, with arequest for comments, to the agencies, organizations, and persons listed inChapter 8 of this report. In addition, the NRC requested comments on the DESfrom interested persons by a notice published in the Federal Register.
Those who responded to the requests for comments are listed below, chronologi-cally in order of the dates of their letters. The letters are reproduced inAppendix A. In parentheses after the name of each commentor are the initialsused to identify the commentor later in this chapter and the page in Appendix Aon which the comment letter begins. The commentors were
U.S. Department of Agriculture, Economics Research Service (USDA-E, 1)
U.S. Department of the Army, Corps of Engineers, Buffalo District (COE, 2)
U.S. Department of Commerce, National Oceanic and Atmospheric Administration,National Marine Fisheries Service (NMFS, 3)
U.S. Environmental Protection Agency, Region II (EPA, 5)
Niagara Mohawk Power Corporation (the applicant) (NMPC, 8)
New York State Department of Environmental Conservation (DEC, 35)
The letters from NMFS, USDA-E, and COE did not require a staff response becausethey essentially had no comments on the project. The remaining letters didrequire a staff response; however, specific comments that either indicatedagreement with the DES or that were not comments on the DES were not addressed.
The staff's consideration of the comments and its disposition of the issuesinvolved are reflected, in part, by revised text in pertinent sections of thisFES, and, in part, by the discussion following in this chapter. The discussionis generally keyed to the body of the statement; for example, Section 9.5.9.3contains the staff's response to comments on Section 5.9.3 inthe DES. The com-ments are referenced by use of the abbreviations indicated above and by theindividual comment numbers indicated in the margins of the comment lettersshown in Appendix A.
Table 9.1 is a cross-reference list of comments and the section(s) of thisreport in which they are addressed.
9.1 Abstract, Summary and Conclusions, Foreword, and Introduction
NMPC-1
NMPC (the applicant) states that impacts from construction of the transmissionline are less than expected at the CP stage because of the design change from
NMP-2 FES 9-1

765 kV to 345 kV. This change meant that no additional right of way had to beacquired and less clearing was required.
Staff Response
The text has been changed to reflect this comment.
NMPC-2
The applicant notes, as stated in Section 5.14.1, that monitoring to assesspotential salt drift impact on vegetation is no longer required.
Staff Response
The text has been changed to reflect that such a monitoring program is notrequired.
NMPC-3
The applicant comments that the total area disturbed by construction activitiesis 56.02 ha (138.4 acres). The major reasons for the difference between thisarea and that predicted at the CP stage (40 acres) is that at the CP stageland requirements for construction laydown (79.35 acres), parking (10.44 acres),and spoil material (11.79 acres) were underestimated.
Staff Response
.The text has been revised to reflect this comment.
NMPC-18
Because fish that are diverted and returned to the lake are not "impinged," theapplicant suggests substituting the word "entrapped" in item (5)(a).
Staff Response
The suggested change has been made.
9.1.2 Permits and Licenses
NMPC-13
The applicant notes that on July 26, 1984 (after the DES was published) theapplicant certified to the New York Department of State that operation of NMP-2will be in compliance with the state's approved coastal management program.
Staff Response
In January 1985, the state responded to the applicant, concurring with theconsistency certification and providing further clarification of state policies(see Appendix L).
NMP-2 FES 9-2

9.4 Project Description and Affected Environment
9.4.2 Facility Description
9.4.2.1 External Appearance and Plant Layout
NMPC-12
The applicant points out that the new training center being built just west ofthe Energy Information Center should be identified in Section 4.2.1, and theapplicant would provide information on the facility in an ER-OL supplement.
Staff Response
The applicant provided information on the facility in ER-OL Supplement 8 datedFebruary 14, 1985, and the text has been revised to include this new trainingcenter.
9.4.2.2 Land Use
9.4.2.2.1 Plant Site
NMPC-7
The applicant states that the discussion on soil types should indicate that thesoil mapping units within the site boundary that are classified as prime farm-land (Soders) and farmland of statewide importance (Scriba, Ira, arid Ira-Soders)are along the transmission line right' of way south of Lake Road and are notaffected by the main plant facilities. Further, the applicant notes, becauseland along transmission lines can be used for farming, this farmland is not"irreversibly committed."
Staff Response
The text has been revised to note that the agricultural land in the right ofway is not "irreversibly committed.."
9.4.2.2.3 Training Center
NMPC-12
See question NMPC-12 in Section 9.4.2.1.
Staff Response
A new section, Section 4.2.2.3, has been added to discuss facility.
9.4.2.3 Water Use and Treatment
9.4.2.3.1 Water Use
NMPC-24
The applicant states that the estimated maximum use of city water during normaloperations now is 83,270 L/day (22,000 gpd). This revised estimate does not
NMP-2 FES 9-3

alter the conclusion that the NMP-2 water use requirements represent anegligible (<0.4%) increase in demand on the Oswego city water supply.
Staff Response
The text has been revised to reflect this changed estimate.
9.4.2.5 Radioactive.Waste Management Systems
EPA-1
EPA comments that the DES does not contain detailed descriptions or NRC staffevaluations of the radioactive waste treatment systems.
Staff Response
The staff's evaluation of the NMP-2 radwaste treatment systems for the DES is apart of the detailed evaluation that is presented in the NMP-2 SER. The esti-mates of the expected releases to the environment, which were presented forcomment in the DES (Tables D-1 and D-4), are the same as those presented in theSER. As stated in Section 4.2.5 of the DES, the radiological environmentalimpacts were calculated with these quantities and they are adequately presentedin the DES The conclusions in the FES in regard to the radiological environ-ental impact of NMP-2 are in accord with the information presented in the SER.
EPA-2
EPA comments that the DES should address the specifications for spent fuelpools, because no high level radioactive waste repository is in operation.
Staff Response
The spent fuel storage.facility is located in the reactor building and providesunderwater storage for 4000 fuel assemblies (523% of the full core fuel load).The facility consists of high density stainless steel storage racks in a stain-less steel-lined storage pool. The facility is designed to seismic Category Icriteria, and is expected to be in service for the full life of the plant. Thespent fuel storage pool has a capacity for 12 normal fuel discharge cycles,which indicates a storage capacity of at least 18 years after the first corereload.
In the Waste Confidence Decision (49 FR 34658), published on August 31, 1984, theCommission finds reasonable assurance that, if necessary, spent fuel generatedin any reactor can be stored safely and.without significant environmental impactsfor at least 30 years beyond the expiration of that reactor's operating licenseat the reactor's spent fuel storage basin, or at either onsite or offsite inde-pendent spent fuel storage installations. The staff also finds reasonable assur-ance that independent spent fuel storage will be made available, if such sto-rage capacity is needed.
In summary, the applicant is providing sufficient spent fuel storage capacityfor operations beyond the year 2000. Before this time, a Federal repositoryshould be available to accept commercial spent fuel. In the event of an emer-gency, the Department of Energy is empowered by the National Waste Policy Actto provide interim storage.
NMP-2 FES 9-4

9.4.2.6 Nonradioactive Waste Management Systems
9.4.2.6.1 Aqueous Discharges
NMPC-4
The applicant states that the New York Department of Environmental Conserva-tion has approved increasing the average flow of sanitary wastewater (out-fall 030) to 120,000 gpd. A revised SPDES permit reflecting this change wasincluded with the applicant's letter.
Staff Response
The text has been changed to reflect this comment.
NMPC-11
The applicant notes that the SPDES pH limitation on the wastewaters from re-generation of ion exchange resins used in the makeup demineralization watertreatment system is 6.0 to 9.0.
Staff Response
The text has been changed to reflect this comment.
NMPC-14
The applicant comments that the text should be revised to stipulate that treatedradwaste is discharged to Lake Ontario.
* Staff Response
The suggested change has been made.
9.4.2.6.2 Solid Discharges
NMPC-15
The applicant states that the text should specify that cooling tower sludge,sanitary waste sludge, and debris from trash racks and traveling screens willbe the primary nonradioactive solid wastes from NMP-2.
Staff Response
The text has been revised to incorporate this change.
.9.4.2.7 Power Transmission System
NMPC-1
See question NMPC-1 in Section 9.1.1 above.
Staff Response
The text has been changed to reflect this comment.
NMP-2 FES 9-5

NMPC-5
The applicant states that the discussion of transmission line support structuresshould be revised to reflect'the current design. Between the Scriba and Volney
j Stations, the transmission line support structures will be wood-pole, H-framestructures, with tubular steel poles at angle locations. Between Scriba Stationand NMP-2, tubular steel poles will be used.
Staff Response
The text has been revised to reflect this comment.
9.4.3 Project-Related Environmental Descriptions
9.4.3.1 Hydrology
9.4.3.1.1 Site and Facilities
NMPC-19
The applicant suggests that the text be clarified to state that the east andwest berms, the Lake'Road berm, and the southeast berm were constructed toprotect the NMP-1 and NMP-2 complex from flooding.
Staff Response
The suggested change has been made.
9.4.3.1.2 Hydrosphere
9.4.3.1.2.2 Groundwater
NMPC-20
The applicant states that the local water table varies from about 255 feet mslnear the plant to about 244 feet msl near the lake.
Staff Response
The text has been revised to reflect this comment.
EPA-8
EPA asks that the hydraulic head relationships between the unconfined andconfined aquifers be addressed.
Staff Response
According to water levels measured in boreholes by the applicant, there do notappear to be significant differences in hydraulic heads between the unconfinedaquifer and the lower confined aquifers. Close to the lake, a boring into thetransition zone between the Oswego Sandstone and the Pulaski Formation produceda hydraulic head about 7 feet higher than the unconfined aquifer, but stillabout 5 feet below ground level. No text change is necessary.
NMP-2 FES 9-6

9.4.3.2 Water Quality
NMPC-6
The applicant notes that the appropriate unit for the water quality data inTable 4.5 is mg/L.
Staff Response
The suggested change has been made.
9.4.3.3 Meteorology
NMPC-17
The applicant notes that winds at the site are also measured at the 30-m level.
Staff Response
The suggested change has been made.
9.4.3.5 Endangered and Threatened Species
9.4.3.5.1 Terrestrial
NMPC-8
The.applicant cites three recent references that indicate that the timber rattle-snake is not likely to occur in the Oswego County coastal zone area.
Staff Response
The text has been changed to reflect this comment.
9.5 Environmental Consequences and Mitigating Actions
9.5.3 Water
9.5.3.1 Water Use
DEC-1
DEC states that the value of 1000 gpd for the amount of water needed from theCity of Oswego for potable and sanitary purposes seems low and requestsclarification.
Staff-Response
The applicant has revised the estimate of the amount of water needed from theCity of Oswego upward to 22,000 gpd. Section 5.3.1 has been modified to re-flect this new figure.
NMP-2 FES 9-7

9.5.3.2 Water Quality
DEC-3
DEC states that the water quality certification should be revised to reflect alimit of 0.005 mg/L residual chlorine because of the abundance of salmonoidsaround the effluent.
Staff Response
DEC subsequently withdrew this comment.
9.5.3.3 Hydrologic Alterations
EPA-9
EPA requests additional information on drawdown by a permanent dewatering system(last paragraph of Section5.3.3.1).
Staff Response
The drawdown created by the plant's dewatering system is described in the FSAR.FSAR Figure 2.4-13 shows the drawdown progression, and FSAR Figure 2.4-14 showsthe groundwater contours used in design. On the basis of these cont6urs, thestaff does not expect the dewatering system to affect any offsite wells overthe life of the plant. No text change is necessary.
NMPC-19
See question NMPC-19 in Section 9.4.3.1.1.
Staff Response
The suggested change has been made.
9.5.3.4 Water Use Impacts
9.5.3.4.1 Analysis of the Hydrologic Alterations Posing Potential Impacts toWater Use and Availability
9.5.3.4.1.2 Groundwater
EPA-10
EPA states that more data are necessary to assess the impact of the "minor"cone of depression..
Staff Response
See the response to EPA-9 in Section 9.5.3.3.1 above.
NMP-2 FES 9-8

9.5.4 Air Quality
EPA-6
EPA comments that the applicant must substantiate and detail the claim that"exceedances (of secondary TSP levels) were in the vicinity of two industrialfacilities."
Staff Response
The applicant's analysis of total suspended particulate (TSP) monitoring resultsis in ER-OL Section 2.9.3. The applicant has noted that the exceedances of theNational Ambient Air Quality Secondary TSP Standard were associated with south-east winds and that the probable cause of the exceedances was fugitive dust fromlocal construction activities and rural roadways. Because the applicant is notrequired to perform PSD analyses for this application, the staff sees no needto perform the detailed assessments requested by EPA.
EPA-7
EPA comments that the applicant should provide annual summaries of air pollu-tant sampling and compare the results to the National Ambient Air QualitySociety (NAAQS) Standards.
Staff Response
In ER-OL Tables 2.9.1 through 2.9.7, the applicant has presented the maximumpollutant levels measured for each of the criteria pollutants monitored for theappropriate time periods that coincide with the NAAQS Primary and SecondaryStandards and the New York State Air Quality Standards on a year-by-year basis.In ER-OL Section 2.9, in the discussion of ambient air quality, the measuredair quality levels for each of the pollutants measured are compared to theNAAQS Primary and Secondary Standards and the New York State Air QualityStandards.
9.5.4.2 Other Emissions
EPA-5
EPA states that the DES does not adequately address specific emission data forthe cooling tower, nor does it provide detailed information on emissions fromthe standby diesel generators, high pressure core spray generator, or the firepump.
Staff Response
ER-OL Sections 5.5.2.2 and 3.6.1.3.1 provided data indicating that coolingtower drift would be considerably below the Federal and state air qualitystandards for particulate emissions., Biological effluents were not addressed.ER-OL Tables 3.6.2, 3.6.3, and 3.6.4 provide source parameters and emissionsusing the EPA AP-42 guidance.
NMP-2 FES 9-9

DEC-2
DEC comments that the applicant must obtain construction and operationspermits for diesel engines greater than 400 hp.
* Staff Response.
The comment has been noted. However, these permits are not within the areaof the staff review.
9.5.5 Terrestrial and Aquatic Resources
9.5.5.1 Terrestrial Resources
DEC-4
DEC states that the FES should include further discussion of the potential forbird strikes on the cooling tower and potential mitigation measures (aftera monitoring program determines if mitigation measures are necessary).
* Staff Response
The text has been revised to include further justification for not requiringmonitoring of birds killed as a result of collision with the natural draftcooling tower. Nevertheless, the Environmental Protection Plan (to be issuedas OL Appendix B) will specify that: "any occurrence of an unusual or impor-tant event that indicates or could result in significant environmental impactcausally related to plant operation shall be recorded and reported to the NRCwithin 24 hours, followed by a written report." An excessive number of birdskilled is an example of such an unusual event.
9.5.5.2 Aquatic Resources
9.5.5.2.5 Aquatic Resource Impact Summary
NMPC-18
The applicant suggests substituting "entrapped" for "impinged," because fishthat are diverted and returned to the lake are not "impinged."
Staff Response
The suggested changes have been made.
9.5.8 Socioeconomic Impacts
DEC-7
DEC comments that the DES did not address traffic management relating to sta-tion operation.
NMP-2 FES 9-10

Staff Response
The staff assessed potential traffic problems associated with the operation ofthe station and concluded they would be minor, especially compared to thetraffic impacts experienced during construction. No text change is needed.
9.5.9 Radiological Impacts
9.5.9.3 Radiological Impacts from Routine Operation
9.5.9.3.1 Radiation Exposure Pathways: Dose Commitments
9.5.9.3.1.2 Public Radiation Exposure: Transportation of Radioactive Materials
DEC-6
DEC states that the FES should discuss the mode of transportation and the routesthat will be used to dispose of nuclear waste.
* Staff Response
The applicant is aware of his responsibility in regard to the modes and routesof transportation of nuclear waste and will follow the appropriate regulations.All solid waste containers, shipping casks, and methods of packaging meet appli-cable Federal and state regulations. Waste will be shipped to a licensed dis-posal site, in accordance with applicable NRC and Department of Transportationregulations.
9.5.9.3.2 Radiological Impacts on Humans
EPA-4
EPA comments that the FES should provide a dose assessment of the combinedeffects of the liquid gaseous effluents from NMP-2, NMP-1, and the James A.FitzPatrick Nuclear Power Plant.
Staff Response
As part of its evaluation, the staff did consider the combined impacts of thethree plants and concluded that, under normal operations, the facility iscapable of operating within the standards of 40 CFR 190. The data supportingthis conclusion were inadvertently omitted from the DES. However, the materialhas been added to Appendix D (new Table D-8).
9.5.9.3.4 Radiological Monitoring
9.5.9.3.4.1 Preoperational
NMPC-23
The applicant states that Table 5.5, "Preoperational radiological environmentalmonitoring program summary," is based on ER-OL Table 6.2-1, which describes theproposed operational radiological monitoring program. Although the latter isessentially a continuation of the preoperational program, the applicant states
NMP-2 FES 9-11

that there is a significant difference in the food products section. Duringthe preoperational program, six samples of fruits and/or vegetables will becollected from available offsite locations with the highest site average D/Q.
Staff Response
ER-OL Section 6.2.1 states: "the environmental monitoring program is expectedto be modified by the NRC with the issuing of the Radiological Effluent Tech-nical Specifications (RETS)." These RETS have been implemented by Amendment 66to Facility Operating License DPR-63 for NMP-1. The applicant is using theUnit 1 operational monitoring program as specified in the RETS as the preopera-tional program for NMP-2, and the text has been revised accordingly.
9.5.9.4.4 Mitigation of Accident Consequences
(1) Design Features
NMPC-21
The applicant notes that the spent fuel area is part of the refueling floorventilation system.
Staff Response
The text has been revised accordingly.
(3) Emergency Preparedness
DEC-5
DEC states that emergency preparedness should include local [fire] districts,ambulances, and emergency services, because they would be directly involvedin an emergency.
Staff Response
The discussion in Section 5.9.4.4(3) has been expanded to address this comment.
9.5.9.4.5 Accident Risk and Impact Assessment
(5) Releases to Groundwater
EPA-8
See question EPA-8 in Section 9.4.3.1.2.2.
Staff Response
See the response to EPA-8 in Section 9.4.3.1.2.2. No text change is necessary.
EPA-9
See question EPA-9 in Section 9.5.3.3.1.
NMP-2 FES 9-12

Staff Response
See the response to EPA-9 in Section 9.5.3.3.1. No text change is necessary.
EPA-11
EPA states that a detailed plan and a map of monitoring well locations is neededto assess the time it would take for any contaminants to travel through theaquifer to the lake.
Staff Response
The applicant is not required.to maintain an onsite well monitoring program dur-ing operation. The travel time for groundwater from the reactor building toLake Ontario is 6.3 years, and the travel times for strontium and cesium aremuch longer. These travel times would allow ample time for monitoring andmitigation measures after an accident. The long travel times also would resultin very low concentrations of radionuclides at the drinking water intakes onLake Ontario. No text change is necessary.
EPA-12
EPA states that additional information should be provided on the possible con-tamination of drinking water in the event of a meltdown.
Staff Response
See the response to EPA-11 immediately above. No text change is necessary.
(8) Comparison of NMP-2 Risks with Other Plants
NMPC-16
The applicant notes thatarrows on Figures 5.13 and 5.15 are improperly placed.
Staff Response
The arrows have been deleted from the figures.
9.5.11 Decommissioning
EPA-3
EPA wants assurance that funds (for decommissioning) will be available whenrequired and asks that the issue of termination of the licensee's financial re-sponsibilities be clarified.
Staff Response
The Commission's rule on decommissioning (Decommissioning Criteria for NuclearFacilities), which was issued on February 11, 1985, for public comment, setsforth the Commission's policy on decommissioning. This policy includes minimumfinancing requirements and acceptable decommissioning methodologies. NMP-2will be subject to this rulemaking.
NMP-2 FES 9-13

9.5.13 Emergency Planning Impacts
DEC-8
DEC states that the FES should include specific details for the emergency evacua-tion plans, including transportation impacts.
Staff Response
See the response to-DEC-5 in Section 9.5.9.4.4(3).
9.5.14 Environmental Monitoring
9.5.14.1 Terrestrial Monitoring
NMPC-9
The applicant questions the need for an Environmental Protection Plan (mentionedin Section 5.14.1 and elsewhere in the DES) because (1) the DES does not iden-tify any environmental monitoring programs (except for the aquatic program to beconducted in accordance with SPDES and for the radiological monitoring programto be defined in the Radiological Effluent Technical Specifications), and(2) general stipulations--such as prompt reporting of unusual events--can beincorporated into the Appendix A Technical Specifications.
Staff Response
It is NRC policy to fnclude an Environmental Protection Plan as Appendix B tothe OL as a mechanism for keeping the NRC informed of environmental problems(potential and actual) after a facility is licensed.
9.6 Evaluation of the Proposed Action
9.6.2 Irreversible and Irretrievable Commitments of Resources
NMPC-1
See question NMPC-1 in Section 9.1.4.
Staff Response
The text has been changed to reflect this comment.
9.6.4 Benefit-Cost Summary
NMPC-22
The applicant suggests that Section 6.4 be revised to (1) assume a capacityfactor of 55%, which, the applicant says, is a more reasonable approximation;(2) change "(1987 dollars)" to "(for the year 1987)"; and (3) emphasize thatthe $128 million annual production cost savings projected by the staff exceedsthe estimated total annual production cost of $98 million.
NMP-2 FES 9-14

Staff Response
Section 6.4 has been modified to reflect the staff's conservatism in using a55% capacity factor. The staff is generally conservative in its analysis indeveloping a "worst case" scenario. Although the staff agrees that from timeto time annual average capacity factors of 65% or more may be achieved, theaverage of all annual capacity factors will probably range between 55% and 65%,with factors around 60% likely.
In regard to (2), the staff has added "constant" to "1987 dollars" to minimizethe possibility of any ambiguity.
Regarding (3), the staff considers the DES analysis sufficiently clear; no addi-tional emphasis is necessary.
9.10 Appendices
9.10.4 Appendix D - Examples of Site-Specific Dose Calculations
EPA-4
EPA suggests that the FES provide an assessment of the combined effects ofliquid gaseous effluents from NMP-2, NMP-1, and the nearby James A. FitzPatrickPower Plant.
- Staff Response
The staff performed such an assessment and concluded that NMP-2 is capable ofoperating within the standards of 40 CFR 190. The data supporting this con-clusion were inadvertently omitted from the DES, but are in Appendix D of theFES (new Table D.8).
NMPC-10
The applicant, states that Table D.5 should note that a transit time of 46 hoursand a dilution factor of 263 apply to the nearest accessible shoreline.
Staff Response
The table has been revised to reflect this comment.
NMP-2 FES 9-15

Table 9.1 Cross-reference of comments on the DES and sectionsof this report in which they are addressed
Comment Section(s) Comment Section(s)
EPA-1 9.4.2.5 NMPC-11 9.4.2.6.12 9.4.2.5 -- 12 9.4.2.1, 9.4.2.2.33 9.5.11 13 9.1.24 9.5.9.3.2, 9.10.4 14 9.4.2.6.15 9.5.4.2 15 9.4.2.6.26 9.5.4 16 9.5.9.5(8)7 9.5.4 17 9.4.3.38 9.4.3.1.2.2, 9.5.9.4.5(5) 18 9.1, 9.5.5.2.59 9.5.3.3.1, 9.5.9.4.5(5) 19 9.4.3.1.1, 9.5.3.3.110 9.5.3.4.1.2 20 9.4.3.1.2.211 9.5. 9.4.5(5) 21 9.5.9.4.4(1)12 9.5.9.4.5(5) 22 9.6.4
NMPC-1 9.1, 9.4.2.7, 9.6.2 23 9.5.9.3.4.12 9.1 24 9.4.2.3.13 9.1, 9.6.2 DEC-1 9.5.3.14 9.4.2.6.1 2 9.5.4.25 9.4.2.7 3 9.5.3.26 9.4.3.2 4 9.5.5.17 9.4.2.2.1 5 9.5.9.4.4(3)8 9.4.3.5.1 6 9.5.9.3.1.29 9.5.14.1 7 9.5.810 9.10.4 8 9.5.13
NMP-2 FES 9-16

APPENDIX A
COMMENTS ON THE DRAFT ENVIRONMENTAL STATEMENT
NMP-2 FES Appendix A


UDSA-E
United StatesDepartment of
f s Agriculture
EconomicResearchService
Washington, D.C.20250
August 17, 1984
Mr. A. SchwencerChief, Licensing Branch No. 2Division of LicensingU.S. Nuclear Regulatory CommissionWashington, D.C. 20555
Dear Mr. Schwencer:
Thank you for forwarding the Draft Environmental Statement concerning
the issuance of operating license to the Niagara Mohawk Power
Corporation for startup and operation of the Nine Mile Point Nuclear
Station Unit 2 in Scriba, New York.
We have reviewed Docket Number 50-410
SiLncerely,
J' A. MI QSKIrector, NabAra' ResourceEconomics Division
and have no comments.
NMP-2 FES 1 Appendix A

DEPARTMENT OF THE ARMY
BUFFALO DISTRICT, CORPS OF ENGINEERS
1776 NIAGARA STREET
BUFFALO, NEW YORK 14207
NCBCO-S 14 September 1984
SUBJECT: Request for Comments Dated 9 August 1984 on the DocumentEntitled "Draft Environmental Impact Statement Related tothe Operation of Nine Mile Point Nuclear Station Unit No. 2"
Mr. Albert SchwencerChief, Licensing Branch No. 2Division of LicensingU.S. Nuclear Regulatory CommissionWashington, DC 20555
Dear Mr. Schwencer:
I have reviewed the subject document which was misdirected to the Corps ofEngineers New York District office and have no comments to offer at thistime.
I would appreciate receiving a copy of the final EIS for this project as.soon as it becomes available.
Correspondence pertaining to this matter should be addressed to the DistrictCommander, U.S. Army Engineer District, Buffalo, 1776 Niagara Street,Buffalo, NY 14207, ATTN: Mr. Paul Leuchner. If you have any questions orrequire additional information, please contact Mr. Leuchner of my RegulatoryBranch at 716-876-5454, extension 2321.
Sincerely,
ROBERT R. HARDIMANColonel, Corps of EngineersDistrict Commander
NMP-2 FES 2 Appendix A

NMFS
,~UNTED STATES DEPARTMENT OF COMMERCENational Oceanic and Atmospheric Administration
U-1 ~Washington, D.C. 20230
OFFICE OF THE ADMINISTRATOR
Mr. Albert SchwencerChief, Licensing Branch No. 2Division of LicensingNuclear Regulatory CommissionWashington, DC 20555
Dear Mr. Schwencer:
This is in reference to your draft environmental impact statementrelated to the operation of the Nine Mile Point Nuclear Station, UnitNo. 2. Enclosed are comments from the National Oceanic and AtmosphericAdministration.
We hope our comments will assist you. Thank you for giving us anopportunity to review the document. We would appreciate receiving twocopies of the final environmental impact statement.
Sincerely,
'- I -I
?A oyce M. WoodChief, Ecology and
Conservation Division
-r-(
Enclosure
DC:das
NMP-2 FES .3 Appendix A

NMFS
i I£ \\ UNITED STATES DEPARTMENT OF COMMERCE/ .4 National Oceanic and Atmospheric Administration
NATIONAL MARINE FISHERIES SERVICE
Services DivisionHabitat Protection Branch14 Elm StreetGloucester, Massachusetts 01930
AUG 3 11984Ms. Mary F. HaugheyDivision of LicensingU.S. Nuclear Regulatory CommissionWashington, D.C. 20555
Dear Ms. Haughey:
The National Marine. Fisheries Service (NMFS) has reviewed theDraft Environmental Impact Statement (DEIS) related to the operationof Nine Mile Point Nuclear Station, Unit No. 2. Nine Mile PointNuclear Station is located on Lake Ontario in the Town of Scriba,Oswego County, New York.
In view of the installation of the natural draft cooling toweras well as other mitigating measures at the site, the NMFS concludesthat the operation of Nine Mile Point Unit No. 2 will have only aminor impact on the living aquatic resources of the area. Sincethis conclusion is in line with the Nuclear Regulatory Commissionand is thoroughly discussed in the DEIS we have no comments tooffer.
Sincerely,
P•-Bruce E. Higgins
Acting Branch Chief
NMP-2 FES 4 Appendix A
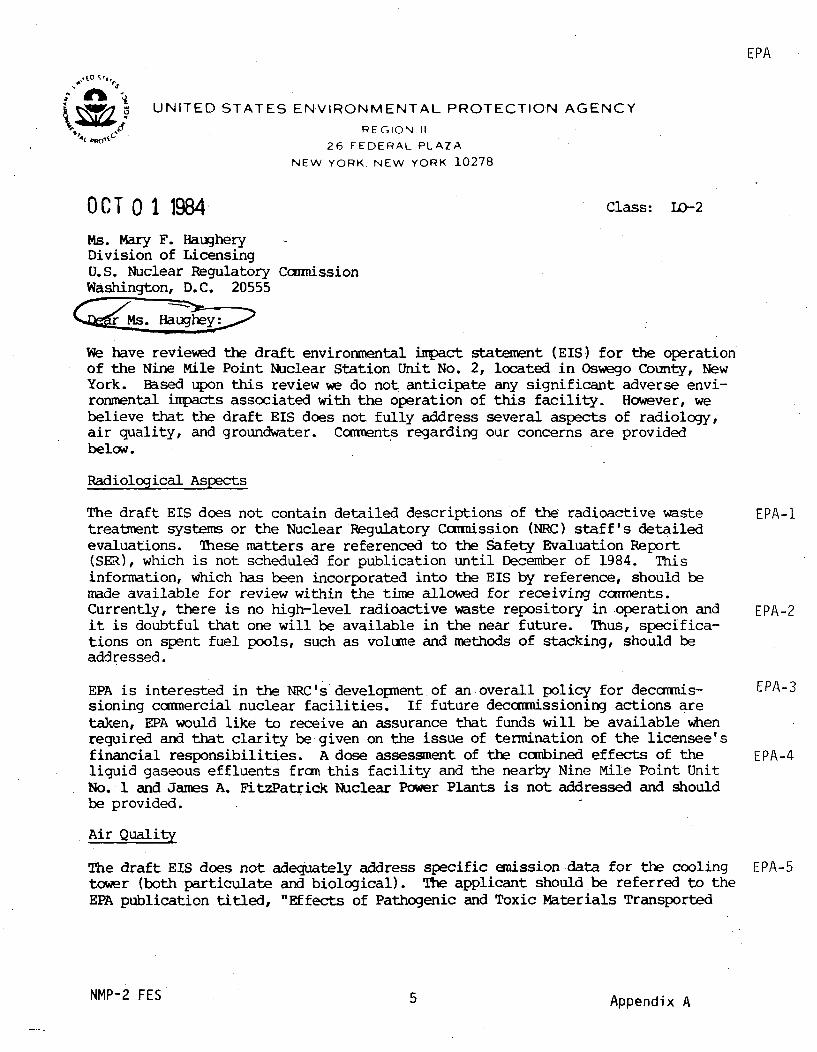
EPA
UNITED STATES ENVIRONMENTAL PROTECTION AGENCYREGION II
26 FEDERAL PLAZA
NEW YORK, NEW YORK 10278
OCT 0 1 1984 Class: 10-2
Ms. Mary F. Haughery -Division of LicensingU.S. Nuclear Regulatory CommissionWashington, D.C. 20555
We have reviewed the draft environmental impact statement (EIS) for the operationof the Nine Mile Point Nuclear Station Unit No. 2, located in Oswego County, NewYork. Based upon this review we do not anticipate any significant adverse envi-ronmental impacts associated with the operation of this facility. However, webelieve that the draft EIS does not fully address several aspects of radiology,air quality, and groundwater. Comments regarding our concerns are providedbelow.
Radiological Aspects
The draft EIS does not contain detailed descriptions of the radioactive waste EPA-itreatment systems or the Nuclear Regulatory Commission (NRC) staff's detailedevaluations. These matters are referenced to the Safety Evaluation Report(SER), which is not scheduled for publication until December of 1984. Thisinformation, which has been incorporated into the EIS by reference, should bemade available for review within the time allowed for receiving comnents.Currently, there is no high-level radioactive waste repository in operation and EPA-2it is doubtful that one will be available in the near future. Thus, specifica-tions on spent fuel pools, such as volume and methods of stacking, should beaddressed.
EPA is interested in the NRC's developnent of an overall policy for deccmmis- EPA-3sioning commercial nuclear facilities. If future decommissioning actions aretaken, EPA would like to receive an assurance that funds will be available whenrequired and that clarity be given on the issue of termination of the licensee'sfinancial responsibilities. A dose assessent of the combined effects of the EPA-4liquid gaseous effluents from this facility and the nearby Nine Mile Point UnitNo. 1 and James A. FitzPatrick Nuclear Power Plants is not addressed and shouldbe provided.
Air Quality
The draft EIS does not adequately address specific emission data for the cooling EPA-5tower (both particulate and biological). The applicant should be referred to theEPA publication titled, "Effects of Pathogenic and Toxic Materials Transported
NMP-2 FES 5 Appendix A

EPA2
Via Cooling Device Drift, Volumes 1 and 2 (EPA-600/7-79-251 a and b)". Detailedinformation on the emissions from the stand-by diesel generators, high-pressurecore spray generator, and the fire punp has not been provided. This informationshould include engine size (cubic inches/cylinder and total cubic inches/engine),fuel type, make and model, and maximnum fuel capacity (gallon/hour emissionfactors).
The applicant must estimate annual pollutant emission rates for the auxillarygenerating equipment to determine if the source will fall under the Preventionof Significant Deterioration (PSD) requirements. We understand the units arepurely for emergency situations with estimated use of 18 hours per month. Theapplicant may have to accept a permit condition to maintain emissions below "deminimis" levels. These levels are defined in the PSD regulation for pollutantscommonly emitted by diesel generators. The emission rates can be obtained fromthe generator vendors and will be for SO2, NOx, CO, and particulates, dependingon the types of fuels used. The EPA guide to emission rates, AP-42, should beused as a source of reference.
EPA-6 The applicant should substantiate the claim that industrial sources in the areaare responsible for total suspended particulate (TSP) secondary standard viola-tions at two of the power plant's monitoring sites. The applicant should ana-lyze the TSP data at each of its monitoring sites and review all violations ofthe secondary TSP standard (24-hour, second highest monitored value(s); includ-ing the meteorological conditions which accompanied these concentrations). Thisreview should include also include hourly wind speed, wind direction, and atmos-pheric stability for the 24 hour period of the violations(s). Please indicatethe type(s) of industry located in the vicinity which are responsible for thesecondary violations and estimate their impact using dispersion models to demon-strate their asssociated impacts.
EPA-7 The applicant should summarize all pollutant levels sampled and relate thesevalues to the National Ambient Air Quality Standards (NAAQS). The sumn-naryshould be addressed on a year-by-year basis for each monitoring site conparingthe maximun pollutant levels with the appropriate time period for that pollutant(e.g., 1 hr., 3 hr., 8 hr., 24hr., etc.).
If there are any questions concerning the specific items mentioned above, theapplicant should contact Mr. Fran Gombar of EPA's Air Programs Branch at (212)264-2058.
Groundwater Protection Aspects
EPA-F The applicant should address the hydraulic head relationships between the un-confined and confined aquifers. T-e information provided in the draft EIS is
EPA-9 uiiciear concerning this matter. OAdditional information is also requested onEPA-10 the drawdown by a permanent dewatering system. Water table maps and the
amount of the drawdown would be needed to assess the impact of the "minor"EPA-11 cone of depression created in the groundwater table. A detailed plan and a
map of monitoring well locations is also needed to assess the travel time forEPA-12 any contaminants to travel through the aquifer to the lake. Additional infor-
mation should be provided to assess possible contamination of drinking watersupplies from radionuclides in the event of a meltdown.
NMP-2 FES 6 Appendix A

EPA
We thank you for the opportunity to coment and if there are any questionsconcerning this matter, please feel free to contact Mr. Christopher Militscherof m• staff at (212) 264-0522.
Sincerely yours,
Richard M. Walka, ChiefEnvironmental Impacts Branch
NMP-2 FES 7 Appendix A

NMPC
TNNIAGARAUMOHAWK
NIAGARA MOHAWK POWER CORPORATION/300 ERiE BOULEVARD WEST. SYRACUSE. NY. 13202/TELEPHONE (2315) 474-1511
October 1, 1984
Mr. Darrell G. Eisenhut, DirectorDivision of LicensingOffice of Nuclear Reactor RegulationU.S. Nuclear Regulatory CommissionWashington, DC 20555
Dear Mr. Eisenhut:
Re: Nine Mile Point Unit 2Docket No. 50-410Comments on Draft Environmental Statement
Enclosed are Niagara Mohawk Power Corporation's comments on the DraftEnvironmental Statement Related to the Operation of Nine Mile Point'NuclearStation, Unit No. 2.
Very truly yours,
C. V. ManganVice President
Nuclear Engineering & Licensing
JAM:jaEnclosure
NMP-2 FES 8 Appendix A

NMPC
NIAGARA MOHAWK POWER CORPORATION
COMMENTS ON DRAFT ENVIRONMENTAL
STATEMENT RELATED TO THE OPERATION
OF NINE MILE POINT NUCLEAR STATION, UNIT NO. 2
1. On Page vii of the Summary and Conclusions, on Page 4-7 (Section 4.2.7, NMPC-1
line 6-8) and on Page 6-1 (Section 6.2, lines 3-5), it is stated that the
impacts from construction of the transmission line are less than expected
because the 365 kV Nine Mile 2-Volney line was realigned so that it is
parallel to existing lines. Impacts from construction of the
transmission line are less than expected at the Construction Permit stage
because of the design change from 765 kV to 345 kV, not because the line
was realigned so that it is parallel to existing lines. Both the
originally proposed 765 kV and the currently proposed 345 kV Nine
Mile 2-Volney transmission line parallel the existing transmission
lines. Impacts associated with construction of the 345 kV design are
less, since no additional right of way had to be acquired and since less
clearing is required compared to the 765 kI alternative.
2. On Page vii of the Summary and Conclusions, Item (5)(e), it is stated NMPC-2
that The applicant will continue an infrared aerial photography
program to assess potential salt drift impacts to vegetation." This
statement contradicts the conclusion presented in Section 5.14.1, "With
three more years of experience in analyzing effects of cooling tower
drift, the staff no longer believes it is necessary to monitor for
possible damage when the drift deposition is as low as predicted for
NMP-2" and should, therefore, be deleted.
3. On page vi of the Summary and Conclusions, Item (5)(d), it is stated that NMPC-3
"...construction activities have disturbed about 46.7 hectares (116
acres). In the same paragraph and on Page 6-1, Section 6.2, it is
further indicated that construction activities disturbed more land than
was anticipated during the Final Environmental Statement - Construction
Permit Stage (FES-CP), in part resulting from the changes in the cooling
system design. As indicated in Table 5.1.1 of the Unit 2 Environmental
Report - Operating License Stage, the total area disturbed by
construction is 56.02 hectares (138.40 acres). This compares to a
NMP-2 FES 9 Appendix A

predicted disturbance of 40 acres in the Final Environmental Statement -
Construction Permit Stage. The change in cooling system design accounts
for only a small part of this discrepancy (about 3.7 acres). The major
reasons for the difference between the actual area disturbed during
construction and the predicted area disturbed is that the area required
for construction laydown.(79.35 acres), parking (10.44 acres) and spoil
material (11.79 acres) was underestimated at the Construction Permit.
stage.
NMPC-4 4. On Page 4-6, it is stated that "The SPOES permit limits the effluent
(outfall 030) to a flow of 65,000 gpd... The applicant anticipates the
flow limit will be revised to 120,000 gpd." Niagara Mohawk has received
approval from the New-York State Department of Environmental Conservation
to increase the average flow associated with outfall 030 (sanitary
wastewater) to 120,000 gpd. A revised State Pollutant Discharge
Elimination System (SPDES) Permit reflecting this change is enclosed with
these comments.
NMPC-5 5. On page 4-7 (Section 4.2.7, lines 8-11), the types of supporting
structures that will be employed along the Nine Mile 2-Volney
transmission line are identified. This discussion should be revised to
reflect the current design as approved by the New York State Public
Service Commission. Between Scriba Substation and the Volney Substation,
the supporting structures of the transmission line will be wood-pole,
H-frame structures with tubular steel poles at angle locations. Between
Scriba Substation and Unit 2, tubular steel poles will be employed.
NMPC-6 6. No units are identified on Table 4.5 (Page 4-26). The appropriate units
are mg/l.
NMPC-7 7. In Section 4.2.2.1 (Page 4-2, lines 6-11),.a discussion of soil types at
the Unit 2 site is provided. This discussion should be clarified to
indicate that the soil mapping units within the site boundary which are
classified as prime farmland (Sodus) and farmland of statewide importance
(Scriba, Ira and Ira-Sodus), by the U.S. Soil Conservation Service, are
located along the transmission right .of way south of Lake Road and are
not affected by the main plant facilities. Further, since agriculture is
not an incompatible use along transmission line rights-of-way, it is not
NMP-2 FES 10 Appendix A

NMPC
reasonable to conclude that "this land [important farmland] is
irreversibly committed."
8. On Page 4-16, Paragraph 4, lines 13-15, it is stated that "The timber NMPC-8
rattlesnake (Crotalus horri'dus) is 'likely to occur on the Unit 2 site or
environs (Environmental Report Table 2.4-13)' and is listed by the state
as threatened." The information provided on the timber rattlesnake in
Environmental Report - Operating License Stage Table 2.4-13 was based on
a 1958 Field Guide to Reptiles and Amphibians of Eastern North America by
R. A. Conant. This reference cited the Oswego County coastal zone area
as being within the northern extent of this species' range.
More recent references indicate that the timber rattlesnake is not likel\
to occur in the Oswego County coastal zone area. A 1976 habitat and
wildlife inventory of the Oswego County coastal zone area conducted by
the Rice Creek Biological Field Station (Environmental Report - Operatin,
License Stage Reference No. l)-did not identify the timber rattlesnake
during literature and field investigations. In addition, a 1979 Audubon
Society Field Guide to North American Reptiles and Amphibians authored by
J. L. Behler identifies the northern tip of the timber rattlesnake's
range in the vicinity of Syracuse-Cortland, more than 30 miles south of
the site. Finally, an article appearing in the New York State
Conservationist (July-August 1981 authored by William S. Brown) reports
the timber rattlesnake as having only scattered distribution in northern
New York. According to Brown, the availability of suitable wintering
habitat is the limiting factor for this species in the northern extent of
its range. Suitable wintering habitat does not exist in the Oswego
County coastal zone area.
9. In Section 5.14 (Environmental Monitoring) and in other sections of the NMPC-9
document, it is indicated that an Environmental Protection Plan will be
'included as an appendix to the operating license. Niagara Mohawk
questions the need for including an Environmental Protection Plan as an
appendix to the operating license for the following reasons.
(a) With the exception of a radiological monitoring program (which will
be defined in the Unit 2 Radiological Effluent Technical
Specifications) and an aquatic ecological monitoring program (which
NMP-2 FES 11 Appendix A

NMPC
will be conducted in accordance with State Pollutant Discharge
Elimination System Permit requirements), there are no environmental
monitoring programs identified in the Draft Environmental Statement
to warrant preparation of an Environmental Protection Plan.
(b) General conditions such as prompt reporting to the Commission of any
important or unusual events that could result in significant -
environmental impact causally related to station operation can be
incorporated into the Appendix A Technical Specifications.
The delegation of responsibilities for nonradiological monitoring
programs to other agencies such as the Environmental Protection Agency
and state water resource agencies is consistent with the Commission's
approach on other dockets. For example, on February 4, 1983, the
Commission requested Niagara. Mohawk to submit a change to the Nine Mile
Point Unit 1 (Docket No. 50-220) Environmental Technical Specifications
removing all portions of the specifications dealing with nonradiological
issues. A change request was submitted and an amendment subsequently
approved by the Commission.
NMPC-10 10. In Appendix D, Table D-5, a transit time of 46 hours and a dilution
factor of 263 are identified for the "nearest shoreline (Lake Ontarionear discharge area)." Table D-5 should be revised to clarify that a
transit time of 46 hours and dilution factor of 263 applies v.. the
nearest accessible shoreline. (Reference Environmental Report -
Operating License Stage Table 5A-2)
NMPC-11 11. On Page 4-5, Section 4.2.6.1, lines 6-9, it is stated that "Waste waters
from regeneration of ion exhange resins used in the makeup
demineralization water treatment system are treated by self-neutralization
of the acid and caustic components in a 227,000 liter (60,000 gallon)
tank to pH 6.5 to 8.5." The State Pollutant Discharge Elimination System
Permit effluent limitation imposed on this waste stream is pH 6.0 to 9.0,
not 6.5 to 8.5.
NMPC-12 12. Section 4.2.1 addresses changes/additions in respect to plant facilitiesmade since the Final Environmental Statement - Construction Permit
Stage. Besides the Energy Information Center and the cooling tower, the
NMP-2 FES 12 Appendix A

NMPC
new training center being constructed just west of the Energy Information
Center should be identified in this section. Niagara Mohawk will provide
a description and assessment of the new training center in the next
Environmental Report - Operating License Stage Supplement.
13. On Page 1-2, the status of Unit 2 compliance with the requirements of the NMPC-13Federal Coastal Zone Management Act is addressed. Subsequent to the
issuance of the Draft Environmental Statement, Niagara Mohawk submitted
(on July 26, 1984) certification to the New York Department of State that
the operation of Unit 2 will comply with the state's approved coastal
management program. Under the provisions of the Federal Coastal Zone
Management Act, the Department of State must respond to this consistency
certification within six months.
14. Section.4.2.6.1, Page 4-5, Paragraph 1 should be clarified to indicate NMPC-14
that treated liquid radwaste is discharged to Lake Ontario.
15. Section 4.2.6.2, Page 4-6, Paragraph I should be clarified to indicate NMPC-15
that the primary nonradioactive solid wastes from Unit 2 will be cooling
tower sludge, sanitary waste sludge and debris from the trash racks and
traveling screens.
16. On Figures 5.13 and 5.15, arrows on thep.X-axis are pointing to the Wolf NMPC-16
Creek plant rather than Nine Mile 2.
17. On Page 4-13, Paragraph 3, line 1, it is indicated that winds are NMPC-17
measured at the site at the 10 meter and 61 meter levels. Winds at the
site are also measured at the 30 meter level.
18. OnPage vi, Section (5)(a), line 6, it is stated that "The design will NMPC-18
include.., a diversion and return system for impinged fishes;..." Since
fish that are diverted and returned to the lake are not impinged, the
word 'impinged' should be replaced by the word 'entrapped' in this
sentence. (The same comment applies to Page 5-11, Paragraph 4, line 8.)
19. Section 4.3.1.1 (Page 4-8) and Section 5.3.3.1 (Page 5-4) should be NMPC-19
clarified to indicate that the east and west berms, Lake Road berm and
the southeast berm were constructed, as shown on Figure 4.1, to protect
the Unit 1 and Unit 2 plant complex from flooding.
NMP-2 FES 13 Appendix A

NMPC
NMPC-20 20. On Page 4-12, line 3, it is stated that "The local water table varies
from about 261 feet msl near the plant to about 244 feet msl (lake level)
near the lake..." This statement should be revised to indicate that the
local water table varies from about 255 feet msl near the plant to about
244 feet msl near the lake.
NMPC-21 21. On page 5-31, Paragraph 2, line 11, the Draft Environmental Statementinaccurately indicates that a filtered exhaust system encloses the spent
fuel pool. This statement should be deleted since the spent fuel pool
area is part of the refueling floor ventilation system.
NMPC-22 22. The Benefit Cost Summary contained in the Draft Environmental Statement
(Section 6.4) should be clarified to reflect the following points:
(a) The analysis conservatively assumes an annual average capacity factor
of 55 percent. Based on the historical performance of boiling waterreactors, a capacity factor of 65 percent would be a more reasonable
approxiination for Unit 2. Furtner, Unit 2's capacity factor can be
expected to.exceed the historical average on the basis of the
estimated 24 month interv-al between scheduled outages for the unit.Assuming a capacity factor of 55 percent understates the economic
benefits of Unit 2 by approximately 20 percent.
(b) Tne qualifier (1987 dollars)" used in this section is misleading in
that it infers that the benefits of Unit 2 will increase at the rate
of inflation. The qualifier should read "(for the year. 1987)."
(c) It should be emphasized in this section that the $128 million annual
production cost savings projected by the NRC staff, under the
conservative assumptions identified above, exceeds the estimated
total annual production cost of $98 million.
NMPC-23 23. Table 5.5 is entitled "Preoperational Radiological Environmental
Monitoring Program Summary." The source of information for this table is
Environmental Report - Operating License Stage Table 6.2-1 which
describes the proposed operational radiological monitoring program for
Jnit 2. Although the proposed operational radiological monitoring
program is essentially a continuation of the preoperational monitoring
NMP-2 FES 14 Appendix A

NMPC
program, there is one significant difference in respect to the food
products section. During the preoperational monitoring program, a total
of six (6) samples (utilizing at least two sections) of fruits and/or
vegetables will be collected from available off-site locations of hignest
calculated site average D/Q.
24. In several locations of the Draft Environmental Statement (Pages 4-3, 5-2 NMPC-24
and 5-4), it is stated that the maximum usage of water from the Oswego
City Water Supply for the Unit 2 sanitary system, personnel safety and
decontamination, emergency water supplies and humidifiers will be 3785
liters/day (1000 gallons/day). The source of this information was
Environmental Report-Operating License Stage Section 5.2.1.2. This
estimate has been revised. It is conservatively estimated that the
maximum usage of city water during normal operations will be 83,270
liters/day (22,000 gallons/day). This revised estimate of city water
usage does not alter the conclusion that the Unit 2 plant water
requirements represent a negligible ( 40.4%) increase in demand on the
Oswego City water supply.
NMP-2 FES 15 Appendix A

NMPC
New York State Department of Environmental ConservationDivision of Regulatory Affairs, Region 7•7431 Henry Clay BoulevardLiverpool , Ne,; York 13083(315) 428-4697 HEN' ( G. -TLLIA'AS
Commi33ionri~December 2, 1983
CERTIFIED MAIL*RETURN RECEIPT REQUESTED
Mr. J. M. Toennies, Envir. Affrs. Dir.Niagara Mohawk Power Corporation300 Erie Boulevard WestSyracuse, NY 13202
RE: MODIFICATION OF POLLUTANT DISCHARGEELIMINATION SYSTEM PERMITNO. NY- 000 1015
X)CýX T )X ScribaCOUNTY OF OSWEGONine Mile Point Nuclear Generation Station
Dear Mr. Toennies:
This is to inform you that pursuant to Environmental Conservation Law (CCL), Article i7,Title 8 (McKiiney's) and 6NYCRR, Part 757, the New York State Department of EnvironmentalConservation has made a determination to modify your referenced Pollutant DischargeEl imination Srstem Permit as:
0 indicated in the complete enclosed revised Permit which supersedes the previous Dermit
XPX' indicared in the following enclosed revised permit page(s) which su.ersed=- andorsupple-ant.) previous corresponding pages. The remainder of the Permit continuesin full force and effect.
XýMX follois: the flow was modified to reflect the increase from 65,000 GPD to120,000 GPD.
Unless otherwise specified, this modification will become effective immediately unlessyou petition, pursuant to ECL Section 17-0907, that you be given an opportunity to beheard in connection with this determination and where applicable, if no written objectionis received by this office within 30 days after receipt of this modification by theRegional Administrator of EPA. Any such petition for a hearing shall contain specificevidence to support your contention that a hearing is necessary and that you were notpreviously given an opportunity to be heard.
Sincerely,
A. A. CoburnRegional Permit Administrator
Joanne L. MarchEnvironmental Analyst Assistant
Enclosure
cc: Region ',o. 7-TechnicalMX. ý o qxx GArveWin. Garvey
A. AdamczykR. Spear .(EPA/NJ)
R. Baker (EPA)County Health Department
NMP-2 FES 16 Appendix A

NMPC
New York State Department of Environmental ConservationDivision of Regulatory Affairs, Region 77481 Henry Clay BoulevardLiverpool, New York 13088(315) 428-4697
December 14, 1983
HENRY G. WILLI[AMSCommissioner
CERTIFIED MAILRETURN RECEIPT REQUESTED
Mr. J. M. Toennies, Envir. Affrs. Dir.Niagara Mohawk Power Corporation300 Erie Boulevard WestSyracuse, NY 13202
RE: MODIFICATION OF POLLUTANT DISCHARGEELIMINATION SYSTEM PERMITNO. NY- 000 1015COO (T)(OW ScribaCOUNTY OF OswegoNine Mile Point Nuclear Generation Station
Dear Mr. Toennies:
This is to inform you that pursuant to Environmental Conservation Law (ECL), Article 17,Title 8 (McKinney's) and 6NYCRR, Part 757, the New York State Department of EnvironmentalConservation has made a determination to modify your referenced Pollutant DischargeElimination System Permit as:
0 indicated in the complete enclosed revised Permit which supersedes the previous permit
X)X" indicated in the following enclosed revised permit page(s) which sue:rsee (and/orsupplement) previous corresponding pages. The remainder of the Permit continuesin full force and effect.
XXDX follows: The chlorine requirement for the contact tank is being deleted,as per agreement with Niagara Mohawk and DEC.
Unless otherwise specified, this modification will become effective immediately unlessyou petition, pursuant to ECL Section 17-0907, that you be given an opportunity to beheard in connection with this determination and where applicable, if no written objectionis received by this office within 30 days after receipt of this modification by theRegional Administrator of EPA. Any such petition for a hearing shall cortain specificevidence to support your contention that a hearing is necessary and that you were notpreviously given an opportunity to be heard.
Sincerely,
A. A. Coburn.Regional Permit Administrator
Joanne L. March
Environmental Analyst Assistant
Enclosure
cc: Reqion No. 7-Technical
Wm. Garvey, BPS, PAS
A. AdamczykR. Spear (EPA/NJ)
R. Baker (EPA)County Health Department
NMP-2 FES 17 Appendix A

NMPC
Coies: R7 - K. DelPrete Facility ID No. : 00- 1po !0153. GarveyR. Baker Effective Date (EDP) : July , .1983R. SpearOswego County Hith. Dept. Expiration Date (ExDP) July 1, 1988Niagara Mohawk - LycomingORA - R7 Mr. Geisendorfer, Rm. 308, BWFO
N-E': YORK STATE DEPART-IT OF ENVIRONFE-NTAL CONSERVATIONSTATE POLLUTANT DISCEARGE ELIMINATION SYSTEM (SPDES)
DISCHARGE PERMIT
Special Conditions(Part I)
This SPDES permit is issued in compliance with Title 8 of Article 17of the Environmental Conservation Law of New York State and in compliance with theClean Wacer Act, as amended, (33 U.S.C. §1251 et. sea.) (hereinafter referred to as'the Act").
Per--itee Nare: Niagara Mzhawk Powtr Corp.
-ermi:zee S:raee: 300 Erie Boulevard West
Attn: Mr. J. M. Toenrnies,Env. Affairs Director
Per-m-i=tee Ci:y: Syracuse State: N.Y. Zin Code: 13202
is authcri:ed tz discharge from the facility described below:
Faclitv Name: Nine Mile Pt. Nuclear Generating Station Units #1 and 2
.acilizv• 'ocacion (C,T,V): Scriba (7)
Facili:y Maiing Address (Street): Lake Road
Faciliry .Mailine Address (City): Lycaing (T)
County: Oswego
State: N.Y. Zip Code: 13093
into receivine waters known as:
Lake Ontario Class A 5Spcial
in accordance *inh the effluent limitaticns, mcnitoring requirements and other conditionsset forzh in :his pe.-it.
This per-it and the authorization to discharee shall exoire on midnightof the expiration date shown above and the permittee shall not discharge after theeypirazion date unless this per--it has been renewed, or extended pursuant to law. To beauch.crized to discharge beyond the expiration date, the permittee shall apply for Permitrene:;al as crescribed by Sections 17-0803 and 17-0804 of the Environnen:al ConserationLaw and Parts 621, 752, and 755 of the Departments' rules and regulations.
By Aun~horit' of
6
Alternate Permit AdministratorDesignated ?.epresencative of Co=missioner of the
Deoartment of Envirornmental Conserve• on
Dazelane -S ien ature
NMP-2 FES 18 Appendix A

NMPC
Part I
Page 2 of 17Facility ID No.: "'Z 000 1015
EFTLUENT LIMITATIONS AlD MONITORING R.EQUIPDS_•TS
D-ring the period beginning July 1, 1983.and lasting until July 1, 1988
the discharges from the permitted facility shall be limitedverzictee as specified below:
Outfall Number &Effluent Paraebeter
Discharge LimitationsDaily Avg. Daily Max. Units
and monitored by the
Mnitoring Recmts.Measurement SampleFreuency Tp
Continuous CalculatedContinuous Metered
010 Condenser Cooling Water Unit #1
Flow*Discharge TemperatureIntake - Discharge
T anperature Difference a
Net Rate of addition of heat acvardde d
115
351.110.1
OF109kcal/hrr. ContinuousHourlyZ-1onthly
Mete-redCaloulated
12. -hr. C•-rcsite
011 Unit li Wastewater
Flow* BatchBatch before discharge
]1Oil and GreaseSuspended Solids'oHCyanide d
1550
/1
30.0 - 9.0 (Range).e
0.4
ng/l
SUnq/l
Calculated
Grab
I!
020 Storm Drainage (No Monitoring Required) Unit #i
021 Filter Backwash & Makeu= Demineralizer Water- Sunulv
Flow*Oil & GreaseSuspended SolidspH
306.0 - 9.0 (Range)
15so 0ng/lmg/lsu
BatchBatch each
discharge
CalculatedGrab
022 Security alilding Air Conditioning b
Oil and GreaseSuspended SolidspH
155030
6.0 - 9.0 (Pangel
Mr/l
Su
Bimonthly Grab
7.-20-2 (5.'0)?. 4
NMP-2 FES 19 Appendix A

NMPC
Part IPage 3 of 17Facility ID No.: Ny 000 1015
EFFLU-T LIMITATIONS AND MONITORING R.EQUIP.U=D S
During the period begining with initiation of preoperational testing (Unit #2)and lasting until EDP + 5 Yearsthe discharges from the permitted facility shall be limited and monitored by thepermittee as specified below:
Outfall Number &Effluent Parameter
Discharge LimitationsDaily Avg. Daily Max.
Monitoring Recmts.Measurement Sample
Units Frequency Type
001-006 Storm Drainage (No Monitoring Required)
007 Floor and Equipment Drains
Oil and GreaseSuspended SolidsPH
15so30
6.0 - 9.0 (Range)
mg/1mg/lSU
2/Month Grab
008 Screen Well Fish Diversion System (No Monitoring Required)
040 Cooling Tower Blowdown (Unit i 2 )c
Flow*Discharse Temperature 110(43.3) 0
F( 0C)
Intake - Discharge Temperature Difference 30(16.7 "Net Addition of Heat 0.12 x 10; kcal/hrTotal Residual Chlorine 0.2 0.5 mg/lpH 6.0.- 9.0 (Range) SU
Continuous Recorder
Daily
Continuous2/Week
CalculatedRecorderGrab
041 Unit #2 Wastewater (Including Demineralizer Reseneration Wastes, Filter Backwash,Floor Drains, & Treated Radioactive Wastese.)
Flow*Oil and Grease
Suspended SolidspH
15
50
mg/l
mg/lSU
Batch CalculatedGrab (once before
discharge)30
6.0 - 9.0 (Range)
FOOTNOTES
*Monitoring Requirement Only
aThe intake temperature shall be considered that temperature existing after intake water
tempering.bThese limits and monitoring requirements shall not apply if this wastewater is discharged
upstream of the sewage treatment facility.elThere shall be no discharge of heat from the main condensers except heat may be discharged
in blowdown from recirculated cooling water systems provided the temperature at which theblowdown is discharged does not exceed at any time the lowest temperature of recirculatedcooling water prior to the addition of.the makeup water.
dMonitoring and limits may be deleted following DEC evaluation of monitoring data.
U1-20-2(5/80)Pg. 4epH range of 4.0 - 9.0 is allowable for wastewater having a coroduct1vir Of less than
l0/NomFES
NMP-2 FES ,,4"U, Appendix A

NMPC
-art 74 of 17
--e l -7 -. D m To
::-in=--h .-l inbe g EDP ann ±astinm .til EDP + 5 years-_.t-ed -ac__- s-11 be 'ia-=zz s e• n: -_:-e e :=4c-,etee
T t-fL-.--
:• . ... (•i.•__---• r" "• :-e::t •"= ot'-'e_--i'ise i d c t d
( -loW 30 day arithetic mea- ifn-n ( )MGD ( X)PD(X) 30CD 30 day arithbetic =9= 2 S mg/l and __ s/da7(1
=-CD: 7 day aritetic ea: g/ andIs/day
(X) Bo:• Daily 45_zg/l and lbs/day)0012) Daily ___mg/l and lbs/day
(X) Suspended Solids 30 day arithmetic mean _mg/l and lbs/da7(7)( ) Suspended Solids 7 day arithmetic mean __ ,mg/l and lbs/day(X) Sus-ended Solids Daily 45 mg/l and _ _bs/da7(X) Effluent disiection required: (X) all year
( ) Seasonal from to:ecal Colifo= 30 day geozetric nean shal not e.ceed 200/100 =_
Cclc__ 7 da- zeczenrmc nean shall mt..'-'ed &L:3•. -,.
-ecl Coliforn 6 -cu. -eoetric :ea- sha__ not exceed C0,/1CO nl(3)
Cc 'c. ! -o
Yea 0: e S- f• izi-iua sMi -=a-
s'-r_ _ot exceed ,n g/l.-a' Colifo-. '0l i!
c ) oal K~(eidan itrogen.... .. Jn/laS) e.--onia 7a4ly/ng/laz/Ps !
( ) D issC ed Cxy gen !.f .. .... great er t"an 3_/
(x) L7 e to 9_x) settleauie Solids Dat!.- ,1/I
0 5 oho-us .iSy D__________Z/7 as PC ) Total Nitrogen, Daily mz/! as N( ' _ _ _ __ _ _ _
(X) Tonal-!o-, NODSX -, . -: /
TA--L: 2
Frecuenc?9/mnnth
Sanne >.oeG~rab
(xCX
:X
0 " d•d Solids, mg/l ...0 Fecal :olifs_-r , N•o./-100 ....) Total CoLifc--, flo./IO nl_
) ~ta- Kelii l N7i7rogen, =g/l as __
'a - - , :z/i as NEi-.~ -e.gen, m',/!
2/month GRAB('. S.- -- 'L-i _ollds, -_/"
) ..... ,_ r-u ., as !.; ---- :-e z_- , C _ _ _ _ _ _ _ _ _
'sN ______ ______._".at l= Tit Z-e ,n/ as .,•
,e !-ues shall not exceed ___f__-__mclue.t.-xgem Lezand) shall be ccnouted and reported as
-=:. +T .i x Tr-"' (Total F-jeldah Nitrcgen)cr-'-ý 4n he inters-tate Saa+ - 5a 1- *
Sanole LocartcnInfluent E7ffluent
x___ _(4)
'=aiues.follows:
• " " : --._ _ ae r e f f lu e n t a n d f . .na- a e f f" -u : i f 1 s a r e s pe i
NMP-2 FES 21 Appendix A

Part IPage5 of- 17Facility ID No.: NY 000 1015
Definition of Daily Average and Daily Maximum
The daily average discharge is the total discharge by weight or in other appropriateunits as specified herein, during a calendar month divided by the number of days in themonth that the production or commercial facility was operating. Where less than dailysampling is required by this permit, the daily average discharge shall be determined bythe summation of all the measured daily discharges in appropriate units as specifiedherein divided by the number of days during the calendar month when the measurementswere made.
The daily maximum discharge means the total discharge by weight or in other appropriateunits as specified herein, during any calendar day.
Monitoring Locations
Permittee shall take samples and measurements to meet the monitoring requirements atthe location(s) indicated below: (Show locations of outfalls with sketch or flowdiagram as appropriate).
14
SECURITY BULDINGAIRCONDITIONING WASTEVYATER
FLOOR &EQUIP.
DRAINS 7
INTAKE - UNIT-i
INTAKE -UNIT-2
9 0r "2TP 3
91-20-2 (5/S0)Pg. 3
NMP-2 FES 22 Appendix A

NMPC
Part IPage 6 of 17Fac.•hty ID NIo.
-"y 000 1015Facility ID ~Lo. ~Y 000 ~015
IL
-C.
:1/
/
/
0'T.4
"
..
1 1 W
4Y-
- CS 020
N~
U MZ ±
L
C,
-----------
.f~g'*:~ I; ~I V~ C.- -. ~.-------------------______________________II -. -9 ,-
~,~1 ~ii3Li
I
N-0'O
NMP-2 FES 23 Appendix A

NMPC
Part IPage 7of 17Facility ID No. NY 000 1015
ADDITIONAL REQUIREMENTS:
I. The following requirements are applicable to Units #1 and #2.
1. There shall be no discharge of PCB's from this facility..
2. In regard to general conditions 11.5, items #3 and #4 shall bereported semi-annually to NYSDEC offices in Cortland and Albany.
3. There shall be no discharge of boiler chemical cleaning compounds,metal cleaning wastewater, or boiler blowdown frcm this facility.
4. Radioactivity
a. Gross Beta - Shall not exceed 1,000 picocuries per liter inthe absence of Sr 9 0 and alpha emitters.
b. Radium.226 - Shall not exceed 3 picocuries per liter.
c. Strontium 90 - Shall not exceed 10 picocuries per liter.
5. The permittee shall submit on a trimesterly basis a reoort.to theDepartment's offices in Cortland and Albany by the 28th of themonth following the end of the period. Submission of reports forUnit #2 shall commence with the initiation of reactor low powertesting.
a. Daily minimum, average, and maximum station electrical outputshall be determined and logged.
b. Daily minimum, average, and maximum water use shall be directlyor indirectly measured or calculated and logged.
c. Daily minimum, average, and maximum intake and dischargetemperatures shall be logged.
d. Measurements in a, b, and c shall be taken on an hourly basis.
6. The location, design, construction, and capacity of cooling waterintake structures, in connection with point source thermal discharges,shall reflect the best technology available for minimizing adverseenvironmental impact.
7. All thermal discharges to the waters of the state shall assure theprotection and propagation of a balanced indigenous population cifshellfish, fish, and wildlife in and on the body of water.
NMP-2 FES . 24 Appendix A

NMPC
Part IPage 8 of 17Facility ID No. NY 000 1015
8. Niagara Mohawk shall notify the Department within one week fromthe time of submission to the Nuclear Regulatory Commission of anyrequested changes to the Environmental Technical Specificationsrequirements which could in any way affect the requirements ofthis permit.
9. Niagara Mohawk shall also submit concurrently to the Departmentany water-related report on the environment it submits to anyfederal, state, or local agency.
10. Niagara Mohawk shall provide access to the Nine Mile Point Site atany time to representatives of the Department subject to sitesecurity regulations to assess the environmental impact of theoperation of the Nine Mile Point Nuclear Facility and to reviewany sampling program, methodology, and the gathering and reportingof any data.
11. No biocides, slimicides, or corrosion control chemicals are authorizedfor use, except for those listed byparameter in the permit. PriorDepartment approval is required for any additional use of thesechemicals as well as for the use of any new water treatment chemicals.
II. The following reouirements are aoclicable to Unit #1.
1. By August 1, 1983, the permittee shall submit final plans, signedand sealed by an engineer licensed to practice in New York State,describing the addition of storage capacity for discharges 011 and021. Construction to be initiated by October 1, 1983.
2. The Department has approved the applicant's request -pursuant toSection 316(a) of the Clean Water Act (CWA) for alternative effluentlimitations at this facility. The thermal effluent limitations onpaqe 2 of this permit reflect this approval.
3. The water temperature at the surface of Lake Ontario shall not beraised more than three Fahrenheit degrees over the temperature thatexisted before the addition of heat of artificial origin except ina mixing zone consisting of an area of 425 acres from the point ofdischarge, this temperature may be exceeded.
4. The Department has contingently approved the applicant's considerationof intake impacts submitted pursuant to Section 316(b) of the CWA.Completion of the biological monitoring program -described inAdditional Requirement Section IV and demonstration of impactssimilar to previous studies is required to obtain final approvalof the 316(b) request.
NMP-2 FES 25 Appendix A

NMPC
Part IPage 9 of 17Facility ID No. NY 000 1015
III. The following requirements are apolicable to Unit #2.
1. By initiation of reactor lower power testing, the company shallfile for approval with the Department at its offices in Albanyand Syracuse an updated report on all Unit #2 water treatment,corrosion inhibitor, anti-fouling, slimicide, biocide, andboiler cleaning chemicals or compounds. Such report shallidentify each product by chemical formula and/or composition,annual consumption, frequency of use, maximum use per incident,effluent concentration, bioassay and toxicity limits, and proceduresfor use. Approval shall only be granted for those circumstancesand uses which do not contravene New York State Water QualityStandards. No substitutions will be allowed without prior approval.Wastewaters containing chemicals and oil shall be collected andtreated prior to dilution with non-contact cooling water in facilitieswhich shall be approved by the Department.
2. No discharge from this facility shall cause violation of the NewYork'State Department of Health regulations contained in 10 NYCRRPart 170 at the source of intake of any water supply used fordrinking, culinary or food processing purposes.
3. Pursuant to Part 704 Criteria Governing Thermal Discharges, Section704.3-Mixing Zone Criteria, upon the presentation of a final designfor the discharge, the Department shall specify, as appropriate,definable numerical limits for the mixing zone, including lineardistances from the point of discharge, surface area involvement,and volume of receiving water entrained in the thermal plume.
4. Not less than 180 days prior to the initiation of discharge fromthe Nine Mile Point Nuclear Generating Station Unit #2, NiagaraMohawk shall submit for approval to the Department of EnvironmentalConservation a plan of study for:
Verification of the extent of the thermal plume in thereceiving waters by conducting thermal surveys inalternate months except for December through Marchduring the first two years of operation.
5. Existing biological studies in Lake Ontario as required by regulatoryagencies shall continue. Such study programs shall be adjustedas required by regulatory agencies to assess the operating impactof Unit #2. Requirements to submit reports, frequency of submission,and content shall be established at the time of approval of thestudy programs.
NMP-2 FES 26 Appendix A

NMPC
Part IPage 10 of 17Facility ID No. NY 000.1015
6. Not less than 180 days prior to the initiation of discharges fromthe Nine Mile Point Nuclear Generating Station Unit #2, NiagaraMohawk shall submit to the NYSDEC office in Albany three copies ofthe following plans and specifications. Plans shall be stampedby an engineer licensed in New York State.
a. Plans of proposed structures, including intake structure,diffuser, tunnel cross section, cooling tower, screenwellbuilding, and equipment (including pumps).
b. Plans of all on-site treatment facilities including oil/waterseparators.
c. Piping and/or flow diagrams for all facility waste streams,including any piping to or from Nine Mile Point Unit #i andcontaminated plant and site drainage.
d. Flow diagram of circulating cooling water, system from theintake to the diffuser.
IV. Biological Monitoring and Related Matters - Unit 41
A. Previous Bioloaidal Monitoring Data - EDP + 3 Months, the permitteeshall file with the Chief, Bureau of Environmental Protection inAlbany; Fishery Section head in Cape Vincent; and with the RegionalSupervisor of Fish and Wildlife in Syracuse a report containingand/or identifying all previous reports regardi.ng this facilitywhich contain biological data relating to the ecological effectsof plant operation from March 31, 1975 *to the present. Previouslysubmitted reports need not be duplicated, but title, date, anddata location must be completely identified. A copy of all unsubmittedreports and data shall be sent to the above offices by EDP + 3 Months.Data to be reported should include, but is not necessarily limitedto cooling water flows, dates, times, available operating andmeteorological conditions, and species, numbers and other availablebiological information.
B. Imoingement Monitoring - The permittee shall conduct a program todetermine the numbers and total weights by.species of fish impingedon all intake traveling screens.
1. Collections shall be made seventy-eight (78) days each year,provided that the circulating water pumps-are in operation.When collection days coincide with shut down of the maincirculating water pumps, collections need not be taken.Collections shall be obtained at the following intensity ondays randomly selected within each month. Should therandomly selected dates result in a period in excess of 10days during any month in which sampling does not occur,
NMP-2 FES 27 Appendix A

NMPC'
Part IPage 11 of 17Facility ID No. NY 000 1015
additional sampling is required so that periods in
excess of 10 days without a sample do not occur.
Month Number of Sample Days
January 4February 4March 4April 16May 20June 4July 4August 6September 4October INovember 4December 4
2. Collections shall be conducted for a minimum oeriod of24 hours. The beginning of the 24-hour period shall beselected and held constant by the permittee for allcollections. A collection period shall be no longerthan 26 hours. Impingement collection shall be calculatedand reported on a 24-hour basis.
3. Travelling screens shall be washed until they are cleanprior to the start of the 24-hour collection period.
4. Individual length (cm) and weight (g) measurements shallbe made on white perch, smallmouth bass, yellow perch,alewife, rainbow smelt, and each species of salmonid inorder to characterize the size distribution for each24-hour collection. No less than 25 organisms of eachspecies shall be measured unless fewer than 25 individualsoccur in the collection.
If more than 25 individuals of a single species are collected,except for smallmouth bass, yellow perch and each species ofsalmonid which are to be processed separately, a represent-ative subsample of 25 fish shall be removed and lengthsand weights recorded for the subsample. In the event ofhigh impingement numbers, an estimate of the numbers andtotal weights by species fish shall be calculated as follows:
Estimated No. of Fish = (Volume of Total Sample) X (No. of Fish in Subsample)Volume of Subsample
The total sample volume shall be determined by repeatedlyfilling a volumetrically graduated 20-gallon plastic containerand then recording and summing the values. The total volumeis then thoroughly mixed by hand or with a shovel and spread
NMP-2 FES 28 Appendix A

NMPC
Part IPage 12 of 17Facility ID No. NY 000 1015
out evenly over a flat surface. An aliquot of the totalsample is randomly selected and this sample portion isremoved from the flat surface and measured in the graduatedcontainer to determine its approximate volume. The totalnumber of fish in the subsample is then determined.
In the event of extremely large impingement loads, thepermittee may request regional staff to make adjustmentsto or suspend the above subsampling procedures.
5. Electrical output and operation of the condenser coolingwater system including intake and discharge temperature andtotal flow shall be recorded on a daily basis and tabulatedas required in the following section (-n reporting.
6. By EDP + 3 Months, the permittee shall file for aporoval atthe office in Section IV.A. above, a plan which willdetermine the collection efficiency of the followingimninged organisms: white perch, smallmouth bass, yellowperch, alewife, and rainbow smelt. Prior collectionefficiency data specific to this plant may be substitutedfor the above plan provided that it is submitted by EDP +3 Months, to the NYSDEC and approved by the NYSDEC.
C. Reoorting
1. All data required by Section IV or incorporated by referencein Section IV shall be included in an annual biologicalmonitoring report.
2. The annual report shall be submitted by six months from thelast month of data collection.
3. The following shall be included in the annual report inaddition to (1) above:
a. Monthly and annual totals of impingement by speciesand grand total over all species. The calculationsto be done are as follows:
" Monthly "mean" is equal to the total numberof fish impinged by species on the samplingdays in the month divided by the total numberof sampling days.
" Annual "mean" is equal to the total number offish impinged by species on the sampling daysin the year divided by the total number ofsampling days.
NMP-2 FES 29 Appendix A

NMPC
Part I 17Page 13 ofFacility ID No. NY 000 1015
Similar calculations shall be made for grand totalover species. The total number of fish and samplingdays shall be clearly indicated in any table report-ing the "totals".
b. An estimate of the collection efficiencies to bedetermined pursuant to Section IV.B.6. above. Ifsufficient time is not available to include theseestimates in the first annual report, the permitteemay, upon written request and substantiation and withNYSDEC approval, extend this reporting requirementinto an annual report other than the initial.
c. Estimates shall be developed of the average monthlyimpingement rate based on the number of samplingdays and total volume of water pumped during thesedays, and also of the total monthly impingement basedon the average monthly rate and the volume of waterpumped during the month, for each species impinged.
4. All measurements shall use the metric system, e.g., flowsshould be in cubic meters/sec. (m3 /s).
5. Copies of all reports regarding water and biological parameterrelated to intake and discharge considerations, whethergenerated for this permit or otherwise, shall be sent to. theoffices in Section IV.A. above.
6. Report(s) submitted in fulfillment of permit conditions shallclearly identify on the title page the permit number and thespecific section(s) by character and number that the report(s)fulfill. Each section of the text of such report(s) shallidentify the section(s) of the permit that it fulfills.
7. NYSDEC reserves the right to have more frequent submittal ofthe data required to be reported, provided that the permitteeis given at least one (1) month prior notice of such morefrequent reporting requirements.
8. The measures the permittee instituted, if any, in the report-ing year to accomplish minimization of facility impacts onaquatic biota shall be sent to the offices in Section IV.A. above.
9. The formats for reporting the following data are included inAppendix A. Data sheets and formats for rep!rtizng the following data:
a. Flowb. Temperaturec. Circulator operationd. Electrical output
are available from the office of Environmental Protection.
NMP-2 FES 30 Appendix A

NMPC
Part IPage 14 of 17Facility ID No. NY 000 1015
D. Biological specimens may be required to be submitted to theNYSDEC upon request.
E. The facility shall be operated in such a manner as to minimizefacility impacts on aquatic biota.
F. As a result of the NYSDEC's review of the biological monitoringprogram, the permittee may be required to implement appropriatemethods and procedures to reduce to the fullest extent possiblethe effects of facility operation on aquatic organisms.
NMP-2 FES 31 Appendix A

NMPC
Page 15 of 17Facility ID No.: NY 000 1015
SC1-=DULE OF COKTLIANCE FOR tD=FLUB! LITATIONS
(a) Permittee shall achieve compliance with the effluent limitationsspecified in this permit for the permitted discharge(s) in accordance with thefollowing schedule:
Action OutfallCode - Number(s) Compliance Action Due Date
02 011 & 021 Approvable Final Plans-Waste Storage Tanks(Additional Requirement # II.1.)
04 011 & 021 Conmmencement of Construction(Additional Requirement #11.1)
8/1/83
10/1/83
01 All
4a 040
02 040
39 NA
44 NA
Chemical Use Report-Unit(Additional Requirement #?II.1)
Plan of Study-Thermal Plume Verification(Additional Requirement #111.4).
Final Plans-Circulating CoolingWater & Waste Treatment(Additional Requirement #III.6)
Compliation of Reports containingBiological Data(Additional Requirement #IV.l.a)
Plan of Study-Collection Efficiency(Additional Requirement #IV.6)
Initiation ofreactor low powertesting.
180 days priorto initiation ofdischarge.
180 days orior toinitiation ofdischarge.
EDP + 3 Months
EDP + 3 Months
(b) The permittee shall submit to the Department of Environmental Conservationthe required document(s) where a specific action is required in (a) above to be taken bya certain date, and a written notice of compliance or noncompliance with each of theabove schedule dates, postmarked no later than 14 days following each elapsed date. Eachnotice of noncompliance shall include the following information:
1. A short description of the noncompliance;
2. A description of any actions taken or proposed by the permitteeto comply with the elapsed schedule requirement without further delay;
3. A description of any factors which tend to explain or mitigatethe noncompliance; and
4. An estimate of the date pernittee will comply with the elapsedschedule requirement and an assessment of the probability that permittee will meetthe next scheduled requirement on time.
91-18-1 (9/78)
NMP-2 FES 32 Appendix A

NMPC
Part IPage 16 of 17
.MON.TRD_-G, R.ECOPR.DNG AIM .EORTYIG Faci I:'- D No.: NTY 000 1015
a) The pernittee shall also refer to the General Cozdi:ions (Part T:) of this perfor additional m=-for-zacion concerning monitoring and reporting requirements and cndiiions.
b) The monm:orizng inform-aion required by this pem-=i: shall be s-arized and repcrtedby submit:ing a completed and signed Discharge Monitorizg Report form once every monthsto the Depar=ent of Environmental Conservation and other appropriate regulatory agenciesat the offices specified below, The fLrst report will be due no later than
h.ereafter, reports shall be submit:ed no Later than the 28th of the following mon~ths):
Water DivisionNew York State Depar=ent of Erviroetenal Conservation50 Vaoif Road - Albany, New York 12233
New York State Deparme=t of Enviro=me=tal CornservationRegional Engineer7481 Henry Clay Blvd.Liver;ool, New York 13038
Oswego Cotunty Dept. of Health.70 Bunner StreetOswego, New York 13126
S(A~ol:aale •Only if checked)
Dr. RcLhard Baker, Chief - Permits Adi=i-stratLom BranchPlan=nig & Y-a'ageme=t DivisionUSZA Region ZI26 Federa.L PlazaNew York, New York 10278
c) If so directed by this pe-i:i or by previous request, Monthly Wastewater TreatmentPlant Operator's Reports shall be submitted to the DEC Regional Office and count- healthdepar-ent or county enviromen-tal control agency specifled above.
d) !L-izcrig _ust be conducted according to test orocedures approved under40 C2R Par: 136, unless other test procedures 'have been specified in this permit.
e) if the pe.i-ttee monitors any pollutant more frequently than required byvthepemzi:, using test procedures approved under 40 C!R 136 or as speclfied n the pe_-it,the results of this nonicortng shall be included in the calculation and reporting of thedata subnm:ied in :he Discharge .oni-orizg Reports.
f) Calculat-ons for all l•-inacions which require averagimg of measureents shall-tý! ize an art_.e•rtc mean unless otherxwise specified in the per--it.
g) Unless otherwvise specified, all infor-acion submitted on the Discharge Moni4toringFo--= shall be based upon measurements and sa=pling carried out duri=g te most recentlyccmnle.ed reportizg period.
h) Blank Discharge Monitoring Report Forms are available an the above addresses.
91-20-2 (3/81) Page 2
NMP-2 FES 33 Appendix A

NMPC
Part IPage 17 of 3.7Facility ID No.: NY 000 1 015
SC=DULE OF COMPLLASCE FOR EFLUL-T LIMTTATIONS(Continued)
c) The permittee shall submit copies of the written notice of
compliance or noncompliance required herein to the follcving offices:
Chlef, Compliance SectionNew York State Department50 Wolf RoadAlbany, New York 12233
Regional Engineer #7New York State Department7481 Henry Clay BoulevardLiverpool, NY 13038
of Envirornental Conservation
of Envtror=ental Conaervation
Oswego County. Dept. of Health70 aunner StreetOSwego, New York 13126
USEA Region IIPlanning and Management Division26 Federal Plaza
New York, New York 10278
The permittee shall submit copies of any engineering reports, plansof study, final plans, as-built plans, infiltration-inflow studies, etc. requiredherein to the New York State Department of Environmental Conservation RegionalOffice specified above unless othervIse specified in this permit or in writingby the Department or its designated field office.
91-18-2 (9/76)
NMP-2 FES 34 Appendix A

DEC
New York State Department of Environmental Conservation
50 Wolf Road, Albany, New York 12233-0001
-lenry G.Commi
October 11, 1984
Mr. Albert Schwencer, ChiefLicensing Branch #2Division of LicensingU.S. Nuclear Regulatory CommissionWashington, D.C. 20555
Re: Draft Environmental Impact Statement:Operation of Nine Mile Point NuclearStation, Unit No. 2
Dear Mr. Schwencer:
The attached comments are based on review by the appropriate New YorkState Agencies of the U.S. Nuclear Regulatory Commission's July 1984 DraftEnvironmental Impact Statement related to the operation of Nine Mile PointNuclear Station, Unit No. 2 (Docket No. 50-410, NUREG - 1085). We recommendincorporation of our concerns into the Final Environmental Impact Statement.
Thank you for the opportunity to comment on your Draft EnvironmentalImpact Statement.
;Si cerely yours,
Louis M. Concra, Jr., DirectorDivision of Regulatory Affairs
LMC/kwcc: See Distribution List
L. Marsh
Williamsssioner
NMP-2 FES 35 Appendix A

DEC
Comments of the State of New YorkIon the
U.S. Nuclear Regulatory Commission'sDraft Environmental Impact Statement (DEIS)
Related to the Operation of Nine Mile Point Nuclear Station Unit No. 2
October 11, 1984
DEC-1 1. Section 5.3.1 indicates that only 1,000 gallons per day of City of Oswegowater will be needed at the facility for potable and sanitary purposes.This figure seems very low. The sanitary waste water treatment plant atNine Mile Point No. 1 typically discharges over 10,000 gallons per day,and the new waste water treatment plant for Nine Mile Point 1 and NineMile Point 2 has a design average flow of 120,000 gallons per day. Thediscrepancies in these figures should be explained.
DEC-2 2. Diesel engines greater than 400 horsepower must obtain construction andoperation permits pursuant to NYCRR 201. Niagara Mohawk should submit alist of all diesel engines and their sizes to the Department ofEnvironmental Conservation, Region 7 office, P.O. Box 5170, FisherAvenue, Cortland. NY 13045 (Attention: Mr. Allan Coburn).
DEC-3 3. Section 5.3.2: The water quality certification should be revised toreflect a limit of .005 milligrams per liter residual chlorine because ofthe abundance of salmonoids around the effluent.
DEC-4 4. Section 5.5.1: The EIS should include further di-scussion of the poten-tial for bird strikes on the cooling tower and potential mitigationmeasures. There should first be a bird collision monitoring program todetermine whether mitigation would be necessary. Applicant should con-tact the NY State Department of Environmental Conservation (address abo-ve) to obtain a Scientific Collectors License for such a program. Theresults of the study should also be sent to that office.
DEC-5 5. The Emergency Preparedness section 5.9.4.4(3) should include local fivedistricts, ambulances, and emergency services, since they would bedirectly involved in an emergency.
DEC-6 6. The EIS should discuss the mode of transportation and routes which willbe used to dispose of nuclear wastes.
DEC-7 7. There was not discussion about traffic management relating to the opera-tion of the station in the completed phase.
DEC-8 8. Specific details of the emergency evacuation plans should be included inthe EIS, including transportation impacts.
The summary should incorporate transportation effects.
9. The applicant should contact the New York State Department ofTransportation Regional Office in Syracuse to satisfy any permit require-ments related to transportation. The address is:
Mr. Richard A. LucasRegional Planning EngineerNYS Department of Transportation333 East Washington StreetSyracuse, New York 13202(315) 428-4409
NMP-2 FES 36 Appendix A

APPENDIX B
NEPA POPULATION-DOSE ASSESSMENT
NMP-2 FES Appendix B


APPENDIX B
NEPA POPULATION-DOSE. ASSESSMENT
Population-dose commitments are calculated for all individuals living within80 km (50 miles) of the Nine Mile Point Unit 2 (NMP-2) facility', employing thesame dose calculation models used for individual doses (see RG 1.109, Revi-sion 1), for the purpose of meeting the "as low as reasonably achievable"(ALARA) requirements of 10 CFR 50, Appendix I. In addition, dose commitmentsto the population residing beyond the 80-km region, associated with the exportof food crops produced within the 80-km region and with the atmospheric andhydrospheric transport of the more mobile effluent species, such as noble gases,tritium, and carbon-14, are taken into consideration for the purpose of meetingthe requirements of the National Environmental Policy Act 1969 (NEPA). Thisappendix describes the methods used to make these NEPA population-doseestimates.
1. iodines and Particulates Released to the Atmosphere
Effluent nuclides in this category deposit onto the ground as the effluentmoves downwind; thus the concentration of these nuclides remaining in the plumeis continuously being reduced. Within 80 km of the facility, the depositionmodel in RG 1.111, Revision 1, is used in conjunction with the dose models. inRG 1.109, Revision 1. Site-specific data concerning production and consumptionof foods within 80 km of the reactor are used. For estimates of populationdoses beyond 80 km, it is assumed that excess food not consumed within the80-km area would be consumed by the population beyond 80 km. It is furtherassumed that none, or very few, of the particulates released from the facilitywill be transported beyond the 80-km distance; thus, they will make no signif-icant contribution to the population dose outside the 80-km region, except byexport of food crops.
2. Noble Gases, Carbon-14, and Tritium Released to the Atmosphere
For locations within 80 km of- the reactor facility, exposures to these effluentsare calculated with a constant mean wind-direction model according to the guid-ance provided in RG 1.111, Revision 1, and the dose models described inRG 1.109, Revision 1. For estimating the dose commitment from these radio-nuclides to the U.S. population residing beyond the 80-km region, two dispersionregimes are considered. These are referred to as the first-pass-dispersionregime and the world-wide-dispersion regime. The model for the first-pass-dispersion regime estimates the dose commitment to the population from theradioactive plume as it leaves the facility and drifts across the continentalU.S. toward the northeastern corner of the U.S. The model for the world-wide-dispersion regime estimates the dose commitment to the U.S. population afterthe released radionuclides mix uniformly in the world's atmosphere or oceans.
NMP-2 FES 1 Appendix B

(a) First-Pass Dispersion
For estimating the dose commitment to the U.S. population residing beyond the80-km region as a result of the first pass of radioactive pollutants, it isassumed that the pollutants disperse in the lateral and vertical directionsalong the plume path. The direction of movement of the plume is assumed to befrom the facility toward the northeast corner of the U.S. The extent of verti-cal dispersion is assumed to be limited by the ground plane and the stableatmospheric layer aloft, the height of which determinesthe mixing depth. Theshape of such a plume geometry can be visualized as a right cylindrical wedge.whose height is equal to the mixing depth. Under the assumption of constantpopulation density, the population dose associated with such a plume geometryis independent of the extent of lateral dispersion; it is only dependent uponthe mixing depth and other nongeometrical related factors (NUREG-0597). Themixing depth is estimated to be 1000 m, and a uniform population density of.62 persons/km2 is assumed along the plume path, with an average plume-transportvelocity of 2 m/s.
The total-body population-dose commitment from the first pass of radioactiveeffluents is due principally to external exposure from gamma-emitting noblegases, and to internal exposure from inhalation of air containing tritium andfrom ingestion of food containing carbon-14 and tritium.
(b) World-Wide Dispersion
For estimating the dose commitment to the U.S. population after the first-pass,world-wide dispersion is assumed. Nondepositing radionuclides with half-livesgreater than 1 year are considered. Noble gases and carbon-14 are assumed tomix uniformly in the world's atmosphere (3.8 x 10¹⁸ M3 ), and radioactive decayis taken into consideration. The world-wide-dispersion model estimates theactivity of each nuclide at the end of a 20-year release period (midpoint ofreactor life) and estimates the annual population-dose commitment at that time,taking into consideration radioactive decay and physical removal mechanisms(for example, carbon-14 is gradually removed to the world's oceans). Thetotal-body population-dose commitment from the noble gases is due mainly toexternal exposure from gamma-emitting nuclides, whereas from carbon-14 it isdue mainly to internal exposure from ingestion of food containing carbon-14.
The population-dose commitment as a result of tritium releases is estimated ina manner similar to that for carbon-14, except that after the first pass, allthe tritium is assumed to be immediately distributed in the world's circulatingwater volume (2.7 x 10¹⁶ M3 ), including the top 75 m of the seas and oceans, aswell as the rivers and atmospheric moisture. The concentration of tritium inthe world's circulating water is estimated at the time after 20 years ofreleases have occurred, taking into consideration radioactive decay. Thepopulation-dose commitment estimates are based on the incremental concentrationat that time. The total-body population-dose commitment from tritium is duemainly to internal exposure from the consumption of food.
3. Liquid Effluents
Population-dose commitments due to effluents in the receiving water within80 km of the facility are calculated as described in RG 1.109, Revision 1. Itis assumed that no depletion by sedimentation of the nuclides present in the
NMP-2 FES 2 Appendix B

receiving water occurs within 80 km. I.t also is assumed that aquatic biotaconcentrate radioactivity in the same manner as was assumed for the ALARA eval-uation for the maximally exposed individual. However, food-consumption valuesappropriate for the average, rather than the maximum, individual are used. Itis further assumed that all the sport and commercial fish and shellfish caughtwithin the 80-km area are eaten by the U.S. population.
Beyond 80 km, it is assumed that all the liquid-effluent nuclides except tritiumhave deposited on the sediments so that they make no further contribution topopulation exposures. The tritium is assumed to mix uniformly in the world'scirculating water volume and to result in an exposure to the U.S. population inthe same manner as discussed for tritium in gaseous effluents.
4. References
U.S. Nuclear Regulatory Commission, NUREG-0597, K. F. Eckerman, et al., "User'sGuide to GASPAR Code," June 1980.
--- , RG 1.109, "Calculation of Annual Doses to Man from Routine Releases ofReactor Effluents for the Purpose of Evaluating Compliance with 10 CFR Part 50,Appendix I," Revision 1, October 1977.
--- , RG 1.111, "Methods for Estimating Atmospheric Transport and Dispersion ofGaseous Effluents in Routine Releases from Light-Water-Reactors," Revision 1,July 1977.
NMP-2 FES 3 Appendix B


APPENDIX C
IMPACTS OF THE URANIUM FUEL CYCLE
NMP-2 FES Appendix C


APPENDIX C
IMPACTS OF THE URANIUM FUEL CYCLE
The following assessment of the environmental impacts of the LWR-supportingfuel cycle as related to the operation of the proposed project is based on thevalues given in Table S-3 (see Section 5.10 of the main 'body of this report)and the NRC staff's analysis of the radiological impact from radon and techne-tium releases. For the sake of consistency, the analysis of fuel-cycle impactshas been cast in terms of a model 1000-MWe light-water-cooled reactor (LWR)operating at an annual capacity factor of 80%. In the following review andevaluation of the environmental impacts of the fuel cycle,.the staff's analysisand conclusions would not be altered if the analysis were to be based on thenet electrical power output of the Nine Mile Point (NMP-2) Nuclear StationUnit 2.
1. Land Use
The total annual land requirement for the fuel cycle supporting a model1O00-MWe LWR is about 460,000 m2 (113 acres). Approximately 53,000 m2
(13 acres) per year are permanently committed land, and 405,000 m2 (100 acres)per year are temporarily committed. (A "temporary" land commitment is a com-mitment for the life of the specific fuel-cycle plant, such as a mill, enrich-ment plant, or succeeding plants. On abandonment or decommissioning, such landcan be used for any purpose. "Permanent" commitments represent land that maynot be released for use after plant shutdown and/or decommissioning.) Of the405,000 m2 per year of temporarily committed land, 320,000 m2 are undisturbedand 90,000 m2 are disturbed. Considering common classes of land use in theUnited States,* fuel-cycle land-use requirements to support the model 1000-MWeLWR do not represent a significant impact.
2. Water Use
The principal water-use requirement for the fuel cycle supporting a model1000-MWe LWR is that required to remove waste heat from the power stationssupplying electrical energy to the enrichment step of this cycle. Of the totalannual requirement of 43 x 106 m3 (11.4 x 10⁹ gal), about 42 x 106 m3 arerequired for this purpose, assuming that these plants use once-through cooling.Other water uses involve the discharge to air (for example, evaporation lossesin process cooling) of about 0.6 x 10⁶ m3 (16 x 107 gal) per year and waterdischarged to the ground (for example, mine drainage) of about 0.5 x 10⁶ m3
per year.
On a thermal effluent basis, annual discharges from the nuclear fuel cycle areabout 4% of those from the model IO00-MWe LWR using once-through cooling. Theconsumptive water use of 0.6 x 10⁶ m3 per year is about 2% of that from the
*A coal-fired plant of 1000-MWe capacity using strip-mined coal requires the
disturbance of about 810,000 m2 (200 acres) per year for fuel alone.
NMP-2 FES 1 Appendix C
model 1000-MWe LWR using cooling towers. The maximum consumptive water use(assuming that all plants supplying elect-ical energy to the nuclear fuel cycleused cooling towers) would be about 6% of the model 1000-MWe LWR using coolingtowers. Under this condition, thermal effluents would be negligible. Thestaff finds that these combinations of thermal loadings and water consumptionare acceptable relative to the water use and thermal discharges of the proposedproject.
3. Fossil Fuel Consumption
Electrical energy and process heat are required during various phases of thefuel cycle process. The electrical energy is usually produced by the combustionof fossil fuel. at conventional power plants. Electrical energy associated withthe fuel cycle represents about 5% of the annual electrical power production ofthe model 1000-MWe LWR. Process heat is primarily generated by the combustionof natural gas. This gas consumption, if used to generate electricity, wouldbe less than 0.3% of the electrical output from the model plant. The stafffinds that the direct and indirect consumptions of electrical energy for fuel-cycle operations are small and acceptable relative to the net power productionof the proposed project.
4. Chemical Effluents
The quantities of chemical, gaseous, and particulate effluents associated withfuel-cycle processes are given in Table S-3. The principal species are sulfuroxides, nitrogen oxides, and particulates. On the basis of data in a Councilon Environmental Quality report (CEQ, 1976), the staff finds that these emis-sions constitute an extremely small additional atmospheric loading in compari-son with the same emissions from the stationary fuel-combustion and transporta-tion sectors in the United States; that is, about 0.02% of the annual nationalreleases for each of these species. The staff believes that such small in-creases in releases of these pollutants are acceptable.
Liquid chemical effluents produced in fuel cycle processes are related to fuel-enrichment, -fabrication, and -reprocessing operations and may be released toreceiving waters. These effluents are usually present in dilute concentrationssuch that only small amounts of dilution water are required to reach levels ofconcentration that are within established standards. The flow of dilution waterrequired for specific constituents is specified in Table S-3. Additionally, allliquid discharges into the navigable waters of the United States from plantsassociated with the fuel-cycle operations will be subject to requirements andlimitations set forth in the pollutant discharge elimination system permitissued by the State of New York (SPDES; see Appendix E).
Tailings solutions and solids are generated during the milling process. Thesesolutions and solids are not released in quantities sufficient to have asignificant impact on the environment.
5. Radioactive Effluents
Radioactive effluents estimated to be released to the environment from repro-cessing and waste-management activities and certain other phases of the fuel-
NMP-2 FES 2 Appendix C

cycle process are set forth in Table S-3. Using these data, the staff has cal-culated for 1 year of operation of the model 1000-MWe LWR the 100-year involun-tary environmental dose commitment* to the U.S. population from the LWR-supporting fuel cycle.
It is estimated from these calculations that the overall involuntary total-bodygaseous dose commitment to the U.S. population from the fuel cycle (excludingreactor releases and the dose commitment due to radon-222 and technetium-99)would be approximately 400 person-rems foreach year of operation of the modelI000-MWe LWR (reference reactor year, or RRY). Based on Table S-3 values, theadditional involuntary total-body dose commitments to the U.S. population fromradioactive liquid effluents (excluding technetium-99) as a result of all fuel-cycle operations other than reactor operation would be about 100 person-remsper year of operation. Thus, the estimated involuntary 100-year environmentaldose commitment to the U.S. population from radioactive gaseous and liquidreleases due to these portions of the fuel cycle is about 500 person-rems(whole-body) per RRY.
At this time the radiological impacts associated .with radon-222 and technetium-99;'releases are not addressed in Table S-3. Principal radon releases occur duringmining and milling operations and as emissions from mill tailings, whereasprincipal technetium-99 releases occur from gaseous diffusion enrichment facil-ities. The staff has determined that radon-222 releases per RRY from theseoperations are as given in Table C-1. The staff has calculated population-dosecommitments for these sources of radon-222 using the RABGAD computer codedescribed in Volume 3 of NUREG-0002, Appendix A, Chapter IV, Section J. Theresults of these calculations for mining and milling activities prior totailings stabilization are listed in Table C-2.
When added to the 500 person-rems total-body dose commitment for the balance ofthe fuel cycle, the overall estimated total-body involuntary 100-year environ-mental dose commitment to the U.S. population from the fuel cycle for the~model1000-MWe LWR is approximately 640 person-rems. Over this period of time, thisdose is equivalent to 0.00002% of the natural-background total-body dose ofabout 3 billion person-rems to the U.S. population.*"
The staff has considered the health effects associated with the releases ofradon-222, including both the short-term effects of mining and milling, andactive tailings, and the potential long-term effects from unreclaimed open-pitmines and stabilized tailings. The staff has assumed that after completion ofactive mining, underground mines will be sealed, returning releases of radon-222to background levels. For purposes of providing an upper bound impact assess-ment, the staff has assumed that open-pit mines will be unreclaimed and hascalculated that if all ore were produced from open-pit mines, releases fromthem would be 110 Ci per RRY. However, because the distribution of uranium-orereserves available by conventional mining methods is 66% underground and 34%
*The 100-year environmental dose commitment is the integrated population dose
for 100 years; that is, it represents the sum of the annual population dosesfor a total of 100 years.
**Based on an annual average natural-background individual dose commitment of
100 millirems and a stabilized U.S. population of 300 million.
NMP-2 FES 3 Appendix C

open pit (Department of Energy, 1978), the staff has further assumed-that ura-nium to fuel LWRs will be produced by conventional mining methods in these pro-portions. This means that long-term releases from unreclaimed open-pit mineswill be 0.34 x 110 or 37 Ci per year per RRY.
Based on the above, the radon released from unreclaimed open-pit mines over100- and 1000-year periods would be about 3700 Ci and 37,000 Ci per RRY,respectively. The total dose commitments for a 100- to 1000-year period wouldbe as shown in Table C-3.
These commitments represent a worst case situation in that no mitigating cir-cumstances are assumed. However, state and Federal laws currently requirereclamation of strip and open-pit coal mines, and it is very probable thatsimilar reclamation will be required for open-pit uranium mines. If so, long-term releases from such mines should approach background levels.
For long-term radon releases from stabilized tailings piles, the staff hasassumed that these tailings would emit, per RRY, 1 Ci per year for 100 years,10 Ci per year for the next 400 years, and 100 Ci per year for periods beyond500 years. With these assumptions, the cumulative radon-222 release fromstabilized-tailings piles per RRY would be 100 Ci in 100 years, 4090 Ci in500 years, and 53,800 Ci in 1000 years (Gotchy, 1978). The total-body., bone,and bronchial epithelium dose commitments for these periods are as shown inTable C-4.
Using risk estimators of 135, 6.9, and 22 cancer deaths per million person-remsfor total-body, bone, and lung exposures, respectively, the estimated risk ofcancer mortality resulting from mining, milling, and active-tailings emissionsof radon-222 is about 0.11 cancer fatality per RRY. When the risk from radon-222 emissions from stabilized tai-lings over a 100-year release period is added,the estimated risk of cancer mortality over a 100-year period is unchanged.Similarly, a risk of about 1.2 cancer fatalities per RRY is estimated over a1000-year release period. When potential radon releases from reclaimed andunreclaimed open-pit mines are included, the overall risks of radon-inducedcancer fatalities per RRY change as follows:
0.11 to 0.19 fatality for a 100-year period0.19 to 0.57 fatality for a 500-year period1.2 to 2.0 1fatalities for a 1000-year period
To illustrate: A single model 1000-MWe LWR operating at an 80% capacity factorfor 30 years would be predicted to induce between 3.3 and 5.7 cancer fatalitiesin 100 years, 5.7 and 17 in 500 years, and 36 and 60 in 1000 years as a resultof releases of radon-222.
These doses and predicted health effects have been compared with those that canbe expected from natural-background emissions of radon-222. Using data from theNational Council on Radiation Protection (NCRP, 1975), the staff calculates theaverage radon-222 concentration in air in the contiguous United States to beabout 150 pCi/m 3 , which the NCRP estimates will result in an annual dose to thebronchial epithelium of 450 millirems. For a stabilized future U.S. populationof 300 million, this represents a total lung-dose commitment of 135 millionperson-rems per year. Using the same risk estimator of 22 lung-cancer fatal-ities per million person-lung-rems used to predict cancer fatalities for the
NMP-2 FES 4 Appendix C

model 1000 MWe LWR, the staff estimates that lung-cancer fatalities alone frombackground radon-222 in-the air can be calculated to be about 3000 per year, or300,000 to 3,000,000 lung-cancer deaths over periods of 100 to 1000 years,respectively.
The staff is currently in the process of formulating a specific model for ana-lyzing the potential impact and health effects from the release of technetium-99during the fuel cycle. However, for the interim period until the model is com-pleted, the staff has calculated that the potential 100-year environmental dosecommitment to the U.S. population from the release of technetium-99 should notexceed 100 person-rems per RRY. These calculations are based on the gaseousand the hydrological pathway model systems described in Volume 3 of NUREG-0002,Chapter IV, Section J, Appendix A. When these figures are added to the640 person-rem total-body dose commitment for the balance of the fuel cycle,including radon-222, the overall estimated total-body involuntary 100-yearenvironmental dose commitment to the U.S. population from the fuel cycle for themodel 1000-MWe LWR is about 740 person-rems. Over this period of time, thisdose is equivalent to 0.00002% of the natural-background total-body dose ofabout three billion person-rems to the U.S. population.*
The staff also considered the potential health effects associated with thisrelease of technetium-99. Using the modeling systems described in NUREG-0002,the major risks from technetium-99 are from exposure of the gastrointestinaltract and kidney,, although there is a small risk from total-body exposure.Using organ-specific risk estimators, these individual organ risks can be con-verted to total-body risk equivalent doses. Then, by using the total-body riskestimator of 135 cancer deaths per million person-rems, the estimated risk ofcancer mortality due to technetium-99 releases from the nucl.ear fuel cycle isabout 0.01 cancer fatality per RRY over the subsequent 100 to 1000 years.
In addition to the radon- and technetium-related potential health effects fromthe fuel cycle, other nuclides produced in the cycle, such as carbon-14, willcontribute to population exposures. It is estimated that an additional 0.08 to0.12 cancer death may occur per RRY (assuming that no cure for or prevention ofcancer is ever developed) over the next 100 to 1000 years, respectively, fromexposures to these other nuclides.
The latter exposures can also be compared with those from naturally occurringterrestrial and cosmic-ray sources. These average about 100 millirems. There-fore, for a stable future population of 300 million persons, the whole-body dosecommitment would be about 30 million person-rems per year, or 3 billion person-rems and 30 billion person-rems for periods of 100 and 1000 years, respectively.These natural-background dose commitments could produce about 400,000 and4,000,000 cancer deaths during the same time periods. From the above analysis,the staff concludes that both the dose commitments and health effects of theLWR-supporting uranium fuel cycle are very small when compared with dose com-mitments and potential health effects to the U.S. population resulting from allnatural-background sources.
*Based on an annual average natural-background individual dose commitment of 100
mrems and a stabilized U.S. population of 300 million.
NMP-2 FES 5 Appendix C

6. Radioactive Wastes
The quantities of buried radioactive waste material (low-level, high-level, andtransuranic wastes) associated with the uranium fuel cycle are specified inTable S-3. For low-level waste disposal at land-burial facilities, the Commis-sion notes in Table S-3 that there will be no significant radioactive releasesto the environment. The Commission notes that high-level and transuranic wastesare to be buried at a Federal repository and that no release to the environmentis associated with such disposal. NUREG-0116, which provides background andcontext for the high-level and transuranic Table S-3 values established by theCommission, indicates that these high-level and transuranic wastes will beburied and will not be released to the biosphere. No radiological environmentalimpact is anticipated from such disposal.
7. Occupational Dose
The annual occupational dose attributable to all phases of the fuel cycle forthe model 1000-MWe LWR is about 200 person-rems. The staff concludes that thisoccupational dose will have a small environmental impact.
8. Transportation
The transportation dose to workers and the public is specified in Table S-3.This dose is small in comparison with the natural-background dose.
9. Fuel Cycle
The staff's analysis of the uranium fuel cycle did not depend on the selectedfuel cycle (no recycle or uranium-only recycle), because the data provided inTable S-3 include maximum recycle-option impact for each element of the fuelcycle. Thus the staff's conclusions as to acceptability of the environmentalimpacts of the fuel cycle are not affected by the specific fuel cycle selected.
10. References
Council on Environmental Quality, "The Seventh Annual Report of the Council onEnvironmental Quality," Figures 11-27 and 11-28, pp. 238-239, September 1976.
Gotchy, R., testimony from ".In the Matter of Duke Power Company (PerkinsNuclear Station)," U.S. Nuclear Regulatory Commission, Docket No. 50-488, filedApril 17, 1978.
National Council on Radiation Protection and Measurements (NCRP), "NaturalBackground Radiation in the United States," NCRP Report No. 45, November 1975.
U.S. Department of Energy,-"Statistical Data of the Uranium Industry,"GJO-100(8-78), January 1978.
U.S. Nuclear Regulatory Commission, NUREG-0002, "Final Generic EnvironmentalStatement on the Use of Recycle Plutonium in Mixed Oxide Fuel in Light-Water-Cooled Reactors," August 1976.
--- , NUREG-0116 (Supplement 1 to WASH-1248), "Environmental Survey of theReprocessing and Waste Management Portions of the LWR Fuel Cycle," October 1976.
NMP-2 FES 6 Appendix C

Table C-I Radon releases from mining and millingoperations and mill tailings for eachyear of operation of the model 1000-MWe LWR*
Radon source Quantity released
Mining"* 4060 Ci
Milling and tailings*** (during active mining) 780 Ci
Inactive tailings*** (before stabilization) 350 Ci
Stabilized tailings*** (several hundred years) 1 to 10 Ci/year
Stabilized tailings*** (after several hundred years) 110 Ci/year
*After three days of hearings before the Atomic Safety and LicensingAppeal Board (ASLAB) using the Perkins record in a "lead case"approach, the ASLAB issued a decision on May 13, 1981 (ALAB-640)on the radon-222 release source term for the uranium fuel cycle.The decision, among other matters, produced new source termnumbers based on the record developed at the hearings. These newnumbers did not differ significantly from those in the Perkinsrecord, which are the values set forth in this table. Any healtheffects relative to radon-222 are still under considerationbefore the ASLAB. Because the source term numbers in ALAB-640do not differ significantly from those in the Perkins record,the staff continues to conclude that both the dose commitments andhealth effects of the uranium fuel cycle are insignificant whencompared to dose commitments and potential health effects to theU.S. population resulting from all natural background sources.Subsequent to ALAB-640, a second ASLAB decision (ALAB-654, issuedSeptember 11, 1981) permits intervenors a 60-day period to challengethe Perkins record on the potential health effects of radon-222emissions.
**R. Wilde, NRC transcript of direct testimony given "In the Matter
of Duke Power Company (Perkins Nuclear Station)," Docket No. 50-488, April 17, 1978.
***P. Magno, NRC transcript of direct testimony given "In the Matter
of Duke Power Company (Perkins Nuclear Station)" Docket No. 50-488,April 17, 1978.
NMP-2 FES 7 Appendix C

Table C-2 Estimated 100-year environmental dose commitmentper year of operation of the model 1000-MWe LWR
Dosage (person-rems).
Radon-222 Total Lung (bronchialRadon source releases (Ci) body Bone epithelium)
Mining 4100 110 2800 2300
Milling andactive tailings 1100 29 750 620
Total 5200 140 3600 2900
Table C-3 Population-dose commitments from unreclaimed open-pit minesfor each year of operation of the model 1000-MWe LWR
Population dose commitments (person-rems)
Time span Radon-222 Total Lung (bronchial(years) releases (Ci) body Bone epithelium)
100 3,700 96 2,500 2,000500 19,000 480 13,000 11,000
1,000 37,000 960 25,000 20,000
Table C-4 Population-dose commitments from stabilized-tailings pilesfor each year of operation of the model 1000-MWe LWR
Population dose commitments (person-rems)
Time span Radon-222 Total Lung (bronchial(years) releases (Ci) body Bone epithelium)
100 100 2.6 68 56500 4,090 110 2,800 2,300
1,000 53,800 1,400 37,000 30,000
NMP-2 FES 8 Appendix C

APPENDIX D
EXAMPLES OF SITE-SPECIFIC DOSE ASSESSMENT CALCULATIONS
NMP-2 FES I Appendix D


APPENDIX D
EXAMPLES OF SITE-SPECIFIC DOSE ASSESSMENT CALCULATIONS
1. Calculational Approach
As mentioned in the main body of this report, the quantities of radioactivematerial that may be released annually from the Nine Mile Point Unit 2 (NMP-2)facility are estimated on the basis of the description of the design and opera-tion of the radwaste systems in the applicant's FSAR and by using the calcula-tive models and parameters described in NUREG-0016. These estimated effluentrelease values for normal operation, including anticipated operational occur-rences, along with the applicant's site and environmental data in the ER-OL andin subsequent answers to NRC staff questions, are used in the calculation ofradiation doses and dose commitments.
The models and considerations for environmental pathways that lead to estimatesof radiation doses and dose commitments to individual members of the public nearthe plant and of cumulative doses and dose'commitments to the entire populationwithin an 80-km (50-mile) radius of the plant as a result of plant operationsare discussed in detail in RG.1.109, Revision 1. Use of these models withadditional assumptions for environmental pathways that lead to exposure to thegeneral population outside the 80-km radius is described in Appendix B of thisstatement.
The calculations performed by the staff for the releases to the atmosphere andhydrosphere provide total integrated dose commitments to the entire populationwithin 80 km of this facility based on the projected population distribution inthe year 2000. The dose commitments represent the total dose that would bereceived over a 50-year period, following the intake of radioactivity for 1 yearunder the conditions existing 20 years after the station begins operation (thatis, the mid-point of station operation). For younger persons, changes in organmass and metabolic parameters with age after the initial intake of radioactivityare accounted for.
2. Dose Commitments from Radioactive Effluent Releases
The NRC staff's estimates of the expected gaseous and particulate releases(listed in Table D-1) along with the site meteorological considerations (sum-marized in Table D-2) were used to estimate radiation doses and dose commitmentsfor airborne effluents. Individual receptor locations and pathway locationsconsidered for the maximally exposed individual in these calculations are listedin Table D-3.
Meteorological data for 1 year were used in the calculation of concentrationsof effluents. The calculation followed guidance given in RG 1.111, Revision 1.Onsite meteorological data collected from January 1975 through December 1975,with wind speed and direction measured at elevations of 62 m and 10 m and thevertical temperature gradient measured between 8 and 61 m, were used as ameasure of atmospheric stability. A straight line Gaussian dispersion model,corrected for effluent recirculation, was utilzed for the routine gaseous
NMP-2 FES 1 Appendix D

release dispersion calculation. Releases evaluated were continuous at groundlevel and from the 131-m stack. Periodic releases-(5 to 24 hours a year) fromthe stack were also evaluated.
The NRC staff estimates of the expected liquid releases (listed in Table D-4),along with the site hydrological considerations (summarized in Table D-5), wereused to estimate radiation doses and dose commitments from liquid releases..
(a) Radiation Dose Commitments to Individual Members of the Public
As explained in the text, calculations are made for a hypothetical individualmember of the public (that is, the maximally exposed individual) who would beexpected to receive the highest radiation dose from all pathways that contri-bute. This method tends to overestimate the doses because assumptions aremade that would be difficult for a real individual to fulfill.
The estimated dose commitments to the individual who is subject to maximum ex-posure at selected offsite locations from airborne releases of radioiodine andparticulates, and waterborne releases are listed in Tables D-6, D-7,and D-8.The maximum annual total body and skin dose to a hypothetical individual andthe maximum beta and gamma air dose at the site boundary are presented inTables D-6, D-7, and D-8.
The maximally exposed individual is assumed to consume well'above averagequantities of the potentially affected foods and to spend more time at poten-tially affected locations than the average person as indicated in Tables E-4and E-5 of Revision 1 of RG 1.109.
(b) Cumulative Dose Commitments to the Ge'neral Population
Annual radiation dose commitments from airborne and waterborne radioactivereleases from the NMP-2 facility are estimated for two populations in the year2000: (1) all members of the general public within 80 km (50 miles) of thestation (Tables D-7 and D-8) and (2) the entire U.S. population (Table D-9).Dose commitments beyond 80 km are based on the assumptions discussed in Appen-dix B. For perspective, annual background radiation doses are given in thetables for both populations.
3. References
U.S. Nuclear Regulatory Commission, NUREG-0016, F. P. Cardile and R. R. Bellamy(editors), "Calculation of Radioactive Materials in Gaseous and Liquid Effluentsfrom Boiling Water Reactors," Revision 1, January 1979.
--- , RG 1.109, "Calculation of Annual Doses to Man From Routine Releases ofReactor Effluents for the Purpose of Evaluating Compliance with 10 CFR Part 50,Appendix I," Revision 1, October 1977.
RG 1.111, "Methods for Estimating Atmospheric Transport and Dispersion ofGaseous Effluents in Routine Releases from Light-Water Reactors," Revision 1,1977.
NMP-2 FES 2 Appendix D

Table D-1 Calculated releasesfrom NMP-2 (Ci/yr)
of radioactive materials in gaseous effluents
Mechanical Radwaste/reactorMain stack' vacuum pump 2 building vent 3
Nuclide (continuous) (intermittent) (continuous)
Ar-41 225 a 15Kr-83m 160 a aKr-85m 7200 a 1Kr-85 240 a aKr-87 130 a aKr-88 6400 a 1Kr-89 581 a 29Xe-131m 98 a aXe-133m 130 a aXe-133 24500 1300 247Xe-135m 445 a 545Xe-135 38 500 313Xe-137 1072 a 228Xe-138 1000 a 4
Total noble gases 45000
Cr-51 0.0002 b 0.0009Mn-54 0.00044 b 0.0007Co-58 0.0001 b 0.001Fe-59 0.00009 b 0.00011Co-60 0.0011 b 0.002Zn-65 0.001 b 0.006Sr-89 b b 0.006Sr-90 0.000003 b 0.00002Nb-95 0.001 b 0.0001Zr-95 0.0003 b 0.00006Mo-99 0.006 b 0.0026Ru-103 0.0002 b 0.00009Ag-110m 0.0000004 b bSb-124 0.000021 b 0.0001Cs-134 0.00072 b 0.00027Cs-136 0.0001 b 0.00011Cs-137 0.001 b 0.0011Ba-140 0.002 b 0.01Ce-141 b b 0.01
Total particulates 0.0054
1-131 0.038 0.15 0.241-133 0.51 1.6 3.09H-3 26.0 b 26.0C-14 b b 9.5
1 The main stack is 430 feet above grade, which is 2.5 times the height of the
I
reactor building.2 Discharged via the main stack, five 24-hour purgesI Ground-level releases (vent stack is approximatelyNotes: a = less than 1.0 Ci/yr for noble gases; b =
this nuclide.
per year.170 feet above grade).less than 1% of total for
NMP.-2 FES 3 Appendix D

Table D-2 Summary of atmospheric dispersion factors (x/Q)deposition values for maximum site boundary andlocations near NMP-2*
and relativereceptor
RelativeLocation"* Source*** x/Q (sec/mi) Deposition (m- 2 )
Nearest effluent- A 3.5 x 10⁻⁸ 4.8 x 10⁻⁹control boundary B 2.0 x 10⁻⁶ 2.1x 10⁻⁹(1.6 km E) C 4.5 x 10⁻⁸ 6.0 x 10⁻⁹
Nearest residence A 9.6 x 10⁻⁹ 8.8 x 10⁻¹⁰and garden B 2.5 x 10⁻⁶ 9.2 x 10⁻⁹(1.6 km SW) C 2.0 x 10⁻⁸ 1.9 x 10⁻⁹,
Nearest milk cow A 2.3 x 10⁻⁸ 1.4 x 10⁻⁹(2.6 km ESE) B 6.1 x 10⁻¹ 3.7 x 10⁻⁹
C 6.1 x 10- 8 3.7 x 10- 9
Nearest milk goat A 9.6 x 10⁻⁹ 5.0 x 10⁻¹⁰(3.8 km SSE) B 1.4 x 10⁻⁷ 8.0 x 10⁻¹⁰
C 4.2 x 10⁻⁸ 2.2 x 10⁻⁹
Nearest meat A 7.8 x 10⁻⁹ 4.6 x 10⁻¹⁰animal (2.3 km SW) B 1.1 x 10⁻⁶ 3.7 x 10⁻⁹
C 3.2 x 10- 8 1.9 x 10- 9
*The values presented in this table are corrected for radioactive decay and
cloud depletion from deposition, where appropriate, in accordance withRegulatory Guide 1.111, Rev. 1, "Methods for Estimating AtmosphericTransport and Dispersion of Gaseous Effluents in Routine Releases from LightWater Reactors," July 1977.
**"Nearest" refers to that type of location where the highest radiation dose
is.expected to occur from all appropriate pathways.***Sources:
A - Main stack, Unit 2, continuous.B - Radwaste/reactor building ventilation exhaust, continous release.C - Main stack, Unit 2, intermittent releases, 5 releases per year,
24 hours each release.
NMP-2 FES 4 Appendix D

Table D-3 Nearest pathway locations used for maximally exposedindividual dose commitments for NMP-2
Location Sector Distance (km)
Nearest effluent- E 1.6
control boundary*
Residence and garden** SW 1.6
Milk cow E 2.6
Milk goat SSE 3.8
Meat animal SW 2.3
*Beta and gamma air doses, total body doses, and skin doses from noble gases
are determined at the effluent-control boundaries in the sector where themaximum potential value is likely to occur.
**Dose pathways including inhalation of atmospheric radioactivity, exposure
to deposited radionuclides, and submersion in gaseous radioactivity areevaluated at residences. This particular location includes doses fromvegetable consumption as well.
NMP-2 FES 5 Appendix D

Table D-4 Calculated release of radioactive materials in liquid effluentsfrom NMP-2
Nuclide Ci/yr* Nuclide Ci/yr*
Corrosion and Activation Products Fission Products (cont'd)
Na-24P-32
Cr-51Mn-54Mn-56
Fe-55Fe-59Co-58Co-60Cu-64
Ni-3Zn-65Zn-69mW-187Np-239
0.00640.000820.0290. 00480.00003
0.0130. 00180.010.0170.015
0.00250.000690.00110.000350.017
S
0.000450.000080. 00110.000380.00017
0.00120. 00150. 00180. 00470.056
Ru-103Ru-105Ru-106Ag-ilOmTe-129m
Te-131m1-131
Te-1321-1321-133
Cs-1341-135
Cs-136Cs-137Ba-140
Ce-141Ce-143Pr-143Ce- 144
All Others
0.000380.000040.0030.00060.00013
0.000150.0240.000040.000040.053
0.0130.00490.00120.0210.0022
0.000310.000050.000130.0035
0.0058
Fission ProductI
Sr-89Sr-90Sr-91
Y-91Y-92
Y-93Zr-95Nb-95Mo-99Tc-99m
Total (except H-3)
H-3
0.27
52.0
*Nucl idesvidual ly
whose release rates are less thanbut are included in "all others."
10-s Ci/yr are not listed indi-
NMP-2 FES 6 Appendix D

Table D-5 Summary of hydrologic transport andfor liquid releases from NMP-2*
dispersion
Transit time DilutionLocation (hours) factor
Nearest drinking-water intake 39 364(Onondaga County)
Nearest sport-fishing location 0 6(discharge area)**
Nearest accessible shoreline 46 263(Lake Ontario neardischarge area)
*See Regulatory Guide 1.113, "Estimating Aquatic
Dispersion of Effluents from Accidental and RoutineReactor Releases for the Purpose of ImplementingAppendix I," April 1977.
**Assumed for purposes of an upper-limit estimate.
NMP-2 FES 7 Appendix D

Table D-6 Annual dose commitments to a maximally exposed individual near NMP-2from operation of NMP-2
Location Pathway Doses (mrems/yr, except as noted)
Noble gases in gaseous effluents
Nearest* site boun-dary (1.6 km E)
Direct radiationfrom plume
Total Gamma air dose Beta air dosebody Skin (mrads/yr) . (mrads/yr)
0.18 0.34 0.27 0.18
Iodine and particulates in gaseous effluents**
Nearest*** siteboundary (1.6 km SW)
Nearest residenceand garden (1.6 kmSW)
Nearest milk cow(2.6 km ESE)
Nearest milk-goat(3.8 km SSE)
Nearest meat animal(2.3 km SW)
Ground depositionInhalation
Ground depositionInhalationVegetable consumption
Ground depositionInhalationVegetable consumptionCow milk consumption
Ground depositionInhalationVegetable consumptionGoat milk consumption
Meat consumption
Total body
a (T)a (T)
Organ
a (C) (thyroid)1.29 (C) (thyroid)
aa0.34
aaa0.15
aaaa
(C)(C)(C)
(I)(I)(I)(I)
(C)(C)(C)(c)
a0.801.96
a0.27a
12.90
aaa11.0
(C) (thyroid)(C) (thyroid)(C) (thyroid)
(I)(I)(I)(I)
(I)(I)(I)(I)
(thyroid)(thyroid)(thyroid)(thyroi d)
(thyroid)(thyroid)(thyroid)(thyroid)
a (C) a (C) (thyroid)
Liquid effluents**
Nearest drinkingwater
Nearest fish atplant-discharge area
Nearest shore accessnear plant-dischargearea
Water ingestion
Total body
a (C)
0.41 (A)
a (T)
Organ
a (C) (bone)
Fish consumption
Shoreline recreation
1.66
a
(C) (bone)
(T) (bone)
a=Less than 0.1 mrem/year.*"Nearest" refers to that site boundary location where the highest radiation doses as a
result of gaseous effluents have been estimated to occur.**Doses are for the age group and organ that results in the highest cumulative dose for
the location: A=adult, T=teen, C=child, I=infant. Calculations were made for theseage groups and for the following organs: gastrointestinal tract, bone, liver, kidney,thyroid, lung, and skin.
***"Nearest" refers to the location where the highest radiation dose to an individualfrom all applicable pathways has been estimated.
NMP-2 FES 8 Appendix D

Table D-7 Calculated Appendix I dose commitments to a maximallyexposed individual and to the population from operation
,of NMP-2
Annual dose
Individual
Appendix I CalculatedSource design objectives* doses**
Liquid effluents
Dose to total body from all pathways 3 mrems 0.4 mremDose to any organ from all pathways 10 mrems 1.7 mrems
(bone)Noble-gas effluents (at site boundary)
Gamma dose in air 10 mrads 0.27 mradBeta dose in air 20 mrads 0.18 mradDose to total body of an individual 5 mrems 0.18 mremDose to skin of an individual 15 mrems 0.34 mrem
Radioiodines and particulates***
Dose to any organ from all pathways 15 mrems 13.2 mrems(thyroid)
Population dose within80 km, person-rems
Total body Thyroid
Natural-background radiation- 120,000Liquid effluents 2.0 0.3Noble-gas effluents 1.57 1.57Radioiodine and particulates 0.78 12.73
*Design Objectives from Sections II.A, II.B, II.C, and II.D of Appendix I,10 CFR Part 50 consider doses to maximally exposed individual and topopulation per reactor unit.
*"Numerical values in this column were obtained by summing appropriate valuesin Table D-6. Locations resulting in maximum doses are represented here.
***Carbon-14 and tritium have been added to this category.~"Natural Radiation Exposure in the United States," U.S. Environmental Protec-tion Agency, ORP-SID-72-1, June 1972; using the average background dose forNew York of 107 mrems/yr, and year 2000 projected population of 1,100,000.
NMP-2 FES 9 Appendix D

Table D-8 Calculated dose commitments to a maximallyexposed individual and to the population fromthe combined operation of NMP-1 and NMP-2 andJames A. FitzPatrick Nuclear Power Plant
Source Annual dose*
Liquid effluents
Dose to total body from all pathwaysDose to any organ from all pathways
Noble-gas effluents (at site boundary)
Gamma dose in airBeta dose in airDose to total body of an individualDose to skin of an individual
Radioiodines and particulates***
Dose to any organ from all pathways
0.5 mrem2.0 mrem
1.7 mrads0.9 mrad1.2 mrems1.8 mrems
31.1 mrems
Population dose within80 km, person-rems
Natural-background radiation***Liquid effluentsNoble-gas effluentsRadioiodines and particulates
Total body
120,0002.22.51.8
Thyroid
3.52.5
14.0
*Numerical values in this column were obtained by summing appropriatevalues from Tables D-6 and D-7 for NMP-2, and the evaluations accord-ing to Appendix I to 10 CFR 50 for NMP-1 and James A. FitzPatrickNuclear Power Plant.
*"Carbon-14 and tritium have been added to this category.
***"Natural Radiation Exposure in the United States," U.S. Environmental
Protection Agency, ORP-SID-72-1, June 1972, using the average back-ground dose for New York of 107 mrems/yr, and the year 2000 projectedpopulation of 1,100,000.
NMP-2 FES 10 Appendix D

Table D-9 Annual total-body population dose commitments,year 2000 from operation of NMP-2
U.S. populationdose commitment,person-rems/yrCategory
Natural background radiation* 26,000,000*
NMP-2 operation
Plant workers 790
General public
Liquid effluents** 2.0Gaseous effluents 30Transportation of fuel and waste 3
*Using the average U.S. background dose (100 mrems/yr) and year2000 projected U.S. population from "Population Estimates andProjections," Series II, U.S. Department of Commerce, Bureauof the Census, Series P-25, No. 704, July 1977.
**80-km (50-mile) population dose
NMP-2 FES 11 Appendix D


APPENDIX E
SPDES PERMITNINE MILE POINT NUCLEAR STATION UNITS 1 AND 2
NIAGARA MOHAWK POWER CORPORATION
NMP-2 FES Appendix E


Copies: R7 - K. DelPrete Facility ID No. : NYB. GarveyR. Baker Effective Date (EDP) : JUR. SpearOswego County Hlth. Dept. Expiration Date (ExDP)Niagara Mohawk - LycomingDRA - R7 Mr. Geisendorfer, Rm. 308, BWFD
NEW YORK STATE DEPARTMENT OF ENVIRON= AL CONSERVATIONSTATE POLLUTANT DISCH!ARGE EL=•NATION SYSTEM (SPDES)
DISCHARGE PERMIT
- oe0 10151y 1, 1983
ly 1, 1988
Special Conditions(Part I)
This SPDES permit is issued in compliance with Title 8 of Article 17of the Environmental Conservation Law of New York State and in compliance with theClean Water Act, as amended, (33 U.S.C. §1251 et. seq.) (hereinafter referred to as"the Act")
Permi-tee Name: Niagara Mhawk Poer Corp.
Perm-ttee Street: 300 Erie B•ulevard West
Attn: Mr. J. M. Toennies,Env. Affairs Dire r
Perz.ittee City: Syracuse State: N.Y. Zip Code: 13202
is authorized to discharge from the facility described below:
Facility Name: Nine Mile Pt. Nurle
Facility Location (C,T,V): Scriba CTI
ar Generatin Station Units #1 and 2
Facility Mailing Address (Street): lake Rcad
Facility •Mailing Address (City): Lycoming (TC
County: Oswego
State: N.Y. Zip Code: 13093
into receiving waters known as:
Lake Ontario Class A Special
in accordance with the effluent limitations, monitoring requirements and other conditionsset forth in this permit.
This permit and the authorization to discharge shall expire on midnightof the expiration date shown above and the permittee shall not discharge after theexpiration date unless this permit has been renewed, or extended pursuant to law. To beauthorized t0 discharge beyond the expiration date, the permittee shall apply for permitrenewal as prescribed by Sections 17-0803 and 17-0804 of the Environmental ConservationLaw and Parts 621, 752, and 755 of the Departments' rules and regulations.
By Authority of Alternate Permit AdministratorDesignated P.epresentative of Co=missioner of the
Department of Environmental Conservation
DaCeDate Signature
Supplement 3 IA- 1 September 1983
NMP-2 FES Appendix E

Part IPage 2 of 17Facility ID No.: NY 000 1015
EFTLIUENT LIMITATIONS AhfD MONITORING REQUIRDENTS
During the period beginning July 1, 1983and lasting until July 1, 1988the discharges from the permitted facility shallper-ittee as specified below:
be limited and monitored by the
Outfall aner &Effluent Paran~eter Discharge LimitePairns
Daily7 Avg. Daily Max.Measurement Sanple
Frelixnc TypeUnits
010 Condenser Cooling Water Unit fi
Flow*Discharge TemperatureIntake - Discharge -Temperature Difference a
Net Rate of addition of heat aCyanide d
115
351.110.1
OFI09 kcal/hr.
mg/l
ContinuousContinuous
Monthly
CalculatedMetered
MeteredCalculated
12.-hr. Camxosi
011 Unit #1 Wastewater
Flow*
Oil and GreaseSuspended Solid%pHCyanide d
155a30
E.0 - 9.0 (PtageIe0.4
Batd±Batch. before discharge
M9g/l W
nig/1SUmg/1
Calculated
GrabN
020 Storm Drainage (No Monitoring Required) Unit #1
021 Filter Backwash & Makeup Demineralizer Water Supply
Flow*Oil & GreaseSuspended SolidspH
306.Q - 9.0 GPangel
1554
M911M1/1SUr/
BatchBatch each.
discharge
CalculatecGrab
022 Security tildin Air Coritionir b
Oil and GreaseSuspended SolidspH
155a3Q
6.0 - 9.0 OMangel
mq/1
so
Bimonthlyft
GrabN
Supplement 3 1A-2 September 1983
*91-20-2(5/10)PF. 4
NMP-2 FES Appendix E

Part IPage 3 of 17Facility ID No.: NY 000 1015
EFFLUENT LIM•ITATIONS AND MONITORING REQUIREMENTS
Durimg the period beginning with initiation of preoperational testing (Unit #2)and lasting until EDP + 5 Yearsthe discharges from the permitted facility shall be limited and monitored by thepermittee as specified below:
Outfall Number &Effluent Parameter
Discharge LimitationsDaily Avg. Daily Max.
Monitori=n Recxts.Meisurement Sample
Units FreQuency Type
001-006 Storm Drainage (No Monitoring Required)
007 Floor and Equipment Drains
Oil and GreaseSuspended SolidspH
155030
6.0 -. 9.0 (Range)
mg/lmg/1SU
2/Month Grab
008 Screen Well Fish Diversion System (No Monitoring Required)
040 Cooling Tower Blowdown (Unit #2)c
Flow*Discharge TemperatureIntake - Discharge Temperature DifferenceNet Addition of HeatTotal Residual Chlorine 0.2pH 6.0 - 9.0 (Range)
110(43.3)30(16. 7
0. 12 x '0ý
0.5
Continuous RecorderOF(ýC)
kcal/hr.mg /ISU
DailyContinuous2/Week
CalculatedRecorderGrab
041 Unit #2 Wastewater (including Demineralizer Regeneration Wastes, Filter Backwash,Floor Drains, & Treated Radioactive Wastese.)
Flow*Oil and Grease
Suspended SolidspH
mg/l
mg/lSU
Batch Calculated" Grab (once before
discharze)30
6.0 - 9.0 (Range)
50
FOOTNOTES
*Monitoring Requirement Only
aThe intake temperature shall be considered that temperature existing after intake water
tempering.bThese limits and monitoring requirements shall not apply if this wastewater is discharged
upstream o-f the sewage treatment facility.CThere shall be no discharge of heat from the main condensers except heat may be discharged
in blowdown from recirculated cooling water systems provided the temperature at which theblowdown is discharged does not exceed at any time the lowest temperature of recirculatedcooling water prior to the addition of the makeup water.
Monitoring and limits may be deleted following DEC evaluation of monitoring data.91-20-2(5/80)Pg. 4
epH range of 4.0 - 9.0 is allowable for wastewater having a conductivitY of less than10 mho/cm
Supplement 3 1A-3 September 1983
NMP-2 FES Appendix E

Part IPage 4 of 17Facility I.D. No. NY 000 1015EFFLUENT LIMITATIONS
During the period beginning EDP and lasting until EDP + 5 Yearsdischarges from the permitted facility shall be limited and monitored by the permitteeas specified below:Outfall
Number
030
TABLE I
Effluent Limitations (Maximum Limits except where otherwise indicated)
(X) Flow 30 day arithmetic mean 65,000 ( )MGD (X)C(X) BOD 30 day arithmetic mean __ mg/l and lbs( ) BOD5 7 day arithmetic mean mg/l and lbs(X) BOD5 Daily 45 mg/l and lbs( ) UOD'(2) Daily - I and lbs(X) Suspended Solids 30 day arithmetic mean • mg/l and lbs( ) Suspended Solids 7 day arithmetic mean mg/l and lbs(X) Suspended Solids Daily - m~Jl and lbs,(X) Effluent disinfection required: (x) all year
( ) Seasonal from toFecal Coliform 30 day geometric mean shall not exceed 200/100 mlFecal Coliform 7 day geometric mean shall not exceed 400/100 mlFecal Coliform 6 hour geometric mean shall not exceed 800/100 ml (3)Fecal Coliform No individual sample may exceed 2400/100 ml (3)
;PD/day (i)/day/day/day/day (1)
/day/day
shall not exceed( ) Total Coliform( ) Total KjeldahJl Nitrog()Ammonia
) Dissolved Oxygen(X) pH(X) Settleable Solids( ) Phosphorus
) Total Nitrogen
Ltoring RecuirementsParameter
Dailyen Daily
Daily
Minimum
RangeDailyDailyDaily
The chlorine residual in the final discharge
/100 mlJmg/l as N/MJml as N 3
greater than mg/l6.0 to 9.0
.7flas Pmg/l as N
TABLE 2 Samnle Location.Influent EffluentFreouency Sample Type
Cx) Total Flow, MGD .2/Month Grab(x) BOD , m. _. $1
(X) Suspended Solids, mg/l ....(X) Fecal Coliform, No./100 ml ....
Total Coliform, No./100 ml( ) Total Kjeldahl Nitrogen, mg/l as N( ) Ammonia, mg/l as __ __
( ) Dissolved Oxygen, mJl_(X) pH LMnth GrabCX) Settleable Solids, m&/i is...I@(X) Residual Chlorine, mg/l ....___X
C ) Phosphorus, 'M-0 as P( ) Temperature, 0 C( ) Total Nitrogen, mg/l as N() Visual Observation
(W)and effluent values shall not exceed % of influent values.(2)UOD (Ultimate Oxygen Demand) shall be computed and reported as follows:
UOD = i x BOD 5 + 4f. x TEN (Total Kjeldahl Nitrogen).(3)applicable only in the Interstate Sanitation District.(4)sample contact chamber effluent and final effluent if limits are specified for both.
91-20-1 (2/78) Supplement 3 1A-4 September 1983
NMP-2 FES Appendix E

Part IPage5 of 17Facility ID No.: NY 000 1015
Definition of Daily Average and Daily Maximu
The daily average discharge is the total discharge by weight or in other appropriateunits as specified herein, during a calendar month divided by the number of days in themonth that the production or counercial facility was operating. Where leass than dailysampling is required by this permit, the daily average discharge shall be determined bythe summation of all the measured daily discharges in appropriate units as specifiedherein-divided by the number of days during the calendar month when the measurementswere made.
The daily maximum discharge means the total discharge by weight or in other appropriateunits as specified herein, during any calendar day.
Monitoring Locatiom.
Permittee shall take samples and measurements to meet the monitoring requirements atthe location(s) indicated below: (Show locations of outfalls with sketch or flowdiagram as appropriate).
SEC.RITY BLU.ING
AlRCaCITICtING wASTENATER
UNIT 1 022UN IT# 2 ff a `Zk NITARY WASTE TREATh'N
FLOOR&EQUIP,
DRAINS
PLANT
INTAKE - LUNIT-1
INTAKE -ULiT-2
* Mo~{ r-r~w~~T ~ri
Supplement 31A-5
September 1983
o0-_7-12(S/80)Pjt. 3
NMP-2 FES Appendix E

Part IPage 6 of 17Fac4ity ID No. NY 000 1015
ni TC,
.. ~ .-- *.'~
I I
//
-9,./
- I / -~- -
~ -~gi - - - - - -'I * **' ...,~-4
fii a
'I - Is lIEN:C. - I ~ f
'~. L ~.,
* 4'
* ~ *,j,,~ I,''
lIE:K,'
i.e
1~
4----W- O~O
(r1
co
0
IA-6
NMP-2 FES Appendix E

Part IPage 7of 17Facility ID No. NY 000 1015.
ADDITIONAL REQUIREMENTS:
I. The following requirements are applicable to Units #1 and #2.
1. There shall be no discharge of PCB's from this facility.
2. In regard to general conditions 11.5, items #3 and #4 shall bereported semi-annually to NYSDEC offices in Cortland and Albany.
3. There shall be no discharge of boiler chemical cleaning compounds,
metal cleaning wastewater, or boiler bldown fram this facility.
4. Radioactivity
a. Gross Beta - Shalh 0 not exceed 1,000 picocuries per liter inthe absence of Sr and alpha emitters.
b. Radium 226 - Shall not exceed 3 picocuries per liter.
c. Strontium 90 - Shall not exceed 10 picocuries per liter.
5. The permittee shall submit on a trimesterly basis a report to theDepartment's offices in Cortland and Albany by the 28th of themonth following the end of the period. Submission of reports forUnit #2 shall commence with the initiation of reactor low powertesting.
a. Daily minimum, average, and maximum station electrical outputshall be determined and logged.
b. Daily minimum, average, and maximum water use shall be directlyor indirectly measured or calculated and logged.
c. Daily minimum, average, and maximum intake and dischargetemperatures shall be logged.
d. Measurements in a, b, and c shall be taken on an hourly basis.
6. The location, design, construction, and capacity of cooling waterintake structures, in connection with point source thermal discharges,shall reflect the best'technology available for minimizing adverseenvironmental impact.
7. All thermal discharges to the waters of the state shall assure theprotection and propagation of a balanced indigenous population ofshellfish, fish, and wildlife in and on the body of water.
Supplement 3 IA-7 September 1983
NMP-2 FES Appendix E

Part IPage 8 of 17Facility ID No. NY 000 1015
8. Niagara Mohawk shall notify the Department within one week fromthe time of submission to the Nuclear Regulatory Commission of anyrequested changes to the Environmental Technical Specificationsrequirements which could in any way affect the requirements ofthis permit.
9. Niagara Mohawk shall also submit concurrently to the Departmentany water-related report on the environment it submits to anyfederal, state, or local agency.
10. Niagara Mohawk shall provide access to the Nine Mile Point Site atany time to representatives of the Department subject to sitesecurity regulations to assess the environmental impact of theoperation of the Nine Mile Point Nuclear Facility and to reviewany sampling program, methodology, and the gathering and reportingof any data.
11. No biocides, slimicides, or corrosion control chemicals are authorizedfor use, except for those listed by parameter in the permit. PriorDepartment approval is required for any additional use of thesechemicals as well as for the use of any new water treatment chemicals.
II. The following requirements are applicable to Unit #1.
1. By August 1, 1983, the permittee shall submit final plans, signedand sealed by an engineer licensed to practice in New York State,describing the addition of storage capacity for discharges 011 and021. Construction to be initiated by October 1, 1983.
2. The Department has approved the applicant's request pursuant toSection 316(a) of the Clean Water Act (CWA) for alternative effluentlimitations at this facility. The thermal effluent limitations onpage 2 of this permit reflect this approval.
3. The water temperature at the surface of Lake Ontario shall not beraised more than three Fahrenheit degrees over the temperature thatexisted before the addition of heat of artificial origin except ina mixing zone consisting of an area of 425 acres from the point ofdischarge, this temperature may be exceeded.
4. The Department has contingently approved the applicant's considerationof intake impacts submitted pursuant to Section 316(b) of the CWA.Completion of the biological monitoring program described inAdditional Requirement Section IV and demonstration of impactssimilar to previous studies is required to obtain final approvalof the 316(b) request.
Supplement 3 1A-8 September 1983
NMP-2 FES Appendix E

Part IPage 9 of 17Facility ID No. NY 000 1015
III. The following requirements are applicable to Unit #2.
1. By initiation of reactor lower power testing, the company shallfile for approval with the Department at its offices in Albanyand Syracuse an updated report on all Unit #2 water treatment,corrosion inhibitor, anti-fouling, slimicide, biocide, andboiler cleaning chemicals or compounds. Such report shallidentify each product by chemical formula and/or composition,annual consumption, frequency of use, maximum use per incident,effluent concentration, bioassay and toxicity limits, and proceduresfor use. Approval shall only be granted for those circumstancesand uses which do not contravene New York State Water QualityStandards. No substitutions will be allowed without prior approval.Wastewaters containing chemicals and oil shall be collected andtreated prior to dilution with non:-contact cooling water in facilitieswhich shall beapproved by the Department.
2. No discharge from this facility shall cause violation of the NewYork State Department of Health regulations contained in 10 NYCRRPart 170 at the source of intake of any water supply used fordrinking, culinary or food processing purposes.
3. Pursuant to Part 704 Criteria Governing Thermal Discharges, Section704.3-Mixing Zone Criteria, upon the presentation of a final designfor the discharge, the Department shall specify, as appropriate,definable numerical limits for the mixing zone, including lineardistances from the point of discharge, surface area involvement,and volume of receiving water entrained in the thermal plume.
4. Not less than 180 days prior to the initiation of discharge fromthe Nine Mile Point Nuclear Generating Station Unit #2, NiagaraMohawk shall submit for approval to the Department of EnvironmentalConservation a plan of study for:
Verification of the extent of the thermal plume in thereceiving waters by conducting thermal surveys inalternate months except for December through Marchduring the first two years of operation.
5. Existing biological studies in Lake Ontario as required by regulatoryagencies shall continue. Such study programs shall be adjustedas required by regulatory agencies to assess the operating impactof Unit #2. Requirements to submit reports, frequency of submission,and content shall be established at the time of approval of thestudy programs.
Supplement. 3 1A-9 September 1983
NMP-2 FES Appendix E

Page 10 of 17Facility ID No. NY 000 1015
6. Not less than 180 days prior to the initiation of discharges fromthe Nine Mile Point Nuclear Generating Station Unit #2, NiagaraMohawk shall submit to the NYSDEC office in Albany three copies ofthe following plans and specifications. Plans shall be stampedby an engineer licensed in New York State.
a. Plans of proposed structures, including intake structure,diffuser, tunnel cross section, cooling tower, screenwellbuilding, and equipment (including pumps).
b. Plans of all on-site treatment facilities including oil/waterseparators.
c. Piping and/or flow diagrams for all facility waste streams,including any piping to or from Nine Mile Point Unit #1 andcontaminated plant and site drainage.
d. Flow diagram of circulating cooling water system from theintake to the diffuser.
IV. Biological Monitoring and Related Matters - Unit #1
A. Previous Biological Monitoring Data - EDP + 3 Months, the permitteeshall file with the Chief, Bureau of Environmental Protection inAlbany; Fishery Section head in Cape Vincent; and with the RegionalSupervisor of Fish and Wildlife in Syracuse a report containingand/or identifying all previous reports regarding this facilitywhich contain biological data relating to the ecological effectsof plant operation from March 31, 1975 to the present. Previouslysubmitted reports need not be duplicated, but title, date, anddata location must be completely identified. A copy of all unsubmitteireports and data shall be sent to the above offices by EDP + 3 Months.Data to be reported should include, but is not necessarily limitedto cooling water flows, dates, times, available operating andmeteorological conditions, and species, numbers and other availablebiological information.
B. Impingement Monitoring - The permittee shall conduct a program todetermine the numbers and total weights by species of fish impingedon all intake traveling screens.
1. Collections shall be made seventy-eight (78) days each year,provided that the circulating water pumps are in operation.When collection days coincide with shut down of the maincirculating water pumps, collections need not be taken.Collections shall be obtained at the following intensity ondays randomly selected within each month. Should therandomly selected dates result in a period in excess of 10days during any month in which sampling does not occur,
Supplement 3 1A-10 September 1983
NMP-2 FES Appendix E

Part IPage 11 of 17Facility ID No. NY 000 1015
additional sampling is required so that periods in
excess of 10 days without a sample do not occur.
Month Number of Sample Days
January 4February 4March 4April 16May 20June 4July 4August 6September 4October 4November 4December 4
2. Collections shall be conducted for a minimum period of24 hours. The beginning of the 24-hour period shall beselected and held constant by the permittee for allcollections. A collection period shall be no longerthan 26 hours. Impingement collection shall be calculatedand reported on a 24-hour basis.
3. Travelling screens shall be washed until they are cleanprior to the start of the 24-hour collection period..
4. Individual length (cm) and weight (g) measurements shallbe made on white perch, smallmouth bass, yellow perch,alewife, rainbow smelt, and each species of salmonid inorder to characterize the size'distribution for each24-hour collection. No less than 25 organisms of eachspecies shall be measured unless fewer than 25 individualsoccur in the collection.
If more than 25 individuals of a single species are collected,except for smallmouth bass, yellow perch and each species ofsalmonid which are to be processed separately, a represent-ative subsample of 25 fish shall be removed and lengthsand weights recorded for the subsample. In the event ofhigh impingement numbers, an estimate of the numbers andtotal'weights by species fish shall be calculated as follows:
Estimated No. of Fish - (Volume of Total Sample) X (No. of Fish in Subsample)Volume of Subsample
The total sample volume shall be determined by repeatedlyfilling a volumetrically graduated 20-gallon plastic containerand then recording and summing the values. The total volumeis then thoroughly mixed by hand or with a shovel and spread
Supplement 3 IA-11 September 1983
NMP-2 FES Appendix E

Part IPage 12 of 17Facility ID No. NY 000 1015
out evenly over a flat surface. An aliquot of the totalsample is randomly selected and this sample portion isremoved from the flat surface and measured in the graduatedcontainer to determine its approximate volume. The totalnumber of fish in the subsample is then determined.
In the event of extremely large impingement loads, thepermittee may request regional staff to make adjustmentsto or suspend the above subsampling procedures.
5. Electrical output and operation of the condenser coolingwater system including intake and discharge temperature andtotal flow shall be recorded on a daily basis and tabulatedas required in the following section an reporting.
6. By EDP + 3 Months, the permittee shall file for approval atthe office in Section IV.A. above, a plan which willdetermine the collection efficiency of the followingimpinged organisms: white perch, smallmouth bass, yellowperch, alewife, and rainbow smelt. Prior collectionefficiency data specific to this plant may be substitutedfor the above plan provided that it is submitted by EDP +3 Months, to the NYSDEC and approved by the NYSDEC.
C. Reporting
1. All data required by Section IV or incorporated by referencein Section. IV shall be included in an annual biologicalmonitoring report.
2. The annual report shall be submitted by six months from thelast month of data collection.
3. The following shall be included in the annual report inaddition to (1) above:
a. Monthly and annual totals of impingement by speciesand grand total over all species. The calculationsto be done are as follows:
e Monthly "mean" is equal to the total numberof fish impinged by species on the samplingdays in the month divided by the total numberof sampling days.
* Annual "mean" is equal to the total number offish impinged by species on the sampling daysin the year divided by the total number ofsampling days.
Supplement 3 1A-12 September 1983
NMP-2 FES Appendix E

Part I 17Page 13 ofFacility-ID No.. NY 000 1015
Similar calculations shall be madeover species. The total number ofdays shall be clearly indicated ining the "totals".
for grand totalfish and samplingany table report-
b. An estimate of the collection efficiencies to bedetermined pursuant to Section IV.B.6. above. Ifsufficient time is not available to include theseestimates in the first annual report, the permitteemay, upon written request and substantiation and withNYSDEC approval, extend this reporting requirementinto an annual report other than the initial.
c. Estimates shall be developed of the average monthlyimpingement rate based on the number of samplingdays and total volume of water pumped during thesedays, and also of the total monthly impingement basedon the average monthly rate and the volume of waterpumped during the month, for each species impinged.
4. All measurements shail use the metric system, e.g., flowsshould be in cubic meters/sec. (m3 /s).
5. Copies of all reports regarding water and biological parametersrelated to intake and discharge considerations, whethergenerated for this permit or otherwise, shall be sent to theoffices in Section IV.A. above.
6. Report(s) submitted in fulfillment of permit conditions shallclearly identify on the title page the permit number and thespecific section(s) by character and number that the report(s)fulfill. Each.section of the text of such report(s) shallidentify the section(s) of the permit that it fulfills.
7. NYSDEC reserves the right to have more frequentthe data required to be reported, provided thatis given at least one (1) month prior notice offrequent reporting requirements.
submittal ofthe permitteesuch more
8. The measures the permittee instituted,ing year to accomplish minimization ofaquatic biota shall be sent to the offices
if any, in the report-facility impacts onin Section IV.A. above.
9. The formats for reporting the following data are included inAppendix A. Data sheets ard formats for reporting the following data:
a.b.c.d.
FlowTemperatureCirculator operationElectrical output
are available fram the office of Envirormental Protection.
Supplement 3 1A-13 September 1983
NMP-2 FES Appendix E

Part IPage 14Facility
of 17ID No. NY 000 1015
D. Biological specimens may be required to be submitted to the.NYSDEC upon request.
E. The facility shall be operated in such a manner as to minimizefacility impacts on aquatic biota.
F. As a result of the NYSDEC's review of the biological monitoringprogram, the permittee may be required to implement appropriatemethods and procedures to reduce to the fullest extent possiblethe effects of facility operation on aquatic organisms.
Supplement 3 -14 September 1983
NMP-2 FES Appendix E

F'acI•lty M No.: NY 000 1015
SrCb=LE OF COMPLIANCE FOR ELM12T LIMITATIONS
(a) Permittee shall achieve compliance with the effluent limitationsspecified in this permit for the permitted discharge(@) in accordance with thefollowing schedule:
Action OutfallCode - Number(s) ComTlia&nce Action
02 oil & 021 Approvable Final Plans-Waste Storage Tanks(Additional Requirement # II.l.)
04 Oil & 021 Commencement of Construction(Additional Requirement #11.1)
Due Date
8/1/83
10/1/83
01 All
44 040
02 040
39 NA
44 NA
Chemical Use Report-Unit(Additional Requirement #riI.l)
Plan of Study-Thermal Plume Verification(Additional Requirement #111.4).
Final Plans-Circulating CoolingWater & Waste Treatment(Additional Requirement #111.6)
Compliation of Reports containingBiological Data(Additional Requirement #IV.l.a)
Plan of Study-Collection Efficiency(Additional Requirement #IV.6)
Initiation ofreactor low powertesting.
180 days priorto initiation ofdischarge.
180 days prior toinitiation ofdischarge.
EDP + 3 Months
EDP + 3 Months
(b) The permittee shall submit to the Department of Environmental Conservationthe required document(s) where a specific action is required in (a) above to be.taken bya certain date, and a written notice of compliance or noncompliance with each of theabove schedule dates, postmarked no later than 14 days following each elapsed date. Eachnotice of noncompliance shall include the following information:
1. A short description of the noncompliance;
2. A description of any actions taken or proposed by the permitteeto comply with the elapsed schedule requirement without further delay;
3. A description of any factors which tend to explain or mitigatethe noncompliance; and
4. An estimate of the date permittee will comply vith the elapsedschedule requirement and an assessment of the probability that permittee will meetthe next scheduled requirement on time.
91-18-1 (9/78)
Supplement 3 1A-15 September 1983
NMP-2 FES Appendix E

Part IPagel6 of 17
'MON=TORING, RECORDING AND REPORTING Facility ID No.: NY 000 1015
a) The permtitee shall also refer to the General Conditions (?art 11) of this per=itfor additional information concerning monitoring and reporting requirements and conditions.,
b) The monitoring information required by this permit shall be starized and reportedby submitting a completed and signed Discharge Monitoring Report form once every monthsto the Department of Environmental Conservation and other appropriate regulatory agenciesat the offices specified below, The first report will be due no later thanThereafter, reports shall be submitted no later than the 28th of the following month(s):
Water DivisionNew York State Department of Environmental Conservation50 Wolf Road - Albany, New York 12233
New York State Department of. Environmental ConservationReg±onal Engineer7481 Henry Clay Blvd.Liverpool, New York 13088
Oswego County Dept. of Bealtfi70 Bunter StreetOswego, New York 13126
• (Applicable only if checked):
Dr. Richard Baker, Chief - Permits Administration BranchPla-_nn & Management DivisionUSEPA Region I-26 Federal PlazaNew York, New York 10278
c) If so directed by this permit or by previous request, Monthly Wastewater TreatmentPlant Operator's Reports shall be submitted to the DEC Regional Office and county healthdepartment or county enviro=mental control agency specified above.
d) Monitor-ng must be conducted according to test procedures approved under40 CFR Part 136, unless other test procedures have been specified in this permit.
e)* If the per=ittee monitors any pollutant more frequently than required by thepermit, using test procedures approved under 40 CTR 136 or as specified in the permit,the results of this monitoring shall be included in the calculation and reporting of thedata submitted in the Discharge Monitoring Reports.
f) Calculations for all limriftations which require averaging of me-asurements shallutilize an artihmetc =ean unless otherwise specified in the permit.
g) Unless otherwise specified, all information submitted on the Discharge MonitoringForm shall be based upon measurements and sampling carried out during the most recently
,completed repcrr±-g period.
h) Blank Discharge Monitoring Report Forms are available at the above addresses.
91-20-2 (8/81) Page'2
Supplement 3 1A-16 September 1983
NMP-2 FES Appendix E

Part IPage 17 of 17Facility ID No.: NY 000 1015
SCHUMLE OF C04LANCE FOR _ETLU-T LIMITATIONS(Continued)
c) The permittee shall submit copies of the written notice ofco=pliance or noncompliance required herein to the follcving offices:
Chief, Compliance SectionNew York State Department50 Wolf RoadAlbany, New York 12233
Regional Engineer #7New York State Department7481 Henry Clay BoulevardLiverpool, NY 13088
of Environmental Conservation
of Environmental Conservation
Osec County Dept. of Health70 Bunner StreetOswego, New York 13126
USEA Region IiPlariing and Manag;re~nt Division26 Federal PlazaNev York, New York 10278
The permittee shall submit copies of any engineering reports, plansof study, final plans, as-built plans, infiltration-inflow studies, etc. requiredherein to the New York State Department of Environmental Conservation RegionalOfftce specified above unless otherwise specified in this permit or in writingby the Department or its designated field office.91-18-2 (9/76)
Supplement 3 1A-17 September 1983
NMP-2 FES Appendix E


APPENDIX F
HISTORIC AND ARCHEOLOGIC SITES
Sites listed or eligible for listing in the National Register of HistoricPlaces that are located in towns within 15 km of Nine Mile Point
Letter from Stephen J. Raiche, State Historic Preservation Officer (SHPO),to P. D. Patel, Stone & Webster Engineering, December 11, 1979
Letter from J. A. Miakisz, Environmental Analyst, Niagara Mohawk PowerCorporation, to Stephen J. Raiche, SHPO, January 18, 1984
Letter from Julia S. Stokes, Deputy Commissioner for Historic Preservation,to J. A. Miakisz, Environmental Analyst, Niagara Mohawk Power Corporation,February 24, 1984
NMP-2 FES Appendix F


SITES LISTED OR ELIGIBLE FOR LISTING IN THENATIONAL REGISTER OF HISTORIC PLACES THAT ARE
LOCATED IN TOWNS WITHIN 15 km OF NINE MILE POINT
AREA PROPERTY
Constantia Trinity Church
Mexico Village Gustin-Earle Factory
Oswego Fort OntarioFranklin Square Historic
DistrictMarket HouseMusico Motors BuildingOswego City HallOswego City LibraryOswego West Side
Archelogical DistrictPontiac HotelRichardson-Bates HouseSheldon HallU.S. CustomhouseWalton and Willette Stone
Store
Pulaski Pulaski Village HistoricDistrict
Source: U.S. Department of Interior, National Park.Service, National Register, 1979, 1980, 1981,1982, 1983, and 1984
NMP-2 FES 1 Appendix F

NEW YORK S10E. PARKS& RECREATION AryqnCw.t,,.,nq I Em'r.'lt Sira ij AIIflnv. New Yofk 12238 Inlor.Inn h•n IS47 Ad 0456
Orn Lehman Comm,ss,onpr
December 11, 1979
Mr. P.D. PatelLead Environmental EngineerStone & WebstIr EngineeringCherry Hill Operations Center3 Executive Campus, P. 0. Box 5200Cherry Hill, NJ 08034
Dear Mr. Patel:
Operating PermitNine Mile Point Nuclear Station - Unit 2Scriba, Oswego County
The State Historic Preservation Officer (SHPO) hasreviewed the above project in accordance with the AdvisoryCouncil on Historic Preservation's regulations, "Protectionof Historic and Cultural Properties," 36 CFR 800.
Based upon this review, it is the opinion of the SHPOthat this project will have no effect upon cultural resourcesincluded in or eligible for inclusion in the National Registerof Historic Places.
Should you have any questions, please contact the pro-ject review staff at 518-474-3176.
Sincerely,
STATE_: IISTORIC PRE qVATION OFFICER
By Steph n Jn Ra.cheDirectorHistoric Preservation Field Services
LRK:mr3/79
NMP-2 FES 2 Appendix F

T NIAGARAUMOHAWK
NIAGARA MOHAWK POWER CORPORATION,300ERIE BOULEVARD WEST. SYRACUSE. NY 13202/TELE•HCNE (315) 474 1511
January 18, 1984
Mr. Stephen J. Raiche, DirectorHistoric Pr servation Field ServicesNYS Parks and RecreationAgency Building 1Empire State PlazaAlbany, NY 12238
RE: Nine Mile Point Nuclear Station Unit 2
Dear Mr. Raiche:
Presently, Niagara Mohawk's application for an operatinglicense for the Nine Mile Point Nuclear Station Unit 2is pending approval by the Nuclear Regulatory Commission.In December of 1979, yomr office reviewed the Unit 2project and concluded, based on that review, that it willnot have any effect upon cultural resources included inor eligible for inclusion in the National Register ofHistoric Places (see attached correspondence).
It is my understanding that your 1979 review was limitedto the Nine Mile 2 project boundary per se and did notinclude a review of the transmission line that will beconstructed to serve this Project. The Nine Mile 2-Volney345kV Transmission Line has, however, been reviewed underArticle VII of the NYS Public Service Law and was approvedby the Public Service Commission on August 12, 1983.
The enclosed reports document the results of culturalresource studies of the Nine Mile 2-Volney TransmissionLine right-of-way and-Scriba Substation. These studieswere performed for Niagara Mohawk by Pratt and PrattArchaeological Consultants, Inc., in support-of theArticle VII Certification proceedings.
Would you please review these reports and advise me ofany comments or concerns that you may have concerningconstruction of the Nine Mile 2-Volney transmission linefacilities. Niagara Mohawk will then forward any comments
NMP-2 FES 3 Appendix F

Mr. S. J. RalcheJanuary 18, 1984Page 2
you have concerning the transmission line along withyour 1979 comments concerning the Unit 2 Project tothe Nuclear Regulatory Commission in order that theymay meet their obligations under 36CFR800.
Please do not hesitate to contact me if you have anyquestions legarding this matter.
Sincerely,
J. A. MiakiszEnvironmental Analyst
JAM/kmEnclosurexc: J. M. Toennies/T. J. Rooney
A. F. Zallnick/N. L. RademacherNMP2 Project File
Appendix F
I NMP-2 FES4

Q' A
SI~
/ • New York Stale Office of Parks, Recreation and Historic Preservation
-" The Governor lNe!ý on A Ro.:ke!ee•lr Er.nre State Plaza- WrI.,,qK ST A7 f Agency Bu'iding 1 Albany. New York 12238
Orin Ler~manCom-,s,oner February 24, 1984
J.A. Miakisz, Environmental AnalystNiagara Mohawk Power Corp.300 Erie Boulevard WestSyracuse, NY 13202
Dear Mr. Miakisz:
NRC ProjectNine Mile PointNuclear Station, Unit 2Cultural Resource SurveyScriba, Oswego County
The State Historic Preservation Officer (SHPO) hasreviewed the above project in accordance with theAdvisory Council on Historic Preservation's regulations,"Protection of Historic and Cultural Properties," 36 CFR800.
Based upon this review, it is the opinion of theSHPO that this project will -have no effect upon culturalresources included in or eligible for inclusion in theNational Register of Historic Places.
Should you have any questions, please contact theproject review staff at 518-474-3176.
Sincerely,
iaS. Stokes7 puty Cormrissioner for HistoricAR•H :mr ) irese rvation
#111/82
NMP-2 FES 5 Appendix F


APPENDIX G
EVALUATION OF THE ENVIRONMENTAL EFFECTS DUE TOTHE CHANGE IN COOLING SYSTEMS AT NINE MILE POINT UNIT 2
FROM A ONCE-THROUGH SYSTEM TO A CLOSED CYCLE SYSTEMUTILIZING A NATURAL DRAFT COOLING TOWER
RELATED TO THE OPERATION OFNINE MILE POINT NUCLEAR STATION, UNIT 2
DOCKET NO. 50-410NIAGARA MOHAWK POWER CORPORATION
APRIL 1981
Prepared by the Nuclear Regulatory Commission,Office of Nuclear Reactor RegulationWashington, D.C.
NMP-2 FES Appendix G


APPENDIX G
The following NRC persons contributed to the preparation of the report.
W. Britz, Health Physicist
M. Fliegel, Hydrologist
G. Gears, Land Use Analyst
J. Goll, Meteorologist
C. Hickey, Senior Fishery Biologist
T. Johnson, Hydrologist
M. Kaltman, Regional Planning Analyst
K. Kiper, Project Manager
J. Norris, Environmental Project Manager
R. Samworth, Environmental Engineer
NMP-2 FES i Appendix G


TABLE OF CONTENTS
PAGE
IINTRODUCTION...................................................... 1-1
2 ENVIRONMENTAL DESCRIPTION.......................................... 2-1
2.1 Water Use .................................................... 2-12.2 Ecology...................................................... 2-1l
2.2.1 Terrestrial Ecology .................................... 2-12.2.2 Aquatic Ecology........................................ 2-1l
2.3 Socioeconomics................................................2
2.3.1 Introduction........................................... 2-1L2.3.2 Community Characteristics .............................. 2-5
2.3.2.1 Physical Ambiance ............................. 2-52.3.2.2 Municipalities and Other Government
Organizations in the Area...................... 2-52.3.2.3 Population and Existing Land Use Patterns ... 2-92.3.2.4 Transportation Facilities ....................... 2-112.3.2.5 Taxes and Community Services ............... 2-142.3.2.6 Future Development and Planning Objectives
of the Local Communities ....................... 2-14
2.3.3 Historic, Natural, and Scenic Points of Interest .... 2-17
3 PLANT DESCRIPTION ......................................... 3-1
3.1 Plant Water Use .............................................. 3-13.2 Cooling System ............................................... 3-1
3.2.1 Intake System..........................................3-13.2.2 Discharge System ...................................... 3-11
4 ENVIRONMENTAL IMPACTS OF CONSTRUCTION .............................. 4-1
4.1 Ecological Impacts............................................ 4-1
4.1.1 Terrestrial Ecosystems.................................. 4-14.1.2 Aquatic Ecosys tems.....................................4-1
NMP-2 FES iiApnii i i ,Appendix G

TABLE OF CONTENTS (Cont'd)
PAGE
4.2 Socioeconomic Impacts ......................................... 4-2
4.2.1 Stress on Community Services ........................... 4-24.2.2 Highways and Traffic ................................... 4-24.2.3 Tax Revenues ........................................... 4-44.2.4 Employment and Income Benefits .......................... 4-44.2.5 Impact of Aesthetic on Recreation and Land Uses ........ 4-44.2.6 Summary Comparison of Impacts of Alternative Cooling
Systems ................................................ 4-4
5 ENVIRONMENT IMPACT OF STATION OPERATION ............................ 5-1
5.1 Cooling System Impacts ........................................ 5-1
5.1.1 Intake System; Aquatic Impacts ......................... 5-15.1.2 Discharge System; Aquatic Impacts ...................... 5-115.1.3 Heat Dissipation Systems; Impacts to Terrestrial
Ecosystem .............................................. 5-16
5.2 Radiological Impacts of Normal Operation ...................... 5-17
5.2.1 Dose Evaluation for Cooling Tower Operation ............. 5-18
5.3 Socioeconomic Impacts ......................................... 5-18
5.3.1 Physical .............................................. 5-185.3.2 Social and Economic .................................... 5-18
5.3.2.1 Visual and Aesthetic Impacts ............. ..... 5-185.3.2.2 Noise ........................................ 5-255.3.2.3 Drift and Local Weather Modifications ......... 5-265.3.2.4 Tax Revenues ................................. 5-275.3.2.5 Summary Comparison--Impacts of Alternative
Systems on the Human Environment ............... 5-27
6 ECONOMIC EVALUATION ................................................. 6-1
6.1 Expenditures Previously Committed to the Once-Through System . 6-16.2 Direct Cost Differential ...................................... 6-16.3 Engineering Services Cost Differential ........................ 6-56.4 Operational Cost Penalties .................................... 6-5
NMP-2 FES i v Appendix G

LIST OF TABLES
TABLE PAGE
2.1 Scheduled Frequency of Sampling for Ecological Studies in NineMile Point Area of Lake Ontario (1976) ............................ 2-3
2..2 Summary of Sampling Locations for Ecological Studies in NineMile Point Area of Lake Ontario (1976) ........................... 2-5
2.3 Oswego County Land Use Inventory ................................. 2-7
2.4 Agricultural Acreage in the Nine Mile Point Impact Area: 1972 ... 2-8
2.5 Population in Impact Area: 1960-1990 ............................ 2-10
2.6 Selected Farm Characteristics for Oswego County: 1969 and 1974 2-12
2.7 Inventory of Public Recreation Facilities in Impact Area ......... 2-13
2.8 Assessed Value and Taxes Levied in 1976 for Payment in 1977 2-15
2.9 Existence of Planning Boards and Development Regulations in theImpact Area: 1977 ............................................. 2-16
2.10 Inventory of Historic Sites Within Impact Area .................... 2-18
5.1 Summary of Fish Impingement Estimates (Major Species) at NineMile Point Unit 1 and FitzPatrick Nuclear Power Plants Duringthe Period 1973-1976 .............................................. 5-2
5.2 Comparison.of the AnnualTotal Number of Fishes (All Species)and Alewives in Impingement Samples During 1976 at Nine MilePoint and FitzPatrick Nuclear Power Plants, Adjusted for HoursSampled and Volume of Water Withdrawn During Sampling ............ 5-4
5.3 Critical Swimming Speeds of Alewife .............................. 5-5
5.4 Design Specifications of Palisades Nuclear Generating Plantand Donald C.. Cook Nuclear Plant Unit 1, Lake Michigan .......... 5-6
5.5 Summary of Fish Impingement Estimates (Major Species) atPalisades NPP During the Period of Once-Through Cooling (1972-73)and Closed Cycle Cooling (1974 to 1977) .......................... 5-7
5.6 Summary of Fish Impingement Estimates (Major Species) at CookNPP During the Period 1975-1976 .................................. 5-9
5.7 Chemicals Discharged from Unit 2 - Closed Cycle .................. 5-13
v Appendix GNMW'4 rca V

LIST OF TABLES (Cont'd)
PAGE
5.8 Comparison of Chemicals Discharged from Unit 2, Once Throughand ClosedCycle Cooling Systems ............................. .... 5-15
5.9 Visibility of Natural Draft Cooling Towers at Nuclear PowerStations ......................... ................................ 5-21
5.10 Population Change in Areas with Nuclear Power Stations andClosed Cycle Heat Dissipation Systems: 1965-1970 and 1970-1975 .. 5-23
6.1 Summary of. Differential Cost of Once-Through Versus CoolingTower ............................................................ 6-2
6.2 Direct Cost Comparison of Once-Through Versus Closed LoopCooling System-Estimate (D) ...................................... 6-3
6.3 Operational Cost Penalties Associated with Closed Loop CoolingSystem-Estimate ................................................. 6-4
LIST OF FIGURES
FIGURE PAGE
2.1 Nine Mile Point Ecological Study Area ............................ 2-2
3.1 Cooling Tower Location Nine Mile Point, Unit 2 ................... 3-2
3.2 Schematic of Water Flow, Yearly'Average Nine Mile Point, Unit 2 3-3
3.3 Flow Diagram, Service Water and Circulating Water System Nine.Mile Point, Unit 2 ............................................. 3-4
3.4 Relative Locations of Cooling Water Intake and DischargeStructures for Nine Mile Point Unit 1 and Unit 2 (previousonce-through and current closed-cycle designs) ................... 3-5
3.5. Closed Cycle Cooling System Intake Structure Design ... ............ 3-6
3.6 No. 1 Intake Tunnel and Diffuser ................................. 3-8
3.7 No. 2 Intake Tunnel and Fish Return System ....................... 3-9
3.8 Design of Screenwell, Fish Removal System and AssociatedStructures ....................................................... 3-10
3.9 Discharge Diffuser ............................................. 3-10
-2 FF5 vi *Appendix GNMP

SUMMARY AND CONCLUSIONS
This report was prepared by the U.S. Nuclear Regulatory Commission, Office ofNuclear Reactor Regulation.
The proposed change in the cooling mode for the Nine Mile Point Nuclear Sta-tion, Unit 2, from the previously reviewed once-through system to a closedcycle system utilizing a natural draft cooling tower (NDCT) will cause certainchanges in environmental effects. The most significant of these effects andtheir differences from those resulting from the once-through system are sum-marized below.
(a) The reduction in the intake volume and velocity will reduce the potentialfor fish impingement. This reduction, coupled with the capability forguiding entrapped fish back to Lake Ontario, should result in minimalimpact to the fish species affected by impingement.
(b) Similarily, the environmental risk associated with entrainment of organ-isms is expected to be reduced in approximate proportion to the fractionalflow reduction. The effects of entrainment on aquatic biota are now expect-ed to be so low as not to be measurable. Any effects which may be incurredare expected to be localized in the Nine Mile Point area only.
(c) The proposed system will cause discharge of a much larger quantity of chem-icals into Lake Ontario than would have resulted from the once-throughsystem. There are no applicable criteria or standards which would pro-hibit these substances from being discharged.
(d) The operation of the cooling tower will cause deposition of salt drift.It is expected that salt deposition from drift in the amounts projectedat Nine Mile Point will not result in unacceptable botanical damageeither through soil contamination or through foliar interception pathway.There is no salt drift associated with once-through cooling mode.
(e) The proposed change will cause an increase in the estimated radiologicaltotal body dose commitment to the maximum individual. These doses arehigher than those estimated for the once-through system. However, theyare within the guidelines of Section II.A, Appendix I to 10 CFR Part 50,and are therefore acceptable.
(f) The estimated annual radiological total'body dose commitment to the popu-lation within 80 km of the NMP-2 will also be higher than those estimatedfor the once-through system. However, they are cost-beneficial accordingto Section II.D, Appendix I to 10 CFR Part 50, and are therefore acceptable.
(g) The massive tower and the plume will represent a very large visual intru-sion over a large area. In contrast, the once-through system, not havinga massive tower or visible plume associated with its operation, is lessvisually intrusive and, therefore, is aesthetically preferred.
NMP-2 FES 1 Appendix G

(h) The noise produced by the operation of the NOCT will be of higher levelsthan from the once-through system. However, it is expected to be withinHUD noise guidelines and, therefore, acceptable.
(i) The proposed NOCT will cost more than the presently approved once-throughsystem. Niagara Mohawk Power Corporation estimates the difference to be$19.4 million.
The staff finds that both the NDCT and the once-through systems are environ-mentally acceptable. The proposed NDCT is ranked by the staff as preferableto the once-through system with respect to potential for fish impingement andfor entrainment of aquatic organisms. The once-through system is ranked bythe staff as preferable to the NDCT with respect to chemical load into the LakeOntario, drift and local weather modification, noise, radiological doses, andvisual aesthetics. However, considering the environmental effects in total,neither system is ranked by the staff as preferableiover the other.
The staff's analysis indicated also that the NDCT is $19.4 million more expen-sive to build and operate than the once-through system. This differential costbetween the systems represents a commitment of resources--materials, equipment,manpower, and incremental fuel requirements--that would not occur if the once-through system were built and operated as previously approved. However, thestaff has determined that this incremental cost does not tip the balance betweenthe costs and the benefits derived from the plant, but maintains the currentcost-benefit balance for the project as a whole.
Inasmuch as the environmental costs and benefits are not greatly changed bythis action, the staff has no objection to the modification in the coolingsystem as described herein.
2 -
NMP-2 FES Appendix G

I INTRODUCTION
On June 24, 1974 the Construction Permit No. CPPR-112 was issued to the NiagaraMohawk Power Corporation (NMPC) to construct Nine Mile Point Nuclear Station,Unit 2 (NMP-2) utilizing a once-through cooling system.
In February 1976, NMPC informed the Nuclear Regulatory Commission of theirintent to revise the cooling system for NMP-2 from a once-through cooling to aclosed cycle system utilizing a cooling tower. This was followed by a "ReportOn Circulating Water Cooling System Employing a Natural Draft Cooling Tower"submitted to the NRC in July 1976. On September 30, 1977 the report was supple-mented by "Responses to NRC Requests Dated April 22, 1977 for AdditionalInformation Regarding the Proposed Cooling System Design Change." In addi-tion, NMPC supplied NRC requests for further information in letters datedJanuary 16, 1978, April 18, 1978, and November 21, 1980.
This report summarizes the staff's environmental review and sets out the staff'stechnical evaluation of the proposed change.
NMP-2 FES 171 Appendix G


2 ENVIRONMENTAL DESCRIPTIONS
2.1 Water Use
The station is located in the northeast portion of the Lake Ontario Plain drain-age basin. The section that further describes surface water, 2.5.1, has notchanged and can be found on page 2-10 of the Final Environmental Statement (FES)for the Nine Mile Point, Unit 2.'
Additional water quality data for Lake Ontario has been provided by NiagaraMohawk Power Corporation in the form of several annual monitoring reports forNine Mile Point, Unit 1. A recent report, Nine Mile Point Aquatic Ecology Stu-dies 1977 Data Report, indicates that no basic water quality changes haveoccurred in Lake Ontario since the publication of the Nine Mile Point Unit 2,FES.'
2.2 Ecology2.2.1 Terrestrial Ecology
The description of terrestrial ecology of the site and vicinity included inSection 2.7.1 of the Final Environmental Statement issued in June 1973 isstill valid.' The staff has reviewed the list of threatened and endangeredspecies (Federal Register: Vol. 45, No. 99, May 20, 1980) and concludes thatthe site and vicinity contain no threatened or endangered species.
2.2.2 Aquatic Ecology
The aquatic biota of Lake Ontario and the Nine Mile Point area were discussedin Section 2.7.2 of the FES' based upon preoperational studies described in theApplicant's Environmental Report of January 1973 and pertinent published litera-ture. Additionally, the FES Summary and Conclusions (p. iv) and Section 6.1(pp. 6-1 to 6-5) recommended several modifications in the aquatic biologicalmonitoring programs at both Nine Mile Point and FitzPatrick Nuclear Stations forthe purposes of impact assessment. These modifications have been made, asreflected in the operational studies conducted at both facilities. 2 ' 3 ' 4 ' 5 ' 6 ' 7
The ecological and in-plant sampling programs are summarized in Tables 2.1 and2.2, with the farfield stations illustrated in Figure 2.1. Species occurrenceand composition are discussed in relation to potential impacts in Sections 5.1.1and 5.1.2.
2.3 Socioeconomics2.3.1 Introduction
This section summarizes the staff's evaluation of the social and economicimpacts of two alternative heat dissipation systems, once through and naturaldraft cooling towers. The potential impacts of alternative heat dissipationsystems for Nine Mile PointUnit 2 are evaluated with consideration given tothe construction and operation of a single natural draft cooling tower as areplacement for the once-through system which the staff had evaluated in itsJune 1973 FES. The staff's objective in the present analysis is to determine
NMP-2 FES 2-1 Appendix G

FIGURE 2.1 Nine Mile Point Ecological Study Area.Source: Reference 6, Vol. 1, Fig. 111-I.
CR.
z - i
~-UA
NZ
w~..
2 3:
a.
aC
zLJ42
0
"e4
0
NMP-2 FES 2-2 Appendix G

TABLE 2.1. Scheduledfrequency of Sampling for EcologicalStudies in Nine Mile Point Area of Lake Ontario(1976). Source: Reference 6, Vol. 1, Table 11-10.
A. ;ENELAL ECOLOCICAL EL'RVEY
'.on~aratine :raual study
Seine,
,;:l nets ý;eneral ecoL.)
13uc •alysis)
3ent no
Macural daoicacs
fton-Cladonnora Coe.ntun,
.:atn iz.4 analysis)Sedinent acounulation
3orctm juaLc-t•onjanir ;arbon)
ArtifitaL Suascraces ?einoheton)
So: t o3uo-!
1ater QuaLitc
Mont'L7 'LI i Z8 aacaneters)3SionctLy EL7 parameters).hermal strariL:atianRadio 1ogical uarer
(R-CC-ZCNC
:e 3rnLt
tW-,,ur rerriegals)
(earl-,
Alcernace notnvs
7.ice *•earlyM!Oonth[
Altcernate M4ontus
Munn 17-
AoriJ.-Dereaer
August
A.riL-Decienur
MonthLy.. ice nonhi
M!Onthl
?lankton
?h-'to•lankaon
Chlrnnvl , -L4, :0.mnity Monthlyv (3)
Eooolankcon MonchLy E0)
M4cranzooolankcon'
enuonratcon oe. taxa Monchly :)
enumerate Montaly 2?1,
?unonnr~oeis,
: acm.rus
:Cnthyoplankcan Meýeelt (D/4)
ttntovolanicone Ely )
koti~n.c.~oer
Aornt-SeceanerAorii-Sene:h.erApr~L- Dec tOner
- Aor~L-yeneinber
May-? en eon
AyrU-SnoooerJ-nne-,enonoer
JuneorS-Santenberus4~ 'a, oid-Sent enzer-Jenenner
3. -r1,n iILE ?OINT NLUCLE.kR 3TAT'OEi 'NIT L
fntrainzenc
E:tnnc'oolankiCionrebay onLyP:
Epn inemem t
"ekv : liz M)
Luice:ontL. ....
th•ree :imes;-meea
May-Setceoer 3
AorLl, Seo:e=mer 3-OcCr;er
Sanuary-Secemoer
NMP-2 FES 2-3 Appendix G

TABLE 2.1 (Continued)
C. JA.MES A. FITZPATR:CK NUCLEAR POWER PLANT
Entrainment
FREOUENCY' PERIOD
Phvcoplankton: ziscnarge afirav,
enumeration
a-!! and Cnloroohnln a: nntooiankconviability, intake &-discharge hayse
.oopiankton t
enumeration: cischaree arla:viabilitv
.amn-arus: i:take fcoreay,enumeration'
Uch:yoolanktocn: inLake 'crebas.enuneration-
Monthly (D)
Twice nonchly (D/N)
ý Montnly ID)
TIice monthly :0/N)
'MonChly (C 0/2 N)Monthlyp(D/N)
',eekl (2 D/2 1N)
Twice monthly (2 D/2 N)
,wice monthly CD/N)
.iabilhit of Ga--arus: intake Tvice monthly (N)farebav 1 discharze aitba,, Monchip (N)
"iaoilici of Cchthvoolankton: Monthly (D/N)intake forebay & discharge aftraye Twice mortnly CO/NI
Simulated Laboratory Studies C!? Mixing Zone & ZT Area) (scheduled)'
C-i4 & Chloronhyll a CMonhly• -- Twice monthS? (C)
Zooplankon f Monthly (D)
Twice monthly (NI
NTwice noochly (M)ichthyoplankmon NMonhl:y (N)
Twice monthly (NCfaaros Monthly (N)
Lake Viability Studies (3F? Mixing Zone & •70 Area)
5- & Chloropnyil a Monchly CD)
-oopiankton Monchly (D)
(.ice Monthly (D),chcbyoplaaktom Nice Monthly (N)
iMonchly (D/N)
:=pingement -hree timee/weekd'h
Acril-December
APril-Uecemaer
Anril-DecemberADril-December
-anuarv-Seotember
*ccooer-Decemner
May-September 8.anuary-vDril
Septemaer 22-Decenuer-
Noy-SepcenoerAzrý., Cctober-Decemner
Xav-Sep•teber
Arpril-Decesber
A::il-December
AprN ;-Nay
ceo tember
Aorirl-Sepcember 20Ocztber-December
A.r-December
April-December
April-August 31Jue-ugust 31
SepC ener
ianuary-December
_amoiin& contingent cn weather conditionsu7!crczociunantco analyzed from tahthnoplaoktoo coIlection-a--'inR date and t-ie tne same for Nine Mile Point and Pittlacriob Nuclear Stations (Hours: li00.
:7M, 22.0, f5•0. or 1:00 and :200); 30 minute sample:Monday and rridy: ZA-hr composite sample; ;ednesday: 2C hourly samples; frequency increased duni::
--r--- s of ,;;r-n ingement (>20,000 fish)no periods: 7, CL, -d, and 72 :o0' for 4an and nignt collections f(r C-U- a Zhlorophblla
aafe. e Se;a en.er(; - hours for cay collections for C-!4 only; i- ate analysis f:r :ava o.i snit cuoc ec: ons f:r :hlorophyll a analyses; C :epiicatea
icy: -m yours a:ter coilection (samole maintained in ambient water); enumeration of the same sa$pielAco"L onal samples L: lake conditions are hazardous'conesday: day:nighr collections as of C June
C •an collecticnS ignt zollet::i,
NMP-2 FES 2-4 Appendix G

TABLE 2.2 Summary of Sampling Locations for Ecological Studiesin Nine Mile Point Area of Lake Ontario (1976). DepthContours and Transects Correspond to those in Figure 2.1.Source: Reference 6, Vol. 1, Table 111-13.
-- -T. . ?ROGRAM -RAN SECTS,:;-"; - U., 5A.,-- U-
S. ? STUDY S--q •? pw SIX. ? P N14P P/F!Z _!TZ ? ME
ý-"re Seines 3 3 - 35o::oz ?enrivh.on D 3 3 3
lc Bentnos .non-Cladoohora community) 337 D 3 DBotram ?eriphvton 3 3 . 3?hvcoplankcOn- S 3 C C C
Zo . >6ar.k : . ,J :cii ca e co w C C C C-ill 4ets ýFisn) 541 3 3
3romachs) _3T B 2 3 3
- T aa.,ls •L3:er). 3 3
Ben:hos ýnon-2.adoonora cocnjniry) 3:. D D D. 'ice cn-:hLv ' 4_ quaiitv '17 parameters) 3 A Ai!onthlv 4, cualiti" (11 parameters) & A A A
RadioloeicalBSorro Fer:;n3ton "_7 3 3 3
?3: . .- •=- . C C C c-ocnia n:c .. (>76_.. vzli e : o0 .
:7 Q.- aiity 43 parameters) 5Raaiological I A
ci ill Sets '.Fish) 5'
3entios scn-Cladcchora commsunity) 33T D D 3
Sot= ' 3-,• ..a'Ls t .:er; 55T 3 •
fiandar- Yankee Trawl) 530 3
5i!s 'Net. ý'ish) S-ni~hc;13T-Aay 3 3 3 5-enz.os ýn:n-,ladoonora :comuni:y
5 :a4rns size) 3 3 - D_ediment (crzanic -arbon) CT-3uoS -er i-'y :=n :
Sediment Accu=ulaamion D 3
Monthly ..0 Quality (11 Para=ecers) AARadio o0ical
Otto= 3er:h. on5 D D D D?h-.vtoplazkmas •C C
::separate
-. c~iznk:c S ..'s•-) :4!1u .' CC C
:Monthlv -.. Qaiity ;48 ýara=ecers) & A
Rsdiolozical -
C Trawls (Cz:erj 5 3
(Standard Yankee Trawl) BeT 3,iil Yets (Fish) C 3 3 3 3Senthos (on-C.adothora community) 3- 3 D DTwice con:hlyv 0. Quality (17 parameters) A A A
neral 4r ::zaS.n A:0 -erna i S:rat f.i:acsion A ~ AA
.a "-z~er Quali ty F=rcgra=rga=svrr- ih .ora--
" ankcon ?rc;ra=-- 5n ci ?.-ora= '3ers:.cs and ?eriphycon)E " :' .Zce
-=T"-ýctem
' non :rc;-ra= - ecies enss-aeration, C-14, a-t ,::c.:rcnvyl a
NMP-2 FES 2-5 Appendix G

whether the natural draft cooling tower produces impacts in the human environ-ment which are significantly worse than those produced by a once-through system.If the staff finds that the natural draft cooling tower produces impacts whichare significantly worse than impacts associated with a once-through system,the staff must then determine whether the mitigation of the cooling towerimpacts or the selection of an alternative system can be justified in a cost-benefit framework.
2.3.2 Community Characteristics
For the purposes of this discussion, the staff has analyzed impacts within anarea approximately 10 miles from the plant site. Within this area are theTowns of Mexico, Minetto, New Haven, Richland, Scriba, and Volney; and theCity of Oswego. These jurisdictions are within Oswego County. In the staff'sjudgment, an area with a 10-mile radius is a conservative approximation withinwhich most of the local impacts attributable to alternative heat dissipationsystems are expected to occur.
2.3.2.1 Physical Ambiance
Nine Mile Point Station is located on the south shore of Lake Ontario in theTown of Scriba, Oswego County. The station is in the Erie-Ontario Lowlandsphysiographic province, a relatively flat plain which rises gently from LakeOntario to the Appalachian Uplands at the site's southern border. The stationis located in an area that is approximately 260 feet MSL; one mile due southof the station's major structures--at the southern boundary on the site--theground rises to 310 feet. One and one-half miles further to the south, theland rises more rapidly to 400 and more feet.
Almost 75 percent of the land in Oswego County is. presently either forest, wet-lands, or residual vacant land (see Table 2.3). Significant forest tracts existin the Towns of New Haven, Scriba, and Volney. 8 Much of this land was farmedin an earlier period but is now covered with second growth trees and brush.
-Table 2.4 provides data on agricultural acreage within the local impact area.As the table indicates, only one-half of the land in commercial farming isactually used for the production of crops.
The temperature, humidity, precipitation, and cloud cover of the area are con-trolled by the St. Lawrence Valley storm track and moderated by Lake Ontario.Climate is continental in character, with long, cold winters (average tempera-ture near 25'F) and short summers (average temperature close to 70'F). Theaverage annual precipitation is thirty-four inches and the average annual snow-fall is eighty-eight inches. With the exception of the winter months, theprevailing winds are from the southwest and follow a course nearly parallel tothe long axis of Lake Ontario. During thewinter months, the predominant winddirection shifts to the west.
2.3.2.2 Municipalities and Other Government Organizations in the Area
In addition to the towns listed in Section 2.3.2, the impact region containsthe incorporated villages of Pulaski in Richland and Mexico in the Town ofMexico. All towns in the County elect a supervisor and are governed by anelected Town Board headed by the supervisor. Seven school districts serve the
NMP-2 FES 2-6 Appendix G

TABLE 2.3 OSWEGO COUNTY LAND USE INVENTORY
Category % of Total
High Density Residential 0.4
Low Density Residential 1.2
Public and Semi-Public 0.4
Commercial 0.1
Industrial 0.5
Transportation and Utilities 0.6
Agriculture and Forestry 16.1
Other* 73.4
Water 7.1
Outdoor Recreation 0.2100.0%
SOURCE: Final Oswego County Subplan, Central New YorkRegional Planning and Development Board, May 1979.
"Other" includes forest, wetlands, residual vacant land(which is composed of inactive agricultural land, otherinactive land, land under construction, sand and rockland).
NMP-2 FES 2-7 AppendixG

TABLE 2.4 AGRICULTURAL ACREAGE IN THE NINE MILE POINTIMPACT AREA: 1972
Total % Farm Land % CroplandLand Area Farm To Total To(Acres) Land* Cropland Land Area Farm Land
Towns:
Mexico 30,016 6,641 3,854 22.1 58.0
Minetto 3,840 - -.
New Haven 20,096 2,521 1,199 12.5 47.6
Richland 34,816 7,505 3,934 21.6 52.4
Scriba 26,368 926 384 3.5 41.5
Volney 31,552 1,616 860 5.1 53.2
Oswego City 5,120 564 181 11.0 32.1
Oswego County 619,520 66,704 31,827 10.8 47.7
SOURCE: Oswego County Planning Board. Oswego County Data (1977). p. 4;and Oswego County Planning Board. Oswego County: 1985 & 1990Land Use Plan (June 1977). p. 16.
* Data is limited to farms that have an income in excess of $10,000peryear.
NMP-2 FES 2-8 Appendix G

impact area; these districts are the Enlarged School District of Oswego, MexicoAcademy and Central School, Altmar-Parish-Williamstown Central, Sandy CreekCentral, Central Square, Pulaski Central School, and the Fulton ConsolidatedSchool District. The Nine Mile Point site is located in the Oswego School dis-trict. In 1955 the New York State Legislature created the Port of OswegoAuthority for the purpose of developing, operating, and promoting shippingfacilities in the port district. The district includes the City of Oswego andthe westernmost part of the Town of Scriba. 9
2.3.2.3 Population and Existing Land Use Patterns
The six towns and the City of Oswego had a population of 45,000 in 1970.Table 2.5 presents 1970 population data and 1990 projected population figuresby community. Communities in the impact area are expected to grow at a slowerrate than Oswego county, with the result that this area would constitute approx-imately 43% of the County's total population in 1990.
In addition to the year-round resident population, a limited weekend and vaca-tion population occupies cottages along the lake shore. Lakeview, a summercamp located less than one mile southwest of the station, is operated by theOntario Bible Conference and is used by up to 1500 people for limited periods.In both instances, this transient activity occurs during the summer and fallmonths.
The Nine Mile Point Station site comprises approximately 900 acres and is adja-cent to the 700-acre site for the James A. FitzPatrick Nuclear Power Plantimmediately to the east. Within 10 miles of the site, the land use can be gen-erally characterized as rural residential and agricultural. The nearestconcentration of population is in Lycoming which is located at the intersec-tion of Miner Road and County Route 29, approximately 8400 feet from theproposed location of the natural draft cooling tower. The largest populationcenter is the City of Oswego, seven miles southwest of the site; in 1970,Oswego had a population of 23,844.
Approximately 750 people are employed at the Alcan Aluminum Corporation plant;this facility is the nearest large manufacturing plant and is about 3-1/4miles southwest of the plant site in Scriba. The most intensively developedindustrial area within 10 miles of the station is the lake shore on the eastside of Oswego.
Electric power stations represent an important component of the industrial useof the Lake Ontario shoreline. In addition to the three nuclear units at NineMile Point, six fossil units are located in Oswego on a site adjacent to theCollege. The proposed Sterling nuclear plant site is-located approximately16 miles west of the Nine Mile Point Station in Cayuga County. It should benoted that the Oswego area is at the midpoint of the cross-state transmissionsystem and is an ideal location for supplying loads in the western, central,or eastern portion of the Niagara Mohawk system.' 0
NMP-2 FES 2-9 Appendix G

TABLE 2.5 POPULATION IN IMPACT AREA: 1960-1990
Actual1960 1970
Projected1980 1990
Towns:
Mexico
Minetto
New Haven
Scriba
Volney
Richland
Oswego City
Oswego County
3,435
1,290
1,478
2,489
3,785
4,554
22,155
86,118
4,174
1,688
1,845
3,619
4,520
5,324
23,844
100,897
5,075
2,124
2,242
4,485
5,430
6,374
25,379
117,089
6,206
2,563
2,698
5,397
6,341
7,556
26,986
135,459
SOURCE: Oswego County Planning Board.(1977).- p. 14.
Oswego County Data
NMP,2 FES 2-10 Appendix G

Data for Oswego County indicate that agriculture is playing an increasinglyless important role in the economy (see Table 2.6). Poor soil conditions havegenerally discouraged investment in new commercial farms and within the 10-milearea of the plant few areas are considered to have "high" economic viabilityfor agriculture (ER, Fig. 2.2-1).
Within the impact area there is a variety of recreational and wildlife resour-ces. State parks at Battle Island near Fulton and Selkirk Shores, bothapproximately 10 miles from the Nine Mile Point Station, attract more than250,000 visitors a year (see Table 2.7): There are no Federal or county p-arksor recreation areas within the impact area; however, the City of Oswego con-tains a number of small recreation areas. The Town of Scriba has developed a47-acre park with facilities for both active and passive recreation;-the parkis approximately 5.5 miles south of the plant site.
The State University College at Oswego is a major provider of recreational ser-vices and facilities. In addition to on-campus facilities for tennis, swimming,and track, the College owns Fallbrook, a 55-acre facility containing horsebackriding trails, ski slopes, and picnic areas; Fallbrook is located 9.5 milessouthwest of the plant site. Adjacent to Fallbrook is the Rice Creek Bio-logical Field Station, a 56-acre outdoor classroom that is only available tothe public on a restricted basis (PSAR, p. 2.1-6).
Waterborne recreation activity is focused on Lake Ontario. The Oswego Marina,a privately-owned facility, has 68 berths and during the peak of the pleasure-boating season, approximately 30 boats stop for overnight berthing. Inaddition, New York State owns and operates a boat launching site at MexicoPont about seven miles east of the plant (PSAR, p. 2.1-7). The site and adja-cent areas along the shore near the site, however, have little potential forwater-based recreation. In this area, the Lake is not suitable for swimmingas the bottom is composed primarily of bedrock and there are few natural har-bors or landings.
Niagara Mohawk's site plan included the development of a visitors center. Thisfacility, called the "Progress Center," shares part of the site west of Unit 1and provides educational exhibits, picnic and playground areas, and nature studytrails. Since its completion in 1967 the Center has attracted 50,000 visitorsannually.
2.3.2.4 Transportation Facilities
The nearest major road, U.S. 104, is more than 3-1/2 miles south of the siteand connects the City of Oswego and Mexico Village. County route No. 29, whichforms the eastern boundary of the FitzPatrick plant site, is located approxi-mately one mile from Unit 2 buildings. Rail service to the plant is providedon a Penn Central Railroad (Ontario Branch) spur.
The Port of Oswego is located 6.5 miles southwest of the station site and pro-vides linkage to all the ports on the Great Lakes and the St. Lawrence Riverand to the ports of the world via the St. Lawrence Seaway. As the easternmostport on Lake Ontario, the Port of Oswego is a transshipment point to the lar-gest concentration of people and markets on the continent."1 Ships in thenormal commercial lanes would pass no closer than six miles from the site.
NMP-2 FES 2-11 Appendix G

TABLE 2.6 SELECTED FARM CHARACTERISTICS FOROSWEGO COUNTY: 1969 AND 1974
1969 1974
Total number of farms 1,000 979With sales of $2500 and over 607 529With sales less than $2500 393 450
Dairy farms with sales of $2500 ind over 380 270Value of dairy products sold $7,106,000 $9,104,000
Acreage:Total in farms 161,347 154,465Harvested croplands 48,388 50,550
SOURCE: Oswego County Planning Board. Oswego County Data (1977). p. 44.
NMP-2 FES 2-12 Appendix G

TABLE 2.7 INVENTORY OF PUBLIC RECREATION FACILITIES IN IMPACT AREA
ApproximateName Acreage Activities
City of Oswego:
Fort Ontario
Leighton School
Fitzhugh Park
Riley School
(Peglow Park)
East Park
Kingsford Park
South Park
West Park
Charles C. CrisafulliPark
Veterans Park
Municipal Beach
Town of Scriba Park
State of New York:
Battle Island
Selkirk Shores
State University College
15
7
3
2
7
5
4
7
3
Baseball, playground,. track,swimming pool, tennis
Baseball, football, playground
Baseball, tennis, playground,ice skating
Ballfield, playground, iceskating
Playground
Ballfield, playground, iceskating rink and pavillion
Baseball, playground
Ballfield, playground
Ballfield, playground
Passive
Swimming
Tennis, playground, baseball
Golf
Beach, hiking, playfield, camping,fishing
Tennis, swimming, track, ridingtrails, ski slopes
3
N.A.
46
240
980
N.A.
N. A. - Information Not Available
NMP-2 FES 2-13 Appendix G

Regular commercial air service is provided at the Clarence E. Hancock Airportwhich is located 31 miles southeast of the plant near Syracuse. The nearestflight corridor associated with this airport is 13.8 miles east of the station(PSAR, Suppl. 6, p. R 2.2-1). Light plane traffic is handled at the FultonMunicipal Airport in the Town of Volney, approximately 12 miles south of thesite.
2.3.2.5 Taxes and Community Services
The basic support of local government is the combined town-county real proper-ty tax levy which is used to meet county and town legislative, judicial,'andadministrative costs. Each of the towns collects the local property taxrevenues which are subsequently dispersed to other governmental levels andspecial districts. The major categories of services financed by the town rev-enues are public works, debt redemption, fire protection, highway projects,snow removal, and sanitation. In addition, county revenues support health andsocial services, highway projects, and police protection. Special purpose dis-tricts, such as those established to meet educational needs, sewer construction,and street lighting have their own tax rates, which are typically collected atthe town level.
Both the Town of Scriba and the County have experienced a dramatic tax wind-fall as a result of the Nine Mile Point Station. The total of assessed valuesin the Town is second only to that in the City of Oswego among all jurisdic-tions in the County (see Table 2.8). Although the staff does not have adistribution of real, property values by ownership, Niagara Mohawk's propertyat Nine Mile Point is assumed to constitute the overwhelming percentage ofassessed values in Scriba.
2.3.2.6 Future Development and Planning Objectives of the Local Communities
In New York State, counties do not have zoning powers.with which to implement•comprehensive plans.. As a consequence, each town and village establishes itsown planning and zoning policies through the creation of a planning board andthe adoption of development codes and regulations. The county planning func-tion serves to facilitate local planning and development efforts through thepreparation of land use plans which are generalized guides for directing poten-tial growth. However, the initiative for detailed planning and zoning effortsmust come from the town or village level. Table 2.9 summarizes the status ofadministrative and regulatory instruments for controlling local growth anddevelopment.
The County's land use plan is reasonably explicit in its treatment of futuredevelopment within the impact area. An analysis of soil capabilities and theacceptability of septic tank leach fields and basements in specific soils indi-cates that severe development limitations exist in the shoreline area, southeastMexico, and eastern Richland; slight to severe limitations are to be found inMinetto, Scriba, New Haven, and Richland. Only north central Volney, northeastMexico, and southwest Richland are subject to slight development limitations.12.The plan proposes additions to existing sewer and water systems that would in-crease development opportunities within limited areas in the Towns of Scribaand Volney.1 3
NMP-2 FES 2-14 Appendix G

TABLE 2.8 ASSESSED VALUE AND TAXES LEVIED IN 1976 FOR PAYMENT IN 1977
Tax Rates Per $1000Assessed Valuation Tax Levied
Assessed Value County Town County Town
Towns:
Mexico $ 4,939,654 79.20 61.30 $ 391,358 267,402
Minetto 2,239,348 115.00 40.60 257,702 115,062
New Haven 1,324,185 136.80 71.30 181,081 104,524
Richland 5,911,849 88.70 37.32 524,346 202,765
Scriba 29,783,373 90.80 12.80 2,701,427 454,987
Volney 12,396,246 61.20 12.60 759,014 216,151
City of Oswego 87,167,423 68.51 5,971,466
County Total $214,0.27,516 $16,500,667 3,442,445
SOURCE: Oswego County Planning Board. Oswego County Data 1977). p. 78-9.
NMP-2 FES 2-15 Appendix G

z!
rnlV.) TABLE 2.9 EXISTENCE OF PLANNING BOARDS AND DEVELOPMENT REGULATIONS IN THE IMPACT AREA: 1977
MobilePlanning Mobile Home Junk- Sub- Building FloodBoard Zoning Sanitary Home Park yard Signs division Code Plain
Towns (Villages):
Mexico, Yes Yes Yes Yes* Yes
(Mexico) Yes Yes Yes Yes
Minetto Yes Yes Yes"* Yes** Yes" Yes*" Yes Yes
New Haven Yes Yes
Richland Yes Yes Yes"* Yes" Yes" Yes** Yes
(Pulaski) Yes Yes Yes Yes Yes*" Yes** Yes** Yes Yes* Yes
Scriba Yes Yes
Volney Yes Yes Yes" Yes" Yes** Yes Yes
City of Oswego Yes Yes Yes Yes"* Yes"* Yes** Yes*" Yes* Yes
! ,
SOURCE: Oswego County Planning Board. Oswego County Data. p. 106.
* State Code.
* In zoning ordinance.-e-e

The synthesis of the data and policies listed in the plan is a conclusion thatdevelopment should be encouraged to locate in growth centers by 1990. OswegoCity, the eastern portion of Scriba, Minetto, and southwestern Volney are pro-posed as major centers in the Oswego River Valley. Intermediate growth centersare proposed for the Villages of Mexico and Pulaski..14 The remainder of theimpact area is proposed to remain in the low density, rural/agriculturalcategory.'
5
2.3.3 Historic, Natural, and Scenic Points of Interest
The New York State Historic Trust and the Oswego County Planning Board pro-vided the Applicant with a list of points of interest in the County (see ER,Appendix C). As of December 31, 1977, seven properties within 10 miles of thestation were included in the National Register of Historic Places; two addi-tional properties are under consideration for inclusion (see Table 2.10). Inaddition, eight properties have been identified as having historic significance.Appendix E of the Applicant's Environmental Report indicates no points of scenicor natural interest within the 10-mile impact area.
There are no known archeological values associated with either the Nine MilePoint site or the immediate vicinity of the site. Although lakeshore beachesand streams have yielded relics of prehistoric settlements, the rocky bluffsof the shore at the site probably had discouraged settlement by nativeAmericans.
NMP-2 FES 2-17 Appendix G

TABLE 2.10 INVENTORY OF HISTORIC SITES WITHIN IMPACT AREA
Name Town
Oswego City Library*
Fort Ontario*
Oswego Market House*
Fort Oswego
Oswego Harbor
Oswego City Hall*
Richardson-Bates House*
U.S. Custom House*
Walton and Willet Stone Store*
Musico-Motors Building*"
Battle Island State.Park
Spy Island
Arthur Tavern
Allen-Conklin House
Chandler-Brown-Roop House
Shubal and Lucinda Alfred House
Colosse
Gustin-Earle Factory Site*"
Selkirk Lighthouse
Shepard Estate
Oswego
Oswego
Oswego
Oswego
Oswego
Oswego
Oswego
Oswego
Oswego
Oswego
Granby
Mexico
Mexico
Mexico
Mexico
Mexico
Mexico
Mexico
Richland
New Haven Township
SOURCE: ER, Appendix C; National Register of Historic Places: AnnualListing of Historic Properties, February 7, 1978; telephone con-servation with Ellen Miller, Historic Preservation Field ServicesOffice, N.Y.S., Department of Parks and Recreation, 3-9-78.
*Properties in the National Register.**Properties under consideration for inclusion in the National Register.
NMP-2 FES 2-18 Appendix G

References for Section 2
1. U.S. Atomic Energy Commission.Related to Construction of NineNo. 50-410. USAEC, Directorate
June 1973. Final Environmental StatementMile Point Nuclear Station Unit 2. Docketof Licensing, Wash., D.C.
2. Quirk, Lawler, and Matusky Engineers. 1974. 1973 Nine Mile Point AquaticEcology Studies - Nine Mile Point Generating Station. Prepared for NiagaraMohawk Power Corp.
3. Lawler, Matusky, and Skelly Engineers. December 1975. 1974Point Aquatic Ecology Studies. LMS Project 191-21, 22, 23.Niagara Mohawk Power Corp. and Power Authority of the State
Nine MilePrepared forof New York.
4. Lawler, Matusky, and Skelly Engineers. April 1975. Impingement Studiesat Nine Mile Point Nuclear Station Unit 1. Prepared for Niagara MohawkPower Corp.
5. Lawler,AquaticNiagara
6. Lawler,AquaticNiagara
Matusky, and Skelly Engineers. May 1976. 1975 Nine Mile PointEcology Studies. LMS Project Nos. 191-31, 32, 33. Prepared forMohawk Power Corp. and Power Authority of the State of New York.
Matusky, and Skelly Engineers. May 1977. 1976 Nine Mile PointEcology Studies. LMS Project Nos. 191-40, 41, 42. Prepared forMohawk Power Corp. and Power Authority of the State of New York.
7. Texas Instruments Incorporated. February 1978.Ecology Studies 1977 Data Report. Prepared forCorporation and Power Authority of the State of
Nine Mile Point AquaticNiagara Mohawk PowerNew York.
8. Oswego County Planning Board, Oswego County 1985 & 200 Land Use Plan, June1977, p. 17.
9. Oswego County Planni~ng Board, Oswego County Data, 1977, pp. 53-4.
10. 1976 Report of Member Electric Systems of the New York Power Pool and theEmpire State Electric Energy Research Corporation, Vol. 2, Long RangeGeneration and Transmission Plan, April 1976, pp. 132-134.
11. Oswego County, County Data, p. 52.
12. Oswego County, Plan, p. 29.
13. Ibid.,. pp. 31 and 32.
14. Ibid., p. 50.
15. Ibid., pp. 48 and 49.
NMP-2 FES 2-19 Appendix G

3 PLANT DESCRIPTION
3.1 Plant Water Use
All water used at the station will be drawn from Lake Ontario and returned tothe lake after completing its function. With the proposed closed cycle coolingsystem for Unit 2, the annual average water consumption will be 11,000 gpm andthe estimated maximum rate will be 12,000 gpm. This will result in about 31%oof the average intake flow rate be lost due to evaporation. With the originalonce-through cooling system less water consumption due to evaporation wasexpected (see FES 3.3).
The location of the cooling tower with respect to the rest of the Unit 2 facil-ity is shown in Figure 3.1. The water usage for Unit 2 operating in the closedcycle cooling mode is shown schematically in Figure 3.2; the service water andcirculating water systems are shown in Figure 3.3.
In the original once-through cooling system for Unit 2, no chemicals or inhibi-.tors were to be added to the circulating or service water systems. Chemicalswould be used in the makeup water treatment, analytical sampling, and decontam-ination systems. However, for the closed-cycle cooling system in addition tothe chemical use mentioned above, chlorine and sulfuric acid will be added tothe circulating water system. Chlorine will be used to control biological foul-ing, while sulfuric acid will control scaling.
3.2 Cooling System
3.2.1 Intake System.
The cooling water intake system will consist of two identical offshore intakestructures, two intake pipes, and an onshore intake screenwell and pump housecontaining traveling screens and a fish return system.
Cooling water will be withdrawn from Lake Ontario through the two intake struc-tures placed approximately 400 feet apart, each at a depth of 19.5 feet andlocated approximately 1000 feet offshore (Figure 3.4). The east intake is tobe located approximately 200 feet to the southeast of the previously proposedonce-through intake location which was to be at a depth of 26.5 feet. Thecurrently proposed west intake will be located approximately 480 feet shore-ward of the current discharge structure (Figure 3.4). The Unit 2 intakespecifications as currently proposed, 1 ' 2 the previous once-through design, andthe designs of Nine Mile Point Unit 1 and FitzPatrick Nuclear Stations compareas follows:
NMP-2 FES 3-1 Appendix G

Figure 3.1 COOling Tower Location, Nine
Source: Reference
No. 3. Mile Point Unit 2.
0
I I i
NMP-2 FES Appendix G

FIGURE 3.2 Schematic of Water Flow, Yearly Average. NineMile Point, Unit 2. Source: Reference No. 1.
NMP-2 FES 3-3 FEAppendix G
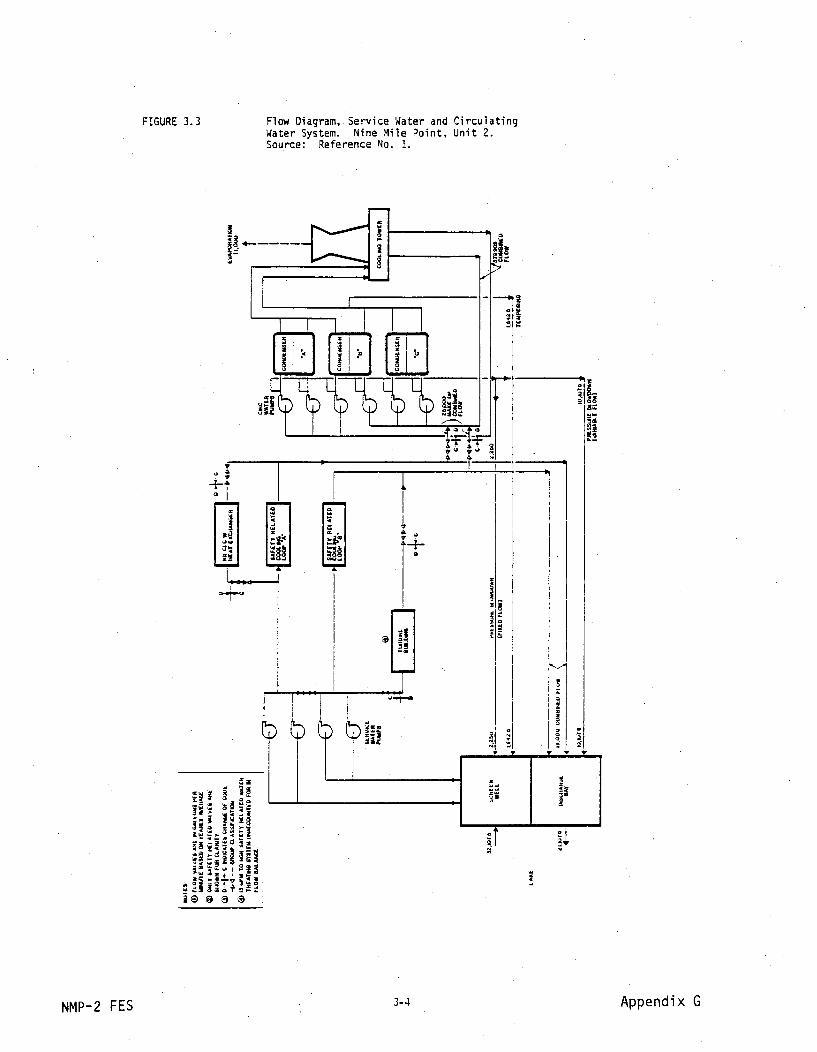
FIGURE 3.3 Flow Diagram, Service Water and CirculatingWater System. Nine Mile Point, Unit 2.Source: Reference No. 1.
NMP-2 FES 3-4 Appendix G

FIGURE 3.4 Relative Locations of Cooling Water Intake andDischarge Structures for Nine Mile Point, UnitI and 2 (Previous once through and currentclosed - cycle designs). Source: Reference 2,Figure R11-I.
'A ~IL ~i~n1tI Ii~~!~j
El
Ii.1
g.z
Id 0
I'deg:
NMP-2 FES 3-5 Appendix G

FIGURE 3.5. Closed - Cycle Cooling System Intake StructureDesign. Source: Reference 2, Figure R12-1.
MOO7NOWT
0 ,
5CALI - FUT
EL,. 2"4-0' v MEM LOW WmiI
fSHAFTA-A
3-6NMP-2 FES Appendix G

DepthCooling Intake Vol Intake of DistanceSystem in GPM Velocity Intake OffshoreType (cfs) (fps) (ft) (ft)
NMP-1 once-through 268,000(598) 2.0 18.0 850NMP-2 once-through 535,000(1194) 1.0 26.5 1200NMP-2 closed cycle 36,000(80) 0.5 19.5 1000FitzPatrick once-through 370,200(826) 1.2 24.0 900
Details of the two intake structures are shown inFigure 3.5. The structureswill have a 4.5-ft sill at the bottom to prevent silt from entering the intakes.Each structure will have six intake openings 7.5 ft wide by 3 ft high, a 2-ftroof thickness, and a 10-ft clearance between the top of the structure and thelake surface at the mean low water level of 244 ft. The width of each struc-ture will be 22.5 ft between opposite openings. The six intake openings oneach structure will be equipped with electrically heated bar racks to preventthe formation of frazil ice. The total area of the twelve openings is designedto provide a maximum intake velocity approaching the bar racks of 0.5 feet persecond (fps) while drawing water through both structures.
Each intake will be independently connected to the onshore screenwell by a4.5-foot diameter concrete intake pipe located within tunnels drilled throughthe, bedrock beneath Lake Ontario (Figures 3.4, 3.6, 3.7). The concrete pipes
have a design velocity of 2.5-4.5 fps while drawing water through both intakestructures. The velocity is dependent on lake temperature and whether or notthe fish removal system is operating, as follows:
LakeTFmperature
32-38
Cooling WaterIntake Flow forNormal Operation
GPM CFS
Fish ReturnSystem Flow
GPM CFSTotal Intake Flow
GPM CFS
31,400-36,000
36,000
70. 1-80.4
80.438-78
>78
13,400
13,400
16,600
29.9
29.9
37.1
44,800-49,400
100-110.3
49,400 110.3
61,600 137.545,000 100.4
Note: During normal plant shutdown,be 48,750 gpm (108 cfs).
the cooling water intake flow rate will
NMP-2 FES3-7 Appendix G

At the onshore screenwell, the intake pipes will connect to two vertical shafts,each pipe connecting to a separate shaft. The screenwell arrangement is shownon Figure 3.8. Two motor operated rectangular butterfly gates, normally open,will be located between the north shaft and the intake bay. When the gatesare closed, no flow will enter the intake bay from the north shaft. Down-stream of these butterfly gates, flow from both vertical shafts will mergeinto a common bay and then divide into two 4-ft wide screenbays. Trash racksequipped with a rake and angled flush-mounted traveling water screens will belocated in each screenbay. Two motor operated valves will be located upstreamof the trash racks to bypass the two screenbays and provide a redundant fTowpath to the service water pumps. The bypass valves will be in parallel andconnected to separate Class IE electrical buses to ensure opening of one valve.A trash rack will be located between the valves and the service water pumps.
The intake structures, intake pipes, screenwell substructure, bypass valves,trash racks, and butterfly gates will be designed to withstand the design basisearthquake. The traveling water screens will not be designed for seismic load-ings. If a single failure of an intake structure or intake pipe is postulated,the total flow will be transported through the remaining intake system. Duringthis postulated single failure, the plant discharge will follow the normal flowpath through the diffuser to the lake. If a single failure in the dischargesystem is postulated, two level switches in the discharge bay, each connectedto a separated butterfly gate, will close the gates, and the discharge waterwill overflow the weir into the north shaft. A stop log extending from theweir crest to the deck (elevation 285.0 ft) will prevent flow into the southvertical shaft. The discharge will flow to the lake through the west intakestructure, while the intake requirement will flow through the east intakestructure and the south shaft.
During normal plant operation, the intake flow required for the service waterpumps will be conveyed through both intake structures to the onshore screenwell.
The minimum water surface elevation in the intake bay is 233.0 ft while drawingwater through both structures with the postulated lake elevation of 236.5 ft.Drawing the safe shutdown flow requirements through one structure will resultin a water surface elevation of 234.7 ftin the intake bay. The service waterpumps will be designed to operate at the minimum water elevation of 233.0 ftwith the centerline of the horizontal suction pipes at elevation 226.17 ft.
The screenwell fish removal system is shown in Figure 3.8. There will be twoscreenbays, each 4 ft wide. Fish entering the screenwell will pass throughtrash racks made up of 3 in. by 1/2 in. bars with 3 in. clear spacing betweenthe bars. After passing through the trash racks, the fish will be guided byangled, flush-mounted, traveling water screens into bypass slots. The twotraveling water screens will be angled 25 degrees to the upstream direction offlow with their downstream ends converging, but separated by a 5-ft wide pier.The screens are similar to conventional vertical traveling water screens exceptthat the screen panels and frames are designed to form flush surfaces along
NMP-2 FES 3-8 Appendix G

FIGURE 3.6. Number I Intake Tunnel and Diffuser. Source:Reference 2, Figure R15-1.
U,
NN
I: ~a:9.5
Till7-
,. -- "- . ,i'
I__.: -- •-•.
" i • • iI
NMP-2 FES 3-9 Appendix G

FIGURE 3.7. Number 2 Intake Tunnel and Fish Return System.Source: Reference 2, Figure R15-2.
2=- C11
,_ Jo'
=,V = , .---3
!l
;Su, '4
C''~~~C~;4 ~~ C~-.a~ -~C
NMP-2 FES 3-10 Appendix G

FIGURE 3.8 Design of Screenwell, Fish Removal Systemand Associated Structures. Source: Reference2, Figure R12-2.
YC
"- U , " - " • " =
-- . . . , -- _
5..
-, _ _ -_ _ - I • ,
" ' __ I 6 -,
_ , .• • =i "= *'1••. X' " • :] I:/
~~il Ila_ _ _ _ _
'.t).j $ 0
NMP-2 FES 3-11 Appendix G

the screen face. At the downstream end of each screen and extending the fulldepth of the water column, there will be a 6-inch wide bypass slot. The twoslots will converge, and at their junction a funnel-shaped transition will con-verge in the vertical plane at a 30 degree angle to 18-inch diameter pipes.The two pipes will manifold into a single 24-inch diameter suction pipe lead-ing to a peripheral jet pump. The jet pump will discharge into a 42-inchdiameter fish return pipe within the east tunnel for approximately 1300 ft,where it will rise vertically and terminate horizontal to the lake bottom inan easterly direction. A fish sampling area will be provided downstream ofthe jet pump.
3.2.2 Discharge System
Cooling tower blowdown will be combined with that part of the service watersystem discharge not used as cooling tower makeup, and will be discharged toLake Ontario via the discharge diffuser. The discharge diffuser will belocated 480 feet further offshore than the west intake structure in about40 feet of water. See Figure 3.4. Total distance offshore will be about1525 feet.
The diffuser will have two nozzles, with ports 18 inches in diameter, branch-ing from a single riser and diverging at a 120 degree horizontal angle. Thenozzles will be elevated upward at a 5 degree angle from horizontal with thecenterline of the port 45 inches off the lake bottom. See Figure 3.9.
The applicant states ,that the discharge flow ratewill vary between 18,000gallons per minute and 35,900 gallons per minute with an average flow of25,200 gallons per minute. The resulting nozzle exit velocity will rangebetween 11.3 feet per second and 22.6 feet per second with an average velocityof 15.8 feet per second.
The Applicant states that the size and location of the discharge nozzles weredesigned to meet the New York criteria governing thermal discharges (6NYCRR704)applicable to Lake Ontario. That regulation limits the surface temperaturerise outside the mixing zone to 3 degrees Fahrenheit above the temperature thatexisted before the addition of heat of artificial origin. The applicant statesthat the annual average AT is 19'F and that the maximum AT is 30.6'F. The appli-cant calculated the maximum surface AT for the latter case as 2.8'F. We haveindependently calculated the surface AT for both cases and conclude that themaximum temperature rise will be below 30 F and that the discharge system should,therefore, meet the New York State criteria.
NMP-2 FES 3-12 Appendix G

FIGURE 3.9 Discharge Diffuser
PLAN
y W.S.EL.244.O'(MEAN LOW WATER)
EL 207.7V
3.0' 0
ELEVATION
NMP-2 FES 3- 13 Appendix G

References for Section 3
1. Niagara Mohawk Power Corporation. July 1976.Cooling System Employing a Natural Draft.CoolNuclear Station - Unit 2. Docket No. 50-410.
Report oning Tower.
19 p. and
Circulating WaterNine Mile PointTables and Figures.
2. Niagara Mohawk Power Corporation. September 1977. Responses to NRC RequestsDated April 22, 1977, for additional Information Regarding the ProposedCooling System Design Change. Nine Mile Point Nuclear Station - Unit 2.Docket No. 50-410.
3. Niagara Mohawk Power Corporation, Responses to NRC Request for AdditionalInformation, November 21, 1980.Docket No. 50-410.
3-14 a ..Nr, ll-- FErSi piJ=cu ^

4 ENVIRONMENTAL IMPACTS OF CONSTRUCTION
4.1 Ecological Impacts
4.1.1 Terrestrial Ecosystems
Areas to be cleared consist primarily of land formerly farmed but now coveredwith trees and brush characteristic of secondary growth. The wildlife speciesfound near the site are typical of the northeastern United States. The mostcommon small mammals on site which may experience a reduction in numbers dueto construction activities include cottontail rabbit, eastern chipmunk, andsquirrel. The effect of plant construction on wide-ranging large mammals,such as deer and raccoon, should be nominal if surrounding habitats are notalready stressed in terms of population numbers.
Since the proposed cooling tower site will occupy habitats that are not-uniqueto either the station site or the region, the loss of vegetation during con-struction will result in only a small reduction of individuals of the variousspecies present, but not totally exclude any from the site. The remainingundisturbed site vegetation should provide some habitat for a variety of ani-mal species that are found onsite.
The applicant has used mitigative measures to ensure thaterosion impacts will
be minimized (FES, Nine Mile Point Unit 2). The staff finds them satisfactory.
4.1.2 Aquatic Ecosystems
The potential effects upon the lake bottom and associated biota in relation toconstruction of the previously proposed once-through cooling intake and dis-charge structures were discussed in the June 1973 FES (Section 4.2, pages 4-3to 4-4)1 and by the Applicant. 2
Substrate composition along the western sampling transects NMPW and NMPP(Figure 2.1) are typically composed of flatrock or cobble substratum overlainwith a layer of silt. Sand and silt are more prevalent at the eastern tran-sects (FITX and NMPE) 3 and progressively thin out in a westerly direction. 4
The eastern transect has the most unstable sediments. 4 The currently proposedclosed-cycle intake and discharge structures are in close proximity to thosepreviously considered (difference in depth contours - 4-5 feet) and thus thebenthic populations would not be expected to differ substantially.
The intake and discharge structures designed for the previous once-throughsystem were considerably larger than those currently proposed and would haverequired the disturbance of more lake bottom area during construction. Thedisturbance to benthic communities, therefore, should be less under the newdesign. Such disturbance will be temporary and restricted to the immediateconstruction areas. The nature of the more coarse sediments in the westerlyareas of Nine Mile Point should result in relatively low levels of turbidityand siltation during construction. As such, the previous FES assessment ofconstruction impacts as "minor and temporary" remains valid. Similarly,
NMP-2 FES 4-1 Appendix G

impacts to Lake Ontario from offshore construction activities at Ginna andFitzPatrick Nuclear Power Plants were considered to be minimal andacceptable. 56
4.2 Socioeconomic Impacts
4.2.1 Stress on Community Services
After reviewing the proposal for Nine Mile Point Nuclear Station Unit 2, thestaff concluded that local public servicesand facilities would experience.little impact as most of the construction craftsmen and laborers will be drawnfrom nearby communities (FES, p. 4-4). This review assumed that heat dissi-pation would be accomplished through a once-through cooling system which wouldeject waste heat from turbine condensers and the service water cooling systemto Lake Ontario and subsequently to the atmosphere. As of April 1980, con-struction on Nine Mile Point Unit 2 was estimated to be 37% complete. 7
The major potential sources of impact on community services are associated withthe number and activities of the construction force and with the physical andfinancial impacts directly associated with construction activity. Data on man-power, scheduling, and wages for constructing an NOCT and for a once-throughcooling system indicate that site labor hours and labor cost are similar forboth alternatives.8
The applicant has indicated a 32-month construction period for the NDCT.Employment on the NDCT would peak at 90 workers while the total number of con-struction workers at the site would be approximately 2500.9
The commutation pattern of workers required to design and construct the NOCTor the once-through system will follow the pattern of station constructionworkers in general: most will travel from labor pools within 50 to 60 milesof the plant site. Moreover, the similarity in labor requirements' for bothheat dissipation systems indicates that the differential impact of construc-tion workers on community services in the impact area will be insignificant.The staff concludes that the public service demands of construction workersdoes not provide the basis for differentiating the cooling system options.
4.2.2 Highways and Traffic
The staff estimates that as many as 200 cars per day at peak for commutingtraffic and up to 100 or more truck passages per day will be associated withthe construction of either cooling system. This volume of traffic will haveto be managed so as to limit the congestion on vehicular arteries both on andoff site. Although the complete route to be taken by trucks is dependent uponthe final decision of where to dispose of the spoils, County Roads 29 and 1,Middle Road, and U.S. Route 104 may constitute part of the route.
Although a sound emission impact study has not been conducted by the appli-cant, the only construction-related noise of potential concern is that oftruck traffic along the selected route. There will be a noticeable increasein sound levels from truck traffic for a period of approximately six months toa year.
NMP-2 FES 4-2 Appendix G

With respect to auto and truck traffic and sound emissions, it should be notedthat neither the NDCT or the once-through system enjoys an advantage. More-over, both effects are small in relation to overall construction at the site.
4.2.3 TaxRevenues
Real estate taxes from the Nine Mile Point Station accrue to the Town of Scriba,Oswego County, the State of New York, and the Enlarged City School District ofOswego. Real estate taxes are assessed on the value of plant (structure) in-place in each taxing period. The staff has not estimated the possible flow oftax revenues during the construction period. However, it should be noted thatunder present New York State law closed cycle cooling systems are eligible forlocal tax exemption as pollution control devices. The applicant has yet toapply to the State for a ruling on this matter.
4.2.4 Employment and Income Benefits
The staff anticipates that cooling system construction workers associated witheither system alternative will not number more than 250 at peak and nearly allwill commute from their present residences within a 50- to 60- mile radius.The number of skilled workers required is a small fraction .of the total numberavailable in the region, and thus, little impact is anticipated on the labormarket.
Wageswill be distributed over the region in the same pattern as other workerson the Nine Mile Point Station. Only a small portion of the payments to laborwill go into the communities that comprise the impact area.
4.2.5 Impact of Aesthetic on Recreation and Land Uses
Aesthetic impacts during the early stages of constructing the natural drafttowerý will be mainly confined to the site. Construction activity during thisperiod will be visible from the Lake but hidden by vegetation from land loca-tions'outside the applicant's property. As construction progresses, the towerwill become increasingly visible as it reaches its design height of approxi-mately 540'. However, because of the low density resident population and thelimited use of the Lake in the immediate vicinity of the station, the signif-icance of any aesthetic impact during the construction period will benegligible.
4.2.6 Summary Comparison of Impacts of Alternative Cooling Systems
Community and regional impacts during construction of a cooling system will bequite limited with either the once-through or NDCT alternatives. Although dif-ferences in community impacts may exist between the alternatives, thesedifferences are not considered of major importance in the cost-benefit balanc-ing of the alternatives. The aesthetic impact of the NDCT is the only variabledifferentiating the cooling system alternatives. Toward the end of the construc-tion period, the NDCT will become visible over a wide area. In contrast, theonce-through system will have no highly visible structure and, consequently,no impacts on the aesthetics of the environment (ER, p. 8.5.3). However, asstated above, the significance of the aesthetic impact during the constructionperiod is considered by the staff to be negligible.
NMP-2 FES 4-3 Appendix G

References for Section 4
1. U.S. Atomic Energy Commission. June 1973. Final Environmental StatementRelated to Construction of Nine Mile Point Nuclear Station Unit 2. DocketNo. 50-410. USAEC Directorate of Licensing Washington, D.C.
2. Niagara Mohawk Power Corporation. September 1977. Responses to NRC RequestsDated April 22, 1977, for Additional Information Regarding the ProposedCooling System Design Change. Docket No. 50-410.
3. Lawler,AquaticNiagaraYork.
4. Lawler,AquaticNiagaraYork.
Matusky, and Skelly Engineers. May 1977. 1976 Nine Mile PointEcology Studies. LMS Project Nos. 191-40, 41, 42. Prepared forMohawk Power Corporation and Power Authority of the State of New
Matusky, and Skelly Engineers. May 1976. 1975 Nine Mile PointEcology Studies. LMS Project Nos. 191-31, 32, 33. Prepared forMohawk Power Corporation and Power Authority of the State of New
5. U.S. Atomic Energy Commission. December 1973. Final Environmental State-ment Related to the Operation of R. E. Ginna Nuclear Power Plant Unit 1.Docket No. 50-244. USAEC Directorate of Licensing, Washington, D.C.
6. U.S. Atomic Energy Commission. March 1973. Final Environmental StatementRelated to the Operation of James A. Fitzpatrick Nuclear Power Plant.Docket No. 50-333. USAEC Directorate of Licensing, Washington, D.C.
7. U.S. Nuclear Regulatory Commission, Construction Status Report: Data asof April 30, 1980, NUREG-0030, Vol. III, No. 2, June 1980, p. 2-27.
8. The staff's principal source of information comes from an NRC-sponsoredstudy of nuclear station construction costs undertaken by United Engineerand Constructors, Inc. of Philadelphia (Cooling Systems Addendums:Capital and Total Generating Cost Studies Series 7. NUREG-0247.COO-2477-11. Preliminary Draft). In this study the reference plant is a1190 MWe BWR constructed in the Northeast. The cost basis is July 1976.
9. Niagara Mohawk Power Corporation, Response to NRC Request forInformation, November 21, 1980. Docket No. 50-410.
NMP-2 FES 4-4
Additional
Appendix G

5 ENVIRONMENTAL IMPACTS OF STATION OPERATION
5.1 Cooling System Impacts
5.1.1 Intake System; Aquatic Impacts
Impingement of Fishes
The June 1973 FES' discussed potential intake effects of the proposed once-through design and predicted that it should-have little or no noticeableeffect on the fish population as a whole (p. i), but expressed concern that"...Fish kills due to impingement at Unit 2 may become unacceptable when addedto the fish killed at Unit 1 and FitzPatrick Plants" (p. 5-33). This concernwas expressed for the following reasons:
(1) "Studies...have shown a general tendency for fish to concentrate alongthe 25-foot contour where the intake will be situated or in slightlydeeper water" (p. 5-29);
(2) "An average intake velocity of 1.0 fps at the face of the bar racks can-not be considered low enough for the protection of fish..." (p. 5-29);
(3). At that time (1973) there was "...insufficient data to demonstrate thatthe Unit 2 intake, as designed, precludes possibilities of substantialfish kills due to impingement..." (p.. 5-33).
Since the publication of the 1973 FES, several years of operational studieshave been conducted at both Nine Mile Point, Unit 1, and FitzPatrick. Environ-mental Impact Appraisals (EIA) have been performed on intake and dischargerelated impacts in association with changes in the monitoring programs. 4
0'41
In the EIAs, the staff determined that operational impacts at both power plantshave been minimal and acceptable.
Additionally, FES Summary and Conclusions (p. iv), Section 5.5.2 (p. 5-33),and Section 9.2.7 (pp. 9-28 to 9-29) recommended "...changes in intake design,modification of existing intakes., and/or development and implementation ofother preventive methods..." as necessary to minimize impacts to fish popula-tions. Section 9.2.7 specifically recommended examination of alternativeintake designs to include:
(1) reduction in average intake velocity;
(2) relocation of the intake to a different depth;
(3) use of a fish guidance system to guide fish away from the area of impinge-ment and return them to the Lake.
These design modifications have been implemented as described in Section 3.4.2.
Ecology studies at Nine Mile Point, Unit No. 1, and at FitzPatrick have shownthat the fish species most abundant in impingement samples have also been among
NMP'-2 FES' 5-1 Appendix G

TABLE 5.1 SUMMARY OF FISH IMPINGEMENT ESTIMATES (MAJOR SPECIES) ATNINE MILE POINT UNIT 1 AND FITZPATRICK NUCLEAR POWERPLANTS DURING THE PERIOD 1973-1976.
Rainbow Spottail MottledAlewife Smelt Shiner Sculpin Total Fish
NINE MILE POINT UNIT 1
19731 4,931,566 116,277 683 2,946 5,079,603
1974' 2'001,698 83,771 7,468 4,405 2,120,761
19751 780,738 65,570 1,892 2,996 970,321
19762 3,060,580 136,151 12,507 7,390 3,436,085
FITZPATRICK
19753(Sept.-Dec.) 59,257 11,099 1,068 892 84,411
19762 3,877,550 259,783 11,683 7,301 4,313,562
Sharma, R. K. and R. F.ment at Power Plants inANL/ES-56. 218 p.
Freeman III. March 1977. Survey of Fish Impinge-the United States. Volume I. The Great Lakes.
2 1976 Nine Mile Point Aquatic Ecology Studies. May 1977. LMS ProjectNos. 191-40, 41, 42, Volume 1, Chapter IX. Niagara Mohawk Power Corp.and Power Authority of the State of New York.
3 1975 Nine Mile Point Aquatic Ecology Studies. May 1976. LMS ProjectNos. 191-31, 32, 33. Chapter IX. Niagara Mohawk Power Corp. and PowerAuthority of the State of New York. Estimated numbers impinged areexpanded from the raw data presented by licensee.
NMP-2 FES 5-2 Appendix G

the most abundant and most prolific in the Lake-in the site vicinity. Ale-wives have accounted for 80% to 97% of the annual total estimated fishimpinged, followed by rainbow smelt which comprised 2% to 6% of the annualtotal.
The species composition and abundance of the fishes impinged were similar atboth power plants during 1976, which is to be expected since the plants arenearby and of very similar design and water withdrawal capacity. Examinationof the impingement catches in units of effort shows that during 1976 the numberof alewives impinged per million gallons (mg) of water withdrawn (during t-hesampling periods) were similar at both plants (Table 5.2). Likewise, the totalfish (all species)'impinged per mg were similar. The fish impinged per hour,of sampling effort was greater at FitzPatrick, however, presumably as a resultof a greater water withdrawal requirements for cooling purposes. This corres-ponds to a greater annual impingement at FitzPatrick during 1976. The numbersof alewives impinged per volume of water withdrawn at each plant on a monthlybasis' during 1976 varied, but were similar during May when 68% and 72% of thetotal annual alewife impingement occurred at Nine Mile Point, Unit No. 1, andFitzPatrick, respectively.
The similarities in catch per volume and the differences in catch per hoursuggest that alewife impingement (and perhaps total impingement for allspecies) may be related to volume of water withdrawn, intake velocity, or acombination of both. The lengths of alewives impinged during the spring of1976 generally were between 2.5 inches and 7 inches long, with the majoritybeing about 5.5-6.5 inches long in.May. Examination of swim speed data foralewive (Table 5.3) suggests that the larger spring fish might be non-susceptible to entrapment at both FitzPatrick (intake velocity 1.2 fps) andNine Mile Point Unit 1 (intake velocity 2.0 fps) at warm water temperatures.At lower water temperatures, however, alewife cruising speed is reduced, 2 sothat during the April-May period when ambient lake temperatures are -6'-11'C,alewife might be highly susceptible to entrapment and impingement. It islikely that environmental and stress-inducing factors which influence springmass mortalities of alewives in several of the Great Lakes and nearby waterbodies 3 '4's'6' 7' 8 also contribute to the spring impingement of alewives.Similarly, the maximum sustained swim speed for rainbow smelt of 1.15 fps(length 5.3. inches; 6'C) 9 renders that species susceptible to entrapment athigh intake velocities.
Alewife and rainbow smelt have been the dominant species in impingement samplesat power plants on Lake Michigan.' 0 11I Two such plants with offshore intakesand design similar to Nine Mile Point are the Palisades and Cook plants on LakeMichigan's eastern shore (Table 5.4). During the years 1972-1973 the Palisadesplant operated with a once-through cooling system, but converted to closed-cycle after that time. In discussing the effects of impingement under thealtered design, the Final Addendum to the Palisades FES" 2 stated that "Impinge-ment of fish can be conservatively assumed to be reduced in proportion to thereduction of total intake flow which is a factor of about 5.5... The actualreduction should be even more significant than indicated by just the flow reduc-tion because of the effect of reducing the intake approach velocity." Examinationof impingement catches at Palisades before and after the conversion to closed-cycle does show a marked reduction in the loss estimates for the most susceptiblespecies (Table 5.5). Comparison of these data with those at the nearby Cook
C c 5-3 Annpndix GNmr-•L LJ

TABLE 5.2 COMPARISON OF THE ANNUAL TOTAL NUMBER OF FISHES (ALL SPECIES)AND ALEWIVES IN IMPINGEMENT SAMPLES DURING 1976 AT NINE MILEPOINT AND FITZPATRICK NUCLEAR POWER PLANTS,' ADJUSTED FORHOURS SAMPLED AND VOLUME OF WATER WITHDRAWN DURING SAMPLING
NMP Fitz
Total Alewives (No)
Total Fish (All spp)
Total Hours sampled
Total Vol. Sampled (MG)
Average withdrawal MG/hr
1,935,168
2,150,563
2,270,274
2,504,002
4056.26
72986
4080.10
60982
14.95 (556 cfs) 17.99 (669 cfs)
Alewives/hr
Alewives/MG
Total Fish/hr
Total Fish/MG
474.29
31.73
572.09
35.26
559.70
31.11
617.32
34.31
1 1976 Nine Mile Point Aquatic Ecology Studies. May 1977. LMS ProjectNos. 191-40, 41, 42. Volume 1, Chapter IX. Niagara Mohawk Power Corp. andPower Authority of the State of New York.
NMP-2 FES 5-4 Appendix G

TABLE 5.3 CRITICAL SWIMMING SPEEDS OF ALEWIFE'
Length Swimspeed Acclimationin. fps Temp. 'C
3.5 1.34 24.0
3.6 1.20. 24.0
3.9 1.78 25.0
4.3 0.87 25.0
5.0 2.77 20.0
5.4 1.78 20.0
5.4 2.12 20.0
5.6 1.67 20.0
1 Wyllie, M. C., E. R. Holmstrom, and R. K. Wallace. 1976.Temperature Preference, Avoidance, Shock and Swim SpeedStudies with Marine and Estuarine Organisms from NewJersey. Ichthyological Associates, Inc. BulletinNo. 15. 76 pp.
5-5NMP-2 FES Appendix G

TABLE 5.4 DESIGN SPECIFICATIONS OF PALISADES NUCLEAR GENERATING PLANTAND DONALD C. COOK NUCLEAR PLANT UNIT 1, LAKE MICHIGAN
Intake Depth of DistanceCooling System Intake Vol. in Velocity Intake OffshoreType GPM(cfs) (fps) (ft) (ft)
Palisades Once-through 405,000(900)' 0.69-0.952 382 33002
Palisades Closed cycle 3 80,000(179) 0.1 38 3300
Cook Once-through 3 1,6455000(3,672) 1.3-1.9 24 2250
1 USAEC. June 1972. Final Environmental Statement Related to the Operationof Palisades Nuclear Generating Plant. Docket No. 50-255.
2 Consumers Power Company. May 1975. Summary of the effects of once-throughcooling at the Palisades Nuclear Power Plant.
Sharma, R. K. and R. F. Freeman III.at Power Plants in the United States.218 pp.
March 1977. Survey of Fish ImpingementVol. I. The Great Lakes. ANL/ES-56.
NMP-2 FES 5-6 Appendix G

TABLE 5.5 SUMMARY OF FISH IMPINGEMENT ESTIMATES (MAJOR SPECIES ATPALISADES NPP DURING THE PERIOD OF ONCE-THROUGH COOLING(1972-73) AND CLOSED CYCLE COOLING (1974 TO 1977)
Year Rainbow Spottail Slimy Total(Months Samples) Alewife Smelt Shiner Sculpin Fish
19721 71,529 886 23,672 9,061 119,744(Jan-Dec)
1973' 311,870 6,747 23,225 171,187 534,188(Jan-Oct)
19742 1,116 * 49 5,887 7,220(Mar-Dec)
1975(Jan-Mar) 2 71 * 47 51 217(July-Dec) 3 198 20 0 184 4509 mo. total 269 20+ 47 235 667
19764 1,113 29 35 385 1,750(May-Dec)
19775 568 0 7 72 855(Jan-Sept)
1 Consumers Power Company. May 1975. Summary of thecooling at the Palisades Nuclear Power Plant.
effects of once-through
2 Sharma, R. K. and R. F. Freeman III.at power plants in the United States.218 p.
March 1977. Survey of fish impingementVol. I. The Great Lakes. ANL/ES-56.
Consumers Power Company. March 1976. Palisades Plant - First Annual Reportof Operations, January 1 through December 31, 1975. Numbers impinged areexpansions of the raw data presented by licensee.
4 Consumers Power Company. April 1977. Palisades Plant - Radioactive Effluentsand Environmental Monitoring Sections to Second Annual Report. Numbersimpinged are expansions of the raw data presented by licensee.
s Letterdated October 28, 1977 from D. P. Hoffman, Consumers Power Company,to A. Schwencer, USNRC. Numbers impinged are expansions of the raw datapresented by licensee.
* Not reported by Sharma and Freeman (1977), but reported to be 113 fish byCDM/Limnetics (1977): The Lake-Wide Effects of Impingement and Entrainmenton the Lake Michigan Fish Populations; March 21, 1974 through March 25, 1975.
NMP-2 FES 5-7 Appendix G

facility (Table 5.6) shows the differences and the comparative ability of closed-cycle cooling to reduce impingement losses.
It has been recognized that fish impingement is an unavoidable result of thescreening of water taken from water bodies inhabited by fish. 10 This isespecially applicable to the most susceptible species of Great Lakes fish(e.g., alewife, smelt, etc.), as indicated by their occurrence and abundanceat industrial ,13'14 municipal' 3 '' 4 and power utility1 0 '' 1'1 3'' 4 intake screen-ing devices of varying design, capacity, and location. Where fish impingementhas been documented, the use of fish bypass facilities may improve performance,and at new intakes where it is not clear that impingement can be avoided, suchfacilities may be desirable.' 5
The current proposal to place the intake structures at a depth of 19.5 feetmay have some advantage for reducing potential impingement of fishes, sincesome species appear to be more abundant seasonally in deeper water. Thisdepth does not appear to be unique with respect to species occurrence or habi-tat when compared with the previously assessed 26.5-foot location or the presentUnit No. 1 location at a 25-foot depth. The species composition of the fishimpingement catch at Unit No. 2, therefore, may be expected to be similar tothat observed at Unit No. 1. The reduction in design intake volume (1194 to80 cfs) and velocity (1.0 to 0.5 fps) at Unit No. 2 under the closed cycle modeand the comparable reductions compared with Unit No. 1 design will be chieflyresponsible for reducing potential impingement losses (especially to the mostsusceptible species). The >85% reduction in intake volume and 75% reductionin intake velocity compared with Unit No. 1 may likely result in comparableimpingement levels at Unit No. 2 of less than 15% of those observed at UnitNo. 1. This reduction coupled with the capability for guiding entrapped fishpast the traveling screens and returning them to Lake Ontario should result inminimal impact to the fish species affected. Minimization of impact to themost susceptible species should result in minimized impact to other species aswell. As such, the low level of impingement losses which might occur at UnitNo. 2 should not become unacceptable when added to those of Unit No. I andFitzPatrick which have been minimal. Therefore, the June 1973 FES Conclusion(page i) that fish impingement at Unit No. 2 "...should have little or no notice-able effect on the fish population of the Lake as a whole..." remains valid.
Entrainment of Plankton
The Unit No. 2 FES of June 19731 evaluated the potential effects of once-throughcooling entrainment on the plankton populations (Section 5.5.2.b, pages 5-33to 5-35). With respect to phytoplankton and zooplankton, the following conclu-sions were stated:
(1) "...a comparatively small percentage of the total volume of water availablein the vicinity of the three plants under static or current conditionswill be withdrawn for cooling in a day" (p. 5-35);
(2) "Most planktonic forms have a short generation time and can respond tochanges in the population in a short period" (p. 5-35);
NMP-2 FES 5-8 Appendix G

TABLE 5.6 SUMMARY OF FISH IMPINGEMENT ESTIMATES (MAJOR SPECIES)AT COOK NPP DURING THE PERIOD 1975-1976
Year Rainbow Spottail Slimy(Months Sampled) Alewife Smelt Shiner Sculpin Total Fish
19751(Jan-Dec) 172,827 3,911 10,295 8,233 221,892
19762(Jan-Oct) 94,318 2,045 22,889 5,384 151,342
1 Indiana and Michigan Power Company. Environmental Operating Report.
Donald C. Cook Nuclear Power Plant Unit 1. January 1, 1976 throughJune 30, 1976.
2 Indiana and Michigan Power Company. Environmental Operating Report.
Donald C. Cook Nuclear Power Plant Unit 1. July 1, 1976 throughDecember 31, 1976.
NMP-2 FES 5-9 Appendix G

(3) "Zooplankton are expected to suffer a high mortality rate in the summer.However, even if the rate were 100%, the impact of such mortality amongorganisms with a short generation time will not be measurable in thearea" (p. i);
(4) "...the staff anticipates that no significant adverse effects on theLake's planktonic populations will result from the operation of the threeplants [Nine Mile Point Units 1 and 2 and Fitzpatrick] with once-throughcooling" (p. 5-35).
Under the current closed cycle proposal, the reduction in withdrawal volume atUnit No. 2 to <7% of the originally proposed once-through volume should fur-ther minimize potential impact to planktonic populations* The FES conclusionsof "no significant adverse effects" therefore remain unchanged.
With respect to entrainment of fish eggs and larvae, the FES concluded (p. 5-35):
(1) The assessment of "...no significant adverse effects on the lake's plank-tonic populations.... is not applicable to entrainable forms of fish life";
(2) Adequate studies on plankton near the site and on plankton entrainmentwere not conducted.
Operational monitoring studies at Nine Mile Point Unit No. 1 for the years 197516and 1976'1 indicated that ichthyoplankton species which constituted the majorityof those entrained were alewife and rainbow smelt. Species occurring in lowernumbers were white perch, yellow perch, and others. Generally, species occur-rence in entrainment samples coincided with periods of abundance and occurrencein the lake far field samples, although densities in entrainment samples oftenexceeded those of lake samples. Based on the presence of fish eggs and larvaein the water, alewifespawning may have occurred as far offshore as the 100 footdepth contour (,one mile offshore, the maximum offshore point sampled), withhighest densities occurring near the 20-foot contour (the most inshore pointsampled). Rainbow smelt eggs and larvae were most abundant inshore of the40-foot contour, but larvae occurred beyond the 60-foot contour. White perchlarvae occurred in low numbers and were most abundant at the 20-foot contour.White perch eggs were in very low abundance. Yellow perch larvae were mostabundant at the 20-foot contour, but were collected offshore to the 60-footcontour. These species all utilize nearshore areas of the lake for spawning,which probably includes the area shoreward of the 20-foot contour. Based onthe data collected, ichthyoplankton abundance generally has been greatest atthe most inshore area sampled (20-foot contour), which also corresponds to theapproximate location of the proposed closed-cycle intake structures (19.5-footcontour). Abundance shoreward of the 20-foot contour was not investigated.Although location of the intakes at a depth greater than 19.5 feet would reducethe level of ichthyoplankton potentially entrained with makeup water, a signifi-cant reduction for the major species (with respect to abundance at the 20-footcontour) might not be assured unless the intake depth exceeded 40 feet (>1500feet offshore). The feasibility of siting the intakes at such depths and dis-tances offshore apparently has not been investigated, and doing so mightnecessitate re-siting of the discharge structure as well. Although no samp-ling occurred at the 26.5-foot contour (depth of the previously proposed
NMP-2 FES 5-10 Appendix G

once-through intake), it would not appear that this depth is substantially dif-ferent from the 19.5-foot depth with respect to ichthyoplankton composition orabundance.
The environmental risk associated with entrainment is related, in large part,to the volume of water passing through a cooling water intake structure, andthus reduction of intake volume (capacity) is one of the most effective methodsfor reduction of adverse environmental impacts. s Such a reduction should, inmost cases, reduce the number of organisms that are subject to entrainment indirect proportion to the fractional flow reduction.'s Reduction in intake 'volumeat Palisades Nuclear Generating Plant (due to conversion from once-through toclosed-cycle cooling) was predicted to conservatively result in about a two-thirds reduction in the total number of fish eggs and larvae killed.1 2 Simi-larly, the low makeup water requirements at Nine Mile Point Nuclear StationUnit 2 will serve to minimize impacts to Lake Ontario fish eggs and larvae.The prolificnature of alewife and the abundance of littoral zone shallowssuitable for its spawning precludes any measurable effect upon lake popula-tions as a result of entrainment at Unit 2. Similarly, rainbow smelt andyellow perch utilize the vast nearshore areas and should not be measurablyaffected by Unit 2 operation. Any effects which may be incurred are expectedto be localized in the Nine Mile Point area only.
5.1.2 Discharge System; Aquatic Impacts
Thermal
The June'1973 FES' evaluated the potential effects of a combined once-throughcooling discharge of Units I and 2 as previously designed (Section 5.5.2c;p. 5-36 to 5-38), and concluded "...thermal discharge effects will be insig-nificant in terms of ecological relationships in the lake as a whole" (p. ii;.5-38). The design reduction in closed cycle discharge volume (mean' of 56.2 cfsfor Unit 2 vs 1792 cfs for Units 1 and 2 once-through) and AT (mean of 10.5'Cof Unit 2 vs >17*C for Units 1 and 2 once-through) 'should further minimize anypotential for impact.
The FES further concluded (p. ii) that significant fish kills due to one reactorshutdown and cold shock would be prevented due to the common two-unit discharge.Under the current proposed design each unit will have a separate discharge,thus the potential for cold shock due to a Unit 2 winter shutdown will beincreased in relation to that discussed in the FES. Such occurrences, how-ever, should not result in any measurable impact to fish populations. Thethermal effluent from Unit 1 has been shown to attract fishes,1 8 but no mortal-ity due to cold shock has been observed (1969-1975).19 The high exit velocitiesat the discharge structure (11.3-22.6 fps) should be sufficient to precludefishes from maintaining a position in the hottest part of the plume. This wasalso hypothesized to be the case for the offshore discharge at the Davis-BesseNuclear Power Station on Lake Erie, at an exit velocity of 6.6 fps. 20 High exitvelocity, low discharge volume, and rapid mixing of the effluent to meet NewYork State Standards should minimize impacts upon Lake Ontario fishes.
It should be noted that the closed cycle cooling design meets the New York Staterequirements for protection of the environment under Section 316(a) of the CleanWater Act.
NMP-2 FES 5-11 Appendix G

Chemical
In the original design, chemicals would not be added to the Nine Mile PointUnit 2 once-through circulating and service water system, FES, Section 3.6.1However, sodium hydroxide and sulfuric acid would be used for the demineralizerregeneration. Further, ferric sulfate would appear in the clarification waste,and phosphates in the sanitary wastes. These chemicals would eventually bedischarged to Lake Ontario.
Additional chemical waste to Lake Ontario consists of intermittent blowdown ofsolids from the Unit 1 clarifier, backwashings from the pressure and acti-vated carbon filters,.and neutralized acid and caustic solutions from ionexchange regeneration cycles. Unit 2 (once-through) would use diatomaceousearth filtration from which there would be no discharge to the lake. Clari-fier blowdown from Unit 1, which is discharged in the settling basin, containsferric hydroxide, calcium carbonate, and suspended material initially presentin lake water. Backwashing water used for the filters contains suspended mat-ter and is also discharged to the settling basin and Lake Ontario.
However, with the possible exception of the levels of total dissolved solidsand the phosphate concentration in the sewage discharge rivulet, which arenear effluent standards, the effluents of Unit 2 (once-through) would conformto all criteria and standards of the State of New York, EPA, and the Inter-national Agreement on Great Lakes Quality between the United States and Canada(1972), FES, Section 5.2.1.1
The average expected chemicals discharged to Lake Ontario from Unit 2 operatingin a closed-cycle cooling mode are shown in Table 5.7. The chemical constituentsshown in this table are mainly removed from lake water during the dimineraliza-tion process and discharged as part of the regeneration waste. This is notthe case for chlorine (Cl-) which is added-as a control from biological foul-ing and sulfuric acid (S0 4 =) added as a control for scaling. However, whenthese chemicals are added to the circulating water, along with the chemicalsoriginally removed from the lake water, the total dissolved solid (TDS) levelwould increase by an average of 282%. Hence, the TDS in the station dischargewould be significantly increased over ambient by operation of Unit 2 as aclosed-cycle cooling system.
Section 9.2 of the FES discusses plant design alternatives and specificallymentions advantages and disadvantages of the closed cycle cooling systems.
With regard to water quality the main disadvantages of the closed cycle cool-ing system are the following:
1. The cycle of concentration is estimated to be 2 to 2.5 times the once-through discharge levels. That is, the closed cycle system would producea dissolved solids buildup of about 2.5 times that of the present once-through level. This concentration buildup would be noticed for mostwater quality parameters.
NMP-2 FES 5-12 Appendix G

TABLE 5.7 CHEMICALS DISCHARGED FROM UNIT 2 - CLOSED CYCLE
Effluent - Unit 2, Closed CycleConc. in
Ion Conc., Lake Ontario, Percent(or TDS) Source of Ion Pounds/Day ppm* ppm Increase
Ca++ Lake water*" 11.8 110.0 44.0 250%
Na+ Sodium hydroxidefor regeneration 114.9 42.9 17.0 252
Mg++ Lake water"* 2.5 22.2 8.9 250
K+ Lake water" 0.5 4.0 1.6 250
Mn++ Lake water"* 0.003 .025 0.01 250
Cl- Lake water" 706.6 103.0 30.0 343
S04= Sulfuric acid forregeneration andscale control 23525.3 152.8 30.0 509
HC0 3 Lake water" 14.7 142.5 57.0 250
R04 = Lake water"* 0.057 0.48 0.19 253
NO- 3 Lake water" 0.042 0.35 0.14 250
TDS Lake water"* 70.1 .582.7 233.0 250
* Calculated by incorporating the 2.5 concentration factor.
* Collected from lake water on ion exchange resins, then released duringregeneration.
NMP-2 FES 5-13 Appendix G

2. The original once-through design did not require additives to control scal-ing or algae growth (FES, p. 3-35).1 However, in the proposed closed cyclecooling system scaling will be controlled by sulfuric acid, with an addi-tional 77 ppm sulfate concentration or 23500 pounds/day in the blowdown(Niagara Mohawk responses to NRC questions dated July.19, 1976).21 Thelicensee's response further mentions that algae, fungi, and bacteriagrowths will be controlled by chlorination. This will produce an addi-tional 28 ppm chloride concentration or 706 pounds/day in the blowdown.It appears that the scaling control agent and the algicide will be usedunder regulation of the appropriate State and Federal agencies.
3. With the original once-through design for Unit 2, and the combined dis-charge of both units, the benefit in "in plant" dilution was possible.Now, with the proposed closed cycle cooling system for Unit 2, this bene-fit is not possible. Hence, without the water volume from Unit 2, thesole discharge of Unit 1 may not be in compliance with certain waterquality standards; especially total dissolvedsolids.
4. The proposed closed cycle cooling system will pump 32,110 gpm of waterfrom Lake Ontario. 2 1 Niagara Mohawk Power Corporation has estimated that11,000 gpm will be lost to the atmosphere due to Natural Cooling Towerevaporation. This results in a water consumptive loss due to evaporationof about 34% of the entire water entering Unit 2. The water loss due toevaporation in the original once-through cooling system would be much less,FES Section 3.3.
5. Table 5.7 indicates that TDS in the closed-cycle discharge for Unit 2 wouldbe significantly increased (about 250%) over ambient. This increase couldbe an issue of possible long-term concern. With Unit 2 operating in aonce-through cooling system, the TDS increase over ambient would be lessthan 1%o, FES Section 3.6.1
The main advantages of the closed cycle cooling system are the following:.
1. The expected plant water use for the closed cycle cooling system is32,100 gpm, while 535,000 gpm were expected to be used in the once-through cooling system. This indicates that the total plant water usefor the proposed closed-cycle cooling system is 6% of the once-throughsystem.
2. Only a fraction of the original circulating cooling water will be dis-charged as blow-down from Unit 2 operating with a closed cycle coolingsystem. The once-through cooling system had an expected discharge of535,000 gpm (1194 cfs). On the other hand, the closed cycle cooling sys-tem has an estimated discharge of 21,110 gpm (47 cfs), this would be 3.9%of the original once-through discharge from the station to Lake Ontario.The closed-cycle cooling system discharge is only 3.9% of the once-throughcirculating discharge. However, the closed cycle cooling system will havea chemical concentration factor of 2.5X.
The expected pounds per day of chemicals added to the lake will be greater withthe closed cycle system, Table 5.8. This table indicates that over 24,000 pounds/day or over 44 times more TDS substances will be added to and discharged from
NMP-2 FES 5-14 Appendix G

TABLE 5.8 COMPARISON OF CHEMICALS DISCHARGED FROMUNIT 2, ONCE-THROUGH AND CLOSED-CYCLECOOLING SYSTEMS
Pounds/Day
Once-Through Closed Cycle1194 cfs 56 cfsSubstance (Ion or TDS)
Ca+++
Na
Mg++
K
Mn++
Cl
S0 4
HCO 3
NO3
Fe+++
TDS
Chlorine
TOTAL
11.8
114. 9 a
2.5
0.5
0.003
11.5
240.5
14,. 7
0. 042
96.7e
70. 1
0
563.2
11.8
114.9a
2.5
0.5
0.003
1I. 5 b
23500 d
14.7
0. 042
96.7e
70.1
706.6f
24529.3
a
b
c
d
e
f
Added as NaOH for regeneration
Additional increase due to chlorine use
Added as H2 SO 4 for regeneration
Added as H2 SO 4 for regeneration and control for scaling
Added as Fe 2 (S0 4 ) 3 for clarification
Most is discharged as chloride ion
NMP-2 FES 5-15 Appendix G

the closed cycle than from the once-through cooling system into Lake Ontario.The reduced blowdown in the closed cycle cooling system with the addition ofchemicals for scaling and algae control and the expected 2.5 concentrationfactor, results in a discharge at a higher concentration for closed cycle oper-ation.
The addition of chlorine to control biological fouling within the closed cyclecooling system will be within EPA effluent limitation guidelines (40 CFR 423).These guideline limits require that the average free available chlorine con-centration be less than 0.2 mg/1 and the maximum be less than 0.5 mg/i.Neither free available nor total residual chlorine will be discharged for morethan two hours per day. Most of the added chlorine will be reduced to chlorideion. Based on previous experience, all residual chlorine discharge concentra-tions should be well within the effluent limitation guidelines. Dischargeconcentrations at the guideline levels although expected infrequently could bepotentially toxic. Dilution and further chemical reduction in the mixing zoneshould result in concentrations well below toxic levels even when dischargingat a free available concentration of 0.5 mg/l.
Also, it cannot, be overlooked that some chemical substances will accumulate inthe cooling tower basin sludge. Eventually, the towers will be cleaned andthe sludge must be disposed.
The chemicals remaining in. the sludge could become a terrestrial concern andthe disposal of such sludge must be done in a sound manner as to avoid athreat to the environment.
In conclusion, as previously evaluated in the FES, the chemical discharges ofthe once-through cooling system of Nine Mile Point Unit 2 would pose no envir-onmental threat to the aquatic biota or water quality of Lake Ontario. Eventhough the closed cycle cooling system would minimize the amount of blowdownentering the lake, but not necessarily the amount of chemicals, it appearsthat this system would also pose no significant threat to the water quality ofLake' Ontario. The chemical discharges from either cooling system would con-form to all criteria and standards of the State of New York, EPA, and theInternational Agreement on Great Lakes Quality between the United States andCanada (1972).
5.1.3 Heat Dissipation Systems; Impacts to Terrestial Ecosystems
The staff reviewed the potential impacts from drift generated from closed cyclecooling systems on terrestrial biota in Section 9 of the FES.' It concludedthat the postulated values for drift deposition would have negligible impacton the surrounding biota. The applicant has submitted a report 2 1 on its pro-posed cooling system design change and additional information 2 2 in response tostaff questions. The purpose of this evaluation is to address in more detailthe effects of salt drift from the proposed natural draft tower on the sur-rounding environment.
The botanical consequences of drift deposition depend on the amounts depositedand on the distribution of salt tolerant and intolerant plant species. It isexpected that salt deposition from drift in the amounts expected at Nine MilePoint will not create saline soils and that botanical damage because of soil
NMP-2 FES 5-16 Appendix G

contamination is unlikely. The only significant pathway for potential botan-ical injury at the Nine Mile Point site is by direct foliar interception ofdrift particles from the atmosphere. The difference between the two pathwaysis important since, if soil contamination were important, it could lead tochronically deteriorating biota over the life of the plant while foliar con-tamination could result in a series of damaging episodes, which are largelyindependent of one another. In many such cases, foliar recovery could takeplace between episodes. The situation would not be a progressively deterior-ating one unless the damaging episodes were repeated in sufficiently rapidsuccession to prevent foliar recovery in the intervals. The applicant haspresented both yearly and monthly drift deposition values predicted by a modelusing onsite meteorological data. 2 2 The maximum salt deposition rate was calcu-lated to be 0.27 lbs/acre/year, 6750 feet northwest of the proposed tower.The staff believes that.thresholds for the appearance of foliar symptoms willnot be reached at this rate of salt deposition and, therefore, concludes thatno unacceptable botanical injury would result from the operation of the pro-posed natural draft cooling tower at Nine Mile Point Nuclear Station, Unit 2.The staff, however, believes it is prudent to monitor for verification of theanalyses even though serious effects are not expected.
The staff has analyzed data on bird impaction from operating plants locatednear or along migratory flyways. From the data collected and analyzed, thestaff finds no evidence to conclude that cooling towers and meteorological,structures present a hazard to bird populations. Specific terrestrial moni-toring programs will be determined at the operating license review by thestaff.
5.2 Radiological Impacts of Normal Operation
5.2.1 Dose Evaluation for Cooling Tower Operation
The liquid radwaste dose evaluation for NMP-2 was presented in the June 1973Final Environmental Statement. The evaluation considered the radwaste to bediluted and discharged with the plant cooling water discharge flow of 1788cubic feet per second (CFS). A change from once-through cooling to the use ofa cooling tower will result in less cooling water being discharged and thusless dilution before mixing in Lake Ontario. The dose evaluation for theliquid pathway has therefore been reevaluated and is presented hv6. The dosevia the gaseous pathways will nnt hb sinnificantl, 2ffa-ted.
The major differencr; between this analysis and th' cne presented in the JunezI• , , are the dilution flows and mixing ratios. This analysis uses a COC,ing tower discharge flow of 46 cfs instead of 1788 cfs. The mixing ratio(referred to as dilution factor in the FES) for the discharge area was changedfrom 0.1 to 0.5, and for the nearest drinking water intake was changed from0.067 to 0.01, to reflect current procedures in use for evaluating doses. Theliquid source term from Table 3.5 in the FES was Used for this evaluation.
The estimated total body dose commitment to the maximum individual from allpathways due to liquid radwaste releases is calculated to be 0.58 mrem/yr.The estimated dose commitment from all pathways to the maximum organ is calcu-lated to be 0.84 mrem/yr to the bone. These doses are higher than thosepresented in the FES but are within the guidelines of Section II.A, Appendix I
NMP-2 FES 5-17 Appendix G

to 10 CFR Part 50, which became effective May 5, 1975, and are therefore accept-able. This analysis was performed using conservative values for the mixingratios. Lower doses could be calculated by developing more representative mix-ing ratios, but this was not deemed a necessary effort to demonstrateacceptability of the doses to the maximum individual.
The estimated annual total body dose commitment to the population within 50miles of the NMP-2 site from all pathways due to liquid radwaste releases iscalculated to be 0.12 man-rem/yr. The thyroid dose commitment is calculatedto be 1.7 man-rem/yr. These doses are also higher than those presented in theFES, but are cost-beneficial according to Section II-D, Appendix I to 10 CFRPart 50, and are acceptable.
The staff concludes that the change from once through cooling to cooling towerswill be acceptable in regard to its effect on radiological dose commitments toindividuals and to the population within 80 km of the NMP-2 site.
5.3 Socioeconomic Impacts5.3.1 Physical
The staff has reviewed the New York State ambient air quality standard for settle-able particulates of 0.3 mg/sq cm/mo and concludes that the proposed tower wouldnot contravene this standard.
The staff further concludes that State and Federal primary suspended particu-late concentrations will also be met throughout the predicted drift field.
Contributions of moisture from cooling tower operation will be insignificantin comparison to the daily fluctuations in the local moisture regime. Theaverage offsite incremental relative humidity (RH) due to two natural drafttowers was calculated to be about 0.02-0.03% (in % RH above ambient RH) forthe Indian Point site. 2 3 The staff, therefore, concludes that these moisturechanges are insignificant to the surrounding environment at the Nine MilePoint site.
5.3.2 Social and Economic.
In this section, the staff will evaluate four impacts of operating the alter-native heat dissipation systems; these impacts are concerned with changes inthe visual aesthetic environment, noise, drift and local weather modifications,and tax revenues. As the text below will indicate, the change in the visualaesthetic environment resulting from the operation of an NDCT is an impactthat differentiates the dissipation systems.
5-3.2.1 Visual and Aesthetic Impacts
The once-through cooling system does not have any components that are signifi-cantly visible and, therefore, would not have visual or aesthetic impacts.However, the operation of an NDCT would have two generalized impacts. Thefirst is related to the physical attributes of the tower itself and its sitingin the environment. The second visual impact involves the tower plumes whichwill have a variable impact apart from the relatively unchangeable impact ofthe tower. These aspects of impact are discussed as well as an attempt todetermine their significance in the human environment.
NMP-2 FES 5- 18 Appendix G

The applicant is proposing to construct and operate a 536-foot hyperbolic NDCTon the Nine Mile Point site. The cooling tower wil be 273 feet across at thelip and approximately 445 feet across at the base. 4 The great bulk and heightof the towers can be appreciated if we consider that it will be as tall as a50-story office building and would be able to support a football field.
Visual Intrusion
Within the local impact area, the tower would be out of proportion with thenatural environment. Because of the relatively flat topography and decreasingvisibility, the staff considers that a 10-mile viewshed would be appropriate.Approximately 48,500 people will live in the impact area by 1985, one-half inthe City of Oswego. It should be mentioned that most people will not be ableto view the tower; from many vantage points within the viewshed, the full orpartial extent of the tower would be obscured by topography, vegetation,and/or buildings.
The tower will be visible from an extensive area on Lake Ontario and could, infact, become a navigational landmark. Because of its massive size the towerwill eliminate sections of forest background. However, these alterations arepart of a transformation of the natural shoreline of the Lake. Completion ofthree nuclear plants at Nine Mile Point and six fossil-fired plants in Oswegoand expansion of Oswego port facilities will successively alter the lake's shore-line.
In contrast to-the relatively constant impact of the tower, visible plumes area variable impact controlled by atmospheric conditions. Several points shouldbe raised when discussing the visible plumes from the NDCT proposed for NineMile Point Unit 2. First, the accompanying plume will extend the visibilityof the tower as the plumes rise more than 1000 feet under certain circumstances.Thus, the viewshed of the tower and plume is considerably more extensive thanthe tower's viewshed. Second, the frequency of overhead plumes is inverselyrelated to distance from the cooling tower: as the viewer moves away from thetower, the incidence of a visible plume overhead decreases. Third, the appli-cant's data indicates that the visible plumes would move beyond the siteboundaries and appear overhead for only a small percentage of time during theyear. For instance, a visible plume would be overhead in the E-SSE quadrantfor less than 10 percent of the winter and spring months. In all other situ-ations overhead plumes would be visible less than five percent of the time.Finally, recognition of cooling tower plumes under conditions of high humidityand/or low cloud cover is difficult as the plumes tend to become indistinguish-able from ambient conditions. Also, the difficulty of recognizing visibleplume from an NDCTJ increases with distance from the plume source.
On the basis of the evidence available on visual and aesthetic intrusivenessof alternative cooling systems for the Nine Mile Point Station, the staffwould rate the once-through system as being superior to the NDCT. The plumeof the NDCT taken alone will be a moderate visual intrusion a large percentageof time and over a large area, although its visibility will depend upon meteoro-logical conditions. In contrast, the operation of a once-through system does
NMP-2 FES 5,19 Appendix G

not result in a plume. The NDCT structure, which is not only massive in itsproportions but also out of proportion with the existing viewscape, will beseen by a small number of residents within a 10-mile radius.
Property Values
The staff investigated the potential for a change in visual quality resultingfrom an NDCT to have adverse impacts on the local economy, especially the realestate market, land development, historic resources, and recreation. Countyplanners and assessors in each county where an operational nuclear power s-ta-tion with a natural draft tower is located were contacted to determine thenature and extent of impacts that could be attributed to the tall towers. 2 4
The plants involved are Beaver Valley 1, Davis Besse 1, Rancho Seco, ThreeMile Island, and Trojan (see.Table 5.9). The staff contacted the relevantpublic officials for Arkansas One, Unit 2 and Zimmer which are not yet opera-tional, although natural draft cooling towers had been constructed at thosesites. Those interviews indicate that reaction to tower visual aesthetics ismixed, with some residents reacting negatively, others positively. In noinstance could an assessor indicate that the tower adversely influenced proper-ty values or that the community discounted the values of properties because oftheir location in the tower viewshed. Finally, in no community could the con-tacted official identify any adverse impacts on land use and developmentattributable to the tower or the plant itself.
The staff's concludes from these interviews that tall cooling towers have hadno discernible adverse impact on community property values. This conclusiondoes not necessarily mean that some people do not feel that their aestheticenvironment had been degraded. Rather, the absence of observed impacts mayindicate that, for most people in the communities contacted, other consider-ations were balanced against a change in aesthetics. The staff assumes thatwhere property tax revenues from the station are gained by the local community,residents decide that such benefits more than compensate for the external costs(aesthetic decline) of the cooling towers.
Land Development
Real estate development decisions are based on numerous considerations; thesignificance of the visual impact of an NDCT must be evaluated in terms of aspecific investment decision. Although the staff recognizes the possibilitythata highly visible cooling tower may inhibit the development of uses whichar, nartircilrlv sensitive to visual intrusion, nd which are proximatelylocated to the towers, tfns impact should be minimal considering both the JUWdensity throughout the impact area and the low potential for growth in the imme-diate vicinity of the plant. Much of the land adjacent to the site is presentlyused for agricultural activities. The County land use plan has designated mostof the land within the impact area as rural/agricultural, the major exceptionsbeing the areas immediately adjacent to Oswego City, southwestern Volney, andthe Villages of Mexico and Pulaski.
A recent study of community change subsequent to the siting of an energy facil-ity indicated that opportunities for growth and development are determined bythe area's competitive advantages. 2" This study concluded that the extent towhich growth occurs in a community depends upon a variety of factors such as:
NMP-2 FES 5-20 Appendix G

rn
TABLE 5.9 Visibility 'of Natural Draft Cooling lowers at Nuclear Power Stations
Date of PopulationCommeercial Tower Within 10
Station County State Operation Height Miles (1970) Visibility
Davis Besse 1 Ottawa Ohio 11-20-77 493' 15,528 Tower visible for at least 10 miles.
Arkansas One, Pope Ark. 1/ 475' 25,000 Tower visible within 10 mile area.Unit 2 (approx.)
Rancho Seco Sacramento Calif. 4-17-75 425' 6,061 Towers visible within 10 mile area.
Beaver Valley 1 Beaver Pa. 10-1-76 500' 67,996?/ Tower visible for 1.5 miles north andsouth on river and. visible from TownMidland (1.5 miles away).
Trojan Columbia Oregon 5-20-76 499' 38,669-2
Three Mile Island Dauphin Pa. 9-2-74 370' 124,326-/ Four towers visible from limited1 & 2 immediate area but is visible from
high points about 5-6 miles away.
Zi mmeer Clermont Ohio Under 479', 24,073 Tower visible for at least 5 milesConstruction along river from hillside houses and
Town of Moscow (1/2 mile away).
Nine Mile Point Oswego N.Y. Proposed 536' 45,014 Tower will be visible within 10 miles.Unit 2
Source: Applicants' Environmental Reports and staff comments..
l/Unit 1 operational since 12-19-74 with once-through, Unit 2 under construction but tower has been completed at least 2 years.21Total of 4 population centers within 10 miles of plant: East Liverpool, Ohio; Aliquippa, Pa.; Ambridge, Pa.; Beaver Falls,
Pa.-3/Iotal population for Kelso and Longview cities.4/ Total population for 10 municipalities within 10-mile radius.
2:.-e

Amount of open land available for residential development.
Access to regional highways.
-- Commuting access to. significant job centers.
Proximity to resort/recreational activities of major regionalsignificance.
Extent of property tax and service levels before and after construction.
Inherent strength and application of land use controls prior to, during,and after construction.
Extent of past and expected population migration within and into thecounty or general area.
Type and level of public and private services in the town prior toconstruction.
Extent of the existing and expected real property tax differential(accounting for possible Federal income tax deductions) and servicelevel differential between the nuclear plant town and surroundingtown.
-- Need to "import" construction workers from noncommutable distances.
This conclusion is consistent with the conclusion reached in a series of staffinterviews with county planners in communities where natural draft towers arelocated. In those communities, none of the planners could cite the towers asa factor in retarding housing or commercial development. In two of the communi-ties, Sacramento County and Ottawa County, the towers were looked upon by thepublic as landmarks.
The growth-inducing effects of nuclear power plants arise from their large taxpayments to municipalities. Such payments permit beneficiary counties and specialdistricts to implement policies leading toward the improvement of services andfacilities, the lowering of taxes, or a combined policy of service improvementand tax reduction. Without counteractive growth control policies, communitiescan expect to attract an increased increment of regional growth and risingproperty values, all other considerations being equal. 26 Also, the staff assumesthat land development decisions are made soon after a firm decision to constructthe power plant. Table 5-10 shows population growth in all communities thathost nuclear power stations with closed cycle cooling systems. Although thedata do not prove a causal relationship between power plants and growth, thetable does indicate two points. First, in all but one situation the hostcounty experiences a population change which parallels the general pattern ofpopulation change in the surrounding counties. Second, of the six communitieswith natural draft towers, three had a higher percentage of population growth
NMP-2 FES 5-22 Appendix G

zmo
-nCd-
TABLE 5.10 POPULATION CHANGE IN AREAS WIIH NUCLEAR POWER STATIONS AND CLOSED CYCLEHEAT DISSIPATION SYSTEMS: 1965-1910 AND 1970-1975
Plant
Beaver Valley 1
Browns Ferry 3
Davib-Besse I
Duane Arnold
Fdrley I
lfot St. Vrain
Ilalch 1
Monticello
Palisades
Peach BoLtom 2/3
Prairie Island 1/2
Rancho Seco
lhree Mile Island
I' rj an
Vermont Yankee
LocationCounty Siate
Host CoutLy PopulationYear of Cooling _DensityOperation Tower Type 1965 1970 1-9h-ge
AdjacentCounties%Change
Host County PopulationDensi ty
1970 1975 %Change
AdjacentCounties%Change
Beaver
L fInes tone
Ottawa
L inn
iHuOus toll
Weld
AppI i ng
" Wright
Van Burren
York
Goodhue
Sac ranientu
Dauph iII
Co I umb i a
Windh,,m
UmN)
Pa.
Ala.
Ohio
Iowa
Al abama
Co 10.
Ga.
M inn.
Mich.
Pa.
Mi nli
Calif
Pa.
Oregon
VL.
Ark
1976
1977
1977
1975
197/
1914
19/5
1971
1971
1974
1974
1975
1974
1976
1972A
NDCT
(6)MDCI
NDCT
(2)MDCI
(3)MDCT
MDCI
MDCT
(2)MDCI
(2)MDCT
(3)MDCI
(4)MDCI
(2)MUCI
(4)NDCI
NHCI
(2)MDCI
NDCI
204.9
41.1
34.7
152.0
54.4
78.0
12.8
33.0
51.6
257.0
33.2
601.4
224.4
23.6
42.9
26. 7
208.7
41.8
37.1
163.6
56. 7
89.9
12.8
39.0
56.3
273.1
34.9
634.7
224.4
28.9
44.2
28.7
1.8
1.7
6.9
7.6
4.2
15.2
0
18.1
9.1
6.2
5.1
5.5
0
22.4
3.0
7.4
0.6
2.5
4.6
3.3
14.7
16.3
0
9.3
9.4
8.1
15.2
9.6
4.2
9.6
11.9
2.6
41.8
31.1
163.6
56.7
89.9
12.8
39.0
56.3
273.1
34.9
634.7
224.0
28.9
44.228.7
43.5
38.8
166.3
69.3
107. 7
14.4
46.7
62.1
285.6
37.3
688.0
224.2
31. 1
46.1
34.1
4.0
4.5
1.6
22.2
19.8
12.519.8
10.3
4.5
6.8
8.3
0
7.6
4.2
18.8
208.7 207.6 -0.5 -3.3
2.4
1.3
1.9
-0.5
20.4
7.1
20.4
3.1
5.1
13. 1
6.9
6.0
3.7
9.3
10. 7Arkan-as One-Unit 2 Pope
Source: Population fi0ures are froom the Bureau of the Census.
APlcuft not operational; however, tower had been cunstructed several years ago.
-P>-00
xr
m~

than their surrounding neighbors in the 1965-1970 period; this number rose tofive during the 1970-1975 period. For the 16 plants listed in the table, thehost county had a higher percentage change in population for the earlier periodthan adjacent counties in six instances; during the 1970-1975 period, the numberrose to 10.
After reviewing the published studies, available statistical data, and interviewswith local planners in communities with natural draft cooling towers, the staff'sjudgment is that the visual aesthetic impact of the towers will be subordinatedto other considerations, notably taxes. Moreover, in the absence of stronggrowth controls, the competitive advantages of the town which arise from thestation will influence the level of development in the impact area and in OswegoCounty.
Recreation and Historic Resources
Within 10 miles of the tower location are a number of recreational facilitiesincluding two state parks, Lake Ontario, and Fallbrook; these facilities arelisted in Table 2.7. These facilities offer a variety of activities throughoutthe year to hikers, campers, beachgoers, fishermen, skiiers, and athletes.
Aesthetic impacts that reduce recreational activity in the impact area couldnegatively affect jobs, services, income, and the County's sense of well-being.However, research into the relationship between aesthetic perception and recrea-tional activity has not produced conclusive findings. One study has concludedthat man-made or man-induced development has a notable effect on the preferencesexpressed for pictures of outdoor recreation landscapes and that preferencevaries inversely with the level or extent of that development. 2 7 Other researchhas indicated that campers in the Mid-West and beach users in Cape Cod considerthe quality of scenery (aesthetics) to be an important determination in select-ing a specific facility. 2 8 Others who have studied outdoor recreation activitysuggest that both the level of participation and the motivation for thatparticipation is changing. For instance, among campers, there is a growingsegment for whom direct contact with the natural environment is of lesserimportance than the social aspects of the camping experience. 2 9 The staff isnot aware of published longitudinal studies that have evaluated changes in theuse of recreational facilities subjected to a negative aesthetic impact.
The NRC staff has undertaken an analysis of recreation data from facilitieswithin 10 miles of the following plants: Connecticut Yankee, Vermont Yankee,Maine Yankee, Indian Point (New York), Three Mile Island (Pennsylvania), Cook(Michigan), Brunswick (North Carolina), Millstone Point (Connecticut), San Onofre(California), St. Lucie (Florida), and Zion (Illinois). 30 Specific causalrelationships between a facility and tourist and recreational use patterns inthe vicinity could not be adequately verified because of the relatively lowquality of data and the lack of "control" facilities. The staff depended uponresponse data gathered through telephone interviewswith public officials andbusinessmen. The interviews served to explain probable causes in attendancefluctuations at state park facilities and describe the uses at each facility.
The staff concluded that, in general, people do not avoid recreational andtourist areas in the vicinity of nuclear power plants to a measurable extent.The staff was able to document instances in which plants might have even enhanced
NMP-2 FES 5-24 Appendix G

the recreational environment. Several interview respondents noted that warmwater discharged from nuclear stations seemed to improve the size of the fishcatch and the length of the fishing season. With respect to state park attend-ance, the staff concluded that the data could not adequately support statementsabout causality. On the other hand, the subjective judgments of officials andbusinessmen familiar with tourism and recreational behavior in each localitydiscounted the possibility that the stations negatively influenced recreationaland tourist behavior.
The staff believes that the future of recreational opportunities in the Oswegoregion will be determined in some measure by their competitiveness with alternaterecreational opportunities especially with respect to cost, management, andthe quantity and quality of services and facilities offered. 3 1 The impact which.a highly visible cooling tower would have on the quality of the recreationalexperience and ultimately on the use of facilities is less certain, althoughthe information available to the staff indicates that the adverse impact torecreation resulting from cooling tower aesthetics would be minimal if, in fact,such impact does occur.
Table 2.10 lists the historic resources within the 10-mile impact area. Thenearest historic sites are within approximately seven to eight miles of thetowers. The staff assumes that the plume will not reach these resources exceptunder the most unusual circumstances. The staff concludes that physical damageto historic resources from tower effluent is highly unlikely. Further, thetowers would not directly produce change in the study area that would~reducethe enjoyment of these resources. Although visitors may be aware of the presenceof the tower, the distance to the tower will not significantly decrease theenjoyment of these resources. The staff does not expect the NDCT to reducevisitation to historic resources in the impact area.
Conclusion on Visual Aesthetic Impact
The staff concludes that the once-through cooling system is less.visuallyintrusive and, therefore, is aesthetically preferred. However, the staff hasalso presented information which strongly suggests that the visual intrusionand adverse aesthetic impact of the NDCT would not have significance in termsof altering human behavior.
5.3.2.2 Noise
The staff has evaluated noise levels produced by Nine Mile Point Unit 2 withrespect to (a) theproposed New York State Noise Code which requires that night-time sound levels not exceed 45 dBA at a commercial-industrial property line,and (b) threshold differences of 5 dBA above ambient noise levels which isconsidered the minimum level at which residents would notice a change.
Neither the once-through system nor the NOCT would produce noise contours of45 dBA at the property boundary. The NOCT, which produces higher noise levelsthan the once-through system, would impact the Lakeview Road corridor from LakeOntario to the plant's southern boundary with noise within the 35 to 40 dBArange; other nearby residential areas would be impacted with less than 35 dBAsound levels. With respect to the incremental increase in noise as a resultof operating a NDCT, sound increments of 5 dBA or more over ambient would beproduced at measurement stations 5 and 6, along Lakeview Road.32
NMP-2 FES 5-25 Appendix G

Although the NOCT is environmentally acceptable in terms of HUD noise guidelines,the tower noise would produce a greater awareness of plant operation than theonce-through system. However, as the number of people living along LakeviewRoad or other areas adjacent to the plant boundary is limited, the staff attachesno significance to the noise differentials between the cooling system options.
5.3.2.3 Drift and Local Weather Modifications
The NDCT system will not produce a downwashing of the plume to the ground and,therefore, will neither stimulate nor augment natural fog conditions. 34 Effluentfrom the NDCT has the potential for causing icing in the vicinity of the toweras a result of water deposition or splashing through of cooling water at theair inlet louvers. The applicant has indicated that icing as a result ofdeposition would-be less than 0.002 inches per year, an amount which is con-siderably less than ice deposits of a single storm in this area. The applicantconcludes that incidents of icing as a result of splashing or blow through wouldnot be of long duration or extensive.3s The once-through cooling system doesnot rely primarily on evaporation or heat transfer to the atmosphere; therefore,.episodes of fogging should be less frequent than such occurrences from the NOCT.
Induced fog, if it does occur, will tend to occur during periods of relativelylowvisibility and early in the morning; thus, the intrusion of additional. fogwill be severely limited. The staff does not expect suchepisodes to hinderboat or automobile travel. Because of the insignificance of their occurrence,icing and fogging are not an important consideration in the selection of analternative cooling system.
The applicant's analysis of salt deposition indicates that the maximum amountof salt to be deposited by the NDCT system was predicted to be 0.27 lbs/acre/yrat 6750 feet northwest of the tower; deposition rates for distances closer tothe tower are lower, as expected. 36 It should be noted that the maximum deposi-tion rate is well below threshold levels normally associated with damage tovegetation and soil. Maximum water deposition was predicted to be 690.6lbs/acre/yr (0.0030 inches/yr) occurring 6750 feet northwest of the-tower.The staff concludes that the contributions of moisture to the total moistureregime from the NDCT will be insignificant in comparison with daily fluctuations.Neither water or salt deposition provides the basis for differentiating betweenthe cooling system alternatives. -
Several studies of plume behavior have indicated that the increase in shadowingcaused by visible plumes would be less than 6 percent within 1970 feet; beyond3300 feet, shadowing effects would be negligible. Using the location of nearbygardens. in each sector, the applicant has concluded that the shadowing effectssolely due to the plume should not occur. However, on cloudy days, coolingtower plumes may combine with natural cloud conditions to shadow these nearbygardens. 3
Incidents of light, fluffy snowfall induced by cooling towers have been noted.However, such incidents have-been characterized by short duration and byparalleling the trajectory of the visible plume. Further, the impact on agri-culture should be negligible as none of the observations occurred during thegrowing season.38
NMP-2.FES 5-26 Appendix G

Although drift and weather modifications are characteristic of NDCTs and notonce-through cooling systems, the staff concludes that such impacts are withoutsocial or economic significance in the Nine Mile Point environment.
5.3.2.4 Tax Revenues
The applicant has not estimated real estate taxes for the once-through coolingsystem. However, during its operating life, local property taxes would becollected by the Town of Scriba and distributed to: the Town, Oswego County,and the Enlarged City School District of Oswego. The amount to be paid wouldbe determined by the assessment of the improvement and applicable rates estab-lished by the tax levying jurisdictions in the Town.
The staff has been informed that the NDCT system might be eligible for taxexemption under the provisions of Section 477 of the New York State Real PropertyTax Law. 3 9 Section 477 holds that the local assessor shall approve the exemptionpursuant to his evaluation and certification by state officials that the coolingsystem is an industrial waste treatment facility. For the purposes of the law,industrial waste treatment facilities shall encompass:
"...facilities for the treatment, neutralization or stabilizationof industrial waste (as the term "industrial waste" is defined insection 17-0105 of the environmental conservation law) from a pointimmediately preceding the point of such treatment, neutralizationor stabilization to the point of disposal, including the necessarypumping and transmitting facilities, but excluding such facilitiesinstalled for the primary purpose of salvaging materials whichare usable in the manufacturing process or are marketable."
Exemption from local taxation can be granted for a 10-year period during whichthe percentage of exemption decreases by 10 percent annually. The staff hasnot uncovered any State property tax provisions that would reduce the localtax burden on a once-through cooling facility.
5.3.2.5 Summary Comparison--Impacts of Alternative Systems on the HumanEnvironment
The staff has evaluated the possible social and economic impacts of operationof two alternative cooling systems for Nine Mile Point Unit 2. In its analysis,the staff has considered the construction and operation of a single NOCT ofapproximately 540 feet in height and a once-through cooling system. Five areasof potential impacts investigated are visual aesthetics, noise, drift and localweather modification, and tax revenues.
With respect to noise, drift and local weather modifications, the once-throughcooling system performed in a more acceptable manner; however, the impactsassociated with the NOCT were without socioeconomic significance and are con-sidered environmentally acceptable. Visual aesthetics proved to be the oneimpact which most clearly differentiated the cooling system alternatives. Theonce-through alternative would not have components that are visually obtrusive;therefore, adverse aesthetic impact is not possible. On the other hand, theNDCT would represent a visual intrusion over a large viewshed area as a resultof a massive tower structure and a variable plume that would be visible a large
NMP-2 FES 5-27 Appendix G

percentage of the time. Despite this intrusion, the staff concludes that impactsto property values, land development, historic sites, and recreation will beminimal.
NMP-2 FES 5-28 Appendix G

References for Section 5
1. U. S. Atomic Energy Commission. June 1973. Final Environmental StatementRelated to the Construction of Nine Mile Point Nuclear Station Unit 2.Docket No. 50-410. USAEC Directorate of Licensing, Washington D.C.
2. Colby, P. J. 1971. Alewife Dieoffs: Why Do They Occur? LIMNOS. 4(2):18-27.
3. Christie, W. J. 1973. A Review of the Changes in the Fish Species Composi-tion of Lake Ontario. Tech. Rept. No. 23. Great Lakes Fishery Commission,Ann Arbor, Michigan. 65 p.
4. Hartman, W. L. 1973. Effects of Exploitation, EnvironmentalNew Species on the Fish Habitats and Resources of Lake Erie.No.*22. Great Lake Fishery Commission, Ann Arbor, Michigan.
Changes, andTech. Rept.43 p.
5. Wells, L. and A. L. McLain. 1973. Lake Michigan - Man's Effects on NativeFish Stocks and Other Biota. Tech. Rept. No. 20. Great Lakes FisheryCommission, Ann Arbor, Michigan. 55 p.
6. Brown, E. H., Jr. 1972. Population Biology of Alewives, Alosapseudoharengus, in Lake Michigan, 1949-1970. J. Fish. Res; Bd. Cana.29(5):477-500.
7. Brown, E. H., Jr. 1968. Population Characteristicsof Alewives.in a Mass Dieoff in Lake Michigan, 1967.Great Lakes Fishery Commission, Ann Arbor, Michigan.
and Physical ConditionTech. Rept. No. 13.20 p.
8. Rothschild, B. J. 1966. Observations on the Alewife (Alosa pseudoharengus)in Cayuga Lake. New York Fish and Game Journal. 13(2):188-195.'
9. Detroit Edison Company. February 1978. Supplement 4, Environmental ReportOperating License Stage. Enrico Fermi Atomic Power Plant Unit 2. DocketNo. 50-341. Detroit, Michigan.
10. Sharma, R. K. and R. F. Freeman III. March 1977. Survey of Fish Impinge-ment at Power Plants in the United States. Vol. I. The Great Lakes.ANL/ES-56. 218 p.
11. CDM/Limnetics. 1977. The Lake-wide Effects of Impingement. and Entrainmenton the Lake Michigan Fish Populations. Milwaukee, Wisconsin.
12. U. S. Nuclear Regulatory Commission. February 1978. Final Addendum tothe Final Environmental Statement Related to Operation of Palisades NuclearGenerating Plant. Docket No. 50-255. USNRC Office of Nuclear ReactorRegulation. Washington, D.C.
NMP-2 FES 5-29 Appendix G

13. Smith, S. H. 1968. The Alewife. LIMNOS. 1(2):1-8.
14. Edsall, T.. A., and T. G. Yocum. 1972. Review of Recent Technical Infor-mation Concerning the Adverse Effects of Once-through Cooling on Lake Michigan.Prepared for the Lake Michigan Enforcement Conference, September 19-21,1972, Chicago, Illinois. Great Lakes Fishery Laboratory, Ann'Arbor, Michigan.
15. U. S. Environmental Protection Agency. April 1976. Development Documentfor Best Technology Available for the location, Design, Construction, andCapacity of Cooling Water Intake Structures for Minimizing Adverse Environ-mental Impact. EPA 440/1-76/015-2. USEPA, Washington,, D.C. 263 p.
16. Lawler, Matusky and Skelly Engineers. May 1976. 1975 Nine Mile PointAquatic Ecology Studies. LMS Project Nos. 191-31, 32, 33. Prepared forNiagara Mohawk Power Corporation and Power Authori ty of the State of NewYork.
17. Lawler, Matusky and Skelly Engineers. May 1977. 1976 Nine Mile PointAquatic Ecology Studies. LMS Project Nos. 191-40,41,42. Prepared forNiagara Mohawk Power Corporation and Power Authority of the State of NewYork.
18. Storr, J. F., and G. Schlenker. 1974. Response of Perch and their Forageto Thermal Discharges in Lake Ontario. p. 363-370. In: Gibbons, J. W.,and R. R. Sharity (Eds). Thermal Ecology. U.S. Atomic Energy Commission,Oak Ridge, Tennessee.
19. Niagara Mohawk Power Corporation. 1976. 316(a) Demonstration Submission.Nine Mile Point Unit 1. NPDES Permit NY 0001015.
20. Reutter, J. M., and C. E. Herdendorf. 1976. Thermal Discharge from aNuclear Power Plant: Predicted Effects on Lake Erie Fish. The Ohio Journalof Science. 76(1):39-45.
21. Niagara Mohawk Power Corporation. July 1976. Report on Circulating WaterCooling System Employing a Natural Draft Cooling Tower. Nine Mile PointNuclear Station - Unit 2. Docket No. 50-410. 19 p. and Tables and Figures.
22. Niagara Mohawk Power Corporation, "Responses to NRC Requests Dated April 22,1977, For Additional Information Regarding the Proposed Cooling SystemDesign Change," September 30, 1977. Docket No. 50-410.
23. Draft Environment Statement. Indian Point Unit No. 3. August 1977.
U.S. Nuclear Regulatory Commission.
24. The following persons were contacted by telephone:
Arkansas One, Unit 2 - Judge Ermil Grant, Pope County Judge (Telephoneconversation on 2-3-78); Stanford Lee, Pope County Assessor (2-8-78).Beaver Valley 1 - Michael Van Doren, Chief Assessor of Beaver County (2-2-78),Edward Blanarike, Assistant Director of Planning of Beaver County (2-2-78).Three Mile Island - Bill Collins, Appraisal Consultant in County AssessorsOffice (2-2-78); James Zeiter, Staff Planner of the Tri-County Regional
NMP-2 FES 5-30 Appendix G

Planning Commission (2-2-78). Rancho Seco - Emmeron Wallner, SacramentoCounty Assessors Office (2-2-78); Stewart Wilson, Sacramento County PlanningDepartment (2-2-78). Davis Besse - Walter Wehenkel, Assistant Director,Regional, Planning Commission (2-2-78); Don Zucker, Ottawa County Appraiser(2-3-78). Trojan - Henry T. Hudson, Columbia County Assessors Office (2-3-78);Don Ludroot, Acting Planning Director of Columbia County (2-3-78).
25. Harbridge House, Inc., The Social and Economic Impact of a Nuclear PlantUpon Montague, Massachusetts, and the Surrounding Area (Boston: HarbridgeHouse, 1974), pp. 1-7 and 1-8.
26. Wallace E. Oates, "The Effects of Property Taxes and Local Public Spendingon Property Values: An Empirical Study of Tax Capitalization and the TieboutHypothesis," Journal of Political Economy, November/December, 1969,pp. 957-71.
27. E. Glenn Carls, "The Effects of People and Man-Induced Conditions onPreferences for Outdoor Recreation Landscapes," Journal of Leisure Research,Vol. 6, No. 1, Winter 1974, pp. 237-50.
28. Charles E. Taylor, and Douglas M. Knudson, "Area Preferences of MidwesternCampers," Journal of Leisure Research, Vol. 5 No. 2, Spring 1973, pp. 39-48,and Richard D. Hecock, "Recreation Behavior Patterns as Related to SiteCharacteristics of Beaches," Journal of Leisure Research, Vol. 2, No. 4,Fall 1970, pp. 237-50.
29. Roger N. Clark, John C. Hendee, and Frederick L. Campbell, "Values, Behavior,and Conflict in Modern Camping Culture," Journal of Leisure Research, Vol. 3,No. 3, Summer 1971, pp. 143-59.
30. Draft manuscript by Ellen Aronson of the NRC.
31. Warren E. Johnston, and Gary H. Elsner, "Variability in Use Among Ski Areas:A Statistical Study of the California Market Region," Journal of LeisureResearch, Vol. 4, No. 1, Winter 1972, pp. 43-9. See also the Taylor andHecock articles referenced above.
32. Niagara Mohawk Power Corporation, Report on Circulating Water CoolingSystem Employing a Natural Draft Cooling Tower: Nine Mile Point NuclearStation Unit 2, July 1976, Docket No. 50-410, Figs. 13, 14, and 15, andTable 1.
33. Ibid., Table 1, and Figure 13.
34. Ibid., pp. 9 and 10.
35. Ibid., p. 11.
36. Niagara Mohawk Power Corporation, "Responses to NRC Requests Dated April 22,1977, For Additional Information Regarding the Proposed Cooling SystemDesign Change," September 30, 1977, Docket No. 50-410, p. 4-1 and Fig. R4-1.
NMP-2 FES 5-31 Appendix G

37. Ibid. , p. 8-1.
38. Ibid., p. 8-2.
39. Telephone communication with Thomas Quinn, Bureau of Energy Waste Coordi-nation, N.Y.S. Department of Environmental Conservation, on March 9, 1978and McKinney's-Consolidated Laws of New York, Vol. 49A, Section 477, pp.216-17.
40. U.S. Nuclear Regulatory Commission. September 1978. Environmental ImpactAppraisal by the Office of Nuclear Reactor Regulation Supporting AmendmentNo. 29 to Facility License No. DPR-63, Niagara Mohawk Power Corporation,Nine Mile Point Nuclear Station, Unit 1. Docket No. 50-220. Washington,D.C.
41. U.S. Nuclear Regulatory Commission. March 1979. Environmental ImpactAppraisal by the Office of Nuclear Reactor Regulation Supporing AmendmentNo. 46 to Facility License No. DPR-59, Power Authority of the State ofNew York, Fitzpatrick Nuclear Power Plant. Docket No. 50-333. Washington,D.C.
42. Niagara Mohawk Power Corporation, Responses to NRC Requests for AdditionalInformation, November 21, 1980.Docket No. 50-410
NMP-2 FES 5-32 Appendix G

6 ECONOMIC EVALUATION
Nine Mile Point Unit 2 is a nuclear fueled boiling water reactor supplying steamto a turbine generator rated at a nominal 3,323 MWt and approximately 1,100MWe net. The ultimate expected capability is 3,489 MWt and 1,150 MWe net.Commercial operation is planned for the second quarter of 1986 to meet predictedsystem electrical power demands.
In the FES Section 9.2 a once-through condenser cooling system was selectedbecause it was concluded after extensive evaluation that this type of systembest balanced economic generation of power with proper concern for environmentalprotection. Other cooling methods considered in detail were a natural draftcooling tower system, a mechanical draft cooling tower system, and a coolingpond system. A dry cooling tower, a spray pond, and supplementary cooling werediscussed and rejected as being less desirable alternatives.
Recent U. S. Environmental Protection Agency effluent guides require applicantsto demonstrate that no harm will occur to the aquatic community of the receivingwater body as a result of operating a once-through system.' Niagara Mohawkhas modified the Unit 2 design to incorporate a natural draft cooling tower(NOCT), a system which conforms to the best technology economically availableas required by the Environmental Protection Agency. The estimated costdifferential associated with incorporating this system is summarized inTable 6.1 and the details are discussed in following paragraphs.
The overall cost of the NOCT system is estimated to be $19,421,000 more in1975 than the once-through system. Based on a 19% fixed charge rate and 70%capacity factor this would increase the cost of generating electricity about0.52 mills/kWh. (Note that the dollar estimates that follow are based on 1975costs.)
6.1 Expenditures Previously Committed to the Once-Through System
A. The engineering and design work completed, which was abandoned with theadoption of cooling towers, is estimated to have cost $495,000.
B. The model studies completed to prove that the once-through dischargecomplies with thermal criteria set forth by the NYDEC have cost $563,000.
6.2 Direct Cost Differential
The once-through system is slightly more costly to build than the NDCT becauseof increased water flow which results in larger structures and equipment andthe requirements for fish diversion. The closed loop system requires theadditional cost of the NDCT. Table 6.2 presents the comparison of direct costof once-through versus NOCT.
NMP-2 FES 6-1 Appendix G

TABLE 6.1 Summary of Differential Cost ofOnce-Through Versus Cooling Tower
Expenditures Previously Committed.
A. Engineering & Design Services
B. Once-through Thermal DischargeModel Studies
TOTAL
Direct Cost Differential
Engineering Services Cost Differential
Operational Cost Penalties (Capitalized)
$ 495,000
563,000
$1,058,000
($ 712,000)
$ 142,000
$18,933,000$19,421,000
NMP-2 FES 6-2 PAppendix G

TABLE 6.2 Direct Cost Comparison of Once-Through Versus Closed Loop CoolingSystem-Estimate (D)
Chemical Treatment System
Circulating Water System, Intakeand Discharge Tunnel, Screenwell
Intake Structure.(Structural Cost)
Intake Structure (Equipment and Piping
Special Screens for Fish Removal
Piping and Fish Removal Equipment inScreenwell
Fish Diversion-Motive Force Pumps.
Booster Pump House @ Unit 1
Piping (650 ft. of 120 in. Pipe)
Tunnel (Add 200 ft. to Unit 2 Tunnel)
Larger Diffuser Tunnel With AdditionalRisers
Cooling Tower Discharge Structure Model
Study
Totals
Once-Through
$ NA
41,004,000 (A)
9,040,000
392,000
432,000
86,000
235,000
1,280,000
600,000
300,000
2,000,000
NA
$55,459,000
Closed Loop(BC)
$ 425,000
5 3 , 0 58 , 00 0 (E)
940,000
15,000
144,000
86,000
29,000
NA
NA
NA
NA
50,000
$54,747,000
Notes:
A. "Once-Through Cooling" design includes offshore fish diversion and screenwefish diversion.
B. Cooling Tower based on 16 degree approach 27 degree range, natural drafttower.
C. "Closed Loop Cooling" design includes screenwell fish diversion.
D. All costs for equipment and structures are September 15, 1975, direct costs
only.
E. Includes cost of cooling tower (approximately $16,000,000).
ii
NMP-2 FES 6-3 Appendix G

TABLE 6.3 Operational Cost Penalties Associated with Closed-LoopCooling System-Estimate
Differential capitalized fuel costs $ 3,377,000
Differential capability cost (yearly avg.) 15,286,000
Differential capability due to fish removal energy (730,000)
Capitalized cost of additives over life of plant 1,000,000
Total $18,933,000
Notes:
A. Fuel Cost based on $24,085/Btu of unit heat rate.
B. Capability cost based on $990/kw.
C. "Once-Through Cooling" design includes offshore fish diversion andscreenwell fish diversion.
D. "Closed Loop Cooling" design includes screenwell fish diversion.
NMP-2 FES 6-4 Appendix G

6.3 Engineering Services Cost Differential
The earlier effort on once-through design is conceptually complete as is thepresent closed loop design, and the estimate to complete either system as ofApril 1, 1976, differs by only $142,000 additional for once-through design.
6.4 Operational Cost Penalties
The differential operating costs associated with the cooling tower, as compared.to once-through cooling over the life of plant, are $18,933,000 as outlined inTable 6.3.
NMP-2 FES 6-5 Apppnoix G

References to Section 6
1. U.S. Environmental Protection Agency, "Effluent Guides and Standards forthe Steam Electric Power Generating Point Source Category," 40 CFR 42,October 1974.
NMP-2 FES 6-6 Appendix G

APPENDIX H
NINE MILE POINT 2 RELEASE CATEGORIES USED IN CONSEQUENCE ANALYSIS
NMP-2 FES Appendix H


APPENDIX H
NINE MILE POINT 2 RELEASE CATEGORIES USED IN CONSEQUENCE ANALYSIS
The release categories used in this consequence analysis are a subset of thoseused for the Limerick consequence analysis (NUREG-0974). This choice was basedon (1) the design similarities between Nine Mile Point Unit 2 (NMP-2) andLimerick 1 or 2 and (2) the fact that indepth probabilistic risk analyses (PRAs)were performed by the Limerick applicant and reviewed by the staff. To accountfor differences between NMP-2 and Limerick, the staff adjusted the probabilitiesfor some of the release categories and dropped others.
The release categories selected for NMP-2 are discussed below. The differencesin the probabilities used for this study and those used for Limerick are alsodiscussed. A more detailed description of the methodology used in determiningthe magnitudes of releases is given in NUREG-0974, Appendix H. Externallyinitiated accidents were included in the Limerick study, but not in this studyof NMP-2. Otherwise., the methodology described in NUREG-0974, Appendix Happlies to NMP-2.
Table H.1 is a description of the plant damage states used in this study. Eachplant damage state will lead to one or more release categories, based on thelocation of containment failure (see Table H.2). Each release category isdescribed in Table H.3.
References
Papazoglou, I. A., et al., "Review of Limerick Generating Station ProbabilisticRisk Assessment," U.S. Nuclear Regulatory Commission, NUREG/CR-3028, February1983.
U.S. Nuclear. Regulatory Commission, "Final Environmental Statement related tothe operation of Limerick Generating Station, Units 1 and 2,"' NUREG-0974,April 1984.
NMP-2 FES I Appendix H

Table H.1 Description of damage states
Designator Description
I-S These are LOCA (loss-of-coolant accident)-initiated sequences(medium and small pipe breaks only) involving loss-of-coolantinventory makeup. They would result in a relatively fast coremelt, with the containment intact at the time of core melt.
I-T These are sequences initiated by transient events* involvingloss-of-coolant inventory makeup. Core melt is expected to berelatively fast and the containment to be intact at the time ofcore melt.
II-T These are transient- or LOCA-intiated sequences involving loss ofcontainment heat removal or inadvertent steam relief valve openingaccidents with, inadequate heat removal capability. Core melt isexpected to be relatively slow as a result of the lower decaypower level, with the containment failing before core melt.
III-T These sequences are transients involving loss of scram (fast shut-down of reactor) function and inability to provide coolant makeup,large LOCAs with insufficient coolant makeup, transients with lossof heat removal, and long-term loss-of-coolant inventory makeup.Core melt is expected to be relatively fast, and the containmentintact at core melt. For NMP-'2, all the release categories inthis damage state were assigned a higher probability than forLimerick, based on site-specific differences in the estimatedprobability of anticipated transients without scram.
IV-T These sequences are transients that involve loss of .scram functionand a loss of containment heat removal or all reactivity control,but with coolant makeup capability. Core melt is expected to berelatively fast with the containment failing before core meltbecause of overpressure. As for III-T above, the release categor-ies in this groupwere assigned a higher probability than forLimerick.
IV-A As above but initiated by large LOCAs.
S-H20 These sequences are seismically induced reactor vessel failures(plus random reactor-vessel failure), coupled with immediate con-tainment failure. Core melt is fast, with the vessel and contain-ment both failed at the time of core melt. This sequence assumesthe vessel break is high, which would allow water to be retainedin the bottom of the vessel before core slump.
*See next page for footnote.
.NMP-2 FES 2 Appgndix H

Table H.1 (Continued)
Designator Description
S-H20 As above, but with a vessel failure location that results incomplete draining of the water from the vessel.
*In general, the term reactor transient applies to any significant deviationfrom the normal operating values of any of the key reactor operating param-eters. More specifically, transient, events can be assumed to include allthose situations (except for the LOCA, which is treated separately) thatcould lead to fuel heat imbalances. When viewed in this way, transientscover the reactor in its shutdown condition as well as in its various operat-ing conditions. The shutdown condition is important in the consideration oftransients because many transient conditions result in shutdown of thereactor, and decay heat removal systems are needed to prevent fuel heatimbalances as a result of core decay heat.
Transients may occur as a consequence of an operator error or the malfunc-tion or failure of equipment. Many transients are handled by the reactorcontrol system, which would return the reactor to its normal operating condi-tion. Others would be beyond the capability of the reactor control systemand would require reactor shutdown by the reactor protection system to avoiddamage to the reactor fuel.
In safety analyses, the principal areas of interest are increases in reactorcore power (heat generation), decreases in coolant flow (heat removal), andincreases in reactor coolant system (RCS) pressure. Any of these couldpotentially result from a malfunction or failure, and they represent a poten-tial for damage to the reactor core and/or the pressure boundary of the RCS.The analysis of reactor transients has been directed at identifying thosemalfunctions or failures that can cause core melting or rupture of the RCS.pressure boundary. Regardless of the way in which transients might causecore melting, the consequences are essentially the same; that is, the moltencore would be inside the containment and would follow the same course ofevents as a molten core that might result from a LOCA.
Each potential transient is assessed to fall into either one of two generalcategories, the anticipated (likely) transients and the unanticipated(unlikely) transients. The most probable group of potential transients arethose that have become commonly known as anticipated transients. All othertransients are considered to fall into the unanticipated transients category.The relatively low probability (unanticipated) transients can be eliminatedfrom the risk determination because their potential contribution to risk issmall compared to that of the more likely (anticipated) transients that wouldproduce the same consequences.
The anticipated transient initiators for which successful reactor scram couldbe accomplished have been divided *into five groups for this analysis. Thesegroups are
NMP-2 FES 3 NMP-2FES 3Appendix H

Table H.1 (Continued)
(1) transients resulting in turbine trip(2) transients leading to isolation of the reactor vessel from the main
condenser, a main steamline isolation valve (MSIV) closure, and loss offeedwater
(3) transients resulting from loss of offsite power(4) transients resulting from inadvertent open relief valve (IORV)(5) orderly and controlled manual shutdown
.Thirty-seven BWR transients identified from operating experience data arelisted in Table 2.9 of NUREG/CR-3028 (Papazoglou, 1983) and are included in-the first four of the above groups. If the reactor protection system fails toscram the reactor after an initiating event in any of the first four transientgroups, then an anticipated transient without scram (ATWS) condition results.The following four groups of ATWS initiators were, therefore, considered:
(1) turbine trip ATWS(2) MSIV closure ATWS(3) loss of offsite power ATWS(4) IORV ATWS
NMP-2 FES 4 Appendix H

Table H.2 Containment failure mode and release path notation
Designator Description
DW Containment failure via overpressurization. Failure location inthe drywell.
WW Containment failure via overpressurization. Failure location inthe wetwell above the suppression pool.
WW Containment failure via overpressurization. Failure location inthe wetwell below the suppression pool resulting in loss ofsuppression pool water.
SE Failure via in-vessel steam explosion-generated missiles.
HB Failure via hydrogen burning during the periods when the contain-ment atmosphere is de-inerted. This failure mode also includeshydrogen detonation and ex-vessel steam explosion failure modes,which are of very low frequency.
LGT Containment leakage rates sufficiently low to allow the standbygas treatment system (SGTS) to operate effectively.
LGT Containment leakage rates so high that the SGTS is ineffective.
NMP-2 FES 5 Appendix H

I Table H.3 Description of the release categories*
Category Description
1. RELEASE CATEGORIES ASSOCIATEDWITH DAMAGE STATE I-T
I-T/DW
The damage state I-T is defined inTable H.1 and basically consists oftransients with loss-of-coolant inventorymakeup. Core melt in such situations isexpected to be relatively fast and occurswithin an intact containment. After ves-sel failure, the majority of the corematerials are retained on the diaphragmfloor below the reactor vessel. Contain-ment failure occurs via gradual overpres-surization (except for SE, HB, LGT andLGT release -- see Table H.2) severalhours after vessel failure as a result ofcore/concrete interactions.
This release category assumes an over-pressure failure in the drywell wall.The gap and melt releases would bedirected to the suppression pool andsubjected to a DF of 100 (water is sub-cooled) before they reach the wetwellairspace. The vaporization release wouldbe directed to the drywell without anypool scrubbing. All fission products inthe drywell and wetwell would be subjectedto agglomeration and settling as predicted*by the CORRAL code, before containmentfailure (which occurs several hours afterthe pressure vessel failure).
This release category assumes a failurein the wetwell above the suppression pool.The gap, melt, and vaporization releaseswould be released to the drywell and wet-well as described above. The only dif-ference is that when the containment fails,fission products in the drywell must passthrough the downcomers and suppression poolbefore they are released to the atmosphere.
I-T/WW
*A quantitative description of the release categories as used in the accident
consequence calculations is in Table 5.8.
NMP-2 FES 6 Appendix H

Table H.3 (Continued)
Category Description
I-T/W-W
I-T/SE
I-T/HB
This release category assumes a failurein the wetwell below the suppressionpool, which drains the water. The gap,melt, and vaporization releases would bereleased to the containment as describedabove. The only difference is that atcontainment failure the suppression poolwould be drained so that fission productsin the drywell no longer have to passthrough the suppression pool (as in theI-T/WW release path) before they arereleased to atmosphere.
This release category results from anin-vessel steam explosion-generated mis-sile. All release categories involvinga steam explosion were judged to be sounlikely for NMP-2 that they would makeonly a negligible contribution to risk.
This release category could result fromhydrogen' burn failures during the timewhen the containment atmosphere is de-inerted. BNL used the same release cate-gory as in the LGS-PRA, but reduced thecore fraction associated with the oxida-tion releases in a manner consistent withWASH-1400. (Note in the LGS-PRA, thisrelease category was representative ofex-vessel steam explosions.).
These release categories result fromcontainment leakage-and assume that theSGTS operates (LGT), or that it does notoperate (LGT). BNL used the LGS-PRAreleases, but changed the timing to cor-respond to the BNL MARCH analysis.
The damage state II-T is defined inTable H.1 and basically assumes loss ofcontainment heat removal. Eventually,the containment would fail and cause theloss of inventory makeup. As the con-tainment would fail prior to core melt-and the suppression pool is saturated (DFof 1), the location of containment failure(DW, WW or WW -- see Table H.2) is ofrather less importance than it is for theI-T damage states.
I-T/LGT and I-T/LGT
2. RELEASE CATEGORIES ASSOCIATEDWITH DAMAGE STATE II-T
NMP-2 FES 7 Appendix H

Table H.3 (Continued)
Category Description
I I-_T/WW
3. RELEASE CATEGORIES ASSOCIATEDWITH DAMAGE STATE III-T
This release category assumes a failurein the wetwell above the suppression pool.The melt release would be directed to thesuppression pool, but would not be sub-jected to pool decontamination becausethe water would be saturated. The vapor-ization release would be directed to thedrywell, then through the downcomers tothe wetwell air space, and finally to theatmosphere. This one failure locationwas also used to represent failures inthe drywell (DW) and wetwell below thesuppression pool (W). This assumptionis reasonable because, as the pool issaturated, the different flow paths wouldnot result in significant differences incalculated release fractions (see IV-Tbelow).
The damage state III-T corresponds toa transient event coupled with loss ofscram function (see Table H.1). Coremelt would be rapid and into an intactcontainment. Containment failure ispredicted to occur after vessel failureas a result of overpressurization. How-ever, the suppression pool would besaturated so that the gap, melt, andvaporization releases would not be sub-jected to decontamination by the pool.Consequently, again (as for the II-Tdamage state) one failure location wasused to represent the three potentiallocations.
This release category is similar to theI-T/WW sequence; however, because thepool is saturated, the melt releasewould not be subjected to pool scrubbing.
These release categories are also consid-dered as possible and would be similar toI-T/HB, I-T/LGT and I-T/LGT, respectively.
III-T/WW
III-T/HB, III-T/LGT andIII-T/LGT
NMP-2 FES 8 Appendix H

Table H.3 (Continued)
Category Description
4. RELEASE CATEGORIES ASSOCIATEDWITH DAMAGE STATE IV-T
IV-T/DW, IV-T/WW and IV-T/WW
5. RELEASE CATEGORIES ASSOCIATEDWITH DAMAGE STATES I-S AND IV-A
'-S/DW
IV-A/DW
The damage state IV-T is defined inTable H.1 and essentially consists ofATWS sequences in which continued coolantmakeup was postulated to result in over-pressurization failure of the containmentbefore core melt. The suppression poolwould be saturated for these sequencesand hence the DF would be unity.
For these release categories, the impactsof the three potential failure locations(OW, WW, and WW) were analyzed. Becauseof the saturated pool, similar releasefractions were estimated. These calcula-tions support the use of only one failurelocation for the II-T and III-T damagestates. The release paths (DW, WW, andWW) for the three locations are discussedin detail above.
The damage states I-S and IV-A are definedin Table H.1 and correspond to LOCA-initiated sequences. They were calculatedto have a low frequency but, because ofdifferences in flow paths relative totransients, were analyzed separately.
This release category would result inthe release of the melt and vaporizationreleases to the drywell, thus bypassingpool Scrubbing. However, because thecontainment would fail several hours aftervessel failure, the release fractions arenot significantly different from theI-T/DW flow path (in which the gap andmelt releases were subjected tosuppression pool scrubbing.)
This release category is similar toIV-T/DW except that the initiating eventis a large LOCA.
NMP-2 FES 9 Appendix H

Table H.3 (Continued)
Category Description
6. RELEASE CATEGORIES ASSOCIATEDWITH SURROGATE DAMAGE STATESS-H20 AND S-H20
S-H20/W'and S-H20//W
The damage states S-H20 and S-H20 aredefined in Table H.1; they also wouldbe earthquake induced. The RHR suctionlines would be severed, but the vessel'also could fail at the start of the acci-dent. Thus, the core would melt into afailed containment and none of thereleases would be subjected to poolscrubbing. The only differences betweenthe S-H20 and S-H20 sequences relate tothe location of possible failure in thevessel. For the S-H20 sequence, waterwould remain in the vessel and be avail-able for interacting with core debris asslumping occurs. This would affect move-ment of the fission products and allow thepotential for an in-vessel steam explosion.The S-H20 damage state involves a failureof the vessel so that the water would becompletely drained at the start of theaccident. Thus, there would be no in-vessel debris/water interaction and nopotential for an in-vessel steam explosion.
These release categories are consideredpossible. Assignment of WW failure modeto damage states S-H20 and S-H20 relatesonly to similarity of fission productrelease path and lack of suppression poolscrubbing, rather than the actual failurelocation.
NMP-2 FES 10 Appendix H

APPENDIX I
CONSEQUENCE MODELING CONSIDERATIONS
NMP-2 FES Appendix I


APPENDIX I
CONSEQUENCE MODELING CONSIDERATIONS
1.1 Evacuation Model
"Evacuation," used in the context of offsite emergency response in the event ofa substantial amount of radioactivity release to the atmosphere in a reactoraccident, denotes an early and expeditious movement of people to avoid exposureto the passing radioactive cloud and/or to acute ground contamination in thewake of the cloud passage. It should be distinguished from "relocation," whichdenotes a post-accident response to reduce exposure from long-term ground con-tamination after plume passage. The Reactor Safety Study (RSS) (NUREG-75/014,originally WASH-1400) consequence model provides for incorporating radiologicalconsequence reduction benefits of public evacuation. The benefits of a properlyplanned and expeditiously carried out public evacuation would be well manifestedin a reduction of early health effects associated with early exposure; namely,in the number of cases of early fatality (see Section 1.2) and acute radiationsickness that would require hospitalization, The evacuation model originallyused in the RSS consequence model is described in WASH-1400 as well as inNUREG-0340 and NUREG/CR-2300. The evacuation model that has been used hereinis a modified version of the RSS model (Sandia, 1978) and is, to a certainextent, site-emergency-planning oriented. The modified version is briefly out-lined below.
The model uses a circular area with a specified radius (the 16-km (10-mile)plume exposure pathway emergency planning zone (EPZ)), with the reactor at thecenter. It is assumed that people living within portions of this area wouldevacuate if an accident should occur involving imminent or actual release ofsignificant quantities of radioactivity to the atmosphere.
Significant atmospheric releases of radioactivity would in general be precededby one or more hours of warning time (postulated as the time interval betweenthe awareness of impending core melt and the beginning of the release of radio-activity from the containment building). This warning time is given for eachrelease category in Table 5.8. For the purpose of calculation of radiologicalexposure, the model assumes that all people who live in a fan-shaped area (fan-ning out from the reactor) within the circular zone with the downwind directionas its median--that is, those people who would potentially be under the radio-active cloud that would develop following the release--would leave their resi-dences after lapse of a specified amount of delay time* and then evacuate. Thedelay time is reckoned from the beginning of the warning time and is recognizedas the sum of the time required by the reactor operators to notify the respon-sible authorities; the time required by the authorities to interpret the data,decide to evacuate, and direct the people to evacuate; and the time requiredfor the people to mobilize and get under way.
*Assumed to be a constant value, 1.77 hours, that would be the same for all
evacuees.
NMP-2 FES 1 Appendix I

The model assumes that each evacuee would move radially outward* away from thereactor with an average effective speed** (obtained by dividing the zone radiusby the average time taken to clear the zone after the delay time) over a fixeddistance from the evacuee's starting point. This travel distance is selectedto be 24 km (15 miles), which is 8 km (5 miles) more than the 16-km (10-mile)plume exposure pathway EPZ radius. After reaching the end of the traveldistance, the evacuee is assumed to receive no further radiation exposure.
The model incorporates a finite length of the radioactive cloud in the downwinddirection that would be determined by the product of the duration over whichthe atmospheric release would take place and the average windspeed during therelease. It is assumed that the front and back of the cloud would move with anequal speed that would be the same as the prevailing windspeed; therefore, itslength would remain constant at its initial value. At any time after therelease, the concentration of radioactivity is assumed to be uniform over thelength of the cloud. If the delay time were less than the warning time, then.all evacuees would have a head start; that is, the cloud would be trailing-behind the evacuees initially. On the other hand, if the delay time were morethan the warning time, then depending on initial locations of the evacuees thereare possibilities that (1) an evacuee would still have a head start, or (2) thecloud would already be overhead when an evacuee starts to leave, or (3) anevacuee would be initially trailing behind the cloud. However, this initialpicture of cloud/people disposition would change as the evacuees travel, depend-ing on the relative speed and positions between the cloud and people. The cloudand an evacuee might overtake one another one or more timesbefore the evacueewould reach his/her destination. In the model, the radial position of an evac-uating person, either stationary or in transit, is compared to the front andthe back of the cloud as a function of time to determine a realistic period ofexposure to airborne radionuclides. The model calculates the time periodsduring which people are exposed to radionuclides on the ground while they arestationary and while they are evacuating. Because radionuclides would be de-posited continually from the cloud as it passed a given location, a person whois under the cloud would be exposed to ground contamination less concentratedthan if the cloud had completely passed. To account for this, at least in part,the model assumes that persons are: (1) exposed to the total ground contamina-tion concentration that is calculated to exist after complete passage of thecloud, after they are completely passed by the cloud; (2) exposed to one-halfthe calculated concentration when anywhere under the cloud; and (3) not exposed*when they are in front of the cloud. Different Values of the shielding protec-tion factors for exposures from airborne radioactivity and ground contaminationhave been used.
Results shown in Section 5.9.4.5 of the main body of this environmental state-ment for accidents involving significant release of radioactivity to the atmos-phere were based upon the assumption that all people within the 16-km (10-mile)plume exposure pathway EPZ would evacuate according to the evacuation scenario
*In the RSS consequence model, the radioactive cloud is assumed to travelradially outward only, spreading out as it moves away.
**Assumed to be a constant value 0.47 meters per second (1.05 mph), that would
be the same for all evacuees.
NMP-2 FES 2 Appendix I

described above. For some public or private institutions (nursing homes, etc.)not all persons may be quickly evacuated. However, it is not expected thatdetailed modeling of any such facility near a specific plant site would signi-ficantly alter the conclusions, because the sheltering these facilities providewould mitigate the doses more than is assumed in CRAC. For the delay timebefore evacuation, a value of 1.77 hours was used. The staff believes that sucha value appropriately reflects the Commission's emergency planning requirements.The applicant has provided estimates of the time required to clear the 16-km(10-mile) zone (Parsons, Brinckerhoff, Quade, and Douglas, Inc., 1980, 1984).
From the first of these estimates (Parsons, et al., 1980), the staff has con-servatively estimated the effective evacuation speed to be 0.47 meter persecond (1.05 mph). (After the staff calculations were done, a later study(Parson, et al., 1984) indicated slightly shorter evacuation times. Use of aslightly higher evacuation speed would have reduced the calculated early conse-quences, but by a small amount compared to the uncertainty of the calculation.)
From these estimates, the staff has conservatively estimated the effectiveevacuation speed to be 0.47 meter per second (1.05 mph). It is realistic toexpect that the authorities would aid and encourage evacuation at distances fromthe site where exposures above the threshold for causing early fatalities couldbe reached regardless of the EPZ distance. The potential benefits of this werenot calculated, however. As an additional emergency measure for the NMP-2 site,it was also assumed that all people beyond the evacuation distance who would beexposed to the contaminated ground would be relocated after passage of theplume. A modification of the RSS consequence model was used, which incorporatesthe assumption that if the projected ground dose to the total marrow over a7-day period would exceed 200-rems, then this high dose rate would be detectedby actual field measurements following plume passage, and people from theseregions would be relocated immediately. For this situation the model limitsthe period of ground dose calculation to 12 hours; otherwise, the period ofground exposure is limited to 7 days for calculation of early dose.
Figure 1.1 shows the early fatalities for-a pessimistic case for which no earlyevacuation is assumed, and all persons are assumed to be exposed for the first24 hours following an accident and are then relocated. These results can becompared to the more realistic results shown in Figure 5.8.
The CRAC model has the same provision for calculation of the economic costassociated with implementation of evacuation as the original RSS model. Forthis purpose, the model assumes that for atmospheric releases of durations of3 hours or less, all people living within a circular area of 8-km (5-mile)radius centered at the reactor plus all people within a 450 angular sectorwithin the plume exposure pathway EPZ and centered on the downwind directionwill be evacuated and temporarily relocated. However, if the duration ofrelease were to exceed 3 hours, the cost of evacuation is based on the assump-tion that all people within the entire plume exposure pathway EPZ would beevacuated and temporarily relocated. For either of these situations, the costof evacuation and relocation is assumed to be $225 (1980 dollars) per person,which includes cost of food and temporary sheltering for a period of 1 week.
1.2 Early Health Effects Model
The medical advisors to the RSS (WASH-1400, Appendix IV, Section 9.2.2 andAppendix F) proposed three alternative dose-mortality relationships that can be
NMP-2 FES 3 Appendix I

used to estimate the number of early fatalities that might result in an exposedpopulation. These alternatives characterize different degrees of post-exposuremedical treatment from "minimal," to "supportive," to "herioc"; they are morefully described in NUREG-0340. There is uncertainty associated with the mortal-ity relationships (NUREG/CR-3185) and the availability and effectiveness ofdifferent classes of medical treatment (Elliot, 1982).
The calculative estimates of the early fatality risks presented in the text ofSection 5.9.4.5(3) of the main body of this report and in Section I.1 of thisappendix used the dose-mortality relationship that is based upon the supportivetreatment alternative. This implies the availability of medical care facilitiesand services that are designed for radiation victims, for those exposed inexcess of 170 rems, the approximate level above which the medical advisors tothe RSS recommended more than minimum medical care to reduce early fatalityrisks. At the extreme low probability end of the spectrum (i.e., at the onechance in 10 million per reactor-year level), the number of persons involvedmight exceed the capacity of facilities that provide the best such services, inwhich case the number of early fatalities might have been underestimated. Togain perspective on this element of uncertainty, the staff has also performedcalculations using the most pessimistic dose-mortality relationship based uponthe RSS medical expert's estimated dose-mortality relationship for minimalmedical treatment and using identical assumptions regarding early evacuation andearly relocation as made in Section 5.9.4.5(3). This shows an overall 2 to 3-fold increase in annual risk of early fatalities (see Table 5.12). The majorfraction of the increased risk of early fatality in the absence of supportivemedical treatment would occur within 16 km (10 miles), and virtually all wouldbe within 48 km (30 miles) of the NMP-2 site. However, the hospitals now in theU.S. are likely to be able to supply considerably better care to radiationvictims than the medical care on which the minimal medical treatment relation-ship is based. Further, a major reactor accident at NMP-2 would certainly causea mobilization of such medical services with a high national priority to savethe lives of radiation victims.. Therefore, the staff expects that the mortalityrisks would be less then those indicated by the RSS description of minimaltreatment (and much less, of course, for those who will be given the type oftreatment defined as "supportive"). For these reasons, the staff has concludedthat the early fatality risk estimates are bounded by the range of uncertaintiesdiscussed in Section 5.9.4.5(7).
1.3 References
Elliot, D. A., Andrulis Research Corp., Task 5 letter report on TechnicalAssistance Contract No. NRC-03-82-128, to A. Chu, NRC, December 13, 1982.
Parsons, Brinckerhoff, Quade, and Douglas, Inc., "Evacuation Time Estimates forAreas Near the Site of James A. FitzPatrick and Nine Mile Point Power Plants,"report prepared for Niagara Mohawk*Power Company, December 1980.
"Evacuation Travel Time Estimates for the James A. FitzPatrick/Nine MilePoint Emergency Planning Zone," report prepared for Niagara Mohawk PowerCorporation, May 1984.
Sandia Laboratories, "A Model of Public Evacuation for Atmospheric RadiologicalReleases," SAND 78-0092, June 1978.
NMP-2 FES 4 Appendix I

U.S. Nuclear Regulatory Commission, NUREG-75/014 (WASH-1400), "Reactor SafetyStudy," October 1975.
--- , NUREG-0340, "Overview of the Reactor Safety Study Consequences Model,"October 1977.
--- , NUREG/CR-3185, "Critical Review cf the Reactor Safety Study RadiologicalHealth Effects Model," March 1983.
NMP-2 FES 5 Appendix I

Distribution of early fat. - no evac. for 24 h-o
'1
ci-
;010-lE~
10 id 1 0 Ioe 10i 10 1.0 10,
A
X
C/)
0
n
i,
"-Qo
-Q.0..0m
-6
!0-7
10-9
10-.
105
1-6
10-
1-8
10-
10-1
id,~0
CD
0~
x
101 102 10 0 106X - Early Fatalities
Figure 1.1 Sensitivity of early fatalities to evacuation characteristics
NOTE: See Section 5.9.4.5(7) for a discussion of uncertainties.
J 10-10

APPENDIX J
FISHERY HARVEST ESTIMATES FORLAKE ONTARIO(NINE MILE POINT)
APRIL 30, 1984
Prepared for the NRC staff byRichard B. McLean, Ph.D.Oak Ridge National Laboratory
NMP-2 FES


APPENDIX J
FISH HARVEST ESTIMATES FOR LAKE ONTARIO
(Nine Mile Point)
Nine Mile Point Units 2 and 3 are on the south shore of Lake Ontario in theTown of Scriba, Oswego County, New York. The fisheries yield of Lake Ontariohas steadily and, at times, dramatically declined since white men came into theregion. The reasons for the decline are many, but can be primarily classifiedinto three categories: (1) lamprey introduction, (2) overfishing, and (3) chem-ical contamination. The synergistic stress that these factors produced hasresulted in extinction of species and a shift from dominance of salmonids, white-fish, chubs, deepwater sculpins, cisco, and lake sturgeon to yellow perch, whiteperch, eel, bullhead and carp.' The commercial fishery on the U.S. side of thelake is declining, and the sport fishery is centered on the smallmouth bass.On the Canadian side, the commercial fishery is also declining and the sportfishery is limited to the coastal zone. 2
Research Method
U.S. commercial fishing data for 1976-1980 have been reported by the NationalMarine Fisheries Service, 3 ' 4 and the average catch over these years has beenused in this analysis. Commercial data for the Canadian side of the lake arealso available for 1976-1980.5 Canadian sport harvest data are available, butfor the U.S. side, only numbers of fish caught in 1977 and an indirect referenceto a multimillion dollar recreational fishery' are available. Canadian data areavailable for the Napanee District (Figure 1), which represents about one-halfof Lake Ontario. However, the reported catch includes fish caught in LakeOntario as well as in warm water and cool water streams in the watershed. Thus,the total number of fish caught in the Napanee District is an overestimate ofthe Canadian recreational catch of Lake Ontario proper. Because the NapaneeDistrict represented about one-half of the Canadian side of Lake Ontario, therecreational catch data has been multiplied by a factor of 2 for a conservativeestimate of the Canadian sport catch.. This estimated catch also was used forthe U.S. catch.
Results
Commercial Fishery
Table I shows the Canadian landings of Lake Ontario fish for 1978-1980.The mean total landings were 982,310 kg (2,165,624 lbs). Table 2 showsthe species caught in U.S. waters during the same period. In 1976-1980,the average U.S. landings were 89,986 kg (198,386 lbs). In 1977 the catchwas highest at 93,760 kg (206,740 lbs), and it declined to 72,985 kg(160,733 ibs) by 1980. There were only one commercial vessel and 49 com-mercial fishermen in 1976.3
NMP-2 FES 1 Appendix J

Sport Fishing
Within the Napanee District, cool and warm water fisheries yielded123,300 kg (271,300 Ibs) of predominately pike and panfish. Thus, thetotal Canadian Lake Ontario sport fishery is estimated to be 123,300 kg x2 = 246,600 kg (543,660 lbs). The U.S. sport catch is assumed to be thesame.
Summary
U.S. Canada
kg lbs
Commercial 89,986 198,386Sport 246,600 543,660
Total 336,586 742,046
TOTAL U.S. and Canada 1,565,496 kg
References
1U.S. Great Lakes'Basin Commission, "ReporiStudy," Appendix 8, "Fish," Ann Arbor, Mi
2 Ministry of Natural Resources, "Napanee D
3 U.S. Department of Commerce, "Fishery StalStatistical Digest No. 70, Washington, DC
4National Marine Fisheries Service, "GenerSpecies, 1977-1980," U.S. Department of C
50ntario Commercial Fish Industry, "Statisiof Natural Resources, Ontario.
NMP-2 FES 2
kg lbs
982,310 kg 2,165,624246,600 kg 543,660
1,228,910 kg 2,709,283
(3,451,328 lbs)
L of the Great Lakes Basin Framework
:higan, 1975.
istrict, Land Use Guidelines," 1983.
tistics of the United States, 1976,"October 1980.
al Canvass Catch by Year, State, andommerce, Washington, DC.
tics on Landings, 1976-1980," Ministry
Appendix J

M
rn(--,m
QUEBEC
CarletonPlace
0
LAKE ONTARIO
LEGEND
H• Eastern region boundary
USA
CD
x
20 400660 mi.0 2'0 4'0 6.0 . ' km
E3 District boundary
1 1 Napanee District
Figure 1 Regional setting

MvM,
rn1Mr
Table 1 Canadian landings of Lake Ontario fish
1978 weight 1979 weight 1980 weightSpecies kg -lb kg lb kg lb
Bowfin 4,655 10,262 984 2,170 54 120Bullhead 163,924 361,390 163,786 361,087 166,889 367,927Carp 4,154 9,157 3,791 8,358Catfish 1,688 3,721 125 276 10,817 23,847Coho 296 652 754 1,662Crappie 6,256 13,793 6,832 15,063 8,270 18,233Eel 230,527 508,225 223,295 492,282 165,341 364,514Lake herring 5,515 12,159 13,494 29,749 5,311 11,709Lake trout 304 670 134 296 5 11Lake whitefish 2,120 4,674 1,299 2,863 4,133 9,111Northern-pike 11,645 25,673 18,893 41,653 20,015 44,126Rock bass 16,943 37,354 10,630 23,436 6,190 13,647Smelt 27,190 59,943 26,435 58-,279 22,402 49,387Sturgeon 1,803 3,975 12 27 369 813Sucker 4,385 9,668 8,361 18,432 4,919 10,844Sunfish 67,988 149,887 70,646 155,748 72,910 .160,738White bass 4,868 10,733 1,704 3,756 3,319 7,318White perch 227,443 501,427 46,530 102,580 55,395 122,124Yellow perch 320,,777 707,193 298,093 6517,182 267,582 589,918Yellow pickerel 7,347 16,197 23,919 52,732 57,387 .126,517Other 11,045 24,351 7,525 16,589 27,509 60,646
TOTAL 1,120,873 2,471,1-04 927,242 2,044,220 898,815 1,981,550
MEAN, ALL SPECIES, 1978, 1979, 1980 982,310 kg (2,165,624 lb)
Source: Ontario Commercial Fish Industry, "Statistics on Landings 1976-1980,"Ministry of Natural Resources, Ontario.
$-oVen0~-A.
xC-'

Table 2 Average U.S. commercial landingsof Lake Ontario fish, 1976-1980
Weight,
Species kg lb
Bullheads and catfish 15,207 33,526Carp 987 2,176Crappie 4,406 9,802Eels 20,813 45,884Rock bass 3,548 7,822Freshwater drum 166 367Smelt 9,119 20,104Suckers 1,125 2,481Sunfish 3,084 6,800White bass 68 150White perch 17,094 37,687Yellow perch 13,783 30,386Wal leye 545 1,201
TOTAL 89,986 19.8,386
Sources: U.S. Department of Commerce, "FisheryStatistics of the United States 1976,"1Statistical Digest No. 70. October 1980.,Washington, DC; National Marine FisheriesService, "General Canvass Catch by Year,State, and Species, 1977-1980," U.S.Department of Commerce, Washington, DC.
NMP- FESAppedix5NMP-2 FES Appendix J

Cf..

APPENDIX K
LETTER FROM NIAGARA MOHAWK POWER CORPORATIONON CURRENT FINANCIAL COMMITMENT FOR NINE MILE POINT
UNIT 2
NMP-2 FES Appendix K


NV NIAGARAUA MOHAWK
NIAGARA MOHAWK POWER CORPORATION/300 ERIE BOULEVARD WEST SYRACUSE. N.Y 13202/TELEPHONE (315) 474-15-
March 28, 1984(NMP2L. 0017)
Mr. Darrell G. EisenhutDivision of LicensingOffice of Nuclear Reactor RegulationU.S. Nuclear Regulatory ComnmissionWashington, DC 20005
Dear Mr. Eisenhut:
Subject: Nine Mile Point Unit 2Docket 50-410
This letter responds to an oral request by your Staff.
The owners and ownership of Nine Mile Point Unit 2 have not changed.However, as an interim measure, Niagara Mohawk Power Corporation is payingfor Long Island Lighting Company's current financial commitment for thecost of Nine Mile Point Unit 2. We will keep you apprised of any changein contract status through license amendments if such contract changesoccur.
Sincerely,
C. V. Mangan 5
Vice PresidentNuclear Engineering .& Licensing
CVM/ca
NMP-2 FES 1 Appendix K


APPENDIX L
LETTER FROM STATE OF NEW YORK DEPARTMENTOF STATE CERTIFYING COMPLIANCE WITH THE
STATE COASTAL MANAGEMENT PROGRAM
NMP-2 FES Appendix L


STATE OF NEW YORKDEPARTMENT OF STATE
ALBANY. N.Y. 12231GAIL S. SHAFFER
SECRETARY OF STATE
January 30, 1985
Mr. Joseph MiakiazNiagara Mohawk Power CorporationEnvironmental Affairs Department300 Erie Boulevard WestSyracuse, New York 13202
RE: F-84-440Operating License for Niagara Mohawk PowerCorporation/Nine Mile Point Unit 2Docket No. 50-410
Dear Mr. Miakiaz:
The Department of State has completed its evaluation of your Federal Con-sistency Assessment Form and certification that the above proposed permitactivity complies with New York State's approved Coastal Management Program,and willbe_ conducted in a manner consistent with this program.
Pursuant to 15 CFR Section 930.63, and based upon the project informationsubmitted, the Department of State concurs with your consistency certification.This concurrence fs without~prýejudice to, and does not obviate the need to obtainall other applicable licenses, permits, and approvals required under existingState statutes.
The U.S. Nuclear Regulatory Commission is being notified of this decisionby copy of this letter.
Though we were able to reach our decision based on the information containedin various sections of the Environmental Report and DES, we are offering commentspertaining to your "Assessment of Nine Mile Point Nuclear Station Unit 2 withNew York State Coastal Policies." The following comments should enable you toimprove this section for the FES.
1. Several policies were not included that directly relate to the operationand siting of major electricity generating facilities. The following should beincorporated in an updated policy assessment, should it be prepared. For yourconvenience, we are providing the references to the enclosed list of State coastalpolicies.
Policy 2, "Facilitate the siting of water dependent uses and facilitieson or adjacent to coastal waters," and in particular, item 7 under the listingof water dependent uses (page 3) apply to the evaluation of Unit 2.
NMP-2 FES 1 Appendix L

-2-
Policy 5, "Encourage the location of development in areas where publicservices and facilities essential to such development are adequate," appliesin two ways. First, impacts on municipal water supplies should be addressedhere even though they appear to be negligible. Second, the requirement to locatefacilities in areas of concentrated development does not apply to certain uses.Under the list of excepted uses, item 6 (page 10) qualifies Unit 2 as an exception.
Policy 11, "Buildings and other structures will be sited in the coastalareas so as to minimize damage to property and the endangering of human livescaused by flooding and erosion," should also be referenced since substantialefforts have been made to have buildings elevated above the flood plain andprotected from wave energy during storms.
2. With respect to policies that were included in your assessment, we havethe following suggestions:
Policy 9 -- Given the topography, security requirements and safetypolicies, we agree that the site is not appropriate for water-dependent accessdevelopment. Facilities within a ten mile range of Unit 2, however, do notadequately satisfy existing demand for public access. We suggest that you de-lete the statement that demand is adequately met, and alter your conclusion toreflect that the access limitations at Unit 2 would: (1).probably exist withoutthe project due to topography; and (2) be unavoidable due to operating constraints.
Policy 25-- Although the overall visual character of the area may notbe significantly impacted, further explanation of existing visual features andtheir visual interaction with Unit 2 would be beneficial. An assessment of thispolicy should include a brief inventory of the natural and man-made visual re-sources which contribute to the area's scenic quality. Such an inventory wouldinclude the adjacent power facilities and.natural physiography. The discussicnshould then demonstrate how these inventoried visual resources are protected,restored or enhanced.
Another aspect of scenic quality has been overlooked. The planned land-scaping and revegetation will, in part, mitigate visual impacts at industrialsites in general.
Policy 36 -- Unirradiated nuclear fuel is also a hazardous material thatmust be prevented from entering coastal waters. The methods ensuring transpor-tation and storage safety should be referenced here. Further, a demonstratedability to meet restitution requirements in the event of hazardous waste releasesto coastal waters needs to be presented here.
Policy 37 -- The assessment should address the stormwater drainagesystem design. As a technical recommendation, We suggest including a simpleform of mitigation to reduce potential water quality-related effects of storm-water runoff.
To reiterate, we are providing these comments to improve the submitted con-sistency assessment. We suggest that you incorporate these comments in an updatedassessment. Should you elect to do so, please provide this Department with acopy.. You may also want to have the assessment incorporated in the NuclearRegulatory Commission's Final Environmental Statement.
NMP-2 FES2 2 Appendix I.

3-
Should you have any questions, please don't hesitate to call me at (518)474-3643.
I
Si ncerely, II
Georgq R. StaffordCoastal Programs Administrator
GRS:TH:jscc: U.S. Nuclear Regulatory Commission
NMP-2 FES 3 Appendix L


NRC FORM 335(7-771
I. REPORT NUMBER (Assigned by ODC)
NUREG-1085 FESU.S. NUCLEAR REGULATORY COMMISSION
BIBLIOGRAPHIC DATA SHEET4. TITLE AND SUBTITLE (Add Volume No., if awpnrie) 2. (Le.ve blank)
Final Environmental Statement related to the operation ofNine Mile Point Nuclear Station, Unit No. 2 3. RECIPIENT'S ACCESSION NO.
7. AUTHOR IS) 5. DATE REPORT COMPLETEDMONTH I YEAR
April 19859. PERFORMING ORGANIZATION NAME AND MAILING ADDRESS (Include Zip Code/ DATE REPORT ISSUED
Division of Licensing MONTH YEAR
Office of Nuclear'Reactor Regulation May 1985
U.S. Nuclear Regulatory Commission 6. (Leave blank)
Washington, D. C. 20555 S. (Leave blank)
12. SPONSORING ORGANIZATION NAME AND MAILING ADDRESS (Include Zip Code) 10. PROJECT/TASK/WORK UNIT NO.
Same as 9 above 11. CONTRACT NO.
13. TYPE OF REPORT PERIOD COVERED (Inclusive dates)
Final Environmental Statement
15. SUPPLEMENTARY NOTES V4. (Leave blank)Pertains to Docket No. 50-410
16. ABSTRACT r200 words or less)
This Final Environmental Statement contains the assessment of the environmental impactassociated with the operation of the Nine Mile Point Nuclear Station, Unit 2, pursuant tothe National Environmental Policy Act of 1969 (NEPA) and Title 10 of the Code of FederalRegulations, Part 51, as amended, of the Nuclear Regulatory Commission regulations. Thisstatement examines the environment, environmental consequences and mitigating actions,and environmental and economic benefits and costs.
17. KEY WORDS AND DOCUMENT ANALYSIS 17a. DESCRIPTORS
1 7b. IDENTIFIERS/OPEN-ENDED TERMS
I -- .... ~- , I.,. .,r. rrtnrrc18. AVAILABILITY STATEMENT
Unlimited
I, SE URIITY.CLAPS 1'his reportl z 1-ur Vruncfassifiee
28.•SECLg1S.] • tThii page) 22. PRICES
NRC FORM 335 (7.77)


UNITED STATESNUCLEAR REGULATORY COMMISSION; POSTAGE b FEES PAID
USNRCWASHINGTON, D.C. 20555 WASH. D.C.
PERMIT No. -67
OFFICIAL BUSINESSPENALTY FOR PRIVATE USE, $300