final energy audit report - amazon s3final...2010/06/02 · executive summary a es-3 table es-21...
TRANSCRIPT
A
Final Energy Audit Report
Borough of Westwood June 2010

A i
Contents
Executive Summary
Section 1 Introduction 1.1 General ....................................................................................................................... 1-1 1.2 Background ............................................................................................................... 1-1 1.3 Purpose and Scope ................................................................................................... 1-2
Section 2 Facility Description 2.1 Borough Hall ............................................................................................................. 2-1 2.1.1 Description of Building Envelope ........................................................... 2-1 2.1.2 Description of Building HVAC ............................................................... 2-1 2.1.3 Description of Building Lighting ............................................................ 2-2 2.2 Public Library ............................................................................................................ 2-2 2.2.1 Description of Building Envelope ........................................................... 2-2 2.2.2 Description of Building HVAC ............................................................... 2-2 2.2.3 Description of Building Lighting ............................................................ 2-3 2.3 DPW Main Building ................................................................................................. 2-3 2.3.1 Description of Building Envelope ........................................................... 2-3 2.3.2 Description of Building HVAC ............................................................... 2-4 2.3.3 Description of Building Lighting ............................................................ 2-4 2.4 DPW Garage .............................................................................................................. 2-4 2.4.1 Description of Building Envelope ........................................................... 2-4 2.4.2 Description of Building HVAC ............................................................... 2-4 2.4.3 Description of Building Lighting ............................................................ 2-4 2.5 Fire Department ........................................................................................................ 2-5 2.5.1 Description of Building Envelope ........................................................... 2-5 2.5.2 Description of Building HVAC ............................................................... 2-5 2.5.3 Description of Building Lighting ............................................................ 2-5
Section 3 Baseline Energy Use 3.1 Utility Data Analysis ................................................................................................ 3-1
3.1.1 Electrical Charges ...................................................................................... 3-1 3.1.2 Natural Fuel Charges ................................................................................ 3-2
3.2 Facility Results .......................................................................................................... 3-2 3.2.1 Borough Hall .............................................................................................. 3-2 3.2.2 Public Library ............................................................................................. 3-4 3.2.3 DPW Main Building .................................................................................. 3-5 3.2.4 DPW Garage ............................................................................................... 3-7 3.2.5 Fire Department ......................................................................................... 3-9 3.3 Aggregate Costs ...................................................................................................... 3-11 3.4 Portfolio Manager ................................................................................................... 3-12

Table of Contents Borough of Westwood
Final Energy Audit Report
A ii
3.4.1 Portfolio Manager Overview ................................................................. 3-12 3.4.2 Energy Performance Rating ................................................................... 3-12 3.4.3 Portfolio Manager Account Information.............................................. 3-13
Section 4 Energy Conservation and Retrofit Measures (ECRM) 4.1 Building Lighting Systems ...................................................................................... 4-2
4.1.1 Borough Hall .............................................................................................. 4-2 4.1.2 Public Library ............................................................................................. 4-4 4.1.3 DPW Main Building .................................................................................. 4-5 4.1.4 DPW Garage ............................................................................................... 4-6 4.1.5 Fire Department ......................................................................................... 4-8
4.2 HVAC Systems ......................................................................................................... 4-9 4.2.1 Borough Hall .............................................................................................. 4-9 4.2.2 Public Library ........................................................................................... 4-16 4.2.3 DPW Main Building ................................................................................ 4-21 4.2.4 DPW Garage ............................................................................................. 4-23 4.2.5 Fire Department ....................................................................................... 4-26
4.3 Additional Alternative Energy Sources .............................................................. 4-28 4.3.1 Photovoltaic Solar Energy System Overview ...................................... 4-28 4.3.1.1Borough Hall ................................................................................. 4-29 4.3.1.2 Public Library ............................................................................... 4-30 4.3.1.3 DPW Main Building .................................................................... 4-30 4.3.1.4 DPW Garage ................................................................................. 4-31 4.3.1.5 Fire Department ........................................................................... 4-31 4.3.1.6 Basis for Design and Calculations ............................................. 4-32 4.3.2 Geothermal Energy ................................................................................. 4-34 4.3.3 On-Site Wind Power Generation ........................................................... 4-37 4.3.4 Hydro-Electric Energy ............................................................................ 4-40
4.4 Additional Measures .............................................................................................. 4-40 4.4.1 Water Systems .......................................................................................... 4-41
Section 5 Evaluation of Energy Purchasing and Procurement Strategies 5.1 Energy Deregulation ................................................................................................ 5-1 5.1.1 Alternate Third Party Electrical Energy Supplier ................................. 5-1 5.2 Demand Response Program .................................................................................... 5-2
Section 6 Ranking of Energy Conservation and Retrofit Measures (ECRMs) 6.1. ECRMs ...................................................................................................................... 6-1 6.1.1 Lighting Systems ....................................................................................... 6-1 6.1.2 HVAC Systems .......................................................................................... 6-2 6.1.3 Alternative Energy Systems ..................................................................... 6-2 6.1.4 Wind Energy .............................................................................................. 6-3

Table of Contents Borough of Westwood
Final Energy Audit Report
A iii
Section 7 Grants, Incentives and Funding Sources 7.1 Renewable Energy ..................................................................................................... 7-1 7.1.1 Renewable Energy Certificates (NJ BPU) ............................................... 7-1 7.1.2 Clean Energy Solutions Capital Investment Loan/ Grant (NJ EDA) .......................................................................................... 7-1 7.1.3 Renewable Energy Incentive Program (NJ BPU) .................................. 7-1 7.1.4 Grid Connected Renewables Program (NJ BPU) .................................. 7-1 7.1.5 Utility Financing Programs ...................................................................... 7-2 7.1.6 Renewable Energy Manufacturing Incentive (NJ BPU) ....................... 7-2 7.1.7 PSE&G Solar Loan Program .................................................................... 7-2 7.1.8 Environmental Infrastructure Financing Program ............................... 7-2 7.1.9 Clean Renewable Energy Bonds (IRS) .................................................... 7-2 7.1.10 Qualified Energy Conservation Bonds (IRS) ......................................... 7-3 7.1.11 Global Climate Change Mitigation Incentive Fund (US EDA) ........... 7-3 7.1.12 Private Tax-Exempt Financing ................................................................ 7-4 7.2 Energy Efficiency ....................................................................................................... 7-4 7.2.1 Introduction ............................................................................................... 7-4 7.2.2 New Jersey Smart Start Buildings Program (NJ BPU) ......................... 7-4 7.2.3 Pay for Performance Program (NJ BPU) ................................................ 7-5 7.2.4 Direct Install (NJ BPU) .............................................................................. 7-5 7.2.5 Anemometer Loan Program .................................................................... 7-5 Appendix A Historical Data Analysis Appendix B Statement of Energy Performance Summary Sheets Appendix C eQuest Model Results Appendix D Lighting Spreadsheet Appendix E Solar Energy Financing Worksheet Appendix F New Jersey Smart Start Incentive Worksheets Appendix G Facility Data Forms Appendix H Engineers Opinion of Probable Construction Costs Appendix I ECRM Financial Analysis Appendix J Wind Cad Modeling Appendix K Wind Energy Financing Worksheet Appendix L Glacial Energy – Alternative Electric Supplier Quote Appendix M Water Fixture Inventory
A ES-1
Executive Summary As part of an initiative to reduce energy cost and consumption, the Borough of Westwood has secured the services of Camp Dresser and McKee (CDM) to perform an energy audit for four (4) facilities which are owned and operated by the Borough in an effort to develop comprehensive Energy Conservation and Retrofit Measures (ECRMs). It should be noted that the DPW Garage facility included two separate buildings. The audit therefore included a total of five (5) buildings.
CDM’s energy audit team visited the facilities February 3, 2010. As a result of the site visit and evaluation of the historical energy usage of the facilities, CDM was successful in identifying opportunities for energy savings measures.
CDM has also evaluated the potential for renewable energy technologies to be implemented at the Borough’s facilities to offset the electrical energy usage. Specifically, the use of solar electric photovoltaic panels, ground source heat pumps and wind turbines were investigated.
Potential energy cost savings may be available for the Borough through the use of a third party electric or gas supplier. Additionally, there is potential for the Borough to make money by participation in a Demand Response Program, as discussed in Section 5.2.
Not all ECRMs identified as a result of the energy audit are recommended. ECRMs must be economically feasible to be recommended to the Borough for implementation. The feasibility of each ECRM was measured through a simple payback analysis. The simple payback period was determined after establishing Engineer’s Opinion of Probable Construction Cost estimates, O&M estimates, projected annual energy savings estimates, and the potential value of New Jersey Clean Energy rebates, or Renewable Energy Credits, if applicable. ECRMs with a payback period of 20 years or less can be recommended.
Historical Energy Usage The following table, Table ES-1, summarizes the historical energy usage at each of the Borough’s facilities as presented in Section 3. The data in Table ES-1 has been taken from the facility data forms, provided by the Borough. These values can serve as a bench-marking tool, along with the building profiles that have been established through the EPA’s Portfolio Manager Program, to quantify the reduction in electrical energy and natural gas usage following the implementation of the recommended ECRMs.

Executive Summary
A ES-2
Table ES-1: Summary of Annual Energy Usage & Cost
Electrical Energy
Use (kWH)
Peak Summer Demand
(kW)
Peak Winter
Demand (kW)
Fuel Use for Entire Building (therms)
Cost for Electric Service
Cost for Fuel
Borough Hall 357,920 128 56 9,561 $55,739 $12,325
Public Library 126,090 61.8 37.5 5,474 $23,432 $6,284
DPW Main Building 75,768 13.7 23.2 4,655 $11,064 $6,077
DPW Garage 16,601 4.1 9.7 2,069 $2,667 $2,733
Fire Department 129,900 52.4 38.0 5,212 $19,972 $7,104
Recommended ECRMs The following Table ES-2 presents the ranking of recommended ECRMs identified for the building lighting and HVAC systems based on the simple payback analysis.
Additional ECRMs associated with the building envelope and other miscellaneous appliances were identified and evaluated, as discussed in Sections 2 and 4; however, were not recommended due to longer payback periods. This table includes the Engineer’s Opinion of Probable Construction Cost, projected annual energy cost savings, projected annual energy usage savings, and total simple payback period for each recommended ECRM. The ECRMs are ranked based on payback period.
Table ES-21 Ranking of Energy Savings Measures Summary
Overall Ranking
(Based on Simple
Payback) ECRM Total Cost Energy Savings
Annual Fiscal
Savings2
Simple Payback (Years)
1 Public Library Lighting Upgrades $30,271 54,784 kWh $5,336 5.7
2 DPW Main Building Lighting Upgrades $17,637 24,436 kWh $2,813 6.3
3 Borough Hall Direct Digital Control BMS $25,685 975 Therms
8,452 kWh $2,737 9.4
4 Borough Hall Lighting Upgrades $88,962 15,623 kWh $9,456 9.4
5 DPW Garage Lighting Upgrades $4,355 1,678 kWh $431 10.1

Executive Summary
A ES-3
Table ES-21 Ranking of Energy Savings Measures Summary
Overall Ranking
(Based on Simple
Payback) ECRM Total Cost Energy Savings
Annual Fiscal
Savings2
Simple Payback (Years)
6 Public Library Boiler Upgrade $30,570 1,100 Therms $2,853 10.7
7 Fire Department Lighting Upgrades $19,774 10,770 kWh $1,767 11.2
8 Borough Hall Boiler Upgrade $65,628 2,608 Therms $5,464 12.0
9 Public Library Direct Digital Control BMS $13,800 296 Therms
2,503 kWh $826 16.7
1. Engineers Probable Construction Cost takes into account any applicable rebates. 2. Annual Fiscal Savings takes into account additional O&M cost or savings associated
with the measure.
Renewable Energy Technologies Solar Energy Section 4 of the report provides for an economic evaluation of a solar energy system recommended to be installed at several of the Borough’s facilities. The evaluation covered the economic feasibility of the Borough installing a solar energy system under a typical construction contract and to assume full responsibility of the operation of such a system.
Based on a simple payback model, summarized in Table ES-3, it would benefit the Borough to further investigate the installation of a solar energy system at three (3) buildings. This is primarily based on the initial upfront capital investment required for a solar energy system installation and the 14.8 year payback period. This payback period may justify installing the solar energy system. Other options such as Power Purchase Agreements are potentially available as well to help finance the project. Solar technology is constantly changing and will most likely continue to lower in price.
Two major factors influencing the project financial evaluation is the variance of the prevailing energy market conditions and Solar Renewable Energy Credit (SREC) rates, with the largest impact to the payback model being the SREC credit pricing. For the payback model, conservative estimates of the SREC’s market value over a 25 year period were assumed, as discussed in Section 4.
Table ES-3 includes a simple payback analysis for the installation of a solar energy system at the identified Borough buildings.

Executive Summary
A ES-4
Table ES-3: Simple Payback Analysis for Solar Energy Systems
Parameter
Solar
Estimated Budgetary Project Cost $1,568,850
1st Year Production 127,525 kWh
Annual Electric Savings $19,654.8
Annual Estimated SREC Revenue $86,080
Project Simple Payback 14.8
Wind Power Generation Section 4.3.2 of the report provides for an economic evaluation of a wind turbine energy system recommended to be installed DPW grounds. The evaluation covered the economic feasibility of furnishing and installing a wind turbine energy system under a typical construction contract and to assume full responsibility of the operation of such a system.
CDM completed a preliminary desktop wind power production analysis and has concluded that an additional on-site feasibility study is warranted and recommended. Such a feasibility study would include the installation of a wind test rig to measure actual wind conditions as observed on-site.
Wind power as a renewable energy source also qualifies for Renewable Energy Certificates (REC’s). The prevailing energy market, Renewable Energy Incentive Program (REIP) and REC’s comprise the major factors influencing a wind turbine energy system installation. Other options, such as government bonds or a Power Purchase Agreement are potentially available and can assist with the financing of this project.
Table ES-4 includes a typical simple payback analysis for the installation of a wind turbine energy system located in the Borough. Refer to Appendix K for a more detailed wind energy financing spreadsheet.

Executive Summary
A ES-5
Table ES-4: Ranking of Energy Savings Measures Summary – Wind Turbine Energy System
Parameter Wind Turbine (Minimum Site
Wind Speed – 8.5 mph)
Wind Turbine (Maximum Site
Wind Speed – 12.4 mph)
Wind Turbine (Average Site Wind Speed –
10.6 mph)
Engineer’s Opinion of Probable Cost
$68,489.69 $68,489.69 $68,489.69
Renewable Energy Incentive Program **
-$18,256 -$51,297 -$34,083
Total Cost $50,233.69 $17,192.69 $34,406.69
1st Year Production 5,705 kWh 16,194 kWh 10,651 kWh
Annual Estimated Electric Savings $846.10 $2,401.60 $1,579.5
Annual Estimated REC Revenue $143.00 $405.00 $266
Project Simple Payback 50.8 Years 6.1 Years 18.6 Years
** REIP incentive is calculated for only the first year and is applied as a deduction.
Recommended ECRMs Table ES-5 summarizes the Total Engineer’s Opinion of Probable Construction Cost, annual energy savings, projected annual energy and O&M cost savings and the payback period based on the implementation of all of the above recommended ECRMs.
Table ES-5: Recommended ECRM’s1
Total Engineer’s Opinion of Probable Construction Cost
Projected Annual Energy Savings (kWH or therms)
Projected Annual Fiscal Savings
Simple Payback Period (years)
$296,682 4,979 Therms 118,246 kWh $31,683 9.4
1. Does not include energy savings associated with Solar Energy System or Wind Power Generation.

A 1-1
Section 1 Introduction 1.1 General As part of an initiative to reduce energy cost and consumption, the Borough of Westwood, NJ has secured the services of Camp Dresser and McKee (CDM) to perform an energy audit at four (4) facilities in an effort to develop comprehensive energy conservation initiatives.
The performance of an Energy Audit requires a coordinated phased approach to identify, evaluate and recommend energy conservation and retrofit measures (ECRM). The various phases conducted under this Energy Audit included the following:
Gather preliminary data on all facilities;
Facility inspection;
Identify and evaluate potential ECRMs and evaluate renewable/distributed energy measures;
Develop the energy audit report.
Figure 1-1 is a schematic representation of the phases utilized by CDM to prepare the Energy Audit Report.
Figure 1-1: Energy Audit Phases
1.2 Background The facilities that were included in the energy audit for the Borough of Westwood were the Borough Hall, Public Library, DPW Garage, and Fire Department.
Gather Preliminary Facility Data
Energy Bills Facility Description Operating Hours Equipment Inventory
Facility Inspections
Lighting Systems Building Envelope HVAC Systems Electrical Supply
System Domestic Hot
Water Systems
Evaluate Renewable/ Distributed Energy
Measures
Identify and Evaluate ECRMs Energy
Audit Report

Section 1 Introduction
A 1-2
The Borough Hall was constructed in 1994 and is approximately 29,780 square feet. It is normally occupied during typical business hours (8 AM – 5 PM) Monday through Friday by approximately 26 employees. Additionally, the police station dispatch room is occupied by at least one employee 24 hours a day, seven days per week. The police station has 26 additional employees, divided into four squads which work in 12 hour shifts.
The Public Library was originally constructed in 1939, remodeled in 1994, and is approximately 16,000 square feet. The Library is open Monday, Tuesday and Thursday from 10 AM to 9 PM; Wednesday and Friday from 10 AM to 5 PM; Saturday from 10 AM to 4 PM ; and Sunday from 1 PM to 5 PM. There are 7 employees in this building.
The DPW facility main building was constructed in 1922 and the garage was added in 1996. Together, the buildings total approximately 14,100 square feet. The buildings are primarily occupied Monday through Friday during normal business hours. There are 11 DPW employees, but only a few of them are occupying the DPW buildings at any given time, as the majority of their workload is in the field.
The Fire Department was constructed in 2004 and is 14,552 square feet. There is one full time employee who sporadically occupies the building between inspections during normal business hours, Monday through Friday.
1.3 Purpose and Scope The objective of the energy audit is to identify energy conservation and retrofit measures to reduce energy usage and to develop an economic basis to financially validate the planning and implementation of identified energy conservation and retrofit measures.
Significant energy savings may be available with retrofits to the heating and cooling systems and lighting systems. It should be noted that the magnitude of energy savings available is not only dependent on the type of heating, lighting or insulation systems in use, but also on the age and condition of the equipment and the capital available to implement major changes. Due to the rising cost of power and the desire to minimize dependence on foreign oil supplies, energy consumption is taking a higher priority across the nation and feasible alternatives for reducing energy consumption and operating costs must be evaluated on a case-by-case basis.
The purpose of this energy audit is to identify the various critical building comfort systems that are major consumers of electrical energy and are clear candidates for energy savings measures. In addition, potential energy producing systems such as solar electric, ground source heat pumps, and wind energy systems were also evaluated. A discussion on these technologies is included in Section 4 Energy Conservation and Retrofit Measures (ECRM).

Section 1 Introduction
A 1-3
In addition to identifying ECRMs and the potential for on-site energy generation, there is potential for further energy cost savings through the use of a third party energy supplier and participation in a Demand Response Program. This is discussed further in Section 5.

A 2-1
Section 2 Facility Description 2.1 Borough Hall 2.1.1 Description of Building Envelope The energy audit included an evaluation of the building’s envelope (exterior shell) to determine the components’ effective R-values to be utilized in the building model and to locate and fix any thermal weaknesses that may be present. The components of a building envelope include the exterior walls, foundation and roof. The construction and material, age and general condition of these components, including exterior windows and doors, impact the building’s energy use.
The exterior walls of the Borough Hall are of concrete masonry unit (CMU) construction with a brick exterior and wooden stud interior with a dry wall finish. The existing roof is pitched with a wooden truss frame, plywood sheathing and asphalt shingles. The roof is insulated with fiberglass batting and appears to be in good shape.
At the center of the roof, there is a large cupola which showed signs of significant leakage around the edge. CDM strongly recommends resealing around this cupola to avoid further water damage to the surrounding structure, and minimize infiltration and consequent heat loss.
Also of concern is the existing fire sprinkler system. It was noted by personnel that there have been several pipe bursts within the small closet dormers on the upstairs level. Insulating and heat tracing the fire sprinkler pipe system, especially runs that are in close proximity to the exterior walls, is strongly recommended. This will reduce the chances of future pipe bursts, avoiding costly potential water damage.
The windows throughout the building were found to be double pane, and in good condition.
Overall it was determined that the building envelope is in good condition and is currently providing a high level of insulation. While some minor changes are strongly recommended, modifications to the insulation system would not prove to be cost-effective, from an energy savings stand-point.
2.1.2 Description of Building HVAC Heating in the Borough Hall is primarily provided by a hot water system. A gas-fired Slant Fin cast iron hot water boiler with an input-rated capacity of 900 MBH (1 MBH = 1,000 BTU/Hr) generates hot water which is then distributed to air handling units, providing warm air to the individual occupied spaces.
Cooling is provided to the entire building through the use of air cooled condensing units. Several of these units are located outside around the perimeter of the building,

Section 2 Facility Description
2-2
and interact with the indoor air handling units to reject heat from the individual occupied spaces.
CDM noted no central building management system controlling HVAC equipment.
2.1.3 Description of Building Lighting The Borough Hall existing interior lighting system consists of 1X2 (1 and 2 lamp), 2X2 (2 and 3 lamp), 1X4 (1, 2, and 3 lamp), 2X4 (2, 3, and 4 lamp) T8 and T12 linear fluorescent fixtures with magnetic ballasts, compact fluorescent, incandescent, and high intensity discharge (HID) fixtures. The building has occupancy controls in various rooms. Existing exterior lighting consists of HID wall packs, canopy fixtures, compact fluorescent fixtures, and HID parking lot and sidewalk fixtures. Refer to Section 4 for a more detailed description.
2.2 Public Library 2.2.1 Description of Building Envelope The exterior walls of the Public Library are of CMU construction with a brick exterior and wooden stud interior with a dry wall finish. The existing roof is pitched with a wooden truss frame, plywood sheathing and asphalt shingles. The roof is insulated with fiberglass batting and appears to be in good shape.
Significant cracking was noted at the bottom of the large bay window in the front of the building. CDM recommends caulking cracks such as this to reduce unnecessary infiltration and resulting heat loss within the building.
The majority of the windows throughout the building were found to be double pane, and in good condition.
Overall it was determined that the building envelope is in good condition and is currently providing a high level of insulation. While some minor changes are strongly recommended, modifications to the insulation system would not prove to be cost effective, from an energy savings stand-point.
2.2.2 Description of Building HVAC Heating in the Library is primarily provided by a hot water system. A gas-fired HB Smith cast iron steam boiler generates 710 lbs/hr of steam which then interacts with a steam-to-hot water heat exchanger to provide space heating for the building. The hot water is delivered to hot water coils found in air handling units in the attic and basement mechanical room. At one time, heat was entirely provided by steam to radiators throughout the building. As the steam system was taken offline in favor of a

Section 2 Facility Description
2-3
Example of an Outdoor AC Cover
hot water system, areas that were heated solely by steam radiators, such as stairwells, are now unheated. Heat is supplemented in drafty or chilly spots, such as the main entrance foyer and front reading area by electric resistance heat, in the form of baseboards and fan coils.
The air handling units in the attic and basement interact with roof-mounted air cooled condensing units to provide cooling to all main occupied areas of the building.
HVAC units in this building are currently controlled by an outside company. Library personnel are interested in implementing a building management system which is controlled in-house.
2.2.3 Description of Building Lighting The Public Library existing interior lighting system consists of 1X4 (1 and 2 lamp), 2X4 (2, 3, and 4 lamp) T8 and T12 linear fluorescent fixtures with electronic and magnetic ballasts, compact fluorescent, and incandescent fixtures. Existing exterior lighting consists of compact fluorescent, halogen incandescent, and HID parking lot fixtures. Refer to Section 4 for a more detailed description.
2.3 DPW Main Building 2.3.1 Description of Building Envelope The exterior walls of the DPW main building are of CMU construction. The existing roof is part pitched and part flat with a wooden truss frame, plywood sheathing and asphalt shingles. The roof is insulated with fiberglass batting and appears to be in good shape.
CDM noted a hole in the wall of the building that was found in a storage room in the upstairs attic area of the building. Covering or repairing this wall is strongly recommended as it will reduce unnecessary infiltration and resulting heat loss within the building.
There were a few window air conditioning units in place at the time of the audit. It is recommended that the air conditioning sleeves be checked for a tight seal and as the units are left in place through winter that AC covers be purchased and installed. An outdoor AC cover, covers the top and sides of the unit to stop drafts. Window and though-wall AC covers are UV resistant, water repellent PVC vinyl with elasticized corners and straps for a tight fit. Outdoor or indoor AC covers can also be customized. A standard outdoor AC cover can cost around $15. The impact of the

Section 2 Facility Description
2-4
overall building heating load will be minimal; however, there will be a direct impact on the occupants’ comfort.
Overall it was determined that the building envelope is in good condition and is currently providing a high level of insulation. While some minor changes are strongly recommended, modifications to the insulation system would not prove to be cost effective, from an energy savings stand-point.
2.3.2 Description of Building HVAC Heating in the main building is primarily provided by gas-fired unit heaters. Four ceiling-mounted Reznor units were found in or near the four corners of the building. In the upstairs office area, heating is provided by electric baseboard units.
Cooling is provided in office and break areas by window air conditioning units.
2.3.3 Description of Building Lighting The DPW Main Building existing interior lighting system consists of 1X4 (1 and 2 lamp), 1X8 (2 and 4 lamp), 2X4 (4 lamp) T8 and T12 linear fluorescent fixtures with electronic and magnetic ballasts, circular fluorescent, and a metal halide fixture. Existing exterior lighting consists of halogen incandescent, HID wallpacks, and HID parking lot fixtures. Refer to Section 4 for a more detailed description.
2.4 DPW Garage 2.4.1 Description of Building Envelope The exterior walls of the DPW garage consist of metal cladding with an insulated, finished interior. The existing roof is pitched with a wooden truss frame, plywood sheathing and asphalt shingles. The roof is insulated with fiberglass batting and appears to be in good shape.
Overall it was determined that the building envelope is in good condition and is currently providing a high level of insulation. Modifications to the insulation system would not prove to be cost effective, from an energy savings stand-point.
2.4.2 Description of Building HVAC Heating in the garage building is entirely provided by ceiling-mounted gas-fired radiant tube heaters. Five Roberts Gordon heaters were located throughout the garage.
No cooling was noted in this building.
2.4.3 Description of Building Lighting The DPW Main Building existing interior lighting system consists of 1X8 (2 lamp) T12 linear fluorescent fixtures with magnetic ballasts, and incandescent fixtures. Lighting visibility within the garage area is significantly low and is later addressed in Section 4

Section 2 Facility Description
2-5
of this report. Existing exterior lighting consists of halogen incandescent fixtures, and HID wallpacks. Refer to Section 4 for a more detailed description.
2.5 Fire Department 2.5.1 Description of Building Envelope The exterior walls of the Fire Department are of CMU construction with a brick exterior. The existing roof consists mainly of a flat steel roof deck with a steel frame. The roof is insulated with fiberglass batting and appears to be in good shape.
The windows throughout the building were found to be double pane, and in good condition. The overhead doors are insulated and also appear to be in good condition.
Overall it was determined that the building envelope is in good condition and is currently providing a high level of insulation. Modifications to the insulation system would not prove to be cost effective, from an energy savings stand-point.
2.5.2 Description of Building HVAC The large truck bay in the Fire Department building is heated by gas-fired Re-Verber -Ray radiant tube heaters. The remaining occupied areas of the building are heated by York gas-fired rooftop air conditioning units.
The York rooftop units are packaged with direct expansion (DX) cooling coils and condensers to provide cooling to the occupied areas of the building. No cooling was noted in the truck bay area.
Seven-day programmable thermostats were noted in the occupied spaces of the building.
2.5.3 Description of Building Lighting The Fire Department existing interior lighting system consists of 2X2 (3 lamp), 1X4 (1 and 2 lamp), 2X4 (3 lamp) T8 linear fluorescent fixtures with electronic ballasts, compact fluorescent, halogen incandescent, and high intensity discharge (HID) fixtures. An extensive quantity of occupancy controls is also present in the building. Existing exterior lighting consists of HID wall packs, canopy fixtures, and HID parking lot and garage fixtures. Refer to Section 4 for a more detailed description.
A 3-1
Section 3 Baseline Energy Use 3.1 Utility Data Analysis The first step in the energy audit process is the compilation and quantification of the facility’s current and historical energy usage and associated utility costs. It is important to establish the existing patterns of electricity, gas, and oil usage in order to be able to identify areas in which energy consumption can be reduced.
For this study, the monthly gas and electric bills per facility were analyzed and unit costs of energy were obtained. The unit cost of energy, as determined from the information provided by the Borough, was utilized in determining the feasibility of switching from one energy source to another or reducing the demand on that particular source of energy to create annual cost savings for the Borough.
3.1.1 Electric Charges It is also important to understand how the utilities charge for the service. The majority of the energy consumed is electric as a result of both indoor and outdoor lighting and appliances, such as kitchen appliances, computers, printers and projectors. Electricity is charged by three basic components: electrical consumption (kWh), electrical demand (kW) and power factor (kVAR) (reactive power). The cost for electrical consumption is similar to the cost for fuel and the monthly consumption appears on the utility bill as kWh consumed per month with a cost figure associated with it. The service connections are either billed on a flat rate or time of day rates per kWh.
Electrical demand can be as much as 50 percent or more of the electric bill. The maximum demand (kW value) during the billing period is multiplied by the demand cost factor and the result is added to the electric bill. It is often possible to decrease the electric bill by 15 – 25 percent by reducing the demand, while still using the same amount of energy.
The power factor (reactive power) is the power required to energize electric and magnetic fields that result in the production of real power. Power factor is important because transmission and distribution systems must be designed and built to manage the need for real power, as well as the reactive power component (the total power). If the power factor is low, then the total power required can be greater than 50 percent or more than the real power alone. The power factor charge is a penalty for having a low power factor. Fortunately, this penalty charge does not impact the Borough.
The other parts of the electric bill are the supply charges, delivery charges, system benefits, transmission revenue adjustments, state and municipality tariff surcharges and sales taxes, which cannot be avoided.
Public Service Electric & Gas (PSE&G) is the current supplier and distributor of electric energy for the Borough.
Section 3 Baseline Energy Use
A 3-2
3.1.2 Natural Gas Charges PSE&G is the current supplier and distributor of natural gas for the Borough. The Borough is charged for the cost of the natural gas, a delivery charge and a customer charge, which covers gas administration charges.
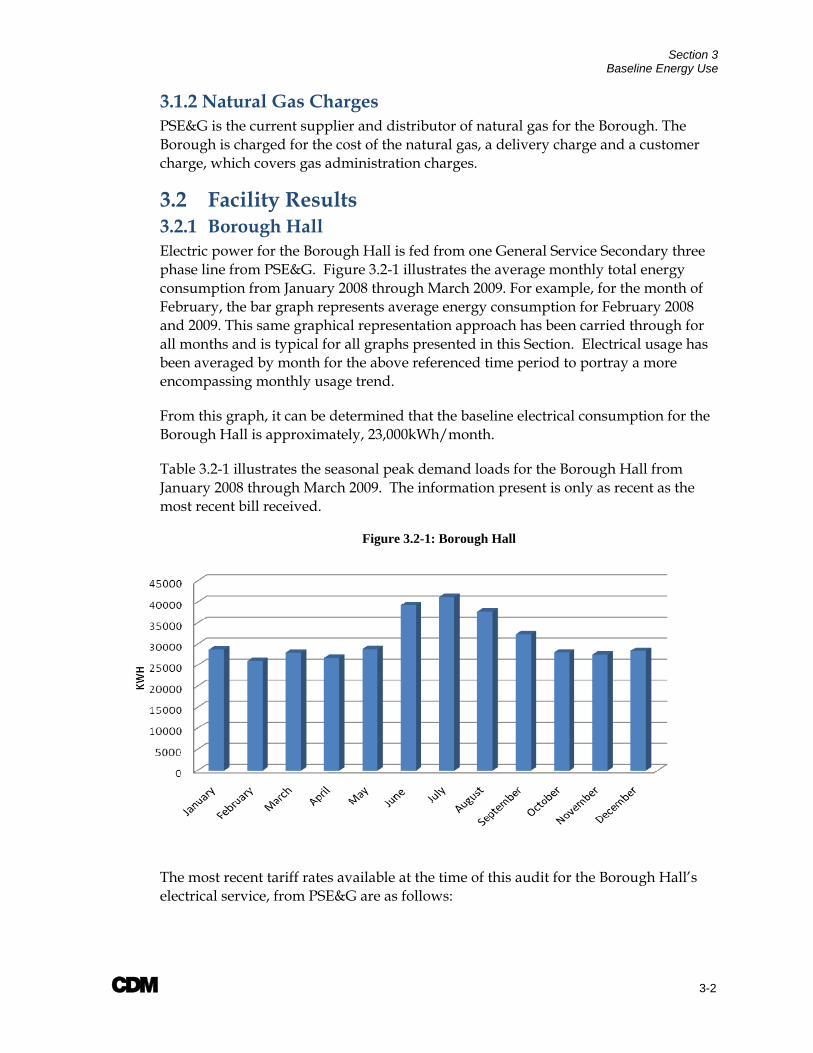
3.2 Facility Results 3.2.1 Borough Hall Electric power for the Borough Hall is fed from one General Service Secondary three phase line from PSE&G. Figure 3.2-1 illustrates the average monthly total energy consumption from January 2008 through March 2009. For example, for the month of February, the bar graph represents average energy consumption for February 2008 and 2009. This same graphical representation approach has been carried through for all months and is typical for all graphs presented in this Section. Electrical usage has been averaged by month for the above referenced time period to portray a more encompassing monthly usage trend.
From this graph, it can be determined that the baseline electrical consumption for the Borough Hall is approximately, 23,000kWh/month.
Table 3.2-1 illustrates the seasonal peak demand loads for the Borough Hall from January 2008 through March 2009. The information present is only as recent as the most recent bill received.
Figure 3.2-1: Borough Hall The most recent tariff rates available at the time of this audit for the Borough Hall’s electrical service, from PSE&G are as follows:

Section 3 Baseline Energy Use
A 3-3
Acct #: 41 815 006 08 Service Charge: $4.24/month
Delivery Service Charges: $0.008416522/kWh
$3.894107142/kW
Societal Benefits Charge: $0.007507785/kWh
Securitization Transition: $0.010353806/kWh
Supply Service Charges:
Generation: $4.664296172/kW
Transmission: $1.658281389/kW
Charge: $0.093369377/kWh
Table 3.2-1: Borough Hall’s Seasonal Peak Demands
Season Peak Demand (kW)
Summer 127
Winter 62
Refer to Table 3.3-1, in Section 3.3 for the average electrical aggregate cost. These tariffs are subject to change quite frequently. Refer to Appendix A for a complete Historical Data Analysis.
Figure 3.2-2 illustrates the Borough Hall’s monthly average natural gas consumption from January 2008 through March 2009.
Figure 3.2-2 Borough Hall’s Gas Usage
For more on the Borough Hall’s gas usage, refer to Section 4.2.
Section 3 Baseline Energy Use
A 3-4
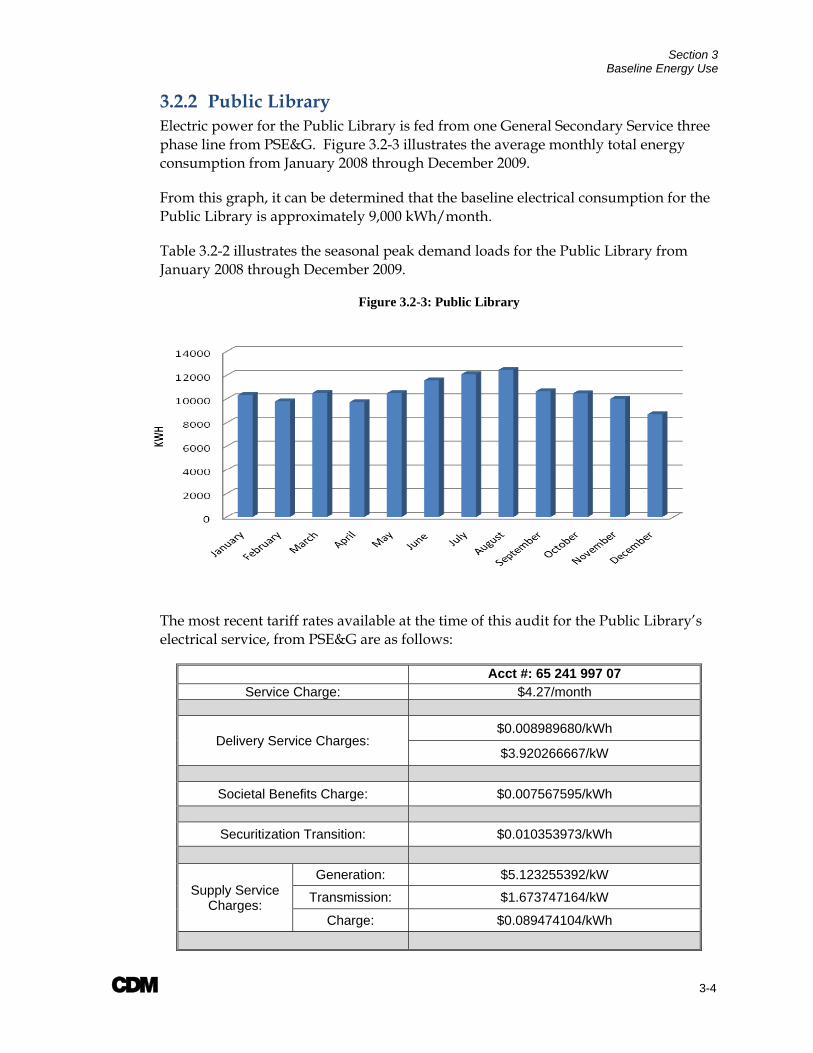
3.2.2 Public Library Electric power for the Public Library is fed from one General Secondary Service three phase line from PSE&G. Figure 3.2-3 illustrates the average monthly total energy consumption from January 2008 through December 2009.
From this graph, it can be determined that the baseline electrical consumption for the Public Library is approximately 9,000 kWh/month.
Table 3.2-2 illustrates the seasonal peak demand loads for the Public Library from January 2008 through December 2009.
Figure 3.2-3: Public Library
The most recent tariff rates available at the time of this audit for the Public Library’s electrical service, from PSE&G are as follows:
Acct #: 65 241 997 07 Service Charge: $4.27/month
Delivery Service Charges: $0.008989680/kWh
$3.920266667/kW
Societal Benefits Charge: $0.007567595/kWh
Securitization Transition: $0.010353973/kWh
Supply Service Charges:
Generation: $5.123255392/kW
Transmission: $1.673747164/kW
Charge: $0.089474104/kWh

Section 3 Baseline Energy Use
A 3-5
Table 3.2-2: Public Library’s Seasonal Peak Demands
Season Peak Demand (kW)
Summer 63
Winter 39
Refer to Table 3.3-1, in Section 3.3 for the average electrical aggregate cost. These tariffs are subject to change quite frequently. Refer to Appendix A for a complete Historical Data Analysis.
Figure 3.2-4 illustrates the Public Library’s monthly average natural gas consumption from January 2008 through December 2009.
Figure 3.2-4: Public Library’s Gas Usage
For more on the Public Library’s gas usage, refer to Section 4.2.
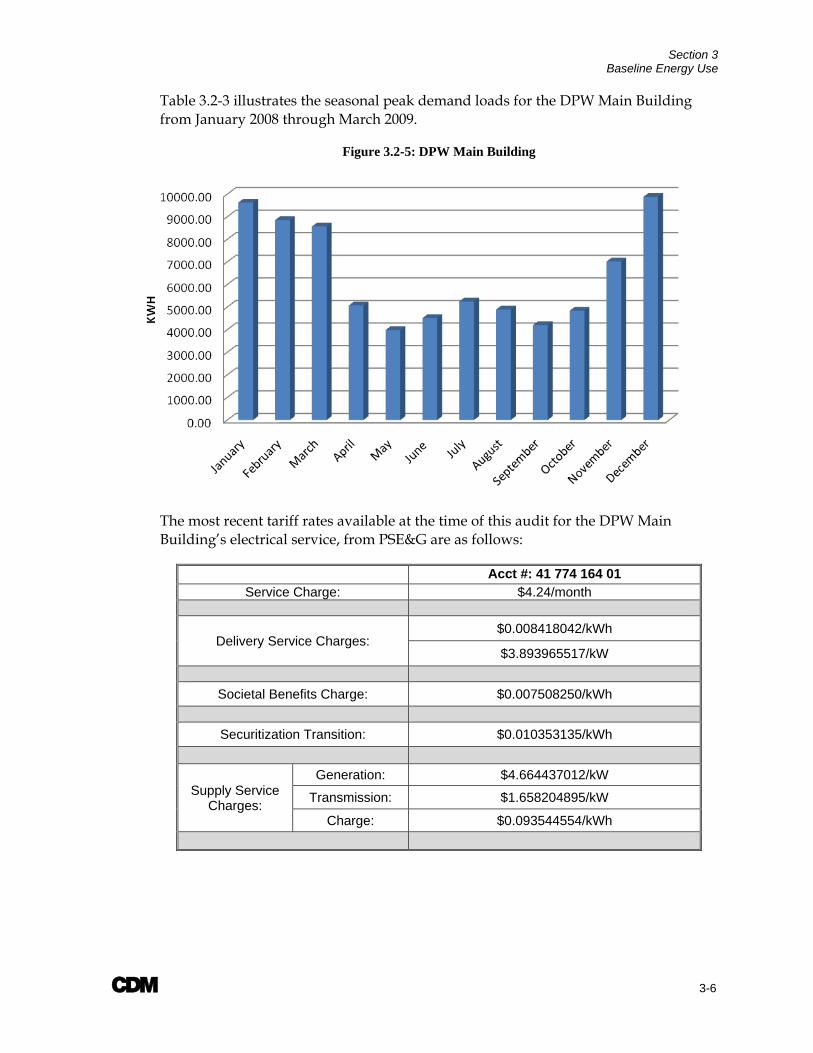
3.2.3 DPW Main Building Electric power for the DPW Main Building is fed from one General Secondary Service single phase line from PSE&G. Figure 3.2-5 illustrates the average monthly total energy consumption from January 2008 through March 2009.
From this graph, it can be determined that the baseline electrical consumption for the DPW Main Building is approximately 3,900 kWh/month.
Section 3 Baseline Energy Use
A 3-6
Table 3.2-3 illustrates the seasonal peak demand loads for the DPW Main Building from January 2008 through March 2009.
Figure 3.2-5: DPW Main Building
The most recent tariff rates available at the time of this audit for the DPW Main Building’s electrical service, from PSE&G are as follows:
Acct #: 41 774 164 01 Service Charge: $4.24/month
Delivery Service Charges: $0.008418042/kWh
$3.893965517/kW
Societal Benefits Charge: $0.007508250/kWh
Securitization Transition: $0.010353135/kWh
Supply Service Charges:
Generation: $4.664437012/kW
Transmission: $1.658204895/kW
Charge: $0.093544554/kWh
Section 3 Baseline Energy Use
A 3-7
Table 3.2-3: DPW Main Building’s Seasonal Peak Demands
Season Peak Demand (kW)
Summer 14
Winter 22
Refer to Table 3.3-1, in Section 3.3 for the average electrical aggregate cost. These tariffs are subject to change quite frequently. Refer to Appendix A for a complete Historical Data Analysis.
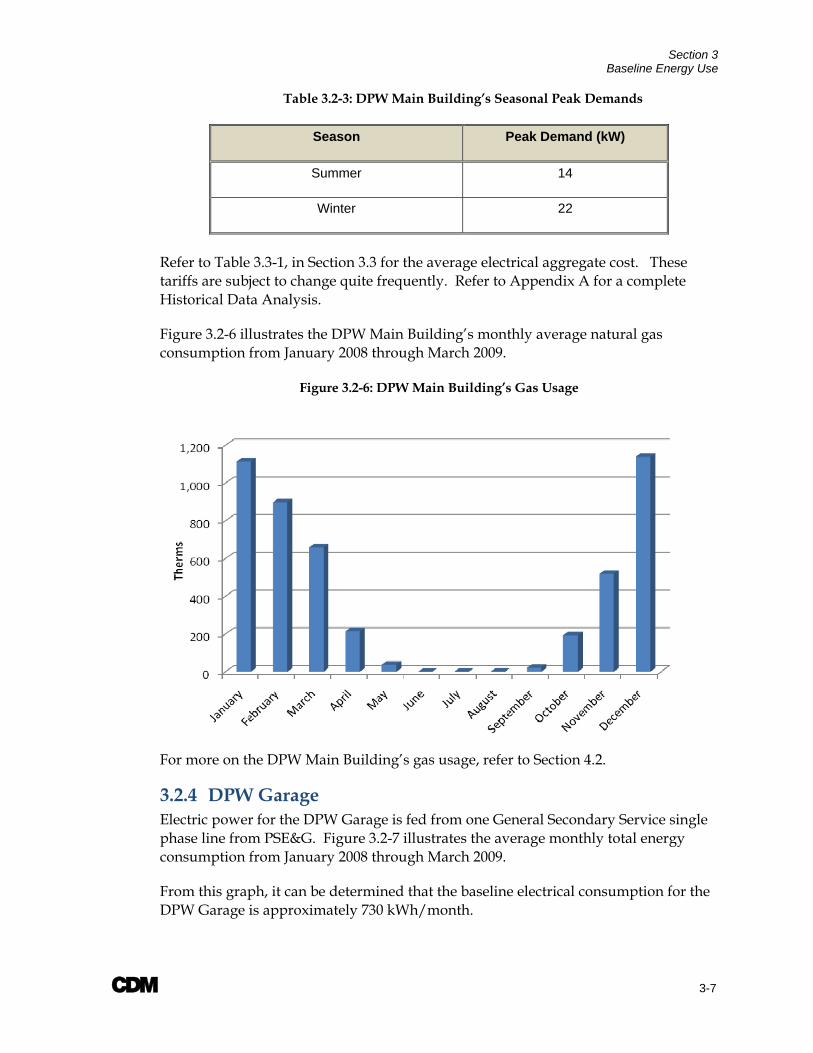
Figure 3.2-6 illustrates the DPW Main Building’s monthly average natural gas consumption from January 2008 through March 2009.
Figure 3.2-6: DPW Main Building’s Gas Usage
For more on the DPW Main Building’s gas usage, refer to Section 4.2.
3.2.4 DPW Garage Electric power for the DPW Garage is fed from one General Secondary Service single phase line from PSE&G. Figure 3.2-7 illustrates the average monthly total energy consumption from January 2008 through March 2009.
From this graph, it can be determined that the baseline electrical consumption for the DPW Garage is approximately 730 kWh/month.

Section 3 Baseline Energy Use
A 3-8
Table 3.2-4 illustrates the seasonal peak demand loads for the DPW Garage from January 2008 through March 2009.
Figure 3.2-7: DPW Garage
The most recent tariff rates available at the time of this audit for the DPW Garage’s electrical service, from PSE&G are as follows:
Acct #: 41 774 161 18 Service Charge: $4.24/month
Delivery Service Charges: $0.008417085/kWh
$3.893650793/kW
Societal Benefits Charge: $0.007507537/kWh
Securitization Transition: $0.010351758/kWh
Supply Service Charges:
Generation: $4.663716814/kW
Transmission: $1.658192090/kW
Charge: $0.093547739/kWh

Section 3 Baseline Energy Use
A 3-9
Table 3.2-4: DPW Garage’s Seasonal Peak Demands Season Peak Demand (kW)
Summer 4
Winter 8
Refer to Table 3.3-1, in Section 3.3 for the average electrical aggregate cost. These tariffs are subject to change quite frequently. Refer to Appendix A for a complete Historical Data Analysis.
Figure 3.2-8 illustrates the DPW Garage’s monthly average natural gas consumption from January 2008 through March 2009.
Figure 3.2-8: DPW Garage’s Gas Usage
For more on the DPW Garage’s gas usage, refer to Section 4.2.
3.2.5 Fire Department Electric power for the Fire Department is fed from one General Secondary Service three phase line from PSE&G. Figure 3.2-9 illustrates the average monthly total energy consumption from January 2009 through December 2009.
From this graph, it can be determined that the baseline electrical consumption for the Fire Department is approximately 8,500 kWh/month.

Section 3 Baseline Energy Use
A 3-10
Table 3.2-5 illustrates the seasonal peak demand loads for the Fire Department from January 2008 through March 2009.
The most recent tariff rates available at the time of this audit for the Fire Department’s electrical service, from PSE&G are as follows:
Acct #: 41 816 039 03 Service Charge: $4.24/month
Delivery Service Charges: $0.008416667/kWh
$3.8940787947/kW
Societal Benefits Charge: $0.007508215/kWh
Securitization Transition: $0.010354460/kWh
Supply Service Charges:
Generation: $4.664192949/kW
Transmission: $1.658358805/kW
Charge: $0.093368545/kWh
Figure 3.2-9: Fire Department

Section 3 Baseline Energy Use
A 3-11
Table 3.2-5: Fire Department’s Seasonal Peak Demands
Season Peak Demand (kW)
Summer 54
Winter 41
Refer to Table 3.3-1, in Section 3.3 for the average electrical aggregate cost. These tariffs are subject to change quite frequently. Refer to Appendix A for a complete Historical Data Analysis.
Figure 3.2-10 illustrates the Fire Department’s monthly average natural gas consumption from January 2008 through March 2009.
Figure 3.2-10: Fire Department’s Gas Usage
For more on the Fire Department’s gas usage, refer to Section 4.2.
3.3 Aggregate Costs For the purposes of computing energy savings for all identified energy conservation and retrofit measures, aggregate unit costs for electrical energy and fuel, in terms of cost/kWH and cost/therm, were determined for each service location and utilized in the simple payback analyses discussed in subsequent sections. The aggregate unit cost accounts for all distribution and supply charges for each location. Table 3.3-1 and

Section 3 Baseline Energy Use
A 3-12
Table 3.3-2 summarize the aggregate costs for electrical energy consumption and therms utilized, respectively.
Table 3.3-1: Electrical Aggregate Unit Costs
Service Location Aggregate $ / kW-hr
Borough Hall $0.1485
Public Library $0.1846
DPW Main Building $0.1483
DPW Garage $0.1746
Fire Department $0.1478
Table 3.3-2: Natural Gas Aggregate Unit Costs
Service Location Aggregate $ / therm
Borough Hall $1.52
Public Library $1.23
DPW Main Building $1.44
DPW Garage $1.41
Fire Department $1.48
3.4 Portfolio Manager 3.4.1 Portfolio Manager Overview Portfolio Manager is an interactive energy management tool that allows the Borough to track and assess energy consumption at the facilities in a secure online environment. Portfolio Manager can help the Borough set investment priorities, verify efficiency improvements, and receive EPA recognition for superior energy performance.
3.4.2 Energy Performance Rating For many facilities, you can rate their energy performance on a scale of 1–100 relative to similar facilities nationwide. Your facility is not compared to the other facilities entered into Portfolio Manager to determine your ENERGY STAR rating. Instead, statistically representative models are used to compare your facility against similar

Section 3 Baseline Energy Use
A 3-13
facilities from a national survey conducted by the Department of Energy’s Energy Information Administration. This national survey, known as the Commercial Building Energy Consumption Survey (CBECS), is conducted every four years, and gathers data on building characteristics and energy use from thousands of facilities across the United States. Your facility’s peer group of comparison is those facilities in the CBECS survey that have similar facility and operating characteristics. A rating of 50 indicates that the facility, from an energy consumption standpoint, performs better than 50% of all similar facilities nationwide, while a rating of 75 indicates that the facility performs better than 75% of all similar facilities nationwide.
3.4.3 Portfolio Manager Account Information A Portfolio Manager account has been established for the Borough, which includes a profile for the five (5) buildings. Information entered into this Portfolio Manager Facility profile, including electrical energy consumption and natural gas consumption has been used to establish a performance baseline.
It is recommended that the information be updated to track the buildings’ energy usage. None of the five (5) buildings were eligible for an energy star label. Ratings were given for one (1) of the five (5) buildings. Of the five (5) buildings, four (4) were of a building type that is not supported by the Energy Star program found in Portfolio Manager. Results are a reflection of the information supplied, if more recent information is entered into the Portfolio Manager account, there is a possibility for better results. It is recommended that the information be updated to track the buildings’ energy usage. At the time of the audit, the Borough Hall received a rating of 65 out of a possible 100. Appendix B contains the Statements of Energy Performance for each building and a Portfolio Manager Reference Sheet. The following website link, username and password shall be used to access the Portfolio Manager account and building profiles that has been established for the Borough:
https://www.energystar.gov/istar/pmpam/ USERNAME: Westwood1 PASSWORD: EnergyStar

A 4-1
Section 4 Energy Conservation and Retrofit Measures (ECRM) The following is a summary of how Annual Return on Investment (AROI), Internal Rate of Return (IRR), and Net Present Value (NPV) will be broken down in the cost analysis for all ECRMs recommended in this report.
Included in the simplified payback analysis summary table is the ‘Annual Return on Investment’ (AROI) values. This value is a performance measure used to evaluate the efficiency of an investment and is calculated using the following equation:
1
Where OCS = Operating Cost Savings, and AECS = Annual Energy Cost Savings. Also included in the table are net present values for each option. The NPV calculates the present value of an investment’s future cash flows based on the time value of money, which is accounted for by a discount rate (DR) (assume bond rate of 3%). NPV is calculated using the following equation:
1
Where Cn=Annual cash flow, and N = number of years.
The Internal Rate of Return (IRR) expresses an annual rate that results in a break-even point for the investment. If the Authority is currently experiencing a lower return on their capital than the IRR, the project is financially advantageous. This measure also allows the Borough to compare ECRM’s against each other to determine the most appealing choices.
0 1
Where Cn=Annual cash flow, and N = number of years.
The lifetime energy savings represents the cumulative energy savings over the assumed life of the ECRM.

Section 4 Energy Conservation and Retrofit Measures
A 4-2
4.1 Building Lighting Systems The goal of this section is to present any lighting energy conservation measures that may also be cost beneficial. It should be noted that replacing current bulbs with more energy-efficient equivalents will have a small effect on the building heating and cooling loads. The building cooling load will see a small decrease from an upgrade to more efficient bulbs and the heating load will see a small increase, as the more energy efficient bulbs give off less heat.
Two options are offered for most buildings. The first option will be for upgrading existing interior lighting, if applicable. The second option will be for upgrading existing exterior lighting, if applicable. A total cost for upgrading both options at the same time will be presented. Retrofitting of existing fluorescent fixtures includes upgrading both ballasts and lamps for the fixture. Refer to Appendix D for more information.
For all of the buildings, it was noted there were existing interior occupancy sensors installed. Installing occupancy sensors in rooms where there are none will typically increase energy savings; however, if the space is not occupied often in the first place, there will be little savings by installing occupancy sensors. However, certain areas of all of the five Borough buildings could benefit from installation of occupancy sensors. Therefore, occupancy sensor installation has been recommended in this report. Refer to Appendix D for occupancy sensor locations and quantities.
Please note that the Engineer’s Estimate of Probable Construction Costs presented herein are estimates based on historic data compiled from similar installations and engineering opinions. Additional engineering will be required for each measure identified in this report and final scope of work and budget cost estimates will need to be confirmed prior to the coordination of project financing or the issuance of a Request for Proposal.
4.1.1 Borough Hall It is recommended that the existing lighting system at the Borough Hall be upgraded to high efficiency standards to create lighting uniformity throughout the building. In general, the recommended lighting upgrade, as presented in Appendix D, involves replacing existing inefficient bulbs, and installing new energy-efficient luminaires to the existing lighting systems. Options for improving the interior and exterior lighting for the Borough Hall are listed in Table 4.1-1.
Table 4.1-1 Borough Hall Lighting System Improvements
Interior Lighting
High Performance T8 Retrofit, Incandescent to Compact Fluorescent
Exterior Lighting
Induction Replacement of Exterior Fixtures
Section 4 Energy Conservation and Retrofit Measures
A 4-3
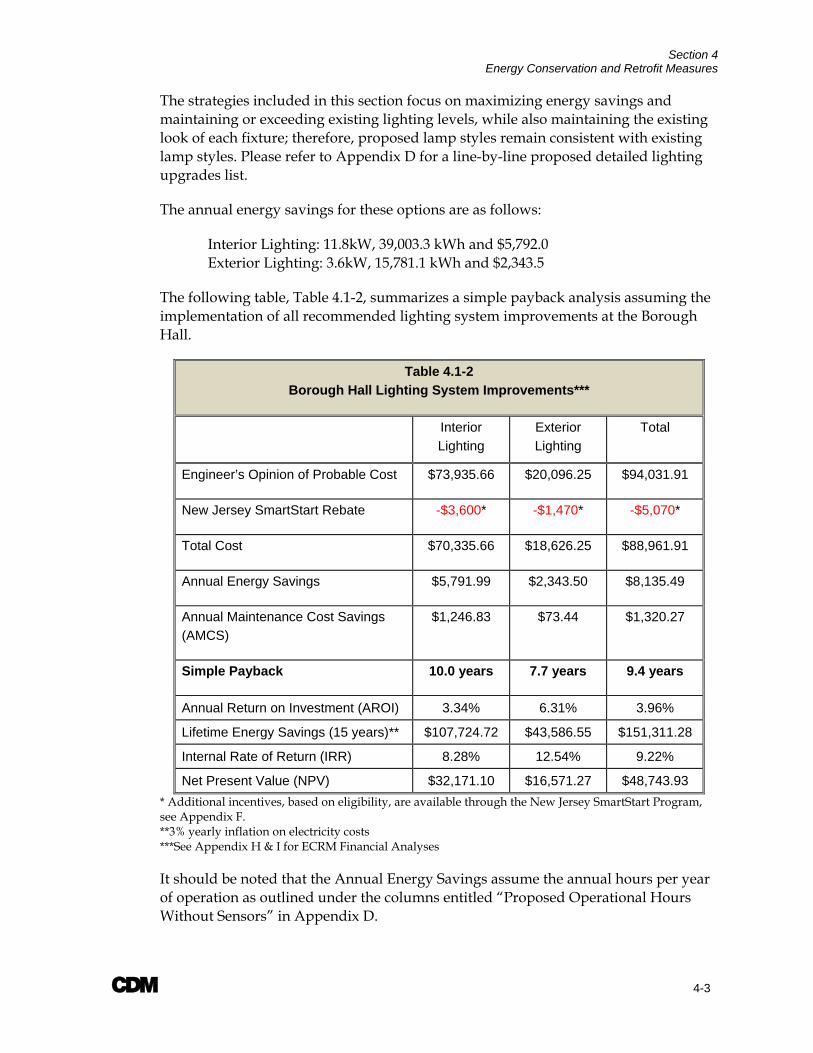
The strategies included in this section focus on maximizing energy savings and maintaining or exceeding existing lighting levels, while also maintaining the existing look of each fixture; therefore, proposed lamp styles remain consistent with existing lamp styles. Please refer to Appendix D for a line-by-line proposed detailed lighting upgrades list.
The annual energy savings for these options are as follows:
Interior Lighting: 11.8kW, 39,003.3 kWh and $5,792.0 Exterior Lighting: 3.6kW, 15,781.1 kWh and $2,343.5
The following table, Table 4.1-2, summarizes a simple payback analysis assuming the implementation of all recommended lighting system improvements at the Borough Hall.
Table 4.1-2 Borough Hall Lighting System Improvements***
Interior Lighting
Exterior Lighting
Total
Engineer’s Opinion of Probable Cost $73,935.66 $20,096.25 $94,031.91
New Jersey SmartStart Rebate -$3,600* -$1,470* -$5,070*
Total Cost $70,335.66 $18,626.25 $88,961.91
Annual Energy Savings $5,791.99 $2,343.50 $8,135.49
Annual Maintenance Cost Savings (AMCS)
$1,246.83 $73.44 $1,320.27
Simple Payback 10.0 years 7.7 years 9.4 years
Annual Return on Investment (AROI) 3.34% 6.31% 3.96%
Lifetime Energy Savings (15 years)** $107,724.72 $43,586.55 $151,311.28
Internal Rate of Return (IRR) 8.28% 12.54% 9.22%
Net Present Value (NPV) $32,171.10 $16,571.27 $48,743.93 * Additional incentives, based on eligibility, are available through the New Jersey SmartStart Program, see Appendix F. **3% yearly inflation on electricity costs ***See Appendix H & I for ECRM Financial Analyses It should be noted that the Annual Energy Savings assume the annual hours per year of operation as outlined under the columns entitled “Proposed Operational Hours Without Sensors” in Appendix D.

Section 4 Energy Conservation and Retrofit Measures
A 4-4
4.1.2 Public Library It is recommended that the existing lighting system at the Public Library be upgraded to high efficiency standards to create lighting uniformity throughout the buildings. In general, the recommended lighting upgrade, as presented in Appendix D, involves replacing existing inefficient bulbs, and installing new energy-efficient luminaires to the existing lighting systems. Options for improving the interior and exterior lighting for the Public Library are listed in Table 4.1-3.
Table 4.1-3 Public Library Building Lighting System Improvements
Interior Lighting High Performance T8 Retrofit, Incandescent to Compact Fluorescent
Exterior Lighting Induction Replacement of Exterior Fixtures, Incandescent to Compact Fluorescent
The strategies included in this section focus on maximizing energy savings and maintaining or exceeding existing lighting levels, while also maintaining the existing look of each fixture; therefore, proposed lamp styles remain consistent with existing lamp styles. Please refer to Appendix D for a line-by-line proposed detailed lighting upgrades list.
The annual energy savings for these options are as follows:
Interior Lighting: 6.1kW, 19,477.9 kWh and $3,595.6 Exterior Lighting: 1.1kW, 4,958.2 kWh and $915.3
The following table, Table 4.1-4, summarizes a simple payback analysis assuming the implementation of all recommended lighting system improvements at the Public Library Building.
Table 4.1-4 Public Library Building Lighting System Improvements***
Interior Lighting
Exterior Lighting
Total
Engineer’s Opinion of Probable Cost $28,029.09 $4,453.38 $32,482.47
New Jersey SmartStart Rebate -$1,840* -$371* -$2,211*
Total Cost $26,189.09 $4,082.38 $30,271.47
Annual Energy Savings $3,595.62 $915.28 $4,510.90
Annual Maintenance Cost Savings (AMCS)
$607.86 $216.96 $824.82

Section 4 Energy Conservation and Retrofit Measures
A 4-5
Simple Payback 6.2 years 3.6 years 5.7 years
Annual Return on Investment (AROI) 9.38% 21.07% 10.96%
Lifetime Energy Savings (15 years)** $66,874.63 $17,023.21 $83,897.84
Internal Rate of Return (IRR) 16.53% 29.88% 18.46%
Net Present Value (NPV) $35,026.92 $12,407.41 $47,432.87 * Additional incentives, based on eligibility, are available through the New Jersey SmartStart Program, see Appendix F. **3% yearly inflation on electricity costs ***See Appendix H & I for ECRM Financial Analyses It should be noted that the Annual Energy Savings assume the annual hours per year of operation as outlined under the columns entitled “Proposed Operational Hours without Sensors” and “Proposed Operational Hours with Sensors” in Appendix D.
4.1.3 DPW Main Building It is recommended that the existing lighting system at the DPW Main Building be upgraded to high efficiency standards to create lighting uniformity throughout the building. In general, the recommended lighting upgrade, as presented in Appendix D, involves replacing existing inefficient bulbs, and installing new energy-efficient luminaires to the existing lighting systems. The proposed option for improving the exterior lighting for the DPW Main Building is listed in Table 4.1-5.
Table 4.1-5 DPW Main Building Lighting System Improvements
Interior Lighting High Performance T8 Retrofit
Exterior Lighting Induction Replacement of Exterior Fixtures, Incandescent to Compact
Fluorescent
The strategies included in this section focus on maximizing energy savings and maintaining or exceeding existing lighting levels, while also maintaining the existing look of each fixture; therefore, proposed lamp styles remain consistent with existing lamp styles. Please refer to Appendix D for a line-by-line proposed detailed lighting upgrades list.
The annual energy savings for this option is as follows:
Interior Lighting: 3.1kW, 7,113 kWh and $1,054.9 Exterior Lighting: 1.9kW, 8,510.3 kWh and $1,262.1
The following table, Table 4.1-6, summarizes a simple payback analysis assuming the implementation of all recommended lighting system improvements at the DPW Main Building.

Section 4 Energy Conservation and Retrofit Measures
A 4-6
Table 4.1-6 DPW Main Building Lighting System Improvements***
Interior Lighting
Exterior Lighting
Total
Engineer’s Opinion of Probable Cost $12,637.78 $6,329.31 $18,967.09
New Jersey SmartStart Rebate -$770* -$560* -$1,330*
Total Cost $11,867.78 $5,769.31 $17,637.09
Annual Energy Savings $1,054.86 $1,262.08 $2,316.94
Annual Maintenance Cost Savings (AMCS)
$207.27 $289.08 $496.35
Simple Payback 9.4 years 3.7 years 6.3 years
Annual Return on Investment (AROI) 3.97% 20.22% 9.28%
Lifetime Energy Savings (15 years)** $19,619.25 $23,473.32 $43,092.75
Internal Rate of Return (IRR) 9.23% 28.96% 16.41%
Net Present Value (NPV) $6,513.75 $16,820.99 $23,333.29 * Additional incentives, based on eligibility, are available through the New Jersey SmartStart Program, see Appendix F. **3% yearly inflation on electricity costs ***See Appendix H & I for ECRM Financial Analyses It should be noted that the Annual Energy Savings assume the annual hours per year of operation as outlined under the columns entitled “Proposed Operational Hours without Sensors” and “Proposed Operational Hours with Sensors” in Appendix D. 4.1.4 DPW Garage It is recommended that the existing lighting system at the DPW Garage Building be upgraded to high efficiency standards to create lighting uniformity throughout the buildings. In general, the recommended lighting upgrade, as presented in Appendix D, involves replacing existing inefficient bulbs, and installing new energy-efficient luminaires to the existing lighting systems. Options for improving the interior and exterior lighting for the DPW Garage Building are listed in Table 4.1-7.
Table 4.1-7 DPW Garage Building Lighting System Improvements
Interior Lighting High Performance T8 Retrofit, Incandescent to Compact Fluorescent
Exterior Lighting Induction Retrofit of Exterior Fixtures, Incandescent to Compact Fluorescent

Section 4 Energy Conservation and Retrofit Measures
A 4-7
The strategies included in this section focus on maximizing energy savings and maintaining or exceeding existing lighting levels, while also maintaining the existing look of each fixture; therefore, proposed lamp styles remain consistent with existing lamp styles. Please refer to Appendix D for a line-by-line proposed detailed lighting upgrades list.
The annual energy savings for these options are as follows:
Interior Lighting: 0.4kW, 942.2 kWh and $164.5 Exterior Lighting: 0.2kW, 735.8 kWh and $128.5
The following table, Table 4.1-8, summarizes a simple payback analysis assuming the implementation of all recommended lighting system improvements at the DPW Garage Building.
Table 4.1-8 DPW Garage Building Lighting System Improvements***
Interior Lighting
Exterior Lighting
Total
Engineer’s Opinion of Probable Cost $3,060.44 $1,578.38 $4,638.82
New Jersey SmartStart Rebate -$270* -$14* -$284*
Total Cost $2,790.44 $1,564.38 $4,354.82
Annual Energy Savings $164.52 $128.48 $293.00
Annual Maintenance Cost Savings (AMCS)
$89.87 $47.74 $137.61
Simple Payback 11.0 years 8.9 years 10.1 years
Annual Return on Investment (AROI) 2.45% 4.60% 3.22%
Lifetime Energy Savings (15 years)** $3,059.89 $2,389.59 $5,449.30
Internal Rate of Return (IRR) 6.89% 10.14% 8.10%
Net Present Value (NPV) $914.45 $1,001.62 $1,916.07 * Additional incentives, based on eligibility, are available through the New Jersey SmartStart Program, see Appendix F. **3% yearly inflation on electricity costs ***See Appendix H & I for ECRM Financial Analyses It should be noted that the Annual Energy Savings assume the annual hours per year of operation as outlined under the columns entitled “Proposed Operational Hours without Sensors” and “Proposed Operational Hours with Sensors” in Appendix D.
Section 4 Energy Conservation and Retrofit Measures
A 4-8
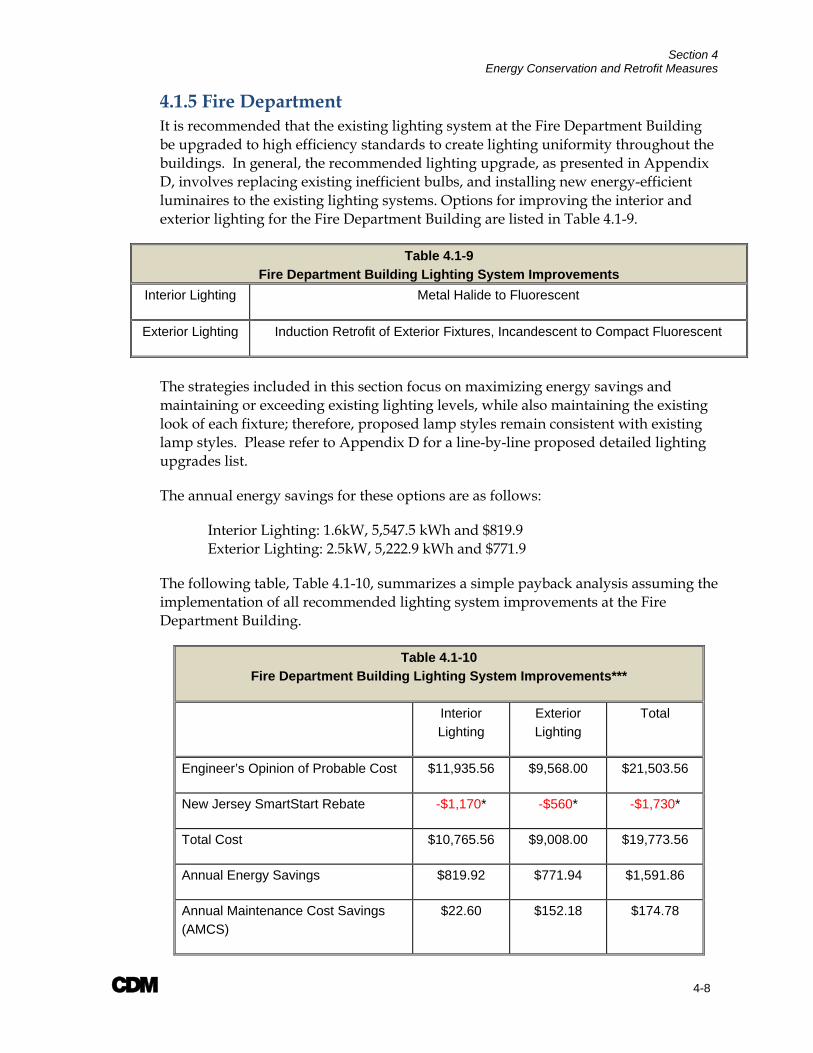
4.1.5 Fire Department It is recommended that the existing lighting system at the Fire Department Building be upgraded to high efficiency standards to create lighting uniformity throughout the buildings. In general, the recommended lighting upgrade, as presented in Appendix D, involves replacing existing inefficient bulbs, and installing new energy-efficient luminaires to the existing lighting systems. Options for improving the interior and exterior lighting for the Fire Department Building are listed in Table 4.1-9.
Table 4.1-9 Fire Department Building Lighting System Improvements
Interior Lighting Metal Halide to Fluorescent
Exterior Lighting Induction Retrofit of Exterior Fixtures, Incandescent to Compact Fluorescent
The strategies included in this section focus on maximizing energy savings and maintaining or exceeding existing lighting levels, while also maintaining the existing look of each fixture; therefore, proposed lamp styles remain consistent with existing lamp styles. Please refer to Appendix D for a line-by-line proposed detailed lighting upgrades list.
The annual energy savings for these options are as follows:
Interior Lighting: 1.6kW, 5,547.5 kWh and $819.9 Exterior Lighting: 2.5kW, 5,222.9 kWh and $771.9
The following table, Table 4.1-10, summarizes a simple payback analysis assuming the implementation of all recommended lighting system improvements at the Fire Department Building.
Table 4.1-10 Fire Department Building Lighting System Improvements***
Interior Lighting
Exterior Lighting
Total
Engineer’s Opinion of Probable Cost $11,935.56 $9,568.00 $21,503.56
New Jersey SmartStart Rebate -$1,170* -$560* -$1,730*
Total Cost $10,765.56 $9,008.00 $19,773.56
Annual Energy Savings $819.92 $771.94 $1,591.86
Annual Maintenance Cost Savings (AMCS)
$22.60 $152.18 $174.78
Section 4 Energy Conservation and Retrofit Measures
A 4-9
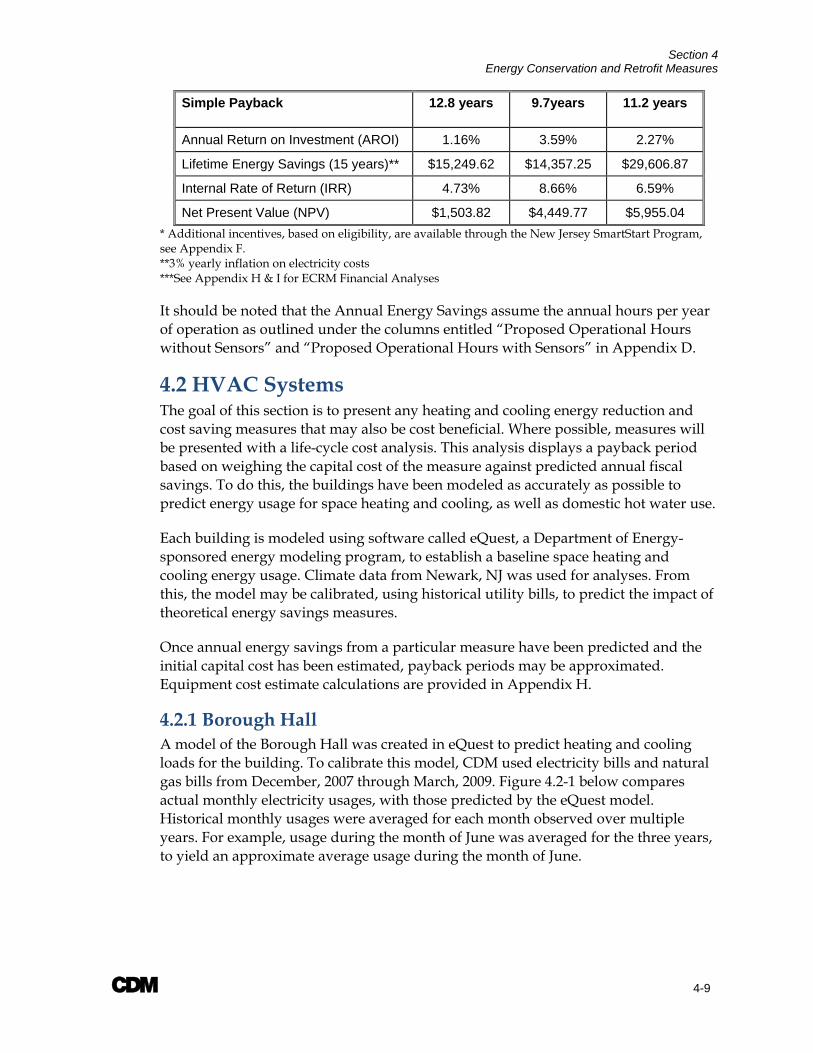
Simple Payback 12.8 years 9.7years 11.2 years
Annual Return on Investment (AROI) 1.16% 3.59% 2.27%
Lifetime Energy Savings (15 years)** $15,249.62 $14,357.25 $29,606.87
Internal Rate of Return (IRR) 4.73% 8.66% 6.59%
Net Present Value (NPV) $1,503.82 $4,449.77 $5,955.04 * Additional incentives, based on eligibility, are available through the New Jersey SmartStart Program, see Appendix F. **3% yearly inflation on electricity costs ***See Appendix H & I for ECRM Financial Analyses It should be noted that the Annual Energy Savings assume the annual hours per year of operation as outlined under the columns entitled “Proposed Operational Hours without Sensors” and “Proposed Operational Hours with Sensors” in Appendix D.
4.2 HVAC Systems The goal of this section is to present any heating and cooling energy reduction and cost saving measures that may also be cost beneficial. Where possible, measures will be presented with a life-cycle cost analysis. This analysis displays a payback period based on weighing the capital cost of the measure against predicted annual fiscal savings. To do this, the buildings have been modeled as accurately as possible to predict energy usage for space heating and cooling, as well as domestic hot water use.
Each building is modeled using software called eQuest, a Department of Energy-sponsored energy modeling program, to establish a baseline space heating and cooling energy usage. Climate data from Newark, NJ was used for analyses. From this, the model may be calibrated, using historical utility bills, to predict the impact of theoretical energy savings measures.
Once annual energy savings from a particular measure have been predicted and the initial capital cost has been estimated, payback periods may be approximated. Equipment cost estimate calculations are provided in Appendix H.
4.2.1 Borough Hall A model of the Borough Hall was created in eQuest to predict heating and cooling loads for the building. To calibrate this model, CDM used electricity bills and natural gas bills from December, 2007 through March, 2009. Figure 4.2-1 below compares actual monthly electricity usages, with those predicted by the eQuest model. Historical monthly usages were averaged for each month observed over multiple years. For example, usage during the month of June was averaged for the three years, to yield an approximate average usage during the month of June.

Section 4 Energy Conservation and Retrofit Measures
A 4-10
Figure 4.2-1: Borough Hall Electricity Usage
Once the eQuest model was calibrated, it could be used to predict approximate major usage categories, such as lighting, plug loads (miscellaneous), ventilation, and cooling. It should be noted that these are only estimated usages based on information gathered during CDM’s field audit. Figure 4.2-2 presents this information to help the Borough visualize where CDM anticipates the electricity is ultimately being used.
Figure 4.2-2: Borough Hall Electricity Usage Breakdown
Figure 4.2-3 below compares actual natural gas usage to model-predicted natural gas use.
05,000
10,00015,00020,00025,00030,00035,00040,00045,00050,000
Electricity Use (kWh)
Actual
Predicted
0
5
10
15
20
25
30
35
40
45
50
Electricity Usage
(kWhX
1000
)
Space Cooling Ventilation Pumps & Aux Exterior Lighting Miscellaneous Interior Lighting

Section 4 Energy Conservation and Retrofit Measures
A 4-11
Figure 4.2-3: Borough Hall Natural Gas Usage
Currently, the heating system utilizes one Slant Fin hot water cast iron boiler with a gross capacity 900 MBH. CDM conservatively estimates this boiler to be 80% efficient.
CDM recommends replacing this boiler with a system of high-efficiency, condensing boilers. Based on the building model, and accounting for a 25% safety factor, CDM has calculated a peak heating load of 1,450 MBH.
Figure 4.2-4 compares current gas usage with predicted gas usage resulting from a switch to a high-efficiency, condensing boiler. Condensing boilers are modeled with a full-load efficiency of ~90% and return water temperature of 120°F.
Figure 4.2-4: Borough Hall – Boiler Upgrade - Natural Gas Usage
Fiscal savings from such an upgrade are then identified in Table 4.2-1 below. Lifetime savings calculations for all ECRM’s may be found in Appendix I. It’s important to note that these are estimates based on building models, and further investigation is warranted before pursuing boiler replacements.
0
200
400
600
800
1,000
1,200
1,400
Natural Gas Usage
(The
rms)
Actual
Predicted
0
500
1000
1500
2000
2500
3000
Natural Gas Usage
(The
rms)
Existing Boiler
Upgraded Boiler

Section 4 Energy Conservation and Retrofit Measures
A 4-12
Due to the improved automation and control within modern condensing boilers, their operation and maintenance costs tend to be less than those of typical cast iron boilers. CDM estimates a cast iron boiler system will typically cost around $3,500 per year for regular preventative maintenance, whereas a condensing boiler system would cost around $2,000 per year. Therefore, replacing the existing boiler with a condensing boiler should result in an operation and maintenance cost savings of $1,500 per year.
Table 4.2-1: Borough Hall Boiler Upgrade Payback
Predicted Annual Savings (Therms) 2,608
Total Annual Savings $3,964
Initial Capital Cost of Upgrade $67,628
Incentives** $2,000
Cost of Upgrade $65,628
Annual Maintenance Cost Savings (AMCS) $1,500
Simple Payback 12.0
Lifetime Energy Savings (24 years)* $120,592
Annual Return on Investment (AROI) 4.16%
Internal Rate of Return (IRR) 9.34%
Net Present Value (NPV) $61,689
*Assumes 2% yearly inflation on natural gas costs **Incentives, per New Jersey Clean Energy Program, are $1.00 per MBH
It should be noted that reducing the temperature at which the water returns to the boiler (return water temperature) can increase condensing boiler efficiencies. However, to obtain a lower return water temperature, air flows from existing air handling units may need to be reevaluated. Therefore, with the installation of condensing boilers, a complete system test and balance is strongly recommended. This procedure will attempt to maximize system efficiencies, while maintaining adequate ventilation, heating and cooling in all spaces. Currently the HVAC systems at the Borough Hall are controlled independently, by room thermostats. It is recommended that a direct digital control (DDC) building management system (BMS) be implemented. A system like this would monitor and control all HVAC equipment, allowing maintenance staff to operate systems and adjust climate control in real time to maximize staff and customer comfort, while minimizing unnecessary heating and cooling. Typically implementation of a BMS will save the owner 5-15% of the energy devoted to HVAC. As all systems are currently independently monitored and controlled, CDM conservatively estimates that implementing a DDC BMS will allow the Borough Hall to save, on average, 10% of the energy being used for HVAC. Table 4.2-2 demonstrates the potential payback from such an implementation.

Section 4 Energy Conservation and Retrofit Measures
A 4-13
Table 4.2-2: Borough Hall DDC BMS Payback
Predicted Annual Savings (Therms) 975
Annual Savings (Natural Gas) $1,482
Predicted Annual Savings (kWh) 8,452
Annual Savings (Electricity) $1,255
Total Annual Savings $2,737
Initial Capital Cost of Upgrade $25,685
Incentives** $0
Cost of Upgrade $25,685
Annual Maintenance Cost Savings (AMCS) $0
Simple Payback 9.4
Lifetime Energy Savings (15 years)* $48,970
Annual Return on Investment (AROI) 3.99%
Internal Rate of Return (IRR) 9.26%
Net Present Value (NPV) $14,174
*Assumes 2% yearly inflation on natural gas costs, 3% inflation on electricity costs **No Incentives found for this upgrade
If the Borough chooses to pursue such a building management system, CDM recommends hiring an independent energy management consultant to implement the system. An independent consultant can review and adjust the desired control schemes based on the existing HVAC systems and occupancy schedules to maximize the efficiency of the BMS.
Over several decades, ASHRAE has compiled data pertaining to service lives of most HVAC related equipment. From this, ASHRAE indicates a median service life (life until replacement) for HVAC related equipment that may be used as an estimate for the useful life of HVAC equipment currently in service. For example, ASHRAE indicates a window air conditioning unit has a median service life of 10 years. Therefore, if a window unit has been in service for more than 10 years, the owner may want to consider replacement. Not only will a replacement ensure minimal downtime between units (the unit is replaced before it ceases to function), but it will also maintain rated system efficiency, as efficiency tends to decrease with age.
All major equipment noted during CDM’s on site audit is listed in Table 4.2-3 below, along with estimated current ages and ASHRAE-expected service lives. It should be noted that only equipment that was observed at the time of the audit is included. Where equipment ages were not found on the equipment tags, they have been estimated based on the unit appearance or approximate renovation dates. In some cases, service locations may have been estimated based on unit proximity. Additionally, in cases where a unit’s manufacturer and/or model could not be determined due to an unreadable, faded, destroyed, or lost tag, manufacturer and model number information has been represented as “unknown”.

Section 4 Energy Conservation and Retrofit Measures
A 4-14
Table 4.2-3 Borough Hall HVAC Equipment Service Lives
Description [Tag ID]
Unit Location
Service Location Manufacturer Model
Estimated Efficiency
Estimated Age
(Years)
ASHRAE Expected
Life (Years)
Air Handling Unit (AHU) Attic Court Room Carrier 39LD1061GA5031‐L N/A* ~15 25
AHU Attic Administration
Area Carrier 39LC1061AB1026‐L N/A* ~15 25 Through‐Wall
Air Conditioner (TWAC)
Basement Computer Room
Basement Computer Room Sanyo KS1872 EER 8‐9 >10 10
AHU [AHU‐1] Basement
Ambulance Corp York N4AHD20A46A N/A* <15 25
AHU [AHU‐2] Basement Police Reserve York N4AHD20A46A N/A* <15 25 AHU
[AHU‐3] Basement Unknown York N4AHD14A46A N/A* <15 25 AHU
[AHU‐4] Basement Building Office York N4AHD14A46A N/A* <15 25 Air Cooled Condensing Unit (ACCU) Outside
Court Room, Right Side [HVAC‐8] Carrier 38AK‐012‐601
EER 9.0‐9.3 <15 20
ACCU Outside
Police Hallway, 2nd
Floor [HVAC‐5] Carrier 38AKS009600
EER 9.0 <15 20
ACCU Outside
Health Department [HVAC‐2] Carrier 38AK‐008‐601
EER 9.1‐9.3 <15 20
ACCU Outside
Police Hallway, 1st
Floor [HVAC‐1] Carrier 38ARS‐008
EER 10.4‐11.2 <15 20
ACCU Outside
Conference Room, 2nd Floor
[HVAC‐6] Carrier 38AK‐012‐601 EER
9.0‐9.3 <15 20
ACCU Outside Dispatch Mitsubishi PUL12EK Unknown <15 20
ACCU Outside
Basement Computer Room Sanyo C1872 Unknown <15 20
ACCU Outside Unknown York H3RA060S06B Unknown <15 20
ACCU Outside Unknown Lennox 13ACD‐060‐230‐02 Unknown <15 20

Section 4 Energy Conservation and Retrofit Measures
A 4-15
Table 4.2-3 Borough Hall HVAC Equipment Service Lives
ACCU Outside AHU‐2 York E1FD0600S46C Unknown <15 20 ACCU
(Heat Pump) Outside Ambulance
Corp Carrier 38YCC060‐641 EER
9.0‐9.6 <15 20
ACCU Outside
Tax and Borough Clerk [HVAC‐4] Carrier 38AK‐012‐601
EER 9.0‐9.3 <15 20
ACCU Outside Unknown [HVAC‐3] Carrier 38AK‐008‐601
EER 9.1‐9.3 <15 20
ACCU Outside
Administration Offices [HVAC‐7] Carrier 38AK‐012‐600
EER 9.0‐9.3 <15 20
ACCU Outside
Court Room, Left Side [HVAC‐9] Carrier 38AK‐012‐600
EER 9.0‐9.3 <15 20
ACCU Outside Unknown York E1FB036S46A Unknown <15 20
ACCU Outside AHU‐4 York E1FD036S06D Unknown <15 20
AHU Over Sally
Port Police Office Hallway Carrier 39LA1031BA1021‐R N/A* <15 25
AHU Over Sally
Port Police Office
Area Carrier 39LC1061AB1026 N/A* <15 25
Boiler, Cast Iron
Boiler Room Entire Building Slant Fin Unknown 80% 15 35
*Heating efficiencies for air handling units with hot water coils accounted for at boiler; cooling efficiencies accounted for at condensing units.
As the ASHRAE expected life for an air-cooled condensing unit is 20 years, the ACCUs at the Borough Hall should still be operating reliably and efficiently and therefore should not warrant immediate replacement. Additionally, CDM has found that a direct replacement of a standard efficiency ACCU with a high efficiency model tends to not be cost beneficial.
However, in approximately five years when the units begin to exceed their expected service lives, the Borough will begin to incur the costs of unit replacements. At this point, CDM recommends evaluating the cost of replacing them with high-efficiency units. The savings realized from a high efficiency unit is often enough to justify the cost difference between replacement with a high efficiency unit and direct replacement with a standard efficiency unit.
Additionally, at the time of the audit, the air handling unit above the “Sally Port” was found to have a significant condensate leak which has caused damage to the ceiling below the unit, resulting in costly repairs. As this unit is still within its expected service life, it is recommended the unit be repaired to mitigate costs associated with anticipated continued ceiling and structure damage.

Section 4 Energy Conservation and Retrofit Measures
A 4-16
CDM also creates an inventory of observed domestic water heaters. This will attempt to inform the Borough of any water heaters that are in need of replacement. Equipment observed to be in poor or aging condition would warrant replacement, as they are likely not operating at peak efficiency. This domestic water heater inventory may be seen as Table 4.2-4 below.
Table 4.2-4 Borough Hall Domestic Water Heaters
Location Make
Storage Capacity (Gallons) Model Number Type
Heating Capacity
Observed Condition
Boiler Room Bradford White 100 M1100T10BN Gas 100 MBH Good
4.2.2 Public Library A model of the Public Library was created in eQuest to predict heating and cooling loads for the building. To calibrate this model, CDM used electricity bills and natural gas bills from December, 2007 through December, 2009. Figure 4.2-5 below compares actual monthly electricity usages, with those predicted by the eQuest model. Historical monthly usages were averaged for each month observed over multiple years.
Figure 4.2-5: Public Library Electricity Usage
Figure 4.2-6 presents an end-usage breakdown to help the Borough visualize where CDM anticipates the electricity is ultimately being used. It should be noted that these are only estimated usages based on information gathered during CDM’s field audit.
0
2,000
4,000
6,000
8,000
10,000
12,000
14,000
16,000
Electricity Use (kWh)
Actual
Predicted

Section 4 Energy Conservation and Retrofit Measures
A 4-17
Figure 4.2-6: Public Library Electricity Usage Breakdown
Figure 4.2-7 below compares actual natural gas usage to model-predicted natural gas use.
Figure 4.2-7: Public Library Natural Gas Usage
0
2
4
6
8
10
12
14
16
Electricity Usage
(kWhX
1000
)
Space Cooling Space Heating Domestic Hot Water VentilationPumps & Aux Exterior Lighting Miscellaneous Interior Lighting
0
200
400
600
800
1,000
1,200
1,400
Natural Gas Usage
(The
rms)
Actual
Predicted
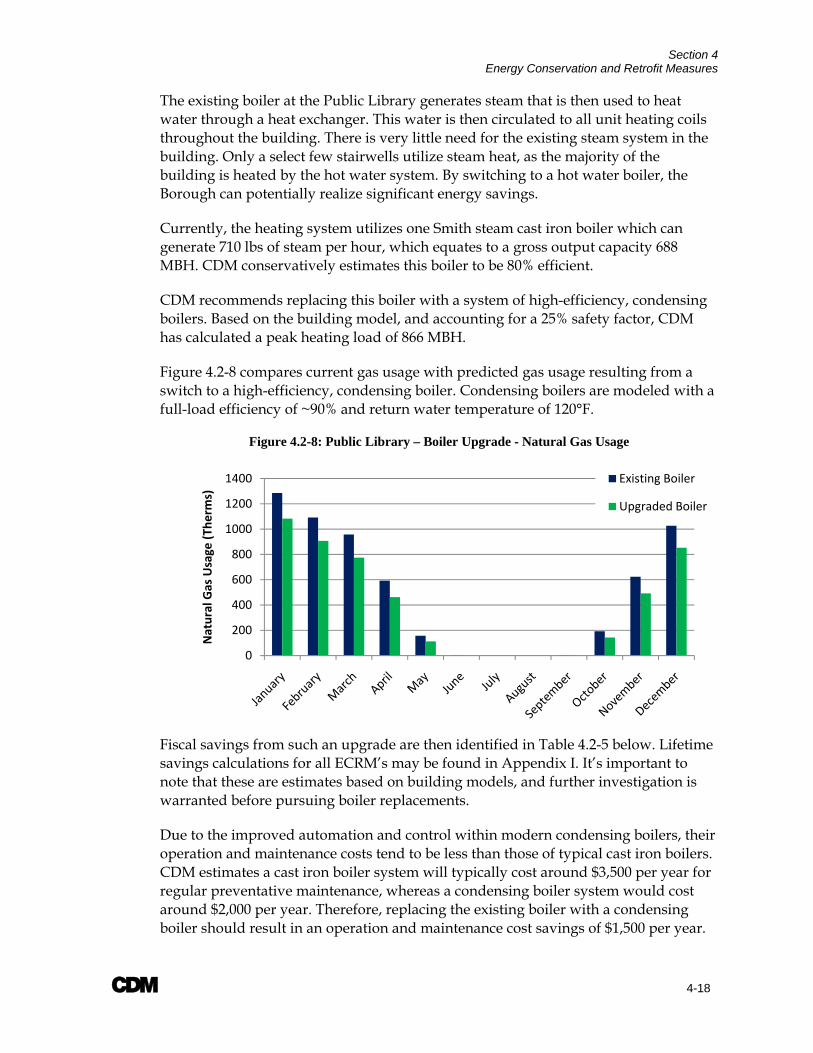
Section 4 Energy Conservation and Retrofit Measures
A 4-18
The existing boiler at the Public Library generates steam that is then used to heat water through a heat exchanger. This water is then circulated to all unit heating coils throughout the building. There is very little need for the existing steam system in the building. Only a select few stairwells utilize steam heat, as the majority of the building is heated by the hot water system. By switching to a hot water boiler, the Borough can potentially realize significant energy savings.
Currently, the heating system utilizes one Smith steam cast iron boiler which can generate 710 lbs of steam per hour, which equates to a gross output capacity 688 MBH. CDM conservatively estimates this boiler to be 80% efficient.
CDM recommends replacing this boiler with a system of high-efficiency, condensing boilers. Based on the building model, and accounting for a 25% safety factor, CDM has calculated a peak heating load of 866 MBH.
Figure 4.2-8 compares current gas usage with predicted gas usage resulting from a switch to a high-efficiency, condensing boiler. Condensing boilers are modeled with a full-load efficiency of ~90% and return water temperature of 120°F.
Figure 4.2-8: Public Library – Boiler Upgrade - Natural Gas Usage
Fiscal savings from such an upgrade are then identified in Table 4.2-5 below. Lifetime savings calculations for all ECRM’s may be found in Appendix I. It’s important to note that these are estimates based on building models, and further investigation is warranted before pursuing boiler replacements.
Due to the improved automation and control within modern condensing boilers, their operation and maintenance costs tend to be less than those of typical cast iron boilers. CDM estimates a cast iron boiler system will typically cost around $3,500 per year for regular preventative maintenance, whereas a condensing boiler system would cost around $2,000 per year. Therefore, replacing the existing boiler with a condensing boiler should result in an operation and maintenance cost savings of $1,500 per year.
0
200
400
600
800
1000
1200
1400
Natural Gas Usage
(The
rms)
Existing Boiler
Upgraded Boiler

Section 4 Energy Conservation and Retrofit Measures
A 4-19
Table 4.2-5: Public Library Boiler Upgrade Payback
Predicted Annual Savings (Therms) 1,100
Total Annual Savings $1,353
Initial Capital Cost of Upgrade $32,122
Incentives** $1,552
Cost of Upgrade $30,570
Annual Maintenance Cost Savings (AMCS) $1,500
Simple Payback 10.7
Lifetime Energy Savings (24 years)* $41,161
Annual Return on Investment (AROI) 5.17%
Internal Rate of Return (IRR) 7.23%
Net Present Value (NPV) $35,908
*Assumes 2% yearly inflation on natural gas costs **Incentives, per New Jersey Clean Energy Program, are $2.00 per MBH
It should be noted that reducing the temperature at which the water returns to the boiler (return water temperature) can increase condensing boiler efficiencies. However, to obtain a lower return water temperature, air flows from existing air handling units may need to be reevaluated. Therefore, with the installation of condensing boilers, a complete system test and balance is strongly recommended. This procedure will attempt to maximize system efficiencies, while maintaining adequate ventilation, heating and cooling in all spaces. Currently, the HVAC equipment at the library is controlled by a third-party company. Library personnel expressed interest in implementing a building management system (BMS) that they have control over. A system like this would monitor and control all HVAC equipment, allowing library staff to operate systems and adjust climate control in real time to maximize staff and customer comfort, while minimizing unnecessary heating and cooling.
Typically, implementation of a BMS will save the owner 5-15% of the energy devoted to HVAC. While there is a third party control system currently implemented, staff has noted that systems such as the air handling unit serving the lower level auditorium run constantly to cool or heat the space even when it is completely unoccupied. If a DDC BMS monitored and controlled by library staff is implemented, systems such as this one can be set to only operate when needed, and adjustments can be made in real time to respond occupant needs. Therefore, CDM conservatively estimates that implementing a DDC BMS will allow the library to save, on average, 5% of the energy being used for HVAC. Table 4.2-6 demonstrates the potential payback from such an implementation.

Section 4 Energy Conservation and Retrofit Measures
A 4-20
Table 4.2-6: Public Library DDC BMS Payback
Predicted Annual Savings (Therms) 296
Annual Savings (Natural Gas) $364
Predicted Annual Savings (kWh) 2,503
Annual Savings (Electricity) $462
Total Annual Savings $826
Initial Capital Cost of Upgrade $13,800
Incentives** $0
Cost of Upgrade $13,800
Annual Maintenance Cost Savings (AMCS) $0
Simple Payback 16.7
Lifetime Energy Savings (15 years)* $14,888
Annual Return on Investment (AROI) (0.68%)
Internal Rate of Return (IRR) 1.28%
Net Present Value (NPV) ($1,771)
*Assumes 2% yearly inflation on natural gas costs, 3% inflation on electricity costs **No Incentives found for this upgrade
If the Borough chooses to pursue such a building management system, CDM recommends hiring an independent energy management consultant to implement the system. An independent consultant can review and adjust the desired control schemes based on the existing HVAC systems and occupancy schedules to maximize the efficiency of the BMS.
All major equipment noted during CDM’s on site audit is listed in Table 4.2-7 below, along with estimated current ages and ASHRAE-expected service lives. It should be noted that only equipment that was observed at the time of the audit is included.
Table 4.2-7 Public Library HVAC Equipment Service Lives
Description [Tag ID]
Unit Location
Service Location Manufacturer Model
Estimated Efficiency
Estimated Age
(Years)
ASHRAE Expected
Life (Years)
AHU [AHU‐2] Attic
Children’s Section Carrier 38RR016500 N/A 20‐25 25
[AHU‐1] Attic Office Area Carrier Unknown N/A 15‐20 25 ACCU
[ACCU‐5] Roof Adult’s Section Trane TTA180B300BA
EER 10‐11 16 20
ACCU [ACCU‐6] Roof Entryway Sanyo CH1232 Unknown 9 20 ACCU
[ACCU‐2] Roof Children’s Section Trane TTA120B300BA
EER 10‐11 16 20

Section 4 Energy Conservation and Retrofit Measures
A 4-21
Table 4.2-7 Public Library HVAC Equipment Service Lives ACCU
[ACCU‐1] Roof Office Area Trane TTR060C100A2 EER 10‐11 16 20
ACCU [ACCU‐3] Roof
Lower Level
Auditorium Trane TTA120B300BA EER 10‐11 16 20
AHU
Lower Level
Mechanical Room
Lower Level
Auditorium Trane TWE120B300BB N/A 16 25 Electric Unit
Heater (EUH) Foyer Foyer Sanyo FH1232 100% <13 13
Boiler, Cast Iron
Boiler Room
Entire Building HB Smith Unknown 80% 29 35
A domestic water heater inventory may be seen as Table 4.2-8 below.
Table 4.2-8 Public Library Domestic Water Heaters
Location Make
Storage Capacity (Gallons) Model Number Type
Heating Capacity
Observed Condition
Boiler Room AO Smith 50 ECL 50 200 Electric 3.5 kW Good 4.2.3 DPW Main Building A model of the main building on the Department of Public Works Complex was created in eQuest to predict heating and cooling loads for the building. To calibrate this model, CDM used electricity bills and natural gas bills from December, 2007 through March, 2009. Figure 4.2-9 below compares actual monthly electricity usages, with those predicted by the eQuest model. Historical monthly usages were averaged for each month observed over multiple years.
Figure 4.2-9: DPW Main Building Electricity Usage
0
2,000
4,000
6,000
8,000
10,000
12,000
Electricity Use (kWh)
ActualPredicted

Section 4 Energy Conservation and Retrofit Measures
A 4-22
Figure 4.2-10 presents an end-usage breakdown to help the Borough visualize where CDM anticipates the electricity is ultimately being used. It should be noted that these are only estimated usages based on information gathered during CDM’s field audit.
Figure 4.2-10: DPW Main Building Electricity Usage Breakdown
Figure 4.2-11 below compares actual natural gas usage to model-predicted natural gas use.
Figure 4.2-11: DPW Main Building Natural Gas Usage
All major equipment noted during CDM’s on site audit is listed in Table 4.2-9 below, along with estimated current ages and ASHRAE-expected service lives. It should be noted that only equipment that was observed at the time of the audit is included.
0
2
4
6
8
10
12
Electricity Usage
(kWhX
1000
)
Space Cooling Space Heating Domestic Hot Water Ventilation
Exterior Lighting Miscellaneous Interior Lighting
0
200
400
600
800
1,000
1,200
1,400
Natural Gas Usage
(The
rms)
Actual
Predicted

Section 4 Energy Conservation and Retrofit Measures
A 4-23
Table 4.2-9 DPW Main Building HVAC Equipment Service Lives
Description [Tag ID]
Unit Location
Service Location Manufacturer Model
Estimated Efficiency
Estimated Age
(Years)
ASHRAE Expected
Life (Years)
Gas‐Fired Unit Heater (GFUH) Garage Garage Reznor Unknown 80% 15‐20 13
GFUH Garage Garage Reznor Unknown 80% 15‐20 13
GFUH Garage Garage Reznor Unknown 80% 15‐20 13
GFUH Garage Garage Reznor Unknown 80% 15‐20 13 Window Air Conditioner
(WAC) Ready Room
Ready Room Friedrich Unknown EER 8‐9 <10 10
WAC Office Office GE Unknown EER 8‐9 <10 10
WAC Office Office GE Unknown EER 8‐9 <10 10
WAC Break Room
Break Room Whirlpool Unknown EER 8‐9 <10 10
A domestic water heater inventory may be seen as Table 4.2-10 below.
Table 4.2-10 DPW Main Building Domestic Water Heaters
Location Make
Storage Capacity (Gallons) Model Number Type
Heating Capacity
Observed Condition
Bathroom Rheem 50 81V52DC Electric 4.5 kW Good 4.2.4 DPW Garage A model of the Garage Building on the Department of Public Works Complex was created in eQuest to predict heating and cooling loads for the building. To calibrate this model, CDM used electricity bills and natural gas bills from December, 2007 through March, 2009. Figure 4.2-12 below compares actual monthly electricity usages, with those predicted by the eQuest model. Historical monthly usages were averaged for each month observed over multiple years.

Section 4 Energy Conservation and Retrofit Measures
A 4-24
Figure 4.2-12: DPW Garage Electricity Usage
The upward trend in usage during the winter months is likely attributed to the use of electric engine block heaters, as no electric-resistance heating units were noted. However, as eQuest does not have the capacity to accurately account for block heater usage, the model has assumed a small electric heat load to mimic this usage.
Figure 4.2-13 presents an end-usage breakdown to help the Borough visualize where CDM anticipates the electricity is ultimately being used. It should be noted that these are only estimated usages based on information gathered during CDM’s field audit. The category “Space Heating” in this Figure represents usage likely attributed to engine block heaters.
Figure 4.2-13: DPW Garage Electricity Usage Breakdown
0
500
1,000
1,500
2,000
2,500
3,000
Electricity Use (kWh)
Actual
Predicted
0
1
1
2
2
3
Electricity Usage
(kWhX
1000
)
Space Heating Ventilation Exterior Lighting Miscellaneous Interior Lighting

Section 4 Energy Conservation and Retrofit Measures
A 4-25
Figure 4.2-14 below compares actual natural gas usage to model-predicted natural gas use.
Figure 4.2-14: DPW Garage Natural Gas Usage
As all of the HVAC equipment is operating well and efficiently, CDM has no HVAC-related recommendations for this building.
All major equipment noted during CDM’s on site audit is listed in Table 4.2-11 below, along with estimated current ages and ASHRAE-expected service lives. It should be noted that only equipment that was observed at the time of the audit is included.
Table 4.2-11 DPW Garage HVAC Equipment Service Lives
Description [Tag ID] Unit Location
Service Location Manufacturer Model
Estimated Efficiency
Estimated Age
(Years)
ASHRAE Expected
Life (Years)
Radiant Tube Heater (RTH) Garage Garage
Roberts Gordon Gordon Ray BH 80% <18 18
RTH Garage Garage Roberts Gordon Gordon Ray BH 80% <18 18
RTH Garage Garage Roberts Gordon Gordon Ray BH 80% <18 18
RTH Garage Garage Roberts Gordon Gordon Ray BH 80% <18 18
RTH Garage Garage Roberts Gordon Gordon Ray BH 80% <18 18
0
100
200
300
400
500
600Natural Gas Usage
(The
rms)
Actual
Predicted

Section 4 Energy Conservation and Retrofit Measures
A 4-26
4.2.5 Fire Department A model of the Fire Department was created in eQuest to predict heating and cooling loads for the building. To calibrate this model, CDM used electricity bills and natural gas bills from December, 2007 through March, 2009. Figure 4.2-15 below compares actual monthly electricity usages, with those predicted by the eQuest model. Historical monthly usages were averaged for each month observed over multiple years.
Figure 4.2-15: Fire Department Electricity Usage
Figure 4.2-16 presents an end-usage breakdown to help the Borough visualize where CDM anticipates the electricity is ultimately being used. It should be noted that these are only estimated usages based on information gathered during CDM’s field audit.
Figure 4.2-16: Fire Department Electricity Usage Breakdown
0
2,000
4,000
6,000
8,000
10,000
12,000
14,000
16,000
18,000
Electricity Use (kWh)
Actual
Predicted
0
2
4
6
8
10
12
14
16
Electricity Usage
(kWhX
1000
)
Space Cooling Ventilation Pumps & Aux Exterior Lighting Miscellaneous Interior Lighting
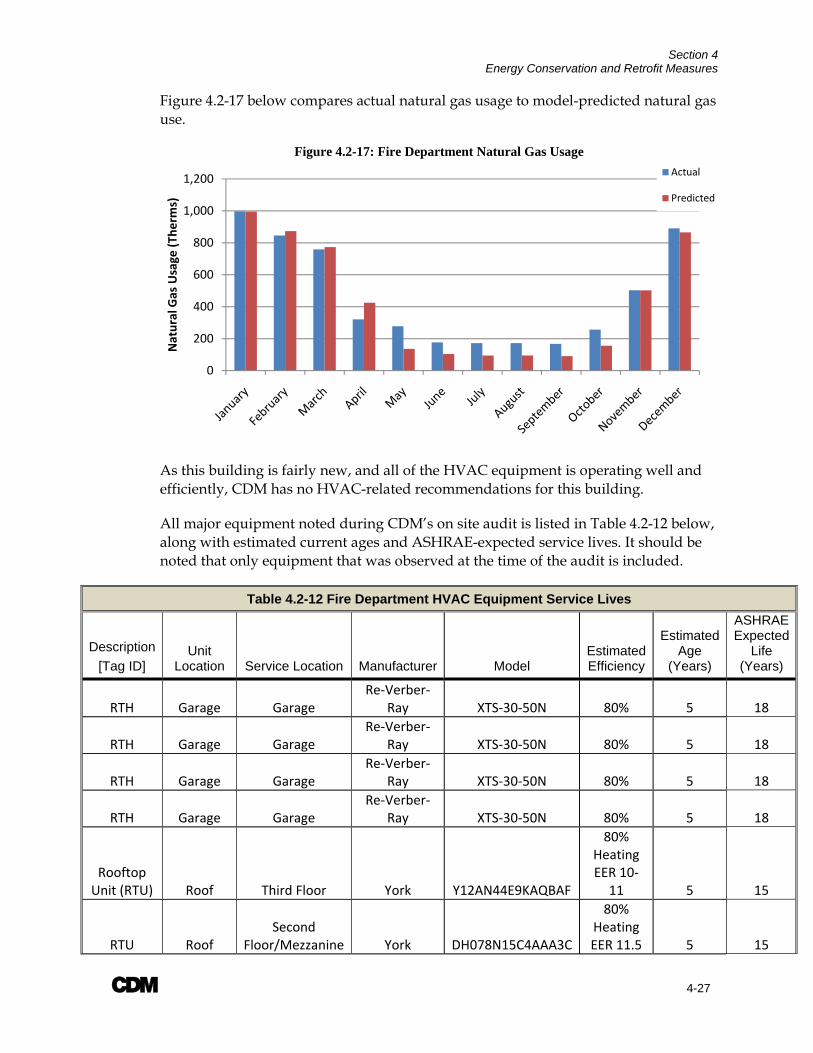
Section 4 Energy Conservation and Retrofit Measures
A 4-27
Figure 4.2-17 below compares actual natural gas usage to model-predicted natural gas use.
Figure 4.2-17: Fire Department Natural Gas Usage
As this building is fairly new, and all of the HVAC equipment is operating well and efficiently, CDM has no HVAC-related recommendations for this building.
All major equipment noted during CDM’s on site audit is listed in Table 4.2-12 below, along with estimated current ages and ASHRAE-expected service lives. It should be noted that only equipment that was observed at the time of the audit is included.
Table 4.2-12 Fire Department HVAC Equipment Service Lives
Description [Tag ID]
Unit Location Service Location Manufacturer Model
Estimated Efficiency
Estimated Age
(Years)
ASHRAE Expected
Life (Years)
RTH Garage Garage Re‐Verber‐
Ray XTS‐30‐50N 80% 5 18
RTH Garage Garage Re‐Verber‐
Ray XTS‐30‐50N 80% 5 18
RTH Garage Garage Re‐Verber‐
Ray XTS‐30‐50N 80% 5 18
RTH Garage Garage Re‐Verber‐
Ray XTS‐30‐50N 80% 5 18
Rooftop Unit (RTU) Roof Third Floor York Y12AN44E9KAQBAF
80% Heating EER 10‐
11 5 15
RTU Roof Second
Floor/Mezzanine York DH078N15C4AAA3C
80% Heating EER 11.5 5 15
0
200
400
600
800
1,000
1,200Natural Gas Usage
(The
rms)
Actual
Predicted
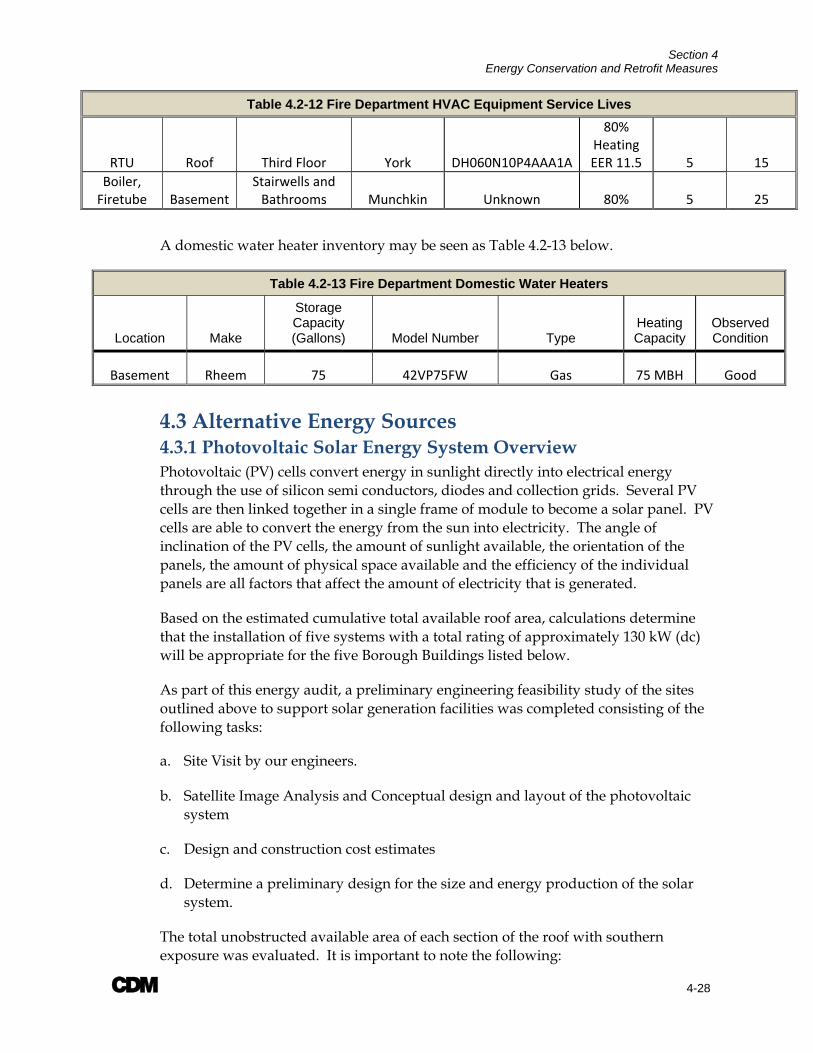
Section 4 Energy Conservation and Retrofit Measures
A 4-28
Table 4.2-12 Fire Department HVAC Equipment Service Lives
RTU Roof Third Floor York DH060N10P4AAA1A
80% Heating EER 11.5 5 15
Boiler, Firetube Basement
Stairwells and Bathrooms Munchkin Unknown 80% 5 25
A domestic water heater inventory may be seen as Table 4.2-13 below.
Table 4.2-13 Fire Department Domestic Water Heaters
Location Make
Storage Capacity (Gallons) Model Number Type
Heating Capacity
Observed Condition
Basement Rheem 75 42VP75FW Gas 75 MBH Good
4.3 Alternative Energy Sources 4.3.1 Photovoltaic Solar Energy System Overview Photovoltaic (PV) cells convert energy in sunlight directly into electrical energy through the use of silicon semi conductors, diodes and collection grids. Several PV cells are then linked together in a single frame of module to become a solar panel. PV cells are able to convert the energy from the sun into electricity. The angle of inclination of the PV cells, the amount of sunlight available, the orientation of the panels, the amount of physical space available and the efficiency of the individual panels are all factors that affect the amount of electricity that is generated.
Based on the estimated cumulative total available roof area, calculations determine that the installation of five systems with a total rating of approximately 130 kW (dc) will be appropriate for the five Borough Buildings listed below.
As part of this energy audit, a preliminary engineering feasibility study of the sites outlined above to support solar generation facilities was completed consisting of the following tasks:
a. Site Visit by our engineers.
b. Satellite Image Analysis and Conceptual design and layout of the photovoltaic system
c. Design and construction cost estimates
d. Determine a preliminary design for the size and energy production of the solar system.
The total unobstructed available area of each section of the roof with southern exposure was evaluated. It is important to note the following:

Section 4 Energy Conservation and Retrofit Measures
A 4-29
1. The structural integrity of the roofs was not confirmed during our site visit. The municipal buildings may require some degree of roofing work prior to the implementation of a solar system.
2. In the case of the flat areas, the PV system sizing and kWh production was calculated assuming the installation of a crystalline module facing south direction (180 Degree Azimuth) and tilted approximately 20 degrees to allow better rain water shedding and snow melting. Please note that the kWh production as well as system size may differ significantly based on final panel tilt selected during the RFP and design phase.
3. Blended electric rates were used based on actual utility bills and were applied for the facility.
The following is a preliminary study on the feasibility of installing PV solar systems at the five Borough buildings to generate a portion of each facility’s electricity requirements. Each system is designed to offset the electric purchased from the local utility and not as a backup or emergency source of power.
In order to determine the best location for the installation of the PV solar system, a satellite image analysis and site walkthrough of the buildings was performed on February 3rd. As per the Scope of Work, only the building roofs were considered for PV installation.
Also, as part of our assessment we investigated possible locations for electrical equipment that need to be installed such as combiner boxes, disconnect switches and DC to AC inverters. Consideration was also given to locations of interconnection between the solar system and building’s electrical grid.
4.3.1.1 Borough Hall Building The roof of the Borough Hall Building is a pitched roof with very few obstructions. The few obstructions include some vent piping, two chimneys, and an ornamental structure at the peak. There is no amount of shading on the roof from adjacent foliage that would need to be addressed during the design phase of the project. The structural integrity of the roof was not confirmed although a visual inspection revealed no leaks or major defects. The structural integrity of the roof and the existence of a warranty shall be confirmed prior to the implementation of a PV system.
The Project Team conducted both a facility walkthrough and a satellite image analysis and based on the estimated total available area we calculated the installation of a solar system, rated at approximately 34.3 kW (dc).
Electrical Service The existing electrical service size of the Borough Hall Building is 3-phase, 277/480V, at 600 Amps. The interconnection point for the PV system will require a modification or replacement of the existing service entrance equipment wherein the PV system feeder connections will have to be made after the main circuit breaker, and protective
Section 4 Energy Conservation and Retrofit Measures
A 4-30
relaying will also have to be implemented. Any connection points would have to meet NEC and local utility requirements. Further investigation and verification of existing electrical equipment would be required prior to implementation of a PV system.
4.3.1.2 Public Library The roof of the Public Library is a pitched roof with a very few obstructions such as exhaust fans, rooftop HVAC units, and electrical and gas piping. There is a minimal amount of shading on the roof from adjacent foliage that would need to be addressed during the design phase of the project. The structural integrity of the roof was not confirmed although a visual inspection revealed no leaks or major defects. The structural integrity of the roof and the existence of a warranty shall be confirmed prior to the implementation of a PV system.
The Project Team conducted both a facility walkthrough and a satellite image analysis and based on the estimated total available area we calculated the installation of a solar system, rated at approximately 16.8 kW (dc).
Electrical Service The existing electrical service size of the Public Library is 3-phase, 120/208V, at 800 Amps. The interconnection point for the PV system will require a modification or replacement of the existing service entrance equipment wherein the PV system feeder connections will have to be made after the main circuit breaker, and protective relaying will also have to be implemented. Any connection points would have to meet NEC and local utility requirements. Further investigation and verification of existing electrical equipment would be required prior to implementation of a PV system.
4.3.1.3 DPW Main Building The roof of the DPW Main Building is a combination of a pitched roof with very few obstructions and a flat roof over the work shop area. These flat surfaces have few obstructions such as exhaust fans, a chimney, and electrical and gas piping. There is no amount of shading on the roof from adjacent foliage that would need to be addressed during the design phase of the project. The structural integrity of the roof was not confirmed although a visual inspection revealed no leaks or major defects. The structural integrity of the roof and the existence of a warranty shall be confirmed prior to the implementation of a PV system.
The Project Team conducted both a facility walkthrough and a satellite image analysis and based on the estimated total available area we calculated the installation of a solar system, rated at approximately 55 kW (dc).
Electrical Service The existing electrical service size of the DPW Main Building is 1-phase, 120/240V, at 200 Amps. The interconnection point for the PV system will require a modification or replacement of the existing service entrance equipment wherein the PV system feeder connections will have to be made after the main circuit breaker, and protective

Section 4 Energy Conservation and Retrofit Measures
A 4-31
relaying will also have to be implemented. Any connection points would have to meet NEC and local utility requirements. Further investigation and verification of existing electrical equipment would be required prior to implementation of a PV system.
4.3.1.4 DPW Garage The roof of the DPW Garage is a pitched roof with a very few obstructions such as electrical and gas piping. There is a no amount of shading on the roof from adjacent foliage that would need to be addressed during the design phase of the project. The structural integrity of the roof was not confirmed although a visual inspection revealed no leaks or major defects. The structural integrity of the roof and the existence of a warranty shall be confirmed prior to the implementation of a PV system.
The Project Team conducted both a facility walkthrough and a satellite image analysis and based on the estimated total available area we calculated the installation of a solar system, rated at approximately 11.5 kW (dc).
Electrical Service The existing electrical service size of the DPW Garage is 1-phase, 120/240V, at 200 Amps. The interconnection point for the PV system will require a modification or replacement of the existing service entrance equipment wherein the PV system feeder connections will have to be made after the main circuit breaker, and protective relaying will also have to be implemented. Any connection points would have to meet NEC and local utility requirements. Further investigation and verification of existing electrical equipment would be required prior to implementation of a PV system.
4.3.1.5 Fire Department The roof of the Fire Department is a flat roof with some obstructions such as exhaust fans, rooftop HVAC units, and electrical and gas piping. There is no amount of shading on the roof from adjacent foliage that would need to be addressed during the design phase of the project. The structural integrity of the roof was not confirmed although a visual inspection revealed no leaks or major defects. The structural integrity of the roof and the existence of a warranty shall be confirmed prior to the implementation of a PV system.
The Project Team conducted both a facility walkthrough and a satellite image analysis and based on the estimated total available area we calculated the installation of a solar system, rated at approximately 12.1 kW (dc).
Electrical Service The existing electrical service size of the Fire Department is 3-phase, 277/480V, at 200 Amps. The interconnection point for the PV system will require a modification or replacement of the existing service entrance equipment wherein the PV system feeder connections will have to be made after the main circuit breaker, and protective relaying will also have to be implemented. Any connection points would have to

Section 4 Energy Conservation and Retrofit Measures
A 4-32
Fixed Tilt System
meet NEC and local utility requirements. Further investigation and verification of existing electrical equipment would be required prior to implementation of a PV system.
4.3.1.6 Basis for Design and Calculations
The proposed Photovoltaic (PV) Power systems outlined above for each facility are comprised of the PV arrays, inverter(s), combiner boxes, disconnect switches, and all of the necessary wiring and interconnection equipment. The solar panels will be mounted onto the roof. The array outputs will feed power into the DC to AC inverters. AC outputs will then be connected at each building’s electrical service as outlined above. Pending further engineering analysis of the roofs, it is yet to be determined if the solar arrays will be installed using a self-ballasting system, or roof penetration system, or a combination of both.
The most common roof mounted system is referred to as a (“fixed tilt”) system typically mounted to a metal rack that can be fixed at a specific angle. There are also (“tracking systems”) or movable along one or two axes to follow the position of the sun during the day. For a roof-mounted PV system, tracking systems are very rarely installed and are usually used for ground-mounted systems only, as they require more complex racks and higher maintenance costs. For the “fixed” system, the tilt is determined based on the following factors: geographical location, total targeted kWh production, seasonal electricity requirements and weather conditions such as wind. Ideally, the module tilt for Central to Eastern New Jersey should be 25-35 degrees with an azimuth as close as possible to 180 (south); however, our experience has shown that PV systems are typically installed at a tilt of 20 degrees or lower in order to avoid any issues with wind and to maximize total system size
The type of PV panels and equipment used to mount the system shall be determined based on the wind conditions and structural integrity of the roof determined during the design phase of the project. In general, penetration/tie-down systems, non-penetrating ballasted type systems, or a combination of the two should be considered.
In addition to the installation of the solar panels, the roof of the Borough Hall building should be replaced prior to panel installation. Due to the excessive age of the roof, it is necessary that the roof be demolished and replaced before any panel installation is finalized for its lifetime.

Section 4 Energy Conservation and Retrofit Measures
A 4-33
Calculation of PV System Yield An industry accepted software package PV Watts was used to calculate projected annual electrical production of the crystalline silicon PV system in its first year, as summarized in Table 4.3-1. The system was designed to provide maximum kWh production based on available roof space.
Table 4.3-1 Summary of Solar (PV) Systems
Site Est. Area (ft2)
kWh Annual Energy Savings
Est. Annual SREC
Lifetime Energy Savings
(25 Years)*
Annual Return On Investment
(AROI)
Net Present Value (NPV)
Internal Rate of Return (IRR)
Borough Hall 3,426 41,170 $6,113.7 $27,790 $222,901 2.6% -$96,243 0.7%
Public Library 1,684 20,237 $3,735.8 $13,660 $136,205 1.5% -$94,152 -0.6%
DPW Main Building 5,502 66,118 $9,805.3 $44,360 $357,494 3.3% -$79,111 1.8%
DPW Garage 1,150 14,094 $2,460.8 $9,513 $89,719 0.7% -$104,172 -2.1%
Fire Department 1,212 14,565 $2,152.7 $9,831 $78,486 0.6% -$115,055 -2.7%
*3% yearly inflation on electricity costs
Total Costs It should be noted that construction costs are only estimates based on historic data compiled from similar installations, and engineering opinion. Additional engineering and analysis is required to confirm the condition of the roofs, structural integrity of the roofs, the system type, sizing, costs and savings. Budget costs assume existing roofs are structurally sound, do not need to be replaced, and can accommodate a solar system. For illustration purposes, a draft financial analysis pro forma is attached outlining all project costs and revenues.
Table 4.3-2 Engineers Opinion of Probable Cost
Engineers Opinion of Probable Cost $2,084,575
As stated above the estimated installation costs are based on significant experience with the pricing of solar installations in New Jersey, and are intended to provide the Borough with a realistic budget cost. A typical solar installation can vary in cost from $7.00 - $10.00 per watt depending on size, complexity of the system, labor rates, etc. Approximately 60-70% of that number is material costs while the balance is labor, engineering, etc. Like any installation, certain conditions can affect a price upward or downward. For purposes of this analysis the estimated installation cost does not include any roofing or structural work which may be required to maintain warranties or for additional structural support. We have included a budget of $9/watt for the solar system installation with an additional estimated budget of $100,000 for potential electric service work.

Section 4 Energy Conservation and Retrofit Measures
A 4-34
Refer to Section 7 for discussion on Solar Renewable Energy Certificates and other financing options for solar projects. The financial model in Appendix E provides an annual forecast illustration of project revenues and costs for 25 years.
4.3.2 Geothermal Energy Geothermal systems utilize the constant temperature of the earth throughout the year (at depths from 5 ft. to 1,000 ft. the earth temperature remains at 53 deg. F) as the primary source of energy for the heating/cooling and domestic hot water production. Additionally, since the earth is maintained at a constant temperature from heat absorbed from the sun this energy is considered a “renewable resource,” and therefore is not as reliant on existing supplies of fossil fuels
Even though this application requires significantly higher up-front costs, it has several advantages over conventional HVAC systems such as substantially lower operating and maintenance costs. The life span of the system is longer than conventional heating and cooling systems. Most loop fields are warranted for 25 to 50 years and are expected to last at least 50 to 100 years. However it is important to note that geothermal systems are more difficult to install in existing facilities and require higher capital cost due to having to complete significant infrastructure changes.
The Borough Hall may be a potential candidate for ground source heat pumps, because there is an existing hot water system that may be used to bring ground-loop water to water source heat pumps. Depending on required flows, this may eliminate the need to run piping through the building, which drastically reduces initial construction costs.
All estimates for ground source heat pump systems are based on assumed soil and ground conditions. Test boring would need to be performed to confirm the adequacy of the ground conditions for a ground source heat pump system.
Figure 4.3-1 shows the predicted electricity usage resulting from implementation of a GSHP system. The water source heat pumps that would supply building heat in lieu of the boiler system will require more electricity in the winter. Therefore, a GSHP system may result in increased electricity usage and decreased natural gas usage.
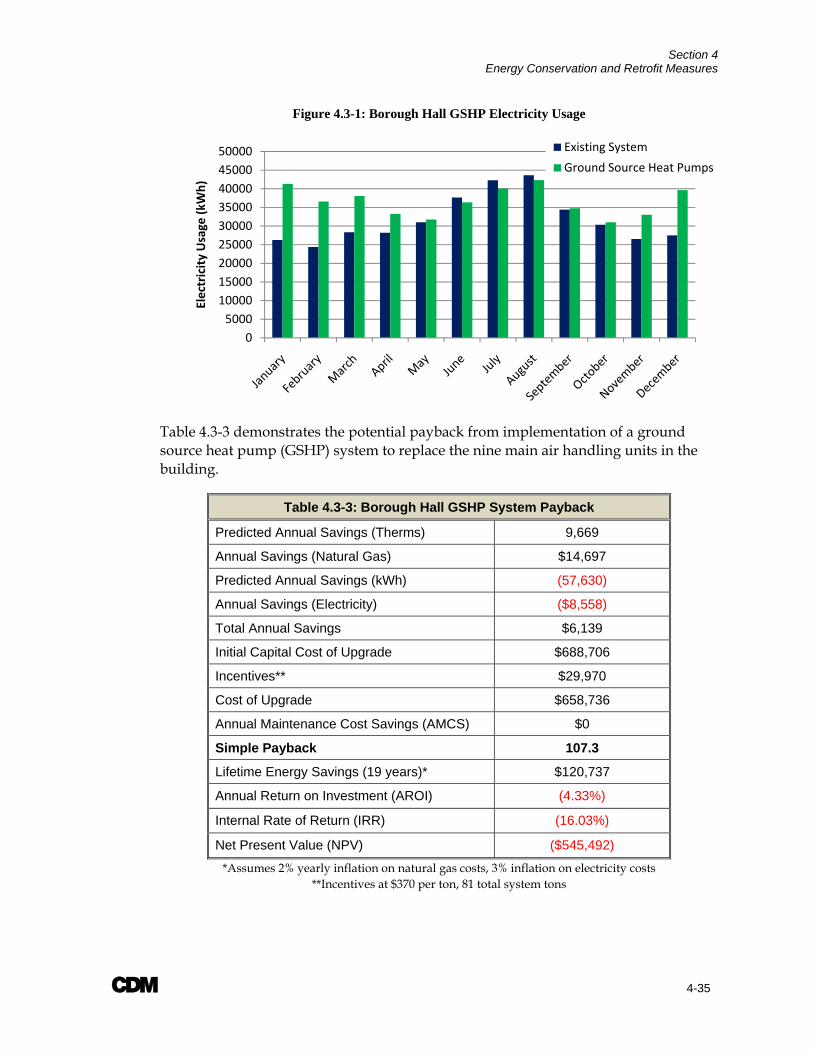
Section 4 Energy Conservation and Retrofit Measures
A 4-35
Figure 4.3-1: Borough Hall GSHP Electricity Usage
Table 4.3-3 demonstrates the potential payback from implementation of a ground source heat pump (GSHP) system to replace the nine main air handling units in the building.
Table 4.3-3: Borough Hall GSHP System Payback
Predicted Annual Savings (Therms) 9,669
Annual Savings (Natural Gas) $14,697
Predicted Annual Savings (kWh) (57,630)
Annual Savings (Electricity) ($8,558)
Total Annual Savings $6,139
Initial Capital Cost of Upgrade $688,706
Incentives** $29,970
Cost of Upgrade $658,736
Annual Maintenance Cost Savings (AMCS) $0
Simple Payback 107.3
Lifetime Energy Savings (19 years)* $120,737
Annual Return on Investment (AROI) (4.33%)
Internal Rate of Return (IRR) (16.03%)
Net Present Value (NPV) ($545,492)
*Assumes 2% yearly inflation on natural gas costs, 3% inflation on electricity costs **Incentives at $370 per ton, 81 total system tons
05000
100001500020000250003000035000400004500050000
Electricity Usage
(kWh)
Existing System
Ground Source Heat Pumps

Section 4 Energy Conservation and Retrofit Measures
A 4-36
Due to the high initial capital cost associated with a switch to ground source heat pump system, CDM recommends against pursuing this implementation at the Borough Hall at this time.
The Library is also a potential candidate for ground source heat pumps, because there is an existing hot water system that may be used to bring ground-loop water to water source heat pumps. Depending on required flows, this may eliminate the need to run piping through the building, which drastically reduces initial construction costs.
Figure 4.3-2 shows the predicted electricity usage resulting from implementation of a GSHP system. The water source heat pumps that would supply building heat in lieu of the boiler system will require more electricity in the winter. Therefore, a GSHP system may result in increased electricity usage and decreased natural gas usage.
Figure 4.3-2: Public Library GSHP Electricity Usage
Table 4.3-4 demonstrates the potential payback from implementation of a ground source heat pump (GSHP) system to replace the four main air handling units in the building. The basement areas heated by hot water unit heaters remain unaffected under this recommendation evaluation.
Table 4.3-4: Public Library GSHP System Payback
Predicted Annual Savings (Therms) 4,966
Annual Savings (Natural Gas) $6,108
Predicted Annual Savings (kWh) 4,640
Annual Savings (Electricity) $857
Total Annual Savings $6,965
Initial Capital Cost of Upgrade $413,218
Incentives** $17,020
Cost of Upgrade $396,198
0
2000
4000
6000
8000
10000
12000
14000
16000
Electricity Usage
(kWh)
Existing SystemGround Source Heat Pumps

Section 4 Energy Conservation and Retrofit Measures
A 4-37
Table 4.3-4: Public Library GSHP System Payback
Annual Maintenance Cost Savings (AMCS) $0
Simple Payback 56.9
Lifetime Energy Savings (19 years)* $161,035
Annual Return on Investment (AROI) (3.51%)
Internal Rate of Return (IRR) (6.66%)
Net Present Value (NPV) ($267,717)
*Assumes 2% yearly inflation on natural gas costs, 3% inflation on electricity costs **Incentives at $370 per ton, 46 total system tons
Due to the high initial capital cost associated with a switch to ground source heat pump system, CDM recommends against pursuing this implementation at the Public Library at this time.
The DPW garages are not good candidates for GSHP systems. These buildings do not have existing water infrastructure, and they require very little cooling. GSHP systems are best-suited for buildings with similar heating and cooling loads, such as office buildings. Therefore, CDM recommends against pursuing GSHP systems at these facilities.
The Fire Department does not have an existing water heating or cooling system. The cost to install the infrastructure needed to operate a GSHP system at this facility would be significant. Therefore, CDM recommends against pursuing a GSHP system at this facility.
4.3.3 On-Site Wind Power Generation On-site wind power generation typically utilizes a form of turbine, which is rotated with the flow of wind across it, this rotational force powers a generator, producing DC electricity. The DC electricity is then converted into AC electricity, which can be used for commercial power, or can be fed back into the power grid, reducing the overall electric demand. The size of the turbine is proportional to the amount of wind and concurrently the amount of energy it can produce. An ideal location for a wind turbine is 20 feet above any surrounding object within a 250 foot radius. In general this relates to a property size of one acre or more.
CDM has determined that it is feasible for the Borough of Westwood to install a wind turbine energy system on the DPW grounds. A wind turbine energy system would not be viable for the other municipal buildings as the available ground space required for a wind turbine is either paved, or limited in available area. For the purpose of this feasibility analysis, CDM’s recommended payback is for a 1-10KW wind turbine. Depending on area available, and funding, the Borough may choose to install more than 1 wind turbine on the premises.
Utilizing NASA’s online wind mapping tool, it was determined that the local average wind speeds at the DPW Grounds ranged from 8.52mph to 12.35mph at 100ft, or

Section 4 Energy Conservation and Retrofit Measures
A 4-38
3.81m/s to 5.52m/s at 30m. In general, around 9mph of average wind speed, as determined over the course of a year, is necessary to “fuel” the turbine. These values fall within the range of feasibility for installation of a new wind turbine system.
For the purposes of this feasibility analysis, CDM chose a 10KW Bergey wind turbine. This turbine size is used most often for small commercial applications. Power Curve data was determined through the use of the product specification sheets on vendor websites, and vendor provided tools. Actual turbine size, height, location, and manufacturer should be determined upon design of a wind turbine system.
The estimated wind speed data, associated wind probability distribution function (weibull value), turbulence losses, and other relevant data were then incorporated into Bergey’s Wind Cad program to estimate the annual output for the wind turbine. Refer to Appendix J for Wind Cad Modeling.
In order to determine simple payback analysis of the proposed wind turbine, CDM used the vendor pricing information located on the Bergey Wind Turbine website (www.bergey.com), for more information on wind turbine cost estimation refer to Appendix G. By installing the proposed wind turbine, Westwood will offset between $846.10 and $2,401.6 per year in utility costs based on the minimum and maximum average local wind speeds. In addition, Renewable Energy Credits (REC’s) are obtainable for renewable power and incentives are available through the Renewable Energy Incentive Program (REIP); refer to Section 7 for a more in depth explanation.
This simple payback calculation takes into account the incentive provided for wind turbines through the REIP program. For the first 16,000 kWh of production, the incentive is $3.20/kWh. For production between 16,000 kWh – 750,000 kWh the REIP program incentive is $0.50/kWh. CDM used this incentive as an upfront deduction from the Engineer's Opinion of Probable Cost. In addition, in order to benefit from the REIP incentive, the Borough must purchase a wind turbine on the approved NJ Clean Energy list. CDM chose the Bergey wind turbine for this analysis as it is approved by the NJ Clean Energy program and is the appropriate size for smaller commercial installations. Refer to the NJ Clean Energy website for more information.
Table 4.3-5 includes a simple payback analysis for the installation of a wind turbine energy system on the DPW grounds. Refer to Appendix K for a more detailed wind turbine financing spreadsheet, including utility cost avoidance and REC’s.
Table 4.3-5: Simple Payback Analysis for Wind Turbine Energy System
Parameter Wind Turbine (Minimum Site
Wind Speed – 8.5 mph)
Wind Turbine (Maximum Site
Wind Speed – 12.4 mph)
Wind Turbine (Average Site Wind Speed –
10.6 mph)
Engineer’s Opinion of Probable Cost
$68,489.69 $68,489.69 $68,489.69
Renewable Energy Incentive Program**
-$18,256 -$51,297 -$34,083
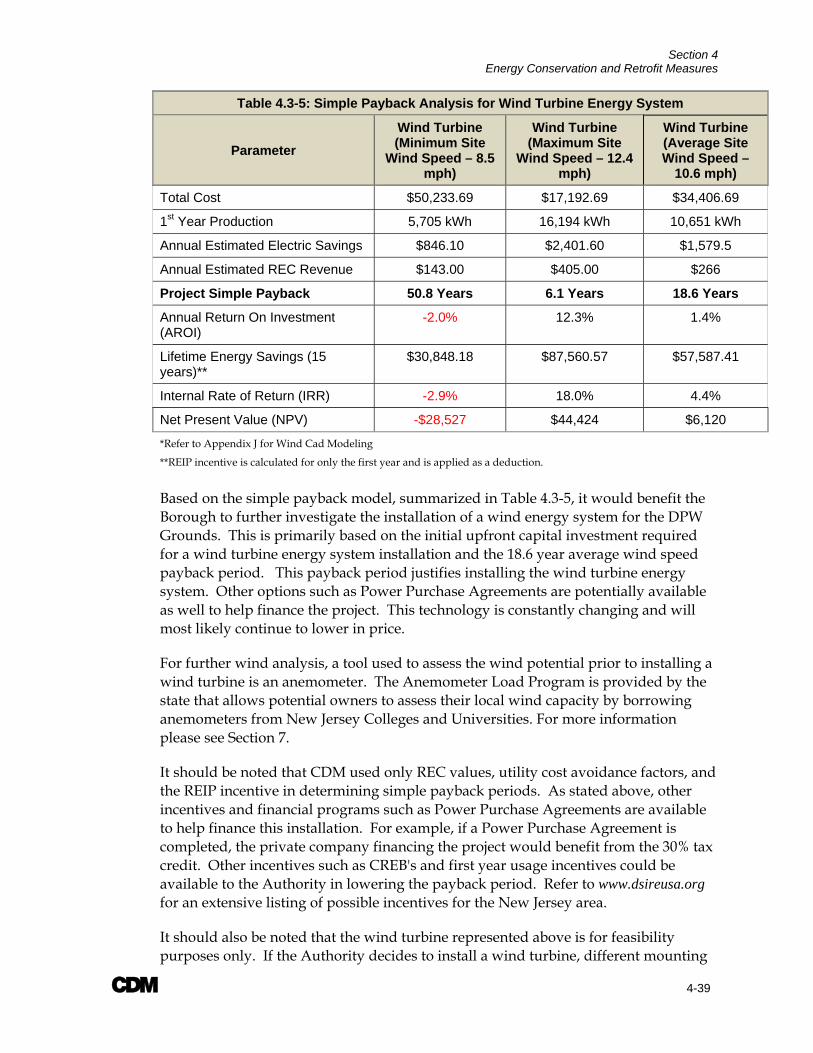
Section 4 Energy Conservation and Retrofit Measures
A 4-39
Table 4.3-5: Simple Payback Analysis for Wind Turbine Energy System
Parameter Wind Turbine (Minimum Site
Wind Speed – 8.5 mph)
Wind Turbine (Maximum Site
Wind Speed – 12.4 mph)
Wind Turbine (Average Site Wind Speed –
10.6 mph)
Total Cost $50,233.69 $17,192.69 $34,406.69
1st Year Production 5,705 kWh 16,194 kWh 10,651 kWh
Annual Estimated Electric Savings $846.10 $2,401.60 $1,579.5
Annual Estimated REC Revenue $143.00 $405.00 $266
Project Simple Payback 50.8 Years 6.1 Years 18.6 Years
Annual Return On Investment (AROI)
-2.0% 12.3% 1.4%
Lifetime Energy Savings (15 years)**
$30,848.18 $87,560.57 $57,587.41
Internal Rate of Return (IRR) -2.9% 18.0% 4.4%
Net Present Value (NPV) -$28,527 $44,424 $6,120
*Refer to Appendix J for Wind Cad Modeling
**REIP incentive is calculated for only the first year and is applied as a deduction. Based on the simple payback model, summarized in Table 4.3-5, it would benefit the Borough to further investigate the installation of a wind energy system for the DPW Grounds. This is primarily based on the initial upfront capital investment required for a wind turbine energy system installation and the 18.6 year average wind speed payback period. This payback period justifies installing the wind turbine energy system. Other options such as Power Purchase Agreements are potentially available as well to help finance the project. This technology is constantly changing and will most likely continue to lower in price.
For further wind analysis, a tool used to assess the wind potential prior to installing a wind turbine is an anemometer. The Anemometer Load Program is provided by the state that allows potential owners to assess their local wind capacity by borrowing anemometers from New Jersey Colleges and Universities. For more information please see Section 7.
It should be noted that CDM used only REC values, utility cost avoidance factors, and the REIP incentive in determining simple payback periods. As stated above, other incentives and financial programs such as Power Purchase Agreements are available to help finance this installation. For example, if a Power Purchase Agreement is completed, the private company financing the project would benefit from the 30% tax credit. Other incentives such as CREB's and first year usage incentives could be available to the Authority in lowering the payback period. Refer to www.dsireusa.org for an extensive listing of possible incentives for the New Jersey area.
It should also be noted that the wind turbine represented above is for feasibility purposes only. If the Authority decides to install a wind turbine, different mounting
Section 4 Energy Conservation and Retrofit Measures
A 4-40
heights, turbine sizes, and manufacturers should be considered. In addition, permits may be required for installation according to local zoning laws. The FAA must also be notified in order to give clearance for the tower, and for installation of aviation safety lights if necessary.
4.3.4 Hydro-Electric Energy Presently, the Borough of Westwood in conjunction with a local resident and college professor is investigating the utilization of water as an alternative energy source through the use of a turbine. Water power is the combination of head and flow. In a typical hydro system, water is diverted from a stream or reservoir into a pipeline called a penstock, where it is conveyed downhill and through a turbine. The vertical drop or static elevation (head) creates pressure at the bottom end of the penstock. The pressurized water emerging from the end of the penstock creates the force that drives the turbine. More flow or more head increases the potential power that can be generated.
As an alternative energy source, the installation of a hydro-electric system will reduce the Borough’s overall carbon footprint. The implementation of a hydro-electric system will work to reduce carbon emissions, reduce the demand on the electric power grid and reduce the dependence on fossil fuel sources for the production of electricity. CDM encourages the Borough to continue pursuing the investigation and future implementation of a hydro-electric system as a viable source of alternative energy.
4.4 Additional Measures It may be possible to reduce the plug load of the facilities even further with the implementation of smart strips and energy star appliances. Smart Strips save energy by electronically unplugging all of the devices that are plugged into the “Automatically Switched outlets” when the device plugged into the control outlet is turned off. It is important to note that CDM is not suggesting that computers be plugged into the automatically switched off outlets, as there would be potential for the computers to be shut off mid-operation. There are a vast amount of computer peripherals that are typically left on after a computer is shut off, including monitors, scanners, printers and DSL/Cable modems. These peripherals can be plugged into the automatic outlets.
A standard Smart Strip has one ‘control’ outlet, six (6) outlets that are automatically switched off when the control device is and three (3) outlets that are always hot. An example of how the Borough can implement the use of Smart Strips office or library settings is to plug a computer into the control outlet, five (5) monitors and a personal printer (8 W in standby mode) into the automatic outlets and three (3) computers into the always hot outlets. An LCD monitor can use up to 34W; in standby mode the monitor utilizes 1 – 2W. A CRT monitor typically utilizes around 75W. The following table 4.4-1 summarizes the payback of a Smart Strip, assuming 5 LCD monitors and 1 printer are automatically powered down that would otherwise been left on 8 hours/day and in standby mode 16 hours/day, 5 days/week for 9 months.
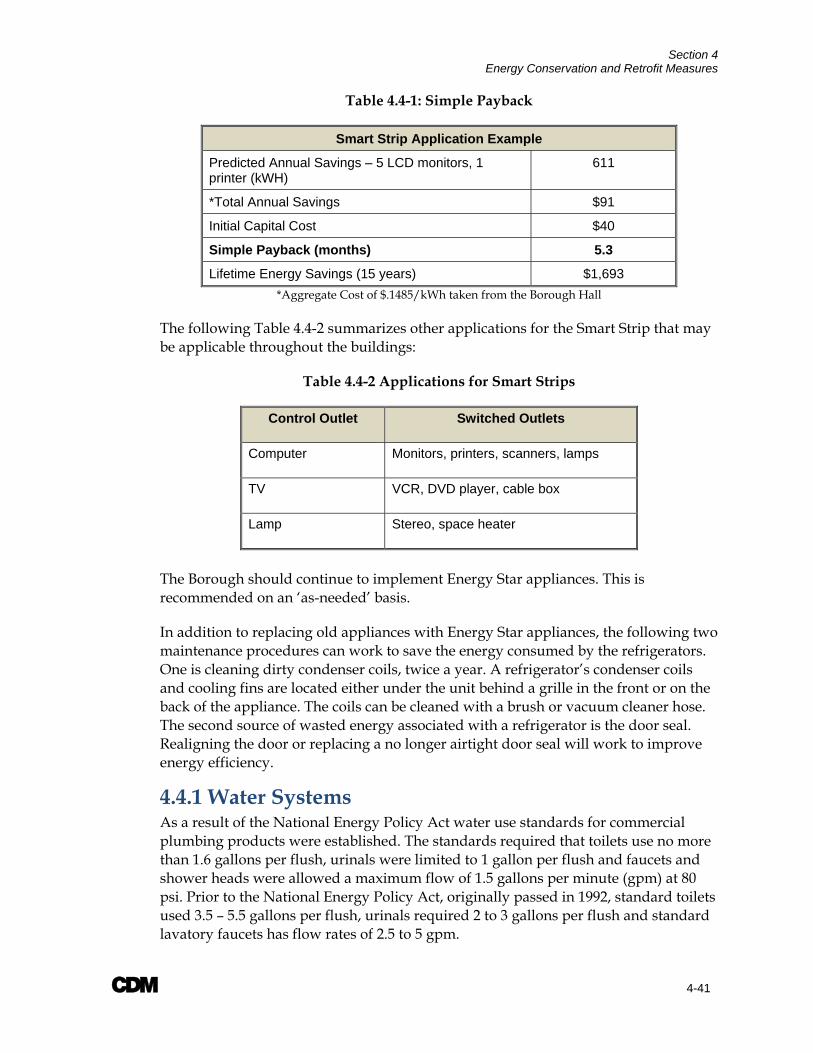
Section 4 Energy Conservation and Retrofit Measures
A 4-41
Table 4.4-1: Simple Payback
Smart Strip Application Example
Predicted Annual Savings – 5 LCD monitors, 1 printer (kWH)
611
*Total Annual Savings $91
Initial Capital Cost $40
Simple Payback (months) 5.3
Lifetime Energy Savings (15 years) $1,693 *Aggregate Cost of $.1485/kWh taken from the Borough Hall
The following Table 4.4-2 summarizes other applications for the Smart Strip that may be applicable throughout the buildings:
Table 4.4-2 Applications for Smart Strips
Control Outlet Switched Outlets
Computer Monitors, printers, scanners, lamps
TV VCR, DVD player, cable box
Lamp Stereo, space heater
The Borough should continue to implement Energy Star appliances. This is recommended on an ‘as-needed’ basis.
In addition to replacing old appliances with Energy Star appliances, the following two maintenance procedures can work to save the energy consumed by the refrigerators. One is cleaning dirty condenser coils, twice a year. A refrigerator’s condenser coils and cooling fins are located either under the unit behind a grille in the front or on the back of the appliance. The coils can be cleaned with a brush or vacuum cleaner hose. The second source of wasted energy associated with a refrigerator is the door seal. Realigning the door or replacing a no longer airtight door seal will work to improve energy efficiency.
4.4.1 Water Systems As a result of the National Energy Policy Act water use standards for commercial plumbing products were established. The standards required that toilets use no more than 1.6 gallons per flush, urinals were limited to 1 gallon per flush and faucets and shower heads were allowed a maximum flow of 1.5 gallons per minute (gpm) at 80 psi. Prior to the National Energy Policy Act, originally passed in 1992, standard toilets used 3.5 – 5.5 gallons per flush, urinals required 2 to 3 gallons per flush and standard lavatory faucets has flow rates of 2.5 to 5 gpm.

Section 4 Energy Conservation and Retrofit Measures
A 4-42
Appendix M presents a compiled inventory of the water fixtures per building and assumptions made to determine existing monthly water consumption and the water and cost savings that would result from the installation of new low flow toilets and urinals and retrofitting the existing faucets with low flow aerators.
In general, replacement of the water fixtures results in a 40 – 50% reduction in water consumption. Water is currently available to customers at low rates, specifically for United Water customers in New Jersey water consumption is charged at $4.40/1,000 gallons of water used.
Although these water savings retrofits are a sustainable solution, benefiting society as a whole, the associated cost savings are minimal when compared to the investments, resulting in generally unattractive paybacks. Tables 4.4-3, 4.4-4, 4.4-5, and 4.4-6 demonstrate the anticipated savings and simple paybacks associated with these measures. No maintenance cost savings are anticipated with this measure. Additionally, no incentives were found to offset the cost of implementing automatic sensors and flushometers.
Table 4.4-3: Borough Hall Water Fixtures Payback
Predicted Annual Savings (Gallons of Water) 110,040
Annual Savings $484
Initial Capital Cost of Upgrade $21,090
Incentives $0
Cost of Upgrade $21,090
Annual Maintenance Cost Savings (AMCS) $0
Simple Payback 43.6
Lifetime Energy Savings (15 years)* $9,002
Annual Return on Investment (AROI) (4.37%)
Internal Rate of Return (IRR) (8.69%)
Net Present Value (NPV) ($14,041)
Table 4.4-4: Public Library Water Fixtures Payback
Predicted Annual Savings (Gallons of Water) 12,972
Annual Savings $57
Initial Capital Cost of Upgrade $6,584
Incentives $0
Cost of Upgrade $6,584
Annual Maintenance Cost Savings (AMCS) $0
Simple Payback 115.5
Lifetime Energy Savings (15 years)* $1,060

Section 4 Energy Conservation and Retrofit Measures
A 4-43
Table 4.4-4: Public Library Water Fixtures Payback
Annual Return on Investment (AROI) (5.80%)
Internal Rate of Return (IRR) (16.57%)
Net Present Value (NPV) ($5,754)
Table 4.4-5: DPW Garages Water Fixtures Payback
Predicted Annual Savings (Gallons of Water) 20,394
Annual Savings $90
Initial Capital Cost of Upgrade $8,555
Incentives $0
Cost of Upgrade $8,555
Annual Maintenance Cost Savings (AMCS) $0
Simple Payback 95.1
Lifetime Energy Savings (15 years)* $1,674
Annual Return on Investment (AROI) (5.61%)
Internal Rate of Return (IRR) (15.12%)
Net Present Value (NPV) ($7,244)
Table 4.4-6: Fire Department Water Fixtures Payback
Predicted Annual Savings (Gallons of Water) 1,854
Annual Savings $8
Initial Capital Cost of Upgrade $17,758
Incentives $0
Cost of Upgrade $17,758
Annual Maintenance Cost Savings (AMCS) $0
Simple Payback 2,220
Lifetime Energy Savings (15 years)* $149
Annual Return on Investment (AROI) (6.62%)
Internal Rate of Return (IRR) (34.18%)
Net Present Value (NPV) ($17,642)

A 5-1
Section 5 Evaluation of Energy Purchasing and Procurement Strategies 5.1 Energy Deregulation In 1999, New Jersey State Legislature passed the Electric Discount & Energy Competition Act (EDECA) to restructure the electric power industry in New Jersey. This law, the deregulation of the market, allowed all consumers to shop for their electric supplier. The intent was to create a competitive market for electrical energy supply. As a result, utilities were allowed to charge Cost of Service and customers were given the ability to choose a third party supplier. Energy deregulation in New Jersey increased the energy buyers’ options by separating the function of electricity distribution from that of electricity supply.
To sell electric generation service in New Jersey, electric power suppliers must be licensed by the New Jersey Board of Public Utilities (NJ BPU). They must also be registered with the local public utility (PSE&G) to sell electric service in that utility’s service areas. The following suppliers are licensed with the NJ BPU and are registered to sell electric service in the PSE&G service territory:
Amerada Hess Corp BOC Energy Services Con Edison Solutions, Inc. Constellation New Energy, Inc. Direct Energy, LLC. First Energy Solutions Corp. Glacial Energy Integrys Energy Service Liberty Power Pepco Energy Services, Inc. PP&L Energy Plus, LLC. Reliant Energy Solutions East, LLC. Sempra Energy Solutions South Jersey Energy Strategic Energy LLC Suez Energy Resources NA, Inc UGI Energy Services
5.1.1 Alternate Third Party Electrical Energy Supplier In evaluating the potential for an alternative third party supplier, CDM contacted and requested a proposal for electrical service from Glacial Energy. The objective of which was to get an overall idea of whether or not switching electric energy suppliers is an avenue that should be pursued further to obtain electrical energy cost savings.

Section 5 Evaluation of Energy Purchasing and Procurement Practices
A 5-2
Due to recent changes in the billing process, PSE&G now requires additional information for each account from Glacial Energy before they will help Glacial generate a comparative quote. This information can be found on the most recent bills as the Point of Delivery (POD) number, which is used to identify PSE&G customers to third party suppliers that participate in the Clean Power Choice program.
The utility bills received by CDM for the accounts at the Fire Department, Borough Hall, and DPW Garages were not recent enough to include a POD number. Glacial Energy was therefore not able to supply a quote for these accounts. However, it should be noted that quotes obtained for similar studies have indicated an 11-12% savings from switching to an alternative third party energy supplier.
For the Library account, Glacial Energy has proposed a flat rate retail cost per kWH over the next 6 or 12 month period. The proposal is included in Appendix L.
The following table, Table 5.1-1, summarizes the annual cost savings available based on historical energy consumption and the proposed energy rate for a 12 month term. The retail rates used in this analysis represent the baseline generation rates from the two suppliers and do not include any applicable demand charges, societal benefits charges, transmission charges, energy charges, reconciliation charges, transitional assessment charges or system control charges that were included in the aggregate rates presented in Section 3. These baseline generation rates, are used for comparison purposes to identify any potential energy cost savings, as all other applicable charges cannot be avoided by switching suppliers. This summary table, which utilizes the historical electrical energy usage presented in Appendix A, confirms the information and available cost savings presented by Glacial Energy.
Table 5.1-1: Potential Energy Cost Savings with an Alternate Third Party Supplier – Glacial Energy
Service Location Annual
Consumption (kWh)
Projected Annual Cost with PSE&G(@
$0.13035/kWh)
Proposed Annual Cost with Glacial
Energy (@ $0.10882/kWh)
Potential Annual Savings ($)
Westwood Free Public Library 127,979 $16,682 $13,926 $2,755
Total Potential Annual Savings: $2,755
As energy cost savings are available by switching to a third party supplier, such as Glacial Energy, this is a recommended energy cost savings measure. The estimated annual cost savings available by switching to Glacial Energy is a 17% savings. CDM recommends that the Borough investigate this cost savings opportunity further and

Section 5 Evaluation of Energy Purchasing and Procurement Practices
A 5-3
compare proposals from alternate third party suppliers to obtain the lowest electrical energy rates available.
5.2 Demand Response Program Demand Response is a program through which a business can make money on reducing their electricity use when wholesale electricity prices are high or when heavy demand causes instability on the electric grid, which can result in voltage fluctuations or grid failure. Demand Response is an energy management program that compensates the participant for reducing their energy consumption at critical times. Demand Response is a highly efficient and cost effective means of reducing the potential for electrical grid failure and price volatility and is one of the best solutions to the Mid-Atlantic region’s current energy challenges.
The program provides at least 2 hours advance notice before curtailment is required. There is typically 1 event a year that lasts about 3 hours in the summer months, when demand for electricity is at its highest.
Participation in Demand Response is generally done through companies known as Curtailment Service Providers, or CSPs, who are members of PJM Interconnection. There is no cost to enroll in the program and participation is voluntary, for instance, you can choose when you want to participate. In most cases, there is no penalty for declining to reduce your electricity use when you’re asked to do so. The event is managed remotely by notifying your staff of the curtailment request and then enacting curtailment through your Building Management System. CSPs will share in a percentage of your savings, which may differ among various CSPs, since there may be costs associated with the hardware and /or software required for participation, so it is recommended that a number of CSPs be contacted to review their offers.
A 6-1
Section 6 Ranking of Energy Conservation and Retrofit Measures (ECRM) 6.1 ECRMs The main objective of this energy audit is to identify potential Energy Conservation and Retrofit Measures and to determine whether or not the identified ECRM’s are economically feasible to warrant the cost for planning and implementation of each measure. Economic feasibility of each identified measure was evaluated through a simple payback analysis. The simple payback analysis consists of establishing the Engineer’s Opinion of Probable Construction Cost estimates; O&M cost savings estimates, projected annual energy savings estimates and the potential value of New Jersey Clean Energy Rebates or Renewable Energy Credits, if applicable. The simple payback period is then determined as the amount of time (years) until the energy savings associated with each measure amounts to the capital investment cost.
As discussed in Section 3, aggregate unit costs for electrical energy delivery and usage and natural gas delivery and usage, which accounts for all demand and tariff charges at each complex, was determined and utilized in the simple payback analyses.
In general, ECRMs having a payback period of 20 years or less have been recommended and only those recommended ECRMs within Section 4 of the report have been ranked for possible implementation. The most attractive rankings are those with the lowest simple payback period.
Ranking of ECRMs has been broken down into the following categories:
Lighting Systems
HVAC Systems
Solar Systems
Wind Systems
6.1.1 Lighting Systems Table 6.1-1 includes the recommended ECRMs to provide energy savings for all building lighting systems, which include the installation of energy-efficient luminaires and occupancy sensors. A detailed discussion on building lighting systems is presented in Section 4.1.

Section 6 Ranking of Energy Conservation and Retrofit Measures (ECRM)
A 6-2
Table 6.1-1 Ranking of Energy Savings Measures Summary – Lighting System Retrofits
Complex Retrofit Cost Incentives Total Cost
Annual Fiscal
Savings
Simple Payback(Years)
Public Library $32,482.47 $2,211 $30,271.47 $5,335.72 5.7 DPW Main Building $18,967.09 $1,330 $17,637.09 $2,813.29 6.3
Borough Hall $94,031.91 $5,070 $88,961.91 $9,455.76 9.4 DPW Garage $4,638.82 $284 $4,354.82 $430.61 10.1
Fire Department $21,503.56 $1,730 $19,773.56 $1,766.64 11.2
6.1.2 HVAC Systems Table 6.1-2 includes the recommended ECRM to provide energy savings for building HVAC systems, which provide a simple payback of less than 20 years. A detailed discussion on building HVAC systems is presented in Section 4.4.
Table 6.1-2 Ranking of Energy Savings Measures Summary – HVAC System Upgrade
Building Measure
Retrofit Cost Incentives
Total Cost
Annual Fiscal
Savings
Simple Payback (Years)
Borough Hall DDC BMS $25,685 $0 $25,685 $2,737 9.4 Public Library Boiler Upgrade $32,122 $1,552 $30,570 $1,353 10.7 Borough Hall Boiler Upgrade $67,628 $2,000 $65,628 $3,964 12.0 Public Library DDC BMS $13,800 $0 $13,800 $826 16.7
6.1.3 Solar Energy Implementation of new solar energy systems has been evaluated to determine the economic feasibility for furnishing and installing such systems. Based on the simple payback modeling performed, it would benefit the Borough to further investigate installing the solar energy systems. This is primarily based on the initial upfront capital investment required for a solar energy system installation and an acceptable payback period. Table 6.1-3, includes a ranking of the solar energy ECRMs evaluated for the Borough.

Section 6 Ranking of Energy Conservation and Retrofit Measures (ECRM)
A 6-3
Table 6.1-3 Ranking of Energy Savings Measures Summary – Solar Energy Systems
Building & Measure Retrofit Cost Annual SREC
Credit
Annual Fiscal
Savings
Simple Payback (Years)
DPW Main Building - PV Solar System $743,975 $44,630 $9,805.3 13.7
Borough Hall - PV Solar System $510,425 $27,790 $6,113.7 15.1
Public Library - PV Solar System $314,450 $13,660 $3,735.8 18.1
6.1.4 Wind Energy Implementation of new wind energy systems has been evaluated to determine the economic feasibility for furnishing and installing such systems. Based on the simple payback modeling performed, it would benefit the Borough to further investigate installing the wind energy systems. This is primarily based on the initial upfront capital investment required for a wind energy system installation and an acceptable payback period. Table 6.1-4, includes a ranking of the wind energy ECRMs evaluated for the Borough.
Table 6.1-4: Ranking of Energy Savings Measures Summary – Wind Turbine Energy System
Parameter Wind Turbine (Minimum Site
Wind Speed – 8.5 mph)
Wind Turbine (Maximum Site
Wind Speed – 12.4 mph)
Wind Turbine (Average Site Wind Speed –
10.6 mph)
Engineer’s Opinion of Probable Cost
$68,489.69 $68,489.69 $68,489.69
Renewable Energy Incentive Program
-$18,256 -$51,297 -$34,083
Total Cost $50,233.69 $17,192.69 $34,406.69
1st Year Production 5,705 kWh 16,194 kWh 10,651 kWh
Annual Estimated Electric Savings $846.10 $2,401.60 $1,579.5
Annual Estimated REC Revenue $143.00 $405.00 $266
Project Simple Payback 50.8 Years 6.1 Years 18.6 Years

A 7-1
Section 7 Grants, Incentives and Funding Sources 7.1 Renewable Energy 7.1.1 Renewable Energy Certificates (NJ BPU) As part of New Jersey’s Renewable Portfolio Standards (RPS), electric suppliers are required to have an annually-increasing percentage of their retail sales generated by renewable energy. Electric suppliers fulfill this obligation by purchasing renewable energy certificates (RECs) from the owners of solar generating systems. One REC is created for every 1,000 kWh (1 MWh) of renewable electricity generated. Although solar systems generate electricity and SRECs in tandem, the two are independent commodities and sold separately. The RPS, and creation of RECs, is intended to provide additional revenue flow and financial support for renewable energy projects in New Jersey. Class I RECs, which include electricity generation from wind, wave, tidal, geothermal and sustainable biomass typically trade at around $25/MWh. RECs generated from solar electricity, or SRECs, trade at $550/MWh due to supplemental funding from NJ PBU. The supplemental funding will decrease over time to $350/MWh.
7.1.2 Clean Energy Solutions Capital Investment Loan/Grant (NJ EDA) NJ EDA in cooperation with NJ DEP is offering interest-free loans and grants for energy efficiency, combined heat and power (CHP) and renewable energy projects with total project capital equipment costs of at least $1 million. The interest-free loans are available for up to $5 million, a portion of which may be issued as a grant. The most recent round was closed as of October 2009, but new CESCI program updates will be posted at www.njeda.com. For additional information, contact [email protected] or call 866-534-7789.
7.1.3 Renewable Energy Incentive Program (NJ BPU) The Renewable Energy Incentive Program (REIP) provides rebates for installing solar, wind, and sustainable biomass systems in Smart Growth regions. Rebates of $1.00 per watt are available for solar electricity projects up to 50 kW in capacity. Wind systems can receive rebates up to $3.20 per expected kWh produced. Sustainable biomass rebates start at $4.00 per watt installed with a maximum incentive amount of 30 percent of project costs. REIP will give out $53.25 million in rebates from 2009 - 2012. Project owners must complete the Pay for Performance Program, Direct Install or Local Municipal audit, or the rebate will be reduced by $0.10 per watt. For more information on REIP, please see www.njcleanenergy.com.
7.1.4 Grid Connected Renewables Program (NJ BPU) The New Jersey Grid Connected Renewables Program offers competitive incentives for wind and sustainable biomass electricity generation projects larger than 1 Megawatt (MW). Applications for the most recent round of funding, which totaled $6

Section 7 Available Grants, Incentives and Funding Sources
A 7-2
million, were due January 8, 2010. Requests for Proposals (RFPs) for the next round will be posted at www.njcleanenergy.com and www.state.nj.us/bpu. A total of roughly $16 million is available for incentives under this program during 2010. Most of the incentives offered under this program will take the form of a payment for energy production ($/MWh) once the project is operating. Incentives range up to $58.49/MWh for publicly-owned wastewater biogas projects. Up to 10% of the incentive may be requested in the form of a lump grant to cover up-front costs such as financing fees, interconnection fees, project design, permitting, and construction costs.
7.1.5 Utility Financing Programs All four Electric Distribution Companies (EDCs) in New Jersey have developed long term contracting or financing programs for the development of solar energy systems. In all of the programs, Solar Renewable Energy Credits (SRECs) generated by the solar energy systems will be sold at auction to energy suppliers who are required to purchase a certain quantity of SRECs to meet their Renewable Portfolio Standard requirements.
7.1.6 Renewable Energy Manufacturing Incentive (NJ BPU) New Jersey’s Renewable Energy Manufacturing Incentive (REMI) program provides rebates to purchase and install solar panels, inverters, and racking systems manufactured in New Jersey. Rebates for panels start at $0.25 per watt and rebates for racking systems and inverters start at $0.15 per watt for solar projects up to 500 kW in capacity. To be eligible for REMI, applicants must apply to either the Renewable Energy Incentive Program (REIP) or the SREC Registration Program (SRP).
7.1.7 Clean Renewable Energy Bonds (IRS) CREBs are 0% interest bonds typically issued for up to approximately $3.0 million administered by the Internal Revenue Service (IRS). Last year, $2.2 billion in CREBs was allocated to municipal entities to fund 610 renewable energy projects, including anaerobic digestion. IRS has been allocating funding for CREBs annually since 2005. Last year, IRS solicited applications starting in April, which were due in August. The IRS is expected to receive additional funding for CREBs and release another round of solicitations in 2010.
7.1.8 Qualified Energy Conservation Bonds (IRS) These IRS 0% interest bonds are very similar to CREBs except they are allocated based on state and county population. New Jersey was allocated $90 million as part of the ARRA stimulus fund. QECBs are typically distributed through municipal bond banks or state economic development agencies.
7.1.9 Global Climate Change Mitigation Incentive Fund (US EDA) The Economic Development Agency (part of the U.S. Department of Commerce) administers the GCCMIF to public works projects that reduce greenhouse gas

Section 7 Available Grants, Incentives and Funding Sources
A 7-3
emissions and creates new jobs. In FY 2009, $15 million was allocated to the fund, and additional funding is expected to be allocated in FY 2010. Applications are due on a rolling basis. The program does not have a maximum grant amount but does limit the grant to 50 percent of the project cost.
7.1.10 Private Tax-Exempt Financing Similar to traditional municipal bond financing, there are many private financial service companies that offer a myriad of options for tax-exempt financing of municipal projects. The providers of these services suggest that this capital can be offered at competitive rates in an expedited timeframe and with fewer complications when compared to traditional municipal financing methods. Though these factors would need to be compared on a case-by-case basis, the one distinct advantage to private financing on the current project would likely be the flexibility to structure payments to meet budget needs with consideration given to the terms and conditions of existing loan and/or bond agreements. For example, this mechanism could be used to limit the initial debt payments when the current bond debt is the greatest and the operations savings of the project has yet to be fully realized. It should also be noted that, in many cases, the construction and long term financing can be rolled into a single private financing agreement. Also, in some instances, equipment manufacturers have the ability to offer competitive financing terms (e.g. Siemens Financial Services Corporation), though financing from these sources is generally contingent upon a substantial portion of the project cost (~20% to 30%) being for their respective equipment.
7.1.11 Performance Based Contracts (ESCOs) A second financing alternative for a project of this nature would be to enter into a Performance Based Contract with an Energy Services Company (ESCO). The premise of this type of contract is that it requires no initial municipal capital contributions in order to implement the project - instead relying on future operations cost savings and/or energy production, to fund the annual payments. Prior to entering into an agreement for the funding of the project, an ECSO would perform an energy audit and/or conceptual studies to confirm future energy cost savings or energy production inherent with the projects implementation and operation. The contract would then be formulated based on some measurable parameter(s) (sludge reduction, energy production, etc) which would be verified by measurement throughout the contract duration. The savings in energy costs or energy production would then be used to pay back the capital investment of the project over the contract time period (typically on the order of 10-years or less). The ESCO would guarantee the agreed upon energy savings or energy production. If the project does not meet energy savings or production commitments, the ESCO pays the owner the equivalent difference.
With this funding alternative, the ownership and operation of the facility would be maintained by the original owner. A performance contract may also include ESCO operation and maintenance of the energy-related facilities if that were deemed appropriate. Significant ESCO’s with experience in this area include Siemens Building

Section 7 Available Grants, Incentives and Funding Sources
A 7-4
Technologies, Chevron and Johnson Controls. CDM has functioned in several roles on performance based contracts including being the owner’s representative and, on different contracts, providing design-build services (as a subcontractor to the ECSO). We can provide additional experience-based information upon request.
7.1.12 Power Purchase Agreements (SPCs) More commonly referred to as a Build-Own-Transfer (BOT) agreement in the Water/Wastewater industry, a Power Purchase Agreement (PPA) also delivers a project with no initial capital contribution by the original owner. In this model, a Special Purpose Company (SPC) created by a developer, would own the energy production facilities. Within the framework of a PPA, a SPC will typically lease property from the owners for construction and operation of the new facilities. The funding and construction of the new facilities would be performed by the SPC who would then own and operate the facilities for the duration of the contract (typically 20 to 30 years). Throughout that period of time, the original owner would purchase power from the SPC at a pre-negotiated rate which would take into account the initial capital cost, operation and maintenance of the constructed facility, ancillary benefits of the project and investor returns on investment. For renewable energy, financial incentives may enable this financing approach to compete favorably with utility power tariffs. Incentives include state and local tax credits, renewable energy credits, and Federal energy production tax credits or energy investment tax credits. It is expected that a number of experienced companies and developers may be interested in a PPA for New Jersey municipal renewable energy projects.
7.2 Energy Efficiency 7.2.1 Introduction New Jersey's Clean Energy Program (NJ CEP) promotes increased energy efficiency and the use of clean, renewable sources of energy including solar, wind, geothermal, and sustainable biomass. The results for New Jersey are a stronger economy, less pollution, lower costs, and reduced demand for electricity. NJCEP offers financial incentives, programs, and services for residential, commercial, and municipal customers.
NJCEP reduces the need to generate electricity and burn natural gas which eliminates the pollution that would have been caused by such electric generation or natural gas usage. The benefits of these programs continue for the life of the measures installed, which on average is about 15 years. Thus, the public receives substantial environmental and public health benefits from programs that also lower energy bills and benefit the economy.
7.2.2 New Jersey Smart Start Buildings Program (NJ BPU) The New Jersey Smart Start Buildings Program offers rebate incentives for several qualifying equipment such as high efficient premium motors and lighting, and lighting controls.
Section 7 Available Grants, Incentives and Funding Sources
A 7-5
Incentive information and incentive calculation worksheets are provided for the various new equipment installation identified in this report and are included in Appendix G.
7.2.3 Pay for Performance Program (NJ BPU) Another program offered through the New Jersey Smart Start Program, is the Pay for Performance Program. Commercial, industrial and institutional buildings are eligible for participation if not already receiving Energy Efficiency and Conservation Block Grants.
Incentives are available for buildings that are able to present an Energy Reduction Plans that reduce the building’s current energy consumption by 15% or more, in addition to incentives for installing the recommended measures and incentives for presenting the energy savings in a post-construction benchmarking report. No more than 50% of the total energy savings may be derived from lighting retrofits. In addition, the total energy savings of 15% may not come from the implementation of one energy savings measure. The incentive structure is provided in Appendix F.
The recommended ECRM’s presented in this report are expected to warrant participation in this program.
7.2.4 Direct Install (NJ BPU) Owners of existing small to mid-size commercial and industrial facilities with a peak electric demand that did not exceed 200 kW in any of the preceding 12 months are eligible to participate in Direct Install. Buildings must be located in New Jersey and served by one of the state’s public, regulated electric or natural gas utility companies.
This program will cover up to 80% of the retro-fitting costs associated with the use of new energy efficient equipment. Lighting, HVAC, refrigeration, motors, natural gas systems, and variable frequency drives are covered under the Direct Install program.
7.2.5 Anemometer Loan Program The Anemometer Loan Program is funded by a grant provided by the United States DOE Wind Powering America Program and New Jersey's Clean Energy Program, the Office of Clean Energy has partnered with five colleges to implement the New Jersey Anemometer Loan Program, a tool used to assess the wind potential prior to installing small wind generating equipment. For more information regarding this program, click here or email [email protected] or call 973-648-7405. The selected institution delivers and administers the anemometer.

APPENDIX A
UTILITY BILL INFORMATION

MonthAverage (KWH) Demand (KW)
January 28752 62February 26009 60
March 27966 63April 26730 83May 28853 95
June 39269 127July 41203 98
August 37720 102September 32379 101
October 28014 85November 27492 71December 28420 60
Service From Service To YearDelivery Charges
Supply Charges
PSE&G Electric Charges Meter #: 728013246 KWH
PSE & G Cost Per KWH
Measured Demand KW
Demand Charge
Overall Cost Per kW Demand Month
Adjusted Monthly
Usage KWH
Adjusted Monthly
Demand KW
12/28/2007 1/29/2008 2008 $978.46 $2,806.94 $3,785.40 31120.00 $0.12 65.6 $3.89 $0.06 January 29218.00 62.061/30/2008 2/27/2008 2008 $880.21 $2,555.87 $3,436.08 27120.00 $0.13 64.0 $3.89 $0.06 February 27055.00 63.592/28/2008 3/30/2008 2008 $920.87 $2,633.60 $3,554.47 28880.00 $0.12 64.0 $3.89 $0.06 March 27966.00 62.763/31/2008 4/28/2008 2008 $912.93 $2,321.01 $3,233.94 25840.00 $0.13 80.0 $3.89 $0.05 April 26730.00 83.114/29/2008 5/28/2008 2008 $964.42 $2,434.48 $3,398.90 26720.00 $0.13 88.0 $3.89 $0.04 May 28853.00 95.375/29/2008 6/26/2008 2008 $2,526.60 $4,457.61 $6,984.21 37840.00 $0.18 128.0 $3.89 $0.03 June 39269.00 127.366/27/2008 7/29/2008 2008 $2,440.92 $5,329.77 $7,770.69 44080.00 $0.18 104.0 $3.89 $0.04 July 41203.00 97.907/30/2008 8/27/2008 2008 $2,137.03 $4,609.01 $6,746.04 35760.00 $0.19 94.4 $3.89 $0.04 August 37720.00 101.768/28/2008 9/26/2008 2008 $2,124.96 $4,096.02 $6,220.98 33200.00 $0.19 104.0 $3.89 $0.04 September 32379.00 101.339/27/2008 10/26/2008 2008 $956.45 $2,836.97 $3,793.42 27040.00 $0.14 84.0 $3.89 $0.05 October 28014.00 85.2110/27/2008 11/24/2008 2008 $915.10 $2,665.24 $3,580.34 26560.00 $0.13 72.0 $3.89 $0.05 November 27492.00 71.1711/25/2008 12/23/2008 2008 $886.34 $2,599.75 $3,486.09 26640.00 $0.13 56.0 $3.89 $0.07 December 28420.00 60.4112/24/2008 1/20/2009 2009 $890.48 $2,606.76 $3,497.24 25520.00 $0.14 56.0 $3.89 $0.07 January 28286.00 62.001/21/2009 2/17/2009 2009 $895.05 $2,771.93 $3,666.98 25600.00 $0.14 56.0 $3.89 $0.07 February 24962.00 56.812/18/2009 3/16/2009 2009 $829.86 $2,530.68 $3,360.54 23120.00 $0.15 56.0 $3.89 $0.07
Account # 41 815 006 08Electric Bills ‐ Westwood Borough Hall

MonthAverage Therm
Usage
January 2,212
February 1,873March 1,335April 307May 57June 49July 48August 46September 70October 397November 1,274December 2,088
Service From Service To YearMeter #: 3355385 Delivery Charge
Supply Charge Total Charge
PSE&G Gas Usage
Cost/Therm Month
Adjusted Monthly Usage
12/28/2007 1/29/2008 2008 2124.31 $845.91 $2,093.10 $2,939.01 $2,939.01 $1.38 January 1998.001/30/2008 2/27/2008 2008 1900.22 $757.81 $2,042.35 $2,800.16 $2,800.16 $1.47 February 1857.002/28/2008 3/30/2008 2008 1412.73 $564.31 $1,668.30 $2,232.61 $2,232.61 $1.58 March 1335.003/31/2008 4/28/2008 2008 314.06 $104.15 $394.04 $498.19 $498.19 $1.59 April 307.004/29/2008 5/28/2008 2008 56.29 $26.82 $80.54 $107.36 $107.36 $1.91 May 57.005/29/2008 6/26/2008 2008 47.95 $24.32 $72.13 $96.45 $96.45 $2.01 June 49.006/27/2008 7/29/2008 2008 51.22 $25.30 $83.58 $108.88 $108.88 $2.13 July 48.007/30/2008 8/27/2008 2008 42.99 $22.82 $52.39 $75.21 $75.21 $1.75 August 46.008/28/2008 9/26/2008 2008 42.90 $22.80 $48.45 $71.25 $71.25 $1.37 September 70.009/27/2008 10/26/2008 2008 242.53 $82.85 $249.09 $331.94 $331.94 $1.34 October 397.0010/27/2008 11/24/2008 2008 1084.08 $440.43 $1,009.56 $1,449.99 $1,449.99 $1.34 November 1274.0011/25/2008 12/23/2008 2008 1823.49 $742.19 $1,747.60 $2,489.79 $2,489.79 $1.37 December 2088.0012/24/2008 1/20/2009 2009 2245.43 $918.61 $2,040.13 $2,958.74 $2,958.74 $1.32 January 2426.001/21/2009 2/17/2009 2009 2092.82 $856.78 $1,622.25 $2,479.03 $2,479.03 $1.18 February 1889.002/18/2009 3/16/2009 2009 1517.29 $622.90 $1,034.94 $1,657.84 $1,657.84 $1.09
Natural Gas BillsWestwood Gas Account # 41 815 006 08 : Borough Hall
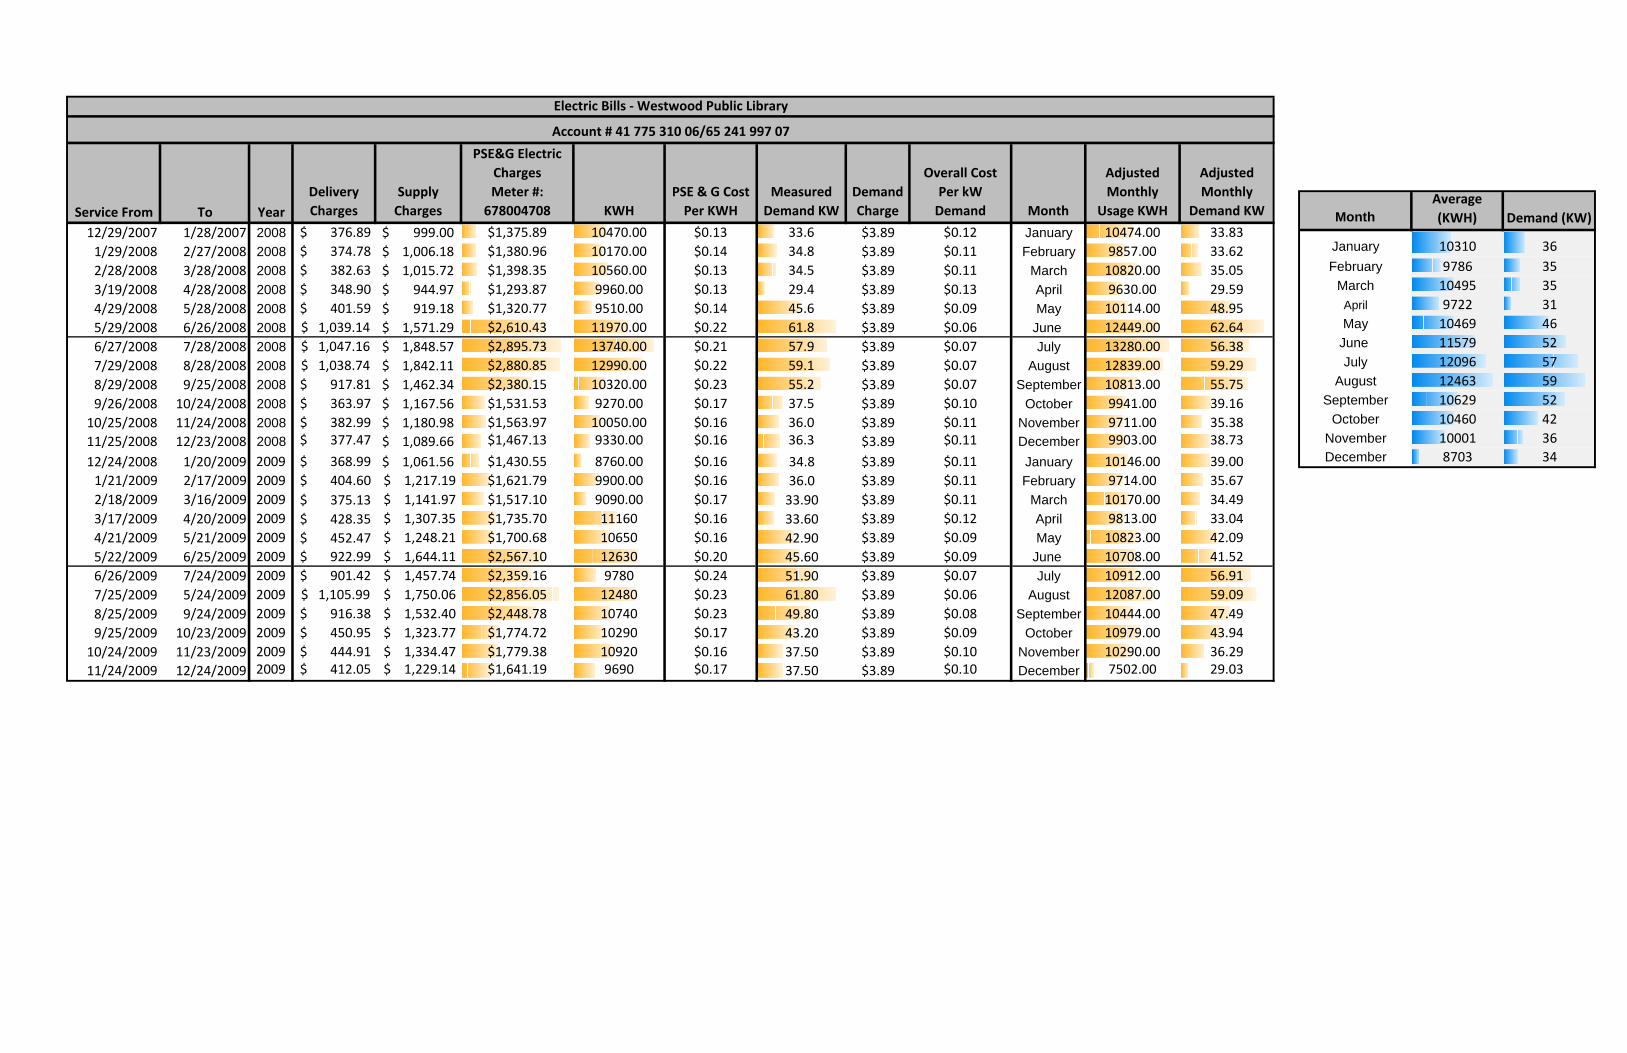
MonthAverage (KWH) Demand (KW)
January 10310 36February 9786 35
March 10495 35April 9722 31May 10469 46
June 11579 52July 12096 57
August 12463 59September 10629 52
October 10460 42November 10001 36December 8703 34
Service From To YearDelivery Charges
Supply Charges
PSE&G Electric Charges Meter #: 678004708 KWH
PSE & G Cost Per KWH
Measured Demand KW
Demand Charge
Overall Cost Per kW Demand Month
Adjusted Monthly
Usage KWH
Adjusted Monthly
Demand KW
12/29/2007 1/28/2007 2008 $ 376.89 999.00$ $1,375.89 10470.00 $0.13 33.6 $3.89 $0.12 January 10474.00 33.831/29/2008 2/27/2008 2008 $ 374.78 1,006.18$ $1,380.96 10170.00 $0.14 34.8 $3.89 $0.11 February 9857.00 33.622/28/2008 3/28/2008 2008 $ 382.63 1,015.72$ $1,398.35 10560.00 $0.13 34.5 $3.89 $0.11 March 10820.00 35.053/19/2008 4/28/2008 2008 $ 348.90 944.97$ $1,293.87 9960.00 $0.13 29.4 $3.89 $0.13 April 9630.00 29.594/29/2008 5/28/2008 2008 $ 401.59 919.18$ $1,320.77 9510.00 $0.14 45.6 $3.89 $0.09 May 10114.00 48.955/29/2008 6/26/2008 2008 $ 1,039.14 1,571.29$ $2,610.43 11970.00 $0.22 61.8 $3.89 $0.06 June 12449.00 62.646/27/2008 7/28/2008 2008 $ 1,047.16 1,848.57$ $2,895.73 13740.00 $0.21 57.9 $3.89 $0.07 July 13280.00 56.387/29/2008 8/28/2008 2008 $ 1,038.74 1,842.11$ $2,880.85 12990.00 $0.22 59.1 $3.89 $0.07 August 12839.00 59.298/29/2008 9/25/2008 2008 $ 917.81 1,462.34$ $2,380.15 10320.00 $0.23 55.2 $3.89 $0.07 September 10813.00 55.759/26/2008 10/24/2008 2008 $ 363.97 1,167.56$ $1,531.53 9270.00 $0.17 37.5 $3.89 $0.10 October 9941.00 39.16
10/25/2008 11/24/2008 2008 $ 382.99 1,180.98$ $1,563.97 10050.00 $0.16 36.0 $3.89 $0.11 November 9711.00 35.3811/25/2008 12/23/2008 2008 $ 377.47 1,089.66$ $1,467.13 9330.00 $0.16 36.3 $3.89 $0.11 December 9903.00 38.73
12/24/2008 1/20/2009 2009 $ 368.99 1,061.56$ $1,430.55 8760.00 $0.16 34.8 $3.89 $0.11 January 10146.00 39.001/21/2009 2/17/2009 2009 $ 404.60 $ 1,217.19 $1,621.79 9900.00 $0.16 36.0 $3.89 $0.11 February 9714.00 35.672/18/2009 3/16/2009 2009 $ 375.13 $ 1,141.97 $1,517.10 9090.00 $0.17 33.90 $3.89 $0.11 March 10170.00 34.493/17/2009 4/20/2009 2009 $ 428.35 $ 1,307.35 $1,735.70 11160 $0.16 33.60 $3.89 $0.12 April 9813.00 33.044/21/2009 5/21/2009 2009 $ 452.47 $ 1,248.21 $1,700.68 10650 $0.16 42.90 $3.89 $0.09 May 10823.00 42.095/22/2009 6/25/2009 2009 $ 922.99 $ 1,644.11 $2,567.10 12630 $0.20 45.60 $3.89 $0.09 June 10708.00 41.526/26/2009 7/24/2009 2009 $ 901.42 $ 1,457.74 $2,359.16 9780 $0.24 51.90 $3.89 $0.07 July 10912.00 56.917/25/2009 5/24/2009 2009 $ 1,105.99 $ 1,750.06 $2,856.05 12480 $0.23 61.80 $3.89 $0.06 August 12087.00 59.098/25/2009 9/24/2009 2009 $ 916.38 $ 1,532.40 $2,448.78 10740 $0.23 49.80 $3.89 $0.08 September 10444.00 47.499/25/2009 10/23/2009 2009 $ 450.95 $ 1,323.77 $1,774.72 10290 $0.17 43.20 $3.89 $0.09 October 10979.00 43.94
10/24/2009 11/23/2009 2009 $ 444.91 $ 1,334.47 $1,779.38 10920 $0.16 37.50 $3.89 $0.10 November 10290.00 36.2911/24/2009 12/24/2009 2009 $ 412.05 $ 1,229.14 $1,641.19 9690 $0.17 37.50 $3.89 $0.10 December 7502.00 29.03
Electric Bills ‐ Westwood Public Library
Account # 41 775 310 06/65 241 997 07

MonthAverage Therm
Usage
January 1258.99February 1067.96March 811.99April 436.25May 135.37June 45.79July 0.00
August 0.00September 28.77October 245.26November 593.02December 933.55
Service From Service To YearMeter #: 3166230
Delivery Charge
Supply Charge
PSE&G Gas Usage
Cost Per Therm Month
Adjusted Monthly Usage
12/29/2007 1/28/2007 2008 1252.05 $ 505.71 $505.71 $0.40 January 1249.401/29/2008 2/27/2008 2008 1185.16 $ 479.22 $479.22 $0.40 February 1121.812/28/2008 3/28/2008 2008 827.39 $ 337.55 $337.55 $0.41 March 817.473/19/2008 4/28/2008 2008 467.43 $ 150.17 583.30$ $733.47 $1.57 April 432.974/29/2008 5/28/2008 2008 161.57 $ 58.41 230.19$ $288.60 $1.79 May 150.795/29/2008 6/26/2008 2008 0.00 $ 9.93 $9.93 June 0.006/27/2008 7/28/2008 2008 0.00 $ 9.93 $9.93 July 0.007/29/2008 8/28/2008 2008 0.00 $ 9.93 $9.93 August 0.008/29/2008 9/25/2008 2008 0.00 $ 9.93 $9.93 $1.38 September 35.339/26/2008 10/24/2008 2008 204.90 $ 71.43 211.99$ $283.42 $1.36 October 323.6310/25/2008 11/24/2008 2008 682.26 $ 283.55 641.30$ $924.85 $1.36 November 731.1011/25/2008 12/23/2008 2008 980.68 $ 405.85 938.19$ $1,344.04 $1.37 December 1112.88
12/24/2008 1/20/2009 2009 1172.84 $ 486.69 1,068.87$ $1,555.56 $1.33 January 1268.571/21/2009 2/17/2009 2009 1096.64 $ 455.83 $ 857.00 $1,312.83 $1.20 February 1014.112/18/2009 3/16/2009 2009 854.92 $ 357.55 $ 584.63 $942.18 $1.10 March 806.503/17/2009 4/20/2009 2009 699.74 $ 227.30 $ 437.62 $664.92 $0.95 April 439.534/21/2009 5/21/2009 2009 123.00 $ 48.63 $ 70.36 $118.99 $0.97 May 119.955/22/2009 6/25/2009 2009 128.21 $ 50.49 $ 73.17 $123.66 $0.96 June 91.586/26/2009 7/24/2009 2009 0.00 $ 10.12 $10.12 July 0.007/25/2009 5/24/2009 2009 0.00 $ 10.12 $10.12 August 0.008/25/2009 9/24/2009 2009 0.00 $ 10.12 $10.12 September 22.219/25/2009 10/23/2009 2009 107.36 $ 44.14 $ 62.87 $107.01 $1.00 October 166.8810/24/2009 11/23/2009 2009 316.69 $ 136.28 $ 209.11 $345.39 $1.09 November 454.9411/24/2009 12/24/2009 2009 974.20 $ 404.51 $ 678.70 $1,083.21 $1.11
Natural Gas BillsWestwood Gas Account # 41 775 310 06/65 241 997 07 : Public Library

Service From To Year
PSE&G Electric Charges Meter #: 728011249 KWH
Measured Demand KW
PSE & G Cost Per KWH
Demand Charge
Overall Cost Per kW Demand Month
Adjusted Monthly
Usage KWH
Adjusted Monthly Demand
KW
12/29/2007 1/29/2008 2008 $1,519.08 11,760 37.6 $0.13 $3.89 $0.10 January 11454.83 36.481/30/2009 2/28/2009 2008 $1,575.77 11,960 36.0 $0.13 $3.89 $0.11 February 11162.67 33.603/1/2009 3/31/2009 2008 $1,522.90 11,800 34.8 $0.13 $3.89 $0.11 March 11800.00 34.804/1/2009 4/29/2009 2008 $1,313.21 9,840 40.8 $0.13 $3.89 $0.10 April 10168.00 42.354/30/2009 5/29/2009 2008 $1,349.71 9,840 46.4 $0.14 $3.89 $0.08 May 10425.10 48.415/30/2009 6/27/2009 2008 $2,677.56 13,240 51.6 $0.20 $3.89 $0.08 June 13875.65 52.956/28/2009 7/29/2009 2008 $2,153.52 16,520 52.4 $0.13 $3.89 $0.07 July 15831.94 50.977/30/2009 8/27/2009 2008 $1,769.56 12,480 50.4 $0.14 $3.89 $0.08 August 13235.31 53.698/28/2009 9/26/2009 2008 $2,578.35 12,120 50.8 $0.21 $3.89 $0.08 September 11784.00 49.509/27/2009 10/27/2009 2008 $1,206.67 9,920 42.4 $0.12 $3.89 $0.09 October 9815.17 41.0710/28/2009 11/25/2009 2008 $1,028.43 8,520 30.0 $0.12 $3.89 $0.13 November 8750.54 31.0011/26/2009 12/24/2009 2008 $1,508.94 9,840 36.0 $0.15 $3.89 $0.11 December 10871.33 40.71
12/25/2008 1/20/2009 2009 $1,499.31 9,400 38.0 $0.16 $3.89 $0.10 January 10482.96 40.411/21/2009 2/17/2009 2009 $1,472.84 8,960 31.2 $0.16 $3.89 $0.12 February 8911.11 31.332/18/2009 3/16/2009 2009 $1,413.67 8,520 30.4 $0.17 $3.89 $0.13
Electric Bills ‐ Westwood Fire HallAccount # 41 816 039 03
MonthAverage (KWH)
Demand (KW)
January 10969 38February 10037 32
March 11800 35April 10168 42May 10425 48
June 13876 53July 15832 51
August 13235 54September 11784 50
October 9815 41November 8751 31December 10871 41

MonthAverage Therm
Usage
January 996.78February 846.23March 759.58April 321.14May 277.87June 176.79July 172.20
August 171.67September 167.48October 257.01November 503.27December 890.22
Service From Service To YearMeter #: 3228079
PSE&G Gas Usage
Cost Per Therm Month
Adjusted Monthly Usage
12/29/2007 1/29/2008 2008 997.464 $1,382.99 $1.39 January 965.381/30/2008 2/28/2008 2008 921.446 $1,357.94 $1.47 February 860.023/1/2008 3/31/2008 2008 759.575 $1,202.94 $1.58 March 759.584/1/2008 4/29/2008 2008 311.968 $494.96 $1.59 April 321.144/30/2008 5/29/2008 2008 275.183 $486.23 $1.77 May 277.875/30/2008 6/27/2008 2008 171.989 $320.25 $1.86 June 176.796/28/2008 7/29/2008 2008 177.717 $353.16 $1.99 July 172.207/30/2008 8/27/2008 2008 161.459 $257.60 $1.60 August 171.678/28/2008 9/26/2008 2008 160.1 $239.19 $1.49 September 167.489/27/2008 10/27/2008 2008 222.669 $306.23 $1.38 October 257.0110/28/2008 11/25/2008 2008 457.28 $603.61 $1.32 November 503.2711/26/2008 12/24/2008 2008 763.445 $1,034.38 $1.35 December 890.22
12/25/2008 1/20/2009 2009 909.658 $1,191.17 $1.31 January 1028.181/21/2009 2/17/2009 2009 902.004 $1,060.84 $1.18 February 832.432/18/2009 3/16/2009 2009 699.001 $756.45 $1.08
Natural Gas BillsWestwood Gas Account # 41 816 039 03 : Fire Hall
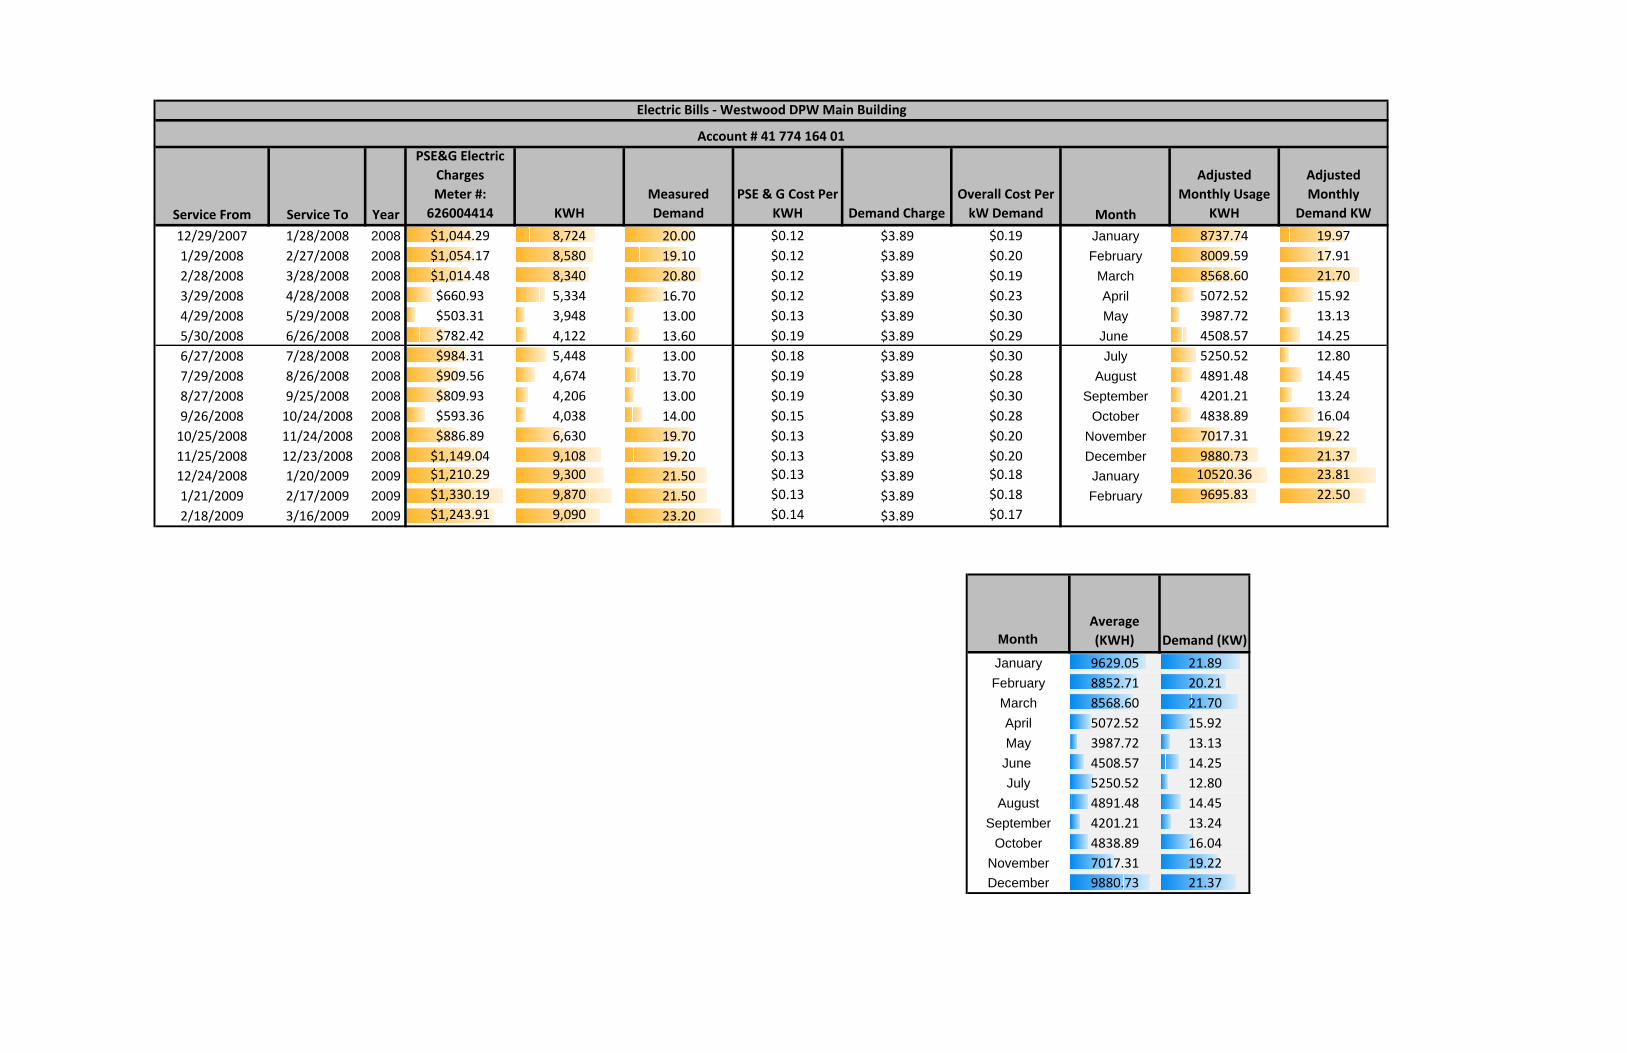
MonthAverage (KWH) Demand (KW)
January 9629.05 21.89February 8852.71 20.21
March 8568.60 21.70April 5072.52 15.92May 3987.72 13.13
June 4508.57 14.25July 5250.52 12.80
August 4891.48 14.45September 4201.21 13.24
October 4838.89 16.04November 7017.31 19.22December 9880.73 21.37
Service From Service To Year
PSE&G Electric Charges Meter #: 626004414 KWH
Measured Demand
PSE & G Cost Per KWH Demand Charge
Overall Cost Per kW Demand Month
Adjusted Monthly Usage
KWH
Adjusted Monthly
Demand KW
12/29/2007 1/28/2008 2008 $1,044.29 8,724 20.00 $0.12 $3.89 $0.19 January 8737.74 19.971/29/2008 2/27/2008 2008 $1,054.17 8,580 19.10 $0.12 $3.89 $0.20 February 8009.59 17.912/28/2008 3/28/2008 2008 $1,014.48 8,340 20.80 $0.12 $3.89 $0.19 March 8568.60 21.703/29/2008 4/28/2008 2008 $660.93 5,334 16.70 $0.12 $3.89 $0.23 April 5072.52 15.924/29/2008 5/29/2008 2008 $503.31 3,948 13.00 $0.13 $3.89 $0.30 May 3987.72 13.135/30/2008 6/26/2008 2008 $782.42 4,122 13.60 $0.19 $3.89 $0.29 June 4508.57 14.256/27/2008 7/28/2008 2008 $984.31 5,448 13.00 $0.18 $3.89 $0.30 July 5250.52 12.807/29/2008 8/26/2008 2008 $909.56 4,674 13.70 $0.19 $3.89 $0.28 August 4891.48 14.458/27/2008 9/25/2008 2008 $809.93 4,206 13.00 $0.19 $3.89 $0.30 September 4201.21 13.249/26/2008 10/24/2008 2008 $593.36 4,038 14.00 $0.15 $3.89 $0.28 October 4838.89 16.0410/25/2008 11/24/2008 2008 $886.89 6,630 19.70 $0.13 $3.89 $0.20 November 7017.31 19.2211/25/2008 12/23/2008 2008 $1,149.04 9,108 19.20 $0.13 $3.89 $0.20 December 9880.73 21.3712/24/2008 1/20/2009 2009 $1,210.29 9,300 21.50 $0.13 $3.89 $0.18 January 10520.36 23.81
1/21/2009 2/17/2009 2009 $1,330.19 9,870 21.50 $0.13 $3.89 $0.18 February 9695.83 22.50
2/18/2009 3/16/2009 2009 $1,243.91 9,090 23.20 $0.14 $3.89 $0.17
Electric Bills ‐ Westwood DPW Main Building
Account # 41 774 164 01

MonthAverage Therm
Usage
January 1114.60February 897.88March 659.49April 215.54May 37.05June 0.00July 0.00
August 0.35September 21.57October 192.98November 519.06December 1138.45
Service From Service To YearMeter #: 1673518
PSE&G Gas Usage
Cost/Therm Month
Adjusted Monthly Usage
12/29/2007 1/28/2008 2008 968.249 $1,347.42 $1.39 January 969.931/29/2008 2/27/2008 2008 953.759 $1,406.84 $1.48 February 881.122/28/2008 3/28/2008 2008 659.411 $1,047.27 $1.59 March 659.493/29/2008 4/28/2008 2008 235.802 $374.93 $1.59 April 215.544/29/2008 5/29/2008 2008 39.61 $78.27 $1.98 May 37.055/30/2008 6/26/2008 2008 0 $9.93 June 0.006/27/2008 7/28/2008 2008 0 $9.93 July 0.007/29/2008 8/26/2008 2008 0 $9.93 August 0.358/27/2008 9/25/2008 2008 2.093 $12.94 $6.18 September 21.579/26/2008 10/24/2008 2008 114.99 $163.42 $1.42 October 192.9810/25/2008 11/24/2008 2008 433.213 $590.82 $1.36 November 519.0611/25/2008 12/23/2008 2008 887.726 $1,217.54 $1.37 December 1138.45
12/24/2008 1/20/2009 2009 1198.953 $1,589.91 $1.33 January 1259.27
1/21/2009 2/17/2009 2009 1025.48 $1,228.24 $1.20 February 914.64
2/18/2009 3/16/2009 2009 716.789 $791.50 $1.10
Natural Gas BillsWestwood Gas Account # 41 774 164 01 : DPW Main Building

MonthAverage (KWH) Demand (KW)
January 1847.50 6.25February 1758.50 7.80
March 1306.00 4.70April 1120.00 4.60May 984.00 5.00
June 730.00 4.30July 740.00 4.30
August 736.00 4.10September 764.00 4.40
October 952.00 4.90November 1346.00 7.70December 2721.00 8.30
Service From Service To Year
PSE&G Electric Charges Meter #: 626044514 KWH
Measured Demand (kW)
PSE & G Cost Per KWH
Demand Charge
Overall Cost Per kW Demand Month
Adjusted Monthly
Usage KWH
Adjusted Monthly
Demand KW
12/29/2007 1/28/2008 2008 $169.38 1,270 5.1 $0.13 $3.89 $0.76 January 1,270 5.11/29/2008 2/27/2008 2008 $193.82 1,424 5.9 $0.14 $3.89 $0.66 February 1,424 5.92/28/2008 3/28/2008 2008 $172.93 1,306 4.7 $0.13 $3.89 $0.83 March 1,306 4.73/29/2008 4/28/2008 2008 $150.14 1,120 4.6 $0.13 $3.89 $0.85 April 1,120 4.64/29/2008 5/29/2008 2008 $138.39 984 5.0 $0.14 $3.89 $0.78 May 984 5.05/30/2008 6/26/2008 2008 $173.76 730 4.3 $0.24 $3.89 $0.90 June 730 4.36/27/2008 7/28/2008 2008 $178.98 740 4.3 $0.24 $3.89 $0.90 July 740 4.37/29/2008 8/26/2008 2008 $180.65 736 4.1 $0.25 $3.90 $0.95 August 736 4.18/27/2008 9/25/2008 2008 $184.13 764 4.4 $0.24 $3.89 $0.88 September 764 4.49/26/2008 10/24/2008 2008 $157.28 952 4.9 $0.17 $3.89 $0.79 October 952 4.9
10/25/2008 11/24/2008 2008 $207.62 1,346 7.7 $0.15 $3.89 $0.51 November 1,346 7.711/25/2008 12/23/2008 2008 $360.64 2,721 8.3 $0.13 $3.89 $0.47 December 2,721 8.3
12/24/2008 1/20/2009 2009 $331.87 2,425 7.4 $0.14 $3.89 $0.53 January 2,425 7.41/21/2009 2/17/2009 2009 $314.37 2,093 9.7 $0.15 $3.89 $0.40 February 2,093 9.72/18/2009 3/16/2009 2009 $288.90 1,990 6.3 $0.15 $3.89 $0.62 March 1,990 6.3
Electric Bills ‐ Westwood DPW GarageAccount # 41 774 161 18
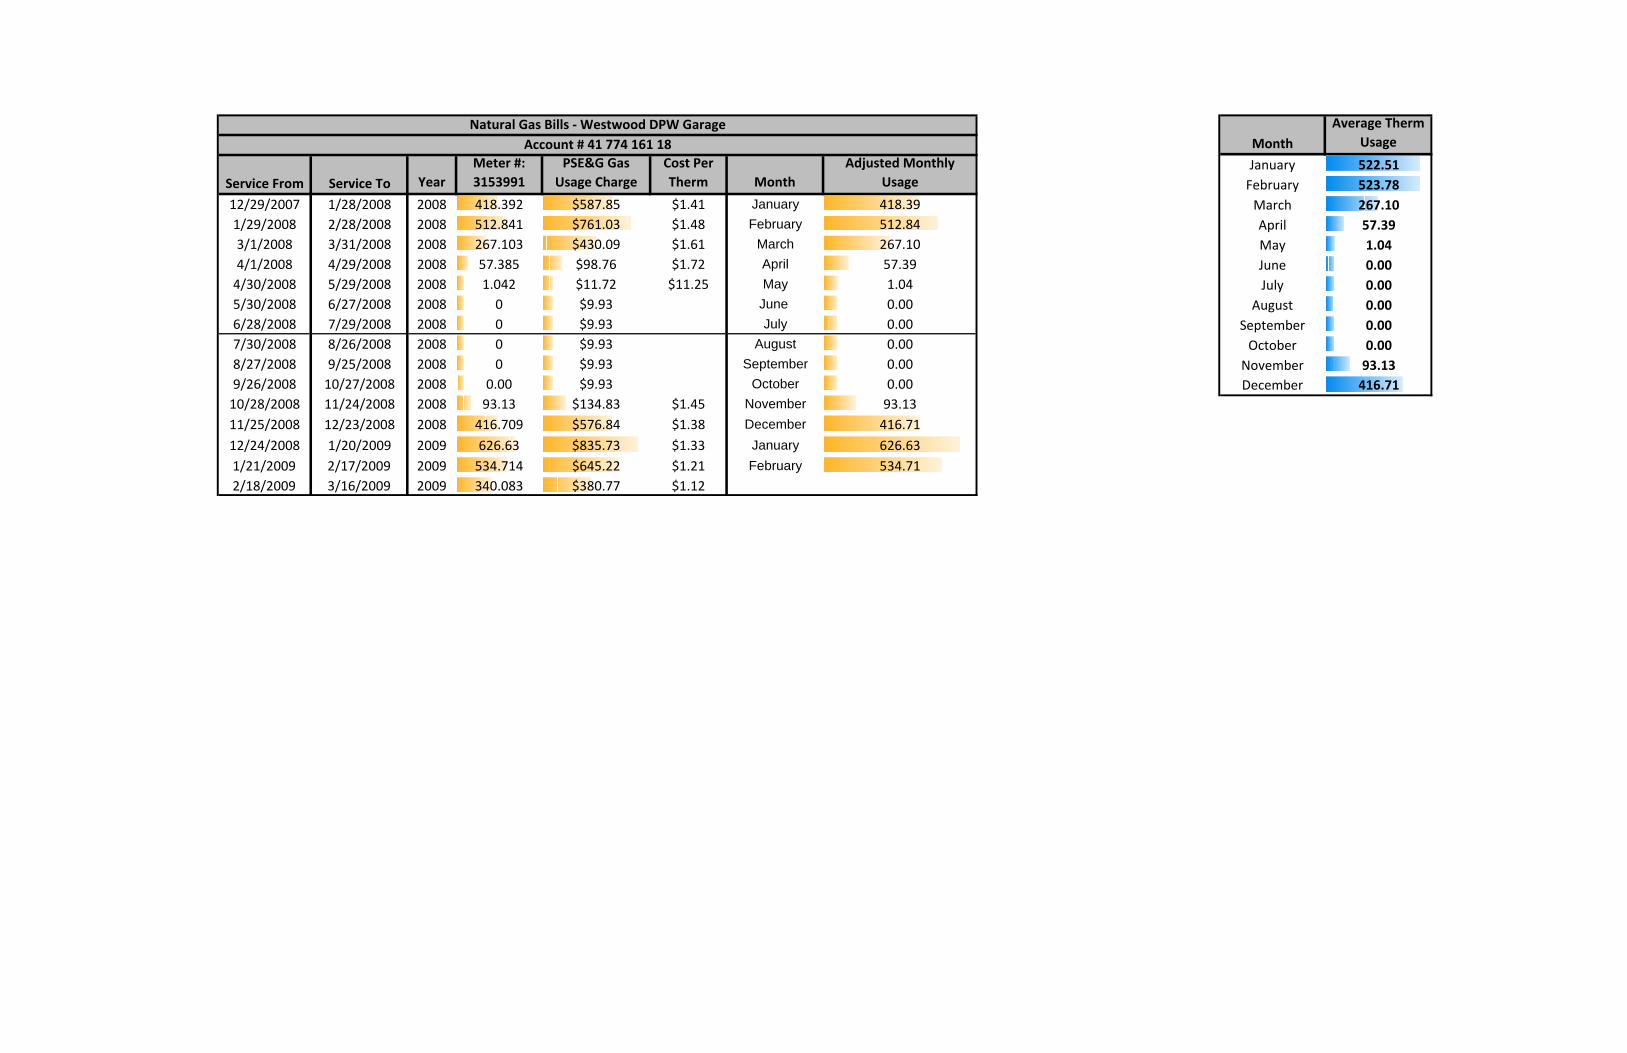
MonthAverage Therm
Usage
January 522.51February 523.78March 267.10April 57.39May 1.04June 0.00July 0.00
August 0.00September 0.00October 0.00November 93.13December 416.71
Service From Service To YearMeter #: 3153991
PSE&G Gas Usage Charge
Cost Per Therm Month
Adjusted Monthly Usage
12/29/2007 1/28/2008 2008 418.392 $587.85 $1.41 January 418.391/29/2008 2/28/2008 2008 512.841 $761.03 $1.48 February 512.843/1/2008 3/31/2008 2008 267.103 $430.09 $1.61 March 267.104/1/2008 4/29/2008 2008 57.385 $98.76 $1.72 April 57.394/30/2008 5/29/2008 2008 1.042 $11.72 $11.25 May 1.045/30/2008 6/27/2008 2008 0 $9.93 June 0.006/28/2008 7/29/2008 2008 0 $9.93 July 0.007/30/2008 8/26/2008 2008 0 $9.93 August 0.008/27/2008 9/25/2008 2008 0 $9.93 September 0.009/26/2008 10/27/2008 2008 0.00 $9.93 October 0.0010/28/2008 11/24/2008 2008 93.13 $134.83 $1.45 November 93.1311/25/2008 12/23/2008 2008 416.709 $576.84 $1.38 December 416.71
12/24/2008 1/20/2009 2009 626.63 $835.73 $1.33 January 626.631/21/2009 2/17/2009 2009 534.714 $645.22 $1.21 February 534.712/18/2009 3/16/2009 2009 340.083 $380.77 $1.12
Natural Gas Bills ‐ Westwood DPW GarageAccount # 41 774 161 18

APPENDIX B
STATEMENT OF ENERGY PERFORMANCE
PORTFOLIO MANAGER REFERENCE SHEET

OMB No. 2060-0347
STATEMENT OF ENERGY PERFORMANCEBorough Hall
Building ID: 2252641 For 12-month Period Ending: February 28, 20091
Date SEP becomes ineligible: N/A Date SEP Generated: April 01, 2010
FacilityBorough Hall101 Washington AvenueWestwood, NJ 07675
Facility OwnerBorough of Westwood101 Washington Avenue Westwood, NJ 07675
Primary Contact for this FacilityRobert Hoffmann101 Washington Avenue Westwood, NJ 07675
Year Built: 1994Gross Floor Area (ft2): 29,780
Energy Performance Rating2 (1-100) 65
Site Energy Use Summary3
Electricity - Grid Purchase(kBtu) 1,265,708 Natural Gas (kBtu)4 998,729 Total Energy (kBtu) 2,264,437
Energy Intensity5 Site (kBtu/ft2/yr) 76 Source (kBtu/ft2/yr) 177 Emissions (based on site energy use) Greenhouse Gas Emissions (MtCO2e/year) 246 Electric Distribution Utility Public Service Elec & Gas Co National Average Comparison National Average Site EUI 91 National Average Source EUI 212 % Difference from National Average Source EUI -17% Building Type Office
Stamp of Certifying Professional
Based on the conditions observed at thetime of my visit to this building, I certify that
the information contained within thisstatement is accurate.
Meets Industry Standards6 for Indoor EnvironmentalConditions:Ventilation for Acceptable Indoor Air Quality N/A Acceptable Thermal Environmental Conditions N/A Adequate Illumination N/A
Certifying ProfessionalMatthew Goss11 British American Boulevard Latham, NY 12110
Notes: 1. Application for the ENERGY STAR must be submitted to EPA within 4 months of the Period Ending date. Award of the ENERGY STAR is not final until approval is received from EPA.2. The EPA Energy Performance Rating is based on total source energy. A rating of 75 is the minimum to be eligible for the ENERGY STAR.3. Values represent energy consumption, annualized to a 12-month period.4. Natural Gas values in units of volume (e.g. cubic feet) are converted to kBtu with adjustments made for elevation based on Facility zip code.5. Values represent energy intensity, annualized to a 12-month period.6. Based on Meeting ASHRAE Standard 62 for ventilation for acceptable indoor air quality, ASHRAE Standard 55 for thermal comfort, and IESNA Lighting Handbook for lighting quality.
The government estimates the average time needed to fill out this form is 6 hours (includes the time for entering energy data, PE facility inspection, and notarizing the SEP) and welcomessuggestions for reducing this level of effort. Send comments (referencing OMB control number) to the Director, Collection Strategies Division, U.S., EPA (2822T), 1200 Pennsylvania Ave., NW,Washington, D.C. 20460.
EPA Form 5900-16

ENERGY STAR®
Data Checklistfor Commercial Buildings
In order for a building to qualify for the ENERGY STAR, a Professional Engineer (PE) must validate the accuracy of the data underlying the building's energyperformance rating. This checklist is designed to provide an at-a-glance summary of a property's physical and operating characteristics, as well as its total energyconsumption, to assist the PE in double-checking the information that the building owner or operator has entered into Portfolio Manager.
Please complete and sign this checklist and include it with the stamped, signed Statement of Energy Performance.NOTE: You must check each box to indicate that each value is correct, OR include a note.
CRITERION VALUE AS ENTERED INPORTFOLIO MANAGER VERIFICATION QUESTIONS NOTES
Building Name Borough Hall Is this the official building name to be displayed inthe ENERGY STAR Registry of LabeledBuildings?
Type Office Is this an accurate description of the space inquestion?
Location 101 Washington Avenue,
Westwood, NJ 07675 Is this address accurate and complete? Correctweather normalization requires an accurate zipcode.
Single Structure Single Facility
Does this SEP represent a single structure? SEPscannot be submitted for multiple-buildingcampuses (with the exception of acute care orchildren's hospitals) nor can they be submitted asrepresenting only a portion of a building
Borough Hall (Office)
CRITERION VALUE AS ENTERED INPORTFOLIO MANAGER VERIFICATION QUESTIONS NOTES
Gross Floor Area 29,780 Sq. Ft.
Does this square footage include all supportingfunctions such as kitchens and break rooms usedby staff, storage areas, administrative areas,elevators, stairwells, atria, vent shafts, etc. Alsonote that existing atriums should only include thebase floor area that it occupies. Interstitial(plenum) space between floors should not beincluded in the total. Finally gross floor area is notthe same as leasable space. Leasable space is asubset of gross floor area.
Weekly operatinghours 84 Hours
Is this the total number of hours per week that theOffice space is 75% occupied? This numbershould exclude hours when the facility is occupiedonly by maintenance, security, or other supportpersonnel. For facilities with a schedule that variesduring the year, "operating hours/week" refers tothe total weekly hours for the schedule most oftenfollowed.
Workers on MainShift 26
Is this the number of employees present during themain shift? Note this is not the total number ofemployees or visitors who are in a building duringan entire 24 hour period. For example, if there aretwo daily 8 hour shifts of 100 workers each, theWorkers on Main Shift value is 100. The normalworker density ranges between 0.3 and 10workers per 1000 square feet (92.8 squaremeters)
Number of PCs 51 Is this the number of personal computers in theOffice?
Percent Cooled 50% or more Is this the percentage of the total floor space withinthe facility that is served by mechanical coolingequipment?
Percent Heated 50% or more Is this the percentage of the total floor space withinthe facility that is served by mechanical heatingequipment?
Page 1 of 3

ENERGY STAR®
Data Checklistfor Commercial Buildings
Energy ConsumptionPower Generation Plant or Distribution Utility: Public Service Elec & Gas Co
Fuel Type: Electricity
Meter: 728013246 (kWh (thousand Watt-hours))Space(s): Entire Facility
Generation Method: Grid Purchase
Start Date End Date Energy Use (kWh (thousand Watt-hours))
01/21/2009 02/17/2009 25,600.00
12/24/2008 01/20/2009 25,520.00
11/25/2008 12/23/2008 26,640.00
10/27/2008 11/24/2008 26,560.00
09/27/2008 10/26/2008 27,040.00
08/28/2008 09/26/2008 33,200.00
07/30/2008 08/27/2008 35,760.00
06/27/2008 07/29/2008 44,080.00
05/29/2008 06/26/2008 37,840.00
04/29/2008 05/28/2008 26,720.00
03/31/2008 04/28/2008 25,840.00
02/28/2008 03/30/2008 28,880.00
728013246 Consumption (kWh (thousand Watt-hours)) 363,680.00
728013246 Consumption (kBtu (thousand Btu)) 1,240,876.16
Total Electricity (Grid Purchase) Consumption (kBtu (thousand Btu)) 1,240,876.16
Is this the total Electricity (Grid Purchase) consumption at this building including allElectricity meters?
Fuel Type: Natural Gas
Meter: 3355385 (therms)Space(s): Entire Facility
Start Date End Date Energy Use (therms)
01/21/2009 02/17/2009 2,092.82
12/24/2008 01/20/2009 2,245.43
11/25/2008 12/23/2008 1,823.49
10/27/2008 11/24/2008 1,084.08
09/27/2008 10/26/2008 242.53
08/28/2008 09/26/2008 42.90
07/30/2008 08/27/2008 42.99
06/27/2008 07/29/2008 51.22
05/29/2008 06/26/2008 47.95
04/29/2008 05/28/2008 56.29
Page 2 of 3

03/31/2008 04/28/2008 314.06
02/28/2008 03/30/2008 1,413.73
3355385 Consumption (therms) 9,457.49
3355385 Consumption (kBtu (thousand Btu)) 945,749.00
Total Natural Gas Consumption (kBtu (thousand Btu)) 945,749.00
Is this the total Natural Gas consumption at this building including all Natural Gas meters?
Additional FuelsDo the fuel consumption totals shown above represent the total energy use of this building?Please confirm there are no additional fuels (district energy, generator fuel oil) used in this facility.
On-Site Solar and Wind EnergyDo the fuel consumption totals shown above include all on-site solar and/or wind power located atyour facility? Please confirm that no on-site solar or wind installations have been omitted from thislist. All on-site systems must be reported.
Certifying Professional (When applying for the ENERGY STAR, the Certifying Professional must be the same as the PE that signed and stamped the SEP.)
Name: _____________________________________________ Date: _____________
Signature: ______________________________________ Signature is required when applying for the ENERGY STAR.
Page 3 of 3

FOR YOUR RECORDS ONLY. DO NOT SUBMIT TO EPA.
Please keep this Facility Summary for your own records; do not submit it to EPA. Only the Statement of Energy Performance(SEP), Data Checklist and Letter of Agreement need to be submitted to EPA when applying for the ENERGY STAR.
FacilityBorough Hall101 Washington AvenueWestwood, NJ 07675
Facility OwnerBorough of Westwood101 Washington Avenue Westwood, NJ 07675
Primary Contact for this FacilityRobert Hoffmann101 Washington Avenue Westwood, NJ 07675
General InformationBorough Hall
Gross Floor Area Excluding Parking: (ft2) 29,780 Year Built 1994 For 12-month Evaluation Period Ending Date: February 28, 2009
Facility Space Use SummaryBorough Hall
Space Type Office
Gross Floor Area(ft2) 29,780
Weekly operating hours 84
Workers on Main Shift 26
Number of PCs 51
Percent Cooled 50% or more
Percent Heated 50% or more
Energy Performance ComparisonEvaluation Periods Comparisons
Performance Metrics Current(Ending Date 02/28/2009) Baseline Rating of 75 Target National Average
Energy Performance Rating 65 75 N/A 50
Energy Intensity
Site (kBtu/ft2) 76 N/A 67 N/A 91
Source (kBtu/ft2) 177 N/A 157 N/A 212
Energy Cost
$/year $ 70,466.68 N/A $ 62,497.01 N/A $ 84,497.00
$/ft2/year $ 2.37 N/A $ 2.10 N/A $ 2.84
Greenhouse Gas Emissions
MtCO2e/year 246 N/A 218 N/A 295
kgCO2e/ft2/year 8 N/A 7 N/A 10
More than 50% of your building is defined as Office. Please note that your rating accounts for all of the spaces listed. The National Average column presents energyperformance data your building would have if your building had an average rating of 50. Notes:o - This attribute is optional.d - A default value has been supplied by Portfolio Manager.

OMB No. 2060-0347
STATEMENT OF ENERGY PERFORMANCEPublic Library
Building ID: 2252727 For 12-month Period Ending: November 30, 20091
Date SEP becomes ineligible: N/A Date SEP Generated: April 01, 2010
FacilityPublic Library49 Park AvenueWestwood, NJ 07675
Facility OwnerBorough of Westwood101 Washington Avenue Westwood, NJ 07675
Primary Contact for this FacilityRobert Hoffmann101 Washington Avenue Westwood, NJ 07675
Year Built: 1939Gross Floor Area (ft2): 16,000
Energy Performance Rating2 (1-100) N/A
Site Energy Use Summary3
Electricity - Grid Purchase(kBtu) 429,870 Natural Gas (kBtu)4 552,073 Total Energy (kBtu) 981,943
Energy Intensity5 Site (kBtu/ft2/yr) 61 Source (kBtu/ft2/yr) 126 Emissions (based on site energy use) Greenhouse Gas Emissions (MtCO2e/year) 95 Electric Distribution Utility Public Service Elec & Gas Co National Average Comparison National Average Site EUI 104 National Average Source EUI 213 % Difference from National Average Source EUI -41% Building Type Other
Stamp of Certifying Professional
Based on the conditions observed at thetime of my visit to this building, I certify that
the information contained within thisstatement is accurate.
Meets Industry Standards6 for Indoor EnvironmentalConditions:Ventilation for Acceptable Indoor Air Quality N/A Acceptable Thermal Environmental Conditions N/A Adequate Illumination N/A
Certifying ProfessionalMatthew Goss11 British American Boulevard Latham, NY 12110
Notes: 1. Application for the ENERGY STAR must be submitted to EPA within 4 months of the Period Ending date. Award of the ENERGY STAR is not final until approval is received from EPA.2. The EPA Energy Performance Rating is based on total source energy. A rating of 75 is the minimum to be eligible for the ENERGY STAR.3. Values represent energy consumption, annualized to a 12-month period.4. Natural Gas values in units of volume (e.g. cubic feet) are converted to kBtu with adjustments made for elevation based on Facility zip code.5. Values represent energy intensity, annualized to a 12-month period.6. Based on Meeting ASHRAE Standard 62 for ventilation for acceptable indoor air quality, ASHRAE Standard 55 for thermal comfort, and IESNA Lighting Handbook for lighting quality.
The government estimates the average time needed to fill out this form is 6 hours (includes the time for entering energy data, PE facility inspection, and notarizing the SEP) and welcomessuggestions for reducing this level of effort. Send comments (referencing OMB control number) to the Director, Collection Strategies Division, U.S., EPA (2822T), 1200 Pennsylvania Ave., NW,Washington, D.C. 20460.
EPA Form 5900-16

ENERGY STAR®
Data Checklistfor Commercial Buildings
In order for a building to qualify for the ENERGY STAR, a Professional Engineer (PE) must validate the accuracy of the data underlying the building's energyperformance rating. This checklist is designed to provide an at-a-glance summary of a property's physical and operating characteristics, as well as its total energyconsumption, to assist the PE in double-checking the information that the building owner or operator has entered into Portfolio Manager.
Please complete and sign this checklist and include it with the stamped, signed Statement of Energy Performance.NOTE: You must check each box to indicate that each value is correct, OR include a note.
CRITERION VALUE AS ENTERED INPORTFOLIO MANAGER VERIFICATION QUESTIONS NOTES
Building Name Public Library Is this the official building name to be displayed inthe ENERGY STAR Registry of LabeledBuildings?
Type Other Is this an accurate description of the space inquestion?
Location 49 Park Avenue,
Westwood, NJ 07675 Is this address accurate and complete? Correctweather normalization requires an accurate zipcode.
Single Structure Single Facility
Does this SEP represent a single structure? SEPscannot be submitted for multiple-buildingcampuses (with the exception of acute care orchildren's hospitals) nor can they be submitted asrepresenting only a portion of a building
Library (Other)
CRITERION VALUE AS ENTERED INPORTFOLIO MANAGER VERIFICATION QUESTIONS NOTES
Gross Floor Area 16,000 Sq. Ft.
Does this square footage include all supportingfunctions such as kitchens and break rooms usedby staff, storage areas, administrative areas,elevators, stairwells, atria, vent shafts, etc. Alsonote that existing atriums should only include thebase floor area that it occupies. Interstitial(plenum) space between floors should not beincluded in the total. Finally gross floor area is notthe same as leasable space. Leasable space is asubset of gross floor area.
Number of PCs 30(Optional) Is this the number of personal computers in thespace?
Weekly operatinghours 56Hours(Optional)
Is this the total number of hours per week that thespace is 75% occupied? This number shouldexclude hours when the facility is occupied only bymaintenance, security, or other support personnel.For facilities with a schedule that varies during theyear, "operating hours/week" refers to the totalweekly hours for the schedule most often followed.
Workers on MainShift 7(Optional)
Is this the number of employees present during themain shift? Note this is not the total number ofemployees or visitors who are in a building duringan entire 24 hour period. For example, if there aretwo daily 8 hour shifts of 100 workers each, theWorkers on Main Shift value is 100.
Page 1 of 3

ENERGY STAR®
Data Checklistfor Commercial Buildings
Energy ConsumptionPower Generation Plant or Distribution Utility: Public Service Elec & Gas Co
Fuel Type: Electricity
Meter: 678004708 (kWh (thousand Watt-hours))Space(s): Entire Facility
Generation Method: Grid Purchase
Start Date End Date Energy Use (kWh (thousand Watt-hours))
10/24/2009 11/23/2009 10,920.00
09/25/2009 10/23/2009 10,290.00
08/25/2009 09/24/2009 10,740.00
07/25/2009 08/24/2009 12,480.00
06/26/2009 07/24/2009 9,780.00
05/22/2009 06/25/2009 12,630.00
04/21/2009 05/21/2009 10,650.00
03/17/2009 04/20/2009 11,160.00
02/18/2009 03/16/2009 9,090.00
01/21/2009 02/17/2009 9,900.00
12/24/2008 01/20/2009 8,760.00
678004708 Consumption (kWh (thousand Watt-hours)) 116,400.00
678004708 Consumption (kBtu (thousand Btu)) 397,156.80
Total Electricity (Grid Purchase) Consumption (kBtu (thousand Btu)) 397,156.80
Is this the total Electricity (Grid Purchase) consumption at this building including allElectricity meters?
Fuel Type: Natural Gas
Meter: 3166230 (therms)Space(s): Entire Facility
Start Date End Date Energy Use (therms)
10/24/2009 11/23/2009 316.69
09/25/2009 10/23/2009 107.36
08/25/2009 09/24/2009 0.00
07/25/2009 08/24/2009 0.00
06/26/2009 07/24/2009 0.00
05/22/2009 06/25/2009 128.21
04/21/2009 05/21/2009 123.00
03/17/2009 04/20/2009 699.74
02/18/2009 03/16/2009 854.92
01/21/2009 02/17/2009 1,096.64
12/24/2008 01/20/2009 1,172.84
Page 2 of 3

3166230 Consumption (therms) 4,499.40
3166230 Consumption (kBtu (thousand Btu)) 449,940.00
Total Natural Gas Consumption (kBtu (thousand Btu)) 449,940.00
Is this the total Natural Gas consumption at this building including all Natural Gas meters?
Additional FuelsDo the fuel consumption totals shown above represent the total energy use of this building?Please confirm there are no additional fuels (district energy, generator fuel oil) used in this facility.
On-Site Solar and Wind EnergyDo the fuel consumption totals shown above include all on-site solar and/or wind power located atyour facility? Please confirm that no on-site solar or wind installations have been omitted from thislist. All on-site systems must be reported.
Certifying Professional (When applying for the ENERGY STAR, the Certifying Professional must be the same as the PE that signed and stamped the SEP.)
Name: _____________________________________________ Date: _____________
Signature: ______________________________________ Signature is required when applying for the ENERGY STAR.
Page 3 of 3

FOR YOUR RECORDS ONLY. DO NOT SUBMIT TO EPA.
Please keep this Facility Summary for your own records; do not submit it to EPA. Only the Statement of Energy Performance(SEP), Data Checklist and Letter of Agreement need to be submitted to EPA when applying for the ENERGY STAR.
FacilityPublic Library49 Park AvenueWestwood, NJ 07675
Facility OwnerBorough of Westwood101 Washington Avenue Westwood, NJ 07675
Primary Contact for this FacilityRobert Hoffmann101 Washington Avenue Westwood, NJ 07675
General InformationPublic Library
Gross Floor Area Excluding Parking: (ft2) 16,000 Year Built 1939 For 12-month Evaluation Period Ending Date: November 30, 2009
Facility Space Use SummaryLibrary
Space Type Other - Other
Gross Floor Area(ft2) 16,000
Number of PCso 30
Weekly operating hourso 56
Workers on Main Shifto 7
Energy Performance ComparisonEvaluation Periods Comparisons
Performance Metrics Current(Ending Date 11/30/2009)
Baseline(Ending Date 12/31/2008) Rating of 75 Target National Average
Energy Performance Rating N/A N/A 75 N/A N/A
Energy Intensity
Site (kBtu/ft2) 61 65 0 N/A 104
Source (kBtu/ft2) 126 132 0 N/A 213
Energy Cost
$/year $ 29,862.85 $ 27,707.29 N/A N/A $ 50,606.75
$/ft2/year $ 1.87 $ 1.73 N/A N/A $ 3.17
Greenhouse Gas Emissions
MtCO2e/year 95 99 0 N/A 161
kgCO2e/ft2/year 6 6 0 N/A 10
More than 50% of your building is defined as Other. This building is currently ineligible for a rating. Please note the National Average column represents the CBECSnational average data for Other. This building uses X% less energy per square foot than the CBECS national average for Other. Notes:o - This attribute is optional.d - A default value has been supplied by Portfolio Manager.
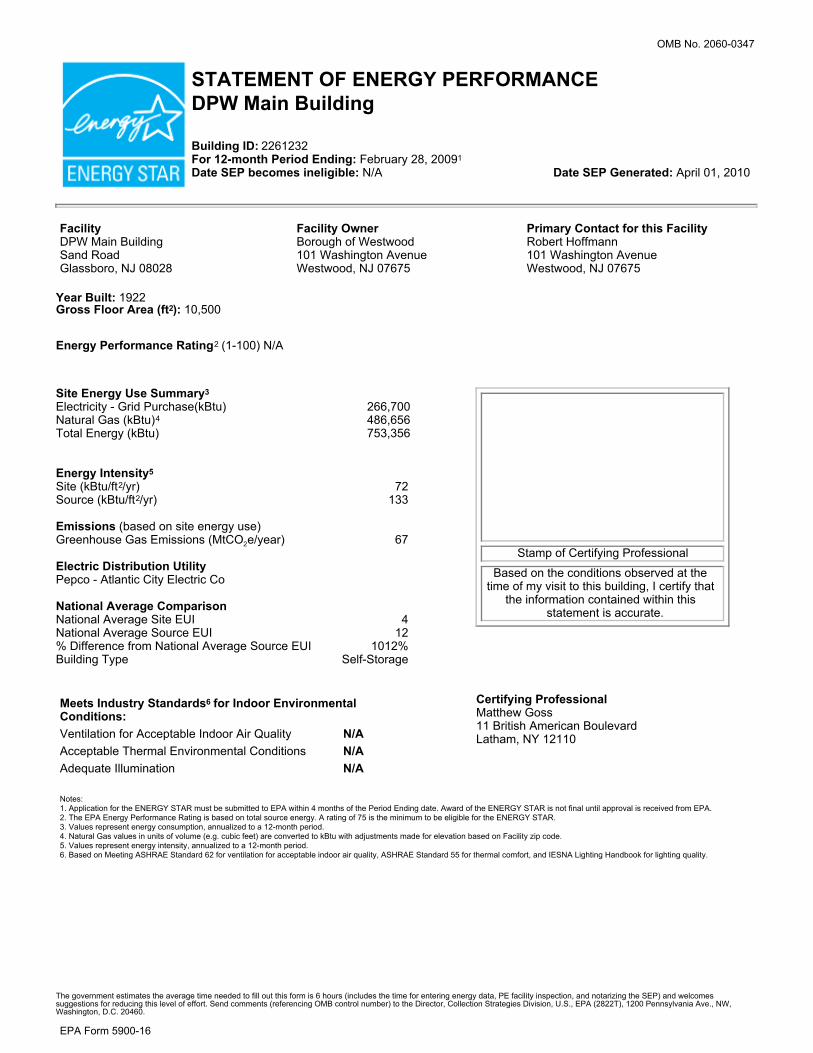
OMB No. 2060-0347
STATEMENT OF ENERGY PERFORMANCEDPW Main Building
Building ID: 2261232 For 12-month Period Ending: February 28, 20091
Date SEP becomes ineligible: N/A Date SEP Generated: April 01, 2010
FacilityDPW Main BuildingSand RoadGlassboro, NJ 08028
Facility OwnerBorough of Westwood101 Washington Avenue Westwood, NJ 07675
Primary Contact for this FacilityRobert Hoffmann101 Washington Avenue Westwood, NJ 07675
Year Built: 1922Gross Floor Area (ft2): 10,500
Energy Performance Rating2 (1-100) N/A
Site Energy Use Summary3
Electricity - Grid Purchase(kBtu) 266,700 Natural Gas (kBtu)4 486,656 Total Energy (kBtu) 753,356
Energy Intensity5 Site (kBtu/ft2/yr) 72 Source (kBtu/ft2/yr) 133 Emissions (based on site energy use) Greenhouse Gas Emissions (MtCO2e/year) 67 Electric Distribution Utility Pepco - Atlantic City Electric Co National Average Comparison National Average Site EUI 4 National Average Source EUI 12 % Difference from National Average Source EUI 1012% Building Type Self-Storage
Stamp of Certifying Professional
Based on the conditions observed at thetime of my visit to this building, I certify that
the information contained within thisstatement is accurate.
Meets Industry Standards6 for Indoor EnvironmentalConditions:Ventilation for Acceptable Indoor Air Quality N/A Acceptable Thermal Environmental Conditions N/A Adequate Illumination N/A
Certifying ProfessionalMatthew Goss11 British American Boulevard Latham, NY 12110
Notes: 1. Application for the ENERGY STAR must be submitted to EPA within 4 months of the Period Ending date. Award of the ENERGY STAR is not final until approval is received from EPA.2. The EPA Energy Performance Rating is based on total source energy. A rating of 75 is the minimum to be eligible for the ENERGY STAR.3. Values represent energy consumption, annualized to a 12-month period.4. Natural Gas values in units of volume (e.g. cubic feet) are converted to kBtu with adjustments made for elevation based on Facility zip code.5. Values represent energy intensity, annualized to a 12-month period.6. Based on Meeting ASHRAE Standard 62 for ventilation for acceptable indoor air quality, ASHRAE Standard 55 for thermal comfort, and IESNA Lighting Handbook for lighting quality.
The government estimates the average time needed to fill out this form is 6 hours (includes the time for entering energy data, PE facility inspection, and notarizing the SEP) and welcomessuggestions for reducing this level of effort. Send comments (referencing OMB control number) to the Director, Collection Strategies Division, U.S., EPA (2822T), 1200 Pennsylvania Ave., NW,Washington, D.C. 20460.
EPA Form 5900-16
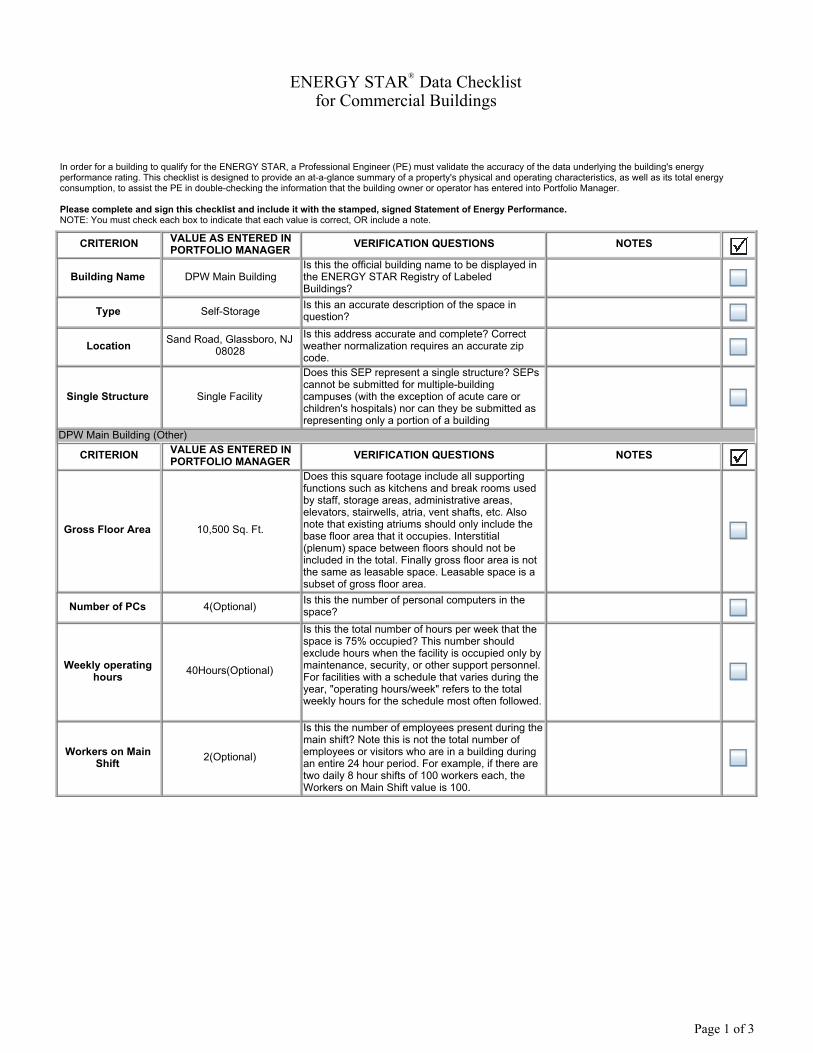
ENERGY STAR®
Data Checklistfor Commercial Buildings
In order for a building to qualify for the ENERGY STAR, a Professional Engineer (PE) must validate the accuracy of the data underlying the building's energyperformance rating. This checklist is designed to provide an at-a-glance summary of a property's physical and operating characteristics, as well as its total energyconsumption, to assist the PE in double-checking the information that the building owner or operator has entered into Portfolio Manager.
Please complete and sign this checklist and include it with the stamped, signed Statement of Energy Performance.NOTE: You must check each box to indicate that each value is correct, OR include a note.
CRITERION VALUE AS ENTERED INPORTFOLIO MANAGER VERIFICATION QUESTIONS NOTES
Building Name DPW Main Building Is this the official building name to be displayed inthe ENERGY STAR Registry of LabeledBuildings?
Type Self-Storage Is this an accurate description of the space inquestion?
Location Sand Road, Glassboro, NJ
08028 Is this address accurate and complete? Correctweather normalization requires an accurate zipcode.
Single Structure Single Facility
Does this SEP represent a single structure? SEPscannot be submitted for multiple-buildingcampuses (with the exception of acute care orchildren's hospitals) nor can they be submitted asrepresenting only a portion of a building
DPW Main Building (Other)
CRITERION VALUE AS ENTERED INPORTFOLIO MANAGER VERIFICATION QUESTIONS NOTES
Gross Floor Area 10,500 Sq. Ft.
Does this square footage include all supportingfunctions such as kitchens and break rooms usedby staff, storage areas, administrative areas,elevators, stairwells, atria, vent shafts, etc. Alsonote that existing atriums should only include thebase floor area that it occupies. Interstitial(plenum) space between floors should not beincluded in the total. Finally gross floor area is notthe same as leasable space. Leasable space is asubset of gross floor area.
Number of PCs 4(Optional) Is this the number of personal computers in thespace?
Weekly operatinghours 40Hours(Optional)
Is this the total number of hours per week that thespace is 75% occupied? This number shouldexclude hours when the facility is occupied only bymaintenance, security, or other support personnel.For facilities with a schedule that varies during theyear, "operating hours/week" refers to the totalweekly hours for the schedule most often followed.
Workers on MainShift 2(Optional)
Is this the number of employees present during themain shift? Note this is not the total number ofemployees or visitors who are in a building duringan entire 24 hour period. For example, if there aretwo daily 8 hour shifts of 100 workers each, theWorkers on Main Shift value is 100.
Page 1 of 3

ENERGY STAR®
Data Checklistfor Commercial Buildings
Energy ConsumptionPower Generation Plant or Distribution Utility: Pepco - Atlantic City Electric Co
Fuel Type: Electricity
Meter: 626004414 (kWh (thousand Watt-hours))Space(s): Entire Facility
Generation Method: Grid Purchase
Start Date End Date Energy Use (kWh (thousand Watt-hours))
01/21/2009 02/17/2009 9,870.00
12/24/2008 01/20/2009 9,300.00
11/25/2008 12/23/2008 9,108.00
10/25/2008 11/24/2008 6,630.00
09/26/2008 10/24/2008 4,038.00
08/27/2008 09/25/2008 4,206.00
07/29/2008 08/26/2008 4,674.00
06/27/2008 07/28/2008 5,448.00
05/30/2008 06/26/2008 4,122.00
04/29/2008 05/29/2008 3,948.00
03/29/2008 04/28/2008 5,334.00
02/28/2008 03/28/2008 8,340.00
626004414 Consumption (kWh (thousand Watt-hours)) 75,018.00
626004414 Consumption (kBtu (thousand Btu)) 255,961.42
Total Electricity (Grid Purchase) Consumption (kBtu (thousand Btu)) 255,961.42
Is this the total Electricity (Grid Purchase) consumption at this building including allElectricity meters?
Fuel Type: Natural Gas
Meter: 1673518 (therms)Space(s): Entire Facility
Start Date End Date Energy Use (therms)
01/21/2009 02/17/2009 1,025.48
12/24/2008 01/20/2009 1,198.95
11/25/2008 12/23/2008 887.73
10/25/2008 11/24/2008 433.21
09/26/2008 10/24/2008 114.99
08/27/2008 09/25/2008 2.09
07/29/2008 08/26/2008 0.00
06/27/2008 07/28/2008 0.00
05/30/2008 06/26/2008 0.00
04/29/2008 05/29/2008 39.61
Page 2 of 3

03/29/2008 04/28/2008 235.80
02/29/2008 03/28/2008 659.41
1673518 Consumption (therms) 4,597.27
1673518 Consumption (kBtu (thousand Btu)) 459,727.00
Total Natural Gas Consumption (kBtu (thousand Btu)) 459,727.00
Is this the total Natural Gas consumption at this building including all Natural Gas meters?
Additional FuelsDo the fuel consumption totals shown above represent the total energy use of this building?Please confirm there are no additional fuels (district energy, generator fuel oil) used in this facility.
On-Site Solar and Wind EnergyDo the fuel consumption totals shown above include all on-site solar and/or wind power located atyour facility? Please confirm that no on-site solar or wind installations have been omitted from thislist. All on-site systems must be reported.
Certifying Professional (When applying for the ENERGY STAR, the Certifying Professional must be the same as the PE that signed and stamped the SEP.)
Name: _____________________________________________ Date: _____________
Signature: ______________________________________ Signature is required when applying for the ENERGY STAR.
Page 3 of 3

FOR YOUR RECORDS ONLY. DO NOT SUBMIT TO EPA.
Please keep this Facility Summary for your own records; do not submit it to EPA. Only the Statement of Energy Performance(SEP), Data Checklist and Letter of Agreement need to be submitted to EPA when applying for the ENERGY STAR.
FacilityDPW Main BuildingSand RoadGlassboro, NJ 08028
Facility OwnerBorough of Westwood101 Washington Avenue Westwood, NJ 07675
Primary Contact for this FacilityRobert Hoffmann101 Washington Avenue Westwood, NJ 07675
General InformationDPW Main Building
Gross Floor Area Excluding Parking: (ft2) 10,500 Year Built 1922 For 12-month Evaluation Period Ending Date: February 28, 2009
Facility Space Use SummaryDPW Main Building
Space TypeOther -
Self-Storage
Gross Floor Area(ft2) 10,500
Number of PCso 4
Weekly operating hourso 40
Workers on Main Shifto 2
Energy Performance ComparisonEvaluation Periods Comparisons
Performance Metrics Current(Ending Date 02/28/2009)
Baseline(Ending Date 12/31/2008) Rating of 75 Target National Average
Energy Performance Rating N/A N/A 75 N/A N/A
Energy Intensity
Site (kBtu/ft2) 72 68 0 N/A 4
Source (kBtu/ft2) 133 127 0 N/A 12
Energy Cost
$/year $ 17,893.34 $ 19,930.53 N/A N/A $ 997.54
$/ft2/year $ 1.70 $ 1.90 N/A N/A $ 0.09
Greenhouse Gas Emissions
MtCO2e/year 67 63 0 N/A 4
kgCO2e/ft2/year 6 6 0 N/A 0
More than 50% of your building is defined as Self-Storage. This building is currently ineligible for a rating. Please note the National Average column represents theCBECS national average data for Self-Storage. This building uses X% less energy per square foot than the CBECS national average for Self-Storage. Notes:o - This attribute is optional.d - A default value has been supplied by Portfolio Manager.
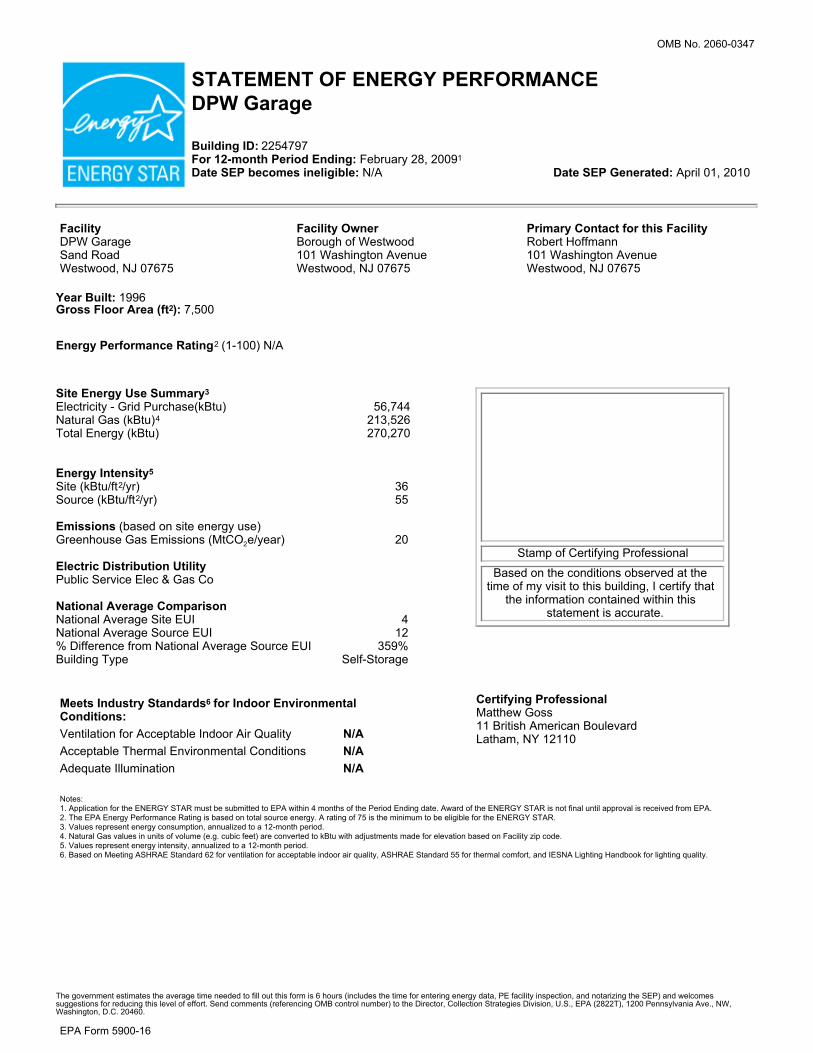
OMB No. 2060-0347
STATEMENT OF ENERGY PERFORMANCEDPW Garage
Building ID: 2254797 For 12-month Period Ending: February 28, 20091
Date SEP becomes ineligible: N/A Date SEP Generated: April 01, 2010
FacilityDPW GarageSand RoadWestwood, NJ 07675
Facility OwnerBorough of Westwood101 Washington Avenue Westwood, NJ 07675
Primary Contact for this FacilityRobert Hoffmann101 Washington Avenue Westwood, NJ 07675
Year Built: 1996Gross Floor Area (ft2): 7,500
Energy Performance Rating2 (1-100) N/A
Site Energy Use Summary3
Electricity - Grid Purchase(kBtu) 56,744 Natural Gas (kBtu)4 213,526 Total Energy (kBtu) 270,270
Energy Intensity5 Site (kBtu/ft2/yr) 36 Source (kBtu/ft2/yr) 55 Emissions (based on site energy use) Greenhouse Gas Emissions (MtCO2e/year) 20 Electric Distribution Utility Public Service Elec & Gas Co National Average Comparison National Average Site EUI 4 National Average Source EUI 12 % Difference from National Average Source EUI 359% Building Type Self-Storage
Stamp of Certifying Professional
Based on the conditions observed at thetime of my visit to this building, I certify that
the information contained within thisstatement is accurate.
Meets Industry Standards6 for Indoor EnvironmentalConditions:Ventilation for Acceptable Indoor Air Quality N/A Acceptable Thermal Environmental Conditions N/A Adequate Illumination N/A
Certifying ProfessionalMatthew Goss11 British American Boulevard Latham, NY 12110
Notes: 1. Application for the ENERGY STAR must be submitted to EPA within 4 months of the Period Ending date. Award of the ENERGY STAR is not final until approval is received from EPA.2. The EPA Energy Performance Rating is based on total source energy. A rating of 75 is the minimum to be eligible for the ENERGY STAR.3. Values represent energy consumption, annualized to a 12-month period.4. Natural Gas values in units of volume (e.g. cubic feet) are converted to kBtu with adjustments made for elevation based on Facility zip code.5. Values represent energy intensity, annualized to a 12-month period.6. Based on Meeting ASHRAE Standard 62 for ventilation for acceptable indoor air quality, ASHRAE Standard 55 for thermal comfort, and IESNA Lighting Handbook for lighting quality.
The government estimates the average time needed to fill out this form is 6 hours (includes the time for entering energy data, PE facility inspection, and notarizing the SEP) and welcomessuggestions for reducing this level of effort. Send comments (referencing OMB control number) to the Director, Collection Strategies Division, U.S., EPA (2822T), 1200 Pennsylvania Ave., NW,Washington, D.C. 20460.
EPA Form 5900-16

ENERGY STAR®
Data Checklistfor Commercial Buildings
In order for a building to qualify for the ENERGY STAR, a Professional Engineer (PE) must validate the accuracy of the data underlying the building's energyperformance rating. This checklist is designed to provide an at-a-glance summary of a property's physical and operating characteristics, as well as its total energyconsumption, to assist the PE in double-checking the information that the building owner or operator has entered into Portfolio Manager.
Please complete and sign this checklist and include it with the stamped, signed Statement of Energy Performance.NOTE: You must check each box to indicate that each value is correct, OR include a note.
CRITERION VALUE AS ENTERED INPORTFOLIO MANAGER VERIFICATION QUESTIONS NOTES
Building Name DPW Garage Is this the official building name to be displayed inthe ENERGY STAR Registry of LabeledBuildings?
Type Self-Storage Is this an accurate description of the space inquestion?
Location Sand Road, Westwood, NJ
07675 Is this address accurate and complete? Correctweather normalization requires an accurate zipcode.
Single Structure Single Facility
Does this SEP represent a single structure? SEPscannot be submitted for multiple-buildingcampuses (with the exception of acute care orchildren's hospitals) nor can they be submitted asrepresenting only a portion of a building
DPW Garage (Other)
CRITERION VALUE AS ENTERED INPORTFOLIO MANAGER VERIFICATION QUESTIONS NOTES
Gross Floor Area 7,500 Sq. Ft.
Does this square footage include all supportingfunctions such as kitchens and break rooms usedby staff, storage areas, administrative areas,elevators, stairwells, atria, vent shafts, etc. Alsonote that existing atriums should only include thebase floor area that it occupies. Interstitial(plenum) space between floors should not beincluded in the total. Finally gross floor area is notthe same as leasable space. Leasable space is asubset of gross floor area.
Number of PCs 0(Optional) Is this the number of personal computers in thespace?
Weekly operatinghours 40Hours(Optional)
Is this the total number of hours per week that thespace is 75% occupied? This number shouldexclude hours when the facility is occupied only bymaintenance, security, or other support personnel.For facilities with a schedule that varies during theyear, "operating hours/week" refers to the totalweekly hours for the schedule most often followed.
Workers on MainShift 0(Optional)
Is this the number of employees present during themain shift? Note this is not the total number ofemployees or visitors who are in a building duringan entire 24 hour period. For example, if there aretwo daily 8 hour shifts of 100 workers each, theWorkers on Main Shift value is 100.
Page 1 of 3

ENERGY STAR®
Data Checklistfor Commercial Buildings
Energy ConsumptionPower Generation Plant or Distribution Utility: Public Service Elec & Gas Co
Fuel Type: Electricity
Meter: 626044514 (kWh (thousand Watt-hours))Space(s): Entire Facility
Generation Method: Grid Purchase
Start Date End Date Energy Use (kWh (thousand Watt-hours))
01/21/2009 02/17/2009 2,093.00
12/24/2008 01/20/2009 2,425.00
11/25/2008 12/23/2008 2,721.00
10/25/2008 11/24/2008 1,346.00
09/26/2008 10/24/2008 952.00
08/27/2008 09/25/2008 754.00
07/29/2008 08/26/2008 736.00
06/27/2008 07/28/2008 740.00
05/30/2008 06/26/2008 730.00
04/29/2008 05/29/2008 984.00
03/29/2008 04/28/2008 1,120.00
02/28/2008 03/28/2008 1,306.00
626044514 Consumption (kWh (thousand Watt-hours)) 15,907.00
626044514 Consumption (kBtu (thousand Btu)) 54,274.68
Total Electricity (Grid Purchase) Consumption (kBtu (thousand Btu)) 54,274.68
Is this the total Electricity (Grid Purchase) consumption at this building including allElectricity meters?
Fuel Type: Natural Gas
Meter: 3153991 (therms)Space(s): Entire Facility
Start Date End Date Energy Use (therms)
01/21/2009 02/17/2009 534.71
12/24/2008 01/20/2009 626.63
11/25/2008 12/23/2008 416.71
10/28/2008 11/24/2008 93.13
09/26/2008 10/27/2008 0.00
08/27/2008 09/25/2008 0.00
07/30/2008 08/26/2008 0.00
06/28/2008 07/29/2008 0.00
05/30/2008 06/27/2008 0.00
04/30/2008 05/29/2008 1.04
Page 2 of 3

04/01/2008 04/29/2008 57.39
03/01/2008 03/31/2008 267.10
3153991 Consumption (therms) 1,996.71
3153991 Consumption (kBtu (thousand Btu)) 199,671.00
Total Natural Gas Consumption (kBtu (thousand Btu)) 199,671.00
Is this the total Natural Gas consumption at this building including all Natural Gas meters?
Additional FuelsDo the fuel consumption totals shown above represent the total energy use of this building?Please confirm there are no additional fuels (district energy, generator fuel oil) used in this facility.
On-Site Solar and Wind EnergyDo the fuel consumption totals shown above include all on-site solar and/or wind power located atyour facility? Please confirm that no on-site solar or wind installations have been omitted from thislist. All on-site systems must be reported.
Certifying Professional (When applying for the ENERGY STAR, the Certifying Professional must be the same as the PE that signed and stamped the SEP.)
Name: _____________________________________________ Date: _____________
Signature: ______________________________________ Signature is required when applying for the ENERGY STAR.
Page 3 of 3

FOR YOUR RECORDS ONLY. DO NOT SUBMIT TO EPA.
Please keep this Facility Summary for your own records; do not submit it to EPA. Only the Statement of Energy Performance(SEP), Data Checklist and Letter of Agreement need to be submitted to EPA when applying for the ENERGY STAR.
FacilityDPW GarageSand RoadWestwood, NJ 07675
Facility OwnerBorough of Westwood101 Washington Avenue Westwood, NJ 07675
Primary Contact for this FacilityRobert Hoffmann101 Washington Avenue Westwood, NJ 07675
General InformationDPW Garage
Gross Floor Area Excluding Parking: (ft2) 7,500 Year Built 1996 For 12-month Evaluation Period Ending Date: February 28, 2009
Facility Space Use SummaryDPW Garage
Space TypeOther -
Self-Storage
Gross Floor Area(ft2) 7,500
Number of PCso 0
Weekly operating hourso 40
Workers on Main Shifto 0
Energy Performance ComparisonEvaluation Periods Comparisons
Performance Metrics Current(Ending Date 02/28/2009)
Baseline(Ending Date 12/31/2008) Rating of 75 Target National Average
Energy Performance Rating N/A N/A 75 N/A N/A
Energy Intensity
Site (kBtu/ft2) 36 32 0 N/A 4
Source (kBtu/ft2) 55 49 0 N/A 12
Energy Cost
$/year $ 5,594.90 $ 5,178.81 N/A N/A $ 620.97
$/ft2/year $ 0.75 $ 0.69 N/A N/A $ 0.08
Greenhouse Gas Emissions
MtCO2e/year 20 18 0 N/A 2
kgCO2e/ft2/year 3 2 0 N/A 0
More than 50% of your building is defined as Self-Storage. This building is currently ineligible for a rating. Please note the National Average column represents theCBECS national average data for Self-Storage. This building uses X% less energy per square foot than the CBECS national average for Self-Storage. Notes:o - This attribute is optional.d - A default value has been supplied by Portfolio Manager.
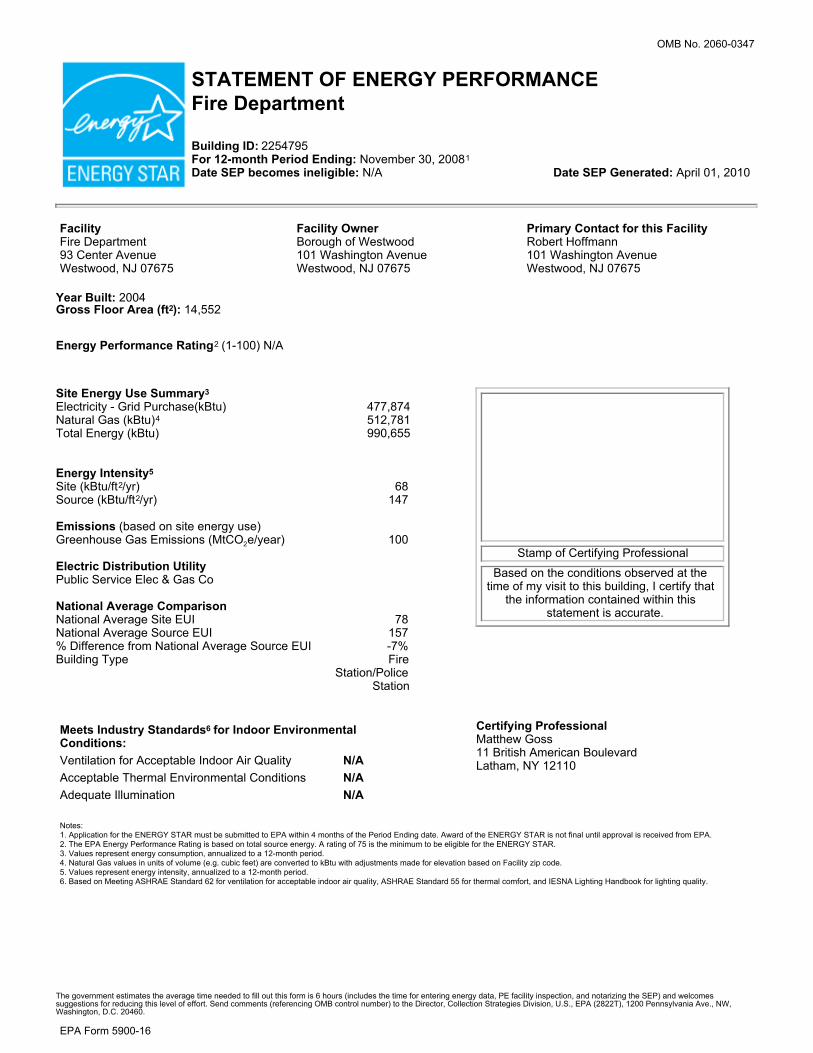
OMB No. 2060-0347
STATEMENT OF ENERGY PERFORMANCEFire Department
Building ID: 2254795 For 12-month Period Ending: November 30, 20081
Date SEP becomes ineligible: N/A Date SEP Generated: April 01, 2010
FacilityFire Department93 Center AvenueWestwood, NJ 07675
Facility OwnerBorough of Westwood101 Washington Avenue Westwood, NJ 07675
Primary Contact for this FacilityRobert Hoffmann101 Washington Avenue Westwood, NJ 07675
Year Built: 2004Gross Floor Area (ft2): 14,552
Energy Performance Rating2 (1-100) N/A
Site Energy Use Summary3
Electricity - Grid Purchase(kBtu) 477,874 Natural Gas (kBtu)4 512,781 Total Energy (kBtu) 990,655
Energy Intensity5 Site (kBtu/ft2/yr) 68 Source (kBtu/ft2/yr) 147 Emissions (based on site energy use) Greenhouse Gas Emissions (MtCO2e/year) 100 Electric Distribution Utility Public Service Elec & Gas Co National Average Comparison National Average Site EUI 78 National Average Source EUI 157 % Difference from National Average Source EUI -7% Building Type Fire
Station/PoliceStation
Stamp of Certifying Professional
Based on the conditions observed at thetime of my visit to this building, I certify that
the information contained within thisstatement is accurate.
Meets Industry Standards6 for Indoor EnvironmentalConditions:Ventilation for Acceptable Indoor Air Quality N/A Acceptable Thermal Environmental Conditions N/A Adequate Illumination N/A
Certifying ProfessionalMatthew Goss11 British American Boulevard Latham, NY 12110
Notes: 1. Application for the ENERGY STAR must be submitted to EPA within 4 months of the Period Ending date. Award of the ENERGY STAR is not final until approval is received from EPA.2. The EPA Energy Performance Rating is based on total source energy. A rating of 75 is the minimum to be eligible for the ENERGY STAR.3. Values represent energy consumption, annualized to a 12-month period.4. Natural Gas values in units of volume (e.g. cubic feet) are converted to kBtu with adjustments made for elevation based on Facility zip code.5. Values represent energy intensity, annualized to a 12-month period.6. Based on Meeting ASHRAE Standard 62 for ventilation for acceptable indoor air quality, ASHRAE Standard 55 for thermal comfort, and IESNA Lighting Handbook for lighting quality.
The government estimates the average time needed to fill out this form is 6 hours (includes the time for entering energy data, PE facility inspection, and notarizing the SEP) and welcomessuggestions for reducing this level of effort. Send comments (referencing OMB control number) to the Director, Collection Strategies Division, U.S., EPA (2822T), 1200 Pennsylvania Ave., NW,Washington, D.C. 20460.
EPA Form 5900-16

ENERGY STAR®
Data Checklistfor Commercial Buildings
In order for a building to qualify for the ENERGY STAR, a Professional Engineer (PE) must validate the accuracy of the data underlying the building's energyperformance rating. This checklist is designed to provide an at-a-glance summary of a property's physical and operating characteristics, as well as its total energyconsumption, to assist the PE in double-checking the information that the building owner or operator has entered into Portfolio Manager.
Please complete and sign this checklist and include it with the stamped, signed Statement of Energy Performance.NOTE: You must check each box to indicate that each value is correct, OR include a note.
CRITERION VALUE AS ENTERED INPORTFOLIO MANAGER VERIFICATION QUESTIONS NOTES
Building Name Fire Department Is this the official building name to be displayed inthe ENERGY STAR Registry of LabeledBuildings?
Type Fire Station/Police Station Is this an accurate description of the space inquestion?
Location 93 Center Avenue,
Westwood, NJ 07675 Is this address accurate and complete? Correctweather normalization requires an accurate zipcode.
Single Structure Single Facility
Does this SEP represent a single structure? SEPscannot be submitted for multiple-buildingcampuses (with the exception of acute care orchildren's hospitals) nor can they be submitted asrepresenting only a portion of a building
Fire Department (Other)
CRITERION VALUE AS ENTERED INPORTFOLIO MANAGER VERIFICATION QUESTIONS NOTES
Gross Floor Area 14,552 Sq. Ft.
Does this square footage include all supportingfunctions such as kitchens and break rooms usedby staff, storage areas, administrative areas,elevators, stairwells, atria, vent shafts, etc. Alsonote that existing atriums should only include thebase floor area that it occupies. Interstitial(plenum) space between floors should not beincluded in the total. Finally gross floor area is notthe same as leasable space. Leasable space is asubset of gross floor area.
Number of PCs 8(Optional) Is this the number of personal computers in thespace?
Weekly operatinghours 15Hours(Optional)
Is this the total number of hours per week that thespace is 75% occupied? This number shouldexclude hours when the facility is occupied only bymaintenance, security, or other support personnel.For facilities with a schedule that varies during theyear, "operating hours/week" refers to the totalweekly hours for the schedule most often followed.
Workers on MainShift 1(Optional)
Is this the number of employees present during themain shift? Note this is not the total number ofemployees or visitors who are in a building duringan entire 24 hour period. For example, if there aretwo daily 8 hour shifts of 100 workers each, theWorkers on Main Shift value is 100.
Page 1 of 3
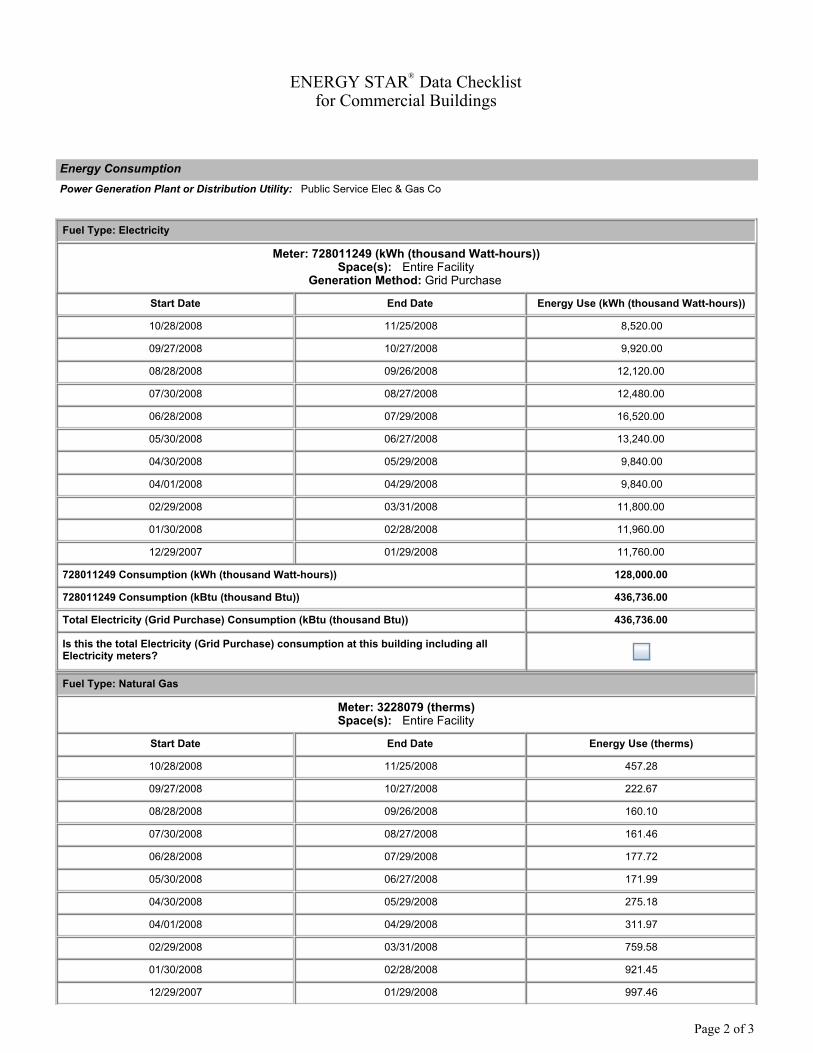
ENERGY STAR®
Data Checklistfor Commercial Buildings
Energy ConsumptionPower Generation Plant or Distribution Utility: Public Service Elec & Gas Co
Fuel Type: Electricity
Meter: 728011249 (kWh (thousand Watt-hours))Space(s): Entire Facility
Generation Method: Grid Purchase
Start Date End Date Energy Use (kWh (thousand Watt-hours))
10/28/2008 11/25/2008 8,520.00
09/27/2008 10/27/2008 9,920.00
08/28/2008 09/26/2008 12,120.00
07/30/2008 08/27/2008 12,480.00
06/28/2008 07/29/2008 16,520.00
05/30/2008 06/27/2008 13,240.00
04/30/2008 05/29/2008 9,840.00
04/01/2008 04/29/2008 9,840.00
02/29/2008 03/31/2008 11,800.00
01/30/2008 02/28/2008 11,960.00
12/29/2007 01/29/2008 11,760.00
728011249 Consumption (kWh (thousand Watt-hours)) 128,000.00
728011249 Consumption (kBtu (thousand Btu)) 436,736.00
Total Electricity (Grid Purchase) Consumption (kBtu (thousand Btu)) 436,736.00
Is this the total Electricity (Grid Purchase) consumption at this building including allElectricity meters?
Fuel Type: Natural Gas
Meter: 3228079 (therms)Space(s): Entire Facility
Start Date End Date Energy Use (therms)
10/28/2008 11/25/2008 457.28
09/27/2008 10/27/2008 222.67
08/28/2008 09/26/2008 160.10
07/30/2008 08/27/2008 161.46
06/28/2008 07/29/2008 177.72
05/30/2008 06/27/2008 171.99
04/30/2008 05/29/2008 275.18
04/01/2008 04/29/2008 311.97
02/29/2008 03/31/2008 759.58
01/30/2008 02/28/2008 921.45
12/29/2007 01/29/2008 997.46
Page 2 of 3

3228079 Consumption (therms) 4,616.86
3228079 Consumption (kBtu (thousand Btu)) 461,686.00
Total Natural Gas Consumption (kBtu (thousand Btu)) 461,686.00
Is this the total Natural Gas consumption at this building including all Natural Gas meters?
Additional FuelsDo the fuel consumption totals shown above represent the total energy use of this building?Please confirm there are no additional fuels (district energy, generator fuel oil) used in this facility.
On-Site Solar and Wind EnergyDo the fuel consumption totals shown above include all on-site solar and/or wind power located atyour facility? Please confirm that no on-site solar or wind installations have been omitted from thislist. All on-site systems must be reported.
Certifying Professional (When applying for the ENERGY STAR, the Certifying Professional must be the same as the PE that signed and stamped the SEP.)
Name: _____________________________________________ Date: _____________
Signature: ______________________________________ Signature is required when applying for the ENERGY STAR.
Page 3 of 3
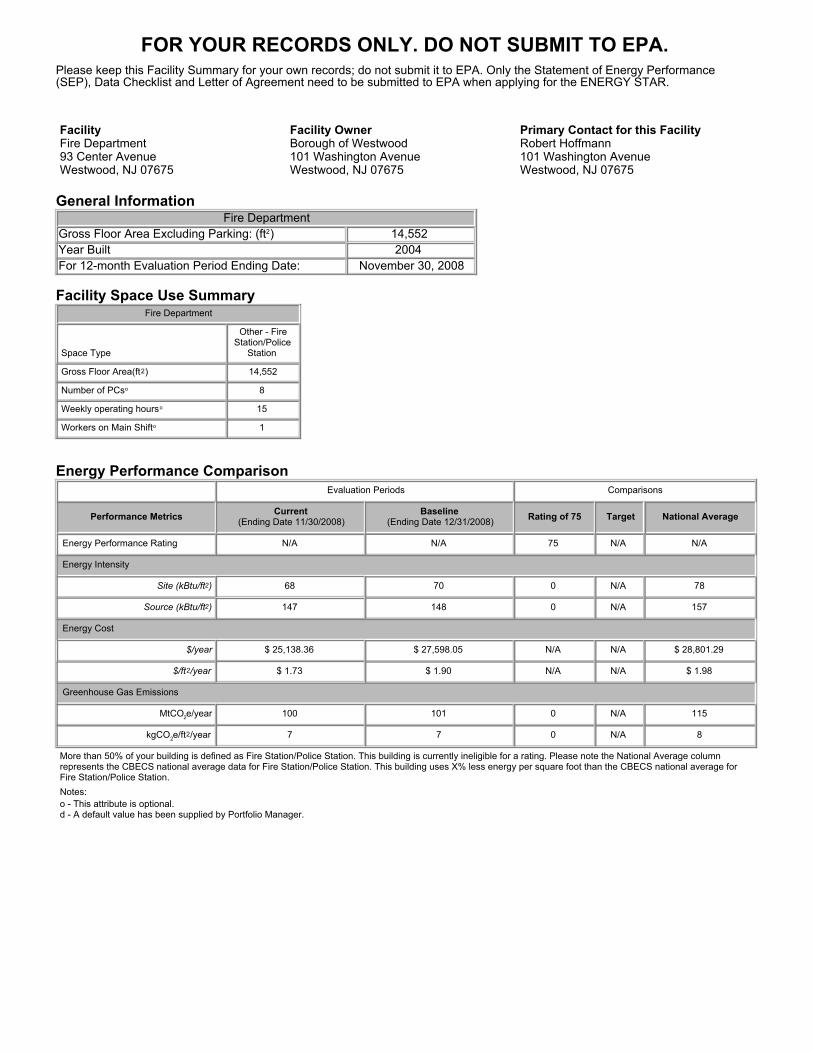
FOR YOUR RECORDS ONLY. DO NOT SUBMIT TO EPA.
Please keep this Facility Summary for your own records; do not submit it to EPA. Only the Statement of Energy Performance(SEP), Data Checklist and Letter of Agreement need to be submitted to EPA when applying for the ENERGY STAR.
FacilityFire Department93 Center AvenueWestwood, NJ 07675
Facility OwnerBorough of Westwood101 Washington Avenue Westwood, NJ 07675
Primary Contact for this FacilityRobert Hoffmann101 Washington Avenue Westwood, NJ 07675
General InformationFire Department
Gross Floor Area Excluding Parking: (ft2) 14,552 Year Built 2004 For 12-month Evaluation Period Ending Date: November 30, 2008
Facility Space Use SummaryFire Department
Space Type
Other - FireStation/Police
Station
Gross Floor Area(ft2) 14,552
Number of PCso 8
Weekly operating hourso 15
Workers on Main Shifto 1
Energy Performance ComparisonEvaluation Periods Comparisons
Performance Metrics Current(Ending Date 11/30/2008)
Baseline(Ending Date 12/31/2008) Rating of 75 Target National Average
Energy Performance Rating N/A N/A 75 N/A N/A
Energy Intensity
Site (kBtu/ft2) 68 70 0 N/A 78
Source (kBtu/ft2) 147 148 0 N/A 157
Energy Cost
$/year $ 25,138.36 $ 27,598.05 N/A N/A $ 28,801.29
$/ft2/year $ 1.73 $ 1.90 N/A N/A $ 1.98
Greenhouse Gas Emissions
MtCO2e/year 100 101 0 N/A 115
kgCO2e/ft2/year 7 7 0 N/A 8
More than 50% of your building is defined as Fire Station/Police Station. This building is currently ineligible for a rating. Please note the National Average columnrepresents the CBECS national average data for Fire Station/Police Station. This building uses X% less energy per square foot than the CBECS national average forFire Station/Police Station. Notes:o - This attribute is optional.d - A default value has been supplied by Portfolio Manager.

1
Portfolio Manager is an interactive energy management tool that allows you to track and assess energy and water consumption across your entire portfolio of buildings in a secure online environment. Use this Quick Reference Guide to identify opportunities for energy efficiency improvements, track your progress over time, and verify results.
PoRtfolio ManaGeR QUick RefeRence GUide
IdentIfy energy effIcIency projectsUse Portfolio Manager to identify under-performing buildings to target for energy efficiency improvements and establish baselines for setting and measuring progress for energy efficiency improvement projects over time.
step ActIvIty ActIon
access Portfolio Manager. (step not shown)
Visit www.energystar.gov/benchmark.Scroll down to the Login section on the right-hand side in the middle of the page.
access your account: (step not shown)
• Create a new account.• Login to an existing account.
• Click regIster, and follow instructions.• Enter user name and password, and click LogIn.
Review system updates and enter account.(step not shown) click Access My portfoLIo, located below Welcome to portfolio Manager.
add a new facility. (step not shown) click Add a Property, located in the upper right portion of the screen.
Select property type and entergeneral facility information.(step not shown)
Select the option that most closely resembles your facility and click contInUe. enter general data and click sAve. for more information on facility space types, see: www.energystar.gov/index.cfm?c=eligibility.bus_portfoliomanager_space_types.
enter space use data.
from the facility summary page, shown above, go to the space Use section, located half way down the page, and click Add spAce.• Enter a facility name. In the select a space type menu, select the appropriate space type(s) for your building. if your space is not listed, select other. click contInUe.• Enter building characteristics. Click sAve. information required for each space type is listed here: www.energystar.gov/index.cfm?c=eligibility.bus_ portfoliomanager_space_types.• Repeat steps above to add all major spaces in your facility.
Use bulk import service to minimize manual data entry of large sets of facility data (10 or more facilities or campuses are required). • Go back to My portfolio by clicking on the link in the upper left portion of the page.• Click IMport facility data Using templates, located below Add a property.
enter energy use data.
from the facility summary page, go to the energy Meters section, located below the space Use section, and click Add Meter. • Enter meter name, type, and units. Click sAve. • Enter number of months and start date. Click contInUe. • Enter energy use and cost for each month. Click sAve. • Repeat for all energy meters and fuel types.
1
2
3
4
5
ww
w.e
nerg
ysta
r.gov
/ben
chm
ark
6
7
7
6

2
step ActIvIty ActIon
create custom groups.
organize facilities into groups (e.g., fire Stations, northwest Region). Groups are completely customizable, and each facility may belong to multiple groups.• From the My portfolio page, click creAte groUp, located directly to the right of the group drop-down menu.• Follow instructions to select buildings and name your group. • Once they have been saved, custom groups will be available in the group drop- down menu.
View and interpret results.
option 1: Go to My portfolio and view all buildings to compare performance metrics.
Option 2: Export data to Microsoft® Excel.
• On the My portfolio page, select the view, from the view drop-down menu that will display the data you wish to export. The My portfolio page will update to display the selected view. (9a)• Select the doWnLoAd In exceL link. a file download dialog window will open. Follow the steps provided by Excel. (9b)• Use Excel functionality to view building energy performance graphically . The example below shows a comparison of Energy Use Intensity for a portfolio of fire stations, identifying under-performing buildings to target for energy eficiency improvements.
9
Fire Stations - EUI Comparison
0
50
100
150
200
250
300
350
Fire Statio
n 1
Fire Statio
n 2
Fire Statio
n 3
Fire Statio
n 4
Fire Statio
n 5
Fire Statio
n 6
Fire Statio
n 7
Fire Statio
n 8
Fire Statio
n 9
Fire Statio
n 10
Fire Stations
Curr
ent W
eath
er
Nor
mal
ized
Sou
rce
Ener
gy
Use
Inte
nsity
(k
BTU
/SF)
8
8
ww
w.e
nerg
ysta
r.gov
/ben
chm
ark
9b
9a

3
trAck progress over tIMe Portfolio Manager comes pre-populated with nine standard summary views of facility data, which are displayed on the My Portfolio summary page. these standard views include: • Summary: Energy Use • Performance: Green House Gas emissions • Performance: Financial • Performance: Water Use
additionally, users can create and save custom downloadable views by choosing from more than 70 different metrics. the default view set by the user will display automatically after logging into Portfolio Manager, and data from all views can be exported to Microsoft® Excel.
ww
w.e
nerg
ysta
r.gov
/ben
chm
ark
creAte A cUstoM vIeW
step ActIon
from the My portfolio page or the facility summary page, select the create view link, located directly to the right of the view drop-down menu.
Enter a name for the view. To set as the default view, select the box labeled set this view as My portfolio default, located directly to the right of view name. You may include up to 7 (seven) columns in each view.
choose each metric to be included in the view by selecting an order number from the preferred column order drop-down menu to the left of the facility data column.
click sAve at the bottom of the page. You will be returned to the My portfolio page, and your custom view will be available in the view drop-down menu. (step not shown)
4
3
1
2
2
3
1

4
verIfy And docUMent resULtsUse Portfolio Manager to quickly and accurately document reductions in energy use, greenhouse gas emissions, water use, and energy costs for an individual building or an entire portfolio. this valuable information can be used to provide a level of transparency and accountability to help demonstrate strategic use of funding.
Generate a Statement of energy Performance that includes valuable information about your building’s performance, including:
• Normalized energy use intensity • National average comparisons • Greenhouse gas emissions • Energy performance rating (if available)
in addition, you can also request an energy Performance Report to see the change in performance over time for selected buildings or an entire portfolio. available comparative metrics in this report include:
• Normalized energy use intensity • Total electric use • Total natural gas use • Energy performance rating (if available)
ww
w.e
nerg
ysta
r.gov
/ben
chm
ark
generAte A stAteMent of energy perforMAnce And An energy perforMAnce report
step ActIon
from your selected building’s facility summary page, click generAte A stAteMent of energy perforMAnce.
On the next page, select a period ending date. (step not shown)
click generAte report, located in the bottom right corner of the screen. (step not shown)
Save the Statement of energy Performance, accompanying data checklist, and facility Summary that include information on energy use intensity and greenhouse gas emissions.
from the My portfolio page, click reQUest energy perforMAnce report, located under Work with facilities, which shows reductions in key performance indicators over a user-specified time period. Specify the type of report, the facilities to be included, and the requested report columns. the report will be e-mailed to a user-specified address within one business day. (step not shown)
4
5
3
1
2
1
4

APPENDIX C
eQUEST MODEL RUN SUMMARIES

Project/Run: Borough Hall - Baseline Design Run Date/Time: 03/26/10 @ 10:09
eQUEST 3.63.6500 Monthly Energy Consumption by Enduse Page 1
0
10
20
30
40
50
Jan Feb Mar Apr May Jun Jul Aug Sep Oct Nov Dec
Electric Consumption (kWh)
(x000)
0
100
200
300
Jan Feb Mar Apr May Jun Jul Aug Sep Oct Nov Dec
Gas Consumption (Btu)
(x000,000)
Area LightingTask LightingMisc. Equipment
Exterior UsagePumps & Aux.Ventilation Fans
Water HeatingHt Pump Supp.Space Heating
RefrigerationHeat RejectionSpace Cooling
Electric Consumption (kWh x000)
Jan Feb Mar Apr May Jun Jul Aug Sep Oct Nov Dec Total Space Cool - - 0.18 1.09 5.26 11.43 16.36 16.31 8.32 3.63 0.19 0.11 62.89 Heat Reject. - - - - - - - - - - - - - Refrigeration - - - - - - - - - - - - - Space Heat - - - - - - - - - - - - - HP Supp. - - - - - - - - - - - - - Hot Water - - - - - - - - - - - - - Vent. Fans 1.26 1.07 1.27 1.40 1.69 1.61 1.48 1.49 1.18 1.70 1.36 1.29 16.80 Pumps & Aux. 0.80 0.71 0.73 0.56 0.20 0.02 - - 0.06 0.35 0.64 0.77 4.83 Ext. Usage 2.15 1.65 1.83 1.77 1.26 1.22 1.26 2.05 1.99 2.05 2.08 2.15 21.46 Misc. Equip. 8.93 8.50 9.88 9.50 9.17 9.50 9.40 9.64 9.26 9.17 9.02 9.40 111.38 Task Lights - - - - - - - - - - - - - Area Lights 13.13 12.47 14.45 13.89 13.46 13.89 13.79 14.12 13.57 13.46 13.24 13.79 163.26 Total 26.26 24.40 28.33 28.21 31.04 37.68 42.30 43.62 34.39 30.36 26.53 27.51 380.62
Gas Consumption (Btu x000,000)
Jan Feb Mar Apr May Jun Jul Aug Sep Oct Nov Dec Total Space Cool - - - - - - - - - - - - - Heat Reject. - - - - - - - - - - - - - Refrigeration - - - - - - - - - - - - - Space Heat 253.2 194.6 144.5 70.7 10.5 0.2 - - 0.2 12.8 89.2 191.0 966.8 HP Supp. - - - - - - - - - - - - - Hot Water 3.5 3.6 4.3 4.1 3.5 3.5 3.1 3.1 2.9 3.0 3.2 3.6 41.4 Vent. Fans - - - - - - - - - - - - - Pumps & Aux. - - - - - - - - - - - - - Ext. Usage - - - - - - - - - - - - - Misc. Equip. - - - - - - - - - - - - - Task Lights - - - - - - - - - - - - - Area Lights - - - - - - - - - - - - - Total 256.7 198.2 148.8 74.8 13.9 3.7 3.1 3.1 3.1 15.8 92.4 194.6 1,008.2

Project/Run: Borough Hall - 1 Run Date/Time: 03/30/10 @ 13:59
eQUEST 3.63.6500 Monthly Energy Consumption by Enduse Page 1
0
10
20
30
40
50
Jan Feb Mar Apr May Jun Jul Aug Sep Oct Nov Dec
Electric Consumption (kWh)
(x000)
0
50
100
150
200
Jan Feb Mar Apr May Jun Jul Aug Sep Oct Nov Dec
Gas Consumption (Btu)
(x000,000)
Area LightingTask LightingMisc. Equipment
Exterior UsagePumps & Aux.Ventilation Fans
Water HeatingHt Pump Supp.Space Heating
RefrigerationHeat RejectionSpace Cooling
Electric Consumption (kWh x000)
Jan Feb Mar Apr May Jun Jul Aug Sep Oct Nov Dec Total Space Cool - - 0.18 1.09 5.26 11.43 16.36 16.31 8.32 3.63 0.19 0.11 62.89 Heat Reject. - - - - - - - - - - - - - Refrigeration - - - - - - - - - - - - - Space Heat 0.29 0.24 0.20 0.11 0.02 0.00 - - 0.00 0.02 0.14 0.25 1.28 HP Supp. - - - - - - - - - - - - - Hot Water - - - - - - - - - - - - - Vent. Fans 1.26 1.07 1.27 1.40 1.69 1.61 1.48 1.49 1.18 1.70 1.36 1.29 16.80 Pumps & Aux. 0.85 0.76 0.78 0.61 0.23 0.02 - - 0.07 0.38 0.69 0.82 5.19 Ext. Usage 2.15 1.65 1.83 1.77 1.26 1.22 1.26 2.05 1.99 2.05 2.08 2.15 21.46 Misc. Equip. 8.93 8.50 9.88 9.50 9.17 9.50 9.40 9.64 9.26 9.17 9.02 9.40 111.38 Task Lights - - - - - - - - - - - - - Area Lights 13.13 12.47 14.45 13.89 13.46 13.89 13.79 14.12 13.57 13.46 13.24 13.79 163.26 Total 26.61 24.69 28.58 28.36 31.08 37.68 42.30 43.62 34.39 30.41 26.72 27.82 382.26
Gas Consumption (Btu x000,000)
Jan Feb Mar Apr May Jun Jul Aug Sep Oct Nov Dec Total Space Cool - - - - - - - - - - - - - Heat Reject. - - - - - - - - - - - - - Refrigeration - - - - - - - - - - - - - Space Heat 193.76 145.87 104.13 47.08 5.82 0.07 - - 0.06 7.33 60.91 140.98 706.01 HP Supp. - - - - - - - - - - - - - Hot Water 3.54 3.61 4.32 4.06 3.47 3.47 3.11 3.09 2.95 2.97 3.19 3.62 41.40 Vent. Fans - - - - - - - - - - - - - Pumps & Aux. - - - - - - - - - - - - - Ext. Usage - - - - - - - - - - - - - Misc. Equip. - - - - - - - - - - - - - Task Lights - - - - - - - - - - - - - Area Lights - - - - - - - - - - - - - Total 197.29 149.48 108.46 51.14 9.29 3.54 3.11 3.09 3.01 10.30 64.11 144.60 747.41

Project/Run: Borough Hall - Baseline Design Run Date/Time: 03/30/10 @ 14:44
eQUEST 3.63.6500 Monthly Energy Consumption by Enduse Page 1
0
10
20
30
40
50
Jan Feb Mar Apr May Jun Jul Aug Sep Oct Nov Dec
Electric Consumption (kWh)
(x000)
0
1
2
3
4
5
Jan Feb Mar Apr May Jun Jul Aug Sep Oct Nov Dec
Gas Consumption (Btu)
(x000,000)
Area LightingTask LightingMisc. Equipment
Exterior UsagePumps & Aux.Ventilation Fans
Water HeatingHt Pump Supp.Space Heating
RefrigerationHeat RejectionSpace Cooling
Electric Consumption (kWh x000)
Jan Feb Mar Apr May Jun Jul Aug Sep Oct Nov Dec Total Space Cool - - 0.00 0.21 1.89 5.15 7.93 8.38 4.06 1.08 0.03 0.00 28.72 Heat Reject. - - - - - - - - - - - - - Refrigeration - - - - - - - - - - - - - Space Heat 9.00 6.88 4.88 2.01 0.11 - - - - 0.15 2.65 6.65 32.33 HP Supp. - - - - - - - - - - - - - Hot Water - - - - - - - - - - - - - Vent. Fans 4.12 3.72 4.12 3.99 4.12 3.99 4.12 4.12 3.99 4.12 3.99 4.12 48.50 Pumps & Aux. 3.98 3.38 2.92 1.91 1.75 2.59 3.56 4.02 1.93 1.00 2.04 3.52 32.60 Ext. Usage 2.15 1.65 1.83 1.77 1.26 1.22 1.26 2.05 1.99 2.05 2.08 2.15 21.46 Misc. Equip. 8.93 8.50 9.88 9.50 9.17 9.50 9.40 9.64 9.26 9.17 9.02 9.40 111.38 Task Lights - - - - - - - - - - - - - Area Lights 13.13 12.47 14.45 13.89 13.46 13.89 13.79 14.12 13.57 13.46 13.24 13.79 163.26 Total 41.32 36.59 38.08 33.28 31.76 36.34 40.06 42.33 34.79 31.03 33.05 39.64 438.25
Gas Consumption (Btu x000,000)
Jan Feb Mar Apr May Jun Jul Aug Sep Oct Nov Dec Total Space Cool - - - - - - - - - - - - - Heat Reject. - - - - - - - - - - - - - Refrigeration - - - - - - - - - - - - - Space Heat - - - - - - - - - - - - - HP Supp. - - - - - - - - - - - - - Hot Water 3.54 3.61 4.32 4.05 3.46 3.45 3.09 3.07 2.93 2.96 3.19 3.61 41.30 Vent. Fans - - - - - - - - - - - - - Pumps & Aux. - - - - - - - - - - - - - Ext. Usage - - - - - - - - - - - - - Misc. Equip. - - - - - - - - - - - - - Task Lights - - - - - - - - - - - - - Area Lights - - - - - - - - - - - - - Total 3.54 3.61 4.32 4.05 3.46 3.45 3.09 3.07 2.93 2.96 3.19 3.61 41.30
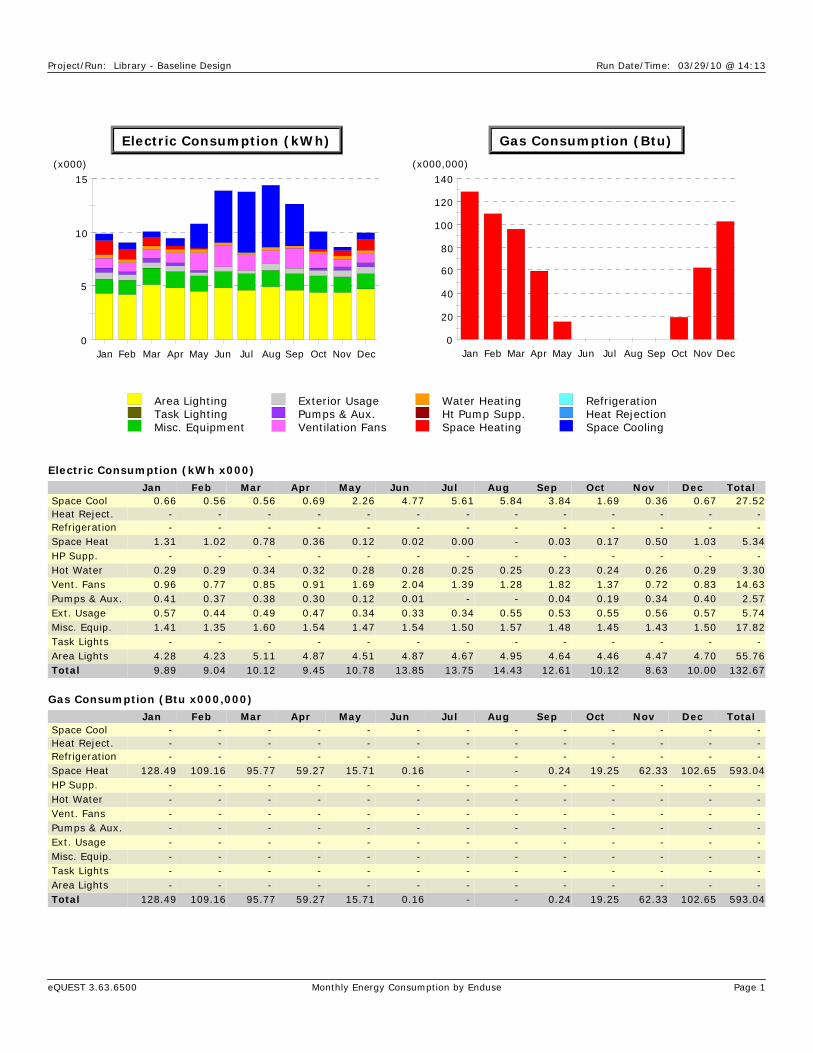
Project/Run: Library - Baseline Design Run Date/Time: 03/29/10 @ 14:13
eQUEST 3.63.6500 Monthly Energy Consumption by Enduse Page 1
0
5
10
15
Jan Feb Mar Apr May Jun Jul Aug Sep Oct Nov Dec
Electric Consumption (kWh)
(x000)
0
20
40
60
80
100
120
140
Jan Feb Mar Apr May Jun Jul Aug Sep Oct Nov Dec
Gas Consumption (Btu)
(x000,000)
Area LightingTask LightingMisc. Equipment
Exterior UsagePumps & Aux.Ventilation Fans
Water HeatingHt Pump Supp.Space Heating
RefrigerationHeat RejectionSpace Cooling
Electric Consumption (kWh x000)
Jan Feb Mar Apr May Jun Jul Aug Sep Oct Nov Dec Total Space Cool 0.66 0.56 0.56 0.69 2.26 4.77 5.61 5.84 3.84 1.69 0.36 0.67 27.52 Heat Reject. - - - - - - - - - - - - - Refrigeration - - - - - - - - - - - - - Space Heat 1.31 1.02 0.78 0.36 0.12 0.02 0.00 - 0.03 0.17 0.50 1.03 5.34 HP Supp. - - - - - - - - - - - - - Hot Water 0.29 0.29 0.34 0.32 0.28 0.28 0.25 0.25 0.23 0.24 0.26 0.29 3.30 Vent. Fans 0.96 0.77 0.85 0.91 1.69 2.04 1.39 1.28 1.82 1.37 0.72 0.83 14.63 Pumps & Aux. 0.41 0.37 0.38 0.30 0.12 0.01 - - 0.04 0.19 0.34 0.40 2.57 Ext. Usage 0.57 0.44 0.49 0.47 0.34 0.33 0.34 0.55 0.53 0.55 0.56 0.57 5.74 Misc. Equip. 1.41 1.35 1.60 1.54 1.47 1.54 1.50 1.57 1.48 1.45 1.43 1.50 17.82 Task Lights - - - - - - - - - - - - - Area Lights 4.28 4.23 5.11 4.87 4.51 4.87 4.67 4.95 4.64 4.46 4.47 4.70 55.76 Total 9.89 9.04 10.12 9.45 10.78 13.85 13.75 14.43 12.61 10.12 8.63 10.00 132.67
Gas Consumption (Btu x000,000)
Jan Feb Mar Apr May Jun Jul Aug Sep Oct Nov Dec Total Space Cool - - - - - - - - - - - - - Heat Reject. - - - - - - - - - - - - - Refrigeration - - - - - - - - - - - - - Space Heat 128.49 109.16 95.77 59.27 15.71 0.16 - - 0.24 19.25 62.33 102.65 593.04 HP Supp. - - - - - - - - - - - - - Hot Water - - - - - - - - - - - - - Vent. Fans - - - - - - - - - - - - - Pumps & Aux. - - - - - - - - - - - - - Ext. Usage - - - - - - - - - - - - - Misc. Equip. - - - - - - - - - - - - - Task Lights - - - - - - - - - - - - - Area Lights - - - - - - - - - - - - - Total 128.49 109.16 95.77 59.27 15.71 0.16 - - 0.24 19.25 62.33 102.65 593.04

Project/Run: Library - 1 Run Date/Time: 03/29/10 @ 16:48
eQUEST 3.63.6500 Monthly Energy Consumption by Enduse Page 1
0
5
10
15
Jan Feb Mar Apr May Jun Jul Aug Sep Oct Nov Dec
Electric Consumption (kWh)
(x000)
0
20
40
60
80
100
120
Jan Feb Mar Apr May Jun Jul Aug Sep Oct Nov Dec
Gas Consumption (Btu)
(x000,000)
Area LightingTask LightingMisc. Equipment
Exterior UsagePumps & Aux.Ventilation Fans
Water HeatingHt Pump Supp.Space Heating
RefrigerationHeat RejectionSpace Cooling
Electric Consumption (kWh x000)
Jan Feb Mar Apr May Jun Jul Aug Sep Oct Nov Dec Total Space Cool 0.66 0.56 0.56 0.69 2.26 4.77 5.61 5.84 3.84 1.69 0.36 0.67 27.52 Heat Reject. - - - - - - - - - - - - - Refrigeration - - - - - - - - - - - - - Space Heat 1.41 1.11 0.87 0.42 0.14 0.02 0.00 - 0.03 0.20 0.57 1.11 5.89 HP Supp. - - - - - - - - - - - - - Hot Water 0.29 0.29 0.34 0.32 0.28 0.28 0.25 0.25 0.23 0.24 0.26 0.29 3.30 Vent. Fans 0.96 0.77 0.85 0.91 1.69 2.04 1.39 1.28 1.82 1.37 0.72 0.83 14.63 Pumps & Aux. 0.45 0.40 0.41 0.33 0.13 0.01 - - 0.04 0.21 0.37 0.43 2.79 Ext. Usage 0.57 0.44 0.49 0.47 0.34 0.33 0.34 0.55 0.53 0.55 0.56 0.57 5.74 Misc. Equip. 1.41 1.35 1.60 1.54 1.47 1.54 1.50 1.57 1.48 1.45 1.43 1.50 17.82 Task Lights - - - - - - - - - - - - - Area Lights 4.28 4.23 5.11 4.87 4.51 4.87 4.67 4.95 4.64 4.46 4.47 4.70 55.76 Total 10.02 9.16 10.24 9.55 10.81 13.85 13.75 14.43 12.62 10.17 8.73 10.12 133.44
Gas Consumption (Btu x000,000)
Jan Feb Mar Apr May Jun Jul Aug Sep Oct Nov Dec Total Space Cool - - - - - - - - - - - - - Heat Reject. - - - - - - - - - - - - - Refrigeration - - - - - - - - - - - - - Space Heat 108.29 90.68 77.49 46.22 11.23 0.09 - - 0.18 14.35 49.20 85.33 483.07 HP Supp. - - - - - - - - - - - - - Hot Water - - - - - - - - - - - - - Vent. Fans - - - - - - - - - - - - - Pumps & Aux. - - - - - - - - - - - - - Ext. Usage - - - - - - - - - - - - - Misc. Equip. - - - - - - - - - - - - - Task Lights - - - - - - - - - - - - - Area Lights - - - - - - - - - - - - - Total 108.29 90.68 77.49 46.22 11.23 0.09 - - 0.18 14.35 49.20 85.33 483.07

Project/Run: Library - Baseline Design Run Date/Time: 03/30/10 @ 15:22
eQUEST 3.63.6500 Monthly Energy Consumption by Enduse Page 1
0
2
4
6
8
10
12
14
Jan Feb Mar Apr May Jun Jul Aug Sep Oct Nov Dec
Electric Consumption (kWh)
(x000)
0
5
10
15
20
Jan Feb Mar Apr May Jun Jul Aug Sep Oct Nov Dec
Gas Consumption (Btu)
(x000,000)
Area LightingTask LightingMisc. Equipment
Exterior UsagePumps & Aux.Ventilation Fans
Water HeatingHt Pump Supp.Space Heating
RefrigerationHeat RejectionSpace Cooling
Electric Consumption (kWh x000)
Jan Feb Mar Apr May Jun Jul Aug Sep Oct Nov Dec Total Space Cool - - - 0.06 0.64 1.82 2.82 3.18 1.56 0.34 0.00 - 10.43 Heat Reject. - - - - - - - - - - - - - Refrigeration - - - - - - - - - - - - - Space Heat 4.27 3.53 2.89 1.57 0.37 0.08 0.00 - 0.00 0.41 1.92 3.45 18.49 HP Supp. - - - - - - - - - - - - - Hot Water 0.29 0.29 0.34 0.32 0.28 0.27 0.24 0.25 0.23 0.24 0.26 0.29 3.29 Vent. Fans 0.71 0.68 0.79 0.75 0.73 0.74 0.73 0.76 0.71 0.72 0.70 0.73 8.76 Pumps & Aux. 0.91 0.86 0.97 0.84 0.76 0.90 0.90 0.95 0.85 0.62 0.80 0.93 10.29 Ext. Usage 0.57 0.44 0.49 0.47 0.34 0.33 0.34 0.55 0.53 0.55 0.56 0.57 5.74 Misc. Equip. 1.41 1.35 1.60 1.54 1.47 1.54 1.50 1.57 1.48 1.45 1.43 1.50 17.82 Task Lights - - - - - - - - - - - - - Area Lights 4.28 4.23 5.11 4.87 4.51 4.87 4.67 4.95 4.64 4.46 4.47 4.70 55.76 Total 12.45 11.37 12.19 10.42 9.08 10.54 11.21 12.21 10.01 8.79 10.14 12.18 130.58
Gas Consumption (Btu x000,000)
Jan Feb Mar Apr May Jun Jul Aug Sep Oct Nov Dec Total Space Cool - - - - - - - - - - - - - Heat Reject. - - - - - - - - - - - - - Refrigeration - - - - - - - - - - - - - Space Heat 19.98 18.89 19.00 13.83 3.30 - - - - 0.66 7.78 13.03 96.47 HP Supp. - - - - - - - - - - - - - Hot Water - - - - - - - - - - - - - Vent. Fans - - - - - - - - - - - - - Pumps & Aux. - - - - - - - - - - - - - Ext. Usage - - - - - - - - - - - - - Misc. Equip. - - - - - - - - - - - - - Task Lights - - - - - - - - - - - - - Area Lights - - - - - - - - - - - - - Total 19.98 18.89 19.00 13.83 3.30 - - - - 0.66 7.78 13.03 96.47

Project/Run: DPW - Main Building - Baseline Design Run Date/Time: 03/29/10 @ 15:14
eQUEST 3.63.6500 Monthly Energy Consumption by Enduse Page 1
0
2
4
6
8
10
Jan Feb Mar Apr May Jun Jul Aug Sep Oct Nov Dec
Electric Consumption (kWh)
(x000)
0
20
40
60
80
100
120
Jan Feb Mar Apr May Jun Jul Aug Sep Oct Nov Dec
Gas Consumption (Btu)
(x000,000)
Area LightingTask LightingMisc. Equipment
Exterior UsagePumps & Aux.Ventilation Fans
Water HeatingHt Pump Supp.Space Heating
RefrigerationHeat RejectionSpace Cooling
Electric Consumption (kWh x000)
Jan Feb Mar Apr May Jun Jul Aug Sep Oct Nov Dec Total Space Cool - - - 0.01 0.23 0.87 1.84 1.96 0.44 0.07 - - 5.41 Heat Reject. - - - - - - - - - - - - - Refrigeration - - - - - - - - - - - - - Space Heat 5.74 5.04 4.75 3.01 0.72 0.03 0.00 - 0.07 1.35 3.84 5.39 29.93 HP Supp. - - - - - - - - - - - - - Hot Water 0.10 0.10 0.11 0.10 0.09 0.09 0.08 0.08 0.08 0.08 0.09 0.10 1.11 Vent. Fans 0.34 0.29 0.28 0.22 0.17 0.16 0.17 0.16 0.16 0.18 0.24 0.31 2.70 Pumps & Aux. - - - - - - - - - - - - - Ext. Usage 1.08 0.83 0.92 0.89 0.63 0.61 0.63 1.03 1.00 1.03 1.04 1.08 10.77 Misc. Equip. 0.43 0.41 0.48 0.47 0.45 0.47 0.47 0.47 0.45 0.45 0.43 0.45 5.42 Task Lights - - - - - - - - - - - - - Area Lights 1.90 1.83 2.15 2.07 1.98 2.07 2.06 2.08 1.99 1.98 1.91 2.00 24.03 Total 9.59 8.50 8.70 6.76 4.28 4.30 5.26 5.77 4.19 5.15 7.56 9.33 79.38
Gas Consumption (Btu x000,000)
Jan Feb Mar Apr May Jun Jul Aug Sep Oct Nov Dec Total Space Cool - - - - - - - - - - - - - Heat Reject. - - - - - - - - - - - - - Refrigeration - - - - - - - - - - - - - Space Heat 116.99 91.43 69.47 34.47 2.91 - - - - 7.47 49.12 94.77 466.62 HP Supp. - - - - - - - - - - - - - Hot Water - - - - - - - - - - - - - Vent. Fans - - - - - - - - - - - - - Pumps & Aux. - - - - - - - - - - - - - Ext. Usage - - - - - - - - - - - - - Misc. Equip. - - - - - - - - - - - - - Task Lights - - - - - - - - - - - - - Area Lights - - - - - - - - - - - - - Total 116.99 91.43 69.47 34.47 2.91 - - - - 7.47 49.12 94.77 466.62
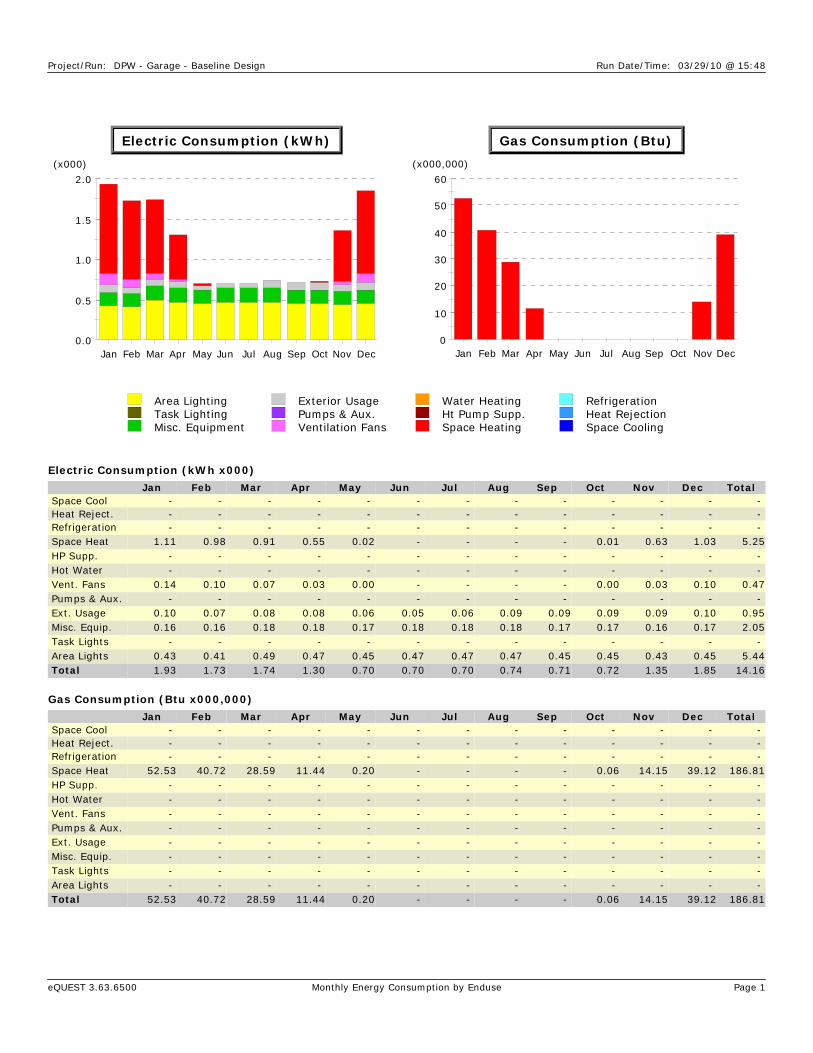
Project/Run: DPW - Garage - Baseline Design Run Date/Time: 03/29/10 @ 15:48
eQUEST 3.63.6500 Monthly Energy Consumption by Enduse Page 1
0.0
0.5
1.0
1.5
2.0
Jan Feb Mar Apr May Jun Jul Aug Sep Oct Nov Dec
Electric Consumption (kWh)
(x000)
0
10
20
30
40
50
60
Jan Feb Mar Apr May Jun Jul Aug Sep Oct Nov Dec
Gas Consumption (Btu)
(x000,000)
Area LightingTask LightingMisc. Equipment
Exterior UsagePumps & Aux.Ventilation Fans
Water HeatingHt Pump Supp.Space Heating
RefrigerationHeat RejectionSpace Cooling
Electric Consumption (kWh x000)
Jan Feb Mar Apr May Jun Jul Aug Sep Oct Nov Dec Total Space Cool - - - - - - - - - - - - - Heat Reject. - - - - - - - - - - - - - Refrigeration - - - - - - - - - - - - - Space Heat 1.11 0.98 0.91 0.55 0.02 - - - - 0.01 0.63 1.03 5.25 HP Supp. - - - - - - - - - - - - - Hot Water - - - - - - - - - - - - - Vent. Fans 0.14 0.10 0.07 0.03 0.00 - - - - 0.00 0.03 0.10 0.47 Pumps & Aux. - - - - - - - - - - - - - Ext. Usage 0.10 0.07 0.08 0.08 0.06 0.05 0.06 0.09 0.09 0.09 0.09 0.10 0.95 Misc. Equip. 0.16 0.16 0.18 0.18 0.17 0.18 0.18 0.18 0.17 0.17 0.16 0.17 2.05 Task Lights - - - - - - - - - - - - - Area Lights 0.43 0.41 0.49 0.47 0.45 0.47 0.47 0.47 0.45 0.45 0.43 0.45 5.44 Total 1.93 1.73 1.74 1.30 0.70 0.70 0.70 0.74 0.71 0.72 1.35 1.85 14.16
Gas Consumption (Btu x000,000)
Jan Feb Mar Apr May Jun Jul Aug Sep Oct Nov Dec Total Space Cool - - - - - - - - - - - - - Heat Reject. - - - - - - - - - - - - - Refrigeration - - - - - - - - - - - - - Space Heat 52.53 40.72 28.59 11.44 0.20 - - - - 0.06 14.15 39.12 186.81 HP Supp. - - - - - - - - - - - - - Hot Water - - - - - - - - - - - - - Vent. Fans - - - - - - - - - - - - - Pumps & Aux. - - - - - - - - - - - - - Ext. Usage - - - - - - - - - - - - - Misc. Equip. - - - - - - - - - - - - - Task Lights - - - - - - - - - - - - - Area Lights - - - - - - - - - - - - - Total 52.53 40.72 28.59 11.44 0.20 - - - - 0.06 14.15 39.12 186.81

Project/Run: Fire Department - Baseline Design Run Date/Time: 03/29/10 @ 16:22
eQUEST 3.63.6500 Monthly Energy Consumption by Enduse Page 1
0
5
10
15
Jan Feb Mar Apr May Jun Jul Aug Sep Oct Nov Dec
Electric Consumption (kWh)
(x000)
0
20
40
60
80
100
Jan Feb Mar Apr May Jun Jul Aug Sep Oct Nov Dec
Gas Consumption (Btu)
(x000,000)
Area LightingTask LightingMisc. Equipment
Exterior UsagePumps & Aux.Ventilation Fans
Water HeatingHt Pump Supp.Space Heating
RefrigerationHeat RejectionSpace Cooling
Electric Consumption (kWh x000)
Jan Feb Mar Apr May Jun Jul Aug Sep Oct Nov Dec Total Space Cool - - 0.00 0.08 0.82 2.87 4.38 4.61 2.03 0.49 0.01 - 15.31 Heat Reject. - - - - - - - - - - - - - Refrigeration - - - - - - - - - - - - - Space Heat - - - - - - - - - - - - - HP Supp. - - - - - - - - - - - - - Hot Water - - - - - - - - - - - - - Vent. Fans 0.78 0.78 0.94 0.90 0.82 0.90 0.86 0.90 0.86 0.82 0.82 0.86 10.25 Pumps & Aux. 0.33 0.29 0.28 0.18 0.02 - - - 0.00 0.07 0.22 0.31 1.72 Ext. Usage 1.47 1.13 1.25 1.21 0.86 0.83 0.86 1.40 1.36 1.40 1.42 1.47 14.66 Misc. Equip. 2.21 2.17 2.60 2.49 2.31 2.49 2.40 2.50 2.39 2.31 2.29 2.40 28.56 Task Lights - - - - - - - - - - - - - Area Lights 4.81 4.78 5.76 5.51 5.05 5.52 5.28 5.52 5.28 5.04 5.04 5.28 62.88 Total 9.60 9.15 10.84 10.37 9.88 12.61 13.79 14.95 11.92 10.14 9.80 10.33 133.38
Gas Consumption (Btu x000,000)
Jan Feb Mar Apr May Jun Jul Aug Sep Oct Nov Dec Total Space Cool - - - - - - - - - - - - - Heat Reject. - - - - - - - - - - - - - Refrigeration - - - - - - - - - - - - - Space Heat 89.26 76.82 64.71 30.59 3.36 0.00 - - 0.01 6.60 40.66 75.86 387.87 HP Supp. - - - - - - - - - - - - - Hot Water 8.67 8.84 10.60 9.95 8.50 8.50 7.60 7.54 7.20 7.24 7.79 8.83 101.27 Vent. Fans - - - - - - - - - - - - - Pumps & Aux. - - - - - - - - - - - - - Ext. Usage - - - - - - - - - - - - - Misc. Equip. 1.67 1.67 2.02 1.93 1.75 1.93 1.84 1.93 1.84 1.75 1.75 1.84 21.92 Task Lights - - - - - - - - - - - - - Area Lights - - - - - - - - - - - - - Total 99.59 87.33 77.32 42.47 13.61 10.44 9.44 9.47 9.05 15.60 50.20 86.53 511.06

APPENDIX D
LIGHTING SPREADSHEETS

Appendix D ‐ Lighting Summary
Building Floor # Location/Room # Existing Fixture/Lamp & Ballast Description Qty of Existing Fixtures
Existing Fixture Watts
Existing kW Operating Hours
Existing kWh Existing Annual Energy Cost
Proposed Replacement SolutionQuantity of Proposed
Proposed Fixture Watts
Proposed kW Base
Proposed Operational Hours Without Sensors
Proposed Operational Hours With Sensors
Proposed kWh Without
Proposed kWh With Proposed Occupancy Sensor Type
Occupancy Sensor
Total kW Saved
Total kWh Saved
Energy Cost Savings
Ballast/Fixture/Reflector Per Unit Price
Bulb (Per Unit Price) Labor (Per Unit Price) Occupancy Sensor (Per Unit Price)
Occupany Sensor (Per Unit Labor Price)
Labor Subtotal Materials Subtotal Labor & Materials Subtotal
Labor Total Materials Total Labor & Materials Total
Borough Hall - Interior 2 Bob Hoffman's Office 2X2 Troffers w/ 3-T8 Lamps w/ Magnetic Ballasts 6 660 0.66 2080 1373 $203.9 Replace Magnetic Ballast w/ Standard Electronic Ballast 6 558 0.56 2080 1456 1161 812 Ceiling Mounted Occupancy Sensor 1 0.10 560 $83.21 $40.0 $0.0 $65.0 $103.0 $73.5 $65.0 $40.0 $105.0 $463.5 $343.0 $806.5
Borough Hall - Interior 2 Receptionist Area 2X2 Troffers w/ 3-T8 Lamps w/ Magnetic Ballasts 10 1100 1.10 2080 2288 $339.8 Replace Magnetic Ballast w/ Standard Electronic Ballast 10 930 0.93 2080 1456 1934 1934 None Proposed 0 0.17 354 $52.51 $40.0 $0.0 $65.0 $0.0 $0.0 $65.0 $40.0 $105.0 $650.0 $400.0 $1,050.0
Borough Hall - Interior 2 Receptionist Area Recessed Can w/ 2-13W CFL's 2 52 0.05 2080 108 $16.1 None Proposed 0 52 0.05 2080 1456 108 108 None Proposed 0 0.00 0 $0.00 $0.0 $0.0 $0.0 $0.0 $0.0 $0.0 $0.0 $0.0 $0.0 $0.0 $0.0
Borough Hall - Interior 2 Closet Strip Fluorescent - 18" Fluorescent w/ 1 T12 Lamp 1 19 0.02 520 10 $1.5 Replace T12 Bulb With T8 Bulb, Replace Ballast w/ Standard Electronic Ballast
1 14 0.01 520 364 7 7 None Proposed 0 0.01 3 $0.39 $35.0 $5.0 $65.0 $0.0 $0.0 $65.0 $40.0 $105.0 $65.0 $40.0 $105.0
Borough Hall - Interior 2 Mayor 2X2 Troffers w/ 3-T8 Lamps w/ Magnetic Ballasts 4 440 0.44 2080 915 $135.9 Replace Magnetic Ballast w/ Standard Electronic Ballast 4 372 0.37 2080 1456 774 542 Ceiling Mounted Occupancy Sensor 1 0.07 374 $55.47 $40.0 $0.0 $65.0 $103.0 $73.5 $65.0 $40.0 $105.0 $333.5 $263.0 $596.5
Borough Hall - Interior 2 Waiting Room 2X2 Troffers w/ 3-T8 Lamps w/ Magnetic Ballasts 4 440 0.44 2080 915 $135.9 Replace Magnetic Ballast w/ Standard Electronic Ballast 4 372 0.37 2080 1456 774 774 None Proposed 0 0.07 141 $21.00 $40.0 $0.0 $65.0 $0.0 $0.0 $65.0 $40.0 $105.0 $260.0 $160.0 $420.0
Borough Hall - Interior 2 Kitchen 2X2 Troffers w/ 3-T8 Lamps w/ Magnetic Ballasts 8 880 0.88 2080 1830 $271.8 Replace Magnetic Ballast w/ Standard Electronic Ballast 8 744 0.74 2080 1456 1548 1083 Automatic Wall Switch Occupancy Sensor 1 0.14 747 $110.95 $40.0 $0.0 $65.0 $63.5 $45.0 $65.0 $40.0 $105.0 $565.0 $383.5 $948.5
Borough Hall - Interior 2 Closet Strip Fluorescent - 18" Fluorescent w/ 1 T12 Lamp 3 57 0.06 520 30 $4.4 Replace T12 Bulb With T8 Bulb, Replace Ballast w/ Standard Electronic Ballast
3 42 0.04 520 364 22 22 None Proposed 0 0.02 8 $1.16 $35.0 $5.0 $65.0 $0.0 $0.0 $65.0 $40.0 $105.0 $195.0 $120.0 $315.0
Borough Hall - Interior 2 Parking Authority 2X2 Troffers w/ 3-T8 Lamps w/ Magnetic Ballasts 2 220 0.22 2080 458 $68.0 Replace Magnetic Ballast w/ Standard Electronic Ballast 2 186 0.19 2080 1456 387 271 Automatic Wall Switch Occupancy Sensor 1 0.03 187 $27.74 $40.0 $0.0 $65.0 $63.5 $45.0 $65.0 $40.0 $105.0 $175.0 $143.5 $318.5
Borough Hall - Interior - Stairwell 2X2 Fixtures w/ 2-T8 Lamps w/ Magnetic Ballasts 8 568 0.57 8760 4976 $738.9 Replace Magnetic Ballast w/ Standard Electronic Ballast 8 480 0.48 8760 6132 4205 4205 None Proposed 0 0.09 771 $114.48 $20.0 $0.0 $65.0 $0.0 $0.0 $65.0 $20.0 $85.0 $520.0 $160.0 $680.0
Borough Hall - Interior 2 Council Caucus Room 2X2 Troffers w/ 3-T8 Lamps w/ Magnetic Ballasts 8 880 0.88 2080 1830 $271.8 Replace Magnetic Ballast w/ Standard Electronic Ballast 8 744 0.74 2080 1456 1548 1548 None Proposed 0 0.14 283 $42.01 $40.0 $0.0 $65.0 $0.0 $0.0 $65.0 $40.0 $105.0 $520.0 $320.0 $840.0
Borough Hall - Interior 2 Storage 2x4 Fixtures w/ 3-T12 Lamp Fixture w/ Magnetic Ballast
2 256.8 0.26 520 134 $19.8 Replace T12 Bulbs With High Perf. T8 Bulbs, Replace Ballast w/ HighPerf., 0.78 Ballast Factor Ballast
2 146 0.15 520 364 76 53 Automatic Wall Switch Occupancy Sensor 1 0.11 80 $11.94 $85.0 $15.0 $65.0 $63.5 $45.0 $65.0 $100.0 $165.0 $175.0 $263.5 $438.5
Borough Hall - Interior 2 Closet Strip Fluorescent - 18" Fluorescent w/ 1 T12 Lamp 1 19 0.02 520 10 $1.5 Replace T12 Bulb With T8 Bulb, Replace Ballast w/ Standard Electronic Ballast
1 14 0.01 520 364 7 7 None Proposed 0 0.01 3 $0.39 $35.0 $5.0 $65.0 $0.0 $0.0 $65.0 $40.0 $105.0 $65.0 $40.0 $105.0
Borough Hall - Interior 2 Closet Strip Fluorescent - 18" Fluorescent w/ 1 T12 Lamp 1 19 0.02 520 10 $1.5 Replace T12 Bulb With T8 Bulb, Replace Ballast w/ Standard Electronic Ballast
1 14 0.01 520 364 7 7 None Proposed 0 0.01 3 $0.39 $35.0 $5.0 $65.0 $0.0 $0.0 $65.0 $40.0 $105.0 $65.0 $40.0 $105.0
Borough Hall - Interior 2 Closet Strip Fluorescent - 18" Fluorescent w/ 1 T12 Lamp 1 19 0.02 520 10 $1.5 Replace T12 Bulb With T8 Bulb, Replace Ballast w/ Standard Electronic Ballast
1 14 0.01 520 364 7 7 None Proposed 0 0.01 3 $0.39 $35.0 $5.0 $65.0 $0.0 $0.0 $65.0 $40.0 $105.0 $65.0 $40.0 $105.0
Borough Hall - Interior 2 Storage Recessed Can w/ 2-13W CFL's 2 52 0.05 520 27 $4.0 None Proposed 0 52 0.05 520 364 27 19 Automatic Wall Switch Occupancy Sensor 1 0.00 8 $1.20 $0.0 $0.0 $0.0 $63.5 $45.0 $0.0 $0.0 $0.0 $45.0 $63.5 $108.5
Borough Hall - Interior 2 Womens Bathroom Recessed Can w/ 2-13W CFL's 2 52 0.05 2080 108 $16.1 None Proposed 0 52 0.05 2080 1456 108 108 None Proposed 0 0.00 0 $0.00 $0.0 $0.0 $0.0 $0.0 $0.0 $0.0 $0.0 $0.0 $0.0 $0.0 $0.0
Borough Hall - Interior 2 Womens Bathroom 1x4 Fixtures w/ 2-T12 Lamp Fixture w/ Magnetic Ballast
3 256.8 0.26 2080 534 $79.3 Replace T12 Bulbs With High Perf. T8 Bulbs, Replace Ballast w/ HighPerf., 0.78 Ballast Factor Ballast
3 145.8 0.15 2080 1456 303 303 None Proposed 0 0.11 231 $34.29 $70.0 $10.0 $65.0 $0.0 $0.0 $65.0 $80.0 $145.0 $195.0 $240.0 $435.0
Borough Hall - Interior 2 Womens Bathroom 24" Fluorescent w/ 2 T12 Lamp 1 56 0.06 2080 116 $17.3 Replace T12 Bulb With T8 Bulb, Replace Ballast w/ Standard Electronic Ballast
1 31 0.03 2080 1456 64 64 None Proposed 0 0.03 52 $7.72 $55.0 $10.0 $65.0 $0.0 $0.0 $65.0 $65.0 $130.0 $65.0 $65.0 $130.0
Borough Hall - Interior 2 Mens Bathroom 1x4 Fixtures w/ 2-T12 Lamp Fixture w/ Magnetic Ballast
4 342.4 0.34 2080 712 $105.8 Replace T12 Bulbs With High Perf. T8 Bulbs, Replace Ballast w/ HighPerf., 0.78 Ballast Factor Ballast
4 194.4 0.19 2080 1456 404 404 None Proposed 0 0.15 308 $45.71 $70.0 $10.0 $65.0 $0.0 $0.0 $65.0 $80.0 $145.0 $260.0 $320.0 $580.0
Borough Hall - Interior 2 Mens Bathroom Recessed Can w/ 2-13W CFL's 2 52 0.05 2080 108 $16.1 None Proposed 0 52 0.05 2080 1456 108 108 None Proposed 0 0.00 0 $0.00 $0.0 $0.0 $0.0 $0.0 $0.0 $0.0 $0.0 $0.0 $0.0 $0.0 $0.0
Borough Hall - Interior 2 Council Chamber Recessed Can w/ (Assume 75W Par 38 Lamp) 25 1875 1.88 2080 3900 $579.2 Replace 75W Lamp with 23W Par CFL 25 575 0.58 2080 1456 1196 1196 None Proposed 0 1.30 2704 $401.54 $0.0 $20.0 $20.0 $0.0 $0.0 $20.0 $20.0 $40.0 $500.0 $500.0 $1,000.0
Borough Hall - Interior 2 Conference Room 2X2 Troffers w/ 3-T8 Lamps w/ Magnetic Ballasts 6 660 0.66 2080 1373 $203.9 Replace Magnetic Ballast w/ Standard Electronic Ballast 6 558 0.56 2080 1456 1161 812 Ceiling Mounted Occupancy Sensor 1 0.10 560 $83.21 $40.0 $0.0 $65.0 $103.0 $73.5 $65.0 $40.0 $105.0 $463.5 $343.0 $806.5
Borough Hall - Interior 2 Conference Room Recessed Can w/ 2-13W CFL's 2 52 0.05 2080 108 $16.1 None Proposed 0 52 0.05 2080 1456 108 108 None Proposed 0 0.00 0 $0.00 $0.0 $0.0 $0.0 $0.0 $0.0 $0.0 $0.0 $0.0 $0.0 $0.0 $0.0
Borough Hall - Interior 2 Receptionist Area 2X2 Troffers w/ 3-T8 Lamps w/ Magnetic Ballasts 8 880 0.88 2080 1830 $271.8 Replace Magnetic Ballast w/ Standard Electronic Ballast 8 744 0.74 2080 1456 1548 1548 None Proposed 0 0.14 283 $42.01 $40.0 $0.0 $65.0 $0.0 $0.0 $65.0 $40.0 $105.0 $520.0 $320.0 $840.0
Borough Hall - Interior 2 Receptionist Area Recessed Can w/ 2-13W CFL's 12 312 0.31 2080 649 $96.4 None Proposed 0 312 0.31 2080 1456 649 649 None Proposed 0 0.00 0 $0.00 $0.0 $0.0 $0.0 $0.0 $0.0 $0.0 $0.0 $0.0 $0.0 $0.0 $0.0
Borough Hall - Interior 2 Office 2X2 Troffers w/ 3-T8 Lamps w/ Magnetic Ballasts 3 330 0.33 2080 686 $101.9 Replace Magnetic Ballast w/ Standard Electronic Ballast 3 279 0.28 2080 1456 580 406 Automatic Wall Switch Occupancy Sensor 1 0.05 280 $41.61 $40.0 $0.0 $65.0 $63.5 $45.0 $65.0 $40.0 $105.0 $240.0 $183.5 $423.5
Borough Hall - Interior 2 Closet Strip Fluorescent - 18" Fluorescent w/ 1 T12 Lamp 1 19 0.02 520 10 $1.5 Replace T12 Bulb With T8 Bulb, Replace Ballast w/ Standard Electronic Ballast
1 14 0.01 520 364 7 7 None Proposed 0 0.01 3 $0.39 $35.0 $5.0 $65.0 $0.0 $0.0 $65.0 $40.0 $105.0 $65.0 $40.0 $105.0
Borough Hall - Interior 2 Court Administration 2X2 Troffers w/ 3-T8 Lamps w/ Magnetic Ballasts 4 440 0.44 2080 915 $135.9 Replace Magnetic Ballast w/ Standard Electronic Ballast 4 372 0.37 2080 1456 774 774 None Proposed 0 0.07 141 $21.00 $40.0 $0.0 $65.0 $0.0 $0.0 $65.0 $40.0 $105.0 $260.0 $160.0 $420.0
Borough Hall - Interior 2 Court Administration Recessed Can w/ 13W CFL 1 13 0.01 2080 27 $4.0 None Proposed 0 13 0.01 2080 1456 27 27 None Proposed 0 0.00 0 $0.00 $0.0 $0.0 $0.0 $0.0 $0.0 $0.0 $0.0 $0.0 $0.0 $0.0 $0.0
Borough Hall - Interior 2 Closet Strip Fluorescent - 18" Fluorescent w/ 1 T12 Lamp 1 19 0.02 520 10 $1.5 Replace T12 Bulb With T8 Bulb, Replace Ballast w/ Standard Electronic Ballast
1 14 0.01 520 364 7 7 None Proposed 0 0.01 3 $0.39 $35.0 $5.0 $65.0 $0.0 $0.0 $65.0 $40.0 $105.0 $65.0 $40.0 $105.0
Borough Hall - Interior 2 Closet Strip Fluorescent - 18" Fluorescent w/ 1 T12 Lamp 1 19 0.02 520 10 $1.5 Replace T12 Bulb With T8 Bulb, Replace Ballast w/ Standard Electronic Ballast
1 14 0.01 520 364 7 7 None Proposed 0 0.01 3 $0.39 $35.0 $5.0 $65.0 $0.0 $0.0 $65.0 $40.0 $105.0 $65.0 $40.0 $105.0
Borough Hall - Interior 2 Main Lobby Recessed Can w/ 2-13W CFL's 6 156 0.16 8760 1367 $202.9 None Proposed 0 156 0.16 8760 6132 1367 1367 None Proposed 0 0.00 0 $0.00 $0.0 $0.0 $0.0 $0.0 $0.0 $0.0 $0.0 $0.0 $0.0 $0.0 $0.0
Borough Hall - Interior 2 Main Lobby Interior Fixture - 70W Metal Halide 4 380 0.38 8760 3329 $494.3 None Proposed 0 380 0.38 8760 6132 3329 3329 None Proposed 0 0.00 0 $0.00 $0.0 $0.0 $0.0 $0.0 $0.0 $0.0 $0.0 $0.0 $0.0 $0.0 $0.0
Borough Hall - Interior 2 Main Lobby 13W CFL Fixture 2 26 0.03 8760 228 $33.8 None Proposed 0 26 0.03 8760 6132 228 228 None Proposed 0 0.00 0 $0.00 $0.0 $0.0 $0.0 $0.0 $0.0 $0.0 $0.0 $0.0 $0.0 $0.0 $0.0
Borough Hall - Interior 2 Mens Bathroom 2X2 Fixtures w/ 2-T8 Lamps w/ Magnetic Ballasts 3 213 0.21 2080 443 $65.8 Replace Magnetic Ballast w/ Standard Electronic Ballast 3 180 0.18 2080 1456 374 374 None Proposed 0 0.03 69 $10.19 $20.0 $0.0 $65.0 $0.0 $0.0 $65.0 $20.0 $85.0 $195.0 $60.0 $255.0
Borough Hall - Interior 2 Mens Bathroom 1X4 Fixtures w/ 2-T8 Lamps w/ Magnetic Ballasts 1 71 0.07 2080 148 $21.9 Replace Magnetic Ballast w/ Standard Electronic Ballast 1 50.7 0.05 2080 1456 105 105 None Proposed 0 0.02 42 $6.27 $20.0 $0.0 $65.0 $0.0 $0.0 $65.0 $20.0 $85.0 $65.0 $20.0 $85.0
Borough Hall - Interior 2 Mens Bathroom Recessed Can w/ 13W CFL 1 13 0.01 2080 27 $4.0 None Proposed 0 13 0.01 2080 1456 27 27 None Proposed 0 0.00 0 $0.00 $0.0 $0.0 $0.0 $0.0 $0.0 $0.0 $0.0 $0.0 $0.0 $0.0 $0.0
Borough Hall - Interior 2 Hall 1X4 Fixtures w/ 3-T8 Lamps w/ Magnetic Ballasts 4 440 0.44 8760 3854 $572.4 Replace Magnetic Ballast w/ Standard Electronic Ballast 4 352 0.35 8760 6132 3084 3084 None Proposed 0 0.09 771 $114.48 $40.0 $0.0 $65.0 $0.0 $0.0 $65.0 $40.0 $105.0 $260.0 $160.0 $420.0
Borough Hall - Interior 2 Police Meeting Room 2X2 Troffers w/ 3-T8 Lamps w/ Magnetic Ballasts 6 660 0.66 2080 1373 $203.9 Replace Magnetic Ballast w/ Standard Electronic Ballast 6 558 0.56 2080 1456 1161 1161 None Proposed 0 0.10 212 $31.51 $40.0 $0.0 $65.0 $0.0 $0.0 $65.0 $40.0 $105.0 $390.0 $240.0 $630.0
Borough Hall - Interior 2 Police Meeting Room Recessed Can w/ 2-13W CFL's 2 52 0.05 2080 108 $16.1 None Proposed 0 52 0.05 2080 1456 108 108 None Proposed 0 0.00 0 $0.00 $0.0 $0.0 $0.0 $0.0 $0.0 $0.0 $0.0 $0.0 $0.0 $0.0 $0.0
Borough Hall - Interior 2 Closet Strip Fluorescent - 18" Fluorescent w/ 1 T12 Lamp 1 19 0.02 520 10 $1.5 Replace T12 Bulb With T8 Bulb, Replace Ballast w/ Standard Electronic Ballast
1 14 0.01 520 364 7 7 None Proposed 0 0.01 3 $0.39 $35.0 $5.0 $65.0 $0.0 $0.0 $65.0 $40.0 $105.0 $65.0 $40.0 $105.0
Borough Hall - Interior 2 Mens Locker Room 2X2 Fixtures w/ 2-T8 Lamps w/ Magnetic Ballasts 1 71 0.07 2080 148 $21.9 Replace Magnetic Ballast w/ Standard Electronic Ballast 1 60 0.06 2080 1456 125 87 Ceiling Mounted Occupancy Sensor 1 0.01 60 $8.96 $20.0 $0.0 $65.0 $103.0 $73.5 $65.0 $20.0 $85.0 $138.5 $123.0 $261.5
Borough Hall - Interior 2 Mens Locker Room 2X4 Fixtures w/ 3-T8 Lamps w/ Magnetic Ballasts 6 660 0.66 2080 1373 $203.9 Replace Magnetic Ballast w/ Standard Electronic Ballast 6 528 0.53 2080 1456 1098 1098 None Proposed 0 0.13 275 $40.77 $40.0 $0.0 $65.0 $0.0 $0.0 $65.0 $40.0 $105.0 $390.0 $240.0 $630.0
Borough Hall - Interior 2 Mens Locker Room 1X4 Fixtures w/ 2-T8 Lamps w/ Magnetic Ballasts 6 426 0.43 2080 886 $131.6 Replace Magnetic Ballast w/ Standard Electronic Ballast 6 304.2 0.30 2080 1456 633 633 None Proposed 0 0.12 253 $37.62 $20.0 $0.0 $65.0 $0.0 $0.0 $65.0 $20.0 $85.0 $390.0 $120.0 $510.0
Borough Hall - Interior 2 Utility Closet 2X2 Fixtures w/ 2-T12 Lamps w/ Magnetic Ballasts 1 85.6 0.09 520 45 $6.6 Replace T12 Bulbs With High Perf. T8 Bulbs, Replace Ballast w/ HighPerf., 0.78 Ballast Factor Ballast
1 50 0.05 520 364 26 26 None Proposed 0 0.04 19 $2.75 $55.0 $10.0 $65.0 $0.0 $0.0 $65.0 $65.0 $130.0 $65.0 $65.0 $130.0
Borough Hall - Interior 1 Board Office Receptionist 2X2 Troffers w/ 3-T8 Lamps w/ Magnetic Ballasts 4 440 0.44 2080 915 $135.9 Replace Magnetic Ballast w/ Standard Electronic Ballast 4 372 0.37 2080 1456 774 774 None Proposed 0 0.07 141 $21.00 $40.0 $0.0 $65.0 $0.0 $0.0 $65.0 $40.0 $105.0 $260.0 $160.0 $420.0
Borough Hall - Interior 1 Registrar 2X2 Troffers w/ 3-T8 Lamps w/ Magnetic Ballasts 4 440 0.44 2080 915 $135.9 Replace Magnetic Ballast w/ Standard Electronic Ballast 4 372 0.37 2080 1456 774 774 None Proposed 0 0.07 141 $21.00 $40.0 $0.0 $65.0 $0.0 $0.0 $65.0 $40.0 $105.0 $260.0 $160.0 $420.0
Borough Hall - Interior 1 Closet 2X4 Fixtures w/ 3-T8 Lamps w/ Magnetic Ballasts 1 110 0.11 520 57 $8.5 Replace Magnetic Ballast w/ Standard Electronic Ballast 1 88 0.09 520 364 46 46 None Proposed 0 0.02 11 $1.70 $40.0 $0.0 $65.0 $0.0 $0.0 $65.0 $40.0 $105.0 $65.0 $40.0 $105.0
Borough Hall - Interior 1 SS 2X4 Fixtures w/ 3-T8 Lamps w/ Magnetic Ballasts 1 110 0.11 2080 229 $34.0 Replace Magnetic Ballast w/ Standard Electronic Ballast 1 88 0.09 2080 1456 183 183 None Proposed 0 0.02 46 $6.80 $40.0 $0.0 $65.0 $0.0 $0.0 $65.0 $40.0 $105.0 $65.0 $40.0 $105.0
Borough Hall - Interior 1 SS 2X2 Troffers w/ 3-T8 Lamps w/ Magnetic Ballasts 3 330 0.33 2080 686 $101.9 Replace Magnetic Ballast w/ Standard Electronic Ballast 3 279 0.28 2080 1456 580 580 None Proposed 0 0.05 106 $15.75 $40.0 $0.0 $65.0 $0.0 $0.0 $65.0 $40.0 $105.0 $195.0 $120.0 $315.0
Borough Hall - Interior 1 Pantry 2X2 Troffers w/ 3-T8 Lamps w/ Magnetic Ballasts 4 440 0.44 2080 915 $135.9 Replace Magnetic Ballast w/ Standard Electronic Ballast 4 372 0.37 2080 1456 774 774 None Proposed 0 0.07 141 $21.00 $40.0 $0.0 $65.0 $0.0 $0.0 $65.0 $40.0 $105.0 $260.0 $160.0 $420.0
Borough Hall - Interior 1 Health Office 2X2 Troffers w/ 3-T8 Lamps w/ Magnetic Ballasts 2 220 0.22 2080 458 $68.0 Replace Magnetic Ballast w/ Standard Electronic Ballast 2 186 0.19 2080 1456 387 271 Ceiling Mounted Occupancy Sensor 1 0.03 187 $27.74 $40.0 $0.0 $65.0 $103.0 $73.5 $65.0 $40.0 $105.0 $203.5 $183.0 $386.5
Borough Hall - Interior 1 Hall 2X2 Fixtures w/ 2-T12 Lamps w/ Magnetic Ballasts 7 599.2 0.60 8760 5249 $779.5 Replace T12 Bulbs With High Perf. T8 Bulbs, Replace Ballast w/ HighPerf., 0.78 Ballast Factor Ballast
7 350 0.35 8760 6132 3066 3066 None Proposed 0 0.25 2183 $324.17 $55.0 $10.0 $65.0 $0.0 $0.0 $65.0 $65.0 $130.0 $455.0 $455.0 $910.0
Borough Hall - Interior 1 Womens Bathroom 1x4 Fixtures w/ 2-T12 Lamp Fixture w/ Magnetic Ballast
2 171.2 0.17 2080 356 $52.9 Replace T12 Bulbs With High Perf. T8 Bulbs, Replace Ballast w/ HighPerf., 0.78 Ballast Factor Ballast
2 97.2 0.10 2080 1456 202 202 None Proposed 0 0.07 154 $22.86 $70.0 $10.0 $65.0 $0.0 $0.0 $65.0 $80.0 $145.0 $130.0 $160.0 $290.0
Borough Hall - Interior 1 Womens Bathroom Recessed Can w/ 2-13W CFL's 1 26 0.03 2080 54 $8.0 None Proposed 0 26 0.03 2080 1456 54 54 None Proposed 0 0.00 0 $0.00 $0.0 $0.0 $0.0 $0.0 $0.0 $0.0 $0.0 $0.0 $0.0 $0.0 $0.0
Borough Hall - Interior 1 Mens Bathroom 24" Fluorescent w/ 2 T12 Lamp 2 184 0.18 2080 383 $56.8 Replace T12 Bulb With T8 Bulb, Replace Ballast w/ Standard Electronic Ballast
2 120 0.12 2080 1456 250 250 None Proposed 0 0.06 133 $19.77 $55.0 $10.0 $65.0 $0.0 $0.0 $65.0 $65.0 $130.0 $130.0 $130.0 $260.0
Borough Hall - Interior 1 Mens Bathroom 1x4 Fixtures w/ 2-T12 Lamp Fixture w/ Magnetic Ballast
2 171.2 0.17 2080 356 $52.9 Replace T12 Bulbs With High Perf. T8 Bulbs, Replace Ballast w/ HighPerf., 0.78 Ballast Factor Ballast
2 97.2 0.10 2080 1456 202 202 None Proposed 0 0.07 154 $22.86 $70.0 $10.0 $65.0 $0.0 $0.0 $65.0 $80.0 $145.0 $130.0 $160.0 $290.0
Borough Hall - Interior 1 Mens Bathroom Recessed Can w/ 13W CFL 1 13 0.01 2080 27 $4.0 None Proposed 0 13 0.01 2080 1456 27 27 None Proposed 0 0.00 0 $0.00 $0.0 $0.0 $0.0 $0.0 $0.0 $0.0 $0.0 $0.0 $0.0 $0.0 $0.0
Borough Hall - Interior 1 Maintenance Closet 2X2 Fixtures w/ 2-T12 Lamps w/ Magnetic Ballasts 1 85.6 0.09 520 45 $6.6 Replace T12 Bulbs With High Perf. T8 Bulbs, Replace Ballast w/ HighPerf., 0.78 Ballast Factor Ballast
1 50 0.05 520 364 26 26 None Proposed 0 0.04 19 $2.75 $55.0 $10.0 $65.0 $0.0 $0.0 $65.0 $65.0 $130.0 $65.0 $65.0 $130.0
Borough Hall - Interior 1 Tax Assesor Receptionist 2X2 Troffers w/ 3-T8 Lamps w/ Magnetic Ballasts 17 1870 1.87 2080 3890 $577.6 Replace Magnetic Ballast w/ Standard Electronic Ballast 17 1581 1.58 2080 1456 3288 3288 None Proposed 0 0.29 601 $89.27 $40.0 $0.0 $65.0 $0.0 $0.0 $65.0 $40.0 $105.0 $1,105.0 $680.0 $1,785.0
Borough Hall - Interior 1 Tax Assesor Office 2X2 Troffers w/ 3-T8 Lamps w/ Magnetic Ballasts 2 220 0.22 2080 458 $68.0 Replace Magnetic Ballast w/ Standard Electronic Ballast 2 186 0.19 2080 1456 387 271 Automatic Wall Switch Occupancy Sensor 1 0.03 187 $27.74 $40.0 $0.0 $65.0 $63.5 $45.0 $65.0 $40.0 $105.0 $175.0 $143.5 $318.5
Borough Hall - Interior 1 Closet 2X2 Fixtures w/ 2-T12 Lamps w/ Magnetic Ballasts 1 85.6 0.09 520 45 $6.6 Replace T12 Bulbs With High Perf. T8 Bulbs, Replace Ballast w/ HighPerf., 0.78 Ballast Factor Ballast
1 50 0.05 520 364 26 26 None Proposed 0 0.04 19 $2.75 $55.0 $10.0 $65.0 $0.0 $0.0 $65.0 $65.0 $130.0 $65.0 $65.0 $130.0
Borough Hall - Interior 1 Clerk's Office 2X2 Troffers w/ 3-T8 Lamps w/ Magnetic Ballasts 3 330 0.33 2080 686 $101.9 Replace Magnetic Ballast w/ Standard Electronic Ballast 3 279 0.28 2080 1456 580 406 Automatic Wall Switch Occupancy Sensor 1 0.05 280 $41.61 $40.0 $0.0 $65.0 $63.5 $45.0 $65.0 $40.0 $105.0 $240.0 $183.5 $423.5
Borough Hall - Interior 1 Main Lobby Recessed Can w/ 2-13W CFL's 22 572 0.57 8760 5011 $744.1 None Proposed 0 572 0.57 8760 6132 5011 5011 None Proposed 1 0.00 0 $0.00 $0.0 $0.0 $0.0 $0.0 $0.0 $0.0 $0.0 $0.0 $0.0 $0.0 $0.0
Borough Hall - Interior 1 Police Waiting Area Recessed Can w/ 2-13W CFL's 6 156 0.16 2080 324 $48.2 None Proposed 0 156 0.16 2080 1456 324 324 None Proposed 1 0.00 0 $0.00 $0.0 $0.0 $0.0 $0.0 $0.0 $0.0 $0.0 $0.0 $0.0 $0.0 $0.0
Borough Hall - Interior 1 Receptionist Area 2X2 Troffers w/ 3-T8 Lamps w/ Magnetic Ballasts 2 220 0.22 2080 458 $68.0 Replace Magnetic Ballast w/ Standard Electronic Ballast 2 186 0.19 2080 1456 387 387 None Proposed 1 0.03 71 $10.50 $40.0 $0.0 $65.0 $0.0 $0.0 $65.0 $40.0 $105.0 $130.0 $80.0 $210.0
Borough Hall - Interior 1 Womens Bathroom Recessed Can w/ 2-13W CFL's 2 52 0.05 2080 108 $16.1 None Proposed 0 52 0.05 2080 1456 108 76 Automatic Wall Switch Occupancy Sensor 1 0.00 32 $4.82 $0.0 $0.0 $0.0 $63.5 $45.0 $0.0 $0.0 $0.0 $45.0 $63.5 $108.5
Borough Hall - Interior 1 Womens Bathroom 1x4 Fixtures w/ 2-T12 Lamp Fixture w/ Magnetic Ballast
1 85.6 0.09 2080 178 $26.4 Replace T12 Bulbs With High Perf. T8 Bulbs, Replace Ballast w/ HighPerf., 0.78 Ballast Factor Ballast
1 48.6 0.05 2080 1456 101 101 None Proposed 0 0.04 77 $11.43 $70.0 $10.0 $65.0 $0.0 $0.0 $65.0 $80.0 $145.0 $65.0 $80.0 $145.0
Borough Hall - Interior 1 Mens Bathroom Recessed Can w/ 2-13W CFL's 3 78 0.08 2080 162 $24.1 None Proposed 0 78 0.08 2080 1456 162 114 Automatic Wall Switch Occupancy Sensor 1 0.00 49 $7.23 $0.0 $0.0 $0.0 $63.5 $45.0 $0.0 $0.0 $0.0 $45.0 $63.5 $108.5
Borough Hall - Interior 1 Mens Bathroom 1x4 Fixtures w/ 2-T12 Lamp Fixture w/ Magnetic Ballast
1 85.6 0.09 2080 178 $26.4 Replace T12 Bulbs With High Perf. T8 Bulbs, Replace Ballast w/ HighPerf., 0.78 Ballast Factor Ballast
1 48.6 0.05 2080 1456 101 101 None Proposed 0 0.04 77 $11.43 $70.0 $10.0 $65.0 $0.0 $0.0 $65.0 $80.0 $145.0 $65.0 $80.0 $145.0
Borough Hall - Interior 1 Captain's Office 2X2 Troffers w/ 3-T8 Lamps w/ Magnetic Ballasts 2 220 0.22 2080 458 $68.0 Replace Magnetic Ballast w/ Standard Electronic Ballast 2 186 0.19 2080 1456 387 271 Ceiling Mounted Occupancy Sensor 1 0.03 187 $27.74 $40.0 $0.0 $65.0 $103.0 $73.5 $65.0 $40.0 $105.0 $203.5 $183.0 $386.5

Appendix D ‐ Lighting Summary
Building Floor # Location/Room # Existing Fixture/Lamp & Ballast Description Qty of Existing Fixtures
Existing Fixture Watts
Existing kW Operating Hours
Existing kWh Existing Annual Energy Cost
Proposed Replacement SolutionQuantity of Proposed
Proposed Fixture Watts
Proposed kW Base
Proposed Operational Hours Without Sensors
Proposed Operational Hours With Sensors
Proposed kWh Without
Proposed kWh With Proposed Occupancy Sensor Type
Occupancy Sensor
Total kW Saved
Total kWh Saved
Energy Cost Savings
Ballast/Fixture/Reflector Per Unit Price
Bulb (Per Unit Price) Labor (Per Unit Price) Occupancy Sensor (Per Unit Price)
Occupany Sensor (Per Unit Labor Price)
Labor Subtotal Materials Subtotal Labor & Materials Subtotal
Labor Total Materials Total Labor & Materials Total
Borough Hall - Interior 1 Sargent's Office 2X2 Troffers w/ 3-T8 Lamps w/ Magnetic Ballasts 5 550 0.55 2080 1144 $169.9 Replace Magnetic Ballast w/ Standard Electronic Ballast 5 465 0.47 2080 1456 967 967 None Proposed 0 0.09 177 $26.25 $40.0 $0.0 $65.0 $0.0 $0.0 $65.0 $40.0 $105.0 $325.0 $200.0 $525.0
Borough Hall - Interior 1 CFO Office 2X2 Troffers w/ 3-T8 Lamps w/ Magnetic Ballasts 3 330 0.33 2080 686 $101.9 Replace Magnetic Ballast w/ Standard Electronic Ballast 3 279 0.28 2080 1456 580 406 Automatic Wall Switch Occupancy Sensor 1 0.05 280 $41.61 $40.0 $0.0 $65.0 $63.5 $45.0 $65.0 $40.0 $105.0 $240.0 $183.5 $423.5
Borough Hall - Interior 1 Clerk's Office 2X2 Troffers w/ 3-T8 Lamps w/ Magnetic Ballasts 7 770 0.77 2080 1602 $237.8 Replace Magnetic Ballast w/ Standard Electronic Ballast 7 651 0.65 2080 1456 1354 1354 None Proposed 0 0.12 248 $36.76 $40.0 $0.0 $65.0 $0.0 $0.0 $65.0 $40.0 $105.0 $455.0 $280.0 $735.0
Borough Hall - Interior 1 Clerk's Office Recessed Can w/ 2-13W CFL's 6 156 0.16 2080 324 $48.2 None Proposed 0 156 0.16 2080 1456 324 324 None Proposed 0 0.00 0 $0.00 $0.0 $0.0 $0.0 $0.0 $0.0 $0.0 $0.0 $0.0 $0.0 $0.0 $0.0
Borough Hall - Interior 1 Chief's Office 2X2 Troffers w/ 3-T8 Lamps w/ Magnetic Ballasts 6 660 0.66 2080 1373 $203.9 Replace Magnetic Ballast w/ Standard Electronic Ballast 6 558 0.56 2080 1456 1161 812 Ceiling Mounted Occupancy Sensor 1 0.10 560 $83.21 $40.0 $0.0 $65.0 $103.0 $73.5 $65.0 $40.0 $105.0 $463.5 $343.0 $806.5
Borough Hall - Interior 1 Communications 2X2 Troffers w/ 3-T8 Lamps w/ Magnetic Ballasts 6 660 0.66 2080 1373 $203.9 Replace Magnetic Ballast w/ Standard Electronic Ballast 6 558 0.56 2080 1456 1161 812 Ceiling Mounted Occupancy Sensor 1 0.10 560 $83.21 $40.0 $0.0 $65.0 $103.0 $73.5 $65.0 $40.0 $105.0 $463.5 $343.0 $806.5
Borough Hall - Interior 1 DARE 2X2 Troffers w/ 3-T8 Lamps w/ Magnetic Ballasts 4 440 0.44 2080 915 $135.9 Replace Magnetic Ballast w/ Standard Electronic Ballast 4 372 0.37 2080 1456 774 542 Ceiling Mounted Occupancy Sensor 1 0.07 374 $55.47 $40.0 $0.0 $65.0 $103.0 $73.5 $65.0 $40.0 $105.0 $333.5 $263.0 $596.5
Borough Hall - Interior 1 Hall 2X2 Fixtures w/ 2-T12 Lamps w/ Magnetic Ballasts 6 513.6 0.51 8760 4499 $668.1 Replace T12 Bulbs With High Perf. T8 Bulbs, Replace Ballast w/ HighPerf., 0.78 Ballast Factor Ballast
6 300 0.30 8760 6132 2628 2628 None Proposed 0 0.21 1871 $277.86 $55.0 $10.0 $65.0 $0.0 $0.0 $65.0 $65.0 $130.0 $390.0 $390.0 $780.0
Borough Hall - Interior 1 Cell 1x4 Fixtures w/ 2-T12 Lamp Fixture w/ Magnetic Ballast
2 171.2 0.17 2080 356 $52.9 Replace T12 Bulbs With High Perf. T8 Bulbs, Replace Ballast w/ HighPerf., 0.78 Ballast Factor Ballast
2 97.2 0.10 2080 1456 202 202 None Proposed 0 0.07 154 $22.86 $70.0 $10.0 $65.0 $0.0 $0.0 $65.0 $80.0 $145.0 $130.0 $160.0 $290.0
Borough Hall - Interior 1 Holding Hall 2X2 Fixtures w/ 2-T12 Lamps w/ Magnetic Ballasts 4 342.4 0.34 2080 712 $105.8 Replace T12 Bulbs With High Perf. T8 Bulbs, Replace Ballast w/ HighPerf., 0.78 Ballast Factor Ballast
4 200 0.20 2080 1456 416 416 None Proposed 0 0.14 296 $43.98 $55.0 $10.0 $65.0 $0.0 $0.0 $65.0 $65.0 $130.0 $260.0 $260.0 $520.0
Borough Hall - Interior 1 ID Room 2X4 Fixtures w/ 3-T8 Lamps w/ Magnetic Ballasts 2 220 0.22 2080 458 $68.0 Replace Magnetic Ballast w/ Standard Electronic Ballast 2 176 0.18 2080 1456 366 366 None Proposed 0 0.04 92 $13.59 $40.0 $0.0 $65.0 $0.0 $0.0 $65.0 $40.0 $105.0 $130.0 $80.0 $210.0
Borough Hall - Interior 1 Police Garage 1x4 Fixtures w/ 2-T12 Lamp Fixture w/ Magnetic Ballast
11 941.6 0.94 2080 1959 $290.8 Replace T12 Bulbs With High Perf. T8 Bulbs, Replace Ballast w/ HighPerf., 0.78 Ballast Factor Ballast
11 534.6 0.53 2080 1456 1112 1112 None Proposed 0 0.41 847 $125.71 $70.0 $10.0 $65.0 $0.0 $0.0 $65.0 $80.0 $145.0 $715.0 $880.0 $1,595.0
Borough Hall - Interior 1 Police Garage Attic 1x4 Fixtures w/ 2-T12 Lamp Fixture w/ Magnetic Ballast
1 85.6 0.09 2080 178 $26.4 Replace T12 Bulbs With High Perf. T8 Bulbs, Replace Ballast w/ HighPerf., 0.78 Ballast Factor Ballast
1 48.6 0.05 2080 1456 101 101 None Proposed 0 0.04 77 $11.43 $70.0 $10.0 $65.0 $0.0 $0.0 $65.0 $80.0 $145.0 $65.0 $80.0 $145.0
Borough Hall - Interior 1 Interrogation Room 2x4 Fixtures w/ 3-T12 Lamp Fixture w/ Magnetic Ballast
2 256.8 0.26 2080 534 $79.3 Replace T12 Bulbs With High Perf. T8 Bulbs, Replace Ballast w/ HighPerf., 0.78 Ballast Factor Ballast
2 146 0.15 2080 1456 304 213 Automatic Wall Switch Occupancy Sensor 1 0.11 322 $47.75 $85.0 $15.0 $65.0 $63.5 $45.0 $65.0 $100.0 $165.0 $175.0 $263.5 $438.5
Borough Hall - Interior 1 Records 2X2 Troffers w/ 3-T8 Lamps w/ Magnetic Ballasts 7 770 0.77 2080 1602 $237.8 Replace Magnetic Ballast w/ Standard Electronic Ballast 7 651 0.65 2080 1456 1354 948 Ceiling Mounted Occupancy Sensor 1 0.12 654 $97.08 $40.0 $0.0 $65.0 $103.0 $73.5 $65.0 $40.0 $105.0 $528.5 $383.0 $911.5
Borough Hall - Interior 1 Sargent's Office 2X2 Troffers w/ 3-T8 Lamps w/ Magnetic Ballasts 4 440 0.44 2080 915 $135.9 Replace Magnetic Ballast w/ Standard Electronic Ballast 4 372 0.37 2080 1456 774 542 Automatic Wall Switch Occupancy Sensor 1 0.07 374 $55.47 $40.0 $0.0 $65.0 $63.5 $45.0 $65.0 $40.0 $105.0 $305.0 $223.5 $528.5
Borough Hall - Interior 1 Detective Bureau 2X2 Troffers w/ 3-T8 Lamps w/ Magnetic Ballasts 6 660 0.66 2080 1373 $203.9 Replace Magnetic Ballast w/ Standard Electronic Ballast 6 558 0.56 2080 1456 1161 812 Ceiling Mounted Occupancy Sensor 1 0.10 560 $83.21 $40.0 $0.0 $65.0 $103.0 $73.5 $65.0 $40.0 $105.0 $463.5 $343.0 $806.5
Borough Hall - Interior 1 Closet 1x4 Fixtures w/ 1-T12 Lamp Fixture w/ Magnetic Ballast
1 42.8 0.04 520 22 $3.3 Replace T12 Bulbs With High Perf. T8 Bulbs, Replace Ballast w/ HighPerf., 0.78 Ballast Factor Ballast
1 24.32 0.02 520 364 13 13 None Proposed 0 0.02 10 $1.43 $35.0 $5.0 $65.0 $0.0 $0.0 $65.0 $40.0 $105.0 $65.0 $40.0 $105.0
Borough Hall - Interior - Stairwell 1x4 Fixtures w/ 2-T12 Lamp Fixture w/ Magnetic Ballast
1 85.6 0.09 2080 178 $26.4 Replace T12 Bulbs With High Perf. T8 Bulbs, Replace Ballast w/ HighPerf., 0.78 Ballast Factor Ballast
1 48.6 0.05 2080 1456 101 101 None Proposed 0 0.04 77 $11.43 $70.0 $10.0 $65.0 $0.0 $0.0 $65.0 $80.0 $145.0 $65.0 $80.0 $145.0
Borough Hall - Interior 0 Computer Room 1x4 Fixtures w/ 2-T12 Lamp Fixture w/ Magnetic Ballast
6 513.6 0.51 2080 1068 $158.6 Replace T12 Bulbs With High Perf. T8 Bulbs, Replace Ballast w/ HighPerf., 0.78 Ballast Factor Ballast
6 291.6 0.29 2080 1456 607 425 Ceiling Mounted Occupancy Sensor 1 0.22 644 $95.59 $70.0 $10.0 $65.0 $103.0 $73.5 $65.0 $80.0 $145.0 $463.5 $583.0 $1,046.5
Borough Hall - Interior 0 Hall 1x4 Fixtures w/ 2-T12 Lamp Fixture w/ Magnetic Ballast
7 599.2 0.60 8760 5249 $779.5 Replace T12 Bulbs With High Perf. T8 Bulbs, Replace Ballast w/ HighPerf., 0.78 Ballast Factor Ballast
7 340.2 0.34 8760 6132 2980 2980 None Proposed 0 0.26 2269 $336.92 $70.0 $10.0 $65.0 $0.0 $0.0 $65.0 $80.0 $145.0 $455.0 $560.0 $1,015.0
Borough Hall - Interior 0 Boiler Room 1x4 Fixtures w/ 2-T12 Lamp Fixture w/ Magnetic Ballast
3 256.8 0.26 2080 534 $79.3 Replace T12 Bulbs With High Perf. T8 Bulbs, Replace Ballast w/ HighPerf., 0.78 Ballast Factor Ballast
3 145.8 0.15 2080 1456 303 303 None Proposed 0 0.11 231 $34.29 $70.0 $10.0 $65.0 $0.0 $0.0 $65.0 $80.0 $145.0 $195.0 $240.0 $435.0
Borough Hall - Interior 0 Armor Room 1x4 Fixtures w/ 2-T12 Lamp Fixture w/ Magnetic Ballast
2 171.2 0.17 2080 356 $52.9 Replace T12 Bulbs With High Perf. T8 Bulbs, Replace Ballast w/ HighPerf., 0.78 Ballast Factor Ballast
2 97.2 0.10 2080 1456 202 142 Automatic Wall Switch Occupancy Sensor 1 0.07 215 $31.86 $70.0 $10.0 $65.0 $63.5 $45.0 $65.0 $80.0 $145.0 $175.0 $223.5 $398.5
Borough Hall - Interior 0 Telephone Room 1x4 Fixtures w/ 2-T12 Lamp Fixture w/ Magnetic Ballast
4 342.4 0.34 2080 712 $105.8 Replace T12 Bulbs With High Perf. T8 Bulbs, Replace Ballast w/ HighPerf., 0.78 Ballast Factor Ballast
4 194.4 0.19 2080 1456 404 283 Automatic Wall Switch Occupancy Sensor 1 0.15 429 $63.73 $70.0 $10.0 $65.0 $63.5 $45.0 $65.0 $80.0 $145.0 $305.0 $383.5 $688.5
Borough Hall - Interior 0 Police Auxiliary Room 2X2 Troffers w/ 3-T8 Lamps w/ Magnetic Ballasts 10 1100 1.10 2080 2288 $339.8 Replace Magnetic Ballast w/ Standard Electronic Ballast 10 930 0.93 2080 1456 1934 1354 Ceiling Mounted Occupancy Sensor 1 0.17 934 $138.69 $40.0 $0.0 $65.0 $103.0 $73.5 $65.0 $40.0 $105.0 $723.5 $503.0 $1,226.5
Borough Hall - Interior 0 Police Office 2X2 Fixtures w/ 2-T8 Lamps w/ Magnetic Ballasts 2 142 0.14 2080 295 $43.9 Replace Magnetic Ballast w/ Standard Electronic Ballast 2 120 0.12 2080 1456 250 175 Automatic Wall Switch Occupancy Sensor 1 0.02 121 $17.92 $20.0 $0.0 $65.0 $63.5 $45.0 $65.0 $20.0 $85.0 $175.0 $103.5 $278.5
Borough Hall - Interior 0 Auxiliary Locker Room 100W Incandescent Fixture 2 200 0.20 2080 416 $61.8 Replace 100W Incandescent Fixture with 25W CFL 2 50 0.05 2080 1456 104 73 Automatic Wall Switch Occupancy Sensor 1 0.15 343 $50.97 $0.0 $7.0 $20.0 $63.5 $45.0 $20.0 $7.0 $27.0 $85.0 $77.5 $162.5
Borough Hall - Interior 0 Closet Interior Fixture - 75W Incandescent Fixture 1 75 0.08 520 39 $5.8 Replace 75W Incandescent Fixture with 13W CFL 1 13 0.01 520 364 7 7 None Proposed 0 0.06 32 $4.79 $0.0 $5.0 $20.0 $0.0 $0.0 $20.0 $5.0 $25.0 $20.0 $5.0 $25.0
Borough Hall - Interior 0 Closet Interior Fixture - 75W Incandescent Fixture 1 75 0.08 520 39 $5.8 Replace 75W Incandescent Fixture with 13W CFL 1 13 0.01 520 364 7 7 None Proposed 0 0.06 32 $4.79 $0.0 $5.0 $20.0 $0.0 $0.0 $20.0 $5.0 $25.0 $20.0 $5.0 $25.0
Borough Hall - Interior 0 Closet 60W Incandescent Fixture 1 60 0.06 520 31 $4.6 Replace 60W Incandescent Fixture with 13W CFL 1 13 0.01 520 364 7 7 None Proposed 0 0.05 24 $3.63 $0.0 $5.0 $20.0 $0.0 $0.0 $20.0 $5.0 $25.0 $20.0 $5.0 $25.0
Borough Hall - Interior 0 Archive Room 1x4 Fixtures w/ 2-T12 Lamp Fixture w/ Magnetic Ballast
2 171.2 0.17 2080 356 $52.9 Replace T12 Bulbs With High Perf. T8 Bulbs, Replace Ballast w/ HighPerf., 0.78 Ballast Factor Ballast
2 97.2 0.10 2080 1456 202 142 Automatic Wall Switch Occupancy Sensor 1 0.07 215 $31.86 $70.0 $10.0 $65.0 $63.5 $45.0 $65.0 $80.0 $145.0 $175.0 $223.5 $398.5
Borough Hall - Interior 0 Zoning Office 2x4 Fixtures w/ 2-T12 Lamp Fixture w/ Magnetic Ballast
2 171.2 0.17 2080 356 $52.9 Replace T12 Bulbs With High Perf. T8 Bulbs, Replace Ballast w/ HighPerf., 0.78 Ballast Factor Ballast
2 97.2 0.10 2080 1456 202 142 Automatic Wall Switch Occupancy Sensor 1 0.07 215 $31.86 $70.0 $10.0 $65.0 $63.5 $45.0 $65.0 $80.0 $145.0 $175.0 $223.5 $398.5
Borough Hall - Interior 0 File Storage 2x4 Fixtures w/ 2-T12 Lamp Fixture w/ Magnetic Ballast
4 342.4 0.34 2080 712 $105.8 Replace T12 Bulbs With High Perf. T8 Bulbs, Replace Ballast w/ HighPerf., 0.78 Ballast Factor Ballast
4 194.4 0.19 2080 1456 404 404 None Proposed 0 0.15 308 $45.71 $70.0 $10.0 $65.0 $0.0 $0.0 $65.0 $80.0 $145.0 $260.0 $320.0 $580.0
Borough Hall - Interior 0 File Storage Closet 1X4 Fixtures w/ 1-T8 Lamps w/ Magnetic Ballasts 1 35 0.04 2080 73 $10.8 Replace Magnetic Ballast w/ Standard Electronic Ballast 1 25.4 0.03 2080 1456 53 53 None Proposed 0 0.01 20 $2.97 $20.0 $0.0 $65.0 $0.0 $0.0 $65.0 $20.0 $85.0 $65.0 $20.0 $85.0
Borough Hall - Interior 0 Construciton Code Office 2X2 Fixtures w/ 2-T12 Lamps w/ Magnetic Ballasts 6 513.6 0.51 2080 1068 $158.6 Replace T12 Bulbs With High Perf. T8 Bulbs, Replace Ballast w/ HighPerf., 0.78 Ballast Factor Ballast
6 300 0.30 2080 1456 624 437 Automatic Wall Switch Occupancy Sensor 1 0.21 631 $93.78 $55.0 $10.0 $65.0 $63.5 $45.0 $65.0 $65.0 $130.0 $435.0 $453.5 $888.5
Borough Hall - Interior 0 Office 2X2 Fixtures w/ 2-T12 Lamps w/ Magnetic Ballasts 6 513.6 0.51 2080 1068 $158.6 Replace T12 Bulbs With High Perf. T8 Bulbs, Replace Ballast w/ HighPerf., 0.78 Ballast Factor Ballast
6 300 0.30 2080 1456 624 437 Automatic Wall Switch Occupancy Sensor 1 0.21 631 $93.78 $55.0 $10.0 $65.0 $63.5 $45.0 $65.0 $65.0 $130.0 $435.0 $453.5 $888.5
Borough Hall - Interior 0 Basement Conference 2x4 Fixtures w/ 4-T12 Lamp Fixture w/ Magnetic Ballast
8 1369.6 1.37 2080 2849 $423.0 Replace T12 Bulbs With High Perf. T8 Bulbs, Replace Ballast w/ HighPerf., 0.78 Ballast Factor Ballast
8 778.4 0.78 2080 1456 1619 1133 Ceiling Mounted Occupancy Sensor 1 0.59 1715 $254.74 $105.0 $20.0 $65.0 $103.0 $73.5 $65.0 $125.0 $190.0 $593.5 $1,103.0 $1,696.5
Borough Hall - Interior 0 Office 2x4 Fixtures w/ 4-T12 Lamp Fixture w/ Magnetic Ballast
6 1027.2 1.03 2080 2137 $317.3 Replace T12 Bulbs With High Perf. T8 Bulbs, Replace Ballast w/ HighPerf., 0.78 Ballast Factor Ballast
6 583.8 0.58 2080 1456 1214 850 Ceiling Mounted Occupancy Sensor 1 0.44 1287 $191.05 $105.0 $20.0 $65.0 $103.0 $73.5 $65.0 $125.0 $190.0 $463.5 $853.0 $1,316.5
Borough Hall - Interior 0 Storage 1x4 Fixtures w/ 2-T12 Lamp Fixture w/ Magnetic Ballast
1 85.6 0.09 520 45 $6.6 Replace T12 Bulbs With High Perf. T8 Bulbs, Replace Ballast w/ HighPerf., 0.78 Ballast Factor Ballast
1 48.6 0.05 520 364 25 25 None Proposed 0 0.04 19 $2.86 $70.0 $10.0 $65.0 $0.0 $0.0 $65.0 $80.0 $145.0 $65.0 $80.0 $145.0
Borough Hall - Interior 0 Archive Room 1x4 Fixtures w/ 2-T12 Lamp Fixture w/ Magnetic Ballast
4 342.4 0.34 2080 712 $105.8 Replace T12 Bulbs With High Perf. T8 Bulbs, Replace Ballast w/ HighPerf., 0.78 Ballast Factor Ballast
4 194.4 0.19 2080 1456 404 283 Automatic Wall Switch Occupancy Sensor 1 0.15 429 $63.73 $70.0 $10.0 $65.0 $63.5 $45.0 $65.0 $80.0 $145.0 $305.0 $383.5 $688.5
Borough Hall - Interior 0 Hall 2x4 Fixtures w/ 3-T12 Lamp Fixture w/ Magnetic Ballast
3 385.2 0.39 8760 3374 $501.1 Replace T12 Bulbs With High Perf. T8 Bulbs, Replace Ballast w/ HighPerf., 0.78 Ballast Factor Ballast
3 219 0.22 8760 6132 1918 1918 None Proposed 0 0.17 1456 $216.20 $85.0 $15.0 $65.0 $0.0 $0.0 $65.0 $100.0 $165.0 $195.0 $300.0 $495.0
Borough Hall - Interior 0 Storage/Maintenance 1x4 Fixtures w/ 2-T12 Lamp Fixture w/ Magnetic Ballast
6 513.6 0.51 2080 1068 $158.6 Replace T12 Bulbs With High Perf. T8 Bulbs, Replace Ballast w/ HighPerf., 0.78 Ballast Factor Ballast
6 291.6 0.29 2080 1456 607 607 None Proposed 0 0.22 462 $68.57 $70.0 $10.0 $65.0 $0.0 $0.0 $65.0 $80.0 $145.0 $390.0 $480.0 $870.0
Borough Hall - Interior 0 Electrical Room 1x4 Fixtures w/ 2-T12 Lamp Fixture w/ Magnetic Ballast
2 171.2 0.17 2080 356 $52.9 Replace T12 Bulbs With High Perf. T8 Bulbs, Replace Ballast w/ HighPerf., 0.78 Ballast Factor Ballast
2 97.2 0.10 2080 1456 202 202 None Proposed 0 0.07 154 $22.86 $70.0 $10.0 $65.0 $0.0 $0.0 $65.0 $80.0 $145.0 $130.0 $160.0 $290.0
Borough Hall - Interior 0 Zoning Waiting Area 2x4 Fixtures w/ 4-T12 Lamp Fixture w/ Magnetic Ballast
2 342.4 0.34 2080 712 $105.8 Replace T12 Bulbs With High Perf. T8 Bulbs, Replace Ballast w/ HighPerf., 0.78 Ballast Factor Ballast
2 194.6 0.19 2080 1456 405 405 None Proposed 0 0.15 307 $45.65 $105.0 $20.0 $65.0 $0.0 $0.0 $65.0 $125.0 $190.0 $130.0 $250.0 $380.0
Borough Hall - Interior 0 Zoning Reception Area 2x4 Fixtures w/ 4-T12 Lamp Fixture w/ Magnetic Ballast
8 1369.6 1.37 2080 2849 $423.0 Replace T12 Bulbs With High Perf. T8 Bulbs, Replace Ballast w/ HighPerf., 0.78 Ballast Factor Ballast
8 778.4 0.78 2080 1456 1619 1619 None Proposed 0 0.59 1230 $182.61 $105.0 $20.0 $65.0 $0.0 $0.0 $65.0 $125.0 $190.0 $520.0 $1,000.0 $1,520.0
Borough Hall - Interior 0 Zoning Reception Area 2X2 Fixtures w/ 2-T12 Lamps w/ Magnetic Ballasts 4 342.4 0.34 2080 712 $105.8 Replace T12 Bulbs With High Perf. T8 Bulbs, Replace Ballast w/ HighPerf., 0.78 Ballast Factor Ballast
4 200 0.20 2080 1456 416 416 None Proposed 0 0.14 296 $43.98 $55.0 $10.0 $65.0 $0.0 $0.0 $65.0 $65.0 $130.0 $260.0 $260.0 $520.0
Borough Hall - Interior 0 Hall 1x4 Fixtures w/ 2-T12 Lamp Fixture w/ Magnetic Ballast
4 342.4 0.34 8760 2999 $445.4 Replace T12 Bulbs With High Perf. T8 Bulbs, Replace Ballast w/ HighPerf., 0.78 Ballast Factor Ballast
4 194.4 0.19 8760 6132 1703 1703 None Proposed 0 0.15 1296 $192.53 $70.0 $10.0 $65.0 $0.0 $0.0 $65.0 $80.0 $145.0 $260.0 $320.0 $580.0
Borough Hall - Interior 0 Foyer Recessed Can w/ 2-13W CFL's 1 26 0.03 8760 228 $33.8 None Proposed 0 26 0.03 8760 6132 228 228 None Proposed 0 0.00 0 $0.00 $0.0 $0.0 $0.0 $0.0 $0.0 $0.0 $0.0 $0.0 $0.0 $0.0 $0.0
Borough Hall - Interior 0 Main Foyer Recessed Can w/ 2-13W CFL's 3 78 0.08 8760 683 $101.5 None Proposed 0 78 0.08 8760 6132 683 683 None Proposed 0 0.00 0 $0.00 $0.0 $0.0 $0.0 $0.0 $0.0 $0.0 $0.0 $0.0 $0.0 $0.0 $0.0
Borough Hall - Exterior - Building Mounted 13W CFL Fixture 3 39 0.04 4380 171 $25.4 None Proposed 0 39 0.04 4380 3066 171 171 None Proposed 0 0.00 0 $0.00 $0.0 $0.0 $0.0 $0.0 $0.0 $0.0 $0.0 $0.0 $0.0 $0.0 $0.0
Borough Hall - Exterior - Canopy Recessed Can w/ (Assume 75W Par 38 Lamp) 2 150 0.15 4380 657 $97.6 Replace 75W Lamp with 23W Par CFL 2 46 0.05 4380 3066 201 201 None Proposed 0 0.10 456 $67.64 $0.0 $20.0 $20.0 $0.0 $0.0 $20.0 $20.0 $40.0 $40.0 $40.0 $80.0
Borough Hall - Exterior - Wall Packs Exterior Fixture - (Assume 70W High Pressure Sodium)
4 376 0.38 4380 1647 $244.6 Replace 70W High Pressure Sodium Fixture with Induction Area Light 4 220 0.22 4380 3066 964 964 None Proposed 0 0.16 683 $101.47 $0.0 $380.0 $134.0 $0.0 $0.0 $134.0 $380.0 $514.0 $536.0 $1,520.0 $2,056.0
Borough Hall - Exterior - Parking Lot Exterior Fixture - 400W Metal Halide 10 4580 4.58 4380 20060 $2,979.0 Replace 400W Metal Halide fixture with Induction Area Light 10 2150 2.15 4380 3066 9417 9417 None Proposed 0 2.43 10643 $1,580.54 $0.0 $485.0 $134.0 $0.0 $0.0 $134.0 $485.0 $619.0 $1,340.0 $4,850.0 $6,190.0
Borough Hall - Exterior - Sidewalk Exterior Fixture - 100W High Pressure Sodium Fixture
11 1518 1.52 4380 6649 $987.4 Replace 100W High Pressure Sodium Fixture with Induction Area Light
11 605 0.61 4380 3066 2650 2650 None Proposed 0 0.91 3999 $593.84 $0.0 $380.0 $134.0 $0.0 $0.0 $134.0 $380.0 $514.0 $1,474.0 $4,180.0 $5,654.0
Public Library - Interior 1 Book Room-Right 1X4 Fixtures w/ 1-T8 Lamps w/ Electronic Ballasts 80 2032 2.03 2080 4227 $780.2 None Proposed 0 2032 2.03 2080 1456 4227 4227 None Proposed 0 0.00 0 $0.00 $0.0 $0.0 $0.0 $0.0 $0.0 $0.0 $0.0 $0.0 $0.0 $0.0 $0.0
Public Library - Interior 1 Receptionist Lobby 2x4 Fixtures w/ 4-T12 Lamp Fixture w/ Magnetic Ballast
4 684.8 0.68 2080 1424 $262.9 Replace T12 Bulbs With High Perf. T8 Bulbs, Replace Ballast w/ HighPerf., 0.78 Ballast Factor Ballast
4 389.2 0.39 2080 1456 810 810 None Proposed 0 0.30 615 $113.50 $105.0 $20.0 $65.0 $0.0 $0.0 $65.0 $125.0 $190.0 $260.0 $500.0 $760.0
Public Library - Interior 1 Receptionist Lobby 1x4 Fixtures w/ 2-T12 Lamp Fixture w/ Magnetic Ballast
5 428 0.43 2080 890 $164.3 Replace T12 Bulbs With High Perf. T8 Bulbs, Replace Ballast w/ HighPerf., 0.78 Ballast Factor Ballast
5 243 0.24 2080 1456 505 505 None Proposed 0 0.19 385 $71.03 $70.0 $10.0 $65.0 $0.0 $0.0 $65.0 $80.0 $145.0 $325.0 $400.0 $725.0
Public Library - Interior 1 Receptionist Lobby Recessed Can w/ 2-13W CFL's 8 208 0.21 2080 433 $79.9 None Proposed 0 208 0.21 2080 1456 433 433 None Proposed 0 0.00 0 $0.00 $0.0 $0.0 $0.0 $0.0 $0.0 $0.0 $0.0 $0.0 $0.0 $0.0 $0.0
Public Library - Interior 1 Receptionist Lobby 2x4 Fixtures w/ 4-T12 Lamp Fixture w/ Magnetic Ballast
5 856 0.86 2080 1780 $328.7 Replace T12 Bulbs With High Perf. T8 Bulbs, Replace Ballast w/ HighPerf., 0.78 Ballast Factor Ballast
5 486.5 0.49 2080 1456 1012 1012 None Proposed 0 0.37 769 $141.88 $105.0 $20.0 $65.0 $0.0 $0.0 $65.0 $125.0 $190.0 $325.0 $625.0 $950.0
Public Library - Interior 1 Book Room-Left 1X4 Fixtures w/ 1-T8 Lamps w/ Electronic Ballasts 127 3225.8 3.23 2080 6710 $1,238.6 None Proposed 0 3225.8 3.23 2080 1456 6710 6710 None Proposed 0 0.00 0 $0.00 $0.0 $0.0 $0.0 $0.0 $0.0 $0.0 $0.0 $0.0 $0.0 $0.0 $0.0
Public Library - Interior 1 Book Room-Left Recessed Can w/ 2-13W CFL's 3 78 0.08 2080 162 $29.9 None Proposed 0 78 0.08 2080 1456 162 162 None Proposed 0 0.00 0 $0.00 $0.0 $0.0 $0.0 $0.0 $0.0 $0.0 $0.0 $0.0 $0.0 $0.0 $0.0
Public Library - Interior 1 Book Room-Left 60W Incandescent Fixture 2 120 0.12 2080 250 $46.1 Replace 60W Incandescent Fixture with 13W CFL 2 26 0.03 2080 1456 54 54 None Proposed 0 0.09 196 $36.09 $0.0 $5.0 $20.0 $0.0 $0.0 $20.0 $5.0 $25.0 $40.0 $10.0 $50.0
Public Library - Interior 1 Elevator 1x4 Fixtures w/ 2-T12 Lamp Fixture w/ Magnetic Ballast
3 256.8 0.26 2080 534 $98.6 Replace T12 Bulbs With High Perf. T8 Bulbs, Replace Ballast w/ HighPerf., 0.78 Ballast Factor Ballast
3 145.8 0.15 2080 1456 303 303 None Proposed 0 0.11 231 $42.62 $70.0 $10.0 $65.0 $0.0 $0.0 $65.0 $80.0 $145.0 $195.0 $240.0 $435.0
Public Library - Interior 1 Side Entrance 2x4 Fixtures w/ 3-T12 Lamp Fixture w/ Magnetic Ballast
1 128.4 0.13 2080 267 $49.3 Replace T12 Bulbs With High Perf. T8 Bulbs, Replace Ballast w/ HighPerf., 0.78 Ballast Factor Ballast
1 73 0.07 2080 1456 152 152 None Proposed 0 0.06 115 $21.27 $85.0 $15.0 $65.0 $0.0 $0.0 $65.0 $100.0 $165.0 $65.0 $100.0 $165.0
Public Library - Interior 1 Bathroom 2x4 Fixtures w/ 2-T12 Lamp Fixture w/ Magnetic Ballast
1 85.6 0.09 2080 178 $32.9 Replace T12 Bulbs With High Perf. T8 Bulbs, Replace Ballast w/ HighPerf., 0.78 Ballast Factor Ballast
1 48.6 0.05 2080 1456 101 71 Automatic Wall Switch Occupancy Sensor 1 0.04 107 $19.81 $70.0 $10.0 $65.0 $63.5 $45.0 $65.0 $80.0 $145.0 $110.0 $143.5 $253.5
Public Library - Interior 1 Book Nook 2x4 Fixtures w/ 2-T12 Lamp Fixture w/ Magnetic Ballast
1 85.6 0.09 2080 178 $32.9 Replace T12 Bulbs With High Perf. T8 Bulbs, Replace Ballast w/ HighPerf., 0.78 Ballast Factor Ballast
1 48.6 0.05 2080 1456 101 101 None Proposed 0 0.04 77 $14.21 $70.0 $10.0 $65.0 $0.0 $0.0 $65.0 $80.0 $145.0 $65.0 $80.0 $145.0
Public Library - Interior 1 Book Nook 2x4 Fixtures w/ 3-T12 Lamp Fixture w/ Magnetic Ballast
1 128.4 0.13 2080 267 $49.3 Replace T12 Bulbs With High Perf. T8 Bulbs, Replace Ballast w/ HighPerf., 0.78 Ballast Factor Ballast
1 73 0.07 2080 1456 152 152 None Proposed 0 0.06 115 $21.27 $85.0 $15.0 $65.0 $0.0 $0.0 $65.0 $100.0 $165.0 $65.0 $100.0 $165.0
Public Library - Interior 1 Staff Lounge 2x4 Fixtures w/ 4-T12 Lamp Fixture w/ Magnetic Ballast
4 684.8 0.68 2080 1424 $262.9 Replace T12 Bulbs With High Perf. T8 Bulbs, Replace Ballast w/ HighPerf., 0.78 Ballast Factor Ballast
4 389.2 0.39 2080 1456 810 567 Ceiling Mounted Occupancy Sensor 1 0.30 858 $158.33 $105.0 $20.0 $65.0 $103.0 $73.5 $65.0 $125.0 $190.0 $333.5 $603.0 $936.5
Public Library - Interior 1 Rm. 108 2x4 Fixtures w/ 4-T12 Lamp Fixture w/ Magnetic Ballast
2 342.4 0.34 2080 712 $131.5 Replace T12 Bulbs With High Perf. T8 Bulbs, Replace Ballast w/ HighPerf., 0.78 Ballast Factor Ballast
2 194.6 0.19 2080 1456 405 283 Automatic Wall Switch Occupancy Sensor 1 0.15 429 $79.17 $105.0 $20.0 $65.0 $63.5 $45.0 $65.0 $125.0 $190.0 $175.0 $313.5 $488.5

Appendix D ‐ Lighting Summary
Building Floor # Location/Room # Existing Fixture/Lamp & Ballast Description Qty of Existing Fixtures
Existing Fixture Watts
Existing kW Operating Hours
Existing kWh Existing Annual Energy Cost
Proposed Replacement SolutionQuantity of Proposed
Proposed Fixture Watts
Proposed kW Base
Proposed Operational Hours Without Sensors
Proposed Operational Hours With Sensors
Proposed kWh Without
Proposed kWh With Proposed Occupancy Sensor Type
Occupancy Sensor
Total kW Saved
Total kWh Saved
Energy Cost Savings
Ballast/Fixture/Reflector Per Unit Price
Bulb (Per Unit Price) Labor (Per Unit Price) Occupancy Sensor (Per Unit Price)
Occupany Sensor (Per Unit Labor Price)
Labor Subtotal Materials Subtotal Labor & Materials Subtotal
Labor Total Materials Total Labor & Materials Total
Public Library - Interior 1 Rm. 113 2x4 Fixtures w/ 3-T12 Lamp Fixture w/ Magnetic Ballast
6 770.4 0.77 2080 1602 $295.8 Replace T12 Bulbs With High Perf. T8 Bulbs, Replace Ballast w/ HighPerf., 0.78 Ballast Factor Ballast
6 438 0.44 2080 1456 911 638 Ceiling Mounted Occupancy Sensor 1 0.33 965 $178.08 $85.0 $15.0 $65.0 $103.0 $73.5 $65.0 $100.0 $165.0 $463.5 $703.0 $1,166.5
Public Library - Interior 1 Center Book Area 2x4 Fixtures w/ 4-T12 Lamp Fixture w/ Magnetic Ballast
16 2739.2 2.74 2080 5698 $1,051.8 Replace T12 Bulbs With High Perf. T8 Bulbs, Replace Ballast w/ HighPerf., 0.78 Ballast Factor Ballast
16 1556.8 1.56 2080 1456 3238 3238 None Proposed 0 1.18 2459 $454.00 $105.0 $20.0 $65.0 $0.0 $0.0 $65.0 $125.0 $190.0 $1,040.0 $2,000.0 $3,040.0
Public Library - Interior 1 Storage 1x4 Fixtures w/ 2-T12 Lamp Fixture w/ Magnetic Ballast
1 85.6 0.09 520 45 $8.2 Replace T12 Bulbs With High Perf. T8 Bulbs, Replace Ballast w/ HighPerf., 0.78 Ballast Factor Ballast
1 48.6 0.05 520 364 25 25 None Proposed 0 0.04 19 $3.55 $70.0 $10.0 $65.0 $0.0 $0.0 $65.0 $80.0 $145.0 $65.0 $80.0 $145.0
Public Library - Interior - Stairwell 2x4 Fixtures w/ 2-T12 Lamp Fixture w/ Magnetic Ballast
1 85.6 0.09 8760 750 $138.4 Replace T12 Bulbs With High Perf. T8 Bulbs, Replace Ballast w/ HighPerf., 0.78 Ballast Factor Ballast
1 48.6 0.05 8760 6132 426 426 None Proposed 0 0.04 324 $59.83 $70.0 $10.0 $65.0 $0.0 $0.0 $65.0 $80.0 $145.0 $65.0 $80.0 $145.0
Public Library - Interior 2 Attic 60W Incandescent Fixture 3 180 0.18 520 94 $17.3 Replace 60W Incandescent Fixture with 13W CFL 3 39 0.04 520 364 20 20 None Proposed 0 0.14 73 $13.53 $0.0 $5.0 $20.0 $0.0 $0.0 $20.0 $5.0 $25.0 $60.0 $15.0 $75.0
Public Library - Interior 0 Fire Alarm Room 1x4 Fixtures w/ 2-T12 Lamp Fixture w/ Magnetic Ballast
1 85.6 0.09 2080 178 $32.9 Replace T12 Bulbs With High Perf. T8 Bulbs, Replace Ballast w/ HighPerf., 0.78 Ballast Factor Ballast
1 48.6 0.05 2080 1456 101 101 None Proposed 0 0.04 77 $14.21 $70.0 $10.0 $65.0 $0.0 $0.0 $65.0 $80.0 $145.0 $65.0 $80.0 $145.0
Public Library - Interior 0 Multi-Purpose Room 1x4 Fixtures w/ 2-T12 Lamp Fixture w/ Magnetic Ballast
11 941.6 0.94 2080 1959 $361.5 Replace T12 Bulbs With High Perf. T8 Bulbs, Replace Ballast w/ HighPerf., 0.78 Ballast Factor Ballast
11 534.6 0.53 2080 1456 1112 778 Ceiling Mounted Occupancy Sensor 1 0.41 1180 $217.86 $70.0 $10.0 $65.0 $103.0 $73.5 $65.0 $80.0 $145.0 $788.5 $983.0 $1,771.5
Public Library - Interior 0 Mechanical Room 60W Incandescent Fixture 3 180 0.18 2080 374 $69.1 Replace 60W Incandescent Fixture with 13W CFL 3 39 0.04 2080 1456 81 81 None Proposed 0 0.14 293 $54.14 $0.0 $5.0 $20.0 $0.0 $0.0 $20.0 $5.0 $25.0 $60.0 $15.0 $75.0
Public Library - Interior - Stairwell 2x4 Fixtures w/ 2-T12 Lamp Fixture w/ Magnetic Ballast
3 256.8 0.26 8760 2250 $415.3 Replace T12 Bulbs With High Perf. T8 Bulbs, Replace Ballast w/ HighPerf., 0.78 Ballast Factor Ballast
3 145.8 0.15 8760 6132 1277 1277 None Proposed 0 0.11 972 $179.50 $70.0 $10.0 $65.0 $0.0 $0.0 $65.0 $80.0 $145.0 $195.0 $240.0 $435.0
Public Library - Interior 0 Hall 1x4 Fixtures w/ 2-T12 Lamp Fixture w/ Magnetic Ballast
5 428 0.43 8760 3749 $692.1 Replace T12 Bulbs With High Perf. T8 Bulbs, Replace Ballast w/ HighPerf., 0.78 Ballast Factor Ballast
5 243 0.24 8760 6132 2129 2129 None Proposed 0 0.19 1621 $299.16 $70.0 $10.0 $65.0 $0.0 $0.0 $65.0 $80.0 $145.0 $325.0 $400.0 $725.0
Public Library - Interior 0 Womens Bathroom 1x4 Fixtures w/ 2-T12 Lamp Fixture w/ Magnetic Ballast
3 256.8 0.26 2080 534 $98.6 Replace T12 Bulbs With High Perf. T8 Bulbs, Replace Ballast w/ HighPerf., 0.78 Ballast Factor Ballast
3 145.8 0.15 2080 1456 303 212 Automatic Wall Switch Occupancy Sensor 1 0.11 322 $59.42 $70.0 $10.0 $65.0 $63.5 $45.0 $65.0 $80.0 $145.0 $240.0 $303.5 $543.5
Public Library - Interior 0 Mens Bathroom 1x4 Fixtures w/ 2-T12 Lamp Fixture w/ Magnetic Ballast
3 256.8 0.26 2080 534 $98.6 Replace T12 Bulbs With High Perf. T8 Bulbs, Replace Ballast w/ HighPerf., 0.78 Ballast Factor Ballast
3 145.8 0.15 2080 1456 303 212 Automatic Wall Switch Occupancy Sensor 1 0.11 322 $59.42 $70.0 $10.0 $65.0 $63.5 $45.0 $65.0 $80.0 $145.0 $240.0 $303.5 $543.5
Public Library - Interior - Stairwell 1x4 Fixtures w/ 2-T12 Lamp Fixture w/ Magnetic Ballast
2 171.2 0.17 8760 1500 $276.8 Replace T12 Bulbs With High Perf. T8 Bulbs, Replace Ballast w/ HighPerf., 0.78 Ballast Factor Ballast
2 97.2 0.10 8760 6132 851 851 None Proposed 0 0.07 648 $119.67 $70.0 $10.0 $65.0 $0.0 $0.0 $65.0 $80.0 $145.0 $130.0 $160.0 $290.0
Public Library - Interior - Stairwell 1x4 Fixtures w/ 4-T12 Lamp Fixture w/ Magnetic Ballast
2 342.4 0.34 8760 2999 $553.7 Replace T12 Bulbs With High Perf. T8 Bulbs, Replace Ballast w/ HighPerf., 0.78 Ballast Factor Ballast
2 194.6 0.19 8760 6132 1705 1705 None Proposed 0 0.15 1295 $239.01 $105.0 $20.0 $65.0 $0.0 $0.0 $65.0 $125.0 $190.0 $130.0 $250.0 $380.0
Public Library - Interior -1 Community Room 2x4 Fixtures w/ 4-T12 Lamp Fixture w/ Magnetic Ballast
13 2225.6 2.23 2080 4629 $854.6 Replace T12 Bulbs With High Perf. T8 Bulbs, Replace Ballast w/ HighPerf., 0.78 Ballast Factor Ballast
13 1264.9 1.26 2080 1456 2631 1842 Ceiling Mounted Occupancy Sensor 1 0.96 2788 $514.58 $105.0 $20.0 $65.0 $103.0 $73.5 $65.0 $125.0 $190.0 $918.5 $1,728.0 $2,646.5
Public Library - Interior -1 Storage 1x4 Fixtures w/ 2-T12 Lamp Fixture w/ Magnetic Ballast
2 171.2 0.17 520 89 $16.4 Replace T12 Bulbs With High Perf. T8 Bulbs, Replace Ballast w/ HighPerf., 0.78 Ballast Factor Ballast
2 97.2 0.10 520 364 51 35 Automatic Wall Switch Occupancy Sensor 1 0.07 54 $9.90 $70.0 $10.0 $65.0 $63.5 $45.0 $65.0 $80.0 $145.0 $175.0 $223.5 $398.5
Public Library - Interior 1 Hall 2x4 Fixtures w/ 3-T12 Lamp Fixture w/ Magnetic Ballast
4 513.6 0.51 8760 4499 $830.5 Replace T12 Bulbs With High Perf. T8 Bulbs, Replace Ballast w/ HighPerf., 0.78 Ballast Factor Ballast
4 292 0.29 8760 6132 2558 2558 None Proposed 0 0.22 1941 $358.35 $85.0 $15.0 $65.0 $0.0 $0.0 $65.0 $100.0 $165.0 $260.0 $400.0 $660.0
Public Library - Interior - Exit Signs CFL Exit Sign 10 160 0.16 2080 333 $61.4 Replace CFL Exit Sign with LED Exit Sign 10 50 0.05 2080 1456 104 104 None Proposed 0 0.11 229 $42.24 $0.0 $61.0 $63.0 $0.0 $0.0 $63.0 $61.0 $124.0 $630.0 $610.0 $1,240.0
Public Library - Exterior - Building Mounted Incandescent Par 38 w/ 2 75W Lamp 3 450 0.45 4380 1971 $363.8 Replace 75W Lamp with 23W Par CFL 3 138 0.14 4380 3066 604 604 None Proposed 0 0.31 1367 $252.27 $0.0 $20.0 $20.0 $0.0 $0.0 $20.0 $20.0 $40.0 $60.0 $60.0 $120.0
Public Library - Exterior - Building Mounted 100W Incandescent Fixture 4 400 0.40 4380 1752 $323.4 Replace 100W Incandescent Fixture with 25W CFL 4 100 0.10 4380 3066 438 438 None Proposed 0 0.30 1314 $242.56 $0.0 $7.0 $20.0 $0.0 $0.0 $20.0 $7.0 $27.0 $80.0 $28.0 $108.0
Public Library - Exterior - Parking Lot Exterior Fixture - (Assume 150W High Pressure Sodium)
5 945 0.95 4380 4139 $764.1 Replace 150W High Pressure Sodium Fixture with Induction Area Light
5 425 0.43 4380 3066 1862 1862 None Proposed 0 0.52 2278 $420.44 $0.0 $440.0 $134.0 $0.0 $0.0 $134.0 $440.0 $574.0 $670.0 $2,200.0 $2,870.0
DPW Main Building - Interior 1 Garage 1x8 Fixtures w/ 4-T12 Lamp Fixture w/ Magnetic Ballast
21 3595.2 3.60 2080 7478 $1,109.0 Replace T12 Bulbs With High Perf. T8 Bulbs, Replace Ballast w/ HighPerf., 0.78 Ballast Factor Ballast
21 2043.3 2.04 2080 1456 4250 4250 None Proposed 0 1.55 3228 $478.71 $105.0 $20.0 $65.0 $0.0 $0.0 $65.0 $125.0 $190.0 $1,365.0 $2,625.0 $3,990.0
DPW Main Building - Interior 1 Garage 1x8 Fixtures w/ 2-T12 Lamp Fixture w/ Magnetic Ballast
5 640 0.64 2080 1331 $197.4 Replace T12 Bulbs With High Perf. T8 Bulbs, Replace Ballast w/ HighPerf., 0.78 Ballast Factor Ballast
5 243 0.24 2080 1456 505 505 None Proposed 0 0.40 826 $122.46 $70.0 $10.0 $65.0 $0.0 $0.0 $65.0 $80.0 $145.0 $325.0 $400.0 $725.0
DPW Main Building - Interior 1 Garage Interior Fixture - 70W Metal Halide 1 95 0.10 2080 198 $29.3 None Proposed 0 95 0.10 2080 1456 198 198 None Proposed 0 0.00 0 $0.00 $0.0 $0.0 $0.0 $0.0 $0.0 $0.0 $0.0 $0.0 $0.0 $0.0 $0.0
DPW Main Building - Interior 1 Office 2x4 Fixtures w/ 4-T12 Lamp Fixture w/ Magnetic Ballast
5 856 0.86 2080 1780 $264.0 Replace T12 Bulbs With High Perf. T8 Bulbs, Replace Ballast w/ HighPerf., 0.78 Ballast Factor Ballast
5 486.5 0.49 2080 1456 1012 708 Automatic Wall Switch Occupancy Sensor 1 0.37 1072 $159.00 $105.0 $20.0 $65.0 $63.5 $45.0 $65.0 $125.0 $190.0 $370.0 $688.5 $1,058.5
DPW Main Building - Interior 1 Storage Circline Fixture w/ 2-T8 Lamps 1 50 0.05 520 26 $3.9 None Proposed 0 50 0.05 520 364 26 26 None Proposed 0 0.00 0 $0.00 $0.0 $0.0 $0.0 $0.0 $0.0 $0.0 $0.0 $0.0 $0.0 $0.0 $0.0
DPW Main Building - Interior 1 Stairwell 1x4 Fixtures w/ 2-T12 Lamp Fixture w/ Magnetic Ballast
1 85.6 0.09 2080 178 $26.4 Replace T12 Bulbs With High Perf. T8 Bulbs, Replace Ballast w/ HighPerf., 0.78 Ballast Factor Ballast
1 48.6 0.05 2080 1456 101 101 None Proposed 0 0.04 77 $11.41 $70.0 $10.0 $65.0 $0.0 $0.0 $65.0 $80.0 $145.0 $65.0 $80.0 $145.0
DPW Main Building - Interior 2 Recreation Room 1X4 Fixtures w/ 1-T8 Lamps w/ Electronic Ballasts 1 25.4 0.03 2080 53 $7.8 None Proposed 0 25.4 0.03 2080 1456 53 37 Ceiling Mounted Occupancy Sensor 1 0.00 16 $2.35 $0.0 $0.0 $0.0 $103.0 $73.5 $0.0 $0.0 $0.0 $73.5 $103.0 $176.5
DPW Main Building - Interior 2 Recreation Room 2x4 Fixtures w/ 4-T12 Lamp Fixture w/ Magnetic Ballast
6 1027.2 1.03 2080 2137 $316.9 Replace T12 Bulbs With High Perf. T8 Bulbs, Replace Ballast w/ HighPerf., 0.78 Ballast Factor Ballast
6 583.8 0.58 2080 1456 1214 1214 None Proposed 0 0.44 922 $136.77 $105.0 $20.0 $65.0 $0.0 $0.0 $65.0 $125.0 $190.0 $390.0 $750.0 $1,140.0
DPW Main Building - Interior 1 Kitchen 2x4 Fixtures w/ 4-T12 Lamp Fixture w/ Magnetic Ballast
4 684.8 0.68 2080 1424 $211.2 Replace T12 Bulbs With High Perf. T8 Bulbs, Replace Ballast w/ HighPerf., 0.78 Ballast Factor Ballast
4 389.2 0.39 2080 1456 810 567 Ceiling Mounted Occupancy Sensor 1 0.30 858 $127.20 $105.0 $20.0 $65.0 $103.0 $73.5 $65.0 $125.0 $190.0 $333.5 $603.0 $936.5
DPW Main Building - Interior 1 Womens Bathroom 1X4 Fixtures w/ 2-T8 Lamps w/ Electronic Ballasts 1 50.7 0.05 2080 105 $15.6 None Proposed 0 50.7 0.05 2080 1456 105 105 None Proposed 0 0.00 0 $0.00 $0.0 $0.0 $0.0 $0.0 $0.0 $0.0 $0.0 $0.0 $0.0 $0.0 $0.0
DPW Main Building - Interior 1 Mens Bathroom 1X4 Fixtures w/ 2-T8 Lamps w/ Electronic Ballasts 1 50.7 0.05 2080 105 $15.6 None Proposed 0 50.7 0.05 2080 1456 105 105 None Proposed 0 0.00 0 $0.00 $0.0 $0.0 $0.0 $0.0 $0.0 $0.0 $0.0 $0.0 $0.0 $0.0 $0.0
DPW Main Building - Interior - Exit Signs CFL Exit Sign 5 80 0.08 2080 166 $24.7 Replace CFL Exit Sign with LED Exit Sign 5 25 0.03 2080 1456 52 52 None Proposed 0 0.06 114 $16.97 $0.0 $61.0 $63.0 $0.0 $0.0 $63.0 $61.0 $124.0 $315.0 $305.0 $620.0
DPW Main Building - Exterior 1 Building Mounted Exterior Fixture - (Assume 150W High Pressure Sodium)
2 378 0.38 4380 1656 $245.5 Replace 150W High Pressure Sodium Fixture with Induction Area Light
2 170 0.17 4380 3066 745 745 None Proposed 0 0.21 911 $135.11 $0.0 $440.0 $134.0 $0.0 $0.0 $134.0 $440.0 $574.0 $268.0 $880.0 $1,148.0
DPW Main Building - Exterior 1 Building Mounted Incandescent Par 38 w/ 2 75W Lamp 2 300 0.30 4380 1314 $194.9 Replace 75W Lamp with 23W Par CFL 2 92 0.09 4380 3066 403 403 None Proposed 0 0.21 911 $135.11 $0.0 $20.0 $20.0 $0.0 $0.0 $20.0 $20.0 $40.0 $40.0 $40.0 $80.0
DPW Main Building - Exterior 1 Building Mounted Incandescent Par 38 w/ 3 75W Lamp 2 450 0.45 4380 1971 $292.3 Replace 75W Lamp with 23W Par CFL 2 138 0.14 4380 3066 604 604 None Proposed 0 0.31 1367 $202.66 $0.0 $20.0 $20.0 $0.0 $0.0 $20.0 $20.0 $40.0 $40.0 $40.0 $80.0
DPW Main Building - Exterior 1 Parking Lot Exterior Fixture - 400W Metal Halide 5 2290 2.29 4380 10030 $1,487.5 Replace 400W Metal Halide fixture with Induction Area Light 5 1075 1.08 4380 3066 4709 4709 None Proposed 0 1.22 5322 $789.21 $0.0 $485.0 $134.0 $0.0 $0.0 $134.0 $485.0 $619.0 $670.0 $2,425.0 $3,095.0
DPW Garage - Interior 1 Garage 1x8 Fixtures w/ 2-T12 Lamp Fixture w/ Magnetic Ballast
14 1792 1.79 2080 3727 $650.8 Replace T12 Bulbs With T8 Bulbs, Replace Ballast Standard Electronic Ballast
14 1526 1.53 2080 1456 3174 3174 None Proposed 0 0.27 553 $96.60 $35.0 $15.0 $65.0 $0.0 $0.0 $65.0 $50.0 $115.0 $910.0 $700.0 $1,610.0
DPW Garage - Interior 1 Womens Bathroom 100W Incandescent Fixture 1 100 0.10 2080 208 $36.3 Replace 100W Incandescent Fixture with 25W CFL 1 25 0.03 2080 1456 52 36 Automatic Wall Switch Occupancy Sensor 1 0.08 172 $29.96 $0.0 $7.0 $20.0 $63.5 $45.0 $20.0 $7.0 $27.0 $65.0 $70.5 $135.5
DPW Garage - Interior 1 Mens Bathroom 100W Incandescent Fixture 1 100 0.10 2080 208 $36.3 Replace 100W Incandescent Fixture with 25W CFL 1 25 0.03 2080 1456 52 36 Automatic Wall Switch Occupancy Sensor 1 0.08 172 $29.96 $0.0 $7.0 $20.0 $63.5 $45.0 $20.0 $7.0 $27.0 $65.0 $70.5 $135.5
DPW Garage - Interior - Exit Signs CFL Exit Sign 2 32 0.03 2080 67 $11.6 Replace CFL Exit Sign with LED Exit Sign 2 10 0.01 2080 1456 21 21 None Proposed 0 0.02 46 $7.99 $0.0 $61.0 $63.0 $0.0 $0.0 $63.0 $61.0 $124.0 $126.0 $122.0 $248.0
DPW Garage - Exterior 1 Building Mounted Incandescent Par 30 w/ 1 60W Lamp 2 120 0.12 4380 526 $91.8 Replace 60W Lamp with 15W Par CFL 2 30 0.03 4380 3066 131 131 None Proposed 0 0.09 394 $68.83 $0.0 $15.0 $20.0 $0.0 $0.0 $20.0 $15.0 $35.0 $40.0 $30.0 $70.0
DPW Garage - Exterior 1 Building Mounted Exterior Fixture - (Assume 70W High Pressure Sodium)
2 188 0.19 4380 823 $143.8 Replace 70W High Pressure Sodium Fixture with Induction Area Light 2 110 0.11 4380 3066 482 482 None Proposed 0 0.08 342 $59.65 $0.0 $380.0 $134.0 $0.0 $0.0 $134.0 $380.0 $514.0 $268.0 $760.0 $1,028.0
Fire Department - Interior 3 Storage Room 1X4 Fixtures w/ 2-T8 Lamps w/ Electronic Ballasts 5 253.5 0.25 2080 527 $77.9 None Proposed 0 253.5 0.25 2080 1456 527 527 None Proposed 0 0.00 0 $0.00 $0.0 $0.0 $0.0 $0.0 $0.0 $0.0 $0.0 $0.0 $0.0 $0.0 $0.0
Fire Department - Interior 3 Meeting Room 2X2 Troffers w/ 3-T8 Lamps w/ Electronic Ballasts 40 3720 3.72 2080 7738 $1,143.6 None Proposed 0 3720 3.72 2080 1456 7738 7738 None Proposed 0 0.00 0 $0.00 $0.0 $0.0 $0.0 $0.0 $0.0 $0.0 $0.0 $0.0 $0.0 $0.0 $0.0
Fire Department - Interior 3 Meeting Room Incandescent Par 16 w/ 1 75W Lamp 87 6525 6.53 2080 13572 $2,005.9 None Proposed 0 6525 6.53 2080 1456 13572 13572 None Proposed 0 0.00 0 $0.00 $0.0 $0.0 $0.0 $0.0 $0.0 $0.0 $0.0 $0.0 $0.0 $0.0 $0.0
Fire Department - Interior 3 Kitchen 1X4 Fixtures w/ 4-T8 Lamps w/ Electronic Ballasts 8 896 0.90 2080 1864 $275.5 None Proposed 0 896 0.90 2080 1456 1864 1864 None Proposed 0 0.00 0 $0.00 $0.0 $0.0 $0.0 $0.0 $0.0 $0.0 $0.0 $0.0 $0.0 $0.0 $0.0
Fire Department - Interior 3 Kitchen 1X4 Fixtures w/ 2-T8 Lamps w/ Electronic Ballasts 1 50.7 0.05 2080 105 $15.6 None Proposed 0 50.7 0.05 2080 1456 105 105 None Proposed 0 0.00 0 $0.00 $0.0 $0.0 $0.0 $0.0 $0.0 $0.0 $0.0 $0.0 $0.0 $0.0 $0.0
Fire Department - Interior 3 Kitchen Storage 1X4 Fixtures w/ 2-T8 Lamps w/ Electronic Ballasts 2 101.4 0.10 2080 211 $31.2 None Proposed 0 101.4 0.10 2080 1456 211 148 Automatic Wall Switch Occupancy Sensor 1 0.00 63 $9.35 $0.0 $0.0 $0.0 $63.5 $45.0 $0.0 $0.0 $0.0 $45.0 $63.5 $108.5
Fire Department - Interior 3 Janitors Closet 1X4 Fixtures w/ 2-T8 Lamps w/ Electronic Ballasts 1 50.7 0.05 2080 105 $15.6 None Proposed 0 50.7 0.05 2080 1456 105 74 Automatic Wall Switch Occupancy Sensor 1 0.00 32 $4.68 $0.0 $0.0 $0.0 $63.5 $45.0 $0.0 $0.0 $0.0 $45.0 $63.5 $108.5
Fire Department - Interior 3 Womens Bathroom 2X4 Fixtures w/ 3-T8 Lamps w/ Electronic Ballasts 2 176 0.18 2080 366 $54.1 None Proposed 0 176 0.18 2080 1456 366 366 None Proposed 0 0.00 0 $0.00 $0.0 $0.0 $0.0 $0.0 $0.0 $0.0 $0.0 $0.0 $0.0 $0.0 $0.0
Fire Department - Interior 3 Mens Bathroom 2X4 Fixtures w/ 3-T8 Lamps w/ Electronic Ballasts 2 176 0.18 2080 366 $54.1 None Proposed 0 176 0.18 2080 1456 366 366 None Proposed 0 0.00 0 $0.00 $0.0 $0.0 $0.0 $0.0 $0.0 $0.0 $0.0 $0.0 $0.0 $0.0 $0.0
Fire Department - Interior 3 Coat Closet 2X4 Fixtures w/ 3-T8 Lamps w/ Electronic Ballasts 2 176 0.18 520 92 $13.5 None Proposed 0 176 0.18 520 364 92 64 Automatic Wall Switch Occupancy Sensor 1 0.00 27 $4.06 $0.0 $0.0 $0.0 $63.5 $45.0 $0.0 $0.0 $0.0 $45.0 $63.5 $108.5
Fire Department - Interior 3 Hall 2X2 Troffers w/ 3-T8 Lamps w/ Electronic Ballasts 4 372 0.37 2080 774 $114.4 None Proposed 0 372 0.37 2080 1456 774 542 Ceiling Mounted Occupancy Sensor 2 0.00 232 $34.31 $0.0 $0.0 $0.0 $206.0 $147.0 $0.0 $0.0 $0.0 $294.0 $412.0 $706.0
Fire Department - Interior 3 Hall Recessed Can w/ 2-13W CFL's 9 234 0.23 2080 487 $71.9 None Proposed 0 234 0.23 2080 1456 487 487 None Proposed 0 0.00 0 $0.00 $0.0 $0.0 $0.0 $0.0 $0.0 $0.0 $0.0 $0.0 $0.0 $0.0 $0.0
Fire Department - Interior - Stairwell 1X4 Fixtures w/ 2-T8 Lamps w/ Electronic Ballasts 8 405.6 0.41 8760 3553 $525.1 None Proposed 0 405.6 0.41 8760 6132 3553 3553 None Proposed 0 0.00 0 $0.00 $0.0 $0.0 $0.0 $0.0 $0.0 $0.0 $0.0 $0.0 $0.0 $0.0 $0.0
Fire Department - Interior 2 Janitors Closet 1X4 Fixtures w/ 2-T8 Lamps w/ Electronic Ballasts 1 50.7 0.05 520 26 $3.9 None Proposed 0 50.7 0.05 520 364 26 26 None Proposed 0 0.00 0 $0.00 $0.0 $0.0 $0.0 $0.0 $0.0 $0.0 $0.0 $0.0 $0.0 $0.0 $0.0
Fire Department - Interior 2 Fire Prevention Bureau 2X2 Troffers w/ 3-T8 Lamps w/ Electronic Ballasts 4 372 0.37 2080 774 $114.4 None Proposed 0 372 0.37 2080 1456 774 774 None Proposed 0 0.00 0 $0.00 $0.0 $0.0 $0.0 $0.0 $0.0 $0.0 $0.0 $0.0 $0.0 $0.0 $0.0
Fire Department - Interior 2 Fire Official 2X4 Fixtures w/ 3-T8 Lamps w/ Electronic Ballasts 2 176 0.18 2080 366 $54.1 None Proposed 0 176 0.18 2080 1456 366 366 None Proposed 0 0.00 0 $0.00 $0.0 $0.0 $0.0 $0.0 $0.0 $0.0 $0.0 $0.0 $0.0 $0.0 $0.0
Fire Department - Interior 2 Rm. 213 2X2 Troffers w/ 3-T8 Lamps w/ Electronic Ballasts 6 558 0.56 2080 1161 $171.5 None Proposed 0 558 0.56 2080 1456 1161 1161 None Proposed 0 0.00 0 $0.00 $0.0 $0.0 $0.0 $0.0 $0.0 $0.0 $0.0 $0.0 $0.0 $0.0 $0.0
Fire Department - Interior 2 Chief's Office 2X2 Troffers w/ 3-T8 Lamps w/ Electronic Ballasts 4 372 0.37 2080 774 $114.4 None Proposed 0 372 0.37 2080 1456 774 774 None Proposed 0 0.00 0 $0.00 $0.0 $0.0 $0.0 $0.0 $0.0 $0.0 $0.0 $0.0 $0.0 $0.0 $0.0
Fire Department - Interior 2 Conference Room 2X2 Troffers w/ 3-T8 Lamps w/ Electronic Ballasts 6 558 0.56 2080 1161 $171.5 None Proposed 0 558 0.56 2080 1456 1161 1161 None Proposed 0 0.00 0 $0.00 $0.0 $0.0 $0.0 $0.0 $0.0 $0.0 $0.0 $0.0 $0.0 $0.0 $0.0
Fire Department - Interior 2 Ladies Auxiliary 2X4 Fixtures w/ 3-T8 Lamps w/ Electronic Ballasts 2 176 0.18 2080 366 $54.1 None Proposed 0 176 0.18 2080 1456 366 256 Automatic Wall Switch Occupancy Sensor 1 0.00 110 $16.23 $0.0 $0.0 $0.0 $63.5 $45.0 $0.0 $0.0 $0.0 $45.0 $63.5 $108.5
Fire Department - Interior 2 Hall Recessed Can w/ 2-13W CFL's 10 260 0.26 2080 541 $79.9 None Proposed 0 260 0.26 2080 1456 541 379 Ceiling Mounted Occupancy Sensor 2 0.00 162 $23.98 $0.0 $0.0 $0.0 $206.0 $147.0 $0.0 $0.0 $0.0 $294.0 $412.0 $706.0
Fire Department - Interior 2 Hall 2X2 Troffers w/ 3-T8 Lamps w/ Electronic Ballasts 10 930 0.93 2080 1934 $285.9 None Proposed 0 930 0.93 2080 1456 1934 1354 Ceiling Mounted Occupancy Sensor 2 0.00 580 $85.77 $0.0 $0.0 $0.0 $206.0 $147.0 $0.0 $0.0 $0.0 $294.0 $412.0 $706.0
Fire Department - Interior 2 Bathroom 2X4 Fixtures w/ 3-T8 Lamps w/ Electronic Ballasts 1 88 0.09 2080 183 $27.1 None Proposed 0 88 0.09 2080 1456 183 183 None Proposed 0 0.00 0 $0.00 $0.0 $0.0 $0.0 $0.0 $0.0 $0.0 $0.0 $0.0 $0.0 $0.0 $0.0
Fire Department - Interior 2 Radio Repair 2X4 Fixtures w/ 3-T8 Lamps w/ Electronic Ballasts 1 88 0.09 2080 183 $27.1 None Proposed 0 88 0.09 2080 1456 183 128 Automatic Wall Switch Occupancy Sensor 1 0.00 55 $8.12 $0.0 $0.0 $0.0 $63.5 $45.0 $0.0 $0.0 $0.0 $45.0 $63.5 $108.5
Fire Department - Interior 1 Elevator 13W CFL Fixture 6 78 0.08 2080 162 $24.0 None Proposed 0 78 0.08 2080 1456 162 162 None Proposed 0 0.00 0 $0.00 $0.0 $0.0 $0.0 $0.0 $0.0 $0.0 $0.0 $0.0 $0.0 $0.0 $0.0
Fire Department - Interior 1 Garage 400W Metal Halide Fixtures 6 2748 2.75 2080 5716 $844.8 Replace Metal Halide Fixtures with 6-Lamp Fluorescent Highbay Fixtures
6 1356 1.36 2080 1456 2820 2820 None Proposed 0 1.39 2895 $427.93 $168.0 $48.0 $100.0 $0.0 $0.0 $100.0 $216.0 $316.0 $600.0 $1,296.0 $1,896.0
Fire Department - Interior 1 Records Storage 2X4 Fixtures w/ 3-T8 Lamps w/ Electronic Ballasts 1 88 0.09 2080 183 $27.1 None Proposed 0 88 0.09 2080 1456 183 128 Automatic Wall Switch Occupancy Sensor 1 0.00 55 $8.12 $0.0 $0.0 $0.0 $63.5 $45.0 $0.0 $0.0 $0.0 $45.0 $63.5 $108.5
Fire Department - Interior 1 Womens Bathroom 2X4 Fixtures w/ 3-T8 Lamps w/ Electronic Ballasts 2 176 0.18 2080 366 $54.1 None Proposed 0 176 0.18 2080 1456 366 366 None Proposed 0 0.00 0 $0.00 $0.0 $0.0 $0.0 $0.0 $0.0 $0.0 $0.0 $0.0 $0.0 $0.0 $0.0
Fire Department - Interior 1 Mens Bathroom 2X4 Fixtures w/ 3-T8 Lamps w/ Electronic Ballasts 2 176 0.18 2080 366 $54.1 None Proposed 0 176 0.18 2080 1456 366 366 None Proposed 0 0.00 0 $0.00 $0.0 $0.0 $0.0 $0.0 $0.0 $0.0 $0.0 $0.0 $0.0 $0.0 $0.0

Appendix D ‐ Lighting Summary
Building Floor # Location/Room # Existing Fixture/Lamp & Ballast Description Qty of Existing Fixtures
Existing Fixture Watts
Existing kW Operating Hours
Existing kWh Existing Annual Energy Cost
Proposed Replacement SolutionQuantity of Proposed
Proposed Fixture Watts
Proposed kW Base
Proposed Operational Hours Without Sensors
Proposed Operational Hours With Sensors
Proposed kWh Without
Proposed kWh With Proposed Occupancy Sensor Type
Occupancy Sensor
Total kW Saved
Total kWh Saved
Energy Cost Savings
Ballast/Fixture/Reflector Per Unit Price
Bulb (Per Unit Price) Labor (Per Unit Price) Occupancy Sensor (Per Unit Price)
Occupany Sensor (Per Unit Labor Price)
Labor Subtotal Materials Subtotal Labor & Materials Subtotal
Labor Total Materials Total Labor & Materials Total
Fire Department - Interior 1 Garage 1X4 Fixtures w/ 1-T8 Lamps w/ Electronic Ballasts 2 50.8 0.05 2080 106 $15.6 None Proposed 0 50.8 0.05 2080 1456 106 106 None Proposed 0 0.00 0 $0.00 $0.0 $0.0 $0.0 $0.0 $0.0 $0.0 $0.0 $0.0 $0.0 $0.0 $0.0
Fire Department - Interior 1 Hall Recessed Can w/ 2-13W CFL's 10 260 0.26 2080 541 $79.9 None Proposed 0 260 0.26 2080 1456 541 379 Ceiling Mounted Occupancy Sensor 2 0.00 162 $23.98 $0.0 $0.0 $0.0 $206.0 $147.0 $0.0 $0.0 $0.0 $294.0 $412.0 $706.0
Fire Department - Interior 1 Hose Storage 1X4 Fixtures w/ 2-T8 Lamps w/ Electronic Ballasts 6 304.2 0.30 520 158 $23.4 None Proposed 0 304.2 0.30 520 364 158 111 Automatic Wall Switch Occupancy Sensor 1 0.00 47 $7.01 $0.0 $0.0 $0.0 $63.5 $45.0 $0.0 $0.0 $0.0 $45.0 $63.5 $108.5
Fire Department - Interior 1 Rm. 204 2X4 Fixtures w/ 3-T8 Lamps w/ Electronic Ballasts 1 88 0.09 2080 183 $27.1 None Proposed 0 88 0.09 2080 1456 183 183 None Proposed 0 0.00 0 $0.00 $0.0 $0.0 $0.0 $0.0 $0.0 $0.0 $0.0 $0.0 $0.0 $0.0 $0.0
Fire Department - Interior 1 Records/Computer Room 2X4 Fixtures w/ 3-T8 Lamps w/ Electronic Ballasts 2 176 0.18 2080 366 $54.1 None Proposed 0 176 0.18 2080 1456 366 366 None Proposed 0 0.00 0 $0.00 $0.0 $0.0 $0.0 $0.0 $0.0 $0.0 $0.0 $0.0 $0.0 $0.0 $0.0
Fire Department - Interior 1 Fire Commmunications 2X2 Troffers w/ 3-T8 Lamps w/ Electronic Ballasts 4 372 0.37 2080 774 $114.4 None Proposed 0 372 0.37 2080 1456 774 774 None Proposed 0 0.00 0 $0.00 $0.0 $0.0 $0.0 $0.0 $0.0 $0.0 $0.0 $0.0 $0.0 $0.0 $0.0
Fire Department - Interior 1 Mechanical Room 1X4 Fixtures w/ 2-T8 Lamps w/ Electronic Ballasts 3 152.1 0.15 2080 316 $46.8 None Proposed 0 152.1 0.15 2080 1456 316 221 Automatic Wall Switch Occupancy Sensor 1 0.00 95 $14.03 $0.0 $0.0 $0.0 $63.5 $45.0 $0.0 $0.0 $0.0 $45.0 $63.5 $108.5
Fire Department - Interior 1 Rm. 110 1X4 Fixtures w/ 2-T8 Lamps w/ Electronic Ballasts 3 152.1 0.15 2080 316 $46.8 None Proposed 0 152.1 0.15 2080 1456 316 221 Automatic Wall Switch Occupancy Sensor 1 0.00 95 $14.03 $0.0 $0.0 $0.0 $63.5 $45.0 $0.0 $0.0 $0.0 $45.0 $63.5 $108.5
Fire Department - Interior 1 Cascade 2X4 Fixtures w/ 3-T8 Lamps w/ Electronic Ballasts 1 88 0.09 2080 183 $27.1 None Proposed 0 88 0.09 2080 1456 183 128 Automatic Wall Switch Occupancy Sensor 1 0.00 55 $8.12 $0.0 $0.0 $0.0 $63.5 $45.0 $0.0 $0.0 $0.0 $45.0 $63.5 $108.5
Fire Department - Interior 1 Deliveries 1X4 Fixtures w/ 2-T8 Lamps w/ Electronic Ballasts 1 50.7 0.05 2080 105 $15.6 None Proposed 0 50.7 0.05 2080 1456 105 74 Automatic Wall Switch Occupancy Sensor 1 0.00 32 $4.68 $0.0 $0.0 $0.0 $63.5 $45.0 $0.0 $0.0 $0.0 $45.0 $63.5 $108.5
Fire Department - Interior 0 Hall 1X4 Fixtures w/ 2-T8 Lamps w/ Electronic Ballasts 3 152.1 0.15 2080 316 $46.8 None Proposed 0 152.1 0.15 2080 1456 316 316 None Proposed 0 0.00 0 $0.00 $0.0 $0.0 $0.0 $0.0 $0.0 $0.0 $0.0 $0.0 $0.0 $0.0 $0.0
Fire Department - Interior 0 Electrical Room 1X4 Fixtures w/ 2-T8 Lamps w/ Electronic Ballasts 2 101.4 0.10 2080 211 $31.2 None Proposed 0 101.4 0.10 2080 1456 211 211 None Proposed 0 0.00 0 $0.00 $0.0 $0.0 $0.0 $0.0 $0.0 $0.0 $0.0 $0.0 $0.0 $0.0 $0.0
Fire Department - Interior 0 Storage 1X4 Fixtures w/ 2-T8 Lamps w/ Electronic Ballasts 8 405.6 0.41 2080 844 $124.7 None Proposed 0 405.6 0.41 2080 1456 844 591 Ceiling Mounted Occupancy Sensor 1 0.00 253 $37.41 $0.0 $0.0 $0.0 $103.0 $73.5 $0.0 $0.0 $0.0 $73.5 $103.0 $176.5
Fire Department - Interior 0 Tower Equipment 1X4 Fixtures w/ 2-T8 Lamps w/ Electronic Ballasts 4 202.8 0.20 2080 422 $62.3 None Proposed 0 202.8 0.20 2080 1456 422 295 Ceiling Mounted Occupancy Sensor 1 0.00 127 $18.70 $0.0 $0.0 $0.0 $103.0 $73.5 $0.0 $0.0 $0.0 $73.5 $103.0 $176.5
Fire Department - Interior 0 Storage 1X4 Fixtures w/ 2-T8 Lamps w/ Electronic Ballasts 4 202.8 0.20 2080 422 $62.3 None Proposed 0 202.8 0.20 2080 1456 422 295 Ceiling Mounted Occupancy Sensor 1 0.00 127 $18.70 $0.0 $0.0 $0.0 $103.0 $73.5 $0.0 $0.0 $0.0 $73.5 $103.0 $176.5
Fire Department - Interior - Exit Signs CFL Exit Sign 15 240 0.24 2080 499 $73.8 Replace CFL Exit Sign with LED Exit Sign 15 75 0.08 2080 1456 156 156 None Proposed 0 0.17 343 $50.72 $0.0 $61.0 $63.0 $0.0 $0.0 $63.0 $61.0 $124.0 $945.0 $915.0 $1,860.0
Fire Department - Exterior - Building Mounted Exterior Fixture - (Assume 70W High Pressure Sodium)
3 282 0.28 2080 587 $86.7 Replace 70W High Pressure Sodium Fixture with Induction Area Light 3 165 0.17 2080 1456 343 343 None Proposed 0 0.12 243 $35.97 $0.0 $380.0 $134.0 $0.0 $0.0 $134.0 $380.0 $514.0 $402.0 $1,140.0 $1,542.0
Fire Department - Exterior - Exterior Canopy 100W Incandescent Fixture 6 600 0.60 2080 1248 $184.5 Replace 100W Incandescent Fixture with 25W CFL 6 150 0.15 2080 1456 312 312 None Proposed 0 0.45 936 $138.34 $0.0 $7.0 $20.0 $0.0 $0.0 $20.0 $7.0 $27.0 $120.0 $42.0 $162.0
Fire Department - Exterior - Exterior Garage Exterior Fixture - 400W Metal Halide 5 2290 2.29 2080 4763 $704.0 Replace 400W Metal Halide fixture with Induction Area Light 5 1075 1.08 2080 1456 2236 2236 None Proposed 0 1.22 2527 $373.52 $0.0 $485.0 $134.0 $0.0 $0.0 $134.0 $485.0 $619.0 $670.0 $2,425.0 $3,095.0
Fire Department - Exterior - Exterior Parking Exterior Fixture - 400W Metal Halide 3 1374 1.37 2080 2858 $422.4 Replace 400W Metal Halide fixture with Induction Area Light 3 645 0.65 2080 1456 1342 1342 None Proposed 0 0.73 1516 $224.11 $0.0 $485.0 $134.0 $0.0 $0.0 $134.0 $485.0 $619.0 $402.0 $1,455.0 $1,857.0

APPENDIX E
SOLAR ENERGY FINANCING WORKSHEET

Borough of Westwood -Borough HallDesign Goal: Provide 11% of average annual electricity
Existing ConditonsAverage Annual Electrical Usage (kWh) 365,200Current Utility Price ($/kWh) $0.1485
CalculationsSolar Rating (Zip Code: 07728) 4.51 kWh/sq-m/daySolar Capacity Required (kW) 34.26Roof Space Needed (sq-ft) 3,426Annual Solar kWh (PV Watts) 41,170Net System installation Cost ($9/kWh) $308,340Electrical Service Modification Cost $100,000Total System Installation Cost $408,340
Materials $285,838Labor $122,502
Engineers Opinion of Probable Cost $510,425
AssumptionsAnnual System Degredation 0.50%Annual Utility Inflation 3.00%Annual Maintenance Costs 2%
Year Utility Price Solar kWh Utility Savings SRECS Maintenance Costs Annual Cash Flow Cummulative Cash FlowInstall
1 0.1485 41,170.0 $6,113.7 $27,790 ($823) $33,080.1 $33,080.12 0.1530 40,964.2 $6,265.7 $26,960 ($819) $32,405.9 $65,486.03 0.1575 40,759.3 $6,421.4 $26,146 ($815) $31,752.3 $97,238.33 0.1575 40,759.3 $6,421.4 $26,146 ($815) $31,752.3 $97,238.34 0.1623 40,555.5 $6,580.9 $25,235 ($811) $31,004.7 $128,243.05 0.1671 40,352.8 $6,744.5 $24,355 ($807) $30,292.9 $158,535.86 0.1722 40,151.0 $6,912.1 $23,507 ($803) $29,615.7 $188,151.67 0.1773 39,950.2 $7,083.8 $22,687 ($799) $28,972.3 $217,123.98 0.1826 39,750.5 $7,259.9 $21,897 ($795) $28,361.7 $245,485.59 0.1881 39,551.7 $7,440.3 $21,134 ($791) $27,782.9 $273,268.510 0.1938 39,354.0 $7,625.2 $20,397 ($787) $27,235.3 $300,503.711 0.1996 39,157.2 $7,814.7 $19,686 ($783) $26,717.9 $327,221.612 0.2056 38,961.4 $8,008.9 $19,000 ($779) $26,229.9 $353,451.513 0.2117 38,766.6 $8,207.9 $18,338 ($775) $25,770.7 $379,222.114 0.2181 38,572.8 $8,411.8 $17,699 ($771) $25,339.4 $404,561.615 0.2246 38,379.9 $8,620.9 $17,082 ($768) $24,935.5 $429,497.116 0.2314 38,188.0 $8,835.1 $955 ($764) $9,026.0 $438,523.117 0.2383 37,997.1 $9,054.7 $950 ($760) $9,244.6 $447,767.818 0.2454 37,807.1 $9,279.7 $945 ($756) $9,468.7 $457,236.519 0.2528 37,618.1 $9,510.3 $940 ($752) $9,698.4 $466,934.820 0.2604 37,430.0 $9,746.6 $936 ($749) $9,933.7 $476,868.621 0.2682 37,242.8 $9,988.8 $931 ($745) $10,175.0 $487,043.622 0.2763 37,056.6 $10,237.0 $926 ($741) $10,422.3 $497,465.923 0.2845 36,871.3 $10,491.4 $922 ($737) $10,675.8 $508,141.724 0.2931 36,687.0 $10,752.1 $917 ($734) $10,935.6 $519,077.225 0.3019 36,503.5 $11,019.3 $913 ($730) $11,201.8 $530,279.1

Borough of Westwood - Public LibraryDesign Goal: Provide 16% of average annual electricity
Existing ConditonsAverage Annual Electrical Usage (kWh) 127,215Current Utility Price ($/kWh) $0.1846
CalculationsSolar Rating (Zip Code: 07728) 4.51 kWh/sq-m/daySolar Capacity Required (kW) 16.84Roof Space Needed (sq-ft) 1,684Annual Solar kWh (PV Watts) 20,237Net System installation Cost ($9/kWh) $151,560Electrical Service Modification Cost $100,000Total System Installation Cost $251,560
Materials $176,092Labor $75,468
Engineers Opinion of Probable Cost $314,450
AssumptionsAnnual System Degredation 0.50%Annual Utility Inflation 3.00%Annual Maintenance Costs 2%
Year Utility Price Solar kWh Utility Savings SRECS Maintenance Costs Annual Cash Flow Cummulative Cash FlowInstall
1 0.1846 20,237.0 $3,735.8 $13,660 ($405) $16,991.0 $16,991.02 0.1901 20,135.8 $3,828.6 $13,252 ($403) $16,677.8 $33,668.73 0.1958 20,035.1 $3,923.7 $12,852 ($401) $16,375.0 $50,043.83 0.1958 20,035.1 $3,923.7 $12,852 ($401) $16,375.0 $50,043.84 0.2017 19,935.0 $4,021.2 $12,404 ($399) $16,026.7 $66,070.45 0.2078 19,835.3 $4,121.2 $11,972 ($397) $15,696.3 $81,766.76 0.2140 19,736.1 $4,223.6 $11,555 ($395) $15,383.5 $97,150.27 0.2204 19,637.4 $4,328.5 $11,152 ($393) $15,087.7 $112,238.08 0.2270 19,539.2 $4,436.1 $10,763 ($391) $14,808.6 $127,046.69 0.2338 19,441.5 $4,546.3 $10,388 ($389) $14,545.7 $141,592.310 0.2409 19,344.3 $4,659.3 $10,026 ($387) $14,298.6 $155,890.811 0.2481 19,247.6 $4,775.1 $9,677 ($385) $14,066.9 $169,957.712 0.2555 19,151.4 $4,893.7 $9,340 ($383) $13,850.2 $183,808.013 0.2632 19,055.6 $5,015.4 $9,014 ($381) $13,648.3 $197,456.314 0.2711 18,960.3 $5,140.0 $8,700 ($379) $13,460.7 $210,917.015 0.2792 18,865.5 $5,267.7 $8,397 ($377) $13,287.1 $224,204.116 0.2876 18,771.2 $5,398.6 $469 ($375) $5,492.5 $229,696.517 0.2962 18,677.4 $5,532.8 $467 ($374) $5,626.2 $235,322.718 0.3051 18,584.0 $5,670.3 $465 ($372) $5,763.2 $241,085.919 0.3143 18,491.1 $5,811.2 $462 ($370) $5,903.6 $246,989.520 0.3237 18,398.6 $5,955.6 $460 ($368) $6,047.6 $253,037.121 0.3334 18,306.6 $6,103.6 $458 ($366) $6,195.1 $259,232.222 0.3434 18,215.1 $6,255.2 $455 ($364) $6,346.3 $265,578.523 0.3537 18,124.0 $6,410.7 $453 ($362) $6,501.3 $272,079.824 0.3643 18,033.4 $6,570.0 $451 ($361) $6,660.2 $278,740.025 0.3753 17,943.2 $6,733.3 $449 ($359) $6,823.0 $285,562.9

Borough of Westwood -DPW Main BuildingDesign Goal: Provide 90% of average annual electricity
Existing ConditonsAverage Annual Electrical Usage (kWh) 73,152Current Utility Price ($/kWh) $0.1483
CalculationsSolar Rating (Zip Code: 07728) 4.51 kWh/sq-m/daySolar Capacity Required (kW) 55.02Roof Space Needed (sq-ft) 5,502Annual Solar kWh (PV Watts) 66,118Net System installation Cost ($9/kWh) $495,180Electrical Service Modification Cost $100,000Total System Installation Cost $595,180
Materials $416,626Labor $178,554
Engineers Opinion of Probable Cost $743,975
AssumptionsAnnual System Degredation 0.50%Annual Utility Inflation 3.00%Annual Maintenance Costs 2%
Year Utility Price Solar kWh Utility Savings SRECS Maintenance Costs Annual Cash Flow Cummulative Cash FlowInstall
1 0.1483 66,118.0 $9,805.3 $44,630 ($1,322) $53,112.6 $53,112.62 0.1527 65,787.4 $10,049.0 $43,296 ($1,316) $52,029.6 $105,142.13 0.1573 65,458.5 $10,298.7 $41,990 ($1,309) $50,979.4 $156,121.63 0.1573 65,458.5 $10,298.7 $41,990 ($1,309) $50,979.4 $156,121.64 0.1621 65,131.2 $10,554.6 $40,527 ($1,303) $49,778.6 $205,900.25 0.1669 64,805.5 $10,816.9 $39,114 ($1,296) $48,635.0 $254,535.26 0.1719 64,481.5 $11,085.7 $37,751 ($1,290) $47,547.2 $302,082.37 0.1771 64,159.1 $11,361.2 $36,435 ($1,283) $46,513.5 $348,595.88 0.1824 63,838.3 $11,643.5 $35,166 ($1,277) $45,532.4 $394,128.29 0.1879 63,519.1 $11,932.8 $33,940 ($1,270) $44,602.6 $438,730.810 0.1935 63,201.5 $12,229.4 $32,757 ($1,264) $43,722.7 $482,453.511 0.1993 62,885.5 $12,533.3 $31,616 ($1,258) $42,891.3 $525,344.812 0.2053 62,571.1 $12,844.7 $30,514 ($1,251) $42,107.2 $567,452.113 0.2114 62,258.2 $13,163.9 $29,451 ($1,245) $41,369.3 $608,821.314 0.2178 61,946.9 $13,491.0 $28,424 ($1,239) $40,676.3 $649,497.615 0.2243 61,637.2 $13,826.3 $27,434 ($1,233) $40,027.1 $689,524.816 0.2310 61,329.0 $14,169.9 $1,533 ($1,227) $14,476.5 $704,001.317 0.2380 61,022.4 $14,522.0 $1,526 ($1,220) $14,827.1 $718,828.418 0.2451 60,717.2 $14,882.8 $1,518 ($1,214) $15,186.4 $734,014.819 0.2525 60,413.7 $15,252.7 $1,510 ($1,208) $15,554.8 $749,569.520 0.2600 60,111.6 $15,631.7 $1,503 ($1,202) $15,932.3 $765,501.821 0.2678 59,811.0 $16,020.2 $1,495 ($1,196) $16,319.2 $781,821.022 0.2759 59,512.0 $16,418.3 $1,488 ($1,190) $16,715.8 $798,536.923 0.2842 59,214.4 $16,826.3 $1,480 ($1,184) $17,122.3 $815,659.224 0.2927 58,918.3 $17,244.4 $1,473 ($1,178) $17,539.0 $833,198.225 0.3015 58,623.8 $17,672.9 $1,466 ($1,172) $17,966.0 $851,164.2

Borough of Westwood -DPW GarageDesign Goal: Provide 100% of average annual electricity
Existing ConditonsAverage Annual Electrical Usage (kWh) 14,093Current Utility Price ($/kWh) $0.1746
CalculationsSolar Rating (Zip Code: 07728) 4.51 kWh/sq-m/daySolar Capacity Required (kW) 11.5Roof Space Needed (sq-ft) 1,150Annual Solar kWh (PV Watts) 14,094Net System installation Cost ($9/kWh) $103,500Electrical Service Modification Cost $100,000Total System Installation Cost $203,500
Materials $142,450Labor $61,050
Engineers Opinion of Probable Cost $254,375
AssumptionsAnnual System Degredation 0.50%Annual Utility Inflation 3.00%Annual Maintenance Costs 2%
Year Utility Price Solar kWh Utility Savings SRECS Maintenance Costs Annual Cash Flow Cummulative Cash FlowInstall
1 0.1746 14,094.0 $2,460.8 $9,513 ($282) $11,692.4 $11,692.42 0.1798 14,023.5 $2,522.0 $9,229 ($280) $11,470.7 $23,163.13 0.1852 13,953.4 $2,584.6 $8,951 ($279) $11,256.3 $34,419.43 0.1852 13,953.4 $2,584.6 $8,951 ($279) $11,256.3 $34,419.44 0.1908 13,883.6 $2,648.9 $8,639 ($278) $11,010.0 $45,429.45 0.1965 13,814.2 $2,714.7 $8,338 ($276) $10,776.2 $56,205.66 0.2024 13,745.2 $2,782.1 $8,047 ($275) $10,554.4 $66,760.07 0.2085 13,676.4 $2,851.3 $7,767 ($274) $10,344.5 $77,104.58 0.2147 13,608.0 $2,922.1 $7,496 ($272) $10,146.1 $87,250.69 0.2212 13,540.0 $2,994.8 $7,235 ($271) $9,958.8 $97,209.410 0.2278 13,472.3 $3,069.2 $6,983 ($269) $9,782.4 $106,991.811 0.2346 13,404.9 $3,145.4 $6,739 ($268) $9,616.7 $116,608.512 0.2417 13,337.9 $3,223.6 $6,504 ($267) $9,461.3 $126,069.813 0.2489 13,271.2 $3,303.7 $6,278 ($265) $9,316.1 $135,385.914 0.2564 13,204.9 $3,385.8 $6,059 ($264) $9,180.7 $144,566.715 0.2641 13,138.9 $3,469.9 $5,848 ($263) $9,055.0 $153,621.716 0.2720 13,073.2 $3,556.2 $327 ($261) $3,621.5 $157,243.217 0.2802 13,007.8 $3,644.5 $325 ($260) $3,709.6 $160,952.818 0.2886 12,942.8 $3,735.1 $324 ($259) $3,799.8 $164,752.719 0.2972 12,878.0 $3,827.9 $322 ($258) $3,892.3 $168,645.020 0.3062 12,813.6 $3,923.1 $320 ($256) $3,987.1 $172,632.121 0.3153 12,749.6 $4,020.5 $319 ($255) $4,084.3 $176,716.422 0.3248 12,685.8 $4,120.5 $317 ($254) $4,183.9 $180,900.323 0.3346 12,622.4 $4,222.8 $316 ($252) $4,286.0 $185,186.224 0.3446 12,559.3 $4,327.8 $314 ($251) $4,390.6 $189,576.825 0.3549 12,496.5 $4,435.3 $312 ($250) $4,497.8 $194,074.6

Borough of Westwood -Fire DepartmentDesign Goal: Provide 11% of average annual electricity
Existing ConditonsAverage Annual Electrical Usage (kWh) 137,840Current Utility Price ($/kWh) $0.1478
CalculationsSolar Rating (Zip Code: 07728) 4.51 kWh/sq-m/daySolar Capacity Required (kW) 12.12Roof Space Needed (sq-ft) 1,212Annual Solar kWh (PV Watts) 14,565Net System installation Cost ($9/kWh) $109,080Electrical Service Modification Cost $100,000Total System Installation Cost $209,080
Materials $146,356Labor $62,724
Engineers Opinion of Probable Cost $261,350
AssumptionsAnnual System Degredation 0.50%Annual Utility Inflation 3.00%Annual Maintenance Costs 2%
Year Utility Price Solar kWh Utility Savings SRECS Maintenance Costs Annual Cash Flow Cummulative Cash FlowInstall
1 0.1478 14,565.0 $2,152.7 $9,831 ($291) $11,692.8 $11,692.82 0.1522 14,492.2 $2,206.2 $9,538 ($290) $11,454.0 $23,146.83 0.1568 14,419.7 $2,261.0 $9,250 ($288) $11,222.5 $34,369.33 0.1568 14,419.7 $2,261.0 $9,250 ($288) $11,222.5 $34,369.34 0.1615 14,347.6 $2,317.2 $8,928 ($287) $10,957.8 $45,327.15 0.1664 14,275.9 $2,374.8 $8,616 ($286) $10,705.7 $56,032.86 0.1713 14,204.5 $2,433.8 $8,316 ($284) $10,465.8 $66,498.67 0.1765 14,133.5 $2,494.3 $8,026 ($283) $10,237.9 $76,736.58 0.1818 14,062.8 $2,556.3 $7,747 ($281) $10,021.6 $86,758.19 0.1872 13,992.5 $2,619.8 $7,477 ($280) $9,816.6 $96,574.710 0.1928 13,922.5 $2,684.9 $7,216 ($278) $9,622.5 $106,197.211 0.1986 13,852.9 $2,751.6 $6,965 ($277) $9,439.1 $115,636.312 0.2046 13,783.7 $2,820.0 $6,722 ($276) $9,266.2 $124,902.513 0.2107 13,714.7 $2,890.1 $6,488 ($274) $9,103.4 $134,005.914 0.2170 13,646.2 $2,961.9 $6,262 ($273) $8,950.5 $142,956.315 0.2236 13,577.9 $3,035.5 $6,043 ($272) $8,807.2 $151,763.616 0.2303 13,510.0 $3,110.9 $338 ($270) $3,178.5 $154,942.017 0.2372 13,442.5 $3,188.2 $336 ($269) $3,255.4 $158,197.518 0.2443 13,375.3 $3,267.5 $334 ($268) $3,334.3 $161,531.819 0.2516 13,308.4 $3,348.7 $333 ($266) $3,415.2 $164,947.020 0.2592 13,241.9 $3,431.9 $331 ($265) $3,498.1 $168,445.121 0.2669 13,175.7 $3,517.2 $329 ($264) $3,583.0 $172,028.122 0.2750 13,109.8 $3,604.6 $328 ($262) $3,670.1 $175,698.223 0.2832 13,044.2 $3,694.1 $326 ($261) $3,759.3 $179,457.624 0.2917 12,979.0 $3,785.9 $324 ($260) $3,850.8 $183,308.425 0.3004 12,914.1 $3,880.0 $323 ($258) $3,944.6 $187,253.0

APPENDIX F
NEW JERSEY SMART START INCENTIVE WORKSHEETS

2010 Prescriptive Lighting Application
Prescriptive Lighting Incentive
$__________ Total Incentive (per attached worksheet calculations)
Note: Prescriptive Lighting Worksheet must accompany this application.
Customer InformationCompany ElectricUtilityServingApplicant ElectricAccountNo. InstallationDate
FacilityAddress City State Zip
TypeofProject SizeofBuilding
❑ NewConstruction ❑ Renovation ❑ EquipmentReplacement
CompanyMailingAddress City State Zip
ContactPerson(Name/Title) TelephoneNo. FaxNo. () ()
Incorporated?❑ Yes❑ No❑ Exempt FederalTaxID#orSSN EmailAddress
IncentivePaymentto Pleaseassignpaymenttocontractor/vendor/otherindicatedbelow
❑ Customer❑ Contractor❑ Other CustomerSignature
002-01/10
Payee Information (must submit W-9 form with application)
Contractor/Vendor Information (if different from Payee)
Company ContactName Incorporated? FederalTaxID# YesNoStreetAddress City StateZipTelephoneNo. FaxNo. () ()
Company ContactName Incorporated? FederalTaxID# ❑ Yes❑ NoStreetAddress City StateZipTelephoneNo. FaxNo. () ()
EmailAddress
EmailAddress
Building Type (circle one)Education-PrimarySchool;Education-CommunityCollege;Education-University;Grocery;Medical-Hospital;Medical-Clinic;LodgingHotel(GuestRooms);LodgingMotel;Manufacturing-LightIndustrial;Office-Large;Office-Small;Restaurant-SitDown;Restaurant-FastFood;Retail-3StoryLarge;Retail-SingleStoryLarge;Retail-Small;StorageConditioned;StorageUnconditioned;Warehouse;Other

Specific Program Requirements* (These requirements are in addition to the Program Terms and Conditions.)
1.PleaserefertotheProgramGuideforadditionalapplicabletechnicalrequirements.2.Includethemanufacturer’sspecificationsheetwiththeapplicationpackageandmailor
faxdirectlytotheCommercial/IndustrialMarketManager.3.IncentivesforT-5andT-8lampswithelectronicballastsareavailableonly
forfixtureswithaTotalHarmonicDistortionof≤20%.4.AlleligiblelightingdevicesmustbeULlisted.5.RequirementsforCFLfixtures(mustmeetallrequirements): ■FixturesmustbenewandENERGYSTARqualified ■Fixturesmusthavereplaceableelectronicballasts ■TotalHarmonicDistortion(THD)mustnotexceed33% ■Powerfactoroftheballastmustbenolessthan90% ■ Themanufacturermustwarrantallfixturesforaminimumof3years.Warranty
doesnotpertaintolampsorphotocellsnotphysicallypartofthefixture. ■Theinstallermustwarrantfixtureinstallation–minimumof1yr.5.1Screw-inPAR38or30CompactFluorescentLamps(CFL)with
AluminumReflectorsreplacingexistingincandescentfixtures. ■Thelampmustbewarrantedbythemanufacturerfor8,000hours ■TotalHarmonicDistortionmustnotexceed33% ■Powerfactoroftheballastmustbe≥90%6.PulseStartMetalHalide(includingpole-mountedparkinglotlighting)
musthavea12%minimumwattagereduction.
7.T-5orT-8FixturesreplacingincandescentorT-12fluorescentfixturesgreaterthan250wattorHighIntensityDischargeshallcomplyasfollows:
7.1T-5fixturesreplacingT-12fluorescentorincandescentfixtures250wattsorgreater,orHIDfixturesshallhaveaballastfactorgreaterthanorequalto1.0;havereflectivitygreaterthanorequalto91%;haveaminimum2lamps;andbedesignatedasF54T5HO.
7.2T-8fixturesreplacingT-12fluorescentorincandescentfixtures250wattsorgreater,orHIDfixturesshallhaveaballastfactorgreaterthanorequalto1.14;havereflectivitygreaterthanorequalto91%;haveaminimumof4lamps;andbedesignatedasF32T8,minimum32watts.
7.3IncentivesfordelampedT-8lampswithnewreflectorsareavailableonlyforfixtureswithaTotalHarmonicDistortionof≤20%.Electronicballastreplacementrequiredforalleligibledelampedfixtures.Eligibledelampingcanincludereductioninlinearlampfeetfromexistingconditions.Forexample,1-8'linearfluorescentlampcanbeconsideredas2-4'linearlamps.U-bendlamps4'intotallengthcanbeconsideredas2-F17/T8lamps.
7.4Electronicballastreplacementisnecessaryforalleligibledelampedfixtures.7.5ReducedwattageT8(28W/25W4')(1-4lamps)retrofitrequireslampandballast replacement.8.LEDRefridgerated/FreezerCaseLightingmustmeetNEEPDesignLights
ConsortiumStandardsorbeonanENERGYSTARoraSSLQualifiedProductlist.Fornewdoorinstallationsonexistingopencases,indicatethenumberofLEDfixturestobeinstalled.Alsoindicate"NewDoor"intheFixtureTypecolumnonthe PrescriptiveLightingWorksheet(ie.NewDoor5'LED).
Acknowledgement
cUStomeR’S SignAtURe_______________________________________________________________________
Bysigning,IcertifythatIhaveread,understandandagreetotheSpecificProgramRequirements/TermsandConditionslistedonthisapplicationform,Iwillalsosubmitforapprovalaproperlycompletedapplicationpackage,whichincludesthissignedapplication,worksheet(ifapplicable),manufacturer’sspecificationsheetsandcompleteutilitybill(nameandaddressonutilitybillmustmatchnameandaddressonapplication).
Visit our web site: NJCleanEnergy.com/ssbNewJerseySmartStartBuildings®isaregisteredtrademark.UseofthemarkwithoutthepermissionoftheNewJerseyBoardofPublicUtilities,OfficeofCleanEnergyisprohibited.
*Incentives/Requirementssubjecttochange.
Mail or fax your application package dIRECTLy to the Commercial/Industrial Market Manager.NewJersey'sCleanEnergyProgram
c/oTRCEnergyServices900Route9North,Suite104•Woodbridge,NJ07095
Phone:866-657-6278•Fax:732-855-0422
❑ PayeeInformationisfilledoutandaW-9formofthepayeeisincluded❑ Manufacturer'sspecificationsheetsforproposedtechnologyareincluded❑ Acopy(allpages)ofarecentmonth'sutilitybillisincluded
Application Checklist (Before submitting your application, please make sure you have signed in the space below and completed the following items.)
Prescriptive Lighting Measures and Incentives*
Recessed and Surface-mounted compact Fluorescents(new Fixtures Replacing incandescent Fixtures only): Onlyavailableforhard-wired,electronicallyballastednewfixtureswithrareearthphosphorlampsand4-pin basedtubes(including:twintube,quadtube,tripletube,2Dorcirclinelamps),THD<33%andBF>0.9
Screw-in PAR 38 or PAR 30 (cFl) as per 5.1 aboveHigh-efficiency Fluorescent Fixtures:For retrofit of t-12 fixtures to t-5 or t-8 with electronic ballasts
For replacement of fixtures with new t-5 or t-8 fixtures
Type of Fixture Incentive
$25per1-lampfixture$30per2-lampormorefixture
$7perlampreplaced
$15perfixture(1-4lampsretrofits)
HID,T-12,IncandescentHID,T-12,IncandescentHID,T-12,Incandescent
HIDonlyHIDonlyHIDonlyT-12onlyT-12only
≥1000Watts400-999Watt250-399Watt175-249Watt100-174Watt75-99Watt<250Watt<250Watt
T-5,T-8T-5,T-8T-5,T-8T-5,T-8T-5,T-8T-5,T-8
T-5,T-8(1&2lamp)T-5,T-8(3&4lamp)
$284$100$50$43$30$16$25$30
type of old Fixture wattage of old Fixture type of new Fixture incentive Per Fixture Removed
For retrofit of t-8 fixtures by permanent delamping & new reflectors are available only for fixtures with a total $20 per fixture Harmonic distortion of ≤20%. electronic ballast replacement required for all eligible delamped fixtures.
new construction & complete Renovation Performance based onlyled exit Signs (new fixtures only): For existing facilities with connected load <75 kw $20 per fixture
For existing facilities with connected load ≥ 75 kw $10 per fixture
Pulse Start metal Halide (for fixtures ≥ 150 watts) $25 per fixture (includes parking lot lighting)
Parking lot low bay - led $43 per fixture
t-12 to t-8 fixtures by permanent delamping & new reflectors. electronic ballast replacement is necessary for all eligible delamped fixtures. $30 per fixture
Retrofit of existing 32 watt t-8 system to Reduced wattage (28w/25w 4') $10 per fixture (1-4 lamps)
led Refrigerated/Freezer case lighting: incentive for replacement of fluorescent lighting systems $42 per 5' led fixturein medium or low temperature display cases $65 per 6' led fixture
induction lighting Fixtures
Retrofit of Hid $50 per Hid (≥100w) fixture retrofitted with induction lamp, power coupler and generator. Replacement unit must use 30% less wattage per fixture than existing Hid system .Replacement of Hid $70 per Hid (≥100w) fixture with a new induction fixture

Program Terms and Conditions
definitions:
design incentives – IncentivesthatmaybeofferedtodesignprofessionalsbytheProgram.
design Services–ServicesthatmaybeofferedtodesignprofessionalsundertheProgram.
energy-efficient measures–AnydeviceeligibletoreceiveaProgramIncentivepaymentthroughtheNJCleanEnergyCommercialandIndustrialProgram(NewJerseySmartStartBuildings).
new Jersey Utilities–Theregulatedelectricand/orgasutilitiesintheStateofNewJersey.Theyare:AtlanticCityElectric,JerseyCentralPower&Light,RocklandElectricCompany,NewJerseyNaturalGas,ElizabethtownGas,PSE&G,andSouthJerseyGas.
Administrator–NewJerseyBoardofPublicUtilities,OfficeofCleanEnergy
Participating customers–Thosenon-residentialelectricand/orgasservicecustomersoftheNewJerseyUtilitieswhoparticipateinthisProgram.
Product installation or equipment installation–InstallationoftheEnergy-EfficientMeasures.
market manager–TRCEnergyServices.
Program–TheCommercialandIndustrialEnergy-EfficientConstructionProgram(NewJerseySmartStartBuildings)offeredhereinbytheNewJerseyBoardofPublicUtilities,OfficeofCleanEnergypursuanttostateregulatoryapprovalundertheNewJerseyElectricDiscountandEnergyCompetitionAct,NJSA48:3-49,etseq.
Program incentives–ReferstotheamountorlevelofincentivethattheProgramprovidestoParticipatingCustomerspursuanttotheProgramofferedherein(seedescriptionunder“IncentiveAmount”heading).
Program offer–ProgramIncentivesareavailabletonon-residentialretailelectricand/orgasservicecustomersoftheNewJerseyUtilitiesidentifiedabove.ProgramIncentivesfornewconstructionareavailableonlyforprojectsinareasdesignatedforgrowthintheStatePlan.Publicschool(K-12)newconstructionprojectsareexemptedfromthisrestrictionandareeligiblefornewProgramincentivesthroughouttheState.Customers,ortheirtradeallies,candetermineifalocationisinadesignatedgrowthareabyreferringtotheSmartGrowthLocatoravailablefromtheHMFAwebsiteorcontacttheMarketManagerifyouareuncertainaboutprojecteligibility.
Application and eligibility Process–TheProgrampaysincentivesaftertheinstallationofqualifiedenergyefficientmeasuresthatwerepre-approved(forexceptionstothiscondition,pleasereferto“ExceptionsforApproval”.)InordertobeeligibleforProgramIncentives,aCustomer,oranagent(contractor/vendor)authorizedbyaCustomer,mustsubmitaproperlycompletedapplicationpackage.Thepackagemustincludeanapplicationsignedbythecustomer;acomplete(current)utilitybill;andtechnologyworksheetandmanufacturer’scutsheets(whereappropriate).ThisinformationmustbesubmittedtotheMarketManagerbeforeequipmentisinstalled.Applicationsformeasuresthatareselfinstalledbycustomersmustbesubmittedbythecustomerandnotthesalesvendorofthemeasure,however,thecustomermayelecttoassignpaymentoftheincentivetothesalesvendor.ThisapplicationpackagemustbereceivedbytheMarketManageronorbeforeDecember31,2010inordertobeeligiblefor2010incentives.TheMarketManagerwillreviewtheapplicationpackagetodetermineiftheprojectiseligibleforaProgramIncentive.Ifeligible,theCustomerwillreceiveanapprovalletterwiththeestimatedauthorizedincentiveamountandthedatebywhichtheequipmentmustbeinstalledinorderfortheapprovaltoremainineffect.Uponreceiptofanapprovalletter,theCustomermaythenproceedtoinstalltheequipmentlistedontheapprovedapplication.EquipmentinstalledpriortothedateoftheMarketManager’sapprovalletterisnoteligibleforanincentive.TheMarketManagerreservestherighttoconductapre-inspectionofthefacilitypriortotheinstallationofequipment.Thiswillbedonepriortotheissuanceoftheapprovalletter.Allequipmentmustbepurchasedwithin12monthsofdateofapplication.Any customer and/or agent who purchases equipment prior to the receipt of an incentive approval letter does so at his/her own risk.
exceptions for Approval–TheApplicationandEligibilityProcesspertainstoallprojectsexceptforthoseinvolvingeitherUnitaryHVACorMotorshavinganincentiveamountlessthan$5,000.Thesemeasures,atthisincentivelevel,maybeinstalledwithoutpriorapproval.Inaddition,butatthesolediscretionoftheMarketManager,emergencyreplacementofequipmentmaynotrequireapriorapprovaldeterminationandletter.in such cases, please notify the market manager of such emergencies as early as possible, that an application will soon be sent in that was not pre-approved.
Post installation Approval–Afterinstallationiscompleted,theCustomer,oranagentauthorizedbytheCustomer,mustfinalizeandsubmitaninvoiceforthepurchaseoftheequipment(materialcostmustbebrokenoutfromlaborcosts),andanyotherrequireddocumentationasspecifiedontheequipmentapplicationorintheMarketManager’sinitialapprovalletter.
NJ SmartStart Buildings®

PleaserefertotheProgramGuideontheNJCleanEnergy.com/ssbwebsiteforthecompleteApplicationandEligibilityProcess.
TheMarketManagerreservestherighttoverifysalestransactionsandtohavereasonableaccesstoParticipatingCustomer’sfacilitytoinspectbothpre-existingproductorequipment(ifapplicable)andtheEnergy-EfficientMeasuresinstalledunderthisProgram,eitherpriortoissuingincentivesoratalatertime.
Energy-EfficientMeasuresmustbeinstalledinbuildingslocatedwithinaNewJerseyUtilities’serviceterritoryanddesignatedontheParticipatingCustomer’sincentiveapplication.ProgramIncentivesareavailableforqualifiedEnergy-EfficientMeasuresaslistedanddescribedintheProgrammaterialsandincentiveapplications.TheParticipatingCustomermustultimatelyowntheequipment,eitherthroughanup-frontpurchaseorattheendofashort-termlease.DesignIncentivesareavailabletodesignprofessionalsasdescribedintheProgrammaterialsandapplications.Adifferentandseparateagreementmustbeexecutedbyparticipatingdesignprofessionalstobeeligibleforthistypeofincentive.ThedesignprofessionaldoesnotneedtobebasedinNewJersey.
Equipment procured by Participating Customers through another program offered by New Jersey's Clean Energy Program or the New Jersey Utilities, as applicable, is not eligible for incentives through this program. Customers who have not contributed to the Societal Benefits Charge of the applicable New Jersey Utility are not be eligible for incentives offered through this program.
incentive Amount–ProgramIncentiveswillequaleither:a)theapprovedProgramIncentiveamount,orb)theactualequipmentcostoftheEnergy-EfficientMeasure,whicheverisless,asdeterminedbytheMarketManager.Productsofferedatnodirectcosttothecustomerareineligible.Incompleteapplicationsubmissions,applicationsrequiringinspectionsandunanticipatedhighvolumeofactivitiesmaycauseprocessingdelays.ProgramIncentivesarelimitedto$500,000perutilityaccountinacalendaryear.ContacttheMarketManagerregardinganyquestions.
tax liability–TheMarketManagerwillnotberesponsibleforanytaxliabilitythatmaybeimposedonanyParticipatingCustomerasaresultofthepaymentofProgramIncentives.AllParticipatingCustomersmustsupplytheirFederalTaxIdentificationnumberorsocialsecuritynumbertotheMarketManagerontheapplicationforminordertoreceiveaProgramIncentive.Inaddition,ParticipatingCustomersmustalsoprovideaTaxClearanceForm(BusinessAssistanceorIncentiveClearanceCertificate)thatisdatedwithin90daysofequipmentinstallation.
endorsement–TheMarketManagerandAdministratordonotendorse,supportorrecommendanyparticularmanufacturer,productorsystemdesigninpromotingthisProgram.
warranties–THEMARKETMANAGERANDADMINISTRATORDONOTWARRANTTHEPERFORMANCEOFINSTALLEDEQUIPMENT,AND/ORSERVICESRENDEREDASPARTOFTHISPROGRAM,EITHEREXPRESSLYORIMPLICITLY.NOWARRANTIESORREPRESENTATIONSOFANYKIND,WHETHERSTATUTORY,EXPRESSED,ORIMPLIED,INCLUDING,WITHOUTLIMITATIONS,WARRANTIESOFMERCHANTABILITYORFITNESSFORAPARTICULARPURPOSEREGARDINGEQUIPMENTORSERVICESPROVIDEDBYAMANUFACTURERORVENDOR.CONTACTYOURVENDOR/SERVICESPROVIDERFORDETAILSREGARDINGPERFORMANCEANDWARRANTIES.
limitation of liability–ByvirtueofparticipatinginthisProgram,ParticipatingCustomersagreetowaiveanyandallclaimsordamagesagainsttheMarketManagerortheAdministrator,exceptthereceiptoftheProgramIncentive.ParticipatingCustomersagreethattheMarketManager’sandAdministrator’sliability,inconnectionwiththisProgram,islimitedtopayingtheProgramIncentivespecified.UndernocircumstancesshalltheMarketManager,itsrepresentatives,orsubcontractors,ortheAdministrator,beliableforanylostprofits,special,punitive,consequentialorincidentaldamagesorforanyotherdamagesorclaimsconnectedwithorresultingfromparticipationinthisProgram.Further,anyliabilityattributedtotheMarketManagerunderthisProgramshallbeindividual,andnotjointand/orseveral.
Assignment–TheParticipatingCustomermayassignProgramIncentivepaymentstoaspecifiedvendor.
Participating customer’s certification–ParticipatingCustomercertifiesthathe/shepurchasedandinstalledtheequipmentlistedintheirapplicationattheirdefinedNewJerseylocation.ParticipatingCustomeragreesthatallinformationistrueandthathe/shehasconformedtoalloftheProgramandequipmentrequirementslistedintheapplication.
termination–TheNewJerseyBoardofPublicUtilitiesreservestherighttoextend,modify(thisincludesmodificationofProgramIncentivelevels)orterminatethisProgramwithoutpriororfurthernotice.
Acknowledgement –Ihaveread,understoodandamincompliancewithallrulesandregulationsconcerningthisincentiveprogram.Icertifythatallinformationprovidediscorrecttothebestofmyknowledge,andIgivetheMarketManagerpermissiontosharemyrecordswiththeNewJerseyBoardofPublicUtilities,andcontractorsitselectstomanage,coordinateorevaluatetheNJSmartStartBuildingsProgram.Additionally,IallowreasonableaccesstomypropertytoinspecttheinstallationandperformanceofthetechnologiesandinstallationsthatareeligibleforincentivesundertheguidelinesofNewJersey’sCleanEnergyProgram.

2010 Prescriptive Lighting Incentive Worksheet
Prescriptive Lighting Information
Total (including additional sheets)
For additional fixtures, attach additional sheets and check here
002–01/10
Customer InformationCompany
Check here if multiple worksheets are being submitted for one project/building.
Facility Address
Date Submitted
Reason Fixture Type Fixture Type Permanent Location Size of A B Total Incentives N–New Installed Removed Delamp w/ (Bldg/Rm) Replaced Incentive # of (AxB) R–Replaced New Lamps Per Fixture Units Reflector (Y/N) in Watts (Table) (Examples) R 2x4 3L T-5 2x4 3L T-12 N Office 40 $15 8 $15 x 8 = $120
R 2x2 2L T-8 2x2 2L T-12 N Office 34 $15 10 $15 x 10 = $150
R 28w CFL 100w Incan N Supply Room 100 $25 3 $25 x 3 = $75
R 250w Pulse Start Metal Halide 400w Mercury Vapor N Warehouse 450 $25 3 $25 x 3 = $75
N New Doors 5' LED 1L T-8 5' N Dairy Case #5 38 $42 25 $42 x 25=$1,050

Specific Program Requirements* (These requirements are in addition to the Program Terms and Conditions.)
1. Please refer to the Program Guide for additional applicable technical requirements.2. Include the manufacturer’s specification sheet with the application package and mail or
fax directly to the Commercial/Industrial Market Manager.3. Incentives for T-5 and T-8 lamps with electronic ballasts are available only
for fixtures with a Total Harmonic Distortion of ≤20%.4. All eligible lighting devices must be UL listed. 5. R equirements for CFL fixtures (must meet all requirements): ■ Fixtures must be new and Energy Star qualified ■ Fixtures must have replaceable electronic ballasts ■ Total Harmonic Distortion (THD) must not exceed 33% ■ Power factor of the ballast must be no less than 90% ■ The manufacturer must warrant all fixtures for a minimum of 3 years. Warranty
does not pertain to lamps or photocells not physically part of the fixture. ■ The installer must warrant fixture installation – minimum of 1 yr.5.1 Screw-in PAR 38 or 30 Compact Fluorescent Lamps (CFL) with
Aluminum Reflectors replacing existing incandescent fixtures. ■ The lamp must be warranted by the manufacturer for 8,000 hours ■ Total Harmonic Distortion must not exceed 33% ■ Power factor of the ballast must be ≥90%6. Pulse Start Metal Halide (including pole-mounted parking lot lighting)
must have a 12% minimum wattage reduction.
7. T-5 or T-8 Fixtures replacing incandescent or T-12 fluorescent fixtures greater than 250 watt or High Intensity Discharge shall comply as follows:
7.1 T-5 fixtures replacing T-12 fluorescent or incandescent fixtures 250 watts or greater, or HID fixtures shall have a ballast factor greater than or equal to 1.0; have reflectivity greater than or equal to 91%; have a minimum 2 lamps; and be designated as F54T5 HO.
7.2 T-8 fixtures replacing T-12 fluorescent or incandescent fixtures 250 watts or greater, or HID fixtures shall have a ballast factor greater than or equal to 1.14; have reflectivity greater than or equal to 91%; have a minimum of 4 lamps; and be designated as F32T8, minimum 32 watts.
7.3 Incentives for delamped T-8 lamps with new reflectors are available only for fixtures with a total Harmonic Distortion of ≤20%. Electronic ballast replacement required for all eligible delamped fixtures. Eligible delamping can include reduction in linear lamp feet from existing conditions. For example, 1-8' linear fluorescent lamp can be considered as 2-4' linear lamps. U-bend lamps 4' in total length can be considered as 2-F17/T8 lamps.
7.4 Electronic ballast replacement is necessary for all eligible delamped fixtures.7.5 Reduced wattage T8 (28W/25W 4') (1-4 lamps) retrofit requires lamp and ballast replacement.8. LED Refridgerated/Freezer Case Lighting must meet NEEP Design Lights
Consortium Standards or be on an ENERGY STAR or a SSL Qualified Product list. For new door installations on existing open cases, indicate the number of LED fixtures to be installed. Also indicate "New Door" in the Fixture Type column on the Prescriptive Lighting Worksheet (ie. New Door 5' LED).
Acknowledgement
cUStomeR’S SignAtURe _______________________________________________________________________
By signing, I certify that I have read, understand and agree to the Specific Program Requirements/Terms and Conditions listed on this application form, I will also submit for approval a properly completed application package, which includes this signed application, worksheet (if applicable), manufacturer’s specification sheets and complete utility bill (name and address on utility bill must match name and address on application).
Visit our web site: NJCleanEnergy.com/ssbNew Jersey SmartStart Buildings® is a registered trademark. Use of the mark without the permission of the New Jersey Board of Public Utilities, Office of Clean Energy is prohibited.
*Incentives/Requirements subject to change.
Mail or fax your application package DIRECTLy to the Commercial/Industrial Market Manager.
New Jersey's Clean Energy Programc/o TRC Energy Services
900 Route 9 North, Suite 104 • Woodbridge, NJ 07095Phone: 866-657-6278 • Fax: 732-855-0422
Prescriptive Lighting Measures and Incentives*
Recessed and Surface-mounted compact Fluorescents(new Fixtures Replacing incandescent Fixtures only): Only available for hard-wired, electronically ballasted new fixtures with rare earth phosphor lamps and 4-pin based tubes (including: twin tube, quad tube, triple tube, 2D or circline lamps), THD<33% and BF>0.9
Screw-in PAR 38 or PAR 30 (cFl) as per 5.1 aboveHigh-efficiency Fluorescent Fixtures:For retrofit of t-12 fixtures to t-5 or t-8 with electronic ballasts
For replacement of fixtures with new t-5 or t-8 fixtures
Type of Fixture Incentive
$25 per 1-lamp fixture$30 per 2-lamp or more fixture
$7 per lamp replaced
$15 per fixture (1-4 lamps retrofits)
HID, T-12, IncandescentHID, T-12, IncandescentHID, T-12, Incandescent
HID onlyHID onlyHID onlyT-12 only T-12 only
≥ 1000 Watts400-999 Watt250-399 Watt175-249 Watt100-174 Watt
75-99 Watt <250 Watt<250 Watt
T-5, T-8T-5, T-8T-5, T-8T-5, T-8T-5, T-8T-5, T-8
T-5, T-8 (1 & 2 lamp)T-5, T-8 (3 & 4 lamp)
$284$100$50$43$30$16$25$30
type of old Fixture wattage of old Fixture type of new Fixture incentive Per Fixture Removed
For retrofit of t-8 fixtures by permanent delamping & new reflectors are available only for fixtures with a total $20 per fixture Harmonic distortion of ≤20%. electronic ballast replacement required for all eligible delamped fixtures.
new construction & complete Renovation Performance based onlyled exit Signs (new fixtures only): For existing facilities with connected load <75 kw $20 per fixture
For existing facilities with connected load ≥ 75 kw $10 per fixture
Pulse Start metal Halide (for fixtures ≥ 150 watts) $25 per fixture (includes parking lot lighting)
Parking lot low bay - led $43 per fixture
t-12 to t-8 fixtures by permanent delamping & new reflectors. electronic ballast replacement is necessary for all eligible delamped fixtures. $30 per fixture
Retrofit of existing 32 watt t-8 system to Reduced wattage (28w/25w 4') $10 per fixture (1-4 lamps)
led Refrigerated/Freezer case lighting: incentive for replacement of fluorescent lighting systems $42 per 5' led Fixturein medium or low temperature display cases $65 per 6' led Fixture
induction lighting Fixtures
Retrofit of Hid $50 per Hid (≥100w) fixture retrofitted with induction lamp, power coupler and generator. Replacement unit must use 30% less wattage per fixture than existing Hid system .Replacement of Hid $70 per Hid (≥100w) fixture with a new induction fixture

Program Terms and Conditions
definitions:
design incentives – Incentives that may be offered to design professionals by the Program.
design Services – Services that may be offered to design professionals under the Program.
energy-efficient measures – Any device eligible to receive a Program Incentive payment through the NJ Clean Energy Commercial and Industrial Program (New Jersey SmartStart Buildings).
new Jersey Utilities – The regulated electric and/or gas utilities in the State of New Jersey. They are: Atlantic City Electric, Jersey Central Power & Light, Rockland Electric Company, New Jersey Natural Gas, Elizabethtown Gas, PSE&G, and South Jersey Gas.
Administrator – New Jersey Board of Public Utilities, Office of Clean Energy
Participating customers – Those non-residential electric and/or gas service customers of the New Jersey Utilities who participate in this Program.
Product installation or equipment installation – Installation of the Energy-Efficient Measures.
market manager – TRC Energy Services.
Program – The Commercial and Industrial Energy-Efficient Construction Program (New Jersey SmartStart Buildings) offered herein by the New Jersey Board of Public Utilities, Office of Clean Energy pursuant to state regulatory approval under the New Jersey Electric Discount and Energy Competition Act, NJSA 48:3-49, et seq.
Program incentives – Refers to the amount or level of incentive that the Program provides to Participating Customers pursuant to the Program offered herein (see description under “Incentive Amount” heading).
Program offer – Program Incentives are available to non-residential retail electric and/or gas service customers of the New Jersey Utilities identified above. Program Incentives for new construction are available only for projects in areas designated for growth in the State Plan. Public school (K-12) new construction projects are exempted from this restriction and are eligible for new Program incentives throughout the State. Customers, or their trade allies, can determine if a location is in a designated growth area by referring to the Smart Growth Locator available from the HMFA website or contact the Market Manager if you are uncertain about project eligibility.
Application and eligibility Process – The Program pays incentives after the installation of qualified energy efficient measures that were pre-approved (for exceptions to this condition, please refer to “Exceptions for Approval”.) In order to be eligible for Program Incentives, a Customer, or an agent (contractor/vendor) authorized by a Customer, must submit a properly completed application package. The package must include an application signed by the customer; a complete (current) utility bill; and technology worksheet and manufacturer’s cut sheets (where appropriate). This information must be submitted to the Market Manager before equipment is installed. Applications for measures that are self installed by customers must be submitted by the customer and not the sales vendor of the measure, however, the customer may elect to assign payment of the incentive to the sales vendor. This application package must be received by the Market Manager on or before December 31, 2010 in order to be eligible for 2010 incentives. The Market Manager will review the application package to determine if the project is eligible for a Program Incentive. If eligible, the Customer will receive an approval letter with the estimated authorized incentive amount and the date by which the equipment must be installed in order for the approval to remain in effect. Upon receipt of an approval letter, the Customer may then proceed to install the equipment listed on the approved application. Equipment installed prior to the date of the Market Manager’s approval letter is not eligible for an incentive. The Market Manager reserves the right to conduct a pre-inspection of the facility prior to the installation of equipment. This will be done prior to the issuance of the approval letter. All equipment must be purchased within 12 months of date of application. Any customer and/or agent who purchases equipment prior to the receipt of an incentive approval letter does so at his/her own risk.
exceptions for Approval – The Application and Eligibility Process pertains to all projects except for those involving either Unitary HVAC or Motors having an incentive amount less than $5,000. These measures, at this incentive level, may be installed without prior approval. In addition, but at the sole discretion of the Market Manager, emergency replacement of equipment may not require a prior approval determination and letter. in such cases, please notify the market manager of such emergencies as early as possible, that an application will soon be sent in that was not pre-approved.
Post installation Approval – After installation is completed, the Customer, or an agent authorized by the Customer, must finalize and submit an invoice for the purchase of the equipment (material cost must be broken out from labor costs), and any other required documentation as specified on the equipment application or in the Market Manager’s initial approval letter.
NJ SmartStart Buildings®

Please refer to the Program Guide on the NJCleanEnergy.com/ssb website for the complete Application and Eligibility Process.
The Market Manager reserves the right to verify sales transactions and to have reasonable access to Participating Customer’s facility to inspect both pre-existing product or equipment (if applicable) and the Energy-Efficient Measures installed under this Program, either prior to issuing incentives or at a later time.
Energy-Efficient Measures must be installed in buildings located within a New Jersey Utilities’ service territory and designated on the Participating Customer’s incentive application. Program Incentives are available for qualified Energy-Efficient Measures as listed and described in the Program materials and incentive applications. The Participating Customer must ultimately own the equipment, either through an up-front purchase or at the end of a short-term lease. Design Incentives are available to design professionals as described in the Program materials and applications. A different and separate agreement must be executed by participating design professionals to be eligible for this type of incentive. The design professional does not need to be based in New Jersey.
Equipment procured by Participating Customers through another program offered by New Jersey's Clean Energy Program or the New Jersey Utilities, as applicable, is not eligible for incentives through this program. Customers who have not contributed to the Societal Benefits Charge of the applicable New Jersey Utility are not be eligible for incentives offered through this program.
incentive Amount – Program Incentives will equal either: a) the approved Program Incentive amount, or b) the actual equipment cost of the Energy-Efficient Measure, whichever is less, as determined by the Market Manager. Products offered at no direct cost to the customer are ineligible. Incomplete application submissions, applications requiring inspections and unanticipated high volume of activities may cause processing delays. Program Incentives are limited to $500,000 per utility account in a calendar year. Contact the Market Manager regarding any questions.
tax liability – The Market Manager will not be responsible for any tax liability that may be imposed on any Participating Customer as a result of the payment of Program Incentives. All Participating Customers must supply their Federal Tax Identification number or social security number to the Market Manager on the application form in order to receive a Program Incentive. In addition, Participating Customers must also provide a Tax Clearance Form (Business Assistance or Incentive Clearance Certificate) that is dated within 90 days of equipment installation.
endorsement – The Market Manager and Administrator do not endorse, support or recommend any particular manufacturer, product or system design in promoting this Program.
warranties – THE MARKET MANAGER AND ADMINISTRATOR DO NOT WARRANT THE PERFORMANCE OF INSTALLED EQUIPMENT, AND/OR SERVICES RENDERED AS PART OF THIS PROGRAM, EITHER EXPRESSLY OR IMPLICITLY. NO WARRANTIES OR REPRESENTATIONS OF ANY KIND, WHETHER STATUTORY, EXPRESSED, OR IMPLIED, INCLUDING, WITHOUT LIMITATIONS, WARRANTIES OF MERCHANTABILITY OR FITNESS FOR A PARTICULAR PURPOSE REGARDING EQUIPMENT OR SERVICES PROVIDED BY A MANUFACTURER OR VENDOR. CONTACT YOUR VENDOR/SERVICES PROVIDER FOR DETAILS REGARDING PERFORMANCE AND WARRANTIES.
limitation of liability – By virtue of participating in this Program, Participating Customers agree to waive any and all claims or damages against the Market Manager or the Administrator, except the receipt of the Program Incentive. Participating Customers agree that the Market Manager’s and Administrator’s liability, in connection with this Program, is limited to paying the Program Incentive specified. Under no circumstances shall the Market Manager, its representatives, or subcontractors, or the Administrator, be liable for any lost profits, special, punitive, consequential or incidental damages or for any other damages or claims connected with or resulting from participation in this Program. Further, any liability attributed to the Market Manager under this Program shall be individual, and not joint and/or several.
Assignment – The Participating Customer may assign Program Incentive payments to a specified vendor.
Participating customer’s certification – Participating Customer certifies that he/she purchased and installed the equipment listed in their application at their defined New Jersey location. Participating Customer agrees that all information is true and that he/she has conformed to all of the Program and equipment requirements listed in the application.
termination – The New Jersey Board of Public Utilities reserves the right to extend, modify (this includes modification of Program Incentive levels) or terminate this Program without prior or further notice.
Acknowledgement – I have read, understood and am in compliance with all rules and regulations concerning this incentive program. I certify that all information provided is correct to the best of my knowledge, and I give the Market Manager permission to share my records with the New Jersey Board of Public Utilities, and contractors it selects to manage, coordinate or evaluate the NJ SmartStart Buildings Program. Additionally, I allow reasonable access to my property to inspect the installation and performance of the technologies and installations that are eligible for incentives under the guidelines of New Jersey’s Clean Energy Program.

2010 Lighting Controls Application
Lighting Control Incentive
$__________ Total Incentive (per attached worksheet calculations)
Note: Lighting Controls Incentive Worksheet must accompany this application.
001-01/10
Customer InformationCompany ElectricUtilityServingApplicant ElectricAccountNo. InstallationDate
FacilityAddress City State Zip
TypeofProject SizeofBuilding
❑ NewConstruction ❑ Renovation ❑ EquipmentReplacement
CompanyMailingAddress City State Zip
ContactPerson(Name/Title) TelephoneNo. FaxNo. () ()
Incorporated?❑ Yes❑ No❑ Exempt FederalTaxID#orSSN EmailAddress
IncentivePaymentto Pleaseassignpaymenttocontractor/vendor/otherindicatedbelow
❑ Customer❑ Contractor❑ Other CustomerSignature
Payee Information (must submit W-9 form with application)
Contractor/Vendor Information (if different from Payee)
Company ContactName Incorporated? FederalTaxID# YesNoStreetAddress City StateZipTelephoneNo. FaxNo. () ()
Company ContactName Incorporated? FederalTaxID# ❑ Yes❑ NoStreetAddress City StateZipTelephoneNo. FaxNo. () ()
EmailAddress
EmailAddress
Building Type (circle one)Education-PrimarySchool;Education-CommunityCollege;Education-University;Grocery;Medical-Hospital;Medical-Clinic;LodgingHotel(GuestRooms);LodgingMotel;Manufacturing-LightIndustrial;Office-Large;Office-Small;Restaurant-SitDown;Restaurant-FastFood;Retail-3StoryLarge;Retail-SingleStoryLarge;Retail-Small;StorageConditioned;StorageUnconditioned;Warehouse;Other

Specific Program Requirements* (These requirements are in addition to the Program Terms and Conditions.)
Visit our web site: www.NJCleanEnergy.com
1.PleaserefertotheProgramGuideforadditionalapplicabletechnicalrequirements,includingspecialrequirementsforlightingcontrols.
2.Includethemanufacturer’sspecificationsheetwiththeapplicationpackageandmailorfaxdirectlytotheCommercial/IndustrialMarketManager.
3.AlllightingcontrolseligibleforincentivesmustbeULlisted.4.Lightingcontrolincentivesareonlyavailableforcontrolofeligible
energyefficientlightingfixtures.5.Ifmorethanoneeligiblelightingcontroldeviceisassociatedwith
thesameeligiblefixture,theincentivepaidwillbeforthelightingcontroldevicethatyieldsthelargestincentiveonly.
6.OccupancySensorControls(existingfacilitiesonly): ■Thereisnoincentiveavailableforoccupancysensorsinstalledina
spacewheretheyareprohibitedbystateorlocalbuildingorsafetycode.Additionally,noincentiveiseligibleforoccupancysensorsinthefollowingspecificspacesinallcases:stairways,restrooms(remotemountedonlyallowed),elevators,corridors/hallways,lobbies,andclosets/storageareas.
■Incentiveswillonlybepaidforeligibleoccupancysensors(OSW&OSR)controllingatleast2eligiblelightingfixturesand,forOSRinstallations,aminimumtotalconnectedloadof180watts.
■IncentiveswillonlybepaidforeligibleOSRHoccupancysensorscontrollingeligiblefixtureswhenthecontrolledwattageisgreaterthan180watts.
■Occupancysensorswithmanualoverridetothe“ON”positionareineligibleforincentive.
7.High-LowControls(OHLFandOHLH): ■Incentiveswillnotbepaidforhigh-lowcontrolsoneligible
fluorescentfixtureswheredaylightdimmingcontrolscanbeeffectivelyemployed.
■Incentiveswillnotbepaidforspacessmallerthan250squarefeet. ■Incentivesavailableonlywhen“lowlevel”isnomorethan60%of
“highlevel.” ■Incentivesarenotavailableforthefollowingspaces:stairways,
elevators,corridors/hallways,orlobbies. ■OHLFwillcontrolfixturesthathaveaballastfactorlessthan1.0forT-5sand1.14forT-8s. ■OHLHwillcontrolfixturesthathaveaballastfactorgreaterthan orequalto1.0forT-5sand1.14forT-8s.8.DaylightDimmingControlsforeligiblefixtures: ■Incentiveswillonlybepaidforeligibledaylightdimmingcontrols
operatingatleast4eligibleballastswithaminimumtotalconnectedloadof240watts.
■ Dimmingshallbecontinuousorsteppedat4ormorelevels. ■Incentiveswillbepaidonlyforeligibledaylightdimmingcontrol
systemsdesignedinaccordancewithIESNApracticeasdelineatedin“RP-5-99,IESNARecommendedPracticeofDaylighting.”
■ DLDwillcontrolfixturesthathaveaballastfactorlessthan1.0forT-5sand1.14forT-8s.
■ DDHwillcontrolfixturesthathaveaballastfactorgreaterthanorequalto1.0forT-5sand1.14forT-8s.
NewJerseySmartStartBuildings®isaregisteredtrademark.UseofthemarkwithoutthepermissionoftheNewJerseyBoardofPublicUtilities,OfficeofCleanEnergyisprohibited.*Incentives/Requirementssubjecttochange.
Acknowledgement
cUStomeR'S SignAtURe___________________________________________________________________________
Bysigning,IcertifythatIhaveread,understandandagreetotheSpecificProgramRequirements/TermsandConditionslistedonthisapplicationform,Iwillalsosubmitforapprovalaproperlycompletedapplicationpackage,whichincludesthissignedapplication,worksheet(ifapplicable),manufacturer’sspecificationsheetsandcompleteutilitybill(nameandaddressonutilitybillmustmatchnameandaddressonapplication).
Lighting Control Prescriptive Incentives*
Control Device Type Incentive per Unit
OSW–OccupancySensorWallMounted(Existingfacilitiesonly) $20percontrol
OSR–OccupancySensorRemoteMounted(Existingfacilitiesonly) $35percontrol
DLD–FluorescentDaylightDimming $25perfixturecontrolled
DLD–FluorescentDaylightDimming(OfficeApplications) $50perfixturecontrolled
OHLF–OccupancyControlledHigh-LowwithStepBallast $25perfixturecontrolled
OSRH–OccupancySensorRemoteMounted $35percontrol
OHLH–OccupancyControlledHigh-LowwithStepBallast $75perfixturecontrolled
DDH–DaylightDimming $75perfixturecontrolled
Mail or fax your application package DIRECTLy to the Commercial/Industrial Market Manager.
NewJersey'sCleanEnergyProgramc/oTRCEnergyServices
900Route9North,Suite104•Woodbridge,NJ07095Phone:866-657-6278•Fax:732-855-0422
❑ PayeeInformationisfilledoutandaW-9formofthepayeeisincluded❑ Manufacturer'sspecificationsheetsforproposedtechnologyareincluded❑ Acopy(allpages)ofarecentmonth'sutilitybillisincluded
Application Checklist (Before submitting your application, please make sure you have signed in the space below and completed the following items.)

Program Terms and Conditions
definitions:
design incentives – IncentivesthatmaybeofferedtodesignprofessionalsbytheProgram.
design Services–ServicesthatmaybeofferedtodesignprofessionalsundertheProgram.
energy-efficient measures–AnydeviceeligibletoreceiveaProgramIncentivepaymentthroughtheNJCleanEnergyCommercialandIndustrialProgram(NewJerseySmartStartBuildings).
new Jersey Utilities–Theregulatedelectricand/orgasutilitiesintheStateofNewJersey.Theyare:AtlanticCityElectric,JerseyCentralPower&Light,RocklandElectricCompany,NewJerseyNaturalGas,ElizabethtownGas,PSE&G,andSouthJerseyGas.
Administrator–NewJerseyBoardofPublicUtilities,OfficeofCleanEnergy
Participating customers–Thosenon-residentialelectricand/orgasservicecustomersoftheNewJerseyUtilitieswhoparticipateinthisProgram.
Product installation or equipment installation–InstallationoftheEnergy-EfficientMeasures.
market manager–TRCEnergyServices.
Program–TheCommercialandIndustrialEnergy-EfficientConstructionProgram(NewJerseySmartStartBuildings)offeredhereinbytheNewJerseyBoardofPublicUtilities,OfficeofCleanEnergypursuanttostateregulatoryapprovalundertheNewJerseyElectricDiscountandEnergyCompetitionAct,NJSA48:3-49,etseq.
Program incentives–ReferstotheamountorlevelofincentivethattheProgramprovidestoParticipatingCustomerspursuanttotheProgramofferedherein(seedescriptionunder“IncentiveAmount”heading).
Program offer–ProgramIncentivesareavailabletonon-residentialretailelectricand/orgasservicecustomersoftheNewJerseyUtilitiesidentifiedabove.ProgramIncentivesfornewconstructionareavailableonlyforprojectsinareasdesignatedforgrowthintheStatePlan.Publicschool(K-12)newconstructionprojectsareexemptedfromthisrestrictionandareeligiblefornewProgramincentivesthroughouttheState.Customers,ortheirtradeallies,candetermineifalocationisinadesignatedgrowthareabyreferringtotheSmartGrowthLocatoravailablefromtheHMFAwebsiteorcontacttheMarketManagerifyouareuncertainaboutprojecteligibility.
Application and eligibility Process–TheProgrampaysincentivesaftertheinstallationofqualifiedenergyefficientmeasuresthatwerepre-approved(forexceptionstothiscondition,pleasereferto“ExceptionsforApproval”.)InordertobeeligibleforProgramIncentives,aCustomer,oranagent(contractor/vendor)authorizedbyaCustomer,mustsubmitaproperlycompletedapplicationpackage.Thepackagemustincludeanapplicationsignedbythecustomer;acomplete(current)utilitybill;andtechnologyworksheetandmanufacturer’scutsheets(whereappropriate).ThisinformationmustbesubmittedtotheMarketManagerbeforeequipmentisinstalled.Applicationsformeasuresthatareselfinstalledbycustomersmustbesubmittedbythecustomerandnotthesalesvendorofthemeasure,however,thecustomermayelecttoassignpaymentoftheincentivetothesalesvendor.ThisapplicationpackagemustbereceivedbytheMarketManageronorbeforeDecember31,2010inordertobeeligiblefor2010incentives.TheMarketManagerwillreviewtheapplicationpackagetodetermineiftheprojectiseligibleforaProgramIncentive.Ifeligible,theCustomerwillreceiveanapprovalletterwiththeestimatedauthorizedincentiveamountandthedatebywhichtheequipmentmustbeinstalledinorderfortheapprovaltoremainineffect.Uponreceiptofanapprovalletter,theCustomermaythenproceedtoinstalltheequipmentlistedontheapprovedapplication.EquipmentinstalledpriortothedateoftheMarketManager’sapprovalletterisnoteligibleforanincentive.TheMarketManagerreservestherighttoconductapre-inspectionofthefacilitypriortotheinstallationofequipment.Thiswillbedonepriortotheissuanceoftheapprovalletter.Allequipmentmustbepurchasedwithin12monthsofdateofapplication.Any customer and/or agent who purchases equipment prior to the receipt of an incentive approval letter does so at his/her own risk.
exceptions for Approval–TheApplicationandEligibilityProcesspertainstoallprojectsexceptforthoseinvolvingeitherUnitaryHVACorMotorshavinganincentiveamountlessthan$5,000.Thesemeasures,atthisincentivelevel,maybeinstalledwithoutpriorapproval.Inaddition,butatthesolediscretionoftheMarketManager,emergencyreplacementofequipmentmaynotrequireapriorapprovaldeterminationandletter.in such cases, please notify the market manager of such emergencies as early as possible, that an application will soon be sent in that was not pre-approved.
Post installation Approval–Afterinstallationiscompleted,theCustomer,oranagentauthorizedbytheCustomer,mustfinalizeandsubmitaninvoiceforthepurchaseoftheequipment(materialcostmustbebrokenoutfromlaborcosts),andanyotherrequireddocumentationasspecifiedontheequipmentapplicationorintheMarketManager’sinitialapprovalletter.
NJ SmartStart Buildings®

PleaserefertotheProgramGuideontheNJCleanEnergy.com/ssbwebsiteforthecompleteApplicationandEligibilityProcess.
TheMarketManagerreservestherighttoverifysalestransactionsandtohavereasonableaccesstoParticipatingCustomer’sfacilitytoinspectbothpre-existingproductorequipment(ifapplicable)andtheEnergy-EfficientMeasuresinstalledunderthisProgram,eitherpriortoissuingincentivesoratalatertime.
Energy-EfficientMeasuresmustbeinstalledinbuildingslocatedwithinaNewJerseyUtilities’serviceterritoryanddesignatedontheParticipatingCustomer’sincentiveapplication.ProgramIncentivesareavailableforqualifiedEnergy-EfficientMeasuresaslistedanddescribedintheProgrammaterialsandincentiveapplications.TheParticipatingCustomermustultimatelyowntheequipment,eitherthroughanup-frontpurchaseorattheendofashort-termlease.DesignIncentivesareavailabletodesignprofessionalsasdescribedintheProgrammaterialsandapplications.Adifferentandseparateagreementmustbeexecutedbyparticipatingdesignprofessionalstobeeligibleforthistypeofincentive.ThedesignprofessionaldoesnotneedtobebasedinNewJersey.
Equipment procured by Participating Customers through another program offered by New Jersey's Clean Energy Program or the New Jersey Utilities, as applicable, is not eligible for incentives through this program. Customers who have not contributed to the Societal Benefits Charge of the applicable New Jersey Utility are not be eligible for incentives offered through this program.
incentive Amount–ProgramIncentiveswillequaleither:a)theapprovedProgramIncentiveamount,orb)theactualequipmentcostoftheEnergy-EfficientMeasure,whicheverisless,asdeterminedbytheMarketManager.Productsofferedatnodirectcosttothecustomerareineligible.Incompleteapplicationsubmissions,applicationsrequiringinspectionsandunanticipatedhighvolumeofactivitiesmaycauseprocessingdelays.ProgramIncentivesarelimitedto$500,000perutilityaccountinacalendaryear.ContacttheMarketManagerregardinganyquestions.
tax liability–TheMarketManagerwillnotberesponsibleforanytaxliabilitythatmaybeimposedonanyParticipatingCustomerasaresultofthepaymentofProgramIncentives.AllParticipatingCustomersmustsupplytheirFederalTaxIdentificationnumberorsocialsecuritynumbertotheMarketManagerontheapplicationforminordertoreceiveaProgramIncentive.Inaddition,ParticipatingCustomersmustalsoprovideaTaxClearanceForm(BusinessAssistanceorIncentiveClearanceCertificate)thatisdatedwithin90daysofequipmentinstallation.
endorsement–TheMarketManagerandAdministratordonotendorse,supportorrecommendanyparticularmanufacturer,productorsystemdesigninpromotingthisProgram.
warranties–THEMARKETMANAGERANDADMINISTRATORDONOTWARRANTTHEPERFORMANCEOFINSTALLEDEQUIPMENT,AND/ORSERVICESRENDEREDASPARTOFTHISPROGRAM,EITHEREXPRESSLYORIMPLICITLY.NOWARRANTIESORREPRESENTATIONSOFANYKIND,WHETHERSTATUTORY,EXPRESSED,ORIMPLIED,INCLUDING,WITHOUTLIMITATIONS,WARRANTIESOFMERCHANTABILITYORFITNESSFORAPARTICULARPURPOSEREGARDINGEQUIPMENTORSERVICESPROVIDEDBYAMANUFACTURERORVENDOR.CONTACTYOURVENDOR/SERVICESPROVIDERFORDETAILSREGARDINGPERFORMANCEANDWARRANTIES.
limitation of liability–ByvirtueofparticipatinginthisProgram,ParticipatingCustomersagreetowaiveanyandallclaimsordamagesagainsttheMarketManagerortheAdministrator,exceptthereceiptoftheProgramIncentive.ParticipatingCustomersagreethattheMarketManager’sandAdministrator’sliability,inconnectionwiththisProgram,islimitedtopayingtheProgramIncentivespecified.UndernocircumstancesshalltheMarketManager,itsrepresentatives,orsubcontractors,ortheAdministrator,beliableforanylostprofits,special,punitive,consequentialorincidentaldamagesorforanyotherdamagesorclaimsconnectedwithorresultingfromparticipationinthisProgram.Further,anyliabilityattributedtotheMarketManagerunderthisProgramshallbeindividual,andnotjointand/orseveral.
Assignment–TheParticipatingCustomermayassignProgramIncentivepaymentstoaspecifiedvendor.
Participating customer’s certification–ParticipatingCustomercertifiesthathe/shepurchasedandinstalledtheequipmentlistedintheirapplicationattheirdefinedNewJerseylocation.ParticipatingCustomeragreesthatallinformationistrueandthathe/shehasconformedtoalloftheProgramandequipmentrequirementslistedintheapplication.
termination–TheNewJerseyBoardofPublicUtilitiesreservestherighttoextend,modify(thisincludesmodificationofProgramIncentivelevels)orterminatethisProgramwithoutpriororfurthernotice.
Acknowledgement –Ihaveread,understoodandamincompliancewithallrulesandregulationsconcerningthisincentiveprogram.Icertifythatallinformationprovidediscorrecttothebestofmyknowledge,andIgivetheMarketManagerpermissiontosharemyrecordswiththeNewJerseyBoardofPublicUtilities,andcontractorsitselectstomanage,coordinateorevaluatetheNJSmartStartBuildingsProgram.Additionally,IallowreasonableaccesstomypropertytoinspecttheinstallationandperformanceofthetechnologiesandinstallationsthatareeligibleforincentivesundertheguidelinesofNewJersey’sCleanEnergyProgram.
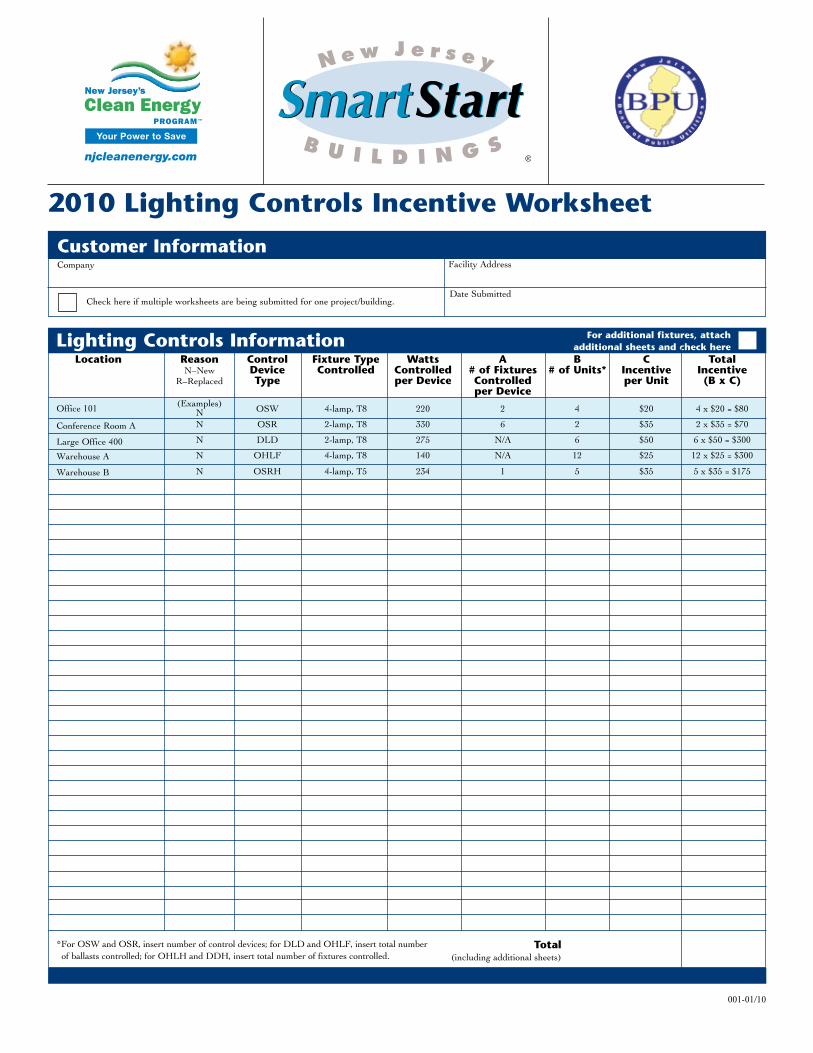
2010 Lighting Controls Incentive Worksheet
Lighting Controls Information
Total(including additional sheets)
For additional fixtures, attach additional sheets and check here
*For OSW and OSR, insert number of control devices; for DLD and OHLF, insert total number of ballasts controlled; for OHLH and DDH, insert total number of fixtures controlled.
Location Reason Control Fixture Type Watts A B C Total N–New Device Controlled Controlled # of Fixtures # of Units* Incentive Incentive R–Replaced Type per Device Controlled per Unit (B x C) per Device
(Examples)
N OSW 4-lamp, T8 220 2 4 $20 4 x $20 = $80
N OSR 2-lamp, T8 330 6 2 $35 2 x $35 = $70
N DLD 2-lamp, T8 275 N/A 6 $50 6 x $50 = $300
N OHLF 4-lamp, T8 140 N/A 12 $25 12 x $25 = $300
N OSRH 4-lamp, T5 234 1 5 $35 5 x $35 = $175
001-01/10
Customer InformationCompany
Check here if multiple worksheets are being submitted for one project/building.
Facility Address
Date Submitted
Office 101
Conference Room A
Large Office 400
Warehouse A
Warehouse B

Specific Program Requirements* (These requirements are in addition to the Program Terms and Conditions.)
Visit our web site: www.NJCleanEnergy.com
Lighting Control Prescriptive Incentives*
Control Device Type Incentive per Unit
OSW – Occupancy Sensor Wall Mounted (Existing facilities only) $20 per control
OSR – Occupancy Sensor Remote Mounted (Existing facilities only) $35 per control
DLD – Fluorescent Daylight Dimming $25 per fixture controlled
DLD – Fluorescent Daylight Dimming (Office Applications) $50 per fixture controlled
OHLF – Occupancy Controlled High-Low with Step Ballast $25 per fixture controlled
OSRH – Occupancy Sensor Remote Mounted $35 per control
OHLH – Occupancy Controlled High-Low with Step Ballast $75 per fixture controlled
DDH – Daylight Dimming $75 per fixture controlled
1. Please refer to the Program Guide for additional applicable technical requirements, including special requirements for lighting controls.
2. Include the manufacturer’s specification sheet with the application package and mail or fax directly to the Commercial/Industrial Market Manager.
3. All lighting controls eligible for incentives must be UL listed.4. Lighting control incentives are only available for control of eligible
energy efficient lighting fixtures.5. If more than one eligible lighting control device is associated with
the same eligible fixture, the incentive paid will be for the lighting control device that yields the largest incentive only.
6. Occupancy Sensor Controls (existing facilities only): ■ There is no incentive available for occupancy sensors installed in a
space where they are prohibited by state or local building or safety code. Additionally, no incentive is eligible for occupancy sensors in the following specific spaces in all cases: stairways, restrooms (remote mounted only allowed), elevators, corridors/hallways, lobbies, and closets/storage areas.
■ Incentives will only be paid for eligible occupancy sensors (OSW & OSR) controlling at least 2 eligible lighting fixtures and, for OSR installations, a minimum total connected load of 180 watts.
■ Incentives will only be paid for eligible OSRH occupancy sensors controlling eligible fixtures when the controlled wattage is greater than 180 watts.
■ Occupancy sensors with manual override to the “ON” position are ineligible for incentive.
7. High-Low Controls (OHLF and OHLH): ■ Incentives will not be paid for high-low controls on eligible
fluorescent fixtures where daylight dimming controls can be effectively employed.
■ Incentives will not be paid for spaces smaller than 250 square feet. ■ Incentives available only when “low level” is no more than 60% of
“high level.” ■ Incentives are not available for the following spaces: stairways,
elevators, corridors/hallways, or lobbies. ■ OHLF will control fixtures that have a ballast factor less than 1.0
for T-5s and 1.14 for T-8s. ■ OHLH will control fixtures that have a ballast factor greater than
or equal to 1.0 for T-5s and 1.14 for T-8s.8. Daylight Dimming Controls for Eligible Fixtures: ■ Incentives will only be paid for eligible daylight dimming controls
operating at least 4 eligible ballasts with a minimum total connected load of 240 watts.
■ Dimming shall be continuous or stepped at 4 or more levels. ■ Incentives will be paid only for eligible daylight dimming control
systems designed in accordance with IESNA practice as delineated in “RP-5-99, IESNA Recommended Practice of Daylighting.”
■ DLD will control fixtures that have a ballast factor less than 1.0 for T-5s and 1.14 for T-8s.
■ DDH will control fixtures that have a ballast factor greater than or equal to 1.0 for T-5s and 1.14 for T-8s.
New Jersey SmartStart Buildings® is a registered trademark. Use of the mark without the permission of the New Jersey Board of Public Utilities, Office of Clean Energy is prohibited. *Incentives/Requirements subject to change.
Mail or fax your application package DIRECTLy to the Commercial/Industrial Market Manager.
New Jersey's Clean Energy Programc/o TRC Energy Services
900 Route 9 North, Suite 104 • Woodbridge, NJ 07095Phone: 866-657-6278 • Fax: 732-855-0422

Program Terms and Conditions
Definitions:
Design Incentives – Incentives that may be offered to design professionals by the Program.
Design Services – Services that may be offered to design professionals under the Program.
Energy-Efficient Measures – Any device eligible to receive a Program Incentive payment through the NJ Clean Energy Commercial and Industrial Program (New Jersey SmartStart Buildings).
New Jersey Utilities – The regulated electric and/or gas utilities in the State of New Jersey. They are: Atlantic City Electric, Jersey Central Power & Light, Rockland Electric Company, New Jersey Natural Gas, Elizabethtown Gas, PSE&G, and South Jersey Gas.
Administrator – New Jersey Board of Public Utilities, Office of Clean Energy
Participating Customers – Those non-residential electric and/or gas service customers of the New Jersey Utilities who participate in this Program.
Product Installation or Equipment Installation – Installation of the Energy-Efficient Measures.
Market Manager – TRC Energy Services.
Program – The Commercial and Industrial Energy-Efficient Construction Program (New Jersey SmartStart Buildings) offered herein by the New Jersey Board of Public Utilities, Office of Clean Energy pursuant to state regulatory approval under the New Jersey Electric Discount and Energy Competition Act, NJSA 48:3-49, et seq.
Program Incentives – Refers to the amount or level of incentive that the Program provides to Participating Customers pursuant to the Program offered herein (see description under “Incentive Amount” heading).
Program Offer – Program Incentives are available to non-residential retail electric and/or gas service customers of the New Jersey Utilities identified above. Program Incentives for new construction are available only for projects in areas designated for growth in the State Plan. Public school (K-12) new construction projects are exempted from this restriction and are eligible for new Program incentives throughout the State. Customers, or their trade allies, can determine if a location is in a designated growth area by referring to the Smart Growth Locator available from the HMFA website or contact the Market Manager if you are uncertain about project eligibility.
Application and Eligibility Process – The Program pays incentives after the installation of qualified energy efficient measures that were pre-approved (for exceptions to this condition, please refer to “Exceptions for Approval”.) In order to be eligible for Program Incentives, a Customer, or an agent (contractor/vendor) authorized by a Customer, must submit a properly completed application package. The package must include an application signed by the customer; a complete (current) utility bill; and technology worksheet and manufacturer’s cut sheets (where appropriate). This information must be submitted to the Market Manager before equipment is installed. Applications for measures that are self installed by customers must be submitted by the customer and not the sales vendor of the measure, however, the customer may elect to assign payment of the incentive to the sales vendor. This application package must be received by the Market Manager on or before December 31, 2010 in order to be eligible for 2010 incentives. The Market Manager will review the application package to determine if the project is eligible for a Program Incentive. If eligible, the Customer will receive an approval letter with the estimated authorized incentive amount and the date by which the equipment must be installed in order for the approval to remain in effect. Upon receipt of an approval letter, the Customer may then proceed to install the equipment listed on the approved application. Equipment installed prior to the date of the Market Manager’s approval letter is not eligible for an incentive. The Market Manager reserves the right to conduct a pre-inspection of the facility prior to the installation of equipment. This will be done prior to the issuance of the approval letter. All equipment must be purchased within 12 months of date of application. Any Customer and/or agent who purchases equipment prior to the receipt of an incentive approval letter does so at his/her own risk.
Exceptions for Approval – The Application and Eligibility Process pertains to all projects except for those involving either Unitary HVAC or Motors having an incentive amount less than $5,000. These measures, at this incentive level, may be installed without prior approval. In addition, but at the sole discretion of the Market Manager, emergency replacement of equipment may not require a prior approval determination and letter. In such cases, please notify the Market Manager of such emergencies as early as possible, that an application will soon be sent in that was not pre-approved.
Post Installation Approval – After installation is completed, the Customer, or an agent authorized by the Customer, must finalize and submit an invoice for the purchase of the equipment (material cost must be broken out from labor costs), and any other required documentation as specified on the equipment application or in the Market Manager’s initial approval letter.
NJ SmartStart Buildings®

Please refer to the Program Guide on the NJCleanEnergy.com/ssb website for the complete Application and Eligibility Process.
The Market Manager reserves the right to verify sales transactions and to have reasonable access to Participating Customer’s facility to inspect both pre-existing product or equipment (if applicable) and the Energy-Efficient Measures installed under this Program, either prior to issuing incentives or at a later time.
Energy-Efficient Measures must be installed in buildings located within a New Jersey Utilities’ service territory and designated on the Participating Customer’s incentive application. Program Incentives are available for qualified Energy-Efficient Measures as listed and described in the Program materials and incentive applications. The Participating Customer must ultimately own the equipment, either through an up-front purchase or at the end of a short-term lease. Design Incentives are available to design professionals as described in the Program materials and applications. A different and separate agreement must be executed by participating design professionals to be eligible for this type of incentive. The design professional does not need to be based in New Jersey.
Equipment procured by Participating Customers through another program offered by New Jersey's Clean Energy Program or the New Jersey Utilities, as applicable, is not eligible for incentives through this program. Customers who have not contributed to the Societal Benefits Charge of the applicable New Jersey Utility are not be eligible for incentives offered through this program.
Incentive Amount – Program Incentives will equal either: a) the approved Program Incentive amount, or b) the actual equipment cost of the Energy-Efficient Measure, whichever is less, as determined by the Market Manager. Products offered at no direct cost to the customer are ineligible. Incomplete application submissions, applications requiring inspections and unanticipated high volume of activities may cause processing delays. Program Incentives are limited to $500,000 per utility account in a calendar year. Contact the Market Manager regarding any questions.
Tax Liability – The Market Manager will not be responsible for any tax liability that may be imposed on any Participating Customer as a result of the payment of Program Incentives. All Participating Customers must supply their Federal Tax Identification number or social security number to the Market Manager on the application form in order to receive a Program Incentive. In addition, Participating Customers must also provide a Tax Clearance Form (Business Assistance or Incentive Clearance Certificate) that is dated within 90 days of equipment installation.
Endorsement – The Market Manager and Administrator do not endorse, support or recommend any particular manufacturer, product or system design in promoting this Program.
Warranties – THE MARKET MANAGER AND ADMINISTRATOR DO NOT WARRANT THE PERFORMANCE OF INSTALLED EQUIPMENT, AND/OR SERVICES RENDERED AS PART OF THIS PROGRAM, EITHER EXPRESSLY OR IMPLICITLY. NO WARRANTIES OR REPRESENTATIONS OF ANY KIND, WHETHER STATUTORY, EXPRESSED, OR IMPLIED, INCLUDING, WITHOUT LIMITATIONS, WARRANTIES OF MERCHANTABILITY OR FITNESS FOR A PARTICULAR PURPOSE REGARDING EQUIPMENT OR SERVICES PROVIDED BY A MANUFACTURER OR VENDOR. CONTACT YOUR VENDOR/SERVICES PROVIDER FOR DETAILS REGARDING PERFORMANCE AND WARRANTIES.
Limitation of Liability – By virtue of participating in this Program, Participating Customers agree to waive any and all claims or damages against the Market Manager or the Administrator, except the receipt of the Program Incentive. Participating Customers agree that the Market Manager’s and Administrator’s liability, in connection with this Program, is limited to paying the Program Incentive specified. Under no circumstances shall the Market Manager, its representatives, or subcontractors, or the Administrator, be liable for any lost profits, special, punitive, consequential or incidental damages or for any other damages or claims connected with or resulting from participation in this Program. Further, any liability attributed to the Market Manager under this Program shall be individual, and not joint and/or several.
Assignment – The Participating Customer may assign Program Incentive payments to a specified vendor.
Participating Customer’s Certification – Participating Customer certifies that he/she purchased and installed the equipment listed in their application at their defined New Jersey location. Participating Customer agrees that all information is true and that he/she has conformed to all of the Program and equipment requirements listed in the application.
Termination – The New Jersey Board of Public Utilities reserves the right to extend, modify (this includes modification of Program Incentive levels) or terminate this Program without prior or further notice.
Acknowledgement – I have read, understood and am in compliance with all rules and regulations concerning this incentive program. I certify that all information provided is correct to the best of my knowledge, and I give the Market Manager permission to share my records with the New Jersey Board of Public Utilities, and contractors it selects to manage, coordinate or evaluate the NJ SmartStart Buildings Program. Additionally, I allow reasonable access to my property to inspect the installation and performance of the technologies and installations that are eligible for incentives under the guidelines of New Jersey’s Clean Energy Program.

New Jersey Clean Energy Program Technical Worksheet – Solar Electric Equipment Information
Please carefully read all of the following information. With the help of your Installation Contractor, fully complete Sections A through D, as applicable, of the attached Technical Worksheet for Solar Electric Equipment, as well as the New Jersey Clean Energy Program Rebate Application Form.
Rebates will be processed based on the date the New Jersey Clean Energy Program (NJCEP) approves the Final Application Form, not on the purchase date of the equipment. Program procedures and rebates are subject to change or cancellation without notice. To qualify for a rebate, Applicant must comply with all Program Eligibility Requirements, Terms and Conditions, and Installation Requirements, and submit a completed Pre-Installation Application Form. For more information about the New Jersey Clean Energy Program, or for assistance in completing applications or forms, please see www.njcleanenergy.com or call 866-NJSMART
Equipment installation must meet the following minimum requirements in order to qualify for payment under the provisions of the New Jersey Clean Energy Program; proposed changes to the requirements will be considered, but they must be documented by the Applicant or Installation Contractor and approved by the NJCEP. These requirements are not all-encompassing and are intended only to address certain minimum safety and efficiency standards.
1. The installation must comply with the provisions of the National Electrical Code and all other applicable local, state and federal codes or practices. 2. All required permits must be properly obtained and posted. 3. The NJCEP Inspection must be performed before the local Building Code Enforcement Office. If not, this may delay the processing of the rebate 4. All required inspections must be performed (i.e., Electrical/NEC, Local Building Codes Enforcement Office, etc.). Note: In order to ensure compliance with provisions of the NEC, an inspection by a state-licensed electrical inspector is mandatory.
1. Modules must be UL Listed and must be properly installed according to manufacturer’s instructions. 2. The maximum amount of sunlight available year-round on a daily basis should not be obstructed. All applications must include documentation of the impact from any obstruction on the annual performance of the solar electric array. This analysis can be performed by using the New Jersey Clean Power Estimator on the program website www.njcep.com. 3. In order to qualify for program incentives, the solar electric system must adhere to a minimum design threshold, relative to the estimated system production using PVWATTS:
• Solar electric array orientations require that the calculated system output must be at least 80% of the default output calculated by PVWatts. Additionally, all individual series strings of modules output must be at least 70% of the default output calculated by PVWatts. • For building integrated solar electric systems (i.e., part of the building envelope materials are comprised of solar electric components), the estimated system output must be 40% of the default output estimated by PVWATTS.
4. System wiring must be installed in accordance with the provisions of the NEC. 5. All modules installed in a series string must be installed in the same plane.
1. The inverter and controls must be properly installed according to manufacturer’s instructions. 2. The inverter must be certified as compliant with the requirements of IEEE 929 for small photovoltaic systems and with UL 1741. 3. The system should be equipped with the following visual indicators and/or controls:
• On/off switch • Operating mode setting indicator • AC/DC over current protection • Operating status indicator 4. Warning labels must be posted on the control panels and junction boxes indicating that the circuits are energized by an alternate power source independent of utility-provided power. 5. Operating instructions must be posted on or near the system, or on file with facilities operation and maintenance documents. 6. Systems must have monitoring capability that is readily accessible to the owner. This monitor (meter or display) must at minimum display instantaneous and cumulative production. All projects greater than 10kW must have an output meter that meets ANSI C.12 standards
1. Areas where wiring passes through ceilings, walls or other areas of the building must be properly restored, booted and sealed. 2. All interconnecting wires must be copper. (Some provisions may be made for aluminum wiring; approval must be received from utility engineering departments prior to acceptance.) 3. Thermal insulation in areas where wiring is installed must be replaced to “as found or better condition.” Access doors to these areas must be properly sealed and gasketed. 4. Wiring connections must be properly made, insulated and weather-protected. 5. All wiring must be attached to the system components by the use of strain relief’s or cable clamps, unless enclosed in conduit. 6. All outside wiring must be rated for wet conditions and/or encased in liquid-tight conduit. 7. Insulation on any wiring located in areas with potential high ambient temperature must be rated at 90° C or higher. 8. All wiring splices must be contained in UL-approved workboxes.
1. The batteries must be installed according to the manufacturer’s instructions. 2. Battery terminals must be adequately protected from accidental contact. 3. DC-rated over current protection must be provided in accordance with the provisions of the NEC.
Revised January 2009
GENERAL TERMS AND CONDITIONS
INSTALLATION REQUIREMENTS
A: Code Requirements
B: Solar Electric Module Array
C: Inverter and Controls
D: Control Panel to Solar Electric Array Wire Runs
E: Batteries (If Applicable)

New Jersey Clean Energy Program Technical Worksheet – Solar Electric Equipment Information
Original Application Date: _________________ Revised Application Date: ______________________ Customer Name: _______________________________ Application Number: _________________ (Corresponding to Rebate Application Form) (Assigned by the NJBPU) A: EQUIPMENT INFORMATION 1. Solar Electric Module Manufacturer: ________________________ Module Model Number: _____________________________ 2. Power Rating per Module: ________ DC Watts (Refer to STC conditions) Number of Modules: _____________________________ 3. Total Array Output: _______ _ DC Watts (No. of Modules x Power Rating) 4. Inverter Manufacturer: __________________________________ Inverter Model Number: _____________________ 5. Inverter’s Continuous AC Rating: _________________________ AC Watts Number of Inverters: _____________________ 6. Total Inverter Output: ________ AC Watts (Inverter Continuous AC Rating x Number of Inverters) 7. Inverter’s Peak Efficiency: ______ _ _ (Refer to manufacturer’s peak efficiency rating)
1. Solar Electric Array Location: _ Rooftop _ Pole Mount or Ground Mount Location: 2. Solar Electric Module Orientation: __________ degrees (e.g., 180 degrees magnetic south)
Note: in Central New Jersey, magnetic south compass reading is 10 degrees east of true south. 3. Solar Electric Module Tilt: ___________ degrees (e.g., flat mount = 0 degrees; vertical mount = 90 degrees) 4. Solar Electric Module Tracking: _Fixed _Single-axis _Double-axis 5. Inverter Location: _ Indoor _ Outdoor Location: _________________________________________________________________ 6. Utility-Accessible AC Disconnect Switch Location: ________________________________________________________________ 7. System Type and Mode of Operation:
_ Utility interactive (parallel/capable of back feeding the meter) (_ with battery backup) _ Dedicated circuit, utility power as backup (transfer switch) (_ with battery charging) _ Stand-alone (system confined to an independent circuit, no utility backup) (_ with battery charging)
1. System rated output (Section A, line 3 above): ____________ DC Watts 2. Incentive Calculation (Calculate appropriate incentive based on System Rated Output):
Residential Applicants that perform Energy Efficiency Audit a. 0 to 10,000 Watts x $1.75/Watt = $___________________+
Commercial, Farm, Public and Non-Profit 0 to 50,000 Watts x $1.00/Watt = $_____________________+
Residential Applicants that do not perform Energy Efficiency Audit b. 0 to 10,000 Watts x $1.55/Watt = $___________________+
Large PV Project Applications > 50,000 Watts = $____Not eligible for rebates____________
d. Total Rebate Calculation: $__________________________
Total Rebate Calculation: $____________________________
3. School Applicants: Maximum Annual School Rebate: $________________ (For Public School applicants, enter the lesser value from no. 6 on the School Application form or $50,000) 4. Total Installed System Cost: $_____________________________
(Eligible installed system cost includes all equipment, installation, and applicable interconnection costs before the New Jersey Clean Energy Program incentive.)
5. Requested Incentive (Enter the appropriate value from C2. b or c): $___________________________________
1. Module: _____ Years at _____ Percent of Rated Power Output 2. Inverter:_____ Years 3. Installation: _____ Years Revised January 2009
B: PROPOSED INSTALLATION/INTERCONNECTION INFORMATION
C: INCENTIVE REQUEST CALCULATION
D: WARRANTY INFORMATION

01-05/09
Incentive #1: Energy Reduction Plan
Incentive #2: Installation of Recommended Measures
Incentive #3: Post-Construction Benchmarking Report
Advanced Measure Incentive: Combined Heat and Power
Incentive Amount: ......................................$0.10 per sq ftMinimum Incentive: ...................................$5,000
Maximum Incentive:: .................................$50,000 or 50% of facility annual energy cost
This incentive will be developed to offset the cost of services associated with the development of the Energy Reduction Plan. Projects must identify efficiency improvements that meet the minimum performance level in order to become eligible for Incentive #1. Incentive amount will be based on the square footage ofthe building.
Electric IncentivesBase Incentive based on 15% savings: ......$0.11 per projected kWh savedFor each % over 15% add: .........................$0.005 per projected kWh savedMaximum Incentive: ..................................$0.13 per projected kWh saved
Gas IncentivesBase Incentive base on 15% savings: ........$1.10 per projected Therm savedFor each % over 15% add: .........................$0.05 per projected Therm savedMaximum Incentive: ..................................$1.45 per projected Therm saved
This incentive will be based on projected energy savings and designed to pay approximately 60% of the total performance-based incentive. Savings projections will be calculated using calibrated energy simulation and rounded to the nearest percent. Incentive #2 may not exceed 30% of the total project cost.
Level 1:Fuel cells not fueled by Class I renewable fuel ...................................................$4.00........................................................................................................... 60%
Level 2:Microturbines .......................................................................................................$1.00........................................................................................................... 30%(1)
Internal Combustion EnginesCombustion Turbines
Level 3:Heat Recovery or other Mechanical Recovery from Existing Equipment ......................................$0.50........................................................................................................... 30%
(1) The maximum % of project cost will go to 40% where a cooling application is used or included with the CHP system.Note: Incentives for renewable fueled projects (Class 1) are currently being developed. This document will be updated when the incentive levels are finalized.
Electric IncentivesBase Incentive based on 15% savings: ......$0.07 per projected kWh savedFor each % over 15% add: .........................$0.005 per projected kWh savedMaximum Incentive: ..................................$0.09 per projected kWh saved
Gas IncentivesBase Incentive base on 15% savings: ........$0.70 per projected Therm savedFor each % over 15% add: .........................$0.05 per projected Therm savedMaximum Incentive: ..................................$1.05 per projected Therm saved
This incentive will be released upon submittal of a Post-Construction Benchmarking Report that verifies that the level of savings actually achieved by the installed measures meets or exceeds the minimum performance threshold. To validate the savings and achievement of the Energy Target, the EPA Portfolio Manager shall be used. Savings should be rounded to the nearest percent. Total value of Incentive #2 and Incentive #3 may not exceed 50% of the total project cost. This incen-tive will "true up" proposed savings and the related payment for Incentive #2 so that the total incentive is based on actual savings. For buildings not covered by EPA, the process used by LEED EB shall be followed.
EligibleTechnology
Incentive (per Watt)Max: $1 Million
Maximum %of Project Cost
Incentive Cap: .................................... 30% of total project cost
Minimum Performance Target: ...........................15%
Minimum Performance Target: ...........................15%
Incentive Cap: .................................... 20% of total project cost
Incentive Structure for NJ Pay For Performance Program

APPENDIX G
FACILITY DATA FORMS

Page 1 of 2 Local Government Energy Audit ProgramFebruary 17, 2009
APPENDIX C - FACILITY DATA FORMComplete one Facility Data Form for each building. If you are seeking to energy audit multiple buildings,
complete one Facility Data Form for each.
FACILITY INFORMATIONPlease complete the information below for this specific facility that is seeking enrollment in the Program.
Facility Name
Street Address County
City State Zip
Facility’s Description
Total Sq Ft Year Built Hours/Week Occupied Number of Employees
Building Type (Check only one of the following):
Emergency Services Garage
Center/Meeting Hall/Library Offices
Recreation/Entertainment/Parks Religious
School School: College
Water Treatment/Pumping Other: _______________________________
ENERGY DATAPlease complete the energy information below for the most recent 12 month period available. In order togain a complete picture of the facility’s energy use, be sure to include all types of energy used by thefacility. Do not include vehicle fuel.
The Data Below is for the 12 Month Period: ____/____/______ to ____/____/______
Public Library
49 Park Ave
Westwood NJ 07675
16,000 1939 50 7
✘ ✘

Page 2 of 2 Local Government Energy Audit ProgramFebruary 17, 2009
ELECTRICITYElectric Utility Name & Account Number(s)
Annual kWh Use Annual Electricity Cost
Max Summer kW Max Winter kW
NATURAL GASNatural Gas Utility Name & Account Number(s)
Annual Use in Therms Annual Natural Gas Cost
FUEL OILFuel Oil Utility Name & Account Number(s)
Annual Use in Gallons Annual Fuel Oil Cost
PROPANEPropane Utility Name & Account Number(s)
Annual Use in Gallons Annual Propane Cost
OTHERIn this section please indicate any other fuel type that the facility uses, such as: solar energy, windenergy, bio-fuel, cogeneration, fuel cells.
Other Fuel Type:
Annual Energy Use (indicate units) Annual Energy Cost
STAFF USE ONLYDate Received: _______________ Project No.: _____________________
PSE&G, Account # 41 775 310 06
PSE&G, Account # 41 775 310 06
5,474 $6,284.11
126,090 $23,432.20
61.8 37.5

Page 1 of 2 Local Government Energy Audit ProgramFebruary 17, 2009
APPENDIX C - FACILITY DATA FORMComplete one Facility Data Form for each building. If you are seeking to energy audit multiple buildings,
complete one Facility Data Form for each.
FACILITY INFORMATIONPlease complete the information below for this specific facility that is seeking enrollment in the Program.
Facility Name
Street Address County
City State Zip
Facility’s Description
Total Sq Ft Year Built Hours/Week Occupied Number of Employees
Building Type (Check only one of the following):
Emergency Services Garage
Center/Meeting Hall/Library Offices
Recreation/Entertainment/Parks Religious
School School: College
Water Treatment/Pumping Other: _______________________________
ENERGY DATAPlease complete the energy information below for the most recent 12 month period available. In order togain a complete picture of the facility’s energy use, be sure to include all types of energy used by thefacility. Do not include vehicle fuel.
The Data Below is for the 12 Month Period: ____/____/______ to ____/____/______
Fire Department
93 Center Ave
Westwood NJ 07675
Fire station
14,552 2004 20 1
✘ ✘
✘

Page 2 of 2 Local Government Energy Audit ProgramFebruary 17, 2009
ELECTRICITYElectric Utility Name & Account Number(s)
Annual kWh Use Annual Electricity Cost
Max Summer kW Max Winter kW
NATURAL GASNatural Gas Utility Name & Account Number(s)
Annual Use in Therms Annual Natural Gas Cost
FUEL OILFuel Oil Utility Name & Account Number(s)
Annual Use in Gallons Annual Fuel Oil Cost
PROPANEPropane Utility Name & Account Number(s)
Annual Use in Gallons Annual Propane Cost
OTHERIn this section please indicate any other fuel type that the facility uses, such as: solar energy, windenergy, bio-fuel, cogeneration, fuel cells.
Other Fuel Type:
Annual Energy Use (indicate units) Annual Energy Cost
STAFF USE ONLYDate Received: _______________ Project No.: _____________________
PSE&G, Account # 41 816 039 03
PSE&G, Account # 41 816 039 03
5,212 $7,104.07
129,900 19,971.77
52.4 38.0

Page 1 of 2 Local Government Energy Audit ProgramFebruary 17, 2009
APPENDIX C - FACILITY DATA FORMComplete one Facility Data Form for each building. If you are seeking to energy audit multiple buildings,
complete one Facility Data Form for each.
FACILITY INFORMATIONPlease complete the information below for this specific facility that is seeking enrollment in the Program.
Facility Name
Street Address County
City State Zip
Facility’s Description
Total Sq Ft Year Built Hours/Week Occupied Number of Employees
Building Type (Check only one of the following):
Emergency Services Garage
Center/Meeting Hall/Library Offices
Recreation/Entertainment/Parks Religious
School School: College
Water Treatment/Pumping Other: _______________________________
ENERGY DATAPlease complete the energy information below for the most recent 12 month period available. In order togain a complete picture of the facility’s energy use, be sure to include all types of energy used by thefacility. Do not include vehicle fuel.
The Data Below is for the 12 Month Period: ____/____/______ to ____/____/______
DPW Main Building
Sand Road
Westwood NJ 07675
Main Building for DPW
8,000 1922 168 11
✘ ✘
✘

Page 2 of 2 Local Government Energy Audit ProgramFebruary 17, 2009
ELECTRICITYElectric Utility Name & Account Number(s)
Annual kWh Use Annual Electricity Cost
Max Summer kW Max Winter kW
NATURAL GASNatural Gas Utility Name & Account Number(s)
Annual Use in Therms Annual Natural Gas Cost
FUEL OILFuel Oil Utility Name & Account Number(s)
Annual Use in Gallons Annual Fuel Oil Cost
PROPANEPropane Utility Name & Account Number(s)
Annual Use in Gallons Annual Propane Cost
OTHERIn this section please indicate any other fuel type that the facility uses, such as: solar energy, windenergy, bio-fuel, cogeneration, fuel cells.
Other Fuel Type:
Annual Energy Use (indicate units) Annual Energy Cost
STAFF USE ONLYDate Received: _______________ Project No.: _____________________
PSE&G, Account # 41 774 164 01
PSE&G, Account # 41 774 164 01
4,655 $6,077.36
75,768 $11,064.14
13.7 23.2

Page 1 of 2 Local Government Energy Audit ProgramFebruary 17, 2009
APPENDIX C - FACILITY DATA FORMComplete one Facility Data Form for each building. If you are seeking to energy audit multiple buildings,
complete one Facility Data Form for each.
FACILITY INFORMATIONPlease complete the information below for this specific facility that is seeking enrollment in the Program.
Facility Name
Street Address County
City State Zip
Facility’s Description
Total Sq Ft Year Built Hours/Week Occupied Number of Employees
Building Type (Check only one of the following):
Emergency Services Garage
Center/Meeting Hall/Library Offices
Recreation/Entertainment/Parks Religious
School School: College
Water Treatment/Pumping Other: _______________________________
ENERGY DATAPlease complete the energy information below for the most recent 12 month period available. In order togain a complete picture of the facility’s energy use, be sure to include all types of energy used by thefacility. Do not include vehicle fuel.
The Data Below is for the 12 Month Period: ____/____/______ to ____/____/______
DPW Garage
Sand Road
Westwood NJ 07675
Garage for DPW
6,000 1996 5-10 11
✘
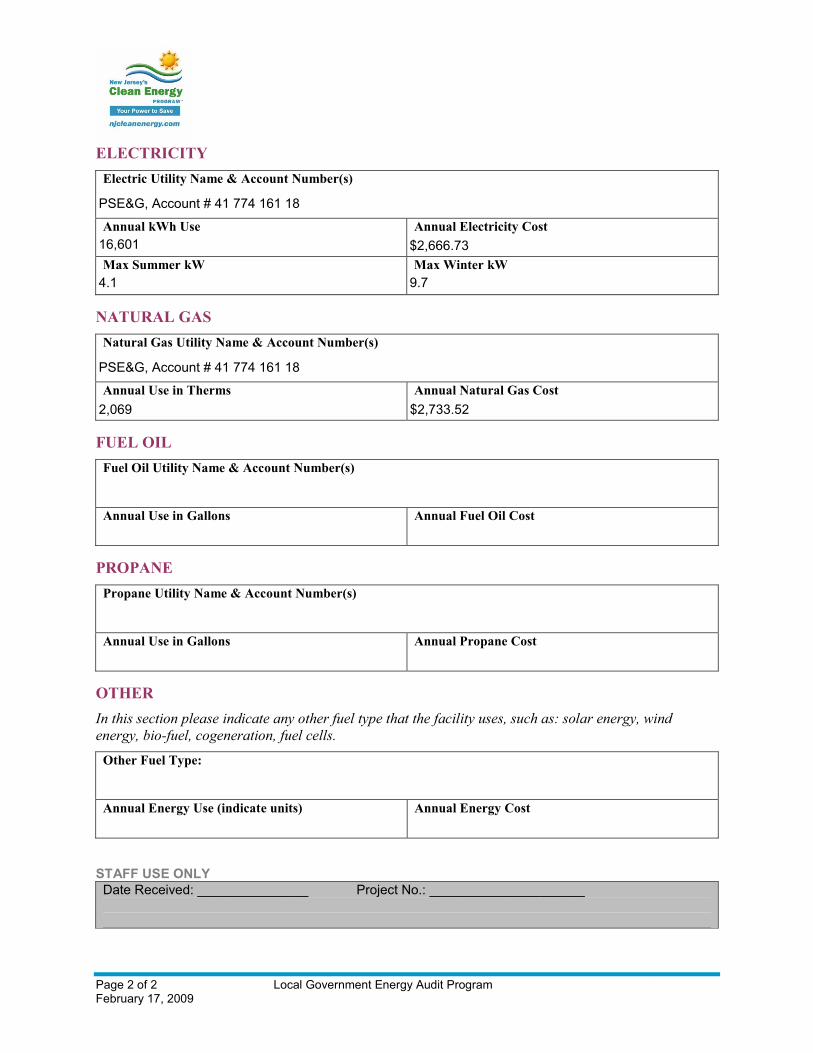
Page 2 of 2 Local Government Energy Audit ProgramFebruary 17, 2009
ELECTRICITYElectric Utility Name & Account Number(s)
Annual kWh Use Annual Electricity Cost
Max Summer kW Max Winter kW
NATURAL GASNatural Gas Utility Name & Account Number(s)
Annual Use in Therms Annual Natural Gas Cost
FUEL OILFuel Oil Utility Name & Account Number(s)
Annual Use in Gallons Annual Fuel Oil Cost
PROPANEPropane Utility Name & Account Number(s)
Annual Use in Gallons Annual Propane Cost
OTHERIn this section please indicate any other fuel type that the facility uses, such as: solar energy, windenergy, bio-fuel, cogeneration, fuel cells.
Other Fuel Type:
Annual Energy Use (indicate units) Annual Energy Cost
STAFF USE ONLYDate Received: _______________ Project No.: _____________________
PSE&G, Account # 41 774 161 18
PSE&G, Account # 41 774 161 18
2,069 $2,733.52
16,601 $2,666.73
4.1 9.7

Page 1 of 2 Local Government Energy Audit ProgramFebruary 17, 2009
APPENDIX C - FACILITY DATA FORMComplete one Facility Data Form for each building. If you are seeking to energy audit multiple buildings,
complete one Facility Data Form for each.
FACILITY INFORMATIONPlease complete the information below for this specific facility that is seeking enrollment in the Program.
Facility Name
Street Address County
City State Zip
Facility’s Description
Total Sq Ft Year Built Hours/Week Occupied Number of Employees
Building Type (Check only one of the following):
Emergency Services Garage
Center/Meeting Hall/Library Offices
Recreation/Entertainment/Parks Religious
School School: College
Water Treatment/Pumping Other: _______________________________
ENERGY DATAPlease complete the energy information below for the most recent 12 month period available. In order togain a complete picture of the facility’s energy use, be sure to include all types of energy used by thefacility. Do not include vehicle fuel.
The Data Below is for the 12 Month Period: ____/____/______ to ____/____/______
Borough Hall
101 Washington Ave
Westwood NJ 07675
Borough Hall for the Borough of Westwood
29,780 1994 168 51
✘

Page 2 of 2 Local Government Energy Audit ProgramFebruary 17, 2009
ELECTRICITYElectric Utility Name & Account Number(s)
Annual kWh Use Annual Electricity Cost
Max Summer kW Max Winter kW
NATURAL GASNatural Gas Utility Name & Account Number(s)
Annual Use in Therms Annual Natural Gas Cost
FUEL OILFuel Oil Utility Name & Account Number(s)
Annual Use in Gallons Annual Fuel Oil Cost
PROPANEPropane Utility Name & Account Number(s)
Annual Use in Gallons Annual Propane Cost
OTHERIn this section please indicate any other fuel type that the facility uses, such as: solar energy, windenergy, bio-fuel, cogeneration, fuel cells.
Other Fuel Type:
Annual Energy Use (indicate units) Annual Energy Cost
STAFF USE ONLYDate Received: _______________ Project No.: _____________________
PSE&G, Account # 41 815 006 08
PSE&G, Account # 41 815 006 08
9,561 $12,325
357,920 $55,739
128 56

APPENDIX H
ENGINEER’S OPINION OF PROBABLE CONSTRUCTION COSTS

CDM ENGINEER'S OPINION OF CONSTRUCTION COST ESTIMATE
11 British American Blvd Location: Borough of WestwoodLatham, NY 12110 Estimate by: PSPhone (518) 782-4500 Checked by: JMFax (518) 786-3810
ITEM DESCRIPTION QTY UNIT MATERIAL MATERIAL QTY UNIT LABOR LABOR TOTALUNIT COST SUBTOTAL COST SUBTOTAL
Borough Hall1 Interior Lighting Upgrades 1 ls. 24,626.00$ 1 ls. 26,807.50$ 26,807.50$ 51,433.50$
Subtotal 24,626.00 26,807.50SUBTOTAL = 51,433.50$ MARKUP % = 0.15$
MARKUP = 7,715.03$ SUB-TOTAL w/ OH & P = 59,148.53$
CONTINGENCY % = 0.25CONTINGENCY = 14,787.13$
BUDGET COST ESTIMATE = 73,935.66$
ITEM DESCRIPTION QTY UNIT MATERIAL MATERIAL QTY UNIT LABOR LABOR TOTALUNIT COST SUBTOTAL COST SUBTOTAL
Borough Hall2 Exterior Lighting Upgrades 1 ls. 10,590.00$ 1 ls. 3,390.00$ 3,390.00$ 13,980.00$
Subtotal 10,590.00 3,390.00SUBTOTAL = 13,980.00$ MARKUP % = 0.15$
MARKUP = 2,097.00$ SUB-TOTAL w/ OH & P = 16,077.00$
CONTINGENCY % = 0.25CONTINGENCY = 4,019.25$
BUDGET COST ESTIMATE = 20,096.25$
ITEM DESCRIPTION QTY UNIT MATERIAL MATERIAL QTY UNIT LABOR LABOR TOTALUNIT COST SUBTOTAL COST SUBTOTAL
Borough Hall3 Combined Lighting Upgrades 1 ls. 35,216.00$ 1 ls. 30,197.50$ 30,197.50$ 65,413.50$
Subtotal 35,216.00 30,197.50SUBTOTAL = 65,413.50$ MARKUP % = 0.15$
MARKUP = 9,812.03$ SUB-TOTAL w/ OH & P = 75,225.53$
CONTINGENCY % = 0.25CONTINGENCY = 18,806.38$
BUDGET COST ESTIMATE = 94,031.91$
4:43 PM 3/31/2010

CDM ENGINEER'S OPINION OF CONSTRUCTION COST ESTIMATE
11 British American Blvd Location: Borough of WestwoodLatham, NY 12110 Estimate by: PSPhone (518) 782-4500 Checked by: JMFax (518) 786-3810
ITEM DESCRIPTION QTY UNIT MATERIAL MATERIAL QTY UNIT LABOR LABOR TOTALUNIT COST SUBTOTAL COST SUBTOTAL
Public Library1 Interior Lighting Upgrades 1 ls. 11,689.50$ 1 ls. 7,809.00$ 7,809.00$ 19,498.50$
Subtotal 11,689.50 7,809.00SUBTOTAL = 19,498.50$ MARKUP % = 0.15$
MARKUP = 2,924.78$ SUB-TOTAL w/ OH & P = 22,423.28$
CONTINGENCY % = 0.25CONTINGENCY = 5,605.82$
BUDGET COST ESTIMATE = 28,029.09$
ITEM DESCRIPTION QTY UNIT MATERIAL MATERIAL QTY UNIT LABOR LABOR TOTALUNIT COST SUBTOTAL COST SUBTOTAL
Public Library2 Exterior Lighting Upgrades 1 ls. 2,288.00$ 1 ls. 810.00$ 810.00$ 3,098.00$
Subtotal 2,288.00 810.00SUBTOTAL = 3,098.00$ MARKUP % = 0.15$
MARKUP = 464.70$ SUB-TOTAL w/ OH & P = 3,562.70$
CONTINGENCY % = 0.25CONTINGENCY = 890.68$
BUDGET COST ESTIMATE = 4,453.38$
ITEM DESCRIPTION QTY UNIT MATERIAL MATERIAL QTY UNIT LABOR LABOR TOTALUNIT COST SUBTOTAL COST SUBTOTAL
Public Library3 Combined Lighting Upgrades 1 ls. 13,977.50$ 1 ls. 8,619.00$ 8,619.00$ 22,596.50$
Subtotal 13,977.50 8,619.00SUBTOTAL = 22,596.50$ MARKUP % = 0.15$
MARKUP = 3,389.48$ SUB-TOTAL w/ OH & P = 25,985.98$
CONTINGENCY % = 0.25CONTINGENCY = 6,496.49$
BUDGET COST ESTIMATE = 32,482.47$
4:43 PM 3/31/2010
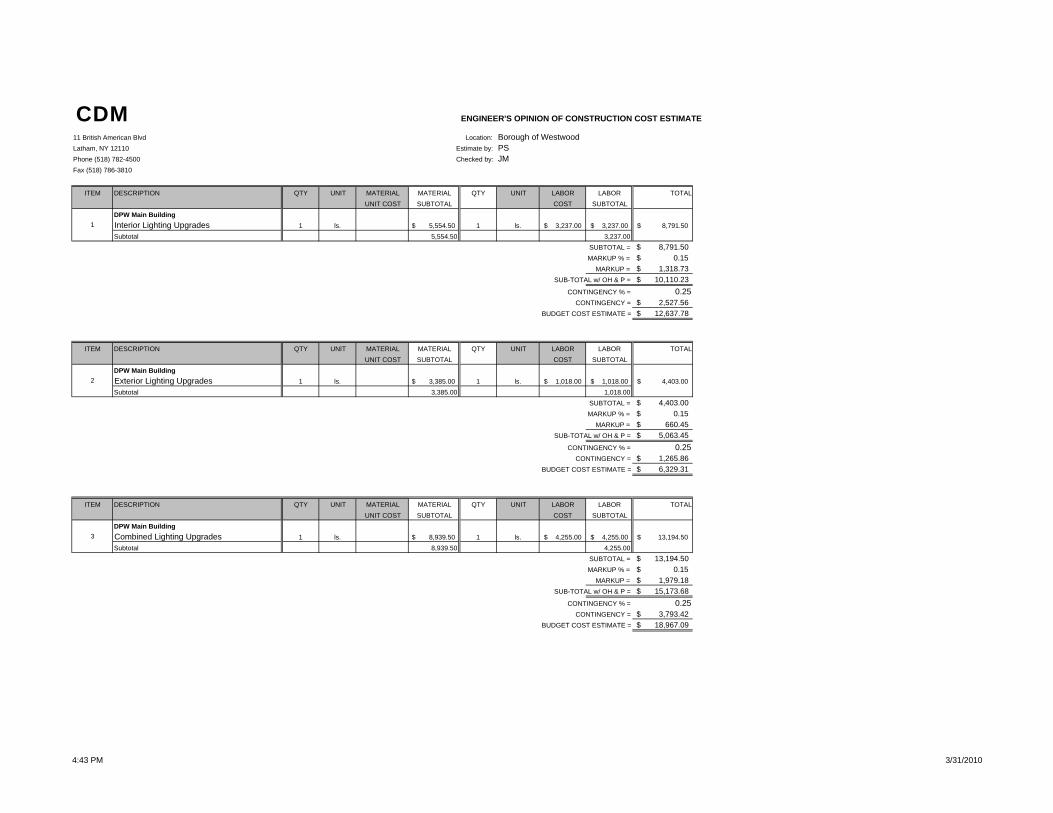
CDM ENGINEER'S OPINION OF CONSTRUCTION COST ESTIMATE
11 British American Blvd Location: Borough of WestwoodLatham, NY 12110 Estimate by: PSPhone (518) 782-4500 Checked by: JMFax (518) 786-3810
ITEM DESCRIPTION QTY UNIT MATERIAL MATERIAL QTY UNIT LABOR LABOR TOTALUNIT COST SUBTOTAL COST SUBTOTAL
DPW Main Building1 Interior Lighting Upgrades 1 ls. 5,554.50$ 1 ls. 3,237.00$ 3,237.00$ 8,791.50$
Subtotal 5,554.50 3,237.00SUBTOTAL = 8,791.50$ MARKUP % = 0.15$
MARKUP = 1,318.73$ SUB-TOTAL w/ OH & P = 10,110.23$
CONTINGENCY % = 0.25CONTINGENCY = 2,527.56$
BUDGET COST ESTIMATE = 12,637.78$
ITEM DESCRIPTION QTY UNIT MATERIAL MATERIAL QTY UNIT LABOR LABOR TOTALUNIT COST SUBTOTAL COST SUBTOTAL
DPW Main Building2 Exterior Lighting Upgrades 1 ls. 3,385.00$ 1 ls. 1,018.00$ 1,018.00$ 4,403.00$
Subtotal 3,385.00 1,018.00SUBTOTAL = 4,403.00$ MARKUP % = 0.15$
MARKUP = 660.45$ SUB-TOTAL w/ OH & P = 5,063.45$
CONTINGENCY % = 0.25CONTINGENCY = 1,265.86$
BUDGET COST ESTIMATE = 6,329.31$
ITEM DESCRIPTION QTY UNIT MATERIAL MATERIAL QTY UNIT LABOR LABOR TOTALUNIT COST SUBTOTAL COST SUBTOTAL
DPW Main Building3 Combined Lighting Upgrades 1 ls. 8,939.50$ 1 ls. 4,255.00$ 4,255.00$ 13,194.50$
Subtotal 8,939.50 4,255.00SUBTOTAL = 13,194.50$ MARKUP % = 0.15$
MARKUP = 1,979.18$ SUB-TOTAL w/ OH & P = 15,173.68$
CONTINGENCY % = 0.25CONTINGENCY = 3,793.42$
BUDGET COST ESTIMATE = 18,967.09$
4:43 PM 3/31/2010

CDM ENGINEER'S OPINION OF CONSTRUCTION COST ESTIMATE
11 British American Blvd Location: Borough of WestwoodLatham, NY 12110 Estimate by: PSPhone (518) 782-4500 Checked by: JMFax (518) 786-3810
ITEM DESCRIPTION QTY UNIT MATERIAL MATERIAL QTY UNIT LABOR LABOR TOTALUNIT COST SUBTOTAL COST SUBTOTAL
DPW Garage1 Interior Lighting Upgrades 1 ls. 963.00$ 1 ls. 1,166.00$ 1,166.00$ 2,129.00$
Subtotal 963.00 1,166.00SUBTOTAL = 2,129.00$ MARKUP % = 0.15$
MARKUP = 319.35$ SUB-TOTAL w/ OH & P = 2,448.35$
CONTINGENCY % = 0.25CONTINGENCY = 612.09$
BUDGET COST ESTIMATE = 3,060.44$
ITEM DESCRIPTION QTY UNIT MATERIAL MATERIAL QTY UNIT LABOR LABOR TOTALUNIT COST SUBTOTAL COST SUBTOTAL
DPW Garage2 Exterior Lighting Upgrades 1 ls. 790.00$ 1 ls. 308.00$ 308.00$ 1,098.00$
Subtotal 790.00 308.00SUBTOTAL = 1,098.00$ MARKUP % = 0.15$
MARKUP = 164.70$ SUB-TOTAL w/ OH & P = 1,262.70$
CONTINGENCY % = 0.25CONTINGENCY = 315.68$
BUDGET COST ESTIMATE = 1,578.38$
ITEM DESCRIPTION QTY UNIT MATERIAL MATERIAL QTY UNIT LABOR LABOR TOTALUNIT COST SUBTOTAL COST SUBTOTAL
DPW Garage3 Combined Lighting Upgrades 1 ls. 1,753.00$ 1 ls. 1,474.00$ 1,474.00$ 3,227.00$
Subtotal 1,753.00 1,474.00SUBTOTAL = 3,227.00$ MARKUP % = 0.15$
MARKUP = 484.05$ SUB-TOTAL w/ OH & P = 3,711.05$
CONTINGENCY % = 0.25CONTINGENCY = 927.76$
BUDGET COST ESTIMATE = 4,638.81$
4:43 PM 3/31/2010

CDM ENGINEER'S OPINION OF CONSTRUCTION COST ESTIMATE
11 British American Blvd Location: Borough of WestwoodLatham, NY 12110 Estimate by: PSPhone (518) 782-4500 Checked by: JMFax (518) 786-3810
ITEM DESCRIPTION QTY UNIT MATERIAL MATERIAL QTY UNIT LABOR LABOR TOTALUNIT COST SUBTOTAL COST SUBTOTAL
Fire Department1 Interior Lighting Upgrades 1 ls. 4,866.50$ 1 ls. 3,436.50$ 3,436.50$ 8,303.00$
Subtotal 4,866.50 3,436.50SUBTOTAL = 8,303.00$ MARKUP % = 0.15$
MARKUP = 1,245.45$ SUB-TOTAL w/ OH & P = 9,548.45$
CONTINGENCY % = 0.25CONTINGENCY = 2,387.11$
BUDGET COST ESTIMATE = 11,935.56$
ITEM DESCRIPTION QTY UNIT MATERIAL MATERIAL QTY UNIT LABOR LABOR TOTALUNIT COST SUBTOTAL COST SUBTOTAL
Fire Department2 Exterior Lighting Upgrades 1 ls. 5,062.00$ 1 ls. 1,594.00$ 1,594.00$ 6,656.00$
Subtotal 5,062.00 1,594.00SUBTOTAL = 6,656.00$ MARKUP % = 0.15$
MARKUP = 998.40$ SUB-TOTAL w/ OH & P = 7,654.40$
CONTINGENCY % = 0.25CONTINGENCY = 1,913.60$
BUDGET COST ESTIMATE = 9,568.00$
ITEM DESCRIPTION QTY UNIT MATERIAL MATERIAL QTY UNIT LABOR LABOR TOTALUNIT COST SUBTOTAL COST SUBTOTAL
Fire Department3 Combined Lighting Upgrades 1 ls. 9,928.50$ 1 ls. 5,030.50$ 5,030.50$ 14,959.00$
Subtotal 9,928.50 5,030.50SUBTOTAL = 14,959.00$ MARKUP % = 0.15$
MARKUP = 2,243.85$ SUB-TOTAL w/ OH & P = 17,202.85$
CONTINGENCY % = 0.25CONTINGENCY = 4,300.71$
BUDGET COST ESTIMATE = 21,503.56$
4:43 PM 3/31/2010

Page 1 of 1
CDM ENGINEER'S OPINION OF PROBABLE CONSTRUCTION COST
15 British American Blvd Location: Borough of WestwoodLatham, NY 12110 Estimate by: RKAPhone (518) 782-4500 Checked by: MGFax (518) 786-3810
ITEM DESCRIPTION QTY UNIT MATERIAL MATERIAL QTY UNIT LABOR LABOR TOTALUNIT COST SUBTOTAL COST SUBTOTAL
Borough Hall
1Boiler, Gas-Fired, Condensing High Efficiency, 2,000 MBH* 1 ea. 34,000.00$ 34,000.00$ 1 ea. 5,750.00$ 5,750.00$ 39,750.00$
2 Removal of Existing Cast Iron Boiler 1 ea. $0 -$ 1 ea. 5,425.00$ 5,425.00$ 5,425.00$
3
New Flue, all fuel, pressure tight, double wall, U.L. listed, 1400 deg F, 304 stainless steel liner, aluminized steel outer jacket, 6" dia
30 LF 47.00$ 1,410.00$ 30 LF 15.35$ 460.50$ 1,870.50$
Subtotal 35,410.00 11,635.50*Pricing from boiler manufacturer quote, dated May, 2009 SUBTOTAL = 47,045.50$ All other pricing per RS Means Costworks 2010 MARKUP % = 0.15$
MARKUP = 7,056.83$ SUB-TOTAL w/ OH & P = 54,102.33$
CONTINGENCY % = 0.25CONTINGENCY = 13,525.58$
BUDGET COST ESTIMATE = 67,627.91$
3:58 PM 3/30/2010

Page 1 of 1
CDM ENGINEER'S OPINION OF PROBABLE CONSTRUCTION COST
15 British American Blvd Location: Borough of WestwoodLatham, NY 12110 Estimate by: RKAPhone (518) 782-4500 Checked by: MGFax (518) 786-3810
ITEM DESCRIPTION QTY UNIT MATERIAL & LABOR MATERIAL & LABOR TOTALUNIT COST SUBTOTAL
Borough Hall1 DDC Control System 29,780 SF 0.60$ 17,868.00$ 17,868.00$
Subtotal 17,868.00Notes: SUBTOTAL = 17,868.00$ 1. DDC Control System Pricing is estimated at $0.60 per square foot MARKUP % = 0.15$ 2. At an assumed $400 per control point, this will allow for 64 points, or roughly 7 per air handler MARKUP = 2,680.20$
SUB-TOTAL w/ OH & P = 20,548.20$ CONTINGENCY % = 0.25
CONTINGENCY = 5,137.05$ BUDGET COST ESTIMATE = 25,685.25$
10:24 AM 4/2/2010
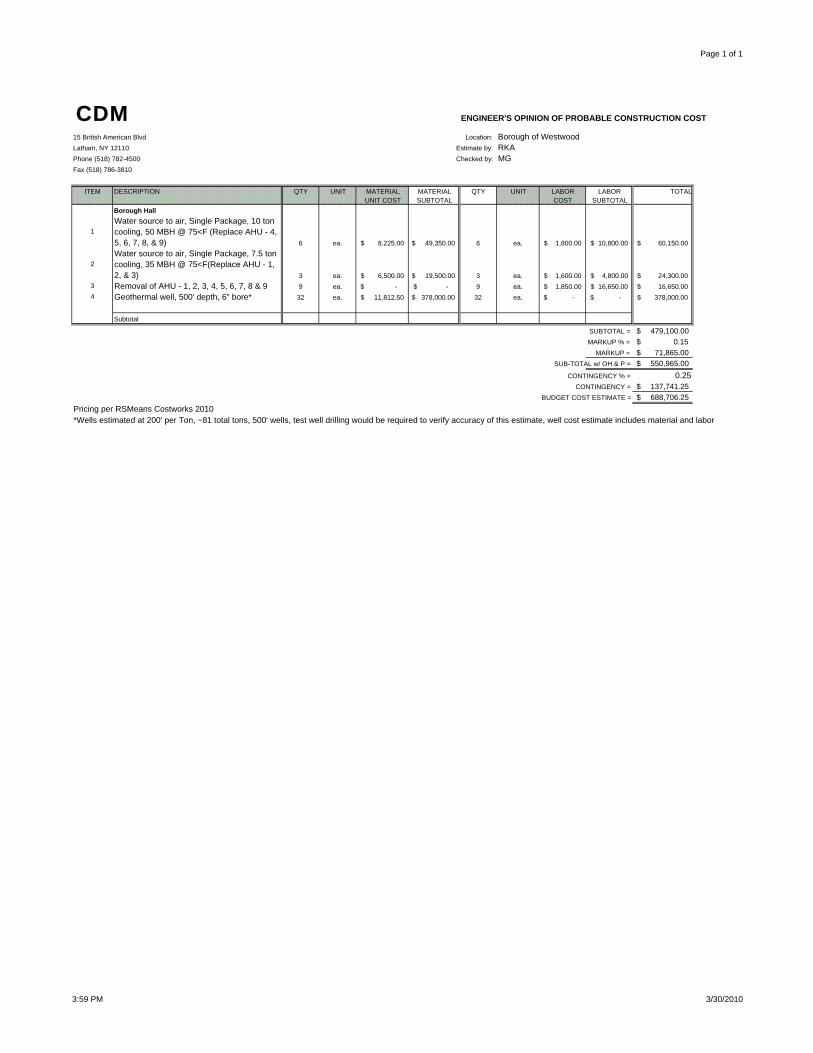
Page 1 of 1
CDM ENGINEER'S OPINION OF PROBABLE CONSTRUCTION COST
15 British American Blvd Location: Borough of WestwoodLatham, NY 12110 Estimate by: RKAPhone (518) 782-4500 Checked by: MGFax (518) 786-3810
ITEM DESCRIPTION QTY UNIT MATERIAL MATERIAL QTY UNIT LABOR LABOR TOTALUNIT COST SUBTOTAL COST SUBTOTAL
Borough Hall
1Water source to air, Single Package, 10 ton cooling, 50 MBH @ 75<F (Replace AHU - 4, 5, 6, 7, 8, & 9) 6 ea. 8,225.00$ 49,350.00$ 6 ea. 1,800.00$ 10,800.00$ 60,150.00$
2Water source to air, Single Package, 7.5 ton cooling, 35 MBH @ 75<F(Replace AHU - 1, 2, & 3) 3 ea. 6,500.00$ 19,500.00$ 3 ea. 1,600.00$ 4,800.00$ 24,300.00$
3 Removal of AHU - 1, 2, 3, 4, 5, 6, 7, 8 & 9 9 ea. -$ -$ 9 ea. 1,850.00$ 16,650.00$ 16,650.00$ 4 Geothermal well, 500' depth, 6" bore* 32 ea. 11,812.50$ 378,000.00$ 32 ea. -$ -$ 378,000.00$
Subtotal
SUBTOTAL = 479,100.00$ MARKUP % = 0.15$
MARKUP = 71,865.00$ SUB-TOTAL w/ OH & P = 550,965.00$
CONTINGENCY % = 0.25CONTINGENCY = 137,741.25$
BUDGET COST ESTIMATE = 688,706.25$ Pricing per RSMeans Costworks 2010*Wells estimated at 200' per Ton, ~81 total tons, 500' wells, test well drilling would be required to verify accuracy of this estimate, well cost estimate includes material and labor
3:59 PM 3/30/2010

Page 1 of 1
CDM ENGINEER'S OPINION OF PROBABLE CONSTRUCTION COST
15 British American Blvd Location: Borough of WestwoodLatham, NY 12110 Estimate by: RKAPhone (518) 782-4500 Checked by: MGFax (518) 786-3810
ITEM DESCRIPTION QTY UNIT MATERIAL MATERIAL QTY UNIT LABOR LABOR TOTALUNIT COST SUBTOTAL COST SUBTOTAL
Public Library
1Boiler, Gas-Fired, Condensing High Efficiency, 194 MBH 4 ea. 2,675.00$ 10,700.00$ 4 ea. 1,250.00$ 5,000.00$ 15,700.00$
2 Removal of Existing Cast Iron Boiler 1 ea. $0 -$ 1 ea. 4,775.00$ 4,775.00$ 4,775.00$
3
New Flue, all fuel, pressure tight, double wall, U.L. listed, 1400 deg F, 304 stainless steel liner, aluminized steel outer jacket, 6" dia
30 LF 47.00$ 1,410.00$ 30 LF 15.35$ 460.50$ 1,870.50$
Subtotal 12,110.00 10,235.50All pricing per RS Means Costworks 2010 SUBTOTAL = 22,345.50$
MARKUP % = 0.15$ MARKUP = 3,351.83$
SUB-TOTAL w/ OH & P = 25,697.33$ CONTINGENCY % = 0.25
CONTINGENCY = 6,424.33$ BUDGET COST ESTIMATE = 32,121.66$
3:58 PM 3/30/2010

Page 1 of 1
CDM ENGINEER'S OPINION OF PROBABLE CONSTRUCTION COST
15 British American Blvd Location: Borough of WestwoodLatham, NY 12110 Estimate by: RKAPhone (518) 782-4500 Checked by: MGFax (518) 786-3810
ITEM DESCRIPTION QTY UNIT MATERIAL & LABOR MATERIAL & LABOR TOTALUNIT COST SUBTOTAL
Public Library1 DDC Control System 16,000 SF 0.60$ 9,600.00$ 9,600.00$
Subtotal 9,600.00Notes: SUBTOTAL = 9,600.00$ 1. DDC Control System Pricing is estimated at $0.60 per square foot MARKUP % = 0.15$ 2. At an assumed $400 per control point, this will allow for 35 points, or roughly 7 per air handler MARKUP = 1,440.00$
SUB-TOTAL w/ OH & P = 11,040.00$ CONTINGENCY % = 0.25
CONTINGENCY = 2,760.00$ BUDGET COST ESTIMATE = 13,800.00$
10:23 AM 4/2/2010

Page 1 of 1
CDM ENGINEER'S OPINION OF PROBABLE CONSTRUCTION COST
15 British American Blvd Location: Borough of WestwoodLatham, NY 12110 Estimate by: RKAPhone (518) 782-4500 Checked by: MGFax (518) 786-3810
ITEM DESCRIPTION QTY UNIT MATERIAL MATERIAL QTY UNIT LABOR LABOR TOTALUNIT COST SUBTOTAL COST SUBTOTAL
Public Library
1
Water source to air, Single Package, 10 ton cooling, 50 MBH @ 75<F (Replace AHUs serving Children's Section and Lower Level Auditorium) 2 ea. 8,225.00$ 16,450.00$ 2 ea. 1,800.00$ 3,600.00$ 20,050.00$
2Water source to air, Single Package, 7.5 ton cooling, 35 MBH @ 75<F(Replace AHU serving Office/Reception area) 3 ea. 6,500.00$ 19,500.00$ 3 ea. 1,600.00$ 4,800.00$ 24,300.00$
3Water source to air, Single Package, 15 ton cooling, 64 MBH @ 75<F(Replace AHU serving Adult's Section area) 1 ea. 14,000.00$ 14,000.00$ 1 ea. 3,175.00$ 3,175.00$ 17,175.00$
3 Removal of four AHUs 4 ea. -$ -$ 4 ea. 1,850.00$ 7,400.00$ 7,400.00$ 4 Geothermal well, 500' depth, 6" bore* 19 ea. 11,812.50$ 218,531.25$ 168 ea. -$ -$ 218,531.25$
Subtotal
SUBTOTAL = 287,456.25$ MARKUP % = 0.15$
MARKUP = 43,118.44$ SUB-TOTAL w/ OH & P = 330,574.69$
CONTINGENCY % = 0.25CONTINGENCY = 82,643.67$
BUDGET COST ESTIMATE = 413,218.36$ Pricing per RSMeans Costworks 2010*Wells estimated at 200' per Ton, ~46 total tons, 500' wells, test well drilling would be required to verify accuracy of this estimate, well cost estimate includes material and labor
3:59 PM 3/30/2010
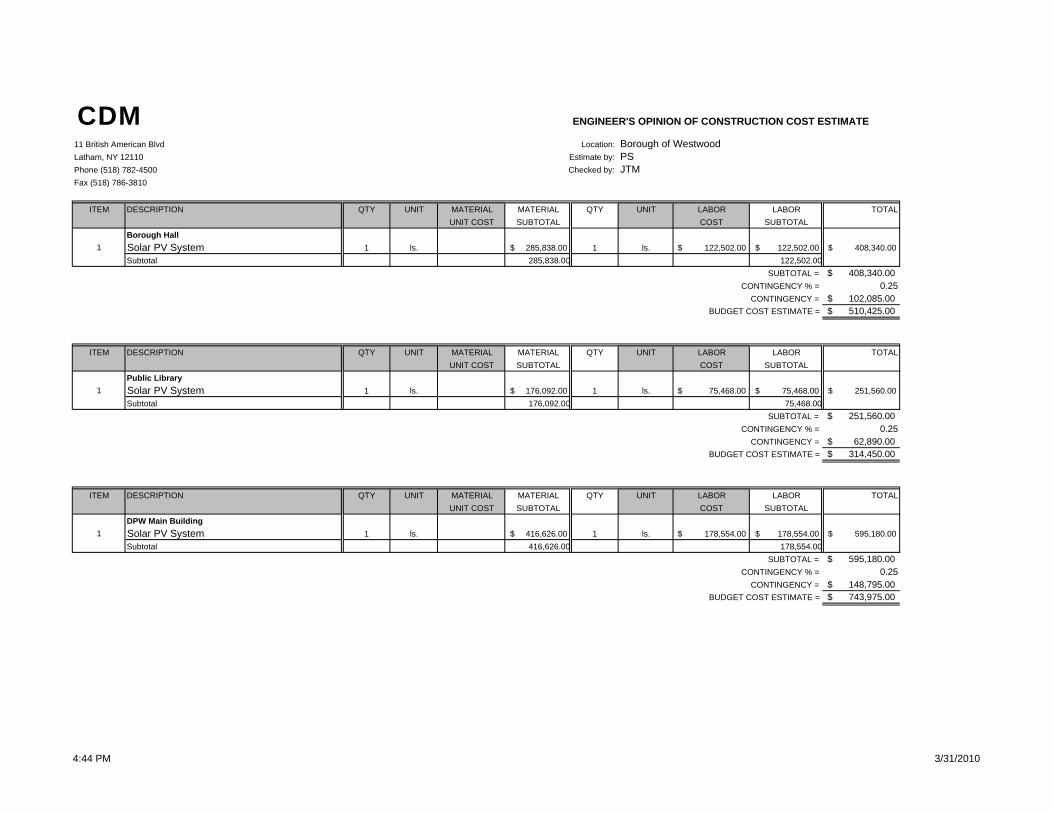
CDM ENGINEER'S OPINION OF CONSTRUCTION COST ESTIMATE
11 British American Blvd Location: Borough of WestwoodLatham, NY 12110 Estimate by: PSPhone (518) 782-4500 Checked by: JTMFax (518) 786-3810
ITEM DESCRIPTION QTY UNIT MATERIAL MATERIAL QTY UNIT LABOR LABOR TOTALUNIT COST SUBTOTAL COST SUBTOTAL
Borough Hall1 Solar PV System 1 ls. 285,838.00$ 1 ls. 122,502.00$ 122,502.00$ 408,340.00$
Subtotal 285,838.00 122,502.00SUBTOTAL = 408,340.00$
CONTINGENCY % = 0.25CONTINGENCY = 102,085.00$
BUDGET COST ESTIMATE = 510,425.00$
ITEM DESCRIPTION QTY UNIT MATERIAL MATERIAL QTY UNIT LABOR LABOR TOTALUNIT COST SUBTOTAL COST SUBTOTAL
Public Library1 Solar PV System 1 ls. 176,092.00$ 1 ls. 75,468.00$ 75,468.00$ 251,560.00$
Subtotal 176,092.00 75,468.00SUBTOTAL = 251,560.00$
CONTINGENCY % = 0.25CONTINGENCY = 62,890.00$
BUDGET COST ESTIMATE = 314,450.00$
ITEM DESCRIPTION QTY UNIT MATERIAL MATERIAL QTY UNIT LABOR LABOR TOTALUNIT COST SUBTOTAL COST SUBTOTAL
DPW Main Building1 Solar PV System 1 ls. 416,626.00$ 1 ls. 178,554.00$ 178,554.00$ 595,180.00$
Subtotal 416,626.00 178,554.00SUBTOTAL = 595,180.00$
CONTINGENCY % = 0.25CONTINGENCY = 148,795.00$
BUDGET COST ESTIMATE = 743,975.00$
4:44 PM 3/31/2010

CDM ENGINEER'S OPINION OF CONSTRUCTION COST ESTIMATE
11 British American Blvd Location: Borough of WestwoodLatham, NY 12110 Estimate by: PSPhone (518) 782-4500 Checked by: JTMFax (518) 786-3810
ITEM DESCRIPTION QTY UNIT MATERIAL MATERIAL QTY UNIT LABOR LABOR TOTALUNIT COST SUBTOTAL COST SUBTOTAL
DPW Garage1 Solar PV System 1 ls. 142,450.00$ 1 ls. 61,050.00$ 61,050.00$ 203,500.00$
Subtotal 142,450.00 61,050.00SUBTOTAL = 203,500.00$
CONTINGENCY % = 0.25CONTINGENCY = 50,875.00$
BUDGET COST ESTIMATE = 254,375.00$
ITEM DESCRIPTION QTY UNIT MATERIAL MATERIAL QTY UNIT LABOR LABOR TOTALUNIT COST SUBTOTAL COST SUBTOTAL
Fire Department1 Solar PV System 1 ls. 146,356.00$ 1 ls. 62,724.00$ 62,724.00$ 209,080.00$
Subtotal 146,356.00 62,724.00SUBTOTAL = 209,080.00$
CONTINGENCY % = 0.25CONTINGENCY = 52,270.00$
BUDGET COST ESTIMATE = 261,350.00$
4:44 PM 3/31/2010
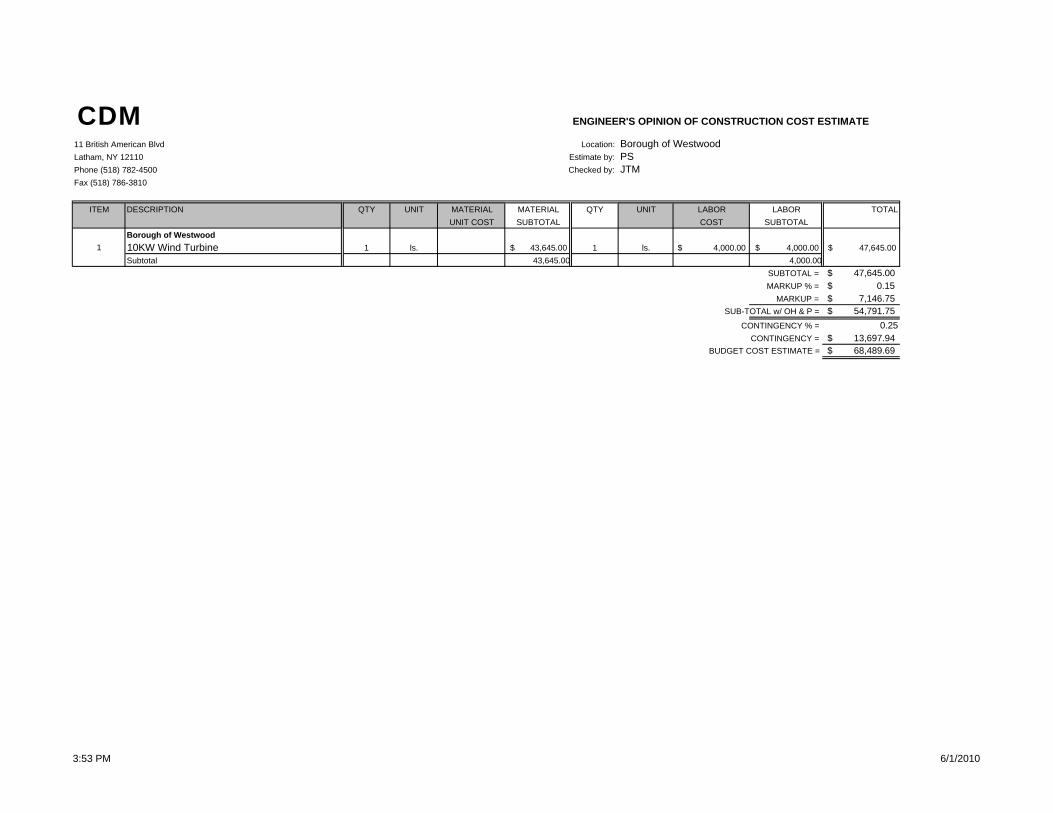
CDM ENGINEER'S OPINION OF CONSTRUCTION COST ESTIMATE
11 British American Blvd Location: Borough of WestwoodLatham, NY 12110 Estimate by: PSPhone (518) 782-4500 Checked by: JTMFax (518) 786-3810
ITEM DESCRIPTION QTY UNIT MATERIAL MATERIAL QTY UNIT LABOR LABOR TOTALUNIT COST SUBTOTAL COST SUBTOTAL
Borough of Westwood1 10KW Wind Turbine 1 ls. 43,645.00$ 1 ls. 4,000.00$ 4,000.00$ 47,645.00$
Subtotal 43,645.00 4,000.00SUBTOTAL = 47,645.00$ MARKUP % = 0.15$
MARKUP = 7,146.75$ SUB-TOTAL w/ OH & P = 54,791.75$
CONTINGENCY % = 0.25CONTINGENCY = 13,697.94$
BUDGET COST ESTIMATE = 68,489.69$
3:53 PM 6/1/2010

Page 1 of 1
CDM ENGINEER'S OPINION OF PROBABLE CONSTRUCTION COST
15 British American Blvd Location: Borough of WestwoodLatham, NY 12110 Estimate by: RKAPhone (518) 782-4500 Checked by: MGFax (518) 786-3810
ITEM DESCRIPTION QTY UNIT MATERIAL MATERIAL QTY UNIT LABOR LABOR TOTALUNIT COST SUBTOTAL COST SUBTOTAL
Public Library
1High efficiency automatic flush sensor and operator for urinals, 0.5 gpf 0 ea. 395.00$ -$ 0 ea. 65.50$ -$ -$
2High efficiency automatic flush sensor and operator for water closets, 1.28 gpf 5 ea. 395.00$ 1,975.00$ 5 ea. 65.50$ 327.50$ 2,302.50$
3Faucet - Automatic sensor and operator with faucet head 5 ea. 370.00$ 1,850.00$ 5 ea. 85.50$ 427.50$ 2,277.50$
Subtotal 3,825.00 755.00Pricing from RS Means Costworks 2010 SUBTOTAL = 4,580.00$
MARKUP % = 0.15$ MARKUP = 687.00$
SUB-TOTAL w/ OH & P = 5,267.00$ CONTINGENCY % = 0.25
CONTINGENCY = 1,316.75$ BUDGET COST ESTIMATE = 6,583.75$
10:05 AM 6/1/2010

Page 1 of 1
CDM ENGINEER'S OPINION OF PROBABLE CONSTRUCTION COST
15 British American Blvd Location: Borough of WestwoodLatham, NY 12110 Estimate by: RKAPhone (518) 782-4500 Checked by: MGFax (518) 786-3810
ITEM DESCRIPTION QTY UNIT MATERIAL MATERIAL QTY UNIT LABOR LABOR TOTALUNIT COST SUBTOTAL COST SUBTOTAL
Fire Department
1High efficiency automatic flush sensor and operator for urinals, 0.5 gpf 0 ea. 395.00$ -$ 0 ea. 65.50$ -$ -$
2High efficiency automatic flush sensor and operator for water closets, 1.28 gpf 11 ea. 395.00$ 4,345.00$ 11 ea. 65.50$ 720.50$ 5,065.50$
3Faucet - Automatic sensor and operator with faucet head 16 ea. 370.00$ 5,920.00$ 16 ea. 85.50$ 1,368.00$ 7,288.00$
Subtotal 10,265.00 2,088.50Pricing from RS Means Costworks 2010 SUBTOTAL = 12,353.50$
MARKUP % = 0.15$ MARKUP = 1,853.03$
SUB-TOTAL w/ OH & P = 14,206.53$ CONTINGENCY % = 0.25
CONTINGENCY = 3,551.63$ BUDGET COST ESTIMATE = 17,758.16$
10:05 AM 6/1/2010

Page 1 of 1
CDM ENGINEER'S OPINION OF PROBABLE CONSTRUCTION COST
15 British American Blvd Location: Borough of WestwoodLatham, NY 12110 Estimate by: RKAPhone (518) 782-4500 Checked by: MGFax (518) 786-3810
ITEM DESCRIPTION QTY UNIT MATERIAL MATERIAL QTY UNIT LABOR LABOR TOTALUNIT COST SUBTOTAL COST SUBTOTAL
DPW Garages
1High efficiency automatic flush sensor and operator for urinals, 0.5 gpf 0 ea. 395.00$ -$ 0 ea. 65.50$ -$ -$
2High efficiency automatic flush sensor and operator for water closets, 1.28 gpf 6 ea. 395.00$ 2,370.00$ 6 ea. 65.50$ 393.00$ 2,763.00$
3Faucet - Automatic sensor and operator with faucet head 7 ea. 370.00$ 2,590.00$ 7 ea. 85.50$ 598.50$ 3,188.50$
Subtotal 4,960.00 991.50Pricing from RS Means Costworks 2010 SUBTOTAL = 5,951.50$
MARKUP % = 0.15$ MARKUP = 892.73$
SUB-TOTAL w/ OH & P = 6,844.23$ CONTINGENCY % = 0.25
CONTINGENCY = 1,711.06$ BUDGET COST ESTIMATE = 8,555.28$
10:04 AM 6/1/2010
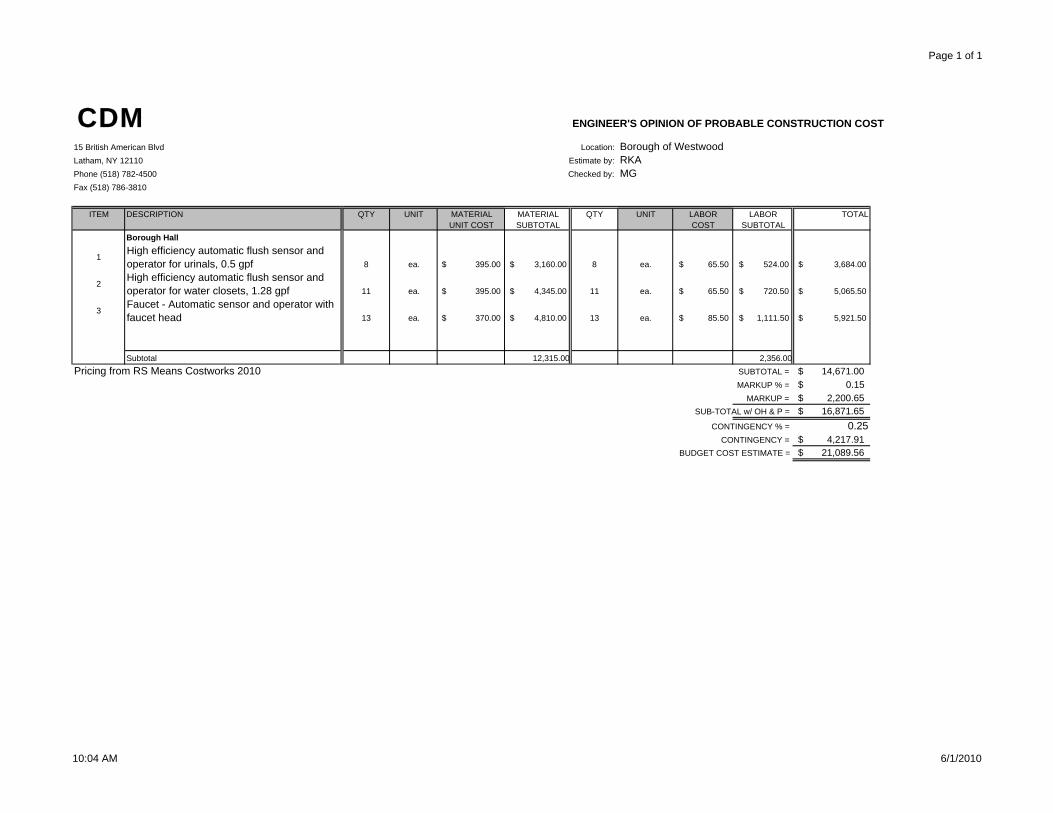
Page 1 of 1
CDM ENGINEER'S OPINION OF PROBABLE CONSTRUCTION COST
15 British American Blvd Location: Borough of WestwoodLatham, NY 12110 Estimate by: RKAPhone (518) 782-4500 Checked by: MGFax (518) 786-3810
ITEM DESCRIPTION QTY UNIT MATERIAL MATERIAL QTY UNIT LABOR LABOR TOTALUNIT COST SUBTOTAL COST SUBTOTAL
Borough Hall
1High efficiency automatic flush sensor and operator for urinals, 0.5 gpf 8 ea. 395.00$ 3,160.00$ 8 ea. 65.50$ 524.00$ 3,684.00$
2High efficiency automatic flush sensor and operator for water closets, 1.28 gpf 11 ea. 395.00$ 4,345.00$ 11 ea. 65.50$ 720.50$ 5,065.50$
3Faucet - Automatic sensor and operator with faucet head 13 ea. 370.00$ 4,810.00$ 13 ea. 85.50$ 1,111.50$ 5,921.50$
Subtotal 12,315.00 2,356.00Pricing from RS Means Costworks 2010 SUBTOTAL = 14,671.00$
MARKUP % = 0.15$ MARKUP = 2,200.65$
SUB-TOTAL w/ OH & P = 16,871.65$ CONTINGENCY % = 0.25
CONTINGENCY = 4,217.91$ BUDGET COST ESTIMATE = 21,089.56$
10:04 AM 6/1/2010

APPENDIX I
ECRM FINANCIAL ANALYSES
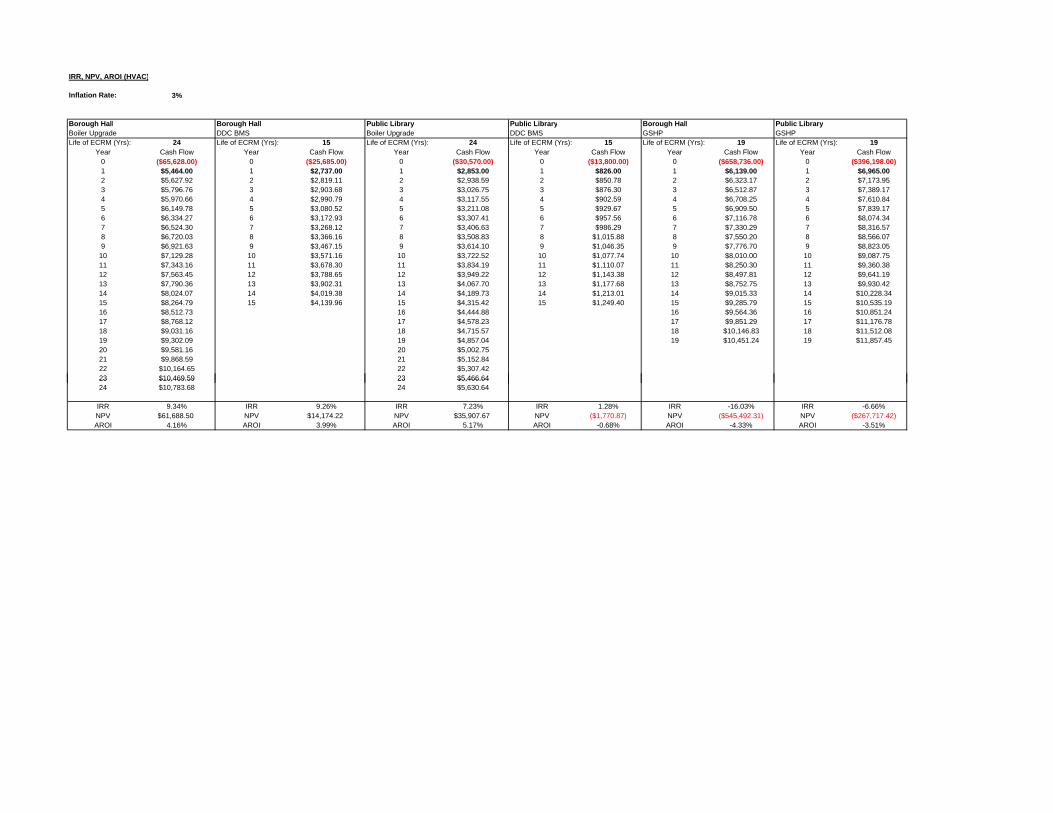
IRR, NPV, AROI (HVAC)
Inflation Rate: 3%
Borough Hall Borough Hall Public Library Public Library Borough Hall Public LibraryBoiler Upgrade DDC BMS Boiler Upgrade DDC BMS GSHP GSHPLife of ECRM (Yrs): 24 Life of ECRM (Yrs): 15 Life of ECRM (Yrs): 24 Life of ECRM (Yrs): 15 Life of ECRM (Yrs): 19 Life of ECRM (Yrs): 19
Year Cash Flow Year Cash Flow Year Cash Flow Year Cash Flow Year Cash Flow Year Cash Flow0 ($65,628.00) 0 ($25,685.00) 0 ($30,570.00) 0 ($13,800.00) 0 ($658,736.00) 0 ($396,198.00)1 $5,464.00 1 $2,737.00 1 $2,853.00 1 $826.00 1 $6,139.00 1 $6,965.002 $5,627.92 2 $2,819.11 2 $2,938.59 2 $850.78 2 $6,323.17 2 $7,173.953 $5,796.76 3 $2,903.68 3 $3,026.75 3 $876.30 3 $6,512.87 3 $7,389.174 $5,970.66 4 $2,990.79 4 $3,117.55 4 $902.59 4 $6,708.25 4 $7,610.845 $6,149.78 5 $3,080.52 5 $3,211.08 5 $929.67 5 $6,909.50 5 $7,839.176 $6,334.27 6 $3,172.93 6 $3,307.41 6 $957.56 6 $7,116.78 6 $8,074.347 $6,524.30 7 $3,268.12 7 $3,406.63 7 $986.29 7 $7,330.29 7 $8,316.578 $6,720.03 8 $3,366.16 8 $3,508.83 8 $1,015.88 8 $7,550.20 8 $8,566.079 $6,921.63 9 $3,467.15 9 $3,614.10 9 $1,046.35 9 $7,776.70 9 $8,823.05
10 $7,129.28 10 $3,571.16 10 $3,722.52 10 $1,077.74 10 $8,010.00 10 $9,087.7511 $7,343.16 11 $3,678.30 11 $3,834.19 11 $1,110.07 11 $8,250.30 11 $9,360.3812 $7,563.45 12 $3,788.65 12 $3,949.22 12 $1,143.38 12 $8,497.81 12 $9,641.1913 $7,790.36 13 $3,902.31 13 $4,067.70 13 $1,177.68 13 $8,752.75 13 $9,930.4214 $8,024.07 14 $4,019.38 14 $4,189.73 14 $1,213.01 14 $9,015.33 14 $10,228.3415 $8,264.79 15 $4,139.96 15 $4,315.42 15 $1,249.40 15 $9,285.79 15 $10,535.1916 $8,512.73 16 $4,444.88 16 $9,564.36 16 $10,851.2417 $8,768.12 17 $4,578.23 17 $9,851.29 17 $11,176.7818 $9,031.16 18 $4,715.57 18 $10,146.83 18 $11,512.0819 $9,302.09 19 $4,857.04 19 $10,451.24 19 $11,857.4520 $9,581.16 20 $5,002.7521 $9,868.59 21 $5,152.8422 $10,164.65 22 $5,307.4223 $10,469.59 23 $5,466.6423 $10,469.59 23 $5,466.6424 $10,783.68 24 $5,630.64
IRR 9.34% IRR 9.26% IRR 7.23% IRR 1.28% IRR -16.03% IRR -6.66%NPV $61,688.50 NPV $14,174.22 NPV $35,907.67 NPV ($1,770.87) NPV ($545,492.31) NPV ($267,717.42)AROI 4.16% AROI 3.99% AROI 5.17% AROI -0.68% AROI -4.33% AROI -3.51%

Borough Hall Borough Hall Public Library Public Library Borough Hall Public LibraryECRM
Borough HallBoiler Upgrade
Borough HallDDC BMS
Public LibraryBoiler Upgrade
Public LibraryDDC BMS
Borough HallGSHP
Public LibraryGSHP
Assumed Inflation (Gas) 2% 2% 2% 2% 2% 2%
Initial Yearly Savings (Gas) $3,964.00 $1,482.00 $1,353.00 $364.00 $14,697.00 $6,108.00
Assumed Inflation (Electricity) 3% 3% 3% 3% 3% 3%
Initial Yearly Savings (Electricity) $1,255.00 $462.00 -$8,558.00 $857.00
Ass med A erage Usef l Life (Years) 24 15 24 15 19 19Assumed Average Useful Life (Years) 24 15 24 15 19 19
Lifetime Savings $120,592.26 $48,970.48 $41,160.78 $14,887.50 $120,737.53 $161,035.29
Year Annual Savings Annual Savings Annual Savings Annual Savings Annual Savings Annual Savings
1 $3,964.00 $2,737.00 $1,353.00 $826.00 $6,139.00 $6,965.00
2 $4,043.28 $2,804.29 $1,380.06 $847.14 $6,176.20 $7,112.87
3 $4,124.15 $2,873.30 $1,407.66 $868.84 $6,211.58 $7,263.95
4 $4,206.63 $2,944.08 $1,435.81 $891.12 $6,245.02 $7,418.33
5 $4,290.76 $3,016.68 $1,464.53 $913.99 $6,276.40 $7,576.06
6 $4,376.58 $3,091.14 $1,493.82 $937.47 $6,305.61 $7,737.22
7 $4,464.11 $3,167.51 $1,523.70 $961.58 $6,332.51 $7,901.90
8 $4,553.39 $3,245.84 $1,554.17 $986.32 $6,356.97 $8,070.17
9 $4,644.46 $3,326.20 $1,585.26 $1,011.73 $6,378.86 $8,242.12$ , $ , $ , $ , $ , $ ,
10 $4,737.35 $3,408.62 $1,616.96 $1,037.82 $6,398.03 $8,417.82
11 $4,832.09 $3,493.16 $1,649.30 $1,064.60 $6,414.32 $8,597.35
12 $4,928.74 $3,579.89 $1,682.29 $1,092.10 $6,427.60 $8,780.82
13 $5,027.31 $3,668.86 $1,715.93 $1,120.34 $6,437.69 $8,968.30
14 $5,127.86 $3,760.13 $1,750.25 $1,149.34 $6,444.43 $9,159.88
15 $5,230.41 $3,853.77 $1,785.25 $1,179.11 $6,447.64 $9,355.67
16 $5 335 02 $1 820 96 $6 447 14 $9 555 7416 $5,335.02 $1,820.96 $6,447.14 $9,555.74
17 $5,441.72 $1,857.38 $6,442.75 $9,760.21
18 $5,550.56 $1,894.53 $6,434.28 $9,969.17
19 $5,661.57 $1,932.42 $6,421.51 $10,182.71
20 $5,774.80 $1,971.07
21 $5,890.30 $2,010.49
22 $6,008.10 $2,050.70
23 $6 128 26 $2 091 7123 $6,128.26 $2,091.71
24 $6,250.83 $2,133.54
25

Lighting Maintenance Cost Savings
T12 Bulb Cost T8 Bulb Cost T12 Bulb Average Lifetime (Years)
T8 Bulb Average Lifetime (Years)
Quantity of T12 Replacements vs. T8 Replacements
Cost of T12 Replacement over T8 Life
T8 Bulb Replacements Over Lifetime (15 Yrs)
1 Lamp $25.0 $23.5 4.6 5.7 1.25 $31.2 3
2 Lamp $69.9 $67.0 4.6 5.7 1.25 $87.4 3
3 Lamp $94.9 $90.5 4.6 5.7 1.25 $118.6 3
4 Lamp $119.8 $114.0 4.6 5.7 1.25 $149.8 3
Incandescent Cost CFL Cost Incandescent Average
Lifetime (Years)CFL Average
Lifetime (Years)
Quantity of Incandescent Replacements vs. CFL
Replacements
Cost of Incandescent Replacement over CFL Life
CFL Replacements Over Lifetime (15 Yrs)
13 Watt $23.0 $25.0 0.5 2.3 5 $115.0 7
15 Par 38 Watt $23.0 $35.0 0.5 2.3 5 $115.0 7
23 Par 38 Watt $23.0 $40.0 0.5 2.3 5 $115.0 7
25 Watt $23.0 $27.0 0.5 2.3 5 $115.0 7
40 Watt $23.0 $32.0 0.5 2.3 5 $115.0 7
65 Watt $23.4 $45.0 0.5 2.3 5 $117.0 7
Metal Halide Cost Induction Cost Metal Halide AverageLifetime ( Years)
Induction Average Lifetime (years)
Quantity of Metal HalideReplacements vs. Induction
Replacements
Cost of Metal Halide Replacementover Induction Life
LED Replacements Over Lifetime (15 Yrs)
400 Watt $86.0 $485.0 4.6 22.8 5 $430.0 1
250 Watt $80.0 $390.0 4.6 22.8 5 $400.0 1
HPS Cost Induction Cost HPS AverageLifetime ( Years)
Induction Average Lifetime (years)
Quantity of HPSReplacements vs. Induction
Replacements
Cost of HPSover Induction Life
Induction Replacements Over Lifetime (15 Yrs)
150 Watt $74.0 $440.0 4.6 22.8 5 $370.0 1
100 Watt $55.0 $380.0 4.6 22.8 5 $275.0 1
70 Watt $25.0 $380.0 4.6 22.8 5 $125.0 1
Metal Halide Cost Fluorescent Cost Metal Halide AverageLifetime ( Years)
Fluorescent Average Lifetime (years)
Quantity of Metal HalideReplacements vs. Fluorescent
Replacements
Cost of Metal Halide Replacementover Fluorescent Life
Fluorescent Replacements Over Lifetime (15 Yrs)
4 Lamp $86.0 $216.0 4.6 5.7 1.25 $107.4 3
6 Lamp $86.0 $288.0 4.6 5.7 1.25 $107.5 3
Interior Option
Building INC-CFL (13W) T12->T8 (1 Lamp) T12->T8 (2 Lamp) T12->T8 (3 Lamp) T12->T8 (4 Lamp) MH->Fluorescent INC-CFL (25W) Total Maintenance Cost Savings
Annual MaintenanceCost Savings Building
Borough Hall $1,057.8 $196.7 $5,602.8 $436.2 $1,889.0 $0.0 $9,519.9 $18,702.4 $1,246.83 Borough Hall
Public Library $2,820.7 $0.0 $1,928.8 $747.8 $3,620.6 $0.0 $0.0 $9,117.9 $607.86 Public Library
DPW Main Building $0.0 $0.0 $275.5 $0.0 $2,833.5 $0.0 $0.0 $3,109.1 $207.27 DPW Main Building
DPW Garage $0.0 $0.0 $642.9 $0.0 $0.0 $0.0 $705.2 $1,348.1 $89.87 DPW Garage
Fire Department $0.0 $0.0 $0.0 $0.0 $0.0 $339.0 $0.0 $339.0 $22.60 Fire Department
Exterior Option
Building MH->Induction (400W) INC->CFL (25W) HPS->Induction (100/150W) HPS->Induction (70W) Total Maintenance Cost Savings
Annual MaintenanceCost Savings Building
Borough Hall $207.2 $705.2 $178.3 $11.0 $1,101.6 $73.44 Borough Hall
Public Library $0.0 $3,173.3 $81.0 $0.0 $3,254.3 $216.96 Public Library
DPW Main Building $94.2 $4,231.1 $0.0 $11.0 $4,336.2 $289.08 DPW Main Building
DPW Garage $0.0 $705.2 $0.0 $11.0 $716.1 $47.74 DPW Garage
Fire Department $150.7 $2,115.5 $0.0 $16.4 $2,282.6 $152.18 Fire Department
High Pressure Sodium/Metal Halide to Fluorescent
T12 to T8 Retrofit
Incandescent to CFL Retrofit
HPS to Induction Retrofit
Metal Halide to Induction Retrofit

ECMBorough Hall-
Interior Public Library-Interior DPW Main Building-Interior DPW Garage-Interior Fire Department-
Interior
Assumed Inflation (Gas) 2% 2% 2% 2% 2%Initial Yearly Savings (Gas)Assumed Inflation (Electricity) 3% 3% 3% 3% 3%Initial Yearly Savings (Electricity) $5,791.99 $3,595.62 $1,054.86 $164.52 $819.92Assumed Average Useful Life (Years) 15 15 15 15 15
Lifetime Savings $107,724.72 $66,874.63 $19,619.25 $3,059.89 $15,249.62
Year Annual Savings Annual Savings Annual Savings Annual Savings Annual Savings1 $5,791.99 $3,595.62 $1,054.86 $164.52 $819.922 $5,965.75 $3,703.49 $1,086.51 $169.46 $844.523 $6,144.72 $3,814.59 $1,119.10 $174.54 $869.854 $6,329.06 $3,929.03 $1,152.67 $179.78 $895.955 $6,518.94 $4,046.90 $1,187.25 $185.17 $922.836 $6,714.50 $4,168.31 $1,222.87 $190.72 $950.517 $6,915.94 $4,293.36 $1,259.56 $196.45 $979.038 $7,123.42 $4,422.16 $1,297.34 $202.34 $1,008.409 $7,337.12 $4,554.82 $1,336.27 $208.41 $1,038.65
10 $7,557.23 $4,691.47 $1,376.35 $214.66 $1,069.8111 $7,783.95 $4,832.21 $1,417.64 $221.10 $1,101.9012 $8,017.47 $4,977.18 $1,460.17 $227.73 $1,134.9613 $8,257.99 $5,126.49 $1,503.98 $234.57 $1,169.0114 $8,505.73 $5,280.29 $1,549.10 $241.60 $1,204.0815 $8,760.90 $5,438.70 $1,595.57 $248.85 $1,240.20
ECMBorough Hall-
Exterior Public Library-Exterior DPW Main Building-Exterior DPW Garage-Exterior Fire Department-
Exterior
Assumed Inflation (Gas) 2% 2% 2% 2% 2%Initial Yearly Savings (Gas)Assumed Inflation (Electricity) 3% 3% 3% 3% 3%Initial Yearly Savings (Electricity) $2,343.50 $915.28 $1,262.08 $128.48 $771.94Assumed Average Useful Life (Years) 15 15 15 15 15
Lifetime Savings $43,586.55 $17,023.21 $23,473.32 $2,389.59 $14,357.25
Year Annual Savings Annual Savings Annual Savings Annual Savings Annual Savings1 $2,343.50 $915.28 $1,262.08 $128.48 $771.942 $2,413.81 $942.74 $1,299.94 $132.33 $795.103 $2,486.22 $971.02 $1,338.94 $136.30 $818.954 $2,560.81 $1,000.15 $1,379.11 $140.39 $843.525 $2,637.63 $1,030.16 $1,420.48 $144.61 $868.836 $2,716.76 $1,061.06 $1,463.10 $148.94 $894.897 $2,798.26 $1,092.89 $1,506.99 $153.41 $921.748 $2,882.21 $1,125.68 $1,552.20 $158.01 $949.399 $2,968.68 $1,159.45 $1,598.77 $162.75 $977.87
10 $3,057.74 $1,194.23 $1,646.73 $167.64 $1,007.2111 $3,149.47 $1,230.06 $1,696.13 $172.67 $1,037.4212 $3,243.95 $1,266.96 $1,747.01 $177.85 $1,068.5513 $3,341.27 $1,304.97 $1,799.42 $183.18 $1,100.6014 $3,441.51 $1,344.12 $1,853.41 $188.68 $1,133.6215 $3,544.75 $1,384.44 $1,909.01 $194.34 $1,167.63
ECM
Borough Hall-Interior & Exterior
Public Library-Interior & Exterior
DPW Main Building-Interior & Exterior
DPW Garage-Interior & Exterior
Fire Department-Interior & Exterior
Assumed Inflation (Gas) 2% 2% 2% 2% 2%Initial Yearly Savings (Gas)Assumed Inflation (Electricity) 3% 3% 3% 3% 3%Initial Yearly Savings (Electricity) $8,135.49 $4,510.90 $2,316.95 $292.99 $1,591.86Assumed Average Useful Life (Years) 15 15 15 15 15
Lifetime Savings $151,311.28 $83,897.84 $43,092.75 $5,449.30 $29,606.87
Year Annual Savings Annual Savings Annual Savings Annual Savings Annual Savings1 $8,135.49 $4,510.90 $2,316.95 $292.99 $1,591.862 $8,379.55 $4,646.23 $2,386.46 $301.78 $1,639.623 $8,630.94 $4,785.61 $2,458.05 $310.83 $1,688.804 $8,889.87 $4,929.18 $2,531.79 $320.16 $1,739.475 $9,156.57 $5,077.06 $2,607.75 $329.76 $1,791.656 $9,431.26 $5,229.37 $2,685.98 $339.66 $1,845.407 $9,714.20 $5,386.25 $2,766.56 $349.85 $1,900.768 $10,005.63 $5,547.84 $2,849.56 $360.34 $1,957.799 $10,305.80 $5,714.27 $2,935.04 $371.15 $2,016.52
10 $10,614.97 $5,885.70 $3,023.09 $382.29 $2,077.0211 $10,933.42 $6,062.27 $3,113.79 $393.75 $2,139.3312 $11,261.42 $6,244.14 $3,207.20 $405.57 $2,203.5113 $11,599.26 $6,431.46 $3,303.42 $417.73 $2,269.6114 $11,947.24 $6,624.41 $3,402.52 $430.27 $2,337.7015 $12,305.66 $6,823.14 $3,504.59 $443.17 $2,407.83

ECMBorough Hall-PV Solar
SystemPublic Library-PV Solar
SystemDPW Main Building-PV
Solar SystemDPW Garage-PV Solar
SystemFire Department-PV
Solar System
Assumed Inflation (Gas)Initial Yearly Savings (Gas)Assumed Inflation (Electricity) 3% 3% 3% 3% 3%Initial Yearly Savings (Electricity) $6,113.70 $3,735.80 $9,805.30 $2,460.80 $2,152.70Assumed Average Useful Life (Years) 25 25 25 25 25
Lifetime Savings $222,901.00 $136,204.52 $357,494.02 $89,718.96 $78,485.86
Year Annual Savings Annual Savings Annual Savings Annual Savings Annual Savings1 $6,113.70 $3,735.80 $9,805.30 $2,460.80 $2,152.702 $6,297.11 $3,847.87 $10,099.46 $2,534.62 $2,217.283 $6,486.02 $3,963.31 $10,402.44 $2,610.66 $2,283.804 $6,680.61 $4,082.21 $10,714.52 $2,688.98 $2,352.315 $6,881.02 $4,204.68 $11,035.95 $2,769.65 $2,422.886 $7,087.45 $4,330.82 $11,367.03 $2,852.74 $2,495.577 $7,300.08 $4,460.74 $11,708.04 $2,938.32 $2,570.448 $7,519.08 $4,594.56 $12,059.28 $3,026.47 $2,647.559 $7,744.65 $4,732.40 $12,421.06 $3,117.27 $2,726.9810 $7,976.99 $4,874.37 $12,793.69 $3,210.79 $2,808.7911 $8,216.30 $5,020.60 $13,177.50 $3,307.11 $2,893.0512 $8,462.79 $5,171.22 $13,572.83 $3,406.32 $2,979.8413 $8,716.67 $5,326.36 $13,980.01 $3,508.51 $3,069.2414 $8,978.17 $5,486.15 $14,399.41 $3,613.77 $3,161.3115 $9,247.52 $5,650.73 $14,831.40 $3,722.18 $3,256.1516 $9,524.95 $5,820.25 $15,276.34 $3,833.85 $3,353.8417 $9,810.69 $5,994.86 $15,734.63 $3,948.86 $3,454.4518 $10,105.01 $6,174.71 $16,206.67 $4,067.33 $3,558.0919 $10,408.17 $6,359.95 $16,692.87 $4,189.35 $3,664.8320 $10,720.41 $6,550.75 $17,193.65 $4,315.03 $3,774.7721 $11,042.02 $6,747.27 $17,709.46 $4,444.48 $3,888.0222 $11,373.28 $6,949.69 $18,240.75 $4,577.81 $4,004.6623 $11,714.48 $7,158.18 $18,787.97 $4,715.15 $4,124.8024 $12,065.92 $7,372.92 $19,351.61 $4,856.60 $4,248.5425 $12,427.89 $7,594.11 $19,932.16 $5,002.30 $4,376.00

ECMWind Turbine - Min
Wind SpeedWind Turbine - Max Wind
SpeedWind Turbine - Avg wind
Speed
Assumed Inflation (Gas)Initial Yearly Savings (Gas)Assumed Inflation (Electricity) 3% 3% 3%Initial Yearly Savings (Electricity) $846.10 $2,401.60 $1,579.50Assumed Average Useful Life (Years) 25 25 25
Lifetime Savings $30,848.18 $87,560.57 $57,587.41
Year Annual Savings Annual Savings Annual Savings1 $846.10 $2,401.60 $1,579.502 $871.48 $2,473.65 $1,626.893 $897.63 $2,547.86 $1,675.694 $924.56 $2,624.29 $1,725.965 $952.29 $2,703.02 $1,777.746 $980.86 $2,784.11 $1,831.077 $1,010.29 $2,867.64 $1,886.018 $1,040.60 $2,953.67 $1,942.599 $1,071.81 $3,042.28 $2,000.86
10 $1,103.97 $3,133.54 $2,060.8911 $1,137.09 $3,227.55 $2,122.7212 $1,171.20 $3,324.38 $2,186.4013 $1,206.34 $3,424.11 $2,251.9914 $1,242.53 $3,526.83 $2,319.5515 $1,279.80 $3,632.64 $2,389.1416 $1,318.20 $3,741.61 $2,460.8117 $1,357.74 $3,853.86 $2,534.6318 $1,398.47 $3,969.48 $2,610.6719 $1,440.43 $4,088.56 $2,688.9920 $1,483.64 $4,211.22 $2,769.6621 $1,528.15 $4,337.56 $2,852.7522 $1,574.00 $4,467.68 $2,938.3423 $1,621.22 $4,601.71 $3,026.4924 $1,669.85 $4,739.77 $3,117.2825 $1,719.95 $4,881.96 $3,210.80

IRR, NPV, AROI
Inflation Rate: 3%
Lighting - Interior Lighting - Interior Lighting - Interior Lighting - Interior Lighting - InteriorBorough Hall Public Library DPW Main Building DPW Garage Fire DepartmentLife of ECRM (Yrs): 15 Life of ECRM (Yrs): 15 Life of ECRM (Yrs): 15 Life of ECRM (Yrs): 15 Life of ECRM (Yrs): 15
Year Cash Flow Year Cash Flow Year Cash Flow Year Cash Flow Year Cash Flow0 ($70,335.70) 0 ($26,189.10) 0 ($11,867.80) 0 ($2,790.40) 0 ($10,765.60)1 $7,038.80 1 $4,203.50 1 $1,262.20 1 $254.40 1 $842.502 $7,249.96 2 $4,329.61 2 $1,300.07 2 $262.03 2 $867.783 $7,467.46 3 $4,459.49 3 $1,339.07 3 $269.89 3 $893.814 $7,691.49 4 $4,593.28 4 $1,379.24 4 $277.99 4 $920.625 $7,922.23 5 $4,731.08 5 $1,420.62 5 $286.33 5 $948.246 $8,159.90 6 $4,873.01 6 $1,463.24 6 $294.92 6 $976.697 $8,404.70 7 $5,019.20 7 $1,507.13 7 $303.77 7 $1,005.998 $8,656.84 8 $5,169.77 8 $1,552.35 8 $312.88 8 $1,036.179 $8,916.54 9 $5,324.87 9 $1,598.92 9 $322.27 9 $1,067.25
10 $9,184.04 10 $5,484.61 10 $1,646.88 10 $331.93 10 $1,099.2711 $9,459.56 11 $5,649.15 11 $1,696.29 11 $341.89 11 $1,132.2512 $9,743.35 12 $5,818.63 12 $1,747.18 12 $352.15 12 $1,166.2213 $10,035.65 13 $5,993.19 13 $1,799.60 13 $362.71 13 $1,201.2014 $10,336.72 14 $6,172.98 14 $1,853.58 14 $373.59 14 $1,237.2415 $10,646.82 15 $6,358.17 15 $1,909.19 15 $384.80 15 $1,274.36
IRR 8.28% IRR 16.53% IRR 9.23% IRR 6.89% IRR 4.73%NPV $32,171.10 NPV $35,026.92 NPV $6,513.75 NPV $914.45 NPV $1,503.82AROI 3.34% AROI 9.38% AROI 3.97% AROI 2.45% AROI 1.16%
Lighting - Exterior Lighting - Exterior Lighting - Exterior Lighting - Exterior Lighting - ExteriorBorough Hall Public Library DPW Main Building DPW Garage Fire DepartmentLife of ECRM (Yrs): 15 Life of ECRM (Yrs): 15 Life of ECRM (Yrs): 15 Life of ECRM (Yrs): 15 Life of ECRM (Yrs): 15
Year Cash Flow Year Cash Flow Year Cash Flow Year Cash Flow Year Cash Flow0 ($18,626.30) 0 ($4,082.40) 0 ($5,769.30) 0 ($1,564.40) 0 ($9,008.00)1 $2,416.90 1 $1,132.30 1 $1,551.20 1 $176.20 1 $924.102 $2,489.41 2 $1,166.27 2 $1,597.74 2 $181.49 2 $951.823 $2,564.09 3 $1,201.26 3 $1,645.67 3 $186.93 3 $980.384 $2,641.01 4 $1,237.29 4 $1,695.04 4 $192.54 4 $1,009.795 $2,720.24 5 $1,274.41 5 $1,745.89 5 $198.31 5 $1,040.086 $2,801.85 6 $1,312.65 6 $1,798.27 6 $204.26 6 $1,071.297 $2,885.90 7 $1,352.03 7 $1,852.21 7 $210.39 7 $1,103.428 $2,972.48 8 $1,392.59 8 $1,907.78 8 $216.70 8 $1,136.539 $3,061.66 9 $1,434.36 9 $1,965.01 9 $223.20 9 $1,170.62
10 $3,153.51 10 $1,477.39 10 $2,023.96 10 $229.90 10 $1,205.7411 $3,248.11 11 $1,521.72 11 $2,084.68 11 $236.80 11 $1,241.9112 $3,345.55 12 $1,567.37 12 $2,147.22 12 $243.90 12 $1,279.1713 $3,445.92 13 $1,614.39 13 $2,211.64 13 $251.22 13 $1,317.5514 $3,549.30 14 $1,662.82 14 $2,277.99 14 $258.76 14 $1,357.0715 $3,655.78 15 $1,712.71 15 $2,346.33 15 $266.52 15 $1,397.78
IRR 12.54% IRR 29.88% IRR 28.96% IRR 10.14% IRR 8.66%NPV $16,571.27 NPV $12,407.41 NPV $16,820.99 NPV $1,001.62 NPV $4,449.77AROI 6.31% AROI 21.07% AROI 20.22% AROI 4.60% AROI 3.59%
Borough Hall Public Library DPW Main Building DPW Garage Fire DepartmentLife of ECRM (Yrs): 15 Life of ECRM (Yrs): 15 Life of ECRM (Yrs): 15 Life of ECRM (Yrs): 15 Life of ECRM (Yrs): 15
Year Cash Flow Year Cash Flow Year Cash Flow Year Cash Flow Year Cash Flow0 ($88,961.90) 0 ($30,271.50) 0 ($17,637.10) 0 ($4,354.80) 0 ($19,773.60)1 $9,455.80 1 $5,335.70 1 $2,813.30 1 $430.60 1 $1,766.702 $9,739.47 2 $5,495.77 2 $2,897.70 2 $443.52 2 $1,819.703 $10,031.66 3 $5,660.64 3 $2,984.63 3 $456.82 3 $1,874.294 $10,332.61 4 $5,830.46 4 $3,074.17 4 $470.53 4 $1,930.525 $10,642.59 5 $6,005.38 5 $3,166.39 5 $484.64 5 $1,988.446 $10,961.86 6 $6,185.54 6 $3,261.39 6 $499.18 6 $2,048.097 $11,290.72 7 $6,371.10 7 $3,359.23 7 $514.16 7 $2,109.538 $11,629.44 8 $6,562.24 8 $3,460.00 8 $529.58 8 $2,172.829 $11,978.32 9 $6,759.11 9 $3,563.80 9 $545.47 9 $2,238.00
10 $12,337.67 10 $6,961.88 10 $3,670.72 10 $561.84 10 $2,305.1411 $12,707.80 11 $7,170.73 11 $3,780.84 11 $578.69 11 $2,374.3012 $13,089.04 12 $7,385.86 12 $3,894.27 12 $596.05 12 $2,445.5313 $13,481.71 13 $7,607.43 13 $4,011.09 13 $613.93 13 $2,518.8914 $13,886.16 14 $7,835.66 14 $4,131.43 14 $632.35 14 $2,594.4615 $14,302.75 15 $8,070.72 15 $4,255.37 15 $651.32 15 $2,672.29
IRR 9.22% IRR 18.46% IRR 16.41% IRR 8.10% IRR 6.59%NPV $48,743.93 NPV $47,432.87 NPV $23,333.29 NPV $1,916.07 NPV $5,955.04AROI 3.96% AROI 10.96% AROI 9.28% AROI 3.22% AROI 2.27%
Lighting - Interior & Exterior Lighting - Interior & Exterior Lighting - Interior & Exterior Lighting - Interior & Exterior Lighting - Interior & Exterior

IRR, NPV, AROI - Solar PV Energy Systems
Financial CalculationsBased on inflation of: 3%O&M inflation: 3%
Solar PV System Solar PV System Solar PV System Solar PV System Solar PV SystemBorough Hall Public Library DPW Main Building DPW Garage Fire DepartmentLife of ECRM (Yrs): 25 Life of ECRM (Yrs): 25 Life of ECRM (Yrs): 25 Life of ECRM (Yrs): 25 Life of ECRM (Yrs): 25
Year Energy Savings SREC Sales Cash Flow Year Energy Savings SREC Sales Cash Flow Year Energy Savings SREC Sales Cash Flow Year Energy Savings SREC Sales Cash Flow Year Energy Savings SREC Sales Cash Flow0 ($510,425) 0 ($314,450) 0 ($743,975) 0 ($254,375) 0 ($261,350)1 $6,113.7 $27,790 $33,903.50 1 $3,735.8 $13,660 $17,395.73 1 $9,805.3 $44,630 $54,434.95 1 $2,460.8 $9,513 $11,974.26 1 $2,152.7 $9,831 $11,984.082 $6,265.7 $26,960 $33,225.20 2 $3,828.6 $13,252 $17,080.47 2 $10,049.0 $43,296 $53,345.30 2 $2,522.0 $9,229 $11,751.20 2 $2,206.2 $9,538 $11,743.863 $6,421.4 $26,146 $32,567.44 3 $3,923.7 $12,852 $16,775.75 3 $10,298.7 $41,990 $52,288.61 3 $2,584.6 $8,951 $11,535.39 3 $2,261.0 $9,250 $11,510.904 $6,580.9 $25,235 $31,815.82 4 $4,021.2 $12,404 $16,425.36 4 $10,554.6 $40,527 $51,081.19 4 $2,648.9 $8,639 $11,287.69 4 $2,317.2 $8,928 $11,244.735 $6,744.5 $24,355 $31,099.92 5 $4,121.2 $11,972 $16,093.01 5 $10,816.9 $39,114 $49,931.12 5 $2,714.7 $8,338 $11,052.45 5 $2,374.8 $8,616 $10,991.196 $6,912.1 $23,507 $30,418.74 6 $4,223.6 $11,555 $15,778.20 6 $11,085.7 $37,751 $48,836.79 6 $2,782.1 $8,047 $10,829.34 6 $2,433.8 $8,316 $10,749.927 $7,083.8 $22,687 $29,771.29 7 $4,328.5 $11,152 $15,480.47 7 $11,361.2 $36,435 $47,796.64 7 $2,851.3 $7,767 $10,618.03 7 $2,494.3 $8,026 $10,520.598 $7,259.9 $21,897 $29,156.67 8 $4,436.1 $10,763 $15,199.39 8 $11,643.5 $35,166 $46,809.19 8 $2,922.1 $7,496 $10,418.21 8 $2,556.3 $7,747 $10,302.859 $7,440.3 $21,134 $28,573.98 9 $4,546.3 $10,388 $14,934.53 9 $11,932.8 $33,940 $45,873.00 9 $2,994.8 $7,235 $10,229.59 9 $2,619.8 $7,477 $10,096.41
10 $7,625.2 $20,397 $28,022.36 10 $4,659.3 $10,026 $14,685.48 10 $12,229.4 $32,757 $44,986.72 10 $3,069.2 $6,983 $10,051.87 10 $2,684.9 $7,216 $9,900.9511 $7,814.7 $19,686 $27,501.00 11 $4,775.1 $9,677 $14,451.85 11 $12,533.3 $31,616 $44,149.02 11 $3,145.4 $6,739 $9,884.80 11 $2,751.6 $6,965 $9,716.1912 $8,008.9 $19,000 $27,009.13 12 $4,893.7 $9,340 $14,233.27 12 $12,844.7 $30,514 $43,358.67 12 $3,223.6 $6,504 $9,728.09 12 $2,820.0 $6,722 $9,541.8513 $8,207.9 $18,338 $26,545.99 13 $5,015.4 $9,014 $14,029.40 13 $13,163.9 $29,451 $42,614.45 13 $3,303.7 $6,278 $9,581.52 13 $2,890.1 $6,488 $9,377.6714 $8,411.8 $17,699 $26,110.87 14 $5,140.0 $8,700 $13,839.89 14 $13,491.0 $28,424 $41,915.22 14 $3,385.8 $6,059 $9,444.83 14 $2,961.9 $6,262 $9,223.4015 $8,620.9 $17,082 $25,703.09 15 $5,267.7 $8,397 $13,664.43 15 $13,826.3 $27,434 $41,259.89 15 $3,469.9 $5,848 $9,317.81 15 $3,035.5 $6,043 $9,078.7916 $8,835.1 $955 $9,789.81 16 $5,398.6 $469 $5,867.90 16 $14,169.9 $1,533 $15,703.08 16 $3,556.2 $327 $3,883.00 16 $3,110.9 $338 $3,448.6817 $9,054.7 $950 $10,004.59 17 $5,532.8 $467 $5,999.71 17 $14,522.0 $1,526 $16,047.54 17 $3,644.5 $325 $3,969.74 17 $3,188.2 $336 $3,524.2918 $9,279.7 $945 $10,224.85 18 $5,670.3 $465 $6,134.86 18 $14,882.8 $1,518 $16,400.78 18 $3,735.1 $324 $4,058.68 18 $3,267.5 $334 $3,601.8419 $9,510.3 $940 $10,450.72 19 $5,811.2 $462 $6,273.44 19 $15,252.7 $1,510 $16,763.03 19 $3,827.9 $322 $4,149.88 19 $3,348.7 $333 $3,681.3720 $9,746.6 $936 $10,682.35 20 $5,955.6 $460 $6,415.54 20 $15,631.7 $1,503 $17,134.51 20 $3,923.1 $320 $4,243.40 20 $3,431.9 $331 $3,762.9221 $9,988.8 $931 $10,919.87 21 $6,103.6 $458 $6,561.24 21 $16,020.2 $1,495 $17,515.44 21 $4,020.5 $319 $4,339.28 21 $3,517.2 $329 $3,846.5422 $10,237.0 $926 $11,163.44 22 $6,255.2 $455 $6,710.62 22 $16,418.3 $1,488 $17,906.06 22 $4,120.5 $317 $4,437.60 22 $3,604.6 $328 $3,932.3023 $10,491.4 $922 $11,413.20 23 $6,410.7 $453 $6,863.79 23 $16,826.3 $1,480 $18,306.62 23 $4,222.8 $316 $4,538.41 23 $3,694.1 $326 $4,020.2324 $10,752.1 $917 $11,669.30 24 $6,570.0 $451 $7,020.83 24 $17,244.4 $1,473 $18,717.35 24 $4,327.8 $314 $4,641.77 24 $3,785.9 $324 $4,110.4025 $11,019.3 $913 $11,931.90 25 $6,733.3 $449 $7,181.84 25 $17,672.9 $1,466 $19,138.51 25 $4,435.3 $312 $4,747.74 25 $3,880.0 $323 $4,202.86
IRR 0.7% IRR -0.6% IRR IRR 1.8% IRR IRR -2.1% IRR IRR -2.7%NPV ($96,242.71) NPV ($94,152.13) NPV NPV ($79,110.92) NPV NPV ($104,172.47) NPV NPV ($115,054.99)AROI 2.6% AROI 1.5% AROI AROI 3.3% AROI AROI 0.7% AROI AROI 0.6%

IRR, NPV, AROI - Wind Energy Systems
Financial Calculations
Based on inflation of: 3%
O&M inflation: 3%
Wind Turbine - Minimum Wind Speed Wind Turbine - Maximum Wind Speed Wind Turbine - Average Wind Speed
REIP Incentive: $18,256 REIP Incentive: $51,297 REIP Incentive: $34,083
Year Energy Savings REC Sales Cash Flow Year Energy Savings REC Sales Cash Flow Year Energy Savings REC Sales Cash Flow0 ($50,234) 0 ($17,193) 0 ($34,406)1 $846.1 $143 $989 1 $2,401.6 $405 $2,806 1 $1,579.5 $266 $1,8462 $867.1 $142 $1,009 2 $2,461.2 $403 $2,864 2 $1,618.8 $265 $1,8843 $888.6 $141 $1,030 3 $2,522.4 $401 $2,923 3 $1,659.0 $264 $1,9234 $910.7 $140 $1,051 4 $2,585.1 $399 $2,984 4 $1,700.2 $262 $1,9635 $933.3 $140 $1,073 5 $2,649.3 $397 $3,046 5 $1,742.5 $261 $2,0036 $956.5 $139 $1,096 6 $2,715.2 $395 $3,110 6 $1,785.8 $260 $2,0457 $980.3 $138 $1,119 7 $2,782.6 $393 $3,175 7 $1,830.2 $258 $2,0898 $1,004.7 $138 $1,142 8 $2,851.8 $391 $3,243 8 $1,875.7 $257 $2,1339 $1,029.6 $137 $1,167 9 $2,922.7 $389 $3,312 9 $1,922.3 $256 $2,178
10 $1,055.2 $136 $1,192 10 $2,995.3 $387 $3,382 10 $1,970.0 $255 $2,22511 $1,081.4 $136 $1,217 11 $3,069.7 $385 $3,455 11 $2,019.0 $253 $2,27212 $1,108.3 $135 $1,243 12 $3,146.0 $383 $3,529 12 $2,069.2 $252 $2,32113 $1,135.8 $134 $1,270 13 $3,224.2 $381 $3,605 13 $2,120.6 $251 $2,37114 $1,164.1 $134 $1,298 14 $3,304.3 $379 $3,684 14 $2,173.3 $249 $2,42315 $1,193.0 $133 $1,326 15 $3,386.4 $377 $3,764 15 $2,227.3 $248 $2,47616 $1,222.6 $132 $1,355 16 $3,470.6 $376 $3,846 16 $2,282.6 $247 $2,53017 $1,253.0 $132 $1,385 17 $3,556.8 $374 $3,930 17 $2,339.4 $246 $2,58518 $1,284.2 $131 $1,415 18 $3,645.2 $372 $4,017 18 $2,397.5 $245 $2,64219 $1,316.1 $130 $1,446 19 $3,735.8 $370 $4,106 19 $2,457.1 $243 $2,70020 $1,348.8 $130 $1,478 20 $3,828.6 $368 $4,197 20 $2,518.1 $242 $2,76021 $1,382.3 $129 $1,511 21 $3,923.8 $366 $4,290 21 $2,580.7 $241 $2,82222 $1,416.7 $128 $1,545 22 $4,021.3 $364 $4,386 22 $2,644.8 $240 $2,88523 $1,451.9 $128 $1,580 23 $4,121.2 $363 $4,484 23 $2,710.6 $238 $2,94924 $1,487.9 $127 $1,615 24 $4,223.6 $361 $4,584 24 $2,777.9 $237 $3,01525 $1,524.9 $126 $1,651 25 $4,328.6 $359 $4,688 25 $2,846.9 $236 $3,083
IRR -2.9% IRR 18.0% IRR 4.4%
NPV -$28,527 NPV $44,424 NPV $6,120
AROI -2.0% AROI 12.3% AROI 1.4%

IRR, NPV, AROI (Water Fixtures)
Inflation Rate: 3%
Borough Hall Public Library DPW Garages Fire Department
Flushometers/Sensors Flushometers/Sensors Flushometers/Sensors Flushometers/Sensors
Life of ECRM (Yrs): 15 Life of ECRM (Yrs): 15 Life of ECRM (Yrs): 15 Life of ECRM (Yrs): 15Year Cash Flow Year Cash Flow Year Cash Flow Year Cash Flow
0 ($21,090.00) 0 ($6,584.00) 0 ($8,555.00) 0 ($17,758.00)
$ $ $ $1 $484.00 1 $57.00 1 $90.00 1 $8.00
2 $498.52 2 $58.71 2 $92.70 2 $8.24
3 $513.48 3 $60.47 3 $95.48 3 $8.49
4 $528.88 4 $62.29 4 $98.35 4 $8.74
5 $544.75 5 $64.15 5 $101.30 5 $9.00
6 $561.09 6 $66.08 6 $104.33 6 $9.27
7 $577.92 7 $68.06 7 $107.46 7 $9.55
8 $595 26 8 $70 10 8 $110 69 8 $9 848 $595.26 8 $70.10 8 $110.69 8 $9.84
9 $613.12 9 $72.21 9 $114.01 9 $10.13
10 $631.51 10 $74.37 10 $117.43 10 $10.44
11 $650.46 11 $76.60 11 $120.95 11 $10.75
12 $669.97 12 $78.90 12 $124.58 12 $11.07
13 $690.07 13 $81.27 13 $128.32 13 $11.41
14 $710.77 14 $83.71 14 $132.17 14 $11.75
15 $732.09 15 $86.22 15 $136.13 15 $12.1015 $732.09 15 $86.22 15 $136.13 15 $12.10
IRR -8.69% IRR -16.57% IRR -15.12% IRR -34.18%
NPV ($14,041.46) NPV ($5,753.90) NPV ($7,244.32) NPV ($17,641.50)
AROI -4.37% AROI -5.80% AROI -5.61% AROI -6.62%

ECRMBorough Hall
Flushometers/SensorsPublic Library
Flushometers/SensorsDPW Garages
Flushometers/SensorsFire Department
Flushometers/Sensors
Assumed Inflation (Water) 3% 3% 3% 3%
Initial Yearly Savings (Water) $484.00 $57.00 $90.00 $8.00
Assumed Average Useful Life (Years) 15 15 15 15
Lifetime Savings $9,001.87 $1,060.14 $1,673.90 $148.79
Year Annual Savings Annual Savings Annual Savings Annual Savings
1 $484.00 $57.00 $90.00 $8.00
2 $498.52 $58.71 $92.70 $8.24
3 $513.48 $60.47 $95.48 $8.49
4 $528.88 $62.29 $98.35 $8.74
5 $544.75 $64.15 $101.30 $9.00
6 $561.09 $66.08 $104.33 $9.27
7 $577.92 $68.06 $107.46 $9.55
8 $595.26 $70.10 $110.69 $9.84
9 $613.12 $72.21 $114.01 $10.13
10 $631.51 $74.37 $117.43 $10.44
11 $650.46 $76.60 $120.95 $10.75
12 $669.97 $78.90 $124.58 $11.07
13 $690.07 $81.27 $128.32 $11.41
14 $710.77 $83.71 $132.17 $11.75
15 $732.09 $86.22 $136.13 $12.10
16
17
18
19
20
21
22
23
24
25

APPENDIX J
WIND CAD MODELING

Wi dC d T bi P f M d lWindCad Turbine Performance ModelWindCad Turbine Performance ModelBWC EXCEL S Grid Intertie / S CBWC EXCEL-S, Grid - Intertie Tier/neo-SH3055-23-BWCBWC EXCEL S, Grid Intertie Tier/neo SH3055 23 BWC
P d F B h f W t dPrepared For: Borough of Westwoodp gSite Location: DPW GroundsSite Location: DPW GroundsData Source: NASAData Source: NASA
Date: 3/31/2010Date: 3/31/2010
Inputs: Results:Inputs: Results:pA Wi d ( / ) 4 72 H b A Wi d S d ( / ) 4 72Ave. Wind (m/s) = 4.72 Hub Average Wind Speed (m/s) = 4.72( ) g p ( )
Weibull K = 2 Air Density Factor = 1%Weibull K = 2 Air Density Factor = -1%Site Altitude (m) = 72 Average Output Power (kW) = 1 22Site Altitude (m) = 72 Average Output Power (kW) = 1.22Wi d Sh E 0 180 D il E O (kWh) 29 2Wind Shear Exp. = 0.180 Daily Energy Output (kWh) = 29.2Wind Shear Exp. 0.180 Daily Energy Output (kWh) 29.2
Anem Height (m) = 30 Annual Energy Output (kWh) = 10 651Anem. Height (m) = 30 Annual Energy Output (kWh) = 10,651Tower Height (m) = 30 Monthly Energy Output = 888Tower Height (m) = 30 Monthly Energy Output = 888
Turbulence Factor = 5.0% Percent Operating Time = 64.7%Turbulence Factor 5.0% Percent Operating Time 64.7%
Weibull Performance CalculationsWeibull Performance CalculationsWind Speed Bin (m/s) Power (kW) Wind Probability (f) Net kW @ V Weibull Calculations:Wind Speed Bin (m/s) Power (kW) Wind Probability (f) Net kW @ V Weibull Calculations:
Wind speed probability is calculated as a Weib ll c r e defined b the a erage ind
1 0.00 6.86% 0.000Weibull Calculations:Wind speed probability is calculated as a Weib ll c r e defined b the a erage ind
1 0.00 6.86% 0.0002 0 00 12 34% 0 000
Weibull Calculations:Wind speed probability is calculated as a Weibull curve defined by the average wind speed and a shape factor K To facilitate2 0.00 12.34% 0.000
3 0 13 15 49% 0 020
Weibull Calculations:Wind speed probability is calculated as a Weibull curve defined by the average wind speed and a shape factor, K. To facilitate piece-wise integration, the wind speed range 3 0.13 15.49% 0.020
Weibull Calculations:Wind speed probability is calculated as a Weibull curve defined by the average wind speed and a shape factor, K. To facilitate piece-wise integration, the wind speed range is broken down into "bins" of 1 m/s in width (C l 1) F h i d d bi
4 0.41 16.10% 0.065
Weibull Calculations:Wind speed probability is calculated as a Weibull curve defined by the average wind speed and a shape factor, K. To facilitate piece-wise integration, the wind speed range is broken down into "bins" of 1 m/s in width (C l 1) F h i d d bi
4 0.41 16.10% 0.0655 0 83 14 62% 0 121
Weibull Calculations:Wind speed probability is calculated as a Weibull curve defined by the average wind speed and a shape factor, K. To facilitate piece-wise integration, the wind speed range is broken down into "bins" of 1 m/s in width (Column 1). For each wind speed bin, instantaneous wind turbine power (W
5 0.83 14.62% 0.1216 1 43 11 86% 0 169
Weibull Calculations:Wind speed probability is calculated as a Weibull curve defined by the average wind speed and a shape factor, K. To facilitate piece-wise integration, the wind speed range is broken down into "bins" of 1 m/s in width (Column 1). For each wind speed bin, instantaneous wind turbine power (W, Column 2)) is multiplied by the Weibull wind6 1.43 11.86% 0.169
Weibull Calculations:Wind speed probability is calculated as a Weibull curve defined by the average wind speed and a shape factor, K. To facilitate piece-wise integration, the wind speed range is broken down into "bins" of 1 m/s in width (Column 1). For each wind speed bin, instantaneous wind turbine power (W, Column 2)) is multiplied by the Weibull wind speed probability (f, Column 3). This cross 7 2.22 8.72% 0.193
Weibull Calculations:Wind speed probability is calculated as a Weibull curve defined by the average wind speed and a shape factor, K. To facilitate piece-wise integration, the wind speed range is broken down into "bins" of 1 m/s in width (Column 1). For each wind speed bin, instantaneous wind turbine power (W, Column 2)) is multiplied by the Weibull wind speed probability (f, Column 3). This cross 7 2.22 8.72% 0.193
8 3 24 5 84% 0 189
Weibull Calculations:Wind speed probability is calculated as a Weibull curve defined by the average wind speed and a shape factor, K. To facilitate piece-wise integration, the wind speed range is broken down into "bins" of 1 m/s in width (Column 1). For each wind speed bin, instantaneous wind turbine power (W, Column 2)) is multiplied by the Weibull wind speed probability (f, Column 3). This cross product (Net W, Column 4) is the
t ib ti t t bi t t8 3.24 5.84% 0.189
Weibull Calculations:Wind speed probability is calculated as a Weibull curve defined by the average wind speed and a shape factor, K. To facilitate piece-wise integration, the wind speed range is broken down into "bins" of 1 m/s in width (Column 1). For each wind speed bin, instantaneous wind turbine power (W, Column 2)) is multiplied by the Weibull wind speed probability (f, Column 3). This cross product (Net W, Column 4) is the contribution to average turbine power output contributed by wind speeds in that bin The9 4.53 3.59% 0.163
Weibull Calculations:Wind speed probability is calculated as a Weibull curve defined by the average wind speed and a shape factor, K. To facilitate piece-wise integration, the wind speed range is broken down into "bins" of 1 m/s in width (Column 1). For each wind speed bin, instantaneous wind turbine power (W, Column 2)) is multiplied by the Weibull wind speed probability (f, Column 3). This cross product (Net W, Column 4) is the contribution to average turbine power output contributed by wind speeds in that bin The%
10 6 06 2 03% 0 123
Weibull Calculations:Wind speed probability is calculated as a Weibull curve defined by the average wind speed and a shape factor, K. To facilitate piece-wise integration, the wind speed range is broken down into "bins" of 1 m/s in width (Column 1). For each wind speed bin, instantaneous wind turbine power (W, Column 2)) is multiplied by the Weibull wind speed probability (f, Column 3). This cross product (Net W, Column 4) is the contribution to average turbine power output contributed by wind speeds in that bin. The sum of these contributions is the average 10 6.06 2.03% 0.123
11 7 75 1 06% 0 082
Weibull Calculations:Wind speed probability is calculated as a Weibull curve defined by the average wind speed and a shape factor, K. To facilitate piece-wise integration, the wind speed range is broken down into "bins" of 1 m/s in width (Column 1). For each wind speed bin, instantaneous wind turbine power (W, Column 2)) is multiplied by the Weibull wind speed probability (f, Column 3). This cross product (Net W, Column 4) is the contribution to average turbine power output contributed by wind speeds in that bin. The sum of these contributions is the average power output of the turbine on a continuous, 11 7.75 1.06% 0.082
Weibull Calculations:Wind speed probability is calculated as a Weibull curve defined by the average wind speed and a shape factor, K. To facilitate piece-wise integration, the wind speed range is broken down into "bins" of 1 m/s in width (Column 1). For each wind speed bin, instantaneous wind turbine power (W, Column 2)) is multiplied by the Weibull wind speed probability (f, Column 3). This cross product (Net W, Column 4) is the contribution to average turbine power output contributed by wind speeds in that bin. The sum of these contributions is the average power output of the turbine on a continuous, 24 hour, basis.Best results are achieved using annual or
12 9.46 0.51% 0.048
Weibull Calculations:Wind speed probability is calculated as a Weibull curve defined by the average wind speed and a shape factor, K. To facilitate piece-wise integration, the wind speed range is broken down into "bins" of 1 m/s in width (Column 1). For each wind speed bin, instantaneous wind turbine power (W, Column 2)) is multiplied by the Weibull wind speed probability (f, Column 3). This cross product (Net W, Column 4) is the contribution to average turbine power output contributed by wind speeds in that bin. The sum of these contributions is the average power output of the turbine on a continuous, 24 hour, basis.Best results are achieved using annual or
12 9.46 0.51% 0.04813 10 73 0 23% 0 024
Weibull Calculations:Wind speed probability is calculated as a Weibull curve defined by the average wind speed and a shape factor, K. To facilitate piece-wise integration, the wind speed range is broken down into "bins" of 1 m/s in width (Column 1). For each wind speed bin, instantaneous wind turbine power (W, Column 2)) is multiplied by the Weibull wind speed probability (f, Column 3). This cross product (Net W, Column 4) is the contribution to average turbine power output contributed by wind speeds in that bin. The sum of these contributions is the average power output of the turbine on a continuous, 24 hour, basis.Best results are achieved using annual or monthly average wind speeds Use of daily13 10.73 0.23% 0.024
14 11 10 0 09% 0 010
Weibull Calculations:Wind speed probability is calculated as a Weibull curve defined by the average wind speed and a shape factor, K. To facilitate piece-wise integration, the wind speed range is broken down into "bins" of 1 m/s in width (Column 1). For each wind speed bin, instantaneous wind turbine power (W, Column 2)) is multiplied by the Weibull wind speed probability (f, Column 3). This cross product (Net W, Column 4) is the contribution to average turbine power output contributed by wind speeds in that bin. The sum of these contributions is the average power output of the turbine on a continuous, 24 hour, basis.Best results are achieved using annual or monthly average wind speeds. Use of daily or hourly average speeds is not 14 11.10 0.09% 0.010
Weibull Calculations:Wind speed probability is calculated as a Weibull curve defined by the average wind speed and a shape factor, K. To facilitate piece-wise integration, the wind speed range is broken down into "bins" of 1 m/s in width (Column 1). For each wind speed bin, instantaneous wind turbine power (W, Column 2)) is multiplied by the Weibull wind speed probability (f, Column 3). This cross product (Net W, Column 4) is the contribution to average turbine power output contributed by wind speeds in that bin. The sum of these contributions is the average power output of the turbine on a continuous, 24 hour, basis.Best results are achieved using annual or monthly average wind speeds. Use of daily or hourly average speeds is not recommended.15 11.38 0.04% 0.004
Weibull Calculations:Wind speed probability is calculated as a Weibull curve defined by the average wind speed and a shape factor, K. To facilitate piece-wise integration, the wind speed range is broken down into "bins" of 1 m/s in width (Column 1). For each wind speed bin, instantaneous wind turbine power (W, Column 2)) is multiplied by the Weibull wind speed probability (f, Column 3). This cross product (Net W, Column 4) is the contribution to average turbine power output contributed by wind speeds in that bin. The sum of these contributions is the average power output of the turbine on a continuous, 24 hour, basis.Best results are achieved using annual or monthly average wind speeds. Use of daily or hourly average speeds is not recommended.15 11.38 0.04% 0.004
16 11 46 0 01% 0 001
Weibull Calculations:Wind speed probability is calculated as a Weibull curve defined by the average wind speed and a shape factor, K. To facilitate piece-wise integration, the wind speed range is broken down into "bins" of 1 m/s in width (Column 1). For each wind speed bin, instantaneous wind turbine power (W, Column 2)) is multiplied by the Weibull wind speed probability (f, Column 3). This cross product (Net W, Column 4) is the contribution to average turbine power output contributed by wind speeds in that bin. The sum of these contributions is the average power output of the turbine on a continuous, 24 hour, basis.Best results are achieved using annual or monthly average wind speeds. Use of daily or hourly average speeds is not recommended.
16 11.46 0.01% 0.001
Weibull Calculations:Wind speed probability is calculated as a Weibull curve defined by the average wind speed and a shape factor, K. To facilitate piece-wise integration, the wind speed range is broken down into "bins" of 1 m/s in width (Column 1). For each wind speed bin, instantaneous wind turbine power (W, Column 2)) is multiplied by the Weibull wind speed probability (f, Column 3). This cross product (Net W, Column 4) is the contribution to average turbine power output contributed by wind speeds in that bin. The sum of these contributions is the average power output of the turbine on a continuous, 24 hour, basis.Best results are achieved using annual or monthly average wind speeds. Use of daily or hourly average speeds is not recommended.
17 11.47 0.00% 0.000
Weibull Calculations:Wind speed probability is calculated as a Weibull curve defined by the average wind speed and a shape factor, K. To facilitate piece-wise integration, the wind speed range is broken down into "bins" of 1 m/s in width (Column 1). For each wind speed bin, instantaneous wind turbine power (W, Column 2)) is multiplied by the Weibull wind speed probability (f, Column 3). This cross product (Net W, Column 4) is the contribution to average turbine power output contributed by wind speeds in that bin. The sum of these contributions is the average power output of the turbine on a continuous, 24 hour, basis.Best results are achieved using annual or monthly average wind speeds. Use of daily or hourly average speeds is not recommended.
18 11.42 0.00% 0.000
Weibull Calculations:Wind speed probability is calculated as a Weibull curve defined by the average wind speed and a shape factor, K. To facilitate piece-wise integration, the wind speed range is broken down into "bins" of 1 m/s in width (Column 1). For each wind speed bin, instantaneous wind turbine power (W, Column 2)) is multiplied by the Weibull wind speed probability (f, Column 3). This cross product (Net W, Column 4) is the contribution to average turbine power output contributed by wind speeds in that bin. The sum of these contributions is the average power output of the turbine on a continuous, 24 hour, basis.Best results are achieved using annual or monthly average wind speeds. Use of daily or hourly average speeds is not recommended.
18 11.42 0.00% 0.00019 11 25 0 00% 0 000
Weibull Calculations:Wind speed probability is calculated as a Weibull curve defined by the average wind speed and a shape factor, K. To facilitate piece-wise integration, the wind speed range is broken down into "bins" of 1 m/s in width (Column 1). For each wind speed bin, instantaneous wind turbine power (W, Column 2)) is multiplied by the Weibull wind speed probability (f, Column 3). This cross product (Net W, Column 4) is the contribution to average turbine power output contributed by wind speeds in that bin. The sum of these contributions is the average power output of the turbine on a continuous, 24 hour, basis.Best results are achieved using annual or monthly average wind speeds. Use of daily or hourly average speeds is not recommended.
19 11.25 0.00% 0.000
Weibull Calculations:Wind speed probability is calculated as a Weibull curve defined by the average wind speed and a shape factor, K. To facilitate piece-wise integration, the wind speed range is broken down into "bins" of 1 m/s in width (Column 1). For each wind speed bin, instantaneous wind turbine power (W, Column 2)) is multiplied by the Weibull wind speed probability (f, Column 3). This cross product (Net W, Column 4) is the contribution to average turbine power output contributed by wind speeds in that bin. The sum of these contributions is the average power output of the turbine on a continuous, 24 hour, basis.Best results are achieved using annual or monthly average wind speeds. Use of daily or hourly average speeds is not recommended.
20 10.80 0.00% 0.000
Weibull Calculations:Wind speed probability is calculated as a Weibull curve defined by the average wind speed and a shape factor, K. To facilitate piece-wise integration, the wind speed range is broken down into "bins" of 1 m/s in width (Column 1). For each wind speed bin, instantaneous wind turbine power (W, Column 2)) is multiplied by the Weibull wind speed probability (f, Column 3). This cross product (Net W, Column 4) is the contribution to average turbine power output contributed by wind speeds in that bin. The sum of these contributions is the average power output of the turbine on a continuous, 24 hour, basis.Best results are achieved using annual or monthly average wind speeds. Use of daily or hourly average speeds is not recommended.
20 10.80 0.00% 0.0002008 BWC Totals: 99 41% 1 216
Weibull Calculations:Wind speed probability is calculated as a Weibull curve defined by the average wind speed and a shape factor, K. To facilitate piece-wise integration, the wind speed range is broken down into "bins" of 1 m/s in width (Column 1). For each wind speed bin, instantaneous wind turbine power (W, Column 2)) is multiplied by the Weibull wind speed probability (f, Column 3). This cross product (Net W, Column 4) is the contribution to average turbine power output contributed by wind speeds in that bin. The sum of these contributions is the average power output of the turbine on a continuous, 24 hour, basis.Best results are achieved using annual or monthly average wind speeds. Use of daily or hourly average speeds is not recommended.
2008, BWC Totals: 99.41% 1.216
Weibull Calculations:Wind speed probability is calculated as a Weibull curve defined by the average wind speed and a shape factor, K. To facilitate piece-wise integration, the wind speed range is broken down into "bins" of 1 m/s in width (Column 1). For each wind speed bin, instantaneous wind turbine power (W, Column 2)) is multiplied by the Weibull wind speed probability (f, Column 3). This cross product (Net W, Column 4) is the contribution to average turbine power output contributed by wind speeds in that bin. The sum of these contributions is the average power output of the turbine on a continuous, 24 hour, basis.Best results are achieved using annual or monthly average wind speeds. Use of daily or hourly average speeds is not recommended.
Weibull Calculations:Wind speed probability is calculated as a Weibull curve defined by the average wind speed and a shape factor, K. To facilitate piece-wise integration, the wind speed range is broken down into "bins" of 1 m/s in width (Column 1). For each wind speed bin, instantaneous wind turbine power (W, Column 2)) is multiplied by the Weibull wind speed probability (f, Column 3). This cross product (Net W, Column 4) is the contribution to average turbine power output contributed by wind speeds in that bin. The sum of these contributions is the average power output of the turbine on a continuous, 24 hour, basis.Best results are achieved using annual or monthly average wind speeds. Use of daily or hourly average speeds is not recommended.

Wi dC d T bi P f M d lWindCad Turbine Performance ModelWindCad Turbine Performance ModelBWC EXCEL S Grid IntertieBWC EXCEL-S, Grid - Intertie Tier/neo-SH3055-23-BWCBWC EXCEL S, Grid Intertie Tier/neo SH3055 23 BWC
P d F B h f W t dPrepared For: Borough of WestwoodPrepared For: Borough of WestwoodSite Location: DPW GroundsSite Location: DPW GroundsData Source: NASAData Source: NASA
Date: 3/31/2010Date: 3/31/2010
Inputs: Results:Inputs: Results:puts esu tsAve. Wind (m/s) = 5.52 Hub Average Wind Speed (m/s) = 5.52Ave. Wind (m/s) 5.52 Hub Average Wind Speed (m/s) 5.52
Weibull K = 2 Air Density Factor = 1%Weibull K = 2 Air Density Factor = -1%ySite Altitude (m) = 72 Average Output Power (kW) = 1 85Site Altitude (m) = 72 Average Output Power (kW) = 1.85Wind Shear Exp. = 0.180 Daily Energy Output (kWh) = 44.4Wind Shear Exp. = 0.180 Daily Energy Output (kWh) = 44.4
A H i ht ( ) 30 Ann al Energ O tp t (kWh) 16 194Anem. Height (m) = 30 Annual Energy Output (kWh) = 16,194g ( ) gy p ( ) ,Tower Height (m) = 30 Monthly Energy Output = 1 350Tower Height (m) = 30 Monthly Energy Output = 1,350
Turbulence Factor = 5 0% Percent Operating Time = 72 8%Turbulence Factor = 5.0% Percent Operating Time = 72.8%
Weibull Performance CalculationsWeibull Performance CalculationsWi d S d Bi ( / ) P (kW) Wi d P b bilit (f) N t kW @ V Weibull Calculations:Wind Speed Bin (m/s) Power (kW) Wind Probability (f) Net kW @ V Weibull Calculations:
Wind speed probability is calculated as a Weib ll c r e defined b the a erage ind
p ( ) ( ) y ( ) @1 0 00 5 07% 0 000
Weibull Calculations:Wind speed probability is calculated as a Weib ll c r e defined b the a erage ind
1 0.00 5.07% 0.0002 0 00 9 37% 0 000
Weibull Calculations:Wind speed probability is calculated as a Weibull curve defined by the average wind speed and a shape factor K To facilitate2 0.00 9.37% 0.000
Weibull Calculations:Wind speed probability is calculated as a Weibull curve defined by the average wind speed and a shape factor, K. To facilitate piece-wise integration, the wind speed range 3 0.13 12.34% 0.016
Weibull Calculations:Wind speed probability is calculated as a Weibull curve defined by the average wind speed and a shape factor, K. To facilitate piece-wise integration, the wind speed range 3 0.13 12.34% 0.016
4 0 41 13 72% 0 056
Weibull Calculations:Wind speed probability is calculated as a Weibull curve defined by the average wind speed and a shape factor, K. To facilitate piece-wise integration, the wind speed range is broken down into "bins" of 1 m/s in width (C )
4 0.41 13.72% 0.0565 0 83 13 57% 0 113
Weibull Calculations:Wind speed probability is calculated as a Weibull curve defined by the average wind speed and a shape factor, K. To facilitate piece-wise integration, the wind speed range is broken down into "bins" of 1 m/s in width (Column 1). For each wind speed bin, instantaneous wind turbine power (W
5 0.83 13.57% 0.113
Weibull Calculations:Wind speed probability is calculated as a Weibull curve defined by the average wind speed and a shape factor, K. To facilitate piece-wise integration, the wind speed range is broken down into "bins" of 1 m/s in width (Column 1). For each wind speed bin, instantaneous wind turbine power (W, Column 2)) is multiplied by the Weibull wind6 1.43 12.24% 0.174
Weibull Calculations:Wind speed probability is calculated as a Weibull curve defined by the average wind speed and a shape factor, K. To facilitate piece-wise integration, the wind speed range is broken down into "bins" of 1 m/s in width (Column 1). For each wind speed bin, instantaneous wind turbine power (W, Column 2)) is multiplied by the Weibull wind6 1.43 12.24% 0.174
7 2 22 10 18% 0 226
Weibull Calculations:Wind speed probability is calculated as a Weibull curve defined by the average wind speed and a shape factor, K. To facilitate piece-wise integration, the wind speed range is broken down into "bins" of 1 m/s in width (Column 1). For each wind speed bin, instantaneous wind turbine power (W, Column 2)) is multiplied by the Weibull wind speed probability (f, Column 3). This cross 7 2.22 10.18% 0.226
Weibull Calculations:Wind speed probability is calculated as a Weibull curve defined by the average wind speed and a shape factor, K. To facilitate piece-wise integration, the wind speed range is broken down into "bins" of 1 m/s in width (Column 1). For each wind speed bin, instantaneous wind turbine power (W, Column 2)) is multiplied by the Weibull wind speed probability (f, Column 3). This cross product (Net W, Column 4) is the
t ib ti t t bi t t8 3.24 7.88% 0.255
Weibull Calculations:Wind speed probability is calculated as a Weibull curve defined by the average wind speed and a shape factor, K. To facilitate piece-wise integration, the wind speed range is broken down into "bins" of 1 m/s in width (Column 1). For each wind speed bin, instantaneous wind turbine power (W, Column 2)) is multiplied by the Weibull wind speed probability (f, Column 3). This cross product (Net W, Column 4) is the
t ib ti t t bi t t8 3.24 7.88% 0.2559 4 53 5 70% 0 258
Weibull Calculations:Wind speed probability is calculated as a Weibull curve defined by the average wind speed and a shape factor, K. To facilitate piece-wise integration, the wind speed range is broken down into "bins" of 1 m/s in width (Column 1). For each wind speed bin, instantaneous wind turbine power (W, Column 2)) is multiplied by the Weibull wind speed probability (f, Column 3). This cross product (Net W, Column 4) is the contribution to average turbine power output contributed by wind speeds in that bin The9 4.53 5.70% 0.258
10 6 06 3 86% 0 234
Weibull Calculations:Wind speed probability is calculated as a Weibull curve defined by the average wind speed and a shape factor, K. To facilitate piece-wise integration, the wind speed range is broken down into "bins" of 1 m/s in width (Column 1). For each wind speed bin, instantaneous wind turbine power (W, Column 2)) is multiplied by the Weibull wind speed probability (f, Column 3). This cross product (Net W, Column 4) is the contribution to average turbine power output contributed by wind speeds in that bin. The sum of these contributions is the average 10 6.06 3.86% 0.234
Weibull Calculations:Wind speed probability is calculated as a Weibull curve defined by the average wind speed and a shape factor, K. To facilitate piece-wise integration, the wind speed range is broken down into "bins" of 1 m/s in width (Column 1). For each wind speed bin, instantaneous wind turbine power (W, Column 2)) is multiplied by the Weibull wind speed probability (f, Column 3). This cross product (Net W, Column 4) is the contribution to average turbine power output contributed by wind speeds in that bin. The sum of these contributions is the average power output of the turbine on a continuous, 11 7.75 2.46% 0.191
Weibull Calculations:Wind speed probability is calculated as a Weibull curve defined by the average wind speed and a shape factor, K. To facilitate piece-wise integration, the wind speed range is broken down into "bins" of 1 m/s in width (Column 1). For each wind speed bin, instantaneous wind turbine power (W, Column 2)) is multiplied by the Weibull wind speed probability (f, Column 3). This cross product (Net W, Column 4) is the contribution to average turbine power output contributed by wind speeds in that bin. The sum of these contributions is the average power output of the turbine on a continuous, 11 7.75 2.46% 0.191
12 9 46 1 48% 0 140
Weibull Calculations:Wind speed probability is calculated as a Weibull curve defined by the average wind speed and a shape factor, K. To facilitate piece-wise integration, the wind speed range is broken down into "bins" of 1 m/s in width (Column 1). For each wind speed bin, instantaneous wind turbine power (W, Column 2)) is multiplied by the Weibull wind speed probability (f, Column 3). This cross product (Net W, Column 4) is the contribution to average turbine power output contributed by wind speeds in that bin. The sum of these contributions is the average power output of the turbine on a continuous, 24 hour, basis.Best results are achieved using annual or
12 9.46 1.48% 0.140
Weibull Calculations:Wind speed probability is calculated as a Weibull curve defined by the average wind speed and a shape factor, K. To facilitate piece-wise integration, the wind speed range is broken down into "bins" of 1 m/s in width (Column 1). For each wind speed bin, instantaneous wind turbine power (W, Column 2)) is multiplied by the Weibull wind speed probability (f, Column 3). This cross product (Net W, Column 4) is the contribution to average turbine power output contributed by wind speeds in that bin. The sum of these contributions is the average power output of the turbine on a continuous, 24 hour, basis.Best results are achieved using annual or monthly average wind speeds Use of daily13 10.73 0.84% 0.090
Weibull Calculations:Wind speed probability is calculated as a Weibull curve defined by the average wind speed and a shape factor, K. To facilitate piece-wise integration, the wind speed range is broken down into "bins" of 1 m/s in width (Column 1). For each wind speed bin, instantaneous wind turbine power (W, Column 2)) is multiplied by the Weibull wind speed probability (f, Column 3). This cross product (Net W, Column 4) is the contribution to average turbine power output contributed by wind speeds in that bin. The sum of these contributions is the average power output of the turbine on a continuous, 24 hour, basis.Best results are achieved using annual or monthly average wind speeds. Use of daily or hourly average speeds is not 14 11.10 0.45% 0.049
Weibull Calculations:Wind speed probability is calculated as a Weibull curve defined by the average wind speed and a shape factor, K. To facilitate piece-wise integration, the wind speed range is broken down into "bins" of 1 m/s in width (Column 1). For each wind speed bin, instantaneous wind turbine power (W, Column 2)) is multiplied by the Weibull wind speed probability (f, Column 3). This cross product (Net W, Column 4) is the contribution to average turbine power output contributed by wind speeds in that bin. The sum of these contributions is the average power output of the turbine on a continuous, 24 hour, basis.Best results are achieved using annual or monthly average wind speeds. Use of daily or hourly average speeds is not 14 11.10 0.45% 0.049
15 11 38 0 22% 0 026
Weibull Calculations:Wind speed probability is calculated as a Weibull curve defined by the average wind speed and a shape factor, K. To facilitate piece-wise integration, the wind speed range is broken down into "bins" of 1 m/s in width (Column 1). For each wind speed bin, instantaneous wind turbine power (W, Column 2)) is multiplied by the Weibull wind speed probability (f, Column 3). This cross product (Net W, Column 4) is the contribution to average turbine power output contributed by wind speeds in that bin. The sum of these contributions is the average power output of the turbine on a continuous, 24 hour, basis.Best results are achieved using annual or monthly average wind speeds. Use of daily or hourly average speeds is not recommended.15 11.38 0.22% 0.026
Weibull Calculations:Wind speed probability is calculated as a Weibull curve defined by the average wind speed and a shape factor, K. To facilitate piece-wise integration, the wind speed range is broken down into "bins" of 1 m/s in width (Column 1). For each wind speed bin, instantaneous wind turbine power (W, Column 2)) is multiplied by the Weibull wind speed probability (f, Column 3). This cross product (Net W, Column 4) is the contribution to average turbine power output contributed by wind speeds in that bin. The sum of these contributions is the average power output of the turbine on a continuous, 24 hour, basis.Best results are achieved using annual or monthly average wind speeds. Use of daily or hourly average speeds is not recommended.
16 11.46 0.11% 0.012
Weibull Calculations:Wind speed probability is calculated as a Weibull curve defined by the average wind speed and a shape factor, K. To facilitate piece-wise integration, the wind speed range is broken down into "bins" of 1 m/s in width (Column 1). For each wind speed bin, instantaneous wind turbine power (W, Column 2)) is multiplied by the Weibull wind speed probability (f, Column 3). This cross product (Net W, Column 4) is the contribution to average turbine power output contributed by wind speeds in that bin. The sum of these contributions is the average power output of the turbine on a continuous, 24 hour, basis.Best results are achieved using annual or monthly average wind speeds. Use of daily or hourly average speeds is not recommended.
16 11.46 0.11% 0.01217 11 47 0 05% 0 006
Weibull Calculations:Wind speed probability is calculated as a Weibull curve defined by the average wind speed and a shape factor, K. To facilitate piece-wise integration, the wind speed range is broken down into "bins" of 1 m/s in width (Column 1). For each wind speed bin, instantaneous wind turbine power (W, Column 2)) is multiplied by the Weibull wind speed probability (f, Column 3). This cross product (Net W, Column 4) is the contribution to average turbine power output contributed by wind speeds in that bin. The sum of these contributions is the average power output of the turbine on a continuous, 24 hour, basis.Best results are achieved using annual or monthly average wind speeds. Use of daily or hourly average speeds is not recommended.
17 11.47 0.05% 0.00618 11 42 0 02% 0 002
Weibull Calculations:Wind speed probability is calculated as a Weibull curve defined by the average wind speed and a shape factor, K. To facilitate piece-wise integration, the wind speed range is broken down into "bins" of 1 m/s in width (Column 1). For each wind speed bin, instantaneous wind turbine power (W, Column 2)) is multiplied by the Weibull wind speed probability (f, Column 3). This cross product (Net W, Column 4) is the contribution to average turbine power output contributed by wind speeds in that bin. The sum of these contributions is the average power output of the turbine on a continuous, 24 hour, basis.Best results are achieved using annual or monthly average wind speeds. Use of daily or hourly average speeds is not recommended.
18 11.42 0.02% 0.002
Weibull Calculations:Wind speed probability is calculated as a Weibull curve defined by the average wind speed and a shape factor, K. To facilitate piece-wise integration, the wind speed range is broken down into "bins" of 1 m/s in width (Column 1). For each wind speed bin, instantaneous wind turbine power (W, Column 2)) is multiplied by the Weibull wind speed probability (f, Column 3). This cross product (Net W, Column 4) is the contribution to average turbine power output contributed by wind speeds in that bin. The sum of these contributions is the average power output of the turbine on a continuous, 24 hour, basis.Best results are achieved using annual or monthly average wind speeds. Use of daily or hourly average speeds is not recommended.
19 11.25 0.01% 0.001
Weibull Calculations:Wind speed probability is calculated as a Weibull curve defined by the average wind speed and a shape factor, K. To facilitate piece-wise integration, the wind speed range is broken down into "bins" of 1 m/s in width (Column 1). For each wind speed bin, instantaneous wind turbine power (W, Column 2)) is multiplied by the Weibull wind speed probability (f, Column 3). This cross product (Net W, Column 4) is the contribution to average turbine power output contributed by wind speeds in that bin. The sum of these contributions is the average power output of the turbine on a continuous, 24 hour, basis.Best results are achieved using annual or monthly average wind speeds. Use of daily or hourly average speeds is not recommended.
19 11.25 0.01% 0.00120 10 80 0 00% 0 000
Weibull Calculations:Wind speed probability is calculated as a Weibull curve defined by the average wind speed and a shape factor, K. To facilitate piece-wise integration, the wind speed range is broken down into "bins" of 1 m/s in width (Column 1). For each wind speed bin, instantaneous wind turbine power (W, Column 2)) is multiplied by the Weibull wind speed probability (f, Column 3). This cross product (Net W, Column 4) is the contribution to average turbine power output contributed by wind speeds in that bin. The sum of these contributions is the average power output of the turbine on a continuous, 24 hour, basis.Best results are achieved using annual or monthly average wind speeds. Use of daily or hourly average speeds is not recommended.
20 10.80 0.00% 0.000
Weibull Calculations:Wind speed probability is calculated as a Weibull curve defined by the average wind speed and a shape factor, K. To facilitate piece-wise integration, the wind speed range is broken down into "bins" of 1 m/s in width (Column 1). For each wind speed bin, instantaneous wind turbine power (W, Column 2)) is multiplied by the Weibull wind speed probability (f, Column 3). This cross product (Net W, Column 4) is the contribution to average turbine power output contributed by wind speeds in that bin. The sum of these contributions is the average power output of the turbine on a continuous, 24 hour, basis.Best results are achieved using annual or monthly average wind speeds. Use of daily or hourly average speeds is not recommended.
2008, BWC Totals: 99.56% 1.849
Weibull Calculations:Wind speed probability is calculated as a Weibull curve defined by the average wind speed and a shape factor, K. To facilitate piece-wise integration, the wind speed range is broken down into "bins" of 1 m/s in width (Column 1). For each wind speed bin, instantaneous wind turbine power (W, Column 2)) is multiplied by the Weibull wind speed probability (f, Column 3). This cross product (Net W, Column 4) is the contribution to average turbine power output contributed by wind speeds in that bin. The sum of these contributions is the average power output of the turbine on a continuous, 24 hour, basis.Best results are achieved using annual or monthly average wind speeds. Use of daily or hourly average speeds is not recommended.

Wi dC d T bi P f M d lWindCad Turbine Performance ModelWindCad Turbine Performance ModelBWC EXCEL S Grid IntertieBWC EXCEL-S, Grid - Intertie Tier/neo-SH3055-23-BWCBWC EXCEL S, Grid Intertie Tier/neo SH3055 23 BWC
P d F B h f W t dPrepared For: Borough of WestwoodPrepared For: Borough of WestwoodSite Location: DPW GroundsSite Location: DPW GroundsData Source: NASAData Source: NASA
Date: 3/31/2010Date: 3/31/2010
Inputs: Results:Inputs: Results:puts esu tsAve. Wind (m/s) = 3.81 Hub Average Wind Speed (m/s) = 3.81Ave. Wind (m/s) 3.81 Hub Average Wind Speed (m/s) 3.81
Weibull K = 2 Air Density Factor = 1%Weibull K = 2 Air Density Factor = -1%ySite Altitude (m) = 72 Average Output Power (kW) = 0 65Site Altitude (m) = 72 Average Output Power (kW) = 0.65Wind Shear Exp. = 0.180 Daily Energy Output (kWh) = 15.6Wind Shear Exp. = 0.180 Daily Energy Output (kWh) = 15.6
A H i ht ( ) 30 Ann al Energ O tp t (kWh) 5 705Anem. Height (m) = 30 Annual Energy Output (kWh) = 5,705g ( ) gy p ( ) ,Tower Height (m) = 30 Monthly Energy Output = 475Tower Height (m) = 30 Monthly Energy Output = 475
Turbulence Factor = 5 0% Percent Operating Time = 51 2%Turbulence Factor = 5.0% Percent Operating Time = 51.2%
Weibull Performance CalculationsWeibull Performance CalculationsWi d S d Bi ( / ) P (kW) Wi d P b bilit (f) N t kW @ V Weibull Calculations:Wind Speed Bin (m/s) Power (kW) Wind Probability (f) Net kW @ V Weibull Calculations:
Wind speed probability is calculated as a Weib ll c r e defined b the a erage ind
p ( ) ( ) y ( ) @1 0 00 10 33% 0 000
Weibull Calculations:Wind speed probability is calculated as a Weib ll c r e defined b the a erage ind
1 0.00 10.33% 0.0002 0 00 17 55% 0 000
Weibull Calculations:Wind speed probability is calculated as a Weibull curve defined by the average wind speed and a shape factor K To facilitate2 0.00 17.55% 0.000
Weibull Calculations:Wind speed probability is calculated as a Weibull curve defined by the average wind speed and a shape factor, K. To facilitate piece-wise integration, the wind speed range 3 0.13 20.04% 0.026
Weibull Calculations:Wind speed probability is calculated as a Weibull curve defined by the average wind speed and a shape factor, K. To facilitate piece-wise integration, the wind speed range 3 0.13 20.04% 0.026
4 0 41 18 23% 0 074
Weibull Calculations:Wind speed probability is calculated as a Weibull curve defined by the average wind speed and a shape factor, K. To facilitate piece-wise integration, the wind speed range is broken down into "bins" of 1 m/s in width (C )
4 0.41 18.23% 0.0745 0 83 13 95% 0 116
Weibull Calculations:Wind speed probability is calculated as a Weibull curve defined by the average wind speed and a shape factor, K. To facilitate piece-wise integration, the wind speed range is broken down into "bins" of 1 m/s in width (Column 1). For each wind speed bin, instantaneous wind turbine power (W
5 0.83 13.95% 0.116
Weibull Calculations:Wind speed probability is calculated as a Weibull curve defined by the average wind speed and a shape factor, K. To facilitate piece-wise integration, the wind speed range is broken down into "bins" of 1 m/s in width (Column 1). For each wind speed bin, instantaneous wind turbine power (W, Column 2)) is multiplied by the Weibull wind6 1.43 9.18% 0.131
Weibull Calculations:Wind speed probability is calculated as a Weibull curve defined by the average wind speed and a shape factor, K. To facilitate piece-wise integration, the wind speed range is broken down into "bins" of 1 m/s in width (Column 1). For each wind speed bin, instantaneous wind turbine power (W, Column 2)) is multiplied by the Weibull wind6 1.43 9.18% 0.131
7 2 22 5 27% 0 117
Weibull Calculations:Wind speed probability is calculated as a Weibull curve defined by the average wind speed and a shape factor, K. To facilitate piece-wise integration, the wind speed range is broken down into "bins" of 1 m/s in width (Column 1). For each wind speed bin, instantaneous wind turbine power (W, Column 2)) is multiplied by the Weibull wind speed probability (f, Column 3). This cross 7 2.22 5.27% 0.117
Weibull Calculations:Wind speed probability is calculated as a Weibull curve defined by the average wind speed and a shape factor, K. To facilitate piece-wise integration, the wind speed range is broken down into "bins" of 1 m/s in width (Column 1). For each wind speed bin, instantaneous wind turbine power (W, Column 2)) is multiplied by the Weibull wind speed probability (f, Column 3). This cross product (Net W, Column 4) is the
t ib ti t t bi t t8 3.24 2.66% 0.086
Weibull Calculations:Wind speed probability is calculated as a Weibull curve defined by the average wind speed and a shape factor, K. To facilitate piece-wise integration, the wind speed range is broken down into "bins" of 1 m/s in width (Column 1). For each wind speed bin, instantaneous wind turbine power (W, Column 2)) is multiplied by the Weibull wind speed probability (f, Column 3). This cross product (Net W, Column 4) is the
t ib ti t t bi t t8 3.24 2.66% 0.0869 4 53 1 18% 0 054
Weibull Calculations:Wind speed probability is calculated as a Weibull curve defined by the average wind speed and a shape factor, K. To facilitate piece-wise integration, the wind speed range is broken down into "bins" of 1 m/s in width (Column 1). For each wind speed bin, instantaneous wind turbine power (W, Column 2)) is multiplied by the Weibull wind speed probability (f, Column 3). This cross product (Net W, Column 4) is the contribution to average turbine power output contributed by wind speeds in that bin The9 4.53 1.18% 0.054
10 6 06 0 47% 0 028
Weibull Calculations:Wind speed probability is calculated as a Weibull curve defined by the average wind speed and a shape factor, K. To facilitate piece-wise integration, the wind speed range is broken down into "bins" of 1 m/s in width (Column 1). For each wind speed bin, instantaneous wind turbine power (W, Column 2)) is multiplied by the Weibull wind speed probability (f, Column 3). This cross product (Net W, Column 4) is the contribution to average turbine power output contributed by wind speeds in that bin. The sum of these contributions is the average 10 6.06 0.47% 0.028
Weibull Calculations:Wind speed probability is calculated as a Weibull curve defined by the average wind speed and a shape factor, K. To facilitate piece-wise integration, the wind speed range is broken down into "bins" of 1 m/s in width (Column 1). For each wind speed bin, instantaneous wind turbine power (W, Column 2)) is multiplied by the Weibull wind speed probability (f, Column 3). This cross product (Net W, Column 4) is the contribution to average turbine power output contributed by wind speeds in that bin. The sum of these contributions is the average power output of the turbine on a continuous, 11 7.75 0.16% 0.013
Weibull Calculations:Wind speed probability is calculated as a Weibull curve defined by the average wind speed and a shape factor, K. To facilitate piece-wise integration, the wind speed range is broken down into "bins" of 1 m/s in width (Column 1). For each wind speed bin, instantaneous wind turbine power (W, Column 2)) is multiplied by the Weibull wind speed probability (f, Column 3). This cross product (Net W, Column 4) is the contribution to average turbine power output contributed by wind speeds in that bin. The sum of these contributions is the average power output of the turbine on a continuous, 11 7.75 0.16% 0.013
12 9 46 0 05% 0 005
Weibull Calculations:Wind speed probability is calculated as a Weibull curve defined by the average wind speed and a shape factor, K. To facilitate piece-wise integration, the wind speed range is broken down into "bins" of 1 m/s in width (Column 1). For each wind speed bin, instantaneous wind turbine power (W, Column 2)) is multiplied by the Weibull wind speed probability (f, Column 3). This cross product (Net W, Column 4) is the contribution to average turbine power output contributed by wind speeds in that bin. The sum of these contributions is the average power output of the turbine on a continuous, 24 hour, basis.Best results are achieved using annual or
12 9.46 0.05% 0.005
Weibull Calculations:Wind speed probability is calculated as a Weibull curve defined by the average wind speed and a shape factor, K. To facilitate piece-wise integration, the wind speed range is broken down into "bins" of 1 m/s in width (Column 1). For each wind speed bin, instantaneous wind turbine power (W, Column 2)) is multiplied by the Weibull wind speed probability (f, Column 3). This cross product (Net W, Column 4) is the contribution to average turbine power output contributed by wind speeds in that bin. The sum of these contributions is the average power output of the turbine on a continuous, 24 hour, basis.Best results are achieved using annual or monthly average wind speeds Use of daily13 10.73 0.01% 0.002
Weibull Calculations:Wind speed probability is calculated as a Weibull curve defined by the average wind speed and a shape factor, K. To facilitate piece-wise integration, the wind speed range is broken down into "bins" of 1 m/s in width (Column 1). For each wind speed bin, instantaneous wind turbine power (W, Column 2)) is multiplied by the Weibull wind speed probability (f, Column 3). This cross product (Net W, Column 4) is the contribution to average turbine power output contributed by wind speeds in that bin. The sum of these contributions is the average power output of the turbine on a continuous, 24 hour, basis.Best results are achieved using annual or monthly average wind speeds. Use of daily or hourly average speeds is not 14 11.10 0.00% 0.000
Weibull Calculations:Wind speed probability is calculated as a Weibull curve defined by the average wind speed and a shape factor, K. To facilitate piece-wise integration, the wind speed range is broken down into "bins" of 1 m/s in width (Column 1). For each wind speed bin, instantaneous wind turbine power (W, Column 2)) is multiplied by the Weibull wind speed probability (f, Column 3). This cross product (Net W, Column 4) is the contribution to average turbine power output contributed by wind speeds in that bin. The sum of these contributions is the average power output of the turbine on a continuous, 24 hour, basis.Best results are achieved using annual or monthly average wind speeds. Use of daily or hourly average speeds is not 14 11.10 0.00% 0.000
15 11 38 0 00% 0 000
Weibull Calculations:Wind speed probability is calculated as a Weibull curve defined by the average wind speed and a shape factor, K. To facilitate piece-wise integration, the wind speed range is broken down into "bins" of 1 m/s in width (Column 1). For each wind speed bin, instantaneous wind turbine power (W, Column 2)) is multiplied by the Weibull wind speed probability (f, Column 3). This cross product (Net W, Column 4) is the contribution to average turbine power output contributed by wind speeds in that bin. The sum of these contributions is the average power output of the turbine on a continuous, 24 hour, basis.Best results are achieved using annual or monthly average wind speeds. Use of daily or hourly average speeds is not recommended.15 11.38 0.00% 0.000
Weibull Calculations:Wind speed probability is calculated as a Weibull curve defined by the average wind speed and a shape factor, K. To facilitate piece-wise integration, the wind speed range is broken down into "bins" of 1 m/s in width (Column 1). For each wind speed bin, instantaneous wind turbine power (W, Column 2)) is multiplied by the Weibull wind speed probability (f, Column 3). This cross product (Net W, Column 4) is the contribution to average turbine power output contributed by wind speeds in that bin. The sum of these contributions is the average power output of the turbine on a continuous, 24 hour, basis.Best results are achieved using annual or monthly average wind speeds. Use of daily or hourly average speeds is not recommended.
16 11.46 0.00% 0.000
Weibull Calculations:Wind speed probability is calculated as a Weibull curve defined by the average wind speed and a shape factor, K. To facilitate piece-wise integration, the wind speed range is broken down into "bins" of 1 m/s in width (Column 1). For each wind speed bin, instantaneous wind turbine power (W, Column 2)) is multiplied by the Weibull wind speed probability (f, Column 3). This cross product (Net W, Column 4) is the contribution to average turbine power output contributed by wind speeds in that bin. The sum of these contributions is the average power output of the turbine on a continuous, 24 hour, basis.Best results are achieved using annual or monthly average wind speeds. Use of daily or hourly average speeds is not recommended.
16 11.46 0.00% 0.00017 11 47 0 00% 0 000
Weibull Calculations:Wind speed probability is calculated as a Weibull curve defined by the average wind speed and a shape factor, K. To facilitate piece-wise integration, the wind speed range is broken down into "bins" of 1 m/s in width (Column 1). For each wind speed bin, instantaneous wind turbine power (W, Column 2)) is multiplied by the Weibull wind speed probability (f, Column 3). This cross product (Net W, Column 4) is the contribution to average turbine power output contributed by wind speeds in that bin. The sum of these contributions is the average power output of the turbine on a continuous, 24 hour, basis.Best results are achieved using annual or monthly average wind speeds. Use of daily or hourly average speeds is not recommended.
17 11.47 0.00% 0.00018 11 42 0 00% 0 000
Weibull Calculations:Wind speed probability is calculated as a Weibull curve defined by the average wind speed and a shape factor, K. To facilitate piece-wise integration, the wind speed range is broken down into "bins" of 1 m/s in width (Column 1). For each wind speed bin, instantaneous wind turbine power (W, Column 2)) is multiplied by the Weibull wind speed probability (f, Column 3). This cross product (Net W, Column 4) is the contribution to average turbine power output contributed by wind speeds in that bin. The sum of these contributions is the average power output of the turbine on a continuous, 24 hour, basis.Best results are achieved using annual or monthly average wind speeds. Use of daily or hourly average speeds is not recommended.
18 11.42 0.00% 0.000
Weibull Calculations:Wind speed probability is calculated as a Weibull curve defined by the average wind speed and a shape factor, K. To facilitate piece-wise integration, the wind speed range is broken down into "bins" of 1 m/s in width (Column 1). For each wind speed bin, instantaneous wind turbine power (W, Column 2)) is multiplied by the Weibull wind speed probability (f, Column 3). This cross product (Net W, Column 4) is the contribution to average turbine power output contributed by wind speeds in that bin. The sum of these contributions is the average power output of the turbine on a continuous, 24 hour, basis.Best results are achieved using annual or monthly average wind speeds. Use of daily or hourly average speeds is not recommended.
19 11.25 0.00% 0.000
Weibull Calculations:Wind speed probability is calculated as a Weibull curve defined by the average wind speed and a shape factor, K. To facilitate piece-wise integration, the wind speed range is broken down into "bins" of 1 m/s in width (Column 1). For each wind speed bin, instantaneous wind turbine power (W, Column 2)) is multiplied by the Weibull wind speed probability (f, Column 3). This cross product (Net W, Column 4) is the contribution to average turbine power output contributed by wind speeds in that bin. The sum of these contributions is the average power output of the turbine on a continuous, 24 hour, basis.Best results are achieved using annual or monthly average wind speeds. Use of daily or hourly average speeds is not recommended.
19 11.25 0.00% 0.00020 10 80 0 00% 0 000
Weibull Calculations:Wind speed probability is calculated as a Weibull curve defined by the average wind speed and a shape factor, K. To facilitate piece-wise integration, the wind speed range is broken down into "bins" of 1 m/s in width (Column 1). For each wind speed bin, instantaneous wind turbine power (W, Column 2)) is multiplied by the Weibull wind speed probability (f, Column 3). This cross product (Net W, Column 4) is the contribution to average turbine power output contributed by wind speeds in that bin. The sum of these contributions is the average power output of the turbine on a continuous, 24 hour, basis.Best results are achieved using annual or monthly average wind speeds. Use of daily or hourly average speeds is not recommended.
20 10.80 0.00% 0.000
Weibull Calculations:Wind speed probability is calculated as a Weibull curve defined by the average wind speed and a shape factor, K. To facilitate piece-wise integration, the wind speed range is broken down into "bins" of 1 m/s in width (Column 1). For each wind speed bin, instantaneous wind turbine power (W, Column 2)) is multiplied by the Weibull wind speed probability (f, Column 3). This cross product (Net W, Column 4) is the contribution to average turbine power output contributed by wind speeds in that bin. The sum of these contributions is the average power output of the turbine on a continuous, 24 hour, basis.Best results are achieved using annual or monthly average wind speeds. Use of daily or hourly average speeds is not recommended.
2008, BWC Totals: 99.09% 0.651
Weibull Calculations:Wind speed probability is calculated as a Weibull curve defined by the average wind speed and a shape factor, K. To facilitate piece-wise integration, the wind speed range is broken down into "bins" of 1 m/s in width (Column 1). For each wind speed bin, instantaneous wind turbine power (W, Column 2)) is multiplied by the Weibull wind speed probability (f, Column 3). This cross product (Net W, Column 4) is the contribution to average turbine power output contributed by wind speeds in that bin. The sum of these contributions is the average power output of the turbine on a continuous, 24 hour, basis.Best results are achieved using annual or monthly average wind speeds. Use of daily or hourly average speeds is not recommended.

APPENDIX K
WIND ENERGY FINANCING WORKSHEET

Borough of Westwood(Average Site Wind Speed @30m ‐ 10.56 mph)
Annual kWh 10,651Engineer's Opinion of Probable Cost $68,489.69
AssumptionsAnnual System Degredation 0.50%Annual Utility Inflation 3.00%Annual Maintenance Costs $0.02/kWh ProductionREC Factor $25/MWh ProductionREIP Incentive $3.20/kWh First 16,000 kWh
$0.50/kWh 16,000 kWh ‐ 750,000 kWh
Year Utility PriceAnnual Wind kWh
Production Utility SavingsRenewable Energy Credits (RECs)
Renewable Energy Incentive Program
(REIP) Maintenance Costs Annual Cash Flow Cumulative Cash Flow
1 0.1483 10,651.0 $1,579.5 $266 $34,083 ($213) $1,632.8 $1,632.82 0.1527 10,597.7 $1,618.8 $265 $0 ($212) $1,671.8 $3,304.63 0.1573 10,544.8 $1,659.0 $264 $0 ($211) $1,711.7 $5,016.34 0.1621 10,492.0 $1,700.2 $262 $0 ($210) $1,752.7 $6,769.05 0.1669 10,439.6 $1,742.5 $261 $0 ($209) $1,794.7 $8,563.76 0.1719 10,387.4 $1,785.8 $260 $0 ($208) $1,837.7 $10,401.57 0.1771 10,335.4 $1,830.2 $258 $0 ($207) $1,881.9 $12,283.38 0.1824 10,283.8 $1,875.7 $257 $0 ($206) $1,927.1 $14,210.49 0.1879 10,232.3 $1,922.3 $256 $0 ($205) $1,973.4 $16,183.810 0.1935 10,181.2 $1,970.0 $255 $0 ($204) $2,020.9 $18,204.811 0.1993 10,130.3 $2,019.0 $253 $0 ($203) $2,069.6 $20,274.412 0.2053 10,079.6 $2,069.2 $252 $0 ($202) $2,119.6 $22,394.013 0.2114 10,029.2 $2,120.6 $251 $0 ($201) $2,170.7 $24,564.714 0.2178 9,979.1 $2,173.3 $249 $0 ($200) $2,223.2 $26,787.915 0.2243 9,929.2 $2,227.3 $248 $0 ($199) $2,276.9 $29,064.816 0.2310 9,879.5 $2,282.6 $247 $0 ($198) $2,332.0 $31,396.817 0.2380 9,830.1 $2,339.4 $246 $0 ($197) $2,388.5 $33,785.418 0.2451 9,781.0 $2,397.5 $245 $0 ($196) $2,446.4 $36,231.719 0.2525 9,732.1 $2,457.1 $243 $0 ($195) $2,505.7 $38,737.520 0.2600 9,683.4 $2,518.1 $242 $0 ($194) $2,566.5 $41,304.021 0.2678 9,635.0 $2,580.7 $241 $0 ($193) $2,628.9 $43,932.922 0.2759 9,586.8 $2,644.8 $240 $0 ($192) $2,692.8 $46,625.723 0.2842 9,538.9 $2,710.6 $238 $0 ($191) $2,758.2 $49,383.924 0.2927 9,491.2 $2,777.9 $237 $0 ($190) $2,825.4 $52,209.325 0.3015 9,443.7 $2,846.9 $236 $0 ($189) $2,894.2 $55,103.4

Borough of Westwood(Maximum Average Site Wind Speed @30m ‐ 12.35 mph)
Annual kWh 16,194Engineer's Opinion of Probable Cost $68,489.69
AssumptionsAnnual System Degredation 0.50%Annual Utility Inflation 3.00%Annual Maintenance Costs $0.02/kWh ProductionREC Factor $25/MWh ProductionREIP Incentive $3.20/kWh First 16,000 kWh
$0.50/kWh 16,000 kWh ‐ 750,000 kWh
Year Utility PriceAnnual Wind kWh
Production Utility SavingsRenewable Energy Credits (RECs)
Renewable Energy Incentive Program
(REIP) Maintenance Costs Annual Cash Flow Cumulative Cash Flow
1 0.1483 16,194.0 $2,401.6 $405 $51,297 ($324) $2,482.5 $2,482.52 0.1527 16,113.0 $2,461.2 $403 $0 ($322) $2,541.8 $5,024.43 0.1573 16,032.5 $2,522.4 $401 $0 ($321) $2,602.6 $7,626.94 0.1621 15,952.3 $2,585.1 $399 $0 ($319) $2,664.9 $10,291.85 0.1669 15,872.5 $2,649.3 $397 $0 ($317) $2,728.7 $13,020.56 0.1719 15,793.2 $2,715.2 $395 $0 ($316) $2,794.1 $15,814.67 0.1771 15,714.2 $2,782.6 $393 $0 ($314) $2,861.2 $18,675.88 0.1824 15,635.6 $2,851.8 $391 $0 ($313) $2,930.0 $21,605.89 0.1879 15,557.5 $2,922.7 $389 $0 ($311) $3,000.4 $24,606.210 0.1935 15,479.7 $2,995.3 $387 $0 ($310) $3,072.7 $27,678.911 0.1993 15,402.3 $3,069.7 $385 $0 ($308) $3,146.7 $30,825.612 0.2053 15,325.3 $3,146.0 $383 $0 ($307) $3,222.6 $34,048.313 0.2114 15,248.6 $3,224.2 $381 $0 ($305) $3,300.4 $37,348.714 0.2178 15,172.4 $3,304.3 $379 $0 ($303) $3,380.2 $40,728.915 0.2243 15,096.5 $3,386.4 $377 $0 ($302) $3,461.9 $44,190.716 0.2310 15,021.1 $3,470.6 $376 $0 ($300) $3,545.7 $47,736.417 0.2380 14,945.9 $3,556.8 $374 $0 ($299) $3,631.5 $51,367.918 0.2451 14,871.2 $3,645.2 $372 $0 ($297) $3,719.5 $55,087.519 0.2525 14,796.9 $3,735.8 $370 $0 ($296) $3,809.8 $58,897.320 0.2600 14,722.9 $3,828.6 $368 $0 ($294) $3,902.2 $62,799.521 0.2678 14,649.3 $3,923.8 $366 $0 ($293) $3,997.0 $66,796.522 0.2759 14,576.0 $4,021.3 $364 $0 ($292) $4,094.1 $70,890.623 0.2842 14,503.1 $4,121.2 $363 $0 ($290) $4,193.7 $75,084.324 0.2927 14,430.6 $4,223.6 $361 $0 ($289) $4,295.7 $79,380.125 0.3015 14,358.5 $4,328.6 $359 $0 ($287) $4,400.3 $83,780.4
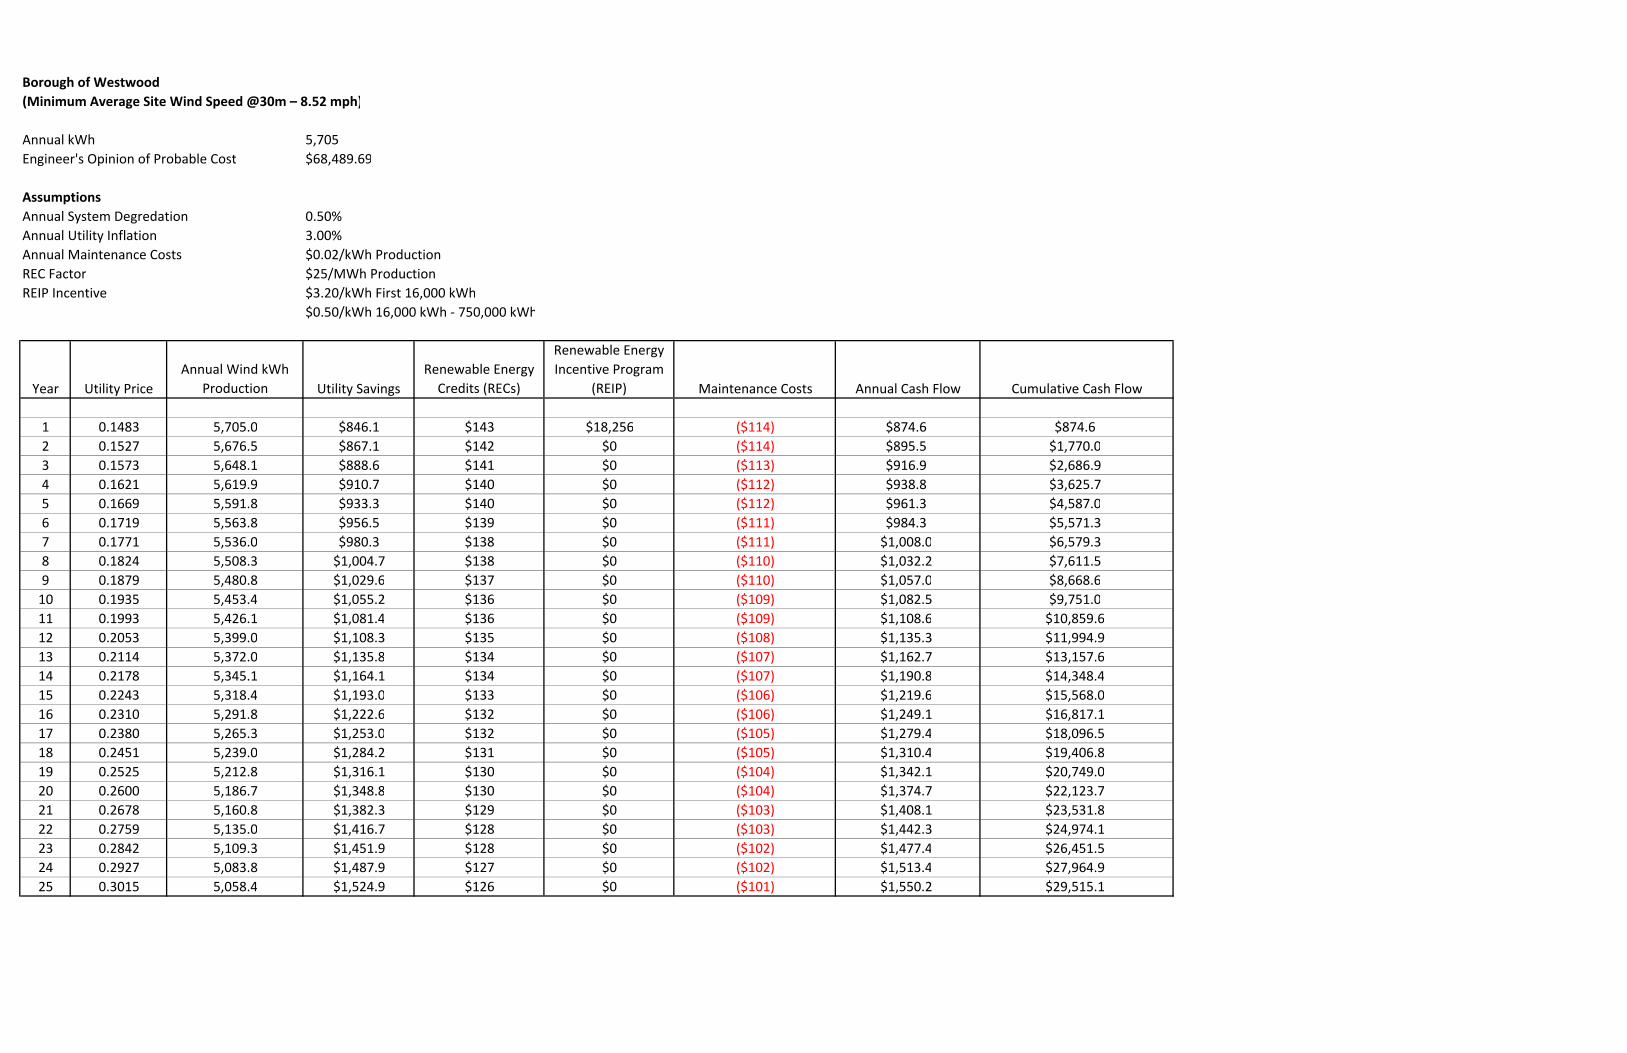
Borough of Westwood(Minimum Average Site Wind Speed @30m – 8.52 mph)
Annual kWh 5,705Engineer's Opinion of Probable Cost $68,489.69
AssumptionsAnnual System Degredation 0.50%Annual Utility Inflation 3.00%Annual Maintenance Costs $0.02/kWh ProductionREC Factor $25/MWh ProductionREIP Incentive $3.20/kWh First 16,000 kWh
$0.50/kWh 16,000 kWh ‐ 750,000 kWh
Year Utility PriceAnnual Wind kWh
Production Utility SavingsRenewable Energy Credits (RECs)
Renewable Energy Incentive Program
(REIP) Maintenance Costs Annual Cash Flow Cumulative Cash Flow
1 0.1483 5,705.0 $846.1 $143 $18,256 ($114) $874.6 $874.62 0.1527 5,676.5 $867.1 $142 $0 ($114) $895.5 $1,770.03 0.1573 5,648.1 $888.6 $141 $0 ($113) $916.9 $2,686.94 0.1621 5,619.9 $910.7 $140 $0 ($112) $938.8 $3,625.75 0.1669 5,591.8 $933.3 $140 $0 ($112) $961.3 $4,587.06 0.1719 5,563.8 $956.5 $139 $0 ($111) $984.3 $5,571.37 0.1771 5,536.0 $980.3 $138 $0 ($111) $1,008.0 $6,579.38 0.1824 5,508.3 $1,004.7 $138 $0 ($110) $1,032.2 $7,611.59 0.1879 5,480.8 $1,029.6 $137 $0 ($110) $1,057.0 $8,668.610 0.1935 5,453.4 $1,055.2 $136 $0 ($109) $1,082.5 $9,751.011 0.1993 5,426.1 $1,081.4 $136 $0 ($109) $1,108.6 $10,859.612 0.2053 5,399.0 $1,108.3 $135 $0 ($108) $1,135.3 $11,994.913 0.2114 5,372.0 $1,135.8 $134 $0 ($107) $1,162.7 $13,157.614 0.2178 5,345.1 $1,164.1 $134 $0 ($107) $1,190.8 $14,348.415 0.2243 5,318.4 $1,193.0 $133 $0 ($106) $1,219.6 $15,568.016 0.2310 5,291.8 $1,222.6 $132 $0 ($106) $1,249.1 $16,817.117 0.2380 5,265.3 $1,253.0 $132 $0 ($105) $1,279.4 $18,096.518 0.2451 5,239.0 $1,284.2 $131 $0 ($105) $1,310.4 $19,406.819 0.2525 5,212.8 $1,316.1 $130 $0 ($104) $1,342.1 $20,749.020 0.2600 5,186.7 $1,348.8 $130 $0 ($104) $1,374.7 $22,123.721 0.2678 5,160.8 $1,382.3 $129 $0 ($103) $1,408.1 $23,531.822 0.2759 5,135.0 $1,416.7 $128 $0 ($103) $1,442.3 $24,974.123 0.2842 5,109.3 $1,451.9 $128 $0 ($102) $1,477.4 $26,451.524 0.2927 5,083.8 $1,487.9 $127 $0 ($102) $1,513.4 $27,964.925 0.3015 5,058.4 $1,524.9 $126 $0 ($101) $1,550.2 $29,515.1

APPENDIX L
GLACIAL ENERGY – ALTERNATIVE ELECTRIC SUPPLIER QUOTE
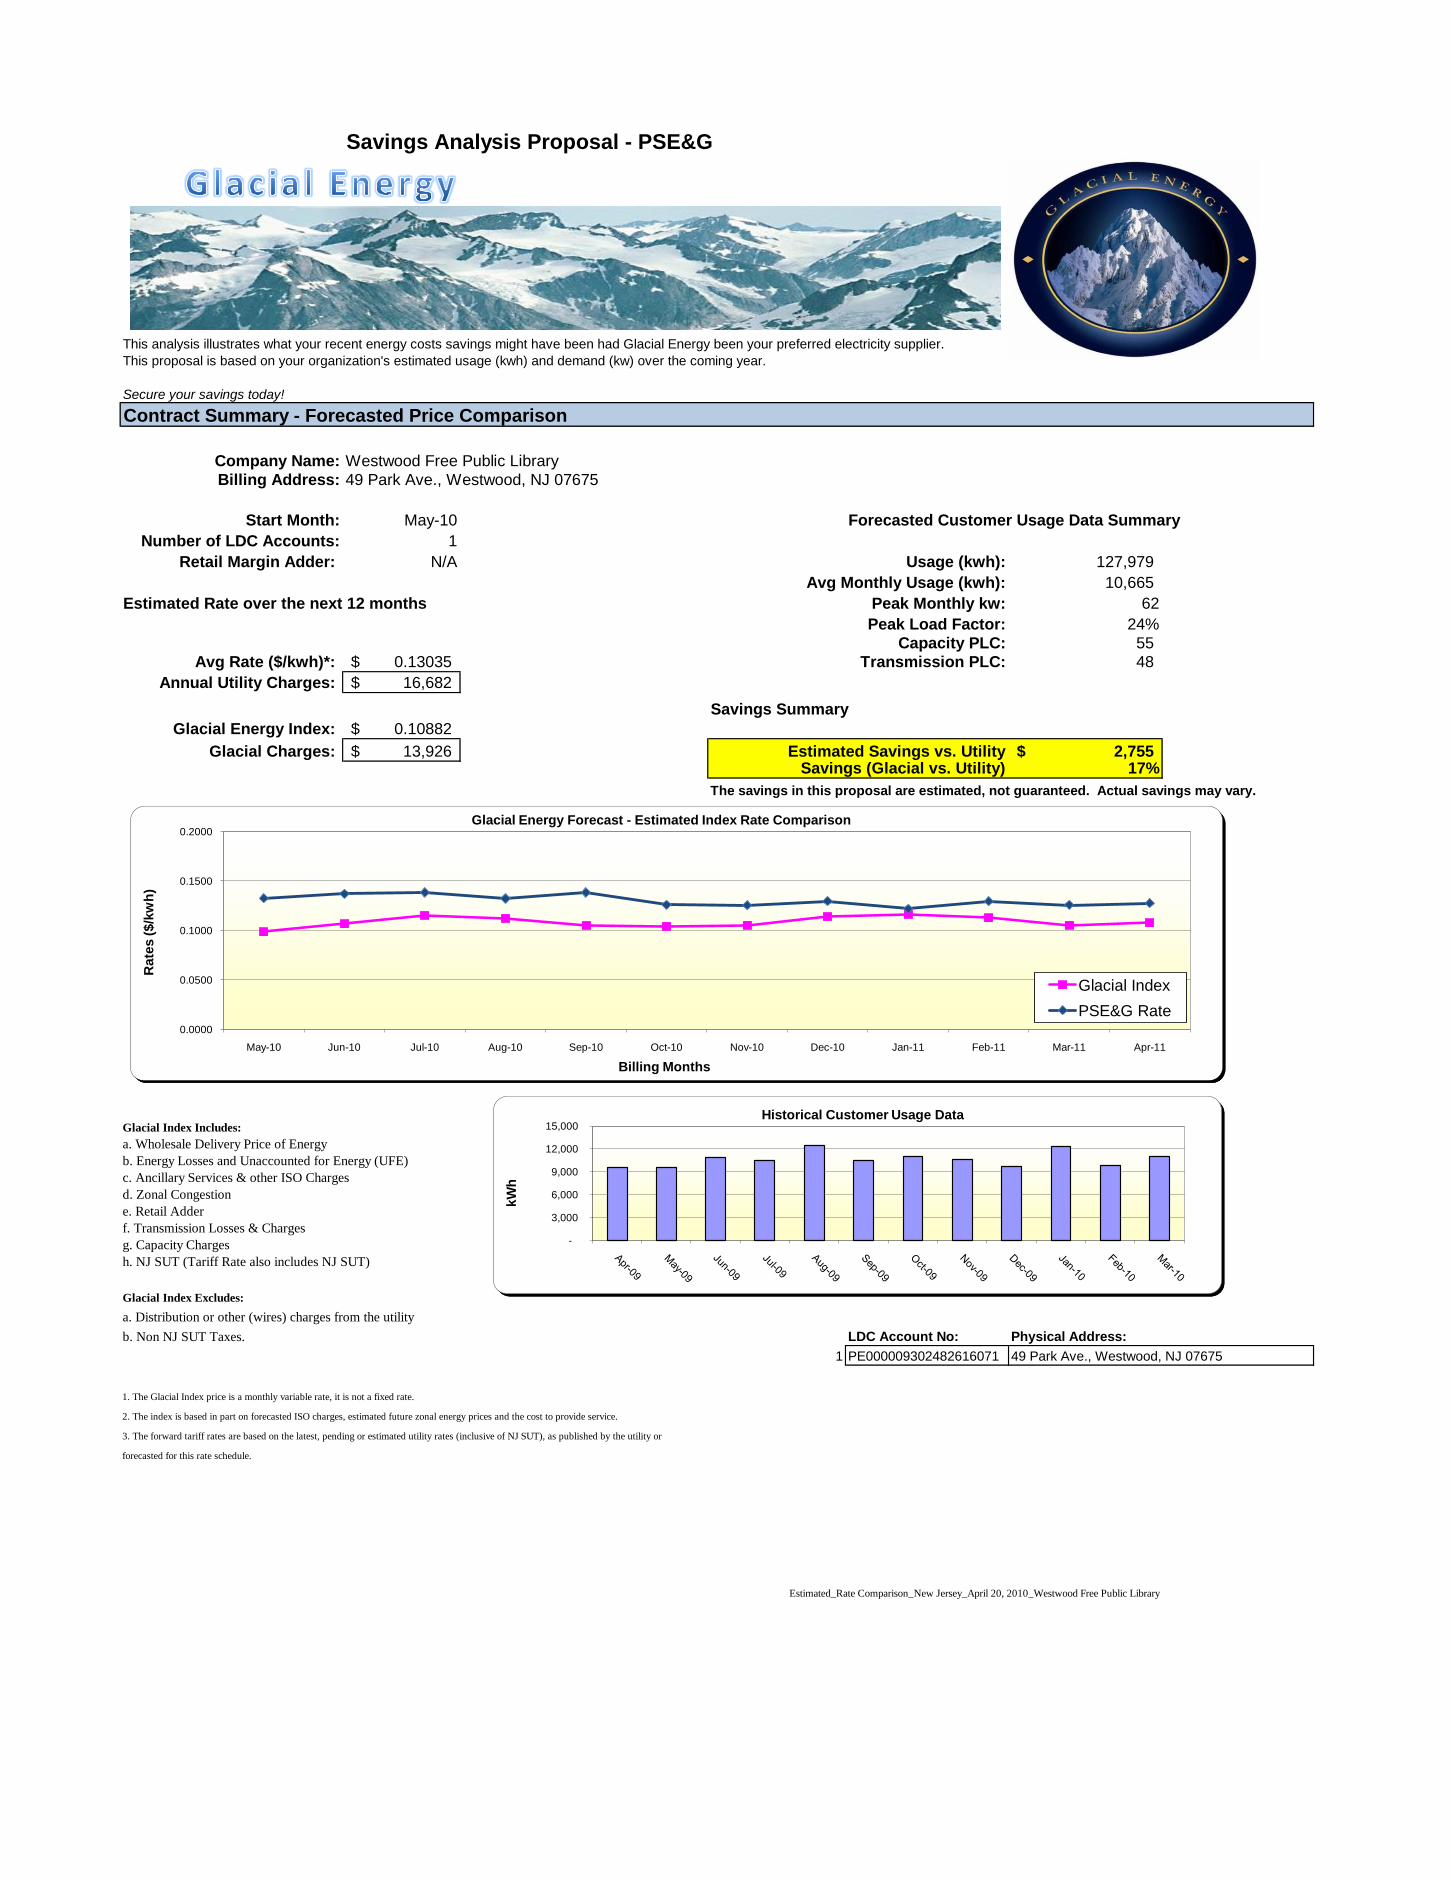
Savings Analysis Proposal - PSE&G
This analysis illustrates what your recent energy costs savings might have been had Glacial Energy been your preferred electricity supplier.
This proposal is based on your organization's estimated usage (kwh) and demand (kw) over the coming year.
Secure your savings today!
Contract Summary - Forecasted Price Comparison
Company Name: Westwood Free Public Library Annual Utility Charge Increase 8,740$
Billing Address: 49 Park Ave., Westwood, NJ 07675 Utility Rate Increase (%) 52%
Start Month: May-10 Forecasted Customer Usage Data Summary
Number of LDC Accounts: 1
Retail Margin Adder: N/A Usage (kwh): 127,979
Avg Monthly Usage (kwh): 10,665
Estimated Rate over the next 12 months Peak Monthly kw: 62
Peak Load Factor: 24%
Capacity PLC: 55
Avg Rate ($/kwh)*: 0.13035$ Transmission PLC: 48
Annual Utility Charges: 16,682$
Savings Summary
Glacial Energy Index: 0.10882$
Glacial Charges: 13,926$ Estimated Savings vs. Utility 2,755$ Savings (Glacial vs. Utility) 17%
The savings in this proposal are estimated, not guaranteed. Actual savings may vary.
1 Total Account
CAP PLC:
CAP Load Factor:
Annual Usage kwh:
Forecast Savings ($)
Forecast Savings (%)
Usage Month
05/01/10
06/01/10
07/01/10
08/01/10
09/01/10
10/01/10
11/01/10
12/01/10
Glacial Index Includes:
a. Wholesale Delivery Price of Energy
b. Energy Losses and Unaccounted for Energy (UFE)
c. Ancillary Services & other ISO Charges
d. Zonal Congestion
e. Retail Adder
f. Transmission Losses & Charges
g. Capacity Charges
h. NJ SUT (Tariff Rate also includes NJ SUT)
Glacial Index Excludes:
a. Distribution or other (wires) charges from the utility
b. Non NJ SUT Taxes. LDC Account No: Physical Address:
1 PE000009302482616071
1. The Glacial Index price is a monthly variable rate, it is not a fixed rate.
2. The index is based in part on forecasted ISO charges, estimated future zonal energy prices and the cost to provide service.
3. The forward tariff rates are based on the latest, pending or estimated utility rates (inclusive of NJ SUT), as published by the utility or
forecasted for this rate schedule.
Estimated_Rate Comparison_New Jersey_April 20, 2010_Westwood Free Public Library
Page 1 of 2
49 Park Ave., Westwood, NJ 07675
-
3,000
6,000
9,000
12,000
15,000
kW
h
Historical Customer Usage Data
0.0000
0.0500
0.1000
0.1500
0.2000
May-10 Jun-10 Jul-10 Aug-10 Sep-10 Oct-10 Nov-10 Dec-10 Jan-11 Feb-11 Mar-11 Apr-11
Ra
tes (
$/k
wh
)
Billing Months
Glacial Energy Forecast - Estimated Index Rate Comparison
Glacial Index
PSE&G Rate

Savings Analysis Proposal - PSE&G
This analysis illustrates what your recent energy costs savings might have been had Glacial Energy been your preferred electricity supplier.
Contract Summary - Historical Utility Charges
Company Name: Westwood Free Public Library
Billing Address: 49 Park Ave., Westwood, NJ 07675
Historical Timeframe (mo.): 6
Start Month: Oct-09 6 month Period Summary
Number of LDC Accounts: 1
Usage (kwh): 64,456
Estimated Historical Utility Charges Avg Monthly Usage (kwh): 10,743
Peak Monthly kw: 62
Avg Rate ($/kwh): 0.12320$ Peak Load Factor: 24%
Annual Utility Charges: 7,941$ Capacity PLC: 55
Transmission PLC: 48
Historical Glacial Index: 0.10520$
Historical Glacial Charges: 6,780$ Savings Summary
Historical Savings vs. Utility 1,161$
Historical Savings (Glacial vs. Utility) 15%
The savings in this proposal are estimated, not guaranteed. Actual savings will vary.
Glacial Index Includes:
a. Wholesale Delivery Price of Energy
b. Energy Losses and Unaccounted for Energy (UFE)
c. Ancillary Services & other ISO Charges
d. Zonal Congestion
e. Retail Adder
f. Transmission Losses & Charges
g. Capacity Charges
h. NJ SUT (Tariff Rate also includes NJ SUT)
Glacial Index Excludes:
a. Distribution or other (wires) charges from the utility
b. Non NJ SUT Taxes.
1. The historic tariff rate comparison is based on the customer's historical usage as provided or estimated and provided or estimated demand over the previous term.
2. Savings are based on the corresponding utility rates for the appropriate rate schedule over the analysis term.
Estimated_Rate Comparison_New Jersey_April 20, 2010_Westwood Free Public Library
0.0000
0.0500
0.1000
0.1500
0.2000
Oct-09 Nov-09 Dec-09 Jan-10 Feb-10 Mar-10
Rate
s (
$/k
wh
)
Billing Months
Glaical Energy Historical-Estimated Index Rate Comparison
Glacial Index
PSE&G Rate

APPENDIX M
WATER FIXTURE INVENTORY

Building Occupants Fixture Type QuantityExisting Water Use (gpm or gallons per flush)
Estimated Existing Monthly Water Use
(gallons)*
Low‐Flo Fixture Water Use (gpm or gallons per
flush)Estimate Future Monthly
Water Use (gallons)
Current Annual Cost
Future Annual Cost
Annual Savings
Faucets 13 3 2295 1.5 1147.5Toilets 11 3.5 10710 1.3 3978Urinals 8 2 1530 0.5 240
Faucets 5 3 315 1.5 157.5Toilets 5 3.5 1470 1.3 546Urinals 0 2 0 0.5 0
Faucets 7 3 495 1.5 247.5Toilets 6 3.5 2310 1.3 858Urinals 0 2 0 0.5 0
Faucets 16 3 45 1.5 22.5Toilets 11 3.5 210 1.3 78Urinals 0 2 0 0.5 0
Assumed Water Cost (Local United Water Rate, Per 1,000 Gallons): $4.3967
$484
$57
$90
$8
$37
$58
$13
$28351
7
11
1 $5
*Includes the assumption that occupants utilize toilets 2 times per day, and that half the occupants utilize urinals 2 times per day. Additionally, occupants are assumed to use faucets for 15 second durations, twice per day. These assumptions are considered conservative.
Borough of Westwood Water Fixtures
Borough Hall
Public Library
DPW Garages
Fire Department
$767
$94
$148