final drainage design report - maine.gov drainage design report route 302, fryeburg-bridgton, maine...
TRANSCRIPT

Final Drainage Design Report Route 302, Fryeburg-Bridgton, Maine
For: FST, Inc.
And Maine Department of Transportation
By: Northstar Hydro, Inc.
April, 2014


Final Design Drainage Report, Route 302, Fryeburg, Maine 1.0 Introduction This report summarizes final drainage design for approximately 5.3 miles of Route 302 in Fryeburg and Bridgton, Maine between Moose Pond to the east and the Saco River to the west. Figure 1 is a topographic map segment showing the drainage basins that influence the project.
Figure 1. Project location and drainage basins. 2.0 Hydrology Drainage basins are shown in Figure 1 and range in size from less than 10 acres to nearly 3500 acres. Flow direction varies throughout the project, but the project splits between the river and the lake drainage basins in West Bridgton. Land use is primarily wooded with light residential development along the roadway. Hydrologic soil groups include A-D soils with a majority of soils in the B and C group. Peak flows were analyzed using model Hydrocad, the Rational Formula and the USGS regional flow formula. Flows were computed for the 50- and 100-year
1

storms for cross culverts and 10-year flows were calculated to check ditches. The USGS formula was used for basins with a drainage area larger than 100 acres. An average of the USGS, Hydrocad and Rational methods was used for areas smaller than 100 acres. Drainage basins were re-evaluated for final design because some existing culverts that were proposed for replacement in preliminary design were combined or eliminated in this design phase. Hydrology detail is included in the appendix and Table 1 summarizes hydrologic computations. 3.0 Culverts Culvert calculations are summarized for all cross culverts in table 2 on the following page. Text below discusses each crossing. Culvert crossings and drainage basins between project stations 315+00 to 375+00 are shown in Figure 2.
Figure 2. Drainage basins for culverts at 321+50 and 347+13 and 386+20.
2

Table 1. Final Drainage Report, Route 302Summary of Hydrologic ComputationsStation D.A. wetlands aquifer USGS Regional Formula flows, cfs
acres acres acres Q1.1 Q2 Q10 Q25 Q50 Q100 Q500321+50 405 125.04 6.9 4.4 8.7 16.7 21.2 24.8 28.7 37.9347+13 110 2.1 0 6.5 17 43.1 60.7 75.7 92.3 136.8386+32 57.7 0.3 0 3.9 10.7 28.2 40.3 50.7 62.3 93.8426+00 3491 0 0 0 0 0 0 0 0 0465+85 236 1.9 48 13.5 34.8 86.1 120.2 148.9 180.6 265.3479+13 66 0 0 4.5 12.4 32.6 46.5 58.5 71.8 108.1502+50 84 0 0 5.6 15.2 39.6 56.3 70.6 86.5 129.6507+29 43 0 0 3.1 8.6 23.1 33.2 41.9 51.6 78.3514+99 13 0 0 1.1 3.1 8.8 12.9 16.5 20.5 31.8521+50 704.8 3.6 0 37.3 91.4 216.4 297.1 364.1 437.5 631.1525+32 8.1 0 0 0.7 2.1 6 8.9 11.4 14.3 22.2540+61 123 0.4 0 7.8 20.6 52.6 74.3 92.8 113.3 168.5555+77 8.7 0 0 0.7 2.2 6.4 9.4 12 15.1 23.5565+41 27 1.3 0 1.6 4.3 11.4 16.3 20.4 25.1 37.8587 R 12.8 0 0 1.1 3.1 8.7 12.7 16.3 20.3 31.4
Station D.A. Hydrocad Comps Hydrocad model flows, cfsacres CN TC, min. Q1.1 Q10 Q25 Q50 Q100 Q500
321+50 405347+13 110386+32 57.7 72 44.4 27 70.1 113.4 132.9 149.4 193.2426+00 3491465+85 236479+13 66 65 39.2 17.2 60.4 107.9 129.9 148.8 199.9502+50 84 64 48 16.8 62.4 113.4 137.3 157.9 213.7507+29 43 67 38 14 45 78 93 106 141514+99 13 65 29.5 4.2 14.6 25.9 31.2 35.7 47.9521+50 704.8525+32 8.1 68 35 3.2 9.6 16.3 19.4 22 29.1540+61 123555+77 8.7 71 16.1 7.5 19.5 31.5 36.9 41.5 53.6565+41 27 68 33.4 10.9 32.9 56 66.6 75.6 99.8587 R 12.8 70 28 8 21.9 36.1 42.5 48 62
Station D.A. Rational Method Flows, cfs EXISTING CULVERTSacres C Q10 Q50 Q100 size, ft material
321+50 405 3 rcp347+13 110 1.5/2 rcp386+32 57.7 0.22 24.6 32.0 36.9 1.25 rcp426+00 3491 new bridge465+85 236 4x3 granite box479+13 66 0.22 31.2 41.6 48.0 2.5 rcp502+50 84 0.18 35.2 48.2 54.6 2 rcp507+29 43 0.18 17.8 24.3 27.6 2.5 rcp514+99 13 0.20 6.0 8.2 9.3 1.5 rcp521+50 704.8 7-8x11 conc box525+32 8.1 0.24 4.8 6.4 7.2 1.5 rcp540+61 123 1 X 3 box below broken dam555+77 8.7 0.25 8.0 10.5 12.2 2 rcp565+41 27 0.19 11.8 15.9 18.3 1.5 rcp587 R 12.8 0.19 6.7 8.8 10.3
3

Fryeburg-Bridgton Route 302Table 2 Culvert Calculation Summary
Station D.A. Existing AVE Round, smooth Other Invert up invert dn length SG up Top Rd US Top pipe Pipe Cover headwater SG - Hw commentsacres size,ft Q50 Q100 size HW/D ft ft ft ft ft ft 1' min Q50 Q100 0' min.
321+50.17 405 3 24.8 28.7 4 6'W x 4' H Bo 386.91 386.10 100 390.88 393 390.91 -0.03 389.25 389.35 1.63 HY-8 Analysis27 1.5 386.91 386.10 100 390.88 393 389.16 1.72 390.29 0.59
347+12.93 110 1.5/2 75.7 92.3 18 high 397.20 397.20 58 401 403 398.70 2.30 No Maint issues, wetland storage U.S24 high 397.20 397.20 58 401 403 399.20 1.80 high suggest 24" if possible to minimize potential for overtopping. 42 1.5 397.20 397.20 58 401 403 400.70 0.30 402.45
386+32.09 57.7 1.3 71.9 82.9 18 high 484.27 484.27 56 486.5 488.2 485.77 0.73 high No maint issues, wetland storage u.s.36 1.5 484.27 484.27 56 486.5 488.2 487.27 -0.77 488.77
426+00 3491 bridge not to be replaced465+84.78 236 4X3 148.9 180.6 54 1.3 421.03 420.55 97 429.7 432 425.53 4.17 426.88 2.82
60 1.15 60" ppp 421.03 420.55 97 429.7 432 426.03 3.67 426.78 2.92479+13.05 66 2.5 76.7 89.5 42 1.4 429.64 426.36 85 434.6 437 433.14 1.46 434.54 435.40 0.06
48 1 429.64 426.36 85 434.6 437 433.64 0.96 433.64 0.96502+50.00 84 2.0 85.4 99.7 42 1.5 445.47 442.88 80 450.72 453 448.97 1.75 450.72 0.00
48 1.1 445.47 442.88 80 450.72 453 449.47 1.25 449.87 0.85507+28.97 43 2.5 53.1 61.7 36 1.5 453.00 446.80 87 457.5 459 456.00 1.50 457.50 0.00
42 1 453.00 446.80 85 457.5 459 456.50 1.00 456.50 1.00514+98.87 13 1.5 18.6 21.8 24 1.5 439.92 439.59 66 443.39 445.2 441.92 1.47 442.92 0.47
27 1 439.92 439.59 66 443.39 445.2 442.17 1.22 442.17 1.22521+50 704.8 7-8X11 364.1 437.5 84 1.2 428.19 424.96 116 437.42 439 435.19 2.23 436.59 0.83
120 12'w x 10'h b 428.19 424.96 116 437.42 439 438.19 -0.77 431.30 432.00 6.12 HY-8 outlet control, 1.2X bankfull, fish525+32.29 8.1 1.5 12.4 14.5 24 1 450.70 448.31 69 453.54 456 452.70 0.84 452.70 454.70 0.84 can inlet be dropped by 0.7'?
30 0.7 450.70 448.31 69 453.54 456 453.20 0.34 452.45 1.09540+60.98 123 1X3 92.8 113.3 42 1.8 481.50 481.05 90 488.07 490.2 485.00 3.07 487.80 0.27 Storage assume 700' X 100'
1 3 X 1 box 481.50 481.05 90 488.07 490.2 481.58 6.49 490.40 -2.33 Q out = 12 cfs, overtops road by hydrocad30 5 embedded 1 481.50 481.05 90 488.07 490.2 484.00 4.07 486.20 1.87 Q out = 21 cfs, see hydrocad
555+77.25 8.7 2.0 19.8 22.9 18 1.2 508.80 505.53 92 514.13 517 510.30 3.83 510.60 3.53565+40.85 27 1.5 34.3 39.7 18 6 487.18 485.20 96 501.57 504.62 488.68 12.89 490.50 11.07 Keep 18" pipe, use upstream storage- see hydrocad587+00 R drive 12.8 22.5 26.2 18 1.5 420.47 419.99 30 423.05 423.05 421.97 1.08 422.72 0.33 need to check inverts and road elev
12.8 24 1.5 420.23 419.90 30 423.05 423.05 422.23 0.82 423.23 -0.1812.8 15 1.5 twin 15" 420.47 419.99 30 423.05 423.05 421.72 1.33 422.35 0.70 Driveway design for Q10 = 12.4
4

319+66: Approximately 9 acres that previously drained from south to north across the road will be routed along the south side of the project towards the river via drainage ditch to the box culvert at 321+50. 321+50: An existing 36” rcp drains approximately 405 total acres from project right to left. Several smaller basins join this watershed. This watershed has a large area of wetland, so expected outflows are lower than would be calculated without wetlands. 50-year flow is 25 cfs and 100-year flow is 29 cfs Maine DOT surveys indicate that this stream has fish on both sides of the culvert. Bank-full width determination was made by MDOT and measured at 4.9’. 1.2 times bank-full width would be approximately 6’. For fish passage, recommended size is a 6’ X 4’ box, embedded 1’. Standard recommended size would be a minimum size of 36” smooth lined culvert to match existing. The existing culvert at 321+50 shows signs of wear, with the road surface cracking above the culvert and the headwall cracked at the downstream end. The existing upstream invert is 387.4, and will be dropped to 385.94 with a subgrade is 390.4.
Figure 3. Downstream end of existing culvert near 321+50.
5

Figure 4. Road over culvert at 321+50. Note cracked road, and large flat area upstream.
Figure 5. Box culvert at old road just upstream of 321+50.
6

347+13: This existing 18-24” culvert drains a total of 110 acres including 2.1 acres of wetlands. The culvert flows from project left to right. Q50 is calculated to be 76 cfs. Recommended replacement size is 42” for smooth or ppp. With a new upstream invert of 397.2 and a subgrade of 401, headwater is limited. Calculated headwater for a 42” smooth pipe is 402.5. Maine DOT maintenance was consulted about this culvert and no known flooding issues were identified. A large wetland area upstream will serve to detain some runoff. Field observations by FST personnel also indicate a large flat area upstream. Assuming a wetland area of 1 acre, this site can detain about 3 acre-feet of runoff below subgrade. Based on the USGS formula flows inserted into Hydrocad, this drainage basin produces about 1.5” of runoff in a 50-year storm event. For 110 acres, this is a volume of about 12 acre feet of runoff in 24 hours. Hydrocad routing suggests a ponding depth of about 400.8’ for the 50-year storm event assuming that the upstream wetland is about 1.2 acres in size.
Figure 6. Downstream end of culvert at 347+13 Because large, flat wetland areas exist on both sides of the road at this location, the proposed 18” RCP will be set at a 0% grade and treated as an “equalizer” pipe. This design concept follows Maine DOT recommendations for this specific location.
7

365+65 The 7.1 acres that drain to an existing 15” culvert which drains from north to south on the project, will be removed. Runoff will be routed along the north side of the project via ditch.
Figure 7. Downstream end of 365+65. Upstream end submerged.
Figure 8. Ponded area downstream of 365+50 373+04 An existing culvert at 373+04 will be removed and the drainage area of 4 acres will be routed to flow on the south side of the project via ditch.
8

Figure 9. Downstream of 373+04 386+32 Figure 10 shows the drainage basin for the existing 15” culvert at 386+32. With a 50-year flow of 72 cfs, a replacement size of 42” would be suggested. However, maintenance records indicate no issues with this culvert. Grade at the road is very flat and a large wetland area was observed during field checks for this project. The road grade is low and downstream grade is low. Discussions indicate that an 18” pipe should be used to replace the 15” existing culvert, and upstream storage will be used to mitigate higher potential runoff flows. Upstream culvert invert is 484.3 and subgrade elevation is 486.5. Assuming a wetland storage area of about 1.2 acres, the 50-year storm event is not expected to overtop the roadway with an 18” culvert. Because large, flat wetland areas exist on both sides of the road at this location, the proposed 18” RCP will be set at 0% grade and treated as an equalizer. This design concept was recommended by Maine DOT for this specific location.
9

Figure 10. Drainage basin for 386+32
10

Figure 11. Downstream end of existing 386+32 submerged, showing low gradient. 417+90: An existing 15” rcp drains from R to L. This culvert will be removed and roadway ditching will route flows to the crossing at 426+00. 426+00. Elkins Brook drains approximately 3491 acres, crossing the project from right to left near station 426+00. A new bridge has recently been constructed at this location, so no further work is proposed for the current project. Figure 12 shows the drainage basin for this stream.
11

Figure 12. Drainage basin for Elkins Brook.
12

Figure 13. Drainage areas for culverts between 453+07 and 521+00 465+85: An existing 4X3’ granite box drains 236 acres with a 50-year flow of 149 cfs. The existing box would not be adequate to convey 149 cfs and maintain an HW/D ratio of less than 1.5. Alternative traditional culvert size is 60”. The upstream invert is 421.03 and the subgrade is elevation 429.7. Expected headwater for a 60” smooth culvert is 426.78 so invert and cover are adequate.
13

The existing culvert is in very poor shape and is very deep. It appears to be blocked, as flow is ponded on the upstream end and the stream downstream was dry on 5/9/13. During the winter field trip, low flow was observed downstream. Flow appeared to be seeping through on the upstream side. The drainage basin is shown above, according to the USGS map. Mapping prepared as part of the National Hydrography Database shows a significant flow area although field evidence of large drainage area is not clear.
Figure 14, Downstream of 465+85 showing dry stream.
Figure 15: Upstream end of 465+85 showing signs of slumping of existing granite box. Seepage observed.
14

Figure 16: Ponded area upstream of 465+85. 469+79: Two existing 18” culverts cross near 469+79 and 471+67, draining 5 acres each. These culverts will be removed and flow will be routed to the large crossing at 465+85 via roadway ditching.
Figure 17. Culvert at 471+67
15

479+13 An existing 30” concrete culvert in good condition currently drains 42 acres from right to left. The new drainage area will be 66 acres due to adding drainage from the existing crossing at 488+15. 50-year flow is calculated to be 77 cfs and the proposed replacement culvert is recommended to be 42”. The upstream invert will be 429.6’, and subgrade is at 434.6’. Projected 50-year headwater is 434.54. This culvert will be lengthened to 85’.
Figure 18. Downstream end of culvert at 479+13
Figure 19. Upstream end of culvert at 479+13
16

488+15: 22 acres drain from right to left to an existing 24” concrete culvert. This culvert will be removed and flow will be routed to the crossing at 479+13 via roadway ditches.
Figure 20. Downstream end of culvert at 488+15.
Figure 21: Ice flows downstream showing unconcentrated flow from 488+15. 493+00, 496+00, 501+11 and 502+50: A total of 84 acres drains to these four locations under existing conditions, draining from right to left. Existing culverts at 493+00, 496+00 and 502+50 are 24” concrete. The existing culvert at 501+11 is 30” concrete. The culverts at 493+00, 496+00 and 501+11 will be eliminated and drainage will be conveyed via ditching to 502+50.
17

Calculated 50-year flow for the combined culverts is 85 cfs. This flow requires a 42” smooth culvert. Upstream invert will be 445.47 and the subgrade will be 450.72. The invert will be dropped to accommodate the new culvert with adequate cover. This area has a somewhat steep gradient from R to L. For a 42” culvert, with upstream invert of 445.47, headwater for 50-year flow is projected be 450.72. Inlet and outlet protection for the new culvert is important due to the steep gradient.
Figure 22. Existing culvert at 493+00, downstream end.
Figure 23: upstream end of 493+00, cracking headwall.
18

Figure 24, US end of 496+00
Figure 25. Downstream of 496+00
19

Figure 26. Upstream end of 501+11
Figure 27. Stream downstream of 501+11.
20

Figure 28. DS face of 502+50. Note hanging outlet and seepage along top of headwall.
Figure 29. Downstream of 502+50
21

Figure 30. Upstream of 502+50. 507+29: 43 acres drains to an existing 30” concrete culvert. With a projected 50-year flow of 53 cfs, a 36” pipe is recommended for replacement. The upstream invert will be 453.00, subgrade at 457.5 and 50-year headwater of 457.50. This culvert and downstream area convey a steep stream that will need riprap protection on banks and at the stream outlet.
Figure 31. Stream upstream of 507+29. Note steep grade
22

Figure 32. Downstream face of 507+29. Note drop at outlet and steep grade
Figure 33. Eroded banks downstream of 507+29 514+99: 13 acres drain to an existing 18” concrete pipe which shows signs of blockage or freeze-up in winter (see figure 34). With a projected 50-year flow of 19 cfs, a replacement pipe
23

of 24” is recommended. Upstream invert will be 439.92 and the subgrade will be 443.39 with projected Q50 headwater of 442.92.
Figure 34. Downstream face of 514+99. Note significant seepage through subgrade. Culvert is blocked and not functioning.
Figure 35. Ditch/Stream upstream end of 514+99. 521+50: 704.8 acres drain to an existing 7-8’ H X 11’ W box culvert. This box has erosion issues upstream and conveys a “fish” stream across the project from right to left. 50-year flow is
24

calculated to be 364 cfs using the USGS Regional formula that includes wetlands. Maine DOT measured bank-full width for the stream at 10’, recommending a new width for the replacement culvert of 12’ or 1.2 X bank-full width. The existing culvert shows signs of deterioration through scour and age. The upstream embankment shows erosion along the roadway bank. The bank has been repaired with large boulder riprap, which is slumping. Bank erosion has also occurred near the cemetery on project right. The stream will be realigned upstream to avoid the eroded banks near the roadway and the railroad. Stream realignment details were reviewed by Maine DOT environmental staff.
The new bridge will be a box 12’ W X 10’ tall, with 2’ embedded. HY-8 analysis of a 12 X 8 box indicates that this size has adequate capacity to pass the 50- and 100-year storm events with Q50 of 364 cfs and Q100 of 437.5. The existing box has an open area of 88 square feet and the new box would have an open area of 96 square feet. Geomorphology at the site indicates significant flow at this site in past storms.
Figure 36. Sketch of recommended stream relocation and existing erosion at 521+50 (from field notes)
25

Figure 37. Upstream face of box culvert at 521+50
Figure 38. Erosion and slumping riprap on upstream right bank near 521+50
26

Figure 39. Looking upstream from box at 521+50.
Figure 40. Upstream floodplain area available for stream relocation for 521+50 box.
27

Figure 41 Drainage areas flowing to the large box culvert at521+50.
28

Figure 42. Drainage basins from 520+00 to end of project.
525+33: 8.1 acres drains from project left to right near station 532+00 to an existing 18” rcp. This culvert bends at the driveway upstream, approaching from the east, turning south at the drive and crossing the road. This culvert will be replaced and relocated at project station 525+33. 50-year flow is calculated to be 12.4 cfs. Because the drainage area is unclear, the proposed replacement pipe will be 24”. The upstream invert is 450.70 and the subgrade will be 453.54’ giving a 50-year headwater elevation of 452.70.
Figure 43. Upstream ditch at 532+00. Flow enters headwall (granite blocks at drive) and turns left across road.
29

Figure 44. Downstream headwall at 532+50 540+61: 123 acres drains to an existing collapsed dam that crosses the road from left to right. The dam contains a sluice that leads to a 1’H X 3’W box. 50-year flow is calculated to be 93 cfs. Upstream invert is 481.5 and subgrade elevation is 488.07. Design size for 93 cfs with 1-1.5 HW/D ratio is 42-54” round. However, this area has upstream storage that allows peak flows to be stored. This is an old dam and box culvert that controls flow due to rubble in outlet section and the 36” X 12” box. Downstream of the dam is a small stream section followed by a second box culvert under the dirt road. This is then followed by a long 6’ box passing below what may have been an old mill or other structure. This box is not in good condition at the downstream end, but other portions appear to be old granite block structure.
Increasing the size of the existing dam structure may increase flow downstream or could be perceived to have made a difference. It is recommended that a 30” culvert be used to replace the box culvert with the 30” culvert embedded by 1’ to create similar conditions to the existing box.
Detailed survey of the upstream storage area has not been provided for this study. Based on field observations, an assumed upstream area of 1.2 acres was used to evaluate existing and proposed conditions. Hydrocad was used to model the approximate conditions at this site. Existing box
30

and proposed 30” replacement culverts were modeled. Hydrocad indicates that the existing box can discharge approximately 12 cfs and the embedded 30” culvert can discharge about 21 cfs. Routing calculations using assumed storage indicate that under existing conditions, the pond elevation at Q50 would be approximately 490.4, possibly overtopping the road. With the 30” replacement culvert, the pond elevation is calculated to be 486.20 based on the assumed storage area.
To confirm these calculated elevations, detailed survey of the outlet structure and the edge of the upstream pond (area of pond in acres) would be required. Flows should not be increased significantly at this site due to complex downstream conditions.
Potential fish passage issues have been reviewed at this location. Maine DOT has identified this stream as requiring fish passage. BFW was measured by MDOT as 3’. To meet 1.2 X bankfull width, a new structure would need to be 3.6’ wide. However, due to competing issues, it is recommended that a 30” embedded culvert be used to simulate existing conditions. This approximates the bank width of the stream, without causing large flow increase downstream.
Figure 45. looking upstream at sluice into box on left side of project.
31

Figure 46. MDOT measuring approximate bankfull width.
Figure 47. Downstream end of long culvert under old mill (?). Collapsing.
32

Figure 48. Sketch of collapsed dam and downstream structures
Figure 49. Sketch highlighting rubble and 3’ X 1’ box and sluice.
33

Figure 50. Looking at collapsing dam from upstream.
546+50: A small drainage area (2.8) of roadway ditch and roadway flows along project right from 551+50 to 546+50 and crosses from R to L at 546+50. This cross culvert replaces closed drainage pipes that collect local drainage under existing conditions. Flow was not computed due to the small drainage basin. An 18” culvert will provide adequate capacity.
34

Figure 51. Drainage basin to culvert at 546+50
552+98: An existing 24” concrete culvert crosses at 552+98. This culvert will be removed and flow will be routed via roadside ditches to 540+60.
Figure 51a. Upstream end of 552+98
35

555+77: 8.7 acres drains to an existing cross pipe which appears to be 18”. 50-year flow is estimated at 20 cfs, so replacement pipe size is also 18”. Upstream invert will be 508.80 and subgrade will be 514.13 providing adequate cover with a 50-year headwater of 510.60. Drainage area is shown above. 565+41: 27 acres drains to a ponded area on the left side of the project. This shallow pond is quite deep below the road, and drains to a second ponded area on the right side of the project. The existing pipe is 18” and appears to have some blockage for flow. 50-year flow is calculated to be 34 cfs. With the large storage area and potential for impacting the hydrology of the ponds, it is recommended that this pipe simply be cleaned and/or replaced in-kind depending on condition. The upstream invert is 487.18’ and the subgrade is 501.6’, so cover is not an issue. 50-year headwater is calculated to be 490.50 assuming an upstream wetland area of 1.2 acres. No change is expected from existing conditions.
Figure 52. upstream face of deep 18” culvert at ponds at 565+41
36

Figure 53. Ponded area upstream of 565+41
Figure 54. Ponded area downstream of 565+41 East End of Project: East of Knights Hill Road, on the left side of the project, runoff drains towards Moose Pond towards a failing culvert that is beyond the project limits. On project right, approximately 12.8 acres drains towards a driveway/dirt road that is currently crossed by twin
37

15” culverts. Calculations indicate that these culverts are adequate to convey the 10-year storm without overtopping. Invert is 420.47/23 and top of road is 423.05. 10-year headwater is 422.4. 50-year flow would overtop the driveway.
Figure 57. Recommended turnout/level spreader location
Figure 58. Off-project culvert
38

Figure 59. Project area ditches will outlet L/R from hill area
4.0 Closed Drainage: Limited segments of curbing were added to the project along the following stations (approximate). 388+50 L to 392+50 L 388+50 R to 392+50 R 392+50 L to 403+50 L 392+50 to 400+50 R 557+00 to 560+00 L/R 260+00 to 563+00 L/R Riprap downspouts are used to manage all curbed drainage except for CB’s at stations 397+00 L and R, and 400+00 L. Closed drainage calculations, hydrology, and spreadwidths, are included under separate cover provided by FST. 5.0 Stormwater Quality MOA review.
This section summarizes final design level findings, recommendations and issues relative to compliance with the MDOT/DEP MOA relative to stormwater management. The following table summarizes existing and proposed impervious Area by drainage basin. Basins are shown in Figure 30.
39

Location Original
Impervious Area (ft2)
Proposed Impervious Area (ft2)
Increase (ft2)
Increase (Acres)
To Saco River: Sta. 319+00 to 375+00 195,817 217,074 21,257 0.49 To Elkins Brook: Sta. 375+00 to 490+00 407,660 434,838 27,178 0.62 To Sawyer Brook: 490+00 to 569+00 264,964 323,767 58,803 1.35 To Moose Pond: 569+00 to End 64,103 68,096 3,993 0.09
Total = 2.55
The Route 302 project in Fryeburg/Bridgeton comprises approximately 5.3 miles of reconstructed roadway. The project is not within the watershed of an LMAR or an Urban Impaired Stream (UIS). From station 319+00 to station 569+00, project drainage flows towards the Saco River to the West, with Elkins Brook and Sawyer Brook entering Kezar Pond before entering the river. From approximately station 569+00 to the project end, drainage flows towards Moose Pond to the West.
Figure 59. Drainage Basins on Route 302 Fryeburg/Bridgton
40

The Memorandum of Agreement (MOA) between MDOT and MDEP applies to this project since it is a linear project.
MOA Review by section: “*” applies to this project 1. MOA Applies to all MDOT projects 2. Definitions 3. Specific Provisions to comply w/Chapter 500 A. * Basic Standards: Apply, and are generally met by following MDOT BMP manual B. * General Standards:
1. * Linear portion in LMAR or UIS shall meet the General Standards “to the extent practicable as determined through consultation with and agreement by DEP, except that redevelopment of existing impervious area may qualify for the exception in Section 4(B)(3)(e).”
2. * Linear portion not in LMAR or UIS does not need to meet General Standards
3. N/A New Linear shall meet General Standards. 4. N/A New Non-linear shall meet General Standards
C. * Phosphorous Standard: Projects shall instead comply with the General Standards.
D. N/A UIS: new impervious must meet UIS standard
E. N/A Flooding Standard: applies to extent practicable.
The MOA stipulates the following for this project:
1. “Basic” Standards apply to this project. These standards are generally met by applying MDOT’s BMP manual. This includes stormwater measures such as inlet/outlet protection for culverts, properly constructed ditches, etc. These standards include basic
• Erosion and Sedimentation Control • Inspection and Maintenance • Housekeeping
2. The project is not in the watershed of an LMAR or an UIS.
3. The project will add 21,257 square feet of new impervious directly to the Saco River drainage area. 27,178 ft2 of new impervious will drain to Elkins Brook, and 58,803 ft2 will drain to Sawyer Brook. 3,993 ft2 of new impervious are will be added to the Moose Pond area.
In DEP Chapter 500, any project that adds more than 1 acre of new impervious in any one watershed must comply with the general standards. As an existing travel corridor the project may comply with the General Standards with a redevelopment waiver. The MOA states the
41

Linear Portion of a redevelopment project within watersheds other than an LMAR or UIS does not need to meet the general standards.
4. The Phosphorous Standard does not apply because it is not in a lake watershed.
5. The Flooding Standard applies to the extent practicable, but would only be mandated if new impervious was > 3.0 acres. Recommended BMP’s:
• Wherever possible, ditches end in turnouts to vegetated buffer zones with 25’ minimum width.
• All culvert inlets and outlets include standard riprap inlet and outlet protection. • Stone check dams will be used every 50’ in the right ditch from project station 567+00 R
to project end (586+00). • Ditches were checked for Q10 flow capacity and for velocity and lining
recommendations. References: 1. U. S. Dept. of the Interior, Geological Survey, with Maine Dept. of Transportation. Estimating the Magnitude and Frequency of Peak Flows for Streams in Maine for Selected Recurrence Intervals. Water Resources Investigations Report 99-4008. 2. Maine Dept of Transportation. Best Management Practices for Erosion and Sediment Control. 3. Maine Dept. of Transportation. Urban and Arterial Highway Design Guide. Chapter 12, 2004 4. Computer Model Hydrocad, Stormwater Modeling System, Version 5.01 and Version 6.0. Applied Microcomputer Systems. www.Hydrocad.net 5. Computer Model Hydraflow, Storm Sewers, Intelisolve. www.Intelisolve.com
6. ESRI, ARCMAP Version 9.3.1, and ArcGIS Desktop Version 9.3.1
7. Maine Dept of Transportation. Best Management Practices for Erosion and Sediment Control. 8. Maine Dept. of Transportation. Standard Details Highways and Bridges. April 1997 9. U.S. Dept of Transportation, FHWA. Hydraulic Design of Highway Culverts. Hydraulic Design Series 5 September, 1985. 10. U.S. Dept of Transportation, FHWA HY-8. Culvert Design Software. Version 7.2, January, 2012
42

Fryeburg Route 302
Final Design Drainage Report
Appendix
Calculations Hydrology Calculations Hydrocad calculations Appendix pages 1-24 HY-8 Culvert Calculations Appendix pages 25-65 321+50
347+13 465+84
479+13 507+29
521+50 Ditch Calculation Summary Appendix 66

(~47+0~ \ ' \ .............. //
34t00
~ 347+01
j~. {507+20'> \ /
\. ............. ./
507+20
j\, \Subcay
\\._ ___ ./
~~
/:--\ / \
(386+20) ( 386+20 ave ) \ I \,__;! ~-~, \..__/
,I\ I \
38120 386~0ave (479+oo) \502+00) \ ___ _/ \ _______ _/
b ~ 386+20
386+20
;--, I \ ~15+oo) \__/
515+00
~~
~87f)> \ .............. ..
587+00 R Drive
479+00
;-\ 025+33>
\___/
525+00
,---\ I \ ~40+61Aj
\ .............. //
502+00
540+61 usgs~
~ :L\ box culvert outlet 30" round outlet
(sss) \_/
555
/'''"''"'"'"'""\
&65+5~ \ __ /
565+50
Drainage Diagram for fryeburg 302 hydrology-final design Prepared by Microsoft, Printed 1/28/2014
HydroCAD® 9.10 s/n 01047 © 2011 HydroCAD Software Solutions LLC
Appendix 1

\
fryeburg 302 hydrology-final design Prepared by Microsoft HydroCAD® 9.10 s/n 01047 © 2011 HydroCAD Software Solutions LLC
Type II 24-hr 50-yr Rainfa/1=6. 60" Printed 1/28/2014
Page 1
Summary for Subcatchment 347+00: 347+00
Runoff = 77.55 cfs @ 12.50 hrs, Volume= 12.522 af, Depth> 1.37"
Runoff by SCS TR-20 method, UH=SCS, Time Span= 5.00-25.00 hrs, dt= 0.01 hrs Type II 24-hr 50-yr Rainfall=6.60"
Area (ac) CN Description * 110.000 49
110.000 100.00% Pervious Area
Tc Length Slope Velocity Capacity Description (min) (feet) (ftlft) (ftlsec) ( cfs) 45.0 Direct Entry,
Summary for Subcatchment 386+20: 386+20
Runoff = 132.91 cfs@ 12.43 hrs, Volume= 16.772 af, Depth> 3.49"
. Runoff by SCS TR-20 method, UH=SCS, Time Span= 5.00-25.00 hrs, dt= 0.01 hrs
. Type II 24-hr 50-yr Rainfall=6.60"
Area (ac) CN Description 3.300
49.300 3.000 2.100
57.700 54.148
3.552
Tc Length (min) (feet)
29.3 100
10.5 300
4.6 1,800
44.4 2,200
Runoff =
98 Paved roads w/curbs & sewers, HSG A 70 Woods, Good, HSG C 65 Brush, Good, HSG C 77 2 acre lots, 12% imp, HSG C 72 Weighted Average
93.84% Pervious Area 6.16% Impervious Area
Slope Velocity Capacity (ft/ft) (ft/sec) (cfs)
0.0330 0.06
0.0360 0.47
0.0310 6.54 117.74
Total
Description
Sheet Flow, woods Woods: Dense underbrush n= 0.800 Shallow Concentrated Flow, woods Forest w/Heavy Litter Kv= 2.5 fps Channel Flow, woods Area= 18.0 sf Perim= 18.0' r= 1.00'
Summary for Subcatchment 386+20 ave: 386+20ave
76.08 cfs@ 12.46 hrs, Volume= 10.288 af, Depth> 2.14"
Runoff by SCS TR-20 method, UH=SCS, Time Span= 5.00-25.00 hrs, dt= 0.01 hrs Type II 24-hr 50-yr Rainfall=6.60"
P2= 3.50"
n= 0.040
Appendix 2

fryeburg 302 hydrology-final design Prepared by Microsoft HydroCAD® 9.10 s/n 01047 © 2011 HydroCAD Software Solutions LLC
Type II 24-hr 50-yr Rainfa/1=6. 60" Printed 1/28/2014
Page 2
Area (ac) CN Description * 57.700 . 58
57.700 100.00% Pervious Area
Tc Length Slope Velocity Capacity Description (min) (feet) (ftlft) (ftlsec) (cfs) 44.0 Direct Entry,
Summary for Subcatchment 479+00: 479+00
Runoff = 129.91 cfs@ 12.37 hrs, Volume= 15.374 af, Depth> 2.80"
Runoff by SCS TR-20 method, UH=SCS, Time Span= 5.00-25.00 hrs, dt= 0.01 hrs Type II 24-hr 50-yr Rainfall=6.60"
Area (ac) CN Description 4.500
18.000 27.500
9.000 1.000 6.000
66.000 64.460
1.540
Tc Length (min) (feet) 30.5 300
4.5 300
4.2 3,300
46 2 acre lots, 12% imp, HSG A 59 Farmsteads, HSG A 70 Woods, Good, HSG C 77 Woods, Good, HSG D 98 Paved parking, HSG A 55 Woods, Good, HSG B 65 Weighted Average
97.67% Pervious Area 2.33% Impervious Area
Slope Velocity Capacity (ftlft) (ftlsec) (cfs)
0.2670 0.16
0.2000 1.12
0.1220 12.98 233.57
Description
Sheet Flow, woods Woods: Dense underbrush n= 0.800 Shallow Concentrated Flow, woods Forest w/Heavy Litter Kv= 2.5 fps Channel Flow, woods
P2= 3.50"
Area= 18.0 sf Perim= 18.0' r= 1.00' n= 0.040 39.2 3,900 Total
Summary for Subcatchment 502+00: 502+00
Runoff = 137.31 cfs@ 12.48 hrs, Volume= 18.881 af, Depth> 2.70"
Runoff by SCS TR-20 methoq, UH=SCS, Time Span= 5.00-25.00 hrs, dt= 0.01 hrs Type II 24-hr 50-yr Rainfall=6.60"
Appendix 3

fryeburg 302 hydrology-final design Prepared by Microsoft Hydro CAD® 9.10 s/n 01047 © 2011 HydroCAD Software Solutions LLC
Type II 24-hr 50-yr Rainfa/1=6. 60" Printed 1/28/2014
Page 3
Area (ac) CN Description 3.500
28.300 44.200
6.000 2.000
84.000 82.000
2.000
Tc Length (min) (feet) .42.0 300
3.2 300
2.8 2,600
30 Woods, Good, HSG A 55 Woods, Good, HSG B 70 Woods, Good, HSG C 77 Woods, Good, HSG D 98 Paved parking, HSG A 64 Weighted Average
97.62% Pervious Area 2.38% Impervious Area
Slope Velocity Capacity (ftlft) (ftlsec) (cfs)
0.1200 0.12
0.4000 1.58
0.1710 15.36 276.52
Description
Sheet Flow, woods Woods: Dense underbrush n= 0.800 P2= 3.50" Shallow Concentrated Flow, woods Forest w/Heavy Litter Kv= 2.5 fps Channel Flow, woods Area= 18.0 sf Perim= 18.0' r= 1.00' n= 0.040
48.0 3,200 Total
Summary for Subcatchment 507+20: 507+20
Runoff = 93.16 cfs@ 12.36 hrs, Volume= 10.714 af, Depth> 2.99"
Runoff by SCS TR-20 method, UH=SCS; Time Span= 5.00-25.00 hrs, dt= 0.01 hrs Type II 24-hr 50-yr Rainfall=6.60"
Area (ac) CN Description 12.000 24.000
5.000 1.500 0.500
43.000 42.320
0.680
Tc Length (min) (feet) 30.4 300
3.7 300
4.0 2,700
55 Woods, Good, HSG B 70 Woods, Good, HSG C 79 Woods, Fair, HSG D 77 2 acre lots, 12% imp, HSG C 98 Paved roads w/curbs & sewers, HSG C 67 Weighted Average
98.42% Pervious Area 1.58% Impervious Area
Slope Velocity Capacity (ft/ft) (ft/sec) (cfs)
0.2700 . 0.16
0.3000 1.37
0.1400 11.12 200.16
Description
Sheet Flow, woods Woods: Dense underbrush n= 0.800 Shallow Concentrated Flow, woods Forest w/Heavy Litter Kv= 2.5 fps Channel Flow, wooded Area= 18.0sf Perim= 18.0' r= 1.00'
P2= 3.50"
n= 0.050 Mountain streams w/large boulders 38.1 3,300 Total
Appendix 4

fryeburg 302 hydrology-final design Prepared by Microsoft HydroCAD® 9.10 s/n 01047 © 2011 HydroCAD Software Solutions LLC
Type II 24-hr 50-yr Rainfa/1=6. 60" Printed 1/28/2014
Page4
Summary for Subcatchment 515+00: 515+00
Runoff = 31.16 cfs@ 12.23 hrs, Volume= 3.029 af, Depth> 2.80"
Runoff by SCS TR-20 method, UH=SCS, Time Span= 5.00-25.00 hrs, dt= 0.01 hrs Type II 24-hr 50-yr Rainfall=6.60"
Area (ac) CN 0.500 77 0.500 98 0.700 30 3.900 55 6.700· 70 0.700 77
13.000 65 12.440 0.560
Tc Length (min) (feet)
Description 2 acre lots, 12% imp, HSG C Paved parking, HSG A Woods, Good, HSG A Woods, Good, HSG B Woods, Good, HSG C Woods, Good, HSG D Weighted Average 95.69% Pervious Area 4.31% Impervious Area
Slope Velocity Capacity (ftlft) (ftlsec) (cfs)
Description
22.0 150 0.1520 0.11 Sheet Flow, woods Woods: Dense underbrush n= 0.800
4.3 300 0:2140 1.16 Shallow Concentrated Flow, woods Forest w/Heavy Litter Kv= 2.5 fps
1.2 1,250 0.2140 17.19 309.34. Channel Flow, woods Area= 18.0 sf Perim= 18.0' r= 1.00'
2.0 1,500 0.1100 12.32 221.78 Channel Flow, meadow Area= 18.0 sf Perim= 18.0' r= 1.00'
29.5 3,200 Total
Summary for Subcatchment 525+33: 525+00
Runoff = 19.40 cfs@ 12.30 hrs, Volume= 2.085 af, Depth> 3.09"
Runoff by SCS TR-20 method, UH=SCS, Time Span= 5.00-25.00 hrs, dt= 0.01 hrs Type II 24-hr 50-yr Rainfall=6.60"
Area (ac) 4.400 2.700 1.000 8.100 7.560 0.540
CN Description 70 Woods, Good, HSG C 79 1 acre lots, 20% imp, HSG C 30 Woods, Good, HSG A 68 Weighted Average
93.33% Pervious Area 6.67% Impervious Area
P2= 3.50"
n= 0.040
n= 0.040
Appendix 5

fryeburg 302 hydrology-final design Prepared by Microsoft HydroCAD® 9.10 s/n 01047 © 2011 HydroCAD Software Solutions LLC
Type II 24-hr 50-yr Rainfa/1=6. 60" Printed 1/28/2014
Page 5
Tc Length Slope Velocity Capacity Description (min) (feet) (ft/ft) (ft/sec) (cfs) 28.4 150 0.0800 0.09 Sheet Flow, woods
Woods: Dense underbrush n= 0.800 P2= 3.50" 3.7 250 0.0500 1.12 Shallow Concentrated Flow, woods
Woodland Kv= 5.0 fps 2.7 900 0.0220 5.51 99.18 Channel Flow, woods
Area= 18.0 sf Perim= 18.0' r= 1.00' n= 0.040 34.8 1,300 Total
Summary for Subcatchment 540+61A: 540+61 usgs flows
Runoff = 95.56 cfs@ 12.73 hrs, Volume= 17.376 af, Depth> 1.70"
Runoff by SCS TR-20 method, UH=SCS, Time Span= 5.00-25.00 hrs, dt= 0.01 hrs Type II 24-hr 50-yr Rainfall=6.60"
Area (ac) CN Description * 123.000 53 usgs calibrated
123.000 100.00% Pervious Area
Tc Length Slope Velocity Capacity Description (min) (feet) (ft/ft) (ft/sec) ( cfs) 60.0 Direct Entry, usgs calibrated
Summary for Subcatchment 555: 555
Runoff = 36.91 cfs@ 12.08 hrs, Volume= 2.457 af, Depth= 3.39"
Runoff by SCS TR-20 method, UH=SCS, Time Span= 5.00-25.00 hrs, dt= 0.01 hrs Type II 24-hr 50-yr Rainfall=6.60"
Area (ac) CN Description 7.700 1.000 8.700 8.580 0.120
Tc Length (min) (feet) 11.8 100
3.5 300
0.8 700
70 Woods, Good, HSG C 77 2 acre lots, 12% imp, HSG C 71 Weighted Average
98.62% Pervious Area 1.38% Impervious Area
Slope Velocity Capacity (ft/ft) (ft/sec) (cfs)
0.0800 0.14
0.0800 1.41
0.0800 13.77 247.84
Description
Sheet Flow, woods Woods: Light underbrush n= 0.400 Shallow Concentrated Flow, woods Woodland Kv= 5.0 fps Channel Flow, meadow
P2= 3.50"
Area= 18.0 sf Perim= 12.0' r= 1.50' n= 0.040 16.1 1,100 Total
Appendix 6

fryeburg 302 hydrology-final design Prepared by Microsoft HydroCAD® 9.10 s/n 01047 © 2011 HydroCAD Software Solutions LLC
Type II 24-hr 50-yr Rainfa/1=6. 60" Printed 1/28/2014
Page 6
Summary for Subcatchment 565+50: 565+50
Runoff· = 66.61 cfs @ 12.29 hrs, Volume= 6.950 af, Depth> 3.09"
Runoff by SCS TR-20 method, UH=SCS, Time Span= 5.00-25.00 hrs, dt= 0.01 hrs Type II 24-hr 50-yr Rainfall=6.60"
Area (ac) CN Description 2.500
24.000 0.500
27.000 26.200
0.800
Tc Length (min) (feet) 22.0 100
7.3 300
4.1 1,480
46 2 acre lots, 12% imp, HSG A 70 Woods, Good, HSG C 98 Paved parking, HSG A 68 Weighted Average
97.04% Pervious Area 2.96% Impervious Area
Slope Velocity Capacity (ftlft) (ftlsec) (cfs)
0.0670 0.08
0.0750 0.68
0.0260 5.99 71.88
Description
Sheet Flow, woods Woods: Dense underbrush n= 0.800 Shallow Concentrated Flow, woods Forest w/Heavy Litter Kv= 2.5 fps Channel Flow, meadow
P2= 3.50"
Area= 12.0 sf Perim= 12.0' r= 1.00' n= 0.040 33.4 1,880 Total
Summary for Subcatchment 587R: 587+00 R Drive
Runoff = 42.52 cfs@ 12.17 hrs, Volume= 3.508 af, Depth> 3.29"
Runoff by SCS TR-20 method, UH=SCS, Time Span= 5.00-25.00 hrs, dt= 0.01 hrs Type II 24-hr 50-yr Rainfall=6.60"
Area (ac) CN Description 12.800 70 Woods, Good, HSG C 12.800 100.00% Pervious Area
Tc Length Slope Velocity Capacity Description (min) (feet) (ftlft) (ftlsec) (cfs) 23.4 1,300 0.0500 0.93 Lag/CN Method,
Summary for Pond 348P: 347+01
Inflow Area = 110.000 ac, 0.00% Impervious, Inflow Depth > 1.37" for 50-yr event Inflow = 77.55 cfs@ 12.50 hrs, Volume= 12.522 af Outflow = 25.26 cfs@ 13.43 hrs, Volume= 11.694 af, Atten= 67%, Lag= 55.5 min Primary = 25.26 cfs @ 13.43 hrs, Volume= 11.694 af
Routing by Stor-lnd method, Time Span= 5.00-25.00 hrs, dt= 0.01 hrs
Appendix 7

fryeburg 302 hydrology-final design Prepared by Microsoft
Type II 24-hr 50-yr Rainfa/1=6. 60" Printed 1/28/2014
Page 7 HydroCAD® 9.10 s/n 01047 © 2011 HydroCAD Software Solutions LLC
Peak Elev= 400.82'@ 13.43 hrs Surf.Area= 1.190 ac Storage= 3.814 af
Plug-Flow detention time= 111.6 min calculated for 11.694 af (93% of inflow) Center-of-Mass det. time= 77.1 min ( 999.1 - 922.0)
Volume #1
Elevation (feet)
397.20 397.30 397.50 401.00
Invert Avaii.Storage Storage Description 397.20'
Surf.Area (acres)
0.000 0.500 1.000 1.200
4.025 af Custom Stage Data (Prismatic) Listed below (Recalc)
Inc. Store (acre-feet)
0.000 0.025 0.150 3.850
Cum.Store (acre-feet)
0.000 0.025 0.175 4.025
Device Routing Invert Outlet Devices #1 Primary 397.20' 24.0" Round Culvert
L= 58.0' RCP, groove end w/headwall, Ke= 0.200 Inlet I Outlet Invert= 397.20' I 397.00' S= 0.0034 '/' Cc= 0.900 n= 0.012
Primary OutFlow Max=25.26 cfs @ 13.43 hrs HW=400.82' (Free Discharge) Y=Culvert (Barrel Controls 25.26 cfs@ 8.04 fps)
Summary for Pond 386+20P: 386+20
Inflow Area= 57.700 ac, 6.16% Impervious, Inflow Depth> 3.49" for 50-yr event Inflow = 132.91 cfs@ 12.43 hrs, Volume= 16.772 af Outflow = 232.32 cfs@ 12.48 hrs, Volume= 13.508 af, Atten= 0%, Lag= 3.1 min Primary = 232.32 cfs@ 12.48 hrs, Volume= 13.508 af
Routing by Stor-lnd method, Time Span= 5.00-25.00 hrs, dt= 0.01 hrs Peak Elev= 1 ,442.61' @ 12.48 hrs Surf.Area= 3.000 ac Storage= 4.610 af
Plug-Flow detention time= 172.6 min calculated for 13.501 af (80% of inflow) Center-of-Mass det. time= 90.6 min ( 951.6- 861.1 )
Volume Invert Avaii.Storage Storage Description #1
Elevation (feet)
484.30 484.40 484.50 486.30
484.30'
Surf.Area (acres)
0.000 0.100 2.000 3.000
Device Routing #1 Primary
4.610 af Custom Stage Data (Prismatic) Listed below (Recalc)
Inc. Store (acre-feet)
0.000 0.005 0.105 4.500
Cum.Store (acre-feet)
0.000 0.005 0.110 4.610
Invert Outlet Devices 484.30' 18.0" Round Culvert
L= 56.0' RCP, mitered to conform to fill, Ke= 0.700 Inlet I Outlet Invert= 484.30' 1484.10' S= 0.0036 'I' Cc= 0.900
Appendix 8

fryeburg 302 hydrology~final design Prepared by Microsoft HydroCAD® 9.10 s/n 01047 © 2011 HydroCAD Software Solutions LLC
n= 0.012
Type II 24-hr 50-yr Rainfa/1=6. 60" Printed 1/28/2014
Page 8
Primary OutFlow Max=232.32 cfs@ 12.48 hrs HW=1,442.61' (Free Discharge) L1=Culvert (Inlet Controls 232.32 cfs@ 131.47 fps)
Summary for Pond 387P: 386+20
Inflow Area= 57.700 ac, 0.00% Impervious, Inflow Depth> 2.14" for 50-yr event Inflow = 76.08 cfs@ 12.46 hrs, Volume= 10.288 af Outflow = 13.14 cfs@ 13.87 hrs, Volume= 9.477 af, Atten= 83%, Lag= 84.7 min Primary = 13.14 cfs@ 13.87 hrs, Volume= 9.477 af
Routing by Stor-lnd method, Time Span= 5.00-25.00 hrs, dt= 0.01 hrs Peak Elev= 488.11' @ 13.87 hrs Surf.Area= 1.486 ac Storage= 4.476 af
Plug-Flow detention time= 195.1 min calculated for 9.477 af (92% of inflow) Center-of-Mass det. time= 153.6 min ( 1,047.0- 893.4)
Volume Invert Avaii.Storage Storage Description #1
Elevation (feet)
484.30 484.40 484.50 486.30 488.20
484.30'
Surf.Area (acres)
0.000 0.100 1.000 1.200 1.500
Device Routing #1 Primary
4.605 af Custom Stage Data (Prismatic) Listed below (Recalc)
Inc. Store (acre-feet)
0.000 0.005 0.055 1.980 2.565
Cum.Store (acre-feet)
0.000 0.005 0.060 2.040 4.605
Invert Outlet Devices 484.30' 18.0" Round Culvert
L= 56.0' RCP, mitered to conform to fill, Ke= 0.700 Inlet I Outlet Invert= 484.30' I 483.00' S= 0.0232 '/' Cc= 0.900 n= 0.012
Primary OutFlow Max=13.14 cfs@ 13.87 hrs HW=488.11' (Free Discharge) L1=Culvert (Inlet Controls 13.14 cfs@ 7.44 fps)
Summary for Pond 540+61: box culvert outlet
Primary = 0.00 cfs @ 5.00 hrs, Volume= 0.000 af
Routing by Stor-lnd method, Time Span= 5.00-25.00 hrs, dt= 0.01 hrs Peak Elev= 0.00' @ 0.00 hrs Surf.Area= 0.000 ac Storage= 0.000 af
Plug-Flow detention time= (not calculated) Center-of-Mass det. time= (not calculated)
Appendix 9

fryeburg 302 hydrology-final design Prepared by Microsoft
Type II 24-hr 50-yr Rainfa/1=6. 60" Printed 112812014
Page 9 HydroCAD® 9.10 s/n 01047 © 2011 HydroCAD Software Solutions LLC
Volume Invert Avaii.Storage Storage Description #1
Elevation (feet)
481.50 481.60 482.00 488.10 490.20
481.50'
Surf.Area (acres)
0.000 0.300 1.300 1.600 1.700
Device Routing #1 Primary
#2 Primary
12.645 af Custom Stage Data (Prismatic) Listed below (Recalc) .
lnc.Store (acre-feet)
0.000 0.015 0.320 8.845 3.465
Cum.Store (acre-feet)
0.000 0.015 0.335 9.180
12.645
Invert Outlet Devices 481.50' 3.0" W x 1.0" H Box Culvert
L= 90.0' Box, headwall wl3 square edges, Ke= 0.500 Inlet I Outlet Invert= 481.50' I 481.05' S= 0.0050 '/' Cc= 0.900 n= 0.020
490.20' 50.0' long x 30.0' breadth Broad-Crested Rectangular Weir Head (feet) 0.20 0.40 0.60 0.80 1.00 1.20 1.40 1.60 Coef. (English) i68 2.70 2.70 2.64 2.63 2.64 2.64 2.63
Primary OutFlow Max=O.OO cfs@ 5.00 hrs HW=O.OO' (Free Discharge) t1=Culvert (Controls 0.00 cfs)
2=Broad-Crested Rectangular Weir (Controls 0.00 cfs)
Summary for Pond 540+61-a: 30" round outlet
Inflow Area= 123.000 ac, 0.00% Impervious, Inflow Depth> 1.70" for 50-yr event Inflow = 95.56 cfs@ 12.73 hrs, Volume= 17.376 af Outflow = 21.05 cfs@ 14.40 hrs, Volume= 14.931 af, Atten= 78%, Lag= 100.5 min Primary = 21.05 cfs@ 14.40 hrs, Volume= 14.931 af
Routing by Stor-lnd method, Time Span= 5.00-25.00 hrs, dt= 0.01 hrs Peak Elev= 486.89' @ 14.40 hrs Surf.Area= 1.540 ac Storage= 7.273 af
Plug-Flow detention time= 213.4 min calculated for 14.923 af (86% of inflow) Center-of-Mass det. time= 146.5 min ( 1,067.4- 920.9)
Volume Invert Avaii.Storage Storage Description #1
Elevation .(feet)
481.50 481.60 482.00 488.10 490.20
481.50'
Surf.Area (acres)
0.000 0.300 1.300 1.600 1.700
Device Routing #1 Primary
12.645 af Custom Stage Data (Prismatic) Listed below (Recalc)
Inc. Store (acre-feet)
0.000 0.015 0.320 8.845 3.465
Cum.Store (acre-feet)
0.000 0.015 0.335 9.180
12.645
Invert Outlet Devices 482.50' 30.0" Round Culvert w/12.0" fill
L= 90.0' RCP, square edge headwall, Ke= 0.500
Appendix 10

fryeburg 302 hydrology-final design Prepared by Microsoft
Type II 24-hr 50-yr Rainfa/1=6. 60" Printed 112812014
Page 10 HydroCAD® 9.10 s/n 01047 © 2011 HydroCAD Software Solutions LLC
#2 Primary
Inlet I Outlet Invert= 481.50' /481.05' S= 0.0050 '/' Cc= 0.900 n= 0.020
490.20' 50.0' long x 30.0' breadth Broad-Crested Rectangular Weir Head (feet) 0.20 0.40 0.60 0.80 1.00 1.20 1.40 1.60 Coef. (English) 2.68 2.70 2.70 2.64 2.63 2.64 2.64 2.63
Primary OutFlow Max=21.05 cfs@ 14.40 hrs HW=486.89' (Free Discharge) t1=Culvert (Barrel Controls 21.05 cfs@ 6.85 fps)
2=Broad-Crested Rectangular Weir (Controls 0.00 cfs)
Summary for Pond 565+50p: 565+50
Inflow Area= 27.000 ac, 2.96% Impervious, Inflow Depth > 3.09" for 50-yr event Inflow = 66.61 cfs@ 12.29 hrs, Volume= 6.950 af Outflow = 11.62 cfs@ 13.21 hrs, Volume= 6.635 af, Atten= 83%, Lag= 55.7 min Primary = 11.62 cfs@ 13.21 hrs, Volume= 6.635 af
Routing by Stor-lnd method, Time Span= 5.00-25.00 hrs, dt= 0.01 hrs Peak Elev= 490.50'@ 13.21 hrs Surf.Area= 1.037 ac Storage= 3.096 af
Plug-Flow detention time= 149.1 min calculated for 6.632 af (95% of inflow) Center-of-Mass det. time= 123.5 min ( 983.7- 860.2)
Volume Invert Avaii.Storage Storage Description #1 487.20' 15.510 af Custom Stage Data (Prismatic) Listed below (Recalc)
Elevation (feet)
487.20 . 487.30
488.00 501.60
Surf.Area (acres)
0.000 0.500 1.000 1.200
Device Routing #1 Primary
Inc. Store (acre-feet)
0.000 0.025 0.525
14.960
Cum.Store (acre-feet)
0.000 0.025 0.550
15.510
Invert Outlet Devices 487.20' 18.0" Round Culvert
L= 96.0' RCP, sq.cut end projecting, Ke= 0.500 Inlet I Outlet Invert= 487.20' 1485.20' S= 0.0208 'I' Cc= 0.900 n= 0.020
'(__,.
Primary OutFlow Max=11.62 cfs @ 13.21 hrs HW=490.50' (Free Discharge) 't._1=Culvert (Barrel Controls 11.62 cfs@ 6.58 fps)
Appendix 11

fryeburg 302 hydrology-final design Prepared by Microsoft
Type II 24-hr 1.1-yr Rainfal/=3.00" Printed 1/28/2014
Page 2 HydroCAD® 9.10 s/n 01047 © 2011 HydroCAD Software Solutions LLC
Time span=S.00-25.00 hrs, dt=0.01 hrs, 2001 points Runoff by SCS TR-20 method, UH=SCS
Reach routing by Stor-lnd+ Trans method - Pond routing by Stor-lnd method
Subcatchment 347+00: 347+00 Runoff Area=110.000 ac 0.00% Impervious Runoff Depth>0.07" Tc=45.0 min CN=49 Runoff=0.89 cfs 0.680 af
Subcatchment 386+20: 386+20 Runoff Area=57.700 ac 6.16% Impervious Runoff Depth>0.81" Flow Length=2,200' Tc=44.4 min CN=72 Runoff=27.03 cfs 3.882 af
Subcatchment 386+20 ave: 386+20ave Runoff Area=57.700 ac 0.00% Impervious Runoff Depth>0.27" Tc=44.0 min CN=58 Runoff=4.93 cfs 1.315 af
Subcatchment 479+00: 479+00 Runoff Area=66.000 ac 2.33% Impervious Runoff Depth>0.51" Flow Length=3,900' Tc=39.2 min CN=65 Runoff=17.15 cfs 2.781 af
Subcatchment 502+00: 502+00 Runoff Area=84.000 ac 2.38% Impervious Runoff Depth>0.47" Flow Length=3,200' Tc=48.0 min CN=64 Runoff=16.79 cfs 3.275 af
Subcatchment 507+20: 507+20 Runoff Area=43.000 ac 1.58% Impervious Runoff Depth>0.58" Flow Length=3,300' Tc=38.1 min CN=67 Runoff=14.27 cfs 2.095 af
Subcatchment 515+00: 515+00 Runoff Area=13.000 ac 4.31% Impervious Runoff Depth>0.51" Flow Length=3,200' Tc=29.5 min CN=65 Runoff=4.16 cfs 0.548 af
Subcatchment 525+33: 525+00 Runoff Area=8.1 00 ac 6.67% Impervious Runoff Depth>0.63" Flow Length=1 ,300' Tc=34.8 min CN=68 Runoff=3.17 cfs 0.423 af
Subcatchment 540+61A: 540+61 usgs Runoff Area=123.000 ac 0.00% Impervious Runoff Depth>0.15" Tc=60.0 min CN=53 Runoff=2.90 cfs 1.517 af
Subcatchment 555: 555 Runoff Area=8.700 ac 1.38% Impervious Runoff Depth=0.76" Flow Length=1,100' Slope=0.0800 '/' Tc=16.1 min CN=71 Runoff=7.50 cfs 0.551 af
Subcatchment 565+50: 565+50 Runoff Area=27.000 ac 2.96% lmpe~j~~ious Runoff Depth>0.63" Flow Length=1 ,880' Tc=33.4 min CN=68 Runoff=1 0.88 cfs 1.409 af
Subcatchment 587R: 587+00 R Drive Runoff Area=12.800 ac 0.00% Impervious Runoff Depth>0.71"
Pond 348P: 347+01
Pond 386+20P: 386+20
Pond 387P: 386+20
Flow Length=1 ,300' Slope=0.0500 '/' Tc=23.4 min CN=70 Runoff=8. 00 cfs 0. 762 af
Peak Elev=397.57' Storage=0.244 af lnflow=0.89 cfs 0.680 af 24.0" Round Culvert n=0.012 L=58.0' S=0.0034 '/' Outflow=0.59 cfs 0.455 af
Peak Elev=485.33' Storage=1.965 af lnflow=27.03 cfs 3.882 af 18.0" Round Culvert n=0.012 L=56.0' S=0.0036 '/' Outflow=3.12 cfs 2.617 af
Peak Elev=484.86' Storage=0.424 af lnflow=4.93 cfs 1.315 af 18.0" Round Culvert n=0.012 L=56.0' S=0.0232 '/' Outflow=1.34 cfs 1.066 af
Pond 540+61: box culvert outlet Peak Elev=O.OO' Storage=O.OOO af Primary=O.OO cfs 0.000 af
Appendix 12

fryeburg 302 hydrology-final design Prepared by Microsoft HydroCAD® 9.10 s/n 01047 © 2011 HydroCAD Software Solutions LLC
Type II 24-hr 1.1-yr Rainfa/1=3.00" Printed 1/28/2014
Page 3
Pond 540+61-a: 30" round outlet Peak Elev=482.74' Storage=1.312 af lnflow=2.90 cfs 1.517 af Outflow=0.70 cfs 0.211 af
Pond 565+50p: 565+50 Peak Elev=487.93' Storage=0.483 af lnflow=1 0.88 cfs 1.409 af 18.0" Round Culvert n=0.020 L=96.0' S=0.0208 '/' Outflow=2.49 cfs 1.276 af
Total Runoff Area= 611.000 ac Runoff Volume= 19.239 af Average Runoff Depth = 0.38" 98.40% Pervious= 601.208 ac 1.60% Impervious= 9.792 ac
Appendix 13

fryeburg 302 hydrology-final design Prepared by Microsoft
Type II 24-hr 1 0-yr Rainfa/1=4. 60" Printed 1/28/2014
Paqe4 HydroCAD® 9.10 s/n 01047 © 2011 HydroCAD Software Solutions LLC
Time span=S.00-25.00 hrs, dt=0.01 hrs, 2001 points Runoff by SCS TR-20 method, UH=SCS
Reach routing by Stor-lnd+ Trans method - Pond routing by Stor-lnd method
Subcatchment 347+00: 347+00 Runoff Area=110.000 ac 0.00% Impervious Runoff Depth>0.49" Tc=45.0 min CN=49 Runoff=18.81 cfs 4.490 af
Subcatchmelit 386+20: 386+20 Runoff Area=57.700 ac 6.16% Impervious Runoff Depth>1.89" Flow Length=2,200' Tc=44.4 min CN=72 Runoff=70.05 cfs 9.102 af
Subcatchment 386+20 ave: 386+20ave Runoff Area=57.700 ac 0.00% Impervious Runoff Depth>0.95" Tc=44.0 min CN=58 Runoff=28.97 cfs 4.591 af
Subcatchment 479+00: 479+00 Runoff Area=66.000 ac 2.33% Impervious Runoff Depth>1.39" Flow Length=3,900' Tc=39.2 min CN=65 Runoff=60.40 cfs 7.660 af
Subcatchment 502+00: 502+00 Runoff Area=84.000 ac 2.38% Impervious Runoff Depth>1.33" Flow Length=3,200' Tc=48.0 min CN=64 Runoff=62.36 cfs 9.276 af
Subcatchment 507+20: 507+20 Runoff Area=43.000 ac 1.58% Impervious Runoff Depth>1.53" Flow Length=3,300' Tc=38.1 min CN=67 Runoff=45.11 cfs 5.480 af
Subcatchment 515+00: 515+00 Runoff Area=13.000 ac 4.31% Impervious Runoff Depth>1.39" Flow Length==3,200' Tc=29.5 min CN=65 Runoff=14.56 cfs 1.509 af
Subcatchment 525+33: 525+00 Runoff Area=8.1 00 ac 6.67% Impervious Runoff Depth>1.60" Flow Length=1 ,300' Tc=34.8 min CN=68 Runoff=9.61 cfs 1.080 af
Subcatchment 540+61A: 540+61 usgs Runoff Area=123.000 ac ·o.OO% Impervious Runoff Depth>0.68" Tc=60.0 min CN=53 Runoff=30.00 cfs 6.971 af
Subcatchment 555: 555 Runoff Area=8. 700 ac 1.38% Impervious Runoff Depth=1.82" Flow Length=1,100' Slope=0.0800 '/' Tc=16.1 min CN=71 Runoff=19.49 cfs 1.319 af
Subcatchment 565+50: 565+50 Runoff Area=27.000 ac 2.96% Impervious Runoff Depth>1.60" Flow Length=1 ,880' Tc=33.4 min CN=68 Runoff=32.88 cfs 3.600 af
Subcatchment 587R: 587+00 R Drive Runoff Area=12.800 ac 0.00% Impervious Runoff Depth>1.74" Flow Length=1 ,300' Slope=0.0500 '/' Tc=23.4 min CN=70 Runoff=21.92 cfs 1.861 af
Pond 348P: 347+01
Pond 386+20P: 386+20
Pond 387P: 386+20
Peak Elev=398.50' Storage=1.207 af lnflow=18.81 cfs 4.490 af 24.0" Round Culvert n=0.012 L=58.0' S=0.0034 '/' Outflow=6.57 cfs 3.953 af
Peak Elev=494.90' Storage=4.610 af lnflow=70.05 cfs 9.102 af 18.0" Round Culvert n=0.012 L=56.0' S=0.0036 '/' Outflow=23.57 cfs 6.777 af
Pec:~k Elev=485.94' Storage=1.616 af lnflow=28.97 cfs 4.591 af 18.0" Round Culvert n=0.012 L=56.0' S=0.0232 '/' Outflow=7.09 cfs 4.115 af
Pond 540+61: box culvert outlet Peak Elev=O.OO' Storage=O.OOO af Primary=O.OO cfs 0.000 af
Appendix 14

fryeburg 302 hydrology-final design Prepared by Microsoft HydroCAD® 9.10 s/n 01047 © 2011 HydroCAD Software Solutions LLC
Type II 24-hr 1 0-yr Rainfa/1=4. 60" Printed 1/28/2014
Page 5
Pond 540+61-a: 30" round outlet Peak Elev=483.77' Storage=2.710 af lnflow=30.00 cfs 6.971 af Outflow=7.93 cfs 5.184 af
Pond565+50p: 565+50 Peak Elev=488.82' Storage=1.375 af lnflow=32.88 cfs 3.600 af 18.0" Round Culvert n=0.020 L=96.0' S=0.0208 '/' Outflow=7.93 cfs 3.385 af
Total Runoff Area= 611.000 ac Runoff Volume= 56.940 af Average Runoff Depth= 1.12" 98.40% Pervious = 601.208 ac 1.60% Impervious = 9. 792 ac
Appendix 15

fryeburg 302 hydrology-final design Prepared by Microsoft
Type II 24-hr 25-yr Rainfa/1=6.00" Printed 1/28/2014
Page 6 HydroCAD® 9.10 s/n 01047 © 2011 HydroCAD Software Solutions LLC
Time span=S.00-25.00 hrs, dt=0.01 hrs, 2001 points Runoff by SCS TR-20 method, UH=SCS
Reach routing by Stor-lnd+ Trans method - Pond routing by Stor-lnd method
Subcatchment 347+00: 347+00
Subcatchment 386+20: 386+20
Runoff Area=11 0.000 ac 0.00% Impervious Runoff Depth>1.07" Tc=45.0 min CN=49 Runoff=56.67 cfs 9.811 af
Runoff Area=57. 700 ac 6.16% Impervious Runoff Depth>2.99" Flow Length=2,200' Tc=44.4 min CN=72 Runoff=113.43 cfs 14.381 af
Subcatchment 386+20 ave: 386+20ave Runoff Area=57.700 ac 0.00% Impervious Runoff Depth>1.76" Tc=44.0 min CN=58 Runoff=60.73 cfs 8.439 af
Subcatchment 479+00: 479+00
Subcatchment 502+00: 502+00
Subcatchment 507+20: 507+20
Subcatchment 515+00: 515+00
Subcatchment 525+33: 525+00
Runoff Area=66.000 ac 2.33% Impervious Runoff Depth>2.35" Flow Length=3,900' Tc=39.2 min CN=65 Runoff=1 07.87 cfs 12.926 af
Runoff Area=84.000 ac 2.38% Impervious Runoff Depth>2.26" Flow Length=3,200' Tc=48.0 min CN=64 Runoff=113.35 cfs 15.824 af
Runoff Area=43.000 ac 1.58% Impervious· Runoff Depth>2.53" Flow Length=3,300' Tc=38.1 min CN=67 Runoff=78.06 cfs 9.062 af
Runoff Area=13.000 ac 4.31% Impervious Runoff Depth>2.35" Flow Length=3,200' Tc=29.5 min CN=65 Runoff=25.89 cfs 2.547 af
Runoff Area=8.1 00 ac 6.67% Impervious Runoff Depth>2.62" Flow Length=1,300' Tc=34.8 min CN=68 Runoff=16.33 cfs 1.769 af
Subcatchment 540+61A: 540+61 usgs Runoff Area=123.000 ac 0.00% Impervious Runoff Depth>1.36" Tc=60.0 min CN=53 Runoff=73.27 cfs 13.932 af
Subcatchment 555: 555 Runoff Area=8.700 ac 1.38% Impervious Runoff Depth=2.90" Flow Length=1,100' Slope=0.0800 '/' Tc=16.1 min CN=71 Runoff=31.51 cfs 2.102 af
Subcatchment 565+50: 565+50 Runoff Area=27.000 ac 2.96% Impervious Runoff Depth>2.62" Flow Length=1 ,880' Tc=33.4 min CN=68 Runoff=56.04 cfs 5.896 af
Subcatchment 587R: 587+00 R Drive Runoff Area=12.800 ac 0.00% Impervious Runoff Depth>2.81" Flow Length=1 ,300' Slope=0.0500 '/' Tc=23.4 min CN=70 Runoff=36.11 cfs 2.992 af
Pond 348P: 347+01
Pond 386+20P: 386+20
Pond 387P: 386+20
Peak Elev=400.00' Storage=2.856 af lnflow=56.67 cfs 9.811 af 24.0" Round Culvert n=0.012 L=58.0' 8=0.0034 '/' Outflow=18.73 cfs 9.066 af
Peak Elev=679.03' Storage=4.610 af lnflow=113.43 cfs 14.381 af 18.0" Round Culvert n=0.012 L=56.0' S=0.0036 '/' Outflow=1 04.57 cfs 11.378 af
Peak Elev=487.42' Storage=3.478 af lnflow=60.73 cfs 8.439 af 18.0" Round Culvert n=0.012 L=56.0' S=0.0232 '/' Outflow=11.55 cfs 7.757 af
Pond 540+61: box culvert outlet Peak Elev=O.OO' Storage=O.OOO af Primary=O.OO cfs 0.000 af
Appendix 16

fryeburg 302 hydrology-final design Prepared by Microsoft HydroCAD® 9.10 s/n 01047 © 2011 HydroCAD Software Solutions LLC
Type II 24-hr 25-yr Rainfa/1=6. 00" Printed 1/28/2014
Page 7
Pond 540+61-a: 30" round outlet Peak Elev=485.79' Storage=5.613 af lnflow=73.27 cfs 13.932 af Outflow=17.25 cfs 11.746 af
Pond 565+50p: 565+50 Peak Elev=489.94' Storage=2.520 af lnflow=56.04 cfs 5.896 af 18.0" Round Culvert n=0.020 L=96.0' S=0.0208 '/' Outflow=10.74 cfs 5.612 af
Total Runoff Area= 611.000 ac Runoff Volume= 99.681 af Average Runoff Depth= 1.96" 98.40% Pervious= 601.208 ac 1.60% Impervious= 9.792 ac
Appendix 17

fryeburg 302 hydrology-final design Prepared by Microsoft
Type II 24-hr 50-yr Rainfa/1=6. 60" Printed 1/28/2014
Page 8 HydroCAD® 9.10 s/n 01047 © 2011 HydroCAD Software Solutions LLC
Time span=S.00-25.00 hrs, dt=0.01 hrs, 2001 points Runoff by SCS TR-20 method, UH=SCS
Reach routing by Stor-.lnd+ Trans method - Pond routing by Stor-lnd method
Subcatchment 347+00: 347+00
.Subcatchment 386+20: 386+20
Runoff Area=110.000 ac 0.00% Impervious Runoff Depth>1.37" Tc=45.0 min CN=49 Runoff=77.55 cfs 12.522 af
Runoff Area=57.700 ac 6.16% Impervious Runoff Depth>3.49" Flow Length=2,200' Tc=44.4 min CN=72 Runoff=132.91 cfs 16.772 af
Subcatchment 386+20 ave: 386+20ave Runoff Area=57.700 ac 0.00% Impervious Runoff Depth>2.14" Tc=44.0 min CN=58 Runoff=76.08 cfs 10.288 af
Subcatchment 479+00: 479+00
Subcatchment 502+00: 502+00
Subcatchment 507+20: 507+20
Subcatchment 515+00: 515+00
Subcatchment 525+33: 525+00
Runoff Area=66.000 ac 2.33% Impervious Runoff Depth>2.80" Flow Length=3,900' Tc=39.2 min CN=65 Runoff=129.91 cfs 15.374 af
Runoff Area=84.000 ac 2.38% Impervious Runoff Depth>2.70" Flow Length=3,200' Tc=48.0 min CN=64 Runoff=137.31 cfs 18.88.1 af
Runoff Area=43.000 ac 1.58% Impervious Runoff Depth>2.99" Flow Length=3,300' Tc=38.1 min CN=67 Runoff=93.16 cfs 10.714 af
Runoff Area=13.000 ac 4.31% Impervious Runoff Depth>2.80" Flow Length=3,200' Tc=29.5 min CN=65 Runoff=31.16 cfs 3.029 af
Runoff Area=8.1 00 ac 6.67% Impervious Runoff Depth>3. 09" Flow Length=1 ,3GO' Tc=34.8 min CN=68 Runoff=19.40 cfs 2.085 af
Subcatchment 540+61A: 540+61 usgs Runoff Area=123.000 ac 0.00% Impervious Runoff Depth>1.70" Tc=60.0 min CN=53 Runoff=95.56 cfs 17.376 af
Subcatchment 555: 555 Runoff Area=8.700 ac 1.38% Impervious Runoff Depth=3.39" Flow Length=1,100' Slope=0.0800 '/' Tc=16.1 min CN=71 Runoff=36.91 cfs 2.457 af
Subcatchment 565+50: 565+50 Runoff Area=27.000 ac 2.96% Impervious Runoff Depth>3.09" Flow Length=1 ,880' Tc=33.4 min CN=68 Runoff=66.61 cfs 6.950 af
Subcatchment 587R: 587+00 R Drive Runoff Area=12.800 ac 0.00% Impervious Runoff Depth>3.29" Flow Length=1 ,300' Slope=0.0500 '/' Tc=23.4 min CN=70 Runoff=42.52 cfs 3.508 af
Pond 348P: 347+01
Pond 386+20P: 386+20
Pond 387P: 386+20
Peak Elev=400.82' Storage=3.814 af lnflow=77.55 cfs 12.522 af 24.0" Round Culvert n=0.012 L=58.0' S=0.0034 '/' Outflow=25.26 cfs 11.694 af
Peak Elev=1,442.61' Storage=4.610 af lnflow=132.91 cfs 16.772 af 18.0" Round Culvert n=0.012 L=56.0' S=0.0036 '/' Outflow=232.32 cfs 13.508 af
Peak Elev=488.11' Storage=4.476 af lnflow=76.08 cfs 10.288 af 18.0" Round Culvert n=0.012 L=56.0' S=0.0232 '/' Outflow=13.14 cfs 9.477 af
Pond 540+61: box culvert outlet Peak Elev=O.OO' Storage=O.OOO af Primary=O.OO cfs 0.000 af
Appendix 18

fryeburg 302 hydrology-final design Prepared by Microsoft HydroCAD® 9.10 s/n 01047 © 2011 HydroCAD Software Solutions LLC
Type II 24-hr 50-yr Rainfa/1=6. 60" Printed 1/28/2014
Page 9
Pond 540+61-a: 30" round outlet Peak Elev=486.89' Storage=7.273 af lnflow=95.56 cfs 17.376 af Outflow=21.05 cfs 14.931 af
Pond 565+50p: 565+50 Peak Elev=490.50' Storage=3.096 af lnflow=66.61 cfs 6.950 af 18.0" Round Culvert n=0.020 L=96.0' S=0.0208 '/' Outflow=11.62 cfs 6.635 af
Total Runoff Area= 611.000 ac Runoff Volume= 119.957 af Average Runoff Depth= 2~36" 98.40% Pervious= 601.208 ac 1.60% Impervious= 9.792 ac
Appendix 19

fryeburg 302 hydrology-final design Prepared by Microsoft
Type II 24-hr 100-yr Rainfa/1=7.10" Printed 1/28/2014
Page 10 HydroCAD® 9.10 s/n 01047 © 2011 HydroCAD Software Solutions LLC
Time span=S.00-25.00 hrs, dt=0.01 hrs, 2001 points Runoff by SCS TR-20 method, UH=SCS
Reach routing by Stor-lnd+ Trans method - Pond routing by Stor-lnd method
Subcatchment 347+00: 347+00
Subcatchment 386+20: 386+20
Runoff Area=11 0.000 ac 0.00% Impervious Runoff Depth>1.63" Tc=45.0 min CN=49 Runoff=96.79 cfs 14.947 af
Rurioff Area=57.700 ac 6.16% Impervious Runoff Depth>3.91" Flow Length=2,200' Tc=44.4 min CN=72 Runoff=149.42 cfs 18.808 af
Subcatchment 386+20 ave: 386+20ave Runoff Area=57.700 ac 0.00% Impervious Runoff Depth>2.48" Tc=44.0 min CN=58 Runoff=89.49 cfs 11.902 af
Subcatchment 479+00: 479+00
Subcatchment 502+00: 502+00
Subcatchment 507+20: 507+20
Subcatchment 515+00: 515+00
Subcatchment 525+33: 525+00
Runoff Area=66.000 ac 2.33% Impervious Runoff Depth>3.18" Flow Length=3,900' Tc=39.2 min CN=65 Runoff=148.84 cfs 17.483 af
Runoff Area=84.000 ac 2.38% Impervious Runoff Depth>3.07" Flow Length=3,200' Tc=48.0 min CN=64 Runoff=157.91 cfs 21.519 af
Runoff Area=43.000 ac 1.58% Impervious Runoff Depth>3.39" Flow Length=3,300' Tc=38.1 min CN=67 Runoff=1 06.07 cfs 12.132 af
Runoff Area=13.000 ac 4.31% Impervious Runoff Depth>3.18" Flow Length=3,200' Tc=29.5 min CN=65 Runoff=35.71 cfs 3.445 af
Runoff Area=8.1 00 ac 6.67% Impervious Runoff Depth>3.49" Flow Length=1 ,300' Tc=34.8 min CN=68 Runoff=22.03 cfs 2.356 af
'
Subcatchment 540+61A: 540+61 usgs Runoff Area=123.000 ac 0.00% Impervious Runoff Depth>1.99" Tc=60.0 min CN=53 Runoff=115.38 cfs 20.419 af
Subcatchment 555: 555 Runoff Area=8.700 ac 1.38% Impervious Runoff Depth=3.81" Flow Length=1,100' Slope=0.0800 '/' Tc=16.1 min CN=71 Runoff=41.48 cfs 2.761 af
Subcatchment 565+50: 565+50 Runoff Area=27.000 ac 2.96% Impervious Runoff Depth>3.49" Flow Length=1 ,880' Tc=33.4 min CN=68 Runoff=75.63 cfs 7.854 af
Subcatchment 587R: 587+00 R Drive Runoff Area=12.800 ac 0.00% Impervious Runoff Depth>3.70" Flow Length=1 ,300' Slope=0.0500 '/' Tc=23.4 min CN=70 Runoff=47.96 cfs 3.948 af
Pond 348P: 347+01
Pond 386+20P: 386+20
Pond 387P: 386+20
Peak Elev=413.27' Storage=4.025 af lnflow=96.79 cfs 14.947 af 24.0" Round Culvert n=0.012 L=58.0' S=0.0034 '/' Outflow=69.52 cfs 14.054 af
Peak Elev=1 ,826.26' Storage=4.610 af lnflow=149.42 cfs 18.808 af 18.0" Round Culvert n=0.012 L=56.0' S=0.0036 '/' Outflow=274.95 cfs 15.382 af
Peak Elev=518.75' Storage=4.605 af lnflow=89.49 cfs 11.902 af 18.0" Round Culvert n=0.012 L=56.0' S=0.0232 '/' Outflow=43.56 cfs 10.991 af
Pond 540+61: box culvert outlet Peak Elev=O.OO' Storage=O.OOO af Primary=O.OO cfs 0.000 af
Appendix 20

fryeburg 302 hydrology-final design Prepared by Microsoft HydroCAD® 9.10 s/n 01047 © 2011 HydroCAD Software Solutions LLC
Type II 24-hr 100-yr Rainfa/1=7.10" Printed 1/28/2014
Page 11
Pond 540+61-a: 30" round outlet Peak Elev=487.88' Storage=8.833 af lnflow=115.38 cfs 20.419 af Outflow=23.99 cfs 17.648 af
Pond 565+50p: 565+50 Peak Elev=490.98' Storage=3.600 af lnflow=75.63 cfs 7.854 af 18.0" Round Culvert n=0.020 L=96.0' S=0.0208 '/' Outflow=12.34 cfs 7.511 af
Total Runoff Area = 611.000 ac Runoff Volume = 137.57 4 af Average Runoff Depth = 2. 70" 98.40% Pervious = 601.208 ac 1.60% Impervious = 9. 792 ac
Appendix 21

frye,burg 302 hydrology-final design Prepared by Microsoft
Type II 24-hr 500-yr Rainfa/1=8.40" Printed 1/28/2014
Page 12 HydroCAD® 9.10 s/n 01047 © 2011 HydroCAD Software Solutions LLC
Time span=S.00-25.00 hrs, dt=0.01 hrs, 2001 points Runoff by SCS TR-20 method, UH=SCS
Reach routing by Stor-lnd+ Trans method - Pond routing by Stor-lnd method
Subcatchment 347+00: 347+00
Subcatchment 386+20: 386+20
Runoff Area=110.000 ac 0.00% Impervious Runoff Depth>2.38" Tc=45.0 min CN=49 Runoff=153.18 cfs 21.855 af
Runoff Area=57.700 ac 6.16% Impervious Runoff Depth>5.04" Flow Length=2,200' Tc=44.4 min CN=72 Runoff=193.19 cfs 24.252 af
Subcatchment 386+20 ave: 386+20ave Runoff Area=57.700 ac 0.00% Impervious Runoff Depth>3.40" Tc=44.0 min CN=58 Runoff=126.37 cfs 16.359 af
Subcatchment 479+00: 479+00
Subcatchment 502+00: 502+00
Subcatchment 507+20: 507+20
Subcatchment 515+00: 515+00
Subcatchment 525+33: 525+00
Runoff Area=66.000 ac 2.33% Impervious Runoff Depth>4.22" Flow Length=3,900' Tc=39.2 min CN=65 Runoff=199.88 cfs 23.201 af
Runoff Area=84.000 ac 2.38% Impervious Runoff Depth>4.1 0" Flow Length=3,200' Tc=48.0 min CN=64 Runoff=213.65 cfs 28.689 af
Runoff Area=43.000 ac 1.58% Impervious Runoff Depth>4.45" Flow Length=3,300' Tc=38.1 min CN=67 Runoff=140.80 cfs 15.960 af
Runoff Area=13.000 ac 4.31% Impervious Runoff Depth>4.22" Flow Length=3,200' Tc=29.5 min CN=65 Runoff=47.93 cfs 4.571 af
Runoff Area=8.1 00 ac 6.67% Impervious Runoff Depth>4.57" Flow Length=1 ,300' Tc=34.8 min CN=68 Runoff=29.07 cfs 3.086 af
Subcatchment 540+61A: 540+61 usgs Runoff Area=123.000 ac 0.00% Impervious Runoff Depth>2.83" Tc=60.0 min CN=53 Runoff=172.22 cfs 28.959 af
Subcatchment 555: 555 Runoff Area=8.700 ac 1.38% Impervious Runoff Depth=4.93" Flow Length=1,100' Slope=0.0800 '/' Tc=16.1 min CN=71 Runoff=53.59 cfs 3.573 af
Subcatchment 565+50: 565+50 Runoff Area=27.000 ac 2.96% Impervious Runoff Depth>4.57" Flow Length=1 ,880' Tc=33.4 min CN=68 Runoff=99.80 cfs 10.288 af
Subcatchment 587R: 587+00 R Drive Runoff Area=12.800 ac 0.00% Impervious Runoff Depth>4.81" Flow Length=1 ,300' Slope=0.0500 '/' Tc=23.4 min CN=70 Runoff=62.43 cfs 5.131 af
Pond 348P: 347+01
Pond 386+20P: 386+20
Pond 387P: 386+20
Peak Elev=502.50' Storage=4.025 af lnflow=153.18 cfs 21.855 af 24.0" Round Culvert n=0.012 L=58.0' S=0.0034 '/' Outflow=190.34 cfs 20.800 af
Peak Elev=1 ,430.22' Storage=4.61 0 af lnflow=193.19 cfs 24.252 af 18.0" Round Culvert n=0.012 L=56.0' S=0.0036 '/' Outflow=230.81 cfs 20.468 af
Peak Elev=787.00' Storage=4.605 af lnflow=126.37 cfs 16.359 af 18.0" Round Culvert n=0.012 L=56.0' S=0.0232 '/' Outflow=130.46 cfs 15.089 af
Pond 540+61: box culvert outlet Peak Elev=O.OO' Storage=O.OOO af Primary=O. 00 cfs 0. 000 af
Appendix 22

fryeburg 302 hydrology-final design Prepared by Microsoft
Type II 24-hr 500-yr Rainfa/1=8.40" Printed 1/28/2014
Page 13 HydroCAD® 9.10 s/n 01047 © 2011 HydroCAD Software Solutions LLC
Pond 540+61-a: 30" round outlet Peak Elev=490.70' Storage=12.645 af lnflow=172.22 cfs 28.959 af Outflow=78.81 cfs 24.867 af
Pond 565+50p: 565+50 Peak Elev=492.30' Storage=4.987 af lnflow=99.80 cfs 10.288 af 18.0" Round Culvert n=0.020 L=96.0' S=0.0208 '/' Outflow=14.11 cfs 9.855 af
Total Runoff Area= 611.000 ac Runoff Volume= 185.923 af Average Runoff Depth= 3.65" 98.40% Pervious = 601.208 ac 1.60% Impervious = 9. 792 ac
Appendix 23

Table 1 -Summary of Culvert Flows at Crossing: 321+50 Headwater Elevation Total Discharge (cfs) Culvert 1 Discharge Roadway Discharge Iterations
(ft) (cfs) (cfs)
387.12 1.00 1.00 0.00 1
387.51 4.80 4.80 0.00 1
388.01 8.60 8.60 0.00 1
388.30 12.40 12.40 0.00 1 388.55 16.20 16.20 0.00 1
388.77 20.00 20.00 0.00 1 388.97 23.80 23.80 0.00 1 389.00 25.00 25.00 0.00 1 389.16 31.40 31.40 0.00 1 389.25 35.20 35.20 0.00 1 389.35 39.00 39.00 0.00 1 392.33 174.98 174.98 0.00 Overtopping
Appendix 24

Table 2 - Culvert Summary Table: Culvert 1 Total Culvert Headwater Inlet Control Outlet Flow Normal Critical Outlet Depth Tailwater Outlet Tailwater
Discharge Discharge Elevation (It) Depth (It) Control Type Depth (ft) Depth (It) (ft) Depth (It) Velocity Velocity (cfs) (cfs) Depth {It) (ft/s) (ft/s)
1.00 1.00 387.12 0.109 0.130 2-M2c 0.081 0.047 0.091 0.190 1.823 0.827
4.80 4.80 387.51 0.514 0.494 2-M2c 0.388 0.225 0.268 0.477 2.267 1.446
8.60 8.60 388.01 1.021 0.729 2-M2c 0.535 0.398 0.398 0.668 3.661 1.754
12.40 12.40 388.30 1.303 0.929 2-M2c 0.679 0.496 0.509 0.823 4.060 1.971
16.20 16.20 388.55 1.555 1.106 2-M2c 0.813 0.593 0.607 0.956 4.445 2.142
20.00 20.00 388.77 1.772 1.265 2-M2c 0.918 0.691 0.699 1.075 4.770 2.284
23.80 23.80 388.97 1.972 1.421 2-M2c 1.024 0.787 0.790 1.183 5.023 2.406
25.00 25.00 389.00 2.002 1.468 2-M2c 1.057 0.811 0.815 1.215 5.114 2.441
31.40 31.40 389.16 2.164 1.707 2-M2c 1.224 0.938 0.950 1.375 5.510 2.610
·l 35.20 35.20 389.25 2.260 1.840 2-M2c 1.310 1.013 1.025 1.462 5.722 2.697
l 39.00 39.00 389.35 2.356 1.967 2-M2c 1.396 1.088 1.096 1.544 5.933 2.778
Appendix 25

Inlet Elevation (invert): 386.99 ft, Outlet Elevation (invert): 386.18 ft
Culvert Length: 95.40 ft, Culvert Slope: 0.0085
Appendix 26

Water Surface Profile Plot for Culvert: Culvert 1
392
391
390
§ 389 :;::::; rn > G) 388 w
Crossing- 321: 50, Design Discharge- 25.0 cfs Culvert- Culvert 1, Culvert Discharge- 25.0 cfs
+----------------
387
386 ~~~~-.. ··----------------+<"
385
-20 0 20 40 60 Station (ft)
Site Data - Culvert 1
Site Data Option: Culvert Invert Data
Inlet Station: 0.00 ft
Inlet Elevation: 386.91 ft
Outlet Station: 95.40 ft
Outlet Elevation: 386.10 ft
Number of Barrels: 1
Culvert Data Summary - Culvert 1
Barrel Shape: Concrete Box
Barrel Span: 6.00 ft
Barrel Rise: 4.00 ft
Barrel Material: Concrete
Embedment: 1.00 in
Barrel Manning's n: 0.0120 (top and sides)
Manning's n: 0.0350 (bottom)
Inlet Type: Conventional
Inlet Edge Condition: Mitered to Conform to Slope
Inlet Depression: NONE
80 100 120
Appendix 27
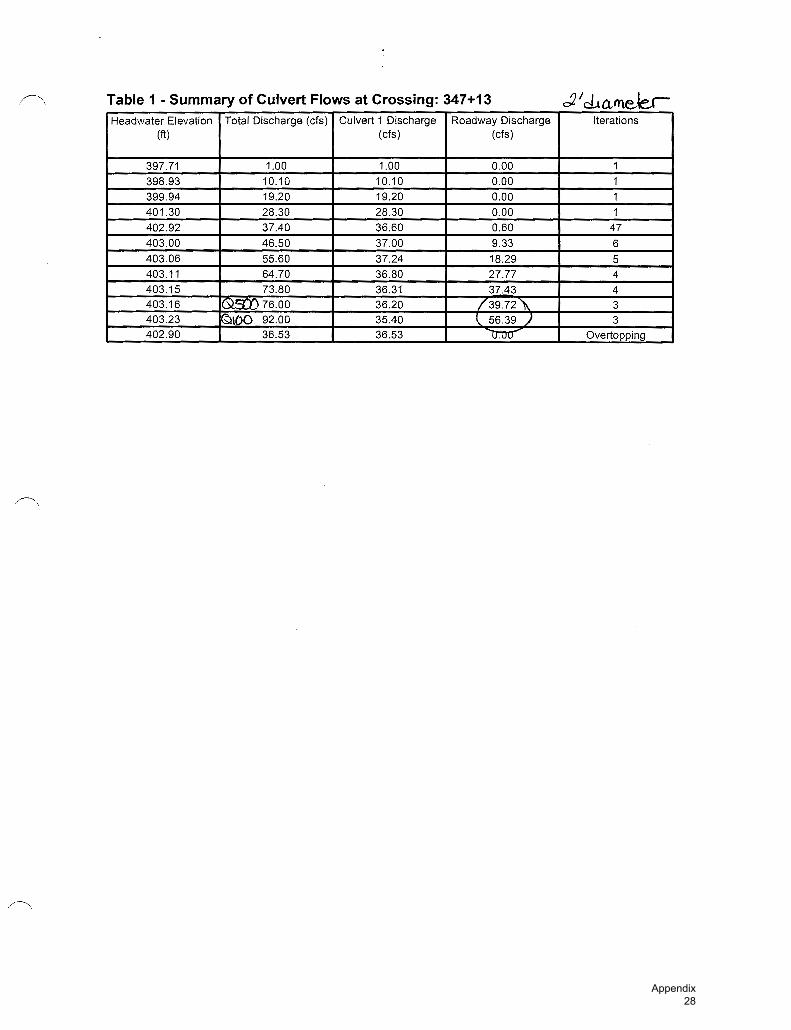
Table 1 -Summary of Culvert Flows at Crossing: 347+13 Headwater Elevation Total Discharge (cfs) Culvert 1 Discharge Roadway Discharge Iterations
(ft) (cfs) (cfs)
397.71 1.00 1.00 0.00 1 398.93 10.10 10.10 0.00 1 399.94 19.20 19.20 0.00 1 401.30 28.30 28.30 0.00 1 402.92 37.40 36.60 0.60 47 403.00 46.50 37.00 9.33 6 403.06 55.60 37.24 18.29 5 403.11 64.70 36.80 27.77 4 403.15 73.80 36.31 37.43 4 403.16 ~91)76.00 36.20 /39.72"' 3 403.23 ~lOO 92.00 35.40 _l 56.39 }_ 3 402.90 36.53 36.53 Jr.m[ Overtopping
Appendix 28

.~. Table 2 - Culvert Summary Table: Culvert 1 Total Culvert Headwater Inlet Control Outlet Flow Normal Critical Outlet Depth Tailwater Outlet Tailwater
Discharge Discharge Elevation (ft) Depth (ft) Control Type Depth (ft) Depth (ft) (It) Depth (ft) Velocity Velocity (cfs) (cfs) Depth (ft) (ft/s) (ft/s)
1.00 1.00 397.71 0.460 0.509 2-M2c 0.419 0.332 0.344 0.211 2.773 0.875
10.10 10.10 398.93 1.644 1.735 2-M2c 1.630 1.134 1.137 0.803 5.476 1.905
19.20 19.20 399.94 2.562 2.745 7-M2c 2.000 1.573 1.576 1.142 7.229 2.307
28.30 28.30 401.30 3.950 4.102 7-M2c 2.000 1.849 1.830 1.405 9.393 2.579
37.40 36.60 402.92 5.706 5.716 6-FFc 2.000 2.000 2.000 1.626 11.652 2.788
46.50 37.00 403.00 5.801 5.800 6-FFc 2.000 2.000 2.000 1.819 11.778 2.960
55.60 37.24 403.06 5.857 5.849 6-FFc 2.000 2.000 2.000 1.992 11.853 3.107
64.70 36.80 403.11 5.752 5.906 4-FFf 2.000 2.000 2.000 2.150 11.713 3.237
73.80 36.31 403.15 5.637 5.950 4-FFf 2.000 2.000 2.000 2.295 11.558 3.353
76.00 36.20 403.16 5.611 5.961 4-FFf 2.000 2.000 2.000 2.329 11.523 3.379
92.00 35.40 403.23 5.427 6.028 4-FFf 2.000 2.000 2.000 2.558 11.270 3.555
Appendix 29

Inlet Elevation (invert): 397.20 ft, Outlet Elevation (invert): 397.10 ft
Culvert Length: 58.00 ft, Culvert Slope: 0.0017
Appendix 30

Water Surface Profile Plot for Culvert: Culvert 1
Crossing- 347+ 13, Design Discharge- 76.0 cfs Culvert- Culvert 1
0 Culvert Discharge- 36.2 ds
c 0
403
402
=§ 400 > (1)
+------------------------------------+
I \\ \------------------"•(
~----------------------~ I w
399
398
0 20 40 Station (ft)
Site Data - Culvert 1
Site Data Option: Culvert Invert Data
Inlet Station: 0.00 ft
Inlet Elevation: 397.20 ft
Outlet Station: 58.00 ft
Outlet Elevation: 397.1 0 ft
Number of Barrels: 1
60
Appendix 31

Table 1 -Summary of Culvert Flows at Crossing: 465+84 Headwater Elevation Total Discharge (cfs) Culvert 1 Discharge Roadway Discharge Iterations
(ft) (cfs) (cfs)
421.24 1.00 1.00 0.00 1
422.66 19.00 19.00 0.00 1
423.36 37.00 37.00 0.00 1
423.99 55.00 55.00 0.00 1
424.56 73.00 73.00 0.00 1
425.07 91.00 91.00 0.00 1 425.56 109.00 109.00 0.00 1
426.05 127.00 127.00 0.00 1 426.57 145.00 145.00 0.00 1
etso 426.69 149.00 149.00 0.00 1
~lli"> 427.75 181.00 181.00 0.00 1 431.76 268.55 268.55 0.00 Overtopping
Appendix 32

Table 2 - Culvert Summary Table: Culvert 1 Total Culvert Headwater Inlet Control Outlet Flow Normal Critical Outlet Depth Tailwater Outlet Tailwater
Discharge Discharge Elevation (ft) Depth (ft) Control Type Depth (ft) Depth (ft) (ft) Depth (ft) Velocity Velocity (cfs) (cfs) Depth (ft) (ft/s) (ft/s)
1.00 1.00 421.24 0.208 o.o· 1-S2n 0.120 0.148 0.138 0.211 2.060 0.875
19.00 19.00 422.66 1.635 o.o· 1-S2n 1.037 1.180 1.040 1.136 6.471 2.300
37.00 37.00 423.36 2.332 o.o· 1-S2n 1.455 1.679 1.458 1.617 7.751 2.780
55.00 55.00 423.99 2.963 o.o· 1-S2n 1.786 2.075 1.800 1.981 8.617 3.098
73.00 73.00 424.56 3.530 o.o· 1-S2n 2.092 2.407 2.139 2.283 9.099 3.343
91.00 91.00 425.07 4.041 o.o• 1-S2n 2.370 2.699 2.423 2.545 9.646 3.545
109.00 109.00 425.56 4.528 o.o· 1-S2n 2.640 2.975 2.696 2.778 10.099 3.717
127.00 127.00 426.05 5.020 o.o· 5-S2n 2.903 3.213 2.952 2.990 10.530 3.868
145.00 145.00 426.57 5.538 o.o· 5-S2n 3.173 3.447 3.182 3.185 11.013 4.004
149.00 149.00 426.69 5.658 2.746 5-S2n 3.234 3.499 3.243 3.226 11.074 4.032
181.00 181.00 427.75 6.717 3.056 5-S2n 3.760 3.840 3.769 3.536 11.426 4.240
Appendix 33

*theoretical depth is impractical. Depth reported is corrected.
Appendix 34

Inlet Elevation (invert): 421.03 ft, Outlet Elevation (invert): 420.55 ft
Culvert Length: 97.00 ft, Culvert Slope: 0.0049
Appendix 35

-~. Water Surface Profile Plot for Culvert: Culvert 1
Crossing- 465+84, Design Discharge- 149.0 cfs
c 0
432
430
i5 426 > <ll
w 424
422
Culvert- Culvert 1, Culv·ert Discharge- 149.0 cfs
\
\ +----------------y--1 ___ \~,)
r~---·--=---·-=------=----·;;,:;.;.;;.:.;·-----,;;.;;;;;;.:;·-----~~-----:..:..:..;,:;;·----:.:.:.:::.i·-----J-------------------x
-20 0 20 40 60 Station (ft)
80 100 120
Site Data - Culvert 1
Site Data Option: Culvert Invert Data
Inlet Station: 0.00 ft
Inlet Elevation: 421.03 ft
Outlet Station: 97.00 ft
Outlet Elevation: 420.55 ft
Number of Barrels: 1
Culvert Data Summary - Culvert 1
Barrel Shape: Circular
Barrel Diameter: 5.00 ft
Barrel Material: Concrete
Embedment: 0.00 in
Barrel Manning's n: 0.0120
Inlet Type: Conventional
Inlet Edge Condition: Square Edge with Headwall
Inlet Depression: NONE
Appendix 36

~. Table 3 - Downstream Channel Rating Curve (Crossing: 465+84)
Flow (cfs) Water Surface Depth (ft) Velocity (ftls) Shear (psf) Froude Number Elev (ft)
1.00 420.76 0.21 0.88 0.07 0.35 19.00 421.69 1.14 2.30 0.35 0.44 37.00 422.17 1.62 2.78 0.50 0.45 55.00 422.53 1.98 3.10 0.62 0.47 73.00 422.83 2.28 3.34 0.71 0.47 91.00 423.09 2.54 3.54 0.79 0.48 109.00 423.33 2.78 3.72 0.87 0.49 127.00 423.54 2.99 3.87 0.93 0.49 145.00 423.73 3.18 4.00 0.99 0.49 149.00 423.78 3.23 4.03 1.01 0.49 181.00 424.09 3.54 4.24 1.10 0.50
Appendix 37

/~. Tailwater Channel Data - 465+84
Tailwater Channel Option: Trapezoidal Channel
Bottom Width: 5.00 ft
Side Slope (H:V): 2.00 L:1)
Channel Slope: 0.0050
Channel Manning's n: 0.0400
Channel Invert Elevation: 420.55 ft
Roadway Data for Crossing: 465+84
Roadway Profile Shape: Constant Roadway Elevation
Crest Length: 50.00 ft
Crest Elevation: 431.76 ft
Roadway Surface: Paved
Roadway Top Width: 30.00 ft
Appendix 38

Table 1- Summary of Culvert Flows at Crossing: 479+13 Headwater Elevation Total Discharge (cfs) Culvert 1 Discharge Roadway Discharge Iterations
(ft) (cfs) (cfs)
429.96 1.00 1.00 0.00 1 430.90 9.90 9.90 0.00 1 431.43 18.80 18.80 0.00 1 431.94 27.70 27.70 0.00 1 432.38 36.60 36.60 0.00 1
432.79 45.50 45.50 0.00 1 433.21 54.40 54.40 0.00 1 433.66 63.30 63.30 0.00 1 434.16 72.20 72.20 0.00 1 434.46 77.00 77.00 0.00 1 435.37 90.00 90.00 0.00 1 437.52 114.49 114.49 0.00 Overtopping
Appendix 39

Table 2 - Culvert Summary Table: Culvert 1 Total Culvert Headwater Inlet Control Outlet Flow Normal Critical Outlet Depth Tailwater Outlet Tailwater
Discharge Discharge Elevation (ft) Depth (ft) Control Type Depth (ft) Depth (ft) {It) Depth (ft) Velocity Velocity (cis) (cis) Depth (ft) (ft/s) (ftls)
1.00 1.00 429.96 0.320 o.o· 1-S2n 0.078 0.252 0.092 0.064 4.363 3.802
9.90 9.90 430.90 1.263 0.0' 1-S2n 0.483 0.939 0.499 0.248 11.382 8.870
18.80 18.80 431.43 1.789 o.o· 1-S2n 0.700 1.318 0.741 0.361 12.771 11.039
27.70 27.70 431.94 2.298 o.o· 1-S2n 0.834 1.615 0.849 0.451 15.225 12.541
36.60 36.60 432.38 2.736 0.0* 1-S2n 0.968 1.871 1.071 0.528 14.700 13.709
45.50 45.50 432.79 3.148 0.0* 1-S2n 1.090 2.103 1.218 0.597 15.223 14.674
54.40 54.40 433.21 3.567 o.o· 5-S2n 1.193 2.301 1.358 0.660 15.753 15.504
63.30 63.30 433.66 4.018 0.0* 5-S2n 1.296 2.489 1.489 0.717 16.210 16.234
72.20 72.20 434.16 4.521 0.0* 5-S2n 1.399 2.651 1.616 0.771 16.614 16.889
:oo:. 77.00 77.00 434.46 . 4.819 0.0* 5-S2n 1.447 2.739 1.683 0.799 16.826 17.215
tot 90.00 90.00 435.37 5.728 0.0* 5-S2n 1.577 2.923 1.856 0.870 17.383 18.027
Appendix 40

* theoretical depth is impractical. Depth reported is corrected.
Appendix 41

********************************************************************************
Inlet Elevation (invert): 429.64 ft, Outlet Elevation (invert): 426.36 ft
Culvert Length: 85.06 ft, Culvert Slope: 0.0386
********************************************************************************
Appendix 42

Water Surface Profile Plot for Culvert: Culvert 1
Crossing - 479+ 13, Design Discharge - 77.0 cfs Culvert- Cu.l:vert 10 Culvert Discharge- 77.0 cfs
438~--------------------------------------------------.
43f3
434 +----------------------/ /
c ~ 432 ro > <])
w 430
428
-20 0 20
Site Data- Culvert 1
Site Data Option: Culvert Invert Data
Inlet Station: 0.00 ft
Inlet Elevation: 429.64 ft
Outlet Station: 85.00 ft
Outlet Elevation: 426.36 ft
Number of Barrels: 1
Culvert Data Summary - Culvert 1
Barrel Shape: Circular
Barrel Diameter: 3.50 ft
Barrel Material: Concrete
Embedment: 0.00 in
Barrel Manning's n: 0.0120
Inlet Type: Conventional
40 60 Station (ft)
Inlet Edge Condition: Square Edge with Headwall
Inlet Depression: NONE
80 100
Appendix 43

,~. Table 3- Downstream Channel Rating Curve (Crossing: 479+13)
Flow (cfs) Water Surface Depth (ft) Velocity (ftls) Shear (psf) Froude Number Elev (ft)
1.00 426.42 0.06 3.80 0.16 2.69 9.90 426.61 0.25 8.87 0.60 3.31 18.80 426.72 0.36 11.04 0.88 3.48 27.70 426.81 0.45 12.54 1.10 3.58 36.60 426.89 0.53 13.71 1.29 3.66 45.50 426.96 0.60 14.67 1.45 3.71 54.40 427.02 0.66 15.50 1.61 3.76 63.30 427.08 0.72 16.23 1.75 3.80 72.20 427.13 0.77 16.89 1.88 3.83 77.00 427.16 0.80 17.22 1.94 3.85 90.00 427.23 0.87 18.03 2.12 3.89
Appendix 44

Tailwater Channel Data- 479+13
Tailwater Channel Option: Trapezoidal Channel
Bottom Width: 4.00 ft
Side Slope (H:V): 2.00 (_:1)
Channel Slope: 0.0390
Channel Manning's n: 0.0120
Channel Invert Elevation: 426.36 ft
Appendix 45

Table 1 -Summary of Culvert Flows at Crossing: 507+29 Headwater Elevation Total Discharge (cfs) Culvert 1 Discharge Roadway Discharge Iterations
(ft) (cfs) (cfs)
454.58 1.00 1.00 0.00 1 455.29 7.10 7.10 0.00 1 455.69 13.20 13.20 0.00 1
456.01 19.30 19.30 0.00 1
456.36 25.40 25.40 0.00 1
456.67 31.50 31.50 0.00 1 456.97 37.60 37.60 0.00 1 457.25 43.70 43.70 0.00 1 457.53 49.80 49.80 0.00 1 457.68 53.00 53.00 0.00 1
458.13 62.00 62.00 0.00 1
459.49 84.24 84.24 0.00 Overtopping
Appendix 46

Table 2- Culvert Summary Table: Culvert 1 Total Culvert Headwater Inlet Control Outlet Flow Normal Critical Outlet Depth Tailwater Outlet Tailwater
Discharge Discharge Elevation (ft) Depth (ft) Control Type Depth (ft) Depth (ft) (ft) Depth (ft) Velocity Velocity (cfs) (cfs) Depth (ft) (ftls) (ftls)
1.00 1.00 454.58 0.310 o.o· 1-S2n 0.052 0.252 0.052 0.125 7.239 2.468
7.10 7.10 455.29 1.020 o.o· 1-S2n 0.356 0.789 0.379 0.390 14.277 4.819
13.20 13.20 455.69 1.422 o.o• 1-S2n 0.454 1.098 0.488 0.551 15.656 5.835
19.30 19.30 456.01 1.737 o.o· 1-S2n 0.553 1.338 0.568 0.678 18.523 6.530
25.40 25.40 456.36 2.089 o.o• 1-S2n 0.652 1.542 0.652 0.786 20.297 7.068
31.50 31.50 456.67 2.405 o.o· 1-S2n 0.731 1.734 0.790 0.881 19.179 "1.511
37.60 37.60 456.97 2.697 o.o• 1-S2n 0.792 1.897 0.874 0.966 19.839 7.892
43.70 43.70 457.25 2.979 o.o· 1-S2n 0.853 2.057 0.955 1.044 20.420 8.227
49.80 49.80 457.53 3.262 0.0' 1-S2n 0.914 2.199 1.039 1.116 20.804 8.525
53.00 53.00 457.68 3.413 o.o· 1-S2n 0.946 2.270 1.083 1.152 20.977 8.671
62.00 62.00 458.13 3.863 o.o· 5-S2n 1.036 2.466 1.186 1.247 21.526 9.047
Appendix 47

* theoretical depth is impractical. Depth reported is corrected.
Appendix 48

Inlet Elevation (invert): 454.27 ft, Outlet Elevation (invert): 446.80 ft
Culvert Length: 85.33 ft, Culvert Slope: 0.0879
********************************************************************************
Appendix 49
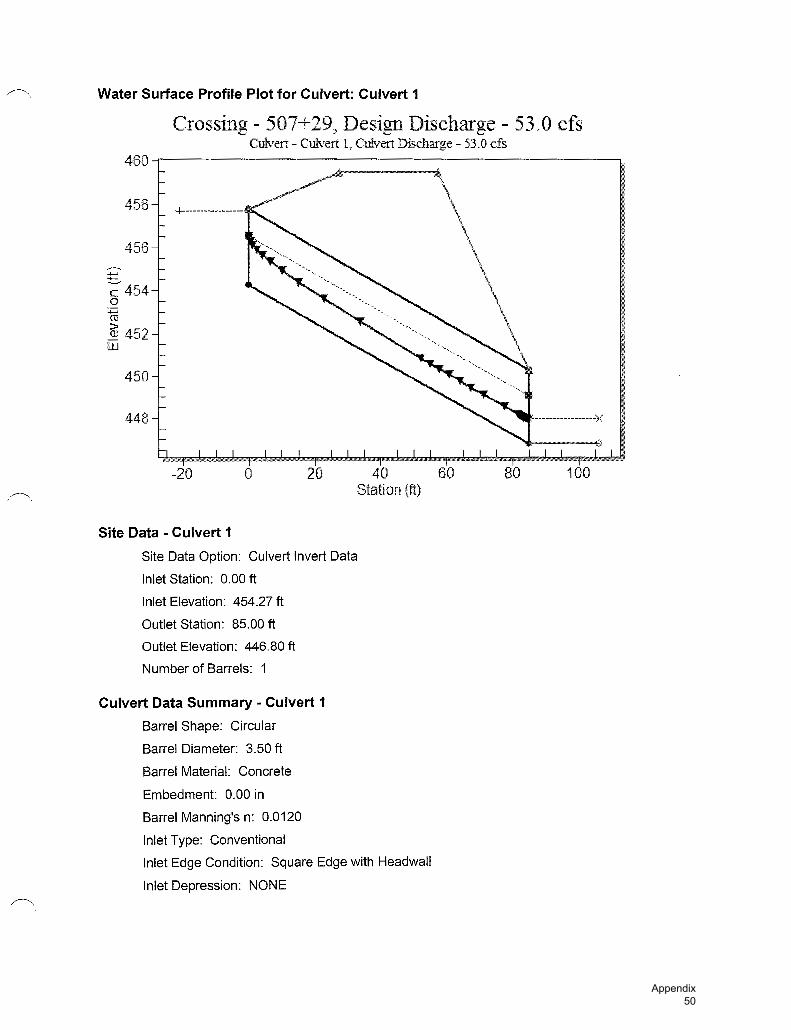
Water Surface Profile Plot for Culvert: Culvert 1
Crossing- 507+29, Design Discharge- 53.0 cfs Culvet1- Culvert 1, Curvett Discharge- 53.0 cfs
458
456 .-~
+-' ::t::--c 454 0
+-' m > (l) 452 w
450
448
-20
Site Data - Culvert 1
0 20
Site Data Option: Culvert Invert Data
Inlet Station: 0.00 ft
Inlet Elevation: 454.27 ft
Outlet Station: 85.00 ft
Outlet Elevation: 446.80 ft
Number of Barrels: 1
Culvert Data Summary - Culvert 1
Barrel Shape: Circular
Barrel Diameter: 3.50 ft
Barrel Material: Concrete
Embedment: 0.00 in
Barrel Manning's n: 0.0120
Inlet Type: Conventional
40 60 Station {ft)
Inlet Edge Condition: Square Edge with Headwall
Inlet Depression: NONE
80 100
Appendix 50

Table 3 -Downstream Channel Rating Curve (Crossing: 507+29)
Flow (cfs) Water Surface Depth (ft) Velocity (ft!s) Shear (psf) Froude Number Elev (ft)
1.00 446.92 0.12 2.47 0.62 1.28 7.10 447.19 0.39 4.82 1.95 1.49
13.20 447.35 0.55 5.84 2.75 1.56 19.30 447.48 0.68 6.53 3.39 1.60 25.40 447.59 0.79 7.07 3.92 1.63 31.50 447.68 0.88 7.51 4.40 1.65 37.60 447.77 0.97 7.89 4.82 1.67 43.70 447.84 1.04 8.23 5.21 1.69 49.80 447.92 1.12 8.53 5.57 1.70 53.00 447.95 1.15 8.67 5.75 1.70 62.00 448.05 1.25 9.05 6.23 1.72
/~.
Appendix 51

Tailwater Channel Data- 507+29
Tailwater Channel Option: Trapezoidal Channel
Bottom Width: 3.00 ft
Side Slope (H:V): 2.00 (_:1)
Channel Slope: 0.0800
Channel Manning's n: 0.0400
Channel Invert Elevation: 446.80 ft
Roadway Data for Crossing: 507+29
Roadway Profile Shape: Constant Roadway Elevation
Crest Length: 50.00 ft
Crest Elevation: 459.49 ft
Roadway Surface: Paved
Roadway Top Width: 30.00 ft
Appendix 52

Table 1 -Summary of Culvert Flows at Crossing: Fryeburg 521+50 Headwater Elevation Total Discharge (cfs) 12X1 0 Discharge (cfs) Roadway Discharge Iterations
(ft) (cfs)
426.71 20.00 20.00 0.00 1
427.70 61.70 61.70 0.00 1 428.37 103.40 103.40 0.00 1
428.93 145.10 145.10 0.00 1
429.44 186.80 186.80 0.00 1
429.92 228.50 228.50 0.00 1 430.36 270.20 270.20 0.00 1
430.79 311.90 311.90 0.00 1 431.20 353.60 353.60 0.00 1 431.29 363.00 363.00 0.00 1 431.96- 437.00 437.00 0.00 1 439.77 1556.91 1556.91 0.00 Overtopping
Appendix 53

Table 2 - Culvert Summary Table: 12X1 0 5!11+50 Total Culvert Headwater Inlet Control Outlet Flow Normal Critical joutlet Depth Tailwater Outlet Tailwater
Discharge Discharge Elevation (ft) Depth (ft) Control Type Depth (ft) Depth (ft) (ft) Depth (ft) Velocity Velocity
(cfs) (cfs) Depth (ft) (ft/s) (ft/s)
20.00 20.00 426.71 0.438 0.780 2-M2c 3.855 0.296 0.440 0.440 3.789 3.528
61.70 61.70 427.70 1.272 1.770 2-M2c 7.669 0.914 0.935 0.855 5.497 5.266
103.40 103.40 428.37 1.873 2.443 2-M2c 9.833 1.283 1.319 1.153 6.533 6.268
145.10 145.10 428.93 2.349 2.999 2-M2c 9.833 1.621 1.653 1.400 7.316 7.001
186.80 186.80 429.44 2.785 3.515 2-M2c 9.833 1.959 1.961 1.616 7.939 7.588
228.50 228.50 429.92 3.183 3.990 2-M2c 9.833 2.221 2.242 1.810 8.491 8.080
270.20 270.20 430.36 3.559 4.436 2-M2c 9.833 2.482 2.508 1.988 8.978 8.508
311.90 311.90 430.79 3.918 4.862 2-M2c 9.833 2.743 2.760 2.153 9.417 8.886
353.60 353.60 431.20 4.262 5.270 2-M2c 9.833 2.995 3.001 2.307 9.818 9.227
363.00 363.00 431.29 4.336 5.360 2-M2c 9.833 3.045 3.054 2.340 9.905 9.300
437.00 437.00 431.96 4.906 6.038 2-M2c 9.833 3.436 3.456 2.590 10.537 9.824
Appendix 54

Inlet Elevation (invert): 425.93 ft, Outlet Elevation (invert): 425.93 ft
Culvert Length: 50.00 ft, Culvert Slope: 0.0000
Appendix 55

Water Surface Profile Plot for Culvert: 12X10
Crossing- Fryeburg 521+50~ Design Discharge- 363.0 cfs Culvert- 12Xl0, Culvert Discharge- 363J} cfs
440
438
436 .-~
'E~434 c 0
15 432 > <D
w 430
428
426
-10 0 10 20 30
Site Data- 12X10
Site Data Option: Culvert Invert Data
Inlet Station: 0.00 ft
Inlet Elevation: 425.76 ft
Outlet Station: 50.00 ft
Outlet Elevation: 425.76 ft
Number of Barrels: 1
Culvert Data Summary -12X10
Barrel Shape: Concrete Box
Barrel Span: 12.00 ft
Barrel Rise: 10.00 ft
Barrel Material: Concrete
Embedment: 2.00 in
Statiort (ft)
Barrel Manning's n: 0.0120 (top and sides)
Manning's n: 0.0350 (bottom)
Inlet Type: Conventional
Inlet Edge Condition: Square Edge with Headwall
Inlet Depression: NONE
~ ~-----------------'?--.:
40 50 60
Appendix 56

Table 3- Downstream Channel Rating Curve (Crossing: Fryeburg 521+50)
Flow (cfs) Water Surface Depth (ft) Velocity (ftls) Shear (psf) Froude Number Elev (ft)
20.00 425.45 0.44 3.53 0.82 0.97 61.70 425.86 0.85 5.27 1.60 1.06 103.40 426.16 1.15 6.27 2.16 1.11 145.10 426.41 1.40 7.00 2.62 1.14 186.80 426.63 1.62 7.59 3.03 1.16 228.50 426.82 1.81 8.08 3.39 1.17 270.20 427.00 1.99 8.51 3.72 1.19 311.90 427.16 2.15 8.89 4.03 1.20 353.60 427.32 2.31 9.23 4.32 1.21 363.00 427.35 2.34 9.30 4.38 1.21 437.00 427.60 2.59 9.82 4.85 1.23
Appendix 57

Tailwater Channel Data- Fryeburg 521+50
Tailwater Channel Option: Trapezoidal Channel
Bottom Width: 12.00 ft
Side Slope (H:V): 2.00 (_:1)
Channel Slope: 0.0300
Channel Manning's n: 0.0400
Channel Invert Elevation: 425.01 ft
Roadway Data for Crossing: Fryeburg 521+50
Roadway Profile Shape: Constant Roadway Elevation
Crest Length: 50.00 ft
Crest Elevation: 439.77 ft
Roadway Surface: Paved
Roadway Top Width: 30.00 ft
Appendix 58

Table 1 - Summary of Culvert Flows at Crossing: 525+32 Headwater Elevation Total Discharge (cfs) Culvert 1 Discharge Roadway Discharge Iterations
(ft) (cfs) (cfs)
451.61 1.00 1.00 0.00 1
451.82 2.35 2.35 0.00 1
451.99 3.70 3.70 0.00 1
452.13 5.05 5.05 0.00 1
452.25 6.40 6.40 0.00 1
452.37 7.75 7.75 0.00 1
452.47 9.10 9.10 0.00 1
452.57 10.45 10.45 0.00 1
452.66 11.80 11.80 0.00 1
452.70 12.40 12.40 0.00 1
452.86 14.50 14.50 0.00 1
455.88 58.82 58.82 0.00 Overtopping
Appendix 59

Table 2 - Culvert Summary Table: Culvert 1 Total Culvert Headwater Inlet Control Outlet Flow Normal Critical Outlet Depth Tailwater Outlet Tailwater
Discharge Discharge Elevation (It) Depth (ft) Control Type Depth (ft) Depth (ft) (ft) Depth (ft) Velocity Velocity (cfs) (cfs) Depth (f!) (fils) (fils)
1.00 1.00 451.61 0.412 o.o· 1-S2n 0.097 0.306 0.105 0.153 4.702 1.977
2.35 2.35 451.82 0.618 o.o• 1-S2n 0.228 0.453 0.228 0.252 6.780 2.659
3.70 3.70 451.99 0.794 o.o· 1-S2n 0.318 0.600 0.350 0.328 10.344 3.090
5.05 5.05 452.13 0,928 o.o· 1-S2n 0.359 0.691 0.381 0.391 9.344 3.414
6.40 6.40 452.25 1.051 o.o• 1-S2n 0.400 0.782 0.412 0.447 10.555 3.678
7.75 7.75 452.37 1.166 o.o• 1-S2n 0.441 0.873 0.463 0.497 10.843 3.900
9.10 9.10 452.47 1.274 o.o• 1-S2n 0.482 0.947 0.487 0.544 11.879 4.094
10.45 10.45 452.57 1.366 o.o· 1-S2n 0.523 1.014 0.537 0.587 11.976 4.268
11.80 11.80 452.66 1.458 o.o· 1-S2n 0.564 1.081 0.598 0.627 11.775 4.425
12.40 12.40 452.70 1.498 o.o• 1-S2n 0.583 1.111 0.590 0.644 12.595 4.489
14.50 14.50 452.86 1.661 o.o· 1-S2n 0.629 1.212 0.639 0.701 13.310 4.699
Appendix 60

*theoretical depth is impractical. Depth reported is corrected.
Appendix 61

·~. Inlet Elevation (invert): 451.20 ft, Outlet Elevation (invert): 448.31 ft
Culvert Length: 69.06 ft, Culvert Slope: 0.0419
Appendix 62

Water Surface Profile Plot for Culvert: Culvert 1
Crossing- 525+32, Design Discharge- 12.4 cfs Culvert - Culvert 10 Cur•.rert DL<:.eharge ~ 12.4 cfs
456
455
454
g453 c 0
~ 452 > Q)
w 451
450
449
448 -20 0 20 40
Site Data - Culvert 1
Site Data Option: Culvert Invert Data
Inlet Station: 0.00 ft
Inlet Elevation: 451.20 ft
Outlet Station: 69.00 ft
Outlet Elevation: 448.31 ft
Number of Barrels: 1
Culvert Data Summary - Culvert 1
Barrel Shape: Circular
Barrel Diameter: 3.00 ft
Barrel Material: Concrete
Embedment: 0.00 in
Barrel Manning's n: 0.0120
Inlet Type: Conventional
Station (ft)
Inlet Edge Condition: Square Edge with Headwall
Inlet Depression: NONE
60 80
Appendix 63

Table 3 -Downstream Channel Rating Curve (Crossing: 525+32)
Flow (cfs) Water Surface Depth (ft) Velocity (ftls) Shear (psf) Froude Number Elev (ft)
1.00 448.46 0.15 1.98 0.38 0.93 2.35 448.56 0.25 2.66 0.63 1.00 3.70 448.64 0.33 3.09 0.82 1.03 5.05 448.70 0.39 3.41 0.98 1.06 6.40 448.76 0.45 3.68 1.12 1.07 7.75 448.81 0.50 3.90 1.24 1.09 9.10 448.85 0.54 4.09 1.36 1.10 10.45 448.90 0.59 4.27 1.46 1.11 11.80 448.94 0.63 4.42 1.56 1.12 12.40 448.95 0.64 4.49 1.61 1.12 14.50 449.01 0.70 4.70 1.75 1.14
Appendix 64

Tailwater Channel Data - 525+32
Tailwater Channel Option: Trapezoidal Channel
Bottom Width: 3.00 ft
Side Slope (H:V): 2.00 (_: 1)
Channel Slope: 0.0400
Channel Manning's n: 0.0400
Channel Invert Elevation: 448.31 ft
Roadway Data for Crossing: 525+32
Roadway Profile Shape: Constant Roadway Elevation
Crest Length: 50.00 ft
Crest Elevation: 455.88 ft
Roadway Surface: Paved
Roadway Top Width: 30.00 ft
Appendix 65

Table 3. Ditch Calculations - Fryeburg-Bridgton Route 302Ditch Stations h, ft n S S^1/2 type of ditcside slopside slope1.49/n*s^1A P A/P^2/3 Q, cfs V, fps DA est C TC est i10 Q10 Station culvert Q10321+50 L to 328+00 L 0.8 0.05 0.0052 0.07 triangular 2.00 3.00 2.16 1.60 4.32 0.52 1.78 1.11 0.64 0.4 5 5.5 1.4 321+50 16.7339+00 from 344+00 L 0.6 0.05 0.016 0.13 triangular 2.00 3.00 3.77 0.90 3.24 0.43 1.44 1.60 0.48 0.4 5 5.5 1.1 347+13 43.1357+00 from 365+50 L 1.6 0.05 0.08 0.28 triangular 2.00 3.00 8.43 6.40 8.64 0.82 44.17 6.90 part of 347+13 43.0 386+32 41.0357 from 360 L 1.15 0.05 0.08 0.28 triangular 2.00 3.00 8.43 3.31 6.21 0.66 18.31 5.54 8.00 0.4 5 5.5 17.6 R-L 426+00 0.0360-365 L 1.3 0.05 0.005 0.07 triangular 2.00 3.00 2.11 4.23 7.02 0.71 6.35 1.50 3.00 0.4 5 5.5 6.6 465+85 86.1356+00 from 365+50 r 0.7 0.05 0.08 0.28 triangular 2.00 3.00 8.43 1.23 3.78 0.47 4.87 3.98 1.80 0.4 5 5.5 4.0 L-R 479+13 41.4356+360R 1.05 0.05 0.08 0.28 triangular 2.00 3.00 8.43 2.76 5.67 0.62 14.36 5.21 17.00 0.2 10 4.3 14.6 502+50 45.7360-365+50 1.9 0.05 0.005 0.07 triangular 2.00 3.00 2.11 9.03 10.26 0.92 17.46 1.93 507+29 28.6368+00 from 373+00 L 2.1 0.05 0.017 0.13 triangular 2.00 3.00 3.89 11.03 11.34 0.98 42.05 3.81 part of 347+13 max possible) 43.0 514+99 9.8
0.6 0.05 0.017 0.13 triangular 2.00 3.00 3.89 0.90 3.24 0.43 1.49 1.65 0.46 0.4 5 5.5 1.0 521+50 216.4368+00 from 377 R 1.5 0.05 0.017 0.13 triangular 2.00 3.00 3.89 5.63 8.10 0.78 17.14 3.05 part of 321+50 (max possible) 17.0 525+32 6.8
0.7 0.05 0.017 0.13 triangular 2.00 3.00 3.89 1.23 3.78 0.47 2.25 1.83 0.83 0.4 5 5.5 1.8 540+61 52.6374+00 from 377+00 L 0.8 0.05 0.005 0.07 triangular 2.00 3.00 2.11 1.60 4.32 0.52 1.74 1.09 0.46 0.4 5 5.5 1.0 555+77 11.3
2 0.05 0.005 0.07 triangular 2.00 3.00 2.11 10.00 10.80 0.95 20.02 2.00 part of 347+13 43.0 565+41 18.7378+00 to 384+00 R 0.4 0.05 0.05 0.22 triangular 2.00 3.00 6.66 0.40 2.16 0.32 0.87 2.16 0.55 0.4 5 5.5 1.2 587 R 12.4400+50 to 406+00 R 0.4 0.05 0.052 0.23 triangular 2.00 3.00 6.80 0.40 2.16 0.32 0.88 2.21 0.83 0.4 5 5.5 1.8403+50 to 412+00 L 0.6 0.05 0.05 0.22 triangular 2.00 3.00 6.66 0.90 3.24 0.43 2.55 2.84 0.98 0.4 5 5.5 2.1415+50 to 424+00 R 0.7 0.05 0.025 0.16 triangular 2.00 3.00 4.71 1.23 3.78 0.47 2.72 2.22 0.98 0.4 5 5.5 2.1418+00 to 423+00 L 0.6 0.05 0.025 0.16 triangular 2.00 3.00 4.71 0.90 3.24 0.43 1.80 2.01 0.57 0.4 5 5.5 1.3426+50 from 453+00 R435-426+50R 2.1 0.05 0.006 0.08 triangular 2.00 3.00 2.31 11.03 11.34 0.98 24.98 2.27 34.00 0.2 15 3.5 23.8445-434R 1.1 0.05 0.063 0.25 triangular 2.00 3.00 7.48 3.03 5.94 0.64 14.43 4.77 17.00 0.2 10 4.3 14.6453-445R 1.3 0.05 0.004 0.06 triangular 2.00 3.00 1.88 4.23 7.02 0.71 5.68 1.34 5.00 0.2 5 5.5 5.5433+00 from 451+00 L451-445L 0.9 0.05 0.006 0.08 triangular 2.00 3.00 2.31 2.03 4.86 0.56 2.61 1.29 0.83 0.5 5 5.5 2.3445-434L 0.85 0.05 0.063 0.25 triangular 2.00 3.00 7.48 1.81 4.59 0.54 7.25 4.02 2.73 0.5 5 5.5 7.5434-433L 1.1 0.05 0.02 0.14 triangular 2.00 3.00 4.21 3.03 5.94 0.64 8.13 2.69 2.89 0.5 5 5.5 8.0451+00 to 459+00 L 0.9 0.05 0.03 0.17 triangular 2.00 3.00 5.16 2.03 4.86 0.56 5.83 2.88 1.84 0.5 5 5.5 5.1459+00 to 466+00 L 1 0.05 0.044 0.21 triangular 2.00 3.00 6.25 2.50 5.40 0.60 9.35 3.74 3.44 0.5 5 5.5 9.5465+00 from 470+00 R 1.5 0.05 0.024 0.15 triangular 2.00 3.00 4.62 5.63 8.10 0.78 20.37 3.62 16.00 0.3 10 4.3 20.6470+00 from 472+00 R 1.2 0.05 0.037 0.19 triangular 2.00 3.00 5.73 3.60 6.48 0.68 13.95 3.87 6.70 0.4 5 5.5 14.7474+00 to 479+00 R 1.2 0.05 0.028 0.17 triangular 2.00 3.00 4.99 3.60 6.48 0.68 12.13 3.37 15.00 0.2 10 4.3 12.9480+00 from 482+00 L 0.6 0.05 0.003 0.05 triangular 2.00 3.00 1.63 0.90 3.24 0.43 0.63 0.69 0.23 0.4 5 5.5 0.5487+00 from 493+00 R 1.5 0.05 0.014 0.12 triangular 2.00 3.00 3.53 5.63 8.10 0.78 15.55 2.77 23.00 0.2 10 3.5 16.1483+00 from 487+00 R 1.5 0.05 0.039 0.20 triangular 2.00 3.00 5.89 5.63 8.10 0.78 25.96 4.62 38.00 0.2 15 3.5 26.6480+00 from 483+00 R 2.1 0.05 0.011 0.10 triangular 2.00 3.00 3.13 11.03 11.34 0.98 33.82 3.07 45.00 0.2 15 3.5 31.5493+00 to 502+50 R 1.8 0.05 0.013 0.11 triangular 2.00 3.00 3.40 8.10 9.72 0.89 24.38 3.01 19.00 0.3 10 4.3 24.5502+00 from 505+50 R 1.7 0.05 0.015 0.12 triangular 2.00 3.00 3.65 7.23 9.18 0.85 22.48 3.11 24.00 0.2 10 4.3 20.6508+00 to 515+00 R 1.15 0.05 0.036 0.19 triangular 2.00 3.00 5.65 3.31 6.21 0.66 12.28 3.71 13.00 0.2 10 4.3 11.2525+00 to 539+00 L 1.4 0.05 0.026 0.16 triangular 2.00 3.00 4.81 4.90 7.56 0.75 17.63 3.60 8.10 0.4 5 5.5 17.8541+00 from 555+00 L 1.7 0.05 0.016 0.13 triangular 2.00 3.00 3.77 7.23 9.18 0.85 23.22 3.21 25.00 0.2 10 4.3 21.5547+00from 551+50 R 1.6 0.05 0.011 0.10 triangular 2.00 3.00 3.13 6.40 8.64 0.82 16.38 2.56 7.60 0.4 5 5.5 16.7568+50 to 574+00 L 0.6 0.05 0.033 0.18 triangular 2.00 3.00 5.41 0.90 3.24 0.43 2.07 2.30 0.63 0.4 5 5.5 1.4579+00-583+00L 0.5 0.05 0.07 0.26 triangular 2.00 3.00 7.88 0.63 2.70 0.38 1.86 2.97 0.46 0.5 5 5.5 1.3586+00 from 569+00 R 1.2 0.05 0.07 0.26 triangular 2.00 3.00 7.88 3.60 6.48 0.68 19.18 5.33 14.00 0.3 10 4.3 18.1
* Note: permissable velocity in grassed channels is < 3.9-5.9 fps depending on grass type, assume 3.9 fps cutoff for riprap** MDOT recommends riprap for slopes > 6%. However, see note on velocity*** Assumes triangular ditches, 2:1 and 3:1 sideslopes.
Appendix 66