final dissertation electrostatic generation and control on
TRANSCRIPT

ABSTRACT
LIU, LU. Electrostatic Generation and Control on Textiles. (Under the direction of Dr. Abdel-Fattah M. Seyam and Dr. William Oxenham). Static electricity has been a major problem for textile manufacturing as well as
consumers, especially after the introduction of manmade fibers. Extensive research has
been done in this field; however, there are still questions not answered, and drawbacks.
For example, the accuracy of the measurement is questionable due to the manual transfer
of samples to the measuring unit, the devices and procedures are complicated and the
results are not reproducible.
The goal of this research was to gain a better understanding on the mechanism of
static generation and dissipation and to find the effects of different parameters on
electrostatic behavior of polymeric surfaces. To realize this goal, precise material
handling/cleaning and testing procedures were developed and three automated devices for
electrostatic measurement were used. The devices were a linear tester, a rubbing tester,
and a contact tester. The description of the devices and the analysis of signal obtained are
given in Chapter 4, 5, and 6. The charge generation and dissipation behaviors of different
polymers were investigated and compared. The effects of different parameters, such as
the rubbing speed, contact force, environmental conditions, and antistatic finishes, are
analyzed, and suggestions are given to textile industries based on the studies.
In this dissertation, literatures are reviewed in Chapter 2. The objectives are given
in Chapter 3. Chapters 4, 5, 6, and 7 were modified from four manuscripts, which had
been submitted to journals. The overall conclusions and suggestions for future work are
given in Chapter 8.
Chapter 4 discusses the electrification produced by running a yarn against a guide
and it was found that charge could be effectively controlled by reducing the relative
rubbing speed between two surfaces. For several applications in textile industry, it is
suggested that rotating rollers would be better than fixed guides for electrostatic control.
Chapter 5 addresses research on rubbing electrification between finish free
polymeric plates and stainless steel plate. It is shown that charge accumulates in repeating

rubbing and reaches the saturation after 2-3 cycles of rubbing PP and PTFE, while the
charge reaches saturation after 40-50 cycles of rubbing nylon. This could be related to the
difference of charge dissipation behavior of different polymers. The charge saturation is
reached when the charge generation and dissipation are in balance. It is found that charge
decays exponentially on nylon and the charge retained is about 60% or lower after 30
seconds, while, there is no decay on PP or PTFE during 30 seconds of observation.
Chapter 6 shows research on contact charging between polymeric plates. It is also
shown that charge increases as the contact force increases. In addition, the tribo-electric
series were found for nylon, stainless steel, PP, and PTFE by contact against each other.
Chapter 7 reports investigation in regards to contact charging and frictional
charging on polymeric plates and yarns treated by antistatic finishes. It is found that ionic
finish performs better than nonionic finish on both nylon and PP, and cationic finish
works better than anionic finish due to difference in antistatic mechanism. From the
observation of charge decay, it is found that there are two types of charge on nylon
surface, which have different decay properties resulting from decay through air and
spread on the surface.
In summary, systematic studies were conducted using newly developed automated
devices, on finish free polymers and polymers with different antistatic finishes. From the
experiments and analysis, the charge generation and dissipation on commonly used
polymeric surfaces were better understood. Furthermore, suggestions were given to
textile industry for reducing/eliminating static.
Electrostatic Generation And Control on Textiles
by Lu Liu
A dissertation submitted to the Graduate Faculty of North Carolina State University
in partial fulfillment of the requirements of the Degree of
Doctor of Philosophy
Fiber and Polymer Science
Raleigh, North Carolina
2010
APPROVED BY:
_____________________________ _____________________________ Dr. Abdel-fattah Mohamed Seyam Co-chair of Advisory Committee
Dr. William Oxenham Co-chair of Advisory Committee
_________________ _________________ __________________ Dr. Thomas Theyson Committee Member
Dr. Jacqueline Krim Minor Representative
Dr. Kristin Thoney Committee Member

ii
DEDICATION
Dedicated to my husband Li Yang
for his support and help in the whole process of my Ph.D. studying
iii
BIOGRAPHY
Lu Liu was born on July 13, 1983 in Hefei, China. She grew up in a family with a
background of engineering and science. She received a Bachelor of Textile Engineering
in 2005 from Dong Hua University in Shanghai, China. She joined the College of
Textiles in North Carolina State University, in July 2005. She was awarded a Master of
Textiles in 2008 and she is presently in the Ph.D. program of Fiber and Polymer Science.

iv
ACKNOWLEGEMENTS
The author wishes to express her appreciation to her advisors, Dr. Abdel-fattah
Mohamed Seyam and Dr. William Oxenham, for the opportunity to work on this project
and their guidance throughout the whole research. The author also wants to thank Dr.
Thomas Theyson, who provided the materials for this research and gave extensive
suggestions. The appreciation is extended to the other committee members, Dr.
Jacqueline Krim and Dr. Kristin Thoney for their advice and help.
The author would like to thank Dr. Peter Castle of Western Ontario University,
Canada, for his discussion and suggestions at the beginning period of this project. The
author wants to thank Dr. Yiyun Cai of USDA for training on the use of equipments. The
author also would like to thank Nguyen Dzung for help in modify and updating some
devices. Additionally, the author extends her thanks to her partners and officemates,
Vamsi Krishna Jasti, Tamer Hamouda, and Ahamed Hassanin for their support and help.
The author is also indebted to the National Textile Center for the financial support
that enables the present research to be conducted.
v
TABLE OF CONTENTS
LIST OF TABLES ........................................................................................................... viii
LIST OF FIGURES ........................................................................................................... ix
1 INTRODUCTION .......................................................................................................... 1
2 LITERATURE REVIEW ............................................................................................... 4
2.1 ELECTROSTATIC REGULATIONS ......................................................................................................... 5
2.2 ELECTROSTATIC RELATED CHARACTERISTICS - RESISTIVITY AND CAPACITANCE .............................. 7
2.2.1 Surface resistance/resistivity .................................................................................................. 7
2.2.2 Questions related to the resistivity of polymers .................................................................... 10
2.2.3 Capacitance .......................................................................................................................... 14
2.3 MECHANISMS OF CHARGE GENERATION .......................................................................................... 15
2.3.1 Contact charging .................................................................................................................. 15
2.3.2 Frictional charging ............................................................................................................... 20
2.3.3 Corona charging ................................................................................................................... 23
2.3.4 Repeating contacts and separations ..................................................................................... 23
2.3.5 Ionic transfer mechanism ..................................................................................................... 26
2.3.6 Bond-breaking mechanism ................................................................................................... 27
2.4 MECHANISMS OF CHARGE DISSIPATION ........................................................................................... 29
2.4.1 Charge decay of conductor ................................................................................................... 29
2.4.2 Charge decay of a non-conducting system ........................................................................... 31
2.4.3 Charge decay through the air ............................................................................................... 33
2.5 PREVIOUS EXPERIMENTAL STUDIES ................................................................................................. 35
2.5.1 Sample preparation .............................................................................................................. 35
2.5.2 Environmental chambers ...................................................................................................... 36
2.5.3 Charge measurement on solids ............................................................................................. 37
2.5.4 Surface analysis .................................................................................................................... 39
2.5.5 Effect of contact pressure ..................................................................................................... 39
2.5.6 Effect of contact time ............................................................................................................ 42
2.5.7 Effect of moisture .................................................................................................................. 42
2.5.8 Effect of temperature ............................................................................................................ 45
2.5.9 Effect of air pressure ............................................................................................................ 47
2.5.10 Effect of rubbing speed .................................................................................................... 48
2.5.11 Effect of system shape ...................................................................................................... 51
2.5.12 Effect of yarn blending ..................................................................................................... 52
2.5.13 Effect of surface components and structure ..................................................................... 55
2.5.14 Triboelectric series .......................................................................................................... 56
2.5.15 Anti-static technology in textiles ...................................................................................... 59
REFERENCES ........................................................................................................................................ 61

vi
3 OBJECTIVES .............................................................................................................. 68
4 FRICTIONAL ELECTRIFICATION OF YARN AND PIN ....................................... 72
4.1 INTRODUCTION ............................................................................................................................... 73
4.2 EXPERIMENTAL ............................................................................................................................... 75
4.2.1 Equipment and test protocol ................................................................................................. 75
4.2.2 Materials and experimental designs ..................................................................................... 77
4.3 CALCULATED RESPONSES ............................................................................................................... 79
4.4 RESULTS AND ANALYSIS ................................................................................................................. 81
4.4.1 Experimental design-I ........................................................................................................... 81
4.4.2 Experimental design-II ......................................................................................................... 93
4.5 CONCLUSION................................................................................................................................... 98
REFERENCES ............................................................................................................................................. 98
5 FRICTIONAL ELECTRIFICATION OF POLYMERIC PLATES .......................... 101
5.1 INTRODUCTION ............................................................................................................................. 102
5.2 EXPERIMENTAL ............................................................................................................................. 104
5.2.1 Charge generation/dissipation measurement device .......................................................... 104
5.2.2 Materials and experimental designs ................................................................................... 105
5.3 SIGNAL ANALYSIS ......................................................................................................................... 109
5.3.1 Charge generation .............................................................................................................. 109
5.3.2 Charge accumulation ......................................................................................................... 110
5.4 RESULTS AND DISCUSSION ............................................................................................................ 112
5.4.1 Experimental design I ......................................................................................................... 112
5.4.2 Experimental design II ........................................................................................................ 119
5.4.3 Experimental design III ...................................................................................................... 122
5.5 CONCLUSION................................................................................................................................. 124
REFERENCES ........................................................................................................................................... 125
6 CONTACT ELECTRIFICATION OF POLYMERIC PLATES ............................... 127
6.1 INTRODUCTION ........................................................................................................................ 128
6.2 EXPERIMENTAL ....................................................................................................................... 129
6.2.1 Contact device .................................................................................................................... 129
6.2.2 Signal analysis .................................................................................................................... 131
6.2.3 Sample preparation ............................................................................................................ 134
6.2.4 Experimental design ........................................................................................................... 135
6.2.5 Statistical analysis .............................................................................................................. 136
6.3 RESULTS .................................................................................................................................... 136
6.3.1 Experimental design I ......................................................................................................... 136
6.3.2 Experimental design II ........................................................................................................ 141
6.4 CONCLUSIONS ............................................................................................................................... 143
REFERENCE ............................................................................................................................................ 144
vii
7 ELECTRIFICATION OF POLYMERIC SURFACES TREATED BY ANTISTATIC
FINISHES ....................................................................................................................... 146
7.1 INTRODUCTION ........................................................................................................................ 147
7.2 EXPERIMENTAL ....................................................................................................................... 148
7.2.1 Sample preparation ............................................................................................................ 148
7.2.2 Experimental design ........................................................................................................... 150
7.3 RESULTS AND DISCUSSION ................................................................................................... 152
7.3.1 Contact electrification ........................................................................................................ 152
7.3.2 Rubbing electrification ....................................................................................................... 154
7.3.3 Yarn rubbing electrification ............................................................................................... 158
7.4 CONCLUSIONS ............................................................................................................................... 160
REFERENCES ........................................................................................................................................... 161
8 OVERALL CONCLUSIONS .................................................................................... 163

viii
LIST OF TABLES
Table 1.1 Approximate value of charge potential generated in different situations (Welker, Nagarajan, & Newberg, 2006) .............................................................................................................................................. 3 Table 2.1 ESD control requirements summary ............................................................................................... 5 Table 2.2 Classification of materials by their resistivity (unit: ohm) ............................................................. 9 Table 2.3 Dielectric constant of materials (Dielectric Constant Reference Guide) ...................................... 15 Table 2.4 Work functions of polymers ......................................................................................................... 19 Table 2.5 Order of magnitude of charge density observed on various materials after contact with metals .. 20 Table 2.6 Penetration depths of charge from metal into polymers (Labadz & Lowell, 1986) ...................... 25 Table 2.7 Indentation characteristics of polymers (Pascoe & Tabor, 1956) ................................................. 41 Table 2.8 Effect of relative humidity on electrostatics ................................................................................. 44 Table 2.9 Optimum fiber blend for staple yarn to minimize charge ............................................................. 53 Table 2.10 Intrinsic impurities for different structures (1980) ...................................................................... 55 Table 2.11 Fiber crystallinity (Morton & Hearle, 2008) .............................................................................. 56 Table 2.12 Triboelectric series ..................................................................................................................... 57 Table 4.1 Experimental design-I ................................................................................................................. 78 Table 4.2 Experimental design-II (Dpin: 25.4 mm, Vy: 100 m/min) ............................................................ 79 Table 5.1 Experimental design I used to study the effect of contact force on static generation/dissipation of polymers after rubbing against stainless steel .............................................................................................108 Table 5.2 Experimental design II for studying the effect of rubbing speed on static behavior of polymers after rubbing against stainless steel .............................................................................................................108 Table 5.3 Experimental design III for investigating static properties of polymers after rubbing against each other .............................................................................................................................................................108 Table 6.1 Experimental design I ..................................................................................................................135 Table 6.2 Experimental design II used to investigate the static generation of nylon, PP, stainless steel, and PTFE by contact against each other ............................................................................................................136 Table 7.1 Components of model surface finishes ........................................................................................149 Table 7.2 Experimental design I ..................................................................................................................151 Table 7.3 Experimental design I ..................................................................................................................152

ix
LIST OF FIGURES
Figure 2.1 Basic setup for surface resistivity measurement ........................................................................... 8 Figure 2.2 Surface resistivity measurement configuration by concentric ring electrodes .............................. 9 Figure 2.3 Effect of relative humidity on resistance of yarn bundles made of different materials (temperature: 20°C) (Hearle, 1953) .............................................................................................................. 11 Figure 2.4 Effect of temperature on resistance of cotton yarn bundles (moisture contents were calculated by weighting dry samples and samples after conditioning under the testing relative humidity) (Hearle, 1953) 12 Figure 2.5 Effect of voltage on the resistance of cotton yarn bundles (moisture content: 6.8%, R100: the resistance measured under 100 voltage) (Hearle, 1953) ............................................................................... 13 Figure 2.6 Charge transfer by making and breaking contacts (Taylor & Secker, 1994) .............................. 16 Figure 2.7 Charges recombine (left) and remain (right) (Taylor & Secker, 1994) ....................................... 16 Figure 2.8 Metal A and B of different work functions (b) Fermi level* of the two metals become equal after contact (Taylor & Secker, 1994) .................................................................................................................. 17 Figure 2.9 Energy band for (a) intrinsic (b) n-type and (c) p-type semiconductor (Taylor & Secker, 1994) (Ec is energy level of conduction band, EG is energy gap between the conduction band and the valence band, Ed is energy level of donors, EF is the Fermi energy level, Ea is the every level of acceptors) .................... 18 Figure 2.10 Asymmetric rubbing (Morton & Hearle, 2008) ........................................................................ 22 Figure 2.11 Corona charging, Va is applied potential and Vs is the surface potential (Taylor & Secker, 1994) ...................................................................................................................................................................... 23 Figure 2.12 Charge backflow from insulator I to metal M (Lowell & Rose-Innes, 1980) ............................ 28 Figure 2.13 Charge decay of a conductor characterized by its capacitance C and resistance R with respect to ground ........................................................................................................................................................... 30 Figure 2.14 Charge dissipation (Taylor & Secker, 1994) ............................................................................. 31 Figure 2.15 Charge decay of charged insulator resting on grounded plane .................................................. 33 Figure 2.16 Charge decay of charge insulator resting on a grounded plane with a grounded plate placed parallel with the charged surface .................................................................................................................. 33 Figure 2.17 Charged body in air with ions ................................................................................................... 34 Figure 2.18 Decay curves of charge on PET film (Ieda & Shinohara, 1967) ............................................... 35 Figure 2.19 Diagram of apparatus for measurement of electrostatic charge ................................................ 38 Figure 2.20 Deformation of OB hard elastic (diamond), OE soft elastic, and OI polymers (The full line represents the load-deformation curves (similar to stain-stress curve), and the dotted curves are pressure-area curves under constant loads. The intersection points indicate the equilibrium situation.) .................... 42 Figure 2.21 Effect of temperature on the amount of water in air (Wikipedia_Humidity) ......................................... 47 Figure 2.22 Paschen curves obtained for Helium, Neon, Argon, Hydrogen and Nitrogen, using the expression for the beakdown voltage, VB as a function of the parameters pd, where, p is the pressure (torr), d is the gap distance (cm) between two parallel paltes. ................................................................................ 48 Figure 2.23 Blends of nylon-Dacron polyester staple-charge developed against chrome-plated surface. .... 54 Figure 2.24 Blends of nylon-Dacron polyester staple-charge developed against cotton .............................. 54 Figure 4.1 Linear Tester ............................................................................................................................... 77 Figure 4.2 Yarn/pin contact angle (same contact angle for pins of two sizes), θ=60° .................................. 77 Figure 4.3 Force diagram analysis on the yarn section contacted with pin when Vy was smaller than Vp (left) and when Vy was larger than Vp (right).............................................................................................. 80 Figure 4.4 Effect of yarn/pin relative rubbing speed on yarn surface potential measured by the probe-I (pin: stainless steel cylinder of 25.4 mm diameter, yarn: 420/72 nylon multifilament with anionic lubricant) .... 82

x
Figure 4.5 Data of figure 4.4 corresponding to the speed of charge pin ...................................................... 82 Figure 4.6 Data of figure 4.4 corresponding to the speed of yarn ............................................................... 83 Figure 4.7 Effect of yarn/pin relative rubbing speed on yarn surface potential measured by the probe-II (pin: stainless steel cylinder of 25.4 mm diameter, yarn: 420/72 nylon multifilament with anionic lubricant) ...................................................................................................................................................................... 83 Figure 4.8 Effect of yarn/pin relative rubbing speed on yarn output tension (pin: stainless steel cylinder of 25.4 mm diameter, yarn: 420/72 nylon multifilament with anionic lubricant) ............................................. 84 Figure 4.9 Effect of yarn/pin relative rubbing speed on contact force on yarn (pin: stainless steel cylinder of 25.4 mm diameter, yarn: 420/72 nylon multifilament with anionic lubricant) ......................................... 85 Figure 4.10 Effect of yarn/pin relative rubbing speed on friction force on yarn (pin: stainless steel cylinder of 25.4 mm diameter, yarn: 420/72 nylon multifilament with anionic lubricant) ......................................... 85 Figure 4.11 Effect of yarn/pin relative rubbing speed on yarn/pin coefficient of friction (pin: stainless steel cylinder of 25.4 mm diameter, yarn: 420/72 nylon multifilament with anionic lubricant) ........................... 86 Figure 4.12 Correlation between yarn potential-I and yarn/pin friction force (pin: stainless steel cylinder of 25.4 mm diameter, yarn: 420/72 nylon multifilament with anionic lubricant) ............................................. 86 Figure 4.13 Pin vibration amplitude measured at different rotating frequency (pin: stainless steel cylinder of 25.4 mm diameter, yarn: 420/72 nylon multifilament with anionic lubricant) ......................................... 87 Figure 4.14 Vibration force calculated at different yarn/pin speeds (pin: stainless steel cylinder of 25.4 mm diameter, yarn: 420/72 nylon multifilament with anionic lubricant) ............................................................ 88 Figure 4.15 Effect of yarn/pin relative rubbing speed on yarn surface potential measured by the probe-I (pin: stainless steel cylinder of 6.35 mm diameter, yarn: 420/72 nylon multifilament with anionic lubricant) ...................................................................................................................................................................... 89 Figure 4.16 Effect of yarn/pin relative rubbing speed on yarn surface potential measured by the probe-II (pin: stainless steel cylinder of 6.35 mm diameter, yarn: 420/72 nylon multifilament with anionic lubricant) ...................................................................................................................................................................... 89 Figure 4.17 Effect of probe-I to pin spacing (the spacing from the aperture of probe-I to the yarn/pin separation point) on measured yarn potential (the position of probe-II was fixed) (yarn: nylon with lubricant, pin: stainless steel cylinder of 25.4 mm diameter; Vy = 100 m/min, Vp = 0, input tension=50 cN) ........... 90 Figure 4.18 Effect of yarn/pin relative rubbing speed on yarn output tension (pin: stainless steel cylinder of 6.35 mm diameter, yarn: 420/72 nylon multifilament with anionic lubricant) ............................................. 91 Figure 4.19. Effect of yarn/pin relative rubbing speed on yarn/pin contact force (pin: stainless steel cylinder of 6.35 mm diameter, yarn: 420/72 nylon multifilament with anionic lubricant) ......................................... 92 Figure 4.20 Effect of yarn/pin relative rubbing speed on yarn/pin friction force (pin: stainless steel cylinder of 6.35 mm diameter, yarn: 420/72 nylon multifilament with anionic lubricant) ......................................... 92 Figure 4.21 Effect of yarn/pin relative rubbing speed on yarn/pin coefficient of friction (pin: stainless steel cylinder of 6.35 mm diameter, yarn: 420/72 nylon multifilament with anionic lubricant) ........................... 93 Figure 4.22 Effect of yarn/pin relative rubbing speed on finish free yarns’ surface charge potential measured by the first probe (pin: stainless steel cylinder of 25.4mm diameter) ........................................... 94 Figure 4.23 Effect of yarn/pin relative rubbing speed on finish free yarns’ surface charge potential measured by the second probe (pin: stainless steel cylinder of 25.4mm diameter) ...................................... 95 Figure 4.24 Effect of yarn/pin relative rubbing speed on yarn output tension (pin: stainless steel cylinder of 25.4mm diameter) ........................................................................................................................................ 95 Figure 4.25 Effect of yarn/pin relative rubbing speed on yarn/pin contact force (pin: stainless steel cylinder of 25.4mm diameter) .................................................................................................................................... 96 Figure 4.26 Effect of yarn/pin relative rubbing speed on yarn/pin friction force (pin: stainless steel cylinder of 25.4mm diameter) .................................................................................................................................... 96

xi
Figure 4.27 Effect of yarn/pin relative rubbing speed on yarn/pin coefficient of friction (pin: stainless steel cylinder of 25.4mm diameter) ...................................................................................................................... 97 Figure 4.28 . Charge potential-I on finish free yarns corresponding to the yarn/pin friction force .............. 97 Figure 5.1 Rubbing tester ............................................................................................................................105 Figure 5.2 Charge potential on nylon in terms of time and locations of potential probe, rubbing head, and rubbing area at starting point (t = 0) and at reversing point (t = 1.2 second) in the first cycle ....................110 Figure 5.3 Charge accumulations in 50 cycles and charge decay on nylon surface ....................................111 Figure 5.4 Charge accumulations in 50 cycles and charge decay on PTFE surface ....................................112 Figure 5.5 Charge accumulations in 50 cycles and charge decay on PP surface .........................................112 Figure 5.6 Effect of contact force on charge generated on polymer surfaces after the first cycle of rubbing against stainless steel (rubbing speed: 27 mm/sec) .....................................................................................114 Figure 5.7 Effect of contact force on charge accumulated on polymer surfaces after 50 cycles of rubbing/contact against stainless steel (rubbing speed: 27 mm/sec) ............................................................114 Figure 5.8 Effect of contact force on charge retained on polymer surfaces after 30 seconds of decay time .....................................................................................................................................................................115 Figure 5.9 Effect of contact force on normalized charge retained on polymer surfaces after 30 seconds of decay time....................................................................................................................................................115 Figure 5.10 Charge potential of the first and second cycles of rubbing (contact force: 1N, rubbing speed: 47 mm/sec) .......................................................................................................................................................116 Figure 5.11 Exponential behavior of charge decay of nylon .......................................................................117 Figure 5.12 Charge decay model of a charged polymeric rubbing plate .....................................................118 Figure 5.13 Effect of rubbing speed on charge generated on polymeric surface after the first cycle of rubbing or the first contact/separation against stainless steel ......................................................................120 Figure 5.14 Effect of rubbing speed on charge generated on polymeric surface after 50 cycles of rubbing (99 strokes) or 99 contacts/separations against stainless steel .....................................................................120 Figure 5.15 Effect of rubbing speed on charge retained on polymeric surfaces after 30 seconds of decay 121 Figure 5.16 Effect of rubbing speed on normalized charge retained on polymeric surfaces after 30 seconds of decay .......................................................................................................................................................121 Figure 5.17 Triboelectric series of nylon, stainless steel, PP, and PTFE .....................................................122 Figure 5.18 Charge potential on rubbing plate after the first cycle of rubbing against the rubbing head (rubbing speed: 47 mm/sec, contact force: 1N) ...........................................................................................123 Figure 5.19 Charge potential on rubbing plate after 50 cycles of rubbing against the rubbing head (rubbing speed: 47 mm/sec, contact force: 1N) ..........................................................................................................124 Figure 6.1 A Diagram of the contact charge generation/dissipation measurement device ..........................130 Figure 6.2 Image of the contact device ........................................................................................................130 Figure 6.3 Typical static charge data of repeated contact test ....................................................................131 Figure 6.4 Electrostatic charges of 50 cycles of contact ..............................................................................133 Figure 6.5 Experimental data of Figure 6.4 and derived exponential regression relationship of charge generated in terms of cycle number .............................................................................................................133 Figure 6.6 Images and dimensions of contact heads ..................................................................................135 Figure 6.7 Charge generated on PTFE after the first contact against nylon ...............................................137 Figure 6.8 Charge generated on PTFE after 50 cycles of contacts against nylon .......................................138 Figure 6.9 Charge generated on PTFE after 100 cycles of contacts against nylon .....................................138 Figure 6.10 Charge generated on PTFE after 120 cycles of contacts against nylon ...................................139 Figure 6.11 Charge generated on PTFE by repeated contacts/separations against nylon, at different contact force (temperature of 30°C and R. H. of 30%) ............................................................................................139 Figure 6.12 Data of Figure 6.9 sorted by the relative humidity ..................................................................140
xii
Figure 6.13 Data of Figure 6.9 sorted by the temperature ..........................................................................140 Figure 6.14 Charge generated on PP after 50 cycles of contacts against nylon, stainless steel, and PTFE .....................................................................................................................................................................142 Figure 6.15 Charge generated on PTFE after 50 cycles of contacts against nylon, stainless steel, and PP 143 Figure 7.1 Schematic of surface treatment by an air brush ..........................................................................150 Figure 7.2 Charge generated on PP after the first contact against stainless steel .......................................153 Figure 7.3 Charge generated on PP after 50 contacts/separations against stainless steel ...........................153 Figure 7.4 Surface charge potential of nylon after the first cycle and 50 cycles of rubbing against stainless steel ..............................................................................................................................................................154 Figure 7.5 Experimental data of charge decay of blank nylon and nylon treated by nonionic finish after 50 cycles of rubbing against stainless steel and regression curves ...................................................................156 Figure 7.6 Experimental data of charge decay on blank nylon and the regression curves ..........................156 Figure 7.7 Experimental data of charge decay on nylon treated by 0.025% nonionic solution and the regression curves .........................................................................................................................................157 Figure 7.8 Experimental data of charge decay on nylon treated by 0.05% nonionic solution and the regression curves .........................................................................................................................................157 Figure 7.9 Surface charge potential of nylon yarns by moving over a chrome pin (surface concentration of active finish: 7 mg/m2, nylon yarns: 200 denier/60 filaments, yarn speed: 300 m/min, yarn input tension: 20 gf, charging pin size: 2 cm in diameter, contact angle: 90°) (Goulston Technologies, Inc.) .......................159

1
1 INTRODUCTION
2
Static charge has positive and negative attributes. On one hand, it is useful in electrets
filters and the formation of textiles structures such as electro-spinning and flocking. On
the other hand, it has negative impacts on processes and products. For example, charge
accumulation during the processing of yarns, fabrics, or films may cause irregularity of
textiles and low efficiency of manufacturing. Major issues to end users are related to
static generation and discharge such as clinging of clothes and discomfort from static
shock when walking on a carpet and touching a doorknob. More seriously, potential life
threatening accidents may take place because of static generation and discharge such as
initiation of major fires at gas stations and failure of a parachute to open. Table 1.1 shows
the approximate levels of charge potential generated in different situations.
To minimize the impact of static electrification, it is necessary to obtain a better
understanding of the mechanisms involved in static generation and dissipation.
Electrostatic charge is generated by contact and separating two different surfaces (contact
charging). When two different surfaces were contacted, charge would transfer from
surface of high Fermi level to surface of low Femi level. When the two surfaces are
separated, the transferred charge would be recombined (metals contact/separation) or be
trapped on the surface (insulators contact/separation), which is determined by the static
properties of contacted surfaces. Charge generated by rubbing two surfaces (frictional
charging) is more severe than the contact charging, which is more complex. It could be
affected by the rubbing speed and local temperature of the surface. The mechanisms of
electrostatics will be reviewed in section 2.3 and 2.4.
To eliminate the static generation, there have been different approaches, such as,
applying antistatic surface finish, incorporating conductive fibers, increasing the relative
humidity, using ionizing gas gun, and it is always suggested to ground the working table
and machines. However, the difficulties are that, polymeric surfaces are hard to control,
which are irregular, not 100% crystal, and usually have contaminations. The electrostatic
properties of polymers can be very different when the surface is contaminated or just
been touched. Therefore, a very careful and consistent handling process is required for
electrostatic studies. In addition, very precise static detecting methods are required.
Electrostatic charge has to be monitored in time and without touching, otherwise, the

3
reading would be very different. Extensive research has been done in this field, which is
reviewed in section 2.5. However, there are still questions, and drawbacks. For example,
the accuracy of the measurement is questionable due to manual transfer of sample to the
measuring unit, the devices and procedures are complicated and the results are not
producible. Therefore, a more critical study is required on the electrostatics in textiles.
Table 1.1 Approximate value of charge potential generated in different situations (Welker, Nagarajan, & Newberg, 2006)
Activity Charge Generation (kV) at
20% R.H. 80% R.H.
Walking across vinyl floor 12 0.25
Walking across synthetic carpet 35 1.5
Arising from foam cushion 18 1.5
Picking up polyethylene bag 20 0.6
Sliding styrene box on carpet 18 1.5
Moving the Mylar®
tape (PET) from PC board 12 1.5
Shrinkable film on PC board 16 3
Triggering vacuum solder remover 8 1
Aerosol circuit freeze spray 15 5

4
2 LITERATURE REVIEW

5
2.1 Electrostatic regulations Worldwide, there are almost one hundred standards and testing methods associated with
static generation and dissipation (1999). They are published by institutes such as:
U.S. Military Department of Defense (DOD)
American Society for Testing and Materials (ASTM)
National Fire Protection Association (NFPA)
Joint Electron Device Engineering Council (JEDEC)
International Electro technical Commission (IEC)
American National Standards Institute (ANSI)
Institute of Electrical and Electronics Engineers (IEEE)
Electronic Industries Alliance (EIA)
ESD Association (ESDA)
Generally, the electrical resistance of an item is used alone or combined with the charge
potential generated on the item to evaluate its electrostatic properties, though it is still
questionable whether the resistance is necessarily correlated with the static generation or
dissipation (Owen, 1990). Table 2.1 shows static control levels (as inferred from
resistance) recommended by several standards. The testing methods are described in
detail inside the standard.
Table 2.1 ESD control requirements summary
ESD Control Item Recommended Range Standard
Work surface <1x10⁹ ohm and/or <200 Volts ESD S 4.1
Wrist Strap Cord 0.8x10⁶ to 1.2x10
6 ohm ESD S 1.1
Footwear <1x10⁹ ohm ESD S 9.1
Flooring <1x10⁹ ohm ANSI ESD S 7.1
Seating <1x10⁹ ohm ESD STM 12.1
6
The charge potential generated on an item is also used for qualifying its
electrostatic properties. For example, the Military Standard 883 classifies items as
follows using the standard 100 pF, 1.5 KΩ human body model:
Class 1: > 0 to ≤ 1999 V
Class 2: > 2000 to ≤ 3999 V
Class 3: > 4000 V and above
In industry, to evaluate whether a work area is safe from potential static hazards,
the working areas are classified into three different levels characterized by the discharge
time and the charge potential (Welker, Nagarajan, & Newberg, 2006):
For critical ESD (electrostatic discharge) safe work areas, the float potential
should be less than ± 20 V and the discharge time should be less than 20 seconds
from ± 1000 V to less than ± 20 V.
For highly sensitive but not critical ESD-safe work areas, the float potential
should be less than ± 50 V and the discharge time should be less than 20 seconds
from ± 1000 V to less than ± 50 V.
For conventional ESD-safe work areas, the float potential should be less than ±
100 V, and the discharge time can be less than 45 seconds from ± 1000 V to less
than ± 100 V.
In all the standards and testing methods, the sample conditioning and cleaning are
emphasized, since static properties are dramatically sensitive to the surface conditions.
The sample has to be stored in uncontaminated environment under constant ambient
conditions (temperature and relative humidity). Even contact to another surface during a
test can alter a surface and give non-reproducible results in subsequent tests. Additionally,
it is stated in the ASTM D 4470-97, Standard Test Method for Static Electrification, that
"Cleaning" of a surface with solvents rarely cleans the surface. It probably produces a
uniform, reproducible, state of contamination, however. Thus, cleaning with solvents
should be considered as a means of obtaining reproducibility in a test.

7
Charge generation varies widely with the moisture content of a material. The
conditioning time required depends on the rate of adsorption of moisture and the
thickness (or mass) of the specimen. Thick sheets, for example, it takes a much longer
time to condition then thin films. For another example, materials with high affinity (or
absorptive capacity) for water take longer to condition than those with low affinity. Since
there is a hysteresis effect on conditioning of many materials, the moisture content of a
specimen also depends on whether the material was wetter or dryer than the conditions of
the test. It is required by ATMS 4470-97 that the specimens should be dryer than the
specified test condition before conditioning and the specimens should be equally
conditioned for at least 24 hours at the specified relative humidity before testing.
Additionally, not only it is important to condition specimens properly at the required
relative humilities prior to the test, but the test should also be conducted in the same
conditioning environment.
Practical considerations favor conditioning in the following two environments: (1)
preferably 20±2% relative humidity, 23±2°C, (2) preferably 50±2% relative humidity,
23±2°C. Other relative humidity may be adopted depending on specific end-use
requirements. However, the relative humidity, temperatures, and the conditioning time
are required to clearly state in the test results.
2.2 Electrostatic related characteristics - resistivity and capacitance The resistivity and capacitance are important electrical characterizations of materials.
Their definitions, testing methods, and how they are affected by other factors, like the
relative humidity and temperature, are reviewed in this part.
2.2.1 Surface resistance/resistivity The surface resistance is the resistance to the flow of electrical current across a surface,
while the volume (bulk) resistance is the resistance to flow through the three-dimensional
volume of a sample. Since static is considered to primarily be a surface phenomenon,

8
which is mostly determined by surface properties of materials, thus the surface resistance,
instead of the volume resistance, is usually more important in studies of electrostatic.
Concepts of surface resistance and surface resistivity can be sometimes confusing.
Definitions of both terms can be found in many book and standards. Surface resistance,
RS, is defined as the ratio of a DC voltage U to the current, Is flowing between two
electrodes of specified configuration (Figure 2.1) that are in contact with the same side of
a material. The surface resistivity, ρs is determined by the ratio of DC voltage U drop per
unit length L to the surface current Is per unit width D (equation [1-1]). The surface
resistivity is the intrinsic property of a surface, which is not affected by the measured
surface area. The physical unit of surface resistivity is also ohm (Ω). In order to
differentiate from the volume resistivity, the surface resistivity is expressed also in
ohm/square (Ω/square).
Figure 2.1 Basic setup for surface resistivity measurement
ρ /
/ [1‐1]
The testing method for measuring the surface resistivity using concentric ring
electrodes is recommended in standards (AATCC 76, ASTM D257, IEC 93-IEC 60093
and JIS K6911). The sketch of equipment used by this method is shown in Figure 2.2.
The inner top electrode is circular while the outer top electrode is annular. The sample
area between the inner and outer electrodes is measured when voltage applied between

9
the electrodes. The electrical current flows from the inter electrode to the outer electrode
through the sample surface.
Figure 2.2 Surface resistivity measurement configuration by concentric ring electrodes
The resistance was used by standards to evaluate static properties of items as
shown in Table 2.1. Furthermore, the surface resistivity and the linear resistivity (volume
resistance per unit length, ohm/m) are often used to classify materials of isolative,
antistatic, static dissipative, conductive, etc, as shown in Table 2.2. The term “static
dissipative” is not synonymous with the term “antistatic”. The "static dissipative
material" defines material on which charge can decay quickly, while the material's charge
generation ability is not concerned. On the other hand, the "antistatic material" represents
material that resists charging and produces minimal static charge generation.
Table 2.2 Classification of materials by their resistivity (unit: ohm)
Classification ESDA Standards Typical Vendor Kanarek & Tan (1998)Isolative ND1 ND ND Antistatic ND 10
10-10
14 Ω/sq ND
Static dissipative 10
2-10
9 Ω/m
105-10
12 Ω/sq
102-10
8 Ω/sq
105-10
12 Ω/m
105-10
12 Ω/sq
Resistive ND ND ND Conductive <10
2 Ω/m ND <10
2 Ω/m

10
<105 Ω/sq <10
5 Ω/sq
Electrostatic shielding ND ND <10 Ω/m EMI shielding ND 10
-2-1.0Ω/sq ND
1 ND: not defined
Besides the resistivity of materials, the conductivity is sometimes used to describe
material electrical properties, which is the reciprocal of surface resistivity.
2.2.2 Questions related to the resistivity of polymers There are mainly three questions raised from the literature review of surface resistivity of
polymers.
1) Does the volume resistivity affect the surface resistivity?
Using the standard surface resistivity testing method, the electrical current will flow
mostly along the surface, thus the surface conducting mechanism was dominant.
However, the measurement of surface resistivity is affected by the volume resistivity
(Taylor & Secker, 1994). For example, the charge conduction of fibers depends on the
contacts between fibers surface as well as the fibers bulk, which is hard to separate.
2) Are the effects of different factors on the resistivity of polymers the same as that
on the resistivity of conductors?
The resistivity of conductors has been well understood, for example, the resistivity of
metals decreased as the temperature increased. However, the effects of different factors
on the resistivity of polymers are not always the same as that for conductors. It is pointed
out in the ASTM D257 that the resistance of insulators decreases both with increasing
temperature and with increasing humidity. In addition, for polymers, the volume
resistance is particularly sensitive to temperature changes, while surface resistance
changes greatly and very rapidly with humidity changes.
Hearle (1953) tested the resistance of yarn bundles under different conditions,
where the yarns were wounded on a polythene film, and the two electrodes were set at
two ends of the film. The study included the effect of different parameters on resistivity.

11
a) The effect of relative humidity
Testing environments of different levels of relative humidity were realized using
saturated solutions of different salts inside testing jars. The results are shown in
Figure 2.3, which indicates that the resistance of yarn bundles decreases as the
relative humidity increases. This effect was explained as that the movement of ions
and the dissociation are varying with the moisture content (Hearle, 1953).
Figure 2.3 Effect of relative humidity on resistance of yarn bundles made of different
materials (temperature: 20°C) (Hearle, 1953)
b) The effect of temperature
Experiments showed that, at each level of relative humidity, the resistance of
cotton, silk, acetate rayon and wool yarn bundles all decreased as the temperature
increased. Figure 2.4 shows the effect of temperature on resistances of cotton yarn
bundles.

12
Figure 2.4 Effect of temperature on resistance of cotton yarn bundles (moisture contents
were calculated by weighting dry samples and samples after conditioning under the
testing relative humidity) (Hearle, 1953)
c) The effect of voltage
Experiments showed that, at low voltages, the resistance falls rapidly as the voltage
increases, but the decrease in resistance became leveled at higher voltages, though
there is still a slight trend of decrease from 50 to 400 Volts. Figure 2.5 shows the
effect of voltage on cotton yarn bundles.

13
Figure 2.5 Effect of voltage on the resistance of cotton yarn bundles (moisture content:
6.8%, R100: the resistance measured under 100 voltage) (Hearle, 1953)
d) The effect of the tension on the specimen
The effect of tension on the yarn resistance was investigated by hanging weights on
two ends of the yarn bundles. For cotton, there was a tendency for the resistance to
increase as the tension is increased, but for viscose rayon filament, the resistance
decreases as the tension is increased. In both case, the change was very small.
3) Is surface resistivity a parameter of importance?

14
It is questionable that the surface resistivity may not necessarily correlate with the static
phenomenon of the surface (Owen, 1990) and this need to be verified by further
investigations.
On one hand, the mechanism of charge generation indicates that the amount of
charge generated is determined by the difference of Fermi energy level of two contacted
surfaces. There is no indication that surface resistivity is directly correlated to the charge
generation. On the other hand, it is commonly considered that the charge decay would be
affected by the surface resistivity, since the definition of surface resistivity is the
resistance to the flow of electrical current across a surface. However, when the surface is
not put between two electrodes, which is the setup of surface resistivity measurement,
then the charge dissipation may be determined by the dielectric constant and the
resistivity of the surrounding items, such as the atmosphere air and solids close to the
surface (Niels, 1998).
2.2.3 Capacitance The capacitance quantifies the ability of a system to store charge (Cardona, 2001). Its unit
is Faraday, which is one coulomb per volt. If a charge is transferred from one surface to
another, it produces a potential difference between them, then the capacitance of the
system C can be given by equation [1-2]. For a parallel-plates capacitor, if the potential
of the lower plate is zero, the system’s capacitance can be given by equation [1-3].
/ [1-2]
/ [1-3]
where q is the charge (Coulomb), C is the system capacitance (Faraday), V is the
potential (Volt), ε0 is the vacuum permittivity, ε is the media permittivity (relative
dielectric constant), A is the surface area of the plates (m2), d is the plates’ separation (m)
between plates.
The relative dielectric constant (relative permittivity) is defined as the ratio of the
actual permittivity versus the permittivity of the vacuum media. The values of the relative

15
dielectric constants of materials used in this work are shown in Table 2.3. The charge
dissipation may be affected by the relative dielectric constant of materials (Niels, 1998),
which will be discussed in detail in section 2.4.
Table 2.3 Dielectric constant of materials (Dielectric Constant Reference Guide)
Medium: Vacuum Atmosphere Cotton Teflon PP PET Nylon
ε: 1 1.00054 1.3-1.4 2.1 2.25 2.8-4.5 4-5
2.3 Mechanisms of charge generation Charge generation can be classified into contact charging, frictional charging, and corona
charging according to the mode of charge generation. The contact charging or frictional
charging is composed of bond-forming and bond-breaking processes and charge is
generated by contacting (bond forming) and breaking (bond breaking) two different
surfaces. The bond-forming process is usually explained based on an electrons-transfer
mechanism; however, it is also explained by an ions-transfer mechanism. The bond-
breaking process can be combined with several complicated phenomenon, such as the
back-flow and gaseous discharge. In addition, charge can accumulate by repeating
contacts and separations. The mechanisms on all these aspects are reviewed and
discussed in this section.
2.3.1 Contact charging
Taylor and Secker (1994) explained the contact-charging phenomenon from
thermodynamic point of view: when two different surfaces get into contact, charges will
transfer from one surface to the other in order to keep the thermodynamic equilibrium.
When the two surfaces are separated quickly, the transferred charge may be kept on the
other surface as shown in Figure 2.6. For conductors, the transferred charge will move
rapidly and will recombine during the separation. However, for insulators, the transferred
charges cannot move as freely because they are trapped inside the insulator surface,
16
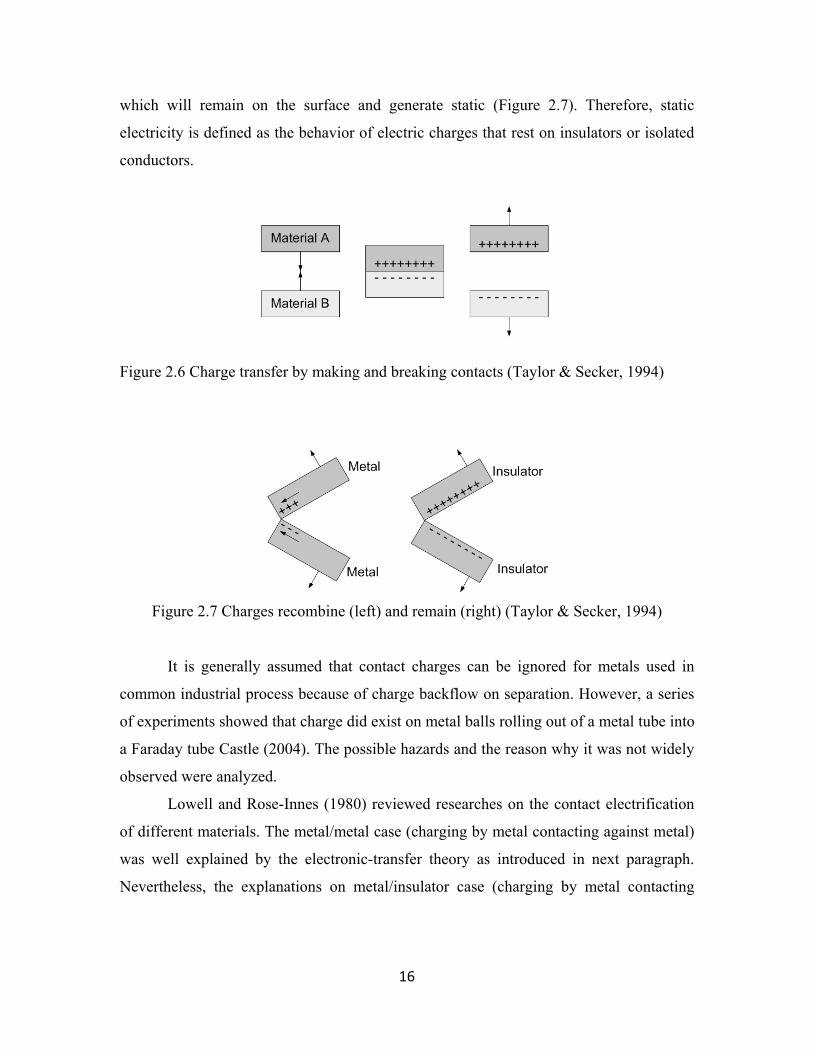
which will remain on the surface and generate static (Figure 2.7). Therefore, static
electricity is defined as the behavior of electric charges that rest on insulators or isolated
conductors.
Figure 2.6 Charge transfer by making and breaking contacts (Taylor & Secker, 1994)
Figure 2.7 Charges recombine (left) and remain (right) (Taylor & Secker, 1994)
It is generally assumed that contact charges can be ignored for metals used in
common industrial process because of charge backflow on separation. However, a series
of experiments showed that charge did exist on metal balls rolling out of a metal tube into
a Faraday tube Castle (2004). The possible hazards and the reason why it was not widely
observed were analyzed.
Lowell and Rose-Innes (1980) reviewed researches on the contact electrification
of different materials. The metal/metal case (charging by metal contacting against metal)
was well explained by the electronic-transfer theory as introduced in next paragraph.
Nevertheless, the explanations on metal/insulator case (charging by metal contacting

17
against insulator) and insulator/insulator case (charging by insulator contacting against
insulator) remained unsatisfactory since the lack of knowledge on insulators’ surfaces.
The theory of contact charging between metals was established in by Harper
(1957). As shown in Figure 2.8, metal A has work function φA, and metal B has work
function φB, where φA < φB (the work function represents the minimum energy for an
electron to escape from the metal). When the metal A and the metal B get into contact,
electrons in higher energy state in metal A will transfer into unoccupied lower energy
states in metal B until the surface potential is sufficient to cause the same work function
for both surfaces (Taylor & Secker, 1994). The work functions of 94 elements can be
found in literature (Welker, Nagarajan, & Newberg, 2006). The surface work function of
most metal is about 4-5 eV.
Figure 2.8 Metal A and B of different work functions (b) Fermi level* of the two metals
become equal after contact (Taylor & Secker, 1994)
*In Quantum mechanism, solid surface is occupied by electrons in discrete energy states. For metals,
electrons only occupied the states below Fermi energy, EF. The energy interval, φW, from EF to vacuum
level (zero potential state) is the work function (Patterson & Bailey, 2007).
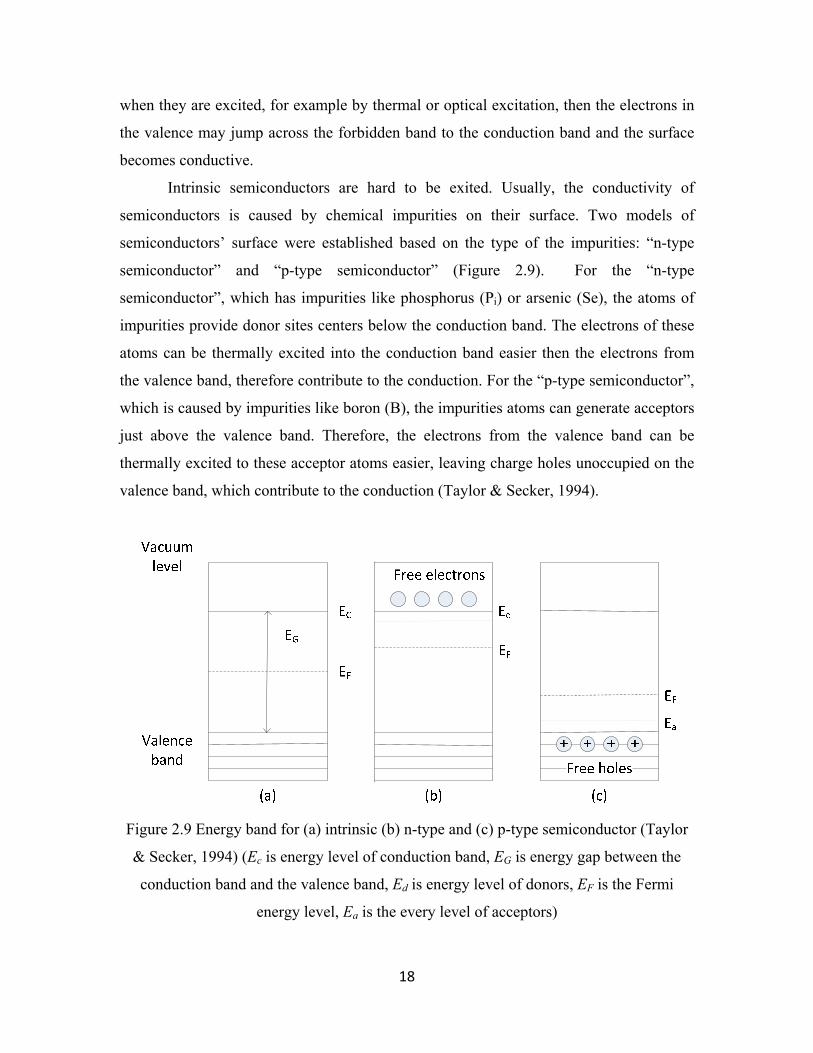
The surface energy states for semiconductor is similar to that for metal surface,
but there exists a forbidden band, EG, between the valence band and the conduction band
as shown in Figure 2.9. The valence band of these materials is already fully occupied by
electrons, therefore, the electrons cannot move freely in the valence band. However,
18
when they are excited, for example by thermal or optical excitation, then the electrons in
the valence may jump across the forbidden band to the conduction band and the surface
becomes conductive.
Intrinsic semiconductors are hard to be exited. Usually, the conductivity of
semiconductors is caused by chemical impurities on their surface. Two models of
semiconductors’ surface were established based on the type of the impurities: “n-type
semiconductor” and “p-type semiconductor” (Figure 2.9). For the “n-type
semiconductor”, which has impurities like phosphorus (Pi) or arsenic (Se), the atoms of
impurities provide donor sites centers below the conduction band. The electrons of these
atoms can be thermally excited into the conduction band easier then the electrons from
the valence band, therefore contribute to the conduction. For the “p-type semiconductor”,
which is caused by impurities like boron (B), the impurities atoms can generate acceptors
just above the valence band. Therefore, the electrons from the valence band can be
thermally excited to these acceptor atoms easier, leaving charge holes unoccupied on the
valence band, which contribute to the conduction (Taylor & Secker, 1994).
Figure 2.9 Energy band for (a) intrinsic (b) n-type and (c) p-type semiconductor (Taylor
& Secker, 1994) (Ec is energy level of conduction band, EG is energy gap between the
conduction band and the valence band, Ed is energy level of donors, EF is the Fermi
energy level, Ea is the every level of acceptors)
19
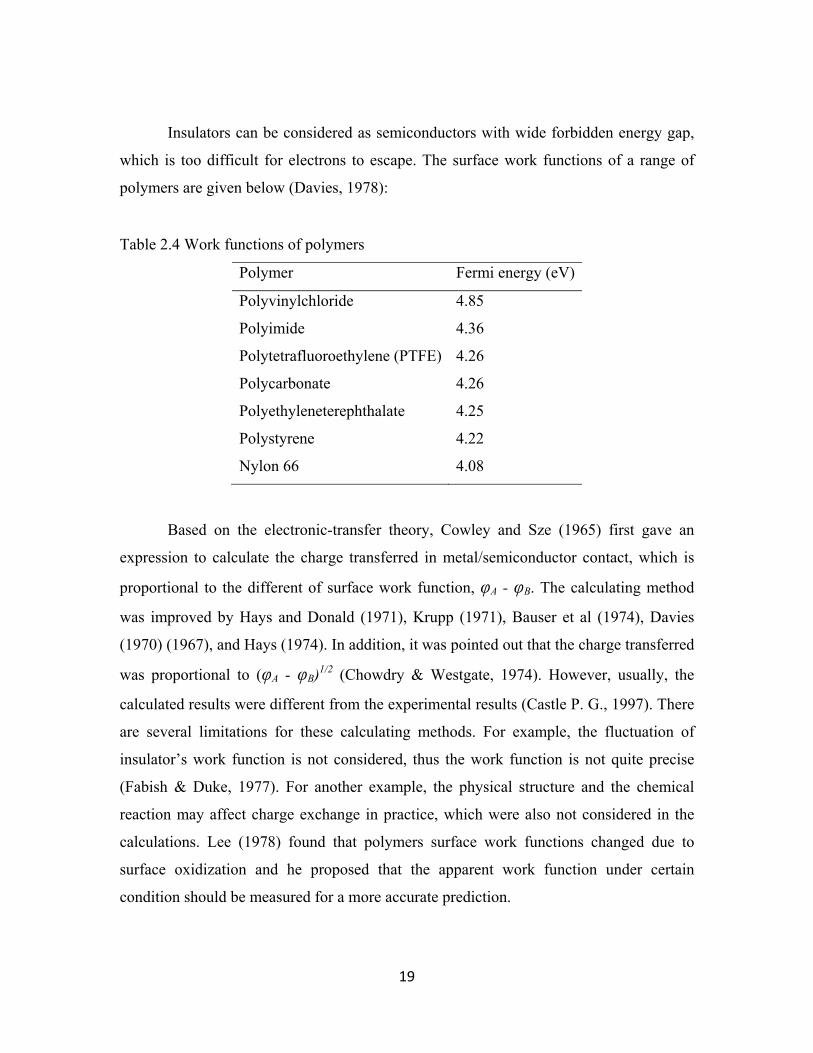
Insulators can be considered as semiconductors with wide forbidden energy gap,
which is too difficult for electrons to escape. The surface work functions of a range of
polymers are given below (Davies, 1978):
Table 2.4 Work functions of polymers
Polymer Fermi energy (eV)
Polyvinylchloride 4.85
Polyimide 4.36
Polytetrafluoroethylene (PTFE) 4.26
Polycarbonate 4.26
Polyethyleneterephthalate 4.25
Polystyrene 4.22
Nylon 66 4.08
Based on the electronic-transfer theory, Cowley and Sze (1965) first gave an
expression to calculate the charge transferred in metal/semiconductor contact, which is
proportional to the different of surface work function, φA - φB. The calculating method
was improved by Hays and Donald (1971), Krupp (1971), Bauser et al (1974), Davies
(1970) (1967), and Hays (1974). In addition, it was pointed out that the charge transferred
was proportional to (φA - φB)1/2 (Chowdry & Westgate, 1974). However, usually, the
calculated results were different from the experimental results (Castle P. G., 1997). There
are several limitations for these calculating methods. For example, the fluctuation of
insulator’s work function is not considered, thus the work function is not quite precise
(Fabish & Duke, 1977). For another example, the physical structure and the chemical
reaction may affect charge exchange in practice, which were also not considered in the
calculations. Lee (1978) found that polymers surface work functions changed due to
surface oxidization and he proposed that the apparent work function under certain
condition should be measured for a more accurate prediction.
20
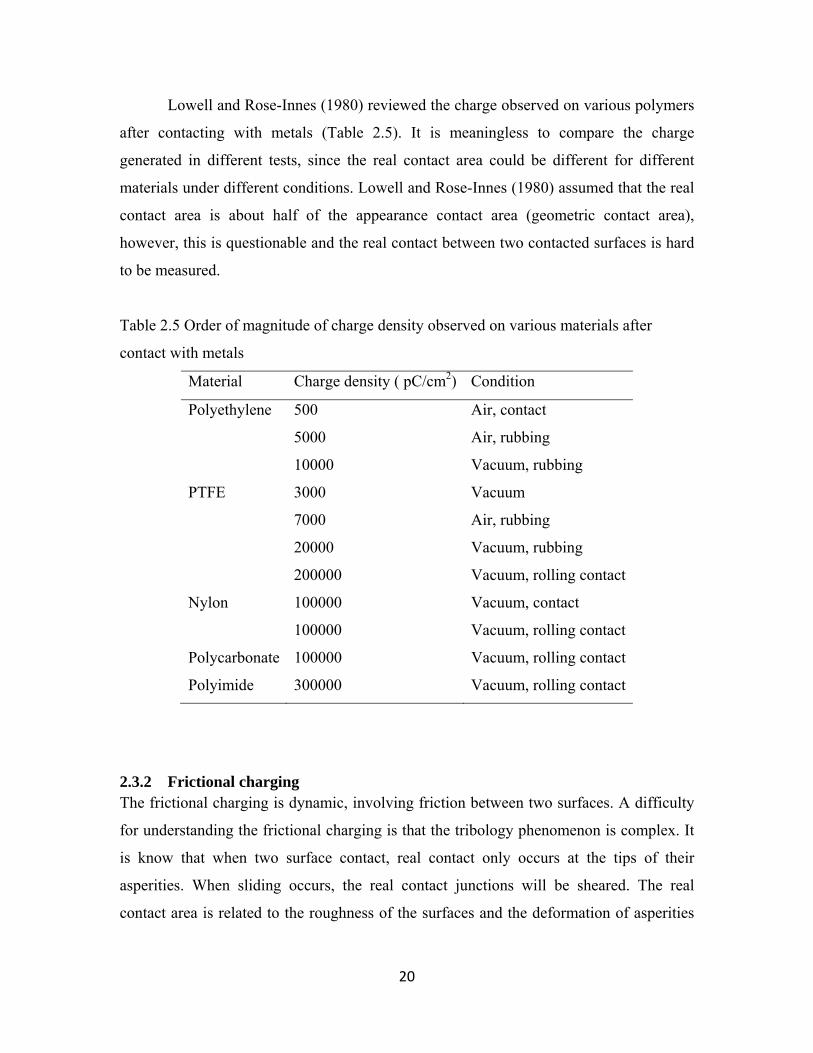
Lowell and Rose-Innes (1980) reviewed the charge observed on various polymers
after contacting with metals (Table 2.5). It is meaningless to compare the charge
generated in different tests, since the real contact area could be different for different
materials under different conditions. Lowell and Rose-Innes (1980) assumed that the real
contact area is about half of the appearance contact area (geometric contact area),
however, this is questionable and the real contact between two contacted surfaces is hard
to be measured.
Table 2.5 Order of magnitude of charge density observed on various materials after
contact with metals
Material Charge density ( pC/cm2) Condition
Polyethylene 500 Air, contact
5000 Air, rubbing
10000 Vacuum, rubbing
PTFE 3000 Vacuum
7000 Air, rubbing
20000 Vacuum, rubbing
200000 Vacuum, rolling contact
Nylon 100000 Vacuum, contact
100000 Vacuum, rolling contact
Polycarbonate 100000 Vacuum, rolling contact
Polyimide 300000 Vacuum, rolling contact
2.3.2 Frictional charging The frictional charging is dynamic, involving friction between two surfaces. A difficulty
for understanding the frictional charging is that the tribology phenomenon is complex. It
is know that when two surface contact, real contact only occurs at the tips of their
asperities. When sliding occurs, the real contact junctions will be sheared. The real
contact area is related to the roughness of the surfaces and the deformation of asperities
21
(Howell, Mieszkis, & Tabor, 1959) (Gupta, 2007). As to the complex effect of speed on
friction, it was found for example, that for lubricated yarns, the coefficient of friction
increased when the rubbing speed increased. This is a practical example of the added
complication introduced by additives (essentially deliberately applied “impurities”)
which mean that some consideration must also be given to the influence of hydrodynamic
factors (Lyne, 1955). Additionally, it is also interesting to note that friction could be
reduced by modulating vibration (Armstrong-Helouvry, 1991), which is a factor that is of
significance in a moving thread line. For those approaches that are applied to reduce
friction, the ultimate goal is usually to control the electrostatic charging and reduce wear
or surface attrition of the various component surfaces. While there is much work on
friction and on static electrification, the correlation between these is still not well
understood.
A commonly asked question is that whether rubbing charges different from
charging by contact/separation. Experiments showed that charge transferred in a rubbing
process was several orders of magnitude greater than in a simple contact, and it was
easier for the frictional charging to reach the thermodynamic equilibrium than the
repeating contact charging (Taylor & Secker, 1994). Experiments using the Van de Graff
generator (Serway & Jewett, 2007) showed that charge increased as the rubbing speed
(belt winding across rollers) increased. An obvious explanation of this phenomenon is
that the sample length increased at higher rubbing speed, which gave more contact area
for the charge generation. However, if the sample length was the same, the effect of
rubbing speed on the charge generation is still unknown. It is also unknown that whether
there is any more fundamental difference between rubbing charging and contact charging.
If the process of rubbing were to influence the basic mechanism of charge transfer, in
addition to the factor of contacting area, one would expect the velocity of rubbing to
affect the charge (Lowell & Rose-Innes, 1980).
On one hand, a decrease of charge at high speeds could possibly be caused by
heating, which would increase the conductivity of the polymer. On the other hand, it was
expected that the charge would increase with speed increasing since charge tended to
flow back to the rubbing metal. However, Ohara argued that charge back-flow is
22
probably not important for his samples. Ohara (1980) reported that the charge transferred
to a polymer by a metal sliding on it increased at first with the speed of sliding, then
decreased again at high speeds, in another word, there was a certain speed at which the
transferred charge was maximum. He suggested that the peak is a consequence of thermal
motion of the polymer segments (details introduced in following paragraphs). Zimmer
(1970) found charge reversal phenomenon (charge polarity changed) when the rubbing
speed increased. They proposed that as the high speed rubbing process caused the local
temperature increased, therefore enhanced the diffusion of the electrons from the hotter
part to the cooler part of the surface. However, there was no method to monitor the
electrons diffusion on polymers surfaces. Cunningham showed that the electrification of a
polymer sheet passing over a metal roller was much greater when slipping occurred than
when the roller and the polymer sheet had the same velocity. However, it could be argued
that the slipping merely increases the total area of contact. A variation of this kind has
been reported several times (Hersh & Montgomery, 1956) (Lowell & Rose-Innes, 1980),
but it is not certain whether it was caused by back-flow of charge or whether a more
fundamental process was taking effect. More works will be reviewed in details in section
2.5.
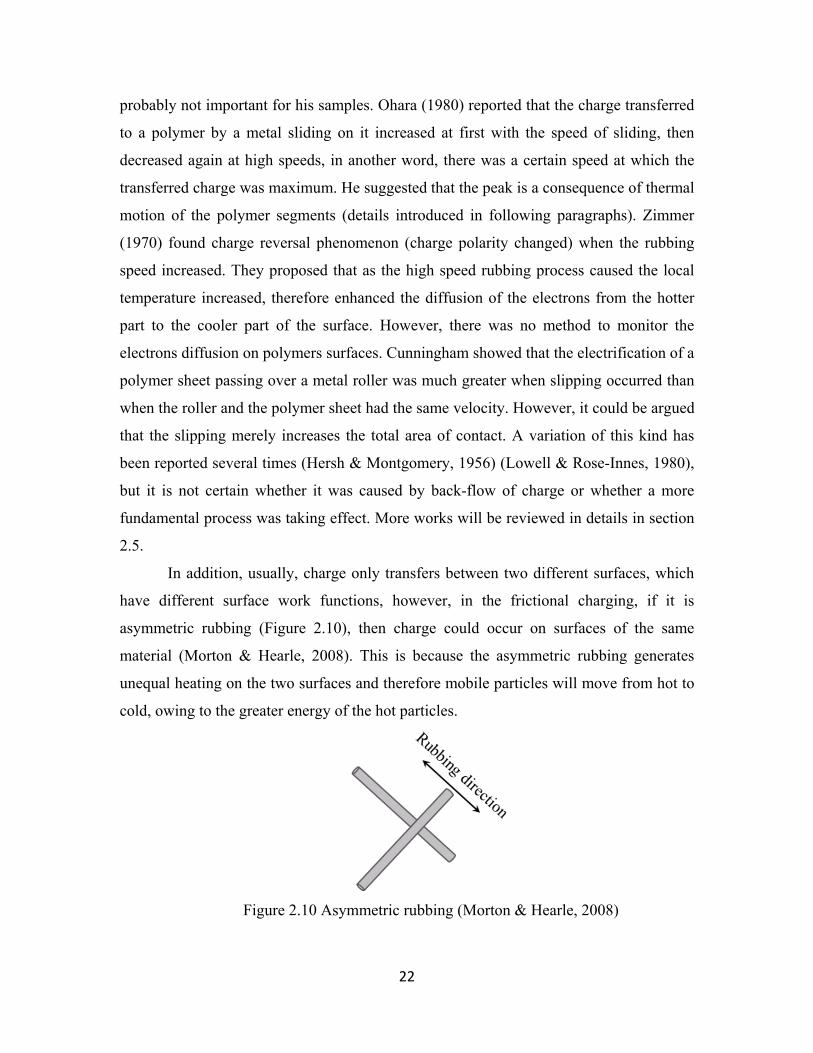
In addition, usually, charge only transfers between two different surfaces, which
have different surface work functions, however, in the frictional charging, if it is
asymmetric rubbing (Figure 2.10), then charge could occur on surfaces of the same
material (Morton & Hearle, 2008). This is because the asymmetric rubbing generates
unequal heating on the two surfaces and therefore mobile particles will move from hot to
cold, owing to the greater energy of the hot particles.
Figure 2.10 Asymmetric rubbing (Morton & Hearle, 2008)

23
2.3.3 Corona charging Because the charge generation in the contact and rubbing processes are hard to control,
(they are sensitive to the processing parameters, such as the contact pressure and the
rubbing speed) corona charging is used for observing static behavior. As shown in Figure
2.11, the corona charging is a self-sustaining, partial breakdown of gas, which is
subjected to highly divergent electric field (Taylor & Secker, 1994). It is often initiated
deliberately for some application, such as for the precipitation of dust and smoke and for
dry powder coating. There is significant information about the corona charging (Baum,
Lewis, & Toomer, 1977) (Gas Gupta & Doughty, 1978) (Pethig, 1983). There is also
research comparing the tribocharging and the corona charging (Chubb, 2002). However,
corona charging is beyond the scope of this research work.
Figure 2.11 Corona charging, Va is applied potential and Vs is the surface potential
(Taylor & Secker, 1994)
2.3.4 Repeating contacts and separations Contact charging and rubbing charging are non-equilibrium bond-breaking and bond-
building processes. For each contact/rubbing, new charge should be transferred from one
surface to the other until equilibrium is reached. Although there is charge dissipation
during each separation, usually the charge will accumulate in repeating contact. (Hays,
1991).

24
Previous researches on the contact electrification indicated that charge increased
as the number of contact increased. The rate of increase of the charge decreased as
contacts were repeated, and after many contacts, the charge appeared to saturate (Lowell
and Rose-Innes, 1980). Why this happens is not, however, understood. Several
explanations have been put forward, as discussed below, but each of these is applicable to
only a certain kind of insulator:
1) The increase of charge with increased number of contacts may be explained by the
suggestion that the charge transferred depends on the total time of contact.
This simple explanation is probably not generally correct. First, charge transfer
seems to occur very quickly, in a period less than the duration of individual contact in
most experiments (Lowell & Rose-Innes, 1980). Secondly, specific experiments on KCl,
anthracene, and some polymers (Lowell & Rose-Innes, 1980) have shown that the
increase in charge by repeating contacts cannot be explained in this way. In each case, N
times of contacts, each of which had t seconds of contact, generated much more charge
than a single contact with contact time of N × t seconds.
2) The increase of charge with number of contacts may be caused by the increase of real
contact area, which is related to the visco-elastic deformation, by repeating contacts.
The visco-elastic increase of area seems to be ruled out by the following
observations (Lowell & Rose-Innes, 1980). A series of contacts was made to the same
position on the polymer. The charge increased rapidly at first, and then became almost
constant. The charge was then removed by exposing the polymer to ionized gas and
another series of contacts made to the same position. In this second series of contacts, the
charge built up in much the same way as it did in the first series that the charge increased
strongly initially. According to the visco-elastic hypothesis, however, the build-up of
charge is due to a gradual increase in the total area of contact, and the fact that the charge
eventually becomes almost constant must imply that that area of contact has almost
ceased to change. The fact that in the second series of contacts, the charge increased
strongly at first therefore contradicts the visco-elastic hypothesis.

25
3) The repeating contacts may be expected to increase the charge if the insulator is
slightly conducting, because the charge tends to spread (under its own Coulomb repulsion)
into the bulk, making room, for more charge to be deposited in the next contact (Harper,
1967).
Homewood and Rose-Innes (1982) used very hard crystalline insulators to study
the charge accumulation, so that the surface relocation and the surface deformation in
repeating contacts could be negligible. They found the charge accumulation began to
happen after they added some additive to increase the surface conductivity. Therefore,
they concluded that the charge accumulation was related to the surface conductivity.
Between contacts, charge could leak from the contact point and be replaces on the next
charging. Cunningham and Goodings (1986) observed charge accumulation a long time
after the possible effect of plastic deformation has been eliminated. They assumed that
the charge could penetration into the bulk, which depended on the surfaces boundary
conditions. Other reserachers (Hays, 1991) (Lowell, 1984) (Labadz & Lowell, 1986)
(Fabish & Duke, 1977) studied how charge is accumulated on an insulator and how deep
the charge could penetrate. Their experiments indicated the repeating metal-polymer
contact charging may involve the bulk states of the polymer, and they reported that the
penetration depth is in micrometer range as shown in Table 2.6. In addition, Lowell
(1967) pointed out that the charge penetration into the bulk of an insulator is caused by
the thermal activation in the conduction band.
Table 2.6 Penetration depths of charge from metal into polymers (Labadz & Lowell,
1986)
Polymer Penetration depth (nm)
Polyvinyl Chloride (PVC) 48
Polyimide 20
Polycarbonate 46
26
PTFE 13
Polyethylene Terephthalate (PET) 24
Polystyrene 43
Nylon 66 51
However, Lowell and Rose-Innes (1980) argued with this explanation. They
pointed out that for polymers such as PTFE the charge is immobile. A spot of charge
deposited on the surface remains virtually undiminished for several hours. Thus, for
certain materials, it is unlikely that the increase in charge with repeated contacts is due to
charge flowing away from the point of contact.
Mathematical methods and derived numerical techniques were used to predict the
charge accumulation in repeating contact process, most of which were formulated by a
function with a sum of exponential terms as shown in equation [1-4]:
1 exp / 1 exp / [1‐4]
Where, y is the saturation values of the whole process, which is a sum of ys1 and ys2. σ1
and σ2 are time constants, respectively. In addition, a 3-expontential sum function was
established by Gibbing (1975), which could fit the experimental curves better, but it
became difficult to explain their physical meaning.
2.3.5 Ionic transfer mechanism
In early years, a number of authors (Henry, 1957) (Ruckdeschel & Hunter, 1977) have
suggested that contact electrification may be caused by the transfer of ions from one
surface to the other. It is possible that the ionic species can influence the charging
mechanism, but the question remains whether it is correct to assume ions to be the charge
carriers. However, the overall electrical effect of a positive ion being transferred from a
surface cannot be distinguished from an electron transferred to that surface to neutralize
the ion. In the case of metal-insulator contacts, at least, the latter is more plausible.

27
The ion transfer mechanism regained attention in recent years because in
electrophotographic industries, the addition of some ionic CCA (charge control agents)
has been shown to accelerate the charging process. Some additives, like organic pigments
with NR3 and NR4+ groups, are positively charged. Some substances with COOH,
CONR2, SO3, SO2NR2 groups are anionic and negatively charged. However, their roles in
contact electrification remain obscure.
Mizes et al. (1990) studied the contact charging between indium and polystyrene
doped with some organic salt (cetyl pyridinium bromide). They observed the transfer of
the bromide ions, and assumed the ionic transfer was the only mechanism for contact
electrification. Dias et al. (1991) explained the charging results with pyridinium
toluensulfonate salts in terms of ionic transfer and pointed out the polarity and the
magnitude of the charge is depending on the mobility of the cation and the anion.
Water is reported to influence contact electrification, which is related to the ionic-
transfer mechanism (Field, 1946). When there was adsorption of moisture layer on a solid
surface, ions were claimed to be the major cause of charging and charge transferring was
seen as a redistribution of ions between the contacting surfaces. It is also claimed that the
effect of water on contact electrification is to increase the conductivity of the insulator.
The charge transferred in a single normal contact is unlikely to be affected, but if contacts
are repeated, the enhanced conductivity of the insulator may help the charge build up to a
large value and if sliding occurs, an increased conductivity may be expected to reduce the
total charge transferred by enhancing back-flow. In summary, ion transfer between
insulators is probably non-critical as well, though there is much less evidence in this case.
The role of ions in a surface layer of water needs further investigation.
2.3.6 Bond-breaking mechanism
Both of contact and frictional charging are considered as two-step processes phenomenon
consisting of instantaneous bond forming and bond breaking (1989). For the bond-
forming step, electronic and ionic transfer mechanisms have been discussed. For the
bond-breaking step, it may be combined with phenomenon like charge backflow, and air
breakdown.
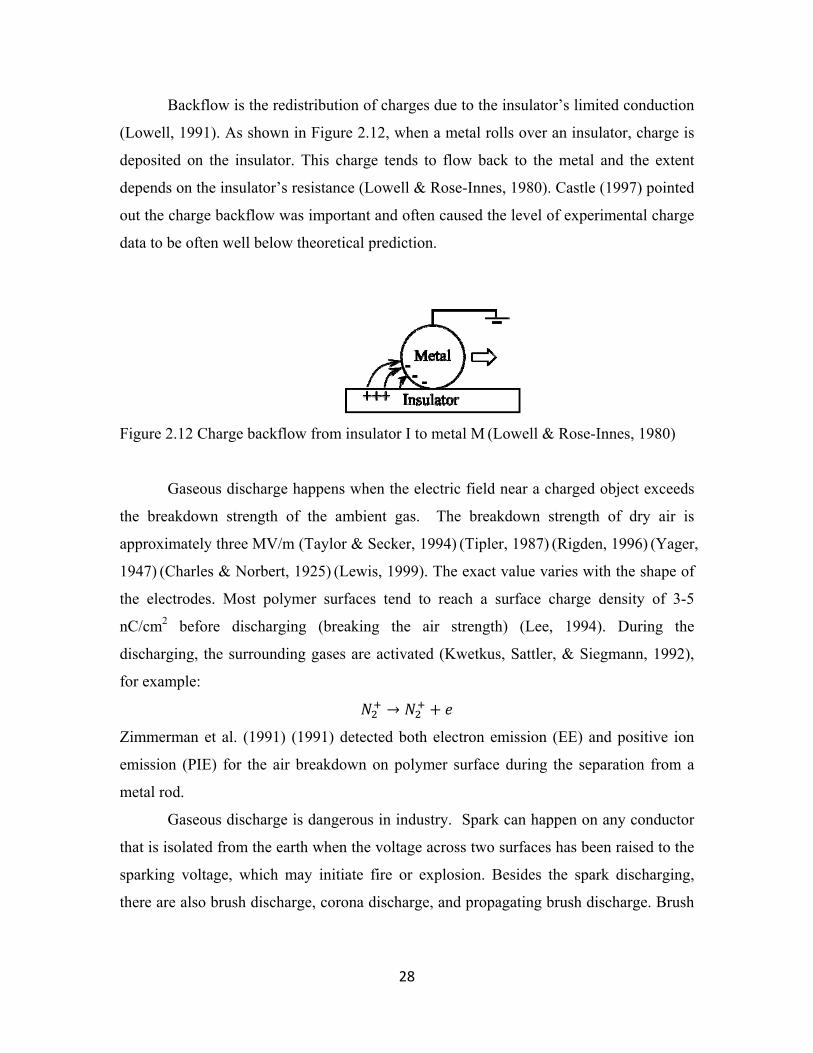
28
Backflow is the redistribution of charges due to the insulator’s limited conduction
(Lowell, 1991). As shown in Figure 2.12, when a metal rolls over an insulator, charge is
deposited on the insulator. This charge tends to flow back to the metal and the extent
depends on the insulator’s resistance (Lowell & Rose-Innes, 1980). Castle (1997) pointed
out the charge backflow was important and often caused the level of experimental charge
data to be often well below theoretical prediction.
Figure 2.12 Charge backflow from insulator I to metal M (Lowell & Rose-Innes, 1980)
Gaseous discharge happens when the electric field near a charged object exceeds
the breakdown strength of the ambient gas. The breakdown strength of dry air is
approximately three MV/m (Taylor & Secker, 1994) (Tipler, 1987) (Rigden, 1996) (Yager,
1947) (Charles & Norbert, 1925) (Lewis, 1999). The exact value varies with the shape of
the electrodes. Most polymer surfaces tend to reach a surface charge density of 3-5
nC/cm2 before discharging (breaking the air strength) (Lee, 1994). During the
discharging, the surrounding gases are activated (Kwetkus, Sattler, & Siegmann, 1992),
for example:
→
Zimmerman et al. (1991) (1991) detected both electron emission (EE) and positive ion
emission (PIE) for the air breakdown on polymer surface during the separation from a
metal rod.
Gaseous discharge is dangerous in industry. Spark can happen on any conductor
that is isolated from the earth when the voltage across two surfaces has been raised to the
sparking voltage, which may initiate fire or explosion. Besides the spark discharging,
there are also brush discharge, corona discharge, and propagating brush discharge. Brush

29
discharge happens between an earthed sphere and a suspended charged plate. The electric
field between the sphere and the plate is not uniform. The spark is initiated at the sphere
and then “fans” out into lots of small channels when approaching the plate surface. When
the charged plate is put on the front of an earthed plate, the charge density on the charged
plate will become significantly greater than the air breakdown limit. This is because the
electric field density from the charge plate surface to the backing earthed plate will be
much higher than that to the surrounding air. Now, if an earthed sphere approaches the
charged plate surface, when the distance between the earthed sphere and the charged
surface equal to the thickness of the charged plate, the charge flow direction will switch
from the earthed bottom plate to the sphere and the propagating brush discharging will be
initialized. The minimum charge required to initiate a propagating brush discharging
depends on the plate’s thickness (Taylor & Secker, 1994).
2.4 Mechanisms of charge dissipation The charge generated on a surface can move under the electric fields, spreading or
neutralizing the charges and making the fields decay. In all kind of charge decay, some
sort of conducting path, containing mobile charge carriers, has to be established from the
location of the charge to the ground. The static decay can be classified to three types: 1)
Charge decay of isolated conductors, 2) Charge decay of insulators, and 3) Charge decay
through the air.
2.4.1 Charge decay of conductor First, the charge might decay of an isolated conductor. For example, a conductor is
insulted by a material has resistance R as shown in Figure 2.13. The capacitance of the
conductor is C. When a charge q is plated on the conductor, then the conductor will be
surrounded by an electric field E, giving an initial voltage V:
/ [1-5]
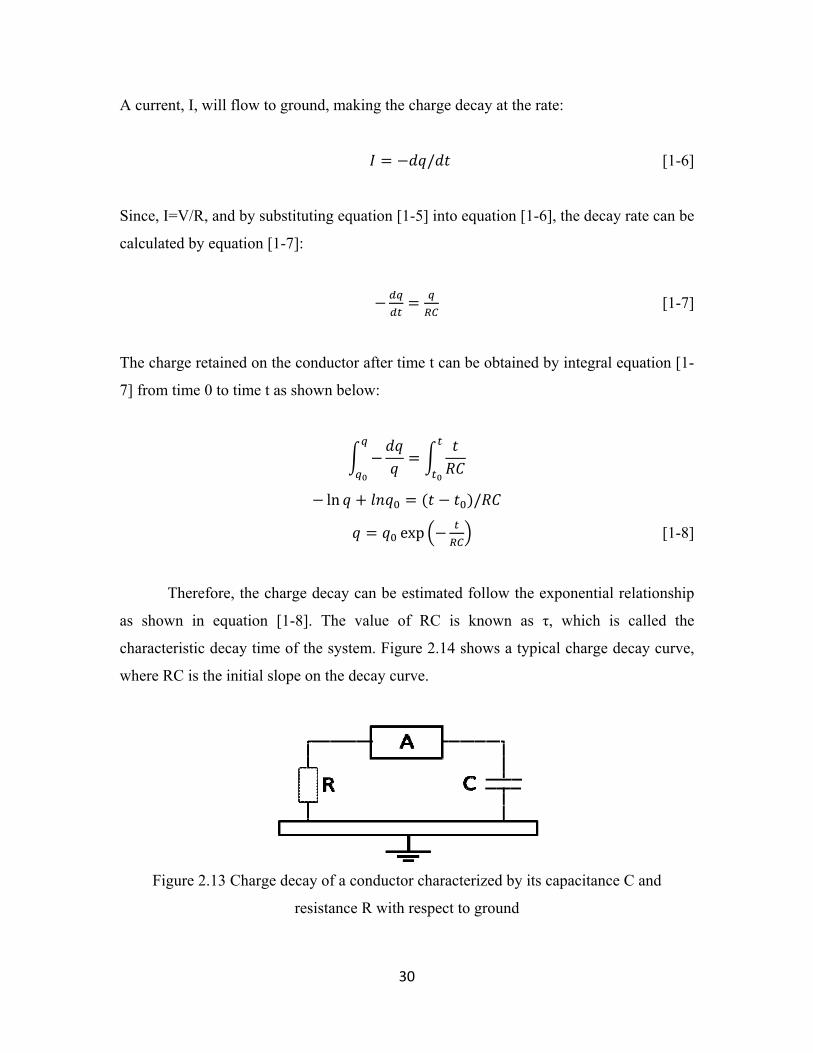
30
A current, I, will flow to ground, making the charge decay at the rate:
/ [1-6]
Since, I=V/R, and by substituting equation [1-5] into equation [1-6], the decay rate can be
calculated by equation [1-7]:
[1-7]
The charge retained on the conductor after time t can be obtained by integral equation [1-
7] from time 0 to time t as shown below:
ln /
exp
[1-8]
Therefore, the charge decay can be estimated follow the exponential relationship
as shown in equation [1-8]. The value of RC is known as τ, which is called the
characteristic decay time of the system. Figure 2.14 shows a typical charge decay curve,
where RC is the initial slope on the decay curve.
Figure 2.13 Charge decay of a conductor characterized by its capacitance C and
resistance R with respect to ground

31
Figure 2.14 Charge dissipation (Taylor & Secker, 1994)
2.4.2 Charge decay of a non-conducting system From the equation [1-8], the charge decay rate and voltage retained on the conductor can
be calculated from the system’s resistance and capacitance, which can be measured
directly. However, for an insulator, the charge decay may depend on very complex
geometrical, dielectric and resistive conditions of the system. For example, when an
insulator of resistivity ρ and permittivity (relative dielectric constant) ε resting on a
grounded plane, a charge q is distributed uniformly over the area A, then the surface
charge density will be:
[1-9]
If there is no conductor surrounding the charge surface as shown in Figure 2.15,
then the field form the charge will be directed toward the grounded plane and the charge
will decay through the insulator itself. The charge density on surface after time t can be
calculated by equation [1-10]:
exp / [1-10]

32
Where, σ is charge density on insulator surface after time t, σ0 is the surface’s initial
charge density, ρ is the resistivity of the insulator, and ε is the relative dielectric constant
of the insulator.
If there is a grounded plate placed parallel with the charged surface with distance
x to the surface (Figure 2.16), then the electrical field will also direct from the charge
surface to the grounded plate through the air. The charge density retained on surface after
time t can be predicted by equation [1-11]:
exp [1-11]
Where, ε0 is the dielectric constant of the air, d is the distance between the charged
surface and the grounded plate, and x is the thickness of the insulator. Equation [1-10]
indicated that the charge decay of an insulator is not only determined by the material
parameters, but also by the geometry and dielectric and resistive properties of the
surroundings. The charge decay can only be predicted in special cases like the model
shown above, while, on the other hand, it can be much more complicated in practice. For
example, when two different medium materials (e.g. insulator and gas) are present
between a charged surface and the grounding point, the system’s resistance and capacity
need to be modified into a serial model. For another example, for insulators, volume and
surface resistivity may be different and they have not been well separated. These can
result in the decay characteristics of insulators departing significantly from the ideal
exponential behavior expected.
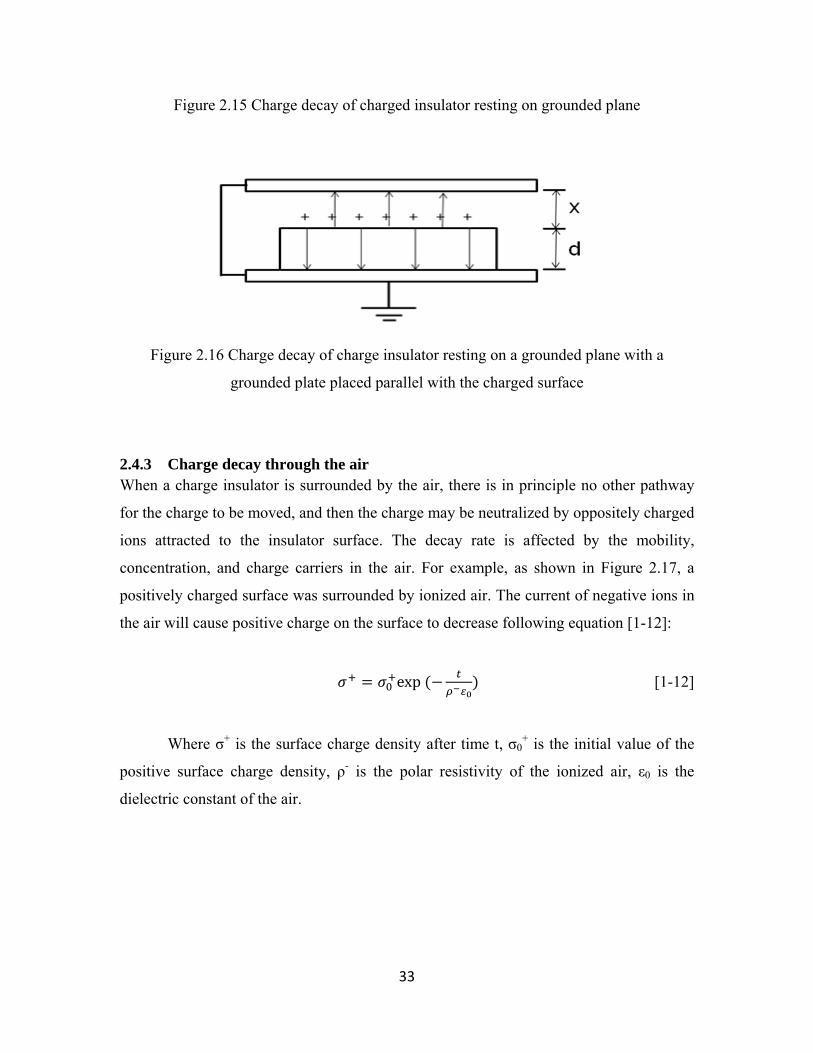
33
Figure 2.15 Charge decay of charged insulator resting on grounded plane
Figure 2.16 Charge decay of charge insulator resting on a grounded plane with a
grounded plate placed parallel with the charged surface
2.4.3 Charge decay through the air When a charge insulator is surrounded by the air, there is in principle no other pathway
for the charge to be moved, and then the charge may be neutralized by oppositely charged
ions attracted to the insulator surface. The decay rate is affected by the mobility,
concentration, and charge carriers in the air. For example, as shown in Figure 2.17, a
positively charged surface was surrounded by ionized air. The current of negative ions in
the air will cause positive charge on the surface to decrease following equation [1-12]:
exp [1-12]
Where σ+ is the surface charge density after time t, σ0+ is the initial value of the
positive surface charge density, ρ- is the polar resistivity of the ionized air, ε0 is the
dielectric constant of the air.

34
Figure 2.17 Charged body in air with ions
It worth mentioning that the characteristic decay time or the half decay time are
often used for evaluating static properties of materials (Taylor, 1987, Kan, 2008) and
these value are adopted by the industry. It has been documented by earlier investigation
(Ieda & Shinohara, 1967) that the higher the charge generation the faster the charge
decay. A material with low charge generation may take longer half decay time compared
to another material with high charge generation. The latter may retain more charge than
the former material as is demonstrated in Figure 2.18. The half decay time is therefore
not a direct factor to be considered. The charge retained as a normalized value compared
to the accumulated charge coupled with the actual decay behaviour (time versus charge
level) provides better method to compare between materials.
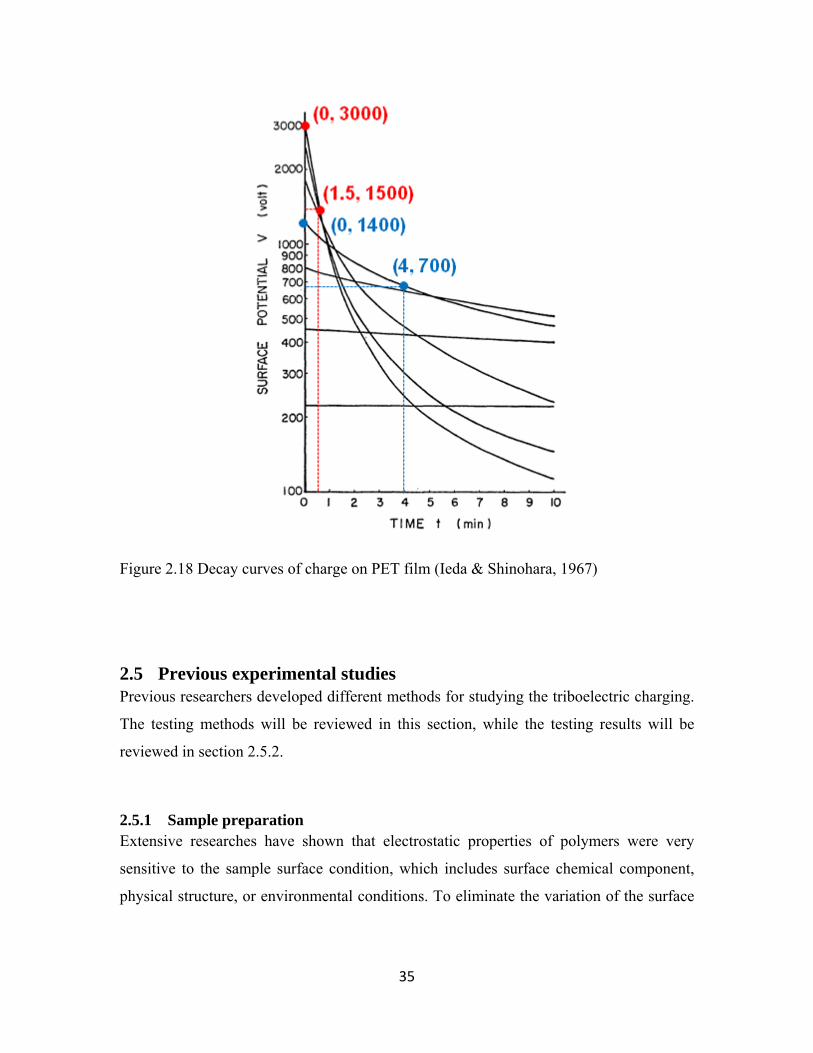
35
Figure 2.18 Decay curves of charge on PET film (Ieda & Shinohara, 1967)
2.5 Previous experimental studies Previous researchers developed different methods for studying the triboelectric charging.
The testing methods will be reviewed in this section, while the testing results will be
reviewed in section 2.5.2.
2.5.1 Sample preparation Extensive researches have shown that electrostatic properties of polymers were very
sensitive to the sample surface condition, which includes surface chemical component,
physical structure, or environmental conditions. To eliminate the variation of the surface

36
condition, different kinds of sample preparation methods were developed in previous
studies. For example, in Medley’s experiments (1954), petroleum ether and water were
used to clean fibers, which could be distilled directly without exposure to the external air.
The initial charge on fibers was discharged by β irradiation through an aluminum foil
window on a sealed chamber, where all testing devices were enclosed. In the experiments
of Kematsu et al. (2004), polymeric disks were cleaned by ethyl-alcohol and the initial
charge was removed by spraying ionized air. In the experiments of Sereda and Feldman
(1964), fabrics were washed in diethyl ether, ethyl alcohol, and distilled water in turn.
After washing, part of the samples were dried over magnesium perchlorate and other part
were centrifuged to a spin-dry condition. In the work of Homewood and Rose-Innes
(1979), polymeric samples were discharged through a flow of ionized argon gas. Many
researches also use coating method to get dense layer of desired molecular to make the
tribo-electrification. For example, Ohara et al. (2001) used polymer films or LB
(Langmuir-Blodgett) layers deposited on flat substrates to rub against each other. For
another example, Robin et al. (1975) coated ions at two ends of pyroelectric materials
(polarized in applied electric field) to investigate the effect of adsorbed ions in contact
charging. However, until now, sample preparation remains one of the major difficulties
of the static experiments. There is still accepted standard to what precision and
cleanliness the surface should be prepared (2004).
2.5.2 Environmental chambers For electrostatic tests, testing environment need to be controlled because electrostatic
phenomenon can be affected by the environment parameters. For some static experiments,
the purpose was to find the influence of relative humidity or temperature on the charge
generation or dissipation, then the testing environment need to be adjustable to provide
different levels of constant condition. To realize these experiment, sealed chamber were
usually used in previous works, where the relative humidity was controlled. For example,
in Medley’s tests, all devices were enclosed inside a grounded metal chamber, where the
relative humidity was controlled by solution. In the experiments of Hersh et al. (1956),
parts of the devices (except cam, motor and electrometer) were placed inside a chamber

37
made of plywood and Lucite. The temperature was controlled by a heater and the
humidity was controlled by saturated salt solutions contained in trays. Air –circulating
fan was applied in most of previous work, which is also enclosed in their chambers. In
the experiments of Sereda and Feldman (1964), two series of vacuum desiccators,
containing sulphuric acid solutions adjusted to concentrations were used to give different
levels of relative humidity conditions.
In addition, vacuum chamber and chambers filled with particular air were also
used in previous work to study the static behavior in these environments. For example,
vacuum bell jar and environment with Nitrogen gas of 50 KPa were also use in the
experiments of Kematsu et al. (2004). For another example, the experiment of
Homewood and Rose-Innes (1979) were carried out in a vacuum chamber.
2.5.3 Charge measurement on solids Charge generated on small specimens can be measured by placing them into a Faraday
cage. The Faraday cage is composed of two cups with a small opening on top of the inner
cup and a lid, which can be closed on the top of the outer cup. The inner enclosure is
electrically connected to an electrometer. It is insulated from the outer enclosure by rigid,
very high resistance, insulator, such as the PTFE. The outer enclosure is connected to
ground and serves to shield the inner enclosure from external fields, which could affect
the measurement. Measurement of charge on large specimens, which cannot be totally
enclosed by a Faraday cage, can be done using two concentric cylinders enclosing the
part of the specimen to be measured. The outer cylinder should be longer than the inner
cylinder to shield it from charge outside.
The electric field strength can be measured using a fieldmeter. When a charged
specimen is placed in front of the sensing unit of the fieldmeter, the sensing unit will
induce electrostatic charge. There are mainly two types of fieldmeter: 1) rotating vane
fieldmeter, 2) vibrating plate fieldmeter.
For a rotating vane fieldmeter, the vane is rotating and a sensor plate is fixed.
When the rotating vane covers the sensor plate, the induced charge in the sensor is small.

38
When the opening in the rotating vane is in the opposite position from the sensor, the
induced charge in the sensor is a maximum. Thus, there will be a periodically AC signal
on the sensor plate, which will be amplified, processed, and read by a display unit. For
the vibrating sensor, there are a moving electrode and a fixed electrode (the two
electrodes are called “folk”). As the distance between the two electrodes varied, the
capacitance varies and electric charge is forced in and out of the capacitor. The AC signal
produced is amplified and displayed as a voltage. As the probe moves away from the
charged material, less charge is induced on the sensor, whereas as it moves toward the
charged material, more charge is induced on the sensor. Thus, the distance between the
sensor and the charged surface need to fix during the test.
Both the Faraday cage (charge measurement) and the fieldmeter (field
measurement) are often attached by a cable to an electrometer, which is also called
electrostatic voltmeter. Figure 2.19 shows the diagram of apparatus for measurement of
electrostatic charge.
Figure 2.19 Diagram of apparatus for measurement of electrostatic charge
One of the drawbacks on charge measurement in previous researches is the
manual moving of sample. For example, in the experiments of Sereda and Feldman
(1964), after rubbing, the sample was lifted with insulated tongs and dropped into a
Faraday tube. They announced that the variables caused by manual operation were not
significant, however, there was no evidence and the limitation was obvious. Another
drawback is that many researchers measured the charge on the other surface instead of
the charge on the samples. For example, Robins et al. (1975) recorded the potential of
metal ball before and after contacting with different polymeric surface and he stated that
the charge on the insulator and the charge on the metal was equal and opposite. However,
this assumption is questionable since the conductivity of two different contacted
39
materials are different and the distance from the measured surface to the grounding point
are also different, both of which could cause different charge generated or measured.
2.5.4 Surface analysis The most important surface analysis regarding electrostatic properties is the resistivity
measurement, which has been introduced in section 2.2. Since the electrification is a
surface phenomenon, therefore, different surface analysis techniques can be used to help
understanding the electrification phenomenon. Briggs (1979) discussed the advantage and
disadvantages of several types of methods and their use in the study of electrification
phenomenon. Those techniques include photoelectron spectroscopy (PES), which is
subdivided into ultraviolet (UPS) and x-ray photoelectron spectroscopy (XPS), electron
spectroscopy for chemical analysis (EXCA), auger electron spectroscopy (AES),
scanning auger microscopy (SAM), low-energy electron diffraction (LEED), secondary
ion mass spectroscopy (SIMS) and ion scattering spectroscopy (ISS). For example, AES
may damage the surface and may give additional charging onto the surface. In the work
of Németh et. al., the XPS was used to investigate the elemental surface composition of
film samples after charging. Beside this, solvatochromic measurements were also applied
in their experiment, where proving molecules were used to display the polarity of surface
after charging.
2.5.5 Effect of contact pressure Since real bodies are never perfectly smooth, when two surfaces contact, the real contact
only occurs at the tips of their asperities, which is affected by the surfaces roughness
(crimp crowns in the case of woven fabric) and the asperities' deformation properties. The
real contact area is defined as the regions of contact between two bodies through which
mechanical actions or reactions are transferred. The apparent contact area is defined as
the area of contact between two flat macroscopic bodies, which could by measuring the
length and width of the rectangular macroscopic contact region. The real contact area of

40
apparently flat materials is always less than the apparent contact area (ASTM D 4470-97
Standard test method for static electrification).
The real area of contact between two surfaces usually is not known, thus, the true
charge density at the points of contact cannot be determined. Therefore, the questions are
whether the real contact area is an appreciable fraction of the apparent contact area, and
whether there is reason to believe that this fraction does not appreciably vary from one
test to another under constant pressure. For example, Lowell and Rose-Innes announced
that if a metal sphere about 1 cm in diameter contacts PTFE with a force of 0.1 N, then
the PTFE plastically deformed indentation is about 0.5 mm in diameter. Therefore, he
assumed that the true area of contact is about half the apparent area. In addition, the
charge density averaged over the whole contact area (apparent contact area) may be used
for comparison purposes.
During the electrification, charge only transferred at the points of real contact.
Any parameters that may affect the real contact area between surfaces, such as the
contact force, must be controlled. Slip between surfaces during the making or breaking of
contact must be minimized or measured so it can be made reproducible. Roughness of
surfaces can alter the real contact area and hence the charge transfer, so one must be
careful to test surfaces of approximately the same roughness or under conditions (such as
high pressure or long time of contact) where surface roughness has less effect (ASTM D
4470-97 Standard test method for static electrification).
For examples, Coste and Pechery (1981) found that the greatest charge transfer
occurs when the surface roughness was the smallest by contact charging a series of PET
film samples of various micro-roughness. Since larger contacting area provides more
surface to participate in the charge transfer between two surfaces. For another example,
Ohara et al. (2001) performed frictional charging on Langmuir-Blodgett film (LB film),
and they found the charge magnitude increased as the roughness or the irregularity of the
film decreased, also because less rough LB film provides bigger contact area in the
rubbing process.
The surface deformation of a fiber compressed by a steel ball was studied (Pascoe
& Tabor, 1956). They found the relation between applied force, the yarn diameter, and

41
the indentation diameter as shown in equation [1-13]. Some typical values of the index m
in [1-13] are given in Table 2.7. The table also includes the value of the yield pressure of
the polymer under specified conditions of deformation (D=5 mm, d=1 mm).
[1-13]
W: load, D: fiber diameter, d: diameter of indentation, m, k: constant parameters (Pascoe
& Tabor, 1956).
Table 2.7 Indentation characteristics of polymers (Pascoe & Tabor, 1956)
Polymer m Yield Pressure (kg/mm2)
Nylon 6,6 2.7 7.32
PTFE 2.5 2.7
PP 2.7 1.27
*D=5 mm, d=1 mm
In addition, the relationship between material deformation and the truly contact
area is shown in Figure 2.20.
Under contact force, in addition to the increase of contact area, some chemical
bonds might be broken on polymers surfaces. These chemical segments can act as traps
for electrons and promote the static generation. This phenomenon was observed when
pressing polymers strongly against a metal and it was expected that the number of broken
bonds correlated with the contact force (Rose & Ward, 1957).
Since polymers are a type of viscoelastic materials. Their viscoelasticity is the
result of the diffusion of atoms or molecules inside their amorphous area (Morton &
Hearle, 2008). Thus, there can be certain amount of chemical bonds breaking under
compression and therefore affect the surface static behavior.

42
Figure 2.20 Deformation of OB hard elastic (diamond), OE soft elastic, and OI
polymers (The full line represents the load-deformation curves (similar to stain-stress
curve), and the dotted curves are pressure-area curves under constant loads. The
intersection points indicate the equilibrium situation.)
2.5.6 Effect of contact time
Polymers surface deformation is a time dependent process (Morton & Hearle, 2008). As
the contact time increases, the true contact area should increase within certain range,
therefore, the charge transferred will also increase. This is verified in the work of
Homewood and Rose-Innes (1979). They modified a microscope to contact a PTFE film
by the lens of the microscope. The image of contacted surface was monitored after 3 s,
100 s, and 1000 s. They found the contact area was about 30% of the geometrical area
after 3 s, and increased to about 40% after 1000 s contact. They concluded that the
contact area increases with the contacting time, but the rate varies with different material.
2.5.7 Effect of moisture Charge generation varies widely with the moisture content of a material. Generally, the
moisture tends to increase the charge conductivity along polymers surface, as well as the
43
charge dissipation to the surrounding air. Therefore, it was believed that the static
decreases as the relative humidity increases (Greason, 2000). However, it was also found
that below certain level of relative humidity, the moisture contributes ions on polymers
surfaces, which helps charge transfer (Nemeth, Albrecht, & Schubert, 2003) (Nemeth,
Albrecht, & Schubert, 2003). Moreover, for hydrophilic fibers, the water absorption may
cause swelling, which alters the stiffness and surface area of fiber, yarns or fabrics
(Morton & Hearle, 2008), therefore, more chemical bonds in the microstructure of the
surface may break and contribute to the charge exchanging. Considering effects from
these aspects, people have determined the moisture level at which electrostatic reaches
the maximum. Their results are shown in table 2.8.
Medley (1950) (1954) studied the charge behavior of Nylon film rubbing against a
metal wire. He found the maximum charge occurred at 70% R.H., and assumed this was
related to the air breaking strength (charge reaches the maximum value before break the
air). This conclusion was supported by the test in air saturated with carbon tetrachloride
(increase air breaking strength), which resulted in higher maximum charge.
Sawa and Calderwood (1971) investigated the corresponding increases in
insulator’s surface conductivity with water sorption. They conclude that the effect of
humidity is to increase the mobility of the surface-charge carrier. However, the lack of
knowledge of the depth of the surface layer prevents the determination of the exact
calculation.
Awakuni and Calderwook (1972) found the effect of humidity for Teflon surface
was much less than the effect for oxidized polyethylene. From their report, the surface
conductivity of Teflon increased exponentially with water adsorption. This conductivity
remained low until the first monolayer of water was complete. They concluded that,
water molecules become mobile only when a first monolayer of water is complete.
Sereda and Feldman (1964) proposed a mechanism to explain the relation
between the relative humidity and the charge saturation or discharge (saturation point
exceeds the air dielectric strength). They assumed each water molecule occupies an area
of 10.8 Ǻ, Combined with the materials’ sorption isotherms, they concluded “a maximum
in electrostatic potential is attained when a monomolecular layer of water is complete”.
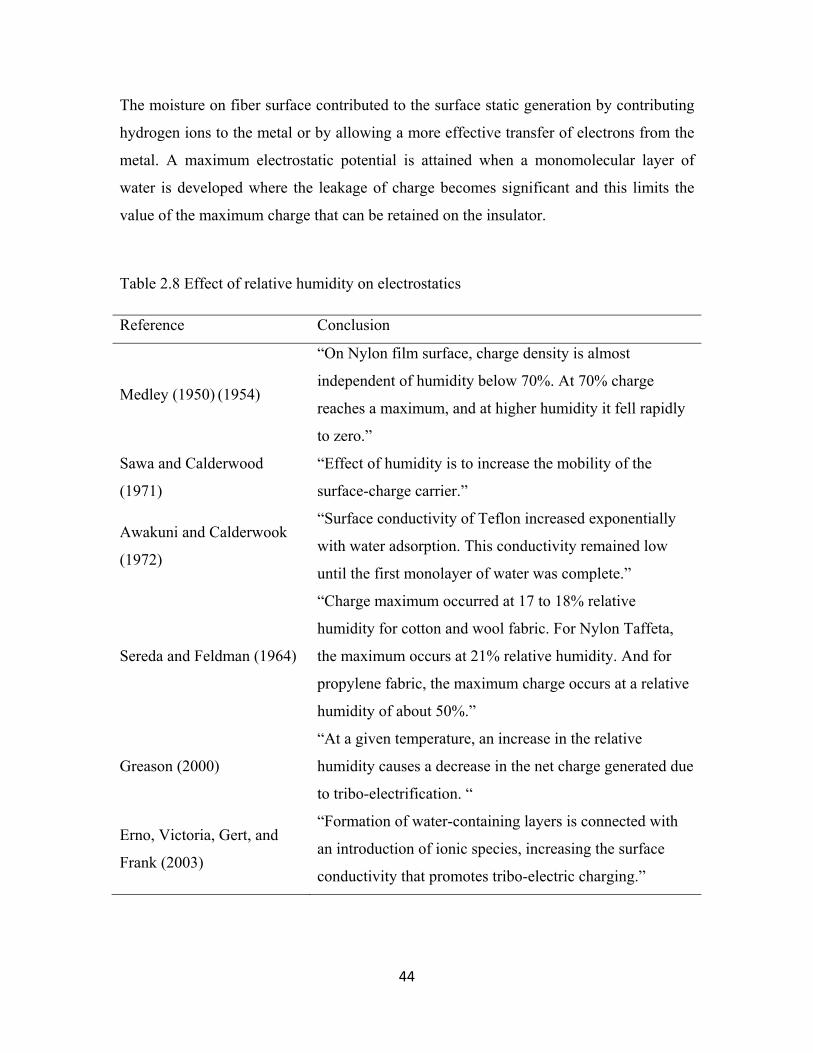
44
The moisture on fiber surface contributed to the surface static generation by contributing
hydrogen ions to the metal or by allowing a more effective transfer of electrons from the
metal. A maximum electrostatic potential is attained when a monomolecular layer of
water is developed where the leakage of charge becomes significant and this limits the
value of the maximum charge that can be retained on the insulator.
Table 2.8 Effect of relative humidity on electrostatics
Reference Conclusion
Medley (1950) (1954)
“On Nylon film surface, charge density is almost
independent of humidity below 70%. At 70% charge
reaches a maximum, and at higher humidity it fell rapidly
to zero.”
Sawa and Calderwood
(1971)
“Effect of humidity is to increase the mobility of the
surface-charge carrier.”
Awakuni and Calderwook
(1972)
“Surface conductivity of Teflon increased exponentially
with water adsorption. This conductivity remained low
until the first monolayer of water was complete.”
Sereda and Feldman (1964)
“Charge maximum occurred at 17 to 18% relative
humidity for cotton and wool fabric. For Nylon Taffeta,
the maximum occurs at 21% relative humidity. And for
propylene fabric, the maximum charge occurs at a relative
humidity of about 50%.”
Greason (2000)
“At a given temperature, an increase in the relative
humidity causes a decrease in the net charge generated due
to tribo-electrification. “
Erno, Victoria, Gert, and
Frank (2003)
“Formation of water-containing layers is connected with
an introduction of ionic species, increasing the surface
conductivity that promotes tribo-electric charging.”

45
Greason (2000) found the increase in the relative humidity (from 10% to 70%)
caused a decrease in net charge generated between a stainless steel ball and different
insulators (glass, PTFE, acrylic, polycarbonate, and nylon). He assumed this decrease
could be related to a decrease in the volume and surface resistivity of insulators caused
by the increase in relative humidity.
It was pointed out that water adsorption influences the charging mechanism
(Nemeth, Albrecht, & Schubert, 2003). Several polymers showed an increased uptake of
water, which forms adsorption or swollen layers, with increasing the atmospheric
humidity. The incorporation of water into polymer’s surface introduces ions in the
systems. These ions can be formed by the auto-dissociation of water. Furthermore, water
molecules are able to initiate the dissociation reactions of surface groups (e.g. carboxyl
groups). In addition, impurities may be solvated and mobilized by the water molecules.
2.5.8 Effect of temperature In the energy states model for semiconductors or insulators’ surfaces (section 2.3.1), the
electrons cannot jump across the forbidden band to escape the surface until there are
thermal or optical excitations, so temperature increasing will help the electrons transfer
between two surfaces (Taylor & Secker, 1994). Besides the energy states theory, it is
realized that molecular thermal motion increases as temperature increases, therefore,
more molecules can be brought to the surface to participate in true (molecular) contact.
There is microbrownian motion of polymer chains and some deformed polymer segments
may relax from the main chain as temperature increases (Ohara K. , 1980). It is easier for
frictional charging to reach the thermodynamic equilibrium because there is more heat
generated in the rubbing process than in the contact charging (Lee, 1994).
Ohara (1980) investigated the relationship between frictional electrification and
the molecular motion of polymers at different temperature. He used polycarbonate films
(30 µm thickness) to rub against a spherical steel tip (5 mm in diameter) at chamber
temperature ranging of 10 to 100 °C. Peaks of output voltage appeared at 40, 50 and
70 °C and friction speeds of 0.065, 0.41 and 3.6 mm/s, respectively. For the former two
cases, the charge began to increase again from 60 and 90 °C, respectively. They predicted

46
there could be another peak at about the glass transition temperature (149 °C) of
polycarbonate. These results were interpreted in terms of the molecular motion in the
polymer chains and the relaxation of deformed molecules. The effect of temperature was
considered as be related with the rubbing speed, because the charge transfer was affected
by the frequency of thermal motion of the chains, and affected by the frequency of
mechanical contact and separation.
From the contact tests between stainless steel and insulators (glass, quartz, PTFE,
acrylic, polycarbonate, and nylon), Greason (2000) found that at a given relative
humidity, an increase in the temperature (from 10 °C to 30 °C) caused a decrease in the
average charge measured for all six insulators. He assumed this was ascribed to a
decrease in the volume and surface resistivity of insulators by an increase in
environmental temperature (the samples resistivity not measured in his work). This
interpretation is questionable because the data analyzed were the average value from six
different materials. Nevertheless, the effect of temperature on different materials may
various largely.
Additionally, Greason (2000) found the interaction between the effect of relative
humidity and temperature on contact electrification. At a high temperature, the effect of
relative humidity was more distinct (charge decreases as relative humidity increased), and
when the relative humidity was at a higher level, the effect of temperature on static
generation was enhanced. The reason was not explained in his paper, but this could be
due to the fact that, as there was more water vapor in the air at higher temperature when
the relative humidity percentage is the same (Figure 2.21). Therefore, the effect of
moisture was stronger under lower temperature.

47
Figure 2.21 Effect of temperature on the amount of water in air (Wikipedia_Humidity)
100%
RH is relative humidity of the mixture p(mixed) is the pressure of water vapor in the mixture,
and p(saturated) is the saturated vapor pressure of water at the temperature of the mixture
2.5.9 Effect of air pressure Keiji Ohara (1988) studied the potential on a steel ball in repeating contact with a
polymethyl methacrylate plate. He observed the saturation value at four different
atmospheric pressures, and found it is the minimum at 1×10³ Pa. This agreed with the
“Paschen’s Law” (Figure 2.22), which studied the breakdown voltage of parallel plates in

48
a gas as a function of pressure and gap distance. The voltage necessary to arc across the
gap decreased as the pressure was reduced. As the pressure was reduced below a torr, the
curve of breakdown voltage versus pressure reaches a minimum, and then as the pressure
is further reduced, rises steeply again (Paschen, 1889).
Figure 2.22 Paschen curves obtained for Helium, Neon, Argon, Hydrogen and Nitrogen,
using the expression for the beakdown voltage, VB as a function of the parameters pd,
where, p is the pressure (torr), d is the gap distance (cm) between two parallel paltes.
2.5.10 Effect of rubbing speed The effect of rubbing speed on charge generation has been reviewed in section 2.3.2. In
this part, the experimental results of some previous work will be introduced.
1) Frictional charging between yarn sections

49
Hersh and Montgomery (1955) investigated the influence of speed on yarns’ tribo-
electrification by rubbing yarns (viscose, nylon, cotton, polyethylene, polyvinyl chloride)
against each other and by rubbing yarn against metal wires (aluminium, stainless steel,
magnesium, and platinum). In their experiments, a top yarn or wire moved over a fix
bottom yarn at different levels of speed. The rubbing motion direction was 45° to both
yarns, therefore, fresh surface is always contacting fresh surface, which was called
“symmetric rubbing”. The bottom yarn together with other elements were enclosed in a
Faraday cage, so that the charge generated on the bottom yarn was measured by a
electrometer at about 90% resolution. It was found that for yarns other than
polytetrafluoroethylene (PTFE), the charge was independent of speed when they rubbed
against each other. When PTFE rubbed against other yarns, the charge was increasing
with velocity sometimes. For all other yarns except PTFE rubbing against metals, the
charge was found to increase linearly with velocity until a threshold value was reached,
and then to remain constant. When PTFE and metals were rubbed together, the charge
increased linearly with velocity without reaching a maximum. All their tests were
conducted inside a chamber, where the temperature and humidity was simply controlled
by enclosed heater and solutions.
2) Frictional charging between continuous moving yarn and stationary pin
Another study on the effect of rubbing speed was conducted by London (1966) by
transporting continuous filament yarns over a stationary guider at different levels of
speed inside a chamber. It was observed that charge increased with an increase of yarn
speed for polypropylene and polyester over stainless steel or aluminium guides.
However, the effect of yarn speed was a decrease in charge generation with an increase in
yarn speed for all other combinations (polypropylene or polyester against ceramic guide,
acetate or fibreglass against stainless steel, aluminium, or ceramic guides). Furthermore,
they observed an increase in yarn speed for nylon on aluminium and stainless steel
yielded a decrease in negative charge, a shift of sign, and an increase in positive charge
generation. Their testing temperature and humidity are kept “constant” by continuous air
feed and return. The cleaning of guiders was not mentioned in his procedures or not

50
conducted. From these previous works, the effect of speed on yarns’ electrification is not
consistent and there has been no universal agreement on the effect of speed on tribo-
electrification.
3) Frictional charging between polymeric film and substrate cylinder
Ohara (1980) investigated the tribo-electrification by rotating a metal cylinder at different
levels of rubbing speed and environmental temperature against a stationary polycarbonate
film wrapped over the cylinder. The surface potential of the film was measured by an
electrometer fixed inside the metal cylinder with a hole on the cylinder’s surface, which
allowed the electrode to detect the charge on the polymer film surface covered on the
cylinder. The experiments were conducted inside a temperature and humidity regulated
chamber. The electrification showed a maximum value and then decreased as the rubbing
speed increased. It was pointed out that the electrification on polymers’ surfaces was
related to the relaxation process of the deformed molecular chains. He proposed that
charge reached a maximum value when the frequency of appearance of polymer
segments to the surfaces by thermal motion (temperature dependent) coincides with the
frequency of surfaces mechanical contact/separation.
Ohara (1980) studied the dependence of rubbing speed and temperature in
frictional electrification. He found the charge kept decreasing with the increasing friction
speed in the range of 0.001 to 100 mm/s (very low speed range) when the temperature
was 30 °C. Moreover, the charge had peak values at 0.02, 0.069 and 3.6 mm/s when the
environmental temperatures were 45, 60 and 80 °C, respectively. Further, the charge kept
increasing with the increasing speed at 100 and 110 °C, which suggested that the peaks
might exist above their speed limit. Therefore, they concluded that the peak shifted to a
higher friction speed region with increasing temperature. The peak position was
explained as when the in/out frequency of polymer surface segments by thermal motion
coincided with the contact/separation frequency of surfaces mechanical friction, the
probability of molecular contact became largest and the number of transferred charges
became largest.

51
4) Frictional charging between rotating polymeric disks
Komatsu (Komatsu, 2004) conducted asymmetric rubbing between eight different
polymers, which were prepared in plastic disk shape. The electrostatic was generated by
rotating two disks side by side at two different rotational speeds. Charge generated on
each disk was monitored by a surface electric potential sensor with 1.5-2 mm spacing to
the edge of each disk. They found that when positively charge was generated on the slow
rotating disk, its charge magnitude was larger than that generated on the other disk. This
was explained by the thermal diffusion of electrons due to a temperature gradient,
because the temperature of slow rotating disk should be higher than that of the faster
rotating disk. However, this rule could not be applied to the cases in which the slow
rotating disk was negatively charged. They could not explain the instability. Their
experiments were conducted in different conditions, vacuum, Nitrogen gas, and
atmospheric air, all of which gave the similar results except the charge diffusion seemed
larger in normal air.
From these previous works, the results about effect of rubbing speed on yarns’
electrification were not consistent. This might be caused by some limitations in their
equipments and measurements. First, the surfaces cleaning and conditioning procedures
were not emphasized, which were a key factor for the electrification. Secondly, the
charge measurements were questionable. The devices (e.g. the Faraday cage and the Field
mill) calibration was not mentioned and the relative position between these devices and
the charged surface had to be kept precisely constant. Third, the environments were all
controlled by chambers, which might not be reliable. Last but not the least, the devices
and procedures were complicated. These could have caused the issue of measuring not
accurate and not repeatable.
2.5.11 Effect of system shape Static phenomenon can also be affected by the shape of charged surface and the
arrangement of nearby conductors. For example, the electrical field outside a yarn is 4πσ
(σ is charge density), if gaseous discharging happen, it requires 4πσ=30 KV (dielectric
strength of air). Therefore, the discharging requires σ to be 8 e.s.u./cm2. However, this
52
calculation has error in experiment, because usually the field force lines are not uniform
in one direction. If the electrified surface has a small radius of curvature, the emerging
field force line will diverge rapidly and the field will fall rapidly with distance from the
charged surface, which reduce its ability to break the air. Therefore, the required charge
density for air breaking should be higher than the calculated value. Medley (1954) predicted
the charge distribution around a yarn section, which was close to the contact/separation
point with a metal roller. He summarized that the charge distribution was related to the
shape of charged surface and the placing of nearby conductors. In the present work, static
generation and dissipation on the same polymer but different shapes will be investigated
and compared. On the other hand, the nearby conductors may affect the field distribution.
The static can adjacent to nearby surface electrodes even without contact (Baum, Lewis, &
Toomer, 1977). Therefore, in the present work, the bodies of static generation apparatus are all
well grounded and their structures are kept consistent for each test.
2.5.12 Effect of yarn blending It has been proved that a judicious combination of fibers from the triboelectric series can
effectively reduce the static problem (Ballou, 1954). This was first noticed in textile
processing that static was influenced by the blend ratio of different fibers. Then spun
yarns of different compositions of nylon and Dacron were tested on purpose by rubbing
against chrome-plated surface. It was found that no net charge observed somewhere
between 40% and 50% nylon content as shown in Figure 2.23. Even though there are a
large number of positive and negative charges, the blend is essentially static-free. This
phenomenon was also seen when rubbing the same yarns against cotton and around 75%
nylon is required for neutrality as shown in Figure 2.24. It was explained by the reason
that, in the electrostatic series, cotton has a position in between nylon and Dacron, which
means that some blend composition of nylon and Dacron should be neutral to cotton.
This was also observed that none of the compositions of nylon and Dacron polyester
could be neutral to wool because wool is even above nylon in the series. Table 2.9
summarized the yarn components, rubbing materials, and the optimum fiber blend when
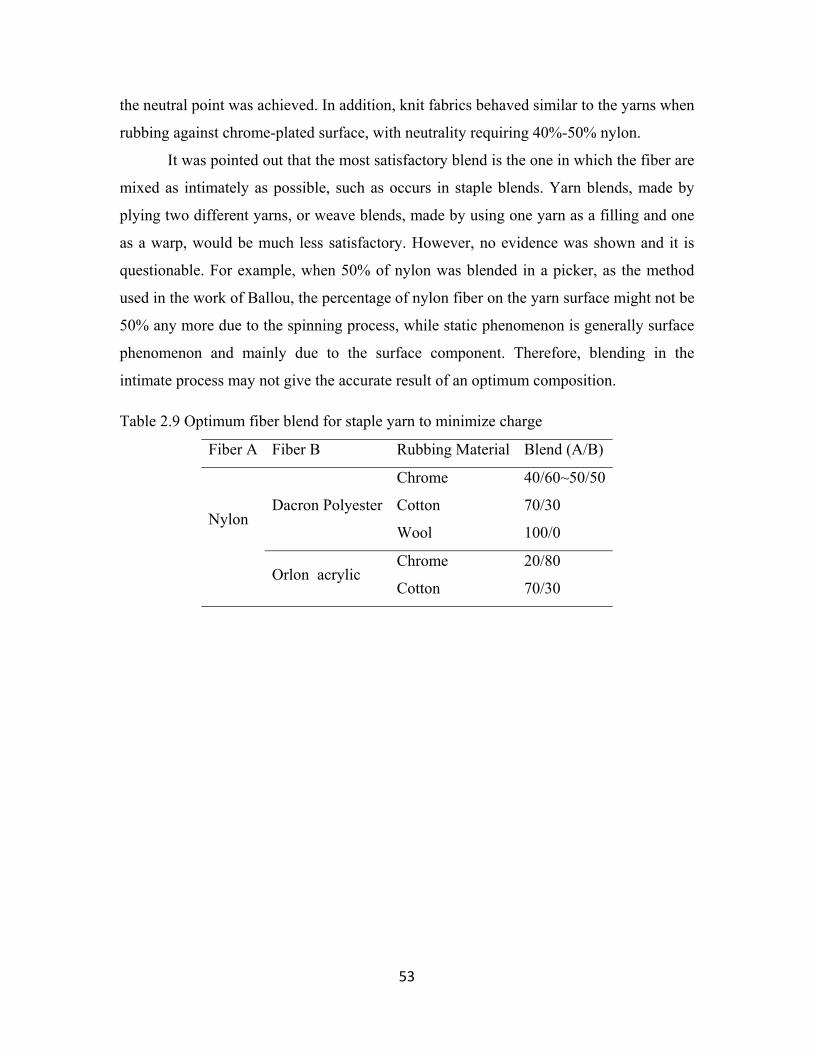
53
the neutral point was achieved. In addition, knit fabrics behaved similar to the yarns when
rubbing against chrome-plated surface, with neutrality requiring 40%-50% nylon.
It was pointed out that the most satisfactory blend is the one in which the fiber are
mixed as intimately as possible, such as occurs in staple blends. Yarn blends, made by
plying two different yarns, or weave blends, made by using one yarn as a filling and one
as a warp, would be much less satisfactory. However, no evidence was shown and it is
questionable. For example, when 50% of nylon was blended in a picker, as the method
used in the work of Ballou, the percentage of nylon fiber on the yarn surface might not be
50% any more due to the spinning process, while static phenomenon is generally surface
phenomenon and mainly due to the surface component. Therefore, blending in the
intimate process may not give the accurate result of an optimum composition.
Table 2.9 Optimum fiber blend for staple yarn to minimize charge
Fiber A Fiber B Rubbing Material Blend (A/B)
Nylon
Dacron Polyester
Chrome 40/60~50/50
Cotton 70/30
Wool 100/0
Orlon acrylic Chrome 20/80
Cotton 70/30

54
Figure 2.23 Blends of nylon-Dacron polyester staple-charge developed against chrome-
plated surface.
Figure 2.24 Blends of nylon-Dacron polyester staple-charge developed against cotton

55
2.5.13 Effect of surface components and structure The electrostatic properties of polymers are decided by their surface chemical
components. The Xerox Corporation investigated the static polarities of series of
substitute styrene and n-butyl methacrylate copolymers. They found chemical groups,
like NH2, OCH3, CH3, C2H5, OH, H, are electron repelling, which causes the surface be
positively charged. Some chemical groups, like Cl, Br, I, COCH3, NO2, are electron
attracting, which made the surface charged negatively.
Many works have been done in this field, for example, Hays (1974) found the
contact charging between polyethylene and liquid mercury increased a lot when it was
exposed to ozone. For another example, Lowell and Brown (1980) found polyvinyl
alcohol was charged positively in contact with metals. However, after the surface OH
group was converted to halogen (F, Cl, Br, and I), it was negatively charged under the
same condition. Furthermore, Gibson et al (1979) found a linear relationship between the
charging amount of polymer and the mole percent conversion to its substituted version.
In addition to the surface’s chemical components, their structures are also
important, which governs whether it is easy for the chemical segments to break to
participate in the charge exchanging. As mentioned in electronic transfer mechanism, the
surface impurities proved donor or acceptor energy states for the electron exchanging.
Some of impurities come from the environment; some of them are intrinsic, which are
segments loosed from the polymer chains. Lowell and Rose-Innes (1980) gave the
sources of intrinsic impurities for different structures as shown in table 2.10.
Table 2.10 Intrinsic impurities for different structures (1980)
Structure Intrinsic Impurities
Covalently bonded crystals Dangling bonds
Ionic crystal Perturbed orbital isolated ions
Molecular solids Weak molecular interactions
In the present work, it is considered that polymer surfaces are typical molecular
solids composed of irregular crystalline and amorphous area. It is much easier for the
segment to break in the amorphous area then in the crystalline area. Therefore, polymers

56
structures of more amorphous area may have more intrinsic impurities on their surface,
which make them easier to be charged, vice versa. The general agreement of the
materials’ crystallinity used in the present work is shown in Table 2.11. The static
accumulation on these polymers will be observed to find the effect of their structure.
Table 2.11 Fiber crystallinity (Morton & Hearle, 2008)
Material Crystallinity (%) Nylon 40 PET 40 PP 80
2.5.14 Triboelectric series Despite the complicated effects, it is possible to arrange materials in a “triboelectric
series” from rubbing plants of materials against each other. With the triboelectric series,
it is easy to figure out the charge polarity in contact or rubbing with another material.
Materials at the top of the series (positive end) will charge positively when rubbed
against those lower (negative end) in the series. Table 2.12 shows triboelectric series
developed by different researchers, where the series established by Hersh and
Montgaomery was cited in literatures most frequently.
Most of the work for determining the electrostatic series was made by asymmetric
rubbing rather than by contact (Lehmicke, 1949) (Ballou, 1954). There are a few conflicts
between different people’s series, for example, the sequence between wool and nylon, but
most of the results agreed with each other. One thing need to be noted is that fibers
containing amide groups, for example, wool, nylon, and silk, are at the positive end of the
series, and hydrocarbons and halogenated hydrocarbons, such as polyethylene and Saran
(PVC) are at the negative end. Wool, silk, and nylon have significantly higher dielectric
constants than that of polyethylene and Saran.
Most of the triboelectric series only gave the information on charge polarity, but
did not conclude on the difference of charge magnitude when rubbing against different
materials. However, it is mentioned in some research (Welker, Nagarajan, & Newberg,
2006) that, if two materials were contact and separated, the charge magnitude would

57
probably be greater if two materials are farther away from each other in the triboelectric
series.
Table 2.12 Triboelectric series
Smith, East, Brown and Wake(1988)
Tsuji and Okada (1985)
Hesh and Montgomery (1955)
Coehn (1898)
Henniker (1962)
Adams (1987)
Diaz and Felix-Navarro(2004)
Wool* Glass Wool Nylon 6.6 Silicone elastomer
Air Poly(vinyl-2-pyridine)
Hercosett wool
Nylon 6.6
Nylon Cellulse Voroslicate glass
Human hands
Nylon 6.6
Nylon 6.6 Nylon 6 Viscose Cellulose acetate
Window glass
Asbestos
Polyvinyl alcohol
Nylon 6 Wool Cotton Polymethyl methacrylate
Aniline-formol resin
Rabbit fur
Polycinyl acetate
Silk Silk Silk Polyacetate Polyformaldehyde
Glass
Polymethyle methacrylate
Regenerated cellulose
Viscose Acetate Poly(ethylene terephthalate)
Polymethl methacrylate
Mica Polycarbonate
Cotton Vinylon (PVAlc)
Lucite (PMMA)
Polyacylonitrile EtylcelluloseHuman hair
Polystyrene
Poly(vinyl alcohol)(PVAlc)
Acrilan (Acrylic)
PVAlc Polyvinyl chloride
Polyamide 11 Nylon Polypropylene
Chlorinated wool
Steel Dacron (Polyester)
Polybisphenol carbonate
Polyamide 6.6
Wool Polyimide
Cellulose triacetate
Cotton Orlon (Acrylic)
PolychloroetherRock salt (NaCl)
Fur Polyethylene terephtalate
Calcium alginate
Orlon (Acrylic)
PVC Polyvinylidine chloride
Melaime formol
Lead Polyvinyl chloride
Acrylic Acetate Dynel (VC/AN)
Poly(2,6-dimethy polyphenylene oxide
Wool Silk Polytetrafluoroethylene
Cellulose acetate
Dynel (VC/AN)
Velon (VDC/VC)
Polystyrene Silica Aluminum

58
Table 2.13 Continued
Polytetrafluoroethylene (PTFE)
Saran (PVDC)
Polyethylene
Polyethylene Silk Paper
Polyethylene Rhovyl (PVC)
Teflon (PTFE)
Polypropylene Polyethylene glycol succinate
Cotton
polypropylene Rubber
Cellulose acetate
Steel
Poly(ethylene terephthalate)
Polyethylene glycol adipate
Wood
Poly(1,4-butylene terephthalate)
Polydiallyl phthalate
Amber
Modacrylic
Cellulose acetate
Sealing wax
Chlorofibre
Sponge Hard rubber
Cotton
Nickel, Copper
Polyurethane elastomer
Brass, Silver
Styrene-acrylomitrile copolymer
Gold, Platinum
Styrene-butadiene copolymer
Sulfur
Polystyrene
Acetate, Rayon
Polyisobutylene
Polyester
Polyurethane sponge
Styrene (Styrofoam)
Borosilicate glass
Orlon
Polyethylene glycol terephthalate
Saran
Polyvinyl butyral
Polyurethane

59
Table 2.14 Continued
Formo-phenolique
Polyethylene
Eposide resin
Polypropylene
Polychlorobutadiene
Vinyl (PVC)
Butadiene-acrylonitrile copolymer
Silicon
Natural rubbber
Teflon
Polyacrilonitrile
Sulfur Polyethylene
Polydiphenylol propane carbonate
Chlorinated polyether
Polyvinyl chloride
Polytrifluorochloroethylene
Polytetrafluoroethylene (PTFE)
2.5.15 Anti-static technology in textiles An antistatic agent is a compound used for treatment of materials or their surfaces in
order to reduce or eliminate buildup of static electricity generally caused by the
triboelectric effect.
While there has been considerable discussion concerning the controlling of static
through the use of ionizing atmosphere or through air conduction, the most prevalent
approach for the static controlling in fibers and plastics is to modify the surface. There
are mainly two methods: treatment by antistatic agent and incorporating with conductive
fibers. For the antistatic agents, they can reduce the static by being conductive themselves,

60
or by absorbing moisture from the air. Most of the antistatic agents are kinds of
surfactants, which are composed of hydrophilic and hydrophobic parts. The hydrophobic
side interacts with the surface of the material, while the hydrophilic side interacts with
the air moisture and binds the water molecules to improve the static dissipation. If the
introduction of agents is by chemical bonding, it requires the modification should not
affect the original property of the material. If the introduction is just coating without
chemical reaction, it needs to be strongly attached on the surfaces (Holme, McIntyre, &
Shen, 1998).
Conductivity of a fibrous assembly can be improved by incorporating conductive
fibers such as carbon, copper, steel, silver, etc. or using fibers, which have been “treated”
with metallic salts (Holme, McIntyre, & Shen, 1998). A recent alternative is the use of bi-
component fibers where one component is conductive (Bharat, 2005) and there is
currently a lot of interest in the use of fibers containing carbon nanotube (Puetz &
Aegerter) (Lo, Li, Yeung, & Yuen, 2007).
Plasma treatment can be used to improve the anti-static property of textiles. After
the plasma treatment, people have found the polyester surface was seriously etched,
which provided more capacity of the surface to capture moisture and hence to increase
the static dissipation. Moreover, because oxygen-containing polar groups were
introduced by plasma treatment onto the surface, which could incorporate with moisture
through hydrogen bonding and help moisture penetration, therefore, enhanced
electrostatic dissipation (Kan & Yuen, 2008). The antistatic mechanism of plasma
treatment is very different from the agents coating or conductive fiber blending. It is
environmentally friendly, but it is higher cost now.
There are specialized anti-static performance apparel products. The static on
human body is especially dangerous because the high conductivity of body and the large
capacitance of clothing-body system. Therefore, most of the antistatic apparels are
grounded by electrical continuity across all fabric panels, which are connected to a
ground cord (Bharat, 2005). Kowalski et al. summarized some principles of static
protection, and different evaluation systems and standards (Kowalski & Wroblewska,
2006).

61
The study of conductive fibers or plasma treatment for static control is not within
the scope of the present work. However, when considering the effect of topical applied
agents, though it has been widely recognized that minor changes in the composition can
lead to significant changes in the static accumulation, there have been no systematic
studies in this topic. The present project will apply non-ionic, cationic, and anionic agents
on polymer surfaces at different concentration to observe their static phenomenon, which
can provide constructive suggestions for the industry cooperators and may open the
possibility of completely new approaches to the control of static in fiber processing
environment.
REFERENCES
Anti-Static Technology in performance Apparel. (2005). Technical Textile Markets , 4.
Armstrong-Helouvry, B. (1991). Control of machines with friction. Norwell: Kluwer Academic Publishers.
ESD association standard for the development of an electrostatic discharge control program for - protection of electrical and electronic parts, assemblies and equipment. New York: Electrostatic Discharge Association.
ASTM D 4470-97 Standard test method for static electrification. (n.d.).
Awakuni, Y., & Calderwood, J. H. (1972). Water Vapor Adsorption and Surface Conductivity in Solids. J. Phys. D: Appl. Phys. , 5, 1038.
Ballou, J. W. (1954). Static Electricity in Textiles. Text. Res. J. , 24 (2), 146-155.
Baum, E. A., Lewis, T. J., & Toomer, R. (1977). Decay of Electrical Charge on Polyethylene Films. J. Phys. D: Appl. Phys , 10, p. 487.
Bauser, H. (1974). Static electrification of organic solids. Dechema Monograph , 72, 11-28.

62
Briggs, D. (1979). The Role of Modern Surface Analysis Techniques in Understanding Electrification Phenomenon. In D. Briggs (Ed.). The Institute of Physics.
Cardona, P. Y. (2001). Fundamentals of Semiconductors (3rd Edition ed.).
Castle, P. (2004). Contact Charging between Metals Revisited. 40 (5).
Castle, P. G. (1997). Contact Charging between Insulators. Journal of Electrostatics , 40-41, 13-20.
Charles, D. H., & Norbert, A. L. (1925). Handbook of Chemistry and Physics 10th Edition. Cleveland, OH: Chemical Rubber Publishing Co.
Chowdry, C. R., & Westgate, A. (1974). The Role of Bulk Traps in Metal Insulator Charging. 7, 713-725.
Chubb, J. (2002). New Approaches for Electrosatic Testing of Materials. 54, 233-244.
Clark, T. D., & Feast, J. W. (1978). Polymer Surfaces. New York: John Wiley & Sons.
Coste, J., & Pechery, P. (1981). Influence of Surface Profile in Polymer-Metal Contact Charging. 10, 129-136.
Cowley, A. M., & Sze, S. M. (1965). Surface States and Barrier Height of Metal-Semiconductor Systems. Journal of Physics , 36, 3212.
Cunningham, S., & Goodings, A. (1986). Plastic Deformation and the Transfer of Electrostatic Charge between Metals and Polymers during Repeating-Contact Experiments. J. Electrostatics , 18, 103.
Davies, D. K. (1978). Corona Charging and the Piezoelectric Effect in Polyvinylidene Fluoride. J Appl Phys , 49, 4601-4603.
Davies, D. K. (1967). The Examination of the Electrical Properties of Insulators by Surface Charge Measurements. 44, 521-524.
Davis, D. K. (1970). Charge Generation on Solids. Adv. Static Electricity (1), 10.
Diaz, S., Fenzel-Alexander, D., Wollmann, D., & Eisenberg, A. (1991). Effect of Ionomer Ion Aggregation on Contact Charging. J. Polyms. Sci. Polym. Phys. , 29, 1559.
Dielectric Constant Reference Guide. (n.d.). Retrieved from http://www.clippercontrols.com/info/dielectric_constants.html#P

63
Fabish, T. J., & Duke, C. B. (1977). Molecular Charge States and Contact Charge Exchange in Polymers. J. Appl. Phys. , 48, 4265.
Field, R. F. (1946). The Formation of Ionized Water Films on Dielectrics under Conditions of High Humidity. J. Appl. Phys. , 17, 318.
Gas Gupta, K. D., & Doughty, K. (1978). Corona Charging and the Piezoelectric Effect in Polyvinylidene Fluoride. J Appl. Phys , 49, pp. 4601-4603.
Gibbings, J. C. (1975). On the Fitting of Exponential Curves to Experimental Results. Journal of Electrostatics , 187-192.
Gibson, H. W., Bailey, F. C., Mincer, J. L., & Gunther, W. H. (1979). Chemical Modification of Polymers: XII Control of Triboelectric Charging Properties of Polymers by chemical Modification. 17, 2961-2974.
Greason, W. D. (2000). Investigation of a Test Methodology for Triboelectrification. Journal of Electrostatics , 49, 245-256.
Gupta, S. B. (2007). Friction in textile materials. London: Woodhead.
Hanton, W. A. (1924). Mechanics of Textile Machinery. Manchester: Longmans.
Harper, W. R. (1957). The generation of static charge. Advances in Physics , 6 (24), 365-417.
Hays, D. A. (1974). Contact Electrification between Mercury and Polyethylene: Effect of Surface Oxidation. 61, 1455-1462.
Hays, D. A. (1991). Fundamentals of Adhesion. New York: L.H. Lee Ed. Plenum Press.
Hays, D. A., & Donald, D. K. (1971). Effect of an Electrific Field on the Contact Electrification of Polymers by Mercury. Conference on Electrical Insulation and Dielectric Phenomena.
Hearle, J. W. (1953). The electrical resistance of textile materials: I.the influence of moisture content. Journal of the Textile Institute Transactions , 44 (4), 117-143.
Hearle, J. W. (1953). The electrical resistance of textile materials: II.the effect of temperature. Journal of the Textile Institute Transactions , 44 (4), 144-454.
Hearle, J. W. (1953). The electrical resistance of textile materials: IV.theory. Journal of Textile Institute Transactions , 44 (4), 177-198.

64
Henry, H. P. (1957). Overseas conference-static electricity in textiles. Journal of Textile Institute , 48 (1), 4-122.
Hersh, S. P., & Montgomery, D. J. (1956). Static Electrification of Filaments-Theoretical Aspects. Text Res J , 26, 903-913.
Holme, I., McIntyre, J. E., & Shen, Z. J. (1998). Electostatic Charging of Textiles. Textile Progress , 28 (1), 1-84.
Homewood, K. P., & Rose-Innes, A. C. (1979). The Effect of Contact Time on the Electrification of Polymer by Metals. 48. Inst. Phys. Conf. Ser.
Howell, G. H., Mieszkis, W. K., & Tabor, D. (1959). Friction in textiles. New York: Textile book publishers in association with the Textile Institute.
Ieda, S. M., & Shinohara, U. (1967). A Decay Process of Surface Electric Charges Across Polyethylene Film. Japanese Journal of Applied Physics , 6, 793-794.
Intelligence, T. (2005). Anti-Static Technology in Performance Apparel. Technical Textile Markets , 4.
Kan, C. W., & Yuen, C. W. (2008). Static Properties and Moisture Content Properties of Polyester Fabrics Modified by Plasma Treatment and Chemical Finishing. Nuclear Instruments and Methods in Physics Research B , 266, 127-132.
Kanarek, J., & Tan, W. (1998). A primer on static control plastics-part 1. Wescorp Corporation Newsletter . Wescorp World.
Keijo, O. (1988). A Method of Exponential Function Analysis of Contact and Frictional Electrification Curves. Journal of Electrostatics , 319-326.
Komatsu, T. S., Hashimoto, M., Arakawa, I., & Nasuno, S. (2004). Static Electrification by Asymmetric Rubbing. Applied Surface Science , 235 (1-2), 60-64.
Kowalski, J. M., & Wroblewska, M. (2006). Premises for Practical Evaluation of the Anti-electrostatic Properties of Protective Garments. Fibers and Textiles in Eastern Europe , 14 (5), 59.
Krupp, H. (1971). Physical Models of the Static Electrification of Solids. IOP Conf. Ser.
Kwetkus, B. A., Sattler, K., & Siegmann, H. C. (1992). Gas Breakdown in Contact Electrification. J. Phys. D.: Appl. Phys. , 25, 139.

65
Labadz, A. F., & Lowell, J. (1986). Contact Charge Density and Penetration Depth. J. Electostatics , 18, 103.
Lee, L. (1994). Dual Mechanism for Metal-Polymer Contact Electrification. Journal of Electrostatics , 32, 1-29.
Lee, L. H. (1978). A Surface Interaction Model for Triboelecrifiction of Toner-Carrier. Photo. Sci. Eng. , 22, 228.
Lehmicke, D. J. (1949). Static in Textile Processing. Am. Dyes., Rptr. , 38 (24), 853.
Lewis, A. R. (1999). Dielectrics.
Lo, L. Y., Li, Y., Yeung, K. W., & Yuen, C. W. (2007). Indicating the Development Stage of Nanotechnology in the Textile and Clothing Industry. International Journal of Nanotechnology , 4 (6), 667-679.
Lowell. (1984). Charge Accumulation by Repeated Contacts of Metals to Insulators. J. Phys. D.: Appl. Phys. , 17, 1859.
Lowell. (1991). Mechanisms of Contact Charging and Charge Accumulation: Experiments on Soda Glass. J. Phys. D: Appl. Phys. , 24, 375.
Lowell, J., & Rose-Innes, A. C. (1980). Contact Electrification. Adv. Phys. , 29, 947-1023.
Lyne, G. D. (1955). Fiber friction. Journal of Textile Institute , 46 (1), 3-136.
Ma, Z. Y., & Dickinson, J. T. (1991). Fracto-emission from Embedded Intergaces. J. Appl. Phys. , 70, 4797.
Medley, J. A. (1950). Frictional Electrification and Gaseous Discharge . Nature , 166, 524.
Medley, J. A. (1954). The Discharge of Electrified Textiles. 45 (2).
Mizes, H. A., Conwell, E. M., & Salamida, D. P. (1990). Direct Observation of Ion Transfer in Contact Charging between a Metal and a Polymer. Appl. Phys. Lett. , 56, 1597.
Morton, W. E., & Hearle, J. W. (2008). Physical Properties of Textile Fibres. Cambridge, England: Woodhead Publishing in association with the Textile Institute .
Nemeth, E., Albrecht, V., & Schubert, G. (2003). Polymer Tribo-electric Charging: Dependence on Thermodynamic Surface Properties and Relative Humidity. Jounrnal of Electrostatics , 3 (16).
66
Niels, J. (1998). Electrostatics. New York: International Thomson Publishing.
Ohara, K. (1980). Relationship between Frictional Electrification and Molecular Motion of Polymers. J. Electrostatics , 9, 107-115.
Ohara, K. (1980). Relationship between Frictional Electrification and Molecular Motion of Polymers. 9, pp. 107-115. Journal of Electrostatics.
Ohara, K., Nakamura, I., & Kinoshita, M. (2001). Frictional Electrification between Flat Surfaces of Polymers and of Langmuir-Blodgett Layers. Journal of Electrostatics , 51-52, 351-358.
Owen, M. J. (1990). Electrostatic discharge control. New York: McGraw-Hill Publishing Company.
Paschen, F. (1889). Ueber die zum Funkenübergang in Luft, Wasserstoff und Kohlensäure bei verschiedenen Drucken erforderliche Potentialdifferenz. Annalen der Physik , 5, pp. 69-75.
Pascoe, M. W., & Tabor, D. (1956). The Friction and Deformation of Polymers. A235 (210).
Patterson, J. D., & Bailey, B. C. (2007). Solid-state physics : introduction to the theory. Berlin : Springer.
Pethig, R. (1983). The Physical Characteristics and Control of Air Ions for Biological Studies. J Bioelectricity , pp. 15-35.
Puetz, J., & Aegerter, M. A. Chemical Nanotechnology for Transparent Conducting Coating on Thin-glass and Plastic-foil Substrates. Journal of the Society for Information Display , 13 (4), 321-328.
Rigden, J. S. (1996). Macmillan Encyclopedia of Physics. Simon & Schuster.
Robins, E. S., Rose-Innes, A. C., & Lowell, J. (1975). Are Adsorbed Ions Involved in the Contact Charging between Metals and Insulators? 27. Inst. Phys. Conf. Ser.
Rose, S. G., & Ward, G. S. (1957). Contact Electrification Across Metal-Dielectric and Dielectric-Dielectric Interfaces. J Appl. Phys. , 121.
Rose-Innes, A. C., & Homewood, K. P. (1982). An Accumulation of Contact Charge on Insulators Repeated Touched by Metals. J. Phys. D., Appl. Phys. , 15, 2283.
Rose-Innes, A. C., & Lowell, J. (1980). Contact electrification. 29, 947-1023.

67
Ruckdeschel, R. F., & Hunter, P. L. (1977). Thermionic return currents in contact electrification. Journal of Applied Physics , 48 (12), 4898-4902.
Sawa, G., & Calderwood, J. H. (1971). Dependence of surface Conduction Current in Oxidized Polyethylene on Electric Field at Various Humidities. J. Phys. C: Solid St. Phys. , 4, 2313.
Sereda, P. J., & Feldman, R. F. (1964). Electrostatic charging on fabrics at various humidities. 55 (5), T288-T298.
Serway, R. A., & Jewett, J. W. (2007). Physics for Scientists and Engineers, 7 edition. Brooks Cole.
Taylor, D. M., & Secker, P. E. (1994). Industrial Electrostatics: Fundamentals and Measurements. Tanton, Somerset, England: Research Studies Press; New York: J. Wiley.
Tipler, P. A. (1987). College Physics. Worth.
Welker, R. W., Nagarajan, R., & Newberg, C. E. (2006). Contamination and ESD control in high-technology manufacturing. New Jersey: John Wiley & Sons, Inc.
Welker, R. W., Nagarajan, R., & Newberg, C. E. (2006). Contamination and ESD Control in High-technoogy Manufacturing. New Jersey: Wiley & Sons, Inc.
Wikipedia_Humidity. (n.d.). Retrieved from http://en.wikipedia.org/wiki/Humidity
Yager, W. A. (1947). Digest on Literature on Dielectrics (Vol. X). Murray Hill, NJ: Bell Telephone Laboratories.
Yu, Z. Z., & Watson, P. K. (1989). Contact Charge Accumulation and Reversal on Polystyrene and PYFE Films upon Repeated Contacts. Journal of Physics D: Appl. Phys. , 798.
Zimmer, E. (1970). Electrostatic Charging of High-Polymeric Insulating Materials. 60, 465-468.
Zimmerman, K. A., Langford, S. C., & Dickson, J. T. (1991). Electrical Transients during Interfacial Debonding and Pullout of a Metal Rod from an Epoxy Matrix. J. Appl. Phys. , 70, 4808.

68
3 OBJECTIVES
69
The literature review indicates that despite of plenty of research in the area of
electrostatic generation and control, there has not been a universally agreed explanation
regarding the mechanism of static generation and dissipation, and there are still questions,
which have not been answered, such as:
Does rubbing speed affect charge generation on polymers?
What is the effect of contact force between two surfaces on contact and frictional
electrification?
Is charge generated on nylon higher than that generated on the other polymers,
such as PP and PET?
Does charge on polymeric surfaces decay exponentially?
What is the difference of antistatic effect of nonionic, cationic, and anionic
finishes, when they are applied on polymer surfaces?
What is the minimum concentration of surface finish required to control static on
polymer surface?
The literature review also indicates that there are discrepancies among published
research, For example, nylon was generally positively charge after rubbing against
stainless steel, however, it was sometimes negatively charged (London, 1966). Another
example, charge was not always increased with rubbing speed (Hersh and Montgomery,
1955). Possible explanations for those disagreements are the differences in sample
preparation, experimental procedures, and coupling effect with the level of accuracy of
the systems used. The literature review on the measurement of electrostatic generation
and dissipation (section 2.5) disclosed a number of drawbacks:
Initial surface cleaning procedures (prior to testing) were not emphasized (or not
mentioned) in their reports (Hubbard, 1967) (Robins, Rose-Innes, & Lowell, 1975)
(London, 1966) . However, the sample cleaning is a critical issue because even
one molecular layer of contamination could dramatically change the surface’s
electrification properties (ASTM 4470-97);
Calibration for charge detecting devices was not mentioned in those reports
(Medley, 1954) (Ohara K. , 1980) (Hersh & Montgomery, 1956). However, static

70
signal are extremely sensitive and thus the detecting devices must be calibrated
regularly under the same environmental conditions as formal testing.
The testing conditions were established by sealed chambers using different
chemical solutions to vary humidity, which might be limiting (London, 1966)
(Medley, 1954);
Manual testing for contact or rubbing is susceptible to subjective error (Chubb,
2002, Sereda and Feldman, 1964);
The accuracy of the measurement is questionable due to the manual transfer of
sample to the measuring unit (Chubb, 2002, Sereda & Feldman, 1964);
Charge generated on sample surface was predicted from charge measured on
another material, which is connected with or contacted against the sample.
However, this could not reflect the real charge generated on sample surface since
different surfaces have different charge capacities and resistance (Robins, Rose-
Innes, & Lowell, 1975).
Last but not the least, the devices and procedures used were very complicated and
this could have led to reduced accuracy and questionable repeatability of results
(Ohara, 1980, Hersh and Montgomery, 1955).
Those discrepancies reported on electrification of polymers and the limitations of
previous studies promoted the undertaking a more comprehensive research in this area,
using advanced charge detecting devices, motion control systems, environmental control
system, and consistent sample preparation and testing procedures.
The overall goal of this project is to obtain a better understanding of the
mechanism of static behavior of polymeric surface, and to find the effects of different
parameters, such as the rubbing speed, contact force, relative humidity, temperature, and
surface finishes, on static generation and dissipation of commonly used polymers in
textiles. This work is expected to provide the industry with evaluation techniques that
support the development of polymeric products with enhanced processing and
performance properties.
The objectives are achieved through conducting experiments using three devices,
a linear tester, a rubbing tester, and a contact tester. The devices and signal analysis are
71
described in Chapters 4, 5, and 6. Utilizing the devices, the effects of different parameters
on charge generation and dissipation were studied. Chapter 4 discusses the effect of
rubbing speed on charge generated between yarn and pin. Chapter 5 discusses the effects
of rubbing speed and contact force on frictional electrification between parallel polymeric
surfaces. Chapter 6 investigates the effects of contact force, relative humidity, and
temperature on contact electrification between polymeric surfaces. In addition, Chapter 7
discusses both the contact and frictional electrification of polymeric surfaces after they
are treated by three types of antistatic finishes.

72
4 FRICTIONAL ELECTRIFICATION OF YARN AND PIN
This chapter is modified from a manuscript entitled “Effect of relative rubbing speed on
the tribo-electrification of continuous filament yarn by stainless steel pin”, by L. Liu, W.
Oxenham, A. M. Seyam, and T. Theyson, which has been accepted by the Journal of
Textile Institute.

73
4.1 Introduction In the textile industry, a considerable amount of static may be generated whenever fibres,
yarns, or fabrics rub over another solid. It creates hazards, affects the quality of products
and the efficiency of manufacturing processes. To minimize the impact of static
electrification, it is necessary to obtain a better understanding of mechanisms involved in
charge generation and dissipation. A particular issue of importance to the current study is
the question whether rubbing speed plays an important role in the tribo-electrification of
yarns.
While a full review of previous work is given in Chapter 2, it was believed useful,
to briefly include those of direct relevance to the present study. The mechanism of
electrostatics was first developed by Harper (1957) and confirmed experimentally by
Lowell and his colleagues (1980) who established the theory of simple contact charging
between two metals. Attempts at better understanding of the contact charging of
insulators was much more difficult, especially in the case of polymeric surfaces, which
are irregular, not 100% crystalline, and usually contain “impurities”. Furthermore, it was
found that charge could flow back from the insulator to the metal after charge generation,
which caused the discrepancy between most theoretical and experimental results (Castle
1997).
Another difficulty for understanding the electrostatic phenomenon is that the
tribology theory is complex, which in turn means that frictional charging is more
complicated than simple contact charging. It is known that when two surfaces contact,
real contact only occurs at the tips of their asperities. When sliding occurs, the real
contact junctions will be sheared. The real contact area is related to the surfaces’
roughness and the asperities’ deformation properties (Howell, Mieszkis, & Tabor 1959,
and Gupta, 2009). As to the complex effect of speed on friction, it was found for
example, that for lubricated yarns, the coefficient of friction increased when the rubbing
speed increased. This is a practical example of the added complication introduced by
additives (essentially deliberately applied “impurities”) which mean that some
consideration must also be given to the influence of hydrodynamic factors (Lyne, 1955).
Additionally, it is also interesting to note that friction could be reduced by modulating
74
vibration (Armstrong-Hélouvry, 1991), which is a factor that is of significance in a
moving thread line. For those approaches applied to reduce friction, their ultimate goal is
usually to control the electrostatic charging and reduce wear or surface attrition of the
various component surfaces. While there is much work on friction and on static
electrification, the correlation between these is still not well understood.
Previous researchers have investigated the effect of rubbing speed on tribo-
electrification of polymers by rubbing yarns against metals or by rubbing yarns against
each other (Hersh and Montgomery, 1955, London, 1966, Ohara, 1980, Komatsu, 2004).
It is evident that their reported observations were not consistent and in some cases
conflict with each other. Possible explanations for this disparity are the differences in
experimental procedures (equipment and measuring techniques) coupled with the
accuracy of the systems used. First, initial surface cleaning and conditioning procedures
(prior to testing) were not emphasized (or not mentioned) in their reports. This is a
critical issue because even one molecular layer of contamination could dramatically
change the surface’s electrification properties (Ohara, 2001). Secondly, calibration for
charge detecting devices was not mentioned in those papers, however, static signal are
extremely sensitive and thus the detecting devices must be calibrated regularly under the
same environmental conditions as formal testing. Thirdly, the testing conditions were
established by sealed chambers using different chemical solutions to vary humidity,
which might be limiting. Last but not the least, the devices and procedures used were
very complicated and this could have led to reduced accuracy and questionable
repeatability of results.
The discrepancy reported on tribo-electrification of polymers and the limitations
of the devices used in previous studies prompted a series of projects to undertake some
more comprehensive research in this area. The overall goal of this research is to obtain a
better understanding of the mechanism of static electrification on polymeric surfaces
based on experiments, and to relate these findings to the static charge issues in textile
processing. In a previous publication (Seyam, Cai, & Oxenham, 2009), a “Linear Tester”
was introduced for measuring the static charge generation and dissipation of continuous
moving yarn when rubbing against a “charging pin”. In another publication (Suh et al.,
75
2010), the developed linear tester was used to investigate the influence of ambient
conditions and processing parameters on the static generation and dissipation on
polyester multifilament yarn when rubbed against a stainless steel pin.
In the present work, the charge pin on the “Linear Tester” has been modified so
that it can now rotate at prerequisite speeds. This allows the study of tribo-electrification
at different levels of relative rubbing speed, together with the role of absolute moving
speed of the yarn and the pin. The study includes the influence of the relative rubbing
speed on the tribo-electrification of different filament yarns when rubbed against
different size stainless steel pins. The multifilament yarns included in the study were
nylon treated with lubricant; finish free nylon; finish free polyester; and finish free
polypropylene.
4.2 Experimental
4.2.1 Equipment and test protocol The “Linear Tester” was modified and used in this work to generate and measure
electrostatic charge on a moving yarn (Figure 4.1). The apparatus consists of a Constant
Tension Transport (CTT) system, a rotating pin (referred to as the charge pin), two
potential probes, a tensiometer, a vibration sensor, and a computer. The CTT unit
(Lawson-Hemphill®) was calibrated and used for transporting yarn at the desired speed
and input tension. The yarn output tension was monitored continuously by an onboard
tensiometer. A stainless steel rotational pin was installed on the CTT, so that it created a
60˚ yarn/pin contact angle with the moving yarn (Figure 4.2). The pin’s rotational speed
could be set at different levels and for each test and the speed was checked with a
tachometer. Two potential probes (Model 1017, Monroe Electronics®) were used to
measure the yarn surface potential. For each run, the probe-to-yarn spacing was adjusted
precisely by the aid of micrometer to 3 mm when the yarn and pin were running and on
the backside of the yarn; grounding metal plates were placed parallel to yarn with a 57
mm spacing. The plates acted as a background of zero potential, shielding the sensor
from any stray electrical fields.

76
The chopped signal inside the probe is proportional to the potential difference
between the yarn surface and the sensor assembly. In the setup described above, an area
of 8 mm diameter in front of the probe was detected at 99% resolution (Monroe
Electronics, Inc., 1991). One of the potential probes was set 3 cm away from the yarn/pin
separation point, which was called probe-I, and the potential it measured was called
potential-I. The other probe was 40 cm away from the yarn/pin separation point, which
was named as probe-II and the potential measured was potential-II. Each probe was
connected to a voltmeter (Model 244A, Monroe Electronics®), which can measure
potential in the range 3 kV for 3 mm probe-to-surface spacing and this can be increased
to 30 kV using a gradient adaptor. The probes and voltmeters were all calibrated before
testing. When the adaptor was used, its position was adjusted based on the manual. The
output of two voltmeters and the tensiometer were input into a computer. In addition to
the charge potential and yarn tension measurement, a piezoelectric sensor (model
303A03, PCB Piezotronics®) was bonded to the pin/motor supporting panel and was used
to monitor any possible vibration in the rotating pin. This precautionary step was taken
since it was considered that unwanted vibrations could result in variations in contact and
thus possible variations in tribocharging. Signals detected were recorded by a computer
and analyzed automatically by SpectraPLUS® software. All equipment was housed inside
an environmental room that can provide temperature and relative humidity control of ±
0.1°C and ± 1.0% RH.
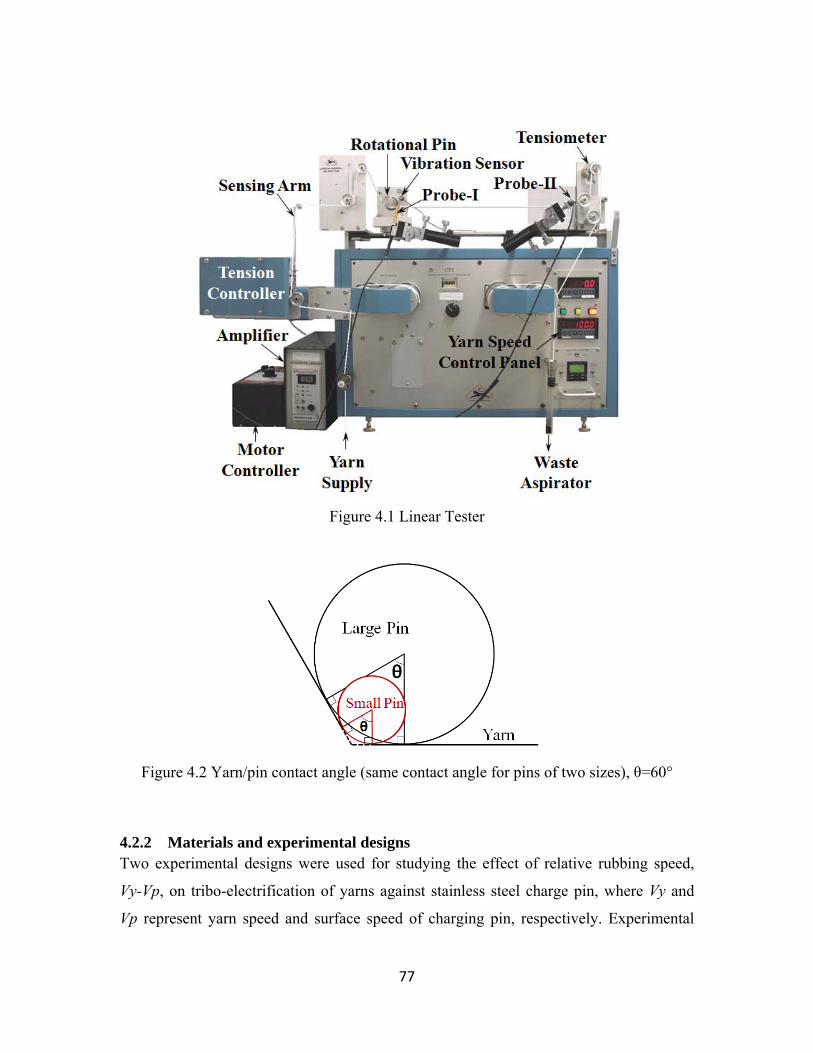
77
Figure 4.1 Linear Tester
Figure 4.2 Yarn/pin contact angle (same contact angle for pins of two sizes), θ=60°
4.2.2 Materials and experimental designs Two experimental designs were used for studying the effect of relative rubbing speed,
Vy-Vp, on tribo-electrification of yarns against stainless steel charge pin, where Vy and
Vp represent yarn speed and surface speed of charging pin, respectively. Experimental

78
design-I was used to investigate the behaviour of nylon with 1.2% anionic commercial
lubricant, when rubbed against two different diameter pins, Dpin (6.35 and 25.4 mm in
diameter), and three levels of yarn transporting speed. This set up facilitated a range of
relative speed (Vy-Vp), since the pin could be rotated either in the same direction as the
moving yarn or in the counter direction to the yarn. Experimental design-II was used to
study finish free yarns of three different polymeric materials, when using a constant pin
size and yarn transporting speed. Table 4.1 and 4.2 list the parameters used in each
experiment.
The yarn used in experiment design-I was 420/72 nylon (420 denier comprised of
72 filaments) and the yarns used in experimental design-II were 200/60 (200 denier /60
filaments). Yarns were pre-tensioned at 0.12 cN/denier (50 cN for experimental design-I
and 24 cN for experimental design-II) and all tests were conducted at a relative humidity
of 43% and temperature of 21⁰C (suggested by AATCC Test Method 84), with all yarn
samples being conditioned for one week prior to testing. The friction pin, rollers and
guides on the CTT machine were all cleaned with ethanol and de-ionizing gas before
running each type of yarn. All tests were conducted in a random sequence. The
measurement responses are potential-I (volt), potential-II (volt), output tension (cN or gf),
and vibration amplitude (dB). The data collection rate for each response was 100
points/second, and sampling time was 20 seconds for each run. Three replications were
carried out for each condition. The calculated responses are contact force (cN), friction
force (cN), coefficient of friction, and vibration force (cN).
Table 4.1 Experimental design-I
Parameters Levels
Pin Diameter (mm) 6.35, 25.4
Vy (m/min) 50, 100, 150
Vy-Vp 1 (m/min) -150, -100, -50, -25, 0; 25, 50, 100, 150

79
1: when the smaller pin was used, six speed levels were not achievable because the
motor’s maximum rotational speed (9140 rev/min) determined the Vp maximum to be
182 m/min.
Table 4.2 Experimental design-II (Dpin: 25.4 mm, Vy: 100 m/min)
Parameters Levels
Materials Nylon, PP, PET
Vy-Vp (m/min) -100, -50, -25, 0, 25, 50, 100
4.3 Calculated responses The contact force, friction force, and coefficient of friction on the yarn section in contact
with pin were calculated from the yarn input and output tensions. The yarn input tension
was set by the CTT machine. Its variation was within ± 3% regardless of the speed of the
yarn or the pin. This was verified by a tensiometer mounted 10 cm before the pin. The
yarn moving speed was also set by CTT and the variation in speed was ± 1%, when a
tachometer was used to track the machine speed. The output tension, monitored by the
tensiometer, changed as the relative speed (yarn to pin) changed. The contact force and
friction force on each point of contact are different; however, the total force on the yarn
section in contact with pin can be calculated by equation [2-1] and [2-2] respectively.
sin /2 [2-1]
cos /2 [2-2]
where, T1 is the absolute value of yarn tension on the looser side (cN or gf); T2 is the
absolute value of yarn tension on the tighter side (cN or gf), θ is the angle of contact
(Figure 2), which is π/3 in this work; N (cN or gf) is the absolute value of contact force
on the yarn section being contacted; and F (cN or gf) is the absolute value of friction
force on the yarn section being contacted. The force diagrams are shown in Figure 4.3.

80
When the yarn/pin relative rubbing speed was negative (Vy < Vp), it was found
that yarn output tension (T1 in Figure 4.3 left) was smaller than the input tension. The
friction force promotes the movement of the yarn, which had the same direction as the
yarn output tension. When the yarn/pin relative speed was positive (Vy > Vp), the yarn
output tension (T2 in Figure 4.3 right) was higher than the input tension (T1 in Figure 4.3
right). The friction force hindered the movement of the yarn so its direction was the same
as the input tension on the yarn.
Figure 4.3 Force diagram analysis on the yarn section contacted with pin when Vy was
smaller than Vp (left) and when Vy was larger than Vp (right)
The coefficient of friction was calculated from the input and output tension by the
Simple Capstan Equation as shown in equation [2-3].
⁄ [2-3]

81
where, µ is the coefficient of friction (dimensionless), θ is the angle of contact (rad),
which is π/3 in this work, T1 is absolute value of yarn tension on the looser side (cN or gf),
and T2 is absolute value of yarn tension on the tighter side (cN or gf).
Additionally, the electrical signal generated by the piezoelectric sensor, was
recorded by the computer. The vibration force (cN) was calculated based on the
piezoelectric sensor’s sensitivity, which is 1cN/10mV.
4.4 Results and analysis
4.4.1 Experimental design-I When 25.4 mm diameter pin was used, the measurement responses (potential-I, potential-
II, yarn output tension, and pin vibration amplitude) and the calculated responses (contact
force, frictional force, coefficient of friction, and vibration force) are shown in Figure 4.4
to 2-13. Each data point represents the average of 6000 readings (three replications for
each condition and 2000 readings in each replica). The error bars with standard
deviations of 6000 readings are also shown in the charts.
Figure 4.4 shows that the yarn surface potential detected by the first probe
(potential-I) is minimal when the yarn/pin relative speed approaches zero. This indicates
that the charge is minimal when the friction between two surfaces is the smallest. The
data in Figure 4.4 is also drawn corresponding to Vy as shown in Figure 4.5 and
corresponding to Vp as shown in Figure 4.6, both of which show that charge was minimal
when Vy was close to Vp. The effect of yarn/pin relative rubbing speed on charge
potential is also confirmed from the data obtained from the second probe (potential-II) as
shown in Figure 4.7. Thus, friction plays a more complicated role in static charging, and
it should not be simply considered as charging by contact and separation (zero yarn/pin
relative rubbing speed).
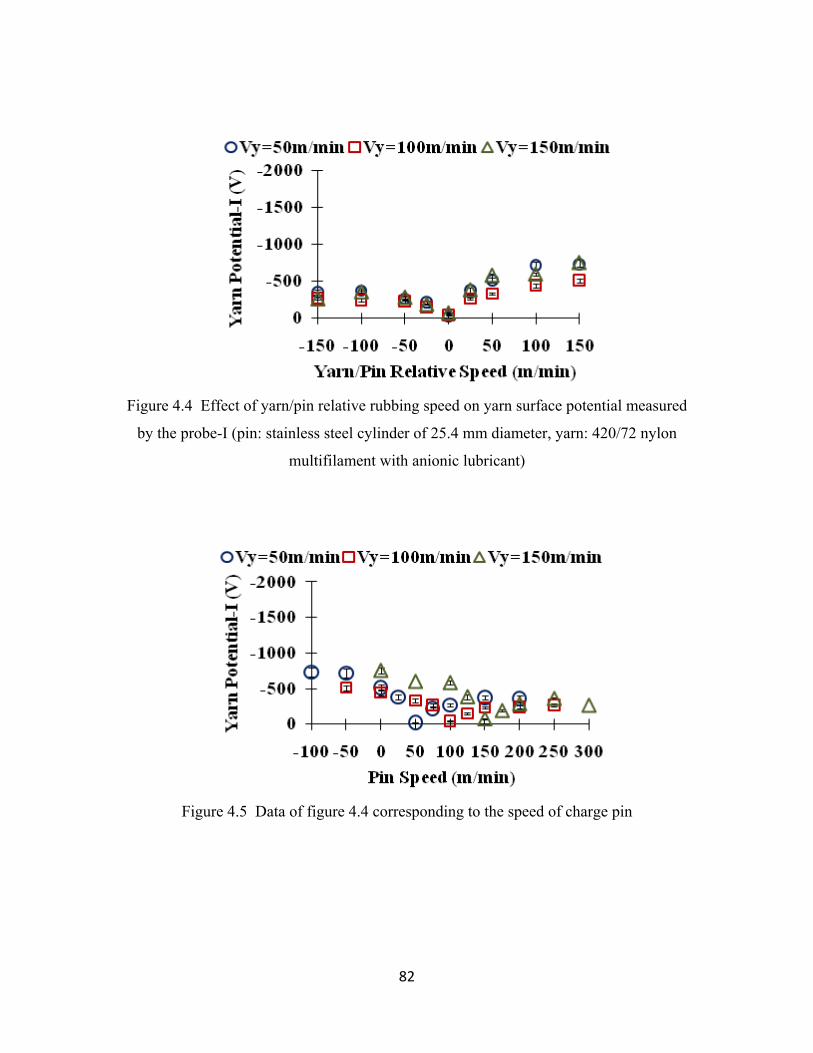
82
Figure 4.4 Effect of yarn/pin relative rubbing speed on yarn surface potential measured
by the probe-I (pin: stainless steel cylinder of 25.4 mm diameter, yarn: 420/72 nylon
multifilament with anionic lubricant)
Figure 4.5 Data of figure 4.4 corresponding to the speed of charge pin
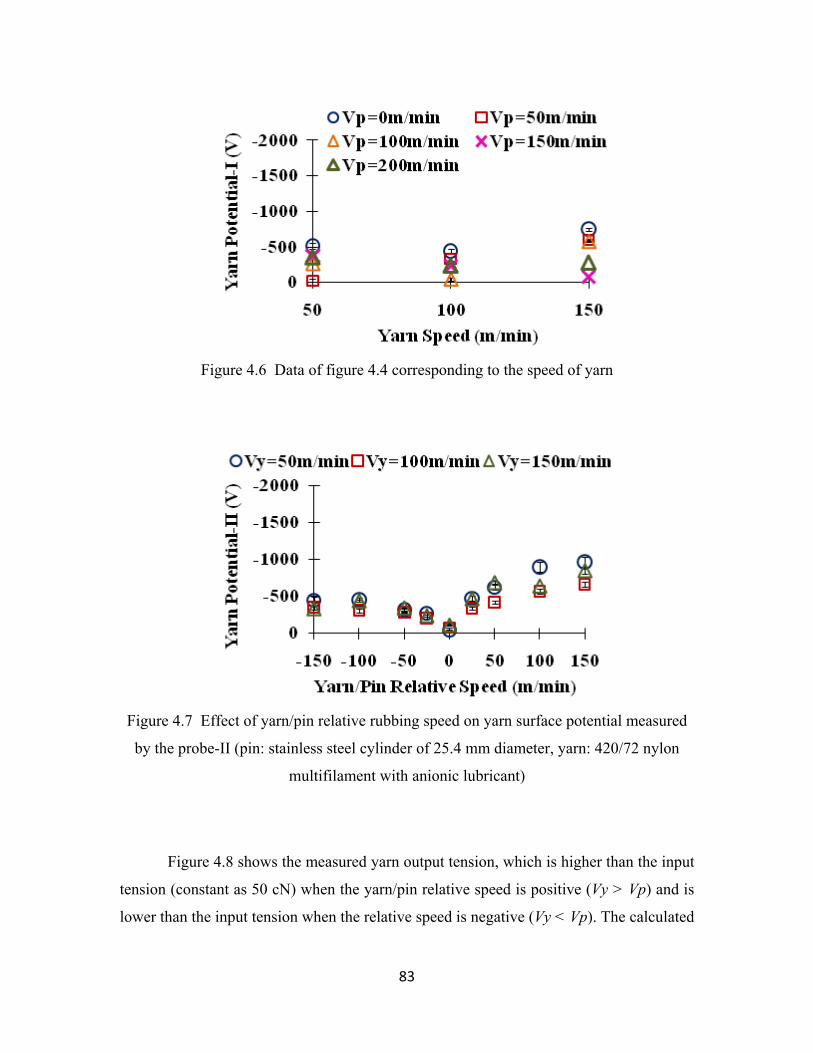
83
Figure 4.6 Data of figure 4.4 corresponding to the speed of yarn
Figure 4.7 Effect of yarn/pin relative rubbing speed on yarn surface potential measured
by the probe-II (pin: stainless steel cylinder of 25.4 mm diameter, yarn: 420/72 nylon
multifilament with anionic lubricant)
Figure 4.8 shows the measured yarn output tension, which is higher than the input
tension (constant as 50 cN) when the yarn/pin relative speed is positive (Vy > Vp) and is
lower than the input tension when the relative speed is negative (Vy < Vp). The calculated

84
contact force is shown in Figure 4.9, which is also higher than 50 cN when yarn/pin
relative speed is positive and is lower than 50 cN when yarn/pin relative speed is
negative. These can be explained by the force analysis of yarn/pin contact section as
mentioned above (Figure 4.2).
Figure 4.10 and 4.11 show the calculated friction force and the coefficient of
friction, respectively. Both of them perform similar tendency as that of yarn potentials
corresponding to the yarn/pin relative rubbing speed. When the friction force was
minimal (the coefficient of friction was also minimal), the charge generation was the
smallest. Figure 4.12 shows the correlation between friction force and potential-I. It is
clear from the chart that the potential increased as the friction force increased.
Figure 4.8 Effect of yarn/pin relative rubbing speed on yarn output tension (pin: stainless
steel cylinder of 25.4 mm diameter, yarn: 420/72 nylon multifilament with anionic
lubricant)

85
Figure 4.9 Effect of yarn/pin relative rubbing speed on contact force on yarn (pin:
stainless steel cylinder of 25.4 mm diameter, yarn: 420/72 nylon multifilament with
anionic lubricant)
Figure 4.10 Effect of yarn/pin relative rubbing speed on friction force on yarn (pin:
stainless steel cylinder of 25.4 mm diameter, yarn: 420/72 nylon multifilament with
anionic lubricant)
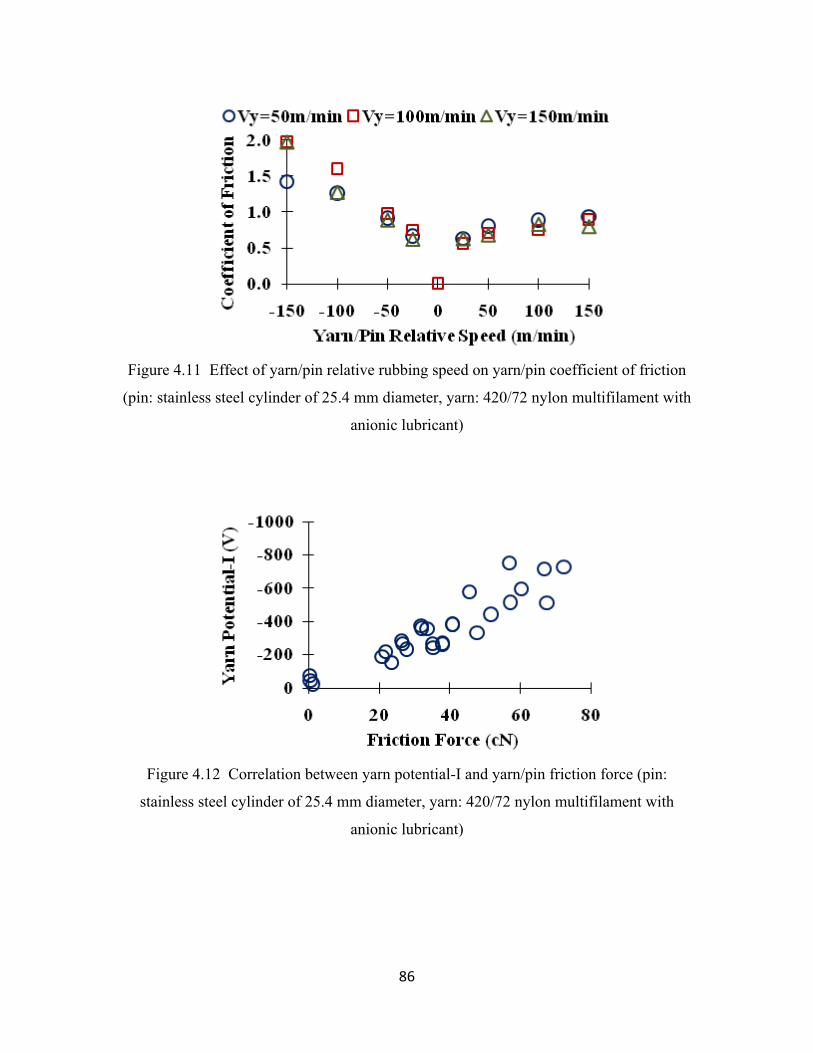
86
Figure 4.11 Effect of yarn/pin relative rubbing speed on yarn/pin coefficient of friction
(pin: stainless steel cylinder of 25.4 mm diameter, yarn: 420/72 nylon multifilament with
anionic lubricant)
Figure 4.12 Correlation between yarn potential-I and yarn/pin friction force (pin:
stainless steel cylinder of 25.4 mm diameter, yarn: 420/72 nylon multifilament with
anionic lubricant)
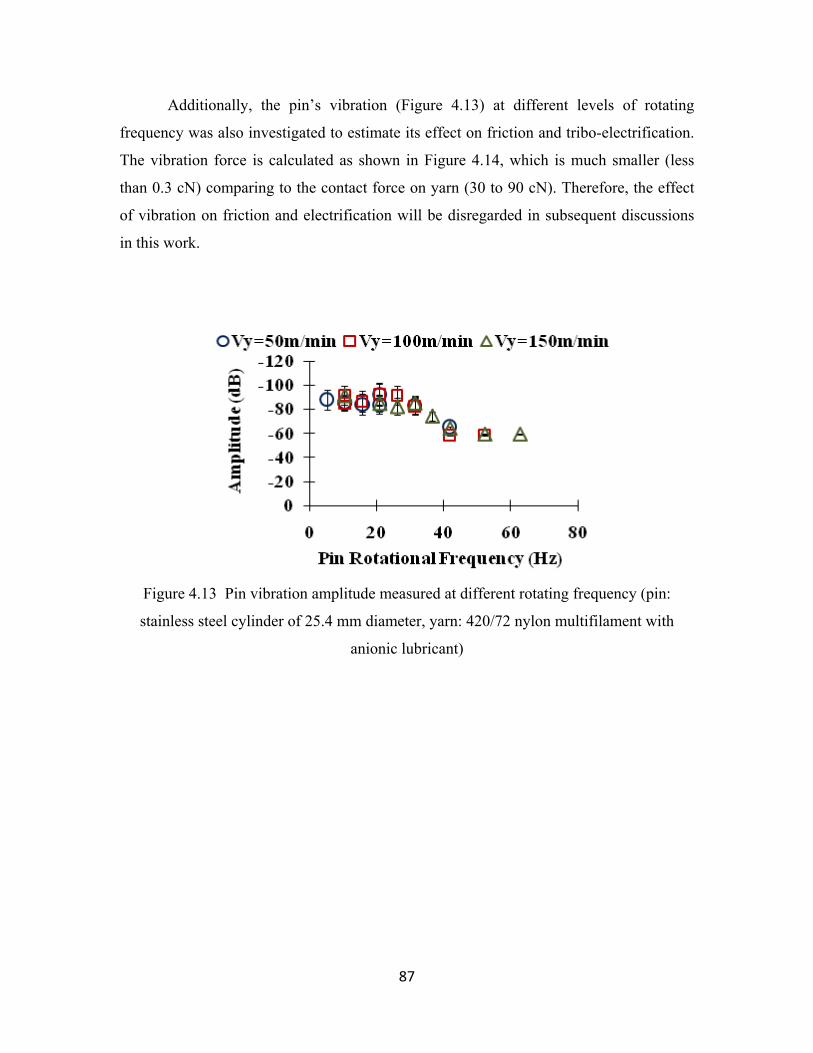
87
Additionally, the pin’s vibration (Figure 4.13) at different levels of rotating
frequency was also investigated to estimate its effect on friction and tribo-electrification.
The vibration force is calculated as shown in Figure 4.14, which is much smaller (less
than 0.3 cN) comparing to the contact force on yarn (30 to 90 cN). Therefore, the effect
of vibration on friction and electrification will be disregarded in subsequent discussions
in this work.
Figure 4.13 Pin vibration amplitude measured at different rotating frequency (pin:
stainless steel cylinder of 25.4 mm diameter, yarn: 420/72 nylon multifilament with
anionic lubricant)

88
Figure 4.14 Vibration force calculated at different yarn/pin speeds (pin: stainless steel
cylinder of 25.4 mm diameter, yarn: 420/72 nylon multifilament with anionic lubricant)
When the 6.35 mm diameter pin was used to rub against the nylon filament, it was
found that more charge was generated than that by rubbing against the 25.4 mm diameter
pin. The values of potential-I and potential-II are shown in Figure 4.15 and 4.16,
respectively. In similar behaviour to that observed when rubbing against the 25.4 mm
diameter pin, the charge is minimal when the relative rubbing speed approaches zero.
It is interesting to note that the absolute value of potential-II was always higher
than that of potential-I when observed in the same run. This was unexpected considering
that the probe-II was farther away from the yarn/pin separation point, where charge
should have begun to decay, and thus potential-II should be lower than potential-I. The
same tendency was observed when the probes and voltmeters were switched to determine
whether a possible error might have been introduced by differences in the sensors. It was
thought that the difference might be associated with differences in the surrounding
electric field, because there was the stainless steel charge pin close to probe-I, while there
was no similar pin placed close to probe-II. A simple trial was carried out by also putting
a stainless steel pin close to probe-II, to mirror the set-up at probe-I. Under this set-up the
absolute value of potential-II decreased and became consistently smaller than potential-I.

89
Figure 4.15 Effect of yarn/pin relative rubbing speed on yarn surface potential measured
by the probe-I (pin: stainless steel cylinder of 6.35 mm diameter, yarn: 420/72 nylon
multifilament with anionic lubricant)
Figure 4.16 Effect of yarn/pin relative rubbing speed on yarn surface potential measured
by the probe-II (pin: stainless steel cylinder of 6.35 mm diameter, yarn: 420/72 nylon
multifilament with anionic lubricant)

90
This explanation (that the pin was influencing the values from Probe-I, was
further supported by a specifically designed test. The probe-I was placed at different
distance from the charge pin while the probe-II was fixed at the same position. Figure
4.17 shows the yarn potential detected by the two probes. It is clear that potential-II was
around the same level in the different runs, however, the absolute value of potential-I
decreased as probe-I got closer to the stainless steel pin.
In this work, since the spacing from the sensitive aperture of probe-I to the
yarn/pin separation point was 3 cm, thus, the probe-I registered less charge than probe-II.
However since the positions of probe-I and probe-II were kept constant during all the
tests, the values measured by the probe-I can be compared with other data obtained from
probe-1 in different runs. Similarly, the values measured by the probe-II can be compared
with each other, however, potential-I was not compared with potential-II in subsequent
trials.
Figure 4.17 Effect of probe-I to pin spacing (the spacing from the aperture of probe-I to
the yarn/pin separation point) on measured yarn potential (the position of probe-II was
fixed) (yarn: nylon with lubricant, pin: stainless steel cylinder of 25.4 mm diameter; Vy =
100 m/min, Vp = 0, input tension=50 cN)
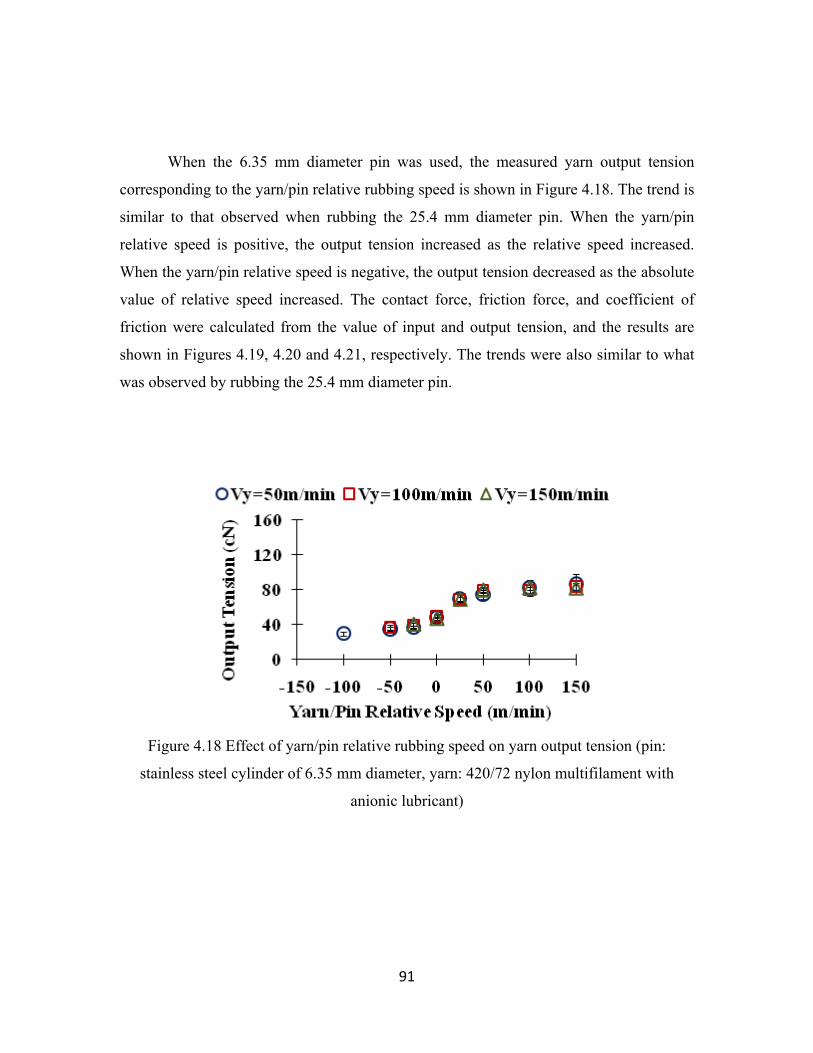
91
When the 6.35 mm diameter pin was used, the measured yarn output tension
corresponding to the yarn/pin relative rubbing speed is shown in Figure 4.18. The trend is
similar to that observed when rubbing the 25.4 mm diameter pin. When the yarn/pin
relative speed is positive, the output tension increased as the relative speed increased.
When the yarn/pin relative speed is negative, the output tension decreased as the absolute
value of relative speed increased. The contact force, friction force, and coefficient of
friction were calculated from the value of input and output tension, and the results are
shown in Figures 4.19, 4.20 and 4.21, respectively. The trends were also similar to what
was observed by rubbing the 25.4 mm diameter pin.
Figure 4.18 Effect of yarn/pin relative rubbing speed on yarn output tension (pin:
stainless steel cylinder of 6.35 mm diameter, yarn: 420/72 nylon multifilament with
anionic lubricant)

92
Figure 4.19. Effect of yarn/pin relative rubbing speed on yarn/pin contact force (pin:
stainless steel cylinder of 6.35 mm diameter, yarn: 420/72 nylon multifilament with
anionic lubricant)
Figure 4.20 Effect of yarn/pin relative rubbing speed on yarn/pin friction force (pin:
stainless steel cylinder of 6.35 mm diameter, yarn: 420/72 nylon multifilament with
anionic lubricant)

93
Figure 4.21 Effect of yarn/pin relative rubbing speed on yarn/pin coefficient of friction
(pin: stainless steel cylinder of 6.35 mm diameter, yarn: 420/72 nylon multifilament with
anionic lubricant)
4.4.2 Experimental design-II Selected parameters were used in experimental design-II to investigate the effect of
relative rubbing speed on the electrification of three different finish free yarns made from
nylon, PET and PP. The stainless steel pin of 25.4 mm diameter was used and the yarn
transport speed was kept as 100 m/min.
Experiments found that nylon yarn was always positively charged while PET and
PP yarns were always negatively charged by rubbing against stainless steel. These agree
with other researchers’ tribo-electric series (Diaz and Felix, 2004). However, only the
absolute charge potential values are shown in Figure 4.22 (potential-I) and Figure 4.23
(potential-II) for the convenience of comparison.
Figures 4.22 and 4.23 indicate that the relative rubbing speed has a significant
effect on the amount of charge generated on nylon, while relative speed has only a minor
influence on the amount of charge generated on the other two yarns. For nylon, the yarn
surface potential increases almost linearly with the increase of yarn/pin speed difference.
When the speed difference between the yarn and the pin approached 100m/min, the
voltage measured by the first probe approached 10,000 volts. For PET, the mean value of

94
absolute charge increases as the speed difference increased; however, this effect is not
significant once the variation is taken into consideration. For PP, the effect of relative
rubbing speed is significant on the charge generation; however, the slope of charge
against speed is much smaller than that of nylon. In the present study it was found that
when the relative speed was not zero, the charge on nylon was much higher than
polyester; however at zero relative speed the polyester had a slightly higher charge.
Figure 4.22 Effect of yarn/pin relative rubbing speed on finish free yarns’ surface charge
potential measured by the first probe (pin: stainless steel cylinder of 25.4mm diameter)
The trends of the effects of relative rubbing speed on the output tension, friction
force, contact force and coefficient of friction were similar for nylon, PET, and PP as
shown in Figures 4.24, 4.25, 4.26 and 4.27, respectively. At the same level of relative
speed, the friction of PP was significantly higher than both PET and nylon, but as
indicated above this was not reflected in the charge generated. Figure 4.28 shows the
charge potential-I of three different yarns corresponding to their yarn/pin friction force. It
reveals that charge on finish free nylon increases dramatically as the friction force
increases; however, the influence of friction on potential for the finish free PET and PP
was only marginal. It is thus clear that when restricting studies to a particular fibre type
frictional force may play a role in the potential generated. However when several types of

95
fibre are studied the effects of friction cannot be generalized and the polymer type
dominates any trends.
Figure 4.23 Effect of yarn/pin relative rubbing speed on finish free yarns’ surface charge
potential measured by the second probe (pin: stainless steel cylinder of 25.4mm diameter)
Figure 4.24 Effect of yarn/pin relative rubbing speed on yarn output tension (pin:
stainless steel cylinder of 25.4mm diameter)
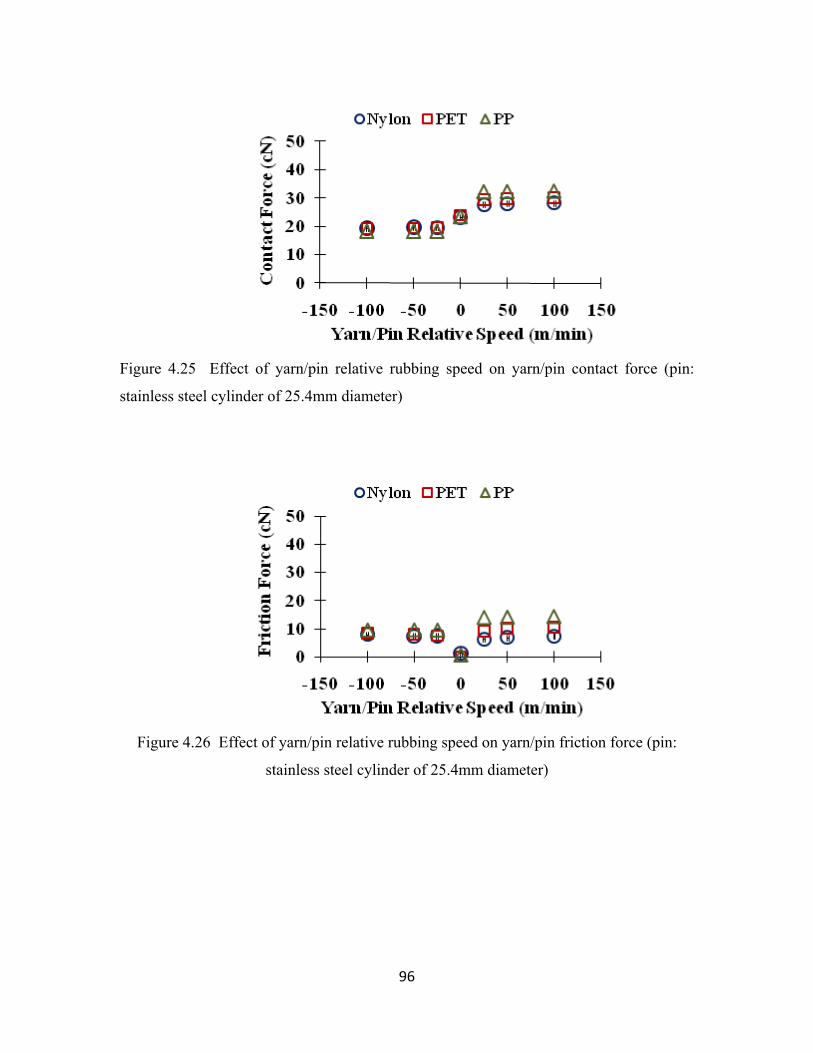
96
Figure 4.25 Effect of yarn/pin relative rubbing speed on yarn/pin contact force (pin:
stainless steel cylinder of 25.4mm diameter)
Figure 4.26 Effect of yarn/pin relative rubbing speed on yarn/pin friction force (pin:
stainless steel cylinder of 25.4mm diameter)

97
Figure 4.27 Effect of yarn/pin relative rubbing speed on yarn/pin coefficient of friction
(pin: stainless steel cylinder of 25.4mm diameter)
Figure 4.28 . Charge potential-I on finish free yarns corresponding to the yarn/pin friction
force
98
4.5 Conclusion The developed equipment enabled a more accurate investigation of tribo-electrification of
continuous filament yarns against a rotating surface at different levels of relative rubbing
speed. It was found that charge generated on a nylon multifilament yarn with 1.2%
anionic lubricant, after rubbing against a stainless steel pin, was minimal as the relative
rubbing speed approached zero. This was found to be true regardless of the absolute
moving speeds of yarn and pin. The calculated friction force and coefficient of friction
also yield the smallest values when the relative speed approaches zero. It can be
concluded that more static was generated by friction than that generated merely by
contact and separation without relative rubbing, and the tribo-electrification increased as
the relative rubbing speed increased. The results also showed that less charge was
generated when larger pin was used when the relative rubbing speed was at the same
level. Based on these findings, the electrostatic could be effectively controlled in industry
by reducing the relative rubbing speed between surfaces such as using rotating rollers
rather than fixed guides.
From the investigation on different types of finish free yarns after rubbing against
stainless steel charge pin, it was found that the nylon yarn was positively charged when
rubbed against stainless steel while the PET and PP yarns were always charged
negatively. The surface potential of nylon increased almost linearly with the increase of
relative rubbing speed, while the surface potential of PET and PP increased slightly and
levelled off as the relative speed increased.
The study indicated that the fibre type (polymer type) was the dominant factor for
the tribo-electrification, and it was further influenced by the relative rubbing speed.
References Armstrong-Hélouvry, B. (1991). Control of machines with friction. Boston: Kluwer Academic Publishers.

99
Castle, P.G. (1997). Contact charging between insulators. Journal of Electrostatics, 40 (1), p. 13-20. Diaz, A.F. and Felix-Navarro, R.M. (2004). A semi-quantitative tribo-electric series for polymeric materials: the influence of chemical structure and properties. Journal of Electrostatics. 62(4), p. 277-290. Gupta, B. S. (2007). Friction in Textile Materials. London: Woodhead. Harper, W.R. (1957). The generation of static charge. Advances in Physics, 6(24), p. 365-417. Hersh, S.P. and Montgomery, D.J. (1955). Static electrification of filaments. Textile Research Journal, 25(4), p. 279-295. Howell, H.G., Mieszkis, K.W., & Tabor,D. (1959). Friction in textiles. New York: Textile book publishers in association with the Textile Institute. Komatsu, T.S. (2004). Static electrification by asymmetric rubbing. Applied Surface Science, 235(1-2), p. 60-64. London, J.J. (1966). Effects of pretension and yarn speed on electrostatic charge generation on continuous filament yarns (Master Thesis). North Carolina State University. Lowell, J. and Rose-Innes, A.C. (1980). Contact electrification. Advances in Physics, 29(6), p. 947-1023. Lyne, D.G. (1955). Fibre friction. Journal of Textile Institute, 46(1), p. 3-136. Monroe Electronics, Inc. (1991). Instruction Manual. Lyndonville, New York. Ohara, K. (1980). Relationship between frictional electrification and molecular motion of polymers. Journal of Electrostatics, 9(2), p. 107-115. Ohara, K., Nakamura, I., and Kinoshita, M. (2001). Frictional electrification between flat surfaces of polymers and of Langmuri-Blodgett layers. Journal of Electronics, 51-51(1-4), p. 351-358. Seyam, A. M., Cai, Y., and Oxenham, W. (2009). Devices for measuring electrostatic generation and dissipation on the surfaces of polymeric materials. Journal of Textile Institute. 100(4), p. 338-349.
100
Suh, M., Seyam, A.M., Oxenham, W. and Theyson, T. (2010). Static generation and dissipation of polyester continuous filament yarn. Journal of Textile Institute. 101(3), p. 261-269.

101
5 FRICTIONAL ELECTRIFICATION OF POLYMERIC PLATES
This chapter is modified from a manuscript entitled “Frictional electrification on polymeric flat surfaces”, by L. Liu, A.M. Seyam, and W. Oxenham, which is submitted to Journal of Engineered Fibers and Fabrics.

102
5.1 Introduction Electrostatic charge is generated by contact and separating two different surfaces. Based
on a “Surface State Model”, which is an idealized electron-transfer model, the generated
charge polarity and magnitude can be predicted (Harper, 1957). When two different
surfaces are contacted, electrons attempt to transfer from the surface of higher Fermi
level to the surface of lower Fermi level. The charge transferred to the surface is
proportional to the difference of their Fermi Levels. After separation, the transferred
electrons are trapped on the surface and the surface is negatively charged (Taylor and
Secker, 1994). However, experimental results generally do not agree with the predicted
results, especially when polymeric surfaces were examined (Castle 1997). Since
polymeric surfaces are irregular, not 100% crystalline, and usually contain “impurities”,
it is difficult to determine their Fermi Levels. Furthermore, the phenomenon becomes
more complicated in frictional charging than that in contact charging. When friction
(sliding/rubbing) occurs, the real contact junctions between two surfaces are sheared,
which is related to the surfaces’ roughness and deformation properties (Howell, Mieszkis,
& Tabor 1959; Gupta, 2009). The correlation between friction and electrification is still
unclear answers for many questions such as will more charge be generated by friction
than by repeated contacts and separations, and does charge increase as rubbing speed
increase?
In textiles, most of the materials are polymers, and their frictional electrification
has been investigated by rubbing fiber against fiber (Hersh and Montgomery, 1955), fiber
against cylinder (Medley, 1954), yarn against cylinder (Suh. et al., 2010; London, 1966;
Ballou, 1954), film against cylinder (Ohara, 1980), fabric against cylinder/roller (Sereda
and Feldman, 1964; Ballou, 1954), and plastic disk against disk (Komatsu, 2004). It is
evident that their reported observations were not consistent and in some cases conflicted
with each other. For example, nylon was generally positively charge after rubbing against
metal, however, it was sometimes negatively charged (London, 1966). For another
example, charge was not always increased with rubbing speed (Hersh and Montgomery,
1955). Possible explanations for these disparities are the differences in sample
preparation (surface contamination and texture) experimental procedures (equipment and
103
measuring techniques) coupled with the level of accuracy of the systems used. In another
research of Ohara (2001), a high-precision friction apparatus was constructed to
investigate the frictional electrification between two flat surfaces. The study revealed
that:
(a) Charge increases as the number of friction cycles increases
(b) More charge was generated on nylon than on other polymers (polyester,
polycarbonate, polypropylene, polystyrene, etc.)
(c) Charge increases as the surface roughness decreases
However, these conclusions were all based on experiments of only five or six
cycles of rubbing. The answers to the following questions were not addressed: When the
charge will get saturated? What is the difference of saturation levels for different
polymers? And, what are the impacts of rubbing speed and contact force on the saturation
levels?
The discrepancy reported on tribo-electrification of polymers and the limitations
of the experiments in previous studies prompted us to conduct comprehensive research in
the area of electrostatic generation/dissipation of polymeric materials. The overall goal of
this work is to gain a better understanding of the mechanism of static generation and
dissipation on polymeric surfaces and to relate these findings to the static charge issues in
textile processing. In this study, finish free nylon, PP, and PTFE surfaces were prepared
to be rubbed against stainless steel flat surface for 50 cycles (which was found to be the
maximum number of cycles required to reach charge saturation for the materials studied)
at different levels of rubbing speed and contact force to find their effects on charge
generation and dissipation. In addition, surfaces (nylon, PP, PTFE, stainless steel) were
rubbed against each other to find out their tribo-electric series. A rubbing device (Seyam,
Cai, & Oxenham, 2009) was modified, which can provide forward-and-backward rubbing
motion between two surfaces (movable rubbing head or rubber and fixed sample in form
of plate) at different levels of speed, contact force, and stroke length. The rubbing head
can also provide up-and-down movement to realize repeated contacts and separations.

104
The surface charge potential of the rubbing plate (sample) was detected continuously by a
potential probe, which was fixed with the rubbing head.
5.2 Experimental
5.2.1 Charge generation/dissipation measurement device Figure 5.1 shows the device developed for measuring the surface charge potential of a
fixed rubbing plate rubbing against a movable rubbing head. The rubbing plate is
mounted on a metal grounded fixture and the rubbing head is attached to a metal shaft by
double sided adhesive tape. The contact force between the rubbing plate and the rubbing
head can be adjusted by adding different loads (weight blocks) on top of the shaft. The
shaft is held by a bush so that the shaft can move up/down inside the bush freely. A
potential probe (Model 1017, Monroe Electronics®) is mounted on one side of the bush.
The bush is connected to a stepper motor that move the assembly of bush, rubbing head,
load, shaft, and the potential probe in reciprocating motion. The rubbing movement can
be precisely controlled and pre-programmed through user interface.
During measurement of charge, the potential probe is moved forward-and-
backward. When the rubbing head moves forward, the probe is tailing the rubbing head
and detects the charge newly generated on the surface of rubbing plate. When the rubbing
head moves backward, the probe is leading the rubbing head and monitors the charge
retained on the surface. The distance from the detecting aperture of the probe (facing
rubbing plate) to the left edge of the rubbing head is fixed as 20 mm and the probe is kept
above the rubbing plate with 3 mm spacing. By this setup, charge in the area of 8 mm
diameter on the rubbing plate surface can be detected at 99% resolution (Monroe
Electronics, Inc., 1991).
The device is housed inside a walk-in environmental room where temperature and
humidity are precisely controlled.

105
Figure 5.1 Rubbing tester
5.2.2 Materials and experimental designs Finish free nylon 6,6, polypropylene (PP), stainless steel (SS), and
polytetrafluoroethylene (PTFE) were prepared as rubbing heads of dimensions 10 mm ×
20 mm × 3 mm and as rubbing plates of dimensions of 300 mm × 90 mm × 3 mm. The
edges of rubbing heads were polished to avoid any scratching in rubbing against rubbing
plates. Each sample was cleaned and de-ionized using ethanol, ionized water, and ionized
gas respectively to remove contaminations and initial charge that may have accumulated
from handling. The initial surface charge of each sample was checked by the potential
probe before each test and if it was not zero, the cleaning and de-ionizing procedure was
repeated until no charge was detected on the test sample. All samples were conditioned
inside the environmental room at the temperature of 21°C and relative humidity (R.H.) of
43% for at least 24 hours before testing.
Three sets of experiments were conducted to evaluate the charge behavior of
nylon, PP, and PTFE. Tables 5.1 to 5.3 depict the parameters and their levels. The first
experiment was used to find the effect of the force between the two surfaces on the static
generation and dissipation of nylon, PP, and PTFE plates in rubbing against stainless
steel. Four levels of contact force were used and three replications were conducted for
106
each run. The fixed parameters were rubbing speed of 47 mm/second, rubbing stroke
length of 52 mm, and number of rubbing cycles (forward and backward stroke/cycle) was
50. In the 50th cycle, the rubbing head was stopped after the forward stroke and was not
moved backward (49 ½ cycles or 99 strokes were conducted). At this moment the probe
is monitoring the potential of the sample at the middle of the rubbed area (see section
5.3.1 for details). The charge decay on the plate was recorded at this position for 30
seconds.
The second experiment was carried out to evaluate the effect of rubbing speed on
charge generation and dissipation of nylon, PP, and PTFE after rubbing against stainless
steel. Four levels of rubbing speeds, including zero speed, which was repeated contacts
and separations, were used. Again three replications were conducted for each run. The
constant parameters were contact force of 1 N, rubbing stroke length of 52 mm, and 50
cycles of rubbing. The repeated contacts/separations were realized by raising and
releasing the shaft for 99 times at the same location without forward/backward
movement. After the 99th contact/separation, the probe was moved (at 47 mm/second) to
the charged area to measure the surface potential.
The third experiment was designed to find the tribo-electric series of nylon,
stainless steel, PP, and PTFE by rubbing against each other. Three replications were
conducted for each run. The constant parameters were rubbing speed of 47 mm/s, contact
force of 1 N, rubbing stroke length of 52 mm, and the number of rubbing cycles was 50.
The acceleration/deceleration of rubbing movement was constant as 400 mm/s2
for the three experiments, which was selected after carrying out trials using
accelerations/decelerations in the range of 150-4000 mm/s2. At 400 mm/s2
acceleration/deceleration, the movement took 0.12 second to accelerate from 0 to 47
mm/s (constant rubbing speed used in experimental design I) and it took 0.12 second to
decelerate from 47 mm/s to 0, without jerky motion (happened when the
acceleration/deceleration was too high). The rubbing speeds were selected after
conducting trials at speeds in the range of 20-100 mm/s. The speed of 47 mm/s used in
experimental design I was around the middle of the range. The other two levels of speed
used in experimental design II, 27 mm/s and 95 mm/s, were selected to represent low and
107
high levels of speed. All the three speeds provided smooth rubbing motion. The selected
contact forces (0.4, 1, 1.5, and 2 N) provided good contact between two surfaces a matter
that led to measurable charge potential, and they did not cause severe friction between the
two surfaces, which would block the movement.
All the experiments were conducted at temperature of 21°C and relative humidity
of 43%. The temperature of 21°C is recommended by standard testing methods related to
electrostatics (AATCC 76, AATCC 84, AATCC 134, and NFPA 56). The standards,
however, did not specify relative humidity and suggested that the test be done under
relative humidity of choice depending on the investigated materials. The 43% R.H. was
selected in this investigation since static is more of an issue at lower levels of humidity
and this was the lowest R.H. available at 21°C for the environmental room used. The
number of contact, 50 cycles, was also decided after preliminary trails. It was indicated
that charge usually leveled off before 50 cycles of rubbing for samples used in this work,
thus, additional rubbing did not provide more information. Additionally, for all the tests,
the data collection rate was 100 points/second, which was enough to provide reasonable
data points per cycle (120) without loss of any details of signal.
The responses for each experiment were charge potential on the rubbing plate
after first cycle of rubbing and 50 cycles of rubbing (V50), potential retained (V) and
normalized potential retained (V/V50 × 100, %) after 30 seconds.
In industrial application and consumer products, polymer surfaces are subjected to
simple rubbing or multiple rubbing cycles. This is the reason behind characterizing the
charge generation after one cycle and 50 cycles of rubbing. As stated earlier, 50 cycle of
rubbing causes the charge to reach its maximum. Characterizing the maximum charge is a
significant issue to determine the problem that that the charge may cause. The charge
decay parameters provide significant information on whether a surface treatment is
needed to expedite the charge decay.

108
Table 5.1 Experimental design I used to study the effect of contact force on static generation/dissipation of polymers after rubbing against stainless steel
Parameters Levels
Material of Rubbing Plate Nylon, PP, PTFE
Contact Force (N) 0.4, 1, 1.5, 2
Total Runs1 3×4= 12 1Each run was replicated 3 times and a total of 36 observations were obtained for each
response (3×4×3 replications = 36)
Table 5.2 Experimental design II for studying the effect of rubbing speed on static
behavior of polymers after rubbing against stainless steel
Parameters Levels
Material of Rubbing Plate Nylon, PP, PTFE
Rubbing Speed (mm/sec) 0, 27, 47, 95
Total Runs1 3×4 = 12 1Each run was replicated 3 times and a total of 36 observations were obtained for each
response (3×4×3 replications = 36)
Table 5.3 Experimental design III for investigating static properties of polymers after
rubbing against each other
Parameters Levels
Material of Rubbing Plate Nylon, PP, PTFE
Material of Rubbing Head Stainless Steel, Nylon, PP, PTFE
Total Runs1 3×4 = 12 1Each run was replicated 3 times and a total of 36 observations were obtained for each
response (3×4×3 replications = 36)

109
5.3 Signal analysis
5.3.1 Charge generation Figure 5.2 shows the charge potential on nylon in terms of time. The charge potential
signal is also corresponding to the rubbing movement at each point of time. The location
of potential probe, rubbing head, and rubbing area (the area rubbed by the rubbing head)
at starting point (t = 0) and at reversing point (t = 1.2 second = 46.48 mm / 47 mm/sec +
0.12 sec acceleration time + 0.12 sec deceleration time) are shown above the potential-
time curve. At point A1, the rubbing head and the probe started moving forward. The
rubbing head rubbed against the rubbing plate. The probe was trailing the rubbing head
and detected the surface potential of the rubbing plate, which was zero outside the
rubbing area. At point B1, the probe moved into the rubbing area, thus the sample charge
is detected. At point C1, the probe was reached the most forward point (end of forward
stroke) at almost the middle of the rubbing area and the motion was reversed. At point
D1, the probe left the rubbing area (same position as that of point B1) and surface
potential decreased to zero. The period T1 represents the time during which the rubbing
head and probe moved forward while the period of T2 is the time during which the
rubbing head and probe moved backward. Points A2, B2, C2, and D2 are the same as
above for the second cycle of rubbing. Figure 5.2 shows that the charge potential in the
second cycle of rubbing (represented by potential at point C2) is higher than the potential
generated in the first cycle of rubbing (represented by C1).
It is shown in Figure 5.2 that the potential curves of forward and backward
strokes were not symmetric. The charge potential detected in the forward stroke was
higher than that detected in the backward stroke when it passed by the same position.
This is because in the forward stroke, the probe is trailing the rubbing head and detected
the charge been newly generated. However, in the backward stroke, the probe is leading
the rubbing head and detected the charge, which was generated in the previous forward
stroke, retained on the rubbing plate. The latter charge is less due to decay. The charge
decay depends on polymer type. For some polymers such as polyester and polypropylene,
the charge decay is very slow and did not show difference in the forward and backward
stroke.
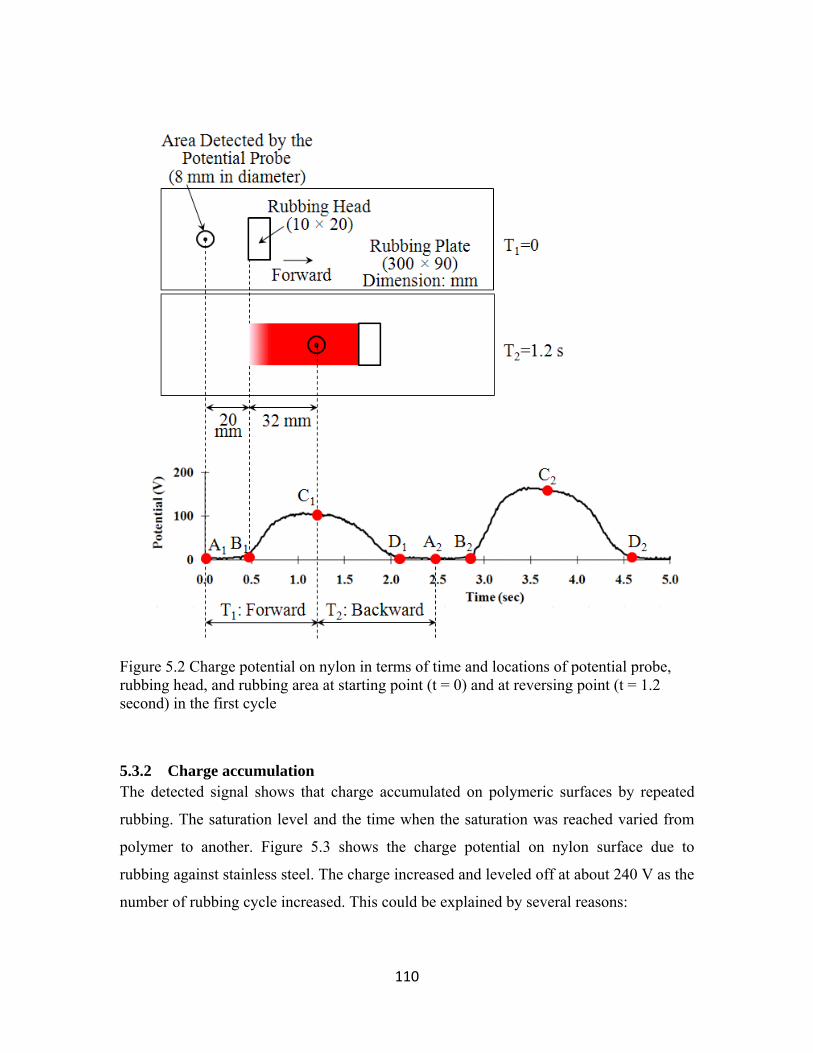
110
Figure 5.2 Charge potential on nylon in terms of time and locations of potential probe, rubbing head, and rubbing area at starting point (t = 0) and at reversing point (t = 1.2 second) in the first cycle
5.3.2 Charge accumulation The detected signal shows that charge accumulated on polymeric surfaces by repeated
rubbing. The saturation level and the time when the saturation was reached varied from
polymer to another. Figure 5.3 shows the charge potential on nylon surface due to
rubbing against stainless steel. The charge increased and leveled off at about 240 V as the
number of rubbing cycle increased. This could be explained by several reasons:

111
The increase of potential with number of rubbing may be caused by the increase of
real contact area between two surfaces, which is related to the deformation of
polymers (Lowell and Rose-Innes, 1980).
The repeated contacts may be expected to increase the charge if the insulator is
slightly conducting, because the charge tends to spread (under its own Coulomb
repulsion) into the bulk, making room from more charge to be deposited during the
next contact (Harper, 1967).
As the number of rubbing cycle increase, the electrons or ions on nylon surface
available for transfer decreases, thus the charge generation get difficult (Lowell and
Rose-Innes, 1980).
Charge decays on nylon plate during the time interval between each cycle (2.4
seconds). The charge saturation is reached when the charge dissipation and generation
were in balance.
Figure 5.4 indicates that the charge on PTFE surface as a result of rubbing against
stainless steel reached the saturation level at about -600 V after just two or three cycles of
rubbing and kept almost constant with more rubbing cycles. Figure 5.5 shows the charge
on PP surface also reached the saturation at about -83 V after two or three rubbing cycles.
Figures 5.3, 5.4, and 5.5 also show the charge decay on nylon, PTFE, and PP for
30 seconds after the 50 cycles. The analysis of charge decay will be addressed in section
5.4.1.
Figure 5.3 Charge accumulations in 50 cycles and charge decay on nylon surface

112
Figure 5.4 Charge accumulations in 50 cycles and charge decay on PTFE surface
Figure 5.5 Charge accumulations in 50 cycles and charge decay on PP surface
5.4 Results and discussion
5.4.1 Experimental design I Experiments showed that nylon was always positively charged (e.g. Figure 5.3), while PP
and PTFE were always negatively charged (e.g. Figures 5.4 and 5.5) by rubbing against
stainless steel. In order to compare the magnitude of charge generated under different
conditions, only the absolute value (without polarity) of surface charge potential were
compared. Figure 5.6 shows the absolute charge generated on polymers after the first
cycle of rubbing and Figure 5.7 shows the absolute charge generated on polymers after
50 cycles of rubbing at different levels of contact force. Comparing the charge potential
values in Figure 5.6 and Figure 5.7, it is shown that charge after 50 cycles of rubbing is
much higher than charge after the first rubbing, for reasons discussed in section 5.3.2.
113
Figure 5.6 and 5.7 revealed that for PP, the charge increased almost linearly as the
contact force increased from 0.4 N to 2 N. For nylon, charge was not significantly
affected by the contact force. For PTFE, charge increased as the contact force increased
from 0.4 N to 1.5 N, and then leveled off when the contact force increased from 1.5 N to
2 N. The difference might be caused by the difference of deformation properties of those
surfaces. Howell, et al. (1959) found that when two surfaces contact the real contact area
increased as the applied contact force increased. For polymeric surfaces, the elastic
deformation is more significant for surface with lower Young's modulus. The modulus
for materials used in this work was 1,655 mega Pascal (or 240,000 psi) for the PTFE and
the PP, and 2,827 mega Pascal (or 410,000 psi) for the nylon (Manufacture data sheet,
Industrial Plastic Supply, Inc.). Therefore, the real contact area of the PTFE and the PP
could be increased, during the rubbing test, as the contact force increased, while, there
was little deformation for the nylon. Since more real contact area would provide more
particles to participate in the charge generation, it is expected that the charge potential
increased significantly on PTFE and PP as the contact force increased, while there will be
no significant charge increase on nylon. Furthermore, Rose and Ward (1957) showed that
chemical bonds on polymers surfaces might be broken under the contact force. The
broken chemical segments can provide electrons or ions to promote the charge generation.
Therefore, charge generation increased as the contact force increased.
Both Figure 5.6 and Figure 5.7 show that the absolute charge generated on the
PTFE was more than that on nylon and PP exhibited the lowest charge. This might be due
to the difference in their surface chemical compositions and structures. Generally,
polymer surface is composed of irregular crystalline and amorphous regions. The
molecular segments existing in the amorphous region are more than that in the crystalline
region. Polymer with a lower crystallinity might have more molecular segments on its
surface, which can provide more free particles (electrons or ions), and promote the charge
generation. Since, the crystallinity is about 40% for nylon, 43-48% for PTFE, and 80%
for PP (Morton, 1975, Rae and Dattelbaum, 2004), charge generated on PP was found to
be lower than that on nylon and PTFE. Nylon contains amine groups on its surface (-CO-
NH-), which are highly polarized and could promote the charge generation. However, the

114
real contact area of nylon might be much lower than that of PTFE as discussed in
previous paragraph (the modulus of nylon is higher than that of PTFE), thus, charge
observed on nylon was still lower than that of PTFE.
Figure 5.6 Effect of contact force on charge generated on polymer surfaces after the first
cycle of rubbing against stainless steel (rubbing speed: 27 mm/sec)
Figure 5.7 Effect of contact force on charge accumulated on polymer surfaces after 50
cycles of rubbing/contact against stainless steel (rubbing speed: 27 mm/sec)

115
The charge retained on three polymers after 30 seconds, which is a measure of charge
decay, is shown in Figure 5.8 and the normalized charge retained is shown in Figure 5.9.
It is shown that, after 30 seconds, charge retained on the nylon decreased to 60% or lower
of the initial potential, while charge retained on the PTFE and the PP were the same as
the initial potential indicating no charge decay within the time of measurement. The
absolute charge retained on the PTFE was still the highest among the three polymers.
Figure 5.8 Effect of contact force on charge retained on polymer surfaces after 30
seconds of decay time
Figure 5.9 Effect of contact force on normalized charge retained on polymer surfaces
after 30 seconds of decay time

116
Figure 5.10 shows the charge signals of the first two cycles of rubbing the three
polymers. It can be seen that the curves for PTFE and PP within each cycle are
symmetrical, while the curve for nylon is not. This reflects that there was no charge
decay on PTFE and PP surfaces, while charge had decayed obviously in the backward
stroke on nylon surface within a cycle (short time).
Figure 5.10 Charge potential of the first and second cycles of rubbing (contact force: 1N,
rubbing speed: 47 mm/sec)
The results of the charge decay on nylon, PTFE, and PP in 30 seconds after the 50
cycles are shown in Figure 5.3, 5.4, and 5.5. For nylon, the charge decayed exponentially
with time, and charge decayed to less than half of the initial charge within 30 seconds.
For PTFE or PP surfaces, no charge decay was observed within 30 seconds. The typical
curve of charge decay on nylon is regressed as shown in Figure 5.11, which was found to
fit the following equation with R2 value of 0.968.

117
98 . 135 .
Figure 5.11 Exponential behavior of charge decay of nylon
In the rubbing device setup (Figure 5.1), a grounded plane was placed under the
charged rubbing plate and there were grounded metal parts surrounding the charged
surface. These are the bush, the shaft, the load, and the driving rod. Considering this
device setup, a description of charge decay on the rubbing plate is shown in Figure 5.12,
which is developed based on the decay mechanism for insulators (Jonassen, 1998). The
decay of the charge occurs partly due to that the electrical flux (field lines) from the
surface extended through the air toward the surrounding metal parts on the top, and part
of the flux extended through the polymer bulk towards the substrate of the grounded
plane.

118
Figure 5.12 Charge decay model of a charged polymeric rubbing plate
Additionally, since the rubbing plate (300 × 90 mm) is larger than the rubbing
area (52 × 20 mm; red rectangle in Figure 5.2), charge might move along the surface
from the rubbing area to the surrounding areas on the plate (spread), which contributed to
the decrease of the monitored charge potential. Literature (Ottewill, 1975) showed that
charge could move along a polymeric surface when the humidity is high or the polymer
has hydrophilic properties. In this work, only nylon is hydrophilic polymer (2% moisture
content at 21°C and 43% R.H.) and PP and PTFE are hydrophobic, therefore, charge on
nylon moved along its surface, while charge on PP and PTFE did not move during the 30
seconds of measurements.
Figures 5.3 to 5.5, and 5.11 depict different charge decay for different polymer.
The rate of charge decay is determined by the properties of the medium, which could be
the surrounding air, the nature of the surface and the bulk of rubbing plate. Thus the
differences between the three polymers decay behavior can be explained as follows:
Although the environmental condition was kept constant, however, the moisture
absorbed/adsorbed on different polymeric rubbing plate is different, which affect
the ability of charge moving (spreading) along the surface. Since the moisture
content under temperature of 21°C and 43% R.H. was about 2% for nylon and

119
about 0% for PTFE and PP (Morton, 1975), thus, the charge moving on the nylon
surface was faster than that the other two materials.
The electrical properties (resistivity and dielectric constant) of polymers varied,
which could affect the decay through the polymer to the substrate grounded plane.
The dielectric constants were 3.6 for the nylon, 2.1 for the PTFE and 2.3 for the
PP. The bulk resistivity is about 1015 ohm for the nylon, 1022-1024 ohm for the
PTFE and 1020 ohm for the PP (Manufacture data sheet, Industrial Plastic Supply,
Inc.), thus the charge might decay faster through the nylon than the other two
polymers.
5.4.2 Experimental design II Four levels of rubbing speed, including zero speed, which is equivalent to repeated
contacts/separations, were used in experimental design II to find whether more charge
was generated by rubbing than by contacts/separations, and whether the frictional charge
is affected by the rubbing speed. The charge observed after the first cycle of rubbing is
shown in Figure 5.13 and the charge after 50 cycles of rubbing is shown in Figure 5.14. It
is shown that, for PTFE and nylon, the charge generated by friction was higher than that
generated by repeated contacts/separations. For PP, however, the charges generated by
contact and rubbing are close. During the rubbing, the real contact junctions between two
surfaces are sheared, then the real contact area is increased, and molecular segments are
broken and appease on the surface, which promotes the charge generation. However, this
effect of rubbing might be not significant on PP, because of its higher crystalline
structure; therefore not many molecular segments appear on the surface, even under the
friction, to contribute to charge generation.
Figures 5.13 and 5.14 also indicate that, when the rubbing speed was not zero, the
charge was not affected by the rubbing speed. It is worth mentioning that, in Chapter 4,
on the frictional electrification between yarn and cylinder, it was found that charge
increased significantly as the relative rubbing speed increased from 400 mm/sec to 1600
mm/sec. Therefore, it can only be concluded that frictional electrification is not affected

120
by rubbing speed at low speed levels, used in this research. Our device is limited in speed
and it is recommended to conduct research to examine the phenomenon at higher speed
than that used here.
Figure 5.13 Effect of rubbing speed on charge generated on polymeric surface after the
first cycle of rubbing or the first contact/separation against stainless steel
Figure 5.14 Effect of rubbing speed on charge generated on polymeric surface after 50
cycles of rubbing (99 strokes) or 99 contacts/separations against stainless steel

121
The charge retained on polymer surfaces after 30 seconds of decay time is shown
in Figure 5.15 and the normalized charge retained as the percentage of the initial potential
is shown in Figure 5.16. Again, the charge on the nylon surface decayed to 60% or lower
compared to the initial potential, while the PTFE and PP did not show any decay.
Figure 5.15 Effect of rubbing speed on charge retained on polymeric surfaces after 30
seconds of decay
Figure 5.16 Effect of rubbing speed on normalized charge retained on polymeric surfaces
after 30 seconds of decay
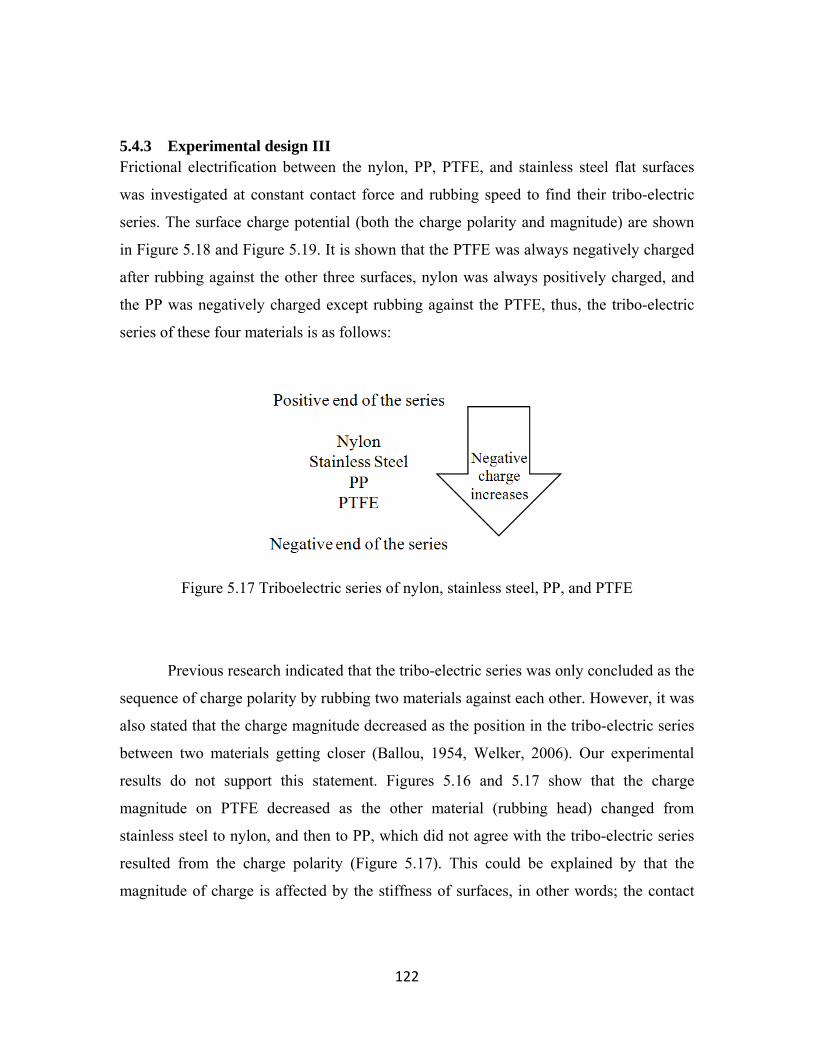
122
5.4.3 Experimental design III Frictional electrification between the nylon, PP, PTFE, and stainless steel flat surfaces
was investigated at constant contact force and rubbing speed to find their tribo-electric
series. The surface charge potential (both the charge polarity and magnitude) are shown
in Figure 5.18 and Figure 5.19. It is shown that the PTFE was always negatively charged
after rubbing against the other three surfaces, nylon was always positively charged, and
the PP was negatively charged except rubbing against the PTFE, thus, the tribo-electric
series of these four materials is as follows:
Figure 5.17 Triboelectric series of nylon, stainless steel, PP, and PTFE
Previous research indicated that the tribo-electric series was only concluded as the
sequence of charge polarity by rubbing two materials against each other. However, it was
also stated that the charge magnitude decreased as the position in the tribo-electric series
between two materials getting closer (Ballou, 1954, Welker, 2006). Our experimental
results do not support this statement. Figures 5.16 and 5.17 show that the charge
magnitude on PTFE decreased as the other material (rubbing head) changed from
stainless steel to nylon, and then to PP, which did not agree with the tribo-electric series
resulted from the charge polarity (Figure 5.17). This could be explained by that the
magnitude of charge is affected by the stiffness of surfaces, in other words; the contact

123
area dominated the amount of charge generated here and does not correlate to the position
of a material in the tribo-electric series.
Furthermore, it is evident from these results that the charge measured on the
rubbing plate cannot be used to infer the charge on the rubbing head. Indeed when the
polymers used for rubbing plate and rubbing head are interchanged, very different results
can be found. For example, when nylon rubbing against PTFE, the magnitude of charge
observed on nylon (58 V) is not equal to that observed on PTFE (212 V). This could be
attributed to the difference in decay behavior discussed earlier since the measurement is
monitored with lag time between the charge and measurement by the probe.
The results of the absolute charge retained on the surface and normalized charge
retained (not shown) indicated that charge on nylon decreased to about 60% or less
amount of the initial charge, while the other two materials did not show any charge decay
in 30 seconds. This supports the findings of experimental design I discussed in section
5.4.1.
Figure 5.18 Charge potential on rubbing plate after the first cycle of rubbing against the
rubbing head (rubbing speed: 47 mm/sec, contact force: 1N)

124
Figure 5.19 Charge potential on rubbing plate after 50 cycles of rubbing against the
rubbing head (rubbing speed: 47 mm/sec, contact force: 1N)
5.5 Conclusion Our automated rubbing device enabled an investigation of tribo-electrification between
two parallel surfaces at any desired number of cycles of rubbing under different levels of
contact force and rubbing speed. It was found that charge accumulated on nylon surface
in repeated rubbing and leveled off after about 40-50 cycles, while charge on PTFE and
PP reached the charge saturation after only 2 or 3 cycles. Charge on nylon decreased to
60% or less of the initial charge (charge accumulated after 50 cycles of rubbing), while
charge on PTFE and PP did not decay within 30 seconds.
When the three examined polymers were rubbed against stainless steel surface, it
was found that charge on PTFE and PP increased as the contact force increased, however,
the effect was not seen on nylon. The study also showed that charge generated on nylon
and PTFE due to rubbing was higher than due to repeated contacts/separations. However,
this effect was not observed on PP. Rubbing speed in the range 27-95 mm/sec did not
show significant difference on charge generation on the three polymers studied.

125
The tribo-electric series of four materials were established by rubbing against
each other under the same contact force and rubbing speed, which indicated that the
series was nylon (+), stainless steel, PP, and PTFE (-) from positive to negative. The
charge observed on one surface did not reflect the charge generated on the other been
rubbed against it due to difference in decay behavior.
Our findings could be used to characterize polymers electrostatic behavior and
identify whether a polymer requires antistatic finish treatment to reduce/eliminate the
problems of such material during processing or while use by consumers.
References
Ballou, J.W., “Static Electricity in Textiles” (1954), Textile Research Journal, 24(2), p.146-155. Castle, P.G., “Contact charging between insulators” (1997), Journal of Electrostatics, 40 (1), p. 13-20. Gupta, B.S., “Friction in Textile Materials” (2007), London: Woodhead. Harper, W.R., “The generation of static charge” (1957), Advances in Physics, 6(24), p. 365-417. Hersh, S.P. and Montgomery, D.J., “Static electrification of filaments” (1955), Textile Research Journal, 25(4), p. 279-295. Howell, H.G., Mieszkis, K.W., & Tabor, D., “Friction in textiles” (1959), New York: Textile book publishers in association with the Textile Institute. Jonassen, N., “Electrostatics” (1998), New York: Chapman and Hall. Komatsu, T.S., “Static electrification by asymmetric rubbing” (2004), Applied Surface Science, 235(1-2), p. 60-64. London, J.J., “Effects of pretension and yarn speed on electrostatic charge generation on continuous filament yarns” (Master Thesis) (1966), North Carolina State University. Medley, J.A., “Discharge of electrified textiles” (1954), Journal of Textile Institute, 45(2), p. 123-141.

126
Morton, W.E. and Hearle, J.W., “Physical Properties of Textile Fibers” (1975), London: Heinemann, p. 171. Ohara, K., “Relationship between friction electrification and molecular motion of polymers” (1980), Journal of Electrostatics, 9(2), p. 107-115. Ohara, K., Nakamura, I., and Kinoshita, M., “Frictional electrification between flat surfaces of polymers and of Langmuri-Blodgett layers” (2001), Journal of Electronics, 51-51(1-4), p. 351-358. Ottewill, R.H., “Static Electrification” (1975), IPPS Conference, London: Institute of Physics. 27, p. 56 Rae, P.J. and Dattelbaum, D.M., “The properties of poly(tetrafluoroethylene) (PTFE) in compression” (2004), Polymer, 45(22), p. 7615-7625. Suh, M., Seyam, A.M., Oxenham, W., and Theyson, T., “Static generation and dissipation of polyester continuous filament yarn” (2010), Journal of Textile Institute, 101(3), p. 261-269. Seyam, A.M., Cai, Y., and Oxenham, W., “Devices for measuring electrostatic generation and dissipation on the surfaces of polymeric materials” (2009), Journal of Textile Institute, 100(4), p. 338-349. Taylor, D.M. and Secker, P.E., “Industrial Electrostatics: Fundamentals and Measurement” (1994), New Jersey: John Wiley & Sons, Inc.

127
6 CONTACT ELECTRIFICATION OF POLYMERIC PLATES
This chapter is modified from a manuscript entitled “Contact electrification of polymeric surfaces”, by L. Liu, W. Oxenham and A.M. Seyam, which is submitted to Indian Journal of Fiber and Textile Research.

128
6.1 INTRODUCTION Synthetic polymers are widely used because they offer excellent properties and relatively
low price. However, most of the synthetic polymers have a common drawback, which is
that electrostatic charge is easy to generate but hard to dissipate, which causes problems
in industry. For example, in textiles, charge can be generated on synthetic fibers/filaments
when they are transported across rollers and guides. The generated charge may cause the
films/fibers/filaments to cling on parts of the machine and therefore cause the production
line to stop, which results in the irregularity of products and low manufacturing efficiency.
More severely, the charge may be sufficient to cause sparks and lead to fires and
explosions in the plants. Therefore, it is extremely important to understand the
mechanisms of static behavior of synthetic polymers, so that efforts can be made to
minimize its negative impact.
The static generation can be classified into contact electrification (charging by
contact and separation of two different surfaces) and frictional electrification (charging
by dynamic rubbing of two surfaces). Compared to the frictional electrification, the
contact electrification is simpler for analysis since there is no concern about the rubbing
speed and its interactions with other factors (e.g. temperature and contact area) on the
static generation. There have been several studies on the contact electrification of
polymeric plates (Lowell and Rose-Innes, 1980, Castle, 1997, Homewood and Rose-
Innes, 1982). It was revealed that charge increased as the number of contacts increased,
and the rate of increase of charge decreased as the number of contacts increased and a
saturation value appeared after many cycles of contacts. However, there is no universally
agreed explanation on the issue that why the charge increases with number of contacts.
One of the important factors influencing the charge generation is the contact area between
two contacted surfaces. The researches of Coste and Pechery (1981) and Ohara et al.
(2001) indicated that charge would increase as the surface roughness decreased. The
reason lies in that the increase of the real contact area would provide more electrons or
ions to participate in the charge transfer. In addition to the effect of contact area,
researchers have attempted to understand the influence of environmental conditions on
contact electrification (Medley, 1954, Sawa and Calderwood, 1971, Awakuni and

129
Calderwood, 1972, Sereda and Feldman, 1964, and Greason, 2000). However, it is
evident that in some cases the reported observations were in conflict with each other. For
example, Sereda and Feldman (1964) and Medley (1954) pointed out that charge would
increase as the relative humidity (R.H.) increased. After the charge reached a maximum
value, the charge decreased rapidly as the R.H. kept increasing. Ohara (1980) found that
charge could reach a maximum value and then decreased as the temperature increased.
However, Greason (2000) found that charge kept decreasing as the R.H. and the
temperature increased. Possible reasons for this disparity could be attributed to the
differences in experimental procedures coupled with the accuracy of systems used.
In order to gain a better understanding of the static behavior of polymers, this
work examines the contact electrification of flat polymeric surfaces that are commonly
used in industry. PTFE, nylon 6,6 and PP were tested for static charging under different
levels of contact force, relative humidity, and temperature.
6.2 EXPERIMENTAL
6.2.1 Contact device The device used to measure the amount of electrostatic charge generated on a sample
after contacting a polymeric surface is shown in Figures 6.1 and 6.2. The device is
housed inside a walk-in environmental room where temperature and humidity are
precisely controlled. The Faraday tube is used for determining the charge amount. For
each contact, the stepper motor drives the contact head with controlled speed and force to
establish contact of the sample with the polymeric flat surface, and then the contact head
is withdrawn into the Faraday tube, thus static charge amount can be detected after each
contact and separation (cycle). The procedure is repeated in order to measure the charge
accumulation after certain number of cycles that enable the evaluation of saturation
charge (maximum charge that the surface can accumulate). The charge amount is
measured by a Keithley® 6514 electrometer. The contact force is monitored by a
Transducer Techniques® compression load cell. The desired test parameters (contact
force, number of contacts, rate of data collection, and contacts/minute) can be precisely
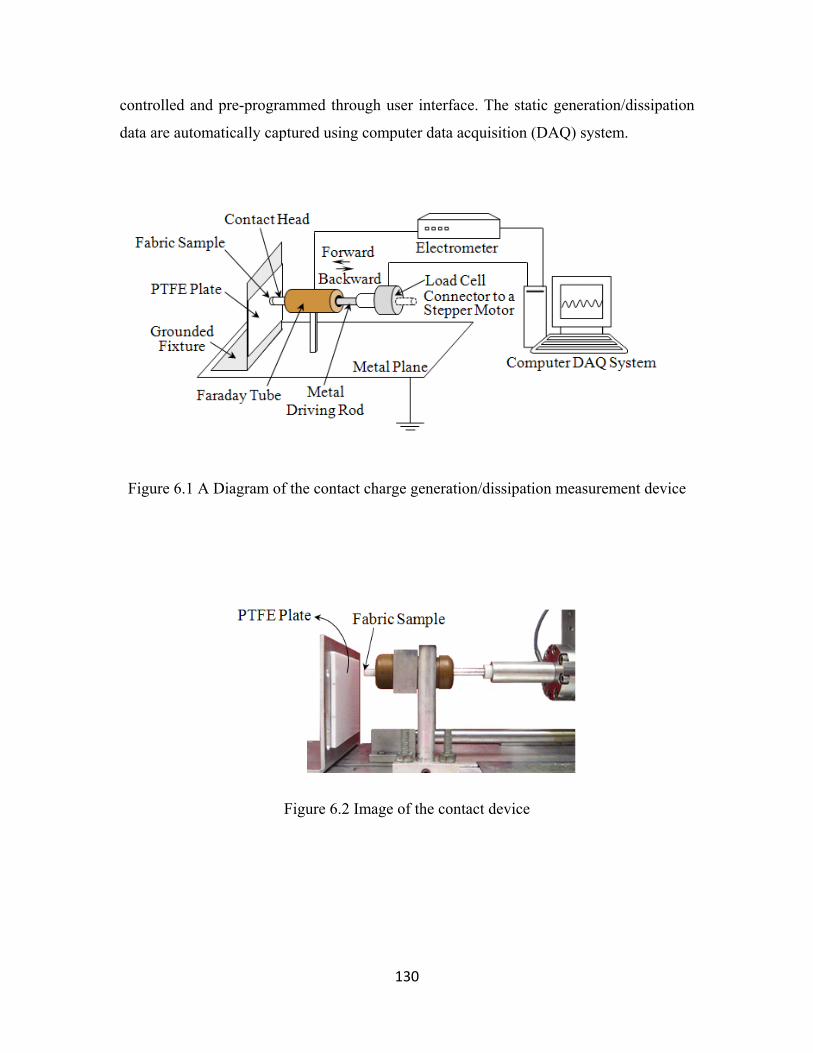
130
controlled and pre-programmed through user interface. The static generation/dissipation
data are automatically captured using computer data acquisition (DAQ) system.
Figure 6.1 A Diagram of the contact charge generation/dissipation measurement device
Figure 6.2 Image of the contact device
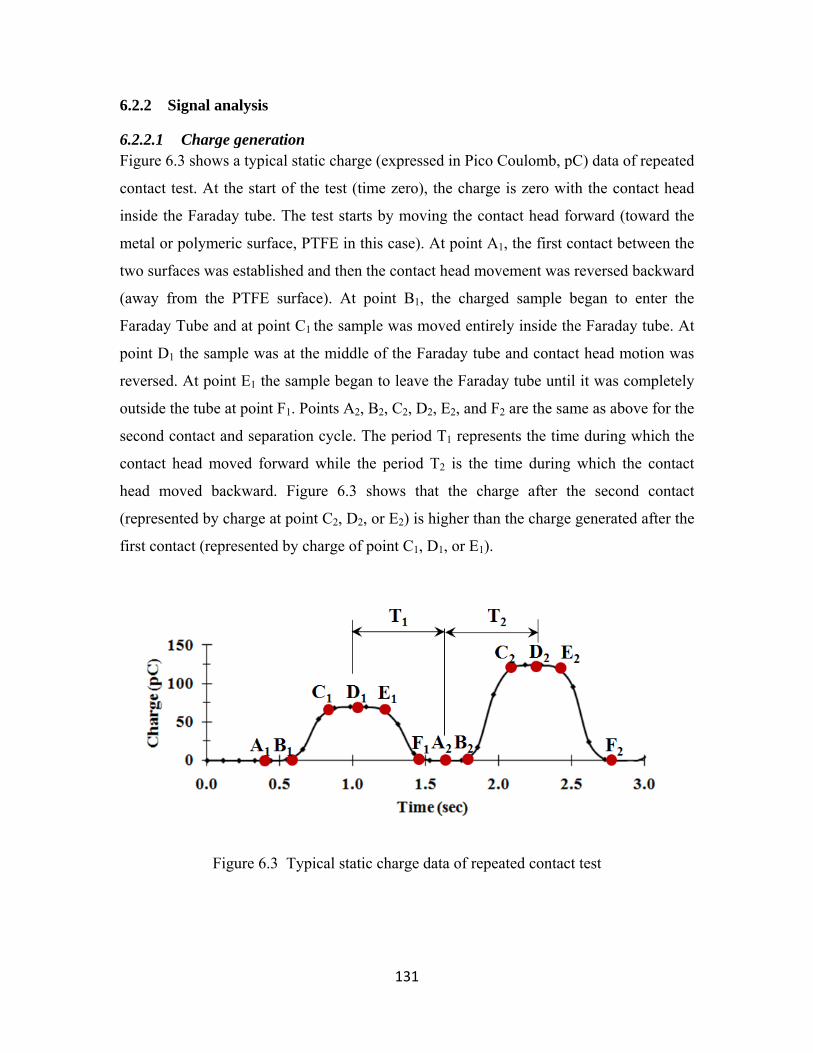
131
6.2.2 Signal analysis
6.2.2.1 Charge generation Figure 6.3 shows a typical static charge (expressed in Pico Coulomb, pC) data of repeated
contact test. At the start of the test (time zero), the charge is zero with the contact head
inside the Faraday tube. The test starts by moving the contact head forward (toward the
metal or polymeric surface, PTFE in this case). At point A1, the first contact between the
two surfaces was established and then the contact head movement was reversed backward
(away from the PTFE surface). At point B1, the charged sample began to enter the
Faraday Tube and at point C1 the sample was moved entirely inside the Faraday tube. At
point D1 the sample was at the middle of the Faraday tube and contact head motion was
reversed. At point E1 the sample began to leave the Faraday tube until it was completely
outside the tube at point F1. Points A2, B2, C2, D2, E2, and F2 are the same as above for the
second contact and separation cycle. The period T1 represents the time during which the
contact head moved forward while the period T2 is the time during which the contact
head moved backward. Figure 6.3 shows that the charge after the second contact
(represented by charge at point C2, D2, or E2) is higher than the charge generated after the
first contact (represented by charge of point C1, D1, or E1).
Figure 6.3 Typical static charge data of repeated contact test
132
6.2.2.2 Determination of charge saturation We established procedure to determine the charge saturation (maximum charge that the
material can hold under certain experimental conditions) of a material. The first step is to
run repeated contact test for large number of cycles as shown in Figure 6.4. Then use the
charge after each contact along with the corresponding cycle number to derive an
exponential regression equation that fits the data. Figure 6.5 shows the experimental data
(dots) of Figure 6.6 and the derived exponential regression relationship (continuous line)
of charge generated in terms of cycle number. The general form of regression equation
that fits the data is
[6-1]
Where a, b, and c are constants, Q is charge in Pico Coulomb, and n is a positive integer
representing the number of contacts (1, 2, 3…).
Equation 6-2 shows the derived equation that fits the data of Figure 6.5 with R2
value of 0.9953.
207 210 . [6-2]
The charge after first contact (Q1) can be obtained when substituting n=1 into
equation [6-2] as follows:
. 207 210 0.9143 15
The charge saturation (QS) can be obtained when substituting n= ∞ into equation
[6-2] as follows:
0 207
The equation allows the determination of charge generated after any desired
number of cycles.

133
Figure 6.4 Electrostatic charges of 50 cycles of contact
Figure 6.5 Experimental data of Figure 6.4 and derived exponential regression
relationship of charge generated in terms of cycle number
From a range of experimental runs, it was found that the charge saturation in most
runs was reached after 50 contacts. This fact was supported by calculating the charge
saturation at different number of cycles as well as infinite number of contacts.
Additionally, the rank of the cycle number-charge relationship in terms of parameters
studied is the same for 50, 100, or infinite contacts. This is the reason why the charge
generation after 50 contacts was selected as response for the experimental design.
134
Previous literature (Lowell and Rose-Innes, 1980) indicated that the charge
increased as the number of contact increased. The rate of increase of the charge decreased
as contacts were repeated, and after many contacts, the charge appeared to saturate. The
reason why this happens is not, however, understood. Several explanations have been put
forward, but each of them is applicable to only a certain kind of material:
1) The increase of charge with number of contacts may be a result of the fact that the
charge transferred depends on the total time of contact (Lowell and Rose-Innes,
1980).
2) The increase of charge with number of contacts may be caused by the increase of
real contact area, which is related to the viscoelastic deformation of polymeric
surfaces, produced by repeated contacts (Lowell and Rose-Innes, 1980).
3) The repeating contacts may be expected to increase the charge if the polymeric
surface is slightly conducting, because the charge tends to spread (under its own
Coulomb repulsion) into the bulk, making room for more charge to be deposited
during the next contact (Harper, 1967).
6.2.3 Sample preparation The device (Figure 6.2) used to measure the amount of electrostatic charge generated on a
contact head after contacting a fixed contact plate (polymeric or metal). In this work,
finish free nylon, PP, PTFE, and stainless steel rods were machined to the required shape
of contact head, which is cylinder of 6.35 mm diameter (Figure 6.7). One end of the
contact was drilled for mounting onto a driving rod. The other end of the contact head
was flat surface, which would contact and separate with the fixed contact plate. After the
initial machining, each contact head was smoothed by sand paper (grit size: 2000) and
water to reduce their surface roughness. Additionally, nylon, PP, PTFE and stainless steel
plates were cut as 10×10 cm to be used as the fixed contact plate. All the contact heads
and contact plates were cleaned by ethanol, deionizing water, and deionizing gas, and
then kept inside an environmental room under required condition for at least 24 hours.
Before each test, the initial charge on the contact head and the contact plate was
measured and if it was not zero, the cleaning procedure was repeated again.

135
Figure 6.6 Images and dimensions of contact heads
6.2.4 Experimental design Two sets of experiments were conducted. The first dealt with evaluation of static
generation on PTFE contact head after contacting against nylon contact plate (Table 6.1).
The second addressed static generation on nylon, PTFE, stainless steel and PP surfaces
when contact against each other (Table 6.2). Tables 6.1 and 6.2 depict the parameters and
their levels.
Table 6.1 Experimental design I
Parameters Levels
Relative Humidity (%) 43, 55, 65
Temperature (°C) 21, 25, 30
Contact Force (N) 11, 14, 17
Total Runs1 3×3×3 = 27 1Each run was replicated 3 times and a total of 81 observations were obtained for each
response (3×3×3×3 = 81)
The fixed parameters for the first experiment were: PTFE contact head; nylon
contact plate; 72 cycles/min contact frequency; 17 points/sec data collection rate. The
responses considered for this experiment were charge generated on the PTFE contact
head after the first contact, 50 contacts, 100 contacts, and 120 contacts.

136
Table 6.2 Experimental design II used to investigate the static generation of nylon, PP,
stainless steel, and PTFE by contact against each other
Parameters Levels
Relative Humidity (%) 43, 65
Temperature (°C) 21, 30
Contact Head Material Nylon, PP, Stainless Steel, PTFE
Contact Plate Material Nylon, PP, Stainless Steel, PTFE
Total Runs1 2×2×4×4=64 1Each run was replicated 3 times and a total of 192 observations were obtained for each
response (2×2×4×4×3= 192)
The following parameters were fixed for the second experiment: 14 N contact
force; 72 cycles/min contact frequency; 17 points/sec data collection rate. The response
considered for this experiment was charge generated on the contact head after 50 contacts.
6.2.5 Statistical analysis The data of the measured parameters were processed using Analysis of Variance
(ANOVA) to reveal the influence of the main parameters and their interactions on the
responses listed above.
6.3 RESULTS
6.3.1 Experimental design I The ANOVA indicated that the effect of contact force on charge generation is significant
for charge generated after the first, 50, 100, and 120 cycles of contact. The p-value is
0.0094 for the response of charge generated after the first contact, 0.0008 for charge after
50 contacts, 0.0003 for charge after 100 contacts, and 0.0004 for charge after 120
contacts (if the p-value < 0.05, it indicates that the effect is significant at 95% confident
level). Figures 6.8, 6.9, 6.10, and 6.11 show the charge generated on PTFE after the first

137
contact, 50 contacts, 100 contacts, and 120 contacts against nylon. Each value in the
figures represents the mean of 3 replications. Although there are a few exceptions (charge
generated under 25°C and 43% R.H. and under 25°C and 65% R.H.), the absolute charge
generally increases as the contact force increases from 11 N to 17 N. This can be
explained by the fact that with higher force the contact area between the nylon and PTFE
surfaces increases (Pascoe and Tabor, 1956). The increase of contact area allows greater
transfer of electrons from the nylon to the PTFE, which causes more negative charge
generated on the PTFE.
Figure 6.12 shows typical curves of charge generated in repeating contacts under
the three levels of contact force. It is found that charge saturation in most runs was
reached after 50-100 contacts. Additionally, the rank of the cycle number-charge
relationship in terms of parameters studies is the same for 50, 100, or 120 contacts.
Figure 6.7 Charge generated on PTFE after the first contact against nylon

138
Figure 6.8 Charge generated on PTFE after 50 cycles of contacts against nylon
Figure 6.9 Charge generated on PTFE after 100 cycles of contacts against nylon

139
Figure 6.10 Charge generated on PTFE after 120 cycles of contacts against nylon
Figure 6.11 Charge generated on PTFE by repeated contacts/separations against nylon, at
different contact force (temperature of 30°C and R. H. of 30%)
The ANOVA indicated that when the data was collectively analyzed the effect of
R.H., temperature, and their interaction on charge generation is significant irrespective of
the number of contacts (p-values are smaller than 0.05). The values of charge generated
after 50 contacts (data shown in Figure 6.9) are sorted by relative humidity as shown in
Figure 6.13 and by temperature in Figure 6.14. Figure 6.13 shows no general trends and
only in two cases were immediately observable difference present (at the temperature of

140
21° and 25°C, R.H. of 55%, and the contact force of 17 N). Similarly, no general trends
were observed for the difference of temperature with only the two data points mentioned
above showing any major difference. The statistically significant differences seem to be
very influenced by the two highest values.
Figure 6.12 Data of Figure 6.9 sorted by the relative humidity
Figure 6.13 Data of Figure 6.9 sorted by the temperature

141
6.3.2 Experimental design II In experimental design II, the nylon, PP, stainless steel and PTFE surfaces were contacted
against each other. It was found that the PTFE was always negatively charged and the
nylon was always positively charged after contacting (and separating from) the other
three materials. The PP was negatively charged against nylon and stainless steel, and it
was positively charged against the PTFE. According to these observations, the
triboelectric series for these four materials can be summarized in the order of nylon (+),
stainless steel, PP, and PTFE (-). The material close to the positive end of the series is
positively charged when contact against materials close to the negative end of the series.
This agrees with other researchers’ tribo-electric series (Diaz and Felix, 2004).
Figure 6.15 shows the charge generated on PP after 50 contacts against other
materials. It is shown that the amount of charge on PP after contacting nylon is larger
than that after contacting PTFE, and the charge on PP after contacting stainless steel is
lowest. There is no general tends exhibited for the effect of R.H. on charge generated.
Figure 6.15 also shows that the higher charge is generated at the higher temperature
irrespective of humidity. This could be the combine results of different effects:
At a given relative humidity, the water content in the air at high temperature is more
than that at low temperature. At the R.H. of 43%, there was about 12 g of water per
kilogram of air when the temperature was 21°C, while 20 g of water per kilogram of
air when the temperature was 30°C (Perry and Green, 2007). The water in the air can
be adsorbed on synthetic polymeric surface, though the surface is hydrophobic. The
water molecules on polymeric surface may perform in two ways: 1) Charging - water
performs like media for charge transfer, and thus potentially increase charging; 2)
Dissipation - water acts as conductor, which may help the charge moving along the
surface or into the bulk (Sereda and Feldman, 1964).
The mobility of molecules increase as temperature increases. Based on this law, the
mobility of molecules on polymeric surface increases as the temperature increases,
which can promote the charge transfer (Ohara, 1980). Meanwhile, the mobility of
molecules in the air increases as the temperature increases, which may promote the
charge dissipation through the air (Jonassen, 1998).

142
Figure 6.14 Charge generated on PP after 50 cycles of contacts against nylon, stainless
steel, and PTFE
Figure 6.16 shows the charge generated on PTFE after 50 cycles of contacts
against other materials. The charge on PTFE after contacting nylon is highest, while the
charge generated on PTFE after contacting PP is variable with temperature and humidity;
however no clear trend is evident. It is interesting to note that the charge generated on
PTFE after contacting nylon is higher than contacting other materials, however, the
charge observed on nylon after contacting other materials is always very low (< 15 pC).
Additionally, no charge was observed on the stainless steel contact head, which is
expected from a good conductor.
It is evident from these results that the charge measured on the contact head
cannot be used to infer the charge on the contact plate. Indeed when the polymer used for
contact plate and contact head are interchanged very different results can be found. For
example, PP generates a significant charge when contacted against the PTFE plate, but
PTFE only generates a small charge when contacted against the PP plate.

143
Figure 6.15 Charge generated on PTFE after 50 cycles of contacts against nylon,
stainless steel, and PP
6.4 Conclusions The contact electrification tests between finish free PTFE and nylon surfaces revealed
that charge increases as contact force increases. The triboelectric series of four different
materials was investigated by contacting against each other. It was found that their tribo-
electric series was nylon (+), stainless steel, PP, and PTFE (-). The absolute charge
generated on nylon was much lower than that generated on PP or PTFE. Additionally, it
is found that charge generated on one surface can not represent the charge on the other
surface by which it is contacted.

144
Reference
Awakuni, Y. and Calderwook, J.H. (1972). Water vapour adsorption and surface conductivity in solids. Journal of Physics D-Applied Physics, 5(5), p.1038-1045. Castle, G.S.P. (1997). Contact charging between insulators. Journal of Electrostatics, 40&41, p.13-20. Coste, J. and Pechery, P. (1981). Influence of surface profile in polymer-metal contact charging. Journal of Electrostatics, 10(5), p.129-136. Diaz, A.F. and Felix-Navarro, R.M. (2004). A semi-quantitative tribo-electric series for polymeric materials: the influence of chemical structure and properties. Journal of Electrostatics. 62(4), p. 277-290. Greason, W.D. (2000). Investigation of a test methodology for triboelectrification. Journal of Electrostatics, 49(3-4), p.245-256. Homewood, K.P. and Rose-Innes, A.C. (1982). Investigation of contact-charge accumulation on insulators repeatedly touched by metals. Journal of Physics D-Applied Physics, 15(11), p.2283-2296. Jonassen, N. (1998). Electrostatics. New York: Chapman and Hall. Lowell, J. and Rose-Innes (1980). Contact electrification. Advances in Physics, 29(6), p.947-1023. Medley, J.A. (1954). The discharge of electrified textiles. Journal of Textile Institute, 45(2), p.123-141. Ohara, K. (1980). Relationship between frictional electrification and molecular motion of polymers. Journal of Electrostatics, 9(2), p.107-115. Ohara, K. (2001). Frictional Electrification between Flat Surfaces of Polymers and of Langmuir-Blodgett Layers. Journal of Electronics, 51, p.351-358. Perry, R.H. and Green, D.W (2007), Perry's Chemical Engineers' Handbook (8th Edition). New York: McGraw-Hill. Sawa, G, Calderwood, J. H. (1971) Dependence of surface conduction current in oxidized polyethylene on electric field at various humidities. Journal of Physics C-Solid State Physics, 4(15), p.2313.

145
Sereda, P.J. and Feldman, R.F. (1964). Electrostatic charging on fabrics at various humidities. Journal of Textile Institute, 55(5), p.288-298. Seyam, A. M., Cai, Y., and Oxenham, W. (2009). Devices for measuring electrostatic generation and dissipation on the surfaces of polymeric materials. Journal of Textile Institute. 100(4), p. 338-349.
146
7 ELECTRIFICATION OF POLYMERIC SURFACES TREATED BY ANTISTATIC
FINISHES
This chapter is modified from a manuscript entitled “Electrification of antistatic treated polymeric surface”, by L. Liu, T. Theyson, W. Oxenham, and A.M. Seyam, which has been submitted to Journal of Textile Institute.

147
7.1 INTRODUCTION Static charge generation and control are still major issues in the full range of textile
processes. While, there have been considerable discussion on innovative concepts
relating to static charge control, the major commercial technology for controlling static
charge during polymer processing remains the combination of topically applied antistatic
agents (additives that accelerate the static dissipation process) together with humidity
control and/or ionized air in the processing environment. Most antistatic agents are
surfactants (composed of hydrophilic and hydrophobic sub-structures) that interact with
the surface of the textile polymer and assist in absorbing/holding moisture to the surface,
which further enhances the static dissipation process. By their own ionic character and
water that is attracted to the surface, these materials can provide a low resistance pathway
for the conduction of static charge to ground. To be effective on polymer surfaces, such
agents must have a basic affinity for the surface, but not be so strongly attached that it
interferes with the mobility of the molecule that provides the basis for improved surface
conductivity (Holme, 1998).
When the performance objective is to control static charge during both the
processing stage and in the final textile product, other, more “durable” or “permanent”
methods of static control have been used or suggested. These include:
Improving the conductivity of the fibrous assembly by incorporating a conductive
fiber into the yarn (Holme, 1998)
Increasing the conductivity of the base polymer through the addition of conductive
additives such as carbon or carbon nanotubes (Lo, et al., 2007)
Chemically modifying the surface through chemical grafting or high energy process
(plasma, etc.) to increase the polarity and surface conductivity of the polymer (Kan
and Yuen, 2008)
Several reviews are available that cover the use of these types of approaches to generate
static control apparel for use in a variety of environments (Holme, 1998; Kowalski and
Wroblewska, 2006)
The purpose of this work is to provide a better understanding of the charge
generating process (contact charging and frictional charging) on traditional fiber forming

148
polymers (polypropylene and nylon) and the impact of applying traditional nonionic and
ionic antistatic agents to these processes. While it is widely recognized that traditional
antistatic finishes can assist in controlling static charge through providing accelerated
dissipation once the charge is generated, there is little work on the effect of these
materials on the actual static generation process. In this work, three types of static control
finishes (nonionic, cationic, and anionic) are applied to polypropylene (PP) and nylon 6,
6 surfaces at four different solution concentration levels. Contact and frictional
electrifications between the polymeric surfaces and stainless steel were conducted by
automatically controlled contact and rubbing devices (section 5.2.1 and 6.2.1). The
charge generated on the polymeric surfaces is monitored in order to determine the
effectiveness of finish and the influence of increasing surface finish concentration on the
processes. This work concludes by offering insights into the processes of static charge
generation and control that could provide the basis for the development of new, more
efficient methods for the controlling static charge in textiles, under both manufacturing
and end-use conditions.
7.2 EXPERIMENTAL
7.2.1 Sample preparation Heavy films of polypropylene (PP) and nylon 6, 6 were shaped to required size for the
contact or rubbing electrification tests (Chapter 5 and 6). The shaped surfaces were
cleaned by ethanol, deionizer water, and deionizer gas to remove surface contaminants
and residual static charge that might have accumulated from handling. The stainless steel
contact/rubbing surfaces used in this study were also cleaned by ethanol, deionizer water
and deionizer gas. Before each test, the initial charge on the investigated sample surface
was measured and if this was not zero, the cleaning procedure was repeated until no
charge was detected on the test sample.
Three model surface finishes, using typical fibre processing components, were
prepared and used to treat the polymeric surfaces. The components and chemical
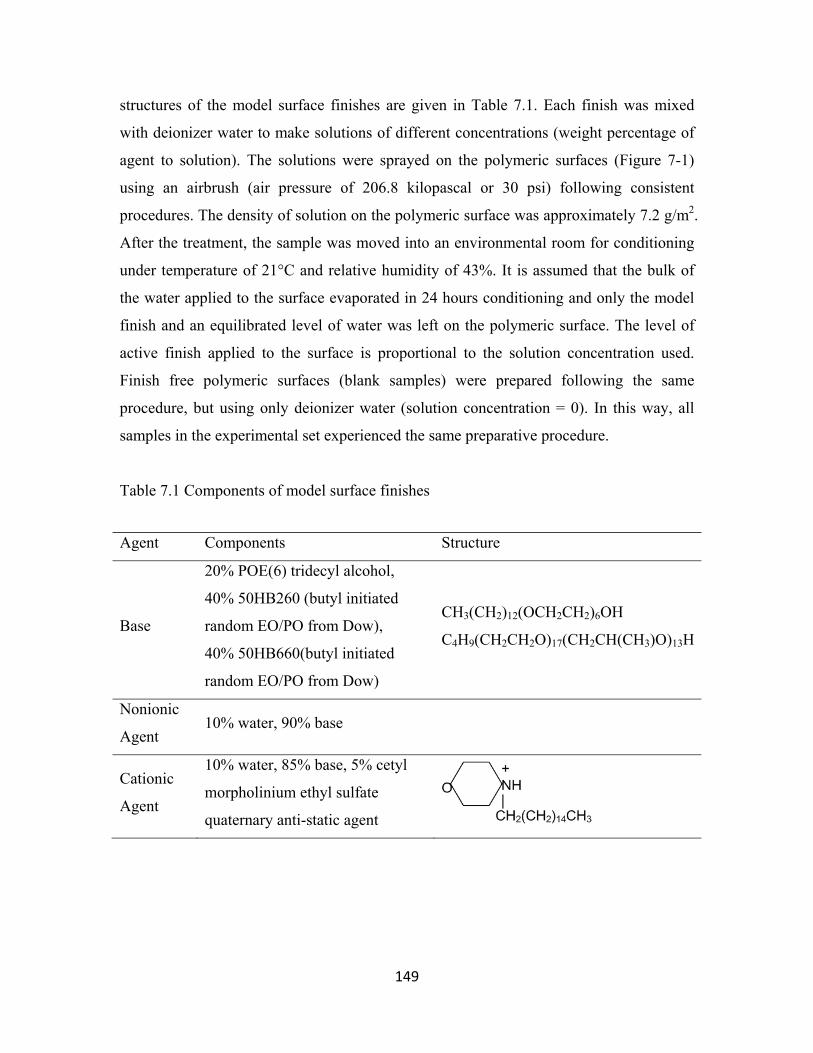
149
structures of the model surface finishes are given in Table 7.1. Each finish was mixed
with deionizer water to make solutions of different concentrations (weight percentage of
agent to solution). The solutions were sprayed on the polymeric surfaces (Figure 7-1)
using an airbrush (air pressure of 206.8 kilopascal or 30 psi) following consistent
procedures. The density of solution on the polymeric surface was approximately 7.2 g/m2.
After the treatment, the sample was moved into an environmental room for conditioning
under temperature of 21°C and relative humidity of 43%. It is assumed that the bulk of
the water applied to the surface evaporated in 24 hours conditioning and only the model
finish and an equilibrated level of water was left on the polymeric surface. The level of
active finish applied to the surface is proportional to the solution concentration used.
Finish free polymeric surfaces (blank samples) were prepared following the same
procedure, but using only deionizer water (solution concentration = 0). In this way, all
samples in the experimental set experienced the same preparative procedure.
Table 7.1 Components of model surface finishes
Agent Components Structure
Base
20% POE(6) tridecyl alcohol,
40% 50HB260 (butyl initiated
random EO/PO from Dow),
40% 50HB660(butyl initiated
random EO/PO from Dow)
CH3(CH2)12(OCH2CH2)6OH
C4H9(CH2CH2O)17(CH2CH(CH3)O)13H
Nonionic
Agent 10% water, 90% base
Cationic
Agent
10% water, 85% base, 5% cetyl
morpholinium ethyl sulfate
quaternary anti-static agent

150
Figure 7.1 Schematic of surface treatment by an air brush
7.2.2 Experimental design The effects of surface finishes on the electrification of polymeric surfaces were first
evaluated by contact tests (experimental design I). Experimental trials were conducted on
both PP and nylon surfaces. Since no charging was observed for nylon by contact,
rubbing tests (experimental design II) were carried out, which is viewed as a more severe
mode of electrification. In the contact tests, repeating contacts/separations were
Anionic
Agent
10% water, 85% base, 5%
POE(2)2-ethyl hexyl phosphate
(mix of mono and diester)
Or:

151
conducted between a polymeric sample and a flat stainless steel surface. The charge
generated on the polymeric surface was quantified at the end of each contact/separation
using a Faraday tube. Table 7.2 shows the parameters and levels for the contact tests. The
following contact test conditions were kept unchanged: 10 N contact force, 50 cycles/min
contact frequency, 50 contacts, and 550 points/min data collection rate. The responses are
charge generated on polymeric sample surface after the first contact and charge
accumulated after 50 contacts.
In the rubbing tests, a sample was fixed on a grounded plane and was rubbed by a
flat stainless steel surface automatically. The surface potential of the sample was
continuously monitored by a potential probe. The parameters of rubbing tests are shown
in Table 7.3. The following conditions were kept constant for the rubbing tests: nylon
substrate polymer, 2 N contact force, 25 cycles/min rubbing frequency, 47 mm/sec
rubbing speed, 400 mm/s2 acceleration/deceleration, 52 mm rubbing stroke length (46.48
mm at constant speed + 2.76 mm acceleration + 2.76 mm deceleration), 50 cycles of
rubbing, and 100 points/sec data collection rate. The responses are charge potential of
polymeric sample surface after the first cycle of rubbing, after 50 cycles of rubbing, and
charge decay for 1 minute after the 50th cycle of rubbing. All the experiments were
conducted under temperature of 21°C and relative humidity of 43%.
Table 7.2 Experimental design I
Parameters Levels
Substrate polymeric material PP, nylon 6, 6
Finish Type Nonionic, Anionic, Cationic
Solution Concentration1 (%) 0, 0.025, 0.05, 0.075,0.1
Total Runs 2×3×5×3 replications=90 1 the surface concentration of active finish applied on the polymeric surface was about 0,
1.8, 3.6, 5.4, and 7.2 mg/m2, respectively.

152
Table 7.3 Experimental design I
Parameters Levels
Finish Type Nonionic, Anionic, Cationic
Solution Concentration1 (%) 0, 0.025, 0.05, 0.075,0.1
Total Runs 3×5×3 replications=45 1 the surface concentration of active finish applied on the polymeric surface was about 0,
1.8, 3.6, 5.4, and 7.2 mg/m2, respectively.
7.3 RESULTS AND DISCUSSION
7.3.1 Plate/plate contact electrification The effects of finish type and solution concentration on the charge generation are shown
in Figures 7.2 and 7.3. It is shown that charge generated on PP treated by finishes is
lower than that on PP blank (solution concentration = 0).
Figure 7.2 shows the charge generated on PP after the first contact against
stainless steel. The effects of finish type and solution concentration on the charge
generated after the first contact are not significant, which is characterized by its low value
(absolute charge < 50 pC).
Figure 7.3 shows that, for PP treated by the cationic finish, charge are almost
eliminated when solution concentration is 0.025% (solution composed of 0.025% active
finish and 99.975% water). For PP treated by the nonionic and anionic finishes, the
charge decreased as the solution concentration increased to 0.1% (solution composed of
0.1% active finish and 99.9% water) and the charge generated on PP treated by the
anionic finish was lower than that from PP treated by the nonionic finish. It can be
summarized that charge decreased as the solutions’ concentration increased, and the
cationic finish performed better than the anionic finish, and both of them worked better
than the nonionic finish does.
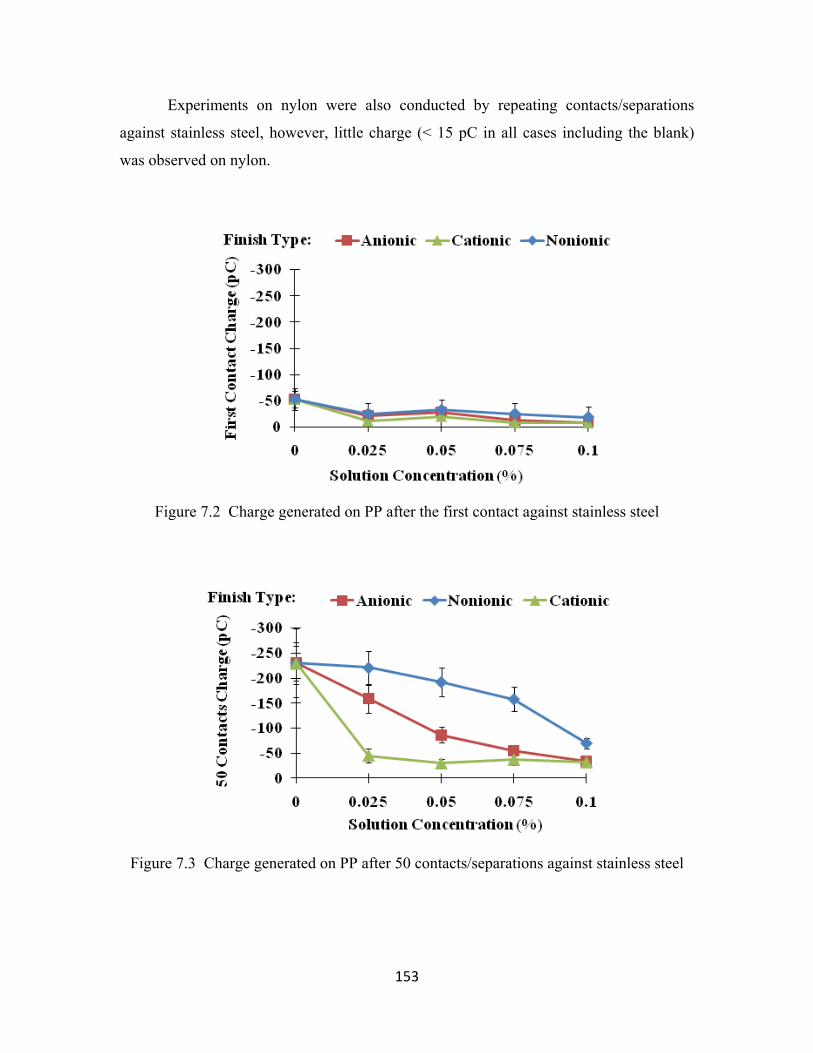
153
Experiments on nylon were also conducted by repeating contacts/separations
against stainless steel, however, little charge (< 15 pC in all cases including the blank)
was observed on nylon.
Figure 7.2 Charge generated on PP after the first contact against stainless steel
Figure 7.3 Charge generated on PP after 50 contacts/separations against stainless steel

154
7.3.2 Plate/plate rubbing electrificationThe nylon surfaces were charged by rubbing against stainless steel flat surface. It was
observed that the nylon surfaces were always positively charged and the charge potential
on a nylon blank surface was about 430 V after 50 cycles of rubbing. However, after
surface treatment by the nonionic finish, the nylon surface potential decreased
significantly as shown in Figure 7.4. It is shown that, both of the charge generated after
the first cycle of rubbing and the charge accumulated after 50 cycles of rubbing decreased
as the solution concentration increased. No charge was observed when the solution
concentration reached 0.1%.
Rubbing experiments were also conducted for nylon treated by the cationic and
anionic finishes, where no charge was observed at any level of treatment application.
Therefore, the cationic and anionic finishes controlled static generation better than the
nonionic finish.
Figure 7.4 Surface charge potential of nylon after the first cycle and 50 cycles of rubbing
against stainless steel

155
The charge dissipation on nylon treated by nonionic solution was also
investigated after the 50 cycles of rubbing as shown in Figure 7.5. The charge on blank
nylon decayed faster than that on the treated surface. The phenomenon of the rate of
decay increase with increasing initial charge was observed and addressed by Ieda, et al.
(1967). In each case, the charge decay seems to involve two components: an initial
exponential decay and a second, nearly linear decay. The experimental data were
regressed and found to fit equation [7-1], [7-2], and [7-3] with R2 value of 0.9923,
0.9791, and 0.8739, respectively:
161 . 230 . [7-1]
. % 82 . 157 . [7-2]
. % 36 . 104 . [7-3]
Each of the equation is the sum of two exponential components. The curves of the
exponential components and their combined regression line are shown in Figure 7.6, 7.7,
and 7.8, respectively. The figures show that one of the components represents the rate of
initial decay and the other represents the level of residual charge.

156
Figure 7.5 Experimental data of charge decay of blank nylon and nylon treated by
nonionic finish after 50 cycles of rubbing against stainless steel and regression curves
Figure 7.6 Experimental data of charge decay on blank nylon and the regression curves

157
Figure 7.7 Experimental data of charge decay on nylon treated by 0.025% nonionic
solution and the regression curves
Figure 7.8 Experimental data of charge decay on nylon treated by 0.05% nonionic
solution and the regression curves

158
Based on these curves, we have several interesting observations:
For the “high rate decay” charge form, the size of the charge generated is
highly dependent on the finish level.
For the “low rate decay” charge form, the size of the charge goes down
with the finish level, but the rate of dissipation also decreases with finish
level.
The two types of decay observed here strongly suggest that there are two types of charge
on the surface, each with a different decay mechanism. This possibility will be the subject
of future research in this area.
7.3.3 Comparison with results of industrial yarn/pin rubbing electrification Besides PP and nylon heavy films, nylon yarns were also treated by these three finishes.
Experiments were conducted by the industry collaborator; Goulston Technologies, Inc.
Charge was generated on a continuous nylon filament yarn when it was transported
across a chrome pin. The nylon filament yarns were treated with 0.5% of weight
percentage of active finish, which lead to about 7 mg/m2 of the surface concentration. It
was found that the yarn surface potential was reduced dramatically after the treatment.
The charge generated on yarn treated by the anionic and cationic solutions were even
lower than that treated by the nonionic solution. Figure 7.9 shows the mean values of
yarn surface charge potential.

159
Figure 7.9 Surface charge potential of nylon yarns by moving over a chrome pin (surface
concentration of active finish: 7 mg/m2, nylon yarns: 200 denier/60 filaments, yarn speed:
300 m/min, yarn input tension: 20 gf, charging pin size: 2 cm in diameter, contact angle:
90°) (Goulston Technologies, Inc.)
Although different devices were used for investigating the antistatic effect of
those three agents and test conditions were significantly different (speed, surface area,
etc.), the same overall tendency was observed. In both of the contact and frictional
electrification, the nonionic treatment gave significant reduction in static generation and
the ionic materials generated little or no charge.
The resistance of the finish free nylon yarn is measured as 1014 ohm. The
resistance of nylon yarns coated by those three finishes at the concentration of 7 mg/m2
was as follows:
1012 ohm for yarns treated by the nonionic solution
109.5 ohm for yarns treated with the anionic solution
1012 ohm for yarns treated by the cationic solution
From this result, we can see that the anionic antistatic agent give a significant
improvement in the conductivity of the nylon yarns. The cationic treatments give small

160
improvement in conductivity. This could be associated with the commercial use
observation that cationic materials strongly absorb to the surface of nylon. This gives an
ionic coating on the surface, but with little ionic mobility, and thus small decrease in
resistance. However, all experiments results showed the cationic agent reduced charge
generation as effectively, or even better than the anionic treatment (Figures 8 and 11).
This suggests different antistatic mechanism for the cationic and the anionic solutions.
For the surface coated with the anionic solution, the surface’s resistivity was reduced and
the improved charge conductivity may well have been a significant component of the
static control mechanism. For the surface treatment based on the cationic agent, the
surface’s resistance is the same as the nonionic treatment. This suggests that the
reduction in charge by the cationic treatment must be based on controlling the charge
generation. The surface of the substrate nylon has been modified by absorption of the
cationic material. This change modifies the charge generation process at the nylon
surface, reducing the amount of charge generated by rubbing against the metal pin. Such
effect needs to be investigated further to confirm the overall behaviour.
7.4 Conclusions The PP and nylon flat surfaces were treated by three different finishes, nonionic, cationic,
and anionic, at four levels of solution concentration (0.025%, 0.05%, 0.075%, and 0.1%).
The electrostatic properties of the PP and nylon surfaces with/without treatment were
investigated by contact tests and rubbing tests.
The contact tests revealed that charge accumulated on PP surfaces after
contacts/separations against stainless steel decreased as the applied solution concentration
increased. The antistatic effect of the cationic finish was better than that of the anionic
finish, and both of them were better than that of the nonionic finish. No charge was
observed on nylon surfaces.
The rubbing tests showed that charge accumulated on nylon surfaces after rubbing
against stainless steel decreased as the applied nonionic solution concentration increased.

161
There was no charge generated on nylon surfaces at any applied concentration of cationic
and anionic finishes.
Tribo-electrification was also investigated on nylon yarns moving across a
chrome pin. The experiments indicated all the three agents reduce or eliminate static
charge generation at an applied level of 7 mg/m2, and the antistatic effect of the cationic
agent was the best.
Several areas for future investigations were identified:
In frictional charging of nylon, there appears to be two types of charge, one controlled
by traditional lubricant system and the other, more stable with time, and not impacted
by the presence of the lubricant treatment.
Although the charge conductivity of nylon treated by the cationic agent was similar to
that treated by the nonionic agent (resistivity was 1012 ohm for both yarns), the
cationic agent appears to be absorbed to the polymer surface and changes the
propensity of nylon to generate charge. This is obviously an interesting behavior and
warrants further investigation.
References
Holme, I., McIntyre, J.E., and Shen, Z.J. (1998). Electrostatic charging of textiles. Textile Progress, 28(1), p. 1-85.
Kan, C.W. and Yuen, C.W.M. (2008). Static properties and moisture content properties of polyester fabrics modified by plasma treatment and chemical finishing. Nuclear Instruments and Methods in Physics Research B. 266(1), p. 127-132. Kowalski, J.M. and Wroblewska, M. (2006). Premises for practical valuation of the anti-electrostatic properties of protective garments. Fibres and Textiles in Eastern Europe, 14(5), p. 23-28. Lo, L.Y., Li, Y., Yeung, K.W., and Yuen, C.W.M. (2007). Indicating the development stage of nanotechnology in the textile and clothing industry. International Journal of Nanotechnology, 4(6), p. 667-679.

162
Seyam, A.M., Cai, Y., and Oxenham, W. (2009). Devices for measuring electrostatic generation and dissipation on the surfaces of polymeric materials. Journal of Textile Institute. 100(4), p. 338-349. Seyam, A.M., Liu, L., Hassan, Y.E., Abid, S.A., and Oxenham, W. (2008). Static generation and dissipation of textile fabrics and films. Proceedings of the Textile Institute 86th World Conference, Hong Kong.

163
8 OVERALL CONCLUSIONS
164
In this work, three testing systems, linear system, rubbing system, and contact system,
were used to study contact and frictional electrification on polymeric surfaces. The
advanced devices and precisely controlled experiments allow a comprehensive study of
electrostatic behavior of polymeric surfaces. Four sets of studies were designed and
carried out:
Frictional electrification between yarn and pin (Chapter 4),
Frictional electrification between parallel polymeric plates (Chapter 5),
Contact electrification between polymeric plates (Chapter 6),
Frictional and contact electrification on polymeric surfaces (plates and yarns)
treated by antistatic finishes (Chapter 7).
The conclusions of each study have been given at the end of each Chapter. Here is a
comparison and summary of results from the four studies:
In both contact and frictional electrification, it is found that charge increased as
the number of contacts or rubbing cycles increased. The reasons for charge accumulation
are discussed in section 5.3.2. After repeating cycles of rubbing, the magnitude of charge
reaches the saturation after 40-50 cycles of rubbing for nylon. However, it reaches the
saturation after only 2-3 cycles of rubbing for PP and PTFE. This could be explained by
the difference of their charge dissipation properties. The saturation value is reached when
the charge generation and dissipation get a balance. It was found that charge decays
exponentially on nylon and the charge retained on nylon is about 60% or less after 30
seconds, but the charge does not decay on PP or PTFE during 30 seconds of observation.
The reasons for why different polymers have different charge dissipation properties were
given in section 5.4.1. One of the reasons is that charge can spread along the nylon
surface, but cannot move on the other two surfaces.
The frictional electrification on both polymeric plates and yarns indicate that, the
magnitude of charge generated on PP was less than that on nylon. On one hand, this
could be due to the fact that polar groups exist in the chemical structure of nylon, which
can provide electrons or ions to contribute to the charge transferring. On the other hand,
this might be also related to the high crystallinity of PP. As a result of high crystallinity,

165
fewer chemical segments, which could provide electrons or ions, appear on the PP
surface.
Both frictional and contact electrification show that, charge increased as the
contact force increased. This could be explained by the increase of contact area between
two contacted surfaces. In addition, more chemical segments could be broken under a
high contact force, which would provide more electrons or ions to contribute to the
charge transferring, therefore, promote charge generation.
The frictional charging is more complicated than the contact electrification
because the former one is influenced by the rubbing speed. It is shown that more charge
was generated due to rubbing than repeating contacts/separations. In regard to the effect
of rubbing speed, it is clearly shown that charge increases as the relative rubbing speed
increases from 400 mm/sec to 1600 mm/sec. However, the effect of rubbing speed was
not obvious in slow rubbing motion (27 ~ 94 mm/sec).
The studies of charge generated on finish free polymeric surfaces provide the
reference for whether a polymer requires antistatic finish treatment to reduce/eliminate
the electrostatic problems during processing or consumer using. The experiments of
contact and frictional electrification on nylon and PP treated by three types of finishes
indicated that: ionic finishes perform better than nonionic finish; cationic finish works
better than anionic finish and the charge was controlled based on different mechanism for
cationic and anionic treated nylon.
In conclusion, this work provides a better understanding of the electrostatic
behaviours of commonly used textile materials, nylon, PP, PET, and PTFE. The effect of
different parameters on the charge generation and dissipation of these materials were
investigated and analyzed. Based on these studies, suggestions were given to industry for
eliminating static generated in textile processing, such as using rotating rollers instead of
fixed guiders. Furthermore, to eliminate the charge, antistatic finishes were applied on
top of the polymers. The effects of different finishes with suitable level of applied
concentration of finish are suggested.

166
APPENDICES

167
A. Experiment procedure of linear test
Experiment Preparation:
1. Clean the friction pin with alcohol
2. Wind the yarn on CTT
3. Open the LJStream software for recording the voltage
Set the parameters as follows:
a. Set the back panel parameters as:
Chanel Voltage Connector
A Y=v*1000 A12
B Y=v*1000 A10
b. Set the data collection rate as:
Yarn Speed (meter/min) Data Collection Rate (points/sec)
50 50
100 100
300 300
c. Select a file to save the data
Zero-check Probe and Set Its Position:
4. Turn on the voltmeters
5. Remove the yarn to the back of the metal ground plate
6. Move the probe close to the metal ground plate (as close as possible but without
touch)
7. Turn the “balance” button till it shows 0 on the voltmeter panel

168
8. Move the probe far from the metal ground plate (as far as possible on the probe
holder)
9. Turn the “zero” button till it shows 0 on the voltmeter panel
10. Repeat procedure 5 to 9 till it always shows 0
11. Make sure the distance from the yarn to the metal ground plate is kept as 6 mm, and
the distance from the end of the probe to the yarn is 3 mm.
Test:
12. Hand in the speed of yarn on CTT panel
13. Check the required speed of friction pin
14. Start the CTT
15. Set the tension on the left side of the CTT
16. Turn on the motor at required speed level for the friction pin
17. Use the Tachometer to measure the real rotating speed of the friction pin
18. Adjust the speed of the friction pin till the reading of Tachometer is the required
speed
19. Keep them running for about 5 second till it is stable.
20. Click the button on potential measurement panel on the computer to star recording the
potential detected on two probes
21. Click “Stop” on the front panel of CTT after certain time (about 5 seconds at 300
m/min, 15 seconds at 100 m/min, and 30 seconds at 50 m/min)
22. Stop data recording
23. Repeat step 13 to 24 for next run
24. Turn off the gas supply outside the environmental room after finish all the tests

169
Apply Probe Adapter:
1. Measure the yarn potential without the adepter, record the data shown on the
voltmeter panel
2. Take the probe off from the holder
3. Fix the adepter onto the end of the probe
4. Put the probe back onto the holder
5. Measure the same position of the yarn
6. If it does not show 1/10 of the value got before applying adepter, then take the probe
off again, and modify the position of the adaptor until it can read the same value (if
the value shows higher than that without adepter, then pull the adaptor a little bit
tighter to the end of the probe, vice versa.)
Safety Information
1. Cover the back end of the probe surface by insulate tape
2. Do not touch the probe by hand when the voltmeter is on (you may get a shock!)
3. Do not put any conductor close to the end of the probe
4. Avoid the cable of the probes crossing or close to any EMF sauce

170
B. Experiment procedure of rubbing test
1. Set up distance from the end of the probe to the sample surface to be constant as 3
mm
2. Raise up the rubbing head
3. Discharge the rubbing sample until the initial surface potential is close to zero
4. Push the probe and rubber to the very beginning position
5. Hand in the parameters of movement on computer based on the information below:
Software motor configuration: 2000 steps/r
Stepper motor property: 7.5°/step = 0.008 inch/step = 0.2032 mm/step
Calculation between software parameter setup to motor real movement:
e.g. when speed is 7 r/min, that is 7/60 (r/s) x 2000 steps/r x 0.2032mm/step = 47.4 mm
e.g. when acceleration is 25 r/s2, that is 25 r/s2 x 2000 steps/r x 0.2032mm/step = 10150
mm/s2
Speed Acceleration Stroke Length
Ideal probe eye-to-rubbing head edge
distance 25mm
width head 10 width
head r/min mm/s rps^2 mm/s^2 steps mm mm mm
3 20.3 vibrate 0.4 162 smooth 120 24.4 N/A 7.2 4 27.1 smooth 0.5 203 smooth 200 40.6 7.8 15.3 5 33.8 vibrate 0.6 244 smooth 250 50.8 12.9 20.4 6 40.6 smooth 0.8 325 smooth 270 54.8 14.9 22.4 7 47.4 smooth 1 406 smooth 8 54.1 smooth 2 812 smooth 9 60.9 smooth 4 1624 smooth 10 67.7 smooth 5 2030 smooth 11 74.4 smooth 10 4060 smooth 12 81.2 smooth 20 8120 smooth 13 88.0 smooth 25 10150 smooth 14 94.7 smooth 50 20300 smooth 15 101.5 vibrate 100 40600 smooth

171
6. Put required load on top of the rubbing head
7. Release the rubbing head to contact the rubbing plate
8. Turn on the stepper motor.
9. Turn on the voltmeter.
10. Start the movement
11. Stop the movement when the probe is above center of the rubbing area, after finishing
required number of rubbing cycles
12. Turn off the motor
13. Keep reading the surface potential of rubbing plate for 30 seconds
14. Stop reading
15. Turn off the voltmeter
16. Check the surface potential data

172
C. Experimental procedure of contact test
The contact test procedure consists of the sample initial charge checking, the sample and
the electrometer setting, the contact movement controlling, and the contact force
monitoring. The electrometer is controlled by the “ExceLINX”. The contact movement is
programmed by the “LabVIEW”, and the contact force is recorded by the “LJstream”.
Sample Initial Charge Checking:
1. Put a clean contact head sample onto the end of the movable rod using clean metal
tweezers
2. Clean the contact head using the neutralizing gas
3. Keep the contact head outside the Faraday tube
4. Turn on “Zero check” function of the electrometer and start it
5. Turn off the “Zero check” function of the electrometer and start it
6. Move the contact head into the Faraday tube by pushing the movable rod manually
7. Check the charge shown on the electrometer when the contact head is inside the
Faraday tube
8. Stop the electrometer
9. Move the contact head outside the Faraday tube by pulling the movable rod manually
10. Repeat step 2 to 9 until no charge measured in step 7
11. Mount a clean contact plate onto the plate holder
12. Clean the contact plate using the neutralizing gas
13. Check the plate surface potential using a probe (Figure 4-14)
14. Repeat step 12 and 13 until the potential measured is zero
Electrometer and Sample Setting:
15. Check the configuration parameters in the “ExceLINX” software (example shown in
Figure L-1). For the data collection rate, “Rate=0.5” means the data collection rate is
about 1 point/sec and “Rate=10” means the data collection rate is about 0.5 point/sec.
16. “Zero check” the electrometer when the contact head (no charge measured) is outside
the Faraday tube
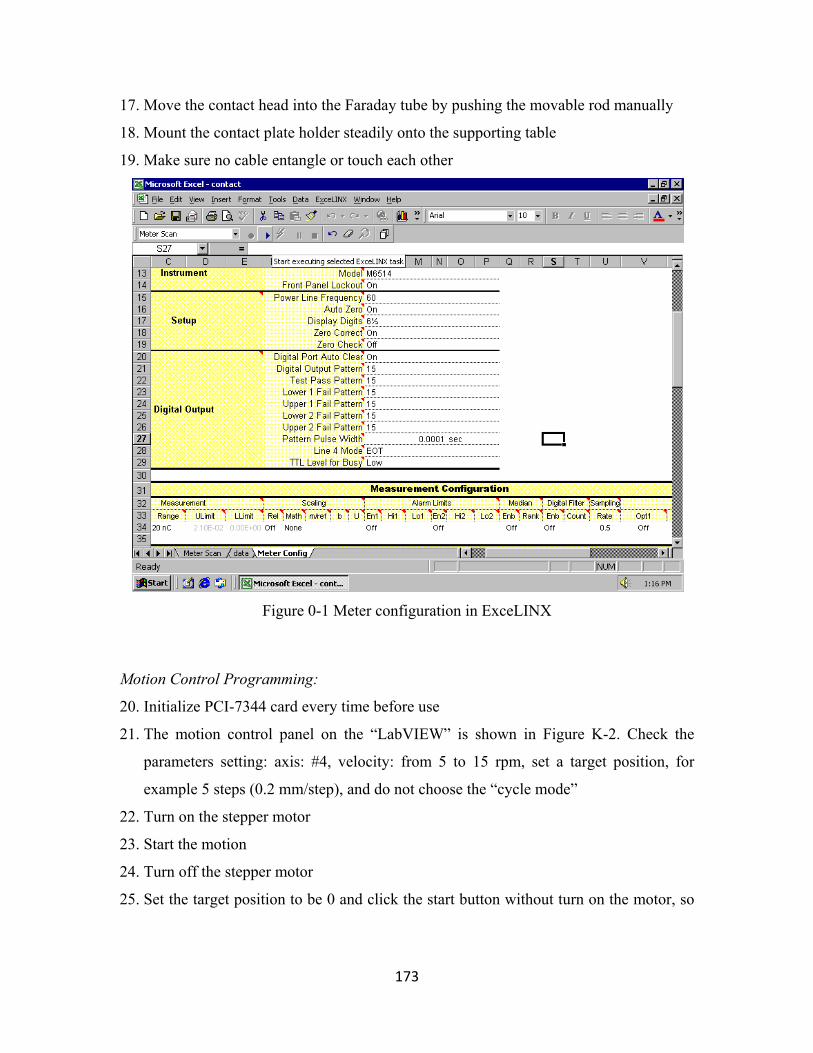
173
17. Move the contact head into the Faraday tube by pushing the movable rod manually
18. Mount the contact plate holder steadily onto the supporting table
19. Make sure no cable entangle or touch each other
Figure 0-1 Meter configuration in ExceLINX
Motion Control Programming:
20. Initialize PCI-7344 card every time before use
21. The motion control panel on the “LabVIEW” is shown in Figure K-2. Check the
parameters setting: axis: #4, velocity: from 5 to 15 rpm, set a target position, for
example 5 steps (0.2 mm/step), and do not choose the “cycle mode”
22. Turn on the stepper motor
23. Start the motion
24. Turn off the stepper motor
25. Set the target position to be 0 and click the start button without turn on the motor, so

174
that the “present position” on the computer goes back to 0, but the truly position stays
at 5, so that the stepper motor will not be bumped directly in the movement
26. Set the target position, for example 120 and choose the cycle mode
Contact Force Monitoring
27. The interface of the “LJstream” is shown in Figure K-3. Check the parameters setting
shown in Figure K-4 (channel B: AI6, channel C: AI7, channel D: AI(6-7), gain for
channel D: 20(+/-1V))
28. Choose a file to save the data of contact force and click “write to file” before test
Figure 0-2 Parameters for controlling contact motion

175
Figure 0-3 Working status of LJstream
Figure 0-4 Parameter for recording the contact force

176
Test:
29. Start the electrometer through the “ExceLINK”
30. Start the contact force monitoring through the “LJstream”
31. Turn on the stepper motor
32. Start the contact movement through the “LabVIEW”
33. After required number of cycles or until the electrometer reading reaches the 2500
reading buffer (“*” symbol disappears), stop the contact movement through the
“LabVIEW”
34. Turn off the stepper motor
35. Stop the electrometer measurement through the “ExceLINK”
36. Stop the force recording through the “LJstream”
37. Wait about 3 minute for the data transferring from the electrometer to the computer
through the “ ExceLINX”
38. Check the measured charge signal
39. Check the detected contact force signal
40. Move the contact plate holder away from the supporting table
41. Take the contact head off the rod

177
D. Raw data of Chapter 4: Frictional electrification of yarn and pin
Raw data of experimental design I:
Pin Diameter = 25.4 mm
Vy=50m/min
Run Sequence # 15 4 7 8 23 9 16 11 19
Relative Speed (Vy-Vp) m/min -150 -100 -50 -25 0 25 50 100 150
Pin Surface Speed (Vp), m/min 200 150 100 75 50 25 0 -50 -100
Pin Rotational Speed, rev/min 2508 1881 1254 940 627 313 0 -627 -1254
Measurement Responses:
Potential-I Average, V -358 -374 -267 -219 -24 -385 -516 -716 -728
Potential-I Average, V (absolute value)358 374 267 219 24 385 516 716 728
STDEV, V 35 27 22 20 4 34 35 52 48
Potential-II Average, V -453 -457 -322 -269 -46 -472 -625 -899 -967
STDEV, V 40 29 22 20 6 37 40 63 62
Tout, cN 11 13 19 25 51 97 116 127 133
STDEV, cN 5.4 5.1 5.3 4.1 4.0 11.8 8.7 28.0 25.0
Pin Rotational Frequency, Hz 41.8 31.4 20.9 15.7 10.5 5.2 0.0 10.5 20.9
Vibration Amplitude, dB -65.7 -83.5 -83.8 -84.2 -85.8 -88.2 N/A -85.8 -92.7
STDEV, dB 0.3 6.7 7.6 8.6 6.1 8.3 N/A 6.1 8.7
Calculated Responses:
Contact Force (Normal Force), cN 30.7 31.7 34.6 37.5 50.7 73.5 83.0 88.5 91.7
Friction Force (Tangential Force), cN 33.5 31.8 26.7 21.7 1.1 40.7 57.2 66.7 72.2
Coefficient of Friction 1.4 1.3 0.9 0.7 0.0 0.6 0.8 0.9 0.9
Vibration Force, cN 0.052 0.007 0.006 0.006 0.005 0.004 N/A 0.005 0.002

178
Raw data of experimental design I continued:
Pin Diameter = 25.4 mm
Vy=100m/min
Run Sequence # 26 1 18 27 25 14 20 24 12
Relative Speed (Vy-Vp) m/min -150 -100 -50 -25 0 25 50 100 150
Pin Surface Speed (Vp), m/min 250 200 150 125 100 75 50 0 -50
Pin Rotational Speed, rev/min 3135 2508 1881 1567 1254 940 627 0 -627
Measurement Responses:
Potential-I Average, V -270 -242 -234 -152 -46 -267 -332 -444-513
Potential-I Average, V (absolute value)270 242 234 152 46 267 332 444 513
STDEV, V 20 20 16 12 4 16 17 30 26
Potential-II Average, V -352 -310 -291 -209 -76 -337 -424 -570-667
STDEV, V 27 24 16 15 5 17 22 38 34
Tout, cN 6 9 18 23 50 91 105 110 128
STDEV, cN 2.8 2.9 3.3 2.8 2.4 5.5 8.0 8.6 14.5
Pin Rotational Frequency, Hz 52.2 41.8 31.4 26.1 20.9 15.7 10.5 0.0 10.5
Vibration Amplitude, dB -58.6 -58.6 -82.5 -91.7 -92.7 -86.8 -91.8 N/A -84.9
STDEV, dB 0.3 0.3 7.0 7.6 9.3 8.4 7.7 N/A 5.6
Calculated Responses:
Contact Force (Normal Force), cN 28.2 29.7 34.0 36.4 49.8 70.3 77.5 79.8 88.9
Friction Force (Tangential Force), cN 37.8 35.2 27.7 23.6 0.4 35.1 47.6 51.6 67.5
Coefficient of Friction 2.0 1.6 1.0 0.8 0.0 0.6 0.7 0.7 0.9
Vibration Force, cN 0.118 0.118 0.007 0.003 0.002 0.005 0.003 N/A 0.006

179
Raw data of experimental design I continued:
Pin Diameter = 25.4 mm
Vy=150m/min
Run Sequence # 22 3 5 17 13 10 2 21
Relative Speed (Vy-Vp) m/min -150 -100 -50 -25 0 25 50 100
Pin Surface Speed (Vp), m/min 300 250 200 175 150 125 100 50
Pin Rotational Speed, rev/min 3761 3135 2508 2194 1881 1567 1254 627
Measurement Responses:
Potential-I Average, V -265 -359 -285 -191 -76 -385 -581 -597
Potential-I Average, V (absolute value) 265 359 285 191 76 385 581 597
STDEV, V 17 18 17 11 6 34 27 23
Potential-II Average, V -335 -443 -347 -239 -113 -472 -690 -644
STDEV, V 22 19 18 11 7 37 29 53
Tout, cN 6 13 20 26 50 97 103 120
STDEV, cN 2.1 2.0 2.2 1.9 2.0 11.8 5.5 11.7
Pin Rotational Frequency, Hz 62.7 52.2 41.8 36.6 31.4 26.1 20.9 10.5
Vibration Amplitude, dB -59.5 -59.5 -64.4 -74.6 -85.3 -82.5 -85.1 -91.7
STDEV, dB 0.3 0.3 1.2 3.8 6.3 7.0 6.9 7.6
Calculated Responses:
Contact Force (Normal Force), cN 28.2 31.6 34.8 38.0 50.2 73.5 76.3 84.8
Friction Force (Tangential Force), cN 37.8 32.0 26.3 20.8 0.3 40.7 45.6 60.3
Coefficient of Friction 2.0 1.3 0.9 0.6 0.0 0.6 0.7 0.8
Vibration Force, cN 0.106 0.106 0.060 0.019 0.005 0.007 0.006 0.003

180
Raw data of experimental design I continued:
Pin Diameter = 6.35 mm
Vy=50m/min
Run Sequence # 12 13 1 2 3 4 5 17
Relative Speed (Vy-Vp) m/min -100 -50 -25 0 25 50 100 150
Pin Surface Speed (Vp), m/min 150 100 75 50 25 0 -50 -100
Pin Rotational Speed, rev/min 7523 5015 3761 2508 1254 0 -2508 -5015
Measurement Responses:
Potential-I Average, V -499 -284 -231 -42 -338 -540 -1120 -1212
STDEV, V 54 31 25 6 38 83 176 229
Potential-II Average, V -542 -309 -270 -17 -379 -565 -1235 -1306
STDEV, V 51 32 28 8 46 95 212 247
Tout, cN 29.8 35.2 37.0 48.7 70.0 74.7 82.4 86.6
STDEV, V 2.2 2.0 1.8 3.9 3.9 5.2 9.0 11.0
Pin Rotational Frequency, Hz 125 84 63 42 21 0 42 84
Vibration Amplitude, dB -60.2 -61.5 -70.6 -76.9 -81.8 N/A -82.1 -61.3
STDEV, dB 3 0 3 7 8 N/A 5 0
Calculated Responses:
Contact Force (Normal Force), cN 39.9 42.6 43.5 49.4 60.0 62.3 66.2 68.3
Friction Force (Tangential Force), cN17.5 12.8 11.3 1.1 17.4 21.4 28.1 31.7
Coefficient of Friction 0.49 0.34 0.29 0.02 0.32 0.38 0.48 0.52
Vibration Force, cN 0.098 0.084 0.029 0.014 0.008 N/A 0.008 0.086

181
Raw data of experimental design I continued:
Pin Diameter = 6.35 mm
Vy=100m/min
Run Sequence # 7 8 9 10 11 14 15 7
Relative Speed (Vy-Vp) m/min -50 -25 0 25 50 100 150 -50
Pin Surface Speed (Vp), m/min 150 125 100 75 50 0 -50 150
Pin Rotational Speed, rev/min 7523 6269 5015 3761 2508 0 -2508 7523
Measurement Responses:
Potential-I Average, V -449 -397 -78 -468 -780 -1286-1438 -449
STDEV, V 35 31 8 35 81 140 160 35
Potential-II Average, V -491 -438 -75 -471 -915 -1467-1722 -491
STDEV, V 39 35 12 36 99 177 195 39
Tout, cN 36.7 39.1 49.7 69.7 79.6 80.0 84.0 36.7
STDEV, V 2.6 2.6 2.1 2.4 3.5 3.3 3.9 2.6
Pin Rotational Frequency, Hz 125 105 81 63 42 0 42 125
Vibration Amplitude, dB -60.2 -64.4 -63.2 -73.8 -72.3 N/A -82.1 -60.2
STDEV, dB 3 2 0 5 6 N/A 5 3
Calculated Responses:
Contact Force (Normal Force), cN 43.4 44.6 49.8 59.8 64.8 65.0 67.0 43.4
Friction Force (Tangential Force), cN11.5 9.4 0.3 17.1 25.6 26.0 29.4 11.5
Coefficient of Friction 0.30 0.23 0.01 0.32 0.44 0.45 0.50 0.30
Vibration Force, cN 0.098 0.060 0.069 0.020 0.024 N/A 0.008 0.098

182
Raw data of experimental design I continued:
Pin Diameter = 6.35 mm
Vy=150m/min
Run Sequence # 19 17 20 18 21 16 19 17
Relative Speed (Vy-Vp) m/min -25 0 25 50 100 150 -25 0
Pin Surface Speed (Vp), m/min 175 150 125 100 50 0 175 150
Pin Rotational Speed, rev/min 8777 7523 6269 5015 2508 0 8777 7523
Measurement Responses:
Potential-I Average, V -576 -87 -600 -915 -1171 -1552 -576 -87
STDEV, V 32 7 33 88 111 147 32 7
Potential-II Average, V -601 -73 -612 -1062 -1359 -1749 -601 -73
STDEV, V 34 9 40 95 138 185 34 9
Tout, cN 40.6 47.4 69.6 80.1 82.8 82.4 40.6 47.4
STDEV, V 1.6 1.8 2.1 2.7 3.0 2.8 1.6 1.8
Pin Rotational Frequency, Hz 146 125 105 84 42 0 146 125
Vibration Amplitude, dB -57.2 -60.2 -56.6 -62.0 -75.3 N/A -57.2 -60.2
STDEV, dB 2 3 0 0 5 N/A 2 3
Calculated Responses:
Contact Force (Normal Force), cN 45.3 48.7 59.8 65.1 66.4 66.2 45.3 48.7
Friction Force (Tangential Force), cN8.1 2.3 17.0 26.1 28.4 28.0 8.1 2.3
Coefficient of Friction 0.20 0.05 0.32 0.45 0.48 0.48 0.20 0.05
Vibration Force, cN 0.138 0.098 0.148 0.080 0.017 N/A 0.138 0.098

183
Raw data of experimental design II:
Yarn Type: Nylon
Random Run Sequence # 6 5 1 3 2 7 4
Relative Speed (Vy-Vp), m/min -100 -50 -25 0 25 50 100
Pin Surface Speed (Vp), m/min 200 150 125 100 75 50 0
Pin Rotational Speed, rev/min 2508 1881 1567 1254 940 627 0
Measurement Responses:
Potential-I Average, V 5978 4588 3680 2329 4937 5785 9489
STDEV, V 874 706 579 516 756 987 278
Potential-II Average, V 7672 5752 4487 2844 6135 7243 12234
STDEV, V 1226 888 685 625 917 1259 404
Tout, cN 14.7 15.4 15.3 22.4 31.4 32 32.6
STDEV, cN 1 1.1 1 2.2 1.5 1.7 1.4
Motor Rotational Frequency, Hz 41.8 31.3 26.1 20.9 15.7 10.4 0.0
Motor Vibration Amplitude, dB -91.2 -91.1 -90.8 -93.6 -90.4 -90.6 N/A
STDEV, dB 4.3 4.0 3.2 7.8 1.7 2.3 N/A
Calculated Responses:
Contact Force (Normal Force), cN 19.4 19.7 19.7 23.2 27.7 28.0 28.3
Frictioinal Force (Tangential Force), cN8.1 7.4 7.5 1.4 6.4 6.9 7.4
Coefficient of Friction 0.468 0.424 0.430 0.066 0.257 0.275 0.293
Vibration Force, cN 0.00276 0.00279 0.00287 0.00208 0.00300 0.00293

184
Raw data of experimental design II continued:
Yarn Type: PET
Random Run Sequence # 8 14 11 9 10 13 12
Relative Speed (Vy-Vp), m/min -100 -50 -25 0 25 50 100
Pin Surface Speed (Vp), m/min 200 150 125 100 75 50 0
Pin Rotational Speed, rev/min 2508 1881 1567 1254 940 627 0
Measurement Responses:
Potential-I Average, V -3557 -3474 -3448 -3285 -3637 -3745 -3732
STDEV, V 886 466 415 410 519 444 579
Potential-II Average, V -4915 -3761 -4165 -3940 -4436 -4544 -4695
STDEV, V 976 590 523 536 626 550 730
Tout, cN 14.3 14.7 15.3 23.8 34.6 35.7 36.3
STDEV, cN 1.5 1.1 1.2 3.2 2.8 2.8 2.3
Motor Rotational Frequency, Hz 41.8 31.3 26.1 20.9 15.7 10.4 0.0
Motor Vibration Amplitude, dB -91.1737 -91.1027 -91.92 -90.7423 -90.5165 -90.5412 N/A
STDEV, dB 4.3 4.0 5.5 2.7 1.9 2.2 N/A
Calculated Responses:
Contact Force (Normal Force), cN 19.2 19.4 19.7 23.9 29.3 29.9 30.2
Frictioinal Force (Tangential Force), cN8.4 8.1 7.5 0.2 9.2 10.1 10.7
Coefficient of Friction 0.495 0.468 0.430 0.008 0.349 0.379 0.395
Vibration Force, cN 0.00276 0.00279 0.00254 0.00290 0.00298 0.00297 N/A
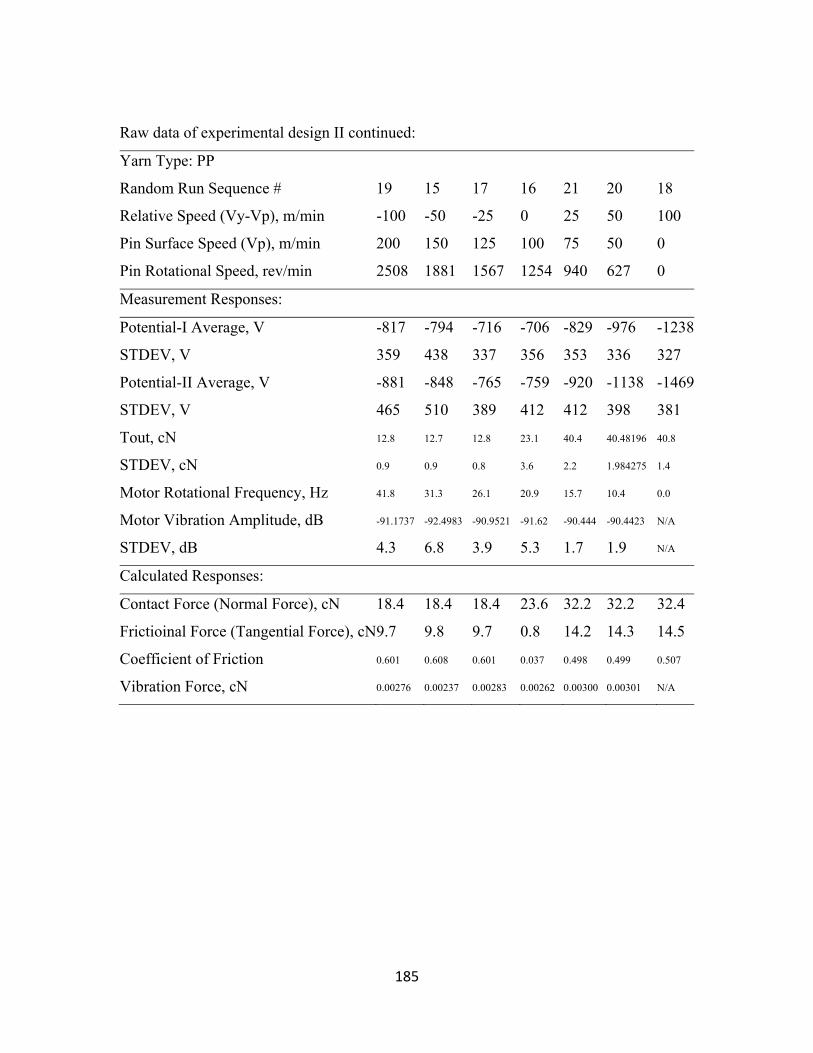
185
Raw data of experimental design II continued:
Yarn Type: PP
Random Run Sequence # 19 15 17 16 21 20 18
Relative Speed (Vy-Vp), m/min -100 -50 -25 0 25 50 100
Pin Surface Speed (Vp), m/min 200 150 125 100 75 50 0
Pin Rotational Speed, rev/min 2508 1881 1567 1254 940 627 0
Measurement Responses:
Potential-I Average, V -817 -794 -716 -706 -829 -976 -1238
STDEV, V 359 438 337 356 353 336 327
Potential-II Average, V -881 -848 -765 -759 -920 -1138 -1469
STDEV, V 465 510 389 412 412 398 381
Tout, cN 12.8 12.7 12.8 23.1 40.4 40.48196 40.8
STDEV, cN 0.9 0.9 0.8 3.6 2.2 1.984275 1.4
Motor Rotational Frequency, Hz 41.8 31.3 26.1 20.9 15.7 10.4 0.0
Motor Vibration Amplitude, dB -91.1737 -92.4983 -90.9521 -91.62 -90.444 -90.4423 N/A
STDEV, dB 4.3 6.8 3.9 5.3 1.7 1.9 N/A
Calculated Responses:
Contact Force (Normal Force), cN 18.4 18.4 18.4 23.6 32.2 32.2 32.4
Frictioinal Force (Tangential Force), cN9.7 9.8 9.7 0.8 14.2 14.3 14.5
Coefficient of Friction 0.601 0.608 0.601 0.037 0.498 0.499 0.507
Vibration Force, cN 0.00276 0.00237 0.00283 0.00262 0.00300 0.00301 N/A

186
E. Raw data of Chapter 5: Frictional electrification of polymeric plates
Raw data of Experimental design I
Rubbing plate: Nylon PTFE PP
Contact force, N: 0.4 1 1.5 2 0.4 1 1.5 2 0.4 1 1.5 2
First cycle average, V 67 61 132 73 236 329 464 413 21 29 42 70
STDEV, V 49 74 94 34 27 73 40 105 3 5 8 15
50 cycle average, V 223 233 257 273 447 579 693 680 31 80 120 143
STDEV, V 92 89 79 30 6 32 15 37 8 6 8 28
Charge retained after 30 seconds, V 111 133 132 111 447 579 693 680 31 80 120 143
STDEV, V 51 54 54 20 6 32 15 37 8 6 8 28
Normalized charge retained, % 49 57 51 40 100 100 100 100 100 100 100 100
STDEV, % 5 3 11 3 0 0 0 0 0 0 0 0
Raw data of Experimental design II
Rubbing plate: Nylon PTFE PP
Speed, mm/s 0 27 47 95 0 27 47 95 0 27 47 95
First cycle average, V 0 80 61 85 0 394 329 371 0 32 29 37
STDEV, V 0 18 74 34 0 10 73 25 0 6 5 6
50 cycle average, V 73 239 233 257 60 578 579 581 61 83 80 86
STDEV, V 6 5 89 31 10 44 32 48 32 0 6 3
Charge retained after 30 seconds, V 47 116 133 130 60 578 579 581 61 83 80 86
STDEV, V 10 23 54 14 10 44 32 48 32 0 6 3
Normalized charge retained, % 64 48 57 51 100 100 100 100 100 100 100 100
STDEV, % 10 11 3 1 0 27 47 95 0 27 47 95
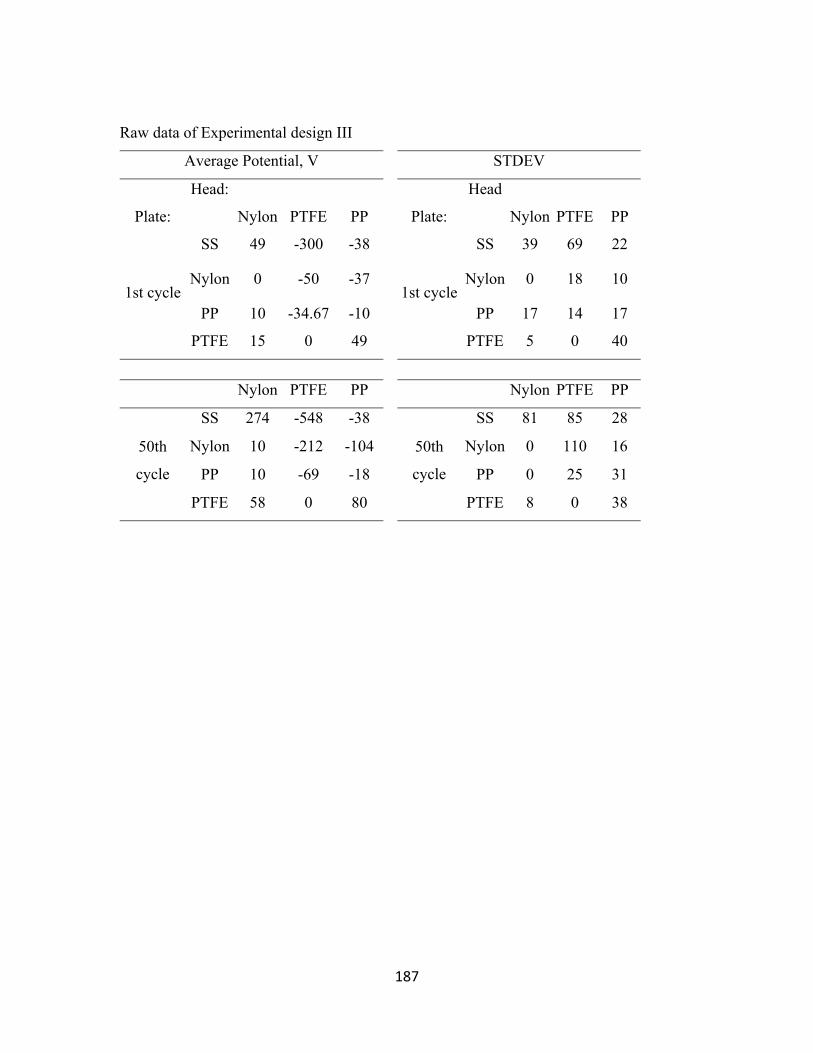
187
Raw data of Experimental design III
Average Potential, V STDEV
Head: Head
Plate: Nylon PTFE PP Plate: Nylon PTFE PP
1st cycle
SS 49 -300 -38
1st cycle
SS 39 69 22
Nylon 0 -50 -37 Nylon 0 18 10
PP 10 -34.67 -10 PP 17 14 17
PTFE 15 0 49 PTFE 5 0 40
Nylon PTFE PP Nylon PTFE PP
50th
cycle
SS 274 -548 -38
50th
cycle
SS 81 85 28
Nylon 10 -212 -104 Nylon 0 110 16
PP 10 -69 -18 PP 0 25 31
PTFE 58 0 80 PTFE 8 0 38
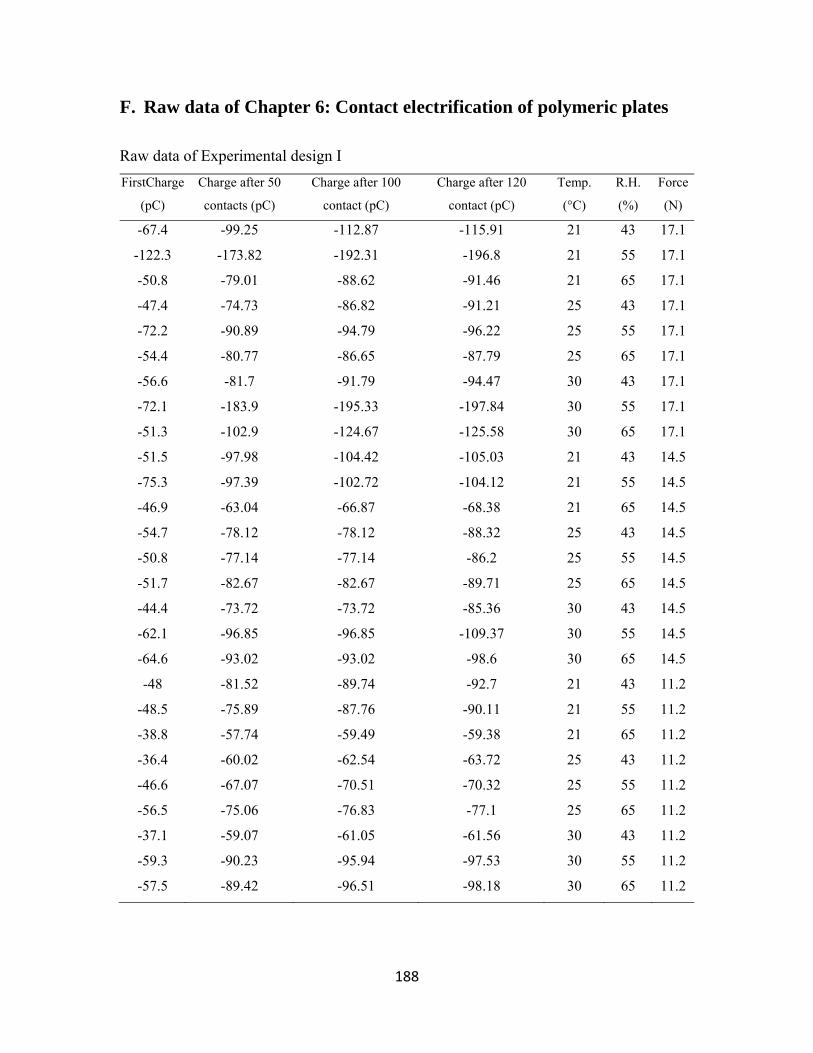
188
F. Raw data of Chapter 6: Contact electrification of polymeric plates
Raw data of Experimental design I
FirstCharge
(pC)
Charge after 50
contacts (pC)
Charge after 100
contact (pC)
Charge after 120
contact (pC)
Temp.
(°C)
R.H.
(%)
Force
(N)
-67.4 -99.25 -112.87 -115.91 21 43 17.1
-122.3 -173.82 -192.31 -196.8 21 55 17.1
-50.8 -79.01 -88.62 -91.46 21 65 17.1
-47.4 -74.73 -86.82 -91.21 25 43 17.1
-72.2 -90.89 -94.79 -96.22 25 55 17.1
-54.4 -80.77 -86.65 -87.79 25 65 17.1
-56.6 -81.7 -91.79 -94.47 30 43 17.1
-72.1 -183.9 -195.33 -197.84 30 55 17.1
-51.3 -102.9 -124.67 -125.58 30 65 17.1
-51.5 -97.98 -104.42 -105.03 21 43 14.5
-75.3 -97.39 -102.72 -104.12 21 55 14.5
-46.9 -63.04 -66.87 -68.38 21 65 14.5
-54.7 -78.12 -78.12 -88.32 25 43 14.5
-50.8 -77.14 -77.14 -86.2 25 55 14.5
-51.7 -82.67 -82.67 -89.71 25 65 14.5
-44.4 -73.72 -73.72 -85.36 30 43 14.5
-62.1 -96.85 -96.85 -109.37 30 55 14.5
-64.6 -93.02 -93.02 -98.6 30 65 14.5
-48 -81.52 -89.74 -92.7 21 43 11.2
-48.5 -75.89 -87.76 -90.11 21 55 11.2
-38.8 -57.74 -59.49 -59.38 21 65 11.2
-36.4 -60.02 -62.54 -63.72 25 43 11.2
-46.6 -67.07 -70.51 -70.32 25 55 11.2
-56.5 -75.06 -76.83 -77.1 25 65 11.2
-37.1 -59.07 -61.05 -61.56 30 43 11.2
-59.3 -90.23 -95.94 -97.53 30 55 11.2
-57.5 -89.42 -96.51 -98.18 30 65 11.2

189
Raw data of Experimental design II
50 contact charge, pC
Head Plate 30°C, 43%30°C, 55%30°C, 65%21°C, 43%21°C, 55% 21°C, 65%
Nylon -73.7 -96.9 -93.0 -98.0 -97.4 -63.6
Teflon PP -3.1 -0.7 -15.5 -84.6 -2.9 -42.6
Metal -64.3 -41.2 -12.0 -61.3 -7.9 -55.1
Teflon 10.6 0.0 5.4 15.9 15.3 0.0
Nylon PP 12.2 0.0 7.9 0.5 0.0 0.0
Metal 0.0 0.0 0.0 2.2 0.0 0.0
Teflon 93.4 74.9 83.0 49.7 40.0 7.7
PP Nylon -148.6 -90.8 -93.8 -56.8 -77.9 -68.0
Metal -67.3 -33.2 -37.0 -46.4 -5.7 -2.6
First contact charge, pC
Head Plate 30°C,
43%
30°C,
55%
30°C,
65%
21°C,
43%
21°C,
55%
21°C,
65%
Nylon -44.4 -62.1 -64.6 -51.5 -75.3 -46.9
Teflon PP -14.2 -23.4 -21.8 -6.5 -20.1 -38.2
Metal -24.4 -43.6 -6.3 -27.7 -7.9 -23.9
Teflon 8.7 0.0 4.2 15.9 15.3 0.0
Nylon PP 7.6 0.0 7.3 0.8 0.0 0.0
Metal 0.0 0.0 0.0 1.1 0.0 0.0
Teflon 28.7 23.8 17.8 17.8 17.5 1.9
PP Nylon -53.0 -80.4 -37.2 -26.4 -27.1 -29.2
Metal -7.9 -17.4 -16.7 -22.3 -5.1 -2.6
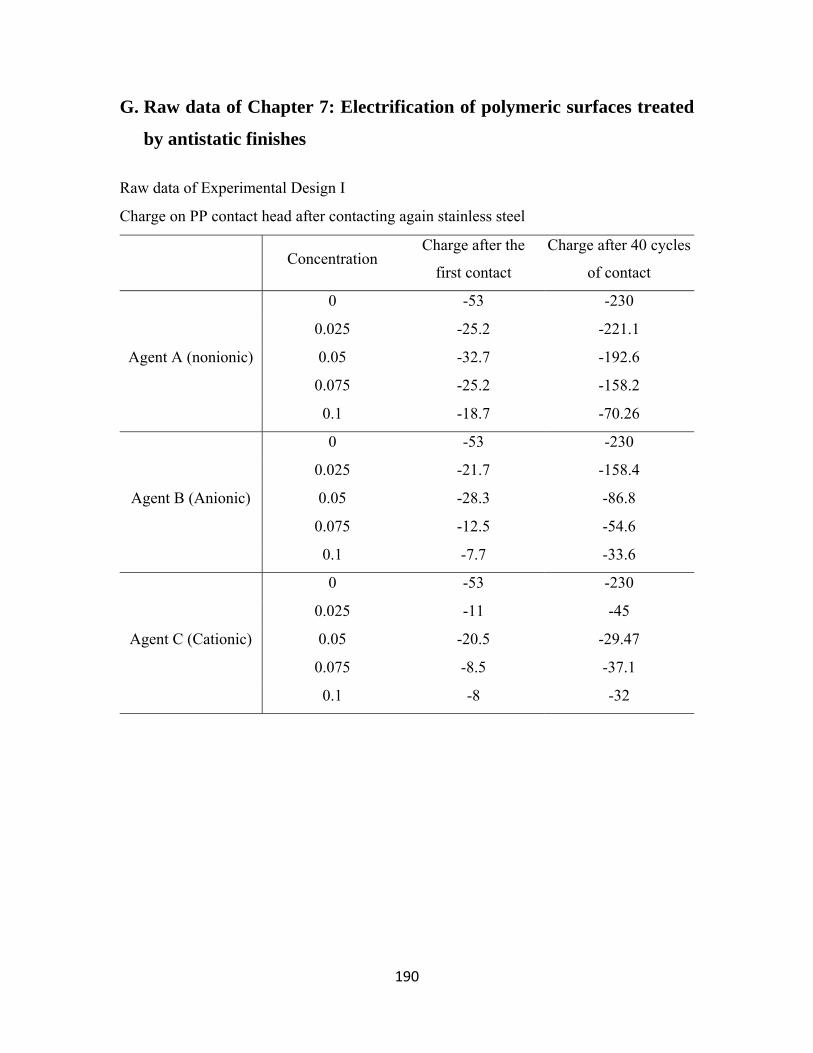
190
G. Raw data of Chapter 7: Electrification of polymeric surfaces treated
by antistatic finishes
Raw data of Experimental Design I
Charge on PP contact head after contacting again stainless steel
Concentration
Charge after the
first contact
Charge after 40 cycles
of contact
Agent A (nonionic)
0 -53 -230
0.025 -25.2 -221.1
0.05 -32.7 -192.6
0.075 -25.2 -158.2
0.1 -18.7 -70.26
Agent B (Anionic)
0 -53 -230
0.025 -21.7 -158.4
0.05 -28.3 -86.8
0.075 -12.5 -54.6
0.1 -7.7 -33.6
Agent C (Cationic)
0 -53 -230
0.025 -11 -45
0.05 -20.5 -29.47
0.075 -8.5 -37.1
0.1 -8 -32
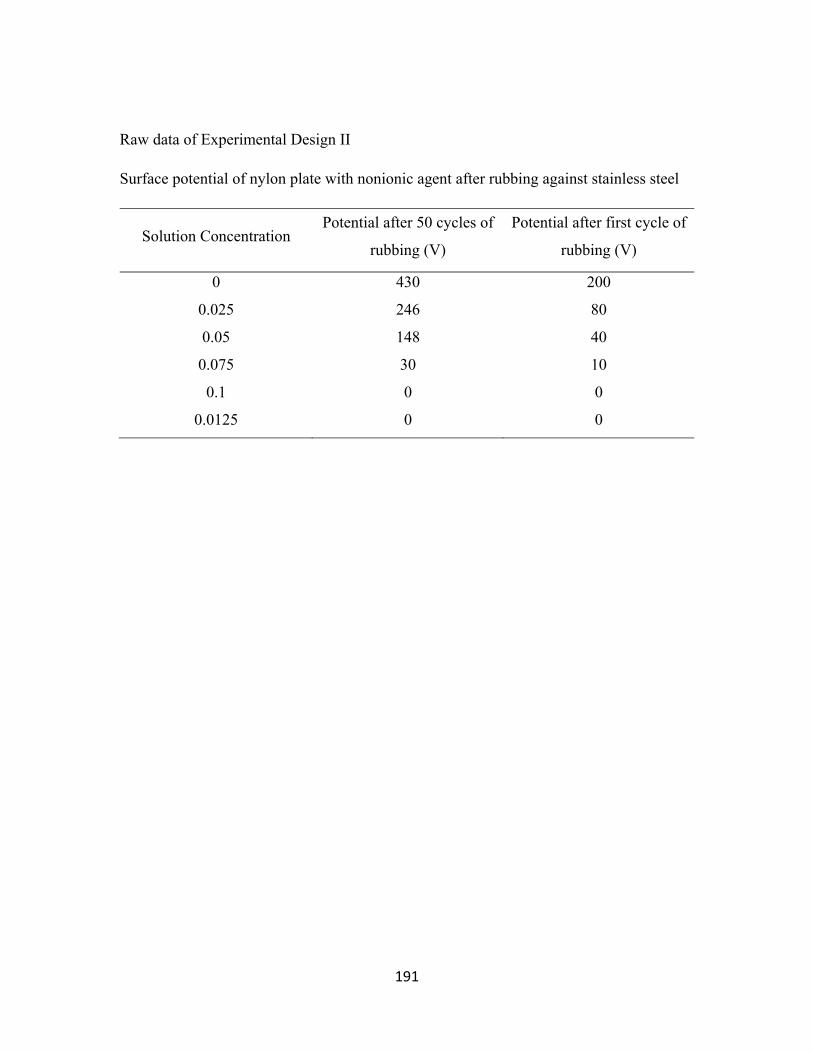
191
Raw data of Experimental Design II
Surface potential of nylon plate with nonionic agent after rubbing against stainless steel
Solution Concentration Potential after 50 cycles of
rubbing (V)
Potential after first cycle of
rubbing (V)
0 430 200
0.025 246 80
0.05 148 40
0.075 30 10
0.1 0 0
0.0125 0 0

192
Raw data of Linear Test in Goulston Technologies, Inc.
Sample m/min Friction Force
(g) Voltage, V
Finish Free Blank
20 27±1 2805±294 2805
50 47±4 3251±567 3251
100 51±2 3385±382 3385
200 52±2 3345±396 3345
300 58±7 3226±442 3226
377-10A
20 50±5 -276±57 276
50 123±13 -431±50 431
100 158±17 -546±57 546
200 174±20 -535±46 535
300 172±18 -478±43 478
377-10B
20 87±7 -10±5 10
50 125±25 -15±3 15
100 168±17 -23±3 23
200 181±17 33±5 33
300 176±16 29±4 29
377-10C
20 104±15 -1±2 1
50 169±22 -4±2 4
100 193±25 22±4 22
200 199±27 -36±6 36
300 198±21 -8±2 8
Note: Finishes applied @0.5% to finish free 200-denier Nylon.
Pretension = 20 grams
Fiber to Metal: Three 3/4” chrome pins, 90° wrap angle, 5 RMS value