final deliverable report on heat rejection systems for...
TRANSCRIPT

Final deliverable report on Heat Rejection Systems for solar cooling Date: 25.11.2014
By Roberto Fedrizzi1, Alice Vittoriosi1, Davide Romeli1, Matteo D’Antoni1, Hannes Fugmann2, Björn Nienborg2, Khalid Nagidi3, Marc Sheldon4 1Institution EURAC
Address viale Druso 1, I-39100 Bolzano
Phone +39 0471055610
e-mail [email protected], [email protected], [email protected], [email protected]
2Institution Fraunhofer ISE
Address Heidenhofstraße 2, D-79110 Freiburg
Phone +49 (0) 7 61/ 45 88-5527
e-mail [email protected], [email protected]
3Institution Energy Management Consulting Group (EMCG)
Address 844 Oakfield Ave, Ste 101, 11793 Wantagh, New York
Phone +1 516 308 4104
e-mail [email protected]
4Institution Coolgaia Pty Ltd
Address GPO Box 326 Sherwood, QLD 4075 Australia
e-mail [email protected]

IEA SHC Task 48 / task48.iea-shc.org
Subtask A – Activity A3 Final Report November 2014
IEA Solar Heating and Cooling Program The Solar Heating and Cooling Programme was founded in 1977 as one of the first multilateral technology initiatives ("Implementing Agreements") of the International Energy Agency. Its mission is “to enhance collective knowledge and application of solar heating and cooling through international collaboration to reach the goal set in the vision of solar thermal energy meeting 50% of low temperature heating and cooling demand by 2050. The member countries of the Programme collaborate on projects (referred to as “Tasks”) in the field of research, development, demonstration (RD&D), and test methods for solar thermal energy and solar buildings. A total of 53 such projects have been initiated to-date, 39 of which have been completed. Research topics include: Solar Space Heating and Water Heating (Tasks 14, 19, 26, 44) Solar Cooling (Tasks 25, 38, 48, 53) Solar Heat for Industrial or Agricultural Processes (Tasks 29, 33, 49) Solar District Heating (Tasks 7, 45) Solar Buildings/Architecture/Urban Planning (Tasks 8, 11, 12, 13, 20, 22, 23, 28, 37, 40, 41, 47,
51, 52) Solar Thermal & PV (Tasks 16, 35) Daylighting/Lighting (Tasks 21, 31, 50) Materials/Components for Solar Heating and Cooling (Tasks 2, 3, 6, 10, 18, 27, 39) Standards, Certification, and Test Methods (Tasks 14, 24, 34, 43) Resource Assessment (Tasks 1, 4, 5, 9, 17, 36, 46) Storage of Solar Heat (Tasks 7, 32, 42) In addition to the project work, there are special activities:
SHC International Conference on Solar Heating and Cooling for Buildings and Industry Solar Heat Worldwide – annual statistics publication Memorandum of Understanding with solar thermal trade organizations Workshops and conferences
Country Members
Australia Germany Singapore
Austria Finland South Africa
Belgium France Spain
China Italy Sweden
Canada Mexico Switzerland
Denmark Netherlands Turkey
European Commission Norway United Kingdom
Portugal United States
Sponsor Members European Copper Institute Gulf Organization for Research and Development
ECREEE RCREEE

IEA SHC Task 48 / task48.iea-shc.org
Subtask A – Activity A3 Final Report November 2014
Contents 1 Executive Summary ........................................................................................................1
1.1 Specific Objectives ...................................................................................................1
2 Nomenclature and Abbreviations .....................................................................................2
2.1 Abbreviations ...........................................................................................................2
2.2 Nomenclature ...........................................................................................................2
2.3 Greek Symbols .........................................................................................................2
2.4 Subscripts ................................................................................................................2
3 Technical Features ..........................................................................................................4
3.1 Main features and sizes............................................................................................4
3.2 Noise levels ..............................................................................................................6
3.3 Working temperature ranges and climate suitability ..................................................7
Cooling period (filtered), [h] ....................................................................................................9
Avg. RH, [%] ...........................................................................................................................9
Max 푇푎,푑푏, [°C] ......................................................................................................................9
3.4 Classification by flow rates .....................................................................................11
3.5 Classification by Powers.........................................................................................11
3.6 Investment Costs....................................................................................................13
4 Available Standards, Guidelines and Manuals ...............................................................15
4.1 Device Manufacturing .............................................................................................15
4.2 Installation Operation and Maintenance .................................................................17
4.3 Noise ......................................................................................................................21
4.4 Performance Testing ..............................................................................................22
4.5 Legionella ...............................................................................................................29
4.6 General ..................................................................................................................32
5 On-Site Experience on Heat Rejection Devices (HRD) ..................................................33
5.1 Installation of heat rejection devices .......................................................................33
5.2 Control of HRD .......................................................................................................33
5.3 Maintenance ...........................................................................................................36
5.4 Performance of HRDs (comparison of monitored devices) .....................................36
Operation conditions.............................................................................................................56
Calculated quantities ............................................................................................................56
6 Conclusions...................................................................................................................57
7 Further reading ..............................................................................................................58
8 Bibliography ..................................................................................................................59

IEA SHC Task 48 / task48.iea-shc.org
Subtask A – Activity A3 - Final Report Page 1 of 60
1 Executive Summary SHC Task 48 Subtask A concentrates on developing tools and deliverables to show the level of quality of the most critical components of the solar cooling and heating system. These components are mainly the chiller, the heat rejection device, the pumps and the solar collectors. This report gives an overview of existing and novel concepts for heat rejection devices in solar cooling systems and recommendations on which heat rejection measure should be used under different boundary conditions (climate, system concept etc.) while achieving the 2 main objectives: 1) investment & operation costs minimization and 2) re-cooling performance and efficiency. For selected components, where it was possible, a performance characterization has been made in partnership with manufacturers.
1.1 Specific Objectives 1. A survey of market available heat rejection devices suitable for solar cooling applications.
An added value to the survey work has been a categorization of the products with regards to technical features:
Specific operating mode (dry cooler, wet cooling tower, hybrid cooler)
Main features and sizes (electric engine size and consumption, water consumption, geometrical sizes)
Working temperature ranges
Possiblepre-defined control strategies
Legionella prevention devices/strategies/costs
Maintenance issues
Investment running costs aspect. “Specific” prices per category and size/rejected heat have been evaluated.
2. A survey of available standards in Europe, USA and Australia to understand the limitations vs. opportunities of the different technologies.
3. “Real-life” examples/experience from monitoring solar cooling systems. Practical hints have been retrieved in terms of:
Main features and sizes (electric engine size and consumption, water consumption, geometrical sizes)
Working temperature ranges
Control strategies
Maintenance issues
Seasonal consumptions (electricity and water)
Investment/running costs.

IEA SHC Task 48 / task48.iea-shc.org
Subtask A – Activity A3 - Final Report Page 2 of 60
2 Nomenclature and Abbreviations 2.1 Abbreviations ca. circa DC Dry cooler EC Electronically Commutated EER Energy Efficiency Ratio HRD Heat rejection device HX Heat exchanger RH Relative humidity STCS Solar thermal cooling system WCT Wet cooling tower
2.2 Nomenclature A Area [m2] 푐 Specific heat at constant pressure [J/kg K] 퐶̇ Heat capacity rate [J/s K] 퐷 Fan diameter [m] 푓 Cooling ratio [-] h Enthalpy [J/kg] 푚̇ Mass flow rate [kg/s] 푁 Total number [-] 푃 Power [W] 푝 Pressure [bar] 푄̇ Rejected heat [W] 푇 Temperature [°C] 푉̇ Volumetric flow rate [m3/s]
2.3 Greek Symbols ∆ Difference [-] 휀 Cooling effectiveness [-] 휂 Efficiency [-]
2.4 Subscripts 푎 air 푐푓 cooling fluid 푐ℎ cooling 푑푏 dry bulb 푒푙 electrical 푓푎푛 specific quantity for the fan(s)

IEA SHC Task 48 / task48.iea-shc.org
Subtask A – Activity A3 - Final Report Page 3 of 60
퐻푇푆 heat transfer surface 푖푛 inlet 푚푎푥 maximum 표푢푡 outlet 푝푢푚푝 specific quantity for the circulation pump(s) 푠푎푡 saturated condition 푤푏 wet bulb
IEA SHC Task 48 / task48.iea-shc.org
Subtask A – Activity A3 - Final Report Page 4 of 60
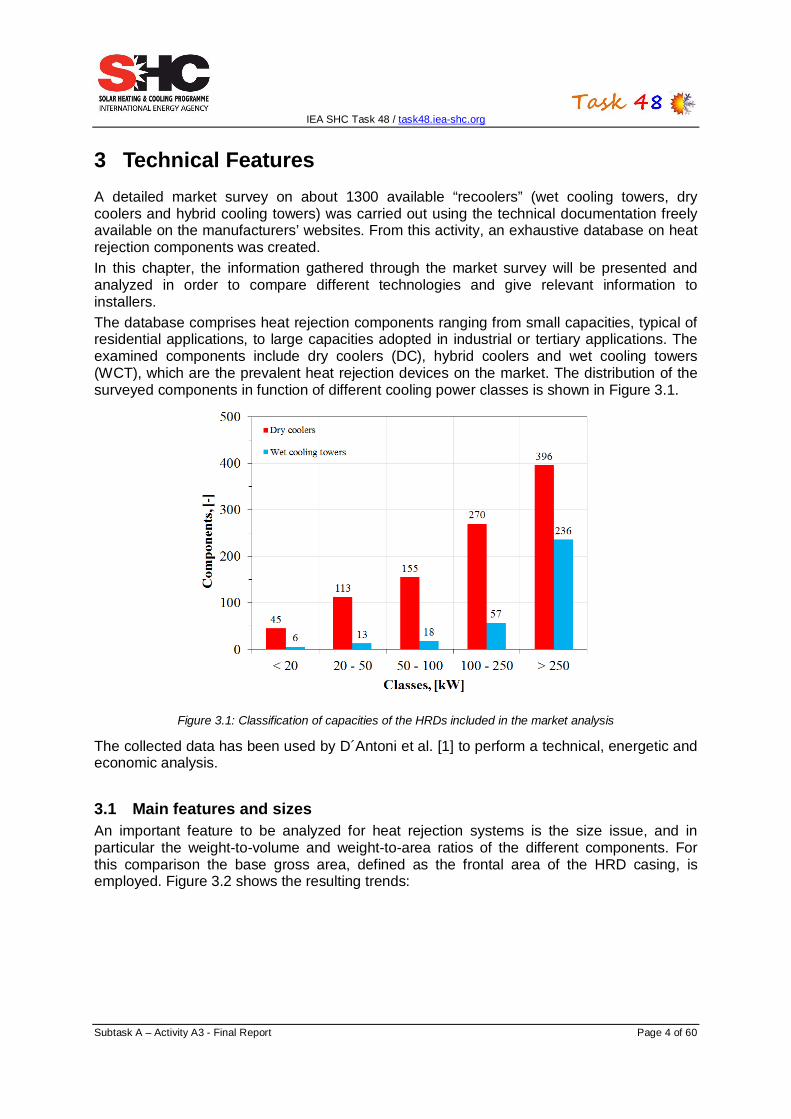
3 Technical Features A detailed market survey on about 1300 available “recoolers” (wet cooling towers, dry coolers and hybrid cooling towers) was carried out using the technical documentation freely available on the manufacturers’ websites. From this activity, an exhaustive database on heat rejection components was created. In this chapter, the information gathered through the market survey will be presented and analyzed in order to compare different technologies and give relevant information to installers. The database comprises heat rejection components ranging from small capacities, typical of residential applications, to large capacities adopted in industrial or tertiary applications. The examined components include dry coolers (DC), hybrid coolers and wet cooling towers (WCT), which are the prevalent heat rejection devices on the market. The distribution of the surveyed components in function of different cooling power classes is shown in Figure 3.1.
Figure 3.1: Classification of capacities of the HRDs included in the market analysis
The collected data has been used by D´Antoni et al. [1] to perform a technical, energetic and economic analysis.
3.1 Main features and sizes An important feature to be analyzed for heat rejection systems is the size issue, and in particular the weight-to-volume and weight-to-area ratios of the different components. For this comparison the base gross area, defined as the frontal area of the HRD casing, is employed. Figure 3.2 shows the resulting trends:

IEA SHC Task 48 / task48.iea-shc.org
Subtask A – Activity A3 - Final Report Page 5 of 60
(a) (b)
Figure 3.2: (a) Relationship between volume and weight of air-based heat rejection components (derived from 82.7% of database data); (b) Relationship between base gross area and weight of air-based heat rejection components (derived from 82.7% of database data)
From Figure 3.2-(a) it is clear that dry coolers and wet cooling towers have almost the same weight-to-volume ratio. For DCs the average weight-to-volume ratio is between 45-126 kg/m3, while for WCT is 41-101 kg/m3. For volumes above ca. 70 m3, only wet cooling tower systems can be found, and a more dispersed weight-to-volume trend is recorded. The same cannot be said about the weight-to-area ratio distribution of Figure 3.2-(b). For the same base gross area, the weight of a wet cooling tower is larger than that of a dry cooler and the difference increases with the surface. On the other hand, for a fixed base gross area the weight of a wet cooling tower is about 60 % greater than that of a dry cooler. This aspect can be explained considering the larger amount of piping equipment and the typical height development of a wet cooling tower with respect to a dry cooler, as shown in Figure 3.3:
Figure 3.3: Height of the heat rejection devices with respect to the specific weight
When limitations on the available space are present, it is important to consider the relationship between the device size and the provided rejected heat (i.e. cooling power). This relationship is shown in Figure 3.4 for the two investigated heat rejection device categories, with respect to volume (a) and base gross area (b).

IEA SHC Task 48 / task48.iea-shc.org
Subtask A – Activity A3 - Final Report Page 6 of 60
(a) (b)
Figure 3.4: (a) Relationship between volume and amount of rejected heat of air-based heat rejection components (derived from 82.7% of database data); (b) Relationship between base gross area and amount of rejected heat of air-based heat rejection components (derived from 82.7% of database data).
The rejected heat-to-volume ratio for dry coolers and wet cooling towers ranges between 10-40 kWch/m3 and 8-47 kWch/m3, respectively. An analogous trend is noticed when the rejected heat is plotted as a function of the gross area. This ratio rages between 13-80 kWch/m2 for dry coolers and between 60-163 kWch/m2 for wet cooling towers.
3.2 Noise levels The noise level considered for the present analysis is defined as the weighted average of the noise pressure values measured at a distance of 10 meters from the “recooler”. It may be linked to the electric consumptions of the fans, as showed in Figure 3.5. For a fixed fan electric power, dry coolers produce less noise than wet cooling towers. For both component categories, the noise level increases with the fan electric power until a maximum noise level is reached: this is about 65 dB for dry coolers and 70 dB for wet cooling towers.
Figure 3.5: Noise pressure level in function of the fan electric consumption

IEA SHC Task 48 / task48.iea-shc.org
Subtask A – Activity A3 - Final Report Page 7 of 60
3.3 Working temperature ranges and climate suitability The technical brochures available for heat rejection systems on the market report the values of thermal performance under some given nominal conditions. Along with these figures, many manufacturers also provide correction factors to calculate the performance under off-design conditions. In this way, it is possible to make a comparison between heat rejection devices whose nominal conditions are different and to analyze the influence on the performance of each variable, such as cooling fluid, air temperatures and mass flow rates. In terms of performance figures, a cooling effectiveness based on temperatures can be defined for both dry coolers and wet cooling towers. The cooling effectiveness compares the obtained cooling fluid temperature difference (훥푇 ) with the cooling potential. In detail, for the dry cooler:
휀 , =푄̇
퐶̇ ∆푇=
훥푇푇 , − 푇 ,
(3.1)
where 푇 , is the dry bulb air inlet temperature.
For the wet cooling tower1:
휀̃ , =훥푇
푇 , − 푇 , (3.2)
where the cooling potential is a function of the wet bulb air inlet temperature 푇 , that includes the influence of the relative humidity in the performance evaluation. Selecting from the database a dry cooler and a wet cooling tower of similar sizes and fixing the same cooling fluid inlet conditions (temperature and mass flow rate), the cooling performance ratio 푓 (defined as the ratio between the actual rejected power and the nominal rejected power) and the cooling effectiveness for the two components can be compared, as shown in Figure 3.6. From the plots reported in Figure 3.6, it is evident that the performance of the wet cooling tower is better than that of the dry cooler, both in terms of rejected thermal power and cooling efficiency. In particular, the difference in terms of cooling effectiveness drastically increases when the inlet dry bulb air temperature approaches the cooling fluid inlet temperature (40°C in this example). It is important to underline that for the case reported in Figure 3.6, the wet cooling tower’s cooling effectiveness has been obtained with a reference inlet air relative humidity equal to 50 %. If this value decreases, the wet cooling tower effectiveness further increases, while with a higher relative humidity the wet tower efficiency will be very close to the one of the dry cooler. The efficiency trends found for the dry cooler are in agreement with ILK Dresden results [2].
1As explained in chapter 5.4.5, the definition of a cooling effectiveness for WCTs based on the temperature is not strictly correct (and is therefore marked with a tilde), since the cooling effectiveness does not vary linearly with the cooling fluid outlet temperature. However, for the analysis of the market survey data, the definition of Eq. 3.2 is used and is distinguished with a tilde on top.

IEA SHC Task 48 / task48.iea-shc.org
Subtask A – Activity A3 - Final Report Page 8 of 60
Figure 3.6: Dry cooler and wet cooling tower performance comparison.
An additional advantage of WCTs on DCs can be seen in terms of fan’s energy savings. This cannot be directly done from the manufacturer datasheets, and a set of numerical
simulations have been carried out by using a validated numerical code [3]. Assuming the same operating condition (Tcf,in=40°C) and environmental boundary conditions (Ta,db=25°C,
RH=50%) for the two technologies, the comparison is showed in Figure 3.7. In general, the fan electrical consumption of DCs is drastically increasing when the cooling fluid outlet temperature is approaching the dry bulb ambient temperature. For a given amount of rejected heat (left axis, blue line), WCTs are more effective when the cooling fluid outlet temperature approaches the ambient temperature, whereas no significant improvement is noticed at higher temperature values.
Figure 3.7: Comparison of fans electric consumption of wet cooling towers and dry coolers under the same operating and environmental boundary conditions.

IEA SHC Task 48 / task48.iea-shc.org
Subtask A – Activity A3 - Final Report Page 9 of 60
To evaluate the suitability of using dry coolers and wet cooling towers in specific climatic conditions, an analysis in terms of energy potential can be done. The energy potential represents the cumulated amount of rejected heat varying in function of different locations and climatic conditions. An example is presented in the following, considering three different locations in the world (namely Rome, Montreal and Singapore) with their hourly distribution of air temperature and total irradiation, as reported in Table 3.1. Cooling hours are filtered in function of the dry bulb air temperature (greater or equal than 20 °C) and of the total irradiation (greater than 100 W/m2).
Table 3.1: Chosen localities and their monitored data
Locations Cooling period (filtered), [h]
Avg. RH, [%]
Max 푇 , , [°C]
Energy potential DC, [MWh]
Energy potential WCT, [MWh]
Rome 1521 (17.4%) 59.7 37.6 9.16 47.59
Montreal 813 (9.3%) 64.7 31.7 7.48 28.43
Singapore 3463 (39.5%) 84.0 33.7 5.37 53.98
The results in terms of energy potential for the three chosen localities, after choosing two heat rejection devices of similar size and fixing the cooling fluid outlet temperature 푇 , to 27 °C and the cooling fluid inlet temperature 푇 , to 32 °C, are reported in Figure 3.8. Along with the energy potential for the selected wet cooling tower (right axis, red dotted curve) and dry cooler (right axis, red solid curve), the distribution of cooling time defined as the number of hours where a dry bulb air temperature greater or equal to 20 °C occurs is reported (left axis, blue curve). From the presented examples it is evident that the wet cooling tower allows rejecting more energy than the dry cooler. The amount of rejected heat switching from a DC to a WCT increases significantly and in particular by a factor of 5 for Rome, 4 for Montreal and 10 for Singapore. The difference between the three locations is mainly affected by the length of the cooling period (e.g. Singapore has 39.5% of the year with potential cooling occurrence) and the relative humidity of ambient air (e.g. Rome is drier than Singapore). This difference increases approaching the peak of cooling time and can be explained considering the two following aspects. At a given air temperature, the wet cooling tower presents always a larger energy potential with respect to the dry cooler, thanks to the contribution of latent heat. Moreover, the wet cooling tower allows working with a broader range of air temperatures: the energy potential for the wet tower drops when the air temperature approaches the cooling fluid inlet temperature, while for dry coolers it drops much before. This discrepancy in terms of performance between the two heat rejection technologies is particularly evident for the operation conditions reported in this example. Indeed a cooling fluid outlet temperature of 27 C, typical for the heat rejection of an absorption chiller, disadvantages the use of dry coolers. A higher outlet temperature would allow the dry cooler to cover a broader range of conditions and thus reject more energy (though always less than the wet cooling tower).

IEA SHC Task 48 / task48.iea-shc.org
Subtask A – Activity A3 - Final Report Page 10 of 60
An extreme condition is represented by the example of Singapore, where the air temperature is very constant throughout the year and equal to 25°C (close to the cooling fluid outlet set point). In this case the difference in energy potential between the dry cooler and the wet cooling tower is very large and suggest that for applications in climates with air temperatures very close to the cooling fluid temperature for the majority of the working time, the wet tower is preferable to dry coolers. In general, the trend in terms of energy analysis (Figure 3.12) confirms those in terms of effectiveness (Figure 3.6).
(a)
(b)
(c)
Figure 3.8: (a) Energy potential of dry cooler and wet cooling tower for the location of Rome; (b) Energy potential of dry cooler and wet cooling tower for the location of Montreal; (c)Energy potential of dry cooler and wet cooling tower for the location of Singapore. Cooling fluid inlet/outlet temp. for the three cases: 32/27 °C.

IEA SHC Task 48 / task48.iea-shc.org
Subtask A – Activity A3 - Final Report Page 11 of 60
3.4 Classification by flow rates Another important aspect to be analyzed for heat rejection systems is the distribution of air and cooling fluid flow rates for the different devices. As showed in Figure 3.9, two very clear linear trends for the two heat rejection technologies can be distinguished. For a given cooling fluid flow, the air flow elaborated by a dry cooler is about 3.5 times larger than for a wet cooling tower.
Figure 3.9: Relationship between cooling fluid and air volume flow
3.5 Classification by Powers The understanding of how construction parameters affect the rejected power of a HRD is of crucial importance for both manufacturers and users. To consider this aspect, for each component included in the market analysis, the rejected heat has been analyzed in function of: Number of fans 푁 and the relative diameter 퐷 (both represented by the fans
passage section 퐴 = 푁 ∙ 퐷 ∙ 휋/4)
Fan electric power consumption (푃 , )
Figure 3.10 shows how the rejected heat of HRDs changes increasing either the number of fans or the relative diameter. For a given fans passage section (퐴 ), the rejected heat provided by a wet cooling tower is typically larger than that provided by a dry cooler. Considering a linear trend, the air passage section required by a wet tower is about 65 % less than that required by a dry cooler.

IEA SHC Task 48 / task48.iea-shc.org
Subtask A – Activity A3 - Final Report Page 12 of 60
Figure 3.10: Heat rejection dependence on the fans passage section
Another very important aspect to be considered is the relationship between the provided rejected heat and the electric power consumption, which is shown in Figure 3.11.
(a) (b)
Figure 3.11: (a) Relationship between rejected heat and electric power of air-based heat rejection components (derived from 90.1% of database data); (b) Relationship between rejected heat and electric power of air-based heat rejection components (derived from 98.8% of wet cooling towers data).
Dry coolers seem to have a linear rejected heat-electric power relationship. On the contrary, for wet cooling towers, different linear trends can be found: this is due again to the various types of wet cooling towers available on the market. An important reference on the values of electric power – rejected heat ratio for these heat rejection devices is given in literature by U. Eicker et al. [4] and Saidi et al. [5]. The results obtained with the present analysis and reported by D´Antoni et al. [1] are in agreement with the literature. The specific consumption values (kWel/kWch) of dry coolers are in general higher than those of wet cooling towers, where the type (open or closed) and the fan function (induced or forced draft towers) deeply influence the performance. The ranges of specific consumption

IEA SHC Task 48 / task48.iea-shc.org
Subtask A – Activity A3 - Final Report Page 13 of 60
which have been found are 0.0125-0.091 kWel/kWch for dry coolers, between 0.005-0.060 kWel/kWch for wet cooling towers. In particular, the average specific consumption for dry coolers is about 0.033 kWel/kWch, while for wet cooling tower is about 0.017 kWel/kWch. This last trend is obtained for the open cooling towers and it is in very good agreement with Eicker´s results. Analyzing in detail the behavior of wet cooling towers (Figure 3.11-(b)), it results that the specific consumptions for induced draft towers are lower than that for the forced draft ones. The range of variation is 0.005-0.025 kWel/kWch for induced wet towers and 0.010-0.060 kWel/kWch for the forced draft ones. In particular, the average consumption for the induced draft tower is 0.014 kWel/kWch, for the forced draft tower is 0.025 kWel/kWch. Again, a similar trend is reported by Saidi and Eicker et al.
3.6 Investment Costs Cost aspects are of fundamental importance. For the present analysis, a primary classification was drafted by researching the market of the real investment costs of heat rejection devices. Starting from a base cost, each manufacturer can provide additional options as required by the project such as side stream filtration system, basin heating element for cooling tower winterization, electronic vibration cutout, working platform and ladder for large towers, chemical treatment system, and others. In particular, four types of accessories have been considered for the cost analysis: Wiring, including all the electric components except for the inverter
EC fans controller, when the fan velocity is controlled by a highly efficient electronic device
Water spray system, when the cooler can work in the hybrid mode
Inverter
In addition to the above mentioned components, structural materials (e.g. mounting racks, weight distribution bars, etc.) and other auxiliaries (e.g. piping for the connection to the circuit, circulation pumps, etc.) are needed for the installation of HRDs. The cost figures for these additional components are usually not included in the datasheets and strongly depend on the specific installation under consideration. For this reason, the data reported in the following do not include these extra components, even though they might strongly affect the final cost figures.
From the collected data, a relationship between the total investment cost and the provided rejected heat has been obtained (as showed in Figure 3.12).

IEA SHC Task 48 / task48.iea-shc.org
Subtask A – Activity A3 - Final Report Page 14 of 60
(a) (b)
Figure 3.12: (a) Trend of the investment cost with the provided cooling tower; (b) Investment cost-to-rejected heat for different manufacturers. Charts derived from 20.3% of the database data.
For a given provided rejected heat, the investment costs for dry coolers are typically higher than for wet cooling towers. In particular, the average cost per unit of rejected heat power ranges for dry coolers between 49 and 107 €/kWch, (i.e. between 61 and 134 US$/ kWch) and for wet cooling towers between 22 and 27 €/kWch (i.e. between 28 and 34 US$/kWch). From Figure 3.12 it is evident that, while wet cooling towers present a good linear cost-to-rejected heat relationship, for dry coolers two different trends can be distinguished. This aspect can be explained considering the data for the single manufacturers, as shown in Figure 3.12-(b). Of the two recognizable linear trends for dry coolers, the one at higher costs represents hybrid components, for which the cost of the spray system has to be included. All other dry cooler models follow a common linear trend (at lower investment costs).

IEA SHC Task 48 / task48.iea-shc.org
Subtask A – Activity A3 - Final Report Page 15 of 60
4 Available Standards, Guidelines and Manuals The following tables reports the principal national and international standards, codes, guidelines and manuals available on heat rejection systems. They are grouped in different categories depending on the specific purpose.
4.1 Device Manufacturing
Title Industrial Cooling Tower Standard
Document Type/Standard Cooling Technology Institute (CTI) Standard
Number/Year STD-203:2005
Geographic area of application
USA
Description This Standard covers the design, fabrication and inspection of crossflow and counterflow mechanical draft cooling towers.
Title Recirculation
Document Type/Standard Cooling Technology Institute (CTI) Document
Number/Year PTB 110:1977
Geographic area of application
USA
Description This is a summary of 7 years field study, and gives a procedure to determine maximum recirculation to be expected for any given operating condition; also recommendations for tower orientation to minimize recirculation.
Title Bid Form - (Factory Assembled)
Document Type/Standard Cooling Technology Institute (CTI) Document
Number/Year PTG 118:1993
Geographic area of application
USA
Description The inquiry and Bid Form is used to show minimum information that is necessary to include inquiries and to show all pertinent data on the requested bids. Cooling tower purchasers use this form with their inquiries by filling out all the information marked with an asterisk (*). Manufacturers then return their bids on this form. This assures the purchaser of receiving adequate information on all bids. It also facilitates the comparison of bids by furnishing the same

IEA SHC Task 48 / task48.iea-shc.org
Subtask A – Activity A3 - Final Report Page 16 of 60
information in the same place on all bids. Further, it establishes uniform units for the various data.
Title Lightning Protection System Guideline
Document Type/Standard Cooling Technology Institute (CTI) Document
Number/Year ESG 120:2009
Geographic area of application
USA
Description This guideline sets forth recommended design criteria, components, and the specifications for traditional lightning protection systems installed on water-cooling towers.
Title Thermoplastic Materials Used for Film Fill, Splash Fill, Louvers and Drift Eliminators
Document Type/Standard Cooling Technology Institute (CTI) Standard
Number/Year STD 136:2010
Geographic area of application
USA
Description This specification covers the most common fills, splash fills, louvers, drift eliminators, nozzles, and other small components for use in standard properties, burning properties, and recommended testing procedures employed to determine the defined values, whether processed from virgin or reground material.
Title Guide for procurement of power station equipment - Part 6-6: Turbine auxiliaries - Wet and wet/dry cooling towers
Document Type/Standard European Standard
Number/Year EN 45510-6-6:1999
Geographic area of application
Europe
Description This standard gives guidance on writing the technical specification for the procurement of natural draft and mechanical draught wet and wet/dry (hybrid) cooling tower and cooling towers internals for use in electricity generating stations (power stations). This Guide for procurement is not applicable to equipment for use in the nuclear reactor plant area of nuclear power stations. Other possible applications of such equipment have not been considered in the preparation of this Guide. This Guide covers: - water distribution system; - spray assembly; - filling (film packing, splash grids or laths, etc.);...
IEA SHC Task 48 / task48.iea-shc.org
Subtask A – Activity A3 - Final Report Page 17 of 60
Title Ventilation and air conditioning, equipment requirements
Document Type/Standard Association of German Engineers (VDI) Document
Number/Year 3803
Geographic area of application
Germany
Description The aim of the guideline is to define the technical requirements for air conditioning systems, so that an efficient building and an energy-efficient and hygienic operation of the air conditioning systems can be realized.
4.2 Installation Operation and Maintenance
Title Water-Cooling Towers
Document Type/Standard National Fire Protection Association (NFPA) Standard
Number/Year 214:2011
Geographic area of application
USA
Description This Standard helps you determine the type and amount of fire protection needed by taking into account factors such as importance to continuity of operation, size and construction of tower, type of tower, location of tower, water supply, and climate.
Title Construction Safety and Health Guidelines
Document Type/Standard Cooling Technology Institute (CTI) Document
Number/Year ESG 121:2009
Geographic area of application
USA
Description The purpose of this document is to serve as a safety and health guideline for various cooling tower procedures that are routinely performed on job sites. The information provided is based on OSHA federal requirements.
Title Guideline: Side Stream Filtration as an Aid to Cooling Tower Performance
Document Type/Standard Cooling Technology Institute (CTI) Document
Number/Year WTG 122:2012
Geographic area of USA

IEA SHC Task 48 / task48.iea-shc.org
Subtask A – Activity A3 - Final Report Page 18 of 60
application
Description The purpose of this guideline is to outline benefits to the operation of evaporative condensers and cooling towers, their components, and to the equipment and systems they support utilizing the most common sediment side stream filtration technologies.
Title Handling Water Treatment Chemicals Safely
Document Type/Standard Cooling Technology Institute (CTI) Document
Number/Year WTG 129:1996
Geographic area of application
USA
Description Laminated poster for use where chemicals are handled. General and emergency procedures.
Title Supervisory Guide Handling Water Treatment Chemicals
Document Type/Standard Cooling Technology Institute (CTI) Document
Number/Year WTG 132:1984
Geographic area of application
USA
Description A guide for first-line supervisors responsible for cooling tower treatment operations
Title Application of Oxidizing Biocides
Document Type/Standard Cooling Technology Institute (CTI) Document
Number/Year WTP 141:2004
Geographic area of application
USA
Description This document will cover the use and application of the four major oxidizing biocides used in treating cooling waters: chlorine, bromine, chlorine dioxide, and ozone. The document will help end users and all personnel involved in treating cooling systems to better understand the chemistry, the application methods and the safety and environmental issues concerning oxidizing biocides.
Title Treatment of Galvanized Cooling Tower to Prevent White Rust
Document Type/Standard Cooling Technology Institute (CTI) Document
IEA SHC Task 48 / task48.iea-shc.org
Subtask A – Activity A3 - Final Report Page 19 of 60
Number/Year WTG 142:1994
Geographic area of application
USA
Description The purpose of this document is to provide steps in preventing "white rust" through the application of appropriate water treatment programs.
Title Water Reuse Paper of Interest To Cooling Tower Users
Document Type/Standard Cooling Technology Institute (CTI) Document
Number/Year WTB 147:1997
Geographic area of application
USA
Description This is a bibliography of published and presented papers on the general subject of water reuse in cooling tower systems.
Title Variable Frequency Drive Application Guidelines for Cooling Towers
Document Type/Standard Cooling Technology Institute (CTI) Standard
Number/Year ESG 151:2002
Geographic area of application
USA
Description This standard covers the guidelines for operation of cooling towers at variable speeds
Title Common Operation and Maintenance Manual
Document Type/Standard Manual (online) http://www.baltimoreaircoil.com/english/resource-library/file/829
Number/Year 2011
Geographic area of application
USA
Description This manual from BAC covers an array of subjects pertaining to cooling towers maintenance, including but not limited to controls, cold weather operation, corrosion protection, bleed rate, basin heater and stand-alone control heater control panel, electronic vibration cutout switch and installation instructions for field connections.
Title The Commissioning Process

IEA SHC Task 48 / task48.iea-shc.org
Subtask A – Activity A3 - Final Report Page 20 of 60
Document Type/Standard ASHRAE Guideline
Number/Year 0:2005
Geographic area of application
USA
Description The purpose of this guideline is to describe the Commissioning Process capable of verifying that the facility and its systems meet the Owner’s Project Requirements.
Title HVAC & R Technical Requirements for the Commissioning Process
Document Type/Standard ASHRAE Guideline
Number/Year 1.1-2007
Geographic area of application
USA
Description The purpose of this guideline is to describe the technical requirements for the application of the commissioning process described in ASHRAE Guideline 0-2005 that will verify that the heating, ventilating, air-conditioning, and refrigerating (HVAC&R) systems achieve the Owner’s Project Requirements.
Title Protection of metallic materials against corrosion - Guidance on the assessment of corrosion likelihood in water distribution and storage systems - Part 1: General
Document Type/Standard European Standard
Number/Year EN 12502-1:2004
Geographic area of application
Europe
Description This document gives guidance for the assessment of the corrosion likelihood of metallic materials in water distribution and storage systems, as a result of corrosion on the water-side. NOTE This document lists the different types of corrosion and describes in general terms the factors influencing corrosion likelihood. Water distribution and storage systems considered in this document are used for waters intended for human consumption according to EC directive 98/83/EEC and for waters of similar chemical composition. This document does not cover systems that convey the following types of water. - sea water; - brackish water; - geothermal water; - sewage water; - swimming pool water; - open cooling tower water; - recirculating heating and cooling water; - demineralized water. Parts 2 to 5 of this document cover the factors influencing the corrosion likelihood for copper and copper alloys, hot-dip galvanized

IEA SHC Task 48 / task48.iea-shc.org
Subtask A – Activity A3 - Final Report Page 21 of 60
ferrous materials, stainless steels and cast iron, unalloyed and low alloyed steels in detail. This document does not cover lead.
4.3 Noise Title Code for Measurement of Sound From Water Cooling
Towers
Document Type/Standard Cooling Technology Institute (CTI) Acceptance Test Code (ATC)
Number/Year ATC 128:2005
Geographic area of application
USA
Description This code applies to mechanical and natural draft towers. Test and measurement procedures, operating conditions and instrumentation are specified.
Title Heat exchangers - Forced convection air cooled refrigerant condensers and dry coolers - Sound measurement
Document Type/Standard European Standard
Number/Year EN 13487:2003
Geographic area of application
Europe
Description This standard specifies methods for uniform assessment and the recording of: - the A-weighted sound power level; - the sound power spectrum; - a calculation method for an overall average sound pressure level at a given distance. Among these data, the sound power level is the only unambiguous characteristic. This standard is applicable to: - forced convection air cooled refrigerant condensers as specified in ENV 327; - air cooled liquid coolers "dry coolers" as specified in ENV 1048.
Title Determination of sound power levels of noise sources using sound intensity
Document Type/Standard International Organization for Standardization (ISO) Standard
Number/Year ISO 9614-1:1993
Geographic area of application
World
Description This standard specifies a method for measuring the component of sound intensity normal to a measurement surface which is chosen so as to enclose the noise source(s)

IEA SHC Task 48 / task48.iea-shc.org
Subtask A – Activity A3 - Final Report Page 22 of 60
of which the sound power level is to be determined.
Title Precision methods for broad band sources in reverberation rooms
Document Type/Standard International Organization for Standardization (ISO) Standard
Number/Year ISO 3741:2010
Geographic area of application
World
Description The normative specifies methods for determining the sound power level or sound energy level of a noise source from sound pressure levels measured in a reverberation test room.
Title Characteristic noise emission values of technical sound sources; cooling towers
Document Type/Standard Association of German Engineers (VDI) Document
Number/Year 3734 Blatt 2:1990-02
Geographic area of application
Germany
Description The Directive applies to wet cooling towers with forced ventilation (serial, cells and round cooling towers) as well as for natural draft cooling towers.
4.4 Performance Testing
Title Standard for the Certification of Water Cooling Tower Thermal Performance
Document Type/Standard Cooling Technology Institute (CTI) Standard
Number/Year STD-201RS:2013
Geographic area of application
USA
Description This Standard sets forth a program whereby the Cooling Tower Institute will certify that all models of a line of evaporative heat rejection equipment offered for sale by a specific Manufacturer will perform thermally in accordance with the Manufacturer's published ratings, as limited in Paragraph 5.3.
Title Operations Manual for Thermal Performance Certification of

IEA SHC Task 48 / task48.iea-shc.org
Subtask A – Activity A3 - Final Report Page 23 of 60
Evaporative Heat Rejection Equipment
Document Type/Standard Cooling Technology Institute (CTI) Standard
Number/Year STD-201OM:2013
Geographic area of application
USA
Description Operations manual to guide program participants in complying with the provisions of the latest edition of CTI Standard 201RS
Title Standard for publication of Custom Cooling Tower Thermal Performance Test Results
Document Type/Standard Cooling Technology Institute (CTI) Standard
Number/Year STD-202:2013
Geographic area of application
USA
Description This Standard sets forth a program whereby manufacturers of custom cooling towers voluntarily allow the results of their CLTTA tests to be published under the requirements of this program.
Title Acceptance Test Code for Water Cooling Towers
Document Type/Standard Cooling Technology Institute (CTI) Acceptance Test Code (ATC)
Number/Year ATC 105:2000
Geographic area of application
USA
Description Part I - Test Procedure: methods and instrumentation for testing mechanical draft and natural draft cooling towers. Part II - Evaluation of results: method for evaluation of the performance of mechanical draft cooling towers using both characteristic curves and performance curves; natural draft and natural draft-fan assisted cooling towers using characteristic curves and performance curves. The results are expressed in terms of water cooling capacity. Part III - Appendix: example evaluation of mechanical draft cooling tower, natural draft cooling tower, and fan-assist cooling tower using either characteristic curve method or performance curve method; calculation of KaV/L; enthalpy tables; facsimiles of ATC-106 Test Forms.
Title Acceptance Test Code for Closed Circuit Cooling Towers

IEA SHC Task 48 / task48.iea-shc.org
Subtask A – Activity A3 - Final Report Page 24 of 60
Document Type/Standard Cooling Technology Institute (CTI) Acceptance Test Code (ATC)
Number/Year ATC 105S:2011
Geographic area of application
USA
Description This code is similar to the open circuit tower in both form and function except for the fluid circuits
Title Acceptance Test Code for Air-cooled Condensers
Document Type/Standard Cooling Technology Institute (CTI) Acceptance Test Code (ATC)
Number/Year ATC 107:2007
Geographic area of application
USA
Description This document details the measured test parameters, instrumentation, test measurements and data reduction procedure required for determination of the thermal capability of a dry, air-cooled steam condenser (ACC).
Title Preparation for an Official CTI Thermal Performance, Plume Abatement, or Drift Emission Test
Document Type/Standard Cooling Technology Institute (CTI) Document
Number/Year PTG 156:2000
Geographic area of application
USA
Description This bulletin covers test preparation for an official water cooling tower thermal performance test, plume abatement test or drift emissions test.
Title Corrosion Testing Procedures
Document Type/Standard Cooling Technology Institute (CTI) Standard
Number/Year STD 149:2000
Geographic area of application
USA
Description A code to develop standardized test procedures and evaluation techniques also designed to provide a uniform method to compare relative water treatment program performance in a cooling water system.

IEA SHC Task 48 / task48.iea-shc.org
Subtask A – Activity A3 - Final Report Page 25 of 60
Title Acceptance Test Procedure for Wet-Dry Plume Abatement
Document Type/Standard Cooling Technology Institute (CTI) Acceptance Test Code (ATC)
Number/Year ATC 150:2011
Geographic area of application
USA
Description This code covers the determination of the effluent air or plume characteristics of wet-dry cooling towers, designed for plume abatement.
Title Measurement of drift loss from cooling towers - Part 1: Chloride Balance Method
Document Type/Standard Australian Standard (AS)
Number/Year 4180.1:2008
Geographic area of application
Australia
Description This Standard provides standardized testing methods that manufacturers may use for product development and to substantiate drift loss performance claims. Part 1 of this Standard describes the chloride balance method (CBM) of measuring drift loss, which is judged to be suitable only for controlled laboratory investigations of componentry.
Title Measurement of drift loss from cooling towers - Part 2: Lost Chloride Method
Document Type/Standard Australian Standard (AS)
Number/Year 4180.2:2008
Geographic area of application
Australia
Description This Standard provides standardized testing methods that manufacturers may use for product development and to substantiate drift loss performance claims. Part 2 (this Part) describes a similar approach known as the lost chloride method (LCM). This method has been shown to be suitable for field applications and is offered as an alternative to the CBM method.
Title Isokinetic Drift Measurement Test Code for Water Cooling Tower
Document Type/Standard Cooling Technology Institute (CTI) Acceptance Test Code

IEA SHC Task 48 / task48.iea-shc.org
Subtask A – Activity A3 - Final Report Page 26 of 60
(ATC)
Number/Year ATC 140:2011
Geographic area of application
USA
Description The purpose of this Code is to describe instrumentation and procedures for the testing and evaluation of drift from water-cooling towers.
Title Recommended Practice for Airflow Testing of Cooling Towers
Document Type/Standard Cooling Technology Institute (CTI) Document
Number/Year PFM 143:1994
Geographic area of application
USA
Description This document helps in determining the purposes for anemometer and/or pitot tube testing in cooling towers.
Title Standard for Water Flow Measurement
Document Type/Standard Cooling Technology Institute (CTI) Standard
Number/Year STD 146:2008
Geographic area of application
USA
Description Methods for cooling tower water flow measurement.
Title Air Cooled Heat Exchangers
Document Type/Standard ASME Code
Number/Year PTC 30:1991
Geographic area of application
USA
Description This Code provides uniform methods and procedures for testing the thermodynamic and fluid mechanical performance of air cooled heat exchangers, and for calculating adjustments to the test results to design conditions for comparison with the guarantee
Title Heat exchangers - Method of measurement and evaluation of thermal performances of wet cooling towers
Document Type/Standard German edition of European Standard
IEA SHC Task 48 / task48.iea-shc.org
Subtask A – Activity A3 - Final Report Page 27 of 60
Number/Year DIN EN 14705:2005
Geographic area of application
Europe
Description This European Standard specifies requirements, test methods and acceptance tests for thermal performances pumping head verification of wet cooling towers and plume abatement for wet/dry cooling towers. This European Standard is applicable to natural draught wet cooling towers (see in 3.1.2.2) fan assisted natural draft cooling tower (see 3.1.2.3), wet/dry cooling towers (see 3.1.2.4) and "Mechanical draught cooling towers", except series ones. It specifies the test methods, the apparatus required, the limitation of errors and the method for results examination. The acceptance testing covers the verification of the thermal performance data and pumping head of the cooling tower as specified in the contract between the supplier and the purchaser. If these tests are required then this should be recognized at the time of the contract, as additional fittings, and preparations for the test may be required. Deviations from the rules laid down below as well as additions need special agreement between purchaser and supplier and should be documented. This standard does not apply to mechanical draught series wet cooling towers which are dealt with in prEN 13741. NOTE Terms like "design", "values", "guarantee" and "acceptance" used in this standard should be understood in a technical but not in a legal or commercial sense.
Title Thermal performance acceptance testing of mechanical draft series wet cooling towers
Document Type/Standard German edition of European Standard
Number/Year DIN EN 13741:2003
Geographic area of application
Europe
Description This European Standard specifies requirements, test method and acceptance tests for thermal performance of mechanical draft series cooling towers. This European Standard is applicable to series type wet cooling towers as defined in 3.1. The acceptance testing covers the verification of the thermal and hydraulic performance data of the cooling tower selected from the product line (see 3.1) and specified in the contract between the supplier and the purchaser.
Title Heat exchangers - Air cooled liquid coolers ('dry coolers') - Test procedures for establishing performance

IEA SHC Task 48 / task48.iea-shc.org
Subtask A – Activity A3 - Final Report Page 28 of 60
Document Type/Standard European Standard
Number/Year EN 1048:1998 (prEN 1048:2012)
Geographic area of application
Europe
Description This European Standard applies to remote forced convection air cooled liquid coolers, within which no change in the liquid phase occurs. This European Standard does not apply to liquid coolers, designed primarily for installation within the machinery compartment of packaged products. Its purpose is to establish uniform methods to test and ascertain the following:-Product identification; Capacity; Air flow rate; Liquid side pressure drop; Energy requirements. This European Standard does not cover technical safety aspects.
Title Water-cooling towers — Testing and rating of thermal performance
Document Type/Standard International Organization for Standardization (ISO) Standard
Number/Year ISO – FDIS 16345:2013b (Final Draft)
Geographic area of application
World
Description This International Standard covers the measurement of the thermal performance and pumping head of open- and closed-circuit, mechanical draft, wet and wet/dry cooling towers and natural draft and fan-assisted natural draft, wet and wet/dry cooling towers. The standard rating boundaries for series mechanical draft, open- and closed-circuit cooling towers are specified.
Title Eurovent Rating Standard for Cooling Towers
Document Type/Standard Eurovent Certification Company (ECC) Rating Standard
Number/Year RS 9C/001-2010
Geographic area of application
Europe
Description The purpose of this Rating Standard is to establish definitions and specifications for testing and rating of Open-Circuit series Cooling Towers, in accordance with Operational Manual OM-4 and CTI STD 201.
Title Operational Manual for the Certification of Cooling Towers
Document Type/Standard Eurovent Certification Company (ECC) Manual

IEA SHC Task 48 / task48.iea-shc.org
Subtask A – Activity A3 - Final Report Page 29 of 60
Number/Year OM-4-2013
Geographic area of application
Europe
Description The purpose of this manual is to prescribe procedures for the operation of the ECC Certification Programme for Open-Circuit series Cooling Towers, in accordance with CTI STD 201.
4.5 Legionella Title Minimizing the Risk of Legionellosis Associated With
Building Water Systems
Document Type/Standard ASHRAE Guideline
Number/Year 12-2000
Geographic area of application
USA
Description The purpose of this guideline is to provide information and guidance in order to minimize Legionella contamination in building water systems.
Title Prevention of Legionellosis Associated with Building Water Systems
Document Type/Standard ASHRAE Standard Project Committee (SPC) Standard
Number/Year SPC 188:2009
Geographic area of application
USA
Description The purpose of this standard is to present practices for the prevention of legionellosis associated with building water systems.
Title Legionellosis
Document Type/Standard Cooling Technology Institute (CTI) Document
Number/Year WTB 148:2008
Geographic area of application
USA
Description CTI Position Statement on the disease known as the Legionnaires' Disease, caused by the bacterium Legionella pneumophila.
Title Air-handling and water systems of buildings - Microbial

IEA SHC Task 48 / task48.iea-shc.org
Subtask A – Activity A3 - Final Report Page 30 of 60
control
Document Type/Standard Australian Standard
Number/Year AS/NSZ 3666:2011
Geographic area of application
Australia
Description Part 1 - Design, installation and commissioning: The primary design standard for cooling towers and cooling water systems. Its primary focus is the control of microbes such as Legionella in building water and air handling systems, particularly cooling water systems and cooling towers. Part 2 - Operation and maintenance: Concerned with the operation and maintenance of air-handling and water systems. Again microbial control within such systems is the main focus. Part 3 - Performance-based maintenance of cooling water systems: Describes a performance based approach to the maintenance of a cooling water system with respect to the control of microorganisms. The approach outlined in this standard combines an automatically monitored water treatment system with prescribed monitoring, assessment and control strategies to maintain a low risk environment within the cooling water system. Part 4 - Performance-based maintenance of air-handling systems (ducts and components): Outlines a performance-based approach to the maintenance of ducts and components forming air-handling systems with respect to the control of microorganisms, within such systems. This approach is based on known risk factors combined with maintenance practices and compliance monitoring to create hygienic conditions within such systems of buildings. The provisions of this Standard are an alternative to the prescriptive requirements of AS/NZS 3666.2 (Clause 2.3.5) for the maintenance of air-handling systems other than those incorporating water-supplied devices such as humidifiers and evaporative coolers.
Title Order relative to cooling installations dispersing water into an air stream subject to authorization under the heading
Document Type/Standard French Regulation
Number/Year 2921:13/12/04
Geographic area of application
France
Description This French regulation provides prescriptions and general requirements for the protection of the environment (with focus on legionella prevention) to be observed for cooling towers and all internal components which are part of the

IEA SHC Task 48 / task48.iea-shc.org
Subtask A – Activity A3 - Final Report Page 31 of 60
water circuit in direct contact with air streams.
Title Open “recooler” systems - Securing hygienically sound operation of evaporative cooling systems
Document Type/Standard Association of German Engineers (VDI) Document
Number/Year 2047:2014-01 Blatt 2
Geographic area of application
Germany
Description This guideline provides guidance for hygienically sound operation of “recooling” systems. The standard applies to existing and new evaporative cooling installations and apparatus where water is trickled or sprayed or can in any other way come into contact with the atmosphere with the exception of natural-draft cooling towers with power dissipations of more than 200 MW. Whether the cooling water is itself the cooling medium in the process or takes over the heat via a heat exchanger from a primary cooling circuit is negligible. Installations where the formation of condensate is possible due to their falling below the dew point are not covered; this is true, e.g., for cold-water aggregates. The standard does not apply to dry-running heat exchangers.
Title Hinweise und Empfehlungen zum wirksamen und sicheren Betrieb von Verdunstungskühlanlagen. Beuth-Verlag
Document Type/Standard German Engineering Federation (VDMA) Technical Rule
Number/Year 24649 - May 2005
Geographic area of application
Germany
Description Guidelines for safe operation of evaporative coolers.
Title Recommended Code of Practice to Keep your Cooling System Efficient and Safe
Document Type/Standard Eurovent Code
Number/Year 9/7 - 2011
Geographic area of application
Europe
Description Guidelines for the Prevention of Uncontrolled Bacteriological Contamination, including Legionella Pneumophila, in Cooling Towers and Evaporative Condensers.

IEA SHC Task 48 / task48.iea-shc.org
Subtask A – Activity A3 - Final Report Page 32 of 60
4.6 General
Title Cooling towers; terms and definitions
Document Type/Standard Association of German Engineers (VDI) Document
Number/Year 2047:1992-07
Geographic area of application
Germany
Description The document contains a glossary with definitions of technical terms in the field of cooling tower construction and operation.
Title Best Management Practice: Cooling Tower Management.
Document Type/Standard Online document: https://www1.eere.energy.gov/femp/program/waterefficiency_bmp10.html
Geographic application area USA
Description This online resource outlines cooling tower best management practices.
Title Cooling Tower Fundamentals
Document Type/Standard Online document http://spxcooling.com/pdf/Cooling-Tower-Fundamentals.pdf
Number/Year 2009
Geographic application area USA
Description This guide addresses cooling tower basics, structural, mechanical and electrical components, specialized tower usage and modifications, auxiliary components, thermal performance testing, and owner responsibilities.
Title Cooling Towers
Document Type/Standard 2012 ASHRAE Handbook – HVAC Systems and Equipment
Number/Year Chapter 40
Geographic area of application
USA
Description This chapter deals with principal of operations, design conditions, types of cooling towers, materials of construction, selection considerations, application, performance curves, cooling tower thermal performance, cooling tower theory, tower coefficients, plus additional information.

IEA SHC Task 48 / task48.iea-shc.org
Subtask A – Activity A3 - Final Report Page 33 of 60
5 On-Site Experience on Heat Rejection Devices (HRD) In this chapter general considerations relative to the operation of HRDs are presented. Guidelines on installation, control and maintenance procedures that have been derived from lessons learned in from the field experiences. Additionally, monitoring data from real plants is presented and analyzed. Finally, the performances of different system sizes and typologies are compared.
5.1 Installation of heat rejection devices For the correct and efficient operation of HRD, as well as the entire heat rejection loop, a number of points must be considered during installation. Positioning of the HRD: Ideally the HRD is positioned in a shady place, e.g. on the northern side of a building (in
the northern hemisphere).
Installation on or near black and metal surfaces which are exposed to the sun is to be avoided as these will lead to an increase of the ambient temperature.
It is extremely important to make sure that the HRD is protected from pollution (e.g. by leaves, pollen, industrial dust) as this may deposit on the heat transfer area of the HRD and decrease performance. In case of open cooling towers it must be assured that the water circuit cannot be blocked by inserted debris.
For HRD with spraying devices (nozzles) it must be assured that the blow off water is drained and does not cause water damage, nor favor the growth of algae.
Wet cooling towers must be installed considering the resulting plume (and the implication of possible legionella legislation).
Further on, the piping of the HRD and its insulation must be protected from weather (moisture and deterioration due to UV radiation) and damage by animals. Also, the piping should be protected from direct insolation which may cause an undesired increase in cooling water temperature. In case the HRD is operated with a water-glycol mixture and a separating heat exchanger is installed, it is essential that the HX is dimensioned properly, and the fluids circulate in counter-flow. Generally, the cooling circuit should be equipped with high efficiency components only and designed in such way, that no substantial amount of electricity is required for frost protection (self-emptying design or water-glycol circuit).
5.2 Control of HRD Since the fans of dry or hybrid coolers and wet cooling towers generally contribute significantly to the auxiliary electricity demand of Solar Thermal Cooling Systems (STCS), special care must be taken of their operation. Conventionally, HRD are operated either with: fixed fan speed, so the fan always works at full load, independently of the ambient
temperature and the cooling load.

IEA SHC Task 48 / task48.iea-shc.org
Subtask A – Activity A3 - Final Report Page 34 of 60
2-step fan speed control, where the power supply to the fan motor is switched between star- and delta connection depending on the cooling water temperature, therefore, reducing the fan electricity consumption (e.g. at low ambient temperatures).
with variable frequency drive (VFD) controlled fan and a fixed set temperature (typically 27°C) for the outlet temperature of the cooling water. This control leads to a noticeable decrease in electricity consumption if the HRD works with highly varying ambient temperatures and cooling loads.
Kühn, Corrales Ciganda et al. [6] were among the first to use another approach to control HRD, which not only tackles its high electricity consumption but also the problem of Thermally Driven Chiller (TDC) not having a capacity control: the fan speed is controlled as a function of the desired chilled water outlet temperature of the TDC. This way, the chilling capacity may be reduced by decreasing the fan speed and thus increasing the cooling water temperature. The resulting lower efficiency of the chiller is knowingly accepted, as this option is most likely still more preferable than turning the chiller on and off, which is the traditional way of dealing with low cooling loads and which leads to substantial losses of efficiency due to the thermal inertia of the system. If this approach is chosen, it is essential to be aware of the fact that also the circulating pumps in the hydraulic circuits around the chiller require a substantial amount of electricity. So if the cooling capacity is decreased a lot, the resulting electric EER of the system may not be competitive with a conventional compression chiller despite the reduced electricity consumption of the HRD. On the other hand, this approach allows to increase the chilling capacities at times of high cold demand by increasing the fan rotational speed which means a reduction of the cooling water temperature. A possibility to further reduce the electricity consumption during part load operation is the control of the circulating pumps. The company PINK already partly controls the pumps in their machine to a fixed temperature difference (driving circuit) or outlet temperature (chilled water circuit). This option can also be analyzed for other chillers. In case of dry coolers, the optional spraying offers the possibility to reduce the cooling water temperature by 2 K on an average [7]. To minimize the water consumption of spraying the set temperature and the duration of the spraying can be optimized. Mittelbach [7] showed that a high frequency of spraying pulses with a short duration is favorable compared to few longer pulses with regard to water consumption and additional cooling effect.

IEA SHC Task 48 / task48.iea-shc.org
Subtask A – Activity A3 - Final Report Page 35 of 60
Figure 5.1: Effect of starting time of spray action on cooling water temperature profile; Source: [7].
If dry coolers with spraying are used in combination with adsorption chillers, the same study explains that the starting time of the spray action strongly influences the cooling water temperature profile. Since the temperature difference between the entering water and the ambient temperature is high at the beginning of each adsorption cycle, a good heat rejection is obtained even without spraying. Towards the end of the cycle the temperature difference decreases so spraying will have a more significant effect on the cooling water outlet temperature (Figure 5.1). Independently of the described options of optimized control, it is essential to adjust the control of the HRD to the control of the entire solar cooling system, the building control (including cold distribution) and the control options of the user. Two examples shall illustrate the importance of this interaction:
a) In an installation in an office building, the solar cooling system was programmed to operate during a certain schedule (working hours of the office building). Yet, the cold distribution (by fan coil units) was controlled by the user without any feedback to the system control. Therefore, the solar cooling system operated during numerous hours although the user had not requested cold. As a result, the system ran at a very low capacity, only compensating the circulating losses of the distribution system.
b) In another system, the operating signal of the fan coil units was connected to the solar cooling system control, assuring that they could only operate simultaneously. Yet, the set value for the fan coil units was above the chilled water set temperature of the chiller. So, an internal bypass valve of the fan coil units returned a large portion of the chilled water “unused” to the chiller, which again led to an inefficient operation of the chiller.
If the system configuration allows for it, the HRD can also be operated in free cooling mode if the ambient temperature is low enough.

IEA SHC Task 48 / task48.iea-shc.org
Subtask A – Activity A3 - Final Report Page 36 of 60
5.3 Maintenance The maintenance requirements of cooling circuit are similar to those of other hydraulic systems. This includes the regular (annual) revision and function test of all components relevant for a safe system operation (e.g. valves, bleeder, expansion vessel, filters). If there is a glycol circuit the pH-value should also be checked regularly. For the HRD itself, the manufacturers typically specify the required maintenance actions instructions, e.g. [8]. Especially cleaning is essential in order to assure proper functioning and performance. For wet cooling towers (and possibly also for dry coolers with spraying and hybrid coolers) special legionella legislation is applicable in many countries. These usually require an antibacterial treatment in certain intervals of time. Maintenance instruction for wet cooling towers also can be found in published guidelines (e.g. [9], [10] or [11]). A typical mechanical maintenance schedule by Eurovent is shown in Table 5.1.
Table 5.1: Typical Mechanical Maintenance Schedule: Source [9].
5.4 Performance of HRDs (comparison of monitored devices) A comparison of performance of different monitored HRDs is only reasonable if the operating conditions are comparable. This does not imply equal operating conditions for comparison. However, the quantities representing the performance need to be independent of operating conditions which differ among the devices. A classical representation of performance is electricity consumption per rejected heat. In Chapter 3, average values retrieved from the market analysis have been reported, namely equal to 0.033 kWel /kWch for dry HRD and 0.017 kWel /kWch for wet cooling towers. However the quantity is strongly dependent on the inlet temperatures and on the mass flow rates of the two streams (water and air). According to the HRD and the system this quantity varies strongly for different operating conditions. A comparison of performance based on this quantity is therefore not carried out in this section.

IEA SHC Task 48 / task48.iea-shc.org
Subtask A – Activity A3 - Final Report Page 37 of 60
The electrical power consumption of the circulating pump and the fans (Pel) shall be the basis for the rating of different design and materials used in HRD, since it is the determinant for the operating costs (at least in case of dry coolers). In [12] and more detailed in [13], it is shown that the total electric power consumption of a HRD (including pumps and fans together or separated) can be expressed as a function of heat capacity flow rate of the cooling fluid 퐶̇ = 푚̇ ∙ 푐 , (e.g. water or glycol/water mixture) and a cooling effectiveness 휀 (cf. Equations (3.1) and (3.2)). For wet cooling towers an additional quantity representing air humidity is necessary. The method of comparison is independent of operating temperatures as long as the fluid temperatures of the HRDs do not differ too much. Therefore, a comparison of monitored devices is possible by plotting electric power versus 퐶̇ and휀 . In Chapter 5.4.2 and 5.4.4 more details are given.
5.4.1 Requirements and constraints in evaluation of monitoring data
For the performance analysis of heat rejection systems for solar cooling, some information on operation conditions is indispensable. The following measured quantities appertain to this information: ambient air temperature
ambient air humidity (for cooling towers and hybrid systems, including spraying)
water/cooling fluid inlet temperature
water/cooling fluid outlet temperature
water/cooling fluid mass or volume flow
electric power consumption heat rejection system:
o electric power consumption fans
rotational speed of fans (or control signal)
o electric power consumption pumps
fresh water mass flow (for cooling towers and hybrid systems, including spraying)
type of cooling fluid:
o specific heat capacity
o density
In addition, information on the heat rejection system itself is helpful to compare different systems, including: base gross area
heat transfer surface
construction volume
investment costs
information on water preparation (investment cost, operating cost)

IEA SHC Task 48 / task48.iea-shc.org
Subtask A – Activity A3 - Final Report Page 38 of 60
Finally, some constraints are associated with comparing heat rejection systems based on monitoring data. These are: The data given is not stationary but has oscillations (especially for adsorption cooling),
therefore mean values have to be generated, in order to compare the different heat rejection systems.
The boundary conditions of temperature and humidity always have to be considered when comparing rejected heat and electrical power consumption.
Missing measured quantities yield an insufficient performance evaluation
o air humidity
o electrical power of pumps
o electrical power of fans
o fresh water mass flow
o energy demand for water treatment
measurement errors
o e.g. discernible by an incorrect energy balance
As the electrical power consumption of fans and pumps is often taken together in one quantity it is hardly possible to determine the performance of the heat exchanger in the heat rejection system separately from the entire heat rejection circuit and the electrical power for the pumps. A comparison has somehow to approximate the power consumption for pumps and eliminate it from the performance evaluation.
Since some of the dry coolers are operated with a glycol mixture, a separating heat exchanger is necessary for the installation. It has to be clarified whether to include the separating heat exchanger to the performance evaluation or consider it as a separated component, which has not to be included in a performance evaluation of a dry cooler.
5.4.2 Dry coolers
In the following, data from 9 sources (see below for the detailed list) are used to show performance differences between HRDs. As the systems for solar cooling differ, so does the method to determine monitoring data. This results in a non-uniform definition of electrical power for the HRDs. In Figure 5.2 different possible system boundaries for electrical powers are defined.
The boundary B1 includes only the electric power necessary to run the fan (푃 , ). For simulation data the electrical power is calculated by 푉̇ Δ푝 /휂 with 휂 = 0.5. The second boundary (B2) includes the electric powers from B1 plus the fraction of electrical power for the cooling fluid pump needed to overcome the pressure drop on the fluid side of the dry cooler (not the tubes connecting chiller and dry cooler). For simulation data this fraction is given by 푉̇ Δ푝 /휂 , with 휂 = 0.3. Within B3 the whole electric power for the cooling fluid pump is taken into account, additional to the electric power for the fan (B1). Some dry coolers operate with a second heat exchanger, separating the cooling fluid (e.g. ethylene glycol solution) from the water in the chiller. The electric power needed to run this second pump is added in B4 to the power needed in B3. In this case, the increased cooling water temperature after the heat exchanger has to be used to determine cooling effectiveness.

IEA SHC Task 48 / task48.iea-shc.org
Subtask A – Activity A3 - Final Report Page 39 of 60
Figure 5.2: Different boundaries for electrical power of a HRD (source: [13])
The monitoring data which will be analyzed does not contain information on all of these boundaries. A comparison of different dry coolers should take place only within the same boundary (text taken from [13]). The 9 data sets employed for the performance analysis of real installations are collected from different projects and involves monitoring data, lab data and simulation data. In particular, these are: DC1: Data calculated with the software CoilDesigner [14] for a dry cooler (퐴 =
152m²); air and cooling fluid (water) mass flow as well as both inlet temperatures are varied; data for B1 and B2 is given.
DC2: Set of monitoring data from the German project SolCoolSys [15] (퐴 unknown); air mass flow and both inlet temperatures are varied; The dry cooler is operated with an ethylene glycol solution (approximately 30 Vol%), the heat capacity is measured in the water circuit after a separating heat exchanger; temperatures for the cooling fluid side are calculated by assuming an effective temperature difference of 1.5K in the separating heat exchanger; data for B1, B3 (temperatures calculated) and B4 is given.
DC3: Set of monitoring data from the German project SolCoolSys [15] with a more recent dry cooler model than DC2 (퐴 = 221m²); same system as DC2; data for B1, B3 (temperatures calculated) and B4 is given
DC4: Lab data measured by German manufacturer Thermofin [16] for a dry cooler (퐴 = 46m²); air and cooling fluid (water) mass flows as well as both inlet temperatures are varied; data for B1 and B2 is given.
DC5: Set of monitoring data from the German project SolCoolSys [15] (퐴 = 221m²); air mass flow and both inlet temperatures are varied; the dry cooler is operated with an ethylene glycol solution (30 Vol%) as cooling fluid; temperatures are measured in the cooling fluid circuit and in the water circuit after a separating heat exchanger; data for B1, B3 and B4 is given.

IEA SHC Task 48 / task48.iea-shc.org
Subtask A – Activity A3 - Final Report Page 40 of 60
DC6: Data calculated with the software Güntner Product Calculator [17] for a dry cooler of type GFW (퐴 = 1072m²); air and cooling fluid (water) mass flow as well as both inlet temperatures are varied; data for B1 is given.
DC7: Set of monitoring data by ZAE Bayern [18]; The dry cooler is of the type GFH produced by Güntner (퐴 = 197m²); air and cooling fluid (water) mass flow as well as both inlet temperatures are varied; data for B1 is given.
DC8: Set of data of the company Invensor; data for B2 is given.
DC9: Set of monitoring data from EURAC (퐴 = 221m²); air mass flow and both inlet temperatures are varied; the dry cooler is operated with an ethylene glycol solution (40 Vol%) as cooling fluid; temperatures are measured in the cooling fluid circuit; data for B1 is given.
The amount of rejected heat (푄̇) from the cooling fluid to the air is different for the given data, ranging from close to zero to 200 kW. The rejected heat is the product of cooling fluid mass flow rate (푚̇ ), cooling fluid specific heat capacity (푐 , ) and temperature difference (Δ푇 ) of inlet and outlet of the cooling fluid (푄̇ = 푚̇ 푐 , Δ푇 ). The plots in Figure 5.3 depict the frequency (density) distribution of rejected heat for the monitored and simulated dry coolers. It is highest for DC7, which is run with variable cooling fluid mass flow rate (푚̇ ). The frequency (density) distribution in mass flow rate is shown for some dry coolers in Figure 5.4.

IEA SHC Task 48 / task48.iea-shc.org
Subtask A – Activity A3 - Final Report Page 41 of 60
Figure 5.3: Frequency (density) distribution of rejected heat in kW for the dry coolers over the individual measurement period.

IEA SHC Task 48 / task48.iea-shc.org
Subtask A – Activity A3 - Final Report Page 42 of 60
Figure 5.4: Frequency (density) distribution of cooling fluid mass flow rate in kg/s for monitored dry coolers over the individual measurement period.
The mass flow rate of DC7 is ranging from 0.2 kg/s to 0.9 kg/s, whereas the mass flow rate of DC2 is approximately constant at 1.0 kg/s. Likewise, DC3, DC5 and DC9 are operating at constant cooling fluid mass flow rate. For the simulation data DC1 and DC6, the cooling fluid mass flow rate is constant as well. Additionally to different cooling fluid mass flow rate, also the heat transfer surface (HTS) of the given dry coolers (퐴 ) is different. In Figure 5.5, the heat transfer surface for the dry coolers is plotted, showing that DC6 has approximately five times the heat transfer surface than the other dry coolers. Despite the fact that the cooling fluid mass flow rate of DC7 is smaller than of DC2 the heat transfer surface is comparable, resulting in much higher quotient of heat transfer area to cooling fluid heat capacity rate (퐶̇ ) for DC7. The different quotients are depicted in Figure 5.6. For the non-constant cooling fluid mass flow rate of DC7 a mean value for cooling fluid heat capacity rate has been taken. The

IEA SHC Task 48 / task48.iea-shc.org
Subtask A – Activity A3 - Final Report Page 43 of 60
following analysis is based on a mass flow rate of 0.5kg/s < 푚̇ < 0.6kg/s for DC7. Figure 5.6 shows that the ratio between heat transfer area and cooling fluid heat capacity rate (cooling fluid mass flow rate) for the monitored data is by far not comparable. A heat rejection system with high heat transfer area and low cooling fluid mass flow rate (as DC7) can operate at lower electric power for the fans as the time for heat transfer is much higher than in comparison to a heat rejection system with low heat transfer area and high cooling fluid mass flow rate (as DC2 and DC5). From a thermodynamic viewpoint, the former operating strategy is favorable, but yields higher investment costs for the same application.
Figure 5.5: Heat transfer area for the dry coolers in m². For DC2 and DC8 the heat transfer area is not known.

IEA SHC Task 48 / task48.iea-shc.org
Subtask A – Activity A3 - Final Report Page 44 of 60
Figure 5.6: Heat transfer area versus cooling fluid capacity flow rate. Grey areas representing similar relation of heat transfer area and cooling fluid capacity rate. Dark grey: high investment cost, low operational cost. Bright
grey: low investment cost, high operational cost. DC2 and DC8 are not included in the plot.
In general, a large heat exchanger (large heat transfer surface) and low cooling fluid mass flow rates (low capacity flow rates) yields a low outlet temperature of the cooling fluid close to the ambient temperature. The pressure drop on cooling fluid side (and therefore the electrical power for pumps) is low, as well as the pressure drop on air side, as air velocity can be reduced due to the large heat transfer surface without reducing the amount of rejected heat. As a consequence, even for the same cooling fluid mass flow, the operating cost will be lower if a larger heat exchanger is used, as the electric power is approximately proportional to velocity to the power of three. A small fictive example shall explain this benefit of larger heat transfer surface for reduced running costs. Assuming a cooling fluid flow of 2 kg/s shall be cooled from a given temperature 푇 , = 40°C to a temperature of30°C. This corresponds to a cooling effectiveness of휖 = 0.5, if the ambient temperature equals푇 , = 20°C. One possibility is to run on one HRD a cooling fluid

IEA SHC Task 48 / task48.iea-shc.org
Subtask A – Activity A3 - Final Report Page 45 of 60
mass flow rate of 2 kg/s, another possibility is to run on two HRD a mass flow rate of 1 kg/s each. This will result in an electric power for the pump of the DC with the lower flow rate which is approximately one eights of the power needed for the DC with high flow rate. Together the electric power is one quarter of the power needed for the DC with high flow rate. For the electric energy consumption of the fan it is necessary to know how this varies with the mass flow rate of the cooling fluid and with the cooling effectiveness (휀 ), defined in Eq. (3.1). As described in [13], the electrical power of the fans is a function with the following form:
푃 , = 푃 , 휀 , 퐶̇ , DC, 푐푓 in [Wel] (5.1)
This function is plotted for the fictive dry cooler of the example and water as cooling fluid in Figure 5.7. Comparing the electric power at 휀 = 0.5 yields 푃 , 푚̇ = 1 = 50푊
and푃 , 푚̇ = 2 = 300푊. As there are two DCs needed for the lower flow rate, the total electric power is 100 W in comparison to 300 W for the DC with higher fluid flow. The rejected heat is for both possibilities the same. The electric energy savings are between 66% (air side) and 75% (water side). The investment costs are approximately double. The relation between heat transfer surface and cooling fluid capacity flow rate is double as well. Whether it is reasonable to run one or two DCs depends on the operational time. This example shall demonstrate, that HRDs which have a high value of 퐴 /퐶̇ have lower running costs, but higher investment costs (dark grey area in Figure 5.6) and that HRDs with a low value of 퐴 /퐶̇ have higher running costs, but lower investment costs (bright grey area in Figure 5.6).
Figure 5.7: electric power for heat rejection in kW versus cooling effectiveness for the same DC at different mass flow rates of 2 kg/s and 1 kg/s.

IEA SHC Task 48 / task48.iea-shc.org
Subtask A – Activity A3 - Final Report Page 46 of 60
In Figure 5.8 the electric power for pumps and fans versus the rejected heat is plotted. Due to the availability of data, the system boundaries for electrical power are fixed as showed in Table 5.2. The data are therefore only partly comparable.
Table 5.2: electrical boundaries for Figure 5.8 to Figure 5.10.
system boundary B1 B2 B4
dry cooler DC6, DC7, DC9 DC1, DC4, DC8 DC2, DC3, DC5
The data scattering of Figure 5.8 is due to different boundary conditions during operation, including different ambient and cooling fluid inlet temperatures, as well as different refrigerated water volume flows. For DC1 the refrigerated water volume flow is kept constant in order to avoid further scattering. This depiction is not sensible enough to compare the performance for dry coolers, as the impact of boundary conditions is too strong. For DC2 e.g. the electric power varies from 0.6 kW to 1.4 kW for the same rejected heat of 15 kW.

IEA SHC Task 48 / task48.iea-shc.org
Subtask A – Activity A3 - Final Report Page 47 of 60
Figure 5.8: electric power for heat rejection in W versus rate of heat flow in W. The rate of heat flow for DC8 is too high to fit into the plot.
For the electric power (푃 ), the sum of electric power for fans and electric power for pumps of the cooling fluid circle and the water (to chiller) circle has been taken when possible. For DC1 a fan efficiency of 0.3 and a pump efficiency of 0.5 have been used for calculation. For DC6, DC7 and DC9 the electric power for pumps is not included (boundary B1, cf. Figure 5.2). The electric power is for all coolers (except DC4 and DC6) an increasing function of the rejected heat. However the gradient differs due to different operating conditions and probably due to different heat exchangers used. In Figure 5.9, the electric power is plotted versus the cooling effectiveness 휀 . The same data as before are used. The scattering is reduced due to the fact that the refrigerated water volume flows are constant for each heat exchanger, and therefore the electrical power is only dependent on the cooling effectiveness. The small scattering of data of DC2 and DC3 is not yet clarified. The unsteady operation of the heat exchanger or measurement errors might be reasons for the scattering. The scattering of DC7 is due to the fact that the cooling fluid mass

IEA SHC Task 48 / task48.iea-shc.org
Subtask A – Activity A3 - Final Report Page 48 of 60
flow is not kept constant. Furthermore, it is not yet cleared if spraying of water takes place at DC7, which yields cooling ratios higher than 1 (plotted data is filtered). As the cooling fluid volume flows differ from dry cooler to dry cooler, a rating of performance is still not possible. Notwithstanding the scattering of data is enormously reduced in comparison to Figure 5.8, especially for DC1, DC5 and DC6 a distinct curve can be detected.
Figure 5.9: electric power for heat rejection in W versus cooling effectiveness. The cooling fluid mass flow rate of DC7 is constant.
For a better comparison, the electric power has to be normalized with a parameter describing somehow the size of the dry cooler. This can be the physical size as well as thermodynamic parameters (e.g. rejected heat or volume flow rate). To get a good comparison of different cooling fluids, normalization with the cooling fluid heat capacity rate is a good choice and is plotted in Figure 5.10.

IEA SHC Task 48 / task48.iea-shc.org
Subtask A – Activity A3 - Final Report Page 49 of 60
Figure 5.10: Ratio of electric power and cooling fluid heat capacity rate in K versus cooling effectiveness.
DC6 is now in the same range as the other heat exchanger, despite the size difference expressed, for example, in terms of heat transfer surface of 1072 m² for DC6 and 152 m² for DC1 (see Figure 5.5). A rating of dry coolers in operation is now possible and yields the best performance for DC7 and DC8. Coming up last are DC4, DC2 and DC3 along the entire range of cooling ratio. It is hardly surprising that DC7 has a better performance than the other dry coolers, as the heat transfer area is relatively (to cooling fluid mass flow rate or capacity rate) high according to Figure 5.5. The bad performance of DC4 is due to the highest capacity flow rate in comparison to heat transfer surface (cf. Figure 5.6). The better performance of DC5 compared to DC2 in Figure 5.10 yields an overall better performance of the whole cooling system in terms of coefficient of performance. For details see the project SolCoolSys [15].

IEA SHC Task 48 / task48.iea-shc.org
Subtask A – Activity A3 - Final Report Page 50 of 60
To compare the performance of the dry coolers, the figures above can only be used as long as the system boundaries for electric power are the same. According to Figure 5.2, three different system boundaries are used in the plots. DC7 and DC8 do not belong to the same boundary group.
To get a better comparison, data have been plotted for the same system boundary B1 (cf. Table 5.3) if the monitoring data were sufficient. The result is shown in Figure 5.11.
Table 5.3: electrical boundaries for Figure 5.11
system boundary B1
dry cooler DC1, DC2, DC3, DC4, DC5, DC6, DC7, DC9
Figure 5.11: Ratio of electric power for fans (B1) and cooling fluid heat capacity rate in K versus cooling effectiveness.
The above figure is a very strong tool for the performance evaluation of HRD. It shows that

IEA SHC Task 48 / task48.iea-shc.org
Subtask A – Activity A3 - Final Report Page 51 of 60
the electrical power (for fans) is lowest for DC7 and DC5 over a wide range of cooling effectiveness. It is highest for DC4. The operating costs (just considering electric power for fans) will therefore be lowest for DC7 and DC5. These results correspond strongly to the observations in Figure 5.6, wherein DC7 and DC5 have the highest specific heat transfer surface and DC4 has the lowest. Interesting is the result for DC3, DC5 and DC9. All three dry coolers are the same, but the operating mass flow rate differs. The mass flow rate of DC5 is 25% less than DC3, and therefore a better thermodynamic performance is a direct consequence. DC3 and DC9 have similar mass flow rates, they have similar performance for a cooling effectiveness of 0.5, but differ strongly for lower cooling effectiveness. The reason for this behavior is not yet known, surprisingly the shape of the curve (DC9) is similar to the DC2.
5.4.3 Dry coolers with spraying
Data of dry coolers with spraying are available, but lack in accuracy, as only the time frame of spraying is given, but the amount of water sprayed is missing. The monitored data have been added to the chapter of dry coolers. Times with spraying have been filtered out.
5.4.4 Wet cooling towers
A performance evaluation for wet cooling towers can be performed with similar methods as those discussed for dry coolers. However, the dry cooling effectiveness has to be changed to a cooling effectiveness based on enthalpy differences, instead of temperature differences, as in addition to air temperature, the humidity of air is now a key quantity, determining the performance of the heat rejection system. The following plots are based on monitoring and simulation data: CT1: Monitoring data from the German project Solarthermie2000+, separated by a
hydraulic compensator; 1700 kW nominal power
CT2: Monitoring data of a Gohl Typ 2/82 Z XL; 1880 kW nominal power
CT3: Monitoring data from the German project SolCoolSys, Axima EWK 036/06 with separating heat exchanger; 45 kW nominal power
CT4: Monitoring data from the German project SolCoolSys, Multi KT-A 90 with separating heat exchanger; 65 kW nominal power
CT5: Simulated data (Trnsys Type 51) of Axima EWK 036/06; 45 kW nominal power
The mean rejected powers are very different for the monitored installations, ranging from 16 kW to 392 kW. In Figure 5.12, the frequency (density) distribution of rejected heat is plotted for the monitoring data. The data has been filtered: data points with electricity consumption of fans equal to zero are eliminated from the data set.

IEA SHC Task 48 / task48.iea-shc.org
Subtask A – Activity A3 - Final Report Page 52 of 60
Figure 5.12: Frequency (density) distribution of rejected heat for monitored and simulated cooling towers
The electricity consumption (푃 ) of the heat rejection system is depicted in Figure 5.13 versus the rejected heat. Both the electric power for fans and the electric power for pumps are included in the electric power푃 . A comparison of CT1 with the other cooling towers is not possible, because of the different sizes. However the performance of CT4 seems to be better than CT3, as the electricity consumption is similar, but the rejected heat is nearly twice as high. However, as further operating conditions are not included in this plot, a HRD performance rating is not possible.

IEA SHC Task 48 / task48.iea-shc.org
Subtask A – Activity A3 - Final Report Page 53 of 60
Figure 5.13: Electric power for heat rejection in W versus rate of heat flow in W. The heat tranfer rate for CT1 and CT2 is too high to fit into the first plot.
A further analysis similar to dry coolers including the cooling effectiveness (휀 ) is possible if the effectiveness definition is adjusted with respect to Eq. (3.2). A wet effectiveness for the cooling fluid can be defined as:
휀 , =훥ℎ ,
훥ℎ=ℎ , , − ℎ , ,
ℎ , , − ℎ , (5.2)
The maximum enthalpy difference 훥ℎ is thereby the difference between the enthalpy of saturated air at water inlet temperature and the enthalpy of the air at the air side inlet. 훥ℎ ,
is the enthalpy difference between the enthalpy of saturated air at water inlet temperature and the enthalpy of saturated air at water outlet temperature. For an ideal cooling tower, the water outlet temperature cannot be lower than the wet bulb temperature of the incoming air. Therefore, the enthalpy of saturated air at water outlet temperature is always lower (or ideally equal) than the enthalpy of the air at the air side inlet. Consequently, the wet cooling effectiveness 휀 , is always in the range of 0 to 1. Only in an ideal heat exchanger, a value of 1 can be reached. In Figure 5.14 the electric power for fans and pumps of the monitored and simulated cooling

IEA SHC Task 48 / task48.iea-shc.org
Subtask A – Activity A3 - Final Report Page 54 of 60
towers 푃 is plotted versus the wet cooling effectiveness휀 , .
Figure 5.14: Electric power in W versus the wet cooling effectiveness
The electric power for CT1 is by far higher than for CT3 and CT4 for the same wet cooling effectiveness, due to a higher water volume flow rate (and rejected heat) of CT1. Neither a comparison of performance for CT3 and CT4 is possible, as the water volume flow rates (and the different amounts of rejected heat) are different as well. One possibility to deal with that sizing problem is a normalization of electrical power with capacity flow rate. This is shown in Figure 5.15. A comparison of performance is now possible as the electric power is scaled.

IEA SHC Task 48 / task48.iea-shc.org
Subtask A – Activity A3 - Final Report Page 55 of 60
Figure 5.15: Ratio of electric power and water heat capacity rate in K versus wet cooling effectiveness
CT1 and CT4 have similar performance, better than CT3. The data show that for each water heat capacity rate (W/K) and a given wet cooling effectiveness of 0.5, an electric power of 0.18 W to 0.35 W has to be invested. For higher wet cooling effectiveness this value increases, for lower values it decreases. Such a plot can be easily used to recalculate the rejected heat related to given inlet enthalpies of water and air:
푄̇훥ℎ
=퐶̇ ∙ 휀 ,
푐 , (5.3)
With
푐 , =훥ℎ ,
훥푇 (5.4)
Table 5.4 can give a short overview on expected values for enthalpy differences and wet cooling effectiveness, dependent on the operation condition of the heat rejection system.

IEA SHC Task 48 / task48.iea-shc.org
Subtask A – Activity A3 - Final Report Page 56 of 60
Table 5.4: different operation conditions and its influence on evaluation quantities.
Operation conditions Calculated quantities
푇 , 푇 , 푇 , , Relative humidity
퐶̇ 훥ℎ , 훥ℎ 푐 , 휀 , 푄̇
°C °C °C % W/K J/kg J/kg J/kg K - W
40 35 30 50 10,000 37,548 103,269 7,509 0.364 50,00
0
A wider range of possible operation conditions and its influence on wet cooling effectiveness is depicted in Figure 5.16. The wet cooling effectiveness is not a linear function of the water side outlet temperatures, but a strictly concave function. The definition given in Eq. (5.2) should be therefore preferred to the one given in Eq. (3.2) for a temperature based wet cooling effectiveness휀̃ ,
.
Figure 5.16: wet cooling effectiveness for different boundary conditions. The wet bulb temperature of air and the inlet temperature of water are fixed. The water outlet temperature range is between these temperatures, yielding the colored lines for wet cooling ratio. (“Rf” for refrigerant is used instead of “cf” as an index).

IEA SHC Task 48 / task48.iea-shc.org
Subtask A – Activity A3 - Final Report Page 57 of 60
6 Conclusions This report presents the main outcomes of activity A3, which focuses on heat rejection devices for solar cooling systems. These components are crucial for the performance of solar cooling systems, determining the operating boundary conditions of the thermal chillers. The extensive review of the market of heat rejection devices included an analysis of about 1300 market available components regarding different key indicators. As a result of this survey, a valid reference has been set to benchmark heat rejection devices against the actual market. A second survey on national and international standards available for heat rejection devices was conducted. This survey focused on different aspects ranging from installation and operation to security and maintenance regulations. This part is clearly aimed at presenting to the reader a quite extensive review of all the standards related to heat rejections and then permit to refer to it when working on this topic. Lessons learned from on-site experiences have been summarized in a series of guidelines focused on installation, maintenance and control strategies for heat rejection devices. A brief overview on possible operation strategies for heat rejection devices, which may significantly reduce their electricity consumption, is included. One of the main issues that have emerged during this work, concerns the need to assess the performance of heat rejection systems and to compare different typologies of components and working scenarios. A comparison of systems from the database is possible, provided that correction coefficients are given by the manufacturers. This allows for performance forecasting for non-nominal working conditions as well as for location-specific boundary conditions. In general, WCTs allow higher heat rejection rates, thanks to the contribution of latent heat. However, specific comparisons need to take into account the air temperature and the air relative humidity, which largely influence the overall performance of HRDs. Besides the performance rated on the datasheet, sets of monitoring data from different real installations were collected (9 sets of data for dry coolers and 5 for wet cooling towers). A direct comparison of these systems (based, e.g., on the variation of electric consumptions versus rejected heat) is not trivial given that the systems largely differ in terms of size and operating conditions. A more appropriate comparison is based on the ratio of electric power and cooling fluid heat capacity versus the cooling effectiveness. These quantities are an indirect representation of the operating costs (specific electric consumptions) and of the investment costs (heat rejection capacity). Particular attention has to be paid to the boundary considered for the measurement of electrical consumptions, which in general might include the consumption for the fans, the cooling fluid circulation pump, etc.. To have a meaningful comparison, the same boundary should be chosen for all the considered systems. The results of the comparison of the monitoring data sets showed that, given a cooling target, the specific electricity consumption for different systems can vary by a factor of 4 for dry coolers and by a factor of 2 for wet cooling towers. The audience of this document is all the entities willing to study the feasibility of a solar cooling project and considering the different options for heat rejection.

IEA SHC Task 48 / task48.iea-shc.org
Subtask A – Activity A3 - Final Report Page 58 of 60
7 Further reading This document has only partially covered the topic of heat rejection systems, focusing mainly on an overview of the state–of-the art of the market and of the policy framework, and presenting a new approach for the elaboration of monitoring data and the performance comparison of different heat rejection devices. The documents listed below can be used as reference for a deeper insight into the broad field of heat rejection technology. VV.AA., TASK 38 – Solar Air-Conditioning and Refrigeration, Technical report of subtask
C - Work package 5, Heat rejection, Edited by L. Reinholdt, 2010 – Available online at:
http://task38.iea-shc.org/data/sites/1/publications/IEA-Task38-Report_C5_Heat%20rejection.pdf
VV.AA. Solar-assisted Air-conditioning in Buildings: A handbook for Planners, H.M. Henning (ed.), Springer Wien-New York, 2nd Ed., 2007
AHRI Standard 560-2000, Absorption Water Chilling and Water Heating Packages – Available online at:
http://www.ari.org/App_Content/ahri/files/standards%20pdfs/AHRI%20standards%20pdfs/AHRI_Standard_560-2000.pdf

IEA SHC Task 48 / task48.iea-shc.org
Subtask A – Activity A3 - Final Report Page 59 of 60
8 Bibliography
[1] M. D'Antoni, D. Romeli and R. Fedrizzi, "Techno-economic analysis of air-to-water heat rejection systems," in Eurosun Conference , Aix-les-Bains, France, 2014.
[2] „SolaRück AP 1.1/AP 1.3,“ Institut für Luft- und Kältetechnik, Dresden, 2013. [3] D. Romeli, Modeling of spray cooling air-water heat exchanger, University of Bergamo,
Italy, 2014. [4] U. Eicker, D. Pietruschka and R. Pesch, "Heat rejection and primary energy efficiency of
solar driven absorption cooling systems," International Journal od Refrigeration, vol. 35, pp. 729-738, 2012.
[5] M. H. Saidi, B. Sajadi and P. Sayyadi, "Energy consumption criteria and labelling programm of wet cooling tower in Iran," Energy and Buildings, vol. 43, no. 10, pp. 2712-2717, 2011.
[6] A. Kühn, J. L. Corrales-Ciganda and F. Ziegler, "Comparison of control strategies of solar absorption chillers," in Eurosun Conference , Lisbon, 2008.
[7] W. Mittelbach, "Experience with dry heat dissipation unit using fresh water spray system," in Solarück Ruckkühl Workshop, Bad Krozingen, 2013.
[8] Alfa Laval, "Maintenance Plan for dry coolers / PFCs," [Online]. Available: http://www.lubeteam.it/Doc/Drycooler%20maintenance.pdf. [Accessed 2 October 2014].
[9] EUROVENT, "9/5 - Recommended code of practice to keep your cooling system efficient and safe," 2002. [Online]. Available: http://www.eurovent-association.eu/fic_bdd/document_en_fichier_pdf/Eurovent%209.5_13772416860.pdf. [Accessed 2 October 2014].
[10] EUROVENT, "9/7 - Recommended code of practice to keep your cooling system efficient and safe," 2011. [Online]. Available: http://www.eurovent-association.eu/fic_bdd/magazine_en_fichier/REC9-7%20Code%20of%20practice,%20efficient%20and%20safe_13157469201.pdf. [Accessed 2 October 2014].
[11] VDMA, "24649 - Hinweise und Empfehlungen zum wirksamen und sicheren Betrieb von Verdunstungskühlanlagen," May 2005. [Online]. Available: http://www.vdma.org. [Accessed 2 October 2014].
[12] B. Nienborg, H. Fugmann, L. Schnabel, P. Schossig, S. Wittig, G. Trommler and A. Dalibard, "Performance figures for the analysis of heat rejection systems," in 5th International Conference Solar Air conditioning, Bad Krozingen, 2013.
[13] H. Fugmann, B. Nienborg, G. Trommler and A. Dalibard, Performance evaluation of air-based heat rejection systems, 2014.
[14] H. Jiang, V. Aute and R. Radermacher, "CoilDesigner: a general-purpose simulation and design tool for air-to-refrigerant heat exchanger," International Journal of Refrigeration, vol. 29, no. 4, pp. 601-610, 2006.
[15] SolCoolSys, "SolCoolSys," 2014. [Online]. Available: https://www.solcoolsys.de/.. [Accessed 29 January 2014].
[16] Thermofin, "Thermofin," 2014. [Online]. Available: http://www.thermofin.de/. [Accessed 4 June 2014].
[17] Günter GmbH & Co, "Günter GmbH & Co. KG: Product Calculator (GPC)," 2014. [Online]. Available: http://www.guentner.de/know-how/product-calculator-gpc/.

IEA SHC Task 48 / task48.iea-shc.org
Subtask A – Activity A3 - Final Report Page 60 of 60
[Accessed 4 June 2014]. [18] ZAE Bayern, "Projekt: Komponenten- und Systementwicklung: Solares Heizen und
Kühlen mit Absorptionskältemaschine und Latentwärmespeicher," 2014. [19] P.N. Melograno, R. Fedrizzi, W. Sparber, G. Franchini, "Test Procedures for Sorpion
Chillers Based on the working Mode," in EuroSun 2010, 2010. [20] Harald Druck, Stephan Bachmann, "Performance Testing Of Solar Combisystems -
Comparison of the CTSS with the ACDC procedure," 2002. [21] B. Mette, J. Ullmann, H. Druck, M.Albaric, A. Leconte, P. Papillon, "CombiSol project -
Solar Combisystems Promotion and Standardisation - D3.1 Comparison of test methods.," 2010.
[22] D. J. Naron, "Using the DST Test Method for Testing "solar only" and "preheat" solar DHW sysyems," 2011.