final cooperating agency report 2015 - nepa a the fourth report on cooperating agencies in...
TRANSCRIPT

Attachment A
The Fourth Report on Cooperating Agencies in Implementing the Procedural Requirements of the National Environmental Policy Act (NEPA)
Council on Environmental Quality
October 2016

Attachment A: Fourth Report on Cooperating Agency Status FY 2015 Page i
Table of Contents The Fourth Report on Cooperating Agencies in Implementing the Procedural Requirements of the National Environmental Policy Act (NEPA) ................................................................................................................................. i Table of Contents............................................................................................................................................................ i I. Summary ................................................................................................................................................................ 1 II. Departments............................................................................................................................................................ 3
A. Department of Agriculture ............................................................................................................................. 4 A1. Agriculture Research Service ................................................................................................................. 6 A2. Animal and Plant Health Inspection Service .......................................................................................... 6 A3. Farm Service Agency ............................................................................................................................. 6 A4. Forest Service ......................................................................................................................................... 7 A5. National Institute of Food and Agriculture ............................................................................................. 8 A6. Natural Resources Conservation Service ............................................................................................... 8 A7. Rural Development ................................................................................................................................. 9
B. Department of Commerce ............................................................................................................................. 9 B1. Economic Development Administration .............................................................................................. 10 B2. First Responders Network Authority .................................................................................................... 11 B3. National Institute of Standards and Technology .................................................................................. 11 B4. National Oceanic and Atmospheric Administration ............................................................................. 11 B5. National Telecommunications and Information Administration .......................................................... 12
C. Department of Defense ................................................................................................................................ 12 C1. Air Force .............................................................................................................................................. 13 C2. Army .................................................................................................................................................... 14 C3. Army Corps of Engineers ..................................................................................................................... 14 C4. Defense Logistics Administration ........................................................................................................ 15 C5. Joint Guam Program Office .................................................................................................................. 15 C6. Marine Corps ........................................................................................................................................ 15 C7. Missile Defense Agency ....................................................................................................................... 16 C8. Navy ..................................................................................................................................................... 16
D. Department of Education ............................................................................................................................. 17 E. Department of Energy ................................................................................................................................. 17 F. Department of Health and Human Services ................................................................................................ 17
F1. Centers for Disease Control .................................................................................................................. 18 F2. Food and Drug Administration ............................................................................................................. 19 F3. Head Start ............................................................................................................................................. 19 F4. Health Resource Services Administration ............................................................................................ 19 F5. Indian Health Service ........................................................................................................................... 20 F6. National Institutes of Health ................................................................................................................. 20
G. Department of Homeland Security .............................................................................................................. 20 H. Department of Housing and Urban Development ....................................................................................... 21 I. Department of Interior ................................................................................................................................. 22
I1. Bureau of Indian Affairs ....................................................................................................................... 23 I2. Bureau of Land Management ............................................................................................................... 23 I3. Bureau of Ocean Energy Management ................................................................................................. 24 I4. Bureau of Reclamation ......................................................................................................................... 25 I5. Fish and Wildlife Service ..................................................................................................................... 25 I6. National Park Service ........................................................................................................................... 26 I7. Office of Surface Mining...................................................................................................................... 26 I8. U.S. Geological Survey ........................................................................................................................ 27
J. Department of Justice .................................................................................................................................. 27 J1. Bureau of Prisons ................................................................................................................................. 28 J2. Community Oriented Policing Services ............................................................................................... 28 J3. Federal Bureau of Investigation ........................................................................................................... 29 J4. Office of Justice Programs ................................................................................................................... 29
K. Department of Labor ................................................................................................................................... 29
Attachment A: Fourth Report on Cooperating Agency Status FY 2015 Page ii
L. Department of State ..................................................................................................................................... 29 M. Department of Transportation ..................................................................................................................... 30
M1. Federal Aviation Administration .......................................................................................................... 31 M2. Federal Highway Administration ......................................................................................................... 32 M3. Federal Motor Carrier Safety Administration ....................................................................................... 32 M4. Federal Railroad Administration .......................................................................................................... 33 M5. Federal Transit Administration ............................................................................................................. 33 M6. Maritime Administration ...................................................................................................................... 34 M7. National Highway Traffic Safety Administration ................................................................................ 34 M8. Pipeline and Hazardous Materials Safety Administration .................................................................... 34 M9. Surface Transportation Board ............................................................................................................... 34
N. Department of the Treasury ......................................................................................................................... 35 O. Department of Veterans Affairs................................................................................................................... 35
III. Independent Agencies .......................................................................................................................................... 36 A. Armed Forces Retirement Home ................................................................................................................. 38 B. Central Intelligence Agency ........................................................................................................................ 38 C. Consumer Product Safety Commission ....................................................................................................... 38 D. Denali Commission ..................................................................................................................................... 38 E. Environmental Protection Agency ............................................................................................................... 39 F. Export-Import Bank ..................................................................................................................................... 39 G. Farm Credit Administration ......................................................................................................................... 39 H. Federal Communications Commission ........................................................................................................ 39 I. Federal Deposit Insurance Corporation ....................................................................................................... 40 J. Federal Energy Regulatory Commission ..................................................................................................... 40 K. Federal Reserve Board................................................................................................................................. 40 L. Federal Trade Commission .......................................................................................................................... 40 M. General Services Administration ................................................................................................................. 41 N. International Boundary and Water Commission ......................................................................................... 41 O. National Aeronautics and Space Administration ......................................................................................... 41 P. National Capital Planning Commission ....................................................................................................... 41 Q. National Endowment for the Arts ................................................................................................................ 41 R. National Indian Gaming Commission ......................................................................................................... 42 S. National Science Foundation ....................................................................................................................... 42 T. Nuclear Regulatory Commission ................................................................................................................. 42 U. Overseas Private Investment Corporation ................................................................................................... 43 V. Presidio Trust .............................................................................................................................................. 43 W. Securities and Exchange Commission ......................................................................................................... 43 X. Small Business Administration.................................................................................................................... 43 Y. Social Security Administration .................................................................................................................... 43 Z. Tennessee Valley Authority ........................................................................................................................ 43 AA. U.S. Access Board ....................................................................................................................................... 44 BB. U.S. Agency for International Development (USAID) ............................................................................... 44 CC. U.S. Postal Service ...................................................................................................................................... 44 DD. Valles Caldera Trust .................................................................................................................................... 45

Attachment A: Fourth Report on Cooperating Agency Status FY 2015 Page 1
I. Summary In 2002, the Council on Environmental Quality (CEQ) issued a memorandum to Federal agencies requesting a report of their efforts to engage other Federal agencies and tribal, state and local government entities as formal cooperating agencies in preparing National Environmental Policy Act (NEPA) reviews.1 In May 2005, CEQ released a cooperating agency report describing cooperating agency activities from March 2002 through August 2004.2 In May 2012, CEQ released its second report on the status of cooperating agency participation in Environmental Impact Statements (EISs) and Environmental Assessments (EAs) for fiscal years (FYs) 2005 through 2011.3 In June 2015, CEQ released its third report on the status of cooperating agency participation in Environmental Impact Statements (EISs) and Environmental Assessments (EAs) for fiscal years (FYs) 2012 through 2014.4 This report provides the cooperating agency information reported by Federal agencies for FY 2015 and, for comparison purposes, includes the previous three years’ data and an overall average figure of all four years.5 During the reporting period, FY 2015, nearly 66 percent of EISs were prepared with the participation of cooperating agencies (see Table 1). This level marked a sharp increase in the number of cooperating agencies. Table 1. Percentage of EISs with Cooperating Agencies Started in FY 2012 and FY 2015
Total FY 2012 FY 2013 FY 2014 FY 2015 Overall # of EISs 244 179 137 261 821 # of EISs w/ CAs 114 76 67 172 429 % of EISs w/ CAs 46.7% 42.5% 48.9% 65.9% 52.2%
The percentage of EAs prepared with designated cooperating agency participation in FY 2015 was roughly five percent, down from the previous two years participation of approximately eight percent (see Table 2). Table 2. Percentage of EAs with Cooperating Agencies for FY 2012 through FY 2015
Total FY 2012 FY 2013 FY 2014 FY 2015 Overall # of EAs 13205 12567 11308 11353 37155 # of EAs w/ CAs 524 1041 941 543 2513 % of EAs w/ CAs 4.0% 8.3% 8.3% 4.8% 6.8%
1 Council on Environmental Quality, “Cooperating Agencies in Implementing the Procedural Requirements of the National Environmental Policy Act,” January 30, 2002. 2 Council on Environmental Quality, “Report on Cooperating Agencies in Implementing the Procedural Requirements of the National Environmental Policy Act,” May 26, 2005. 3 Council on Environmental Quality, “Report on Cooperating Agencies in Implementing the Procedural Requirements of the National Environmental Policy Act,” May 23, 2012. 4 Council on Environmental Quality, “Report on Cooperating Agencies in Implementing the Procedural Requirements of the National Environmental Policy Act” June 10, 2015 5 Departments and agencies report on cooperating agency status in the first year of an EIS (the year of the Notice of Intent) and provide updates through the year of the Record of Decision; EAs are only reported in the year of completion. Cooperating agency status can be established after the year that the NOI is issued; this report does not provide data on such occurrences. Thus, this report may understate the total number of EISs prepared with cooperating agencies.
Attachment A: Fourth Report on Cooperating Agency Status FY 2015 Page 2 Federal departments and agencies were also asked to provide reasons cooperating agencies were not involved more often. Departments most frequently reported that cooperating agencies were not formally designated because potential cooperating agencies lacked special expertise and jurisdiction by law. Agencies also commonly reported that in many instances informal cooperating relationships were used either due to agency preference or project timing and scope. In some years, agencies submitted no report on Cooperating Agency status to the CEQ for inclusion in this report. In those instances, the tables of this report show a dash (-) to indicate the lack of a report. This should be differentiated from a zero (0), which indicates that the agency reported it prepared no reviews of that type. Instances where the agency prepared no environmental reviews in a given year and instances where the agency prepared environmental reviews with no cooperating agencies involved in a given year are not differentiated for the purposes of summary tables and percentages; both instances are represented by zero percent (0.0%). The data provided by the agencies has been analyzed and summarized below. It is organized into two main sections. Information from agencies under Departments is reported in Section II and information from other individual agencies is reported in Section III.

Attachment A: Fourth Report on Cooperating Agency Status FY 2015 Page 3 II. Departments Departments and their components reported that approximately 68 percent of EISs were prepared with cooperating agencies (see Table 3). Of the Departments reporting more than five EISs, the Departments of Commerce, Defense, Energy, Interior, and Transportation all had cooperating agency participation levels over 50 percent (see Table 4). Only three Departments, Housing and Urban Development, Justice, and State reported preparing all of their EISs without cooperating agencies. The other Departments with zero percent cooperating agency participation did not prepare any EISs during the reporting period. Table 3. Percentage of Department EISs with Cooperating Agencies Started in FY 2012 through FY 2015
U.S. Departments FY 2012 FY 2013 FY 2014 FY 2015 Overall # of EISs 225 167 130 214 736 # of EISs w/ CAs 101 73 63 146 383 % of EISs w/ CAs 44.9% 43.7% 47.7% 68.2% 52%
Table 4. Percentage of Department EISs with Cooperating Agencies Started in FY 2012 through FY 2015 by Department6,7
U.S. Department FY 2012 FY 2013 FY 2014 FY 2015 Overall Department of Agriculture 15.8% 21.1% 13.0% 38.2% 22.3% Department of Commerce 16.7% 30.0% 20.0% 75.0% 39.6% Department of Defense 45.6% 51.9% 60.0% 58.1% 53.9% Department of Education 0.0% 0.0% 0.0% 0.0% 0.0% Department of Energy 33.3% 66.7% 100.0% 0.0% 64.3% Department of Health and Human Services
0.0% 50.0% 0.0% 100.0% 33.3%
Department of Homeland Security 80.0% 100.0% 100.0% 0% 87.5% Department of Housing & Urban Development
0.0% 0.0% 0.0% 0.0% 0.0%
Department of the Interior 65.3% 73.8% 73.2% 89.5% 76.2% Department of Justice 0.0% 0.0% 0.0% 0.0% 0.0% Department of Labor 0.0% 0.0% 100.0% 0.0% 100.0% Department of State 100.0% 0.0% 0.0% 0.0% 80.0% Department of Transportation 75.0% 34.8% 84.6% 94.7% 70.1% Department of Treasury 0.0% 0.0% 0.0% 0.0% 0.0% Department of Veterans Affairs 0.0% 0.0% 0.0% 0.0% 0.0% Total 44.9% 43.7% 47.7% 68.2% 52.0%
The Departments indicated that overall cooperating agencies were involved in developing less than five percent of EAs prepared during the reporting period, down from approximately eight percent in the previous two years (see Table 5). The Departments of Education, Labor, State, and the Treasury did not prepare any EAs during the reporting period, which is shown as having zero percent cooperating agency participation (see Table 6). 6 Total FY percentages were derived from actual reporting numbers and not from averaging department percentages. 7 Dashes represent agencies that did not report any EISs or EAs.

Attachment A: Fourth Report on Cooperating Agency Status FY 2015 Page 4 Although the Departments of Energy and Justice reported the highest cooperating agency participation level, this is likely because they only prepared 16 EAs and two EA, respectively, which is significantly less than several other Departments. For instance, the Departments of Agriculture, Defense, and Interior each reported over 2,000 EAs. Table 5. Percentage of Department EAs with Cooperating Agencies Completed in FY 2012 through FY 2015
U.S. Departments FY 2012 FY 2013 FY 2014 FY 2015 Overall # of EAs 12860 12304 11016 10671 46851 # of EAs w/ CAs 508 1026 930 526 2990 % of EAs w/ CAs 4.0% 8.3% 8.4% 4.9% 6.4%
Table 6. Percentage of Department EAs with Cooperating Agencies Completed in FY 2012 through FY 2015 by Department
U.S. Department FY 2012 FY 2013 FY 2014 FY 2015 Overall Department of Agriculture 3.2% 5.8% 4.7% 4.4% 4.7% Department of Commerce 2.5% 4.2% 2.7% 3.8% 3.3% Department of Defense 0.8% 1.4% 0.5% 0.6% 0.9% Department of Education 0.0% 0.0% 0.0% 0.0% 0.0% Department of Energy 20.7% 13.3% 33.3% 31.3% 24.0% Department of Health and Human Services
1.0% 3.5% 3.0% 1.9% 2.7%
Department of Homeland Security 3.1% 7.1% 9.0% 9.3% 5.6% Department of Housing & Urban Development
0.0% 0.0% 0.1% 0.0% 0.0%
Department of the Interior 6.9% 19.0% 20.5% 11.5% 13.9% Department of Justice 92.3% 81.8% 60.0% 50.0% 80.6% Department of Labor 0.0% 0.0% 0.0% 0.0% 0.0% Department of State 0.0% 0.0% 0.0% 0.0% 0.0% Department of Transportation 10.9% 8.8% 7.4% 5.7% 8.2% Department of Treasury 0.0% 0.0% 100.0% 0.0% 100.0% Department of Veterans Affairs 0.0% 0.0% 0.0% 0.0% 0.0% Total 4.0% 8.3% 8.4% 4.9% 6.0%
The fluctuations that we see in use of formal cooperating agreements may be due to variations in project type, rather than agency choice not to formalize cooperating agency agreements. With projects that are narrow in scope there are fewer opportunities to utilize cooperating agencies. To illuminate the variations in project type that may lead to less or more frequent use of formal cooperation agreements under NEPA, we have provided and analyzed detailed information of each individual agency’s reports, below.
A. Department of Agriculture The Department of Agriculture reported that approximately 38 percent of its EISs had cooperating agency participation during FY 2015, a significant increase from the previous reporting period (see Table 7). Table 7. Percentage of Department of Agriculture’s EISs with Cooperating Agencies Started in FY 2012 through FY 2015

Attachment A: Fourth Report on Cooperating Agency Status FY 2015 Page 5
Department of Agriculture FY 2012 FY 2013 FY 2014 FY 2015 Overall # of EISs 57 57 46 55 215 # of EISs w/ CAs 9 12 6 21 48 % of EISs w/ CAs 15.8% 21.1% 13.0% 38.2% 22.3%
Table 8. Percentage of Department of Agriculture’s EISs with Cooperating Agencies Started in FY 2012 through FY 2015 by Agency
Agency FY 2012 FY 2013 FY 2014 FY 2015 Overall Agriculture Research Service - - - - 0.0% Animal and Plant Health Inspection Service
0.0% 20.0% 0.0% 60.0% 16.7%
Farm Service Agency 0.0% 0.0% 100.0% 50.0% 66.7% Forest Service 17.3% 14.0% 7.1% 33.3% 18.1% National Institute of Food and Agriculture
0.0% - - - 0.0%
National Resource Conservation Service
0.0% 100.0% 0.0% 100.0% 100.0%
Rural Development - 100.0% 100.0% 50.0% 85.7% Total 15.8% 21.1% 13.0% 38.2% 22.3%
The Department of Agriculture reported that in total under five percent of their EAs involved cooperating agencies for the reporting period (see Table 9). The Animal and Plant Health Inspection Service prepared a much higher percentage of their EAs with cooperating agency participation compared to other Department of Agriculture Agencies (see Table 10). Table 9. Percentage of Department of Agriculture’s EAs Cooperating Agencies of FY 2012 through FY 2015
Department of Agriculture FY 2012 FY 2013 FY 2014 FY 2015 Overall # of EAs 1269 1970 1737 2370 7346 # of EAs w/ CAs 41 115 82 104 342 % of EAs w/ CAs 3.2% 5.8% 4.7% 4.4% 4.7%
Table 10. Percentage of Department of Agriculture’s EAs with Cooperating Agencies Completed in FY 2012 through FY 2015 by Agency
Agency FY 2012 FY 2013 FY 2014 FY 2015 Overall Agriculture Research Service - - - 2.5% 2.5% Animal and Plant Health Inspection Service
55.6% 66.7% 79.0% 93.3% 76.1%
Farm Service Agency 0.0% 0.0% 0.0% 0.0% 0.0% Forest Service 2.0% 3.5% 4.8% 3.4% 3.2% National Institute of Food and Agriculture
0.0% - - - 0.0%
National Resource Conservation Service
20.0% 25.0% 33.3% 11.1% 18.4%
Rural Development - 5.7% 2.2% 0.9% 2.9% Total 3.2% 5.8% 4.7% 4.4% 4.7%

Attachment A: Fourth Report on Cooperating Agency Status FY 2015 Page 6 A1. Agriculture Research Service During FY 2015, the agency did not report any EISs and reported 40 EAs, one of which used a cooperating agency (see Table 11). Agriculture Research Service cited that the 40 EAs were for internal construction or maintenance activities and did not require a cooperating agency. The Agriculture Research Service did not submit reports to CEQ for the previous reporting period FY 2012 through FY 2014. Table 11. Percentage of Agriculture Research Service’s EAs with Cooperating Agencies Completed in FY 2012 through FY 2015
Agriculture Research Service FY 2012 FY 2013 FY 2014 FY 2015 # of EAs - - - 40 # of EAs w/ CAs - - - 1 % of EAs w/ CAs 0.0% 0.0% 0.0% 2.5%
A2. Animal and Plant Health Inspection Service The Animal and Plant Health Inspection Service (APHIS) prepared five EISs during the reporting period, three of which used a cooperating agency agreement (see Table 12). APHIS also reported preparing 89 EAs with, on average, with an upward trend in cooperating agency participation from 56 percent in FY 2012 to 93 percent in FY 2015 (see Table 13). APHIS noted that it did not formally designate cooperating agency relationships because potential cooperators lacked the capacity (training or resources) and the special expertise or jurisdiction by law. A restriction on the release of confidential business information was cited as the reason for not identifying any cooperating agencies in six EAs. In those cases, a lack of special expertise, authority, or jurisdiction was also noted. Table 12. Percentage of Animal and Plant Health Inspection Service’s EISs with Cooperating Agencies Started in FY 2012 through FY 2015
Animal and Plant Health Inspection Service FY 2012 FY 2013 FY 2014 FY 2015 # of EISs 5 10 1 5 # of EISs w/ CAs 0 2 0 3 % of EISs w/ CAs 0.0% 20.0% 0.0% 60.0%
Table 13. Percentage of Animal and Plant Health Inspection Service’s EAs with Cooperating Agencies Completed in FY 2012 through FY 2015
Animal and Plant Health Inspection Service FY 2012 FY 2013 FY 2014 FY 2015 # of EAs 54 63 62 89 # of EAs w/ CAs 30 42 49 83 % of EAs w/ CAs 55.6% 66.7% 79.0% 93.3%
A3. Farm Service Agency For the reporting period, the Farm Service Agency (FSA) reported two EISs during FY 2015, one of which had a cooperating agency (see Table 14). FSA completed a total of 937 EAs during the reporting period, none of which involved cooperating agencies (see Table 15).

Attachment A: Fourth Report on Cooperating Agency Status FY 2015 Page 7 For one EIS reported, cooperating agency status was initiated with the National Resources Conservation Service, but their participation ended without a reason being provided. FSA indicated that cooperating agency relationships were not formally established for the other EIS because the potential cooperating agency lacked capacity (training or resources) to participate. For the most part, FSA reported that many of its actions involved informal cooperating relationships with other Federal, state and tribal agencies. FSA indicated many of their actions have tight, statutorily defined timelines (i.e., loans); therefore, they do not typically request formal cooperating agency assistance. Further, FSA noted that it works with the Natural Resources Conservation Service on a regular basis pursuant to numerous technical assessment agreements. As such, FSA does not solicit their participation as a cooperator at the field level; however, they do solicit participation for national level programmatic documents when they are prepared. Table 14. Percentage of Farm Service Agency’s EIS that had Cooperating Agencies for FY 2012 through FY 2015
Forest Service FY 2012 FY 2013 FY 2014 FY 2015 # of EISs 0 0 1 2 # of EISs w/ CAs 0 0 1 1 % of EISs w/ CAs 0.0% 0.0% 100.0% 50.0%
Table 15. Percentage of Farm Service Agency’s EAs with Cooperating Agencies Completed in FY 2012 through FY 2015
Farm Service Agency FY 2012 FY 2013 FY 2014 FY 2015 # of EAs 741 467 510 937 # of EAs w/ CAs 0 0 0 0 % of EAs w/ CAs 0.0% 0.0% 0.0% 0.0%
A4. Forest Service The Forest Service (USFS) reported cooperating agency participation for EISs at levels of approximately 33 percent in FY 2015—more than double previous years (see Table 16). It reported cooperating agency participation on EAs during those years of about 3 percent (see Table 17). The Forest Service reported that formal cooperating agency relationships were generally not established in preparing EISs because the potential cooperating agencies lacked the capacity, special expertise, and/or jurisdiction to participate. It did not provide any reasoning as to why cooperating agency status was not pursued during the preparation of EAs. Table 16. Percentage of Forest Service’s EIS that had Cooperating Agencies for FY 2012 through FY 2015
Forest Service FY 2012 FY 2013 FY 2014 FY 2015 # of EISs 52 43 42 45 # of EISs w/ CAs 9 6 3 15 % of EISs w/ CAs 17.3% 14.0% 7.1% 33.3%

Attachment A: Fourth Report on Cooperating Agency Status FY 2015 Page 8 Table 17. Percentage of Forest Service’s EAs with Cooperating Agencies Completed in FY 2012 through FY 2015
Forest Service FY 2012 FY 2013 FY 2014 FY 2015 # of EAs 456 455 209 265 # of EAs w/ CAs 9 16 10 9 % of EAs w/ CAs 2.0% 3.5% 4.8% 3.4%
A5. National Institute of Food and Agriculture The National Institute of Food and Agriculture (NIFA) did not submit cooperating agency data to CEQ for this reporting period. The last NIFA reporting submission identified a total of eight EAs in 2012, none using cooperating agencies. (see Table 18). NIFA did not indicate why cooperating agency relationships were not established. Table 18. Percentage of National Institute of Food and Agriculture’s EAs that had Cooperating Agencies for FY 2012 through FY 2015
National Institute of Food and Agriculture FY 2012 FY 2013 FY 2014 FY 2015 # of EAs 8 - - - # of EAs w/ CAs 0 - - - % of EAs w/ CAs 0.0% - - -
A6. Natural Resources Conservation Service The National Resources Conservation Service (NRCS) reported one EIS during FY 2015 (see Table 19). NRCS reported that cooperating agencies participated in about 11 percent of the 18 EAs conducted during the reporting period (see Table 20). NRCS reported that in three EAs a potential or active cooperating agency lacked capacity (training or resources) to participate. 13 of the reported EAs were programmatic in nature, and did not require agency decisions until site-specific analysis was complete. NRCS also indicated that for one EA it collaborated with other federal agencies. These agencies did not sign on as cooperating agencies for each other’s EAs because each agency has specific responsibilities and expertise to complete the EAs on its own. Natural Resource Districts (NRDs) are the local sponsor for watershed projects, and provide a good avenue for local, state, and other federal agency scoping and participation. Table 19. Percentage of National Resources Conservation Service’s EISs with Cooperating Agencies Started in FY 2012 through FY 2015
National Resources Conservation Service FY 2012 FY 2013 FY 2014 FY 2015 # of EISs 0 1 0 1 # of EISs w/ CAs 0 1 0 1 % of EISs w/ CAs 0.0% 100.0% 0.0% 100.0%
Table 20. Percentage of National Resources Conservation Service’s EAs with Cooperating Agencies Completed in FY 2012 through FY 2015
National Resources Conservation Service FY 2012 FY 2013 FY 2014 FY 2015 # of EAs 10 4 6 18

Attachment A: Fourth Report on Cooperating Agency Status FY 2015 Page 9
# of EAs w/ CAs 2 1 2 2 % of EAs w/ CAs 20.0% 25.0% 33.3% 11.1%
A7. Rural Development Rural Development (RD) reported that one of two EISs in FY 2015 used cooperating agencies (see table 21). RD also reported preparing 1,061 EAs, only 10 of which included cooperating agency participation (see table 22). According to RD, the most common reason for not involving cooperating agencies in its EAs was because it was the only agency with a relevant action in the project or, in the Arecibo Waste-to-Energy and Resource Recovery Project (Puerto Rico) EIS, RD decided that no cooperating agency was necessary since other agencies had already completed NEPA or equivalent processes. Table 21. Percentage of Rural Development’s EISs with Cooperating Agencies Started in FY 2012 through FY 2015
Rural Development FY 2012 FY 2013 FY 2014 FY 2015 # of EISs - 3 2 2 # of EISs w/ CAs - 3 2 1 % of EISs w/ CAs - 100.0% 100.0% 50.0%
Table 22. Percentage of Rural Development’s EAs with Cooperating Agencies Completed in FY 2012 through FY 2015
Rural Development FY 2012 FY 2013 FY 2014 FY 2015 # of EAs - 981 950 1061 # of EAs w/ CAs - 56 21 10 % of EAs w/ CAs - 5.7% 2.2% 0.9%
B. Department of Commerce The First Responders Network Authority and the National Oceanic and Atmospheric Administration (NOAA) are the only agencies within the Department of Commerce that reported developing any EISs during the reporting period. For the FY 2015 reporting period, 100 percent of the EISs prepared by First Responders Network Authority and approximately 64 percent of the EISs prepared by NOAA included cooperating agency participation (see Table 23 and Table 24). Table23. Percentage of Department of Commerce’s EISs that had Cooperating Agencies for FY 2012 through FY 2015
Department of Commerce FY 2012 FY 2013 FY 2014 FY 2015 Overall # of EISs 12 10 10 16 48 # of EISs w/ CAs 2 3 2 12 19 % of EISs w/ CAs 16.7% 30.0% 20.0% 75.0% 39.6%
Table24. Percentage of Department of Commerce’s EISs with Cooperating Agencies Completed in FY 2012 through FY 2015 by Agency
Agency FY 2012 FY 2013 FY 2014 FY 2015 Overall

Attachment A: Fourth Report on Cooperating Agency Status FY 2015 Page 10
Economic Development Administration
0.0% 0.0% 0.0% 0.0% 0.0%
First Responders Network Authority - - - 100% 100% National Institute of Standards and Technology
0.0% 0.0% 0.0% 0.0% 0.0%
National Oceanic and Atmospheric Administration
16.7% 30.0% 20.0% 63.6% 32.6%
National Telecommunications and Information Administration
0.0% 0.0% 0.0% 0.0% 0.0%
Total 16.7% 30.0% 20.0% 75.0% 35.4% The Department of Commerce reported preparing 183 EAs, only about four percent of which included cooperating agency participation (see Table 25). The National Oceanic and Atmospheric Administration and National Institute of Standards and Technology were the only agencies that used cooperating agencies in the preparation of its EAs (see Table 26). Table25. Percentage of Department of Commerce’s EAs with Cooperating Agencies Completed in FY 2012 through FY 2015
Department of Commerce FY 2012 FY 2013 FY 2014 FY 2015 Overall # of EAs 279 259 225 183 946 # of EAs w/ CAs 7 11 6 7 31 % of EAs w/ CAs 2.5% 4.2% 2.7% 3.8% 3.3%
Table26. Percentage of Department of Commerce’s EAs with Cooperating Agencies Completed in FY 2012 through FY 2015 by Agency
Agency FY 2012 FY 2013 FY 2014 FY 2015 Overall Economic Development Administration
0.0% 0.0% 0.0% 0.0% 0.0%
First Responders Network Authority - - - 0.0% 0.0% National Institute of Standards and Technology
0.0% 0.0% 0.0% 100% 25.0%
National Oceanic and Atmospheric Administration
5.2% 9.5% 6.7% 7.1% 7.0%
National Telecommunications and Information Administration
0.0% 0.0% 0.0% 0.0% 0.0%
Total 2.5% 4.2% 2.7% 3.8% 3.3%
B1. Economic Development Administration As noted above, the Economic Development Administration (EDA) did not report preparing any EISs during the survey period. The EDA prepared 97 EAs but did not use any cooperating agency agreements (see Table 27). The EDA indicated that it generally becomes involved in the later stages of a project when it is usually ineffective to establish formal cooperating agency agreements, as other agencies involved normally will have already completed their NEPA activities. Table27. Percentage of Economic Development’s EAs with Cooperating Agencies Completed in FY 2012 through FY 2015
Economic Development Administration FY 2012 FY 2013 FY 2014 FY 2015

Attachment A: Fourth Report on Cooperating Agency Status FY 2015 Page 11
# of EAs 136 143 135 97 # of EAs w/ CAs 0 0 0 0 % of EAs w/ CAs 0.0% 0.0% 0.0% 0.0%
B2. First Responders Network Authority The First Responders Network Authority (FirstNet) was established in February 2012 by the Middle Class Tax Relief and Job Creation Act. FirstNet reported on cooperating agency participation in NEPA reviews for the first time in FY 2015. FirstNet participated in its first EISs during the reporting period for FY 2015, always involving a cooperating agency (see Table 28). Table 28. Percentage of First Responders Network Authority EISs with Cooperating Agencies Started in FY 2015
First Responders Network Authority FY 2015 # of EISs 5 # of EISs w/ CAs 5 % of EISs w/ CAs 100%
B3. National Institute of Standards and Technology The National Institute of Standards and Technology (NIST) did not initiate any EISs during the reporting period and only reported one EA which had cooperating agencies (see Table 29). Table 29. Percentage of NIST’s EAs with Cooperating Agencies Completed in FY 2012 through FY 2015
National Institute of Standards and Technology FY 2012 FY 2013 FY 2014 FY 2015 # of EAs 1 0 0 1 # of EAs w/ CAs 0 0 0 1 % of EAs w/ CAs 0.0% 0.0% 0.0% 100%
B4. National Oceanic and Atmospheric Administration The National Oceanic and Atmospheric Administration (NOAA) reported 64 percent cooperating agency participation on its EISs and seven percent participation on EAs during FY 2015 (see Table 30 and 31). NOAA reported that many of the EISs and EAs were prepared by Fisheries Management Council (Council) staff with assistance from NOAA fisheries. All potential cooperating agencies have a seat at the Council, by law, and are involved in the process without being formally designated as cooperating agencies. Table 30. Percentage of National Oceanic and Atmospheric Administration’s EISs with Cooperating Agencies Started in FY 2012 through FY 2015
National Oceanic and Atmospheric Administration FY 2012 FY 2013 FY 2014 FY 2015
# of EISs 12 10 10 11 # of EISs w/ CAs 2 3 2 7 % of EISs w/ CAs 16.7% 30.0% 20.0% 63.6%

Attachment A: Fourth Report on Cooperating Agency Status FY 2015 Page 12 Table 31. Percentage of National Oceanic and Atmospheric Administration’s EAs with Cooperating Agencies Completed in FY 2012 through FY 2015
National Oceanic and Atmospheric Administration FY 2012 FY 2013 FY 2014 FY 2015
# of EAs 135 116 90 84 # of EAs w/ CAs 7 11 6 6 % of EAs w/ CAs 5.2% 9.5% 6.7% 7.1%
B5. National Telecommunications and Information Administration The National Telecommunications and Information Administration (NTIA) did not initiate any EISs during the reporting period. The NTIA only initiated one EA during FY 2015 (see Table 32). NTIA indicated that the one EA initiated during FY 2015 was for a grant, and therefore no cooperating agency was necessary in its purpose. Table 32. Percentage of National Telecommunications and Information Administration’s EAs with Cooperating Agencies Completed in FY 2012 through FY 2015
National Telecommunications and Information Administration FY 2012 FY 2013 FY 2014 FY 2015
# of EAs 7 0 0 1 # of EAs w/ CAs 0 0 0 0 % of EAs w/ CAs 0.0% 0.0% 0.0% 0.0%
C. Department of Defense The Department of Defense reported that approximately 58% of its EISs started during the reporting period involved cooperating agency participation (see Table 33). Out of all the Department of Defense agencies, the Marine Corps used cooperating agencies on the largest percentage of its EISs (see Table 34). Table 33. Percentage of Department of Defense’s EISs with Cooperating Agencies Started in FY 2012 through FY 2015
Department of Defense FY 2012 FY 2013 FY 2014 FY 2015 Overall # of EISs 57 27 10 31 104 # of EISs w/ CAs 26 14 6 18 51 % of EISs w/ CAs 45.6% 51.9% 60.0% 58.1% 49.0%
Table 34. Percentage of Department of Defense’s EISs with Cooperating Agencies Started in FY 2012 through FY 2015 by Agency
Agency FY 2012 FY 2013 FY 2014 FY 2015 Overall Air Force 100.0% 66.7% 0.0% 0.0% 50.0% Army 33.3% 0.0% - 0.0% 27.2% Army Corps of Engineers 42.9% 40.0% 60.0% 50.0% 48.2% Defense Logistics 0.0% 0.0% - 0.0% 0.0% Joint Guam Program Office 0.0% 100.0% 0.0% 100.0% 66.7%

Attachment A: Fourth Report on Cooperating Agency Status FY 2015 Page 13
Marine Corps 80.0% 100.0% 0.0% 100.0% 90.0% Missile Defense Agency - 0.0% 0.0% 0.0% 0.0% Navy 46.2% 75.0% 0.0% 60.0% 56.3% Total 45.6% 51.9% 60.0% 58.1% 49.0%
The Department of Defense prepared a large volume of EAs during the reporting period, but less than 1 percent of those EAs prepared involved cooperating agency participation (see Table 35). Overall, the Air Force and Army reported the highest percentage of Department of Defense EAs with cooperating agencies at approximately 10% each (see Table 36). Table 35. Percentage of Department of Defense’s EAs with Cooperating Agencies Completed in FY 2012 through FY 2015
Department of Defense FY 2012 FY 2013 FY 2014 FY 2015 Overall # of EAs 4432 4470 3611 3621 16134 # of EAs w/ CAs 37 62 17 23 139 % of EAs w/ CAs 0.8% 1.4% 0.5% 0.6% 0.9%
Table 36. Percentage of Department of Defense’s EAs with Cooperating Agencies Completed in FY 2012 through FY 2015 by Agency
Agency FY 2012 FY 2013 FY 2014 FY 2015 Overall Air Force 10.0% 4.7% 14.7% 10.5% 9.2% Army 10.5% 15.1% - 10.2% 12.3% Army Corps of Engineers 0.2% 0.8% 0.2% 0.3% 0.4% Defense Logistics 0.0% 0.0% - 0.0% 0.0% Joint Guam Program Office 0.0% 0.0% 0.0% 0.0% 0.0% Marine Corps 36.4% 0.0% 9.1% 5.0% 10.8% Missile Defense Agency - 0.0% 0.0% 0.0% 0.0% Navy 2.5% 7.5% 4.7% 3.2% 4.5% Total 0.8% 1.4% 0.5% 0.6% 0.9%
C1. Air Force The Air Force initiated two EISs during the reporting period, both without cooperating agencies (see Table 37). Additionally, about eleven percent of EAs involved cooperating agencies during the reporting period (see Table 38). The Air Force indicated that in instances where the scope of the project was entirely within the confines of a base the support of a cooperating agency was not required because no other Federal authority had jurisdiction. The Air Force reported that for the EAs, no other agency had decisions to make nor maintained data needed by the Air Force. The scope of the proposed action was based within the confines of the installation, and cooperating agency support was not required. Table 37. Percentage of Air Force’s EISs with Cooperating Agencies Started in FY 2012 through FY 2015
Air Force FY 2012 FY 2013 FY 2014 FY 2015 # of EISs 1 3 0 2

Attachment A: Fourth Report on Cooperating Agency Status FY 2015 Page 14
# of EISs w/ CAs 1 2 0 0 % of EISs w/ CAs 100.0% 66.7% 0.0% 0.0%
Table 38. Percentage of Air Force’s EAs with Cooperating Agencies Completed in FY 2012 through FY 2015
Air Force FY 2012 FY 2013 FY 2014 FY 2015 # of EAs 70 64 34 38 # of EAs w/ CAs 7 3 5 4 % of EAs w/ CAs 10.0% 4.7% 14.7% 10.5%
C2. Army The Army did not report initiating any EISs during FY 2015 (see Table 39). It reported that approximately 10 percent of the EAs prepared during that timeframe had cooperating agency participation (see Table 40). The Army indicated that for one EA, a potential cooperating agency lacked authority to enter into an agreement to be a CA. The Eielson Air Force Base was instructed not to become a cooperating agency with the Army by Pacific Air Forces. For other EAs without cooperating agency participation, a reason was not given. Table 39. Percentage of Army’s EISs with Cooperating Agencies Started in FY 2012 through FY 2015
Army FY 2012 FY 2013 FY 2014 FY 2015 # of EISs 9 2 - 0 # of EISs w/ CAs 3 0 - 0 % of EISs w/ CAs 33.3% 0.0% - 0.0%
Table 40. Percentage of Army’s EAs with Cooperating Agencies Completed in FY 2012 through FY 2015
Army FY 2012 FY 2013 FY 2014 FY 2015 # of EAs 172 152 - 59 # of EAs w/ CAs 18 23 - 6 % of EAs w/ CAs 10.5% 15.1% - 10.2%
C3. Army Corps of Engineers The Army Corps of Engineers (USACE) reported that cooperating agencies were involved with 50 percent of its EISs during the reporting period but less than 1 percent of its EAs (see Tables 41 and 42). USACE reported the most EISs and EAs of any Department of Defense agency, totaling 10 EISs and 3,470 EAs. USACE reported that many of the EAs it prepared were too quick or deemed not significant enough for the USACE to ask agencies to cooperate or for the agencies to request to be cooperating agencies. In other instances for both EAs and EISs, the potential cooperating agencies lacked special expertise and jurisdiction by law, capacity (training or resources), or the ability to enter into a cooperating agency agreement.
Table 41. Percentage of Army Corps of Engineers’ EISs with Cooperating Agencies Started in FY 2012 through FY 2015

Attachment A: Fourth Report on Cooperating Agency Status FY 2015 Page 15
Army Corps of Engineers FY 2012 FY 2013 FY 2014 FY 2015 # of EISs 28 15 10 10 # of EISs w/ CAs 12 6 6 5 % of EISs w/ CAs 42.9% 40.0% 60.0% 50.0%
Table 42. Percentage of Army Corps of Engineers’ EAs with Cooperating Agencies Completed in FY 2012 through FY 2015
Army Corps of Engineers FY 2012 FY 2013 FY 2014 FY 2015 # of EAs 4138 4198 3512 3470 # of EAs w/ CAs 7 33 8 11 % of EAs w/ CAs 0.2% 0.8% 0.2% 0.3%
C4. Defense Logistics Administration The Defense Logistics Administration (DLA) did not execute any EISs during the reporting period and only executed 3 EAs that year, none of which were developed with cooperating agency input (see Table 43). The DLA stated that the EAs it prepared were strictly related to DLA mission requirements and did not require cooperating agency participation.
Table 43. Percentage of Defense Logistics’ EAs with Cooperating Agencies Completed in FY 2012 through FY 2015
Defense Logistics FY 2012 FY 2013 FY 2014 FY 2015 # of EAs 1 4 - 3 # of EAs w/ CAs 0 0 - 0 % of EAs w/ CAs 0.0% 0.0% - 0.0%
C5. Joint Guam Program Office The Joint Guam Program Office (JGPO) reported one EIS during the reporting period which involved a cooperating agency (see Table 44). No EAs were reported. Table 44. Percentage of Joint Guam Program Office’s EISs with Cooperating Agencies Started in FY 2012 through FY 2015
Joint Guam Program Office FY 2012 FY 2013 FY 2014 FY 2015 # of EISs 1 1 0 1 # of EISs w/ CAs 0 1 0 1 % of EISs w/ CAs 0.0% 100.0% 0.0% 100.0%
C6. Marine Corps The Marine Corps reported three EISs, with 100 percent cooperating agency participation (see Table 45). The Marine Corps also prepared 20 EAs during the reporting period, with a much lower rate of cooperating agency participation (see Table 46). The Marine Corps reported that for 18 EAs due to the nature of proposed actions, input was not required from any cooperating agencies other than regulatory consultants. Regulatory agencies rarely agree to be cooperating agencies due to manpower issues and concerns about perceived

Attachment A: Fourth Report on Cooperating Agency Status FY 2015 Page 16 conflict of interest. For one EA, potential cooperating agencies were invited but lacked capacity or resources to participate. Table 45. Percentage of Marine Corps’ EISs with Cooperating Agencies Started in FY 2012 through FY 2015
Marine Corps FY 2012 FY 2013 FY 2014 FY 2015 # of EISs 5 2 0 3 # of EISs w/ CAs 4 2 0 3 % of EISs w/ CAs 80.0% 100.0% 0.0% 100.0%
Table 46. Percentage of Marine Corps’ EAs with Cooperating Agencies Completed in FY 2012 through FY 2015
Marine Corps FY 2012 FY 2013 FY 2014 FY 2015 # of EAs 11 12 22 20 # of EAs w/ CAs 4 0 2 1 % of EAs w/ CAs 36.4% 0.0% 9.1% 5.0%
C7. Missile Defense Agency The Agency did not submit a report for FY 2015.
C8. Navy The Navy reported initiating 15 EISs in FY 2015, of which nine had cooperating agencies (see Tables 47). The Navy reported, only about three percent of EAs involved cooperating agencies (see Tables 48). The Navy reported that it frequently engaged in informal consultations with various entities, including regulators, but did not always formalize a cooperating agency relationship. The Navy indicated that in some instances potential cooperating agencies lacked jurisdiction to participate as official cooperating agencies. In other instances, the agency noted that there was no potential cooperating agency associated with a proposed action, or that a request for formal cooperating agency status was not necessary. Table 47. Percentage of Navy’s EISs with Cooperating Agencies Started in FY 2012 through FY 2015
Navy FY 2012 FY 2013 FY 2014 FY 2015 # of EISs 13 4 0 15 # of EISs w/ CAs 6 3 0 9 % of EISs w/ CAs 46.2% 75.0% 0.0% 60.0%
Table 48. Percentage of Navy’s EAs with Cooperating Agencies Completed in FY 2012 through FY 2015
Navy FY 2012 FY 2013 FY 2014 FY 2015 # of EAs 40 40 43 31 # of EAs w/ CAs 1 3 2 1 % of EAs w/ CAs 2.5% 7.5% 4.7% 3.2%

Attachment A: Fourth Report on Cooperating Agency Status FY 2015 Page 17 D. Department of Education The Department of Education did report preparing any EISs or EAs during FY 2015. According to the Department, since it does not have a decision making role in planning for impact aid projects, nor direct management in the implementation or the procurement for such projects the reporting remains “NEPA Not Applicable.” The Department does require those grantees to complete an environmental assessment and ensures that the grantees, in consultation with the Department, have fully considered any potential environmental ramifications of their actions.
E. Department of Energy The Department of Energy reported that it started no EISs and 31 percent of its EAs involved cooperating agency participation during the reporting period (see Table 49 and Table 50). The Department of Energy indicated that they cooperated with many state, local, and tribal governments but that many of these potential cooperating agencies preferred a “commenting agency” or consulting role instead of formal cooperating agency status. For other projects, no candidate entities were identified that had special expertise, authority, or jurisdiction with respect to the proposal. For some EAs, the schedule precluded formal cooperating agency agreements. Table49. Percentage of Department of Energy’s EISs with Cooperating Agencies Started in FY 2012 through FY 2015
Department of Energy FY 2012 FY 2013 FY 2014 FY 2015 Overall # of EISs 6 3 5 0 14 # of EISs w/ CAs 2 2 5 0 9 % of EISs w/ CAs 33.3% 66.7% 100.0% NA 64.3%
Table50. Percentage of Department of Energy’s EAs with Cooperating Agencies Completed in FY 2012 through FY 2015
Department of Energy FY 2012 FY 2013 FY 2014 FY 2015 Overall # of EAs 29 15 15 16 75 # of EAs w/ CAs 6 2 5 5 18 % of EAs w/ CAs 20.7% 13.3% 33.3% 31.3% 24.0%
F. Department of Health and Human Services The Department of Health and Human Services reported only 1 EIS which was prepared with cooperating agency participation (see Tables 51 and 52). Table51. Percentage of Department of Health and Human Services’ EISs with Cooperating Agencies Started in FY 2012 through FY 2015
Department of Health and Human Services FY 2012 FY 2013 FY 2014 FY 2015 Overall
# of EISs 2 2 1 1 6 # of EISs w/ CAs 0 1 0 1 2 % of EISs w/ CAs 0.0% 50.0% 0.0% 100% 33.3%
Table 52. Percentage of Department of Health and Human Services’ EISs with Cooperating Agencies Started in FY 2012 through FY 2015 by Agency
Agency FY 2012 FY 2013 FY 2014 FY 2015 Overall

Attachment A: Fourth Report on Cooperating Agency Status FY 2015 Page 18
Centers for Disease Control 0.0% 0.0% 0.0% 0.0% 0.0% Food and Drug Administration 0.0% 100.0% 0.0% 100% 100.0% Head Start - - 0.0% 0.0% 0.0% Health Resource Services Administration
0.0% 0.0% 0.0% 0.0% 0.0%
Indian Health Service 0.0% 0.0% 0.0% 0.0% 0.0% National Institutes of Health 0.0% 0.0% 0.0% 0.0% 0.0% Total 0.0% 50.0% 0.0% 100% 33.3%
The Department of Health and Human Services reported that only approximately 2 percent of its EAs were prepared with cooperating agency participation (see Table 53). Of the Department of Health and Human Services agencies, the Indian Health Service was the only agency to employ cooperating agencies (see Table 54). Table53. Percentage of Department of Health and Human Services’ EAs that had Cooperating Agencies for FY 2012 through FY 2015
Department of Health and Human Services FY 2012 FY 2013 FY 2014 FY 2015 Overall
# of EAs 96 142 399 154 791 # of EAs w/ CAs 1 5 12 3 21 % of EAs w/ CAs 1.0% 3.5% 3.0% 1.9% 2.7%
Table54. Percentage of Department of Health and Human Services’ EAs that had Cooperating Agencies for FY 2012 through FY 2015 by Agency
Agency FY 2012 FY 2013 FY 2014 FY 2015 Overall Centers for Disease Control 0.0% 0.0% 0.0% 0.0% 0.0% Food and Drug Administration 0.0% 0.0% 13.2% 0.0% 5.3% Head Start - - 0.0% 0.0% 0.0% Health Research Services Administration
0.0% 0.0% 0.0% 0.0% 0.0%
Indian Health Service 4.0% 71.4% 100.0% 42.9% 21.2% National Institutes of Health 0.0% 0.0% 100.0% 0.0% 50.0% Total 1.0% 3.5% 3.0% 1.9% 2.7%
F1. Centers for Disease Control The Centers for Disease Control (CDC) reported zero EISs or EAs in FY 2015 (see Table 55 and 56). Table55. Percentage of Centers for Disease Control’s EISs with Cooperating Agencies Completed in FY 2012 through FY 2015
Centers for Disease Control FY 2012 FY 2013 FY 2014 FY 2015 # of EISs 0 1 0 0 # of EISs w/ CAs 0 0 0 0 % of EISs w/ CAs 0.0% 0.0% 0.0% 0.0%
Table56. Percentage of Centers for Disease Control’s EAs with Cooperating Agencies Completed in FY 2012 through FY 2015

Attachment A: Fourth Report on Cooperating Agency Status FY 2015 Page 19
Centers for Disease Control FY 2012 FY 2013 FY 2014 FY 2015 # of EAs 0 1 0 0 # of EAs w/ CAs 0 0 0 0 % of EAs w/ CAs 0.0% 0.0% 0.0% 0.0%
F2. Food and Drug Administration The Food and Drug Administration (FDA) reported one EIS with a cooperating agency started during the reporting period (see Table 57). The FDA also reported 59 EAs, none of which were prepared with cooperating agency participation (see Table 58). The FDA indicated that no cooperating agencies were designated for the EAs because the potential cooperating agencies lacked special expertise and jurisdiction by law. Table57. Percentage of Food and Drug Administration’s EISs with Cooperating Agencies Started in FY 2012 through FY 2015
Food and Drug Administration FY 2012 FY 2013 FY 2014 FY 2015 # of EISs 0 1 0 1 # of EISs w/ CAs 0 1 0 1 % of EISs w/ CAs 0.0% 100.0% 0.0% 100%
Table58. Percentage of Food and Drug Administration’s EAs with Cooperating Agencies Completed in FY 2012 through FY 2015
Food and Drug Administration FY 2012 FY 2013 FY 2014 FY 2015 # of EAs 35 67 68 59 # of EAs w/ CAs 0 0 9 0 % of EAs w/ CAs 0.0% 0.0% 13.2% 0.0%
F3. Head Start The Office of Head Start did not initiate any EISs or EAs during FY 2015, which was the second year that Head Start reported information on cooperating agency participation.
F4. Health Resource Services Administration The Health Resources Services Administration (HRSA) did not initiate any EISs during the reporting period. Although 86 EAs were prepared, none were prepared with cooperating agency participation (see Table 59). HRSA indicated that there were no formal cooperating agencies because potential cooperating agencies lacked special expertise and jurisdiction by law. Table59. Percentage of Health Resource Services Administration’s EAs with Cooperating Agencies Completed in FY 2012 through FY 2015
Health Resource Services Administration FY 2012 FY 2013 FY 2014 FY 2015 # of EAs 34 67 328 86 # of EAs w/ CAs 0 0 0 0 % of EAs w/ CAs 0.0% 0.0% 0.0% 0.0%

Attachment A: Fourth Report on Cooperating Agency Status FY 2015 Page 20 F5. Indian Health Service The Indian Health Service did not report initiating any EISs during the reporting period but did report seven EAs, 3 of which were prepared with cooperating agency participation (see Table 60). The Indian Health Service stated that it did not utilize cooperating agencies in four cases because no other agency funded or participated in the project. Table60. Percentage of Indian Health Service’s EAs with Cooperating Agencies Completed in FY 2012 through FY 2015
Indian Health Service FY 2012 FY 2013 FY 2014 FY 2015 # of EAs 25 7 1 7 # of EAs w/ CAs 1 5 1 3 % of EAs w/ CAs 4.0% 71.4% 100.0% 42.9%
F6. National Institutes of Health The National Institutes of Health (NIH) reported zero EISs during FY 2015 (see Table 61). The NIH completed two EAs during reporting period, neither of which were prepared with the support of cooperating agencies (see Table 62). The NIH indicated that potential cooperating agencies were not used because they lacked special expertise, and/or jurisdiction by law. Table61. Percentage of National Institute of Health’s EISs with Cooperating Agencies Started in FY 2012 through FY 2015
National Institute of Health FY 2012 FY 2013 FY 2014 FY 2015 # of EISs 2 0 1 0 # of EISs w/ CAs 0 0 0 0 % of EISs w/ CAs 0.0% 0.0% 0.0% 0.0%
Table62. Percentage of National Institute of Health’s EAs with Cooperating Agencies Completed in FY 2015
National Institute of Health FY 2012 FY 2013 FY 2014 FY 2015 # of EAs 2 0 2 2 # of EAs w/ CAs 0 0 2 0 % of EAs w/ CAs 0.0% 0.0% 100.0% 0.0%
G. Department of Homeland Security The Department of Homeland Security (DHS) worked on no EISs during the reporting period. (see Table 63). Of the75 EAs prepared by DHS, approximately 9 percent had cooperating agency participation (see Table 64). DHS indicated that many of the EAs prepared were of minimal complexity, scope and location and that site-specific conditions and resources present did not necessitate other agency input on a scale that would warrant establishment of formal cooperating agency status. In other instances cooperating agency status was not formally established because potential cooperating agencies

Attachment A: Fourth Report on Cooperating Agency Status FY 2015 Page 21 lacked special expertise, jurisdiction by law, authority to enter into a cooperating agency agreement, or the necessary resources to participate. The Federal Emergency Management Agency (FEMA) noted that there were two distinct reasons for why FEMA did not initiate cooperating agency status. In most cases, an appropriate cooperating agency was not identified. For example, there were no permitting agencies involved in the project that warranted cooperating agency consideration. In other cases, agencies were notified during the scoping process, but if no response was received, no formal invitation was issued. Table63. Percentage of Department of Homeland Security’s EISs with Cooperating Agencies Started in FY 2012 through FY 2015
Department of Homeland Security FY 2012 FY 2013 FY 2014 FY 2015 Overall # of EISs 5 2 1 0 8 # of EISs w/ CAs 4 2 1 0 7 % of EISs w/ CAs 80.0% 100.0% 100.0% NA 87.5%
Table64. Percentage of Cooperating Agencies among Department of Homeland Security’s EAs for FY 2012 through FY 2015
Department of Homeland Security FY 2012 FY 2013 FY 2014 FY 2015 Overall # of EAs 163 113 78 75 429 # of EAs w/ CAs 5 8 7 7 27 % of EAs w/ CAs 3.1% 7.1% 9.0% 9.3% 6.3%
H. Department of Housing and Urban Development The Department of Housing and Urban Development (HUD) prepared four EISs during the reporting period, none of which were prepared with cooperating agencies (see Table 65). HUD did not provide an exact EA count; instead, HUD provided an annual approximation of 850 (see Table 66). HUD did not report any cooperating agency participation in EA preparation. For two of the EISs, HUD mentioned that as part of Sandy recovery there is project coordination under the Sandy Regional Infrastructure Resiliency Coordination (SRIRC) and Interagency Review and Permitting Team. HUD did not provide a reason for the lack of cooperating agency participation in the other EISs or EAs, beside noting that under 24 CFR Part 58 State, local and Native American governments assume the legal responsibilities for the environmental review process, which is a form of cooperating agency agreement for NEPA compliance. Table65. Percentage of Department of Housing and Urban Development’s EISs with Cooperating Agencies Started in FY 2012 through FY 2015
Table66. Percentage of Department of Housing and Urban Development’s EAs with Cooperating Agencies Completed in FY 2012 through FY 2015
Department of Housing and Urban Development FY 2012 FY 2013 FY 2014 FY 2015 Overall
# of EISs 3 0 1 4 8 # of EISs w/ CAs 0 0 0 0 0 % of EISs w/ CAs 0.0% 0.0% 0.0% 0.0% 0.0%

Attachment A: Fourth Report on Cooperating Agency Status FY 2015 Page 22
I. Department of Interior The Department of the Interior reported that almost 90 percent of the 57 EISs it prepared during the reporting period involved cooperating agencies (see Table 67). The Bureau of Indian Affairs and the Bureau of Ocean Energy Management both reported involvement of cooperating agencies in all of the EISs they prepared. The Bureau of Land Management, and Bureau of Reclamation’s EISs included cooperating agency participation in over 90 percent of cases and made up nearly half of the EISs prepared by the Department of the Interior for the reporting period. Table67. Percentage of Department of Interior’s EISs with Cooperating Agencies Started in FY 2012 through FY 2015
Department of Interior FY 2012 FY 2013 FY 2014 FY 2015 Overall # of EISs 49 42 41 57 189 # of EISs w/ CAs 32 31 30 51 144 % of EISs w/ CAs 65.3% 73.8% 73.2% 89.5% 76.2%
Table 68. Percentage of Department of Interior’s EISs with Cooperating Agencies Started in FY 2012 through FY 2015 by Agency
Agency FY 2012 FY 2013 FY 2014 FY 2015 Overall Bureau of Indian Affairs 100.0% 100.0% 100.0% 100.0% 100.0% Bureau of Land Management 88.2% 95.5% 85.0% 94.1% 90.7% Bureau of Ocean Energy Management 33.3% 33.3% 66.7% 100.0% 58.3%
Bureau of Reclamation 66.7% 33.3% 100.0% 93.3% 73.3% Fish and Wildlife Service 25.0% 66.7% 0.0% 33.3% 31.3% National Park Service 66.7% 28.6% 50.0% 71.4% 54.2% Office of Surface Mining 100.0% 100.0% 0.0% 0.0% 50.0% US Geological Survey 0.0% 0.0% 0.0% 0.0% 0.0% Total 65.3% 73.8% 73.2% 89.5% 76.2%
The Department of the Interior reported 3,181 EAs, of which approximately about 11.5 percent involved cooperating agencies (see Table 69). The Bureau of Indian Affairs reported the highest percentage of EAs involving cooperating agencies with an overall average of 51 percent (see Table 70). Table69. Percentage of Department of Interior’s EAs with Cooperating Agencies Completed in FY 2012 through FY 2015
Department of Interior FY 2012 FY 2013 FY 2014 FY 2015 Overall # of EAs 5478 4160 3782 3181 16601 # of EAs w/ CAs 376 790 776 365 2307
Department of Housing and Urban Development FY 2012 FY 2013 FY 2014 FY 2015 Overall
# of EAs 850 850 850 850 3400 # of EAs w/ CAs 0 0 1 0 1 % of EAs w/ CAs 0.0% 0% 0.1% 0.0% 0.0%

Attachment A: Fourth Report on Cooperating Agency Status FY 2015 Page 23
% of EAs w/ CAs 6.9% 19.0% 20.5% 11.5% 13.9% Table70. Percentage of Department of Interior’s EAs with Cooperating Agencies Completed in FY 2012 through FY 2015 by Agency
Agency FY 2012 FY 2013 FY 2014 FY 2015 Overall Bureau of Indian Affairs 10.8% 69.5% 45.3% 51.4% 44.3% Bureau of Land Management 4.7% 5.7% 11.3% 8.9% 7.7% Bureau of Ocean Energy Management 18.8% 79.4% 85.7% 0.6% 46.1%
Bureau of Reclamation 8.0% 6.6% 3.6% 7.6% 6.5% Fish and Wildlife Service 8.6% 0.0% 11.1% 7.1% 6.7% National Park Service 10.0% 18.3% 11.8% 15.9% 14% Office of Surface Mining 0.0% 1.5% 0.8% 6.3% 2.15% US Geological Survey 0.0% 0.0% 100.0% 0.0% 25.0% Total 6.9% 19.0% 20.5% 11.5% 14.5%
I1. Bureau of Indian Affairs The Bureau of Indian Affairs (BIA) reported using cooperating agencies for all of its EISs prepared during FY 2015 (see Table 71). The BIA prepared just over fifty percent of its EAs with cooperating agencies (see Table 72). The BIA indicated that its EAs are generally for localized projects on reservations. Cooperating agencies are not more commonly used because in these cases other federal agencies have no special authority or jurisdiction under law. Tribes are always notified about the projects and are given opportunity to participate and review projects but do not always choose to be formally designated as cooperating agencies due to the minor nature of the action. Table 11. Percentage of Bureau of Indian Affairs’ EISs with Cooperating Agencies Started in FY 2012 through FY 2015
Bureau of Indian Affairs FY 2012 FY 2013 FY 2014 FY 2015 # of EISs 4 3 1 9 # of EISs w/ CAs 4 3 1 9 % of EISs w/ CAs 100.0% 100.0% 100.0% 100.0%
Table72. Percentage of Bureau of Indian Affairs’ EAs with Cooperating Agencies Completed in FY 2012 through FY 2015
Bureau of Indian Affairs FY 2012 FY 2013 FY 2014 FY 2015 # of EAs 701 383 351 259 # of EAs w/ CAs 76 266 159 133 % of EAs w/ CAs 10.8% 69.5% 45.3% 51.4%
I2. Bureau of Land Management The Bureau of Land Management (BLM) reported very high percentages of EISs prepared with cooperating agency participation (see Table 73). In contrast, BLM reported approximately 2,333 EAs, only a small percentage of which were prepared with cooperating agencies (See Table 74).

Attachment A: Fourth Report on Cooperating Agency Status FY 2015 Page 24 The BLM reported that although there is interagency collaboration on many EAs, most of the EAs conducted are of such small scope that official cooperating agency status was neither sought from the initiating office nor requested by potential cooperators. Additionally, BLM indicated that cooperating agency status is generally not established because potential cooperators lacked the capacity and/or special expertise to participate. Table73. Percentage of Bureau of Land Management’s EISs with Cooperating Agencies Started in FY 2012 through FY 2015
Bureau of Land Management FY 2012 FY 2013 FY 2014 FY 2015 # of EISs 17 22 20 17 # of EISs w/ CAs 15 21 17 16 % of EISs w/ CAs 88.2% 95.5% 85.0% 94.1%
Table74. Percentage of Bureau of Land Management’s EAs with Cooperating Agencies Completed in FY 2012 through FY 2015
Bureau of Land Management FY 2012 FY 2013 FY 2014 FY 2015 # of EAs 4091 3044 2666 2333 # of EAs w/ CAs 192 175 301 207 % of EAs w/ CAs 4.7% 5.7% 11.3% 8.9%
I3. Bureau of Ocean Energy Management The Bureau of Ocean Energy Management (BOEM) reported six EISs during the reporting period, with one hundred percent cooperating agency participation (see Table 75). Cooperating agency participation on EAs was low at 0.6% percent for FY2015. This was drastically lower than the three previous years (see Table 76). BOEM and the Bureau of Safety and Environmental Enforcement (BSEE) are parties to a Memorandum of Agreement (MOA) on NEPA/environmental compliance that states that BSEE will serve “as a cooperating agency on BOEM NEPA documents” and “that serving as a cooperating agency where practicable will be the standard protocol for any BOEM NEPA analysis that BSEE may adopt for its decisions.” BSEE’s NEPA policy states that the MOA on NEPA/environmental compliance “serves as the overarching cooperating agency agreement between BOEM and BSEE. As such, separate cooperating agency agreements for each NEPA analysis are not required.” BOEM indicated that the majority of EAs reported for FY 2015 were prepared under this framework. BOEM reported that most of the EAs it prepared were for geological and geophysical permitting and plan approvals in addition to structure removals. BOEM indicated that in addition to its standing agreement with BSEE it has established other mechanisms to solicit input on these projects from vested stakeholders, such as making plans available for comment on Regs.gov and providing certain plans directly to the National Oceanic and Atmospheric Administration and the National Marine Fisheries Service for comment. Table75. Percentage of Bureau of Ocean Energy Management EISs with Cooperating Agencies Started in FY 2012 through FY 2015
Bureau of Ocean Energy Management FY 2012 FY 2013 FY 2014 FY 2015

Attachment A: Fourth Report on Cooperating Agency Status FY 2015 Page 25
# of EISs 3 3 3 6 # of EISs w/ CAs 1 1 2 6 % of EISs w/ CAs 33.3% 33.3% 66.7% 100.0%
Table76. Percentage of Bureau of Ocean Energy Management EAs with Cooperating Agencies Completed in FY 2012 through FY 2015
Bureau of Ocean Energy Management FY 2012 FY 2013 FY 2014 FY 2015 # of EAs 480 413 350 350 # of EAs w/ CAs 90 328 300 2 % of EAs w/ CAs 18.8% 79.4% 85.7% 0.6%
I4. Bureau of Reclamation The Bureau of Reclamation reported that 93.3 percent of its EISs were prepared with cooperating agencies during FY 2015 (see Table 77). In contrast, it reported that about seven percent of its EAs were completed with cooperating agency participation during the same time (see Table 78). The Bureau of Reclamation indicated that most of the EAs conducted were of such small scope that cooperating agency status was neither sought from the initiating office nor requested by the potential cooperators. In other instances, BOR reported that the potential cooperating agencies lacked special expertise and/or authority to become a cooperating agency. Also, in some cases, there was consultation and coordination with local, state or federal agencies who could have served as cooperating agencies; however, a formal cooperating agency status was not established by a formal memorandum of agreement. Table77. Percentage of Bureau of Reclamation’s EIS that had Cooperating Agencies for FY 2012 through FY 2015
Bureau of Reclamation FY 2012 FY 2013 FY 2014 FY 2015 # of EISs 3 3 6 15 # of EISs w/ CAs 2 1 6 14 % of EISs w/ CAs 66.7% 33.3% 100.0% 93.3%
Table78. Percentage of Bureau of Reclamation’s EAs with Cooperating Agencies Completed in FY 2012 through FY 2015
Bureau of Reclamation FY 2012 FY 2013 FY 2014 FY 2015 # of EAs 88 91 84 92 # of EAs w/ CAs 7 6 3 7 % of EAs w/ CAs 8.0% 6.6% 3.6% 7.6%
I5. Fish and Wildlife Service The Fish and Wildlife Service (FWS) reported that in FY 2015, one of three EISs involved cooperating agencies (see Table 79). For its EAs, FWS reported much lower cooperating agency participation—with an average of seven percent participation (see Table 80). FWS reported that the reason cooperating agencies were not used in two EISs was that the potential cooperating agency lacked jurisdiction or special expertise—USFWS is the only agency under Federal law having authority to issue Federal permits authorizing incidental take of

Attachment A: Fourth Report on Cooperating Agency Status FY 2015 Page 26 federally listed endangered and threatened bird species. For the EAs, it was noted that the potential cooperating agency lacked jurisdiction of law or that a cooperating agency was not needed to meet FWS requirements. Table 79. Percentage of Fish and Wildlife Service’s EISs with Cooperating Agencies Started in FY 2012 through FY 2015
Fish and Wildlife Service FY 2012 FY 2013 FY 2014 FY 2015 # of EISs 12 3 3 3 # of EISs w/ CAs 3 2 0 1 % of EISs w/ CAs 25.0% 66.7% 0.0% 33.3%
Table 80. Percentage of Fish and Wildlife Service’s EAs with Cooperating Agencies Completed in FY 2012 through FY 2015
Fish and Wildlife Service FY 2012 FY 2013 FY 2014 FY 2015 # of EAs 35 22 9 14 # of EAs w/ CAs 3 0 1 1 % of EAs w/ CAs 8.6% 0.0% 11.1% 7.1%
I6. National Park Service During the reporting period, the National Park Service (NPS) initiated seven EISs, five of which were prepared with cooperating agencies (see Table 81). This is a notable increase than previous reporting years. The National Park Service also reported that only about 16 percent of its EAs had cooperating agencies (see Table 82). NPS explained that many of their projects were entirely within park boundaries, and there was no outside agency involvement. In other cases, agencies were invited but declined due to a lack of jurisdiction or agreement. Table 81. Percentage of National Park Service’s EISs with Cooperating Agencies Started in FY 2012 through FY 2015
National Park Service FY 2012 FY 2013 FY 2014 FY 2015 # of EISs 9 7 8 7 # of EISs w/ CAs 6 2 4 5 % of EISs w/ CAs 66.7% 28.6% 50.0% 71.4%
Table 12. Percentage of National Park Service’s EAs with Cooperating Agencies Completed in FY 2012 through FY 2015
National Park Service FY 2012 FY 2013 FY 2014 FY 2015 # of EAs 80 71 68 69 # of EAs w/ CAs 8 13 8 11 % of EAs w/ CAs 10.0% 18.3% 11.8% 15.9%
I7. Office of Surface Mining The Office of Surface Mining (OSM) reported zero EISs during the reporting period (see Table 83). Six percent of the EAs prepared by OSM involved cooperating agencies (see Table 84). This is a notable increase from the previous reporting years.

Attachment A: Fourth Report on Cooperating Agency Status FY 2015 Page 27 OSM indicated that the vast majority of its EAs pertain to the reclamation of abandoned mine lands and noted that these EAs are fairly simple, highly-focused, and routine. OSM stated the planning for such projects involves the expertise of numerous entities at the state and Federal levels but does not typically rise to the level requiring formal designation as a cooperating agency. Table 13. Percentage of Office of Surface Mining’s EISs with Cooperating Agencies Started in FY 2012 through FY 2015
Office of Surface Mining FY 2012 FY 2013 FY 2014 FY 2015 # of EISs 1 1 0 0 # of EISs w/ CAs 1 1 0 0 % of EISs w/ CAs 100.0% 100.0% 0.0% 0.0%
Table 84. Percentage of Office of Surface Mining’s EAs with Cooperating Agencies Completed in FY 2012 through FY 2015
Office of Surface Mining FY 2012 FY 2013 FY 2014 FY 2015 # of EAs 0 136 252 64 # of EAs w/ CAs 0 2 2 4 % of EAs w/ CAs 0.0% 1.5% 0.8% 6.3%
I8. U.S. Geological Survey The US Geological Survey (USGS) reported no EISs or EAs during the reporting period (see Table 85). Table85. Percentage of Geological Survey’s EAs with Cooperating Agencies Completed in FY 2012 through FY 2015
Geological Survey FY 2012 FY 2013 FY 2014 FY 2015 # of EAs 3 0 2 0 # of EAs w/ CAs 0 0 2 0 % of EAs w/ CAs 0.0% 0.0% 100.0% 0.0%
J. Department of Justice The Department of Justice only reported two EISs in FY 2015, which did not involve cooperating agency participation (see Table 86). Table 86. Percentage of Department of Justice’s EISs with Cooperating Agencies Completed in FY 2012 through FY 2015
Department of Justice FY 2012 FY 2013 FY 2014 FY 2015 Overall # of EAs 0 1 0 2 3 # of EAs w/ CAs 0 0 0 0 0 % of EAs w/ CAs 0.0% 0.0% 0.0% 0.0% 0.0%
The Department of Justice completed 2 EAs during the FY 2015 reporting period, one of which involved cooperating agencies (see Tables 87 and 88).

Attachment A: Fourth Report on Cooperating Agency Status FY 2015 Page 28 Table 87. Percentage of Department of Justice’s EAs with Cooperating Agencies Completed in FY 2012 through FY 2015
Department of Justice FY 2012 FY 2013 FY 2014 FY 2015 Overall # of EAs 13 11 5 2 31 # of EAs w/ CAs 12 9 3 1 25 % of EAs w/ CAs 92.3% 81.8% 60.0% 50.0% 80.6%
Table 88. Percentage of Department of Justice’s EAs with Cooperating Agencies Completed in FY 2012 through FY 2015 by Agency
Agency FY 2012 FY 2013 FY 2014 FY 2015 Overall Bureau of Prisons - 0.0% 0.0% 0.0% 0.0% Community Oriented Policing Services
0.0% 0.0% 0.0% 0.0% 0.0%
Federal Bureau of Investigation - 100.0% 0.0% 100.0% 100.0% Office of Justice Programs 100.0% 100.0% 100.0% 0.0% 75.0% Total 92.3% 81.8% 60.0% 50.0% 80.6%
J1. Bureau of Prisons For FY 2015, BOP reported initiating two EIS and one EAs, none of which involved cooperation agencies (see Tables 89 and 90). BOP reported that the agency frequently cooperates with other entities informally rather than formalizing a cooperation agency agreement. Table 89. Percentage of Bureau of Prisons' EISs with Cooperating Agencies Started in FY 2012 through FY 2015
Bureau of Prisons FY 2012 FY 2013 FY 2014 FY 2015 # of EISs - 1 0 2 # of EISs w/ CAs - 0 0 0 % of EISs w/ CAs - 0.0% 0.0% 0.0%
BOP reported that, due to the small size of the projects, there was no need for a cooperating agency involvement in the EA it prepared in 2015. Again, the agency noted that it frequently cooperates with other entities informally rather than formalizing a cooperation agency agreement. Table 90. Percentage of Bureau of Prisons' EAs with Cooperating Agencies Completed in FY 2012 through FY 2015
Bureau of Prisons FY 2012 FY 2013 FY 2014 FY 2015 # of EAs - 1 2 1 # of EAs w/ CAs - 0 0 0 % of EAs w/ CAs - 0.0% 0.0% 0.0%
J2. Community Oriented Policing Services The Community Oriented Policing Services (COPS) did not initiate any EISs or EAs during the reporting period (see Table 91).

Attachment A: Fourth Report on Cooperating Agency Status FY 2015 Page 29 Table 91. Percentage of Community Oriented Policing Services' EAs with Cooperating Agencies Completed in FY 2012 through FY 2015
Community Oriented Policing Services FY 2012 FY 2013 FY 2014 FY 2015 # of EAs 1 1 0 0 # of EAs w/ CAs 0 0 0 0 % of EAs w/ CAs 0.0% 0.0% 0.0% 0.0%
J3. Federal Bureau of Investigation The Federal Bureau of Investigation (FBI) did not report initiating an EIS during FY 2015. The FBI did report one EA which was completed with a cooperating agency (see Table 92). Table92. Percentage of Federal Bureau of Investigation's EAs with Cooperating Agencies Completed in FY 2012 through FY 2015
Federal Bureau of Investigation FY 2012 FY 2013 FY 2014 FY 2015 # of EAs - 5 0 1 # of EAs w/ CAs - 5 0 1 % of EAs w/ CAs - 100.0% 0.0% 100.0%
J4. Office of Justice Programs The Office of Justice Programs reported initiating no EISs or EAs during FY 2015 (see Table 93). Table 93. Percentage of Office of Justice Programs' EAs with Cooperating Agencies Completed in FY 2012 through FY 2015
Office of Justice Programs FY 2012 FY 2013 FY 2014 FY 2015 # of EAs 12 4 3 0 # of EAs w/ CAs 12 4 3 0 % of EAs w/ CAs 100.0% 100.0% 100.0% 0.00%
K. Department of Labor The Department of Labor did not initiate any EISs or EAs during the FY 2015 reporting period (see table 94). Table94. Percentage of Department of Labor's EAs with Cooperating Agencies Completed in FY2012 through FY 2015
Department of Labor FY 2012 FY 2013 FY 2014 FY 2015 Overall # of EAs 0 7 5 0 12 # of EAs w/ CAs 0 0 0 0 0 % of EAs w/ CAs 0.0% 0.0% 0.0% 0.0% 0.0%
L. Department of State The Department of State reported starting one EIS without a cooperating agency during the FY 2015 reporting period (see Table 95). In the Department’s reported EISs, it was noted that a

Attachment A: Fourth Report on Cooperating Agency Status FY 2015 Page 30 potential or active cooperating agency lack capacity (training or resources) to participate. The agency did not complete any EAs during the reporting period (see Table 96). Table95. Percentage of Department of State’s EISs with Cooperating Agencies Started in FY 2012 through FY 2015
Department of State FY 2012 FY 2013 FY 2014 FY 2015 Overall # of EISs 2 0 2 1 5 # of EISs w/ CAs 2 0 2 0 4 % of EISs w/ CAs 100.0% 0.0% 100.0% 0.0% 80.0%
Table96. Percentage of Department of State’s EAs with Cooperating Agencies Completed in FY 2012 through FY 2015
Department of State FY 2012 FY 2013 FY 2014 FY 2015 Overall # of EAs 0 1 0 0 1 # of EAs w/ CAs 0 0 0 0 0 % of EAs w/ CAs 0.0% 0.0% 0.0% 0.0% 0.0%
M. Department of Transportation Almost 95 percent of the EISs prepared by the Department of Transportation (DOT) were prepared with cooperating agency participation (see Table 97). This represents the highest percentage of cooperating agency participation in the previous four years. Table97. Percentage of Department of Transportation’s EISs with Cooperating Agencies Started in FY 2012 through FY 2015
Department of Transportation FY 2012 FY 2013 FY 2014 FY 2015 Overall # of EISs 32 23 13 19 87 # of EISs w/ CAs 24 8 11 18 61 % of EISs w/ CAs 75.0% 34.8% 84.6% 94.7% 70.1%
Table98. Percentage of Department of Transportation’s EISs with Cooperating Agencies Started in FY 2012 through FY 2014 by Agency
Agency FY 2012 FY 2013 FY 2014 FY 2015 Overall Federal Aviation Administration 100.0% 0.0% 100.0% 100.0% 100.0% Federal Highway Administration 50.0% 27.3% 100.0% 100.0% 57.1% Federal Motor Carrier Safety Administration
0.0% - - - 0.0%
Federal Railroad Administration 100.0% 25.0% 83.3% 100.0% 76.4% Federal Transit Administration 90.0% 42.9% 66.7% 66.7% 69.6% Maritime Administration 0.0% 0.0% 0.0% 0.0% 0.0% National Highway Traffic Safety Administration
100.0% 0.0% 100.0% 100.0% 100.0%
Pipeline and Hazardous Materials Safety Administration
0.0% 0.0% 0.0% 0.0% 0.0%
Surface Transportation Board 100.0% 100.0% - 100.0% 100.0% Total 75.0% 34.8% 84.6% 94.7% 70.1%

Attachment A: Fourth Report on Cooperating Agency Status FY 2015 Page 31 During the reporting period, the DOT reported that under six percent of its EAs were prepared with cooperating agencies (see Table 99). While there has been a general decline in overall involvement of cooperating agencies in EAs prepared by agencies within DOT during the reporting period, the Federal Transit Administration, the Federal Railroad Administration, and the Surface Transportation Board all saw large percentage increases in the rate of participation in FY 2015 (see Table 100). Table99. Percentage of Department of Transportation’s EAs that had Cooperating Agencies for FY 2012 through FY 2015
Department of Transportation FY 2012 FY 2013 FY 2014 FY 2015 Overall # of EAs 211 273 271 192 947 # of EAs w/ CAs 23 24 20 11 78 % of EAs w/ CAs 10.9% 8.8% 7.4% 5.7% 8.2%
Table100. Percentage of Department of Transportation’s EAs with Cooperating Agencies Completed in FY 2012 through FY 2015
Agency FY 2012 FY 2013 FY 2014 FY 2015 Overall Federal Aviation Administration 1.0% 1.0% 5.2% 1.8% 2.6% Federal Highway Administration 19.8% 16.9% 8.6% 9.8% 14.8% Federal Motor Carrier Safety Administration
0.0% - - - 0.0%
Federal Railroad Administration 44.4% 0.0% 0.0% 20.0% 15.2% Federal Transit Administration 10.0% 11.1% 0.0% 12.5% 7.9% Maritime Administration 0.0% 0.0% 0.0% 0.0% 0.0% National Highway Traffic Safety Administration
0.0% 0.0% 0.0% 0.0% 0.0%
Pipeline and Hazardous Materials Safety Administration
0.0% 0.0% 31.3% 8.7% 11.5%
Surface Transportation Board 0.0% 0.0% - 50.0% 20.0% Total 10.9% 8.8% 7.4% 5.7% 8.2%
M1. Federal Aviation Administration The Federal Aviation Administration (FAA) prepared two EISs during the FY 2015 reporting period, both with cooperating agency participation (see Table 101). The FAA reported that only about two percent of its EAs had cooperating agencies for FY 2015 (see Table 102). The FAA noted that most of its actions are under its sole authority; in these instances potential cooperating agencies may lack special expertise and jurisdiction by law. Nevertheless, FAA indicated that it often consults with other agencies without formally designating them as cooperating agencies. Table101. Percentage of Federal Aviation Administration’s EISs with Cooperating Agencies Started in FY 2012 through FY 2015
Federal Aviation Administration FY 2012 FY 2013 FY 2014 FY 2015 # of EISs 1 0 1 2 # of EISs w/ CAs 1 0 1 2 % of EISs w/ CAs 100.0% 0.0% 100.0% 100%

Attachment A: Fourth Report on Cooperating Agency Status FY 2015 Page 32 Table102. Percentage of Federal Aviation Administration’s EAs with Cooperating Agencies Completed in FY 2012 through FY 2015
Federal Aviation Administration FY 2012 FY 2013 FY 2014 FY 2015 # of EAs 100 101 153 113 # of EAs w/ CAs 1 1 8 2 % of EAs w/ CAs 1.0% 1.0% 5.2% 1.8%
M2. Federal Highway Administration The Federal Highway Administration (FHWA) reported that 100 percent of the EISs it prepared during the reporting period involved cooperating agency participation (see Table 103). FHWA also reported that cooperating agency participation in EAs trended downward during the reporting period, from about 20 percent in FY 2012 to about ten percent in FY 2015 (see Table 104). FHWA indicated that because of the nature of the Federal-Aid program, individual NEPA actions are generally performed by FHWA Division Offices with the relevant State DOT, each of which has an individual relationship with resource agencies. FHWA also encourages collaboration between agencies by maintaining contact with resource agency partners through funded liaison projects. Additionally, state DOTs are encouraged to establish early communication with cooperating agencies thorough programs such as Eco-Logical and Planning and Environmental Linkages. FHWA also noted that for one EIS in FY 2012, the potential cooperating agency lacked the capacity (training or resources) to participate. For EAs in FY 2015, FHWA noted that cooperating agency participation was initiated in around 10 percent of cases; however, their records did not indicate why agencies declined or otherwise did not participate as cooperating agencies. Table103. Percentage of Federal Highway Administration’s EISs with Cooperating Agencies Started in FY 2012 through FY 2015
Federal Highway Administration FY 2012 FY 2013 FY 2014 FY 2015 # of EISs 14 11 2 8 # of EISs w/ CAs 7 3 2 8 % of EISs w/ CAs 50.0% 27.3% 100.0% 100%
Table104. Percentage of Federal Highway Administration’s EAs with Cooperating Agencies Completed in FY 2012 through FY 2015
Federal Highway Administration FY 2012 FY 2013 FY 2014 FY 2015 # of EAs 86 130 81 41 # of EAs w/ CAs 17 22 7 4 % of EAs w/ CAs 19.8% 16.9% 8.6% 9.8%
M3. Federal Motor Carrier Safety Administration The Federal Motor Carrier Safety Administration (FMCSA) did not prepare any EISs or EAs during FY 2015.

Attachment A: Fourth Report on Cooperating Agency Status FY 2015 Page 33 M4. Federal Railroad Administration Federal Railroad Administration (FRA) reported that 100 percent of the EISs it worked on involved cooperating agency participation during the reporting period (see Table 105). 20 percent of the EAs the FRA prepared in FY 2015 had cooperating agency participation (see Table 106). The FRA reported that the EAs without cooperating agencies were conducted independently because any potential cooperating agency lacked special expertise and jurisdiction by law. Table 105. Percentage of Federal Railroad Administration’s EISs with Cooperating Agencies Started in FY 2012 through FY 2015
Federal Railroad Administration FY 2012 FY 2013 FY 2014 FY 2015 # of EISs 5 4 6 2 # of EISs w/ CAs 5 1 5 2 % of EISs w/ CAs 100.0% 25.0% 83.3% 100.0%
Table106. Percentage of Federal Railroad Administration’s EAs with Cooperating Agencies Completed in FY 2012 through FY 2015
Federal Railroad Administration FY 2012 FY 2013 FY 2014 FY 2015 # of EAs 9 9 10 5 # of EAs w/ CAs 4 0 0 1 % of EAs w/ CAs 44.4% 0.0% 0.0% 20.0%
M5. Federal Transit Administration The Federal Transit Administration (FTA) reported that two of the three EISs underway during the reporting period had cooperating agencies (see Table 107). Cooperating agencies were utilized in 12.5 percent of EAs for FTA during FY 2015 (see Table 108). FTA indicated that potential cooperating agencies lacked special expertise or jurisdiction under law. In other cases, a potential or active cooperating agency lacked capacity to participate. For the EAs without cooperating agencies, either a potential agency lacked expertise or jurisdiction by law or the agency did not accept the invitation to participate. Table107. Percentage of Federal Transit Administration’s EISs with Cooperating Agencies Started in FY 2012 through FY 2015
Federal Transit Administration FY 2012 FY 2013 FY 2014 FY 2015 # of EISs 10 7 3 3 # of EISs w/ CAs 9 3 2 2 % of EISs w/ CAs 90.0% 42.9% 66.7% 66.7%
Table108. Percentage of Federal Transit Administration’s EAs with Cooperating Agencies Completed in FY 2012 through FY 2015
Federal Transit Administration FY 2012 FY 2013 FY 2014 FY 2015 # of EAs 10 9 11 8 # of EAs w/ CAs 1 1 0 1 % of EAs w/ CAs 10.0% 11.1% 0.0% 12.5%

Attachment A: Fourth Report on Cooperating Agency Status FY 2015 Page 34 M6. Maritime Administration The Maritime Administration (MARAD) did not prepare any EISs or EAs during the reporting period.
M7. National Highway Traffic Safety Administration The National Highway Traffic Safety Administration (NHTSA) reported one EIS during FY 2015 (see Table 109). This was prepared with cooperating agency participation. The NHTSA did not prepare any EAs during the reporting period. Table 109. Percentage of National Highway Traffic Safety Administration’s EISs with Cooperating Agencies for FY 2012 through FY 2015
National Highway Traffic Safety Administration FY 2012 FY 2013 FY 2014 FY 2015 # of EISs 1 0 1 1 # of EISs w/ CAs 1 0 1 1 % of EISs w/ CAs 100.0% 0.0% 100.0% 100.0%
M8. Pipeline and Hazardous Materials Safety Administration The Pipeline and Hazardous Materials Safety Administration (PHMSA) did not prepare any EISs during FY 2015. The PHMSA reported preparing 23 EAs during the reporting period, of which two included cooperating agencies (see Table 110). The PHMSA reported that 21 EAs did not utilize a cooperating agency because potential coopering agencies lacked special expertise and jurisdiction by law. Table110. Percentage of Pipeline and Hazardous Material Safety Administration’s EAs with Cooperating Agencies Completed in FY 2012 through FY 2015
Pipeline and Hazardous Material Safety Administration FY 2012 FY 2013 FY 2014 FY 2015
# of EAs 2 20 16 23 # of EAs w/ CAs 0 0 5 2 % of EAs w/ CAs 0.0% 0.0% 31.3% 8.7%
M9. Surface Transportation Board The Surface Transportation Board (STB) reported that all of the EISs it worked on during FY 2015 involved cooperating agency participation (see Table 111). One of the two EAs prepared by the STB during that period had cooperating agencies (see Table 112). The Surface Transportation Board indicated that one EA was conducted independently because a potential cooperating agency lacked special expertise or jurisdiction by law and lacked authority to enter into an agreement to act as a cooperating agency. Table111. Percentage of Surface Transportation Board’s EISs that have Cooperating Agencies for FY 2012 through FY 2015
Surface Transportation FY 2012 FY 2013 FY 2014 FY 2015 # of EISs 1 1 - 3

Attachment A: Fourth Report on Cooperating Agency Status FY 2015 Page 35
# of EISs w/ CAs 1 1 - 3 % of EISs w/ CAs 100.0% 100.0% - 100.0%
Table 112. Percentage of Surface Transportation Board’s EAs with Cooperating Agencies Completed in FY 2012 through FY 2015
Surface Transportation Board FY 2012 FY 2013 FY 2014 FY 2015 # of EAs 1 2 - 2 # of EAs w/ CAs 0 0 - 1 % of EAs w/ CAs 0.0% 0.0% - 50.0%
N. Department of the Treasury The Department of the Treasury did submit a report for the reporting period and prepared only one EA in FY 2014, which included a cooperating agency.
O. Department of Veterans Affairs The Department of Veterans Affairs (VA) reported initiating one EIS during the reporting period without the help of a coordinating agency. The VA prepared 27 EAs during the reporting period, none of which had cooperating agencies (see Table 113). For the one EIS, the VA reported that no other agency expressed interest in cooperating agency status rather than meeting, reviewing, and commenting. For the EAs prepared during the reporting period, the VA reported that potential cooperating agencies lacked special expertise, jurisdiction by law, or authority to enter into a cooperating agency agreement. Table 14. Percentage of Department of Veteran Affairs’ EAs with Cooperating Agencies Completed in FY 2012 through FY 2015
Department of Veterans Affairs FY 2012 FY 2013 FY 2014 FY 2015 Overall # of EAs 40 32 37 27 136 # of EAs w/ CAs 0 0 0 0 0 % of EAs w/ CAs 0.0% 0.0% 0.0% 0.0% 0.0%

Attachment A: Fourth Report on Cooperating Agency Status FY 2015 Page 36 III. Independent Agencies Agencies that do not fall under one of the U.S. Executive Branch Departments are listed below. A total of 47 EISs were initiated by independent agencies in FY 2015, just over half of which were prepared with cooperating agencies (see Table 114). The Federal Energy Regulatory Commission consistently reported high percentages of EISs with cooperating agency participation, using a cooperating agency in about 95 percent of EISs. Additionally, the Environmental Protection Agency initiated one EIS with the help of a cooperating agency (see Table 116). The Nuclear Regulatory Commission initiated 24 EISs, seven of which had a cooperating agency. The majority of independent agencies; however, did not initiate an EIS during FY 2015. Table 15. Percentage of Other Individual Agencies' EISs Cooperating Agencies Started in FY 2012 through FY 2015
Individual Agencies FY 2012 FY 2013 FY 2014 FY 2015 Overall # of EISs 19 11 9 47 86 # of EISs w/ CAs 13 3 6 26 48 % of EISs w/ CAs 68.4% 27.3% 66.7% 55.3% 55.8%
Table 16. Percentage of Other Individual Agencies’ EISs with Cooperating Agencies Started in FY 2012 through FY 2015 by Agency
Agency FY 2012 FY 2013 FY 2014 FY 2015 Overall Armed Forces Retirement Home - - - 0.0% 0.0% Central Intelligence Agency - - 0.0% - 0.0% Consumer Product Safety Commission
0.0% 0.0% 0.0% 0.0% 0.0%
Denali Commission 0.0% - - 0.0% 0.0% Environmental Protection Agency 0.0% 0.0% 0.0% 100.0% 100.0% Export-Import Bank - - 0.0% 0.0% 0.0% Farm Credit Administration 0.0% 0.0% 0.0% 0.0% 0.0% Federal Communications Commission
0.0% 0.0% 0.0% 0.0% 0.0%
Federal Deposit Insurance Corporation
0.0% 0.0% 0.0% 0.0% 0.0%
Federal Energy Regulatory Commission
90.9% 60.0% 100.0% 94.7% 90.0%
Federal Reserve Board 0.0% 0.0% 0.0% 0.0% 0.0% Federal Trade Commission 0.0% 0.0% - 0.0% 0.0% General Services Administration 0.0% 0.0% - 0.0% 0.0% International Boundary and Water Commission
0.0% 0.0% 100.0% 0.0% 100.0%
National Aeronautics and Space Administration
100.0% - - - 100.0%
National Capital Planning Commission
0.0% 0.0% 0.0% 0.0% 0.0%
National Endowment for the Arts 0.0% 0.0% 0.0% 0.0% 0.0% National Indian Gaming Commission 0.0% 0.0% 0.0% - 0.0% Nuclear Regulatory Commission 33.3% 0.0% 0.0% 29.2% 22.2%

Attachment A: Fourth Report on Cooperating Agency Status FY 2015 Page 37
National Science Foundation 100.0% 0.0% 0.0% 0.0% 100.0% Overseas Private Investment Corporation
- - - - 0.0%
Presidio Trust 0.0% 0.0% 0.0% 0.0% 0.0% Securities Exchange Commission 0.0% 0.0% 0.0% 0.0% 0.0% Small Business Administration - 0.0% 0.0% - 0.0% Social Security Administration 0.0% 0.0% 0.0% 0.0% 0.0% Tennessee Valley Authority 0.0% - - 0.0% 0.0% U.S. Access Board 0.0% 0.0% 0.0% - 0.0% U.S. Agency for International Development
0.0% - 0.0% 0.0% 0.0%
U.S. Postal Service 0.0% 0.0% - 0.0% 0.0% Valles Caldera Trust 0.0% 0.0% - - 0.0% Total 68.4% 27.3% 66.7% 55.3% 55.8%
Overall, the Independent Agencies reported that less than three percent of EAs were prepared with cooperating agency participation during FY 2015(see Table 116). This represents a decrease from previous reporting years. The General Services Administration and National Capital Planning Commission both completed an EA with a cooperating agency during FY 2015 (see Table 117). The Federal Energy Regulatory Commission, Nuclear Regulatory Commission, and Tennessee Valley Authority reported including cooperating agencies in a few of their EAs during FY 2015. All other independent agencies either did not complete an EA or did not involve a cooperating agency in any EAs. Table 17. Percentage of Other Individual Agencies' EAs with Cooperating Agencies Completed in FY 2012 through FY 2015
Individual Agencies FY 2012 FY 2013 FY 2014 FY 2015 Overall # of EAs 345 263 292 682 1582 # of EAs w/ CAs 16 15 11 17 59 % of EAs w/ CAs 4.6% 5.7% 3.8% 2.5% 3.7%
Table 18. Percentage of Other Individual Agencies’ EAs with Cooperating Agencies Completed in FY 2012 through FY 2014 by Agency
Agency FY 2012 FY 2013 FY 2014 FY 2015 Overall Armed Forces Retirement Home - - - 0.0% 0.0% Central Intelligence Agency - - 0.0% - 0.0% Consumer Product Safety Commission 0.0% 0.0% 0.0% 0.0% 0.0% Denali Commission 0.0% - - 0.0% 0.0% Environmental Protection Agency 0.0% 0.0% 0.0% 0.0% 0.0% Export-Import Bank - - 0.0% 0.0% 0.0% Farm Credit Administration 0.0% 0.0% 0.0% 0.0% 0.0% Federal Communications Commission 0.0% 0.0% 0.0% 0.0% 0.0% Federal Deposit Insurance Corporation 0.0% 0.0% 0.0% 0.0% 0.0% Federal Energy Regulatory Commission
9.8% 22.0% 17.9% 19.0% 16.2%
Federal Reserve Board 0.0% 0.0% 0.0% 0.0% 0.0% Federal Trade Commission 0.0% 0.0% - 0.0% 0.0%
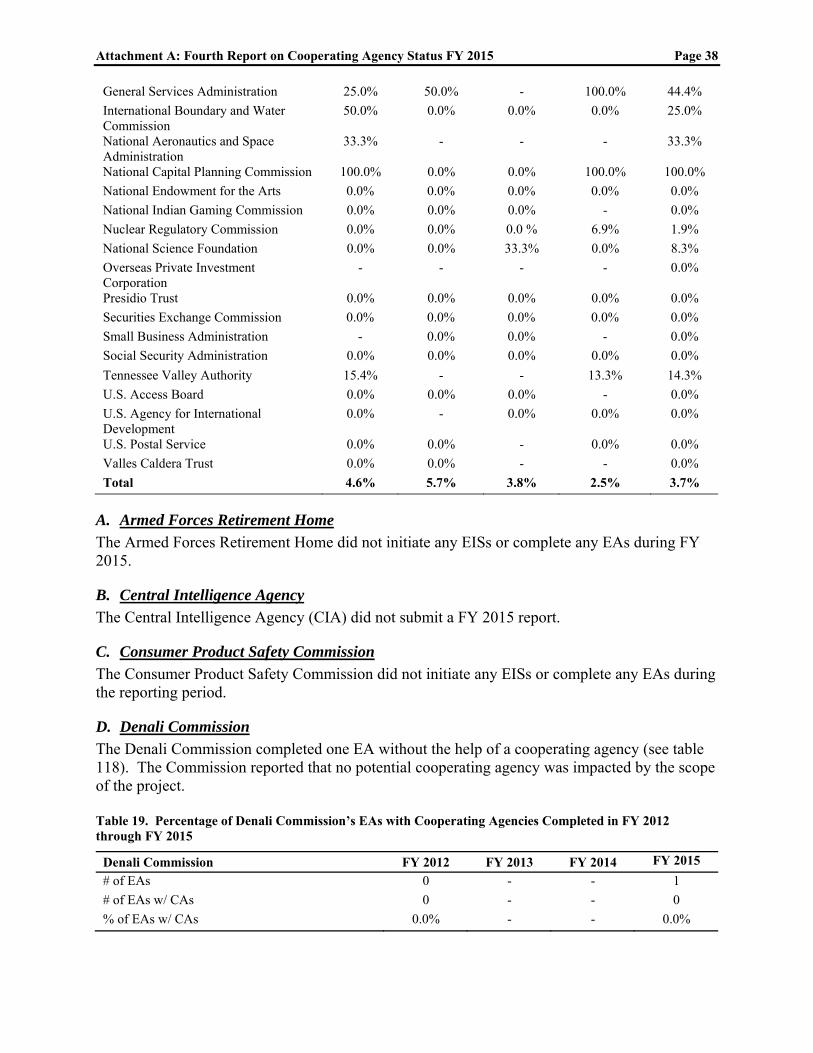
Attachment A: Fourth Report on Cooperating Agency Status FY 2015 Page 38
General Services Administration 25.0% 50.0% - 100.0% 44.4% International Boundary and Water Commission
50.0% 0.0% 0.0% 0.0% 25.0%
National Aeronautics and Space Administration
33.3% - - - 33.3%
National Capital Planning Commission 100.0% 0.0% 0.0% 100.0% 100.0% National Endowment for the Arts 0.0% 0.0% 0.0% 0.0% 0.0% National Indian Gaming Commission 0.0% 0.0% 0.0% - 0.0% Nuclear Regulatory Commission 0.0% 0.0% 0.0 % 6.9% 1.9% National Science Foundation 0.0% 0.0% 33.3% 0.0% 8.3% Overseas Private Investment Corporation
- - - - 0.0%
Presidio Trust 0.0% 0.0% 0.0% 0.0% 0.0% Securities Exchange Commission 0.0% 0.0% 0.0% 0.0% 0.0% Small Business Administration - 0.0% 0.0% - 0.0% Social Security Administration 0.0% 0.0% 0.0% 0.0% 0.0% Tennessee Valley Authority 15.4% - - 13.3% 14.3% U.S. Access Board 0.0% 0.0% 0.0% - 0.0% U.S. Agency for International Development
0.0% - 0.0% 0.0% 0.0%
U.S. Postal Service 0.0% 0.0% - 0.0% 0.0% Valles Caldera Trust 0.0% 0.0% - - 0.0% Total 4.6% 5.7% 3.8% 2.5% 3.7%
A. Armed Forces Retirement Home The Armed Forces Retirement Home did not initiate any EISs or complete any EAs during FY 2015.
B. Central Intelligence Agency The Central Intelligence Agency (CIA) did not submit a FY 2015 report.
C. Consumer Product Safety Commission The Consumer Product Safety Commission did not initiate any EISs or complete any EAs during the reporting period.
D. Denali Commission The Denali Commission completed one EA without the help of a cooperating agency (see table 118). The Commission reported that no potential cooperating agency was impacted by the scope of the project. Table 19. Percentage of Denali Commission’s EAs with Cooperating Agencies Completed in FY 2012 through FY 2015
Denali Commission FY 2012 FY 2013 FY 2014 FY 2015 # of EAs 0 - - 1 # of EAs w/ CAs 0 - - 0 % of EAs w/ CAs 0.0% - - 0.0%

Attachment A: Fourth Report on Cooperating Agency Status FY 2015 Page 39 E. Environmental Protection Agency The Environmental Protection Agency (EPA) reported preparing one EIS with a cooperating agency during FY 2015 (see Table 119). The EPA reported 16 EAs, none of which were prepared with cooperating agencies (see Table 120). The EPA indicated that cooperating agencies were not necessary because the special appropriations grant projects for wastewater, water supply, and solid waste collection facilities are routine actions that do not involve other agencies. Table 119. Percentage of Environmental Protection Agency’s EISs with Cooperating Agencies Started in FY 2012 through FY 2015
Environmental Protection Agency FY 2012 FY 2013 FY 2014 FY 2015 # of EIS 0 0 0 1 # of EIS w/ CAs 0 0 0 1 % of EIS w/ CAs 0.0% 0.0% 0.0% 100.0%
Table 120. Percentage of Environmental Protection Agency’s EAs with Cooperating Agencies Completed in FY 2012 through FY 2015
Environmental Protection Agency FY 2012 FY 2013 FY 2014 FY 2015 # of EAs 38 10 17 16 # of EAs w/ CAs 0 0 0 0 % of EAs w/ CAs 0.0% 0.0% 0.0% 0.0%
F. Export-Import Bank The Export-Import Bank reported no EISs or EAs for FY 2015.
G. Farm Credit Administration The Farm Credit Administration (FCA) did not report any EISs or EAs during the reporting period. The FCA believes that it is highly unlikely that its regulations would ever result in situations where it would need to perform environmental assessments.
H. Federal Communications Commission The Federal Communication Commission (FCC) reported no EISs for FY 2012 through FY 2015. It reported preparing 545 EAs during FY 2015, none of which were prepared with cooperating agency participation (see Table 121). The FCC indicated that while it does not appear that any of the federal or non-federal agencies or governments the FCC has conferred with during the reporting period qualify as cooperating agencies as defined by CEQ rules, the FCC has engaged in a significant number of communications with a variety of federal agencies, state governments, and tribal governments during the reporting period. The nature of the EAs, each of which typically relate to the construction or erection of a single communications tower or facility, do not rise to a level necessitating formal cooperating agency status. Table 121. Percentage of Federal Communications Commission’s EAs with Cooperating Agencies Completed in FY 2012 through FY 2015

Attachment A: Fourth Report on Cooperating Agency Status FY 2015 Page 40
Federal Communication Commission FY 2012 FY 2013 FY 2014 FY 2015 # of EAs 149 159 201 545 # of EAs w/ CAs 0 0 0 0 % of EAs w/ CAs 0.0% 0.0% 0.0% 0.0%
I. Federal Deposit Insurance Corporation The Federal Deposit Insurance Corporation did not report any EISs or EAs during FY 2012 through FY 2015.
J. Federal Energy Regulatory Commission The Federal Energy Regulatory Commission (FERC) reported preparing an average of 95 percent of its EISs during the reporting period with cooperating agency participation (see Table 122) and19 percent of EAs (see Table 123). For the EIS initiated without cooperating agency agreement, the FWS declined in order to retain ability to intervene, and Georgia Department of Natural Resources declined because they lacked the capacity to participate. FERC indicated that it routinely, by formal notice, invites other federal agencies to become cooperators in preparation and review of FERC EAs. For the most part, FERC noted that agencies did not respond to cooperating agency invitations. While not formal cooperating agencies, FERC reported that Federal agencies also provide comments and recommendations via FERC’s consultation procedures and regulations. In other instances, no cooperating agencies were sought because the scope of the action was limited or because potential cooperators lacked agreement with the agency. Table 122. Percentage of Federal Energy Regulatory Commission’s EISs with Cooperating Agencies Started in FY 2012 through FY 2015
Federal Energy Regulatory Commission FY 2012 FY 2013 FY 2014 FY 2015 # of EIS 11 5 5 19 # of EIS w/ CAs 10 3 5 18 % of EIS w/ CAs 90.9% 60.0% 100.0% 94.7%
Table 123. Percentage of Federal Energy Regulatory Commission’s EAs with Cooperating Agencies Completed in FY 2012 through FY 2015
Federal Energy Regulatory Commission FY 2012 FY 2013 FY 2014 FY 2015 # of EAs 92 59 56 58 # of EAs w/ CAs 9 13 10 11 % of EAs w/ CAs 9.8% 22.0% 17.9% 19.0%
K. Federal Reserve Board The Federal Reserve Board did not initiate any EISs or complete any EAs in FY 2015.
L. Federal Trade Commission The Federal Trade Commission did not initiate any EISs or complete any EAs during FY 2015.

Attachment A: Fourth Report on Cooperating Agency Status FY 2015 Page 41 M. General Services Administration The General Services Administration (GSA) prepared one EIS during FY 2015 (see Table 124). The GSA also reported that it completed one EA with cooperating agency participation (see Table 125). The GSA indicated that the EIS was initiated without cooperating status because DoJ and the FBI lacked capacity to participate. Table 124. Percentage of General Services Administration’s EISs with Cooperating Agencies Completed in FY 2012 through FY 2015
General Services Administration FY 2012 FY 2013 FY 2014 FY 2015 # of EAs 0 0 - 1 # of EAs w/ CAs 0 0 - 0 % of EAs w/ CAs 0.0% 0.0% - 0.0%
Table 125. Percentage of General Services Administration’s EAs with Cooperating Agencies Completed in FY 2012 through FY 2015
General Services Administration FY 2012 FY 2013 FY 2014 FY 2015 # of EAs 4 4 - 1 # of EAs w/ CAs 1 2 - 1 % of EAs w/ CAs 25.0% 50.0% - 100.0%
N. International Boundary and Water Commission
O. The International Boundary and Water Commission (IBWC) did not report any EISs or EAs in FY 2015. National Aeronautics and Space Administration
The National Aeronautics and Space Administration (NASA) did not report for FY 2015.
P. National Capital Planning Commission The National Capital Planning Commission (NCPC) did not initiate any EISs during FY 2015. One EA was prepared with cooperating agency participation during FY 2015 (see Table 126). Table 126. Percentage of National Capital Planning Commission’s EAs with Cooperating Agencies Completed in FY 2012 through FY 2015
National Capital Planning Commission FY 2012 FY 2013 FY 2014 FY 2015 # of EAs 1 0 0 1 # of EAs w/ CAs 1 0 0 1 % of EAs w/ CAs 100.0% 0.0% 0.0% 100.0%
Q. National Endowment for the Arts The National Endowment for the Arts did not initiate any EISs or complete any EAs during the reporting period.

Attachment A: Fourth Report on Cooperating Agency Status FY 2015 Page 42 R. National Indian Gaming Commission The National Indian Gaming Commission did not report for FY 2015.
S. National Science Foundation The National Science Foundation (NSF) reported no EISs in FY 2015 (see Table 127). NSF completed 1 EA during the reporting period which did not include cooperating agency participation (see Table 128). The NSF indicated that the typical reason why agencies have elected not to participate as cooperating agencies in NSF environmental documents and processes are often timing and expressed preference for keeping their role separate from that of NSF. NSF funds unique research activities that may not be applicable for cooperating agency status with regard to agencies having special expertise (i.e. not of scientific interest to other agencies). Despite not working together as cooperating agencies, NSF makes strong effort to coordinate closely and cooperatively with any other agency that has expertise or jurisdiction over the proposed action. Table 127. Percentage of National Science Foundation’s EISs with Cooperating Agencies Started in FY 2012 through FY 2015
National Science Foundation FY 2012 FY 2013 FY 2014 FY 2015 # of EISs 1 0 0 0 # of EISs w/ CAs 1 0 0 0 % of EISs w/ CAs 100.0% 0.0% 0.0% 0.0%
Table 128. Percentage of National Science Foundation’s EAs with Cooperating Agencies Completed in FY 2012 through FY 2015
National Science Foundation FY 2012 FY 2013 FY 2014 FY 2015 # of EAs 5 3 3 1 # of EAs w/ CAs 0 0 1 0 % of EAs w/ CAs 0.0% 0.0% 33.3% 0.0%
T. Nuclear Regulatory Commission The Nuclear Regulatory Commission reported preparing 24 EISs and 29 EAs during the reporting period. Of these, seven of the EISs and two of the EAs were prepared with cooperating agency participation (see Tables 129 and 130). The Commission stated that it routinely and extensively consults with Federal, State, Tribal and local entities during the development of EISs and EAs. Formal Cooperating Agency status is usually not established because NRC believes that informal arrangements achieve the spirit of cooperating agency status. Table 129. Percentage of Nuclear Regulatory Commission’s EISs with Cooperating Agencies Started in FY 2012 through FY 2015
National Regulatory Commission FY 2012 FY 2013 FY 2014 FY 2015 # of EISs 3 6 3 24 # of EISs w/ CAs 1 0 0 7 % of EISs w/ CAs 33.3% 0.0% 0.0% 29.2%

Attachment A: Fourth Report on Cooperating Agency Status FY 2015 Page 43 Table 130. Percentage of Nuclear Regulatory Commission’s EAs with Cooperating Agencies Completed in FY 2012 through FY 2015
National Regulatory Commission FY 2012 FY 2013 FY 2014 FY 2015 # of EAs 34 28 13 29 # of EAs w/ CAs 0 0 0 2 % of EAs w/ CAs 0.0% 0.0% 0.0% 6.9%
U. Overseas Private Investment Corporation The Overseas Private Investment Corporation did not submit a report for FY 2015.
V. Presidio Trust The Presidio Trust reported completing one EA without cooperating agency participation during FY 2015 (see Table 131). Presidio Trust noted that cooperating agency status was not initiated in the EA because the National Park Service lacked agreement with the agency. Table 131. Percentage of Presidio Trust’s EAs with Cooperating Agencies Completed in FY 2012 through FY 2015
Presidio Trust FY 2012 FY 2013 FY 2014 FY 2015 # of EAs 0 0 0 1 # of EAs w/ CAs 0 0 0 0 % of EAs w/ CAs 0.0% 0.0% 0.0% 0.0%
W. Securities and Exchange Commission The Securities and Exchange Commission reported no EAs or EISs during FY 2015.
X. Small Business Administration The Small Business did not for FY 2015.
Y. Social Security Administration The Social Security Administration had no EISs or EAs to report during FY 2015.
Z. Tennessee Valley Authority The Tennessee Valley Authority (TVA) reported 2 EISs in 2015, neither of which involved a cooperating agency (see Table 132); however, 13.3 percent of its EAs involved a cooperating agency in 2015 (see Table 133). The Tennessee Valley Authority indicated that potential cooperating agencies lacked special expertise or jurisdiction by law. In most cases, no other agency had an action or a potential cooperating agency had already taken its action. Table 132. Percentage of Tennessee Valley Authority’s EISs with Cooperating Agencies Started in FY 2012 through FY 2015

Attachment A: Fourth Report on Cooperating Agency Status FY 2015 Page 44
Tennessee Valley Authority FY 2012 FY 2013 FY 2014 FY 2015 # of EISs 2 - - 2 # of EISs w/ CAs 0 - - 0 % of EISs w/ CAs 0.0% - - 0.0%
Table 133. Percentage of Tennessee Valley Authority’s EAs with Cooperating Agencies Completed in FY 2012 through FY 2015
Tennessee Valley Authority FY 2012 FY 2013 FY 2014 FY 2015 # of EAs 13 - - 15 # of EAs w/ CAs 2 - - 2 % of EAs w/ CAs 15.4% - - 13.3%
AA. U.S. Access Board The U.S. Access Board did not prepare any EISs or EAs during FY 2012 through FY 2014. No report has been received for FY 2015.
BB. U.S. Agency for International Development (USAID) The U.S. Agency for International Development (USAID) did not report preparing any EISs during FY 2015. USAID reported completing 14 EAs in FY 2015, none of which had cooperating agencies (see Table 134). USAID reported that missions and operating units usually do not ask other federal agencies to participate in EA preparation. Part of this is lack of knowledge about other federal agencies; part is that many federal agencies do not have the international expertise and overseas presence to participate. Table 134. Percentage of U.S. Agency for International Development EAs with Cooperating Agencies Completed in FY 2012 through FY 2015
U.S. Agency for International Development FY 2012 FY 2013 FY 2014 FY 2015 # of EAs 0 0 0 14 # of EAs w/ CAs 0 0 0 0 % of EAs w/ CAs 0.0% 0.0% 0.0% 0.0%
CC. U.S. Postal Service The U.S. Postal Service prepared no EISs or EAs during the reporting period (see Table 135). Table 135. Percentage of U.S. Postal Service’s EAs with Cooperating Agencies Completed in FY 2012 through FY 2015
U.S. Postal Service FY 2012 FY 2013 FY 2014 FY 2015 # of EAs 1 0 - 0 # of EAs w/ CAs 0 0 - 0 % of EAs w/ CAs 0.0% 0.0% - 0.0%

Attachment A: Fourth Report on Cooperating Agency Status FY 2015 Page 45 DD. Valles Caldera Trust The Valles Caldera Trust did not reported for FY 2015.