final bulric models for fixed and mobile networks
TRANSCRIPT

14895-163f
Final BULRIC models for fixed and mobile networks
20 April 2010
Industry presentation: updated for final model
FINAL VERSION

2
14895-163f
Copyright © 2010. Analysys Mason Limited has produced the information contained herein for OPTA.
The ownership, use and disclosure of this information are subject to the Commercial Terms contained in the
contract between Analysys Mason Limited and OPTA

3
14895-163f
Contents
Introduction
Market module
Mobile network design
Fixed network design
Service costing results

4
14895-163f
Project objectives
OPTA has commissioned Analysys Mason to developthe BULRIC models
This document provides an update to the second industry group presentation (originally distributed on 7 January 2010)
the information presented here reflects the final cost model (finalised 4 April 2010)
Introduction

5
14895-163f
The model dimensions a network and calculates service costs
Market volumes
Network costs
Route sharing analysis
Unit costs
Incremental costing and
routeing factors
Network asset dimensioning
Network expenditures
Service unit costs
KEY Input ‘Active’ calculation Result
Depreciation
Network assumptions
Network geodata
‘Offline’ calculation
Operator volumes
Market share
Introduction

6
14895-163f
A modular approach has been used in the construction of the model
Marketmodule
Mobile/fixed module Service costing module
Market volumes
Network costs
Route sharing analysis
Unit costs
Incremental costing and
routeing factors
Network asset
dimensioningNetwork
expenditures
Service unit costs
KEY Input ‘Active’ calculation Result
Depreciation
Network assumptions
Network geodata
‘Offline’ calculation
Inter-connection module
Operator volumes
Market share
Introduction
Calculations

7
14895-163f
Contents
Introduction
Market module
Mobile network design
Fixed network design
Service costing results

8
14895-163f
The fixed and mobile models are based on a single demand forecast …
0
10
20
30
40
50
60
70
2004 2005 2006 2007 2008
Min
utes
(billi
ons)
Mobile-originated Fixed-originatedInternet dial-up VoiP-originated
Market module
Dial-up almost completely gone
Fixed VoIP traffic increasing
Traffic on fixed networks declining
Traffic on mobile networks increasing
Source: Analysys Mason (not based on recent OPTA market information)

9
14895-163f
… which is generated in the market model
Market module
Total market demand is based on publicly available figures*, reconciled with data provided by the operators
this confidential data is used to check the validity of the public information and provide other “average” parameters
The number of mobile and fixed subscribers in the market is calculated using a projection of population, household and business penetration
The forecast traffic demand is determined by a projection of traffic per subscriber, multiplied by subscriber numbers
*Sources: Analysys Research, Operators’ annual reports, OPTA’s public reports

10
14895-163f
Outline of the market modelMarket module
Input data Final/intermediate outputsCalculations
Penetration forecast
Operator subscribers
forecast
Historical population/house-hold/businesses
Market share assumptions
Market total subscribers
forecastHistorical
penetration
Historical subscribers
Population/ household/bus-iness forecast
Market total traffic
forecastOperator traffic
forecastTraffic per user
forecastHistorical traffic per
user
Historical trafficTraffic
breakdown forecast
Historical traffic
breakdown
11
14895-163f
-
5
10
15
20
25
30
35
2006
2008
2010
2012
2014
2016
2018
2020
Con
nect
ions
(milli
ons)
0%
20%
40%
60%
80%
100%
120%
140%
Pen
etra
tion
(%)
Fixed connections Mobile connections
Fixed penetration (HH) Mobile penetration (pop)
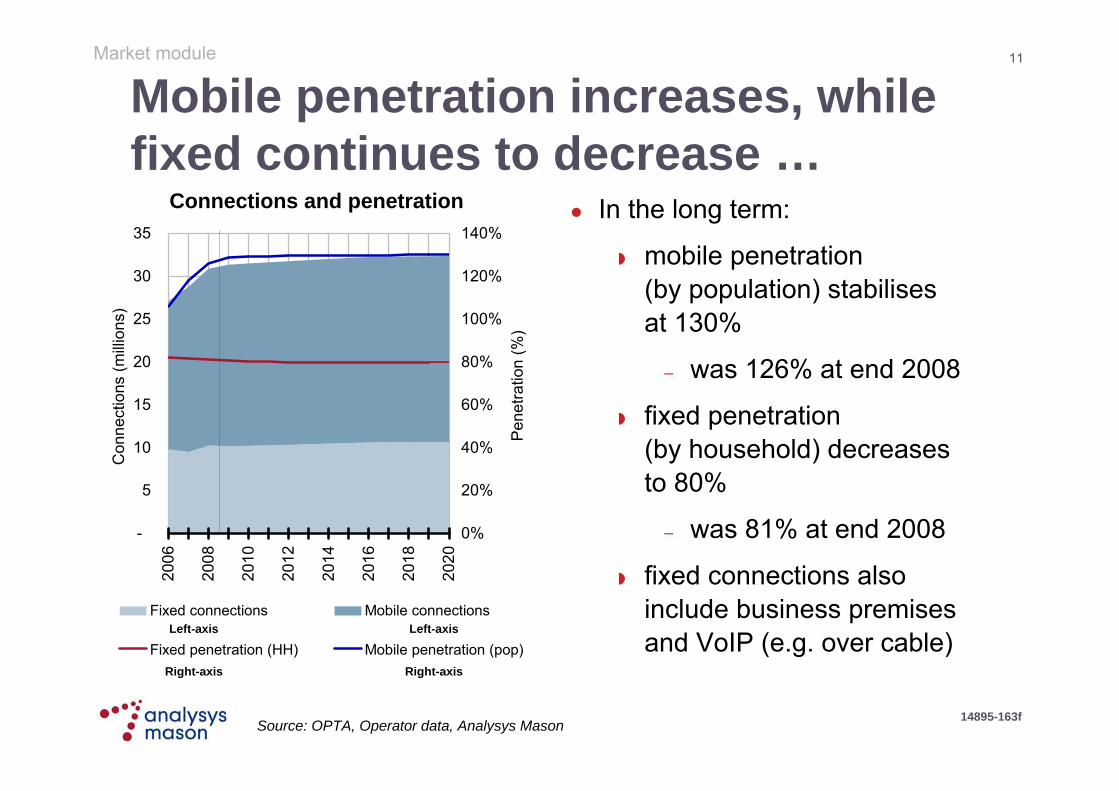
Mobile penetration increases, while fixed continues to decrease …
Market module
In the long term:
mobile penetration(by population) stabilisesat 130%
– was 126% at end 2008
fixed penetration(by household) decreases to 80%
– was 81% at end 2008
fixed connections also include business premises and VoIP (e.g. over cable)
Connections and penetration
Source: OPTA, Operator data, Analysys Mason
Left-axis Left-axis
Right-axis Right-axis

12
14895-163f
… due to ongoing fixed-to-mobile substitution for voice
Market module
In the Netherlands, the number of mobile-only households has increased from 12% in 2005 Q1 to 19% by the end of 2008
based on KPN’s public information factsheets
We have assumed that 20% of Dutch households will be mobile-only for voice services in the long term
Fixed-to-mobile substitution
Source: OPTA, Operator data, Analysys Mason
Left-axis
Left-axis
Right-axis
-
1
2
3
4
5
6
7
8
2004
2006
2008
2010
2012
2014
2016
2018
2020
Hou
seho
lds
(milli
ons)
0%
5%
10%
15%
20%
25%
Hou
seho
ld p
enet
ratio
n (%
)
Mobile only households
Households with fixed connections
Mobile-only households (%)

13
14895-163f
-
10
20
30
40
50
60
2006
2008
2010
2012
2014
2016
2018
2020
Orig
inat
ion
traffi
c (o
n-ne
t plu
s ou
tgoi
ng) (
billio
n m
in)
Fixed Mobile
-
5
10
15
20
25
30
2006
2008
2010
2012
2014
2016
2018
2020
Term
inat
ion
traffi
c fro
m o
ther
net
wor
ks (b
illio
n m
in)
Fixed Mobile
Consequently mobile voice traffic grows, while fixed traffic declines
Market module
Origination traffic Termination traffic
Source: OPTA, Operator data, Analysys Mason

14
14895-163f
Mobile broadband growth exceeds that of fixed broadband …
Market module
Source: OPTA, Operator data, Analysys Mason
Fixed and mobile broadband connections
Left-axis Left-axis Right-axis Right-axis
-
2
4
6
8
10
12
14
2006 2007 2008 2009 2010 2011 2012 2013 2014 2015 2016 2017 2018 2019 2020
Bro
adba
nd c
onne
ctio
ns (m
illion
s)
0%
10%
20%
30%
40%
50%
60%
70%
80%
90%
100%
Hou
seho
ld p
enet
ratio
n (%
)
Fixed broadband Mobile broadband Fixed broadband penetration Mobile broadband penetration

15
14895-163f
… a small proportion of which will be substitute mobile data users
Market module
Source: OPTA, Operator data, Analysys Mason
Mobile broadband subscribers
Left-axis Left-axis Right-axis
0.0
0.5
1.0
1.5
2.0
2.5
3.0
3.5
4.0
4.5
5.0
2006 2007 2008 2009 2010 2011 2012 2013 2014 2015 2016 2017 2018 2019 2020
Mob
ile d
ata
conn
ectio
ns (m
illion
s)
0%
1%
2%
3%
4%
5%
6%
7%
% o
f hou
seho
lds
Supplementary Substitutive Mobile-data only households

16
14895-163f
Fixed broadband data traffic (xDSL) increases over the next five years
Data backhaul per xDSL subscriber increases from around 60kbit/s in 2008 to 110kbit/s in the long term
annual change from launch in year 2000 to 2015 is around 8kbit/s increase per annum
The throughput of the overall market increases by a factor of three to nearly 1000Gbit/s
Market module
0
20
40
60
80
100
120
2006
2008
2010
2012
2014
2016
2018
2020
Bac
khau
l kbp
s pe
r xD
SL
user
xDSL traffic per subscriber
Source: Operator data, Analysys Mason
17
14895-163f
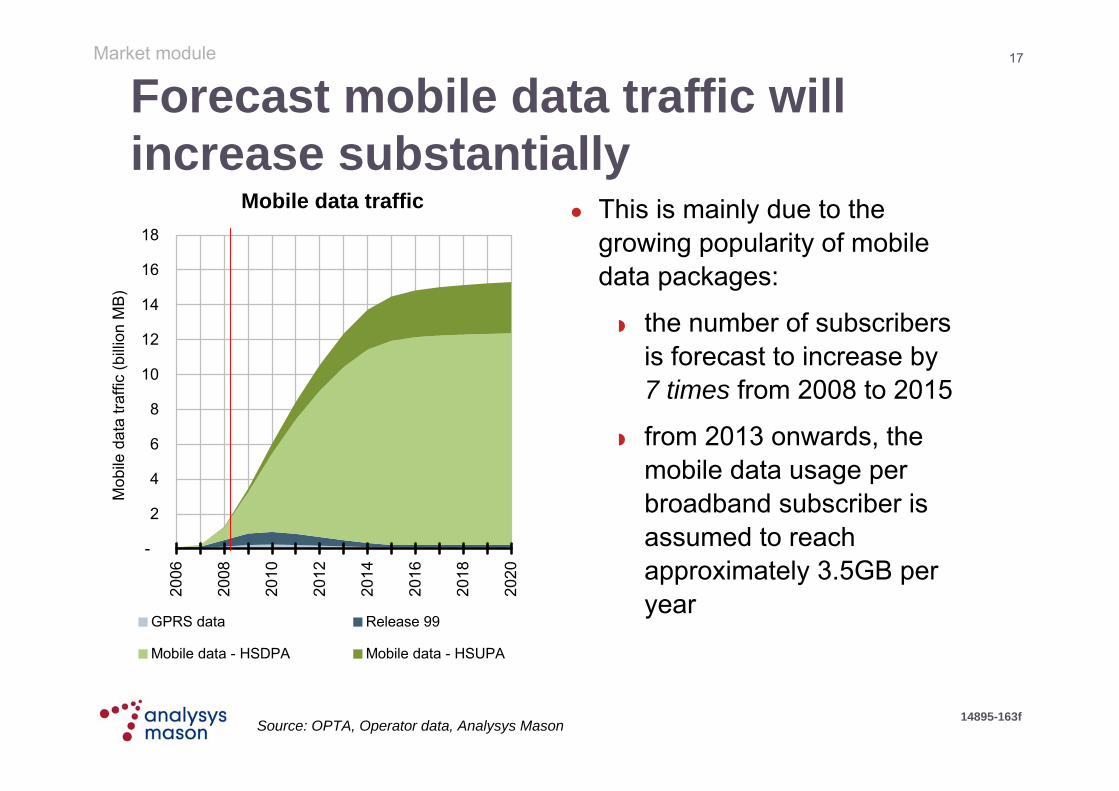
Forecast mobile data traffic will increase substantially
Market module
This is mainly due to the growing popularity of mobile data packages:
the number of subscribers is forecast to increase by 7 times from 2008 to 2015
from 2013 onwards, the mobile data usage per broadband subscriber is assumed to reach approximately 3.5GB per year
Mobile data traffic
Source: OPTA, Operator data, Analysys Mason
-
2
4
6
8
10
12
14
16
18
2006
2008
2010
2012
2014
2016
2018
2020
Mob
ile d
ata
traffi
c (b
illion
MB
)
GPRS data Release 99
Mobile data - HSDPA Mobile data - HSUPA

18
14895-163f
-
20
40
60
80
100
120
140
160
2006
2008
2010
2012
2014
2016
2018
2020
Bus
ines
s da
ta c
onne
ctiv
ity li
nes
(000
s)
# business data connectivity lines
Business data connectivity services will grow steadily [1/2]
Market module
We assume that demand for business data connectivity services will increase in line with the rise in the number of businesses in the Netherlands
Business data lines
Source: Operator data, Analysys Mason
19
14895-163f
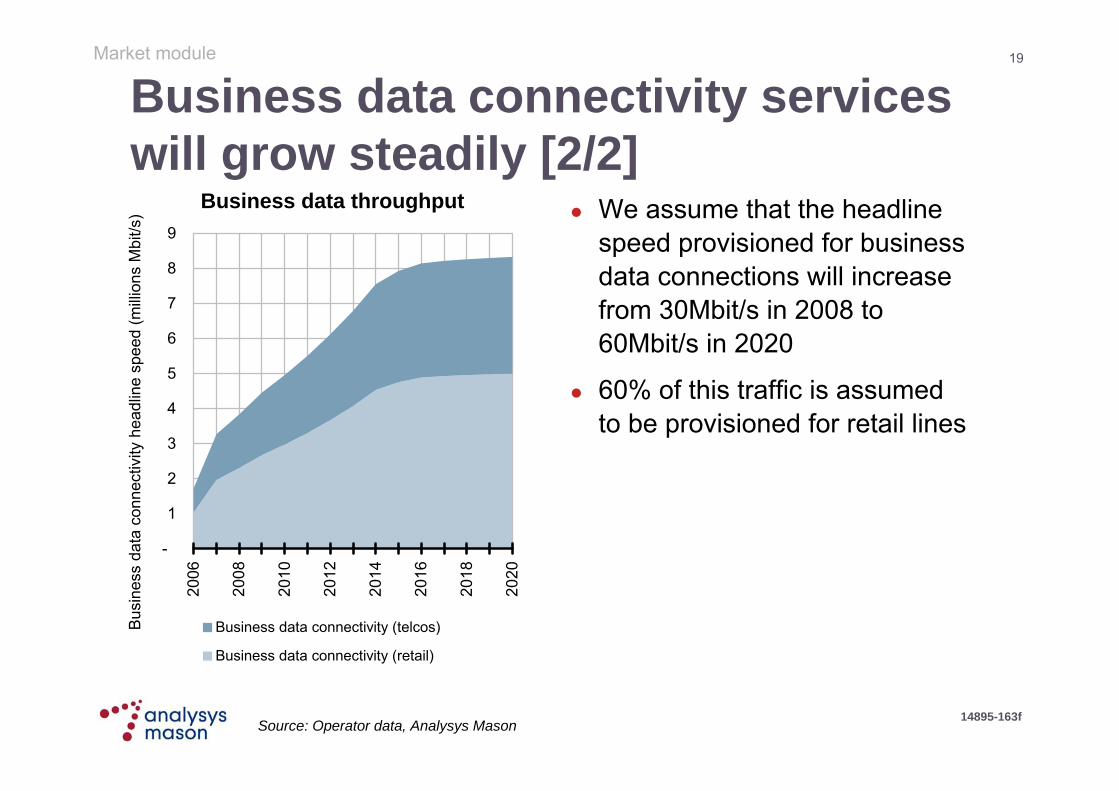
Business data connectivity services will grow steadily [2/2]
Market module
We assume that the headline speed provisioned for business data connections will increase from 30Mbit/s in 2008 to 60Mbit/s in 2020
60% of this traffic is assumed to be provisioned for retail lines
Business data throughput
Source: Operator data, Analysys Mason
-
1
2
3
4
5
6
7
8
9
2006
2008
2010
2012
2014
2016
2018
2020
Bus
ines
s da
ta c
onne
ctiv
ity h
eadl
ine
spee
d (m
illion
s M
bit/s
)
Business data connectivity (telcos)
Business data connectivity (retail)
20
14895-163f
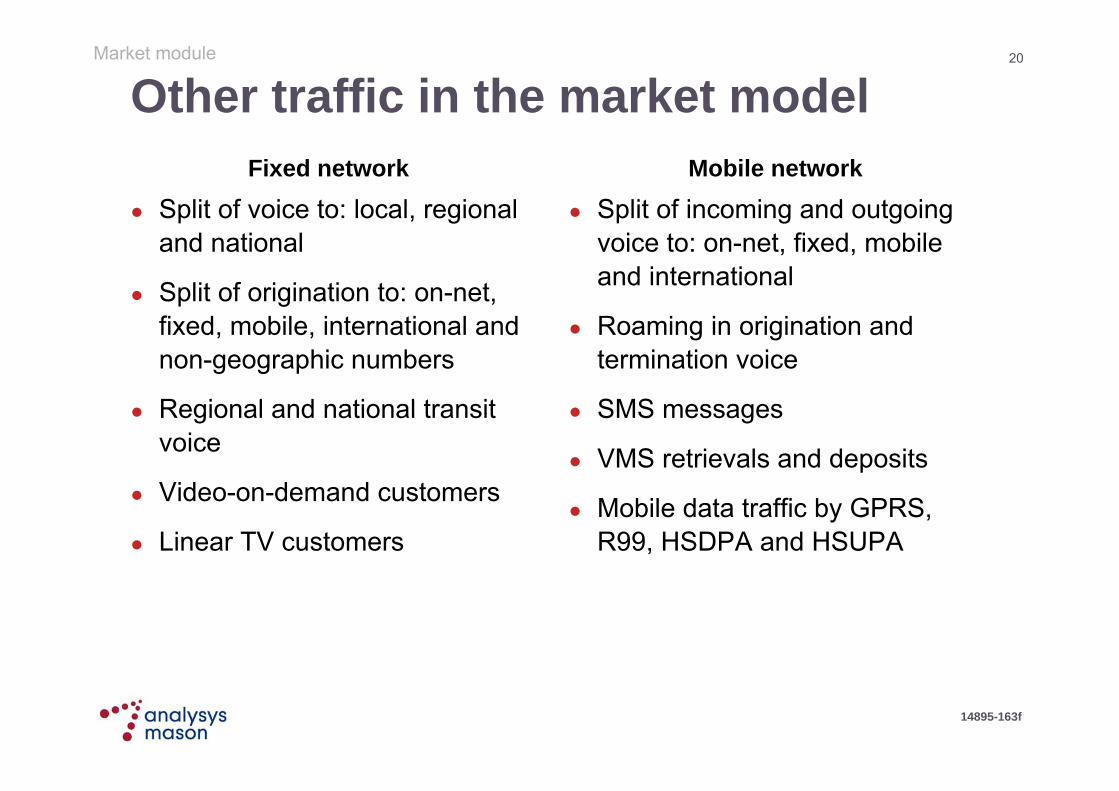
Other traffic in the market model
Split of voice to: local, regional and national
Split of origination to: on-net, fixed, mobile, international and non-geographic numbers
Regional and national transit voice
Video-on-demand customers
Linear TV customers
Split of incoming and outgoing voice to: on-net, fixed, mobile and international
Roaming in origination and termination voice
SMS messages
VMS retrievals and deposits
Mobile data traffic by GPRS, R99, HSDPA and HSUPA
Market module
Fixed network Mobile network
21
14895-163f
1
10
100
1,000
10,000
100,000
1,000,000
10,000,000
2006
2007
2008
2009
2010
2011
2012
2013
2014
2015
Mobile peak Mbit/s Fixed peak Mbit/s
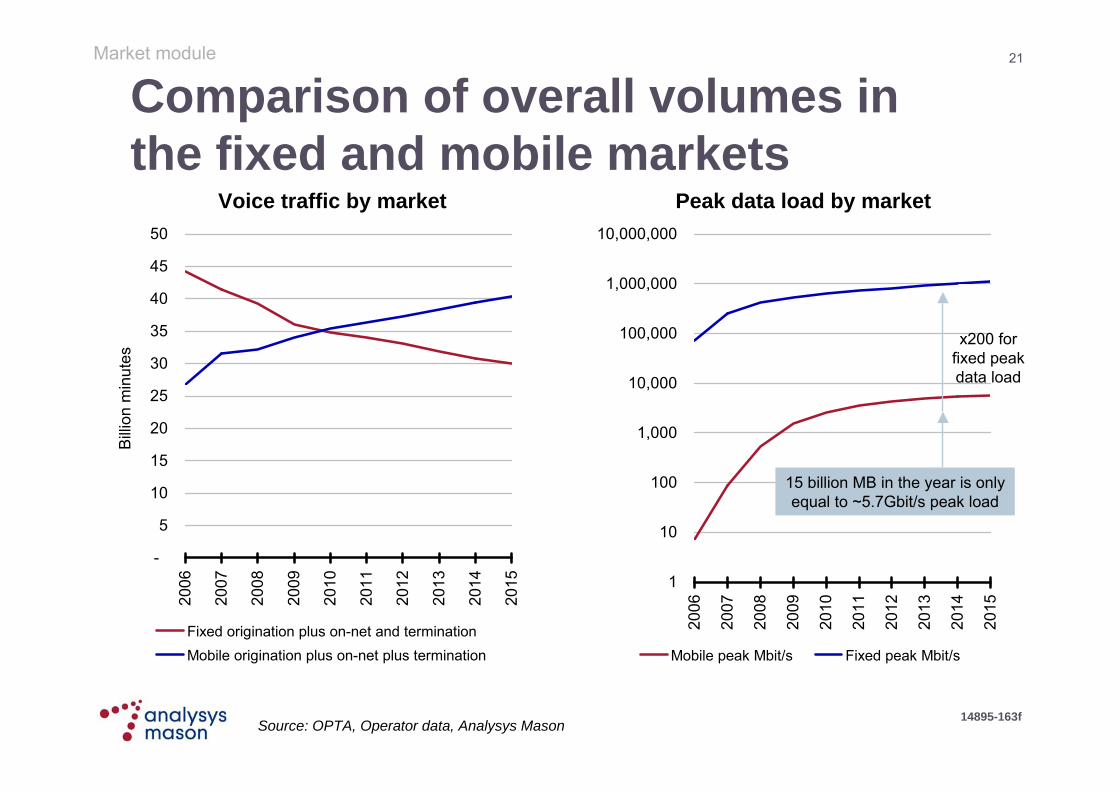
Comparison of overall volumes in the fixed and mobile markets
Market module
Voice traffic by market Peak data load by market
x200 for fixed peak data load
15 billion MB in the year is only equal to ~5.7Gbit/s peak load
Source: OPTA, Operator data, Analysys Mason
-
5
10
15
20
25
30
35
40
45
50
2006
2007
2008
2009
2010
2011
2012
2013
2014
2015
Billi
on m
inut
es
Fixed origination plus on-net and terminationMobile origination plus on-net plus termination

22
14895-163f
We have modelled a hypothetical existing operator for each network
Mobile network
Rolling out 2G in 2004/05
Launching service in 2006
Adding capacity with 1800MHz
Adding overlay with 2100MHz
Fixed network
Rolling out NGN IP core in 2004/05
Launching service in 2006
Specific choice of access technology
Market module
This enables us to calculate a cost that is relevant for the existing suppliers of termination in the Netherlands
Actual modern network characteristics can be taken into account

23
14895-163f
… and also assumed coverage and long-run market share Coverage (footprint) of the
network is a key input to the cost model
degree to which investments precede demand influences the eventual unit cost of traffic
In order to reflect the existing providers, the modelled fixed and mobile operators should offer national coverage at launch
An objective and neutral approach requires using a market share of 1/N, where N is the actual number of national network operators
Hypothetical mobile operator that rolls out a national network has a market share of
33.3% Hypothetical fixed operator that
rolls out a national network has a market share of 50%
3 existing national mobile operators
KPNVodafoneT-Mobile
2 existing national fixed operators
KPNCombined cable
operators
Market module

24
14895-163f
The operator has 1/N of the total market prior to network launch
Market module
We have assumed that the operator has access to a full1/N share of the fixed or mobile market at launch
i.e. it has a pre-existing legacy business Our approach is that rate of network roll-out is rapid:
national roll-out during 2004 and 2005 national launch of NGN services (IP or 2G+3G) on
1 January 2006 rapid movement of existing services onto the new empty
network continued build-up of emerging data services on the
network longer duration to migrate complex legacy
fixed business services/applications to the NGN

25
14895-163f
A series of roll-out curves are used to model the load-up of the NGN
Market module
0%
10%
20%
30%
40%
50%
60%
70%
80%
90%
100%
2004
2005
2006
2007
2008
2009
2010
2011
2012
2013
2014
2015
Sha
re o
f tra
ffic
carr
ied
over
NG
N
Residential traffic Business voice trafficBusiness data traffic
0%
10%
20%
30%
40%
50%
60%
70%
80%
90%
100%
2004
2005
2006
2007
2008
2009
2010
2011
2012
2013
2014
2015
Sha
re o
f tra
ffic
carr
ied
over
mob
ile N
GN
Subscribers, voice and GPRS
Fixed network load-up curves Mobile network load-up curves
Source: Analysys Mason
These load-up curves are key inputs to the fixed and mobile models

26
14895-163f
Calculated demand parameters feed into the fixed/mobile models
Market module
Marketmodule
Mobile/fixed module Service costing module
Market volumes
Network costs
Route sharing analysis
Unit costs
Incremental costing and
routeing factors
network asset dimensioning
Network expenditures
Service unit costs
KEY Input ‘Active’ calculation Result
Depreciation
Network assumptions
Network geodata
‘Offline’ calculation
Inter-connection module
Operator volumes
Market share
Calculations

27
14895-163f
Contents
Introduction
Market module
Mobile network design
Fixed network design
Service costing results

28
14895-163f
The mobile radio technology is a mix of GSM900/1800 and UMTS2100 Current spectrum allocations
can be considered endogenous operators own similar
amounts of 900MHz 1800MHz and 2100MHz
allocation is asymmetric,but compensated by spectrum payments
It is therefore assumed that forward-looking spectrum and coverage costs are symmetrical
GSM/UMTS seems thecurrent efficient technology mix
all existing operatorsuse a GSM/UMTS mix
they operate in a competitive market, which stimulates efficient use of technology
4G is unlikely to be used to deliver large volumes of voice termination in the short term
We will assume that the modelled operator has a 1/3 share of 900MHz
and 1800MHz spectrum and 210MHz of 2100MHz frequencies
We will use both GSM900/1800 and UMTS2100 radio technology, with
UMTS as an overlay
Mobile network design
29
14895-163f
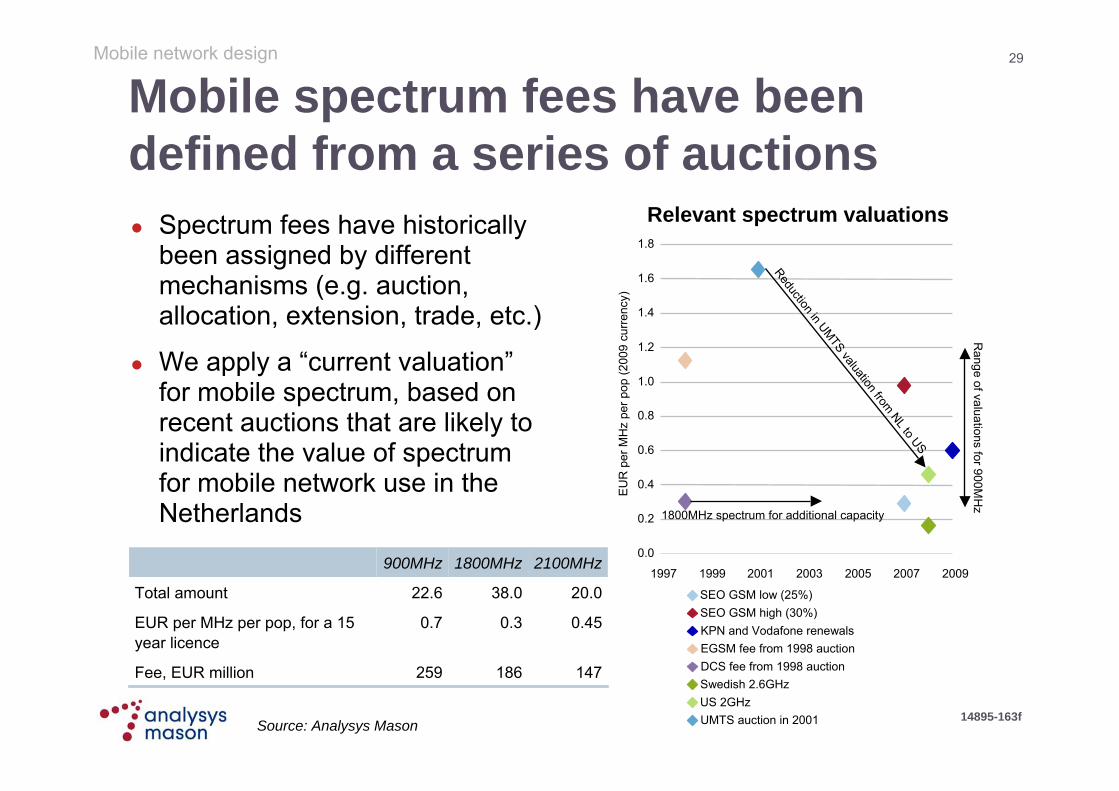
Mobile spectrum fees have been defined from a series of auctions Spectrum fees have historically
been assigned by different mechanisms (e.g. auction, allocation, extension, trade, etc.)
We apply a “current valuation” for mobile spectrum, based on recent auctions that are likely to indicate the value of spectrum for mobile network use in the Netherlands
SEO GSM low (25%)SEO GSM high (30%)KPN and Vodafone renewalsEGSM fee from 1998 auctionDCS fee from 1998 auctionSwedish 2.6GHzUS 2GHzUMTS auction in 2001
Relevant spectrum valuations
0.0
0.2
0.4
0.6
0.8
1.0
1.2
1.4
1.6
1.8
1997 1999 2001 2003 2005 2007 2009
EUR
per
MH
z pe
r pop
(200
9 cu
rrenc
y)
1800MHz spectrum for additional capacity
Reduction in UMTS valuation from NL to US
Range of valuations for 900M
Hz
147186259Fee, EUR million
0.450.30.7EUR per MHz per pop, for a 15 year licence
20.038.022.6Total amount
2100MHz1800MHz900MHz
Mobile network design
Source: Analysys Mason

30
14895-163f
Main nodes are based on population and operator information
We obtained population and area data for 4000 Dutch Zip4 regions
Geotypes have been specified by population density (consistent with the 2006 mobile model)
We have identified 19 main nodes corresponding to areas with high population density, consisting of:
4 national nodes
15 core nodes
We recognise that each operator may have its main nodes placedin different cities along the transmission routes
Mobile network design
Source: OPTA, Statistics Netherlands, Analysys Mason geo-analysis

31
14895-163f
A central core ring connects 8 main cities in the central region
One central core ring connecting 8 main cities: Amsterdam, Rotterdam, Arnhem,Tilburg, Utrecht, ‘s Gravenhage, ‘s Hertogenbosch and Breda
Four national nodes are identified on the central core ring based on a visual scorched node approach. Other locations and routes could equally be reasonable
MSC and MSS/MGW arelocated at up to 7 main citieson the core ring
National nodesCore nodes
Mobile network design
Source: OPTA, CBS, Analysys Mason geo-analysis

32
14895-163f
We have split the Netherlands into 6 regions served by 6 rings …
Six regional backhaul rings connect the core nodes with the national nodes using leased dark fibre
Each ring is connected to at least one national node
Some BSCs are co-located with MSCs, some are remote
Radio sites are connected in a star formation to remote BSCs or transmission access points on the regional rings
Source: OPTA, CBS, Analysys Mason geo-analysis
National nodesCore nodes
Mobile network design
33
14895-163f
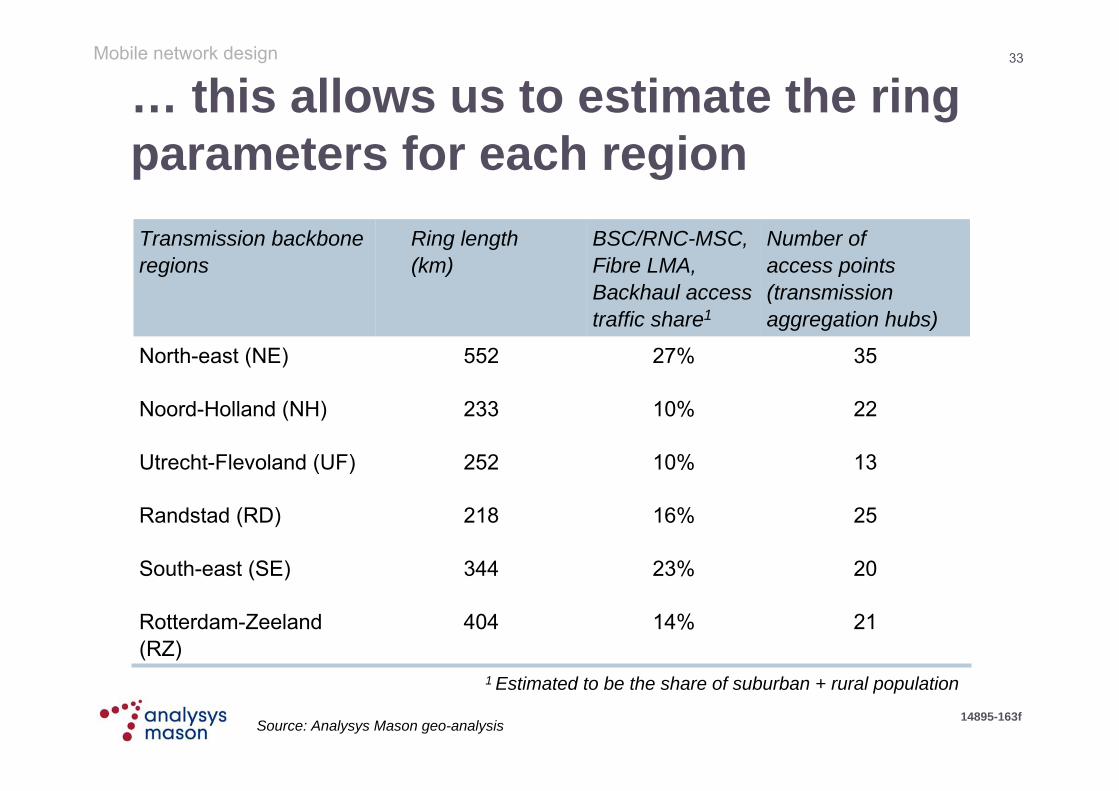
… this allows us to estimate the ring parameters for each region
1 Estimated to be the share of suburban + rural population
2210%233Noord-Holland (NH)
1310%252Utrecht-Flevoland (UF)
2516%218Randstad (RD)
2114%404Rotterdam-Zeeland (RZ)
2023%344South-east (SE)
3527%552North-east (NE)
Number ofaccess points (transmission aggregation hubs)
BSC/RNC-MSC, Fibre LMA, Backhaul access traffic share1
Ring length(km)
Transmission backbone regions
Mobile network design
Source: Analysys Mason geo-analysis

34
14895-163f
Radio sites are concentrated in urban areas
Around 12% of radio sites serve urban areas, which accounts for only 0.95% of the land mass
Compared with rural sites, a greater proportion of urban sites are multiple-technology:
UMTS is overlaid onto GSM at 57% of the urban sites
only 47% of the rural sites have both UMTS and GSM technology
Mobile network design
Source: Antennebureau, Analysys Mason

35
14895-163f
Technology sharing is more prevalent in urban areas
Technology Urban Suburban RuralUMTS 74% 74% 61%GSM 900 60% 62% 65%GSM 1800 48% 39% 34%UMTS+GSM 57% 54% 47%
Proportion of sites equipped with particular technologies
Mobile network design
Source: Antennebureau, Analysys Mason
36
14895-163f
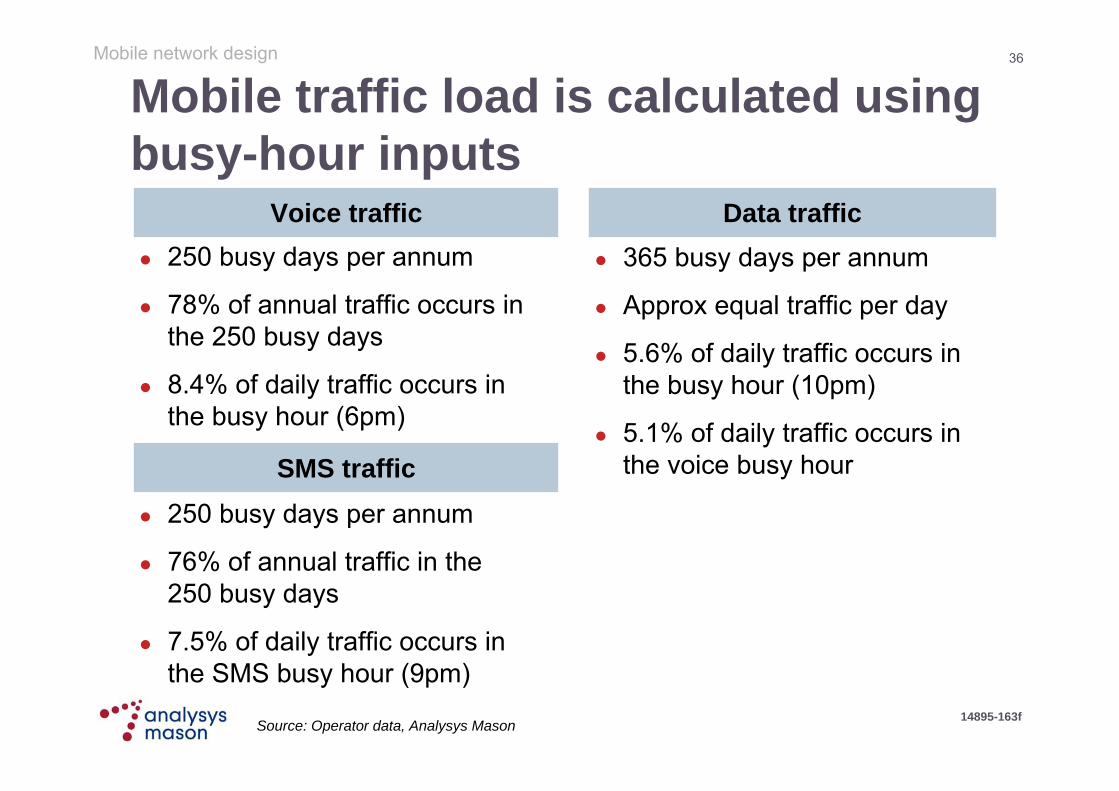
Mobile traffic load is calculated using busy-hour inputs
250 busy days per annum
78% of annual traffic occurs in the 250 busy days
8.4% of daily traffic occurs in the busy hour (6pm)
250 busy days per annum
76% of annual traffic in the 250 busy days
7.5% of daily traffic occurs in the SMS busy hour (9pm)
365 busy days per annum
Approx equal traffic per day
5.6% of daily traffic occurs in the busy hour (10pm)
5.1% of daily traffic occurs in the voice busy hour
Voice traffic Data traffic
SMS traffic
Mobile network design
Source: Operator data, Analysys Mason

37
14895-163f
Various technical parameters are included in the network drivers
Mobile network design
approximately 1.4Call attempts per successful call
10 secondsRing time per call
40% simultaneously attached in SGSN
30% with active PDP session in GGSN
A proportion of data users are connected at peak times
on-net traffic 2
other traffic 1
Radio loading
just under 2 minsAverage call durations
ValueParameter
Source: Operator data, Analysys Mason
38
14895-163f
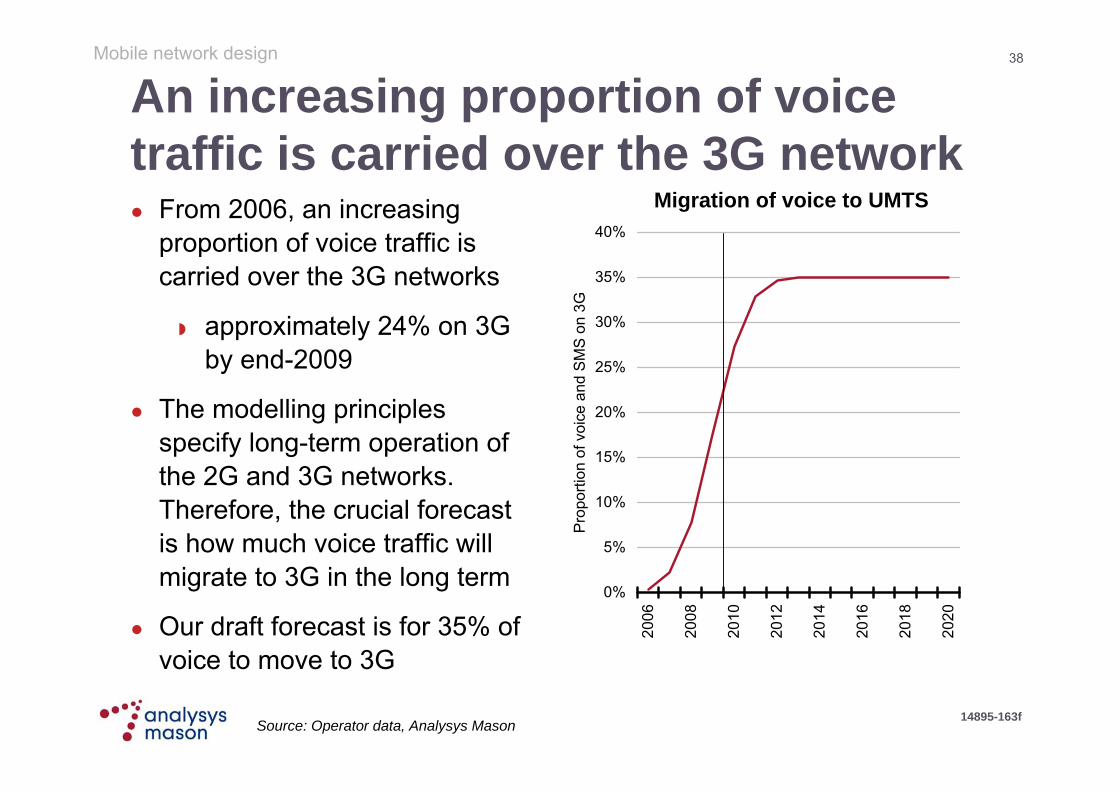
An increasing proportion of voice traffic is carried over the 3G network From 2006, an increasing
proportion of voice traffic is carried over the 3G networks
approximately 24% on 3G by end-2009
The modelling principles specify long-term operation of the 2G and 3G networks. Therefore, the crucial forecast is how much voice traffic will migrate to 3G in the long term
Our draft forecast is for 35% of voice to move to 3G
Migration of voice to UMTS
0%
5%
10%
15%
20%
25%
30%
35%
40%
2006
2008
2010
2012
2014
2016
2018
2020
Pro
porti
on o
f voi
ce a
nd S
MS
on
3G
Mobile network design
Source: Operator data, Analysys Mason

39
14895-163f
The effect of this 35% migration rate is to maintain GSM utilisation The GSM network is operated
in the long term and carries approximately 60 000 Erlangs of traffic over time
The UMTS network is overlaid onto the GSM network from 2004 onwards, and carries:
up to 30 000 voice Erlangs
the majority of low-speed mobile data traffic
all HSPA mobile broadband data traffic
Voice in the 2G and 3G networks
Mobile network design
0
20,000
40,000
60,000
80,000
100,000
120,000
2004
2006
2008
2010
2012
2014
2016
2018
2020
2G BHE 3G BHE
Source: Final model

40
14895-163f
Radio network coverage profiles are applied in the model The modelled operator has
99.1% GSM population indoor coveragein 2006
this coverage is providedin the 900MHz band; 1800MHz spectrum is only used for capacity upgrades
UMTS coverage increases from 52% at mid-year 2006to 90% population in the long term
Population coverage
Mobile network design
Source: Operator data, Analysys Mason
0%
20%
40%
60%
80%
100%
2006 2007 2008 2009 2010 2011 2012
Pop
ulat
ion
cove
rage
GSM UMTS
41
14895-163f
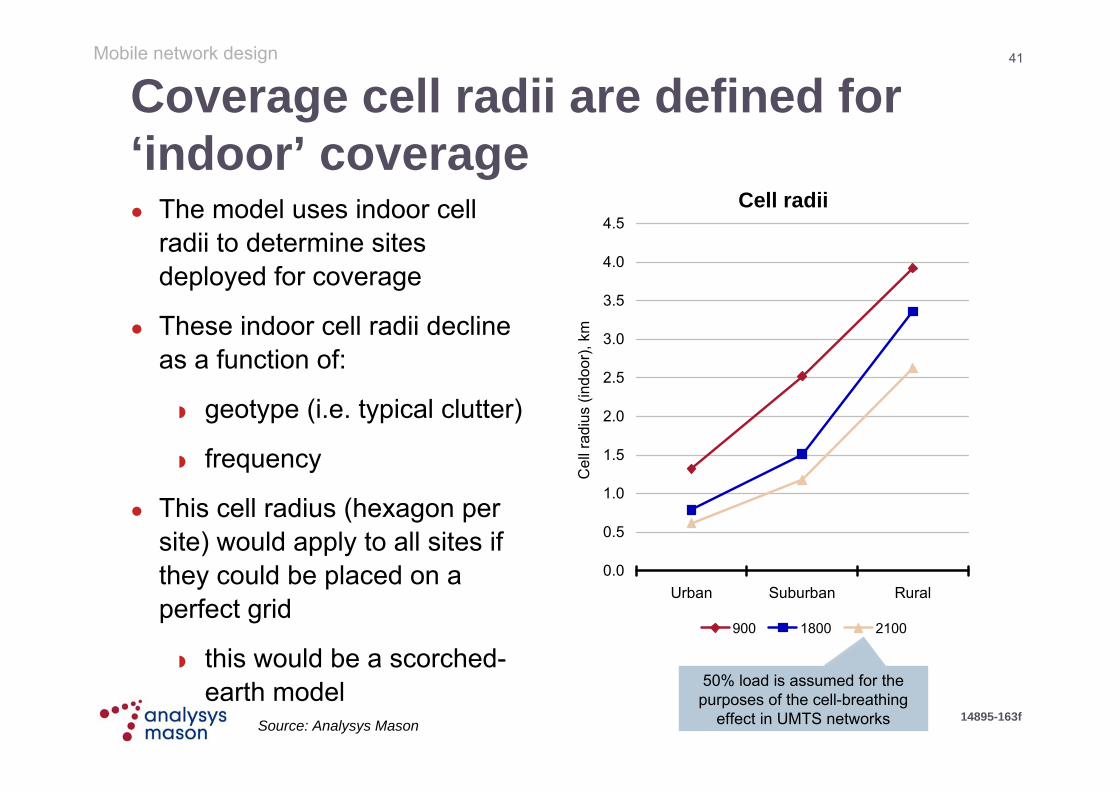
Coverage cell radii are defined for ‘indoor’ coverage The model uses indoor cell
radii to determine sites deployed for coverage
These indoor cell radii decline as a function of:
geotype (i.e. typical clutter)
frequency
This cell radius (hexagon per site) would apply to all sites if they could be placed on a perfect grid
this would be a scorched-earth model
Cell radii
50% load is assumed for the purposes of the cell-breathing
effect in UMTS networks
Mobile network design
Source: Analysys Mason
0.0
0.5
1.0
1.5
2.0
2.5
3.0
3.5
4.0
4.5
Urban Suburban RuralC
ell r
adiu
s (in
door
), km
900 1800 2100

42
14895-163f
However, we reflect scorched-node constraints in the radio deployment It is not possible to obtain perfect site locations
existing rooftops and towers cannot be moved
masts are placed in the corners of fields (e.g. for effective vehicular access) rather than in the optimal mid-point
The model reflects this with an explicit input
The 900MHz input is the most important; 1800MHz is not used for coverage; 2100MHz is an overlay network and does not need to fill every gap of coverage
The SNOCC is lowest in urban areas
Mobile network design
Source: Analysys Mason

43
14895-163f
Illustration of the SNOCC in real mobile networks
Optimal locations of 7 BTSs
Sub-optimal locations of 8 BTSs occurring in reality
Theoretical (clutter) radius Effective radius
Mobile network design
Scorched earth Scorched node

44
14895-163f
We estimate the traffic distribution and other parameters by geotype
Analysys Mason estimate
100%
100%
15%
Sites connected to regional
rings
Analysys Mason using Antenne
Bureau data
40%
40%
10%
Sites deployed
on own towers
HSPA activation dates
Analysys Mason
using operator
data
Analysys Mason
using operator
data
Analysys Mason
using operator
data
Analysys Mason using Antenne
Bureau data
Analysys Mason
estimate
ZIP dataSource:
2011
2010
2009
7.2 Mbit/s
and HSUPA
2009
2009
2008
3.6 Mbit/s
2008
2008
2007
1.8 Mbit/s
20%
20%
20%
3G NodeBdeployed
on 3G-only sites
17.632.0Rural
50.651.1Suburban
31.817.0Urban
Traffic %
Pop %
Mobile network design
Other sites are deployed on another operator’s tower, or on
the roof of a third-party’s building
45
14895-163f
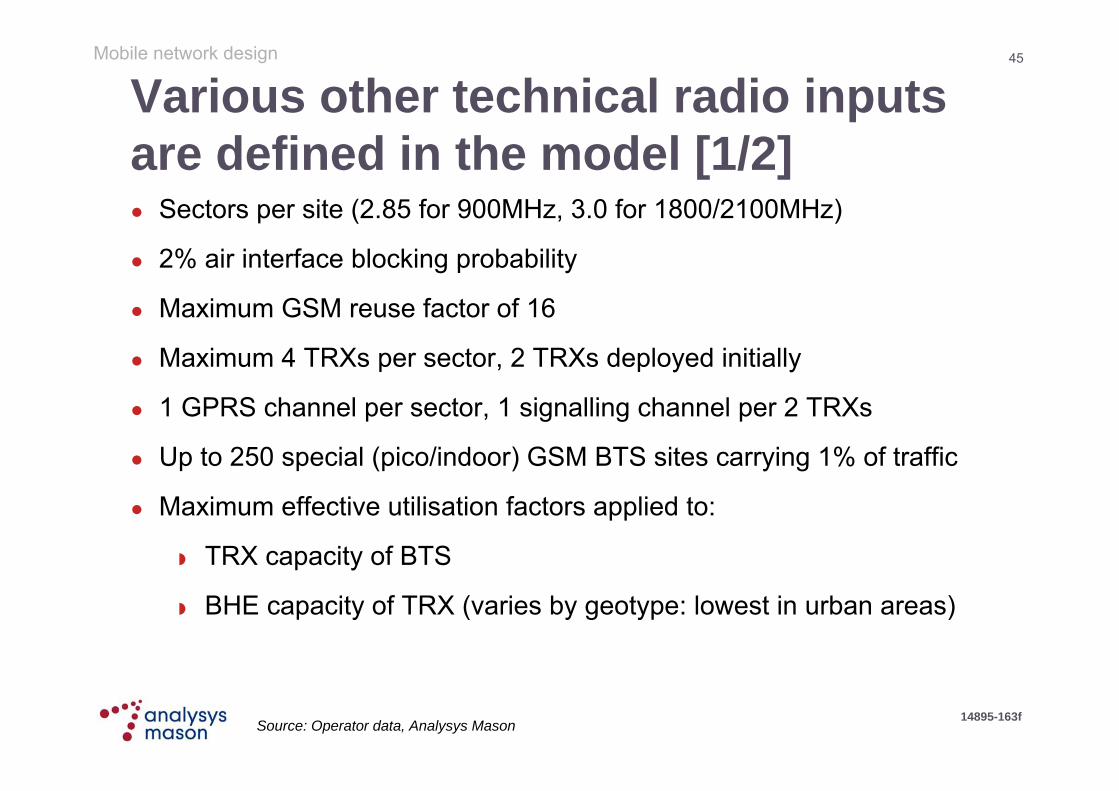
Various other technical radio inputs are defined in the model [1/2] Sectors per site (2.85 for 900MHz, 3.0 for 1800/2100MHz)
2% air interface blocking probability
Maximum GSM reuse factor of 16
Maximum 4 TRXs per sector, 2 TRXs deployed initially
1 GPRS channel per sector, 1 signalling channel per 2 TRXs
Up to 250 special (pico/indoor) GSM BTS sites carrying 1% of traffic
Maximum effective utilisation factors applied to:
TRX capacity of BTS
BHE capacity of TRX (varies by geotype: lowest in urban areas)
Mobile network design
Source: Operator data, Analysys Mason
46
14895-163f
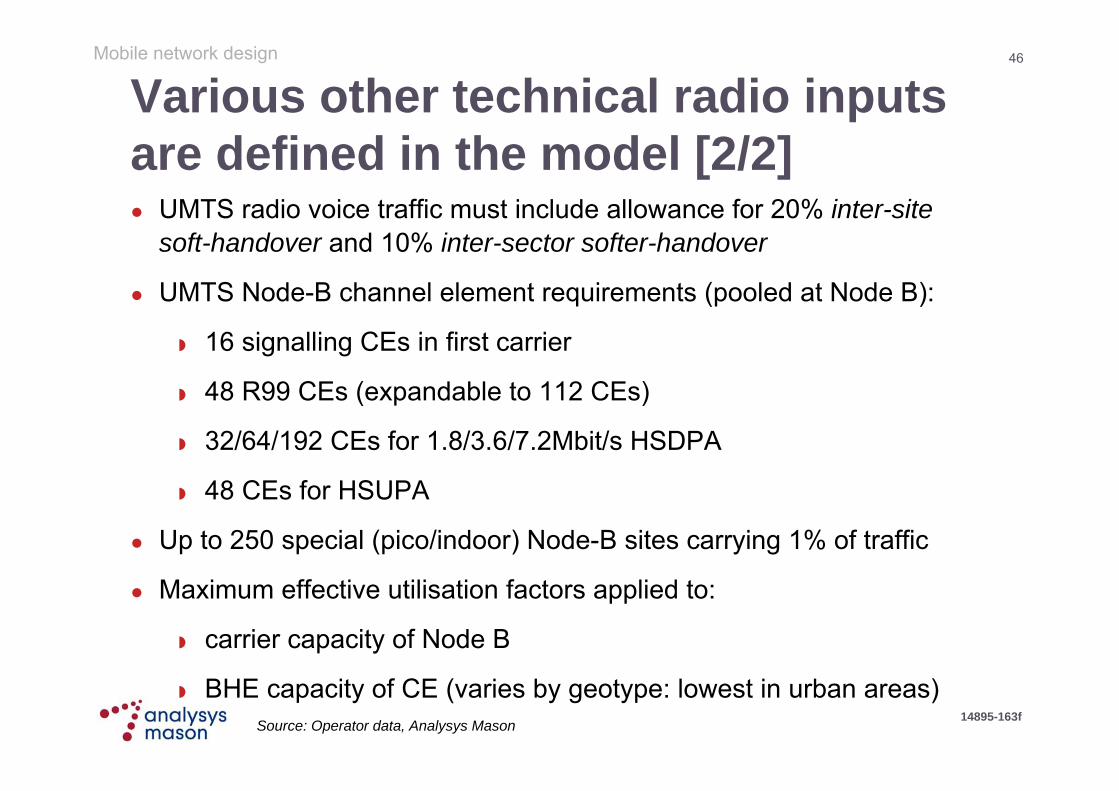
Various other technical radio inputs are defined in the model [2/2] UMTS radio voice traffic must include allowance for 20% inter-site
soft-handover and 10% inter-sector softer-handover
UMTS Node-B channel element requirements (pooled at Node B):
16 signalling CEs in first carrier
48 R99 CEs (expandable to 112 CEs)
32/64/192 CEs for 1.8/3.6/7.2Mbit/s HSDPA
48 CEs for HSUPA
Up to 250 special (pico/indoor) Node-B sites carrying 1% of traffic
Maximum effective utilisation factors applied to:
carrier capacity of Node B
BHE capacity of CE (varies by geotype: lowest in urban areas)
Mobile network design
Source: Operator data, Analysys Mason
47
14895-163f
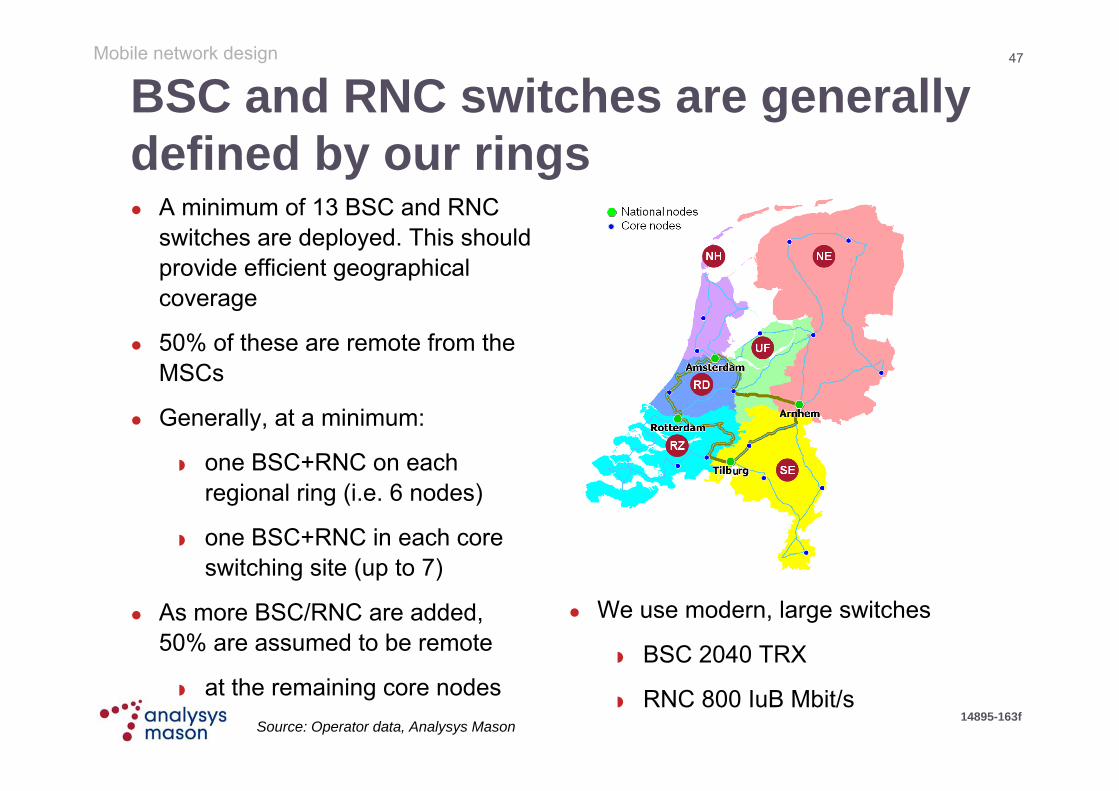
BSC and RNC switches are generally defined by our rings A minimum of 13 BSC and RNC
switches are deployed. This should provide efficient geographical coverage
50% of these are remote from the MSCs
Generally, at a minimum:
one BSC+RNC on each regional ring (i.e. 6 nodes)
one BSC+RNC in each core switching site (up to 7)
As more BSC/RNC are added, 50% are assumed to be remote
at the remaining core nodes
We use modern, large switches
BSC 2040 TRX
RNC 800 IuB Mbit/s
Mobile network design
Source: Operator data, Analysys Mason

48
14895-163f
For the mobile core and transmission, there are three options
(b)Upgraded switching
(a) Separate switching
(c) Combined IP switching
2G/ 3G
MSC
2G/ 3G
MSCBSC
/ RNCBSC
/ RNC
GSNs
Internet
BSCs RNCs
2G GSNs
3G GSNs
PoI
MGW MGW
MSSMSS
BSC/ RNC
BSC/ RNC
Data routers and GSNs
Internet
PoIPoI
3G MSC
2G MSC
2G radio layer
3G radio layer
2G radio layer
3G radio layer
2G radio layer
3G radio layer
Internet
leased lines
self-provided microwave links
leased fibre network
Transmission options
Mobile network design

49
14895-163f
Given our 2004 combined 2G+3G launch, we model options b and c It does not seem efficient to
model all three switching options for an operator starting in 2004
separate 2G and 3G switching layers (Option a) would appear reasonable for an actual operator, but not one deploying as-new in 2004
Migration to layered MSS+MGW switches (Option c) is applied in 2009 and 2010
Option cOption b
MSS +50%
Other rules
322Minimum number
16STM1 ports
MGW
600E1 ports
600 000450 000Busy hour call attempts
11 000Busy hour Erlangs
MSSMSCMeasure
Switch capacity inputs
Mobile network design
Source: Operator data, Analysys Mason

50
14895-163f
The draft model uses dark fibre, microwaves and some leased lines We recognise that operators
make individual choices on network transmission
We use leased dark fibre for:
437km inter-MSC ring
2003km in 6 regional rings
For last-mile access (LMA) to urban and suburban sites
67% microwave (16E1)
2% co-located at switch or fibre access point
6–11% fibre link
20–25% leased E1s
suburban sites are connected to regional rings
For LMA to rural sites
100% microwave, connected to regional rings
Mobile network design
Source: Operator data, Analysys Mason

51
14895-163f
Transmission is dimensioned to carry various traffic types Backhaul: 120 circuits per E1, plus HSDPA throughput
Regional rings: Backhaul access from sites access points and on to nearest switch, backhaul of remote BSC and remote RNC traffic back to main switch sites
National ring: inter-switch voice traffic, VMS traffic, data traffic to the Internet
Migration from STM to IP transmission modelled for 2010–11
Transmission dimensioned for STM (1, 4, 16, 64, 264) and 1G, 10G
2Gbit/sSTM16STM4Regional
20Gbit/s2STM64STM64Core
In 2011 on IPIn 2009On launchRings
Mobile network design
Source: Final model

52
14895-163f
Switches are located in up to seven main switching sites Seven main cities on the core ring function as switching nodes
containing MSCs (or MSS/MGW)
Four sites have gateway interconnection facilities
VMS are hosted on two sites
SGSN and GGSN are located in some of the buildings, but all datatraffic is carried back on the core ring to the Amsterdam Internet exchange
Not all voice traffic needs to be carried inter-switch:
Analysys Mason estimateAverage of operator dataSource:
36%42%13%59%Inter-switch proportion
InternationalOn-netOutgoingIncoming
Mobile network design
53
14895-163f
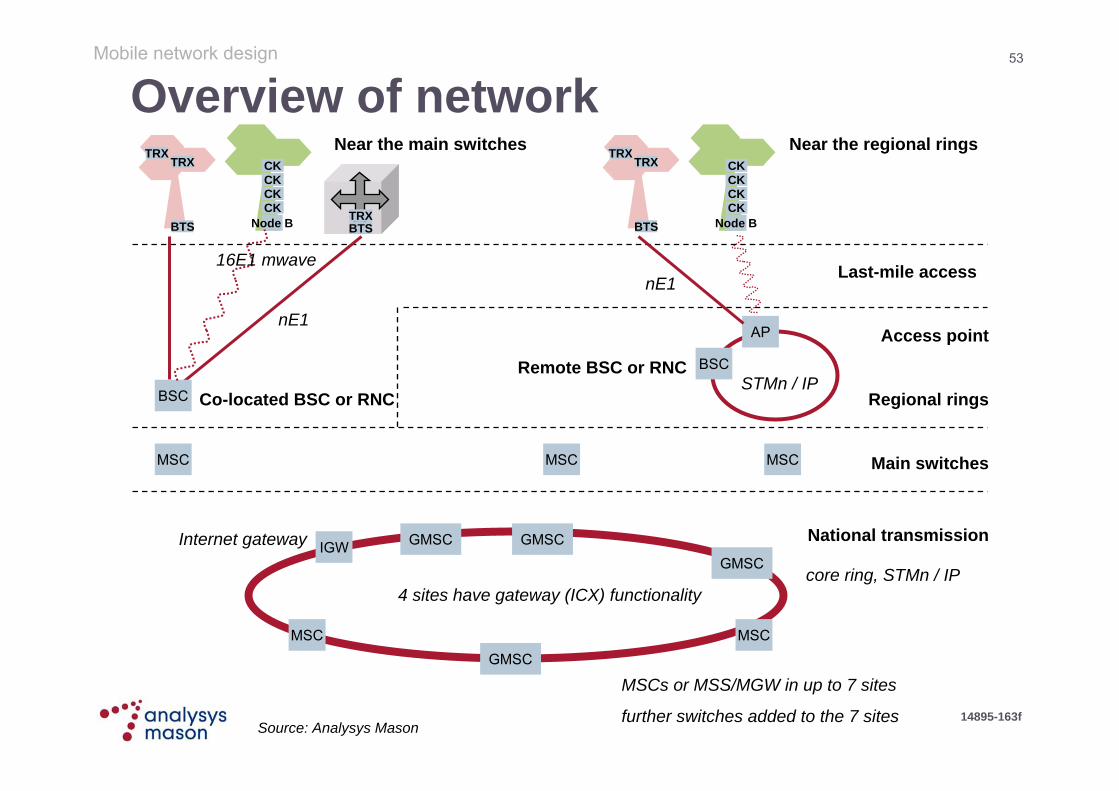
Overview of network TRX
TRX
BTS
CKCK
CKCK
Node B BTSTRX
Near the main switches
Last-mile access
Access pointAP
Regional rings
BSCRemote BSC or RNC
Near the regional ringsTRXTRX
BTS
CKCK
CKCK
Node B
BSC Co-located BSC or RNC
nE1
nE1
STMn / IP
MSCMSC MSC Main switches
National transmissionGMSC
MSC MSC
core ring, STMn / IP
Source: Analysys Mason
16E1 mwave
MSCs or MSS/MGW in up to 7 sites
further switches added to the 7 sites
IGWInternet gateway
GMSC
GMSCGMSC
4 sites have gateway (ICX) functionality
Mobile network design

54
14895-163f
Other network elements are modelled using simple drivers
5 million subscribers, minimum 2HLR, EIR, AUC
5 million subscribers, minimum 2VMS
1 million SAU (calculated from a proportion of the subscriber base)SGSN
1 million PDP contexts GGSN
1NMS
12 million CDRs per dayWholesale billing
500 000 subscribersVAS, IN
1MMSC
400 busy-hour SMS/s, minimum 2SMSC SW
1000 busy-hour SMS/s, minimum 2SMSC HW
Deployment ruleItem
Mobile network design
Source: Operator data, Analysys Mason

55
14895-163f
Business overheads are modelled using annual opex inputs The annual opex for the network share of business
overheads is estimated to be EUR30 million based on operator data
from this, we isolate the Interconnection team (4 FTE), a cost of EUR0.5 million
– since these costs are separately accounted for in the interconnection establishment costing module, they should not be double counted
This input is identical in the fixed and mobile operator models
Mobile network design
Source: Operator data, Analysys Mason

56
14895-163f
So what does the 33.3% operator network look like in mid-2009?
Mobile network design
565Fibre backhaul links
7883G sites / HSDPA7.2
3480GSM BTS
329Indoor sites
3854suburban/rural
788urban
24 645TRX
3463Node B
168 576R99 channels
03G sites / HSDPA1.8
27243G sites / HSDPA3.6
2496E1 backhaul links
10 641Microwave E1s
4609Microwave backhaul links
4642Total macro sites
DeploymentElement
136Regional rings: STM16 Aps
2003kmRegional rings: dark fibre
2SMSC
3HLR
11MSC
13RNC
3GGSN
4SGSN
18IN
1NMS
2Billing system
437kmRegional rings: dark fibre
14Regional rings: STM64 Aps
25BSC
DeploymentElement
Source: Final model

57
14895-163f
The model includes a schedule of equipment capex and opex [1/2]
10%3%30 000HSPA to 7.2Mbit/s+HSUPA
U 15 000 SR 5 000U 60 000 SR 40 00010 000Third party macro site (U,S,R)
10% 3%32 000BTS
10% 3%1700TRX
10% 3%22 700Node B + 1 Carrier
10% 3%1 60016 CE kit
U 4100 to R 49003%5000Backhaul leased line
2% 3%15 000Microwave
10% 3%1 600 000BSC 2040
10% 3%2 000 000RNC 800IuB
50 0002 000 000Remote BSC site
U 20 000 SR 10 000U 75 000 SR 55 00030 000Own macro site (U,S,R)
O&M opex
Direct opex(leases, rents)
Installation and commissioning capex
Direct capex (purchase, acquisition)
Item / Cost in EUR
USR = urban, suburban, ruralO&M = operations and maintenance
Mobile network design
Various other network elements not listed here
Source: Operator data, Analysys Mason

58
14895-163f
The model includes a schedule of equipment capex and opex [2/2]
20002533Dark fibre pair rental (per km)
1SIM card
10%3%2 700 000SGSN
10%3%2 400 000GGSN
20%3%1 200 000MSC HW
3%1 400 000MSC SW
20%3%2 000 000MSS HW
3%1 500 000MSS SW
20%3%1 460 000MGW
10%3%1 000 000 to 4 500 000
Other large switches
10%3%11 000 000Network Management System
200 0003 000 000Main switching site
O&M opex
Direct opex(leases, rents)
I&C capexDirect capex (purchase, acquisition)
Item / Cost in EUR
Mobile network design
Various other network elements not listed here
Source: Operator data, Analysys Mason

59
14895-163f
Equipment cost trends are estimated and applied over time Capital equipment cost trends have been estimated using:
operator input
comparison of operator unit costs with 2006 BULRIC model
Analysys Mason estimates
Opex cost trends are assumed to be zero in real terms
Mobile network design
Source: OPTA, Operator data, Analysys Mason
60
14895-163f
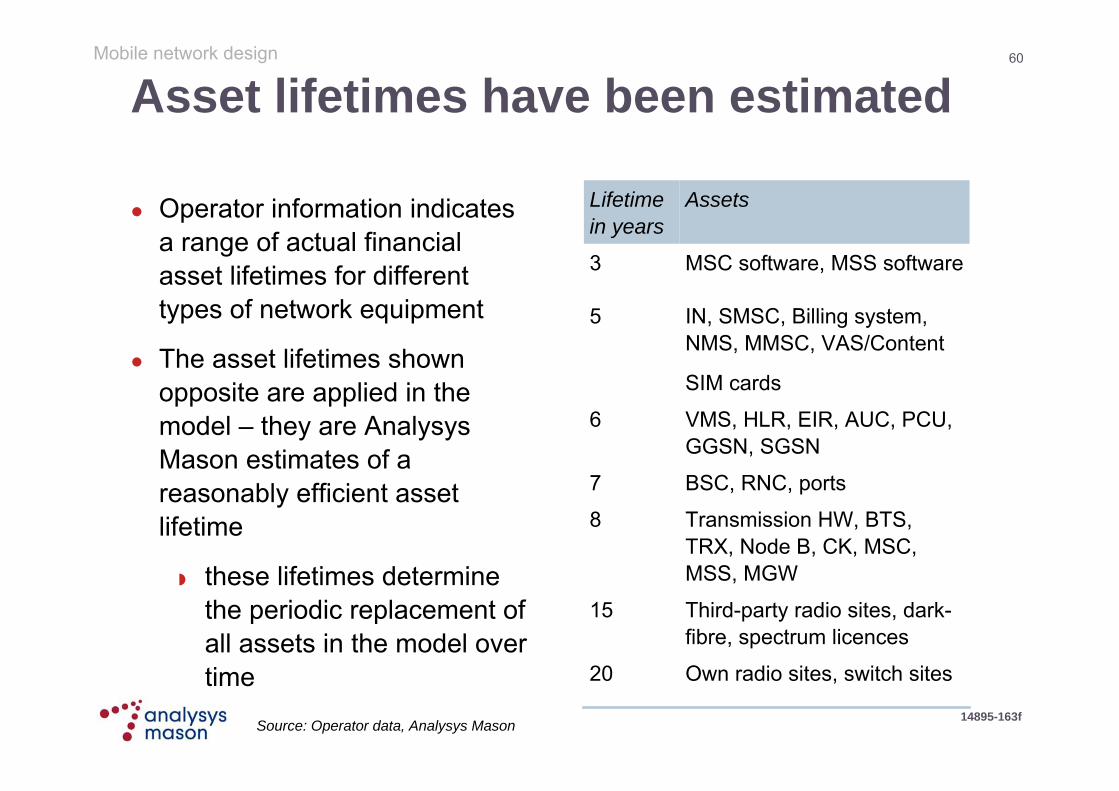
Asset lifetimes have been estimated
Operator information indicates a range of actual financial asset lifetimes for different types of network equipment
The asset lifetimes shown opposite are applied in the model – they are Analysys Mason estimates of a reasonably efficient asset lifetime
these lifetimes determine the periodic replacement of all assets in the model over time Own radio sites, switch sites20
Transmission HW, BTS, TRX, Node B, CK, MSC, MSS, MGW
8
BSC, RNC, ports7
VMS, HLR, EIR, AUC, PCU, GGSN, SGSN
6
Third-party radio sites, dark-fibre, spectrum licences
15
IN, SMSC, Billing system, NMS, MMSC, VAS/Content
SIM cards
5
MSC software, MSS software3
AssetsLifetime in years
Mobile network design
Source: Operator data, Analysys Mason
61
14895-163f
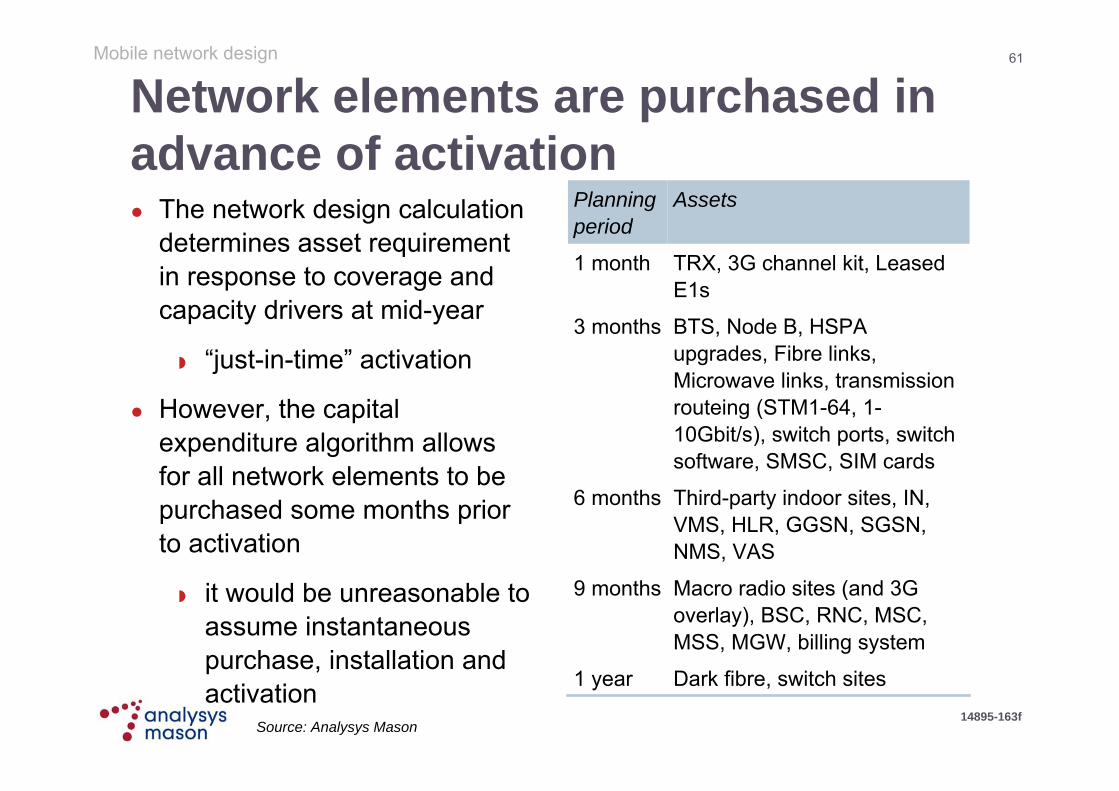
Network elements are purchased in advance of activation
Dark fibre, switch sites1 year
Macro radio sites (and 3G overlay), BSC, RNC, MSC, MSS, MGW, billing system
9 months
Third-party indoor sites, IN, VMS, HLR, GGSN, SGSN, NMS, VAS
6 months
BTS, Node B, HSPA upgrades, Fibre links, Microwave links, transmission routeing (STM1-64, 1-10Gbit/s), switch ports, switch software, SMSC, SIM cards
3 months
TRX, 3G channel kit, Leased E1s
1 month
AssetsPlanning period
Mobile network design
The network design calculation determines asset requirement in response to coverage and capacity drivers at mid-year
“just-in-time” activation
However, the capital expenditure algorithm allows for all network elements to be purchased some months prior to activation
it would be unreasonable to assume instantaneous purchase, installation and activation
Source: Analysys Mason

62
14895-163f
0
500
1,000
1,500
2,000
2,500
2004 2005 2006 2007 2008 2009
Cum
ulat
ive
cape
x (re
al E
UR
, milli
ons)
Wholesale billing system
Network Management Centre
Interconnection
GGSN / SGSN and other GPRS core networks infrastructure
SMSC, MMSC
IN and VAS
VMS
HLR
Backbone links
3G MSC
MSC and VLR
RNC
GPRS radio / PCU
Base station controllers
Backhaul links
3G Base station equipment
2G Base station equipment
Site acquisition, preparation and maintenance
SIM
3G Licences
2G Licences
Capital investment of EUR2 billion to 2009 for the 33.3% operator
Mobile network design
EUR422 million
EUR114 million
EUR592 million
EUR871 million
Source: Final model
63
14895-163f
0
20
40
60
80
100
120
140
160
2009
Ope
ratin
g ex
pend
iture
s (re
al 2
009
EU
R, m
illion
s)
Overheads
Wholesale billing system
Network Management Centre
Interconnection
GGSN / SGSN and other GPRScore networks infrastructureSMSC, MMSC
IN and VAS
VMS
HLR
Backbone links
3G MSC
MSC and VLR
RNC
GPRS radio / PCU
Base station controllers
Backhaul links
3G Base station equipment
2G Base station equipment
Site acquisition, preparation andmaintenance
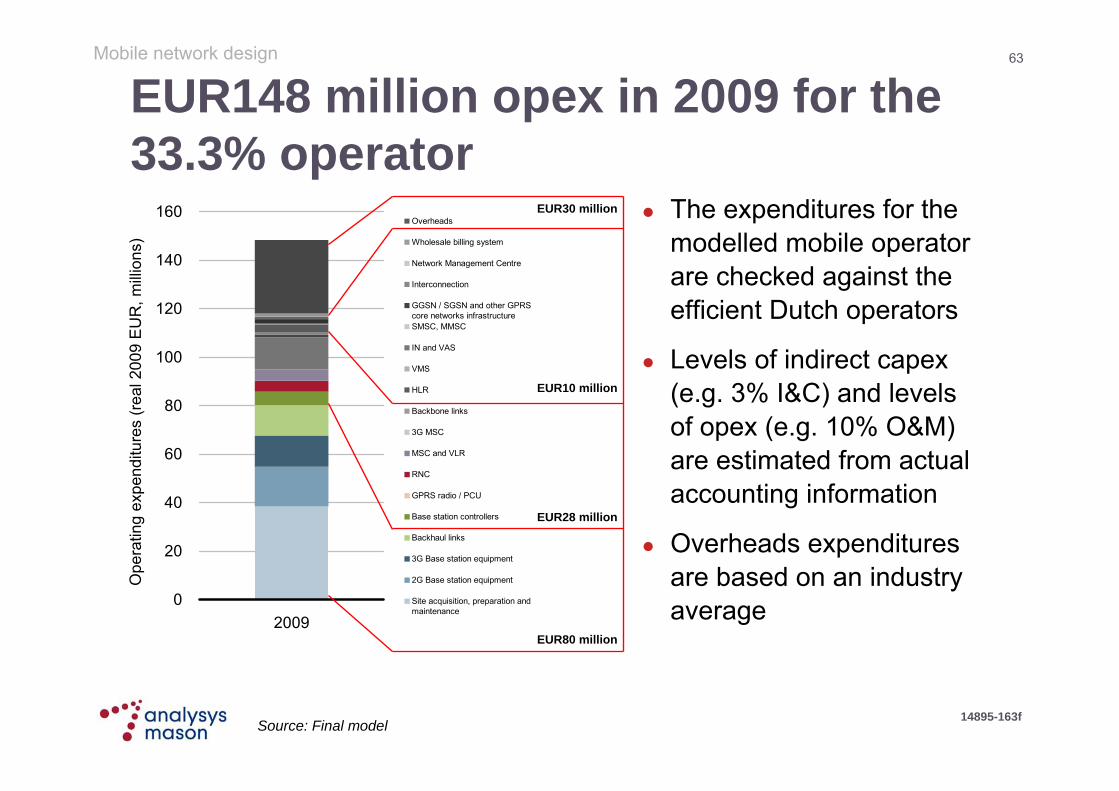
EUR148 million opex in 2009 for the 33.3% operator
The expenditures for the modelled mobile operator are checked against the efficient Dutch operators
Levels of indirect capex (e.g. 3% I&C) and levels of opex (e.g. 10% O&M) are estimated from actual accounting information
Overheads expenditures are based on an industry average
Mobile network design
EUR30 million
EUR10 million
EUR28 million
EUR80 million
Source: Final model

64
14895-163f
These network expenditures feed into the service costing module
Marketmodule
Mobile/fixed module Service costing module
Market volumes
Network costs
Route sharing analysis
Unit costs
Incremental costing and
routeing factors
network asset dimensioning
Network expenditures
Service unit costs
KEY Input ‘Active’ calculation Result
Depreciation
Network assumptions
Network geodata
‘Offline’ calculation
Inter-connection module
Operator volumes
Market share
Calculations
Mobile network design
65
14895-163f
Contents
Introduction
Market module
Mobile network design
Fixed network design
Service costing results
66
14895-163f
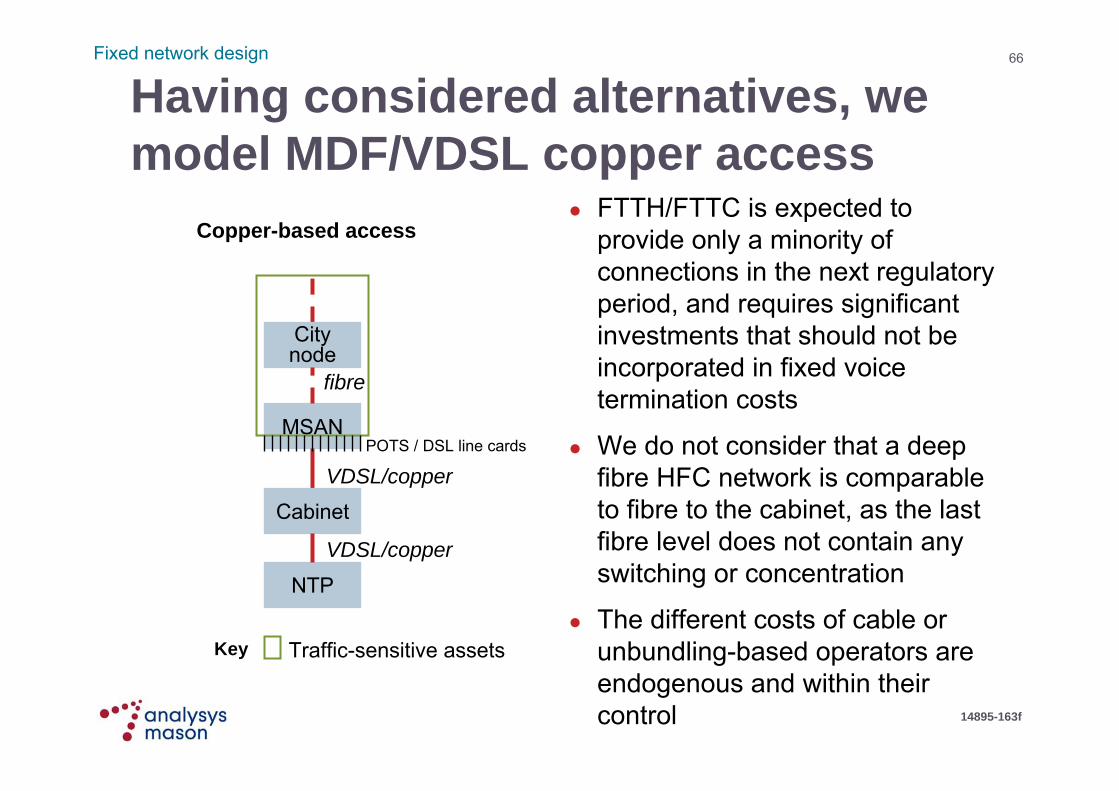
Having considered alternatives, we model MDF/VDSL copper access
FTTH/FTTC is expected to provide only a minority of connections in the next regulatory period, and requires significant investments that should not be incorporated in fixed voice termination costs
We do not consider that a deep fibre HFC network is comparable to fibre to the cabinet, as the last fibre level does not contain any switching or concentration
The different costs of cable or unbundling-based operators are endogenous and within their control
Copper-based access
City node
MSAN
Cabinet
NTP
fibre
VDSL/copper
VDSL/copper
Traffic-sensitive assetsKey
Fixed network design
POTS / DSL line cards

67
14895-163f
The fixed NGN core network is IP BAP-based The EC Recommendation
states that “the core part could in principle be NGN-based”
The choice for VDSL-based access limits the options for the core network architecture to
NGN access gateways (AGWs)
NGN 3G digital loop carriers (DLC)
NGN IP/Ethernet broadband access platforms (IP BAP)
There is general acceptance of an IP-BAP NGN architecture, using an all IP/Ethernet core
We have included E1 interconnection links, as it is relevant for the next regulatory period
Session control and other platforms required to deliver the services have been incorporated
A reasonable level of redundancy is incorporated in the network design algorithms
Fixed network design
68
14895-163f
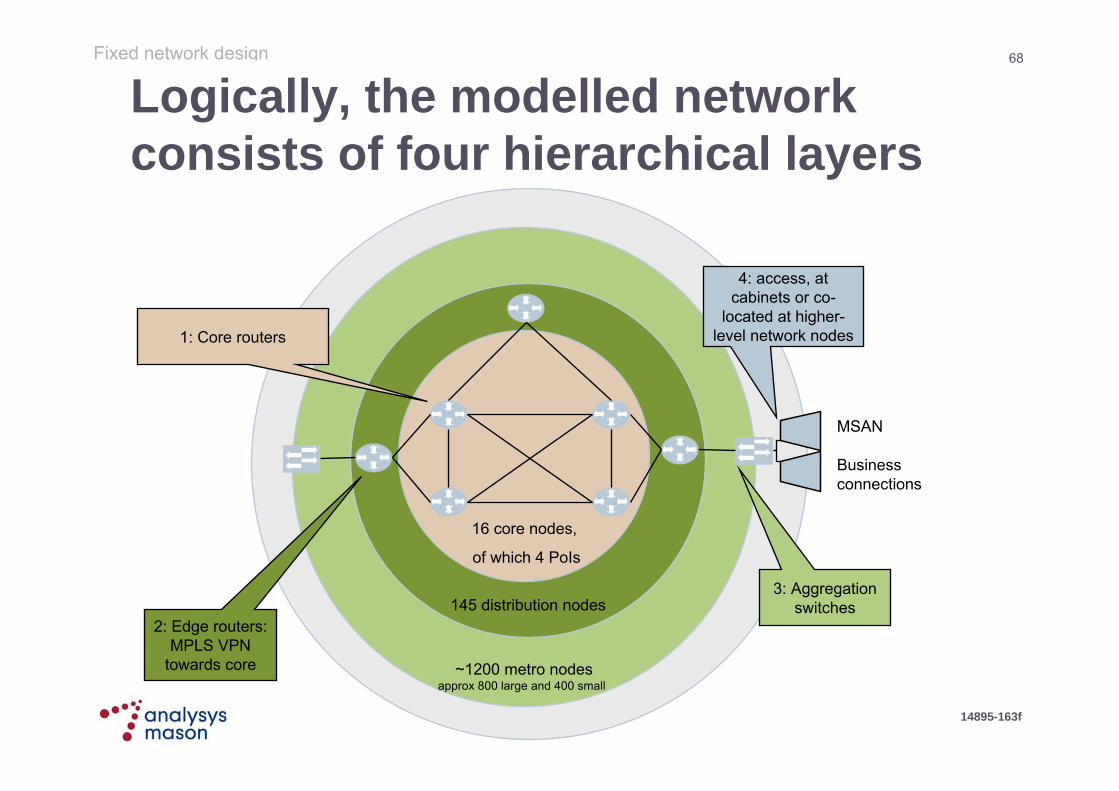
~1200 metro nodes
Fixed network design
~1200 metro nodes
145 distribution nodes
16 core nodes,
of which 4 PoIs
1: Core routers
2: Edge routers: MPLS VPN
towards core
MSAN
Business connections
3: Aggregation switches
4: access, at cabinets or co-
located at higher-level network nodes
approx 800 large and 400 small
Logically, the modelled network consists of four hierarchical layers

69
14895-163f
These four layers are mapped onto five different types of physical building
vAggregation
switch
TV / VoD
a: Small metro nodes (~400)
b: Large metro nodes (~800)
c: Distribution nodes
MSAN
ADM TERM
edge routers
core routers
MSAN
Aggregation switch
switch
d: Core nodes
Routing
Switching
Trans-mission
Internet
ADM TERM
SBC SBC
1/10GE CWDM 1/10GE CWDM
Other core routers
N x λ DWDM @ 10G
Services
Call servers
MSAN
Cabinets
Resilient links, to two core locations
TERM
TGW
Other
Operators
Aggregation switch
edge routers
MSAN MSAN
e: Additional platforms at national core nodes
Out of scope
Fixed network design
ADM = Add-drop multiplexerTERM = Terminal multiplexer

70
14895-163f
A modified scorched-node approach is used
We have defined:
4 national nodes, which will correspond to the national nodes in the mobile model
12 core nodes – based on population density (per ZIP4 region) and operator information
In addition, we have identified the following nodes based on the KPN MDFs
145 distribution nodes
~1200 metro nodes
National nodesCore nodesDistribution/Metro nodes
Fixed network design
Source: Analysys Mason geoanalysis

71
14895-163f
Rings are deployed to connect the national, core and distribution nodes
Six national rings (level-1 rings) connect the national/core nodes
Thirteen regional rings (level-2 rings) connect the remaining distribution nodes back to the national rings
Each regional rings passes through at least one national/core node
Of the 145 distribution nodes, 92 sit on the regional rings, 53 on the national rings
National nodesCore nodes
Fixed network design
Source: Analysys Mason geoanalysis
72
14895-163f
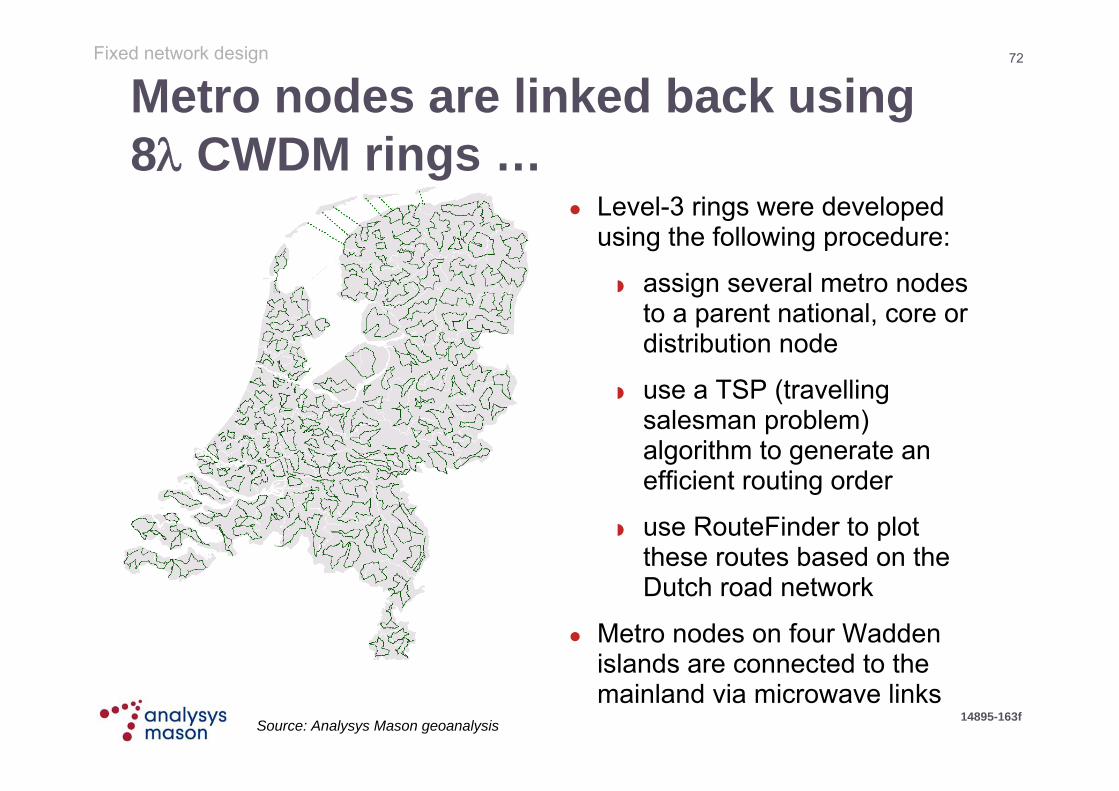
Metro nodes are linked back using 8 CWDM rings …
Level-3 rings were developed using the following procedure:
assign several metro nodes to a parent national, core or distribution node
use a TSP (travelling salesman problem) algorithm to generate an efficient routing order
use RouteFinder to plot these routes based on the Dutch road network
Metro nodes on four Waddenislands are connected to the mainland via microwave links
Fixed network design
Source: Analysys Mason geoanalysis

73
14895-163f
… taking into account a maximum number of nodes per ring
Using an 8-wavelength CWDM system, a maximum of 8 active nodes per ring are connected
In the cases where the number of nodes exceeds 8, an additional fibre pair is installed such that every odd node connects to one fibre pair and every even node connects to the other fibre pair
For regeneration, we consider rings in categories of:
up to 50km 50–100km 100–150km
to determine the number of regeneration points required
8-node ring 16-node ring
a1`
a2
a3
a4 a5
a6
a7
a8DN
a1
a2
a3
a4 a5
a6
a7
a8b1
b2
b3
b4b5
b6
b7
b8DN
DN
a1b1
Distribution node
Metro node on “a” ringMetro node on “b” ring
Fixed network design
Source: Analysys Mason geoanalysisNote: one ring in the figure represents a fibre pair
74
14895-163f
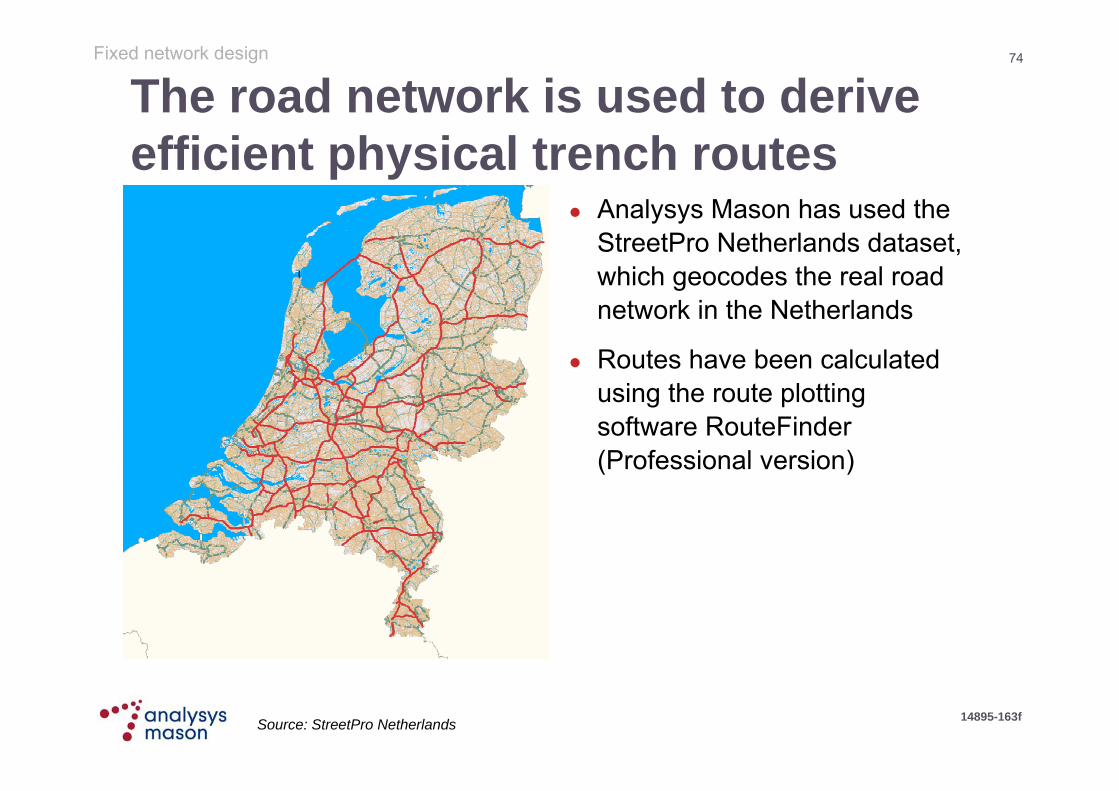
The road network is used to derive efficient physical trench routes
Analysys Mason has used the StreetPro Netherlands dataset, which geocodes the real road network in the Netherlands
Routes have been calculated using the route plotting software RouteFinder (Professional version)
Fixed network design
Source: StreetPro Netherlands
75
14895-163f
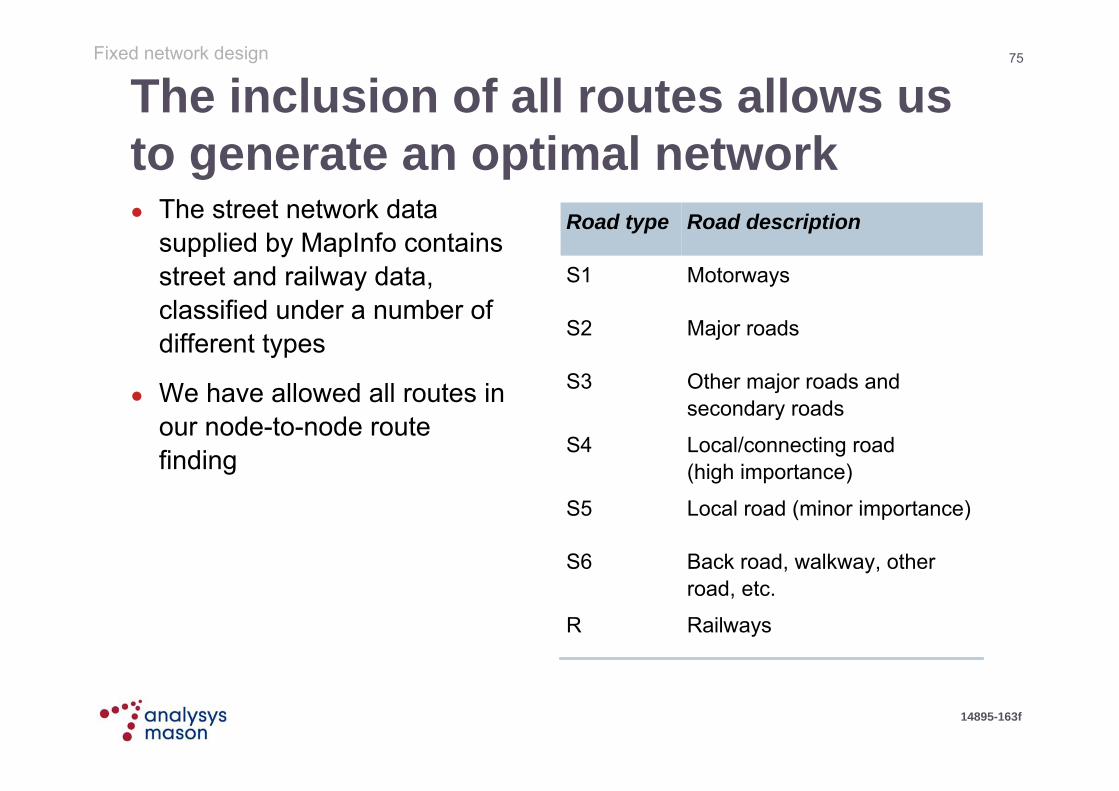
The inclusion of all routes allows us to generate an optimal network The street network data
supplied by MapInfo contains street and railway data, classified under a number of different types
We have allowed all routes in our node-to-node route finding
Major roadsS2
Other major roads and secondary roads
S3
Local/connecting road(high importance)
S4
Local road (minor importance)S5
RailwaysR
Back road, walkway, other road, etc.
S6
MotorwaysS1
Road descriptionRoad type
Fixed network design

76
14895-163f
We have then performed a route overlap analysis …
Dedicated cable length
Trench length (allow intra-level sharing)
Trench length (allow inter-level sharing)
Snap
Buffer
Erase
8a+4b+4c
7a+4b+4c
7a+3b+2c
-a
- (b+2c)
Fixed network design
Source: Analysys Mason geoanalysis
Level 1 Level 1
Level 2Level 3
Inter-level trench sharing
Intra-level trench sharing
a
b
c

77
14895-163f
… to estimate the amount of intra- and inter-level trench sharing achievable
27%1234 12%1688 1891 Level 2
3%8252 8%8510 9152 Level 3
23%1234 12%1599 1811Level 1
% inter-level sharing
Trench length -allow inter-level sharing (km)
% intra-level sharing
Trench length -allow intra-level sharing (km)
Dedicated ring length (km)
Ring system
Fixed network design
Source: Analysys Mason geoanalysis

78
14895-163f
Reasonable redundancy is present in the transmission design Every metro node sits on a ring connecting back to its
parent distribution node A distribution node is parented to a core router, diverse
transmission paths present a fall back Core routers are logically full meshed
there is a single router at each core node with an assumed diverse entry path into the switch building
the network design deploys a single trench per route Capacity utilisation parameters set to 40% to allow for
redundancy in ports/cards/transmission 40% at transmission to allow for alternative transmission
paths 40% at switching/routers level, for alternative routing
Fixed network design
79
14895-163f
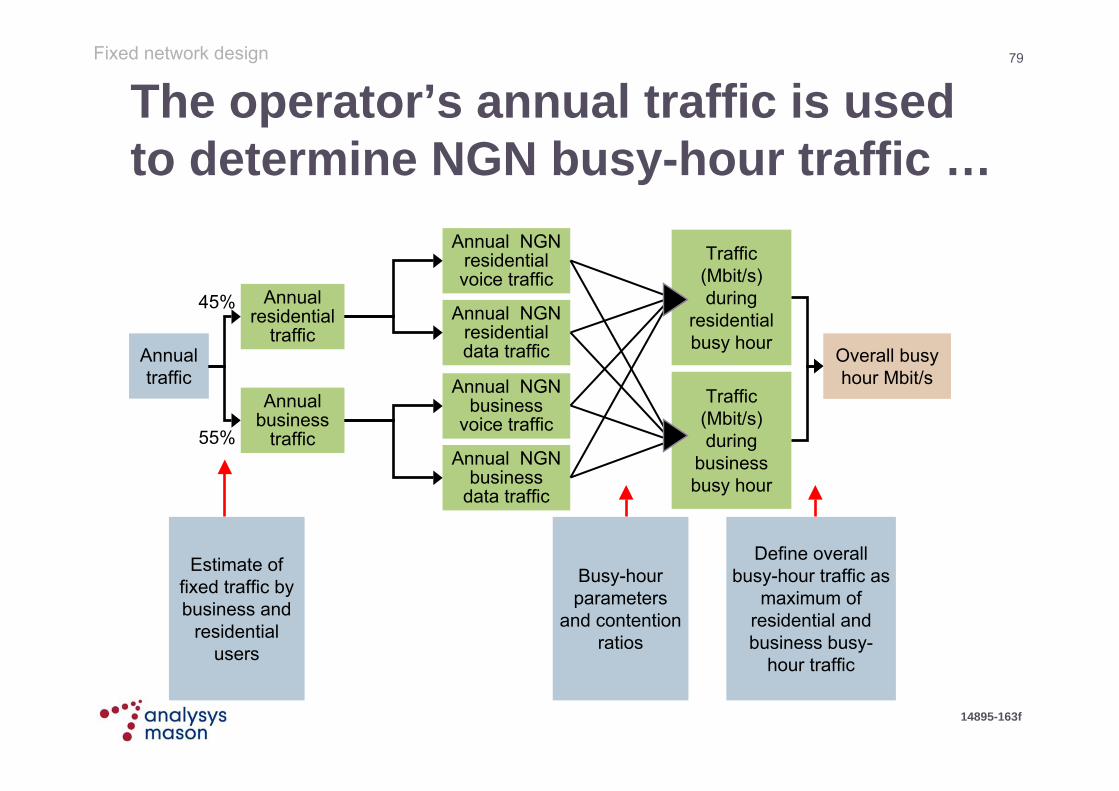
The operator’s annual traffic is used to determine NGN busy-hour traffic …
Annual traffic
Busy-hour parameters
and contention ratios
Overall busy hour Mbit/s
Annual business
traffic
Annual residential
traffic
45%
55%
Annual NGN residential voice traffic
Annual NGN residential data traffic
Annual NGN business
voice traffic
Annual NGN business
data traffic
Traffic (Mbit/s) during
residential busy hour
Traffic (Mbit/s) during
business busy hour
Define overall busy-hour traffic as
maximum of residential and business busy-
hour traffic
Fixed network design
Estimate of fixed traffic by business and
residential users

80
14895-163f
… because business and residential load is not very coincident
Fixed network design
Hour of day Day of week
Residential Business
Hourly traffic Daily traffic

81
14895-163f
A number of parameters are used in this busy-hour calculation [1/2]
Weekday proportion: 70% Traffic in residential busy hour
(8pm) voice: 12% data/VoD: 12%
Traffic at business busy hour (11am) voice: 6% data/VoD: 6%
Weekday proportion: 95% Traffic in residential busy hour
(8pm) voice: 1% data: 1%
Traffic at business busy hour (11am) voice: 13% data: 13%
IP/E-VPN contention: 20
Residential traffic Business traffic
Total traffic 250 busy days per annum
Fixed network design
Source: Operator data, Analysys Mason

82
14895-163f
A number of parameters are used in this busy-hour calculation [2/2]
Average voice bandwidth: 95kbit/s rising to 149kbit/s
Call attempts per successful call: 1.4
Average call duration (mins):
local on-net: 3.1
outgoing to mobile: 1.8
outgoing to fixed: 3.1
national incoming: 2.6
Linear (broadcast) TV
50 IPTV channels
traffic per channel:
SDTV: 3Mbit/s (from 2007)
HDTV: 5Mbit/s (from 2012)
Video-on-Demand
average busy-hour traffic of 200kbit/s per IPTV user
Voice TV
Fixed network design
Source: Operator data, Analysys Mason
83
14895-163f
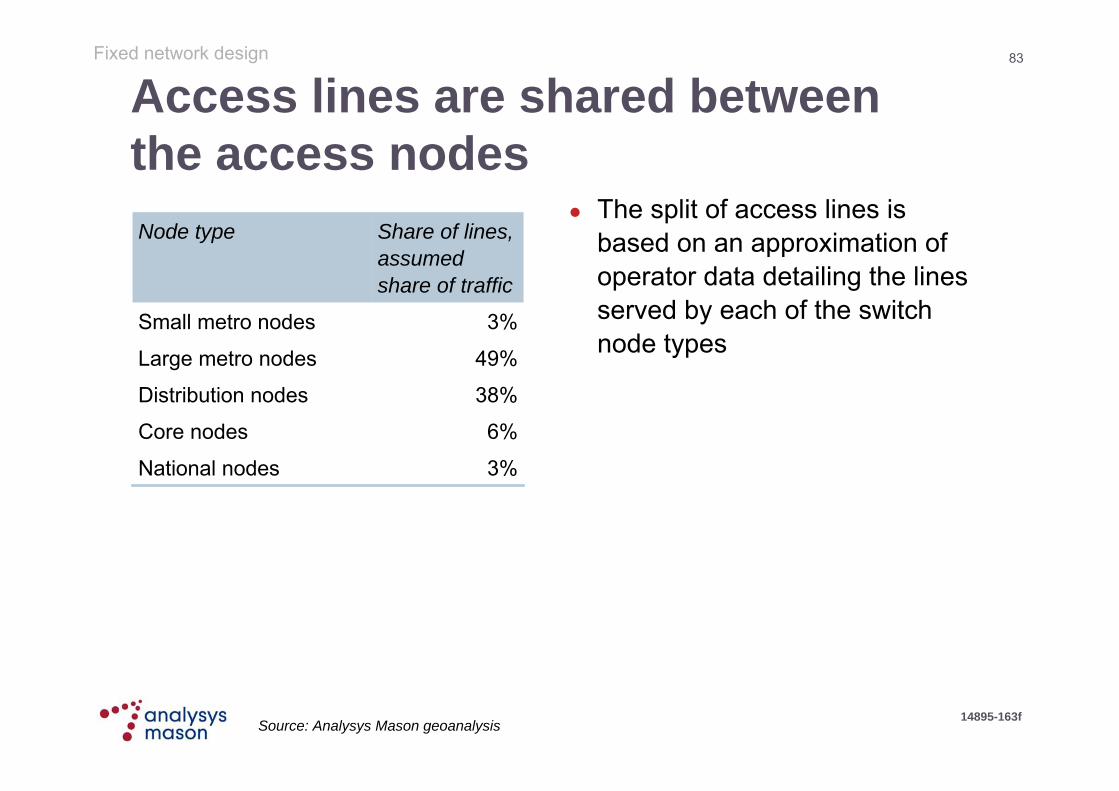
Access lines are shared between the access nodes
National nodes
Core nodes
Distribution nodes
Large metro nodes
Small metro nodes
Node type
3%
6%
38%
49%
3%
Share of lines, assumed share of traffic
Fixed network design
The split of access lines is based on an approximation of operator data detailing the lines served by each of the switch node types
Source: Analysys Mason geoanalysis

84
14895-163f
Network traffic is derived from service traffic
The ratio 26:74 is estimated from the proportion of population (B-numbers) at one regional node, compared to the other (national) nodes
approximately determined by4 interconnection points and 4+12 core locations
no weighting is assumed for traffic locality
A small percentage of VPN links are at local and regional level; the majority are at national level
approximately based on the reciprocal of the number ofedge router locations
74%TV (VoD) – indirect
TV (linear) – indirectTV (linear) – direct
TV (VoD) – directxDSL (indirect)xDSL (direct)National IP/E-VPNRegional IP/E-VPN Local IP/E-VPN National incoming callsRegional incoming callsNational outgoing callsRegional outgoing callsNetwork services
26%
1%8%92%26%74%
74%
26%74%26%
74%
26%
Share
Fixed network design
Source: Analysys Mason

85
14895-163f
A routing matrix then converts network traffic into network load
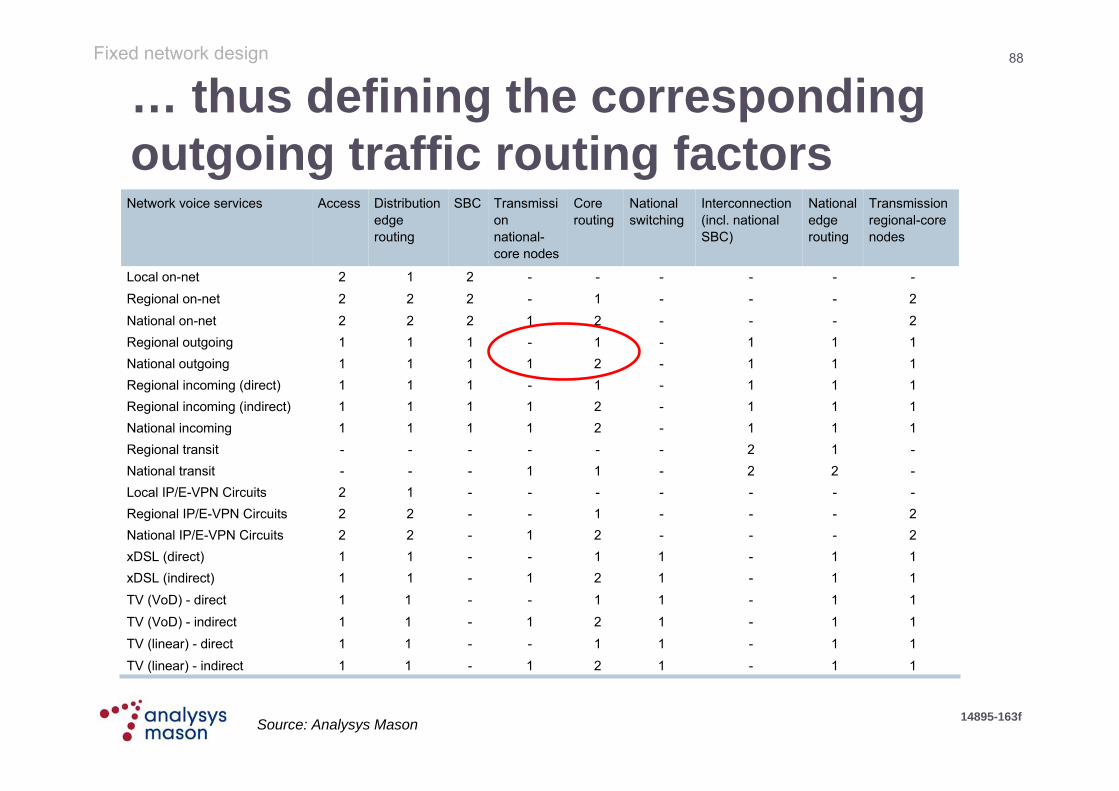
2 ---2 1 2 2 2 National on-net
1 1 1 -2 1 1 1 1 National outgoing
1 1 1 -2 1 1 1 1 Regional incoming (indirect)1 1 1 -2 1 1 1 1 National incoming
1 1 1 -1 -1 1 1 Regional outgoing
1 1 1 -1 -1 1 1 Regional incoming (direct)
-1 2 ------Regional transit-2 2 -1 1 ---National transit-------1 2 Local IP/E-VPN Circuits2 ---1 --2 2 Regional IP/E-VPN Circuits2 ---2 1 -2 2 National IP/E-VPN Circuits
2 ---1 -2 2 2 Regional on-net
1 1 -1 1 --1 1 xDSL (direct)1 1 -1 2 1 -1 1 xDSL (indirect)1 1 -1 1 --1 1 TV (VoD) - direct1 1 -1 2 1 -1 1 TV (VoD) - indirect
1 1
1
Distribution edge routing
--
2
SBC
1 1 -1 2 1 1 TV (linear) - indirect1 1 -1 1 -1 TV (linear) - direct
------2 Local on-net
Transmission regional-core nodes
National edge routing
Interconnection (incl. national SBC)
National switching
Core routing
Transmission national-core nodes
AccessNetwork voice services
Fixed network design
Source: Analysys Mason
86
14895-163f
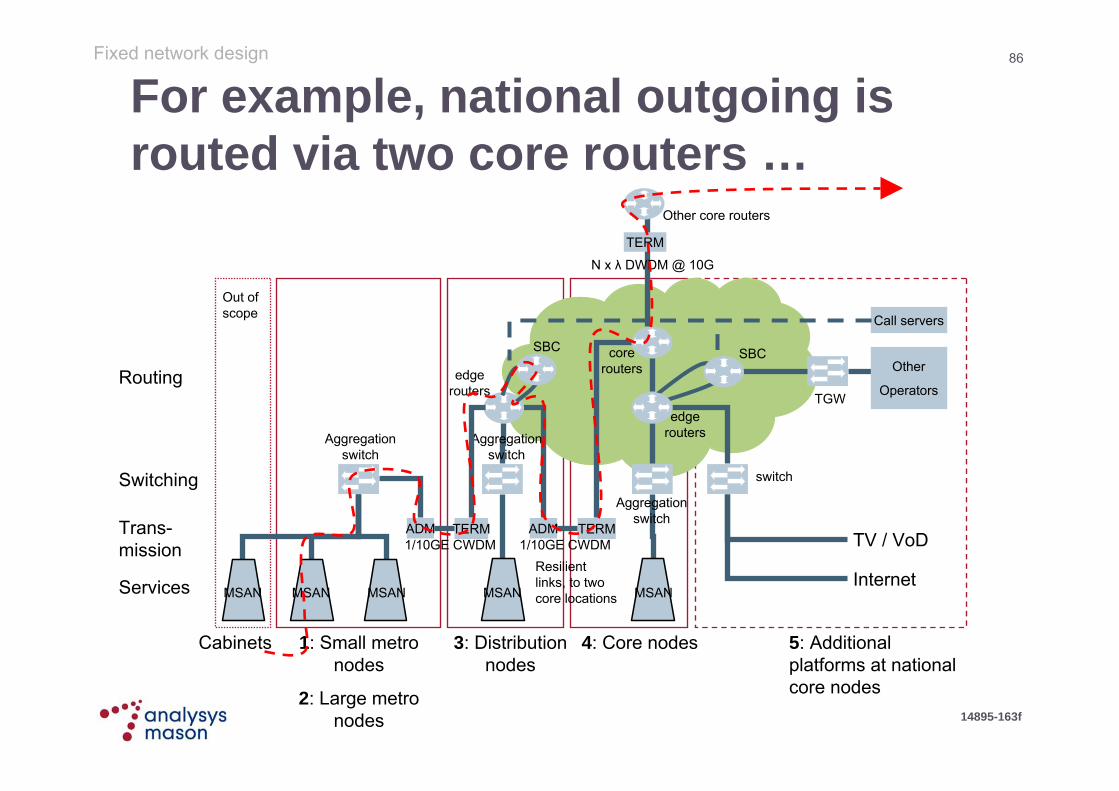
For example, national outgoing is routed via two core routers …
vAggregation
switch
TV / VoD
1: Small metro nodes
2: Large metro nodes
3: Distribution nodes
MSAN
ADM TERM
edge routers
core routers
MSAN
Aggregation switch
switch
4: Core nodes
Routing
Switching
Trans-mission
Internet
ADM TERM
SBC SBC
1/10GE CWDM 1/10GE CWDM
Other core routers
N x λ DWDM @ 10G
Services
Call servers
MSAN
Cabinets
Resilient links, to two core locations
TERM
TGW
Other
Operators
Aggregation switch
edge routers
MSAN MSAN
5: Additional platforms at national core nodes
Out of scope
Fixed network design
87
14895-163f
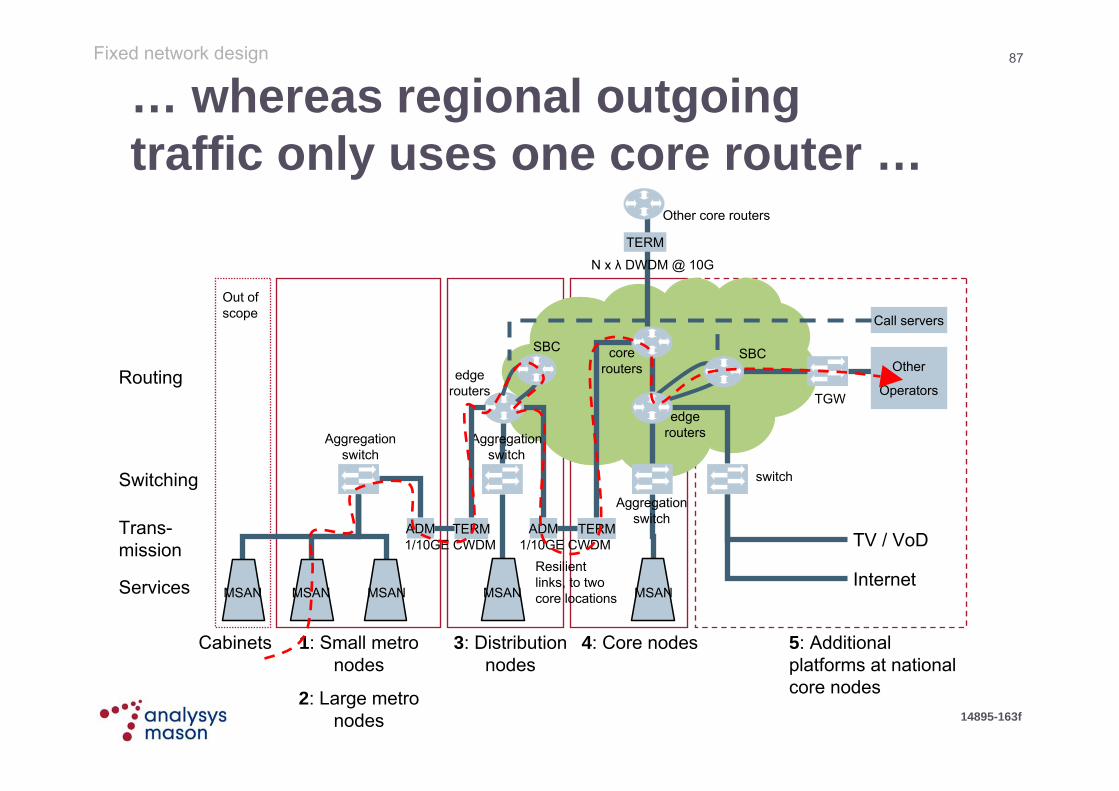
… whereas regional outgoing traffic only uses one core router …
vAggregation
switch
TV / VoD
1: Small metro nodes
2: Large metro nodes
3: Distribution nodes
MSAN
ADM TERM
edge routers
core routers
MSAN
Aggregation switch
switch
4: Core nodes
Routing
Switching
Trans-mission
Internet
ADM TERM
SBC SBC
1/10GE CWDM 1/10GE CWDM
Other core routers
N x λ DWDM @ 10G
Services
Call servers
MSAN
Cabinets
Resilient links, to two core locations
TERM
TGW
Other
Operators
Aggregation switch
edge routers
MSAN MSAN
5: Additional platforms at national core nodes
Out of scope
Fixed network design
88
14895-163f
… thus defining the corresponding outgoing traffic routing factors
Fixed network design
Source: Analysys Mason
2 ---2 1 2 2 2 National on-net
1 1 1 -2 1 1 1 1 National outgoing
1 1 1 -2 1 1 1 1 Regional incoming (indirect)1 1 1 -2 1 1 1 1 National incoming
1 1 1 -1 -1 1 1 Regional outgoing
1 1 1 -1 -1 1 1 Regional incoming (direct)
-1 2 ------Regional transit-2 2 -1 1 ---National transit-------1 2 Local IP/E-VPN Circuits2 ---1 --2 2 Regional IP/E-VPN Circuits2 ---2 1 -2 2 National IP/E-VPN Circuits
2 ---1 -2 2 2 Regional on-net
1 1 -1 1 --1 1 xDSL (direct)1 1 -1 2 1 -1 1 xDSL (indirect)1 1 -1 1 --1 1 TV (VoD) - direct1 1 -1 2 1 -1 1 TV (VoD) - indirect
1 1
1
Distribution edge routing
--
2
SBC
1 1 -1 2 1 1 TV (linear) - indirect1 1 -1 1 -1 TV (linear) - direct
------2 Local on-net
Transmission regional-core nodes
National edge routing
Interconnection (incl. national SBC)
National switching
Core routing
Transmission national-core nodes
AccessNetwork voice services
89
14895-163f
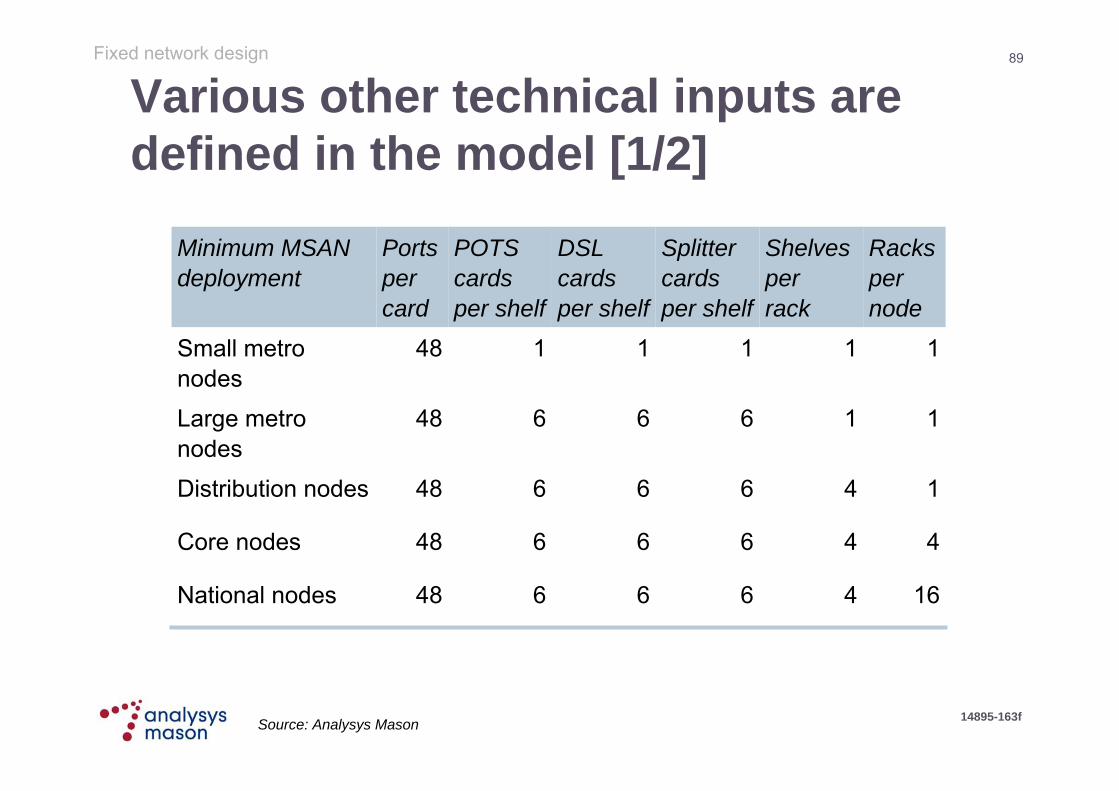
Various other technical inputs are defined in the model [1/2]
1166648Large metro nodes
1466648Distribution nodes
16466648National nodes
4466648Core nodes
1111148Small metro nodes
Racks per node
Shelves perrack
Splitter cards per shelf
DSL cards per shelf
POTS cards per shelf
Ports per card
Minimum MSAN deployment
Fixed network design
Source: Analysys Mason

90
14895-163f
Various other technical inputs are defined in the model [2/2] Aggregation switches
up to 40% utilisation 48 access-facing ports per
1GE card 12 core-facing ports per
10GE card 6 slots per chassis
Edge routers up to 40% utilisation 2 access-facing ports per
1GE or 10GE card 12 slots per chassis
SBCs up to 40% utilisation 8 ports per 1GE card
Distribution switches up to 40% utilisation 48 ports per 1GE card
National/core routers up to 40% utilisation 1 port per 10GE card 15 slots per chassis
Other elements include: call servers, DNS, BRAS, Radius, DNS, TGW, clock and synchronisation equipment, network management, VMS, IN, wholesale billing
Fixed network design
Source: Analysys Mason

91
14895-163f
Traffic and lines drive deployment of access-facing switch ports …#NGN lines, #DSL subs
Required # POTS, DSL, splitter ports
Lines/subs per node
type
Minimum port
deployment
Line share of node
type
# nodes per node type
Ports per line card
Required # line cards
Cards per shelf
Required # shelves
Shelves per rack
Required # MSAN Racks
# MSAN racks
Access BH traffic
# nodes per node type
Access BH traffic per
node
Capacity 1GE port, max. utilisation
Required # access-
facing ports (traffic
capacity)
Required # access-
facing ports (line count) Required #
ports (actual)
Ports per card
Required # 1GE access facing cards
on aggregation
switches
1
Fixed network design
#: Number of …
Businessconnectivity

92
14895-163f
… which, combined with core-facing ports, drives chassis deployment
BH traffic per node
BH access traffic
# nodes per node type
1GE and 10GE port capacities
Required # 1GE or
10GE ports
Threshold for 10GE
Required # 1GE and
10GE ports per node
Ports per card
Required # 1GE and
10GE cards per
node
# nodes per node
type
Required # 1GE and
10GE cards
Required # 1GE access facing
cards on aggregation
switches per node
Cards per chassis
Required # chassis
per node
# nodes per node
type
Required # aggregation
switch chassis
Required # 1GE and 10 GE core-facing cards on
aggregation switches per node
1
2
2
Fixed network design
#: Number of …

93
14895-163f
Calculated MSAN racks and switch ports per node type
Fixed network design
-
1,000
2,000
3,000
4,000
5,000
6,000
7,000
2004 2005 2006 2007 2008 2009 2010
Num
ber o
f MS
AN
rack
s
Small MN Large MNDistribution node Core/National node
MSAN racks Aggregation switch ports in 2009
Source: Final model
0
200
400
600
800
1000
1200
1400
1GE 10GEN
umbe
r of a
ggre
gatio
n sw
itch
card
sSmall MN Large MNDistribution node Core/National node

94
14895-163f
Switch, SBC and core requirements drive edge router deployment
% metro nodes
connected at
distribution level
# distribution nodes
# 1/10GE core-facing ports at aggregation switch, per
node type# 1/10GE
aggregation-facing ports at
distribution nodes
# core nodes
# national nodes
# 1/10GE ports required at
distribution nodes
# 1GE SBC-facing
ports at distribution
nodes
# 10GE core-facing
ports at distribution
nodes
BH traffic towards core router
10GE port capacity and utilisation
Minimum port deployment
# distribution nodes
Available ports per card
Available cards per chassis
# 1GE and 10GE edge router cards
required at distribution nodes
# edge router chassis at distribution nodes
Fixed network design
#: Number of …
Note: for the national nodes, additional ports facing the national switches are modelled

95
14895-163f
Calculated edge router requirements at distribution nodes
Fixed network design
-
20
40
60
80
100
120
140
160
2004 2005 2006 2007 2008 2009 2010
Dis
tribt
utio
n no
de ro
uter
net
wor
k el
emen
ts
DN Edge chassis
Distribution node edge routers Distribution node edge router cards
Source: Final model
-
200
400
600
800
1,000
1,200
2004 2005 2006 2007 2008 2009 2010D
istri
btut
ion
node
rout
er n
etw
ork
elem
ents
DN Edge 1Gbit/s cards DN Edge 10Gbit/s cards

96
14895-163f
Deployment of SBCs and routers
SBC deployment
SBCs are present at all distribution, core and national nodes
Their deployment is driven by voice traffic at the distribution and core/national level respectively, assuming
1GE ports
8 ports per card
a minimum deploymentof 1 port/1 card per SBC location
Core router deployment
Core routers are deployed at every core and national node
Their deployment is driven by
the number of core-facing edge router 1/10GE ports at the distribution, core and national nodes
the number of ports to other core routers, determined by core network traffic, 10GE part capacity, 40% port utilisation, 2 ports per card, and 15 cards per chassis
Fixed network design
Source: Analysys Mason geoanalysis

97
14895-163f
Calculated SBC chassis and cardsFixed network design
SBC chassis SBC cards
Source: Final model
-
20
40
60
80
100
120
140
160
180
2004
2005
2006
2007
2008
2009
2010
2011
2012
2013
2014
2015
Distribution Node SBC Core/National Node SBC
Num
ber o
f cha
ssis
-
20
40
60
80
100
120
140
160
180
200
2004
2005
2006
2007
2008
2009
2010
2011
2012
2013
2014
2015
Core/National Node SBC cardsDistribution Node SBC cards
Num
ber o
f car
ds

98
14895-163f
Calculated edge routers and ports at core/national nodes
Fixed network design
0
2
4
6
8
10
12
14
16
18
2004 2005 2006 2007 2008 2009 2010
Dis
tribt
utio
n no
de ro
uter
net
wor
k el
emen
ts
DN Edge chassis
Core/National node edge routers Core/National node edge router cards
Source: Final model
0
20
40
60
80
100
120
140
2004 2005 2006 2007 2008 2009 2010N
ode
rout
er n
etw
ork
elem
ents
Core/National Edge 10Gbit/s cardsCore/National Edge 1Gbit/s cards

99
14895-163f
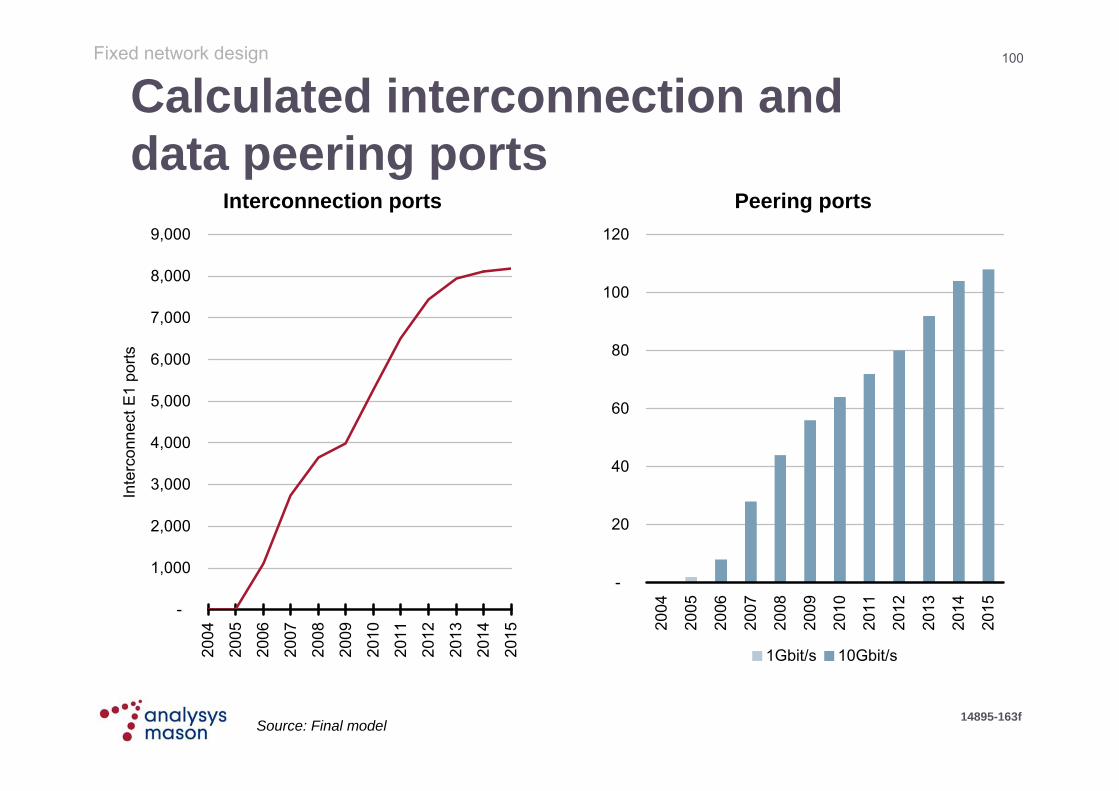
Deployment of interconnection capacity
Voice interconnection
Interconnection takes place at the 4 national nodes
TDM interconnection has been assumed
Interconnection deployment is driven by interconnecting voice traffic, assuming
E1 links
60% utilisation
Internet and TV interconnection
For Internet peering and to connect TV/VoD platforms, an additional switch per national location is deployed
Its dimensioning is driven by
xDSL traffic
TV traffic
VoD traffic
The use of 1GE ports, migration to 10GE ports, is assumed
Fixed network design
100
14895-163f
Calculated interconnection and data peering ports
Fixed network design
Interconnection ports Peering ports
Source: Final model
-
1,000
2,000
3,000
4,000
5,000
6,000
7,000
8,000
9,00020
04
2005
2006
2007
2008
2009
2010
2011
2012
2013
2014
2015
Inte
rcon
nect
E1
ports
-
20
40
60
80
100
120
2004
2005
2006
2007
2008
2009
2010
2011
2012
2013
2014
2015
1Gbit/s 10Gbit/s

101
14895-163f
Additional platforms are located at the national nodes
25,000,000 (80% max. utilisation)
# subscribersVMS
13500,000 (80% max. utilisation)
# subscribersIN
412,000,000 (80% max. utilisation)
# CDRsWholesale billing
851 per BRAS unit# BRAS unitsRadius
82 per national node# national nodesDNS
82 per national node# national nodesClock/sync units
82 per national node# national nodesNMS
8548,000Subscribers concurrent online
BRAS
71,000,000BH call attemptsCall servers
Deployment in 2009
Capacity per unit
Deployment driver
Platform
Fixed network design
Source: Analysys Mason, Draft model

102
14895-163f
Business overheads are modelled using annual opex inputs The annual opex for the network share of business
overheads is estimated to be EUR30 million based on operator data
from this, we isolate the interconnection team (4 FTE), a cost of EUR0.5 million
– since these costs are separately accounted for in the interconnection establishment costing module, they should not be double counted
This input is identical in the fixed and mobile operator models
Fixed network design
Source: Operator data, Analysys Mason

103
14895-163f
Switch and router capex and opexFixed network design
20%3%100 000 to 300 000 chassis + 31 000 / 39 000 cards
Edge router + 1/10 cards
10%3%53 000 to 161 500Switch site Aircon/UPS/generator
79 500 to 242 000Switch site ancillary equipment
5%3%25 000MSAN rack
5%3%500 / 2500Line card in MSAN (POTS / DSL)
20%3%29 000 chassis + 2500/8000Aggregation switch + 1/10 cards
20%3%100 000 chassis +30 000 cardsSBC + cards
20%3%650 000Call server
20%3%40 000 gateway + 1100 portsInterconnect gateway + E1 ports
20%3%105 000BRAS
20%3%25 000DNS, RADIUS
14 52036 30087 120
343 2001 056 000
220 000550 000
1 320 0005 200 000
16 000 000
Switch site Small Metro NodeLarge Metro NodeDistribution Node
Core NodeNational Node
O&M opex
Direct opex (leases, rents)
I&C capex
Direct capex (purchase, acquisition)
Item / Cost in EUR
Various other network elements not listed hereSource: Operator data, Analysys Mason
104
14895-163f
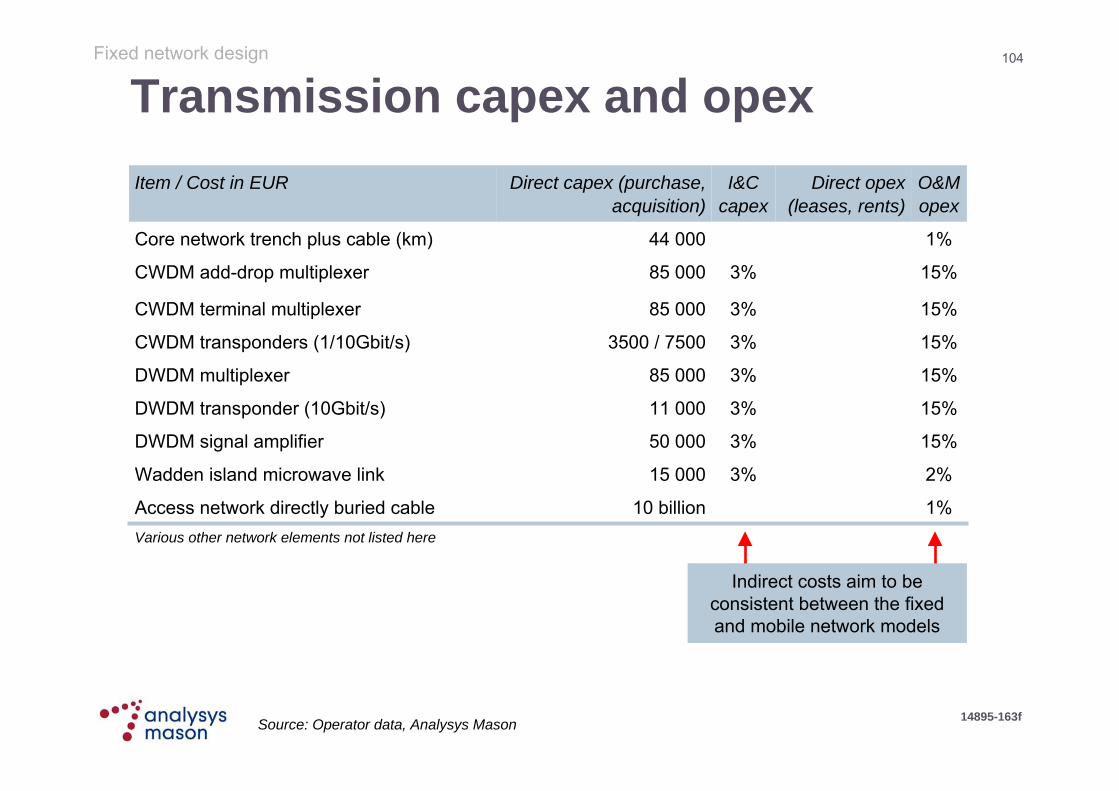
Transmission capex and opexFixed network design
15%3%11 000DWDM transponder (10Gbit/s)
15%3%85 000CWDM add-drop multiplexer
15%3%85 000CWDM terminal multiplexer
15%3%3500 / 7500CWDM transponders (1/10Gbit/s)
15%3%85 000DWDM multiplexer
15%3%50 000DWDM signal amplifier
2%3%15 000Wadden island microwave link
1%10 billionAccess network directly buried cable
1%44 000Core network trench plus cable (km)
O&M opex
Direct opex (leases, rents)
I&C capex
Direct capex (purchase, acquisition)
Item / Cost in EUR
Various other network elements not listed here
Indirect costs aim to be consistent between the fixed and mobile network models
Source: Operator data, Analysys Mason

105
14895-163f
Equipment cost trends are estimated and applied over time Capital equipment cost trends have been estimated using:
operator input Analysys Mason estimates
Similar trends are applied in the fixed and mobile cost models
Opex cost trends are assumed to be zero in real terms
Fixed network design
Source: Analysys Mason

106
14895-163f
Asset lifetimes have been estimated
The asset lifetimes shown opposite are applied in the model – they are Analysys Mason estimates of a reasonably efficient asset lifetime
these lifetimes determine the periodic replacement of all assets in the model over time
We have aimed for consistency between similar fixed and mobile equipment lifetimes
Aircon, UPS, generators and switch ancillary equipment
10
MSAN rack15
Fibre cabling20
Switch sites50
Router and switch chassis, CDWM and DWDM equipment, microwave links
8
VMS, BRAS, RADIUS, DNS, Call server
6
Core network trench, access network transmission
40
Line cards, port cards, IN, billing system, NMS
5
AssetsLifetime in years
Fixed network design
Source: Operator data, Analysys Mason
107
14895-163f
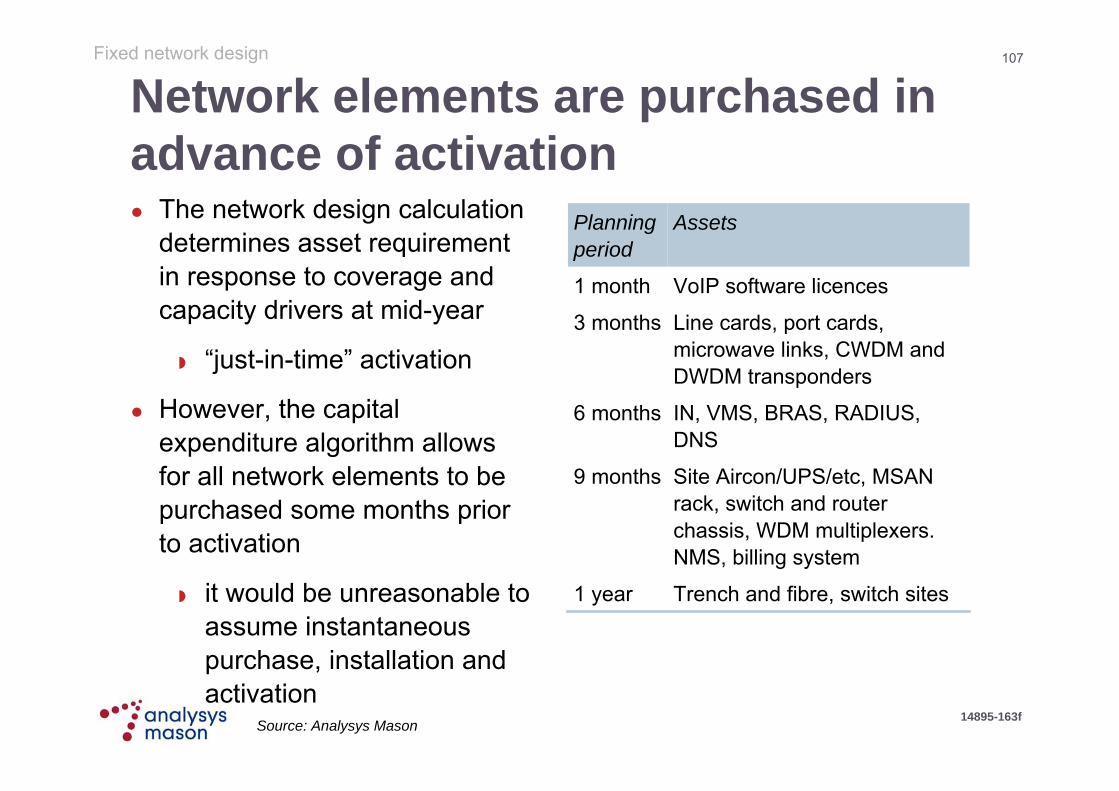
Network elements are purchased in advance of activation
Trench and fibre, switch sites1 year
Site Aircon/UPS/etc, MSAN rack, switch and router chassis, WDM multiplexers. NMS, billing system
9 months
IN, VMS, BRAS, RADIUS, DNS
6 months
Line cards, port cards, microwave links, CWDM and DWDM transponders
3 months
VoIP software licences1 month
AssetsPlanning period
Fixed network design
The network design calculation determines asset requirement in response to coverage and capacity drivers at mid-year
“just-in-time” activation
However, the capital expenditure algorithm allows for all network elements to be purchased some months prior to activation
it would be unreasonable to assume instantaneous purchase, installation and activation
Source: Analysys Mason

108
14895-163f
-
500
1,000
1,500
2,000
2,500
3,000
2004 2005 2006 2007 2008 2009
Cum
ulat
ive
core
cape
x(re
al 2
009
EUR
, milli
ons)
Interconnection
Other service platforms
Wholesale billing system
Network Management Centre
IN and VAS
VMS
Level 3 transmission
Level 2 transmission
Level 1 transmission
Core trench and fibre cables
Core router
Core Edge
Core SBC
Distribution Edge
Distribution SBC
Level 2 aggregation switches
MSAN
PSU and ancillary
Site acquisition, preparation andmaintenance
Capital investment of EUR2.6 billion for the fixed core to 2009 …
Fixed network design
EUR201 million
EUR969 million
EUR417 million
EUR717 million
EUR253 million
Source: Final model
109
14895-163f
Interconnection
Other service platforms
Wholesale billing system
Network Management Centre
IN and VAS
VMS
Level 3 transmission
Level 2 transmission
Level 1 transmission
Core trench and fibre cables
Core router
Core Edge
Core SBC
Distribution Edge
Distribution SBC
Level 2 aggregation switches
MSAN
PSU and ancillary
Site acquisition, preparation andmaintenance
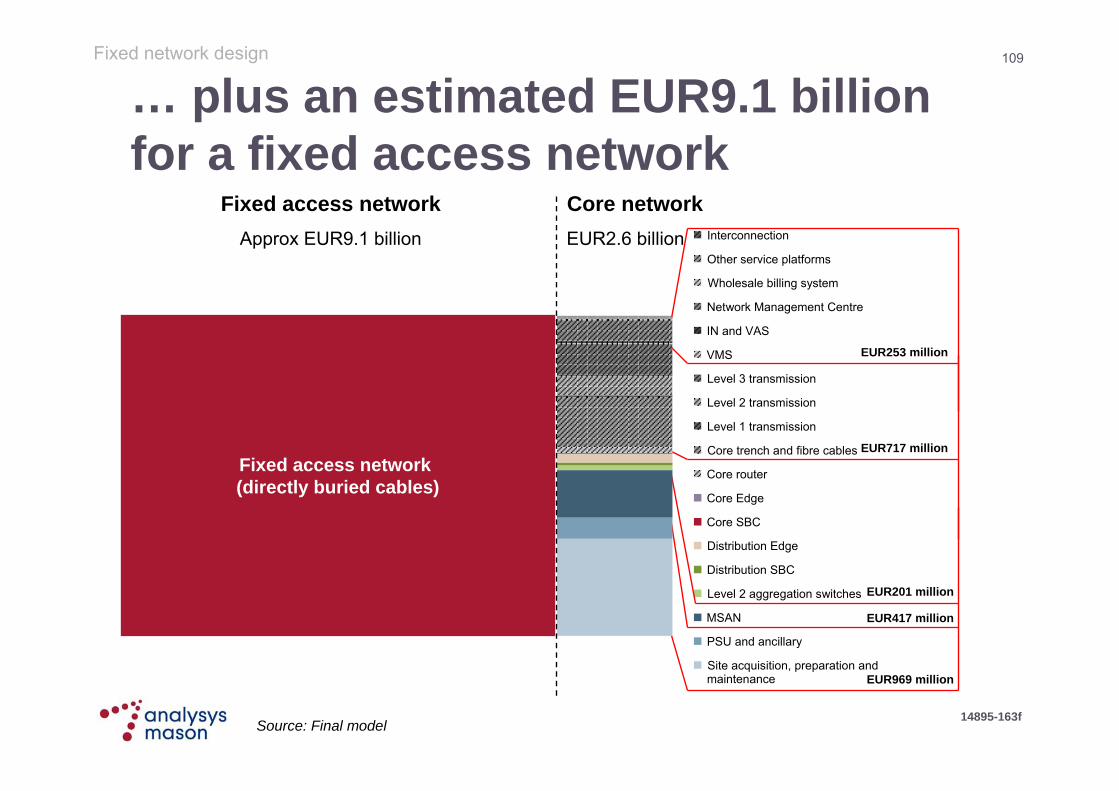
… plus an estimated EUR9.1 billion for a fixed access network
Fixed network design
EUR201 million
EUR969 million
EUR417 million
EUR717 million
EUR253 million
Fixed access network (directly buried cables)
Fixed access networkApprox EUR9.1 billion
Core networkEUR2.6 billion
Source: Final model

110
14895-163f
0
50
100
150
200
250
2009
Ope
ratin
g ex
pend
iture
(EU
R, m
illion
s)EUR230 million core network opexin 2009 for the 50% share operator
The expenditures for the modelled operator are checked against the efficient Dutch operators
Levels of indirect capex (e.g. 3% I&C) and levels of opex (e.g. 10% O&M) are estimated from actual accounting information
Fixed network design
Interconnection
Other service platforms
Wholesale billing system
Network Management Centre
IN and VAS
VMS
Level 3 transmission
Level 2 transmission
Level 1 transmission
Core trench and fibre cables
Core router
Core Edge
Core SBC
Distribution Edge
Distribution SBC
Level 2 aggregation switches
MSAN
PSU and ancillary
Site acquisition, preparation andmaintenance
EUR28 million
EUR65 million
EUR20 million
EU37 million
EUR79 million
Source: Final model
Fixed access networkApprox EUR9.1 billion
Fixed access network
Approx EUR9.1 billion
111
14895-163f
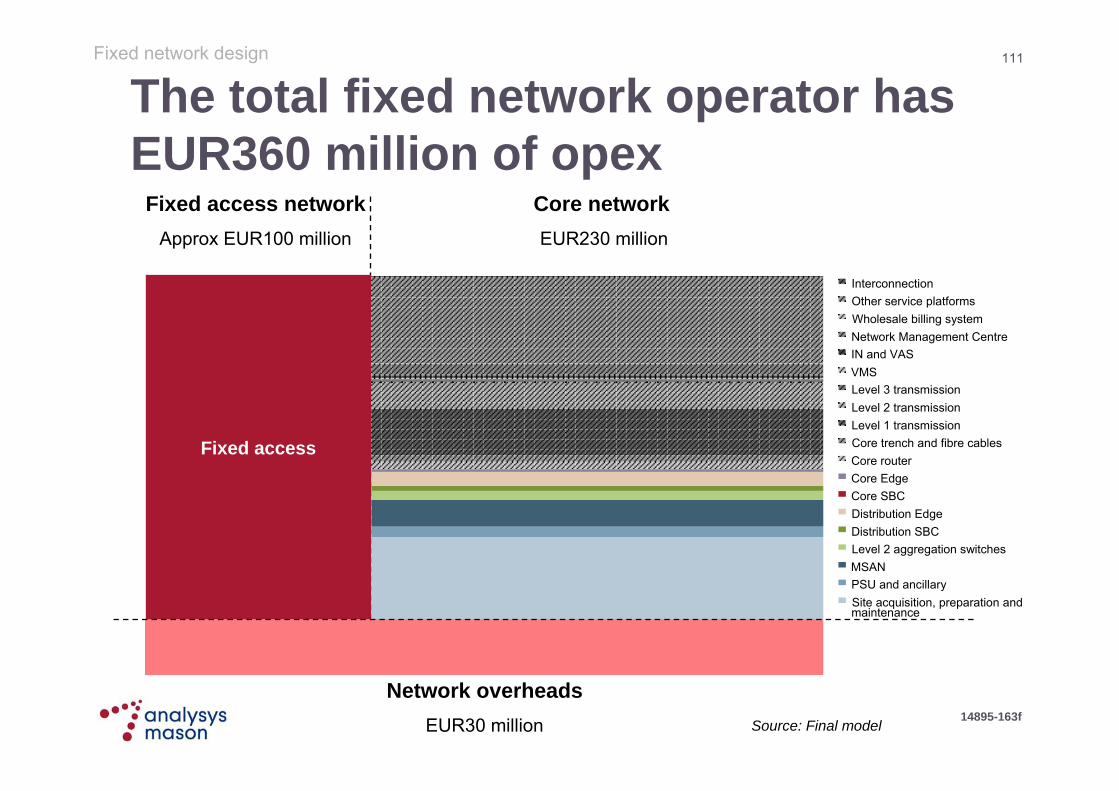
The total fixed network operator has EUR360 million of opex
Fixed network design
Fixed access network
Approx EUR9.1 billion
Fixed access networkApprox EUR100 million
Core networkEUR230 million
Fixed access
InterconnectionOther service platformsWholesale billing systemNetwork Management CentreIN and VASVMSLevel 3 transmissionLevel 2 transmissionLevel 1 transmissionCore trench and fibre cablesCore routerCore EdgeCore SBCDistribution EdgeDistribution SBCLevel 2 aggregation switchesMSANPSU and ancillarySite acquisition, preparation andmaintenance
Network overheadsEUR30 million Source: Final model
112
14895-163f
These network expenditures feed into the service costing module
Marketmodule
Mobile/fixed module Service costing module
Market volumes
Network costs
Route sharing analysis
Unit costs
Incremental costing and
routeing factors
network asset dimensioning
Network expenditures
Service unit costs
KEY Input ‘Active’ calculation Result
Depreciation
Network assumptions
Network geodata
‘Offline’ calculation
Inter-connection module
Operator volumes
Market share
Calculations
Fixed network design
113
14895-163f
Contents
Introduction
Market module
Mobile network design
Fixed network design
Service costing results

114
14895-163f
Investments are annualised using a WACC of 7.38% or 8.45%
Service costing results
8.2%
2.0%
10.3%
25.50%
53.7%
4.7%
8.6%
9.2%
0.41
0.89
6.10%
3.80%
Cable
6.56%
2.0%
8.69%
25.50%
50.92%
1.84%
5.64%
8.83%
0.40
0.82
6.10%
3.80%
Fixed
8.45%
2.0%
10.62%
25.50%
31.86%
1.78%
5.58%
9.67%
0.66
0.96
6.10%
3.80%
Mobile
Equity premium
Equity Beta
Asset Beta
Nominal cost of equity (post-tax)
Nominal cost of debt
Debt premium over risk free rate
D/D+E (gearing)
Tax rate
Nominal WACC (pre-tax)
Real pre-tax WACC
Inflation rate
Risk-free rate (nominal)
WACC values
Note: further details available in the Analysys Mason conceptual paper
Average7.38%
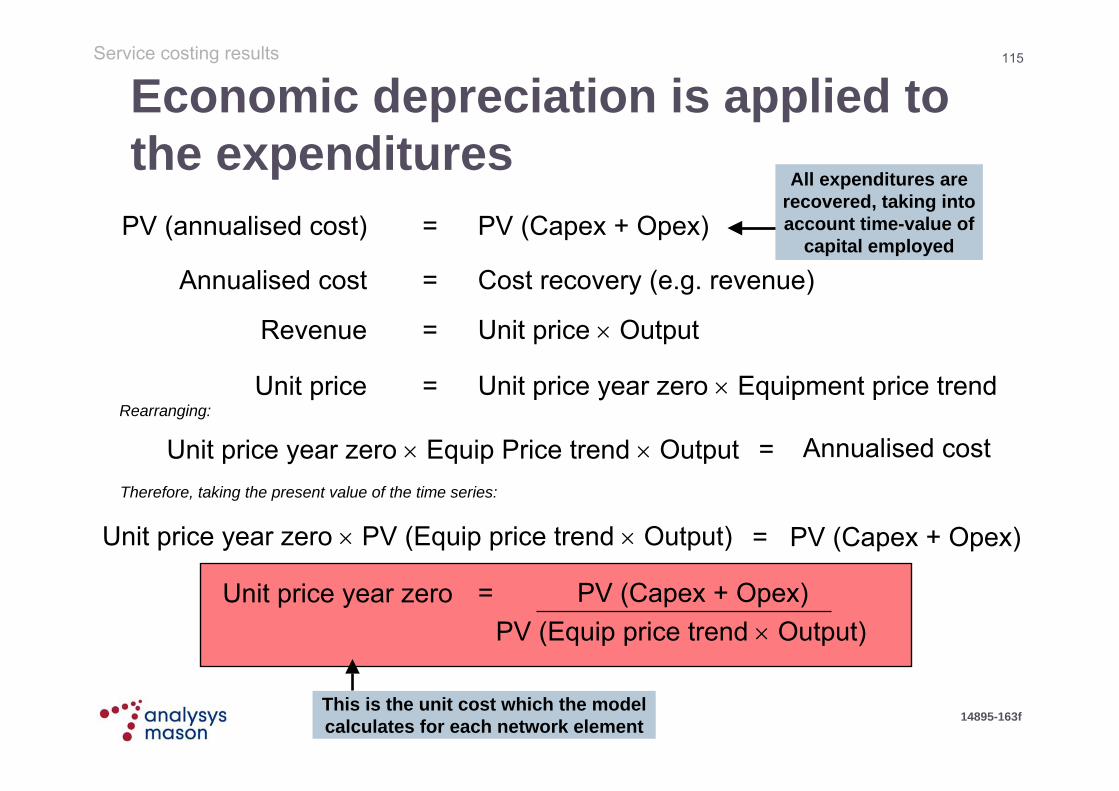
115
14895-163f
Economic depreciation is applied to the expenditures
Service costing results
PV (Capex + Opex)=PV (annualised cost)
Cost recovery (e.g. revenue)=Annualised cost
Unit price Output =Revenue
Unit price year zero Equipment price trend=Unit price
All expenditures are recovered, taking into account time-value of
capital employed
Unit price year zero Equip Price trend Output = Annualised costRearranging:
Therefore, taking the present value of the time series:
Unit price year zero PV (Equip price trend Output) PV (Capex + Opex)=
Unit price year zero PV (Capex + Opex)=PV (Equip price trend Output)
This is the unit cost which the model calculates for each network element
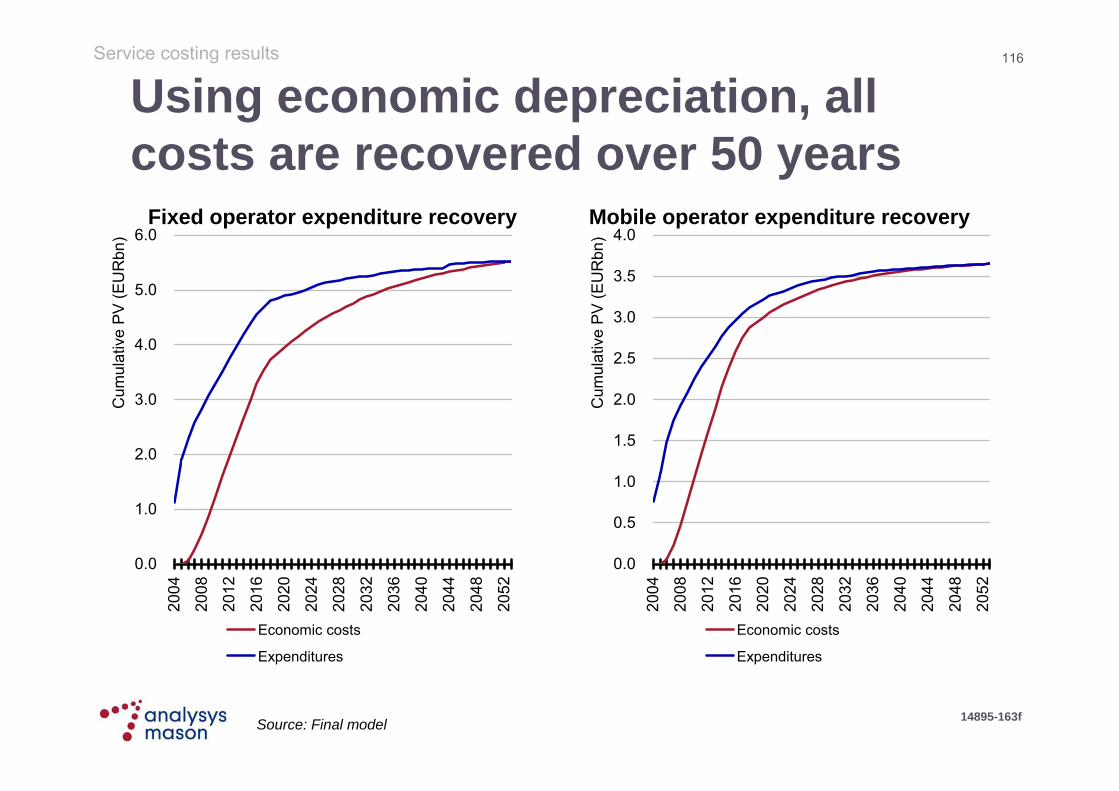
116
14895-163f
Using economic depreciation, all costs are recovered over 50 years
Source: Final model
Service costing results
Fixed operator expenditure recovery Mobile operator expenditure recovery
0.0
1.0
2.0
3.0
4.0
5.0
6.0
2004
2008
2012
2016
2020
2024
2028
2032
2036
2040
2044
2048
2052
Cum
ulat
ive
PV
(EU
Rbn
)
Economic costs
Expenditures
0.0
0.5
1.0
1.5
2.0
2.5
3.0
3.5
4.0
2004
2008
2012
2016
2020
2024
2028
2032
2036
2040
2044
2048
2052
Cum
ulat
ive
PV
(EU
Rbn
)
Economic costs
Expenditures
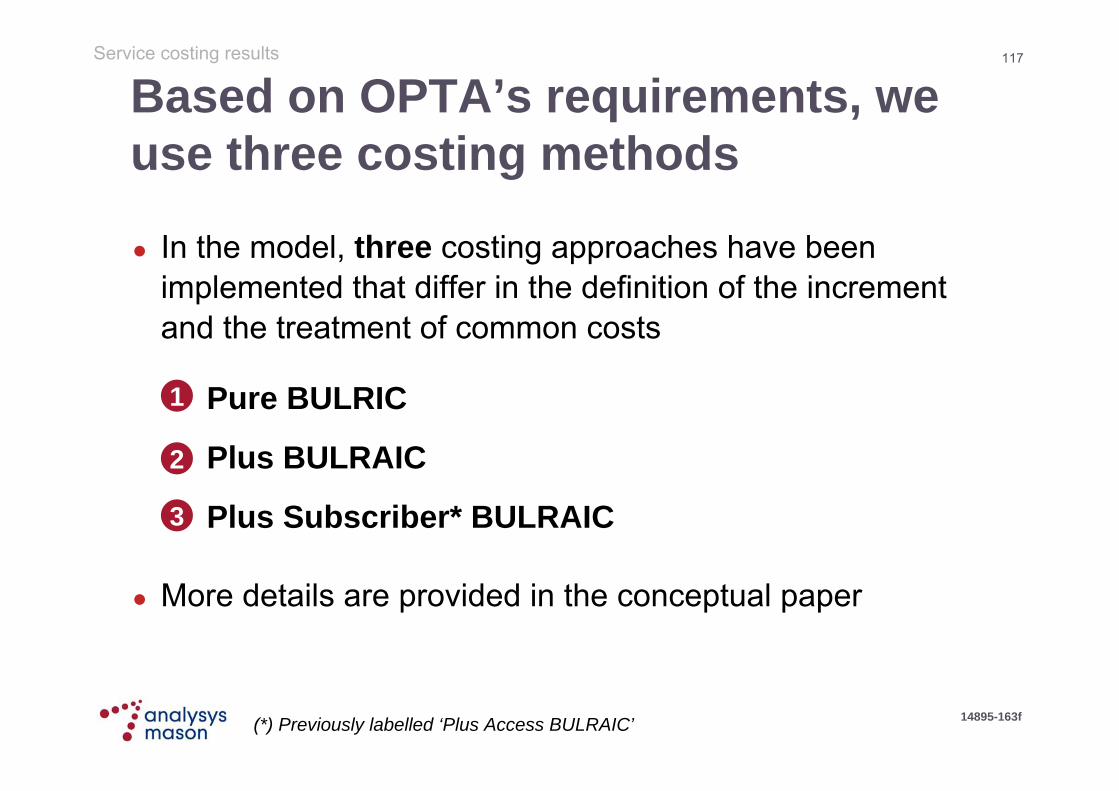
117
14895-163f
Based on OPTA’s requirements, we use three costing methods
In the model, three costing approaches have been implemented that differ in the definition of the increment and the treatment of common costs
Pure BULRIC
Plus BULRAIC
Plus Subscriber* BULRAIC
More details are provided in the conceptual paper
1
2
3
(*) Previously labelled ‘Plus Access BULRAIC’
Service costing results
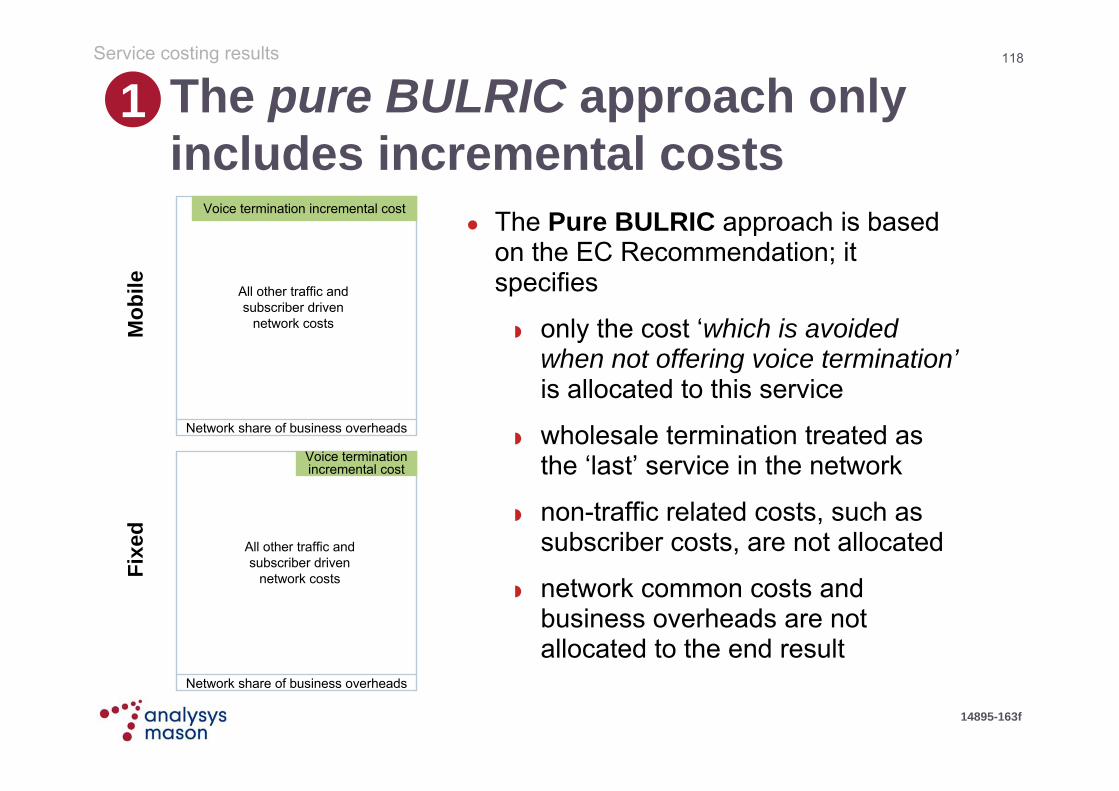
118
14895-163f
The pure BULRIC approach only includes incremental costs
The Pure BULRIC approach is based on the EC Recommendation; it specifies
only the cost ‘which is avoided when not offering voice termination’ is allocated to this service
wholesale termination treated as the ‘last’ service in the network
non-traffic related costs, such as subscriber costs, are not allocated
network common costs and business overheads are not allocated to the end result
Mob
ileFi
xed
Network share of business overheads
Voice termination incremental cost
All other traffic and subscriber driven
network costs
Network share of business overheads
Voice termination incremental cost
All other traffic and subscriber driven
network costs
1Service costing results

119
14895-163f
We calculate pure BULRIC using the difference between two runs
1Service costing results
Model with MT traffic
Expenditures with MT
(asset, time)
Output profile with MT
(asset, time)
Model without MT traffic
Expenditures without MT
(asset, time)
Output profile without MT
(asset, time)
Difference in expenditures (asset, time)
Difference in output profile (asset, time)
Economic cost of
difference (asset, time)
LRIC per minute (time)
MT traffic minutes (time)
Capexand opexcost trends
(asset, time)
Total economic
cost of difference
(time)
Model with voice termination
traffic
Expenditures with voice
termination (asset, time)
Output profile with voice
termination(asset, time)
Model without
Expenditures without voicetermination
(asset, time)
Output profile without voicetermination(asset, time)
Difference in expenditures (asset, time)
Difference in output profile (asset, time)
Economic cost of
difference (asset, time)
BULRIC per minute (time)
Voice terminationtraffic
minutes (time)
Capex and opexcost trends
(asset, time)
Total economic
cost of difference
(time)
Run model with all traffic
Run model with all traffic except
termination increment volume
We use a macro in the Excel file to do this
In the mobile model, the removal of voice termination traffic results in a reduction to some of the network design rules: cell breathing load, indoor coverage signal, TRX and CE per site minimum, indoor GSM micro sites
In the fixed network, we only switch off the termination traffic and do not modify the network design parameters
voice terminationtraffic
120
14895-163f
The other approaches require the definition of subscriber increment A subscriber increment
captures costs which are not traffic-sensitive
The definition has to be consistent across fixed and mobile
We have applied a large increment of all subscribers capturing the cost to connect to the network
‘Subscription’ is considered to be providing end users with connectivity to the traffic-sensitive network
The subscriber incrementtherefore requires:
in a mobile network– a unique SIM card– HLR and VLR registrations – coverage within footprint
in a fixed network– last-drop to NTP– copper pair– shared street ducts back to
point of traffic concentration (traffic-sensitivity)
We have excluded all forms ofend-user terminal/handset
Service costing results

121
14895-163f
Plus BULRAIC is consistent with previous regulatory costing
The Plus BULRAIC approach focuses on consistency with the previous approach in Europe for fixed and mobile termination costing
Average incremental costs of traffic are defined in aggregate, then allocated to various traffic services using routeing factors
Common costs are included (using equi-proportional cost-based mark-up)
we estimate that these are only significant in the mobile network
A large traffic increment implies that costs common to multiple traffic services are included in the average incremental cost of traffic
Mob
ileFi
xed
Network share of business overheads
Traffic incremental costs
= additional radio sites, BTS, additional TRX, higher capacity
links, additional BSC, MSC, additional spectrum, etc
Subscribers = HLR
, LU, S
IM
Mobile coverage network = radio sites, BTS, first TRX, backhaul link,
minimum switch network, licence, etc.
Network share of business overheads
Traffic incremental costs
= all switches, sites and inter-
switch transmission
infrastructure to the first point of
traffic concentration
Subscriber sensitive costs
= last-drop connections
Shared costs of access
= trench, duct and cable from the last-drop to the
first point of traffic concentration
2Service costing results

122
14895-163f
Plus Subscriber BULRAIC treats subscriber costs as common
The previous Plus BULRAIC approach assumes a separate subscriber service
Here, the Plus Subscriber BULRAICapproach considers any incremental costs associated with the subscriber access service as common costs to the traffic-related services
This presents a fully inclusive networkcost of termination
The mobile result can also be considered comparable to the marked-up result from OPTA’s previous costing project, in which location update costs were added to terminated traffic
Mob
ileFi
xed
Network share of business overheads
Traffic incremental costs
= additional radio sites, BTS, additional TRX, higher capacity links,
additional BSC, MSC, additional spectrum, etc
Subscriber costs = HLR, LU, SIMMobile coverage network = radio sites,
BTS, first TRX, backhaul link, minimum switch network, licence, etc
Network share of business overheads
Traffic incremental costs
= all switches, sites and inter-switch transmission infrastructure to the first
point of traffic concentration
Subscriber sensitive costs = last-drop connections
Shared costs of access = trench, duct and cable from the last-drop to the first
point of traffic concentration
Access and core shared trench
3Service costing results

123
14895-163f
Major common costs are identified for the two types of operator For the fixed operator, the
costs assumed to be common to traffic and subscribers (the fixed access network) are the business overheads – all other average incremental costs are allocated on the basis of routeing factors for the different traffic services
For the mobile operator, a minimum functioning coverage network is assumed to be common to traffic and subscribers, as shown to the right:
900MHz and 2100MHz coverage macro sites
1 BTS and Node B per site 1 TRX per sector and 1 CK
per site 1 backhaul link per site 2 BSCs and 2 RNCs with
minimum ports 2 MSCs and 2 switching
sites with minimum ports network management
system business overheads licence fees
Service costing results

124
14895-163f
Traffic-sensitive costs
Cost-based EPMU results – applied in the plus BULRAIC methods
Service costing results
Business overheads
~5%
Access network
Common cost structurein the fixed operator
Common cost structurein the mobile operator
Business overheads, NMS
Common macro sites, backhaul, MSC
2G traffic-sensitive costs 3G traffic-sensitive costs
3G traffic common BTS, TRX, BSC, licences
3G traffic common NodeB,CK, RNC, licences
~30%
~50% ~50%
Source: Final model

125
14895-163f
Service-based cost recovery - fixed
In the fixed economic depreciation calculation, costs are annualised over time according to traffic load
1 Mbit/s of peak load is equivalent to more than 2 million annual minutes of voice traffic
In the Plus BULRAIC models, this voice-data equivalence is used to share out the incremental costs of traffic
Service costing results
Excludes interconnection, access network and line cards
Fixed annualised costsby service type
Source: Final model
0
100
200
300
400
500
600
700
800
2004
2006
2008
2010
2012
2014
2016
2018
Ann
ualis
ed c
ost (
real
200
9 E
UR
, milli
ons) TV -
VoD +Linear
xDSL
IP/EVPNcircuits
Voice
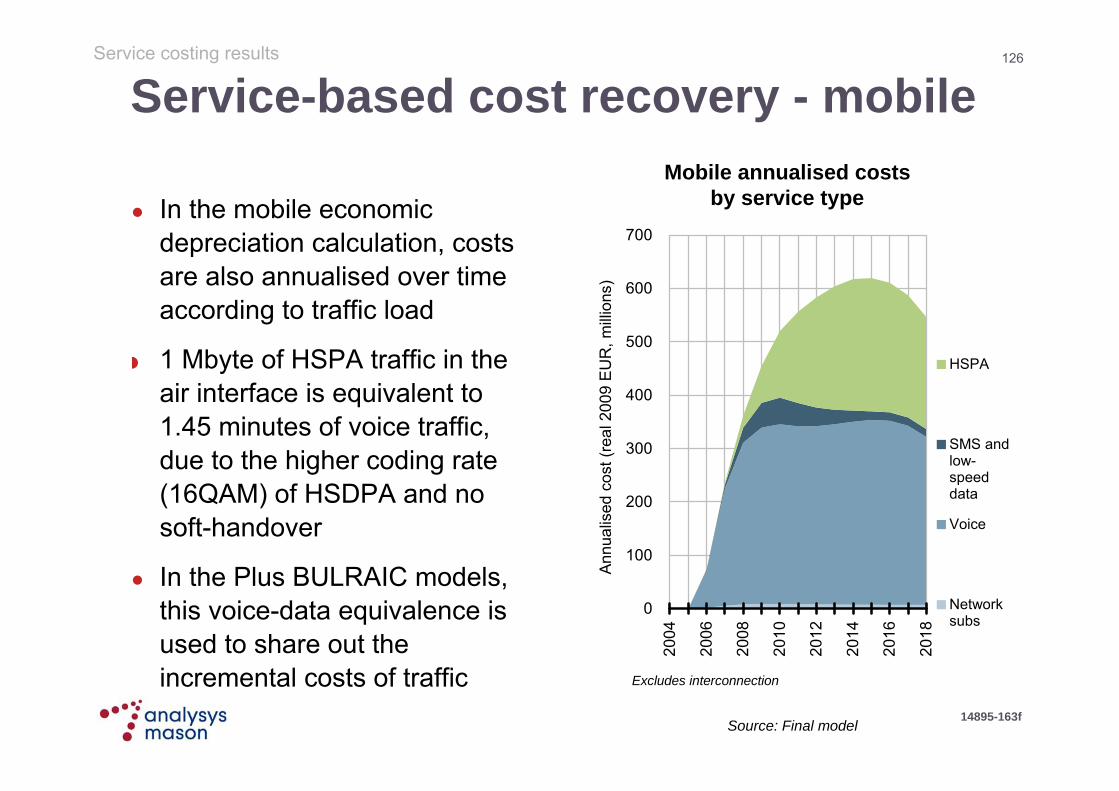
126
14895-163f
Service-based cost recovery - mobileService costing results
Excludes interconnection
Mobile annualised costsby service type
Source: Final model
In the mobile economic depreciation calculation, costs are also annualised over time according to traffic load
1 Mbyte of HSPA traffic in the air interface is equivalent to 1.45 minutes of voice traffic, due to the higher coding rate (16QAM) of HSDPA and no soft-handover
In the Plus BULRAIC models, this voice-data equivalence is used to share out the incremental costs of traffic
0
100
200
300
400
500
600
700
2004
2006
2008
2010
2012
2014
2016
2018
Ann
ualis
ed c
ost (
real
200
9 E
UR
, milli
ons)
HSPA
SMS andlow-speeddata
Voice
Networksubs

127
14895-163f
Main contacts
For OPTA
Huib de Kleijn
+31 70 315 35 83
For Analysys Mason
Ian Streule
+44 1223 460600