final 2014 report - indygo · comprehensive annual financial report ... hess dr aj brown moller ......
TRANSCRIPT

Indianapolis Public Transportation Corporation State of Indiana
Comprehensive Annual Financial Report For the year ending Dec. 31, 2014
A component unit of the consolidated City of Indianapolis-Marion County Government Reporting Entity
2014 Comprehensive annual financial report


COMPREHENSIVE ANNUAL 2014 FINANCIAL REPORT
Indianapolis Public Transportation CorporationA Component Unit of the ConsolidatedCity of Indianapolis – Marion County
Reporting Entity
Michael A. Terry, President & CEO
COMPREHENSIVE ANNUALFINANCIAL REPORT
INDIANAPOLIS, INDIANAFOR THE YEAR ENDING
DECEMBER 31, 2014

Ride IndyGo’s articulated buses to downtown.

TABLE OF CONTENTS
SECTION ONE – INTRODUCTORYLetter of Transmittal ........................................................................................................ IGFOA Certificate of Achievement .................................................................................VIII Organizational Chart ......................................................................................................IXPrincipal Officials and Management .............................................................................X2014 Systems Map - Service Area and Routes ............................................................XITaxing Districts .............................................................................................................. XII
SECTION TWO – FINANCIALIndependent Auditor’s Report ........................................................................................1Management’s Discussion and Analysis .............................................................................3Financial Statements Statements of Net Position .......................................................................................10 Statements of Revenue, Expense and Changes In Fund Equity...............................12 Statements of Cash Flows ........................................................................................13 Notes to Financial Statements ..................................................................................15Required Supplementary Information (Unaudited) Schedule of Funding Progress ..................................................................................32Supplementary Information Schedule of Expenditures of Federal Awards ..........................................................33 Notes to Schedule of Federal Expenditures of Federal Awards ..............................34 Independent Auditor’s Report on Internal Control Over Financial Reporting and on Compliance and Other Matters Based on an Audit of Financial Statements Performed in Accordance with Government Auditing Standards .................................................................................................35 Independent Auditor’s Report on Compliance for Each Major Federal Program; Report on Internal Control Over Compliance ........................................37 Schedule of Findings and Questioned Costs ............................................................39 Schedule of Prior Audit Findings .............................................................................42
SECTION THREE – STATISTICAL (Unaudited)Financial Trends Net Assests by Component ..................................................................................45 Operating Expenses by Type ...............................................................................46 Changes in Net Assets ..........................................................................................47
Revenue Capacity Operating Revenue by Source .............................................................................48 Non-Operating Revenues and Expenses ...........................................................49 Assessed Value and Estimated Actual Value of Taxable Property .................50
Debt Capacity Property Tax Levies and Collections ..................................................................51 Ratios of General Bonded Debt Outstanding ....................................................52 Direct and Overlapping Property Tax Rates .....................................................53 Direct and Overlapping Bonded Debt and Bonding Limit .............................54
Demographic and Economic Information Demographic and Economic Statistics ...............................................................55 Principal Employers ..............................................................................................56 Principal Property Tax Payers .............................................................................57
Operating Information Operating Information .........................................................................................58 Schedule of Insurance in Force ............................................................................59 Transit Vehicles ......................................................................................................60

SECTION ONE – INTRODUCTORY
Letter of Transmittal ............................................................................................ IGFOA Certificate of Achievement .....................................................................VIII Organizational Chart ..........................................................................................IXPrincipal Officials and Management .................................................................X2014 Systems Map - Service Area and Routes ................................................XITaxing Districts .................................................................................................. XII

I

II

III

IV

V

VI

VII

VIII
IND
IAN
AP
OLI
S P
UB
LIC
TR
AN
SP
OR
TA
TIO
N C
OR
PO
RA
TIO
N

IX
IND
IAN
AP
OLI
S P
UB
LIC
TR
AN
SP
OR
TA
TIO
N C
OR
PO
RA
TIO
N

X
INDIANAPOLIS PUBLIC TRANSPORTATION CORPORATION - IndyGoBoard of Directors, Principal Officials and Management
Approximate Length ofName Service Occupation
Appointed Board of Directors
Danny M. Crenshaw, Chair 11-1/2 yrs President(Council) Crenshaw Insurance Agency
Alan Rowland, Vice Chair 6-1/2 yrs Business Development Manager (Council) CompTIA
Juan Gonzalez, Treasurer/Sec’y 5 yr. Vice President - Sr. Business (Mayor) Banking Relationship Manager Key Bank
Tommie L. Jones, 14-1/2 yrs Retired Professional Educator(Council) Decatur Township School District
Jason Konesco 3-1/2 yr. President, Harrison College(Mayor)
Gregory Hahn 2 yr. Partner (Council) Bose McKinney & Evans, LLP
Mark Fisher 6 mos. VP, Gov’t Relations/Policy Div,(Mayor) Indy Chamber
IPTC Principal Management Staff
Michael A. Terry 11-1/2 yrs President/CEO
Jill Russell 10 yrs General Counsel
Andy Jackson 2 yr VP/CFO/Controller Roscoe Brown 16 yr VP of Business Development Mike Birch 17 yrs VP/ Chief Operating Officer
Phalease Crichlow 4 yrs VP of Human Resources

55
5555
38
37
37
37
37
34
31
31
31
30
28
28
28
26
26
26
26
25
2525
25
24
24
24
22
22
21
21 21
18
18
18
17
17
16
16
16
15
15
15
15
12
12
13
13
13
12
12
11
11
5
5
5
5
4
4
4
4
4
4
4
3
3
3
2
2 2
2
4
4
5
14
14
16
18
18
19
19
19
19
19
19
22
26
28
34
34
37
8686
868686
50
14
22
14
17
34
11
4
19
26
38
38
8
8
10
10
1010
39
1010
10
10
39
10
11
21
87
87
39
87
3
2
3055
8
15
10
10
3015 3030
30
88
8
2255
4
11
5
519
17
5
15
28
86
26
17
19
19
39
39
3
3
3
3
15
37
3 37
19
4
2
2
2
5
2818
878
2110
39
30
25
11 30
25
17
38
3428
3838
traders pointtraders point
irvingtonirvingtonirvingtonirvingtonirvingtonirvingtonirvingtonirvingtonirvingtonirvingtonirvingtonirvingtonirvingtonirvingtonirvingtonirvingtonirvingtonirvingtonirvingtonirvingtonirvingtonirvingtonirvingtonirvingtonirvingtonirvingtonirvingtonirvingtonirvingtonirvington
broad ripple
southportsouthportsouthportsouthportsouthportsouthportsouthport
castletoncastletoncastletoncastletoncastletoncastletoncastletoncastletoncastletoncastletoncastletoncastletoncastletoncastletoncastletoncastletoncastletoncastletoncastletoncastletoncastletoncastletoncastletoncastletonnora
eagle creekeagle creekeagle creekeagle creekeagle creekeagle creekeagle creekeagle creek
speedway
monon trail
monon trailmonon trail
monon trail
raceway
raceway
raceway
raceway
raceway
raceway
raceway
raceway
raceway
raceway
raceway
raceway
raceway
raceway
raceway
raceway
raceway
raceway
raceway
raceway
raceway
raceway
woolcowoolcowoolcowoolcowoolcowoolcowoolcowoolcowoolcowoolcowoolcowoolcowoolcowoolcowoolcowoolcowoolcowoolcowoolcowoolcowoolcowoolcowoolcowoolcowoolcowoolcowoolcowoolcowoolcowoolcowoolcowoolcowoolcowoolcowoolcowoolcowoolcowoolcowoolcowoolcowoolcowoolcowoolcowoolcowoolcowoolcowoolcowoolcowoolcowoolcowoolcowoolcowoolcowoolco
hooverhooverhooverhooverhooverhooverhooverhooverhooverhooverhooverhooverhooverhooverhooverhooverhooverhoover
ameriplex
ameriplex
ameriplex
ameriplex
ameriplex
ameriplex
ameriplex
ameriplex
ameriplex
ameriplex
ameriplex
ameriplex
ameriplex
ameriplex
ameriplex
ameriplex
ameriplex
ameriplex
ameriplex
ameriplex
ameriplex
ameriplex
ameriplex
ameriplex
ameriplex
ameriplex
ameriplex
ameriplex
ameriplex
ameriplex
ameriplex
ameriplex
ameriplex
ameriplex
ameriplex
ameriplex
ameriplex
ameriplex
ameriplex
ameriplex
ameriplex
ameriplex
ameriplex
ameriplex
ameriplex
ameriplex
ameriplex
ameriplex
ameriplex
ameriplex
ameriplex
ameriplex
ameriplex
universityuniversityuniversityuniversityuniversityuniversityuniversityuniversityuniversityuniversityuniversityuniversityuniversityuniversityuniversityuniversityuniversityuniversityuniversityuniversityuniversityuniversityuniversityuniversitybeechwoodbeechwoodbeechwoodbeechwoodbeechwoodbeechwoodbeechwoodbeechwoodbeechwoodbeechwoodbeechwoodbeechwoodbeechwoodbeechwoodbeechwoodbeechwoodbeechwoodbeechwoodbeechwoodbeechwoodbeechwoodbeechwoodbeechwoodbeechwoodbeechwoodbeechwoodbeechwoodbeechwoodbeechwoodbeechwood
mollermollermollermollermollermollermollermollermollermollermollermollermollermollermollermollermollermollermollermollermoller norfolk
norfolknorfolknorfolknorfolknorfolknorfolknorfolknorfolknorfolknorfolknorfolknorfolknorfolknorfolknorfolknorfolknorfolknorfolk spring mill road
spring mill roadspring mill roadspring mill roadspring mill roadspring mill roadspring mill roadspring mill roadspring mill roadspring mill roadspring mill roadspring mill roadspring mill roadspring mill roadspring mill roadspring mill roadspring mill roadspring mill roadspring mill roadspring mill roadspring mill roadspring mill roadspring mill roadspring mill roadspring mill roadspring mill roadspring mill roadspring mill roadspring mill roadspring mill roadspring mill roadspring mill roadspring mill roadspring mill roadspring mill roadspring mill roadspring mill roadspring mill roadspring mill roadspring mill roadspring mill roadspring mill roadspring mill roadspring mill roadspring mill roadspring mill roadspring mill roadspring mill road
bayheadbayheadbayheadbayheadbayheadbayheadbayheadbayheadbayheadbayheadbayheadbayheadbayheadbayheadbayheadbayheadbayheadbayhead
noble noble easteasteast
noble industries
martinmartinuniv.
u of Imarsh
greenwoodgreenwoodgreenwoodgreenwoodgreenwoodgreenwood
intech parkparkpark
marianuniv.
southernsouthernsouthernplazaplazaplazaplazaplazaplaza
depauwdepauw
oliveroliveroliveroliveroliveroliveroliveroliver
mann
mann
mann
mann
mann
mann
mann
mann
mann
mann
mann
mann
mann
mann
decatur
decatur
decatur
cambycamby
smith valley rdsmith valley rd
german churchgerman churchgerman churchgerman churchgerman churchgerman churchgerman churchgerman churchgerman churchgerman churchgerman churchgerman churchgerman churchgerman churchgerman churchgerman churchgerman churchgerman churchgerman churchgerman churchgerman church
german churchgerman church
mitthoefermitthoefermitthoefermitthoefermitthoefer
mitthoefermitthoefermitthoefer
bridgeportbridgeportbridgeportbridgeportbridgeportbridgeport
meadowsmeadowsmeadowsmeadowsmeadowsmeadowsmeadowsmeadowsmeadowsmeadowsmeadowsmeadowsmeadows
hesshesshesshess
dr aj brown
dr aj brown
dr aj brown
dr aj brown
mollermoller
allisonallisonallison
kesslerkesslerkesslerkesslerkesslerkesslerkesslerkesslerkesslerkesslerkesslerkesslerkesslerkesslerkesslerkesslerkesslerkesslerkesslerkesslerkesslerkesslerkesslerkesslerkesslerkesslerkesslerkessler
olneyolneyolneyolneyolneyolneyolneyolneyolneyolneyolneyolneyolneyolneyolneyolneyolneyolneyolneyolneyolneyolneyolneyolneyolneyolneyolneyolneyolney
ruralruralruralruralruralruralruralruralruralruralruralruralruralruralruralruralruralruralrural
wellesleywellesleywellesleywellesleywellesley
ritterritterritterritter
postpostpostpostpostpostpostpostpost
postpostpostpostpostpostpost
shermanshermanshermanshermanshermanshermanshermanshermanshermanshermanshermanshermanshermanshermanshermanshermanshermanshermanshermanshermanshermanshermanshermanshermanshermanshermanshermanshermanshermanshermanshermanshermanshermanshermanshermanshermanshermansherman
redfernredfern
divisiondivisiondivisiondivisiondivisiondivisiondivisiondivisiondivisiondivisiondivisiondivisiondivisiondivisiondivisiondivisiondivisiondivision
meridian-kesslermeridian-kesslermeridian-kesslermeridian-kesslermeridian-kesslermeridian-kesslermeridian-kesslermeridian-kesslermeridian-kesslermeridian-kesslermeridian-kesslermeridian-kesslermeridian-kesslermeridian-kesslermeridian-kesslermeridian-kesslermeridian-kesslermeridian-kesslermeridian-kessler
mars hill
beech grove
lawrencelawrence
30
broad ripple ave
purdue
X
J
oP
Q
B
R
U
Z
C
E
V
W
G
S
F
HT
A
D
X
Y
N M
K
N
K
MN
M
N
I
L
L
L
L
N
L
N
K
K
N
N
12
11
5
4
2255
525
Y Downtown Indianapolis
see inset on reverse
GeistReservoirFa
ll Cre
ek
Colle
ge
62nd
86th
91st
Keys
tone
Rura
l
Wes
tfiel
d
Nora
1826/
1826/
18/26 North Loop Sunday Only
J
Q
18
broad ripple L
N
5 days a weekMonday - Friday
6 days a weekMonday - Saturday
7 days a weekMonday - Sunday
2 - East 34th Street 3 - Michigan Street 5 - E. 25th/Harding 8 - Washington Street10 - 10th Street12 - Minnesota13 - Raymond14 - Prospect15 - Riverside17 - College19 - Castleton28 - St. Vincent31 - Greenwood34 - ML King/Michigan Road37 - Park 10038 - Lafayette Square39 - East 38th Street
4 - Fort Harrison16 - Beech Grove 18 - Nora 21 - East 21st Street 24 - Mars Hill 25 - West 16th Street 26 - Keystone Crosstown50 - Red Line 86 - 86th Street Crosstown87 - Eastside Circulator
11 - East 16th Street22 - Shelby30 - 30th Street Crosstown55 - English
Frequent ServiceMonday – Friday Early a.m. through early p.m.
8 - Washington Street 15 minute between Zoo and Meijer/E. Washington10 - 10th Street 20 minute between Lynhurst and German Church39 - East 38th Street 15 minute except between Franklin and Mitthoefer
• •• ••• • •• • •••• •
– – – – – – – –– – – – – – – –– – – – – – – –
KEY DESTINATIONS
HOSPITALS
SHOPPING
POINTS OF INTEREST
A. COMMUNITY NORTHB. ST. VINCENTC. METHODIST D. ESKENAZIE. VETERANSF. ST. FRANCISG. COMMUNITY EASTH. COMMUNITY SOUTHI. WOMEN‘S HOSPITAL
J. CASTLETON MALLK. KMARTL. TARGETM. MEIJERN. WALMARTO. KEYSTONE AT THE CROSSINGP. TRADERS POINTQ. GLENDALE MALLR. LAFAYETTE SQUARES. WASHINGTON SQUARET. GREENWOOD PARK MALL
U. INDIANAPOLIS MUSEUM OF ARTV. INDIANAPOLIS MOTOR SPEEDWAYW. INDIANA STATE FAIRGROUNDSX. IVY TECHY. IUPUIZ. CHILDREN‘S MUSEUM AIRPORT ZOO
Downtown Loop27 of IndyGo’s 31 fixed routes converge in the downtown area on The Loop” – Ohio Street to Capitol Avenue to Maryland Street to Delaware Street. Ohio Street at Meridian Street is the main hub for transfers. Almost all downtown attractions are walkable from the The Loop.
limited serviceAll dashed lines on the map denote “limited service.” This means that the route will not travel the dotted path for every trip, but instead at select times of the day or week. For more specifics refer to individual route maps.
2014 system mapXI

Indianapolis Public Transportation CorporationTaxing Districts
MAP 1 MAP 2
MAP 3 MAP 4
MARION COUNTYAND INCLUDED TOWNS
CONSOLIDATEDCITY OF INDIANAPOLIS
TOWNSHIP(ASSESSED VALUATIONS)
IPTC TAXING DISTRICT
True Value Assessed ValuationMarion County $33,971,640,933Included towns $520,837,233
Assessed ValuationCity of Indianapolis $31,760,083,303Exluded Cities and Towns $2,211,557,630
IPTC $32,132,944,330Exluded Cities and Towns $1,838,696,603
[1] The assessed value figures are those certified by Marion County Auditor Abstract as of 2014[2] Map 4 represents the taxing district of IPTC, not including excluded cities and towns.
Williams Creek92,111,933
Meridian Hills219,675,445
Rocky Ripple20,403,820
Clermont47,295,042
Homecroft20,140,311
Warren Park39,104,792
Cumberland60,311,432
Spring Hills11,214,383
Wynndale10,580,075
SOUTHPORT43,975,610
SPEEDWAY511,652,323
BEECH GROVE372,861,027
LAWRENCE1,283,068,670
REDEVELOPMENT TAXALLOCATION AREA
PIKE TWP4,342,126,381
WASHINGTON TWP7,301,430,955
LAWRENCE TWP4,809,991,548
WAYNE TWP3,465,720,580
CENTER TWP5,009,697,254
WARREN TWP2,852,668,872
DECATUR TWP1,103,785,283
PERRY TWP3,191,377,032
FRANKLIN TWP1,894,843,028
REDEVELOPMENT TAXALLOCATION AREA
SOUTHPORT43,975,610
SPEEDWAY511,652,323
LAWRENCE1,283,068,670
XII
(In Thousands)

Our coach operators are eager to drive you.

SECTION TWO – FINANCIAL
Independent Auditor’s Report ............................................................................1Management’s Discussion and Analysis .................................................................3Financial Statements Statements of Net Position ............................................................................10 Statements of Revenue, Expense and Changes In Fund Equity ...................12 Statements of Cash Flows .............................................................................13 Notes to Financial Statements .......................................................................15Required Supplementary Information (Unaudited) Schedule of Funding Progress ......................................................................32Supplementary Information Schedule of Expenditures of Federal Awards ...............................................33 Notes to Schedule of Federal Expenditures of Federal Awards ...................34 Independent Auditor’s Report on Internal Control Over Financial Reporting and on Compliance and Other Matters Based on an Audit of Financial Statements Performed in Accordance with Government Auditing Standards ......................................................................................35 Independent Auditor’s Report on Compliance for Each Major Federal Program; Report on Internal Control Over Compliance .............................37 Schedule of Findings and Questioned Costs .................................................39 Schedule of Prior Audit Findings .................................................................42

INDIANAPOLIS PUBLICTRANSPORTATION CORPORATION
(A COMPONENT UNIT OF THE CONSOLIDATED CITY OF
INDIANAPOLIS MARION COUNTY GOVERNMENT REPORTING ENTITY)
FINANCIAL STATEMENTSDecember 31, 2014

INDIANAPOLIS PUBLIC TRANSPORTATION CORPORATION(A COMPONENT UNIT OF THE CONSOLIDATED CITY OF INDIANAPOLIS
MARION COUNTY GOVERNMENT REPORTING ENTITY)Indianapolis, Indiana
FINANCIAL STATEMENTSDecember 31, 2014
CONTENTS
INDEPENDENT AUDITOR’S REPORT.................................................................................................... 1
MANAGEMENT’S DISCUSSION AND ANALYSIS .................................................................................. 3
FINANCIAL STATEMENTS
STATEMENT OF NET POSITION ..................................................................................................... 10
STATEMENT OF REVENUES, EXPENSES AND CHANGES IN NET POSITION........................... 12
STATEMENT OF CASH FLOWS....................................................................................................... 13
NOTES TO FINANCIAL STATEMENTS ............................................................................................ 15
REQUIRED SUPPLEMENTARY INFORMATION (UNAUDITED)
SCHEDULE OF FUNDING PROGRESS ........................................................................................... 32
SUPPLEMENTARY INFORMATION
SCHEDULE OF EXPENDITURES OF FEDERAL AWARDS ............................................................ 33
NOTES TO SCHEDULE OF FEDERAL EXPENDITURES OF FEDERAL AWARDS....................... 34
INDEPENDENT AUDITOR’S REPORT ON INTERNAL CONTROL OVER FINANCIAL REPORTING AND ON COMPLIANCE AND OTHER MATTERS BASED ON AN AUDIT OF FINANCIAL STATEMENTS PERFORMED IN ACCORDANCE WITH GOVERNMENT AUDITING STANDARDS........................................................................................ 35
INDEPENDENT AUDITOR’S REPORT ON COMPLIANCE FOR EACH MAJOR FEDERAL PROGRAM; REPORT ON INTERNAL CONTROL OVER COMPLIANCE .................... 37
SCHEDULE OF FINDINGS AND QUESTIONED COSTS................................................................. 39
SCHEDULE OF PRIOR AUDIT FINDINGS ....................................................................................... 42

INDEPENDENT AUDITOR’S REPORT
Board of DirectorsIndianapolis Public Transportation CorporationIndianapolis, Indiana
Report on the Financial Statements
We have audited the accompanying financial statements of the Indianapolis Public Transportation Corporation (IPTC) (a municipal corporation and a component unit of the consolidated City of Indianapolis-Marion County Government Reporting Entity), as of and for the year ended December 31, 2014, and the related notes to the financial statements, which collectively comprise IPTC’s basic financial statements as listed in the table of contents.
Management’s Responsibility for the Financial Statements
Management is responsible for the preparation and fair presentation of these financial statements in accordance with accounting principles generally accepted in the United States of America; this includes the design, implementation, and maintenance of internal control relevant to the preparation and fair presentation of financial statements that are free from material misstatement, whether due to fraud or error.
Auditor’s Responsibility
Our responsibility is to express opinion on these financial statements based on our audit. We conducted our audit in accordance with auditing standards generally accepted in the United States of America and the standards applicable to financial audits contained in Government Auditing Standards, issued by the Comptroller General of the United States, and the Guidelines for Audits of State and Local Governments by Authorized Independent Public Accountants, issued by the Indiana State Board of Accounts. Those standards require that we plan and perform the audit to obtain reasonable assurance about whether the financial statements are free from material misstatement.
An audit involves performing procedures to obtain audit evidence about the amounts and disclosures in the financial statements. The procedures selected depend on the auditor’s judgment, including the assessment of the risks of material misstatement of the financial statements, whether due to fraud or error. In making those risk assessments, the auditor considers internal control relevant to the entity’s preparation and fair presentation of the financial statements in order to design audit procedures that are appropriate in the circumstances, but not for the purpose of expressing an opinion on the effectiveness of the entity’s internal control. Accordingly, we express no such opinion. An audit also includes evaluating the appropriateness of accounting policies used and the reasonableness of significant accounting estimates made by management, as well as evaluating the overall presentation of the financial statements.
We believe that the audit evidence we have obtained is sufficient and appropriate to provide a basis for our audit opinion.
(Continued)
1.

Opinion
In our opinion, the financial statements referred to above present fairly, in all material respects, the financial position of IPTC, as of December 31, 2014, and the changes in its financial position and its cash flows thereof for the year then ended in accordance with accounting principles generally accepted in the United States of America.
Other Matters
Required Supplementary Information
Accounting principles generally accepted in the United States of America require that the Management’s Discussion and Analysis on pages 3 through 9 and the Schedule of Funding Progress on page 32, be presented to supplement the financial statements. Such information, although not a part of the basic financial statements, is required by Governmental Accounting Standards Board who considers it to be an essential part of financial reporting for placing the basic financial statements in an appropriate operational, economic, or historical context. We have applied certain limited procedures to the required supplementary information in accordance with auditing standards generally accepted in the United States of America, which consisted of inquiries of management about the methods of preparing the information and comparing the information for consistency with management’s responses to our inquiries, the basic financial statements, and other knowledge we obtained during our audit of the basic financial statements. We do not express an opinion or provide any assurance on the information because the limited procedures do not provide us with sufficient evidence to express an opinion or provide any assurance.
Supplementary Information
Our audit was conducted for the purpose of forming an opinion on the financial statements that collectively comprise IPTC’s basic financial statements. The schedule of expenditures of federal awards as required by U.S. Office of Management and Budget Circular A-133, Audits of States, Local Governments, and Non-Profit Organizations is presented for purposes of additional analysis and are not a required part of the financial statements.
The schedule of expenditures of federal awards is the responsibility of management and was derived from and relates directly to the underlying accounting and other records used to prepare the basic financial statements. Such information has been subjected to the auditing procedures applied in the audit of the basic financial statements and certain additional procedures, including comparing and reconciling such information directly to the underlying accounting and other records used to prepare the basic financial statements or to the basic financial statements themselves, and other additional procedures in accordance with auditing standards generally accepted in the United States of America. In our opinion, the schedule of expenditures of federal awards is fairly stated, in all material respects, in relation to the basic financial statements as a whole.
Other Reporting Required by Government Auditing Standards
In accordance with Government Auditing Standards, we have also issued our report dated June 22, 2015on our consideration of IPTC’s internal control over financial reporting and on our tests of its compliance with certain provisions of laws, regulations, contracts, and grant agreements and other matters. The purpose of that report is to describe the scope of our testing of internal control over financial reporting and compliance and the results of that testing, and not to provide an opinion on internal control over financial reporting or on compliance. That report is an integral part of an audit performed in accordance with Government Auditing Standards in considering IPTC’s internal control over financial reporting and compliance.
Crowe Horwath LLPIndianapolis, IndianaJune 22, 2015
2.

MANAGEMENT’S DISCUSSION AND ANALYSIS

Wait inside our shelters.

INDIANAPOLIS PUBLIC TRANSPORTATION CORPORATIONMANAGEMENT’S DISCUSSION AND ANALYSIS
Year ended December 31, 2014
This section of the annual financial report presents a discussion and analysis of the Indianapolis Public Transportation Corporation’s (IPTC’s) financial performance for the year ended December 31, 2014.Please read this section in conjunction with the IPTC financial statements in the section that follows. For more detailed information on long-term debt activity and capital asset activity please refer to the relevant disclosures in the notes accompanying the basic financial statements.
FINANCIAL HIGHLIGHTS
• IPTC’s assets exceeded its liabilities at December 31, 2014 by $74.8 million (net position). Of this amount, $14.4 million (unrestricted net position) may be used to meet IPTC’s ongoing obligations arising from providing transportation service to the community.
• Fare revenues for 2014 increased 2 percent over that of the prior year.• FTA capital contributions for 2014 increased 8 percent from that of the prior year.• IPTC received donated land from the City of Indianapolis appraised at $5.6 million to construct a
downtown transit center. • FTA local operating and planning grants and preventative maintenance funding for 2014 increased
by 8 percent over that of the prior year. • Operating expenses before depreciation increased 7 percent from the prior year.• Net position increased approximately $9.0 million, or 14 percent.
OVERVIEW OF THE FINANCIAL STATEMENTS
This annual financial report consists of four parts: management’s discussion and analysis (this section), the basic financial statements, the notes to the financial statements and required supplementary information.
The financial statements are prepared on an accrual basis in conformity with accounting principles generally accepted in the United States of America (GAAP) as applied to governmental units operating as an Enterprise Fund. Under this basis of accounting, revenues are recognized in the period in which they are earned, expenses are recognized in the period in which they are incurred, and depreciation of assets is recognized in the Statements of Revenue, Expense, and Changes in Net Position. All assets and liabilities associated with the operation of the IPTC are included in the Statement of Net Position.
The financial statements provide both short and long-term information about the IPTC’s overall financial status. The financial statements include notes to provide more detailed information on important activities. Please refer to these notes for more in depth and detailed information.
(Continued)
3.

INDIANAPOLIS PUBLIC TRANSPORTATION CORPORATIONMANAGEMENT’S DISCUSSION AND ANALYSIS
Year ended December 31, 2014
FINANCIAL STATEMENT ANALYSIS
Net Position
The IPTC’s total assets at December 31, 2014 were approximately $91.0 million. This represents anincrease of approximately 13 percent from the prior year. Liabilities approximated $16.6 million, an increase of 22 percent for 2014. The overall increase in liabilities is attributed to a significant increase in accounts and contract services payable over the prior year.
Approximately $42.6 million, or 58 percent, of the net position reflects investments in capital assets, less related debt. Approximately $17.8 million, or 24 percent, of the net position is restricted for the future acquisition of capital assets. Approximately $13.0 million, or 18 percent, may be used to meet IPTC’s ongoing obligations arising from providing transportation services to the community.
TABLE 1 - NET POSITION2014 2013
Assets:Current assets $ 23,442,946 $ 22,927,122Capital assets (net) 49,419,241 40,880,339Other non-current assets 18,102,486 16,407,920
Total Assets $ 90,964,673 $ 80,215,381
Liabilities:Current liabilities $ 14,060,702 $ 8,085,703Non-current liabilities 3,535,177 6,349,360
Total liabilities 17,595,879 14,435,063
Net position:Net investment in capital assets 42,647,303 36,110,326Restricted 17,760,498 16,092,365Unrestricted 12,960,993 13,577,627
Total net position 73,368,794 65,780,318Total liabilities and net position $ 90,964,673 $ 80,215,381
(Continued)
4.

INDIANAPOLIS PUBLIC TRANSPORTATION CORPORATIONMANAGEMENT’S DISCUSSION AND ANALYSIS
Year ended December 31, 2014
Changes in Net Position
The change in net position for 2014 represents an increase of approximately $7.6 million, or 12 percent. Of this amount, total revenues increased approximately $9.3 million, or 16 percent. This increase is mainly attributed to a $9.2 million increase in capital grants. Overall operating expenses, excluding depreciation increased $4.8 million, or 8 percent. This increase is primarily attributed to an increase in bus service in 2014.
TABLE 2 - CHANGES IN NET POSITION2014 2013
Operating revenuesPassenger fares $ 11,617,150 $ 11,354,576Advertising 519,732 383,631
Total operating revenues 12,136,882 11,738,207
Non-operating revenues (expenses)Property and excise tax 31,729,423 33,105,656Municipalities 10,877,058 10,842,244FTA Assistance 11,855,317 11,017,598Contributions – capital grants 12,021,795 2,836,387Other net revenues (expenses) 87,036 (134,156)
Total non-operating revenues 66,570,629 57,667,729
Total revenues 78,707,511 69,405,936
Operating expensesTransportation 32,424,781 29,733,176Maintenance of equipment, including fuel 18,932,576 17,098,609Administrative and general 10,311,180 10,208,449Claims and insurance 1,566,982 1,334,836Depreciation 7,883,516 7,293,959
Total operating expenses 71,119,035 65,669,029
Change in net position 7,588,476 3,736,907
Total net position, beginning of year 65,780,318 62,043,411
Total net position, end of year $ 73,368,914 $ 65,780,318
(Continued)
5.

INDIANAPOLIS PUBLIC TRANSPORTATION CORPORATIONMANAGEMENT’S DISCUSSION AND ANALYSIS
Year ended December 31, 2014
Revenues: For 2014, total operating revenues increased approximately $400,000, or 3 percent. Non-operating revenue, excluding capital grant contributions and other revenue (expenses), decreased by approximately $500,000, or 1 percent.
48% Property & Excise Tax 18% FTA Assistance
16% Municipalities 18% Operating Revenue
The revenues and percentages presented exclude “Contributions-capital grants” of $12,021,795 and “Other net revenues (expenses)” of $87,036.
31,729,423
10,877,05811,855,317 12,136,882
2014 Revenue Sources
(Continued)
6.

INDIANAPOLIS PUBLIC TRANSPORTATION CORPORATIONMANAGEMENT’S DISCUSSION AND ANALYSIS
Year ended December 31, 2014
Expenses: Total operating expenses, excluding depreciation, are approximately $63.2 million for 2014.This is an increase of $4.8 million, or 8 percent from prior year. This increase is primarily attributed to increased services added in 2014.
51% Transportation 16% Administration
30%Maintenance & Equip, including fuel 3%
Claims and Insurance
The expenses and percentages presented exclude “depreciation” expense of $7,883,516.
32,424,781
18,932,576
10,311,180
1,566,982
2014 Expenses
(Continued)
7.

INDIANAPOLIS PUBLIC TRANSPORTATION CORPORATIONMANAGEMENT’S DISCUSSION AND ANALYSIS
Year ended December 31, 2014
CAPITAL ASSET AND DEBT ADMINISTRATION
Capital AssetsAs of December 31, 2014, IPTC had invested approximately $49.4 million in capital assets, net of accumulated depreciation. Compared to the prior year, this amount represents an increase of approximately $8.5 million. Capital acquisitions for the year were about $23.8 million with retirements of about $1.1 million. Please refer to Note 3 of the financial statements included in the next section of this report for additional information regarding capital assets activity.
Management has concentrated on making capital investments in equipment and technology that can be effective in improving service and reducing operating costs. These projects can be implemented only because of the availability of Federal capital funding and the establishment of the cumulative capital fund to provide the local match for Federal capital grants.
Significant capital asset acquisitions during 2014 included 13 used and remanufactured articulated buses totaling approximately $5.2 million and downtown transit center activity as discussed on the following page.
Percentage allocation invested in capital assets:
5% Land 37% Buildings
5%Construction in Progress 44%
Revenue Vehicles
9% Other Equipment
5% 5%
37%44%
9%
(Continued)
8.

INDIANAPOLIS PUBLIC TRANSPORTATION CORPORATIONMANAGEMENT’S DISCUSSION AND ANALYSIS
Year ended December 31, 2014
CAPITAL ASSET AND DEBT ADMINISTRATION (Continued)
• For several years, IPTC has been working with local officials and consulting teams to identify the best location to operate a downtown transit center. In 2011, a site evaluation was conducted at a location in close proximity to current multimodal services (i.e. trains, buses, park and ride, pedestrian and bike). Operational plans for transit services from this site were considered and validated for future development. IPTC has signed a contract and has started construction work for the downtown Transit Center. During 2014, the City of Indianapolis gifted IPTC the land, appraised at $5.6 million, where the transit center will be located. As of December 31, 2014, IPTC has incurred approximately $3.7 millionin downtown transit center construction in process.
Debt Disclosures
As of December 31, 2014, IPTC had approximately $4.6 million of notes and bonds payable. During 2014,bonds and notes payable were repaid pursuant to the maturity schedule of each issue. As of December 31, 2014, IPTC had no financial restrictive covenants associated with its outstanding debt. Please refer to Note 4 of the financial statements included in next section of this report for additional information regarding debt activity.
CURRENTLY KNOWN FACTS
Other than the uncertainty of general economic indicators on IPTC, its funding sources, and its customers, there are no significant facts, decisions or conditions that are expected that management believes will have a significant impact on the financial position or results of operations.
The economic environment in which IPTC operates continues to present management with major challenges in sustaining the level and quality of transit service. Management remains concerned over risingvariable operating costs such as fuel and health care benefits. Sufficient growth in our revenue sources is necessary to keep pace with the increase in variable costs.
9.

Ride IndyGo.

FINANCIAL STATEMENTS

INDIANAPOLIS PUBLIC TRANSPORTATION CORPORATION(A COMPONENT UNIT OF THE CONSOLIDATED CITY OF INDIANAPOLIS
MARION COUNTY GOVERNMENT REPORTING ENTITY)STATEMENT OF NET POSITION
December 31, 2014
ASSETSCurrent assetsCash and cash equivalents (Note 2):
Working capital $ 7,913,339Restricted – debt service 562,081Liability reserve accounts 5,021,504
Total cash and cash equivalents 13,496,924
Receivables:Federal grants 6,022,752Operations receivables, net 411,207
Total receivables 6,433,959
Other current assets:Materials and supplies inventory, net 3,025,913Deposits and prepaid expenses 486,150
Total other current assets 3,512,063
Total current assets 23,442,946
Noncurrent assetsRestricted Cash – capital asset acquisition (Note 2) 11,185,488Restricted Investments – capital asset acquisition (Note 2) 6,575,010Net other post-employment benefit asset (Note 11) 341,988
Capital assets (Note 3):Non-depreciable assets:
Land 6,975,654Construction in progress 7,253,735
Total non-depreciable assets 14,229,389Depreciable assets:
Buildings and improvements 51,859,730Revenue vehicles and equipment 61,217,557Other equipment 13,002,020
Total depreciable assets 126,079,307Total capital assets 140,308,696
Accumulated depreciation (90,889,455)Capital assets, net of depreciation 49,419,241
Total noncurrent assets 67,521,727
Total assets $ 90,964,673
See accompanying notes to financial statements.
10.

INDIANAPOLIS PUBLIC TRANSPORTATION CORPORATION(A COMPONENT UNIT OF THE CONSOLIDATED CITY OF INDIANAPOLIS
MARION COUNTY GOVERNMENT REPORTING ENTITY)STATEMENT OF NET POSITION
December 31, 2014
LIABILITIES AND NET POSITIONCurrent liabilities
Accounts and contract services payable $ 8,917,815Accrued payroll and benefits 1,119,663Unearned fare revenue 363,716Notes payable (Note 4) 1,316,186Bonds payable, net of premium (Note 4) 1,627,507Risk management – unpaid claim estimates (Note 5) 460,000Federal grantor reimbursement payable 255,815Environmental remediation liability (Note 8) -
Total current liabilities 14,060,702
Noncurrent liabilitiesBonds payable (Note 4) 1,680,000Risk management – unpaid claim estimate (Note 5) 29,170Environmental remediation liability (Note 8) 1,826,007
Total noncurrent liabilities 3,535,177Total liabilities 17,595,879
Net positionNet investment in capital assets 42,647,303Restricted for capital assets acquisition 17,760,498Unrestricted 12,960,993
Total net position 73,368,794
Total liabilities and net position $ 90,964,673
See accompanying notes to financial statements.
11.

INDIANAPOLIS PUBLIC TRANSPORTATION CORPORATION(A COMPONENT UNIT OF THE CONSOLIDATED CITY OF INDIANAPOLIS
MARION COUNTY GOVERNMENT REPORTING ENTITY)STATEMENT OF REVENUES, EXPENSES AND CHANGES IN NET POSITION
Year ended December 31, 2014
Operating revenuesPassenger fares $ 11,617,150Advertising 519,732
Total operating revenues 12,136,882
Operating expensesTransportation 32,424,781Maintenance of equipment, including fuel 18,932,576Administrative and general 10,311,180Claims and insurance 1,566,982Depreciation 7,883,516
Total operating expenses 71,119,035
Operating loss (58,982,153)
Non-operating revenues (expenses)Operating assistance:
Property and excise tax 31,729,423Municipalities 10,877,058FTA and local operating and planning grants, and preventative maintenance funding 11,855,317
Other net revenues (expenses) (Note 7) 87,036Total non-operating revenue 54,548,834
Change in net position before capital contribution (4,433,319)
Contributions - capital grants 12,021,795
Change in net position 7,588,476
Net position, beginning of year 65,780,318
Net position, end of year $ 73,368,794
See accompanying notes to financial statements.
12.

INDIANAPOLIS PUBLIC TRANSPORTATION CORPORATION(A COMPONENT UNIT OF THE CONSOLIDATED CITY OF INDIANAPOLIS
MARION COUNTY GOVERNMENT REPORTING ENTITY)STATEMENT OF CASH FLOWSYear ended December 31, 2014
Cash flows from operating activitiesReceipts from customers $ 12,193,552Payments for transportation (32,424,781)Payments for maintenance of equipment, including fuel (16,906,553)Payments for administrative and general (10,607,613)Claims and insurance paid to external parties (1,457,229)
Net cash used by operating activities (49,202,624)
Cash flows from noncapital financing activitiesProperty and excise tax distributions 31,729,423Assistance from municipalities 10,877,058FTA operating assistance 8,929,363Interest paid on notes payable (3,558)
Net cash provided by noncapital financing activities 51,532,286
Cash flows from capital and related financing activitiesCapital grant receipts 6,313,130Purchases of capital assets (7,735,967)Proceeds on sale of capital assets 56,483Principal paid on bonds payable (1,415,000)Interest paid on bonds payable (135,415)
Net cash used by capital and related financing activities (2,916,769)
Cash flows from investing activitiesPurchases of investments (613,453)Proceeds from sale of investments 1,225,307Interest received on cash and cash equivalents 104,036
Net cash provided by investing activities 697,890
Net increase in cash and cash equivalents 110,783
Cash and cash equivalents, beginning of year 24,571,629
Cash and cash equivalents, end of year $ 24,682,412
Statement of Net Position Presentation:Cash and cash equivalents – current assets $ 13,496,924Cash – noncurrent assets 11,185,488
Cash and cash equivalents, end of year $ 24,682,412
See accompanying notes to financial statements.
13.

INDIANAPOLIS PUBLIC TRANSPORTATION CORPORATION(A COMPONENT UNIT OF THE CONSOLIDATED CITY OF INDIANAPOLIS
MARION COUNTY GOVERNMENT REPORTING ENTITY)STATEMENT OF CASH FLOWSYear ended December 31, 2014
Reconciliation of operating loss to net cash used byoperating activities:
Operating loss $ (58,982,153)
Adjustments to reconcile loss to net cash and cash equivalents:Depreciation expense 7,883,516
Changes in assets and liabilities:Other receivables 21,069Materials and supplies inventory (224,597)Deposits and prepaid expense 422,186Other post-employment benefit asset (26,433)Accounts and contract services payable 1,870,895Accrued payroll and benefits (42,461)Unearned fare revenue 35,601Risk management 109,753Pension arbitration liability (270,000)
Net cash used by operating activities $ (49,202,624)
Supplemental schedule of noncash investing and financing activities:
Capital assets in accounts payable $ 3,464,431Payment of note payable via transfer of other assets 263,557Donated land 5,600,000
See accompanying notes to financial statements.
14.

INDIANAPOLIS PUBLIC TRANSPORTATION CORPORATION(A COMPONENT UNIT OF THE CONSOLIDATED CITY OF INDIANAPOLIS
MARION COUNTY GOVERNMENT REPORTING ENTITY)NOTES TO FINANCIAL STATEMENTS
December 31, 2014
NOTE 1 - SUMMARY OF SIGNIFICANT ACCOUNTING POLICIES
Reporting Entity: IPTC operates in one business segment, public transportation, as an enterprise fund. IPTC's purpose is to acquire, provide and maintain an urban mass transportation system for the metropolitan Indianapolis area. Indianapolis Public Transportation Corporation (IPTC) d/b/a IndyGo was formed on August 7, 1973 by City-County Council General Ordinance No. 36 as a municipal corporation, which has no stockholders, under the provisions of IC 36-9-4. Management of IPTC has determined that it is a component unit of the Consolidated City of Indianapolis-Marion County Government Reporting Entity in accordance with Governmental Accounting Standards Board (GASB) Statement No. 14 and amended by Statement No. 61 and is considered financially accountable to such reporting entity.
The Board of Directors of IPTC consists of seven members, three of whom are appointed by the Mayor of the City of Indianapolis (Mayor) and four of whom are appointed by the City of Indianapolis-Marion County Council (Council). The IPTC Board designates the management of IPTC, namely the General Manager, the Assistant General Managers and the other principal members of the management staff. The IPTC Board adopts the budget, tax levy, and the issuance of debt. In addition, the Council approves the budget,tax levy, and the issuance of debt.
Basis of Accounting: The operations of IPTC are accounted for as an enterprise fund on an accrual basis in order to recognize the flow of economic resources. Under this basis, revenues are recognized in the period in which they are earned, expenses are recognized in the period in which they are incurred, depreciation of assets is recognized, and all assets and liabilities associated with the operation of IPTC are included in the statement of net position. The principal operating revenues of IPTC are passenger fares. IPTC also recognizes as operating revenue the fees collected from advertisements on IPTC property and miscellaneous operating revenues. Operating expenses for IPTC include the costs of operating the transit system, administrative expenses, and depreciation on capital assets. All revenues and expenses not meeting this definition are reported as non-operating revenues and expenses. IPTC’s policy is to apply externally restricted funds first when an expense is incurred for purposes for which both restricted and unrestricted net position is available.
The Governmental Accounting Standards Board (GASB) is the accepted standard-setting body for establishing governmental accounting and financial reporting principles.
Use of Estimates in Preparation of Financial Statements: The preparation of financial statements inconformity with accounting principles generally accepted in the United States of America (GAAP) requires management to make estimates and assumptions that affect the reported amounts of assets and liabilities and disclosure of contingent assets and liabilities at the date of the financial statements and the reported amount of revenues and expenses during the reporting period. Actual results could differ from those estimates.
Cash Equivalents: For purposes of the statement of cash flows, IPTC considers all liquid investments (including restricted assets) with maturity of three months or less when purchased to be cash equivalents. At December 31, 2014, cash equivalents consisted of demand and money market deposit accounts.
Receivables: Management has recorded an allowance of $10,000 for operating receivables. Management has not made a provision for an allowance for uncollectible property tax receivables or federal grants receivables.
(Continued)
15.

INDIANAPOLIS PUBLIC TRANSPORTATION CORPORATION(A COMPONENT UNIT OF THE CONSOLIDATED CITY OF INDIANAPOLIS
MARION COUNTY GOVERNMENT REPORTING ENTITY)NOTES TO FINANCIAL STATEMENTS
December 31, 2014
NOTE 1 - SUMMARY OF SIGNIFICANT ACCOUNTING POLICIES (Continued)
Materials and Supplies Inventory: Materials and supplies inventories are valued at the lower of average cost (determined on a first-in, first-out basis) or market.
Restricted Assets: Certain cash, cash equivalents and investment balances are restricted as follows:
• Capital Asset Acquisition Accounts: Proceeds from the sale of the Indianapolis Local Public Improvement Bond Bank Bonds, Series 2011C and Series 2012C issued by the Indianapolis Local Public Improvement Bond Bank and capital asset acquisition funds generated as a separate tax (cumulative funds) are restricted to expenditures for the acquisition of additional revenue vehicles and other capital equipment. In 2004, IPTC established a cumulative transportation fund under IC 36-9-4-48 setting forth a separate tax levy for the acquisition of capital assets.
• Liability Reserve Accounts: Funds deposited in these accounts are set aside from the general operations of IPTC and used only for the payment of claims arising from accidents involving IPTC that exceed $100,000.
• Debt Service Account: Funds deposited in these accounts are set aside to be used for the purpose of payments of debt.
Investments: In accordance with Indiana Code Section 5-12 et sequal, it is the policy of the IPTC to deposit public funds into the depositories approved by the Marion County Board of Finance. IPTC is further authorized by statute to invest in obligations of the U. S. Treasury and U. S. Agencies, certificates of deposit, repurchase agreements, passbook savings, money market deposit accounts, and negotiable order of withdrawal accounts. It is the internal policy of IPTC to invest funds with local, federally insured banks that have a principal office within the County and have been approved by the County Board of Finance.
Capital Assets: Major items of capital assets acquired with federal, state and local funds are capitalized at cost. IPTC adheres to the FTA circular regarding capitalization of assets by capitalizing all assets with a value in excess of $5,000 per unit and a useful life in excess of one year and IPTC adheres to the FTA capitalization policy as appropriate for items which are (a) homogeneous and not individually identifiable; (b) may or may not have a units cost meeting the threshold level for a capitalized asset but where the practice is to purchase in groups and capitalize the total group; and (c) will be maintained together or in the same general area, should be listed by homogeneous grouping. Examples include desks, cubicles, file cabinets, furniture, office equipment, and certain technology hardware. Expenditures for maintenance and repairs are charged to operations as incurred. IPTC recognizes depreciation on capital assets on a straight-line basis over the estimated useful lives of the assets, as follows:
YearsLand improvements 10Buildings and shelters 10 to 25Coaches:
Large bus 12Body on chassis 3 to 5
Autos and trucks 3 to 10Fare handling and maintenance equipment 3 to 10Office furniture and equipment 2 to 20
Net Position: GASB Statement 34 requires the classification of net position into three components – net investment in capital assets; restricted; and unrestricted. These net position classifications are defined as follows:
• Net investment in capital assets - This component consists of capital assets, net of accumulated depreciation reduced by the outstanding balances of any bonds, notes, or other borrowings that are attributable to the acquisition, construction, or improvement of those assets.
(Continued)16.
INDIANAPOLIS PUBLIC TRANSPORTATION CORPORATION(A COMPONENT UNIT OF THE CONSOLIDATED CITY OF INDIANAPOLIS
MARION COUNTY GOVERNMENT REPORTING ENTITY)NOTES TO FINANCIAL STATEMENTS
December 31, 2014
NOTE 1 - SUMMARY OF SIGNIFICANT ACCOUNTING POLICIES (Continued)
• Restricted - This component consists of external constraints placed on net position imposed by creditors (such as through debt covenants), contributors, or laws or regulations of other governments or constraints imposed by law through constitutional provisions or enabling legislation. IPTC has restricted net position for capital asset acquisition. If both restricted and unrestricted resources are to be used for the same purpose, restricted resources will be applied first.
• Unrestricted - This component of net position consists of net position that does not meet the definition of “restricted” or “net investment in capital assets.”
Revenue Recognition: Passenger fares are recorded as revenue at the time such services are performed and revenues pass through the fare box. Sales of tickets are recorded initially as unredeemed fares and recognized as income upon passage through the fare box.
Property Taxes: IPTC records property taxes as earned in the year they are due and payable. Taxes are levied separately for operations, capital asset acquisitions, and debt service. All taxable property located within the IPTC taxing district is assessed annually March 1. In mid-April of the year subsequent to the assessment, individual property tax statements are to be mailed by the Marion County Treasurer to the owners of record as of the assessed valuation date. Taxes are payable to the Treasurer in equal installments on or before May 10 and November 10 of the year subsequent to assessment. The Treasurer remits collections to IPTC and other governmental units within the county.
Capital and Operating Grants: Certain expenditures for capital acquisitions, improvements and development of an urban mass transportation system have received significant federal funding through the Federal Transit Administration (FTA). The balance of such expenditures is funded through state and local sources. Funds provided by governmental authorities for capital and operating assistance are recorded when earned.
Expense Classification: Expenses have been classified using functional and activity classifications using direct costs and estimated indirect cost allocations based upon time allocation and benefit.
Risk Management Claims: Property damage claims and liabilities for personal injury are recognized as incurred based on the estimated cost to IPTC upon resolution.
Compensated Absences: Essentially all employees receive compensation for vacations, holidays, illness and certain other qualifying absences. The number of days compensated for the various categories of absence is based generally on length of service. Vacation leave, which has been earned and vested but not paid, has been accrued in the accompanying financial statements. Compensation for holiday and other qualifying absences is not accrued in the accompanying financial statements because rights to such compensation amounts either do not accumulate or they do not vest.
Accumulated unused sick leave benefits are non-vesting and are only paid out upon retirement. The maximum accumulation per employee is 1,800 hours and the maximum paid out per employee is 540 hours. Accumulated unused sick leave benefits are accrued based upon historical information, for employees with at least one year of service regardless of age.
Commitments: IPTC entered into fixed unit cost fuel contracts for the purchase of 1,448,100 gallons of fuel. Total fuel cost commitment under these contracts was $4,533,321 at December 31, 2014.
During 2014, IPTC entered into a commitment not to exceed $17.98 million for construction projects. At December 31, 2014, the remaining commitment on these projects is approximately $13.59 million.
(Continued)17.
INDIANAPOLIS PUBLIC TRANSPORTATION CORPORATION(A COMPONENT UNIT OF THE CONSOLIDATED CITY OF INDIANAPOLIS
MARION COUNTY GOVERNMENT REPORTING ENTITY)NOTES TO FINANCIAL STATEMENTS
December 31, 2014
NOTE 1 - SUMMARY OF SIGNIFICANT ACCOUNTING POLICIES (Continued)
Implementation of New Accounting Standards: In June 2012, the GASB issued Statement 67, Financial Reporting for Pension Plans. This Statement replaces the requirements of Statement 25, Financial Reporting for Defined Benefit Pension Plans and Note Disclosures for Defined Contribution Plans and Statement 50, Pension Disclosures, as they relate to pension plans that are administered through trusts or similar arrangements meeting certain criteria. The Statement builds upon the existing framework for financial reports of defined benefit pension plans, which includes a statement of fiduciary net position (the amount held in a trust for paying retirement benefits) and a statement of changes in fiduciary net position. Statement 67 enhances note disclosures and RSI for both defined benefit and defined contribution pension plans. Statement 67 also requires the presentation of new information about annual money-weighted rates of return in the notes to the financial statements and in 10-year RSI schedules. The implementation of this Statement did not have a material impact on IPTC.
In January 2013, the GASB issued Statement 69, Government Combinations and Disposals of Government Operations. The objective of this Statement is to improve accounting and financial reporting for U.S. stateand local governments’ combinations and disposals of government operations. Government combinations include mergers, acquisitions, and transfers of operations. A disposal of government operations can occur through a transfer to another government or a sale. The implementation of this Statement did not have a material impact on IPTC.
In April 2013, the GASB issued Statement No. 70, Accounting and Financial Reporting for Nonexchange Financial Guarantees. This Statement (1) requires a government that extends a nonexchange financial guarantee to recognize a liability when qualitative factors and historical data, if any, indicate that it is more likely than not that the government will be required to make a payment on the guarantee; (2) requires a government that has issued an obligation guaranteed in a nonexchange transaction to recognize revenue to the extent of the reduction in its guaranteed liabilities, and (3) specifies the information required to be disclosed by governments that extend nonexchange financial guarantees, and (4) requires new information to be disclosed by governments that receive non-exchange financial guarantees. The implementation of this Statement did not have a material impact on IPTC.
New Pronouncements Not Yet Implemented:
In June 2012, the GASB issued Statement 68, Accounting and Financial Reporting for Pensions. This Statement replaces the requirements of Statement No. 27, Accounting for Pensions by State and Local Governmental Employers and Statement No. 50, Pension Disclosures, as they relate to governments that provide pensions through pension plans administered as trusts or similar arrangements that meet certain criteria. Statement 68 requires governments providing defined benefit pensions to recognize their long-term obligation for pension benefits as a liability for the first time, and to more comprehensively and comparably measure the annual costs of pension benefits. The Statement also enhances accountability and transparency through revised and new note disclosures and required supplementary information (RSI). This Statement will be effective for IPTC in the year ending December 31, 2015. Management has not determined what impact, if any, this GASB statement might have on its financial statements.
In November 2013, GASB issued Statement No. 71, Pension Transition for Contributions Made Subsequent to the Measurement Date. The objective of this Statement is to address an issue regarding application of the transition provisions of Statement No. 68, Accounting and Financial Reporting for Pensions. The requirements of this statement should be applied simultaneously with the provisions of Statement 68. Management has not determined what impact, if any, this GASB statement might have on its financial statements.
(Continued)18.

INDIANAPOLIS PUBLIC TRANSPORTATION CORPORATION(A COMPONENT UNIT OF THE CONSOLIDATED CITY OF INDIANAPOLIS
MARION COUNTY GOVERNMENT REPORTING ENTITY)NOTES TO FINANCIAL STATEMENTS
December 31, 2014
NOTE 1 - SUMMARY OF SIGNIFICANT ACCOUNTING POLICIES (Continued)
In addition, GASB issued GASB Statement No. 72, Fair Value Measurement and Application, which addresses accounting and financial reporting issues related to fair value measurements, GASB Statement No. 73, Accounting and Financial Reporting for Pensions and Related Assets That Are Not within the Scope of GASB Statement 68, and Amendments to Certain Provisions of GASB Statements 67 and 68, which completes the suite of pension standards, GASB Statement No. 74, Financial Reporting for Postemployment Benefit Plans Other Than Pension Plans, which addresses reporting by OPEB plans that administer benefits on behalf of governments, and GASB Statement No. 75, Accounting and Financial Reporting for Postemployment Benefits Other Than Pensions, which addresses reporting by governments that provide OPEB to their employees and for governments that finance OPEB for employees of other governments. These statements will not be effective until future years and management has not determined what impact, if any, these GASB’s statement might have on its financial statements.
NOTE 2 - CASH, CASH EQUIVALENTS AND INVESTMENTS
Cash, cash equivalents and investments are reported in the accompanying statements of net position asof December 31, 2014 as follows:
2014
Current assetsCash and cash equivalents
Working capital $ 7,913,339Restricted – debt service 562,081Liability reserve 5,021,504
Noncurrent assets:Restricted Cash – Capital asset acquisition 11,185,488Restricted Investments – Capital asset acquisition 6,575,010
$ 31,257,422
Cash and cash equivalents $ 24,682,412Investments 6,575,010
$ 31,257,422
Deposits: IPTC maintains cash and cash equivalents deposits with area financial institutions. A summary of these deposits at December 31, 2014 is as follows:
----------------2014----------------Carrying Bank
Value Balance
On hand $ 1,300 $ -Cash deposits:
Insured by FDIC 1,954,971 1,954,971Insured by IPDIF 22,726,141 22,843,651
$ 24,682,412 $ 24,798,622
During the year ended December 31, 2014, IPTC held interest bearing demand deposit accounts and interest bearing savings accounts with Indiana financial institutions. Demand deposits are fully insured by the Federal Depository Insurance Corporation (FDIC) or by the Indiana Public Deposits Insurance Fund(IPDIF).
(Continued)19.

INDIANAPOLIS PUBLIC TRANSPORTATION CORPORATION(A COMPONENT UNIT OF THE CONSOLIDATED CITY OF INDIANAPOLIS
MARION COUNTY GOVERNMENT REPORTING ENTITY)NOTES TO FINANCIAL STATEMENTS
December 31, 2014
NOTE 2 - CASH, CASH EQUIVALENTS AND INVESTMENTS (Continued)
The following summarizes the IPTC’s policies on deposit and investment activity:
Investment Policy and Legal and Contractual Provisions Governing Cash Deposits and Investments: In accordance with Indiana Code Section 5-12 et sequal, it is the policy of the IPTC to deposit public funds into the depositories approved by the Marion County Board of Finance. IPTC is further authorized by statute to invest in obligations of the U. S. Treasury and U. S. Agencies, certificates of deposit, repurchase agreements, passbook savings, money market deposit accounts, and negotiable order of withdrawal accounts. It is the internal policy of IPTC to invest funds with local, federally insured banks that have a principal office within the County and have been approved by the County Board of Finance. IPTC does not have specific investment policies on interest rate risk, credit risk, concentration of credit risk, custodial credit risk, or foreign currency risk.
Interest Rate Risk: Interest rate risk is the risk that changes in interest rates will adversely affect the fair value of the investments. The nature of IPTC deposits and investments do not present high exposure to interest rate market risks due to their short term nature. At December 31, 2014, IPTC had the following investments and maturities:
------Maturities (in Years)------Investment Type Fair Value Less than 1 1 - 5
Certificates of Deposit $ 2,015,590 $ 1,514,285 $ 501,305Government-backed Mortgage Notes 4,559,420 3,507,595 1,051,825
$ 6,575,010 $ 5,021,880 $ 1,553,130
Credit Risk and Custodial Credit Risk: Credit risk is the risk that an issuer or other counterparty to an investment will not fulfill its obligations. Custodial credit risk is the risk that the IPTC will not be able to recover the value of its deposits, investments or collateral securities that are in the possession of an outside party if the counter party fails. Deposits are exposed to custodial credit risk if they are not covered by depository insurance and the deposits are uncollateralized or collateralized with securities held by the pledging financial institution. At December 31, 2014, the IPTC’s investments, along with their respective ratings from Moody’s Investor Services, were as follows:
Investment Type Fair Value Credit Rating
Certificates of Deposit $ 2,015,590 UnratedGovernment-backed Mortgage Notes 4,559,420 Aaa
$ 6,575,010
(Continued)20.

INDIANAPOLIS PUBLIC TRANSPORTATION CORPORATION(A COMPONENT UNIT OF THE CONSOLIDATED CITY OF INDIANAPOLIS
MARION COUNTY GOVERNMENT REPORTING ENTITY)NOTES TO FINANCIAL STATEMENTS
December 31, 2014
NOTE 2 - CASH, CASH EQUIVALENTS AND INVESTMENTS (Continued)
Concentration of Credit Risk: Concentration of credit risk is the risk of loss that may arise in the event of default by a single issuer. IPTC places no limit on the amount IPTC may invest in any one issuer. The following table shows investment in issuers and the representative percentage of total investments at December 31, 2014:
Investment Type Fair Value % (rounded)
Certificates of Deposit:BMW Bank North America $ 250,090 3.8%Discover Bank 251,852 3.8%GE Capital Bank 249,452 3.8%Key Bank 250,398 3.8%Merrick Bank 250,150 3.8%National Bank of Indianapolis 513,500 7.8%Synovus Bank Georgia 250,148 3.8%
Government-back Mortgage Notes:Fannie Mae 3,542,355 53.9%Freddie Mac 1,017,065 15.5%
$ 6,575,010
Foreign Currency Risk: Foreign currency risk is the risk that changes in exchange rates will adversely affect the fair value of an investment or a deposit. All IPTC deposits and investments are denominated in United States currency.
NOTE 3 - CHANGES IN CAPITAL ASSETS
A summary of changes in capital assets as follows:
Balance BalanceJanuary 1, Changes During Year December 31,
2014 Additions Reductions 2014Capital Assets Cost:
Non-Depreciable Assets:Land $ 1,375,654 $ 5,600,000 $ - $ 6,975,654Construction in progress* 3,771,654 10,822,422 (7,340,341) 7,253,735
5,147,308 16,422,422 (7,340,341) 14,229,389Depreciable Assets:Buildings and improvements 51,360,458 499,272 - 51,859,730Revenue vehicles and equipment 54,511,283 6,773,592 (67,318) 61,217,557Other equipment 14,004,850 67,477 (1,070,307) 13,002,020
119,876,591 7,340,341 (1,137,625) 126,079,307
Total capital assets $ 125,023,899 $ 23,762,763 $ (8,477,966) $ 140,308,696
(Continued)21.

INDIANAPOLIS PUBLIC TRANSPORTATION CORPORATION(A COMPONENT UNIT OF THE CONSOLIDATED CITY OF INDIANAPOLIS
MARION COUNTY GOVERNMENT REPORTING ENTITY)NOTES TO FINANCIAL STATEMENTS
December 31, 2014
NOTE 3 - CHANGES IN CAPITAL ASSETS (Continued)
Balance BalanceJanuary 1, Changes During Year December 31,
2014 Additions Reductions 2014Accumulated Depreciation:
Depreciable Assets:Buildings and improvements $ (36,348,089) $ (2,502,045) $ - $(38,850,134)Revenue vehicles and equipment (35,552,969) (4,253,289) 67,318 (39,738,940)Other equipment (12,242,502) (1,128,182) 1,070,303 (12,300,381)
Total accumulated depreciation $ (84,143,560) $ (7,883,516) $ 1,137,621 $(90,889,455)
Total capital assets,net of depreciation $ 40,880,339 $ 15,879,243 $ (7,340,431) $ 49,419,241
*Construction in progress also includes capital assets not placed in service such as revenue vehicles and equipment.
NOTE 4 - DEBT OBLIGATIONS
The following disclosure provides detail on IPTC debt obligations. At December 31, 2014, IPTC debt consisted of bonds payable and notes payable. Changes were as follows:
Balance BalanceJanuary 1, Changes During Year December 31,
2014 Additions Reductions 2014 Noncurrent Current
Bonds payable $ 4,675,000 $ - $ (1,415,000) $ 3,260,000 $ 1,680,000 $ 1,580,000Bond premium 95,013 - (47,506) 47,507 - 47,507Notes payable 1,549,420 30,975 (264,209) 1,316,186 - 1,316,186
$ 6,319,433 $ 30,975 $ (1,726,715) $ 4,623,693 $ 1,680,000 $ 2,943,693
Bonds Payable: Bonds consist of the Indianapolis Local Public Improvement Bond Bank Bonds, Series 2009C and 2012A. The amounts outstanding at December 31, 2014 are as follows:
2014
Series 2009C $ 875,000Series 2012A 2,385,000
Less: Current portion 1,580,000
Noncurrent portion $ 1,680,000
(Continued)22.

INDIANAPOLIS PUBLIC TRANSPORTATION CORPORATION(A COMPONENT UNIT OF THE CONSOLIDATED CITY OF INDIANAPOLIS
MARION COUNTY GOVERNMENT REPORTING ENTITY)NOTES TO FINANCIAL STATEMENTS
December 31, 2014
NOTE 4 - DEBT OBLIGATIONS (Continued)
Series 2009C Bonds - The Indianapolis Local Public Improvement Bond Bank Bonds, Series 2009C, dated August 4, 2009, were issued in the aggregate principal amount of $8,045,000, at a premium of $303,081. Proceeds were used to provide local matching funds for FTA grants to acquire new and replacement coaches and other vehicles and equipment and to perform preventative maintenance on equipment and rehabilitation of the facility. Bond proceeds were also used to refund the Series 1999CBonds.
The Series 2009C Bonds bear interest rates varying from 2.75% to 4%, payable on January 10 and July 10 commencing January 10, 2010 and have serial maturities through 2015. The bonds are not subject to optional redemption prior to maturity dates.
Debt service requirements to maturity for the outstanding bonds are as follows:
Years Ending December 31 Principal Interest Total
2015 875,000 35,000 910,000
$ 875,000 $ 35,000 $ 910,000
Bond interest expense on Series 2009C Bonds was $91,600 for the year ended December 31, 2014.
Series 2012A Bonds - The Indianapolis Local Public Improvement Bond Bank Bonds, Series 2012A, dated February 15, 2012, were issued in the aggregate principal amount of $3,100,000. The Series 2012A Bonds proceeds were used to redeem Series 2002C Bonds in 2012. The Series 2012A Bonds bear interest at 2.05%, payable on January 10 and July 10 commencing July 10, 2012 and have serial maturities from 2012 through 2016. The bonds are not subject to optional redemption prior to maturity dates.
Debt service requirements to maturity for the outstanding bonds are as follows:
Years Ending December 31 Principal Interest Total
2015 705,000 66,472 771,4722016 1,680,000 34,440 1,714,440
$ 2,385,000 $ 100,912 $ 2,485,912
Bond interest expense on Series 2012A Bonds was $43,815 for the year ended December 31, 2014.
(Continued)23.

INDIANAPOLIS PUBLIC TRANSPORTATION CORPORATION(A COMPONENT UNIT OF THE CONSOLIDATED CITY OF INDIANAPOLIS
MARION COUNTY GOVERNMENT REPORTING ENTITY)NOTES TO FINANCIAL STATEMENTS
December 31, 2014
NOTE 4 - DEBT OBLIGATIONS (Continued)
Notes Payable: Notes payable consists of two agreements described as follows:
City of Indianapolis Loan Agreement - In 2004, IPTC entered into a $2 million loan agreement with the City of Indianapolis to provide working capital to cover operating expenses, to prevent service reductions in bus routes, to provide alternative forms of transportation for passengers affected byplanned route changes, and review existing routes to plan for needed service change.
In 2007, an agreement was executed to extend the loan. As extended, the loan was payable no later than December 31, 2010. Concurrent with the extension of the agreement, the City expressly waived repayment of interest that had been accrued from date of origination through the date of extension of the agreement amounting to $105,500.
During 2010, IPTC entered into an agreement with the City of Indianapolis that replaces the 2007 loan extension agreement. The new loan agreement extended the due date to December 31, 2011, providedfor interest at 2% per annum and provided a mechanism for repayment including investing in capital assets that are mutually beneficial to the City of Indianapolis and IPTC and providing tickets for City employees and beneficiaries of City programs.
The agreement has been amended in previous years to extend the maturity date. In 2013, the amendment extended the maturity date of the loan to December 31, 2015. Management estimates thereduction of the loan to be $1,316,186 in 2015.
Interest expense for the year ended December 31, 2014 was $30,975 and has been accrued in the balance of the loan. During 2014, IPTC provided $224,739 of passenger bus tickets for the benefit of the City of Indianapolis and $38,818 in investments in capital assets which reduced the outstanding loan balance. The balance of the loan at December 31, 2014 was $1,316,186.
Line of credit: During 2014, IPTC entered into a $7 million line of credit agreement to fund future operating costs. The line matures on December 31, 2015. Interest on the line is payable upon maturity at a rate of 30-day LIBOR plus 0.75%. No borrowings were made on the line during 2014 and no outstanding balance existed as of December 31, 2014.
(Continued)24.

INDIANAPOLIS PUBLIC TRANSPORTATION CORPORATION(A COMPONENT UNIT OF THE CONSOLIDATED CITY OF INDIANAPOLIS
MARION COUNTY GOVERNMENT REPORTING ENTITY)NOTES TO FINANCIAL STATEMENTS
December 31, 2014
NOTE 5 - RISK MANAGEMENT
IPTC is exposed to various risks of loss related to theft of, damage to and destruction of assets; errors and omissions; and natural disasters for which IPTC carries commercial insurance and maintains certain risks. Detail of the claims liability, based upon the requirements of GASB Statement No. 10, is provided below. This requires that a liability for claims be reported if information before the issuance of the financialstatements indicates that it is probable that a liability has been incurred at the date of the financial statements and the amount of the liability can be reasonably estimated. The liability is estimated based upon historical experience. There is no significant incremental claim adjustment expense, salvage, or subrogation attributable to this liability. Activity for the year ended December 31, 2014 was as follows:
2014 2013
Unpaid claims, beginning of year $ 379,417 $ 637,841Incurred claims and changes in claim estimates 1,595,795 1,095,119Claim payments (1,486,042) (1,353,543)
Unpaid claims, end of year $ 489,170 $ 379,417
Current portion $ 460,000 $ 348,417Noncurrent portion 29,170 31,000
Unpaid claims, end of year $ 489,170 $ 379,417
On December 23, 1986, IPTC's Board of Directors approved the establishment of a non-reverting fund (Liability Reserve Accounts) for payment of personal injury and property damage claims in excess of $100,000. For claims in excess of $100,000, the amount of the claim exceeding $100,000 will be paid out of the liability reserve accounts. Claims up to $100,000 will be paid out of the general accounts of IPTC. IPTC is self-insured for worker's compensation without limitation and is entirely self-insured for personal injury. It is completely self-insured for property damage to coaches.
Estimates of expected losses to IPTC resulting from personal injuries for which claims have been filed or for which it is anticipated claims will be filed, have been recorded in the financial statements. Litigation occasionally results from such claims. When, in the opinion of management, such litigation will result in a loss to IPTC, provision is made in the financial statements for loss expected upon resolution. There were no significant reductions in insurance coverage during 2014 and there were no settlements that exceeded insurance coverage during 2014, 2013, or 2012 for those risks that IPTC purchased insurance.
NOTE 6 - OPERATING LEASES
IPTC is obligated under certain leases through December 2017 for the Transit Store premise, parking premises and maintenance and office equipment that are accounted for as operating leases. Lease rental expense for the year ended December 31, 2014 was $123,444. A schedule of future minimum operating lease payments required that have initial or remaining lease terms in excess of one year as of December 31, 2014:
Year Ending December 31:2015 $ 110,3522016 20,8922017 4,482
$ 135,726
(Continued)25.

INDIANAPOLIS PUBLIC TRANSPORTATION CORPORATION(A COMPONENT UNIT OF THE CONSOLIDATED CITY OF INDIANAPOLIS
MARION COUNTY GOVERNMENT REPORTING ENTITY)NOTES TO FINANCIAL STATEMENTS
December 31, 2014
NOTE 7 - OTHER NON-OPERATING REVENUE (EXPENSE)
Other non-operating revenue (expense) consisted of the following:
2014
Other revenues:Investment income $ 40,450Miscellaneous 169,028Pass-through grants for sub-recipients 907,965
1,117,443
Other expenses:Interest - payable from restricted debt service assets 135,415Interest - payable from unrestricted assets 34,533Amortization of bond premium (47,506)Pass-through grants to sub-recipients 907,965
1,030,407
$ 87,036
NOTE 8 - ENVIRONMENTAL REMEDIATION LIABILITY
The IPTC has had discussions with the Indiana Department of Environmental Management regarding a contamination remediation issue traced to leaking underground storage tanks. The cost of remediation is based upon current site knowledge/conditions, past remediation experience of site’s with similar environmental issues, and the current IDEM regulations. The estimate is based on the expectation that a remediation system(s) will be required from the site to meet closure criteria under the IDEM RISC Program’s Industrial Closure Criteria with an environmental deed restriction placed on the property.
Activity for the year ended December 31, 2014 was as follows:
2014
Environmental remediation liability, beginning of year $ 1,826,007Decreases/Payments -
Unpaid claims, end of year $ 1,826,007
Current liability portion $ -Noncurrent liability portion 1,826,007
Unpaid claims, end of year $ 1,826,007
(Continued)26.

INDIANAPOLIS PUBLIC TRANSPORTATION CORPORATION(A COMPONENT UNIT OF THE CONSOLIDATED CITY OF INDIANAPOLIS
MARION COUNTY GOVERNMENT REPORTING ENTITY)NOTES TO FINANCIAL STATEMENTS
December 31, 2014
NOTE 9 - BENEFIT PLANS – DEFINED CONTRIBUTION AND DEFERRED COMPENSATION
Defined Contribution Plan: IPTC maintains a defined-contribution plan, the Indianapolis Public Transportation Corporation Pension Plan, for the benefit of substantially all of its employees. All employees who are regularly scheduled to work at least 30 hours per week become eligible for the Plan on the first day of the month following commencement of employment or completion of any applicable probationary period. The Plan may be amended by action of IPTC’s Board of Directors, subject to any applicable collective bargaining agreement obligations. The plan requires the employees to contribute 3.0% of their compensation in order to receive the 3.0% employer match. Participant contributions for 2014 were $658,626. Employer contributions for 2014 were $578,549.
Deferred Compensation Plan: IPTC maintains an IRS Code Section 457 plan, the Indianapolis Public Transportation Corporation Deferred Compensation Plan. Employees become eligible to participate in the Plan on the first day of the second month following commencement of employment or completion of any applicable probationary period. The Plan allows for employee contributions only. Plan assets are held in a trust separate from IPTC’s assets. Contributions by employees to the Plan were approximately $208,922for the year ended December 31, 2014.
NOTE 10 – BENEFIT PLANS – DEFINED BENEFIT PENSION
Defined Benefit Pension Plan: IPTC provides pension benefits through a single-employer defined-benefit exempt governmental plan known as the Indianapolis Public Transportation Corporation Pension Plan. The Plan is part of an agreement between IPTC and ATU. Effective December 31, 1997, the Plan was amended to freeze all accrued benefits. Full-time IPTC employees who had completed sixty working days of continuous service, on or before December 31, 1997, were eligible to participate in the Plan. For purposes of computing normal retirement benefits, employees’ total earnings through December 31, 1997, wasconsidered. In addition, effective December 31, 1997, the Plan was amended to remove the disability benefit provisions.
On January 10, 2006, a binding interest arbitration award was issued regarding the single-employer defined-benefit exempt governmental plan (Defined Benefit Pension Plan). The arbitration award effectively modified the existing plan agreement for retirees, participants, Indianapolis Public Transportation Corporation and Amalgamated Transit Union, Local 1070.
IPTC, prior to this award, was not legally obligated to make any further contributions to this plan. Subsequent to this award, IPTC was obligated to contribute $1,500,000 to the plan over a ten-year period ending 2015. IPTC contributed the final $270,000 to the plan in 2014 and IPTC no longer has a pension arbitration liability at December 31, 2014.
Normal retirement benefits are payable for employees who have attained age 65 and completed 15 years of service. Early retirement benefits are available for employees who have attained age 55 and completed 15 years of continuous service. Employees are considered 100% vested upon reaching early retirement eligibility.
Prior to December 31, 1997, the normal retirement benefit was equal to 2.75% of total employee earnings since January 1, 1950, plus .75% of the average annual earnings of the occupation group to which the employee belonged for the five years preceding 1950, multiplied by the years of continuous service prior to 1950. Early retirement benefits were available at reduced amounts. Participating employees contributed 3.5% of total compensation to the Plan, and the IPTC contributed 3.5% of the total compensation of the participating employees. Employees' contributions plus interest is to be refunded in the event of separation of service or death.
(Continued)27.

INDIANAPOLIS PUBLIC TRANSPORTATION CORPORATION(A COMPONENT UNIT OF THE CONSOLIDATED CITY OF INDIANAPOLIS
MARION COUNTY GOVERNMENT REPORTING ENTITY)NOTES TO FINANCIAL STATEMENTS
December 31, 2014
NOTE 10 – BENEFIT PLANS – DEFINED BENEFIT PENSION (Continued)
Funding Policy: After December 31, 1997, there were no contribution requirements for either the employer or the employees. Before the Plan was frozen, the contribution requirements of Plan members and IPTC were established by an agreement between IPTC and Local 1070 of the ATU. Contribution requirements were not actuarially determined, but rather were set at 3.5% of annual covered payroll each for employees and the employer.
The binding interest arbitration award, described above, allows for certain participants to be returned contributions they made to the plan without interest and are to be withdrawn for future participation in this plan. Vested participants are to remain in the defined benefit plan while actively employed at IPTC and began making contributions to the plan at a rate of 4.5%. The employer matches their contributions up to 3.5%. Participants remaining in the defined benefit plan will not be allowed to make future contributions to their defined contribution accounts.
The interest arbitration award eliminated the early retirement provision previously provided for in the defined benefit plan.
Annual Pension Cost and Net Pension Obligation: Because the Plan was frozen as of December 31, 1997, and because, before the freeze, the contribution requirements were not actuarially determined, many of the accounting and disclosure requirements of GASB Statement No. 27, Accounting for Pensions by State and Local Governmental Employers, are not applicable. There are no annual required contributions for 2014 and no annual pension cost. IPTC has determined that it has no pension liability (asset) at transition as defined by GASB Statement No. 27.
At December 31, 2014, the Plan’s fiduciary net position, or fair value of Plan assets was $10,539,481 compared to a total pension liability of $10,939,287, resulting in a net pension liability of $399,806. This obligation remains that of the Plan rather than of IPTC. In the event that the Plan does not attain full funding, pursuant to the Plan agreement, the net position of the Plan will first be applied to repay individual employee contributions in excess of any employee contributions previously disbursed. The remainder of net position will be distributed in the proportion that each employee’s actuarially determined accrued benefit has to the accrued benefits of all covered employees.
The Plan’s obligation was determined as part of the December 31, 2014 actuarial valuation using the aggregate actuarial cost method. The actuarial assumptions included a 6.5% investment rate of return (net of administrative expenses) and projected salary increases of 3% and inflation of 2.3%. The projected benefit equals the employee’s actual benefit (based on total compensation through December 31, 1997) with no future benefit accruals. Three-year trend information for the plan reflects that IPTC has no annual required contribution, annual pension cost or net pension obligation.
The entry age normal cost method does not identify or separately amortize unfunded actuarial accrued liabilities. Information about funded status and funding progress is presented using the entry age actuarial cost method. The information presented is intended to serve as a surrogate for the funded status and funding progress of the plan.
(Continued)28.

INDIANAPOLIS PUBLIC TRANSPORTATION CORPORATION(A COMPONENT UNIT OF THE CONSOLIDATED CITY OF INDIANAPOLIS
MARION COUNTY GOVERNMENT REPORTING ENTITY)NOTES TO FINANCIAL STATEMENTS
December 31, 2014
NOTE 11 - POST-EMPLOYMENT BENEFITS OTHER THAN PENSIONS
Plan Description: The Plan consists of IPTC providing medical and life insurance benefits to retirees. Retirees under the 1997 program and their spouses under the age of 65 not covered by Medicare are eligible under the provisions to continue these benefits but must pay 20% of the medical premium. COBRA eligible, or employees who are not receiving pay from the Corporation must submit the employee’s portion, or the COBRA premiums, to Human Resources no later than the first day of the month the premium is due to retain insurance coverage. IPTC will pay $75 per month towards the COBRA continuation or conversion of group health insurance retained by any employee who retires early or is on disability with IPTC pension. If, after the 18th month of continuation group coverage, the retiree is still under the age of 65, IPTC reimburses the retiree up to a maximum of $225 on a quarterly basis towards the cost of the premiums. Retirees also qualify for a life insurance policy with benefits of $5,500 if they retire on or after the age of 55 with at least 15 years of service. This post-employment benefit plan is of the single employee defined benefit variety.
Funding Policy: There is no requirement for IPTC to fund these benefits though IPTC has recorded the cumulative difference between the annual required contributions (ARC) and amounts contributed to the OPEB plan as a net asset. The following schedule reports ARC and actual contributions made for the past three years:
Annual ActualYear Ended Required Contribution Percentage
December 31 Contribution Made Contributed
2014 $ 69,500 $ 84,100 121%2013 58,260 77,200 133%2012 63,790 97,900 153%
Annual OPEB Cost and net OPEB Obligation (Asset): The other post-employment benefit (OPEB) cost is calculated based on the annual required contribution of the employer (ARC), an amount actuarially determined in accordance with the parameters of GASB Statement 45. The ARC represents a level of funding that, if paid on an ongoing basis, is projected to cover normal cost each year and amortize any unfunded actuarial liabilities over a period not to exceed thirty years. The following table shows the components of the annual cost for the year, the amount actually contributed to the plan and changes in the net OPEB asset:
Annual required contribution $ 69,500Interest on net OPEB asset (11,833)Annual OPEB cost 57,667Contributions made (84,100)
Increase in net OPEB asset (26,443)Net OPEB asset – beginning of year (315,555)
Net OPEB asset – end of year $ (341,988)
Funded Status and Funding Progress: As of December 31, 2014, the actuarial accrued liability for benefits was $1,514,000 and the actuarial value of assets was $0 resulting in an unfunded actuarial accrued liability (UAAL) of $1,514,000. The covered payroll (annual payroll of active employees covered by the plan) was not applicable, and the ratio of the UAAL to the covered payroll was not applicable.
(Continued)29.

INDIANAPOLIS PUBLIC TRANSPORTATION CORPORATION(A COMPONENT UNIT OF THE CONSOLIDATED CITY OF INDIANAPOLIS
MARION COUNTY GOVERNMENT REPORTING ENTITY)NOTES TO FINANCIAL STATEMENTS
December 31, 2014
NOTE 11 - POST-EMPLOYMENT BENEFITS OTHER THAN PENSIONS (Continued)
Actuarial valuations of an ongoing plan involve estimates of the value of reported amounts and assumptions about the probability of occurrence of events far into the future. Examples include assumptions about future employment, mortality, and the healthcare cost trend. Amounts determined regarding the funded status of the plan and the annual required contributions of the employer are subject to continual revision as actual results are compared with past expectations and new estimates are made about the future. The schedule of funding progress, presented as required supplementary information following the notes to the financial statements, presents multiyear trend information about whether the actuarial valuation of plan assets is increasing or decreasing over time relative to the actuarial accrued liabilities for benefits. Since 2007, the first year that an actuarial valuation was performed, the schedule of funding progress reflects only the transition year’s data.
Actuarial Methods and Assumptions: Projections of benefits for financial reporting purposes are based on the substantive plan (the plan understood by the employer and the plan members) and include the types of benefits provided at the time of each valuation and the historical pattern of sharing of benefit costs between the employer and the plan members to that point. The actuarial methods and assumptions used include techniques that are designed to reduce the effects of short-term volatility in actuarial accrued liabilities and the actuarial value of asset, consistent with the long-term perspective of the calculations.
The actuarial cost method used for determining the benefit obligations is the Unit Credit Actuarial Cost Method. Under this method, the actuarial present value of projected benefits is the value of benefits expected to be paid for current actives and retirees and is calculated based on the assumptions described in this report and census data. The Actuarial Accrued Liability (AAL) is the actuarial present value of benefits attributed to employee service rendered prior to the valuation date. The AAL equals the present value of benefits multiplied by a fraction equal to service to date over service at expected retirement. The Normal Cost is the actuarial present value of benefits attributed to one year of service. This equals the present value of benefits divided by service at expected retirement. Since retirees are not accruing any more service, their normal cost is zero. In determining the Annual Required Contribution, the Unfunded
AAL is amortized over 30 years from the valuation date on an open basis in level percent of pay payments.The actuarial assumptions are summarized below:
Measurement Date: December 31, 2014
Discount Rate: 3.75% compounded annually
Compensation Increase Rate: 3.00%, compounded annually increase
Mortality: Pre-Retirement: RP-2014 Blue Collar Employee mortality Rates set forward 1 year, projected to the valuation date using Scale BB. Separate rates for males and females.
Post-Retirement: RP-2014 Blue Collar Healthy Annuitant mortality rates set forward 1 year, projected to the valuation date using Scale BB. Separate rates for males and females.
Post-Disability: RP-2014 Disabled mortality rates set forward 1 year, projected to the valuation date using Scale BB. Separate rates for males and females as appropriate.
(Continued)30.

INDIANAPOLIS PUBLIC TRANSPORTATION CORPORATION(A COMPONENT UNIT OF THE CONSOLIDATED CITY OF INDIANAPOLIS
MARION COUNTY GOVERNMENT REPORTING ENTITY)NOTES TO FINANCIAL STATEMENTS
December 31, 2014
NOTE 11 - POST-EMPLOYMENT BENEFITS OTHER THAN PENSIONS (Continued)
Employee Turnover/Withdrawal: Crocker-Sarason T-4 Table
Disablement: 1965 Railroad Retirement Board Disability Table
Retirement Rates: Age %55 2.5%
56-59 1%60 5%61 1%62 30%63 10%64 20%
65+ 100%
Life Insurance Premium: $2.66/mo./$1000 of coverage
31.

IndyGo has 31 fixed routes.

REQUIRED SUPPLEMENTARY INFORMATION (UNAUDITED)

INDIANAPOLIS PUBLIC TRANSPORTATION CORPORATION(A COMPONENT UNIT OF THE CONSOLIDATED CITY OF INDIANAPOLIS
MARION COUNTY GOVERNMENT REPORTING ENTITY)REQUIRED SUPPLEMENTARY INFORMATION
SCHEDULE OF FUNDING PROGRESSDECEMBER 31, 2014
Schedule of Funding Progress: Retiree Health and Life Insurance Plan
Actuarial Accrued Unfunded UAAL as aActuarial Value of Liability AAL Funded Covered percentage ofValuation Assets (AAL) (UAAL) Ratio Payroll Covered Payroll
Date (a) (b) (b-a) (a/b) (c) ((b-a)/c)
12/31/2014 0 1,514,000 1,514,000 0% N/A N/A
12/31/2013 0 1,461,000 1,461,000 0% N/A N/A
12/31/2012 0 1,514,000 1,514,000 0% N/A N/A
32.

SUPPLEMENTARY INFORMATION

Relax on IndyGo.

INDIANAPOLIS PUBLIC TRANSPORTATION CORPORATION(A COMPONENT UNIT OF THE CONSOLIDATED CITY OF INDIANAPOLIS
MARION COUNTY GOVERNMENT REPORTING ENTITY)SCHEDULE OF EXPENDITURES OF FEDERAL AWARDS
Year Ended December 31, 2014
AmountsFederal Grantor/ CFDA Federal Awarded toProgram or Cluster Title Number Expenditures Subrecipients
Department of Transportation Federal Transit AdministrationDirect programs:
Federal Transit Cluster:Capital Investment Grants 20.500 $ 2,532,279 $ -Formula Grants 20.507 14,811,740 -Bus and Bus Facilities
Formula Program 20.526 27,192 -Total Federal Transit Cluster 17,371,211 -
Transit Services Programs Cluster:Enhanced Mobility of Seniors and
Individuals with Disabilities 20.513 75,664 -Job Access and Reverse Commuter
Program 20.516 367,421 453,087New Freedom Program 20.521 515,607 437,374
Total Transit Services Programs Cluster 958,692 890,461
Alternatives Analysis 20.522 17,504 17,504
National Infrastructure Investments 20.933 837,670 -
Total Expenditures of Federal Awards $ 19,185,077 $ 907,965
See accompanying notes to the schedule of expenditures of federal awards.
33.

INDIANAPOLIS PUBLIC TRANSPORTATION CORPORATION(A COMPONENT UNIT OF THE CONSOLIDATED CITY OF INDIANAPOLIS
MARION COUNTY GOVERNMENT REPORTING ENTITY)NOTES TO SCHEDULE OF EXPENDITURES OF FEDERAL AWARDS
Year Ended December 31, 2014
NOTE 1 - BASIS OF PRESENTATION
The accompanying Schedule of Expenditures of Federal Awards includes the federal grant activity of IPTC, for the year ended December 31, 2014 and is presented on the accrual basis of accounting. The information in this schedule is presented in accordance with the requirements of OMB Circular A-133, Audits of States, Local Governments, and Non-Profit Organizations. Therefore, some amounts presented in this schedule may differ from amounts presented in, or used in the preparation of, the financial statements.
NOTE 2 - MATCHING COSTS
Matching costs, i.e., the nonfederal share of program costs, are not included in the accompanying Schedule of Expenditures of Federal Awards.
NOTE 3 - SUBRECIPIENTS
In OMB Circular A-133, subrecipients are defined as nonfederal entities that expend federal awards received from a pass-through entity to carry out a federal program, but do not benefit from that program. IPTC passed through certain amounts to subrecipients, which are identified in the Schedule of Expenditures of Federal Awards.
34.

INDEPENDENT AUDITOR’S REPORT ON INTERNAL CONTROL OVER FINANCIAL REPORTING AND ON COMPLIANCE AND OTHER MATTERS BASED ON AN AUDIT
OF FINANCIAL STATEMENTS PERFORMED IN ACCORDANCE WITH GOVERNMENT AUDITING STANDARDS
Board of DirectorsIndianapolis Public Transportation CorporationIndianapolis, Indiana
We have audited, in accordance with the auditing standards generally accepted in the United States of America, the standards applicable to financial audits contained in Government Auditing Standards issued by the Comptroller General of the United States, and the Guidelines for Audits of State and Local Governments by Authorized Independent Public Accountants, issued by the Indiana State Board of Accounts, the financial statements of Indianapolis Public Transportation Corporation (IPTC) (a municipal corporation and a component unit of the consolidated City of Indianapolis-Marion County Government Reporting Entity) as of and for the year ended December 31, 2014, and the related notes to the financial statements, which collectively comprise IPTC’s basic financial statements, and have issued our report thereon dated June 22, 2015.
Internal Control Over Financial Reporting
In planning and performing our audit of the financial statements, we considered IPTC’s internal control over financial reporting (internal control) to determine the audit procedures that are appropriate in the circumstances for the purpose of expressing our opinion on the financial statements, but not for the purpose of expressing an opinion on the effectiveness of IPTC’s internal control. Accordingly, we do not express an opinion on the effectiveness of IPTC’s internal control.
Our consideration of internal control was for the limited purpose described in the preceding paragraph and was not designed to identify all deficiencies in internal control that might be material weaknesses or significant deficiencies and therefore, material weaknesses or significant deficiencies may exist that were not identified. However, as described in the accompanying Schedule of Findings and Questioned Costs,we identified certain deficiencies in internal control that we consider to be material weaknesses.
A deficiency in internal control exists when the design or operation of a control does not allow management or employees, in the normal course of performing their assigned functions, to prevent, or detect and correct, misstatements on a timely basis. A material weakness is a deficiency, or a combination of deficiencies, in internal control such that there is a reasonable possibility that a material misstatement of the entity’s financial statements will not be prevented, or detected and corrected on a timely basis. A significant deficiency is a deficiency, or a combination of deficiencies, in internal control that is less severe than a material weakness, yet important enough to merit attention by those charged with governance. We consider the deficiencies described in the accompanying schedule of findings and questioned costs to be material weaknesses. (Findings 2014-001 and 2014-002)
(Continued)
35.

Compliance and Other Matters
As part of obtaining reasonable assurance about whether IPTC's financial statements are free of material misstatement, we performed tests of its compliance with certain provisions of laws, regulations, contracts, and grant agreements, noncompliance with which could have a direct and material effect on the determination of financial statement amounts. However, providing an opinion on compliance with those provisions was not an objective of our audit, and accordingly, we do not express such an opinion. The results of our tests disclosed no instances of noncompliance or other matters that are required to be reported under Government Auditing Standards.
IPTC’s Response to Findings
IPTC’s responses to the findings identified in our audit are described in the accompanying Schedule of Findings and Questioned Costs. IPTC’s responses were not subjected to the auditing procedures applied in the audit of the financial statements and, accordingly, we express no opinion on them.
Purpose of this Report
The purpose of this report is solely to describe the scope of our testing of internal control over financial reporting and compliance and the results of that testing, and not to provide an opinion on the effectiveness of the entity’s internal control or on compliance. This report is an integral part of an audit performed in accordance with Government Auditing Standards in considering the entity’s internal control and compliance. Accordingly, this communication is not suitable for any other purpose.
Crowe Horwath LLP
Indianapolis, IndianaJune 22, 2015
36.

INDEPENDENT AUDITOR’S REPORT ON COMPLIANCE FOR EACH MAJOR FEDERAL PROGRAM; REPORT ON INTERNAL CONTROL OVER COMPLIANCE
Board of DirectorsIndianapolis Public Transportation CorporationIndianapolis, Indiana
Report on Compliance for Each Major Federal Program
We have audited Indianapolis Public Transportation Corporation’s compliance with the types of compliance requirements described in the OMB Circular A-133 Compliance Supplement that could have a direct and material effect on each of IPTC’s major federal programs for the year ended December 31, 2014. IPTC’s major federal programs are identified in the summary of auditor’s results section of the accompanying Schedule of Findings and Questioned Costs.
Management’s Responsibility
Management is responsible for compliance with the requirements of laws, regulations, contracts, and grants applicable to its federal programs.
Auditor’s Responsibility
Our responsibility is to express an opinion on compliance for each of IPTC’s major federal programs based on our audit of the types of compliance requirements referred to above. We conducted our audit of compliance in accordance with auditing standards generally accepted in the United States of America; the standards applicable to financial audits contained in Government Auditing Standards, issued by the Comptroller General of the United States; and OMB Circular A-133, Audits of States, Local Governments, and Non-Profit Organizations. Those standards and OMB Circular A-133 require that we plan and perform the audit to obtain reasonable assurance about whether noncompliance with the types of compliance requirements referred to above that could have a direct and material effect on a major federal program occurred. An audit includes examining, on a test basis, evidence about IPTC’s compliance with those requirements and performing such other procedures as we considered necessary in the circumstances.
We believe that our audit provides a reasonable basis for our opinion on compliance for each major federal program. However, our audit does not provide a legal determination of IPTC’s compliance.
Opinion on Each Major Federal Program
In our opinion, IPTC complied, in all material respects, with the types of compliance requirements referred to above that could have a direct and material effect on each of its major federal programs for the year ended December 31, 2014.
(Continued)
37.

Report on Internal Control Over Compliance
Management of IPTC is responsible for establishing and maintaining effective internal control over compliance with the types of compliance requirements referred to above. In planning and performing our audit of compliance, we considered IPTC’s internal control over compliance with the types of requirements that could have a direct and material effect on each major federal program to determine the auditing procedures that are appropriate in the circumstances for the purpose of expressing an opinion on compliance for each major federal program and to test and report on internal control over compliance in accordance with OMB Circular A-133, but not for the purpose of expressing an opinion on the effectiveness of internal control over compliance. Accordingly, we do not express an opinion on the effectiveness of IPTC’s internal control over compliance.
A deficiency in internal control over compliance exists when the design or operation of a control over compliance does not allow management or employees, in the normal course of performing their assigned functions, to prevent, or detect and correct, noncompliance with a type of compliance requirement of afederal program on a timely basis. A material weakness in internal control over compliance is a deficiency, or combination of deficiencies, in internal control over compliance, such that there is a reasonable possibility that material noncompliance with a type of compliance requirement of a federal program will not be prevented, or detected and corrected, on a timely basis. A significant deficiency in internal control over compliance is a deficiency, or a combination of deficiencies, in internal control over compliance with a type of compliance requirement of a federal program that is less severe than a material weakness in internal control over compliance, yet important enough to merit attention by those charged with governance.
Our consideration of internal control over compliance was for the limited purpose described in the first paragraph of this section and was not designed to identify all deficiencies in internal control over compliance that might be material weaknesses or significant deficiencies. We did not identify any deficiencies in internal control over compliance that we consider to be material weaknesses. However, material weaknesses may exist that have not been identified.
The purpose of this report on internal control over compliance is solely to describe the scope of our testing of internal control over compliance and the results of that testing based on the requirements of OMB Circular A-133. Accordingly, this report is not suitable for any other purpose.
Crowe Horwath LLP
Indianapolis, IndianaJune 22, 2015
38.

INDIANAPOLIS PUBLIC TRANSPORTATION CORPORATION(A COMPONENT UNIT OF THE CONSOLIDATED CITY OF INDIANAPOLIS
MARION COUNTY GOVERNMENT REPORTING ENTITY)SCHEDULE OF FINDINGS AND QUESTIONED COSTS
DECEMBER 31, 2014
SECTION 1 – SUMMARY OF AUDITOR’S RESULTS
Financial Statements
Type of auditor’s report issued: Unmodified
Internal control over financial reporting:
Material weakness(es) identified? X Yes No
Significant deficiencies identified not considered to be material weaknesses? Yes X None Reported
Noncompliance material to financial statements noted? Yes X No
Federal Awards
Internal Control over major programs:
Material weakness(es) identified? Yes X No
Significant deficiencies identified not considered to be material weaknesses? Yes X None Reported
Type of auditor’s report issued on compliance for major programs: Unmodified
Any audit findings disclosed that are required to be reported in accordance with Section .510(a) ofOMB Circular A-133? Yes X No
Identification of major programs:
CFDA Number(s) Name of Federal Program or Cluster
20.500, 20.507, 20.526 Federal Transit Cluster
20.933 National Infrastructure Investments
Dollar threshold used to distinguish between Type A and Type B programs: $575,552
Auditee qualified as low-risk auditee? Yes X No
(Continued)
39.

INDIANAPOLIS PUBLIC TRANSPORTATION CORPORATION(A COMPONENT UNIT OF THE CONSOLIDATED CITY OF INDIANAPOLIS
MARION COUNTY GOVERNMENT REPORTING ENTITY)SCHEDULE OF FINDINGS AND QUESTIONED COSTS
DECEMBER 31, 2014
SECTION 2 - FINDINGS RELATING TO THE FINANCIAL STATEMENTS WHICH ARE REQUIRED TO BE REPORTED IN ACCORDANCE WITH GAGAS
FINDING 2014-001 - Controls over Financial Reporting (Material Weakness)
Condition and Criteria: Management is responsible to have internal controls in place to provide appropriate and reliable financial reports and to select and apply appropriate accounting principles. Management is not required to prepare their financial reports, but management needs to demonstrate the level of qualifications and controls to prepare their financial reports without significant deficiencies in these controls.
During the current year audit, a number of material audit adjustments were posted that changed the financial statement results of IPTC by a material amount.
Many of the adjusting entries were made to balance the general ledger to underlying subsidiary detail reports. The primary reason for the nature, number, and material amounts was that accounts were not properly reconciled to the general ledger on a timely basis during the year, or reconciliations were not performed or properly reviewed. These adjustments impacted federal grants, debt, capital assets, accounts payable and payroll. The net impact on the financial statements is shown below:
• Total assets were understated by approximately $563,000• Total liabilities and net position was overstated by approximately $3,196,000• Total revenues were understated by approximately $5,585,000• Total expenses were understated by approximately $1,825,000
Effect: Lack of materially accurate monthly general ledger financial reporting from management during the year.
Cause: The above condition appears to be the result of lack of internal controls over the monthly and annual reconciliation process and/or insufficient training in the Finance Department.
Questioned Costs: None
Recommendations: We suggest that management establish appropriate procedures and reviews to provide for accurate and timely monthly reconciliations so that the general ledger reflects a complete, accurate representation of financial results. Monthly reconciliations should include posting adjustments identified each month. All reconciliations should be reviewed and approved by someone independent of the preparer. Additionally, management should be reviewing net position and ensuring that it properly rolls forward from the prior year.
Management Response and Corrective Action Plan: In 2014, IPTC engaged a firm to review and evaluate our financial structure and staffing. Upon the completion of the review and approval from the IPTC Board of Directors, IPTC worked diligently to fill four positions identified in the review as essential to improving internal controls. These positions included Director of Budget and Compliance, Grants Manager, Staff Accountant and a part-time Payroll Clerk.
In the third and fourth quarter of 2014 all four position were filled. The training for the incumbents is ongoingbut positive impact of these positions is already evident. We expect that these changes will fully resolve the issues identified in this audit.
(Continued)
40.

INDIANAPOLIS PUBLIC TRANSPORTATION CORPORATION(A COMPONENT UNIT OF THE CONSOLIDATED CITY OF INDIANAPOLIS
MARION COUNTY GOVERNMENT REPORTING ENTITY)SCHEDULE OF FINDINGS AND QUESTIONED COSTS
DECEMBER 31, 2014
SECTION 2 - FINDINGS RELATING TO THE FINANCIAL STATEMENTS WHICH ARE REQUIRED TO BE REPORTED IN ACCORDANCE WITH GAGAS (Continued)
FINDING 2014-002 - Internal Controls over Federal Reporting and over Preparation of the Schedule of Expenditures of Federal Awards (Material Weakness)
Condition and Criteria: Material weaknesses in internal controls identified for financial statement reporting increase the risk that internal controls over the reporting of the Schedule of Expenditures of Federal Awards (SEFA) and compliance for major and non-major programs may not be effective.
In addition, during review of the controls over the SEFA preparation with management, we noted that one person has the main responsibility for preparation of the SEFA with no independent review and approval.Also, errors were noted in the SEFA provided by management, including the failure to properly cluster two of the federal grants.
Effect: The SEFA could be materially misstated or contain incorrect information.
Cause: The material weaknesses identified over financial reporting were primarily focused on the internal controls over and reconciliation of subsidiary detail to the general ledger. The general ledger is the official record for financial statement reporting. The lack of timely and accurate reconciliation between subsidiary detail, supporting federal draws, and the general ledger presents a risk related to internal controls over compliance for allowable costs. The necessary controls surrounding the preparation of the SEFA were not in place in the current year to facilitate the SEFA preparation process.
Questioned Costs: None
Recommendations: We recommend that a reconciliation of subsidiary detail to general ledger detail be performed on a monthly basis to determine that federal draws are properly supported by general ledger records. We also recommend that the reconciliation of federal expenditures and preparation of the SEFA be approved by IPTC staff that is independent of the reconciliation and SEFA preparation process.
Management Response and Corrective Action Plan: In 2014, IPTC engaged a firm to review and evaluate our financial structure and staffing. Upon the completion of the review and approval from the IPTC Board of Directors, IPTC worked diligently to fill four positions identified in the review as essential to improving internal controls. These positions included Director of Budget and Compliance, Grants Manager, Staff Accountant and a part-time Payroll Clerk.
In the third and fourth quarter of 2014 all four position were filled. The training for the incumbents is ongoing but positive impact of these positions is already evident. We expect that these changes will fully resolve the issues identified in this audit.
SECTION 3 - FINDINGS AND QUESTIONED COSTS FOR FEDERAL AWARDS INCLUDING AUDIT FINDINGS AS DEFINED IN OMB CIRCULAR A-133 SECTION 510(A)
None
41.

INDIANAPOLIS PUBLIC TRANSPORTATION CORPORATION(A COMPONENT UNIT OF THE CONSOLIDATED CITY OF INDIANAPOLIS
MARION COUNTY GOVERNMENT REPORTING ENTITY)SCHEDULE OF PRIOR YEAR FINDINGS AND QUESTIONED COSTS
DECEMBER 31, 2014
SECTION 4 - PRIOR YEAR FINDINGS AND QUESTIONED COSTS
FINDING 2013-001 - Controls over Financial Reporting (Material Weakness)
Condition and Criteria: Management is responsible to have internal controls in place to provide appropriate and reliable financial reports and to select and apply appropriate accounting principles. Management is not required to prepare their financial reports, but management needs to demonstrate the level of qualifications and controls to prepare their financial reports without significant deficiencies in these controls.
During the current year audit, a significant number of material audit adjustments were posted that changed the financial statement results of IPTC by a material amount.
Many of the adjusting entries were made to balance the general ledger to underlying subsidiary detail reports. The primary reason for the nature, number, and material amounts was that accounts were not properly reconciled to the general ledger on a timely basis during the year, or reconciliations were not performed or properly reviewed. These adjustments impacted federal grants, investments, debt, inventory, capital assets, accounts payable and payroll. The net impact on the financial statements is shown below:
• Total assets were understated by approximately $588,000 • Total liabilities were overstated by approximately $63,000• Total revenues were understated by approximately $340,000• Total expenses were overstated by approximately $310,000
Management Response and Corrective Action Plan: IPTC engaged a firm to review and evaluate our financial structure and the staffing. This review has been received and adopted by IPTC and is in the process of being implemented. This plan calls for adding four additional positions; Director of Budget and Compliance, Grants Manager, Staff Accountant and a part-time Payroll Clerk. These additions should allow the staff to properly account for the assets of IPTC and improve the internal controls. We fully expect that these changes will resolve the issue identified.
Status: Similar finding in the current year, see Finding 2014-001.
FINDING 2013-002 - Review of Disbursements/Transfers (Material Weakness)
Condition and Criteria: During analysis of bond interest expense, we noted that an interest payment for $399,000 was made in September on 2003D bonds that were not issued by IndyGo. We further noted that the transfer of funds from the operating bank account to the sinking fund bank account, as well as the actual payment to the bank, was approved by management.
Management Response and Corrective Action Plan: IPTC engaged a firm to review and evaluate our financial structure and the staffing. This review has been received and adopted by IPTC and is in the process of being implemented. This plan calls for adding four additional positions; Director of Budget and Compliance, Grants Manager, Staff Accountant and a part-time Payroll Clerk. These additions should allow the staff to properly account for the assets of IPTC and improve the internal controls. We fully expect that these changes will resolve the issue identified.
Status: Resolved.
(Continued)
42.

INDIANAPOLIS PUBLIC TRANSPORTATION CORPORATION(A COMPONENT UNIT OF THE CONSOLIDATED CITY OF INDIANAPOLIS
MARION COUNTY GOVERNMENT REPORTING ENTITY)SCHEDULE OF PRIOR YEAR FINDINGS AND QUESTIONED COSTS
DECEMBER 31, 2014
FINDING 2013-003 - Internal Controls over Federal Reporting and over Preparation of the Schedule of Expenditures of Federal Awards (Material Weakness)
Condition and Criteria: Material weaknesses in internal controls identified for financial statement reporting increase the risk that internal controls over the reporting of the Schedule of Expenditures of Federal Awards (SEFA) and compliance for major and non-major programs may not be effective.
In addition, during review of the controls over the SEFA preparation with management, we noted that one person has the main responsibility for preparation of the SEFA with no independent review and approval.Also, errors were noted in the SEFA provided by management, including the failure to identify two of the federal grants.
Management Response and Corrective Action Plan: IPTC engaged a firm to review and evaluate our financial structure and the staffing. This review has been received and adopted by IPTC and is in the process of being implemented. This plan calls for adding four additional positions; Director of Budget and Compliance, Grants Manager, Staff Accountant and a part-time Payroll Clerk. These additions should allow the staff to properly account for the assets of IPTC and improve the internal controls. We fully expect that these changes will resolve the issue identified.
Status: Similar finding in the current year, see Finding 2014-002.
43.

44
SECTION THREE – STATISTICAL (Unaudited)
Financial Trends Net Assests by Component .......................................................................45 Operating Expenses by Type ....................................................................46 Changes in Net Assets ...............................................................................47
Revenue Capacity Operating Revenue by Source ..................................................................48 Non-Operating Revenues and Expenses ................................................49 Assessed Value and Estimated Actual Value of Taxable Property ......50
Debt Capacity Property Tax Levies and Collections .......................................................51 Ratios of General Bonded Debt Outstanding ........................................52 Direct and Overlapping Property Tax Rates ..........................................53 Direct and Overlapping Bonded Debt and Bonding Limit ..................54
Demographic and Economic Information Demographic and Economic Statistics ....................................................55 Principal Employers ..................................................................................56 Principal Property Tax Payers ..................................................................57
Operating Information Operating Information ..............................................................................58 Schedule of Insurance in Force ................................................................59 Transit Vehicles ...........................................................................................60

45
Sche
dule
1In
dian
apol
is P
ublic
Tra
nspo
rtat
ion
Cor
pora
tion
Net
Ass
ets
by C
ompo
nent
Ten
Year
s (1
)
Year
1Ye
ar 2
Year
3Ye
ar 4
Year
5Ye
ar 6
Year
7Ye
ar 8
Year
9Ye
ar 1
0A
ctua
lA
ctua
lA
ctua
lA
ctua
lA
ctua
lA
ctua
lA
ctua
lA
ctua
lA
ctua
lA
ctua
l20
0520
0620
0720
0820
0920
1020
1120
1220
1320
14Bu
sine
ss-ty
pe a
ctiv
ities
Inve
sted
in c
apita
l ass
ets,
net
of r
elat
ed d
ebt
19,5
09,3
4119
,620
,481
15,8
60,9
8714
,846
,493
25,4
81,2
8533
,867
,492
33,9
84,6
0733
,289
,266
36,1
10,3
2642
,647
,303
Res
trict
ed4,
848,
101
8,24
0,63
512
,137
,992
11,4
86,9
6516
,065
,599
17,7
16,4
0617
,268
,294
18,2
81,2
5216
,092
,365
17,7
60,4
98U
nres
trict
ed1,
388,
090
1,19
5,74
71,
435,
264
11,0
03,1
895,
681,
911
3,50
6,78
16,
176,
762
10,4
72,8
9313
,577
,627
12,9
60,9
93To
tal b
usin
ess-
type
act
iviti
es n
et a
sset
s25
,745
,532
29,0
56,8
6329
,434
,243
37,3
36,6
4747
,228
,795
55,0
90,6
7957
,429
,663
62,0
43,4
1165
,780
,318
73,3
68,7
94
(1)
IPTC
ope
rate
s in
one
bus
ines
s se
gmen
t, pu
blic
tran
spor
tatio
n, a
s an
ent
erpr
ise
fund
. IP
TC a
dopt
ed G
ASB
Stat
emen
t No.
34
whi
ch re
quire
d re
clas
sific
atio
n of
ce
rtain
bal
ance
s, in
clud
ing
the
pres
enta
tion
of n
et a
sset
s pr
ospe
ctiv
ely
begi
nnin
g w
ith 2
003.

46
Sche
dule
2In
dian
apol
is P
ublic
Tra
nspo
rtat
ion
Cor
pora
tion
Ope
ratin
g Ex
pens
es b
y Ty
peTe
n Ye
ars
(1)
Mai
nten
ance
of
Subt
otal
To
tal
Cal
enda
rEq
uipm
ent
Adm
inis
trat
ive
Cla
ims
and
Expe
nses
bef
ore
Ope
ratin
gYe
arTr
ansp
orta
tion
Incl
udin
g Fu
elan
d G
ener
alIn
sura
nce
Dep
reci
atio
nD
epre
ciat
ion
Expe
nses
2005
22,8
84,6
6811
,679
,630
6,07
6,30
077
1,24
941
,411
,847
7,38
9,61
248
,801
,459
2006
23,5
99,7
7211
,128
,235
7,03
8,69
51,
100,
458
42,8
67,1
607,
583,
089
50,4
50,2
4920
0726
,994
,527
13,3
83,4
476,
516,
194
756,
182
47,6
50,3
508,
121,
358
55,7
71,7
0820
0829
,541
,787
14,5
38,8
896,
863,
256
1,51
6,93
252
,460
,864
7,62
7,35
960
,088
,223
2009
30,2
59,5
6715
,218
,097
7,86
4,37
62,
226,
549
55,5
68,5
897,
869,
927
63,4
38,5
1620
1030
,175
,698
15,8
20,4
018,
377,
011
1,96
8,98
256
,342
,092
7,20
0,40
563
,542
,497
2011
28,3
78,0
3315
,409
,628
7,36
2,44
91,
860,
421
53,0
10,5
319,
877,
258
62,8
87,7
8920
1228
,619
,510
15,4
34,9
626,
915,
103
1,80
0,77
752
,770
,352
8,25
3,59
861
,023
,950
2013
29,7
33,1
7617
,098
,609
10,2
08,4
491,
334,
836
58,3
75,0
707,
293,
959
65,6
69,0
2920
1432
,424
,781
18,9
32,5
7610
,311
,180
1,56
6,98
263
,235
,519
7,88
3,51
671
,119
,035
(1)
IPTC
ado
pted
GAS
B S
tate
men
t No.
34,
whi
ch re
quire
s re
clas
sific
atio
n of
cer
tain
acc
ount
bal
ance
s, p
rosp
ectiv
ely
begi
nnin
g w
ith 2
003.

47
Sch
edul
e 3
In
dian
apol
is P
ublic
Tra
nspo
rtat
ion
Cor
pora
tion
Ind
iana
polis
Pub
lic T
rans
port
atio
n C
orpo
rati
on
Cha
nges
in N
et A
sset
s
T
en Y
ears
(1)
Non
oper
atin
gIn
com
e (L
oss)
Cha
nge
Fisc
al
Ope
ratin
g O
pera
ting
Ope
ratin
gR
even
uebe
fore
Cap
ital
Cap
ital
in N
et
Year
Rev
enue
Expe
nse
Loss
(Exp
ense
)C
ontr
ibut
ions
Con
trib
utio
nsAs
sets
2005
7,93
6,77
9
48
,801
,459
(4
0,86
4,68
0)
41,1
98,7
75
334,
095
4,
555,
181
4,88
9,27
6
20
068,
776,
427
50,4
50,2
49
(41,
673,
822)
40
,482
,368
(1
,191
,454
)
4,50
2,78
5
3,
311,
331
2007
9,17
9,97
3
55
,771
,708
(4
6,59
1,73
5)
44,2
07,4
56
(2,3
84,2
79)
2,
761,
659
377,
380
2,
008
10,3
55,3
43
60,0
88,2
23
(49,
732,
880)
50
,360
,436
62
7,55
6
5,43
0,24
8
6,
057,
804
2,00
9
10
,128
,052
63
,438
,516
(5
3,31
0,46
4)
50,9
81,0
36
(2,3
29,4
28)
12
,221
,576
9,
892,
148
2,01
0
9,
996,
539
63,5
42,4
97
(53,
545,
958)
49
,221
,744
(4
,324
,214
)
12,1
86,0
98
7,86
1,88
4
2,
011
10,8
84,5
39
62,8
87,7
90
(52,
003,
251)
47
,319
,768
(4
,683
,483
)
7,02
2,46
7
2,
338,
984
2,01
2
11
,661
,120
61
,023
,950
(4
9,36
2,83
0)
50,2
65,9
91
903,
161
3,
710,
587
4,61
3,74
8
2,
013
11,7
38,2
07
65,6
69,0
29
(53,
930,
822)
54
,831
,342
90
0,52
0
2,83
6,38
7
3,
736,
907
2,01
4
12
,136
,882
71
,119
,035
(5
8,98
2,15
3)
54,5
48,8
34
(4,4
33,3
19)
12
,021
,795
7,
588,
476
1 IP
TC a
dopt
rd G
ASB
Stat
emen
t No.
34,
whi
ch re
quire
s re
clas
sific
atio
n of
cer
tain
acc
ount
bal
ance
s,
pros
pect
ivel
y be
ginn
ing
with
200
3
pro
spec
tivel
y be
ginn
ing
with
200
3.

48
Sche
dule
4In
dian
apol
is P
ublic
Tra
nspo
rtat
ion
Cor
pora
tion
Ope
ratin
g R
even
ues
by S
ourc
eTe
n Ye
ars
(1)
Cal
enda
rPa
ssen
ger
Spec
ial
Year
Fare
sSe
rvic
eAd
vert
isin
gTo
tal
2005
7,43
9,43
526
6,10
423
1,24
07,
936,
779
2006
8,08
7,14
024
9,35
543
9,93
28,
776,
427
2007
8,53
5,06
024
2,91
840
1,99
59,
179,
973
2008
9,81
1,30
317
5,35
136
8,68
910
,355
,343
2009
9,82
3,05
2-
305,
000
10,1
28,0
5220
109,
707,
471
-
28
9,06
89,
996,
539
2011
10,4
01,9
22-
482,
617
10,8
84,5
3920
1211
,266
,129
-
39
4,99
111
,661
,120
2013
11,3
54,5
76-
383,
631
11,7
38,2
0720
1411
,617
,150
-
51
9,73
212
,136
,882
1IP
TC a
dopt
ed G
AS
B S
tate
men
t No.
34,
whi
ch re
quire
s re
clas
sific
atio
n of
cer
tain
acc
ount
bal
ance
s, p
rosp
ectiv
ely
begi
nnin
g w
ith 2
003.
49
Sche
dule
5In
dian
apol
is P
ublic
Tra
nspo
rtat
ion
Cor
pora
tion
Non
oper
atin
g R
even
ues
and
Expe
nses
Ten
Year
s (1
)To
tal
Non
oper
atin
gC
alen
dar
Prop
erty
and
FTA
Ope
ratin
gR
even
ue a
ndYe
arEx
cise
Tax
Mun
icip
aliti
esAs
sist
ance
Oth
er, n
etEx
pens
es20
0520
,468
,924
8,97
3,87
412
,151
,019
(395
,042
)41
,198
,775
2006
21,0
13,5
749,
705,
912
10,3
04,8
69(5
41,9
87)
40,4
82,3
6820
0722
,819
,745
10,2
43,5
4910
,779
,969
364,
193
44,2
07,4
5620
0822
,670
,695
12,8
87,1
6414
,527
,052
275,
525
50,3
60,4
3620
0922
,842
,141
12,3
53,3
9316
,456
,216
(670
,714
)50
,981
,036
2010
23,8
79,6
5411
,798
,407
15,4
57,0
06(1
,913
,323
)49
,221
,744
2011
23,9
66,4
6711
,026
,654
12,3
58,1
90(3
1,54
3)47
,319
,768
2012
27,0
29,7
8210
,883
,600
12,3
20,6
0632
,003
50,2
65,9
9120
1333
,105
,656
10,8
42,2
4411
,017
,598
(134
,156
)54
,831
,342
2014
31,7
29,4
2210
,566
,578
11,9
32,2
3817
4,48
854
,402
,726
(1)
IPTC
ado
pted
GA
SB
Sta
tem
ent N
o. 3
4, w
hich
requ
ires
recl
assi
ficat
ion
of c
erta
in a
ccou
nt b
alan
ces,
pro
spec
tivel
y be
ginn
ing
with
200
3.
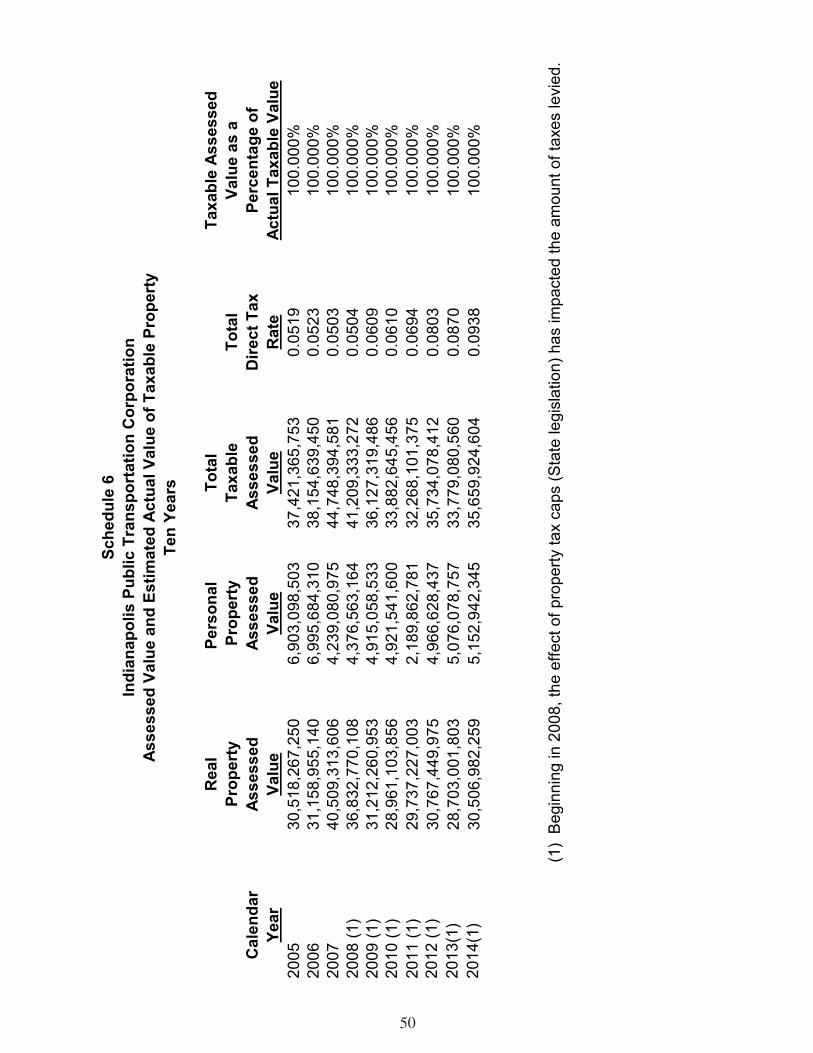
50
Sche
dule
6In
dian
apol
is P
ublic
Tra
nspo
rtat
ion
Cor
pora
tion
Asse
ssed
Val
ue a
nd E
stim
ated
Act
ual V
alue
of T
axab
le P
rope
rty
Ten
Year
s
Rea
lPe
rson
al
Tota
lTa
xabl
e As
sess
edPr
oper
tyPr
oper
tyTa
xabl
eTo
tal
Valu
e as
aC
alen
dar
Asse
ssed
Asse
ssed
Asse
ssed
Dire
ct T
axPe
rcen
tage
of
Year
Valu
eVa
lue
Valu
eR
ate
Actu
al T
axab
le V
alue
2005
30,5
18,2
67,2
506,
903,
098,
503
37,4
21,3
65,7
530.
0519
100.
000%
2006
31,1
58,9
55,1
406,
995,
684,
310
38,1
54,6
39,4
500.
0523
100.
000%
2007
40,5
09,3
13,6
064,
239,
080,
975
44,7
48,3
94,5
810.
0503
100.
000%
2008
(1)
36,8
32,7
70,1
084,
376,
563,
164
41,2
09,3
33,2
720.
0504
100.
000%
2009
(1)
31,2
12,2
60,9
534,
915,
058,
533
36,1
27,3
19,4
860.
0609
100.
000%
2010
(1)
28,9
61,1
03,8
564,
921,
541,
600
33,8
82,6
45,4
560.
0610
100.
000%
2011
(1)
29,7
37,2
27,0
032,
189,
862,
781
32,2
68,1
01,3
750.
0694
100.
000%
2012
(1)
30,7
67,4
49,9
754,
966,
628,
437
35,7
34,0
78,4
120.
0803
100.
000%
2013
(1)
28,7
03,0
01,8
035,
076,
078,
757
33,7
79,0
80,5
600.
0870
100.
000%
2014
(1)
30,5
06,9
82,2
595,
152,
942,
345
35,6
59,9
24,6
040.
0938
100.
000%
(1)
Beg
inni
ng in
200
8, th
e ef
fect
of p
rope
rty ta
x ca
ps (S
tate
legi
slat
ion)
has
impa
cted
the
amou
nt o
f tax
es le
vied
.
51
Sche
dule
7
Pro
pert
y Ta
x Le
vies
and
Col
lect
ions
(1 &
2)
Ten
Year
s
Perc
enta
geC
olle
cted
with
in th
eYe
arTa
xes
Levi
edYe
ar o
f the
Lev
yC
olle
ctio
ns
Tota
l Col
lect
ions
to D
ate
Ende
dfo
r the
Perc
enta
geof
Tax
es L
evie
dD
ecem
ber 3
1Ye
ar (3
)Am
ount
of L
evy
in P
rior Y
ears
Amou
ntof
Lev
y20
05 (4
)19
,298
,119
10,2
10,1
5292
.6%
910,
618
18,7
75,6
23
97.3
%20
0619
,884
,370
17,8
65,0
0594
.8%
535,
198
19,3
78,1
30
97.5
%20
0721
,220
,606
18,8
42,9
3296
.1%
400,
192
20,7
96,1
94
98.0
%20
08 (5
)20
,769
,503
20,3
96,0
0298
.9%
226,
008
20,7
72,1
7110
0.0%
2009
(5) (
6)21
,134
,612
20,5
46,1
6392
.0%
845,
384
20,2
92,6
59
96.0
%20
10 (5
)20
,668
,415
19,6
71,0
6395
.2%
413,
368
20,0
84,4
3197
.2%
2011
(5) (
7)24
,680
,645
23,7
40,2
0196
.2%
940,
444
23,9
66,4
6797
.1%
2012
(5) (
8)25
,732
,422
25,0
55,8
0097
.0%
957,
259
26,8
64,1
64
104.
4%20
13 (5
)(8)
28,0
11,0
9626
,490
,971
94.6
%1,
157,
889
27,6
48,8
60
98.7
%20
14 (5
)(8)
(9)
25,2
92 ,8
9226
,426
,781
104.
5%1,
001,
691
27,4
28,4
72
108.
4%
(1)
Incl
udes
ope
ratin
g, c
umul
ativ
e ca
pita
l and
deb
t ser
vice
fund
s.(2
) D
ata
pres
ente
d on
the
cash
bas
is o
f acc
ount
ing.
(3)
Sou
rce
of in
form
atio
n is
Indi
ana
Dep
artm
ent o
f Loc
al G
over
nmen
t Fin
ance
.(4
) In
clud
es c
umul
ativ
e ca
pita
l fun
d be
ginn
ing
in 2
005.
(5)
Beg
inni
ng in
200
8 th
e ef
fect
of p
rope
rty ta
x ca
ps h
as im
pact
ed th
e va
lue
of ta
xes
levi
ed.
(6)
A n
umbe
r of a
ppea
ls fr
om 2
008
wer
e re
solv
ed in
200
9. T
hese
app
eals
resu
lted
from
pro
perty
tax
reas
sess
men
t.(7
) C
olle
ctio
ns in
clud
e w
ater
com
pany
pilo
t pro
gram
dis
tribu
tion
in li
eu o
f tax
es.
(8)
Col
lect
ed m
ore
delin
quen
t tax
in 2
012.
(9)
The
Tax
Lev
y fo
r 201
4 w
as c
ut $
3.9
milli
on.

Tota
lTo
tal
Less
: Am
ount
sTo
tal D
ebt a
s a
Perc
enta
ge o
fG
ener
al
Not
esA
vaila
ble
in
Per C
apita
Perc
enta
ge o
f A
ctua
l Tax
able
Act
ual T
axab
leC
alen
dar
Bon
ded
Deb
tPa
yabl
e D
ebt S
ervi
cePe
r Cap
itaPe
rson
alPe
r Cap
ita P
erso
nal
Valu
e of
Valu
e of
Year
Out
stan
ding
Out
stan
ding
Fund
Tota
l
D
ebt
Inco
me
Inco
me
Prop
erty
(2)
Prop
erty
2005
15,0
85,0
007,
301,
000
125
22,3
85,8
7528
.27
36,2
860.
0007
837
,421
,365
,753
0.06
0%20
0614
,140
,000
7,08
7,00
0-
21
,227
,000
26.8
036
,869
0.00
073
38,1
54,6
39,4
500.
056%
2007
13,1
20,0
007,
018,
500
157,
519
19,9
80,9
8125
.23
37,9
360.
0006
744
,748
,394
,581
0.03
1%20
0812
,025
,000
7,05
3,50
027
,638
19,0
50,8
6224
.06
25,5
460.
0009
441
,209
,333
,272
0.04
6%20
0910
,625
,000
7,00
3,98
8-
17
,628
,988
22.2
638
,532
0.00
058
36,1
27,3
19,4
860.
049%
2010
9,26
5,00
06,
872,
906
-
16,1
37,9
0620
.38
37,2
320.
0005
533
,882
,645
,456
0.04
8%20
117,
835,
000
6,67
4,15
35,
543
14,5
03,6
1016
.02
37,2
320.
0004
332
,045
,358
,660
0.04
5%20
126,
425,
000
6,62
1,74
85,
543
13,0
41,2
0514
.19
38,3
090.
0003
733
,823
,881
,794
0.03
9%20
134,
675,
000
1,54
9,42
0-
6,
224,
420
7.86
40,1
320.
0002
032
,196
,661
,823
0.01
9%20
142,
925,
000
1,33
6,68
8-
4,
261,
688
4.56
39,9
630.
0001
034
,825
,590
,616
0.01
2%
(1)
Bas
ed o
n 20
14 p
opul
atio
n of
Con
solid
ated
City
(934
,243
) for
201
4. S
ourc
e: U
.S. D
epar
tmen
t of C
omm
erce
, Bur
eau
of C
ensu
s.(2
) Th
e le
gal d
ebt l
imit
for I
PTC
gen
eral
obl
igat
ion
bond
s is
two
perc
ent o
f the
act
ual t
axab
le v
alue
of p
rope
rty.
(3) T
he in
form
atio
n fo
r per
sona
l inc
ome
will
be re
leas
ed b
y th
e B
urea
u of
Eco
nom
ic A
naly
sis
in N
ovem
ber 2
0, 2
015
ther
efor
e, p
rior y
ear n
umbe
rs w
ere
utiliz
ed.
Sche
dule
8In
dian
apol
is P
ublic
Tra
nspo
rtat
ion
Cor
pora
tion
Rat
io o
f Gen
eral
Bon
ded
Deb
t Out
stan
ding
Ten
Year
s
52

Tota
lTo
tal
Less
: Am
ount
sTo
tal D
ebt a
s a
Perc
enta
ge o
fG
ener
al
Not
esA
vaila
ble
in
Per C
apita
Perc
enta
ge o
f A
ctua
l Tax
able
Act
ual T
axab
leC
alen
dar
Bon
ded
Deb
tPa
yabl
e D
ebt S
ervi
cePe
r Cap
itaPe
rson
alPe
r Cap
ita P
erso
nal
Valu
e of
Valu
e of
Year
Out
stan
ding
Out
stan
ding
Fund
Tota
l
D
ebt
Inco
me
Inco
me
Prop
erty
(2)
Prop
erty
2005
15,0
85,0
007,
301,
000
125
22,3
85,8
7528
.27
36,2
860.
0007
837
,421
,365
,753
0.06
0%20
0614
,140
,000
7,08
7,00
0-
21
,227
,000
26.8
036
,869
0.00
073
38,1
54,6
39,4
500.
056%
2007
13,1
20,0
007,
018,
500
157,
519
19,9
80,9
8125
.23
37,9
360.
0006
744
,748
,394
,581
0.03
1%20
0812
,025
,000
7,05
3,50
027
,638
19,0
50,8
6224
.06
25,5
460.
0009
441
,209
,333
,272
0.04
6%20
0910
,625
,000
7,00
3,98
8-
17
,628
,988
22.2
638
,532
0.00
058
36,1
27,3
19,4
860.
049%
2010
9,26
5,00
06,
872,
906
-
16,1
37,9
0620
.38
37,2
320.
0005
533
,882
,645
,456
0.04
8%20
117,
835,
000
6,67
4,15
35,
543
14,5
03,6
1016
.02
37,2
320.
0004
332
,045
,358
,660
0.04
5%20
126,
425,
000
6,62
1,74
85,
543
13,0
41,2
0514
.19
38,3
090.
0003
733
,823
,881
,794
0.03
9%20
134,
675,
000
1,54
9,42
0-
6,
224,
420
7.86
40,1
320.
0002
032
,196
,661
,823
0.01
9%20
142,
925,
000
1,33
6,68
8-
4,
261,
688
4.56
39,9
630.
0001
034
,825
,590
,616
0.01
2%
(1)
Bas
ed o
n 20
14 p
opul
atio
n of
Con
solid
ated
City
(934
,243
) for
201
4. S
ourc
e: U
.S. D
epar
tmen
t of C
omm
erce
, Bur
eau
of C
ensu
s.(2
) Th
e le
gal d
ebt l
imit
for I
PTC
gen
eral
obl
igat
ion
bond
s is
two
perc
ent o
f the
act
ual t
axab
le v
alue
of p
rope
rty.
(3) T
he in
form
atio
n fo
r per
sona
l inc
ome
will
be re
leas
ed b
y th
e B
urea
u of
Eco
nom
ic A
naly
sis
in N
ovem
ber 2
0, 2
015
ther
efor
e, p
rior y
ear n
umbe
rs w
ere
utiliz
ed.
Sche
dule
8In
dian
apol
is P
ublic
Tra
nspo
rtat
ion
Cor
pora
tion
Rat
io o
f Gen
eral
Bon
ded
Deb
t Out
stan
ding
Ten
Year
s
Sche
dule
9In
dian
apol
is P
ublic
Tra
nspo
rtat
ion
Cor
pora
tion
Dire
ct a
nd O
verla
ppin
g Pr
oper
ty T
ax R
ates
(1 &
3)
Ten
Year
s
------
------
------
----D
irect
Rat
es(2
) ----
------
------
------
------
------
------
------
------
------
----O
verla
ppin
g R
ates
------
------
------
------
------
------
----
--Tot
al (2
)--To
tal
Cal
enda
rB
asic
D
ebt
Cum
ulat
ive
Dire
ct
Oth
erYe
arR
ate
Serv
ice
Cap
ital
Rat
eC
ityC
ount
yM
uni C
orp
Scho
olSt
ate
Oth
erTo
tal
2005
0.03
790.
0040
0.01
000.
0519
1.16
700.
4163
0.11
141.
6744
0.00
240.
0516
3.47
5020
060.
0385
0.00
380.
0100
0.05
230.
9546
0.49
480.
3228
1.71
720.
0024
0.05
233.
5964
2007
0.03
610.
0042
0.01
000.
0503
0.87
700.
5607
0.29
171.
8713
0.00
000.
0522
3.70
3220
080.
0370
0.00
340.
0100
0.05
040.
8920
0.46
020.
3017
1.76
680.
0024
0.05
103.
5490
2009
0.04
600.
0049
0.01
000.
0609
0.70
930.
4842
0.26
451.
1569
0.00
240.
0578
2.73
6020
100.
0461
0.00
490.
0100
0.06
100.
8673
0.35
340.
2672
1.36
920.
0000
0.06
152.
9796
2011
0.05
380.
0058
0.01
000.
0696
0.95
250.
3665
0.29
891.
4065
0.00
000.
0615
3.15
5520
120.
0656
0.00
510.
0096
0.08
03
1.00
340.
4007
0.31
551.
2711
0.00
000.
0670
3.13
8020
130.
0870
0.00
610.
0100
0.10
310.
9802
0.39
320.
3283
1.48
290.
0000
0.06
073.
3484
2014
0.07
810.
0057
0.01
000.
0938
0.76
670.
4034
0.34
021.
2889
0.00
000.
0620
2.95
50
(1
)R
ate
is p
er $
100
of a
sses
sed
valu
atio
n.(2
)R
ate
of D
istri
ct 1
01 (I
ndpl
s.-C
ente
r Tw
nshp
.) w
hich
rate
incl
udes
all
maj
or s
ervi
ce.
(3)
Taxa
ble
prop
erty
was
ass
esse
d at
thirt
y th
ree
and
one-
third
of t
he ta
xabl
e as
sess
ed v
alue
as
per t
he M
ario
n C
ount
y A
udito
r's a
bstra
ct.
In 2
002,
a c
hang
e in
Sta
te la
w m
anda
ted
the
use
of tr
ue m
arke
t val
ue a
s ta
xabl
e as
sess
ed v
alue
. Th
e ef
fect
of t
his
chan
ge re
duce
d th
e ef
fect
ive
tax
rate
by
two-
third
s.(4
)Th
e IP
TC B
oard
of D
irect
ors
esta
blis
hed
a C
umul
ativ
e C
apita
l Fun
d w
ith a
one
-cen
t tax
rate
adj
ustm
ent i
n 20
04 to
pro
vide
for f
utur
e ca
pita
l fun
ding
. A
t the
sam
e tim
e th
e IP
TC B
oard
of D
irect
ors
incr
ease
d th
e ge
nera
l fun
d ta
x ra
te a
ppro
xim
atel
y on
e an
d on
e-ha
lf ce
nts.
(5)
The
prop
erty
tax
rate
s fo
r Sta
te fa
ir an
d S
tate
fore
stry
wer
e re
peal
ed in
201
0
53

Bon
ded
Deb
tB
onds
Lim
it (1
)O
utst
andi
ng (2
)O
verla
ppin
g D
ebt
City
of I
ndia
napo
lis3,
372,
850
156,
155
Mar
ion
Cou
nty
227,
610
0-0
Oth
er M
unic
ipal
Cor
pora
tions
677,
054
287,
115
Pub
lic S
choo
ls2,
258,
967
136,
824
Oth
er C
ities
and
Tow
ns22
6,04
27,
890
Oth
er M
isc
City
and
Tow
n, T
owns
hip
20,7
037,
948
Tota
l Ove
rlapp
ing
Deb
t6,
783,
226
595,
932
Dire
ct D
ebt
Indi
anap
olis
Pub
ic T
rans
porta
tion
Cor
pora
tion
215,
291
2,92
5
Tota
l Dire
ct a
nd O
verla
ppin
g D
ebt
6,99
8,51
759
8,85
7
IPTC
's p
erce
ntag
e of
Tot
al D
irect
and
Ove
rlapp
ing
Deb
t3.
08%
0.49
%
(1)
Sou
rce:
Mar
ion
Cou
nty
Aud
itor's
Abs
tract
(2)
Sou
rce:
Ind
iana
polis
City
Con
trolle
r's O
ffice
.
Sche
dule
10
Indi
anap
olis
Pub
lic T
rans
port
atio
n C
orpo
ratio
nD
irect
and
Ove
rlapp
ing
Bon
ded
Deb
t and
Bon
ding
Lim
itAs
of D
ecem
ber 3
1, 2
014
(am
ount
s ex
pres
sed
in th
ousa
nds)
54

Bon
ded
Deb
tB
onds
Lim
it (1
)O
utst
andi
ng (2
)O
verla
ppin
g D
ebt
City
of I
ndia
napo
lis3,
372,
850
156,
155
Mar
ion
Cou
nty
227,
610
0-0
Oth
er M
unic
ipal
Cor
pora
tions
677,
054
287,
115
Pub
lic S
choo
ls2,
258,
967
136,
824
Oth
er C
ities
and
Tow
ns22
6,04
27,
890
Oth
er M
isc
City
and
Tow
n, T
owns
hip
20,7
037,
948
Tota
l Ove
rlapp
ing
Deb
t6,
783,
226
595,
932
Dire
ct D
ebt
Indi
anap
olis
Pub
ic T
rans
porta
tion
Cor
pora
tion
215,
291
2,92
5
Tota
l Dire
ct a
nd O
verla
ppin
g D
ebt
6,99
8,51
759
8,85
7
IPTC
's p
erce
ntag
e of
Tot
al D
irect
and
Ove
rlapp
ing
Deb
t3.
08%
0.49
%
(1)
Sou
rce:
Mar
ion
Cou
nty
Aud
itor's
Abs
tract
(2)
Sou
rce:
Ind
iana
polis
City
Con
trolle
r's O
ffice
.
Sche
dule
10
Indi
anap
olis
Pub
lic T
rans
port
atio
n C
orpo
ratio
nD
irect
and
Ove
rlapp
ing
Bon
ded
Deb
t and
Bon
ding
Lim
itAs
of D
ecem
ber 3
1, 2
014
(am
ount
s ex
pres
sed
in th
ousa
nds)
Sche
dule
11
Indi
anap
olis
Pub
lic T
rans
port
atio
n C
orpo
ratio
nD
emog
raph
ic a
nd E
cono
mic
Sta
tistic
sTe
n Ye
ars
Per
Cap
itaC
alen
dar
Pers
onal
Med
ian
Scho
olU
nem
ploy
men
tYe
arPo
pula
tion
(1)
Inco
me
(2)
Age
(3)
Enro
llmen
t (4)
Rat
e (5
)20
0579
1,92
636
,286
34.7
170,
864
5.4
2006
791,
926
36,8
6935
.016
0,73
24.
920
0779
1,92
637
,936
35.5
158,
991
4.6
2008
791,
926
25,5
4635
.616
2,67
85.
620
0979
1,92
638
,532
35.8
141,
573
9.4
2010
791,
926
37,2
3233
.613
3,08
49.
920
1190
5,39
337
,232
33.0
132,
474
9.4
2012
918,
977
38,3
0933
.714
9,33
57.
720
1392
8,28
140
,132
33.7
128,
478
8.7
2014
934,
243
39,9
6334
.013
0,00
76.
3
(1)
Bas
ed o
n 20
14 e
stim
ates
pop
ulat
ion
of M
ario
n C
ount
y (9
34,2
43) f
or y
ear 2
014.
Sou
rce:
US
Dep
artm
ent o
f
Com
mer
ce, B
urea
u of
Cen
sus.
(2
)D
ata
pres
ente
d ar
e pe
r the
U.S
. Dep
artm
ent o
f Com
mer
ce, B
urea
u of
Eco
nom
ic A
naly
sis.
(3)
Dat
a pr
esen
ted
are
per U
.S. C
ensu
s B
urea
u.(4
)D
ata
pres
ente
d is
for I
ndia
napo
lis P
ublic
Sch
ools
. S
ourc
e: I
ndia
na D
epar
tmen
t of E
duca
tion.
(5)
Dat
a pr
esen
ted
is fo
r Une
mpl
oym
ent r
ate,
non
seas
onal
ly a
djus
ted,
ann
ual a
vera
ge, M
ario
n C
ount
y, IN
. S
ourc
e: B
urea
u of
Lab
or S
tatis
tics.
55

56
2014
2004
Perc
enta
gePe
rcen
tage
of T
otal
City
Tota
lof
Tot
al C
ityEm
ploy
er (2
)Em
ploy
ees
Ran
kEm
ploy
men
t (1)
Empl
oyer
(3)
Empl
oyee
sR
ank
Empl
oym
ent (
1)
St
Vin
cent
Hos
pita
ls &
Hea
lth
Se
17,3
981
0.03
0%E
li Li
lly a
nd C
ompa
ny14
,000
10.
024%
IU H
ealt
h11
,810
20.
020%
Cla
rian
Hea
lth
Par
tner
s7,
500
20.
013%
Eli
Lilly
and
Com
pan y
10,7
353
0.01
9%Fe
dera
l Exp
ress
Cor
p.6,
311
30.
011%
Com
mun
ity
Hea
lth
Net
wor
k10
,402
40.
018%
St.
Vin
cent
Hos
pita
ls6,
000
40.
010%
IUP
UI
7,36
55
0.01
3%R
olls
-Roy
ce4,
500
50.
008%
Cit
y of
Ind
iana
polis
?Mar
ion
Cou
n7,
058
60.
012%
Sou
th W
este
rn B
ell
3,50
06
0.00
6%Fe
d E
x E
xpre
s s6,
000
70.
010%
Inte
nati
onal
Tru
ck a
nd E
ngin
e3,
200
70.
006%
Rol
ls-R
oyce
4,30
08
0.00
7%W
ellp
oint
Inc
. (A
nthe
m I
nc.)
3,00
08
0.00
5%A
nthe
m4,
200
90.
007%
Kro
ger
2,53
09
0.00
4%Fr
anci
scan
St.
Fra
ncis
Hea
lth
4,10
010
0.00
7%C
hase
Ban
k2,
500
100.
004%
Tot
al
0.1
43%
Tot
al0.
092%
(1)
Perc
enta
ge o
f tot
al C
ity e
mpl
oym
ent i
s ca
lcul
ated
usi
ng 2
014
and
2004
Em
ploy
ed L
abor
For
ce, w
hich
can
be
foun
d at
ww
w.s
tats
.indi
ana.
edu.
(2)
Larg
est e
mpl
oyer
s ca
n be
foun
d at
ww
w.in
dypa
rtner
ship
.com
(Ind
y Pa
rtner
ship
). To
tal E
mpl
oyee
s 5
79,0
45(3
) 20
04 la
rges
t em
ploy
ers
data
can
be
foun
d in
IPTC
200
4 An
nual
Rep
ort.
Sche
dule
12
Indi
anap
olis
Pub
lic T
rans
port
atio
n C
orpo
ratio
nPr
inci
pal E
mpl
oyer
sC
urre
nt Y
ear a
nd T
en Y
ears
Ago

Sche
dule
13
I
ndia
napo
lis P
ublic
Tra
nspo
rtat
ion
Cor
pora
tion
P
rinci
pal P
rope
rty
Tax
Paye
rs
Cur
rent
Yea
r and
Ten
Yea
rs A
go (3
)
(am
ount
s ex
pres
sed
in th
ousa
nds)
----
----
----
----
----
----
---2
014-
----
----
----
----
----
----
----
----
----
----
----
---20
04--
----
----
----
-Pe
rcen
tage
of T
otal
City
Taxa
ble
Taxa
ble
Taxa
ble
Asse
ssed
Asse
ssed
Asse
ssed
Taxp
ayer
Valu
e (1
)R
ank
Valu
eTa
xpay
erVa
lue
(2,3
)R
ank
Eli L
illy
and
Com
pany
1,11
4,26
41
3.28
%El
i Lill
y an
d C
ompa
ny79
0,46
81
Citi
zens
Gas
Cok
e U
tility
43
1,32
82
1.27
%So
uth
Wes
tern
Bel
l39
7,08
02
Indi
anap
olis
Pow
er &
Lig
ht32
7,49
33
0.96
%In
dian
apol
is P
ower
and
Lig
ht C
ompa
ny36
1,42
63
Fede
ral E
xpre
ss C
orpo
ratio
n22
6,87
74
0.67
%Si
mon
Pro
perty
Gro
up In
c27
5,55
34
Whi
te L
egac
y Pr
oper
yies
LLC
174,
342
50.
51%
Aim
co26
3,41
95
CW
Mon
umen
t Circ
le In
c16
3,94
46
0.48
%G
ener
al M
otor
s C
orpo
ratio
n19
9,03
06
Cas
tleto
n Sq
uare
, LLC
82,0
907
0.24
%Fe
dera
l Exp
ress
Cor
p.19
4,38
57
Amer
ican
Uni
ted
Life
Insu
ranc
e C
o80
,393
80.
24%
Inte
rnat
iona
l Tru
ck a
nd E
ngin
e (fo
rmer
ly N
avis
tar I
nt'l)
178,
911
8SV
C M
anuf
actu
ring
Inc
72,8
209
0.21
%Vi
steo
n C
orpo
ratio
n (fo
rmer
ly F
ord
Mot
or C
o.)
152,
576
9In
gred
ion
Inc
72,5
2010
0.21
%Am
eric
an U
nite
d Li
fe In
sura
nce
Co.
118,
127
102,
746,
071
8.08
%2,
930,
975
1 R
epre
sent
s th
e M
arch
1, 2
013
valu
atio
ns (3
3,97
1,64
0,93
3) fo
r tax
es d
ue a
nd p
ayab
le in
201
4 an
d re
pres
ente
d by
the
taxp
ayer
.2
Rep
rese
nts
the
Mar
ch 1
, 200
3 va
luat
ions
(39,
498,
980,
565)
for t
axes
due
and
pay
able
in 2
004
and
repr
esen
ted
by th
e ta
xpay
er.
3 Ta
xabl
e as
sess
ed v
alue
was
det
erm
ined
usi
ng p
ublic
reco
rds
from
the
Mar
ion
Cou
nty
Trea
sure
r's O
ffice
.
57
2014
2004
Perc
enta
gePe
rcen
tage
of T
otal
City
Tota
lof
Tot
al C
ityEm
ploy
er (2
)Em
ploy
ees
Ran
kEm
ploy
men
t (1)
Empl
oyer
(3)
Empl
oyee
sR
ank
Empl
oym
ent (
1)
St
Vin
cent
Hos
pita
ls &
Hea
lth
Se
17,3
981
0.03
0%E
li Li
lly a
nd C
ompa
ny14
,000
10.
024%
IU H
ealt
h11
,810
20.
020%
Cla
rian
Hea
lth
Par
tner
s7,
500
20.
013%
Eli
Lilly
and
Com
pan y
10,7
353
0.01
9%Fe
dera
l Exp
ress
Cor
p.6,
311
30.
011%
Com
mun
ity
Hea
lth
Net
wor
k10
,402
40.
018%
St.
Vin
cent
Hos
pita
ls6,
000
40.
010%
IUP
UI
7,36
55
0.01
3%R
olls
-Roy
ce4,
500
50.
008%
Cit
y of
Ind
iana
polis
?Mar
ion
Cou
n7,
058
60.
012%
Sou
th W
este
rn B
ell
3,50
06
0.00
6%Fe
d E
x E
xpre
s s6,
000
70.
010%
Inte
nati
onal
Tru
ck a
nd E
ngin
e3,
200
70.
006%
Rol
ls-R
oyce
4,30
08
0.00
7%W
ellp
oint
Inc
. (A
nthe
m I
nc.)
3,00
08
0.00
5%A
nthe
m4,
200
90.
007%
Kro
ger
2,53
09
0.00
4%Fr
anci
scan
St.
Fra
ncis
Hea
lth
4,10
010
0.00
7%C
hase
Ban
k2,
500
100.
004%
Tot
al
0.1
43%
Tot
al0.
092%
(1)
Perc
enta
ge o
f tot
al C
ity e
mpl
oym
ent i
s ca
lcul
ated
usi
ng 2
014
and
2004
Em
ploy
ed L
abor
For
ce, w
hich
can
be
foun
d at
ww
w.s
tats
.indi
ana.
edu.
(2)
Larg
est e
mpl
oyer
s ca
n be
foun
d at
ww
w.in
dypa
rtner
ship
.com
(Ind
y Pa
rtner
ship
). To
tal E
mpl
oyee
s 5
79,0
45(3
) 20
04 la
rges
t em
ploy
ers
data
can
be
foun
d in
IPTC
200
4 An
nual
Rep
ort.
Sche
dule
12
Indi
anap
olis
Pub
lic T
rans
port
atio
n C
orpo
ratio
nPr
inci
pal E
mpl
oyer
sC
urre
nt Y
ear a
nd T
en Y
ears
Ago

Sche
dule
14
Indi
anap
olis
Pub
lic T
rans
port
atio
n C
orpo
ratio
nO
pera
ting
Info
rmat
ion
Ten
Year
s
2014
2013
2012
2011
2010
2009
2008
2007
2006
2005
EMPL
OYE
E D
ATA:
Num
ber o
f Em
ploy
ees
(1)
Full
Tim
eO
pera
tors
341
380
301
271
277
308
286
277
272
272
Oth
er T
rans
porta
tion
357
190
00
3767
7575
Mai
nten
ance
8569
7976
7883
7980
7675
Adm
inis
trativ
e &
Oth
er43
4158
3837
4641
4236
36To
tal f
ull-t
ime
empl
oyee
s50
449
745
738
539
243
744
346
645
945
8
Par
t Tim
eO
pera
tors
24
50
00
00
00
Oth
er6
54
00
00
00
0To
tal p
art-t
ime
empl
oyee
s8
99
00
00
00
0
Tota
l Em
ploy
ees
512
506
466
385
392
437
443
466
459
458
PASS
ENG
ER D
ATA:
Pas
seng
ers
(2)
10,5
74,8
9510
,526
,681
10,2
48,6
039,
512,
408
8,77
8,09
88,
437,
450
9,89
0,09
89,
409,
066
10,0
33,4
778,
810,
183
Num
ber o
f Fix
ed R
oute
s (3
)31
3130
3030
3231
3129
28A
nnua
l Veh
icle
Mile
s (2
)11
,535
,338
11,0
62,8
3110
,759
,404
10,8
16,5
7410
,907
,886
11,3
77,2
7411
,850
,233
10,8
89,1
6510
,380
,982
9,99
3,24
0A
nnua
l Veh
icle
Hou
rs (2
)63
5,69
371
0,25
362
4,21
967
9,80
569
1,20
371
0,63
772
7,30
169
0,29
367
8,38
264
4,79
5N
umbe
r of C
oach
es (4
)22
023
322
722
822
423
524
022
823
624
0N
umbe
r of A
DA
Acc
essi
ble
vehi
cles
(4)
220
233
227
228
224
235
240
228
236
240
Fare
(Sin
gle
Rid
e) (3
)$1
.75
$1.7
5$1
.75
$1.7
5$1
.75
$1.7
5$1
.50
$1.5
0$1
.25
$1.2
5
(1)
Sou
rce:
Nat
iona
l Tra
nspo
rtatio
n D
atab
ase
(NTD
) For
m R
-10.
Inc
lude
s bo
th m
otor
bus
and
dem
and
resp
onse
mod
es.
(2)
Sou
rce:
NTD
For
m S
-10.
Inc
lude
s bo
th m
otor
bus
and
dem
and
resp
onse
mod
es.
(3)
Sou
rce:
IP
TC T
rans
porta
tion
Dep
artm
ent.
(4)
Sou
rce:
NTD
For
m A
-30.
Inc
lude
s bo
th m
otor
bus
and
dem
and
resp
onse
mod
es.
58

Sche
dule
14
Indi
anap
olis
Pub
lic T
rans
port
atio
n C
orpo
ratio
nO
pera
ting
Info
rmat
ion
Ten
Year
s
2014
2013
2012
2011
2010
2009
2008
2007
2006
2005
EMPL
OYE
E D
ATA:
Num
ber o
f Em
ploy
ees
(1)
Full
Tim
eO
pera
tors
341
380
301
271
277
308
286
277
272
272
Oth
er T
rans
porta
tion
357
190
00
3767
7575
Mai
nten
ance
8569
7976
7883
7980
7675
Adm
inis
trativ
e &
Oth
er43
4158
3837
4641
4236
36To
tal f
ull-t
ime
empl
oyee
s50
449
745
738
539
243
744
346
645
945
8
Par
t Tim
eO
pera
tors
24
50
00
00
00
Oth
er6
54
00
00
00
0To
tal p
art-t
ime
empl
oyee
s8
99
00
00
00
0
Tota
l Em
ploy
ees
512
506
466
385
392
437
443
466
459
458
PASS
ENG
ER D
ATA:
Pas
seng
ers
(2)
10,5
74,8
9510
,526
,681
10,2
48,6
039,
512,
408
8,77
8,09
88,
437,
450
9,89
0,09
89,
409,
066
10,0
33,4
778,
810,
183
Num
ber o
f Fix
ed R
oute
s (3
)31
3130
3030
3231
3129
28A
nnua
l Veh
icle
Mile
s (2
)11
,535
,338
11,0
62,8
3110
,759
,404
10,8
16,5
7410
,907
,886
11,3
77,2
7411
,850
,233
10,8
89,1
6510
,380
,982
9,99
3,24
0A
nnua
l Veh
icle
Hou
rs (2
)63
5,69
371
0,25
362
4,21
967
9,80
569
1,20
371
0,63
772
7,30
169
0,29
367
8,38
264
4,79
5N
umbe
r of C
oach
es (4
)22
023
322
722
822
423
524
022
823
624
0N
umbe
r of A
DA
Acc
essi
ble
vehi
cles
(4)
220
233
227
228
224
235
240
228
236
240
Fare
(Sin
gle
Rid
e) (3
)$1
.75
$1.7
5$1
.75
$1.7
5$1
.75
$1.7
5$1
.50
$1.5
0$1
.25
$1.2
5
(1)
Sou
rce:
Nat
iona
l Tra
nspo
rtatio
n D
atab
ase
(NTD
) For
m R
-10.
Inc
lude
s bo
th m
otor
bus
and
dem
and
resp
onse
mod
es.
(2)
Sou
rce:
NTD
For
m S
-10.
Inc
lude
s bo
th m
otor
bus
and
dem
and
resp
onse
mod
es.
(3)
Sou
rce:
IP
TC T
rans
porta
tion
Dep
artm
ent.
(4)
Sou
rce:
NTD
For
m A
-30.
Inc
lude
s bo
th m
otor
bus
and
dem
and
resp
onse
mod
es.
sc
hedu
le 1
5In
dian
apol
is P
ublic
Tra
nspo
rtat
ion
Cor
pora
tion
Sche
dule
of I
nsur
ance
in F
orce
(1)
D
ecem
ber 3
1, 2
014
Type
of C
over
age
Com
pany
Term
Expi
ratio
n D
ate
Lim
itD
educ
tible
Pub
lic O
ffici
alN
atio
nal U
nion
1 ye
arJa
nuar
y 1
$1,0
00,0
00$2
5,00
0Fi
duci
ary
Liab
ility
Cha
rtis
1 ye
arJa
nuar
y 1
$1,0
00,0
00$1
0,00
0
Pro
perty
:Tr
avel
ers
1 ye
arJa
nuar
y 1
Bui
ldin
g &
Con
tent
s$3
4,94
6,25
0$5
0,00
0E
arth
quak
e$2
0,00
0,00
02%
Floo
d$2
0,00
0,00
0$5
0,00
0S
tock
$1,7
14,0
00$5
,000
Com
pute
r Equ
ipm
ent
$500
,000
$5,0
00
Crim
e:Zu
rich
1 ye
arJa
nuar
y 1
Em
ploy
ee T
heft
$500
,000
$7,5
00Fo
rger
y or
Alte
ratio
n$5
00,0
00$7
,500
Insi
de o
f Pre
mis
es -
Thef
t of M
oney
& S
ecur
ities
$500
,000
$7,5
00In
side
of P
rem
ises
-Rob
bery
& S
afe
Bur
glar
y$5
00,0
00$7
,500
Out
side
of P
rem
ises
$500
,000
$7,5
00C
ompu
ter F
raud
$500
,000
$7,5
00Fu
nds
Tran
sfer
Fra
ud$5
00,0
00$7
,500
Mon
ey O
rder
s an
d C
ount
erfe
it P
aper
Cur
renc
y$5
00,0
00$7
,500
(1)
For m
ore
info
rmat
ion,
refe
r to
Not
e 5
(Ris
k M
anag
emen
t) ac
com
pany
ing
the
basi
c fin
anci
al s
tate
men
ts.
59

Sche
dule
16
Indi
anap
olis
Pub
lic T
rans
port
atio
n C
orpo
ratio
nTr
ansi
t Veh
icle
s
Dec
embe
r 31,
2014
N
o. o
f Se
atin
g Li
ft/R
amp
Vehi
cles
Year
(2)
Man
ufac
ture
Engi
ne T
ype
Cap
acity
Equi
pped
Larg
e B
us:
119
97G
illig
Die
sel
44+2
wc
Yes(
Lift)
219
98G
illig
Die
sel
44+2
wc
Yes(
Lift)
2319
99no
vaD
iese
l39
+3w
cYe
s(Li
ft)15
2000
Gill
igD
iese
l28
+2w
cYe
s(Li
ft)15
2000
Gill
igD
iese
l38
+2w
cYe
s(Li
ft)11
2001
New
Fly
erD
iese
l39
+2w
cYe
s(Li
ft)17
2002
New
Fly
erD
iese
l54
+2w
cYe
s(Li
ft)24
2003
Gill
igD
iese
l38
+2w
cYe
s(Li
ft)2
2004
Gill
igD
iese
l38
+2w
cYe
s(Li
ft)10
2007
Gill
igD
iese
l38
+2w
cYe
s(Li
ft)11
2010
Gill
igD
iese
l38
+2w
cYe
s(Li
ft)11
2010
Gill
igD
iese
l38
+2w
cYe
s(Li
ft)4
2013
Gill
igD
iese
l38
+2w
cYe
s(Li
ft)
146
To
tal L
arge
Bus
es
Bod
y on
Cha
ssis
:1
2006
Ford
Die
sel
11Ye
s(Li
ft)3
2008
Che
vyD
iese
l
1
2+2w
cYe
s(Li
ft)53
2009
Che
vyD
iese
l
1
0+2w
cYe
s(Li
ft)10
2009
Che
vyD
iese
l
8
+2w
cYe
s(Li
ft)4
2012
VP
GD
iese
l
3+
1wc
no3
2014
Che
vyD
iese
l
10+
wc
Yes(
Lift)
74To
tal B
ody
on C
hass
is
220
Veh
icle
s in
Tot
al F
leet
(1)
Use
d ex
clus
ivel
y fo
r dem
and
resp
onse
and
flex
ible
ser
vice
. IP
TC p
olic
y pr
eclu
des
stan
dees
on
thes
e ve
hicl
es.
(2)
Ave
rage
age
of e
quip
men
t is
9.8
year
s.(3
)P
leas
e re
fer t
o N
ote
3 of
the
finan
cial
sta
tem
ents
for a
dditi
onal
info
rmat
ion
rega
rdin
g ca
pita
l ass
ets.
60


1501 West Washington Street Indianapolis, IN 46222 317.635.2100
www.IndyGo.net