fin303 vicentiu covrig 1 risk and return (chapter 8)
TRANSCRIPT

FIN303Vicentiu Covrig
1
Risk and return(chapter 8)

FIN303Vicentiu Covrig
2
Investment returns
The rate of return on an investment can be calculated as follows:
(Amount received – Amount invested)
Return = ________________________
Amount invested
For example, if $1,000 is invested and $1,100 is returned after one year, the rate of return for this investment is:
($1,100 - $1,000) / $1,000 = 10%.
FIN303Vicentiu Covrig
3
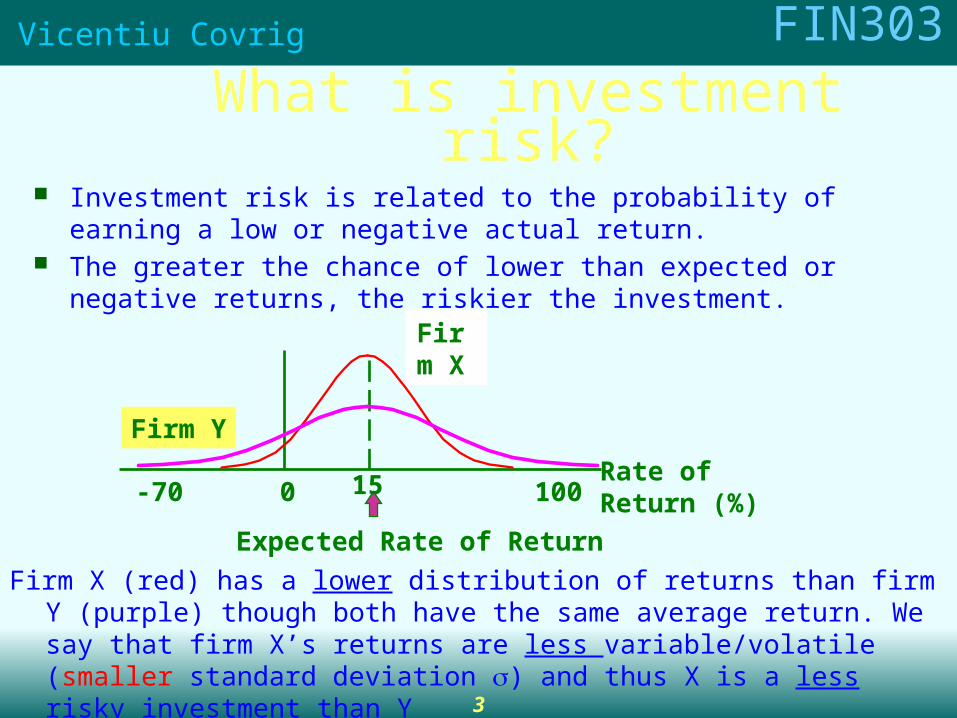
What is investment risk? Investment risk is related to the probability of earning a low or negative
actual return. The greater the chance of lower than expected or negative returns, the riskier
the investment.
Expected Rate of Return
Rate ofReturn (%)100150-70
Firm X
Firm Y
Firm X (red) has a lower distribution of returns than firm Y (purple) though both have the same average return. We say that firm X’s returns are less variable/volatile (smaller standard deviation ) and thus X is a less risky investment than Y
FIN303Vicentiu Covrig
4
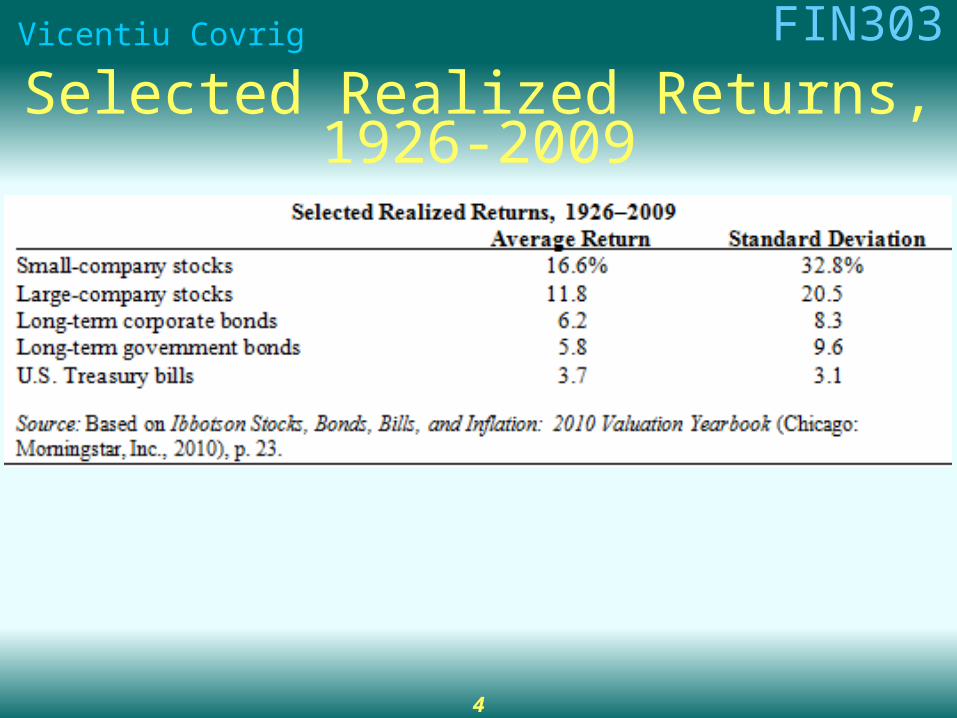
Selected Realized Returns, 1926-2009
FIN303Vicentiu Covrig
5
Why is the T-bill return independent of the economy? Do T-bills promise a completely risk-
free return?• T-bills will return the promised 5.5%, regardless of the
economy.• No, T-bills do not provide a completely risk-free return,
as they are still exposed to inflation. Although, very little unexpected inflation is likely to occur over such a short period of time.
• T-bills are also risky in terms of reinvestment risk.• T-bills are risk-free in the default sense of the word.

FIN303Vicentiu Covrig
6
Return: Calculating the expected return for each alternative
occurs outcomeeach y that probabilit p
outcomeeach for return expected r
outcomes ofnumber n where
rP....rP r
return of rate expected r
nn11
^
^
Outcome Prob. of outcome Return in 1(recession) .1 -15%2 (normal growth) .6 15%
3 (boom) .3 25%
r^ =expected rate of return = (.1)(-15) + (.6)(15) +(.3)(25)=15%

FIN303Vicentiu Covrig
7
Risk: Calculating the standard deviation for each alternative
Standard deviation (σ) measures total, or stand-alone, risk. Greater the σ, greater the risk. Why?
10.96%
(0.3)15.0) - (25.0
(0.6)15.0) - (15.0 (0.1)15.0) - (-15.0
P )r (r
21
2
22
n
1ii
2^
i
FIN303Vicentiu Covrig
8
Investor attitude towards risk Risk aversion – assumes investors dislike risk and require higher
rates of return to encourage them to hold riskier securities. Risk premium – the difference between the return on a risky
asset and less risky asset, which serves as compensation for investors to hold riskier securities
Very often risk premium refers to the difference between the return on a risky asset and risk-free rate (ex. a treasury bond)
Standard deviation (σi) measures total, or stand-alone, risk.
The larger σi is, the lower the probability that actual returns will be closer to expected returns.
Larger σi is associated with a wider probability distribution of returns.
FIN303Vicentiu Covrig
9
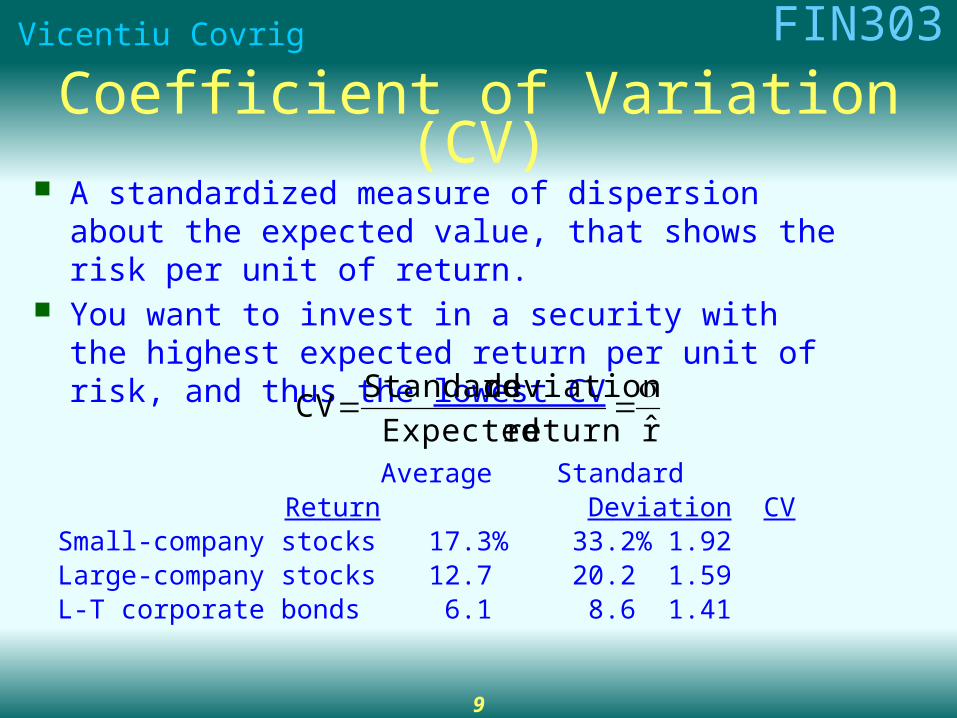
Coefficient of Variation (CV) A standardized measure of dispersion about the expected
value, that shows the risk per unit of return. You want to invest in a security with the highest expected
return per unit of risk, and thus the lowest CV
r̂return Expecteddeviation Standard
CV
Average StandardReturn Deviation CV
Small-company stocks 17.3% 33.2% 1.92Large-company stocks 12.7 20.2 1.59L-T corporate bonds 6.1 8.6 1.41
FIN303Vicentiu Covrig
10
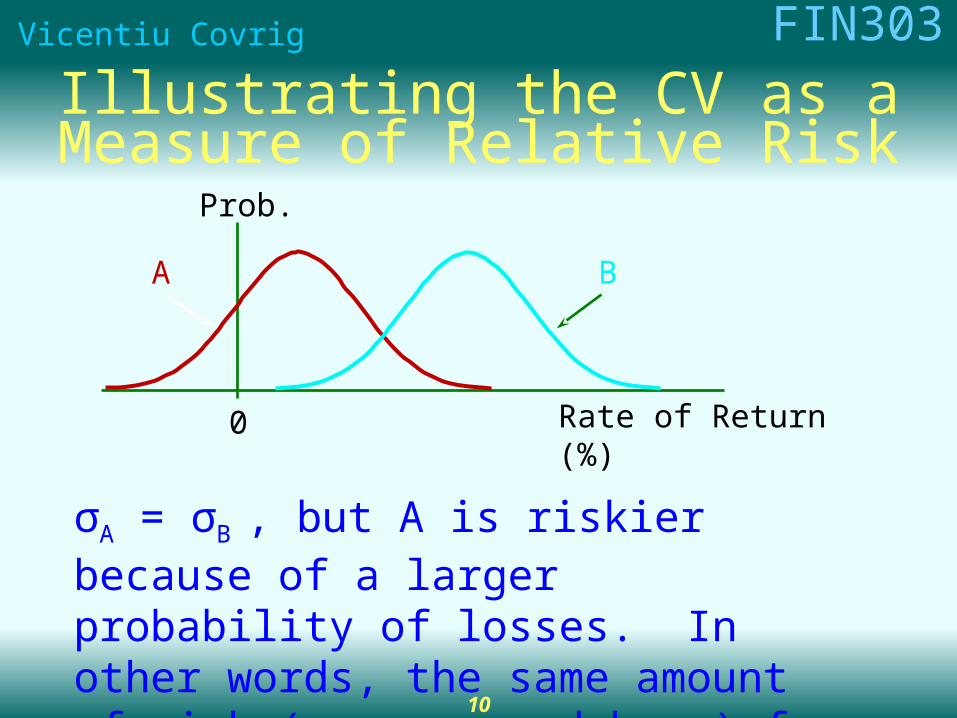
Illustrating the CV as a Measure of Relative Risk
σA = σB , but A is riskier because of a larger probability of losses. In other words, the same amount of risk (as measured by σ) for smaller returns.
0
A B
Rate of Return (%)
Prob.
FIN303Vicentiu Covrig
11
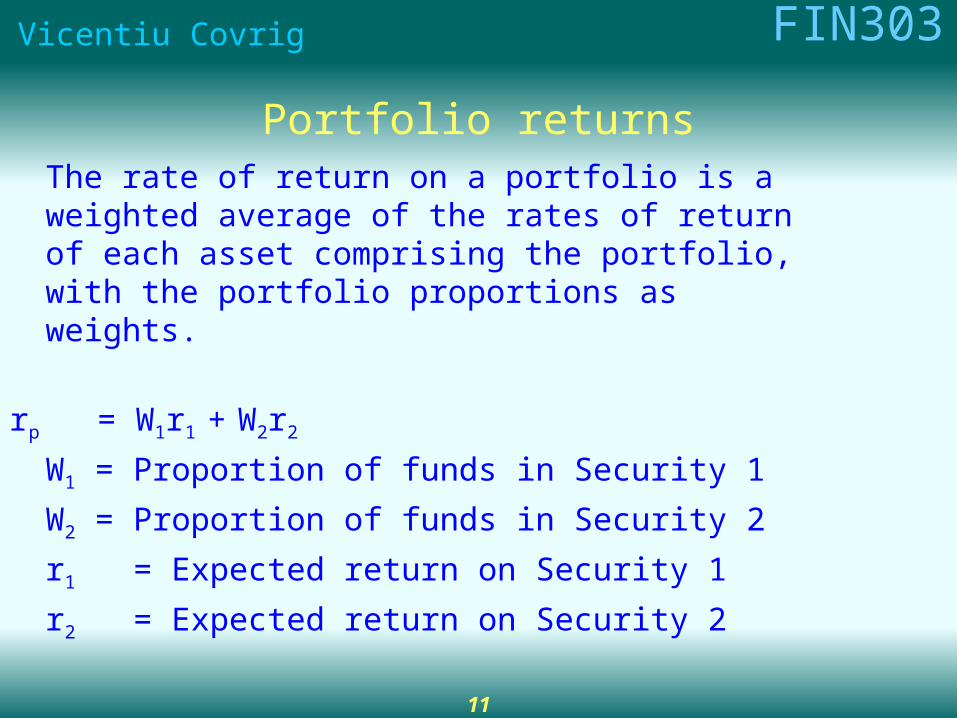
Portfolio returnsThe rate of return on a portfolio is a weighted average of the rates of return of each asset comprising the portfolio, with the portfolio proportions as weights.
rp = W1r1 + W2r2
W1 = Proportion of funds in Security 1
W2 = Proportion of funds in Security 2
r1 = Expected return on Security 1
r2 = Expected return on Security 2

FIN303Vicentiu Covrig
12
Assume that you invested $3000 in Citi stock and $2,000 in Yahoo stock. The expected return of Citi stock is 15%and the expected return of Yahoo is 20%. What is the portfolio expected return?
Answer: W1=3,000/(3,000+2,000)=0.6W2=2,000/ (3,000+2,000)=0.4Expected portfolio return = 0.6*15%+0.4*20%= 17%

FIN303Vicentiu Covrig
13
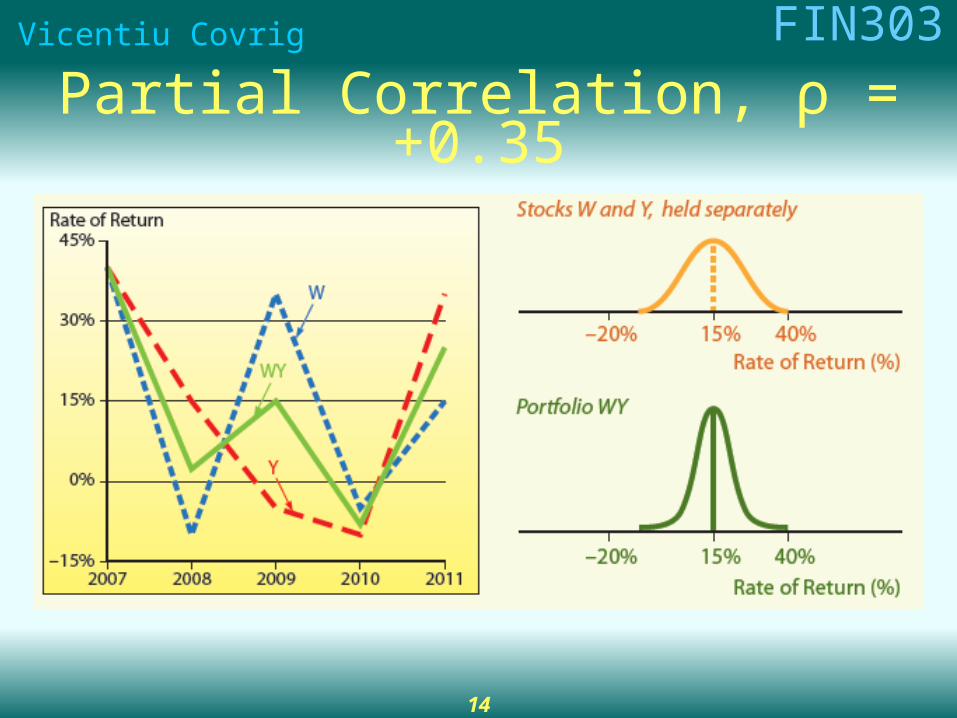
The benefits of diversification Come from the correlation between asset returns Correlation, : a measure of the strength of the linear relationship between two
variables -1.0 < r < +1.0 If r = +1.0, securities 1 and 2 are perfectly positively correlated If r = -1.0, 1 and 2 are perfectly negatively correlated If r = 0, 1 and 2 are not correlated The smaller the correlation, the greater the risk reduction potential greater the
benefit of diversification If r = +1.0, no risk reduction is possible Most stocks are positively correlated with the market (ρ 0.65) Combining stocks and bonds in a portfolio generally lowers risk.
FIN303Vicentiu Covrig
14
Partial Correlation, ρ = +0.35

FIN303Vicentiu Covrig
15
Illustrating diversification effects of a stock portfolio
# Stocks in Portfolio10 20 30 40 2,000+
Company-Specific Risk
Market Risk
20
0
Stand-Alone Risk, sp
sp (%)35
FIN303Vicentiu Covrig
16
Creating a Portfolio: Beginning with One Stock and Adding Randomly Selected Stocks
to Portfolio
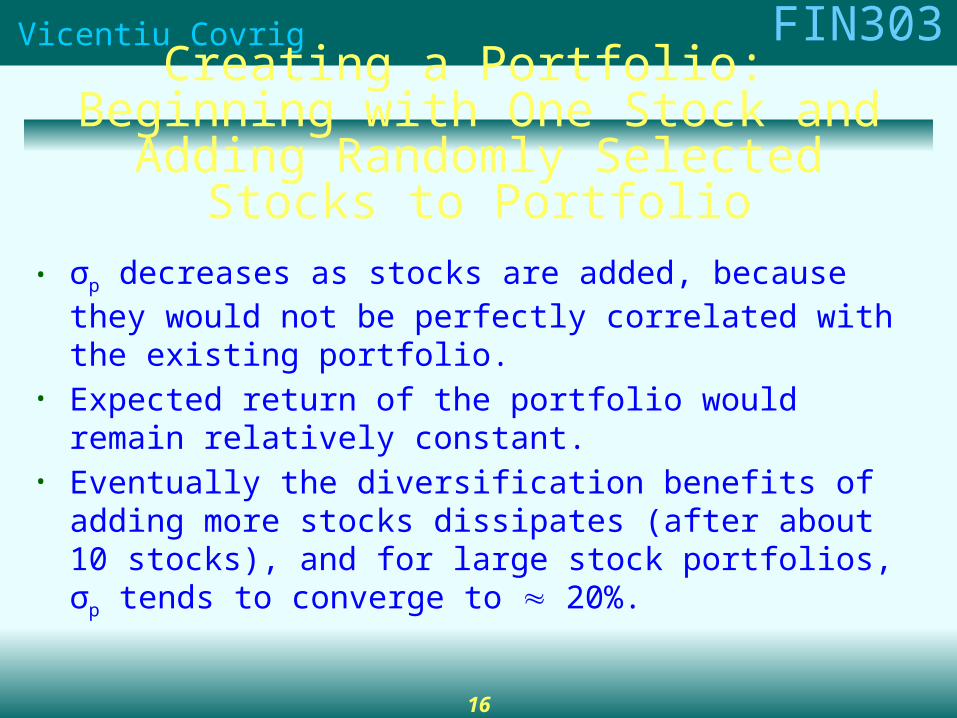
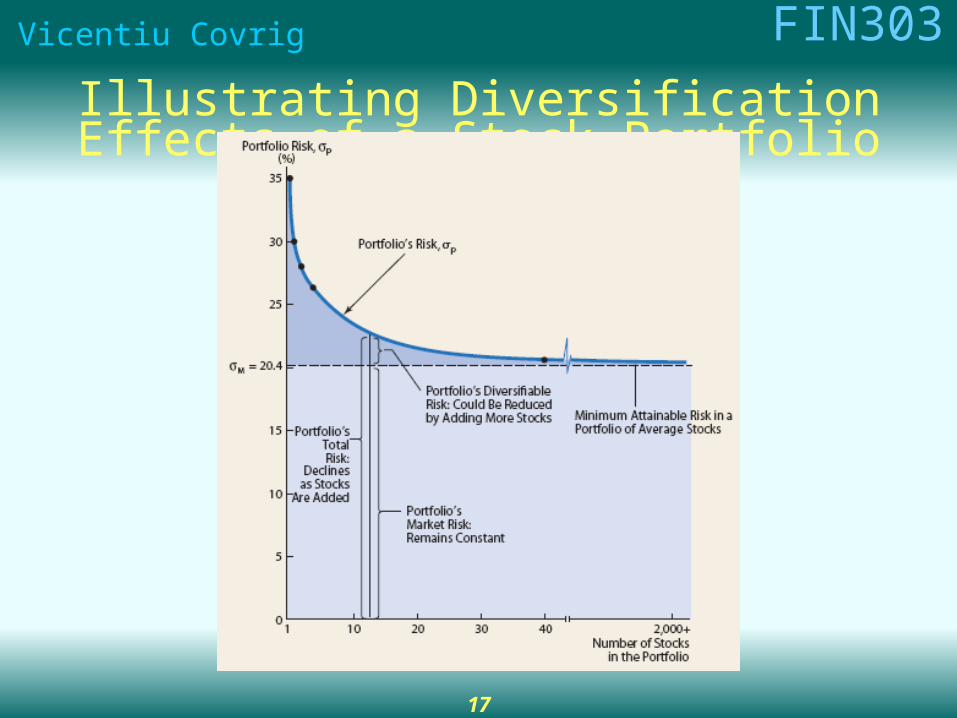
• σp decreases as stocks are added, because they would not be perfectly correlated with the existing portfolio.
• Expected return of the portfolio would remain relatively constant.
• Eventually the diversification benefits of adding more stocks dissipates (after about 10 stocks), and for large stock portfolios, σp tends to converge to 20%.
FIN303Vicentiu Covrig
17
Illustrating Diversification Effects of a Stock Portfolio
FIN303Vicentiu Covrig
18
Breaking down sources of riskStand-alone risk = Market risk + Firm-specific risk
Market risk – portion of a security’s stand-alone risk that cannot be eliminated through diversification. Measured by beta.
Firm-specific risk – portion of a security’s stand-alone risk that can be eliminated through proper diversification.
If an investor chooses to hold a one-stock portfolio (exposed to more risk than a diversified investor), would the investor be compensated for the risk they bear?- NO!- Stand-alone risk is not important to a well-diversified investor.- Rational, risk-averse investors are concerned with σp, which is based upon
market risk.
FIN303Vicentiu Covrig
19
Capital Asset Pricing Model (CAPM)
Model based upon concept that a stock’s required rate of return is equal to the risk-free rate of return plus a risk premium that reflects the riskiness of the stock after diversification.
Primary conclusion: The relevant riskiness of a stock is its contribution to the riskiness of a well-diversified portfolio
Beta: measures a stock’s market risk
Indicates how risky a stock is if the stock is held in a well-diversified portfolio
Beta is calculated using regression analysis
FIN303Vicentiu Covrig
20
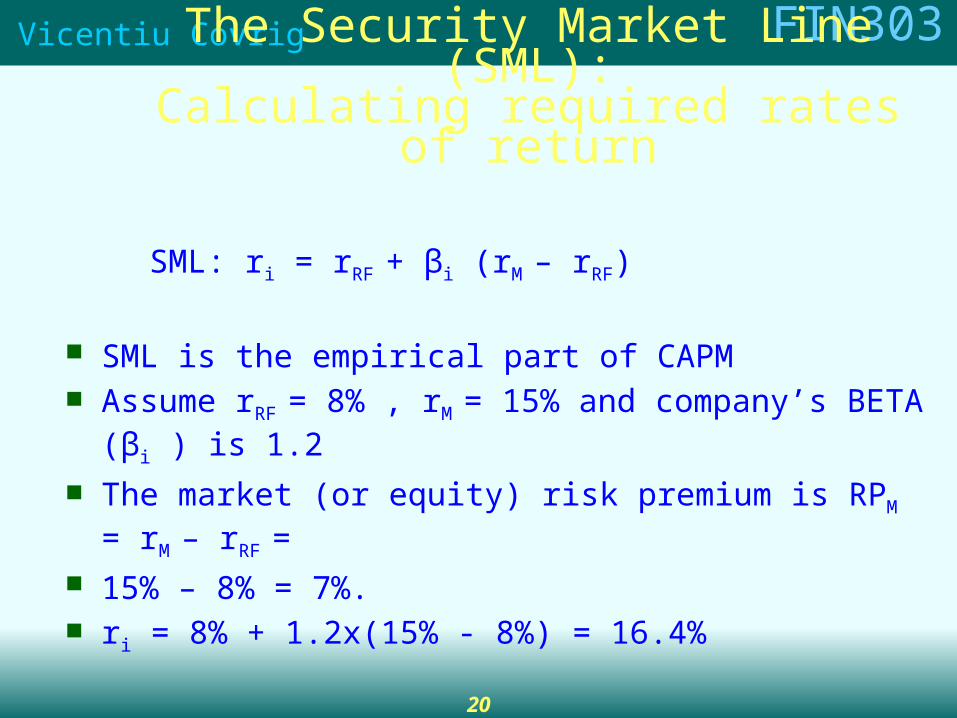
The Security Market Line (SML):Calculating required rates of return
SML: ri = rRF + βi (rM – rRF)
SML is the empirical part of CAPM Assume rRF = 8% , rM = 15% and company’s BETA (βi ) is 1.2
The market (or equity) risk premium is RPM = rM – rRF = 15% – 8% = 7%. ri = 8% + 1.2x(15% - 8%) = 16.4%

FIN303Vicentiu Covrig
21
What is the market risk premium?• Additional return over the risk-free rate needed to
compensate investors for assuming an average amount of risk.
• Its size depends on the perceived risk of the stock market and investors’ degree of risk aversion.
• Varies from year to year, but most estimates suggest that it ranges between 4% and 8% per year.
FIN303Vicentiu Covrig
22
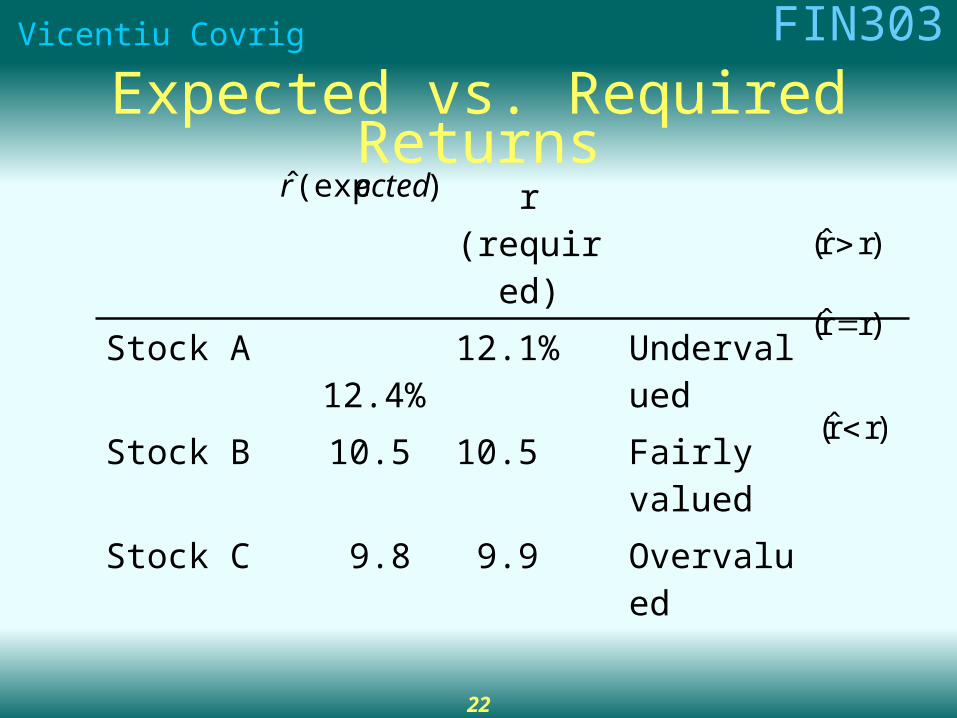
r (required)
Stock A 12.4% 12.1% Undervalued
Stock B 10.5 10.5 Fairly valued
Stock C 9.8 9.9 Overvalued
Expected vs. Required Returns)(expˆ ectedr
)rr̂(
)rr̂(
)rr̂(

FIN303Vicentiu Covrig
23
Illustrating the Security Market Line
..
Coll
.HT
T-bills
.USR
SML
rM = 10.5
rRF = 5.5
-1 0 1 2
.
SML: ri = 5.5% + (5.0%)bi
ri (%)
Risk, bi

FIN303Vicentiu Covrig
24
An Example:Equally-Weighted Two-Stock Portfolio
• Create a portfolio with 50% invested in High Tech and 50% invested in Collections.
• The beta of a portfolio is the weighted average of each of the stock’s betas.
bP = wHTbHT + wCollbColl
bP = 0.5(1.32) + 0.5(-0.87)
bP = 0.225
FIN303Vicentiu Covrig
25
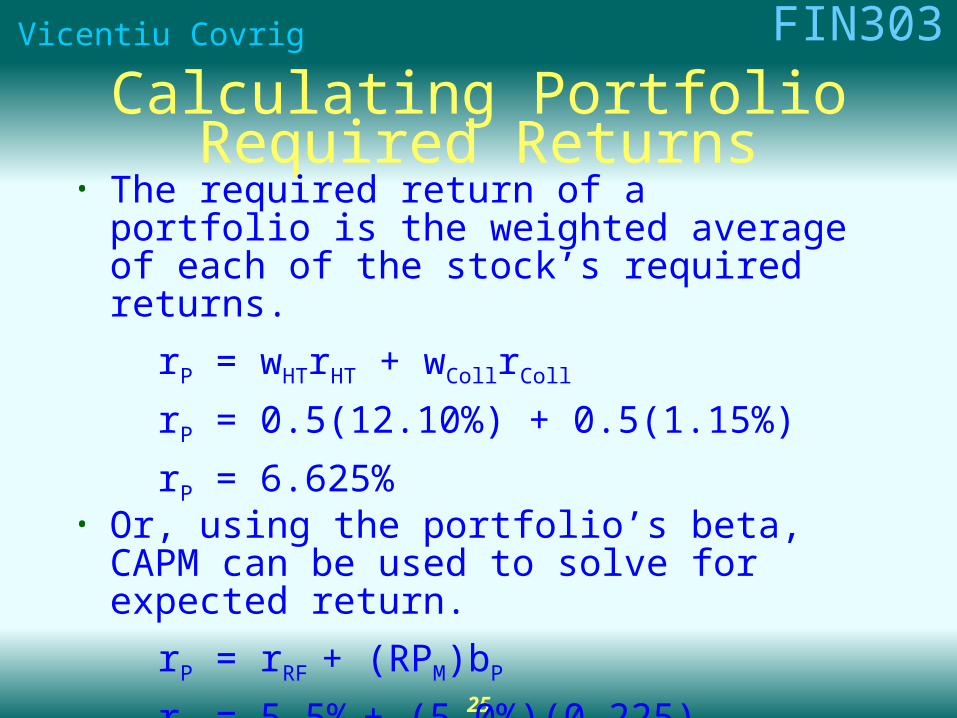
Calculating Portfolio Required Returns• The required return of a portfolio is the weighted
average of each of the stock’s required returns.
rP = wHTrHT + wCollrColl
rP = 0.5(12.10%) + 0.5(1.15%)
rP = 6.625%• Or, using the portfolio’s beta, CAPM can be used
to solve for expected return.
rP = rRF + (RPM)bP
rP = 5.5% + (5.0%)(0.225)
rP = 6.625%
FIN303Vicentiu Covrig
26
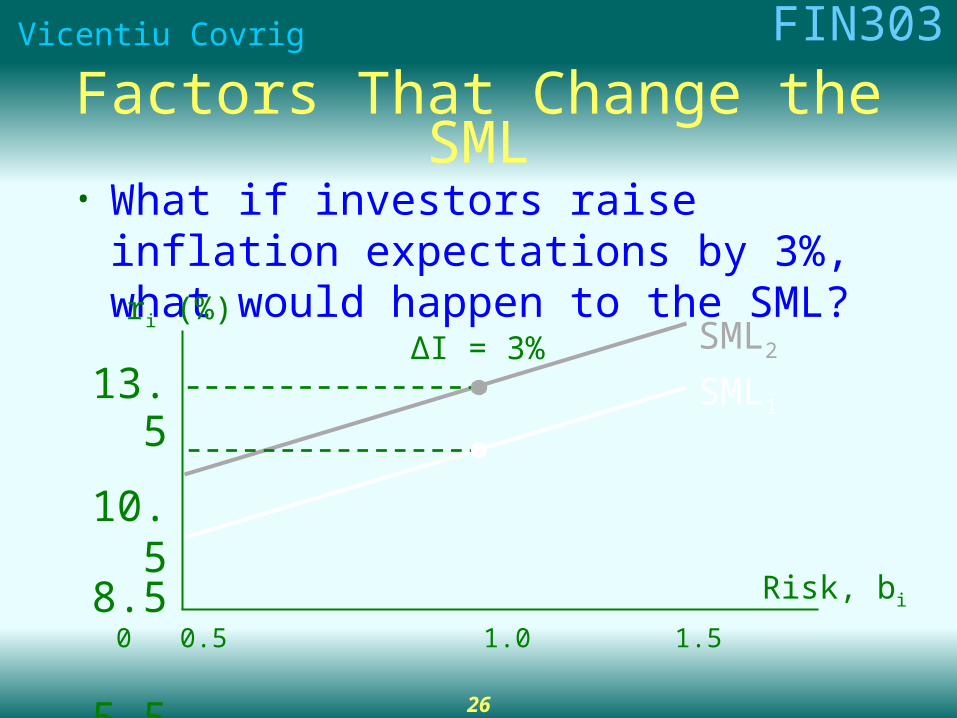
Factors That Change the SML• What if investors raise inflation
expectations by 3%, what would happen to the SML?
SML1
ri (%)SML2
0 0.5 1.0 1.5
13.5
10.58.5
5.5
ΔI = 3%
Risk, bi
FIN303Vicentiu Covrig
27
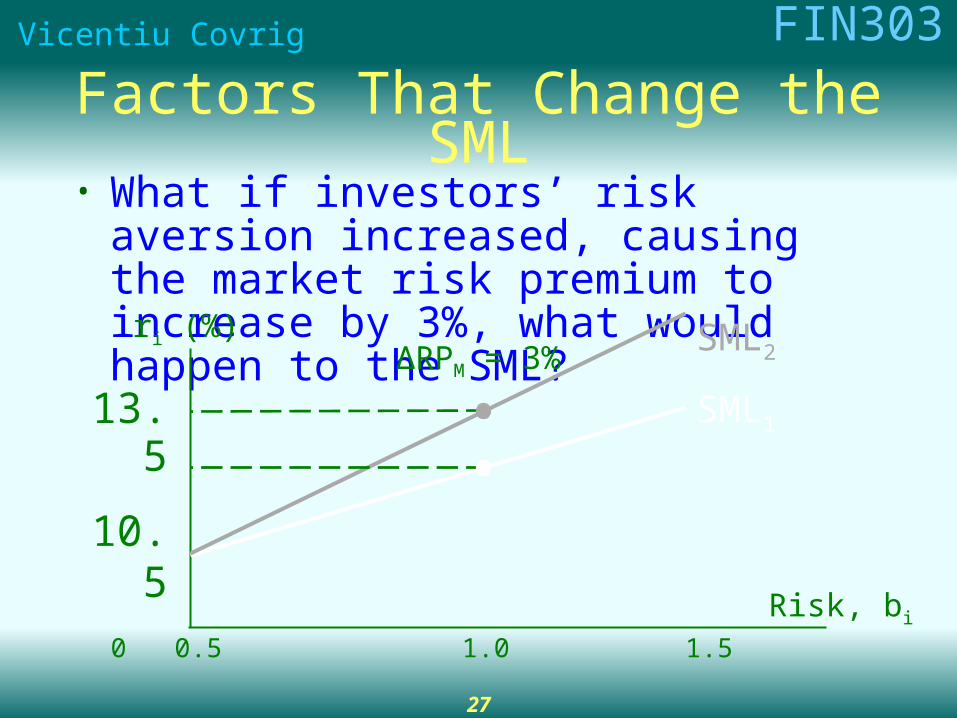
Factors That Change the SML• What if investors’ risk aversion increased,
causing the market risk premium to increase by 3%, what would happen to the SML?
SML1
ri (%) SML2
0 0.5 1.0 1.5
ΔRPM = 3%
Risk, bi
13.5
10.5
5.5
FIN303Vicentiu Covrig
28
Comments on beta
If beta = 1.0, the security is just as risky as the average stock (the market)
If beta > 1.0, the security is riskier than average (the market) If beta < 1.0, the security is less risky than average (the market)
CAPM/SML concepts are based upon expectations, but betas are calculated using historical data. A company’s historical data may not reflect investors’ expectations about future riskiness.
FIN303Vicentiu Covrig
29
Can the beta of a security be negative?• Yes, if the correlation between Stock i and
the market is negative (i.e., ρi,m < 0).
• If the correlation is negative, the regression line would slope downward, and the beta would be negative.
• However, a negative beta is highly unlikely.
FIN303Vicentiu Covrig
30
Calculating Betas• Well-diversified investors are primarily concerned with how
a stock is expected to move relative to the market in the future.
• Without a crystal ball to predict the future, analysts are forced to rely on historical data. A typical approach to estimate beta is to run a regression of the security’s past returns against the past returns of the market.
• The slope of the regression line is defined as the beta coefficient for the security.
FIN303Vicentiu Covrig
31
Learning objectives Know how to calculate a rate of return; historical rates of return 1926-2001 Discuss the investment risk; know that our risk measure will be the standard
deviation of returns (no calculations are necessary) Know how to calculate expected return, standard deviation and coefficient of
variation given probabilities of each outcome Know what is risk aversion and risk premium Know how to calculate the portfolio return Discuss the diversification effects of a portfolio; the role of correlation and its two
signs and the benefits of diversification Know the two sources of risk; market and firm specific Briefly discuss what is CAPM and beta Know how to calculate required return using SML Recommended problems: ST-1, Questions 8-4,8-7,8-8, problems 8-1 to 8-8