fin loads and control-surface hinge …...fin loads and control-surface hinge moments measured in...
TRANSCRIPT

NASA TECHNICAL
M E M O R A N D U M
CMCM
tX
f—
eso <t=9 SS
^ t;
UBNASA TM X4922-
S
FIN LOADS AND CONTROL-SURFACEHINGE MOMENTS MEASURED INFULL-SCALE WIND-TUNNEL TESTSON THE X-24A FLIGHT VEHICLE
by Ming H. Tang and V. Michael DeAngelh
Flight Research Center
Edwards, Calif,
NftTIGNSl AERONAUTICS AND SPACE ADMINISTRATION • WASHINGTON, D. C, • NOVEMBER 1969
https://ntrs.nasa.gov/search.jsp?R=19710005026 2020-03-23T04:45:40+00:00Z

1. Report No. 2. Government Accession No.NASA OM X-1922
4. Title and Subtitle FIN LOADS AND CONTROL -SURF ACEHINGE MOMENTS MEASURED IN FULL-SCALE WIND-TUNNEL TESTS ON THE X-24A FLIGHT VEHICLE (U)
7. Author(s)
Ming H. Tang and V. Michael DeAngelis
9. Performing Organization Name and AddressNASA Flight Research CenterP. O. Box 273Edwards, California 93523
12. Sponsoring Agency Name and AddressNational Aeronautics and Space AdministrationWashington, D. C. 20546
3. Recipient's Catalog No.
5. Report DateNovember 1969
6. Performing Organization Code
8. Performing Organization Report No.H-580
10. Work Unit No.727-00-00-01-24
11. Contract or Grant No.
13. Type of Report and Period Covered
Technical Memorandum
14. Sponsoring Agency Code
15. Supplementary Notes
16. Abstract (U)
Tests were conducted on the full-scale X-24A lifting body in the 40- by80 -Foot Wind Tunnel at the NASA Ames Research Center. One purpose ofthe tests was to measure aerodynamic loads on the stabilizing fins andhinge moments on all the control surfaces. The tests were conducted atdynamic pressures of 60, 80, and 100 lb/ft2 (2870, 3830, and 4790 N/m2).The effects of variations in rudder deflection, flap deflection, and anglesof attack and sideslip were studied. Also, limited tests were performedwith a simulated ablated coating over most of the vehicle to assess theeffects of the ablated surface on the aerodynamic characteristics.
Detailed results of the wind-tunnel tests are given in the form of loadcoefficients and hinge -moment coefficients. The results are comparedwith data from tests performed in other wind tunnels on small-scale models.
17. Key Words Suggested by Author(s)X -24 A lift ing bodyFull-scale wind-tunnel loads
19. Security Classif. (of this report)
18. Distribution StatementAvailable to U. S. Government Agencies and Their
Contractors Only
20. Security Classif. (of this page) 21. No. of Pages 22. Price
Unclassified 34

FIN LOADS AND CONTROL-SURFACE HINGE MOMENTS MEASURED IN
FULL-SCALE WIND-TUNNEL TESTS ON THE X-24A FLIGHT VEHICLE*
By Ming H. Tang and V. Michael DeAngelisFlight Research Center
INTRODUCTION
The development of maneuverable vehicles capable of controlled reentry from earthorbit to a tangential landing led to the construction of three manned lifting-bodyconfigurations to investigate flight controllability in the terminal recovery area. (Seerefs. 1 and 2.) One of these vehicles is the X-24A, currently being flight tested at theNASA Flight Research Center.
The design of the X-24A was based more heavily on configurational test results thanis usual for most flight vehicles. Because the configuration is different from that ofconventional aircraft, there was little design precedent upon which to rely. The finaldesign was the result of an evolutionary process which combined engineering judgmentand theoretical studies with the results of numerous wind-tunnel tests on small-scalemodels. Consequently, as part of the preparation for a flight-test program, it wasdeemed advisable to conduct tests on the full-scale vehicle in the 40- by 80-Foot WindTunnel at the NASA Ames Research Center. A portion of the tests was performed tomeasure aerodynamic loads on the stabilizing fins and hinge moments on all the controlsurfaces. Loads measurements were made with strain-gage instrumentation. Generally,the tests were conducted at a Mach number of 0. 25. In addition, tests were made witha simulated ablated coating on the fuselage and outer portions of the outboard fins toassess the effect of the ablated surface on aerodynamic characteristics, including finloads and control-surface hinge moments.
This repdrf presents~the"loads measurement-s-from the-fullrscale.wind-tunnel J;estsand compares the results with data from previous tests on 8-percent-scale models inother wind tunnels. The comparisons show the agreement between full-scale and small-scale tests and may help to establish a level of confidence in the structural design ofthe vehicle.
SYMBOLS
Measurements for this investigation were taken in the U. S. Customary System ofUnits. Equivalent values are indicated herein in the International System of Units (SI).Details concerning the use of SI, together with physical constants and conversions, aregiven in reference 3.
*Title, Unclassified.

• • : • •• • ; .:•: ... •• ••
B fin bending moment, in-lb (m-N)
b reference span, in. (m)
•r>
fin bending-moment coefficient, qSb
Hcontrol-surf ace hinge-moment coefficient,
fin normal-force coefficient, -5-
TCT fin torsion coefficient,
qSc
T , -5—1 . qSc
c mean aerodynamic chord, in. (m)
c average chord, in. (m)
H hinge moment, in-lb (m-N)
M free-stream Mach number
N fin normal force, Ib (N)
q free-stream dynamic pressure, Ib/ft (N/m^)
S surface area, ft^ (m^)
T fin torsion, in-lb (m-N)
V relative wind, ft/sec (m/sec)
X, Y, Z vehicle reference axes
a vehicle angle of attack, deg

ft vehicle angle of sideslip, deg
6 control-surf ace deflection, deg
6,m differential upper-flap deflection (right roll positive)
Subscripts:
c center fin
I lower flap
r rudder
rb rudder bias
rl lower rudder
ru upper rudder
t outboard fin
u upper flap
DESCRIPTION OF THE X-24A VEHICLE
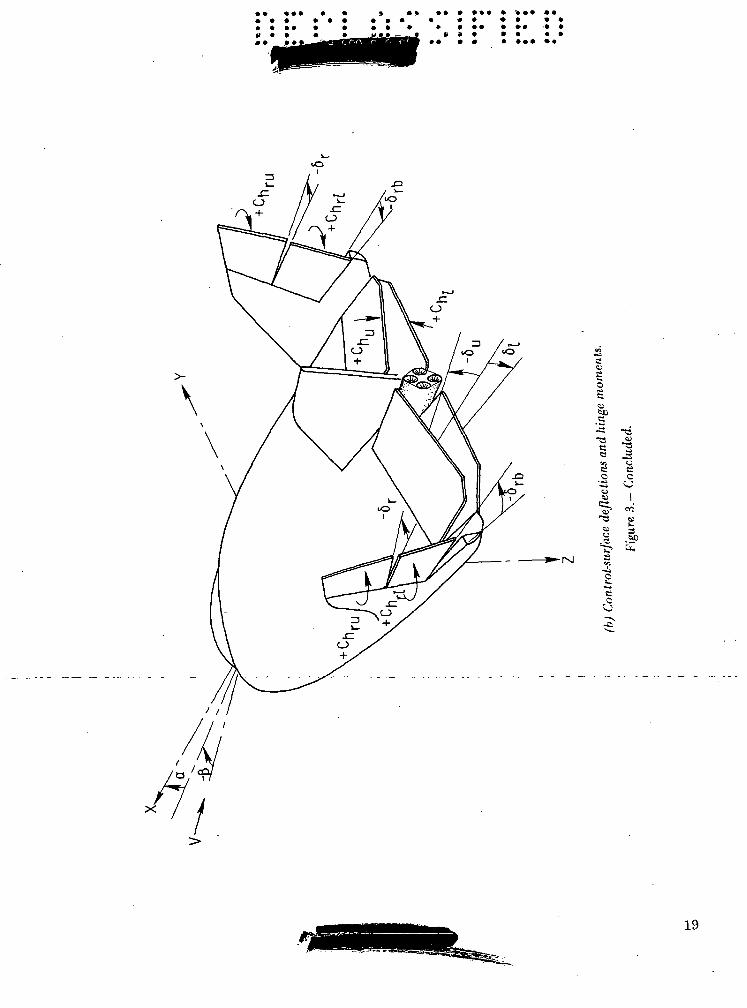
.The X-24A research vehicle , installed in the 40- by 80-Foot Wind Tunnel at theNASA Ames Research Center^ "is~s'h6wnIn figure Ir; ~The-X—24A-has-a-boattailedJbodywith a thick midsection and a blunt nose, three stabilizing vertical fins, and eightcontrol surfaces — four rudders and four flaps. A three-view drawing of the vehicle isshown in figure 2.
Two pairs of rudders, located at the trailing edges of the two outboard fins, can bemoved symmetrically in bias with their trailing edges deflected either outward orinward from the zero, position by an equal amount. In addition, the upper rudders maybe deflected in unison (i. e. , both rudders moving in the same direction) from the biasposition to provide directional control. The two upper flaps and the two lower flaps maybe deflected symmetrically for pitch and trim control. Either the upper flaps or thelower flaps may be deflected differentially for roll control.
A more detailed description of the X-24A vehicle is given in reference 4. Pertinentphysical dimensions of the fins and control surfaces are listed in table I.

INSTRUMENTATION
Instrumentation for the wind-tunnel tests consisted of the wind-tunnelinstrumentation, which measured the tunnel dynamic pressure and vehicle attitude, andthe vehicle instrumentation. Vehicle instrumentation was connected to a pulse codemodulation (PCM) system which telemetered the data to a nearby ground station forstorage on magnetic tape. The wind-tunnel instrumentation was connected to the tunneldata-acquisition system (ref. 5).
The sign conventions for parameters used in this report are shown in figure 3.
Strain-Gage Instrumentation and Calibration
The left-hand outboard fin and the center fin (fig. 3(a)) each have three spars totransmit aerodynamic loads. Five strain-gage shear bridges and six strain-gagebending bridges were installed at the root region of the three spars of the outboard fin.Four shear bridges and four bending bridges were installed at the root region of the twoforward spars of the center fin.
The outboard-fin instrumentation was calibrated by the conventional point-by-pointprocedure of reference 6. Loads were applied at 17 load points on the surface of theoutboard fin. The center fin was calibrated by a distributed load technique. Approxi-mately 75 percent of the area of the center fin was loaded by four separately controlledjacks acting through eight load pads. By regulating the forces applied by each of thejacks, the center of pressure of the combined load from all the jacks was moved to27 different positions over an area bounded by 20 percent to 60 percent of the meanaerodynamic chord and by 40 percent to 60 percent of the span. A large number ofbridge combinations were investigated by means of influence coefficient analysis toderive loads equations (ref. 6). The most accurate equations for shear, bendingmoment, and torque were selected for use with the wind-tunnel data.
The control-surface hinge-moment instrumentation consisted of strain-gagebending bridges mounted on the actuator mechanisms of the various control surfaces.The control-surf ace instrumentation was calibrated at several control positions byloading each surface in place on the aircraft and recording the outputs on a PCM system.A straight line fitted through the data points established the relationship between loadand strain-gage output at each control-surf ace position.
Control -Surface -Position Instrumentation
The position of each control surface was measured by a control-position transducerwhich was calibrated in place on the vehicle with a template prior to the wind-tunneltest. Deflections of the rudders and flaps were taken as the average of the left-handand right-hand surfaces.

"
ESTIMATED ERRORS
Estimates were made of the errors in each of the parameters pertinent to thepresentation of the loads data. The vehicle's attitude and the dynamic-pressure errorswere obtained from reference 5. The error in the control-surf ace position wasestimated from ground-test results.
A probable error of resolution was determined for the shear, bending moment, andtorque equations for the left-hand and center fins and the control-surface hinge moments.This resolution error is based on the PCM system error.
In addition to the resolution error, an equation error was calculated for the shear,bending moment, and torque of the left-hand and center fins. The equation errors arebased on a check-load calibration performed immediately following the wind-tunnel tests.
Because the control-surface hinge moments were obtained from linear influencecoefficients which were free of hysteresis, there are no relevant equation errors.
The estimated errors of the pertinent aircraft and load parameters are summarizedin the following table:
Parametera . .BaQ
Error
±0.2°±0.3°±0 . 3°iO.5 percent
Bc~Probable error of resolutionEquation error
B f-Probable error of resolutionEquation error
Probable error of resolutionEquation error
Probable error of resolutionEquation error
Probable error of resolutionEquation error
Probable error of resolution .Equation error
Hinge-moment probable errors —Upper ruddersLower ruddersUpper flapsRight-hand lower flap
160 in-lb (18. 1 m-N)5 percent
350 in-lb (39.6 m-N)8 percent
24 Ib (106.8 N)5 percent
-120-lb-(533-.8-N-)-8 percent
360 in-lb (40.7 m-N)15 percent
2100 in-lb (237.3 m-N)9 percent
51 in-lb (5.8 m-N)76 in-lb (8.6 m-N)125 in-lb (14. 1 m-N)260 in-lb (29.4 m-N)

TEST PROCEDURE
The vehicle was mounted on struts in the test section of the 40- by 80-Foot WindTunnel. All the wind-tunnel tests discussed herein were performed with the landing -gear doors closed (fig. 1). The wind tunnel is described in reference 7.
The operating procedure was as follows: The control surfaces were set for aparticular configuration, and the vehicle was rotated through a range of angles of attackfrom 0° to 20°. Then the control-surf ace settings were changed, and the angle-of-attackrange was again traversed. Generally, the tests were conducted at a Mach number of0. 25 and a dynamic pressure of 100 lb/ft2 (4790 N/m2). For a limited number of tests,the angle of sideslip and the dynamic pressure were varied; dynamic pressure rangedfrom 60 to 100 lb/ft2 (2870 to 4790 N/m2). Reynolds number varied from 1.52 x 10⁶ perfoot (4. 99 x 106 per meter) to 2.17 x 1Q6 per foot (7.12 x 10⁶ per meter).
In order to simulate the vehicle with a reentry ablated shield in a post-reentrycondition, a mixture of sand and glue was affixed to the outboard sides of the outboardfins and to the sides and bottom of the fuselage. A detailed description of the ablatedtest is presented in reference 8. Shear, bending moment, and torsion loads on the left-hand fin and hinge moments on the eight control surfaces were acquired for the ablatedconfiguration.
The X-24A, with eight control surfaces, presents many possible combinations ofcontrol-surface settings and vehicle attitudes. In order to establish a reasonable numberof configurations for the wind-tunnel tests, only control-surface settings which werelikely to affect the loads significantly were considered. From these, configurationswere selected which were within the range of control-surface settings and vehicleattitudes most likely to be encountered during the manned flight-test program. Only onecontrol-surf ace position or vehicle attitude was varied at a time in order to isolate theeffect on the loads of a change in a particular condition.
RESULTS AND DISCUSSION
Results of the full-scale wind-tunnel tests are presented in figures 4 to 7, and thetest conditions associated with these results are listed in the table on the following page.
Load Coefficients
Left-hand outboard fin. — The left-hand outboard-fin normal-force, bending-moment,and torsion coefficients are plotted against angle of attack in figure 4. In general, thefigure shows that increasing the angle of attack increased the normal-force and bending -moment coefficients. The torsion coefficient was not very sensitive to variation inangle of attack. Positive rudder bias and positive rudder deflections increased theoutboard-fin normal-force and bending-moment coefficients and increased the negativevalues of the torsion coefficients, as shown in figures 4(a) to 4(c). Figure 4(d)illustrates that increasing the deflection of the upper flaps reduced the normal-forceand bending-moment coefficients and had negligible effect on the torsion coefficient.

cQ
rti
oo
COCD
ooCD
-
"O
be •0•o.t,
oT3
«r00(D
T3„
3
to
00
"O
3
00CD
-^X
CDCJOS
*H303
5 !
C<)
£""•'/
-^ ' — '•ij.D
CD SiSi CD
FT | ^
C
—CD
sCOCD
D.
CO
CCD
O
'SOO
-aI.rto£3
T3
§£
CD
O O O O O O O O O
1
I I I I I I
O O O
o o o o o o o o orH rH rH CM rH rH rH
O
o
o o o o o o o o o
o o o o c o c o o o o1^1 *\1 ^vl ^^ 1 1 CM C*-! CM
1 1 1 1 I I I
O<N
COt
o o o o o o o o o
o
o1
•a
~C3
^
T3
S c q c c c g c c
U U U C J O U U U U
'
o o o o o o o o oGl CT5 Ol G^ CT3 C75 t * CO C7it C^ C^ D~ t~ C^ OO CJO C—- f ' ^ f ' H T j ' ^ f ' ^ C M C O ^ f
O O O~ O O~O 'O' 'O"O —o o o o o o o o c o
a £* o T) CD <— ooT^ -^ H/ T^< Tt4 T^ rH
eCO
^H
4Jra
o•^z
o
4 -1
E-i
cQJo
,
o o
0 0
o orH
o o
o^
oCM
1
O COCM 1
1
o o
o
o1
§•5CD CD
o o
0 0t— G500 C-CM rf
o o-0 0
cS aIP LO^
CO
o
o
«°o
CJ•,
o
CDT3TJ3•-J_CD
-aiCDQ.a.n
o o o o o o o o o1
1 1 1 " i i T,.
o o o
CJ3 GJ O^
o o o o o o o o orH rH rH CM rH rH rH
0
o
o o o o o o o o o
o o o o c o c o o o oCM CM CM CO 1 1 CM CM CM
1 1 1 1 III
oCM
CO1
o o o o o o o o o
o
o1
•aCD
ort•acC3
§ § § § § § § § §C D C D C D C D C D C D 0 C D C D
O O U.O U O O O O
o o o o o o o o o<J5 C71 C^ C71 Gl O^ t CO Git~ t~ D~ 1^— C~ C^ 00 00 t~*• ; 1 ' T ' ^ 4 ^ t ' l r f H / C M C O * ^ '
- O O O O O O O O Oo o o o o o o oo~o~
— . — •
cj ,c o ~ CJ <« bJOo o o o o o o
e
CO
j:Q
3
O
Q.rtC
CD>O
•a£3
-CDaQ,D
_ . _
o o o o o o o
en o o o cp cr> en
fco
05
O O O O O O OrH CM rH rH rH
OrH
O
O O O O O O O
O O CO CO O O O^<1 CO 1 1 CM CM CM
OCM
CO
o o o o o o o
o
o1
TD
t3
.O
-aS
§ i § § c3 S SCD CD CD CD CD CD CD
O O U U O O O
o o o o o o oG} GS Gl Gl t~ CO O}t- t> t- C- 00 00 l>Tf -^ ^t- ^ CM CO Tf
O O O O O O O-o-o-o -o-o -oo.-o -
C3 £ O ~O CD
t- c- c- c- c-
s
CO ^
V"o
3
o

Although the effect was relatively small compared with that of the upper-flap deflections,the normal-force and bending-moment coefficients increased with increasing lower-flapdeflections. The torsion coefficients were virtually insensitive to any changes in thelower-flap position (fig. 4(e)). Figure 4(f) shows that the normal-force and bending-moment coefficients and the torsion coefficients increased in magnitude with increasingnegative angles of sideslip. The effect of the simulated ablated coating and of varyingdynamic pressure is shown in figure 4(g). The ablated coating caused a small increasein the normal-force coefficients but virtually no change in the bending-moment andtorsion coefficients. The normal-force coefficient and the torsion coefficient increasedslightly and the bending-moment coefficient decreased slightly with increasing dynamicpressure.
Center fin. — The center-fin normal-force, bending-moment, and torsion coefficientsare plotted versus angle of attack in figure 5. In general, the center-fin loads wereinsensitive to changes in angle of attack. Figure 5(a) shows that negative 6au resulted
in an increase in the normal-force and bending-moment coefficients and an increase inthe negative values of the torsion coefficients. Figure 5(b) shows that both normal-forceand bending-moment coefficients increased with increasing negative sideslip angle. Thetorsion coefficient did not vary with changes in sideslip angle. The effect of variationin dynamic pressure was investigated for a symmetrical configuration only. Becausethe center-fin loads depended on an asymmetric configuration, no data were availableon the effect of dynamic pressure on the center fin.
Hinge-Moment Coefficients
Rudders. — The upper- and lower-rudder hinge-moment coefficients are plottedversus angle of attack in figure 6. Increasing the angle of attack increased the rudderhinge-moment coefficients in most cases. Figures 6(a) to 6(c) show that positive rudderbias increased both the upper- and the lower-rudder hinge-moment coefficients in thepositive direction. Positive rudder deflection increased the left-hand upper-rudderhinge-moment coefficients and decreased the right-hand upper-rudder hinge-momentcoefficients. Rudder deflections had negligible effect on the lower-rudder hinge-momentcoefficients. The upper-rudder hinge-moment coefficients increased with decreasingmagnitude of upper-flap deflections (fig. 6(d)). The lower-rudder hinge-momentcoefficients were insensitive to upper-flap deflections. Only the upper-rudder hinge-moment coefficients showed an increase due to an increase in lower-flap deflection(fig. 6(e)). Figure 6(f) shows that increasing the sideslip angle increased the right-handand decreased the left-hand upper-rudder hinge-moment coefficients. Lower-rudderhinge-moment coefficients were relatively insensitive to variations in sideslip angle.In general, both the ablated coating and the increase in dynamic pressure slightlyincreased the upper-rudder hinge-moment coefficients and had virtually no effect on thelower-rudder hinge-moment coefficients (fig. 6(g)).
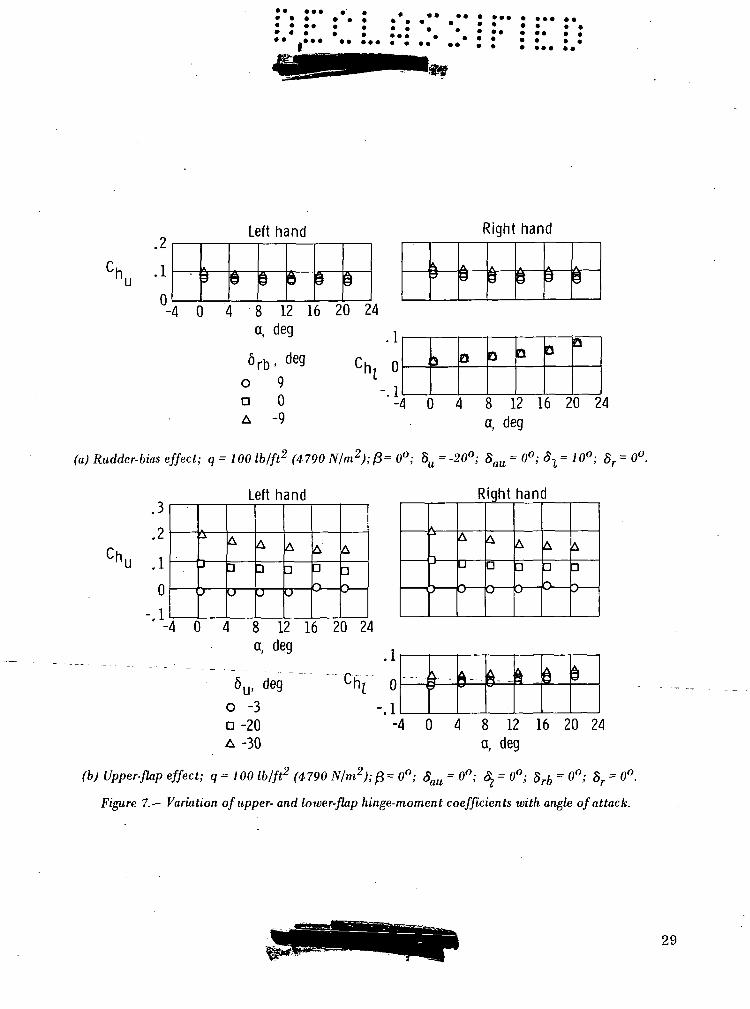
FlapSL- — The left- and right-hand upper-flap and the right-hand lower-flap hinge -moment coefficients are plotted versus angle of attack in figure 7; the left-hand lower-flap instrumentation was inoperative during the tests. Figure 7(a) shows that the upper-flap hinge-moment coefficients were not sensitive to changes in angle of attack nor tovariation in rudder bias. The lower-flap hinge-moment coefficients increased withincreasing angle of attack but were not sensitive to rudder bias. Both the upper- andthe lower-flap hinge-moment coefficients were insensitive to rudder deflections; hence,
8
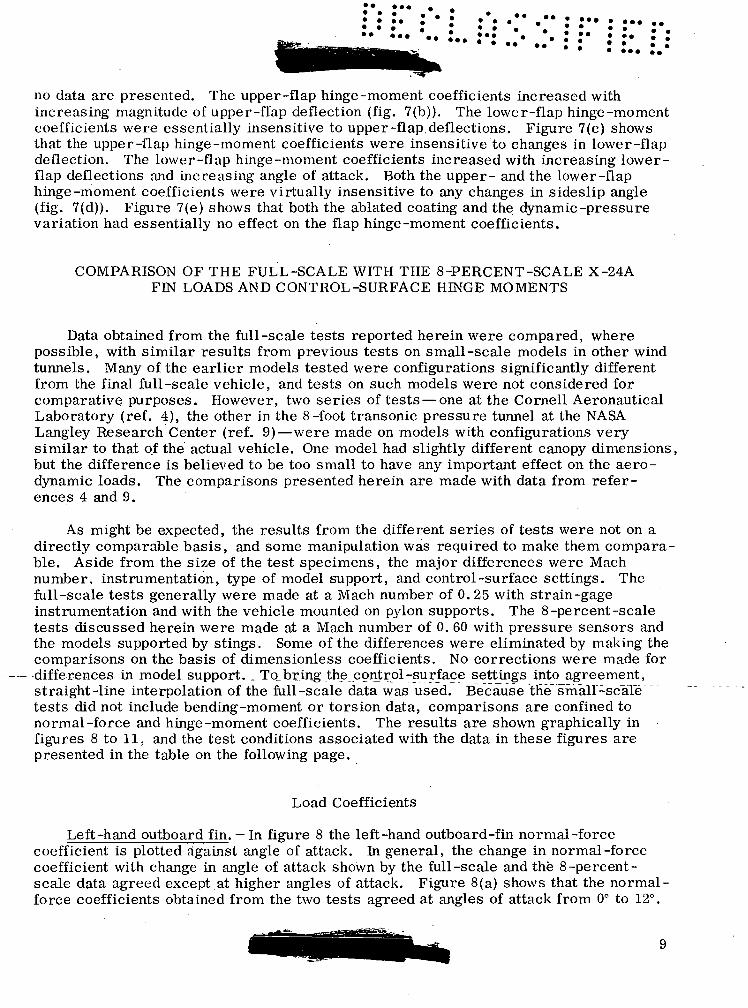
no data are presented. The upper-flap hinge-moment coefficients increased withincreasing magnitude of upper-flap deflection (fig. 7(b)). The lower-flap hinge-momentcoefficients were essentially insensitive to upper-flap.deflections. Figure 7(c) showsthat the upper-flap hinge-moment coefficients were insensitive to changes in lower-flapdeflection. The lower-flap hinge-moment coefficients increased with increasing lower-flap deflections and increasing angle of attack. Both the upper- and the lower-flaphinge-moment coefficients were virtually insensitive to any changes in sideslip angle(fig. 7(d)). Figure 7(e) shows that both the ablated coating and the dynamic-pressurevariation had essentially no effect on the flap hinge-moment coefficients.
COMPARISON OF THE FULL-SCALE WITH THE 8-PERCENT-SCALE X-24AFIN LOADS AND CONTROL-SURFACE HINGE MOMENTS
Data obtained from the full-scale tests reported herein were compared, wherepossible, with similar results from previous tests on small-scale models in other windtunnels. Many of the earlier models tested were configurations significantly differentfrom the final full-scale vehicle, and tests on such models were not considered forcomparative purposes. However, two series of tests — one at the Cornell AeronauticalLaboratory (ref. 4), the other in the 8-foot transonic pressure tunnel at the NASALangley Research Center (ref. 9)—were made on models with configurations verysimilar to that of the actual vehicle. One model had slightly different canopy dimensions,but the difference is believed to be too small to have any important effect on the aero-dynamic loads. The comparisons presented herein are made with data from refer-ences 4 and 9.
As might be expected, the results from the different series of tests were not on adirectly comparable basis, and some manipulation was required to make them compara-ble. Aside from the size of the test specimens, the major differences were Machnumber, instrumentation, type of model support, and control-surface settings. Thefull-scale tests generally were made at a Mach number of 0. 25 with strain-gageinstrumentation and with the vehicle mounted on pylon supports. The 8-percent-scaletests discussed herein were made at a Mach number of 0. 60 with pressure sensors andthe models supported by stings. Some of the differences were eliminated by making thecomparisons on the basis of dimensionless coefficients. No corrections were made fordifferences in modeLsupport. _ To bring jthe control -surface settings into agreement,straight-line interpolation of the full-scale data was used. Because the" smair^scaTetests did not include bending-moment or torsion data, comparisons are confined tonormal-force and hinge-moment coefficients. The results are shown graphically infigures 8 to 11. and the test conditions associated with the data in these figures arepresented in the table on the following page.
Load Coefficients
Left-hand outboard fin. — In figure 8 the left-hand outboard-fin normal-forcecoefficient is plotted against angle of attack. In general, the change in normal-forcecoefficient with change in angle of attack shown by the full-scale and the 8-percent-scale data agreed except at higher angles of attack. Figure 8(a) shows that the normal-force coefficients obtained from the two tests agreed at angles of attack from 0° to 12°.

co
•3nC )
COCDH
CD
"3OCO
1
CCD
•-
81
00
CD
COOCO
i5
beCD•a
~<o
faX)
73X!
O
bD0>•a..
10
MCD
73
"
10
MCD-a01
2:
hocu
73
LO
beCD
73
£
O
M-§
«5~"
bfl•8
bo•s01
X
0 ^
^
be £
tu 3
** C
12 T3C O
.230 0
S £CD pO Q.O
Ciw
T3b
OX!
1
•acrti
*JCDh-t
O O O
o o in
o
in
o o oCM CM CM
Oi— I
O O OCO CO CO1 1 1
„0CM
1
LO O O
O
ini
•-D 3 CO
O
O O O
o o in
o
in
o o oCM CM CM
Op-H
O O OCO CO CO1 1 1
oCM
1
CO O O
o
vD1
in in inCM CM CM
o
'3'3"o'00 OO OO
aCO^
•4-9
o
cCHt,<D
4-9cCDo
0
o
oCM
oCO
in
in
CO
o
o
o
0
CO1
CO
CO1
uraCM
O
OT
aCO>
ZU
CO
^1(-,CD1•oct<
s.Q.
ID
o o o
o m o
0
in
o o oCM CM CM
0T-H
o o oCO CO CO1 1 1
,.o"?o o in
o
ini
CO CO CO
o
o o o
o in o
o"
i
o o oCM CM CM
0t— (
O O OCO CO CO1 1 1
oCM
1
O O CO
o
CO1
in in inCM CM CM
O
"rt 2"3"o o o
sCO>
^6"DM
Xo
COaajG
CD
_O
73
c30)ai_>
o o o
o in o..
ini
o o o^H CM CM
OCM
O O OCM CO CO
n
OCO1
o o m
mi
CO CO CO
0
o o o
o m o
ini
o o oi-l CM CM
OCM
O O OCM CO CO
OCO
1
O O CD
CO1
in in inCM CM CM
O
"3'3"o"T-H 1— 1 ^
CO>J?°
On
3J3
O
10

• ••
Above 12° the difference may be due to the onset and propagation of flow separation,perhaps influenced by the difference in Mach number and Reynolds number between thefull-scale and the 8-percent-scale tests. (The Reynolds numbers for the 8-percent-scale-model tests ranged from 4.4 x 10⁶ to 8. 9 x 10⁶).
Figure 8(b) compares the effect of upper- and lower-flap deflections on the outboard-fin normal-force coefficient shown in the full-scale and the 8-percent-scale tests. Ingeneral, the coefficients from the two tests agreed. Figure 8(c) illustrates the effect ofvarying rudder bias from 5° to -5° on the outboard-fin normal-force coefficient. Thecoefficients from the full-scale and the 8-percent-scale tests agreed reasonably well;only at an angle of attack of 16° did they differ significantly.
Center fin. — Figure 9 shows the center-fin normal-force coefficients plotted againstangle of attack. A comparison of the effect of sideslip-angle variation on the center-finload showed that the change in normal-force coefficient due to a change in sideslip anglewas relatively small in both the full-scale and the small-scale tests. In general, thefull-scale normal-force coefficients were slightly larger in magnitude than those fromthe 8-percent-scale-model tests. The small differences may be due in part to differ-ences in flap setting, sideslip angles, and Mach number between the full-scale tests andthe model tests.
Hinge-Moment Coefficients
Rudders. — The left-hand upper- and lower-rudder hinge-moment coefficients areplotted against angle of attack in figure 10. Figure 10(a) shows the effect of upper- andlower-flap deflections on the rudder hinge-moment coefficients. The full-scale and8-percent-scale hinge-moment coefficients compared reasonably well at angles of attackfrom 0° to 12° but showed poorer agreement from 12° to 20°. The effect of varyingrudder bias on the rudder hinge-moment coefficients is shown in figure 10(b). Both theupper- and the lower-rudder hinge-moment coefficients from the full-scale vehicle wereslightly more positive than the coefficients from the 8-percent-scale models and showedsimilar effects due to variation of rudder bias. Figure 10(c) shows the effect of sideslip-angle variation on the upper- and lower-rudder hinge-moment coefficients. The effectof sideslip-angle variation in the full-scale tests was greater for the upper-rudder andsmaller for the lower-rudder hinge-moment coefficients than in the 8-percent-scale
-tests.
Flaps. —The upper- and lower-flap hinge-moment coefficients are plotted versusangle of attack in figure 11. Only the right-hand lower-flap hinge-moment data wereavailable from the full-scale tests. Because the data presented are from symmetricalconfigurations, the full-scale right-hand lower-flap hinge-moment data were comparedwith the left-hand lower-flap hinge-moment data from the small-scale tests. Thevariation of flap hinge-moment coefficient with change in angle of attack was similar inthe full-scale and the small-scale data. However, the magnitudes of the full-scalecoefficients were somewhat lower than the magnitudes indicated by the small-scale tests.Figure ll(a) indicates that the change in flap hinge-moment coefficients due to flapdeflection was smaller for the full-scale than for the 8-percent-scale tests. Figure ll(b)shows that rudder bias had no effect on either the upper- or the lower-flap hinge-momentcoefficients. Only the upper-flap hinge-moment coefficients were affected by varyingthe sideslip angle (fig. ll(c)).
tF%t- ^mm* Ka*aat!eB3&agS~11

•i
CONCLUSIONS
Aerodynamic loads data were obtained from full-scale wind-tunnel tests of theX-24A research vehicle. Results from the tests showed that:
1. The left-hand outboard-fin normal-force coefficient and bending-momentcoefficient increased with increase in angle of attack, increase in negative angle ofsideslip, decrease in upper-flap deflection, increase in lower-flap deflection, positiverudder bias, and positive rudder deflection.
2. The center-fin normal-force coefficient and bending-moment coefficientincreased with increase in negative angle of sideslip and increase in negative differ-ential upper-flap deflection.
3. The upper- and lower-rudder hinge-moment coefficients were sensitive to thesame parameters as the outboard fin.
4. The upper-flap hinge-moment coefficients were relatively insensitive to changesin angle of attack, angle of sideslip, lower-flap deflection, or rudder bias and sensitiveonly to a variation of upper-flap deflection.
5. The lower-flap hinge-moment coefficients were sensitive primarily to changesin angle of attack and lower-flap deflections.
6. A simulated ablated coating applied to most of the vehicle surface to assesseffects on aerodynamic characteristics tended to increase slightly the normal-forcecoefficient on the outboard fin and had negligible effect on the control-surf ace hinge -moment coefficients.
7. In general, the stabilizing-fin load coefficients and the control-surf ace hinge-moment coefficients agreed reasonably well with comparable loads data obtained fromwind-tunnel tests of 8-percent-scale models.
Flight Research Center,National Aeronautics and Space Administration,
Edwards, Calif., August 29, 1969.
12

REFERENCES
1. Thompson, Milton O.; Peterson, Bruce A.; and Gentry, Jerauld R.: Lifting-BodyFlight Test Program. SETP Technical Review, second 1966 issue, vol. 8, no. 2,Sept. 1966, pp. 1-22.
2. Normyle, William J..- Manned Flight Tests to Seek Lifting-Body Technology.Aviation Week & Space Technology, vol. 84, no. 20, May 16, 1966, pp. 64-65,67, 69, 71, 75. . •
3. Mechtly, E. A. : The International System of Units - Physical Constants andConversion Factors. NASA SP-7012, 19.64.
4. Stouffer, C. G.; and Hutton, B. L.: Transonic Pressure Test Results of an 8%Scale SV-5P Vehicle Tested at Cornell Aeronautical Laboratory, Inc. , 8-FootWind Tunnel. Eng. Rep. No. 14113, vol. II, Martin Co. , March 1966.
5. Mo rt, Kenneth; and Gams e, Berl: Full-Scale Wind-Tunnel Investigation of theAerodynamic Characteristics of the M2-F2 Lifting-Body Flight Vehicle. NASATM X-1588, 1968.
6. Skopinski, T. H.; Aiken, William S. , Jr.; and Houston, Wilber B.: Calibration ofStrain-Gage Installations in Aircraft Structures for the Measurement of FlightLoads. NACA Rep. 1178, 1954.
7. Anon.: Characteristics of Six Research Wind Tunnels of the Ames AeronauticalLaboratory. NACA, 1957.
8. Pyle, Jon S.; and Montoya, Lawrence C.: Effect of Roughness of Simulated AblatedMaterial on Low-Speed Performance Characteristics of a Lifting-Body Vehicle.NASA TM X-1810, 1969. ;
/.
9. Brand, S.; and Blake, W. W.: Transonic Test Results From a Force, Moment,Pressure and Control Surface Hinge Moment Investigation Conducted With an8% Scale SV-5P Vehicle in .the NASA-Langley 8-Foot Transonic Pressure Wind
- - -Tunnel. -Eng. _Rep. No. 13683 (ASTIA No. AD-360 599), vol. IV, Martin Co. ,May 1965. "" ~
13

••• »• • • • ** I .* l_ ^ A A •- • * •••
TABLE I.-REFERENCE AREAS AND DIMENSIONS OF THE FULL-SCALE X-24A FINSAND CONTROL SURFACES
Center vertical fin, (airfoil slab) —Area, ft2 (m2) 14.7 (1.37)Mean aerodynamic chord, in. (m) 57.9 (1.47)Root chord, in. (m) 73.9 (1.88)Tip chord, in. (m) 38.0(0.96)Distance between root chord and mean aerodynamic
chord, in. (m) 17.3 (0.44)Span, in. (m) 38.8 (0.99)
Outboard vertical fin (airfoil cambered with leading-edge droop) —Area, each, ft2 (m2) 24.9 (2.31)Mean aerodynamic chord, in. (m) 77.4 (1.97)Root chord, in. (m) 101.9 (2.59)Tip chord, in. (m) 45.7 (1.16)Distance between root chord and mean aerodynamic
chord, in. (m) 21.3 (0.54)Span, in. (m) 46.6 (1.18)
Upper rudder —Area, each, ft2 (m2) 4.99 (0.46)Chord, in. (m) 29.6 (0.75)Span, in. (m) 24.2 (0.62)
Lower rudder —Area, each, ft2 (m2) 6.67 (0.62)Chord, in. (m) 29.6 (0.75)Span, in. (m) 32.4 (0.82)
Upper flap —Area, each, ft2 (m2) 10.82 (1.01)Chord, in. (m) 34.1(0.87)Span, in. (m) 45.7 (1. 16)
Lower flap —Area, each, ft2 (m2) 13.99 (1.30)Chord, in. (m). 44. 9 (1.14)Span, in. (m) 44.9 (1. 14)
14

(a) Three-quarter front view.
Figure L- X-24A flight vehicle mounted in the Ames 40- by 80-Foot Wind Tunnel.
A-40423-6
15

(b) Three-quarter rear view.
Figure /.— Concluded.
A-40423-8
16

cCDo
17

»* ••• • »«» » ••• * • •- • • •• • •« • *• » "• • * • • * •»* ••* * • • ••
Left-hand outboard fin
Waterline 36
and CN positive in Y-direction (see fig. 3(b))
Center fin
Front spar
(a) Left-hand outboard-fin and <:en£er-/m loads.
Figure ;}.— Sign convention for the X-24A vehicle,.
Root chord line
18
19

1.2
1.0
.8
.6
.4
.2
.6
.5
.4
.3
.2
.1
0
.1
-.1
- ?
orb- u«yo 9D 0A -9
D
3
^
0
D
A
o
D
A
O
D
A
o
a
A
0
A
3
O
n
A
o
D
A
O
J
A
O
A
oJ
2i
D •
3
A
a
0
D
O
D
0
Aao
Aao
1.2
1.0
r .8
.4
.2
.6
.5
.4
S .3
.2
.1
0
.1
f\ \j
-.2
urb- uey
o 9o 0A -9
]v
11
A
D
A
^
D
A
3 '53
;
5
J
^
D
a
A
0
11
A
0
D
D
D
A
^D
\
>
c
1
^
D
3
A
a
o
*3
J
A
aj
- i^ i3
- 4 0 4 8 12 16 20 24a, deg
-4 0 4 8 12 16 20 24a, deg
(a) Rudder-bias effect; q= 100 lb/ft2 (4790 N/m2); b) Rudder-bias effect; q = 100 lb/ft2 (4790 N/m2);yS = 0°; Su = -20°; Sau = 0°; Sl=10°; 8 r = Z 0°. |8 = 0°; Su = -20°; Sau = 0°; ^ = 10°; <Sr = 0°.
Figure 4.— Variation of left-hand outboard-fin normal-force, bending-momcnt, and torsion coefficientswith angle of attack.
20

o 9a 0A -9
1.0
.8
.6
.4
.2
0
.5
.4
.3
.2
.1
0
-.1
.2
.1
0
- 1
3
J
^
O
D
A
o
uA
o
a
A
o
A
0
aA
•*
D
^
0
D
A
0
A
0
3
A
J
AA
3
A
n
o
A
a
0P
A -1
0
A
O
-4 0 4 8 12 16 20 24a, deg
(c) Rudder-bias effect; q= 100 Lb/ft2 (4790 N/m2);d = 0°; = 70°; 8 = -'0
6U, deg
o -3a -20A -30
l.£
1.0
.8
.6
.4
.2
0
.5
.4
.3
.2
.1
0
-.1
.2
.1
0
- 1
•>
i\
D
D
(i
D
A
3
DA
DD
(
O3A
):i
D
3A
O
D
^
Op
A
0DA
bDA
i
P d A8- -
1
- - -
& 6
- 4 0 4 8 12 16 20 24a, deg
(d) Upper-flap effect; q= 100 Ib/ft (4790 N / m ) ;r . &= 0°; $au = 0°; 8^0°; 8rb
= ()°' Sr = °°-
Figure 4.— Continued.
21

JpSJ
•o<u
• — . <o~ s-S *°S O O O O
CM t — OO OO OO3± T CO C^J CM
O OO VO vO« i—<
o a < O
c
c <tt
o<pa<
tXTf
(t
t
fl
p>
OO
4 38D
IIP
<3 E>
<W>
<;»p
"> o
r\ ^3" co cvj I-H o »• • • • •
ocTo
a
CE
03
03<
CPs
OO
s>r>>
~! ° "1
o
CM
oCM
i-H
CM
oo
o
H 1
C *?
C CQ -£e
'•g «> o"§ II O
3 SS fe
O o'
II =>3 'I
cn(_j v^5 f~^ v^5
1
CCLo n <
or-
CT>
cis o or — 1 CM
t — i10 o a <
r
vJ C
-1 I-
<JC
o n
i n •
o c
o
o
3 eH
po
<qa:
,
^;,
r i
D •
p
"> n
» \£
H
20
,
j
<
S ^3
h- »9
r c>0 C3 U
O
0
o
o
0
ri ^
<f
<jn
<JC
a
d <
D
o
o
T r*
D
3
O
LpQ
<ir1
^d
^
^
.,
a
-> c
-*^COo
•)
^
O i-i C3
.
4
-I C
o
<PD
CD
=po
PD
no
no
3 ^~I
• ^
O33
qfl
as]
as)
<B
CMO
0 ^ TCM Si, "
^ a
i— i G) || -8^J ^
CM g> 7 «," *° 1j
"° * ii 6" |oo er ir a ® ^
g to n ,«fe -o .o? :« *- ^
•"* r* t-^c 5 3
15 T ^«• "« R PJ>II "o ^J< W
CO
§
CM
OCM
O^-_ Csi ^ O
S "« vr j sr o *o to"•a 1 .
o oo LT\ *g- r«-> CM •—< O •—i o •—' '2O
COo
22

:*: :!' :"•: •"• •" •" • :•• : :•• :\*.jfeiik..» .n'-i^iftpin..*' *. I J* ; f" • *^SiHIB^^^^BB c %.*
n. 4
9. c.
^N,. 0c u
. 9
- 4
1. iCB nc u
i. io-.i.
CT 0'c u
- l
3
3
\
J
]
:
\
^ '
onA
A
O
D&
ADO
^au1
-2CC
2C
o
D
A
o
A
A.
8
deg
))I
Q
D
^
D
A
A
8
oD
&
0DA
A
8
3
A
0
DA
/\
8
4
9. c.
cNr nc u
- ?
- /i. 4
i. 1
CRDr nL u
_ i. l
_ 9.
i
Cfr n'C U
- 1
D
4
53
^
s9
C
c2
8A
OnA
ft d) -63 0
i 6
0n&
on
A
1*1a
eg
0
A
oA
L)3
A
0-]A
A9
o3
&
03
A
8
-40 4 8 12 16 20 24 -4 0 4 8 12 16 20 24a, deg
(a) Differential upper-flap effect; q = 60(2870 N/m2); @ = 0°; S.. = -20°; $7 = 10°;
(b) Sideslip-angle effect; q = 100 Ib/ft? (4790 N/m2);21.- -= 0- = 0°v '
Figure 5.- Variation of center-fin normal-force, bending-moment, and torsion coefficients withangle of attack.
23

deg
.
ru i. i
_ i. i
r^ n
-.2
i
L
D
i
h
A
ef th
D
Li
0
a
&
and
n
3
A
0
D
A
rxU
u
A
o
D
O
D
D
^
0
0 <
D (A -C
Right hand
3
^
0
D
6
o
D
A
O
<_L
O
D
A
0
D
A
5
D
\
Q
A
O
n
^
o
D
A
O
D
A
0
aA
-4 0 4 8 12 16 20 24 - 4 0 4 8 12 16 20 24a, deg a, deg
(a) Rudder-bias effect; q = 100 lb/ft2 (4790 N/m2); /3 = 0°; Su = -20°;
Figure 6.- Variation of upper- and lower-rudder hinge-moment coefficients with angle of attack.
24

6rb, deg
o 9o 0A -9
.4
.32
Su ;;0
.3
.
°hrt 0
- i
Left hand
'
3
T
^
D
O
D
A
O
— 1 -
A
011
*
0D
*
5 0
D
A
0
D
A
0
a
0
D
AA
Right hand
.,
3
*
O
D
Q
D
A
n
3
&
0
a
A
Q
D
A
0 O
D
A
O
a
&
O .
D
A
0
DA
^^
- 4 0 4 8 1 2 1 6 2 0 2 4 - 4 0 4 8 1 2 1 6 2 0 2 4a, deg a, deg
(b) Rudder-bias effect; q = 100 lb/ft2 (4790 N/m2); fi = 0°; 8.. = -20°;Saa = 0°^7. = 100;Sr=00.
Figure 6.— Continued.
25

•
1
.
o.{.
ru l
nU
- i
- 9
3 ,
I
nu
- i
-.2
• •«
• «
1
t
• *• »i * •
D
3
V
^
\
• •••
• •
Le
o
n
A
0
n
A
• • «•
ft ha
Q
n
A
0
-,
A
> ••
^
nd
0
Q
^
O
3A
»
.
•
O
D
A
O
nA
•
•
0
D
^
-.
D
• • •
•P
6rb-oD
A -
•• •
^
•
deg
909
* *» *• ••ft
•
D
D
\
D
^
Ri
0
n
A
O
n
ght t
0
J
A
O
A
Tand
0
n
A
o
D
A
u
A
O
D
O
D
A
O
D
fmA
-4 0 4 8 12 16 20 24a, deg
-4 04 8 12 16 20 24a, deg
(c) Rudder-bias effect; q= 100 lb/ft2 (4790 N/m2); /8= 0°; 8,, = -20°;
Figure 6.- Continued.
26

• • •
6U, deg
o -3D -20A -30
Left hand Right hand4
3
2
1
n
ii£
oD
OD
O
AA
l>DA
t>
S
O
A
ODA
QD£
eZi
0DA
^a 6 a a
f«u
3
1B I
I
e
-40 4 8 12 16 20 24 -4 0 4 8 12 16 20 24a, deg a, deg
(d) Upper-flap effect; q = 100 lb/ft2 (4790 N/m2);p = 0°; Sau = 0°; $z = 0°; 8rb = 0°; 8r = 0°.
.4
-On- -'3nru 2
.1
.2
-.1
Left hand
—
iA
8ft-
AA &
u
I 1 I1 aAJl
oD
A
, deg0
1020
Right hand
1
L1 1"g 6.....
A0 a- -
^
d a ^ 6
^b
- 4 0 4 8 12 16 20 24 - 4 0 4 8 12 16 20 24a, deg a, deg
(e) Lower-flap effect; q = l O O lb/ft2 (4790 N/m2); /3= 0°; 8U = -3°; Sau = 0°; 5rb = 0°; 8r = 0°.
Figure 6.— Continued.
27

Left hand Right hand
.3
Chru .2
.1
0
.2
.1
'
D
3
^
D
3A
O
D
A
o
uoJ
A
a
^
^a 3 £
^p3
A
D
P
A
2)
A
D
D
A
D
0
A
D
, !| |ft d^
6D
13, dego -6n 0A 6
-4 0 4 8 12 16 20 24 -4 0 4 8 12 16 20 24a, deg a, deg
(f) Sideslip-angle effect; q = 100 lb/ft2 (4790 N/m2); Su = -3°; Sau = 0°; 82= 0°; Srfc = 0°; 8r = 0°.
q, lb/ft2 (N/m2)
o 100 (4790)
Ipfth.nH Dinhth.nH ° 8° (3830)
A 60(2870)O 60 (2870) ablated
.£
.1
hru o
-.1
-.2
.1
-.2
J P
0 S3»
o
c>
©a ft 3 i 9a
1
j p\ 1"
R0
ac>
•4 ^
f^>a ^»i 3
-4 0 4 8 12 16 20 24 -4 0 4 8 12 16 20 24a, deg a, deg
(g) Simulated ablated-coating and dynamic-pressure effect; /? = 0°; §„ = -20°; &,„ = 0°; 8=10°;8rb = -9°;8r=0°. l
Figure 6.- Concluded.
28
•• I*** •• • • • •
.2Left hand Right hand
0
A,
^a g 6 8 &
A.9
A3 i .AB 1
-4 0 48 12 16 20 24a, deg 1
0o 9D 0A -9
-.1
3 Q Q Q Qa
-4 0 4 8 12 16 20 24a, deg
' Rudder-bias effect; q = 100 lb/ft2 (4790 N/m2); 0= 0°; Su = -20°; 8au = 0°; S-L = 10°; Sr = 0°.
Left hand Right hand
.2
Chu .1
0
-.1-
*p
A
D
A
3
u
A
D
A
D
A
D
40 4 8 12 16 20 2a, deg
6U, deg '%"
o - 3a -20A -30
4
.1
0
-.1-I
A._iA
u
0 —
A
a
o —
A
D
o —
A
D
O —
A
-
V .ft- ft- -
4£ i
4 0 4 8 12 16 20 2'a, deg
(b) Upper-flap effect; q = 100 lb/ft2 (4790 N/m2);^=0°; Sau = 0°; $ = 0°; Srb = 0°; Sr = 0°.
Figure 7.— Variation of upper- and lower-flap hinge-moment coefficients with angle of attack.
29

.1
0 ' • Q ^ Q S
•'-4 04 8 12 16 20 24a, deg 2
tl6/ deg ^h/
0 0 °a 10 -.1A 20 "'
i9 9
nB 3—
\ A AR
A
R R*8
1 0 4 8 12 16 20 2a, deg
(c) Lower-flap effect; q = 100 lb/ft2 (4790 N/m2); fi= 0°; Su = -3°; 8au = 0°; 8rb = 0°; Sr = 0°.
Left hand.11 1—r~
ch,
.1
0
- 1
a,3
A§
Ae A8 - HB
A3— *i a
H 9A
'-4 0 4 8 12 16 20 24a, deg
fto -6a 0A 6
'h, 0-.1
6
-4 0 4 8 12 16 20 24a, deg
M Sideslip-angle effect; q = 100 lb/ft2 (4790 N/m2); Sa = -3°; §au = 0°; fy = 0°; $rb = 0°; Sr = 0°.
Left hand Right hand.2
0- 4 0 4 8 12 16 20 24a, deg
q, lb/ft2 (N/m2) c
o 100(4790) l
a 80 (3830) -. 1A 60 (2870)O 60 (2870) ablated
}7 0 '
AB &u
.10 R ft
-4 0 4 8 12 16 20 24a, deg
(e) Simulated abhted-coating and dynamic-pressure effect; ft = 0°; §u = -20°; <5au - 0°;8 l=10°;8rb=-9°; $r=0°.
Figure 7.- Concluded.
30

CD
s
<o LPv
sl/l
CDQ.
OO
LTi LT\ O LTi
o n <
o»s
3,?.
^ CM OT =C ...
2S
- o3 ,,
O P
e M. "
J|
-i '=>c s
s^o^c s
-2
enCD•a
cci
3CO
S
£=CDO!_CDQ.I
OO
vO C5 vO LTv CD LT»
o a <
oVS
-1-<3I
OD

enCD•o
CGL
s00
^ C03 O)O Ol/> i_
CDQ.
i . OO
! O D
1
en
OO
o
o
cxj
I
s -
B O
3 II13 "-o co
~i. t4^ Ca ;? u
s
-o"' 8
,o -5) co
I '§ £
O
32

_CD
roo
enOJ•a
- vCO.
son
CDO
I00
LA O LTv
I O D <
•3,cO
ou
CD03o00
cncu-a
3LO
0>O
CUex1
oo
LTN O LTv LP> CD LTi
I O Q <
S.2B
• *\ t)*» £
S A2 "S a>
""
315 s13llTJ ie -aB S
•S*.O CO
ll
cnCD-a ~
c* r"
<0
CDa>-o '
c~ n13 l
vO
CD -t
«3 CD
S 5£ «~ CL 03 1 00u_ oo
3 CP CO C3-i CNJ i— < ro
3 C3 C3 O*J CO CNJ CO
1 1 1
! o a „i
T Cf
n\ \9
•\ o
U17
\n\
W
V\^J r-
<&<UI
-* c
....
D ^H
r-O-iO CS) II
-O-CQ_
" i-
Q? C
3 Q> O
11Ca-S i i
S,
o
33

_CD
S
_OJ
SCO
.+_«
co>o
"* *- -— <1>— Q.
CD U_ OOo> __
. vO vO Lf\ LPvrO i |
O D
CD-
_<m
OCM
VO
CM
OO
CM >—I O i — I I
« MU ro
SCO
.2 a ii^n o; ,g ^^? eo ..
o
^CJ
CD
•o
±5~i_ L
°
CD
S<SI
« •£fU Q30 o00 i_
— CU— d.Z3 1
LJ_ OO
r\ ur\ 1^1 LPii i1| o n
V
— (
— <
C
KJ
3D
11111|
?
cvj •—i O
11s^o c?'§
a, •?^-si u
•a<"O "Oc: ca e
I!^>
enCD-a
— "cfa a>% S «— a) ca— Q.O^3 I </)
LJ_ OO
O O O CDCM i—I CM i—I
CDO)-a
.. O <O CO C5cvi ro CM
<o I I I I
O D CO CM •—I O OH C M i - H O
=^60-
§: »" -e
CO
Ia
i
34 NASA-Langley, 1969 i H~580

o00
aeronattlkitl ttmi fj>aee activities of the United Stales shall beconducted io an to eatttrihtfte , . . fa the expansion oj hitman knowl-edge of phenomena in the atmosphere and space. The Administrationsha$ provide for the widest practicable on4 appropriate dhsemmationoj mjorm<tliott concerning its aetivities and the refalti thereof."
—NATIONAL AERONAUTICS AN& SPACE ACT OP 1958
NASA SCIENTIFIC AND TECHNICAL PUBLICATIONS
"TECHNICAL REPOHTS: Scientific and technical informarioo consideredimportant, complete, and a lasting contribution to existing knowledge.
TECHNICAL NOTES: Information Jess broad is scope but nevertheless ofimportance as a contribution to existing knowledge.
TECHNICAL MEMORANDUMS: Information receiving limited distribu-tion because of preliminary data, security classification, «r other reasons.
CONTRACTOR REPORTS: Scientific and technical information generatedunder a NASA contract of grant and considered an important contribution toexisting knowledge.
TECHNICAL TRANSLATIONS: Information published in a foreignlanguage considered to merit NASA distribution in English.
SPECIAL PUBLICATIONS: Information derived from or of value to NASAactivities. Publications include conference proceedings, monographs, datacompilations, handbooks, sourcebooks, and special bibliographies.
TICHNOLCX3Y UTILIZATION PUBLICATIONS: Information on tech-nology used by NASA that may be of particular interest in commercial and othernon-aerospace applications. Publications include Tech Briefs, TechnologyUtilization Reports and Notes, and Technology Surveys.
Details on tkt avaitabiKty ef these publicatiom may fee ofefoinet/ from;
SCIENTIFIC AND TECHNICAL INFORMATION DIVISION
NATIONAL AERONAUTICS AND SPACE ADMINISTRATION
Waihingfon, D.C 20546