fin 819: lecture 4 risk, returns, capm and the cost of capital where does the discount rate come...
TRANSCRIPT

FIN 819: lecture 4
Risk, Returns, CAPM and the Cost of Capital
Where does the discount rate come from?

Today’s plan Review some concepts in bond valuation Risk and returns
• 75 years of capital market history
• How to measure risk
• Individual security risk
• Portfolio risk
• Diversification
• Unique risk
• Systematic risk or market risk
• Measure market risk: beta

Today’s plan (continue)
Portfolio rules and diversification Measure market risk: beta CAPM WACC

The Value of an Investment of $1 in 1926
Source: Ibbotson Associates
0.1
10
1000
1925 1940 1955 1970 1985 2000
S&PSmall CapCorp BondsLong BondT Bill
Inde
x
Year End
1
6402
2587
64.1
48.9
16.6

0.1
10
1000
1925 1940 1955 1970 1985 2000
S&PSmall CapCorp BondsLong BondT Bill
Source: Ibbotson Associates
Inde
x
Year End
1
660
267
6.6
5.0
1.7
Real returnsThe Value of an Investment of $1 in 1926

Rates of Return 1926-2000
Source: Ibbotson Associates
-60
-40
-20
0
20
40
60 Common Stocks
Long T-Bonds
T-Bills
Year
Per
cent
age
Ret
urn

Risk premium
The risk premium is the difference between the expected rate of return on a risky security and the expected rate of return on risk-free government bonds or T-bills.
Over the last century, the average risk premium is about 7% for stocks.

Why do investors command a risk premium for stocks?
When investors invest in a risky security, they require a risk premium, or they require a higher expected rate of return than investment in a risk-free security.
How to measure the risk of a security?

Measuring Risk
In financial markets, we use the variance or volatility of a security return to measure its risk.
Variance – Weighted average value of squared deviations from mean.
Standard Deviation – Weighted average value of absolute deviations from mean and is also the square root of the variance

Calculating the risk of a security
We can use two approaches to calculate the risk of a security, depending on what kind of information you are given.• Using the basic definition of expectation and
variance to calculate
• Using the portfolio rule to calculate In fact, these two approaches are exactly
the same, but the second one can omit some detail calculation.

Some basic concepts
Before we go on to show how to use two approaches to calculate risk, let’s first review some basic formula for Expectation and Variance
Let X be a return of a security in the next period. Then we have
N
iiXipXEX
1)()(][
N
iXiXipXVar
1
2))()((][

Portfolio
A portfolio is a set of securities and can be regarded as a security.
If you invest W US dollars in a portfolio of n securities, let Wi be the money invested in security i, then the portfolio weight on stock i is
, with property W
Wx ii 1
1
n
iix

Example 1
Suppose that you want to invest $1,000 in a portfolio of IBM and GE. You spend $200 on IBM and the other on GE. What is the portfolio weight on each stock?

Solution
8.01000/800
2.01000/200
GE
IBM
x
x

Example 2
Suppose that you have $1,000 and borrow another $1,000 from the bank to invest in IBM and GE. You spend $500 on IBM and the other on GE. What is the portfolio weight on each stock?

Three portfolio rules
A: The return of a portfolio is the weighted average of the returns of the securities in the portfolio.
B: The expected return of a portfolio is the weighted average of the expected returns of the securities in the portfolio.
C: The Beta of a portfolio is the weighted average of the Betas of the securities in the portfolio.

Portfolio return and risk of two stocks
)rx()r(x Return Portfolio Expected 2211
)σσρxx(2σxσxVariance Portfolio 21122122
22
21
21

Portfolio risk with two stocks
22
22
211221
1221
211221
122121
21
σxσσρxx
σxx2Stock
σσρxx
σxxσx1Stock
2Stock 1Stock
The variance of a two stock portfolio is the sum of these four boxes

Portfolio risk for N securities
1
2
3
4
5
6
N
1 2 3 4 5 6 N

Example Consider a portfolio of two stocks: IBM and GL.
What is the expected return and standard deviation of the portfolio?
6.0,4.0
8.0
12.0,08.0
3.0,1.0
GI
IG
GI
GI
xx
rr

Solution
%15
02248.02
024.0
%4.1012.0*6.008.0*4.0
22222
R
IGGIGGIIR
GIIGIG
GGII
xxxx
rxrxR

Two types of risks
Unique Risk - Risk factors affecting only that firm. Also called “firm-level risk.”
Market Risk - Economy-wide sources of risk that affect the overall stock market. Also called “systematic risk.”

Diversification
What have your observed from the above example• Risk for each individual stock
• Risk for your portfolio Diversification: put a lot of different
assets in a portfolio to reduce risk Why can diversification be used to
reduce risk?

Diversification and risk
05 10 15
Number of Securities
Po
rtfo
lio
sta
nd
ard
dev
iati
on
Market risk
Uniquerisk

Market risk and Beta
Market Portfolio - Portfolio of all assets in the economy. In practice a broad stock market index, such as the S&P 500, is used to represent the market portfolio.
Beta - Sensitivity of a stock’s return to the return on the market portfolio.
Beta- measures systematic risk

Beta and market risk
2m
imiB
Covariance with the market
Variance of the market

Some true or false questions
1. A market index is used to measure performance of a broad-based portfolio of stocks.
2. Long-term corporate bonds are riskier than common stocks.
3.If one portfolio's variance exceeds that of another portfolio, its standard deviation will also be greater than that of the other portfolio.
4. Portfolio weights are always positive.

Some true or false questions
5. Standard deviation can be calculated as the square of the variance.
6. Market risk can be eliminated in a stock portfolio through diversification.
7. Macro risks are faced by all common stock investors.
8. The risk that remains in a stock portfolio after efforts to diversify is known as unique risk.
9. We use the standard deviation of future stock prices to measure the risk of a stock.

Measuring Market Risk
Market Portfolio • It is a portfolio of all assets in the economy. In
practice a broad stock market index, such as the S&P 500 is used to represent the market portfolio. The market return is denoted by Rm
Beta (β) • Sensitivity of a stock’s return to the return on the
market portfolio,
• Mathematically, )(
),(
m
mii RVar
RrCov

An intuitive example for Beta
Turbo Charged Seafood has the following % returns on its stock, relative to the listed changes in the % return on the market portfolio. The beta of Turbo Charged Seafood can be derived from this information.

Measuring Market Risk (example, continue)
Month Market Return % Turbo Return %
1 + 1 + 0.8
2 + 1 + 1.8
3 + 1 - 0.2
4 - 1 - 1.8
5 - 1 + 0.2
6 - 1 - 0.8

Measuring Market Risk (continue)
When the market was up 1%, Turbo average % change was +0.8% When the market was down 1%, Turbo average % change was -0.8% The average change of 1.6 % (-0.8 to 0.8) divided by the 2% (-1.0 to 1.0) change in the market produces a beta of 0.8. β=1.6/2=0.8

Another example
Suppose we have following information:
State Market Stock A Stock B
bad
good
-8% -10%
38%
-6%
24%32%
a. What is the beta for each stock?
b. What is the expected return for each stock if each scenario is equally likely?
c. What is the expected return for each stock if the probability for good economy is 20%?

Solution
a.
b.
c.
09.0)06.0(*5.024.0*5.0
14.0)1.0(*5.038.0*5.0
B
A
r
r
75.040.0
30.0
)08.0(32.0
)06.0(24.0
2.140.0
48.0
)08.0(32.0
)1.0(38.0
B
A
0)06.0(*8.024.0*2.0
004.0)1.0(*8.038.0*2.0
B
A
r
r

Portfolio Betas
Diversification reduces unique risk, but not market risk.
The beta of a portfolio will be an weighted average of the betas of the securities in the portfolio.
What is the beta of the market portfolio?
What is the beta of the risk-free security?
in
iip x
1

Example
Suppose you have a portfolio of IBM and Dell with a beta of 1.2 and 2.2, respectively. If you put 50% of your money in IBM, and the other in Dell, what is the beta of your portfolio
Beta of your portfolio =0.5*1.2 +0.5*2.2=1.7

Market risk and risk premium
Risk premium for bearing market risk• The difference between the expected return
required by investors and the risk-free asset.
• Example, the expected return on IBM is 10%, the risk-free rate is 5%, and the risk premium is 10% -5%=5%
• If a security ( an individual security or a portfolio) has market or systematic risk, risk-averse investors will require a risk premium.

CAPM (Capital Asset Pricing Model)
The risk premium on each security is proportional to the market risk premium and the beta of the security.• That is,
)( fmifi rRrr
portfoliomarkettheforpremiumriskrR
iurityforpremiumriskrr
fm
fi
sec

Security market line
0
2
4
6
8
10
12
14
16
0 0.2 0.4 0.6 0.8 1 1.2
Beta
Ex
pe
cte
d R
etu
rn (
%)
. The graphic representation of CAPM in
the expected return and Beta plane
rf
Security Market Line

Project Risk and cost of the capital
In capital budgeting, in order to calculate the NPV of the project, we need to measure the risk of the project and thus find out the discount rate (the cost of capital)
We can use Beta of the project cash flows to measure the risk of the project and use CAPM to get the expected return required by investors • )( fmprojectfproject rRrr

Example 1
Based on the CAPM, ABC Company has a cost of capital of 17%. (4 + 1.3(10)). A breakdown of the company’s investment projects is listed below.• 1/3 Nuclear Parts: β=2.0
• 1/3 Computer Hard Drive: β =1.3
• 1/3 Dog Food Production: β =0.6 When evaluating a new dog food production
investment, which cost of capital should be used and how much?

Solution
Since dog food projects may have similar systematic risk to the dog food division, we use a beta of 0.6 to measure the risk of the projects to be taken.
Thus the expected return on the project or the cost of capital is 0.04+0.6*(0.1)=0.l or 10%

Example 2
Stock A has a beta of .5 and investors expect it to return 5%. Stock B has a beta of 1.5 and investors expect it to return 13%. What is the market risk premium and the expected rate of return on the market portfolio?

Solution
According to the CAPM
%9
%1
)(*5.113
)(*5.05
m
f
fmf
fmf
R
r
rRr
rRr

Example 3
You have $1 million of your own money and borrow another $1 million at a risk-free rate of 4% to invest in the market portfolio. The expected return for the market portfolio is 12%, what is the expected return on your portfolio?

Solution
We can use two approaches to solve it:• First, the expected rate of return of a portfolio
is the weighed average of the expected rates of return of the securities in the portfolio.
• Second , the beta of a portfolio is the weighed average of the betas of the securities in the portfolio. Then use the CAPM to get the expected rate of return.

Solution (continue)
First approach
Second approach
%2012*24*1
21
2;1
1
1
2;1;1$
p
mf
mf
R
xx
WWW
%208*24
21*20*1
21
2;1
1
1
2;1;1$
p
p
mf
mf
R
xx
WWW

The cost of capital
Cost of Capital • The expected return the firm’s investors
require if they invest in securities or projects with comparable degrees of risk.

Cost of capital with tax benefit
When tax benefit of debt financing is considered, the company cost of capital is as
equitycdebt rED
ETr
ED
DWACC
)1(

The cost of capital for the bond
The cost of capital for the bond• It is the YTM, the expected return required by
the investors.
• That is
• The expected return on a bond can also be calculated by using CAPM
tddd r
principalcpn
r
cpnr
cpn
111
P2bond
)( fmdfd rRrr

Example 2
A bond with a face value of $2000 matures in 5 years. The coupon rate is 8%. If the market price for this bond is $1900.(a) What is the expected return on this bond or
what is the cost of debt or interest rate for this bond?
(b) Suppose that the YTM is 9%, what is the market value of this bond?

Solution
(a)
(b)
%3.9
)1(
2000
)1(
111601900
55
YTM
YTMYTMYTMYTM
922,1$09.1
2000
09.1*09.0
1
09.0
1160
55
bondP
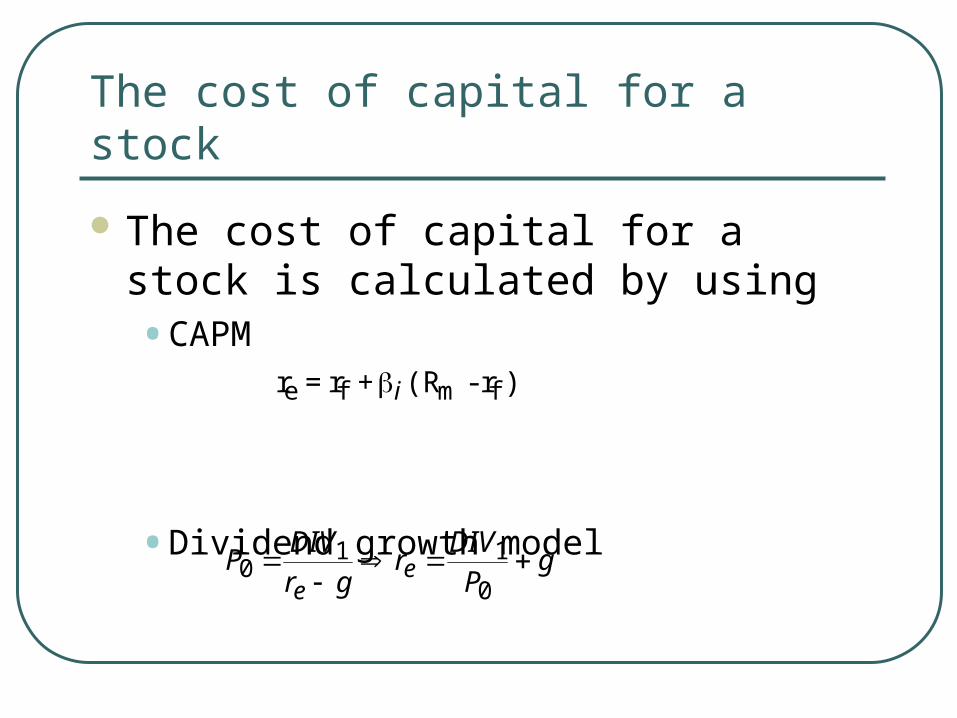
The cost of capital for a stock
The cost of capital for a stock is calculated by using • CAPM
• Dividend growth model
)r-(R+r=r fmfe i
gP
DIVr
gr
DIVP e
e
0
110

Example 3
Sock A now pays a dividend of $1.5 per share annually, It is expected that dividend is going to grow at a constant rate of 2%. The current price for stock A is $25 per share. What is the expected return or the cost of capital by investing in this stock?