filtration factors affecting
TRANSCRIPT

28 VOLUME 91, ISSUE 12 JOURNAL AWWA
O
Factors affectingfiltered water turbidityA study of 75 filtration plants found that operator awarenessand commitment to excellence may be more important to performancethan key water quality, design, and operational variables.
Peter J. Lusardiand Phil J. Consonery
F I L T R A T I O N
ver the past 10 years, opti-mizing the performance of surface water treatmentplants has received considerable attention in theUnited States. Several major waterborne disease out-breaks have narrowed the focus even more. Now,many public water systems, public health officials,regulatory agencies, news media, and others are dis-
cussing the risks associ-ated with microbial con-taminants such as Giardiaand Cryptosporidium. Be-cause of these organismsin particular, both designconsiderations and oper-ational procedures at sur-face water treatmentplants have recentlychanged. These organismsare among the most diffi-cult pathogens to removeand inactivate in watertreatment plants and thusserve as the “yardstick”for reducing health risks.That is, if a plant can re-move and inactivate Giar-
Approximately 8 million of Pennsylvania’s 12 million residentsreceive water from 329 surface water treatment plants. This studyevaluated the performance of a subset of these plants todetermine whether they are prepared to meet the turbiditytreatment technique requirements of the Enhanced Surface WaterTreatment Rule. Using 75 filtration plants, the authors reviewedkey water quality, design, and operational variables to determinetheir effect on filtered water turbidity. Except for plants that didnot use a coagulant, served populations of < 3,300 people, or usedstreams for source water, there was no strong statisticalcorrelation between any of the variables and filtered waterturbidity. Many plants were able to consistently achieve lowturbidity levels despite limitations such as small system size,plant age, or high source water turbidity. The results of this studyshow that intangible variables such as commitment to achievinglow turbidity, operator skill level, and operator attention appearto be more important than tangible variables such as source waterquality, ownership type, plant age, coagulant type, and otheroperational or design factors. For executive summary,
see page 178.

DECEMBER 1999 P.J. LUSARDI ET AL 29
dia cysts and Cryptosporidium oocysts, it is probablyremoving and inactivating other known waterborne,disease-causing organisms. Both Giardia and Cryp-tosporidium are protozoa. Epidemiological investiga-tions have determined that protozoa, as a group, areresponsible for more waterborne disease outbreaksthan any other waterborne pathogen.1
The Pennsylvania Department of EnvironmentalProtection (DEP) is concerned about the performanceof filtration plants and their ability to remove bacte-ria, viruses, and protozoa. About 8 million of thestate’s 12 million residents—plus out-of-state visitors—receive water from 329 sur-face water treatment plants.Even a short-term breakdownin treatment at one of thesefacilities could lead to a wide-spread disease outbreak be-cause of the “acute” nature ofmicrobial pathogens. Fur-thermore, consumers servedby filtered surface water systems may be especiallyvulnerable to a major pathogen breakthrough. Theseindividuals, who normally receive either pathogen-free water or water with low concentrations ofpathogens, may have immune systems that are sus-ceptible to some organisms if they suddenly occur inelevated concentrations in drinking water.1 Moreimportant, individuals with weakened immune sys-
tems may be more vulnerable tocontracting waterborne diseasesas well as experiencing moreserious illnesses. These individ-uals include people who haveundergone organ transplantoperations, are receiving treat-ment for certain cancers, or havehuman immunodeficiency virusor acquired immunodeficiencysyndrome; elderly individuals;or anyone who otherwise has aweakened immune system.2
Opportunistic pathogens such asCryptosporidium, Mycobacteriumavium, and microsporidia maypresent a risk to people who areimmunocompromised.3
Turbidity levels examinedat 75 plants
To assess the current perfor-mance of Pennsylvania’s surface
water treatment plants, this study examined the long-term raw water and finished water turbidity at 75plants. The information from the study will helpdetermine the current performance status of filtrationplants and whether these water systems are preparedto meet the turbidity treatment technique require-ments of the Interim Enhanced Surface Water Treat-ment Rule (IESWTR) and perhaps the Long-TermEnhanced Surface Water Treatment Rule (LTESWTR).
In addition, it will help assess the ability of the plantsto meet performance expectations outlined in the vol-
untary Partnership for Safe Water program. This pro-gram provides water systems with a means of self-assessing their filtration plants to minimize breakthroughof pathogens into finished water. The authors alsoreviewed key water quality, design, and operationalvariables to determine their effects on filtered waterturbidity. Finally, an attempt was made to uncoverproblems with collecting and managing turbidity data.
Operators at 75 treatment plantswere asked to complete monthlymonitoring forms and to report thehighest raw water turbidity of theday as well as the highest finishedwater turbidity of the day.
Consumers served by filtered surfacewater systems may be especiallyvulnerable to a major pathogenbreakthrough.

30 VOLUME 91, ISSUE 12 JOURNAL AWWA
Comparing plant-to-plant turbidity dataFor surface water treatment plants, turbidity is
the primary surrogate for determining the removal ofwaterborne, disease-causing organisms. Turbiditymeasurement is quick, relatively inexpensive, andeasy for water system operators to understand.Whether they use a grab-sampling technique or on-line instrumentation, almost all operators know thebasic processes involved in turbidity measurement.
Limitations to consider. Still, several limitationsmust be considered when turbidity data obtainedfrom multiple plants are compared. First, staff at sur-face water treatment plants have historically selectedinstruments from a variety of manufacturers, whichcould cause some differences in results. Also, oper-ations personnel may have chosen sampling pointsfrom a number of locations within the treatmentplant. For example, DEP specifies that the preferredsampling point for finished water turbidity is thecombined filter effluent before water reaches theclearwell or receives additional treatment. Some fil-tration plants, however, do not provide accessiblepiping at this location. Thus, operators have had to
obtain turbidity measurements from each filter oreven the clearwell itself, which could influence ana-lytical results.
Other problems can lead to plant-to-plant varia-tions in recorded turbidity levels because of incon-sistencies in the way data are recorded. For exam-ple, current Pennsylvania regulations stipulate thatturbidity must be recorded every 4 hours, but they donot specify that the highest value within the 4-hourperiod should be recorded. Operators must decidewhether they should record the highest turbidityresult of the day, an average of multiple readings, orperhaps each of the required 4-hour measurementsduring the day. Some instruments lack recordingdevices (e.g., strip charts, circular charts, data log-gers, or supervisory control and data acquisition sys-
This study examinedlong-term raw waterand finished waterturbidity at 75 plants,to assess the currentperformanceof Pennsylvania’ssurface water treatmentplants.
Coagulant type• Alum• Polyaluminum chloride• Ferric salt• Polymer• None
Population served• �3,300 people• 3,301–10,000 people• 10,001–100,000 people• >100,000 people
Ownership• Municipal• Investor
Source type• Reservoir• River• Stream
Plant type• Conventional• Direct filtration• Package—gravity filters• Package—pressure filters
Plant age in years• �10• 11–25• 26–50• >50
Type of filter media• Sand• Anthracite• Mixed media—sand and anthracite• Multimedia—garnet, sand, and
anthracite
Filtration rate—gpm/sq ft (m/h)• 0–1 (0–2.5)• >1–2 (>2.5–5)• >2–3 (>5–7.5)• >3–4 (>7.5–10)
Factors Evaluatedfor Their Effects on FinishedWater Turbidity Levels

DECEMBER 1999 P.J. LUSARDI ET AL 31
tems). Thus, the value re-corded on a daily monitor-ing form may depend onwhen the plant personnelobserved the readings onthe instrument panel.
Instrument calibrationis another factor that couldaffect turbidimeter perfor-mance.4 At turbidity levels< 0.1 ntu, calibration andquality control are ex-tremely critical for accu-racy. Particularly at me-dium and small watersystems, operators may nothave the time, expertise,and tenacity to pursuequality assurance procedures. Consequently, not allwater systems use instruments that are properly main-tained or calibrated.
Turbidity most practical measure of filter per-formance. Despite these shortcomings, turbidity isstill the most practical physical parameter with whichto gauge filtration plant performance. Other waterquality parameters such as pH and alkalinity can indi-cate optimal performance of chemicals or individual
major unit processes, butthey do not serve as anadequate surrogate forparticle and microbial re-moval. Although parti-cle counters can providevaluable filter perfor-mance data, there aredifficulties with on-sitecalibration and instru-ment-to-instrumentstandardization. Particlecounters are extremelysensitive and are quiteeffective in establishingan in-house perfor-mance baseline; how-ever, they are not yet
conducive to performing plant-to-plant comparisons.During DEP’s statewide filtration plant perfor-
mance evaluations (FPPEs)—an ongoing 11-year pro-gram to evaluate filtration plants for microbialremoval—comparisons between plant turbidimetersand calibrated DEP turbidimeters have demonstratedfairly good accuracy of most plant turbidimeters overthe past three years. Typically the results achievedwere within 0.03 ntu of DEP’s turbidity measure-
0
0.1
0.2
0.3
0.4
0.5
0.6
0.7
0.8
0.9
0
0.1
0.2
0.3
0.4
0.5
0.6
0.7
0.8
0.9
12/1
12/3
1
1/30 3/
1
3/31
4/30
5/30
6/29
7/29
8/28
9/27
10/2
7
11/2
6
0 10 20 30 40 50 60 70 80 90 100
Percent of Time Turbidity Values ≤ X
Turb
idit
y—n
tu
Turb
idit
y—n
tu
Finished Water Turbidity Probability Distribution of All Data
Daily finished water turbidity
Percentile5075909596979899
AverageMinimumMaximum
RSD
Yearly0.100.150.230.280.290.300.330.360.120.050.8063.3%
Jan-980.190.250.290.330.330.37NANA
0.200.080.37
34.3%
Feb-980.170.210.290.340.340.36NANA
0.180.100.36
37.2%
Mar-980.100.140.180.250.250.33NANA
0.120.060.33
49.0%
Apr-980.080.100.160.160.160.20NANA
0.090.060.20
38.2%
May-980.070.090.160.190.190.80NANA
0.110.050.80
126.9%
Jun-980.070.090.110.110.110.13NANA
0.080.050.13
27.2%
Jul-980.080.100.130.150.150.18NANA
0.090.060.18
30.4%
Aug-980.070.090.120.130.130.16NANA
0.080.050.16
33.2%
Sep-980.070.090.100.110.110.19NANA
0.080.050.19
33.4%
Oct-980.080.130.180.200.200.25NANA
0.100.050.25
48.9%
Nov-980.160.230.290.300.300.37NANA
0.170.060.37
47.3%
Dec-980.160.240.280.350.350.36NANA
0.190.080.36
40.1%
Utility namePlant namePlant street addressPlant city, state, zipPlant contact namePlant phone
Start yearMonth
Day
9812
1
365 = Total days12.00 = Total months
Spreadsheet is from the Partnership for Safe Water; RSD—relative standard deviation, NA—not available
Date
FIGURE 1 Example of a Partnership for Safe Water spreadsheet showing data in turbidity-versus-time outputand probability-of-distribution output
For surface watertreatment plants,turbidity is the primarysurrogate for determiningthe removal of waterborne,disease-causingorganisms.
32 VOLUME 91, ISSUE 12 JOURNAL AWWA
ments. This was especiallyremarkable during recentFPPEs because turbidimeterinaccuracy was a problem atmany plants in the early yearsof the program. Althoughthese comparisons do not fallwithin the bounds of a rigor-ous study, they show that thequality of turbidity informa-tion in Pennsylvania is gen-erally improving.
Compiling turbiditydata
In support of the nationalPartnership for Safe Waterprogram, staff in the US Envi-ronmental Protection Agen-cy’s (USEPA’s) Cincinnati,Ohio, office developed aspreadsheet to analyze andgraph turbidity data. Thespreadsheet* summarizes upto 365 days of information inmonthly and yearly per-centiles.5 It also shows thedata in a turbidity-versus-time output as well as a prob-ability distribution output(Figure 1).
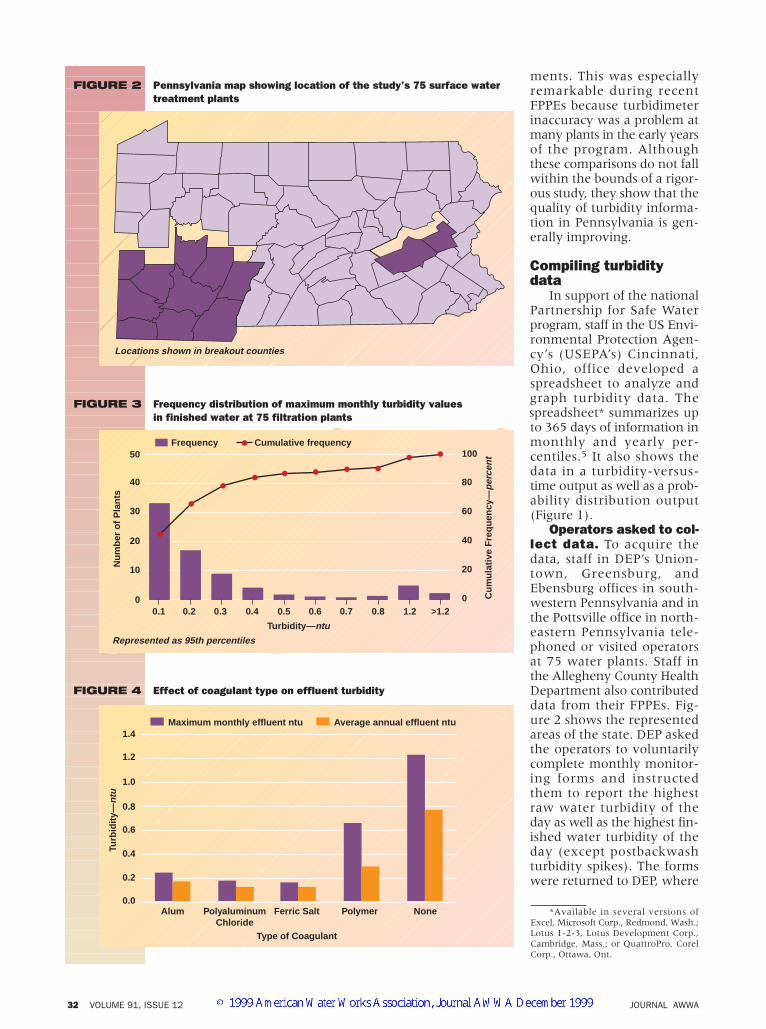
Operators asked to col-lect data. To acquire thedata, staff in DEP’s Union-town, Greensburg, andEbensburg offices in south-western Pennsylvania and inthe Pottsville office in north-eastern Pennsylvania tele-phoned or visited operatorsat 75 water plants. Staff inthe Allegheny County HealthDepartment also contributeddata from their FPPEs. Fig-ure 2 shows the representedareas of the state. DEP askedthe operators to voluntarilycomplete monthly monitor-ing forms and instructedthem to report the highestraw water turbidity of theday as well as the highest fin-ished water turbidity of theday (except postbackwashturbidity spikes). The formswere returned to DEP, where
Locations shown in breakout counties
FIGURE 2 Pennsylvania map showing location of the study’s 75 surface watertreatment plants
0.1 0.2 0.3 0.4 0.5 0.6 0.7 0.8 1.2 >1.20
10
20
30
40
50
0
20
40
60
80
100
Nu
mb
er o
f P
lan
ts
Turbidity—ntu
Represented as 95th percentiles
Frequency Cumulative frequency
Cu
mu
lati
ve F
req
uen
cy—
per
cen
t
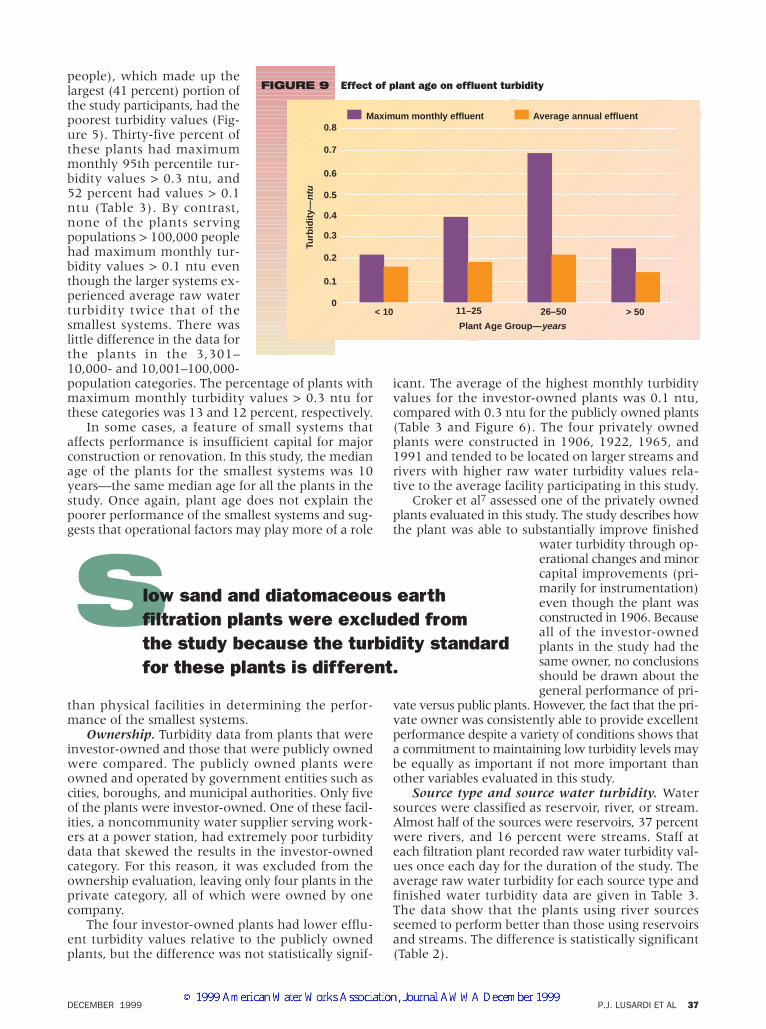
FIGURE 3 Frequency distribution of maximum monthly turbidity valuesin finished water at 75 filtration plants
1.4
1.2
1.0
0.8
0.6
0.4
0.2
0.0Alum Polyaluminum
ChlorideFerric Salt Polymer None
Type of Coagulant
Turb
idit
y—n
tu
Maximum monthly effluent ntu Average annual effluent ntu
FIGURE 4 Effect of coagulant type on effluent turbidity
*Available in several versions ofExcel, Microsoft Corp., Redmond, Wash.;Lotus 1-2-3, Lotus Development Corp.,Cambridge, Mass.; or QuattroPro, CorelCorp., Ottawa, Ont.

DECEMBER 1999 P.J. LUSARDI ET AL 33
the data were entered intospreadsheets (two for eachfiltration plant—one for rawwater and one for finishedwater). Although these datacollection efforts were part ofspecial projects, the turbiditygraphs and percentiles wereso valuable to both DEP staffand water system operatorsthat the data collection andgraphing efforts continuetoday. In fact, some opera-tors began entering the dataand graphing the informationon their own.
Plants had to meet min-imum standards. To be in-cluded in the study, the 75water plants had to meetminimum standards. First,they had to use conventionalor package rapid sand filtra-tion technologies. Slow sandand diatomaceous earth fil-tration plants were excludedfrom the study because theturbidity standard for theseplants is different. In addition,at least six months of turbid-ity data for raw water and finished water had to beavailable from the participating water plants in 1997and submitted to DEP.
Additional filtration plant information on the 75plants was collected through DEP’s FPPE program.This information, which was obtained from reliabledatabase files, included population served, type ofsource water, date of construction, ownership, andvarious design and operational factors (see the side-
bar on page 30). Because these factors—as well asraw water turbidity levels—could affect the finishedwater turbidity levels, the authors compared the vari-ables with the annual 95th percentile of the finishedwater turbidity levels (the 95th percentile means that95 percent of the turbidity values were below theparticular number). This percentile was selectedbecause it would provide a good picture of daily con-ditions while removing unusually low or high
extremes in turbidity. The variables were also com-pared with the highest monthly 95th percentile offinished water turbidity levels to gain a worst-caseperspective. The 95th percentile matches turbidityreporting requirements of the Surface Water Treat-ment Rule (SWTR) and the Pennsylvania FiltrationRule.
Finished water turbidity compared with othervariables. The finished water turbidity levels were
compared with operational,design, and other variablesfor the 75 filtration plants(see the sidebar on page30). The two turbidity val-ues used in the study werethe highest monthly 95thpercentile and the annual95th percentile numbers for1997. The highest monthlydata were derived from asmaller number of sampleresults and were greater in
value than the annual data. In other words, the high-est monthly value was based only on the valuesrecorded during one month, whereas the annualvalue was based on all the values recorded duringthe study, which had a minimum time of six months.
A high monthly value may indicate a short-termupset at the plant, whereas a high annual value sig-nifies consistent poor performance. The IESWTRspecifies the monthly turbidity level for water sys-
Average Annual Maximum Monthly Category 95th Percentile Turbidity 95th Percentile Turbidity
Average value—ntu 0.2 0.3Plants > 0.3 ntu 8 (11 percent) 16 (22 percent)Plants > 0.1 ntu 18 (24 percent) 32 (43 percent)
TABLE 1 Turbidity data summary for 75 filtration plants
Maximum Monthly Average AnnualEffluent Turbidity Effluent Turbidity
Factor F-ratio* P-value† F-ratio* P-value†
Coagulant type‡ 16.52 0.00 8.17 0.00Coagulant type§ 1.10 0.34 1.19 0.31Population served 3.58 0.02 3.47 0.02Ownership 0.87 0.36 0.56 0.46Source type 4.17 0.02 4.00 0.02Plant type 2.03 0.12 0.76 0.52Plant age 2.90 0.04 1.83 0.15Media type 0.51 0.68 0.99 0.40Filtration rate 0.64 2.76 1.33 0.27
*A high F-ratio indicates that the variability between groups is greater than the variability within groups.†P-values test the significance of differences between the turbidity values for various groups within a factor. P-values < 0.05 are assumed to be indicative of a statistically significant difference between the mean turbidityvalues of groups within a factor.‡Includes seven plants that did not use coagulant§Excludes seven plants that did not use coagulant
TABLE 2 Analysis of variance within each factor for maximum monthlyand average annual effluent turbidity
Whether they use a grab-samplingtechnique or on-line instrumentation,almost all operators know the basicprocesses involved in turbiditymeasurement.

34 VOLUME 91, ISSUE 12 JOURNAL AWWA
tems serving � 10,000 people; combined filteredwater turbidity at each plant must remain � 0.3ntu in at least 95 percent of the measurements takeneach month.
The plants participating in the study recorded tur-bidity values to two decimal places, but because of lim-itations in the accuracy of turbidity measurements,turbidity values were rounded to the nearest tenth.This was also in keeping with the regulatory limits thatare specified to one decimal point (e.g., 0.3 ntu). It wasassumed for the various data comparisons used in
the study that all values < 0.1 ntu were equal to 0.1even though many of the finished water turbidityvalues in the study were below this level. Thisassumption was made because differences in turbid-ity levels below 0.1 ntu have a limited meaning,owing to limitations in turbidity instruments whenvalues this low are measured. These limitations havebeen described4 and include difficulties in calibrat-ing instruments to read such low values. The inclu-sion of values below 0.1 ntu in the data could haveobscured the statistical impact of higher turbidity val-
Number of Plants
Maximum Maximum Annual Annual Turbidity*Monthly Monthly Average Average
Number for Turbidity Turbidity Turbidity Turbidity Average Maximum AverageEach Group > 0.1 ntu > 0.3 ntu > 0.1 ntu > 0.3 ntu Raw Monthly Annual
Water Effluent EffluentFactor n percent n percent n percent n percent n percent ntu ntu ntu
Coagulant typeAlum 33 45 13 39 6 18 6 18 3 9 15.8 0.2 0.2Polyaluminum chloride 28 38 12 43 3 11 5 18 0 0 19.1 0.2 0.1Ferric salt 6 8 1 17 1 17 1 17 0 0 28.4 0.2 0.1Polymer 4 5 3 75 3 75 3 75 2 50 14.5 0.7 0.3None 3 4 3 100 3 100 3 100 3 100 2.5 1.2 0.8Total† 74 32 16 18 8
Population group<3,300 31 41 16 52 11 35 12 39 7 23 14.2 0.4 0.33,301–10,000 23 31 10 43 3 13 5 22 1 4 15.2 0.2 0.110,001–100,000 17 23 6 35 2 12 1 6 0 0 22.2 0.2 0.1>100,000 4 5 0 0 0 0 0 0 0 0 32.1 0.1 0.1Total 75 32 16 18 8
Investor-owned?Yes 4 5 1 25 0 0 0 0 0 0 29.4 0.1 0.1No 70 95 30 43 15 21 17 24 7 10 16.4 0.3 0.2Total‡ 74 31 15 17 7
Source typeReservoir 35 47 18 51 9 26 13 37 3 9 7.9 0.3 0.2River 28 37 7 25 2 7 1 4 1 4 32.4 0.2 0.1Stream 12 16 7 58 5 42 4 33 4 33 9.2 0.5 0.3Total 75 32 16 18 8
Plant typeConventional 38 51 12 32 7 18 5 13 4 11 25.0 0.3 0.2Direct 3 4 1 33 0 0 0 0 0 0 2.1 0.1 0.1Package—gravity 26 35 11 42 5 19 7 27 2 8 10.1 0.2 0.2Package—pressure 8 11 8 100 4 50 6 75 2 25 9.1 0.5 0.4Total 75 32 16 18 8
Plant age—years<10 38 51 14 37 4 11 9 24 3 8 12.0 0.2 0.211–25 11 15 6 55 5 45 4 36 2 18 16.2 0.4 0.226–50 12 16 6 50 5 42 3 25 2 17 19.8 0.7 0.2>50 14 19 6 43 2 14 2 14 1 7 30.2 0.3 0.1Total 75 32 16 18 8
Filter media typeSand 11 15 6 55 5 45 5 45 3 27 15.8 0.4 0.2Anthracite 8 11 4 50 2 25 1 13 1 13 27.5 0.3 0.2Mixed 24 32 7 29 3 13 2 8 1 4 25.4 0.2 0.1Multimedia 30 40 13 43 4 13 8 27 1 3 9.5 0.2 0.1Total 73 30 14 16 6
Filter rate—gpm/sq ft (m/h)
0–1 (0–2.5) 10 13 5 50 4 40 3 30 3 30 20.6 0.4 0.3>1–2 (>2.5–5) 30 40 11 37 6 20 5 17 2 7 21.9 0.2 0.1>2–3 (>5–7.5) 17 23 6 35 1 6 3 18 0 0 15.8 0.2 0.1>3–4 (>7.5–10) 10 13 3 30 2 20 2 20 1 10 7.8 0.2 0.1Total§ 67 25 13 13 6
*All turbidity values < 0.1 ntu are assumed to be 0.1 ntu.†Filter plant that uses sodium aluminate was not included in coagulant evaluation.‡Filter plant that serves electric power–generating facility was not included in ownership evaluation.§Filter rate evaluation does not include pressure filters and plants with no flow data given.
TABLE 3 Raw water and effluent turbidity data for each factor

DECEMBER 1999 P.J. LUSARDI ET AL 35
ues associated with some ofthe filtration plants. Eight sys-tems reported monthly maxi-mum 95th percentile turbid-ity values of � 0.05 ntu.
Results and discussionRegulatory mark missed
by several facilities. Theaverage maximum monthlyand annual 95th percentileturbidity values for the facilitiesparticipating in the study were0.3 and 0.2 ntu, respectively.The data in Table 1 show that16 (22 percent) of the 75 facil-ities would not have metIESWTR or LTESWTR require-ments for at least one monthduring the study. (For thisstudy, the authors assumedthat the LTESWTR, whichaffects surface water systemsthat serve smaller populations,would also entail a 0.3-ntulimit.) For instance, the com-bined turbidity must be � 0.3ntu in at least 95 percent ofthe measurements taken eachmonth. Of these, eight plants(11 percent) had an annual95th percentile turbidity > 0.3ntu, which may signifychronic noncompliance. Allturbidity values were roundedto the nearest 0.1 ntu; thus,plants reporting values be-tween 0.30 and 0.35 ntu wereassigned values of 0.3 ntu andwere not included in the num-ber of plants projected to benoncompliant. Forty-threepercent of the facilities wouldnot have met the Partnershipfor Safe Water 0.1-ntu opti-mized performance goal for at least one month ofthe study, and 24 percent would not meet the annualgoal. Figure 3 shows the maximum monthly turbid-ity values at the 95th percentile for finished waterat the various plants.
The estimates of noncompliance in this study maybe conservative because of the methodology used bythe plants to record turbidity data. As discussed ear-lier in this article, participants were asked to record thehighest daily finished water turbidity value (exclud-ing postbackwash turbidity spikes). These values werethen used to derive the 95th percentile values. Com-pliance with the IESWTR and probably the LTESWTRfor many facilities will, however, be based on multi-ple daily values rather than just the highest dailyvalue. Thus, the data in this study may overestimate
the degree of noncompliance. Still, the highest valuerepresents a potential weak point because if pathogensare present in substantial concentrations in the rawwater, a brief increase in turbidity in the finishedwater could signify pathogen breakthrough.
Variability within each of eight factors ana-lyzed. Table 2 shows an analysis of variability withineach factor to determine the significance of the tur-bidity variability of each group within a factor. Forexample, for filter media, the variability in finishedwater turbidity among the sand, anthracite, mixedmedia, and multimedia groups was analyzed to deter-mine whether it was statistically significant. For aver-age annual effluent turbidity, three factors—coagu-lant, population served, and source type—had asignificant difference among the groups within the
0.45
0.40
0.35
0.30
0.25
0.20
0.15
0.10
0.05
0.00
Turb
idit
y—
ntu
Maximum monthly effluent ntu Average annual effluent ntu
<3,300 3,300–10,000 10,000–100,000 >100,000
Population
FIGURE 5 Effect of population served on effluent turbidity
0
0.05
0.10
0.15
0.20
0.25
0.30
Turb
idit
y—n
tu
Investor ownership Public ownership
Ownership Type
Maximum monthly effluent Average annual effluent
FIGURE 6 Effect of ownership on effluent turbidity

36 VOLUME 91, ISSUE 12 JOURNAL AWWA
factor at the 95 percent confidence level. If the plantsnot using a coagulant are excluded from the analy-sis, then there is no significant difference in maxi-mum monthly turbidity among the various types ofcoagulants.
For each of the eight factors, the average turbid-ity values were calculated for the facilities in a par-ticular group along with the number of systems thathad values > 0.3 and 0.1 ntu (Figures 4–11 and Table3). When these results are assessed, small increases infiltered water turbidity can be associated withincreases in concentrations of protozoa, viruses, andbacteria.6
Coagulant type. The coagulants used by the watersystems in this study were broken down into fivecategories: alum, polyaluminum chloride, ferric salt,polymer, and none. Although polymers are not coag-
ulants per se, DEP recordsshowed that four systemsused polymer instead of acoagulant. In this study, thedata for plants using onlypolymer were compared withthose for plants using coagu-lants. Records for the threeplants in the “none” categoryshow that no coagulant orpolymer is used. Althoughthere are differences in thevarious polyaluminum chlo-ride products used in thewater industry, for the pur-pose of this study they werelumped into one category.One of the plants used sodiumaluminate as a coagulant; thisplant was not used in this partof the evaluation because itrepresented only one datapoint. Additionally, the studydid not consider other opera-tional variables that affectcoagulation such as dosage,pH, mixing conditions, andfrequency of jar testing.
The results in Figure 4 andTable 3 show poor perfor-mance for the systems thatused only a polymer or nocoagulant at all. All of the sys-tems in the “none” categoryas well as three of four sys-tems using only a polymerexceeded the 0.3-ntu limit.This was not surprisingbecause all the facilities eval-uated in this study were rapidsand filtration plants, whichrequire effective chemicalcoagulation to provide propertreatment. All of the systems
in the “polymer” or “none” category served < 3,300people (i.e., small systems as defined by USEPA).
There was no significant difference in the turbid-ity data for the other three categories: alum, poly-aluminum chloride, and ferric salt. The average rawturbidity of the systems using ferric salts was, however,substantially higher than that for the systems usingalum and polyaluminum chloride. Most of the plantsused either alum or polyaluminum chloride, and theperformance of the two coagulants appeared to bealmost identical.
Population served. The filtration plant data setswere evaluated with respect to the population servedusing four categories: �3,300, 3,301–10,000,10,001–100,000, and >100,000. USEPA generallyuses these population ranges for regulatory purposes.The plants serving the smallest systems (i.e., �3,300
0
0.1
0.2
0.3
0.4
0.5
0.6Tu
rbid
ity—
ntu
Reservoir StreamSource Type
Maximum monthly effluent Average annual effluent
River
FIGURE 7 Effect of source type on effluent turbidity
0
0.1
0.2
0.3
0.4
0.5
0.6
Turb
idit
y—n
tu
Conventional Package(Pressure Filters)
Plant Type
Maximum monthly effluent Average annual effluent
Direct Package(Gravity Filters)
FIGURE 8 Effect of plant type on effluent turbidity
DECEMBER 1999 P.J. LUSARDI ET AL 37
people), which made up thelargest (41 percent) portion ofthe study participants, had thepoorest turbidity values (Fig-ure 5). Thirty-five percent ofthese plants had maximummonthly 95th percentile tur-bidity values > 0.3 ntu, and52 percent had values > 0.1ntu (Table 3). By contrast,none of the plants servingpopulations > 100,000 peoplehad maximum monthly tur-bidity values > 0.1 ntu eventhough the larger systems ex-perienced average raw waterturbidity twice that of thesmallest systems. There waslittle difference in the data forthe plants in the 3,301–10,000- and 10,001–100,000-population categories. The percentage of plants withmaximum monthly turbidity values > 0.3 ntu forthese categories was 13 and 12 percent, respectively.
In some cases, a feature of small systems thataffects performance is insufficient capital for majorconstruction or renovation. In this study, the medianage of the plants for the smallest systems was 10years—the same median age for all the plants in thestudy. Once again, plant age does not explain thepoorer performance of the smallest systems and sug-gests that operational factors may play more of a role
than physical facilities in determining the perfor-mance of the smallest systems.
Ownership. Turbidity data from plants that wereinvestor-owned and those that were publicly ownedwere compared. The publicly owned plants wereowned and operated by government entities such ascities, boroughs, and municipal authorities. Only fiveof the plants were investor-owned. One of these facil-ities, a noncommunity water supplier serving work-ers at a power station, had extremely poor turbiditydata that skewed the results in the investor-ownedcategory. For this reason, it was excluded from theownership evaluation, leaving only four plants in theprivate category, all of which were owned by onecompany.
The four investor-owned plants had lower efflu-ent turbidity values relative to the publicly ownedplants, but the difference was not statistically signif-
icant. The average of the highest monthly turbidityvalues for the investor-owned plants was 0.1 ntu,compared with 0.3 ntu for the publicly owned plants(Table 3 and Figure 6). The four privately ownedplants were constructed in 1906, 1922, 1965, and1991 and tended to be located on larger streams andrivers with higher raw water turbidity values rela-tive to the average facility participating in this study.
Croker et al7 assessed one of the privately ownedplants evaluated in this study. The study describes howthe plant was able to substantially improve finished
water turbidity through op-erational changes and minorcapital improvements (pri-marily for instrumentation)even though the plant wasconstructed in 1906. Becauseall of the investor-ownedplants in the study had thesame owner, no conclusionsshould be drawn about thegeneral performance of pri-
vate versus public plants. However, the fact that the pri-vate owner was consistently able to provide excellentperformance despite a variety of conditions shows thata commitment to maintaining low turbidity levels maybe equally as important if not more important thanother variables evaluated in this study.
Source type and source water turbidity. Watersources were classified as reservoir, river, or stream.Almost half of the sources were reservoirs, 37 percentwere rivers, and 16 percent were streams. Staff ateach filtration plant recorded raw water turbidity val-ues once each day for the duration of the study. Theaverage raw water turbidity for each source type andfinished water turbidity data are given in Table 3.The data show that the plants using river sourcesseemed to perform better than those using reservoirsand streams. The difference is statistically significant(Table 2).
0
0.1
0.2
0.3
0.4
0.5
0.6
0.7
0.8
Turb
idit
y—n
tu< 10 > 50
Plant Age Group—years
Maximum monthly effluent Average annual effluent
26–5011–25
FIGURE 9 Effect of plant age on effluent turbidity
Slow sand and diatomaceous earthfiltration plants were excluded fromthe study because the turbidity standardfor these plants is different.

38 VOLUME 91, ISSUE 12 JOURNAL AWWA
Approximately 26 percent of the plants usingreservoirs and 47 percent of those using streams hadthe highest monthly turbidity values (>0.3 ntu), com-pared with only 7 percent of the plants using rivers.These results occurred even though the river sourceshad much higher average raw water turbidity val-ues than the streams and reservoirs. The average rawwater turbidity for the rivers was 32 ntu comparedwith 7.9 and 9.2 ntu for the reservoirs and streams,respectively. The median river water turbidity was35 ntu, indicating that the high average value wasprobably not skewed by a few high values.
Pennsylvania riverstend to have highly vari-able water quality relativeto reservoirs. River waterturbidity, pH, and alkalin-ity levels generally fluctu-ate rapidly, depending onflow conditions. Conse-quently, river sources arealmost always more diffi-cult to treat than reservoirsources. Nevertheless, theperformance data for theriver plants appear to besuperior to those for thereservoirs and streams,indicating that source typeis a poor predictor of plantperformance.
A comparison of turbidity data for raw water andfinished water from each plant using a regressionanalysis provides an R2 value of 0.05, which meansthat there is no correlation between the two values.Thus, systems with poorer-quality water are able toprovide treatment on a par with systems that havebetter water quality. Perhaps the plants treatinghigher-turbidity water place more emphasis on fil-tration plant performance because of their concerns
regarding the poor quality ofthe source. Low-turbiditywater, however, does not nec-essarily have low concentra-tions of Giardia cysts and Cryp-tosporidium oocysts. A studyof the Allegheny River nearPittsburgh under varyingwater quality conditions didnot find a correlation betweenGiardia and Cryptosporidiumand turbidity or any otherwater quality factor.8 Nationalstudies, too, have not uncov-ered a good physical or bio-logical surrogate for Giardiaor Cryptosporidium presence.9The findings in this Pennsyl-vania study may suggest thatsurface water systems treat-ing low-turbidity source water
may need to place more emphasis on maintaininglow finished water turbidity levels.
Plant type. Filtration plants were placed into fourcategories: conventional, direct, package (gravity fil-ters), and package (pressure filters). The plants in thepackage (gravity) category include plants in whichone manufacturer provided the flocculation, clarifi-cation, and filtration processes in a complete unit.Two of the plants using pressure filters used a clari-fication process before the filters. The remaining sixpressure filtration plants did not use a clarificationprocess. As discussed previously, diatomaceous earth
filtration plants were notincluded in this study.
Most of the plants inthe study were conven-tional or package (grav-ity). The results of theanalysis (Figure 8 andTable 3) show little dif-ference in performancebetween the conven-tional and package(gravity) plants. Thedirect filtration plantshad lower turbidity val-ues than the conven-tional and package(gravity) plant, but onlythree direct filtrationplants were included in
the study. Additionally, the average raw water tur-bidity for direct filtration plants was much lower thanthat for the other categories.
The package (pressure) plants had higher turbid-ity values relative to the plants in the other cate-gories, but the difference was not statistically signif-icant. Fifty percent of the package (pressure) plantswould not have complied with the 0.3-ntu standardfor at least one month during the study. None of the
0
0.05
0.10
0.15
0.20
0.25
0.30
0.35
0.40
0.45
Sand Anthracite Mixed Media Multimedia
Filter Media Type
Turb
idit
y—n
tuMaximum monthly effluent Average annual effluent
FIGURE 10 Effect of filter media type on effluent turbidity
Aminimum of six monthsof turbidity data forraw water and finishedwater had to beavailable from theparticipating waterplants in 1997.

DECEMBER 1999 P.J. LUSARDI ET AL 39
package (pressure) plantswould have complied with a0.1-ntu standard. All of thepackage (pressure) plantsserved < 5,000 people; five outof eight plants served < 1,000people.
Plant age. To evaluate theeffect of plant age on filtrationplant performance, four clas-sifications of plant age wereused: �10, 11–25, 26–50, and>50 years. About half the sys-tems were < 10 years old, withapproximately equal numbersof systems in the other threeage categories (Table 3). Thelarge number of recently con-structed filtration plants isattributed to Pennsylvania’sregulations enacted in re-sponse to the federal SWTR.Pennsylvania’s regulations require that all surfacewater sources be filtered. As a result, more than 100filtration plants were constructed in the 10-year periodpreceding this study.
There is no obvious correlation between plantage and performance for the plants participating inthis study. The lowest percentages of plants that
exceeded 0.3- and 0.1-ntu levels were in the newestand oldest groups. Conversely, the middle two agegroups had a higher number of systems predicted tobe noncompliant. A comparison of plant age andmaximum monthly finished water turbidity data foreach plant using regression analysis provides an R2
of 0.002. This shows that there is no relationshipbetween turbidity and plant age. The fact that thenewest plants did not appear to have much betterperformance than the oldest plants is somewhat sur-prising because the newer plants were constructed inaccordance with stricter regulatory standards. Thisfinding may suggest that operational considerationsare just as important or more important than plantdesign characteristics.
Media type. There were four classes of filter mediafor the plants in this study: sand only, anthracite only,mixed media (sand and anthracite), and multime-
dia. The filters in the multimedia category had at leastthree types of media, such as sand, anthracite, and gar-net. Two plants using pressure filters were excludedfrom the media evaluation because they used a pro-prietary type of monomedia.
The plants that used sand only and anthraciteonly appeared to have higher finished water turbid-
ity values than the mixedmedia and multimediaplants. There were moresingle-media plants in ex-cess of the 0.3-ntu limit andthe 0.1-ntu optimizationgoal than plants using twoor more types of filtermedia, but the differencesdo not appear to be statisti-cally significant. Variousstudies have shown thatthere is a lower rate of headloss and consequently
longer filter run times for mixed and multimedia fil-ters compared with sand-only filters, but the benefitprovided in terms of improved filtrate quality has notbeen fully demonstrated.10
Filtration rate. Filtration rates were divided intofour categories: 0–1 gpm/sq ft (0–2.5 m/h), >1–2gpm/sq ft (>2.5–5 m/h), >2–3 gpm/sq ft (>5–7.5 m/h),and >3–4 gpm/sq ft (>7.5–10 m/h). Public water sup-ply permits in Pennsylvania limit filtration rates ingravity plants to a maximum of 4.0 gpm/sq ft (10m/h), and none of the gravity plants exceeded thisrate. Five of the pressure filtration plants, however,had filtration rates in the range of 4–7 gpm/sq ft(10–17.5 m/h.) Pennsylvania’s filtration rate limit of4.0 gpm/sq ft (10 m/h) was established for gravityfilters and is not necessarily applicable to pressurefilters. Pressure filtration plants were not included inthe filtration rate evaluation for this reason.
0
0.05
0.10
0.15
0.20
0.25
0.30
0.35
0.40
0.45
Turb
idit
y—n
tu
Monthly Annual
0–1 (0–2.5) >1–2 (>2.5–5) >2–3 (>5–7.5) >3–4 (>7.5–10)
Filtration Rate—gpm/sq ft (m/h)
FIGURE 11 Effect of filtration rate on effluent turbidity
Forty-three percent of the facilitieswould not have met the Partnershipfor Safe Water 0.1-ntu optimizedperformance goal for at leastone month of the study.

40 VOLUME 91, ISSUE 12 JOURNAL AWWA
The plants with the lowest filtration rates (0–1gpm/sq ft [0–2.5 m/h]) appeared to have the worstperformance (Table 3 and Figure 11). There was noobvious relationship between filtration rate and tur-bidity for plants in the other three categories. Thisseems to indicate that the most conservativelydesigned filters do not necessarily have the best per-formance. The R2 value is 0.02, which seems to showthat there is no relationship between filtration rate andturbidity performance. Some studies have shown thatthe effect of filtration rate on filtrate quality does notbecome apparent until rates exceed 4.0 gpm/sq ft (10m/h), which is higher than the rates used by plantsin this study.10 There may, however, be other advan-tages to lower filtration rates, such as longer filterrun times and less water used for backwashing.
ConclusionsThis study examined the long-term finished water
turbidity data at 75 surface water treatment plantsin Pennsylvania. The average maximum monthlyand annual 95th percentile turbidity values for thefacilities participating in the study were 0.3 and 0.2ntu, respectively. Twenty-two percent of the plantswould have not complied with a 0.3-ntu standardfor at least one month of the study.
When turbidity data from multiple plants are com-pared, several potential limitations that could be cru-cial to data collection required under new regula-tions must be considered. Staff at surface watertreatment plants have historically selected instru-ments from a variety of manufacturers, have theoption of choosing sampling points from a number oflocations within the treatment plant, and face instru-ment calibration issues that could affect turbidimeterperformance. All are important considerations whenfiltration plant performance is monitored and plant-to-plant variations are compared. For plant-to-plantcomparisons, data collection must be consistent as towhether the data represent highest, average, or rou-tine sampling (values from once every four hours).
This study also reviewed key water quality, design,and operational variables to determine their effects onfiltered water turbidity. Plants that did not use a coag-ulant, served small systems, or treated water fromstreams had, on average, poor turbidity removal rel-ative to the plants overall. Variations in performanceamong the rest of the plants cannot be explained sta-tistically by the differences in the variables evaluatedas part of the study. Many plants were able to con-sistently achieve extremely low turbidity levels despitelimitations such as small system size, plant age, orhigh source water turbidity. This suggests that smallsystems are not condemned to having poor perfor-mance. Nontangible variables such as commitment toachieving low turbidity, operator skill level, and oper-ator attention appear to be equally as important ifnot more important than tangible variables such assource water quality, plant age, and type of coagulant.The few private plants evaluated were consistentlyable to provide excellent performance despite a vari-
ety of conditions, which further shows that commit-ment to excellence is extremely important. The old-est filtration plants seemed to perform as well as thenewest ones, indicating that some water systemswithout state-of-the-art facilities can significantlyimprove performance by optimizing operations with-out making major capital expenditures. Efforts byregulatory agencies that increase owner and operatorawareness of the importance of filtration plant per-formance and optimization are obviously valuable.
References1. CRAUN, G.F. ET AL. Waterborne Outbreaks of Cryp-
tosporidiosis. Jour. AWWA, 90:9:81 (Sept. 1998).2. Working Group on Waterborne Cryptosporidio-
sis. Cryptosporidium and Water: A Public HealthHandbook. Council of State and Territorial Epi-demiologists, AWWA, Denver, Colo. (1997).
3. MARSHALL, M.M. ET AL. Waterborne ProtozoanPathogens. Clinical Microbiol. Reviews, 10:67 (Jan.1997).
4. BURLINGAME, G.A. ET AL. Practical Applications ofTurbidity Monitoring. Jour. AWWA, 90:8:57 (Aug.1998).
5. USEPA, AWWA, AWWARF, AMWA, ASDWA, &NAWC. Partnership for Safe Water VoluntaryWater Treatment Plant Performance Improve-ment Program. Self-assessment Procedures. (Oct.1995).
6. LECHEVALLIER, M.W. ET AL. Giardia and Cryp-tosporidium in Raw and Finished Water. Jour.AWWA, 87:9:54 (Sept. 1995).
7. CROKER, R.A. ET AL. Meeting Partnership Goalsand Performing Phase III Assessments at Smalland Medium Filtration Plants. Proc. 1997 AWWAWQTC, Denver.
8. STATES, S. ET AL. Protozoa in River Water: Sources,Occurrence, and Treatment. Jour. AWWA, 89:9:74(Sept. 1997).
9. NIEMINSKI, E.C. ET AL. Application of Surrogate Mea-sures to Improve Treatment Plant Performance.AWWA Res. Fdn., Denver (in press).
10. CLEASBY, J.L. Filtration. Water Quality and Treatment(F.W. Pontius, editor). McGraw-Hill, New York(4th edition, 1990).
About the authors: Peter J.Lusardi is a project engineer at CETEngineering Services, 1240 N. Moun-tain Rd., Harrisburg, PA 17112. Hehas BS and MS degrees in engineeringfrom Pennsylvania State Universityin University Park and Harrisburg(Capitol College), Pa., respectively. A
member of AWWA and the American Society of Civil Engi-neers, he has 19 years of environmental engineering expe-rience, including eight years of experience designing water andwastewater treatment facilities. Phil J. Consonery is sanita-tion program specialist at the Pennsylvania Dept. of Envi-ronmental Protection, Rachel Carson State Office Bldg., POB8467, Harrisburg, PA 17105-8467.