filling the gap between buffer and rock in the … · could be used for filling the gap between...
TRANSCRIPT
P O S I V A O Y
O l k i l u o t o
F I -27160 EURAJOKI , F INLAND
Te l +358-2-8372 31
Fax +358-2-8372 3709
P ie t i Mar javaara
Har r i K iv i kosk i
June 2011
Work ing Repor t 2011 -33
Filling the Gap Between Buffer and Rockin the Deposition Hole
June 2011
Working Reports contain information on work in progress
or pending completion.
The conclusions and viewpoints presented in the report
are those of author(s) and do not necessarily
coincide with those of Posiva.
P iet i Mar javaara
Harr i K iv ikosk i
V T T
Work ing Report 2011 -33
Filling the Gap Between Buffer and Rockin the Deposition Hole
ABSTRACT The purpose of this study was to investigate different methods and materials which could be used for filling the gap between bentonite buffer and rock in the deposition hole. This work included a short literature survey of the previous gap filling tests which have been done in the recent years. The experimental work done during the study was divided in two phases. In the first phase small scale laboratory experiments were done using several different bentonite materials, material combinations and installation methods for 25 mm and 35 mm gaps. The sizes of these rectangular gap elements used in these tests were approximately 1 m in height and 2 m wide. Based on the first stage results the second sets of experiments were commenced. This time two materials and two methods were used in larger scale with gap widths of 35 mm and 50 mm. The large scale tests were done with cylinder shaped elements which had real size deposition hole radius of 1.75 m but the height was limited to 2 meters. Materials used in these gap filling tests included bentonite pellets and granules and their combination mixtures. Installation methods studied were free fall pouring method, shotcrete spraying method, Proctor hammer compaction method and two vibration methods to verify their functioning with these materials, material types and material forms. The achieved dry density was determined after each filling. The homogeneities of the fillings were also studied with X-ray imaging. The results from the small scale tests suggest that all the filling materials and methods used during the test would have high enough dry density average value needed by current buffer design options. The dry density values ranged from 800-1200 kg/m3. The lowest values were noted from free fall pouring of the largest Cebogel QSE pellets and the highest values were obtained from compacted small grain size Minelco bentonite. The X-ray images and their analysis showed that Minelco and Ibeco Seal S-FGS had the most homogenised results. The largest differences in homogeneities were determined from Cebogel QSE pellets or from its combination mixture with finer material. Also when these combinations were used with shotcrete spraying installation the separation of the particles could be seen. In large scale experiments the shotcrete spraying tests gave out higher dry density values when compared to free fall pouring. Also there seems to be little or no difference in achieved density values between 35 mm and 50 mm gaps. The increase of the gap size by 15 mm was not a significant factor with the materials and installation methods used in this study. The dry density values ranged from 800-1000 kg/m3. The highest dry density value was lower than in small scale tests because no compaction methods were used. The spraying rates during shotcrete installation method tests varied between 1.6 – 2.0 m3/h depending on the pressure used. Because of the relatively small size of the gap elements used the spraying pressure had to be adjusted lower during installations. In the case of much deeper real size deposition hole the situation may be completely different. If buffer design requires gap filling of certain dry density value range 800 – 1200 kg/m3 to be used it can be achieved in several ways as shown in this study. Pellets could be

used alone and the voids in this type of filling enable artificial wetting design option. Installation method could be the simplest free fall pouring or dry shotcrete spraying. Also there are ways to make more homogeneous filling with fine grain size bentonite materials if the artificial wetting option is not needed. Keywords: Gap, filling, bentonite, deposition hole, pellets, shotcrete spraying, free fall pouring
PUSKURIN JA KALLION VÄLISEN RAON TÄYTTÖKOKEET TIIVISTELMÄ Tutkimuksen tavoitteena oli tutkia erilaisten täyttömenetelmien ja bentoniitti-materiaalien soveltuvuutta loppusijoitusreiän ja kallion välisen raon täyttämiseen. Työn teoriaosuuteen kuului suppea kirjallisuusselvitys viimeaikaisista aiheeseen liittyvistä julkaisuista. Varsinainen kokeellinen työ tehtiin kahdessa osassa. Ensimmäisessä osassa pienimittakaavaisissa kokeissa tutkittiin useita eri bentoniittimateriaaleja, niiden kombinaatioita sekä täyttömenetelmiä 25 mm ja 35 mm rakoleveyksillä. Työ tehtiin suorakaiteenmuotoisilla elementeillä, jotka olivat noin 1 m korkeita ja 2 m leveitä. Toisen osan koesuunnitelma tehtiin ensimmäisen osan tuloksien perusteella. Tutkittavaksi valittiin kaksi bentoniittityyppiä ja kaksi täyttötapaa, joilla täytettiin suuremman mittakaavan rakoelementit. Raot olivat toisessa vaiheessa 35 mm ja 50 mm leveitä. Suuren mittakaavan testeissä käytettiin sylinterinmuotoisia rakoelementtejä, joiden halkaisija vastaa loppusijoitusreiän halkaisijaa 1.75 m. Korkeutta käytetyillä elementillä oli 2 metriä. Kokeissa käytettyjä materiaaleja olivat bentoniittipelletit sekä -granulit ja näiden sekoi-tetut yhdistelmät. Käytetyt asennusmenetelmät olivat vapaa pudotus ja ruiskuttamalla tapahtuva puhallus. Tiivistykseen käytettiin muunnettua Proctor-vasara -menetelmää sekä kahta tärytystapaa. Tutkimuksen mielenkiinnon kohteina olivat näiden asennus- ja tiivistysmenetelmien toimivuus eri bentoniittimateriaaleille, materiaalityypeille ja -muo-doille. Täyttöjen aikaansaamat kuivatiheysarvot määritettiin sekä täyttöjen homo-geenisuutta arvioitiin myös röntgenmittauksin. Saatujen tulosten perusteella näyttää siltä, että kaikki testatut materiaalit sekä testatut asennusmenetelmät tuottavat puskurisuunnittelun rakotäyttöoption kannalta katsottuna riittävän korkeat kuivatiheysarvot. Kokeista saadut kuivatiheysarvot olivat välillä 800–1200 kg/m3. Pienimmät tiheysarvot saatiin vapaasti pudotetuilla suurikokoisimmilla Cebogel QSE -pelleteillä ja korkeimmat arvot sai pienirakeinen tiivistetty Minelco bentoniittigranuli. Röntgenkuvat ja niiden analyysit osoittivat, että Minelco- ja Ibeco Seal S-FGS -granulit tuottivat homogeenisimmat täytöt. Suurimmat erot homogeeni-syydessä löytyivät Cebogel QSE -pelleteillä tai sen yhdistelmäsekoituksilla tehdyistä täytöistä. Näitä sekoituksia ruiskutettaessa huomattiin myös materiaalin separoitumista erilleen pellettien ja hienomman materiaalin välillä. Suuremman mittakaavan kokeissa ruiskuttamalla saatiin korkeampia kuivatiheysarvoja verrattuna vapaasti pudotettujen täyttöjen arvoihin. 35 mm ja 50 mm rakojen välillä ei ollut juurikaan havaittavaa eroa saavutettujen kuivatiheyksien suhteen. Tämän perusteella voidaan olettaa, että raon suurentaminen 15 mm verran ei ollut merkittävä tekijä tässä kokeessa käytetyille materiaaleille tai menetelmille. Mitatut kuivatiheys-arvot olivat välillä 800–1000 kg/m3. Korkein saavutettu kuivatiheysarvo näissä kokeissa oli pienimittakaavaisten kokeiden arvoa matalampi, koska erityisiä tiivistysmenetelmiä ei käytetty. Täyttönopeus ruiskuttaessa vaihteli välillä 1.6 – 2.0 m3/h riippuen laitteiston käyttämästä paineesta. Ottaen huomioon rakoelementtien suhteellisen pienen koon käytettävä ruiskutuspaine jouduttiin pitämään matalana. Varsinaisessa paljon syvem-mässä loppusijoitusreiässä tilanne voi olla erilainen.

Jos puskurisuunnittelu edellyttää 800 – 1200 kg/m3 kuivatiheyksisen rakotäytön käyttöä, se voidaan saavuttaa usealla tässä tutkimuksessa kuvatulla tavalla. Pelkkiä pellettejä voidaan käyttää esimerkiksi silloin, kun halutaan pitää mahdollinen keino-kasteluoptio avoimena. Riittävinä asennusmenetelminä toimivat yksinkertaisin vapaa pudottaminen tai ruiskutus. Jos keinokasteluoptiota ei edellytetä, niin tietyillä hieno-jakoisemmilla bentoniittityypeillä rakotäyttö voidaan tehdä pellettitäyttöä homogeeni-semmaksi. Avainsanat: Rako, rakotäyttö, bentoniitti, loppusijoitus, pelletti, ruiskutus, vapaa-pudotus.

1
TABLE OF CONTENTS ABSTRACT
TIIVISTELMÄ
1 INTRODUCTION ....................................................................................................... 3
2 A LITERATURE SURVEY OF PREVIOUS GAP FILLING TESTS ........................... 5
3 GAP FILLING TESTS ............................................................................................. 13
3.1 Tests ............................................................................................................... 13 3.2 Small scale tests ............................................................................................ 13
3.2.1 Materials .................................................................................................. 13 3.2.2 Gap elements .......................................................................................... 13 3.2.3 Filling methods ........................................................................................ 14 3.2.4 Compaction methods .............................................................................. 14 3.2.5 Measurements and dismantling .............................................................. 16 3.2.6 X-ray imaging .......................................................................................... 17
3.3 Large scale tests ............................................................................................ 20 3.3.1 Measurements ........................................................................................ 22
4 MATERIALS ............................................................................................................ 25
4.1 Cebogel QSE–pellets ..................................................................................... 25 4.2 Ibeco Seal S-FGS granules ............................................................................ 26 4.3 Minelco granules ............................................................................................ 26 4.4 Mixture of Cebogel QSE pellets and Minelco granules .................................. 28 4.5 Mixture of Cebogel QSE– pellets and Ibeco Seal S-FGS granules ............... 29
5 RESULTS OF THE SMALL SCALE GAP FILLING TESTS .................................... 31
5.1 Test methods .................................................................................................. 31 5.2 Free fall pouring and layer filling with compaction .......................................... 31 5.3 Shotcrete spraying ......................................................................................... 31 5.4 Conclusions from small scale tests ................................................................ 33
5.4.1 Cebogel QSE pellets ............................................................................... 35 5.4.2 Ibeco Seal S-FGS ................................................................................... 35 5.4.3 Minelco granules ..................................................................................... 36 5.4.4 Cebogel QSE pellets + Ibeco Seal S-FGS 65/35 mixture ....................... 37 5.4.5 Cebogel QSE pellets + Minelco crushed aggregate 65/35 mixture ......... 38 5.4.6 X-ray analysis .......................................................................................... 39 5.4.7 Small scale test methods variations/errors ............................................. 48 5.4.8 Dust ......................................................................................................... 49 5.4.9 Spraying time and filling rate ................................................................... 49 5.4.10 Densities of the small scale tests ............................................................ 49
6 RESULTS OF THE LARGE SCALE GAP FILLING TESTS .................................... 53
6.1 Test methods .................................................................................................. 53 6.2 Free fall pouring ............................................................................................. 53 6.3 Shotcrete spraying ......................................................................................... 53 6.4 Conclusions from large scale tests ................................................................. 53
6.4.1 Cebogel QSE pellets ............................................................................... 53 6.4.2 Ibeco Seal S-FGS ................................................................................... 54 6.4.3 Large scale test methods variations/errors ............................................. 55 6.4.4 Spraying time and filling rate ................................................................... 56

2
6.4.5 Densities of the large scale tests ............................................................ 56
7 SUMMARY .............................................................................................................. 59
8 CONCLUSIONS AND DISCUSSION ...................................................................... 61
REFERENCES ............................................................................................................. 63
ANNEXES ..................................................................................................................... 65
3
1 INTRODUCTION Vertical deposition holes are drilled to bedrock with certain tolerances and also some clearance is needed for bentonite buffer installation. Because of these facts there is always an unavoidable gap between the bedrock and bentonite buffer. The repository related gap filling including deposition holes and tunnel backfill cases has been studied widely in Nordic countries, Europe and worldwide already for some years. The main focus has been with fillings which have less density than the buffer blocks itself for example various bentonite pellets or granules. Some of the recent studies of the subject include among others articles from Pusch, Johnson and Bluemling (2002), Naundorf & Wollenberg (1992), Nord & Gunnarsson (2005), Tanaka & al. (2006) and Martino & Dixon (2006). SKB has also made gap filling tests and its designs to carry out more tests in the future. There are several reasons for using fillers in the gap. Fillers can secure better thermal conductivity and prevent spalling of the surrounding rock to the deposition hole. Also fillers might be needed to retain the adequate average density for example in cases when the gap itself might be enlarged or the density of the buffer blocks is lowered. Buffer blocks may need to be secured to stay in their places and also slowing down the possible water erosion (piping) may be needed for the wet holes.

4
5
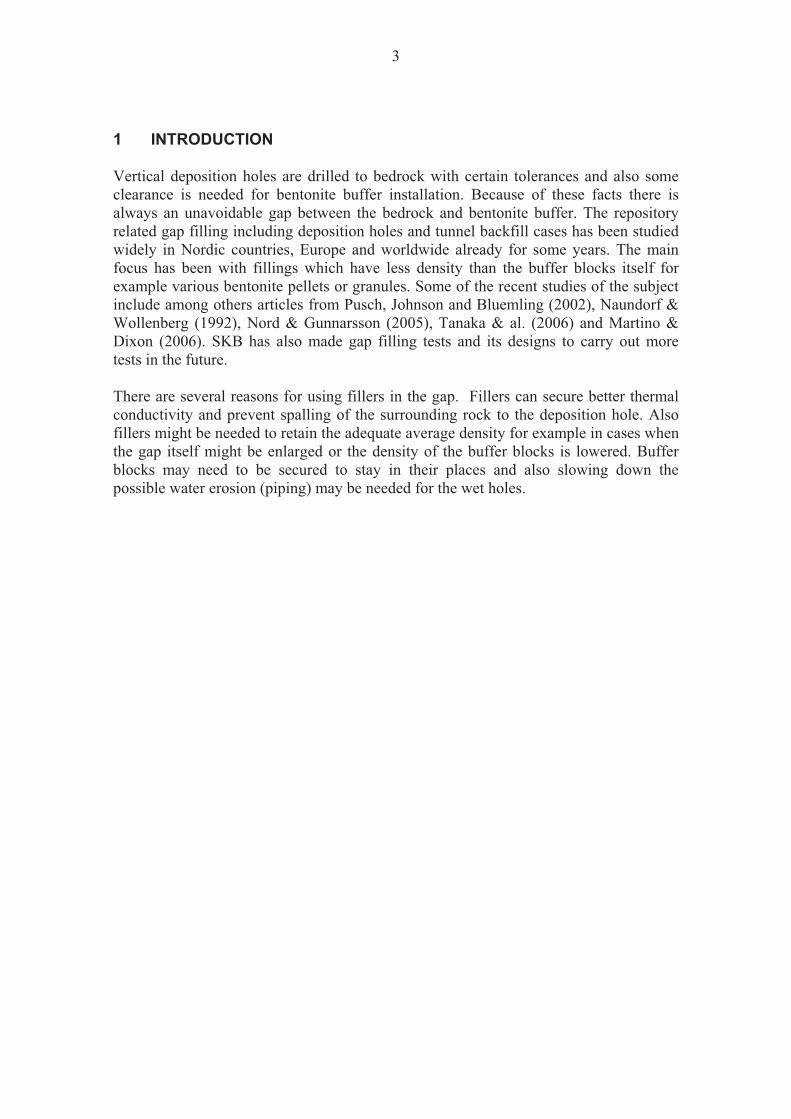
2 A LITERATURE SURVEY OF PREVIOUS GAP FILLING TESTS Several pellet filling tests were carried out in the Bentonite Laboratory at the Äspö. Figure 1 shows a pilot experiment of pellet blowing using conventional concrete equipment with a capacity of about 1 m3/h, with water added at the nozzle, a method that led to a practically applicable way of blowing pellets with limited dusting /Wimelius et al. 2008/. Wooden tunnels of relevant size and shape were constructed to investigate what the homogeneity of the pellet filling would be in practice (Figure 2). Figure 3 shows the nozzle of the blowing tube, which had an outer diameter of 70 mm. An amount of 1 % of water by mass was added at the nozzle to reduce dust during the installation. With this shotcreting technique the emplacement rate was approximately 5 m3/hour.
Figure 1. Spraying of pellets with a capacity of 1 m³/min as part of a study for finding a suitable technique for pellet filling /Wimelius et.al. 2008/.

6
Figure 2. The wooden test tunnel with stepwise stacked concrete blocks resting on the foundation bed and equipment for pellet spraying /Wimelius et.al. 2008/.
Figure 3. The nozzle of the tube for blowing pellets with holes for adding water for reducing generation of dust /Wimelius et.al. 2008/.
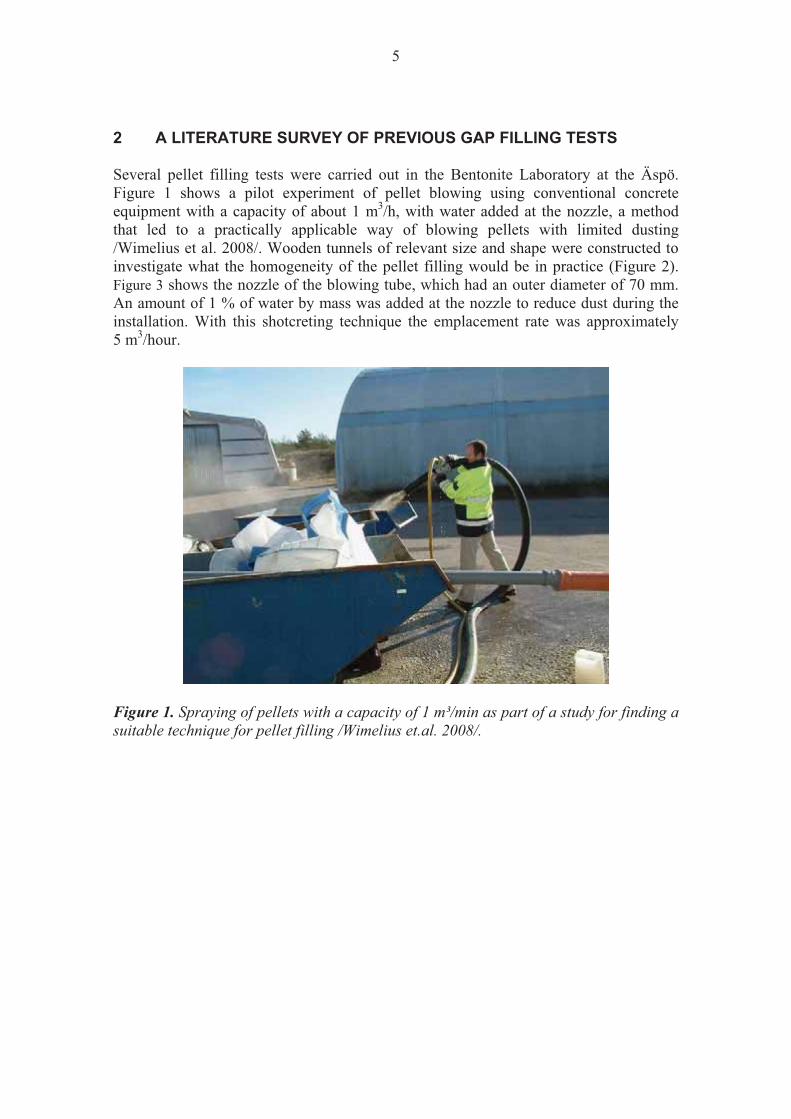
Tests were also made with using augers for pellet installation tools (Figure 4). This technique requires the augers to push the material and fill the volume above. The tests showed that the movement beyond the exit of the auger could hardly exceed about 400 mm. Also it was noted that the auger could not reach into all parts of the space to be filled. This limitation and the risk of heterogeneities in the placed fill suggest that the auger technique should be abandoned and focus should instead be on the blowing technique /Wimelius et.al. 2008/.
7
Figure 4. Pilot test using an auger for placing the pellets /Wimelius et.al. 2008/.
Filling pellets by pouring has been found to be inadequate in some cases since the homogeneity will not be satisfactory and some parts of the volume may remain unfilled, like below rock asperities. Based on these experiences it is suggested that the pellets should be filled by blowing with shotcreting technique. There will be some bouncing of pellets and a variation in homogeneity but the density is believed to be higher than by simple pouring. Still, tests made at Äspö have shown that the dry density of blown pellet fills placed by using tubes with 50 mm diameter and water added at the nozzle will be less than 1000 kg/m3 /Wimelius et.al. 2008/. A possible way of increasing the dry density may be to mix two or more pellet size fractions but there is a risk that they could separate in the filling phase, leading to enrichment of coarser granules in the lowest part of the fill. The matter needs further consideration and full-scale testing. Posiva’s pellet tests as a filling between blocks and ceiling and walls of tunnel were performed in Riihimäki. The test constructions in Riihimäki have exhibited that the estimated dry density of pellets sprayed with water has varied between 473 – 971 kg/m3 /Riikonen 2009/. The reached dry densities increased from test to test; this indicates that the method can be improved. The pellet emplacement test trials as preparation for BACEKO tests were conducted at Sipoo in March 2008. Shotcrete spraying pellets using Meyco Piccolo shotcrete spraying machine has been tested by Posiva Oy in premises of Suomen Rakennevahvistus Oy. The pellets used in testing were Cebogel QSE Ca-bentonite pellets (activated Milos Ca-bentonite). Testing the equipment and the effect of water in shotcrete spraying was carried out with three tests. In each test the pellets were sprayed into a plywood mould with dimensions of 2.4×0.8×0.1 m (Figure 5a). The mould represented a backfilling length of 3 m. Since the mould was vertical, the cover was not analogous with the tunnel ceiling. The first shotcrete spraying test was done without water. The mould filled tighter at the back and the dust from the pellets settled on the upper parts of the mould. At the front of the mould pellets were packed more loosely forming an angle of 45° (Figure 5b). In the second and third tests the water was added from the nozzle so the pellets passed through a water jet. The shotcrete spraying rate of water used in testing was measured twice: before and after the third test. The rate was 1,2 L/min and 1,9 L/min, and the total amount of water added was estimated to have been between 12-28 L. In 200 L mould volume this amount equals 6-14 % added water volume. Water prevented formation of the dust and resulted in a denser packing of the pellets. Almost a vertical layer of pellets (Figure 5c) was produced in both tests.

8
Figure 5a. The moulds. Figure 5b. Dry sprayed pellets in the
45° angle. Figure 5c. Wet sprayed pellets in a vertical layer.
Using water during shotcrete spraying did not seem to have any effect on the actual amount of pellets fitting inside the mould. The pellets tend to pack more densely with water. The air voids were speculated to have been replaced by water. The tested shotcrete spraying equipment assorts to rather small scale use. Similar equipment is available also for operation on larger scale /Riikonen 2009/.
Figure 6. Shotcrete spraying of the pellets /Riikonen 2009/.
Preliminary conclusions /Hansen et al. 2010/ regarding pellet installation in a repository environment can be made based on observations from the tests where a vertical section of pellets was installed. For a gap of 70-100 mm dimension, it is possible to fill the volume by shotcrete spraying pellets, despite any roughness of the surface. The pellets
9
tend to pack more densely when a limited quantity of water is added during the shotcrete spraying process. Kjartanson et al. /2005/ performed gap fill pouring trials using a variety of granular mixtures including commercially available North American bentonite pellets and chips. The Effective Montmorillonite Dry Density (EMDD-values) for the individual pellets and granules examined ranged from 1.21 to 1.70 Mg/m3. EMDD is the dry density of the active montmorillonite swelling component of bentonite. Kjartanson et al. /2005/ recommended use of denser granules or pellets (HCB, Highly Compacted Bentonite) of the same physical dimensions to attempt to achieve greater placement density. They found that particle shape, size and gradation affect greatly to pellet placement density. The EMMD has been defined by Kjartanson et al. /2005/ as follows:
��
���
��
���
�
���
���
��
wn
dcm
wa
dc
dcm
Gff
Gf
ffEMDD
��
��
�)1()1(
1 (1)
where fm = mass fraction of montmorillonite in clay (e.g., > 75 % in MX80); fc = mass fraction of clay in soil (e.g., 100 % in bentonite clay); Ga = relative density of aggregates solids (e.g., quartz sand=2.65); and Gn = relative density of non-montmorillonite clays (e.g., 2.645). /Dixon et al. 2006/ constructed a device from two Plexiglas sheets separated by shims to simulate gaps (10 mm wide between canister and bentonite buffer and 50 mm between buffer and rock). The gap depth was approximately 0.8 m. The tested materials were HCB pellets and mixtures of HCB pellets and granules (sieved 1.18 mm or 0.6 mm mesh). US pellets were elongated briquette-shaped with nominal dimensions of 25 mm by 10 mm by 5 mm, a dry density of 1860 kg/m3 (EMDD=1.68 Mg/m3) and water content of 11.3 %. Swedish pellets were provided by Clay Technology AB (raw material was MX-80 bentonite) and they were pillow-shaped with nominal dimensions of 16 mm by 16 mm by 8 mm thick, a dry density of approximately 1700 kg/m3 (EMDD=1.5 Mg/m3) and water content of 12 %. A lift height of 150 mm was selected to minimize the inter-pellet space clogging or bridging during fines placement. In some trials a mechanical vibrator was used to enhance compaction. The used vibrator was a concrete pencil type vibrator with a fork-like attachment with four 150 mm long spikes spaced 100 mm apart from each other. Vibration time in these tests was 30 seconds and low vibration frequency was used for avoiding fractures or break-ups of pellets. Figure 7 shows the appearance of the US pellet gap fill at different steps in placement.

10
Figure 7. Profile view of US pellets and fines components /Dixon et al. 2006/.
Figure 8 shows the appearance of the Swedish pellet gap fill at different steps in placement.
Figure 8. Profile view of Swedish pellets and fines components /Dixon et al. 2006/.
The results of the gap filling trials made by Dixon et al. are presented in Table 1. Table 1. Results of gap filling trials (50 mm gap) /Dixon et al. 2006/.
Average dry density,Mg/m3
Swedish pellets, poured 0.92 0.75 12.2Swedish pellets, vibrated 0.93-1.01 0.80 12.270% Swedish pellets, 30% LD-30 1.34 1.15 10.770% Swedish pellets, 30% LD-30, vibrated 1.42 1.22 10.780% Swedish pellets, 20% LD-16 1.17 0.98 10.680% Swedish pellets, 20% LD-16, vibrated 1.30 1.11 10.680% Swedish pellets, 20% LD-30 1.17 0.98 10.680% Swedish pellets, 20% LD-30, vibrated 1.29-1.35 1.13 10.6US Pellets, poured 0.99-1.01 0.83 11.6US pellets, vibrated 1.09-1.14 0.94 11.680% US pellets, 20% LD-16 1.23 1.04 10.280% US pellets, 20% LD-16, vibrated 1.35 1.16 10.280% US pellets, 20% LD-30 1.26 1.07 10.580% US pellets, 20% LD-30, vibrated 1.43-1.46 1.24 10.5
Pellet/Granule material Average EMDD, Mg/m3
Water content, weight-%

11
LD-16 and LD-30 are product size designations of National Bentonite (BPM Minerals LLC 1125 17th Street, Suite 1900, Denver Colorado 80202-2024); smallest mesh size is #16 and #30 respectively. The results show that the elongated briquette-shaped pellets (US) provided higher as-placed density as compared to the Swedish pillow-shaped pellets. This is due to higher dry density in the elongated pellets and the pellet shape. The freeze mixing method to adjust water content of bentonite materials was developed in Japan /Kobayashi et al. 2005/. In the conventional method the enlargement of the grain size of the bentonite material lead to several problems. Raw material sticking to a mixer and uneven distribution of water content were identified as the main problems. In the freeze mixing method, during mixing, powdered-ice and chilled-bentonite are employed. The ice and the bentonite are cooled by less than -10 ºC degrees so that the ice may not melt by the frictional heat produced by mixing. The temperature of the mixing area is also less than -10 ºC degrees. In the freeze mixing method, the ice and bentonite can be mixed in the powder state. After the mixing, the mixture of the ice and bentonite can be thawed and preserved at the ordinary temperature. The comparison of the grain size change by water content adjustment between freeze mixing method and conventional method is presented in Figure 9. The figure shows that enlargement of the grain size due to adjustment of water content was prevented by the freeze mixing method.
Figure 9. Comparison of the grain size change by water content adjustment method.

12
13
3 GAP FILLING TESTS
3.1 Tests An experimental study was carried out with free fall pouring method, shotcrete spraying method and several compaction methods to verify the functioning of different materials, material types and material forms. Homogeneity and compaction states were for example in special areas of interest.
The actual experimental tests of the study were performed in two stages. In the first stage the small scale tests were performed in the laboratory with a wider amount of materials, fillings and compaction techniques. The large scale tests of the second stage were performed with two of the chosen tests materials based of the results of small scale test. Also the input from separate artificial wetting tests /Holt et al. 2011/ was taken under consideration. It should be noted that in these small and large scale filling tests the gap or the filling bentonite was not wetted and no extra moisture was used for dust prevention at all.
3.2 Small scale tests
3.2.1 Materials In this study the following materials and their combinations were used in the first stage:
- Pellets, Cebogel QSE (Cebo Holland B.V). - Granulate, Ibeco Seal S-FGS (Oy Lux Ab) - Granulate, Minelco Ca bentonite (Minelco Ab Sweden) - Pellets + granulate (Cebogel + Minelco 65/35) - Pellets + granulate (Cebogel + Ibeco Seal S-FGS 65/35)
The properties of the mixtures of pellets and crushed aggregate (the granulate) were adjusted to produce the smallest voids.
3.2.2 Gap elements Two gap elements of the effective height of 1140 mm and length of 2000 mm were constructed. In this study the front surface of the gap was made from clear acrylic plastic to enable digital image height measuring and visual documentation of the experiments. Outer shape of the gap was straight line. The effect of the gap width was studied by making two separate structures with designed gap widths of 25 mm and 35 mm. Back surface of the gap was made from black plastic which can be considered almost transparent to the radio metric X-ray measuring. Back and front elements were fastened tightly together to keep the gap's nominal inside dimensions close to designed values. The use of compaction techniques during filling caused more than expected horizontal pressure so extra supports were needed. Therefore after initial trials extra vertical and horizontal steel bars were installed to make the structure more rigid.

14
Figure 10. The two gap elements of small scale tests. In the front 25 mm gap is filled with Cebogel QSE pellets.
3.2.3 Filling methods The following filling methods were used: 1) free fall pouring which means dropping the bentonite from the top funnel 2) layer filling and compaction, in this case the bentonite is first dropped freely as a layer (for example 150 mm in height) and then compacted, 3) shotcrete spraying with compressed air-operated shotcrete equipment.
3.2.4 Compaction methods Three different compaction methods were used: The first was a modified Proctor hammer which is dynamic mechanical instrument with gap width specific flat 200 mm long metal pedal at the bottom (Figure 11). It was used by dropping the moving weight (4.54 kg) from a specific level (0.457 m) and repeating this procedure with new adjacent lateral position. The second method was an regular tube type concrete vibrator and the third method was a concrete vibrator used with fork type attachment (Figure 12).

15
Figure 11. A modified Proctor hammer with two inserts for 25 mm & 35 mm gap sizes.
Figure 12. Tube and fork type of concrete vibrating devices.
16
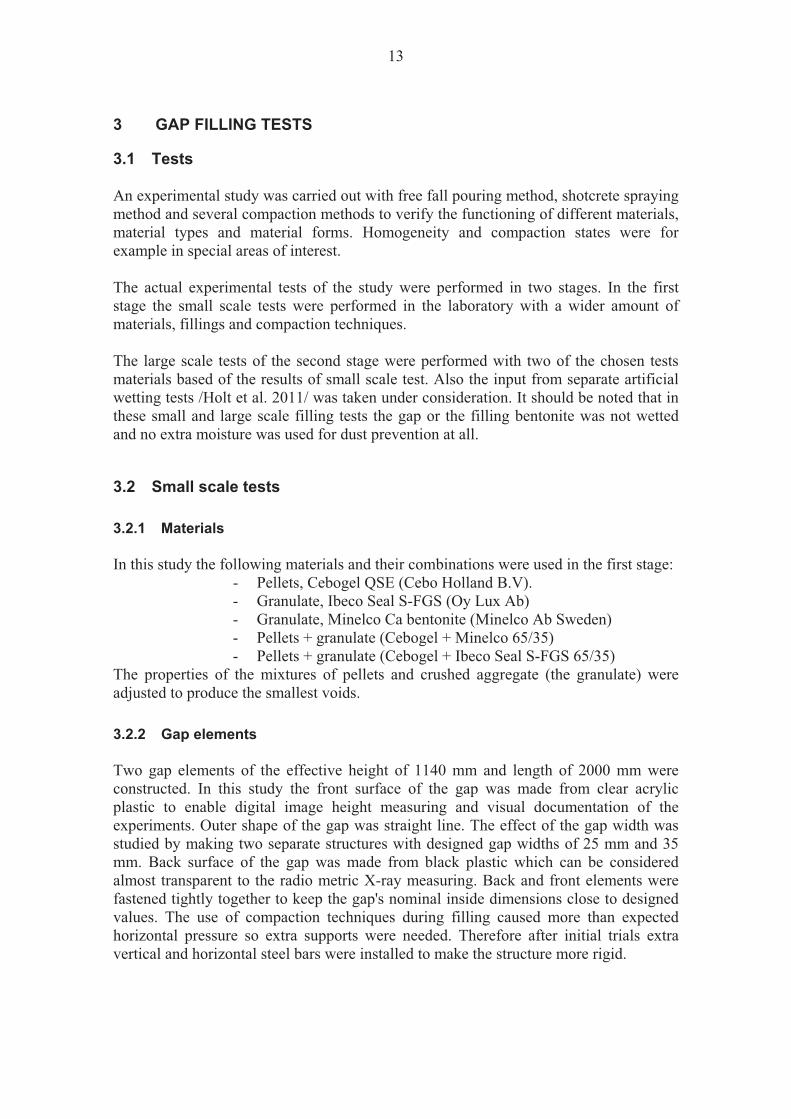
3.2.5 Measurements and dismantling The possible unwanted gap volume changes were monitored during the tests. When the bentonite is packed tight (with the Proctor hammer for example) the plastic walls of the gap system can open wider. This was monitored by installing two dial indicator pairs. The density definitions were calculated against actual gap volumes which were corrected with dial indicator monitoring results. The height of the fill was determined from digital images. The gap element was digitally photographed in three sections. Each section had reference markings in both ends which were used to calibrate the digital image. From each picture the height of the filling was marked and calculated (Figure 13).
Figure 13. The height of the filling was determined from digital images taken in three sections. The numbered yellow points were marked manually along the top of the filling and the actual height was calculated with aid of permanent reference.
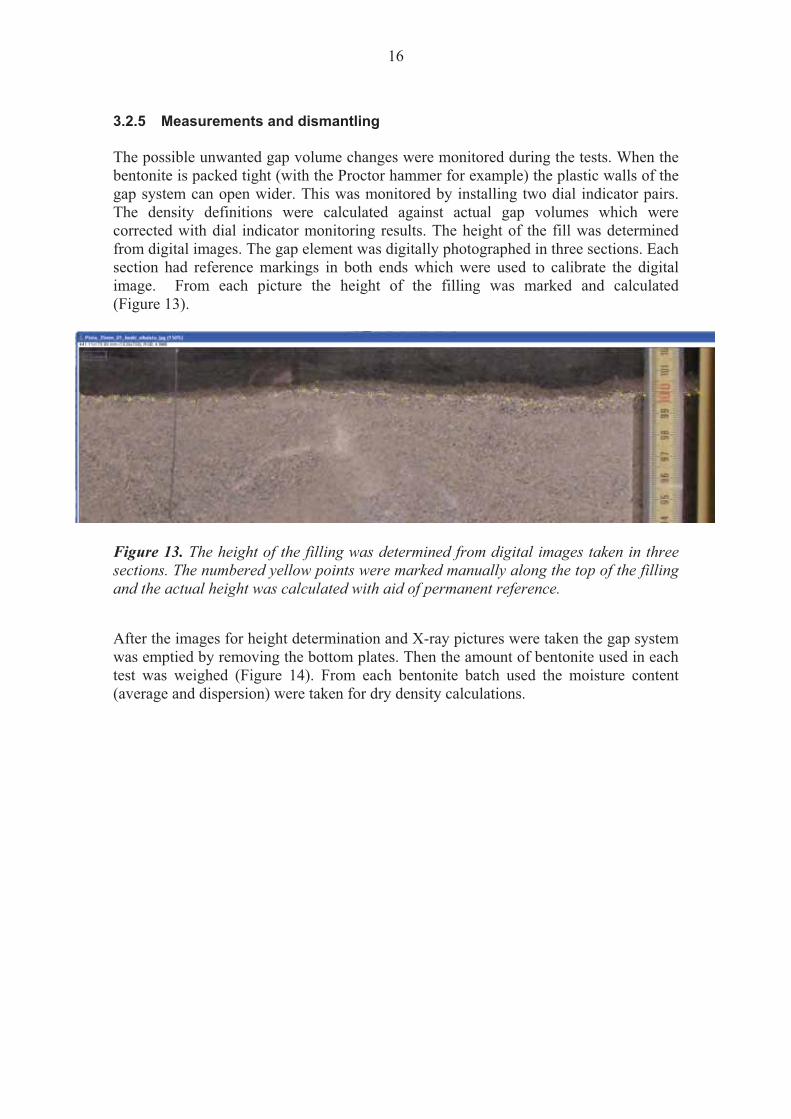
After the images for height determination and X-ray pictures were taken the gap system was emptied by removing the bottom plates. Then the amount of bentonite used in each test was weighed (Figure 14). From each bentonite batch used the moisture content (average and dispersion) were taken for dry density calculations.
17
Figure 14. Empty gap system and collected bentonite. The bottom plate was removed and the used bentonite filling is ready for weighing.
3.2.6 X-ray imaging The homogeneity studies of the fillings were measured by X-ray imaging method. This was done by installing the X-ray source to one side of the gap and inserting a digital X-ray film sensor on the gap face at the other side to capture the attenuated radiation. X-rays were taken from the central part of the gap (0,5 –1,0 m) to eliminate possible edge effects of the limited gap element. Two X-ray images were taken from each fill. The central part was divided in height to A and B sections so the possible vertical homogeneity difference could also been studied. The radio metric imaging was made through both plastic faces and the bentonite filling. This procedure was not calibrated to give absolute density values but enabled a visual way to make comparisons between different tests (Figure 15 and Figure 16). This visual inspection could be aided by using different false colour filters.

18
Figure 15. False colour X-ray images of fillings with Cebogel 65 % + Minelco 35 % in the 35 mm gap. Left free fall pouring + vibration, centre free fall pouring, right shotcrete spraying. Left image shows highest density (dark area = less dense) and best homogeneity with some voids. Right image shows shotcrete spraying pattern and uneven density because material separation during shotcrete spraying.
Figure 16. False colour images from Minelco crushed aggregate bentonite fillings. Left image is free fall pouring method + Proctor, centre shotcrete spraying and right free fall pouring. The density difference can be seen between left and right images. Also from the centre image the shotcrete spraying pattern is clearly recognisable.
Besides visual information a rectangular (800 x 800 pixels) area of interest was marked from the centre part of each image. From this area a mean gray value was calculated. This value relates to density but as stated earlier was not calibrated. This calibration would have had many variables i.e. different material properties, many mixtures, gap widening etc. that it was considered too time consuming to do within the scope of this study where the X-ray imaging was only one part of analysis. These gray values were however roughly compared to the bulk density values and they gave a good correlation. This was done by sorting the bulk density measurement data from lowest to highest
19
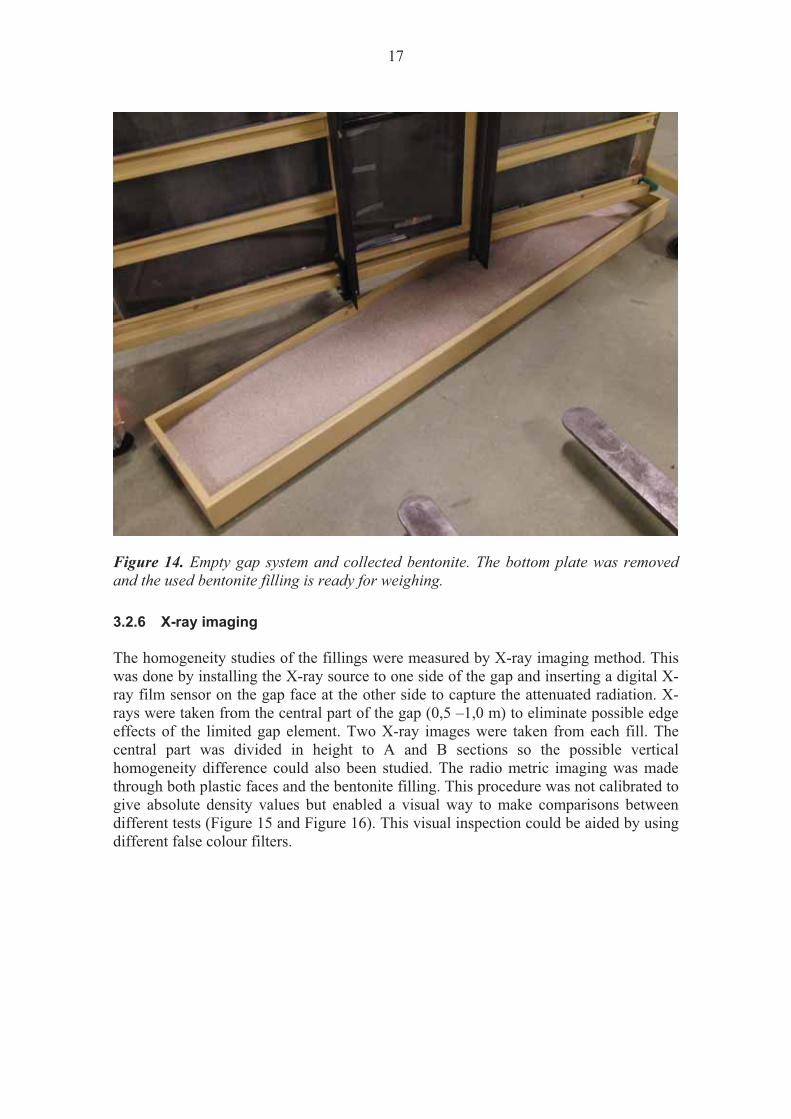
density and comparing it to list sorted by gray values. They give approximately the same order (see section 5.4.6). For each area of interest the standard deviation related to the each gray value calculation was also studied. This relates to the homogeneity of the fill. The basic idea of using the standard deviation is that it defines the variations around the mean value. If these variations are widely spread out then they indicate uneven density distribution and if they are close together then the filling proves to be more homogeneous. Also each area of interest was divided to four smaller sections and the same calculations were made for these sections to give more information about the properties of each fill (Figure 17).
Figure 17. The areas of interest were divided to smaller sections for further analysis. Left image (marked B) was taken from upper part of the fill and right image (marked A) was directly below it from Minelco free fall pouring filling.
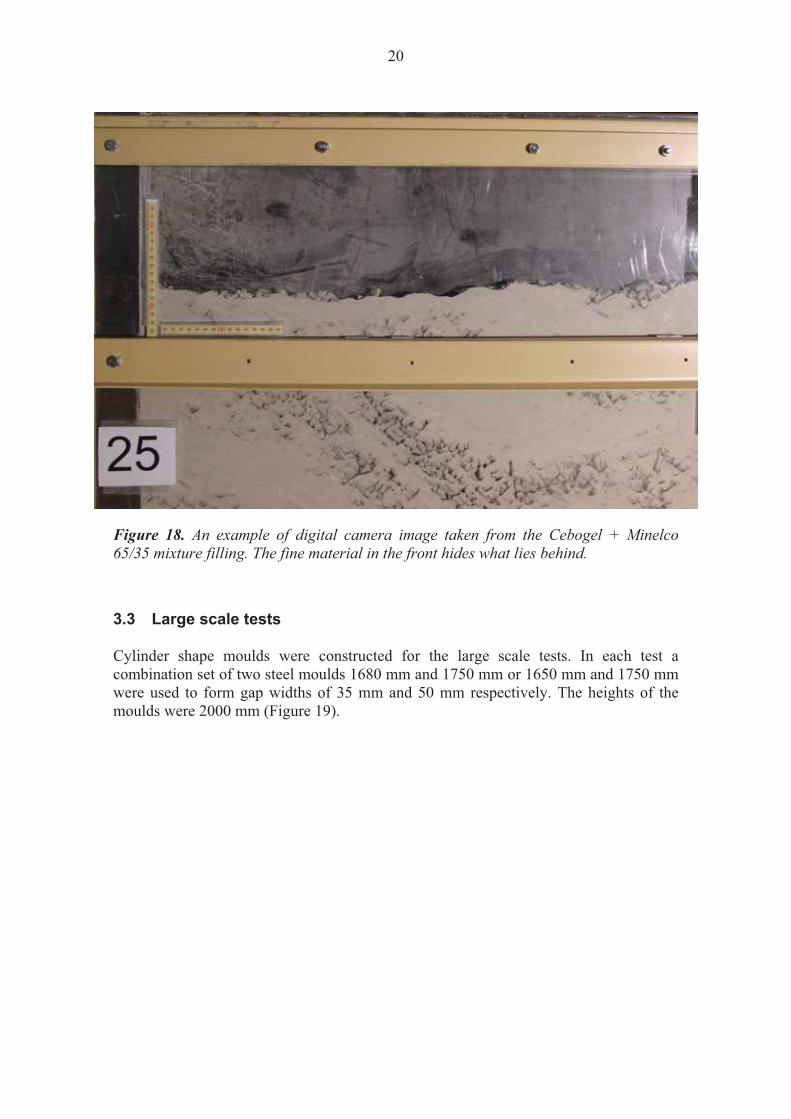
Visual inspection of the bentonite fillings can also be made from images taken by regular digital camera through the Plexiglas front surface. The difference is that especially with bentonite material which has small grain size the fine material can be in the front part or it sticks easily to the window so one cannot be sure what lies behind it (Figure 18). This issue did not affect the radio metric X-ray imaging since it shows the total attenuation caused by the filling.
20
Figure 18. An example of digital camera image taken from the Cebogel + Minelco 65/35 mixture filling. The fine material in the front hides what lies behind.
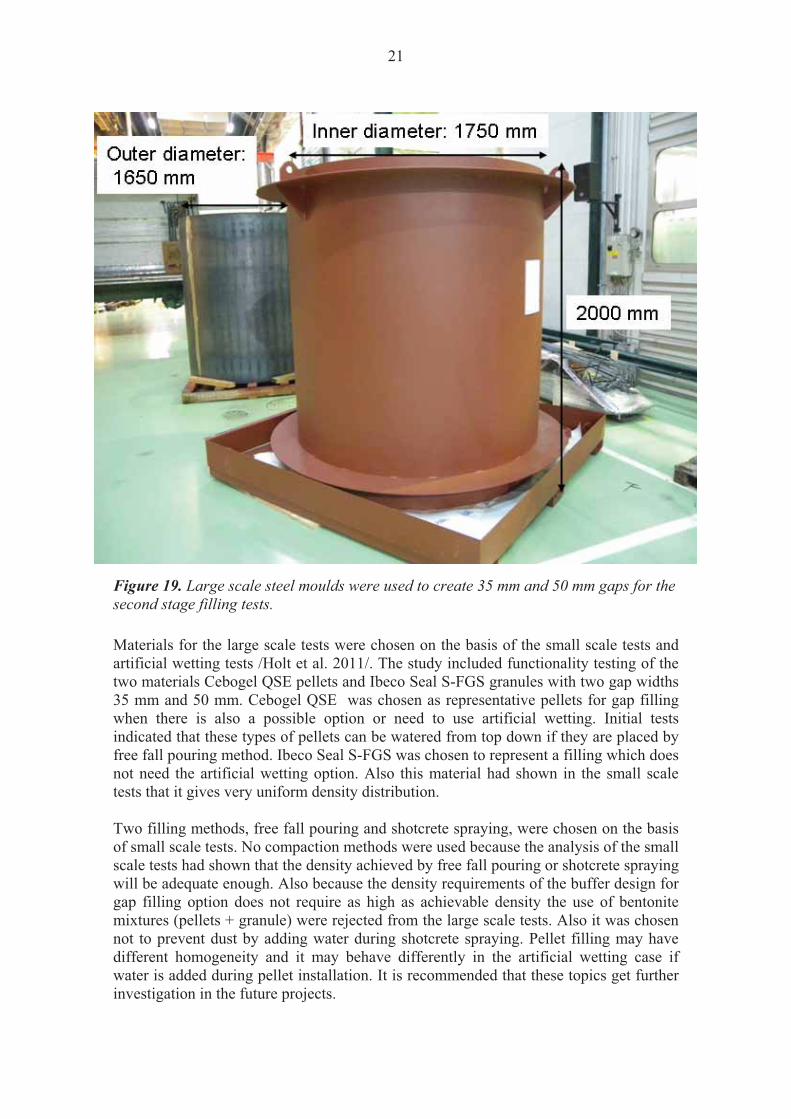
3.3 Large scale tests Cylinder shape moulds were constructed for the large scale tests. In each test a combination set of two steel moulds 1680 mm and 1750 mm or 1650 mm and 1750 mm were used to form gap widths of 35 mm and 50 mm respectively. The heights of the moulds were 2000 mm (Figure 19).
21
Figure 19. Large scale steel moulds were used to create 35 mm and 50 mm gaps for the second stage filling tests.
Materials for the large scale tests were chosen on the basis of the small scale tests and artificial wetting tests /Holt et al. 2011/. The study included functionality testing of the two materials Cebogel QSE pellets and Ibeco Seal S-FGS granules with two gap widths 35 mm and 50 mm. Cebogel QSE was chosen as representative pellets for gap filling when there is also a possible option or need to use artificial wetting. Initial tests indicated that these types of pellets can be watered from top down if they are placed by free fall pouring method. Ibeco Seal S-FGS was chosen to represent a filling which does not need the artificial wetting option. Also this material had shown in the small scale tests that it gives very uniform density distribution. Two filling methods, free fall pouring and shotcrete spraying, were chosen on the basis of small scale tests. No compaction methods were used because the analysis of the small scale tests had shown that the density achieved by free fall pouring or shotcrete spraying will be adequate enough. Also because the density requirements of the buffer design for gap filling option does not require as high as achievable density the use of bentonite mixtures (pellets + granule) were rejected from the large scale tests. Also it was chosen not to prevent dust by adding water during shotcrete spraying. Pellet filling may have different homogeneity and it may behave differently in the artificial wetting case if water is added during pellet installation. It is recommended that these topics get further investigation in the future projects.

22
3.3.1 Measurements In the large scale test the steel moulds were considered to be rigid enough so that there would not be any significant volume change because of the filling. When compared to the small scale test, the mould material was different and also no compaction methods were used so there was very small risk that the gaps would get wider during the tests. No X-ray measurements were taken from the large scale tests. The small scale results had provided enough information from the chosen material and also because the cylinder shape and metal material would have been more challenging to work with. To calculate density achieved in each test the height of the filling was to be measured. The measuring method used was a Bluetooth data transferring laser distance metering unit (Leica Disto) applied from the top of the mould. Readings were taken from 22 different places to create discrete volume sections (Figure 20). The average og two adjacent readings was used to define each section's height.
Figure 20. The gap was divided to discrete volume sections for analysis. This image visualizes the actual measured shotcrete spraying test's Cebogel QSE pellets height data for 50 mm gap.
After the height measurements were taken the cylinders were removed from the bottom plate. The bentonite and the bottom plate were then weighed with a crane mounted load cell (Figure 21).

23
Figure 21. The weighing of the Ibeco Seal S-FGS granules after large scale test with load cell attached to crane.

24
25
4 MATERIALS
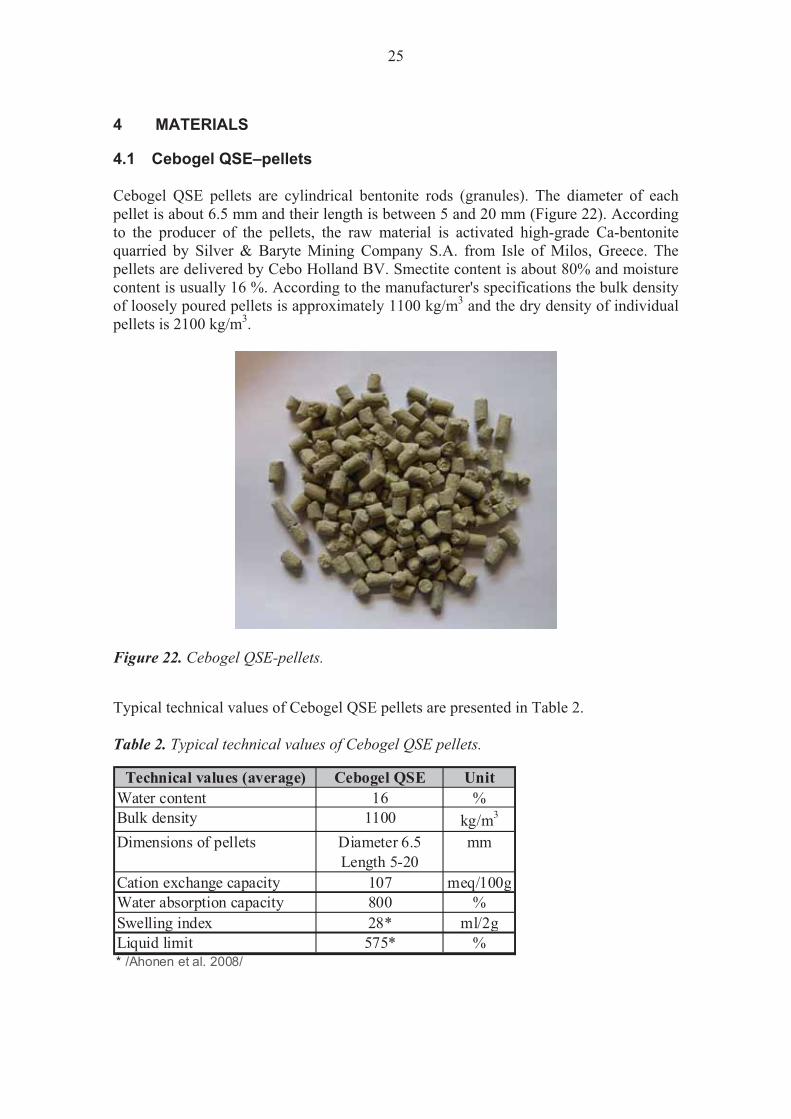
4.1 Cebogel QSE–pellets Cebogel QSE pellets are cylindrical bentonite rods (granules). The diameter of each pellet is about 6.5 mm and their length is between 5 and 20 mm (Figure 22). According to the producer of the pellets, the raw material is activated high-grade Ca-bentonite quarried by Silver & Baryte Mining Company S.A. from Isle of Milos, Greece. The pellets are delivered by Cebo Holland BV. Smectite content is about 80% and moisture content is usually 16 %. According to the manufacturer's specifications the bulk density of loosely poured pellets is approximately 1100 kg/m3 and the dry density of individual pellets is 2100 kg/m3.
Figure 22. Cebogel QSE-pellets.
Typical technical values of Cebogel QSE pellets are presented in Table 2. Table 2. Typical technical values of Cebogel QSE pellets.
Technical values (average) Cebogel QSE UnitWater content 16 %Bulk density 1100 kg/m3
Diameter 6.5 Length 5-20
Cation exchange capacity 107 meq/100gWater absorption capacity 800 %Swelling index 28* ml/2gLiquid limit 575* %* /Ahonen et al. 2008/
Dimensions of pellets mm
26
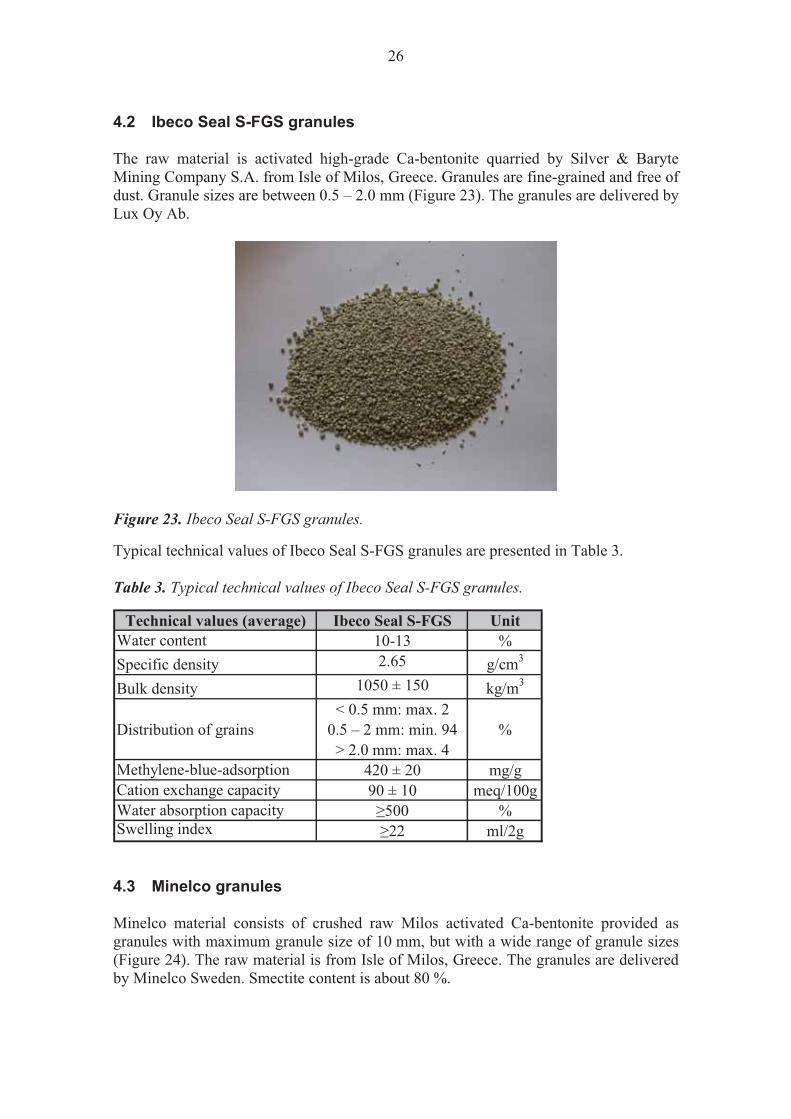
4.2 Ibeco Seal S-FGS granules The raw material is activated high-grade Ca-bentonite quarried by Silver & Baryte Mining Company S.A. from Isle of Milos, Greece. Granules are fine-grained and free of dust. Granule sizes are between 0.5 – 2.0 mm (Figure 23). The granules are delivered by Lux Oy Ab.
Figure 23. Ibeco Seal S-FGS granules.
Typical technical values of Ibeco Seal S-FGS granules are presented in Table 3. Table 3. Typical technical values of Ibeco Seal S-FGS granules.
Technical values (average) Ibeco Seal S-FGS UnitWater content 10-13 %Specific density 2.65 g/cm3
Bulk density 1050 ± 150 kg/m3
< 0.5 mm: max. 2Distribution of grains 0.5 – 2 mm: min. 94 %
> 2.0 mm: max. 4Methylene-blue-adsorption 420 ± 20 mg/gCation exchange capacity 90 ± 10 meq/100gWater absorption capacity �500 %Swelling index �22 ml/2g
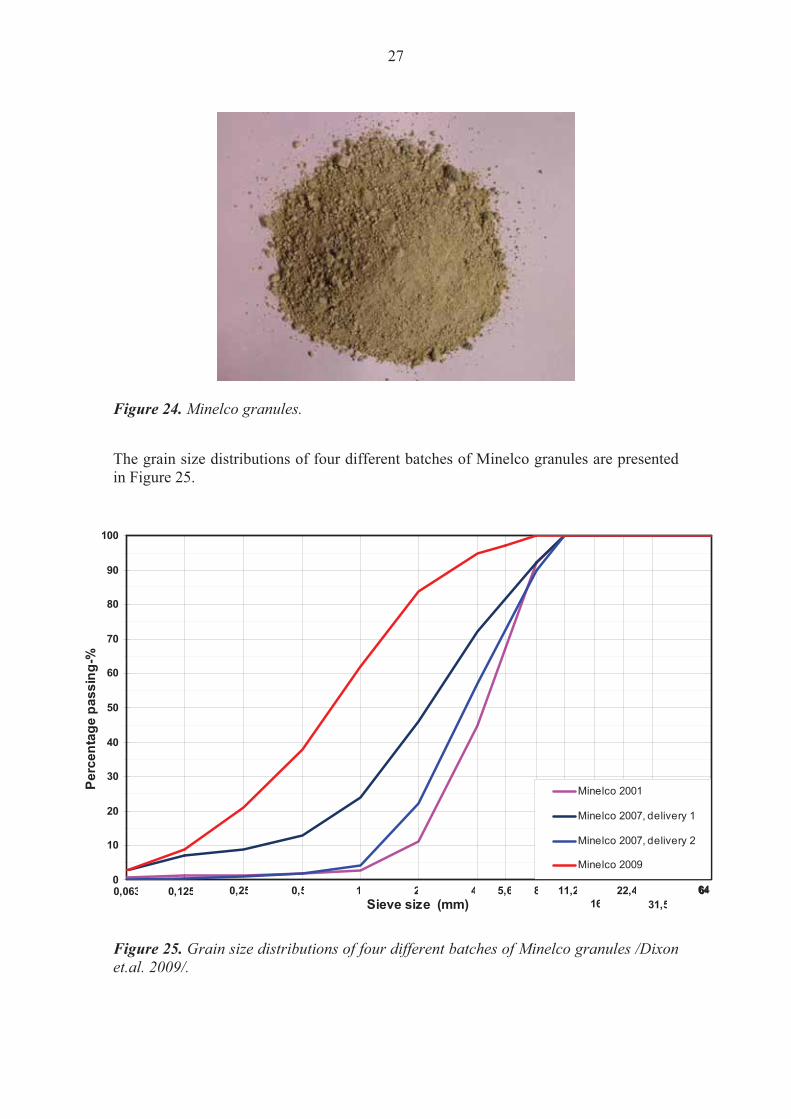
4.3 Minelco granules Minelco material consists of crushed raw Milos activated Ca-bentonite provided as granules with maximum granule size of 10 mm, but with a wide range of granule sizes (Figure 24). The raw material is from Isle of Milos, Greece. The granules are delivered by Minelco Sweden. Smectite content is about 80 %.
27
Figure 24. Minelco granules.
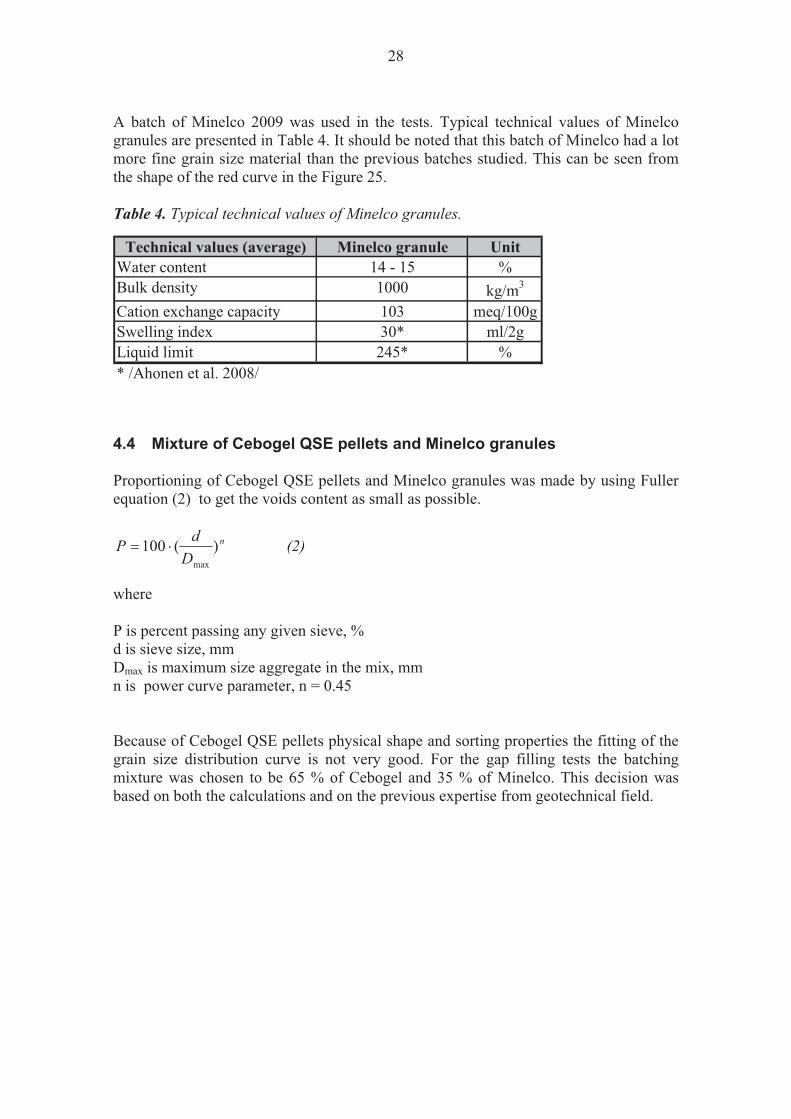
The grain size distributions of four different batches of Minelco granules are presented in Figure 25.
0,125 0,25 0,5 1 2 4 5,6 8 11,2 16
22,4 31,5
6464 0,0630
10
20
30
40
50
60
70
80
90
100
Sieve size (mm)
Perc
enta
ge p
assi
ng-%
Minelco 2001
Minelco 2007, delivery 1
Minelco 2007, delivery 2
Minelco 2009
Figure 25. Grain size distributions of four different batches of Minelco granules /Dixon et.al. 2009/.
28
A batch of Minelco 2009 was used in the tests. Typical technical values of Minelco granules are presented in Table 4. It should be noted that this batch of Minelco had a lot more fine grain size material than the previous batches studied. This can be seen from the shape of the red curve in the Figure 25. Table 4. Typical technical values of Minelco granules.
Technical values (average) Minelco granule UnitWater content 14 - 15 %Bulk density 1000 kg/m3
Cation exchange capacity 103 meq/100gSwelling index 30* ml/2gLiquid limit 245* %* /Ahonen et al. 2008/
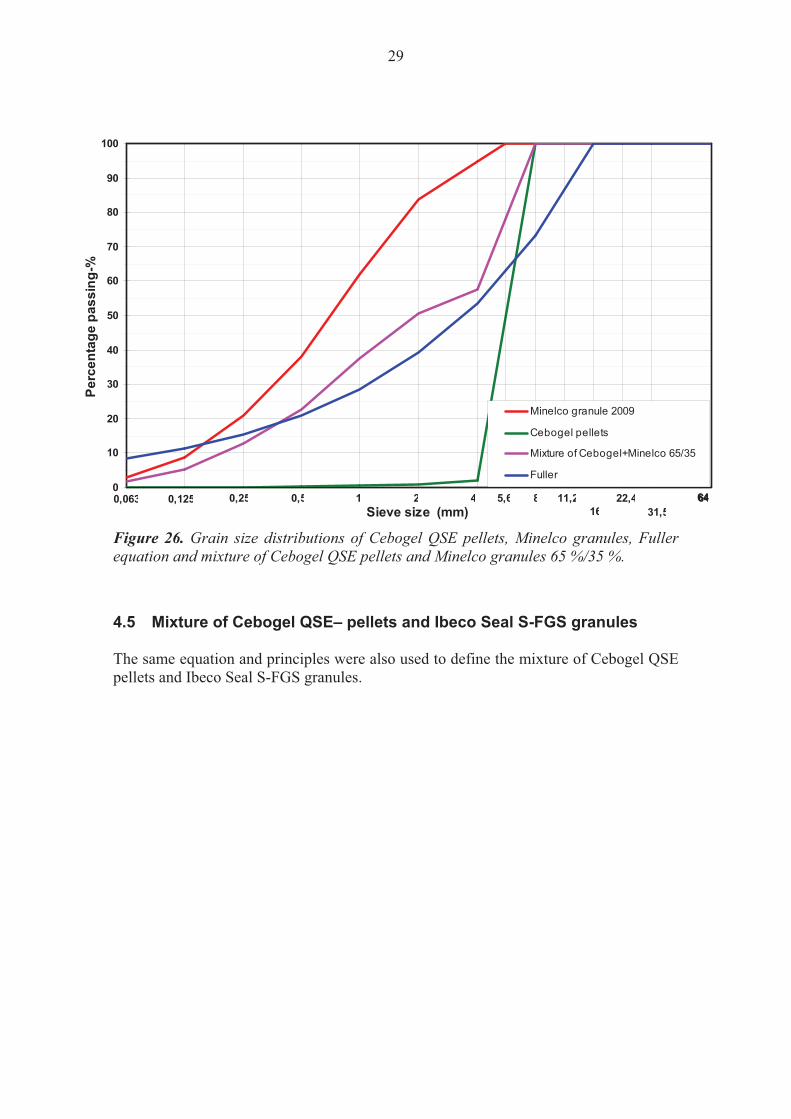
4.4 Mixture of Cebogel QSE pellets and Minelco granules Proportioning of Cebogel QSE pellets and Minelco granules was made by using Fuller equation (2) to get the voids content as small as possible.
n
DdP )(100max
� (2)
where P is percent passing any given sieve, % d is sieve size, mm Dmax is maximum size aggregate in the mix, mm n is power curve parameter, n = 0.45 Because of Cebogel QSE pellets physical shape and sorting properties the fitting of the grain size distribution curve is not very good. For the gap filling tests the batching mixture was chosen to be 65 % of Cebogel and 35 % of Minelco. This decision was based on both the calculations and on the previous expertise from geotechnical field.
29
0,125 0,25 0,5 1 2 4 5,6 8 11,2 16
22,4 31,5
6464 0,0630
10
20
30
40
50
60
70
80
90
100
Sieve size (mm)
Perc
enta
ge p
assi
ng-%
Minelco granule 2009
Cebogel pellets
Mixture of Cebogel+Minelco 65/35
Fuller
Figure 26. Grain size distributions of Cebogel QSE pellets, Minelco granules, Fuller equation and mixture of Cebogel QSE pellets and Minelco granules 65 %/35 %.
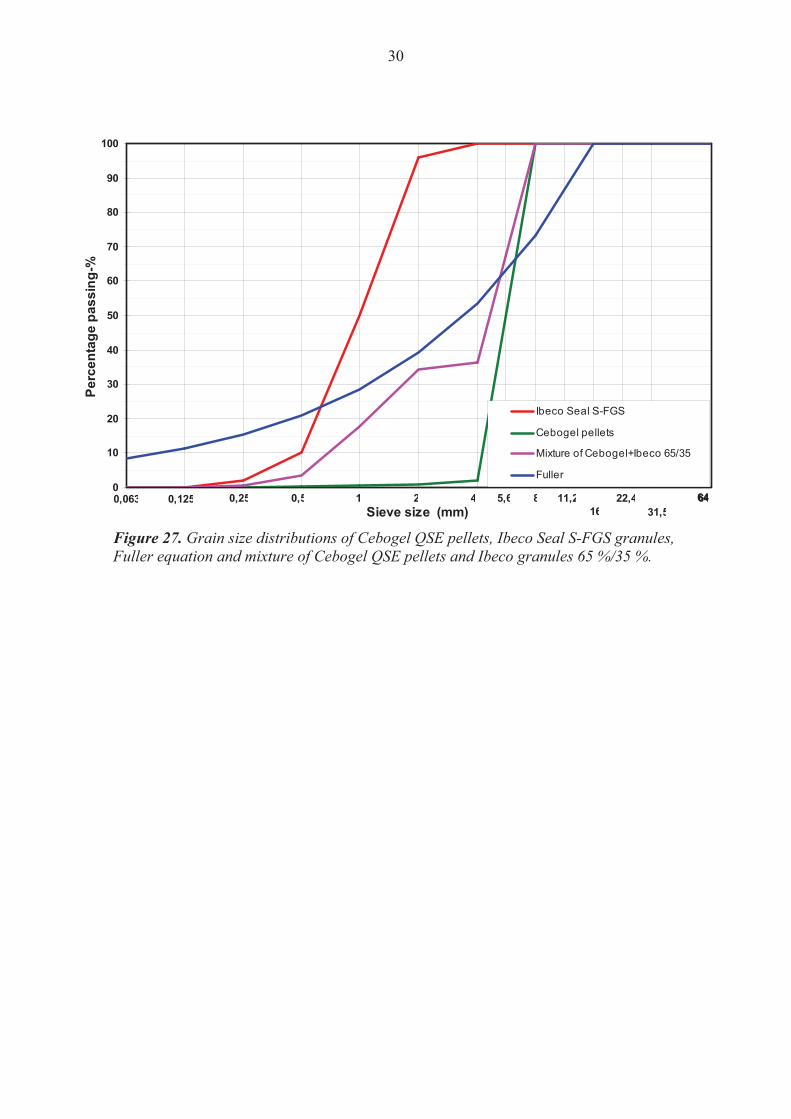
4.5 Mixture of Cebogel QSE– pellets and Ibeco Seal S-FGS granules The same equation and principles were also used to define the mixture of Cebogel QSE pellets and Ibeco Seal S-FGS granules.
30
0,125 0,25 0,5 1 2 4 5,6 8 11,2 16
22,4 31,5
6464 0,0630
10
20
30
40
50
60
70
80
90
100
Sieve size (mm)
Perc
enta
ge p
assi
ng-%
Ibeco Seal S-FGS
Cebogel pellets
Mixture of Cebogel+Ibeco 65/35
Fuller
Figure 27. Grain size distributions of Cebogel QSE pellets, Ibeco Seal S-FGS granules, Fuller equation and mixture of Cebogel QSE pellets and Ibeco granules 65 %/35 %.

31
5 RESULTS OF THE SMALL SCALE GAP FILLING TESTS
5.1 Test methods The three main methods used in small scale test were free fall pouring, thin layer filling and compaction and shotcrete spraying. The compaction techniques used were two types of vibration devices (tube and fork) and the modified Proctor hammer system.
5.2 Free fall pouring and layer filling with compaction The bentonite to be used was weighed and then it was dropped from the top of the gap system by the aid of permanent funnel device. The bentonite could be dropped all at once or in a smaller volumes. The mixtures were prepared at the time of weighing with the aid of a scale to ensure the correct mixture ratio. These mixtures were done in 10 litre batches. When the test scenario included compaction the gap system was first filled with 150 mm bentonite or mixture layer which was then processed with selected compaction technique. In the case of modified Proctor hammer it was used for the whole breadth of the gap system in 200 mm sections. With the vibration devices, certain amount of vibration time was applied to each layer section and the device was moved in the horizontal direction until the whole width of the gap system hade been compacted.
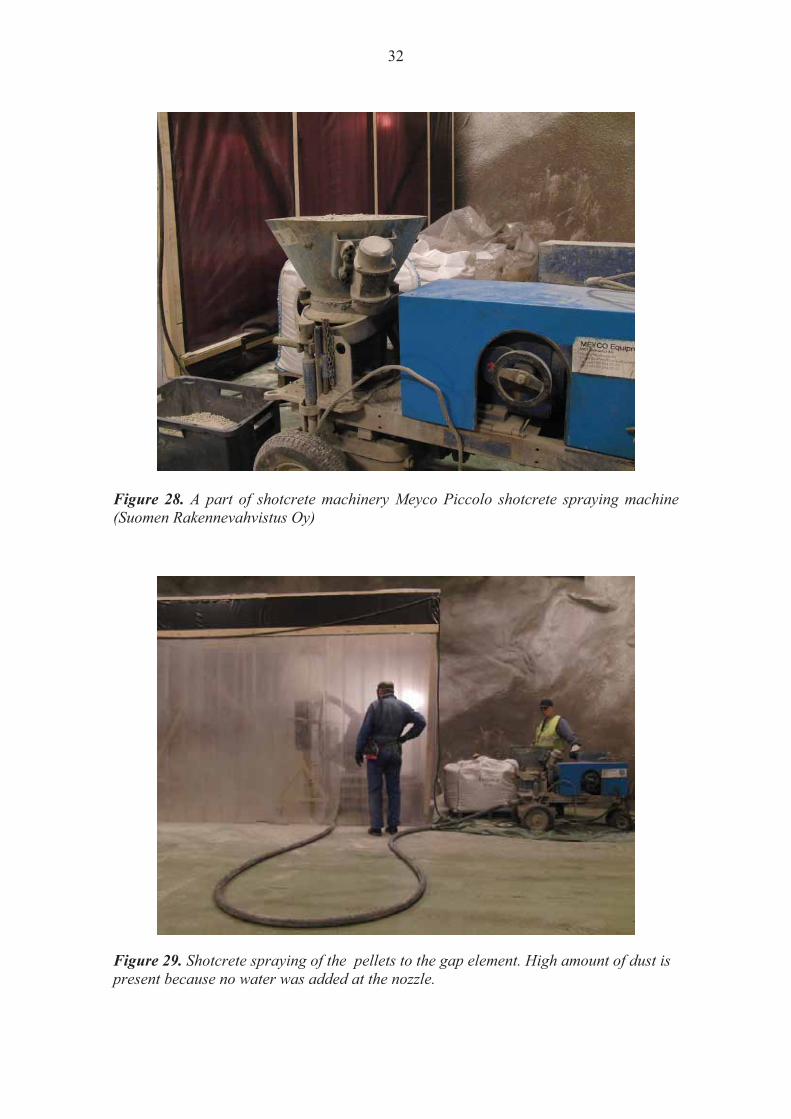
5.3 Shotcrete spraying The pellets and granules were sprayed by Suomen Rakennevahvistus Oy with shotcrete machinery. This system's main components are Meyco Piccola shotcrete spraying unit and Mobilair M80 air compressor. The shotcrete spraying unit is equipped with a hopper to feed the shotcrete spraying material and revolving nine hole rotor which can be run at variable speeds. The tests were performed without water as stated earlier. The pressure used in shotcrete spraying was 125 kPa and in comparison in the Posiva's backfill tests the pressures were between 240 – 300 kPa /Riikonen 2009/.
32
Figure 28. A part of shotcrete machinery Meyco Piccolo shotcrete spraying machine (Suomen Rakennevahvistus Oy)
Figure 29. Shotcrete spraying of the pellets to the gap element. High amount of dust is present because no water was added at the nozzle.
33
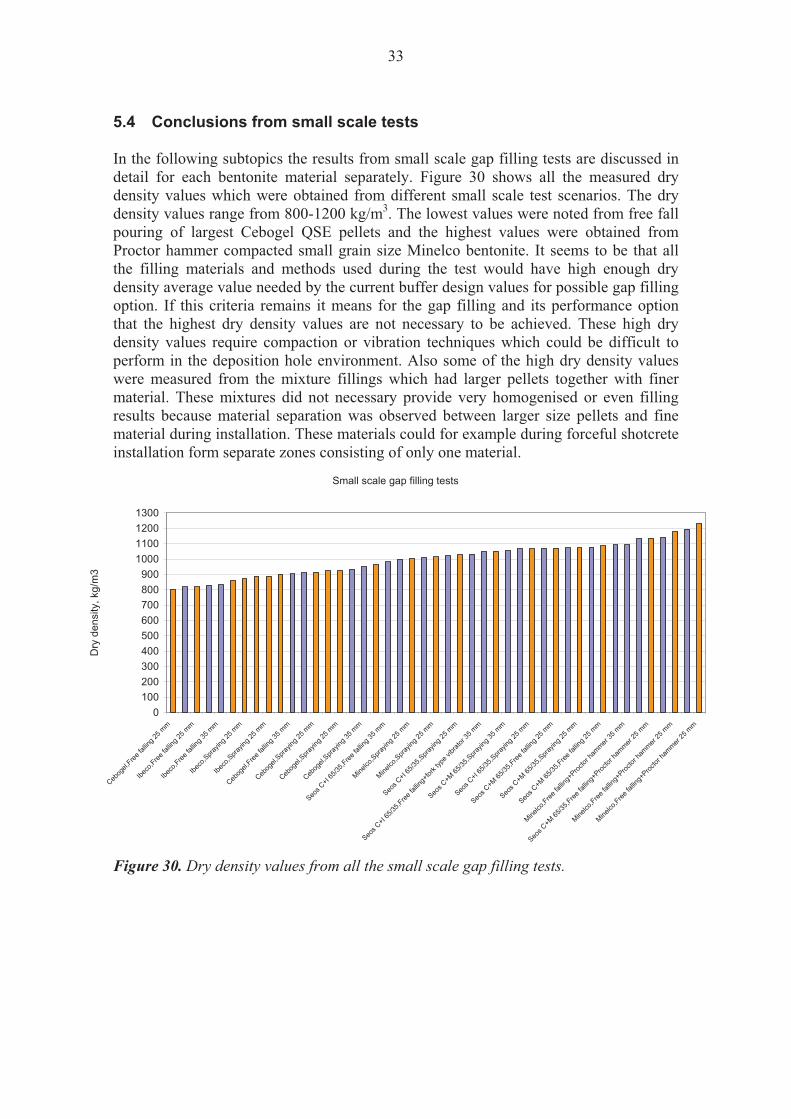
5.4 Conclusions from small scale tests In the following subtopics the results from small scale gap filling tests are discussed in detail for each bentonite material separately. Figure 30 shows all the measured dry density values which were obtained from different small scale test scenarios. The dry density values range from 800-1200 kg/m3. The lowest values were noted from free fall pouring of largest Cebogel QSE pellets and the highest values were obtained from Proctor hammer compacted small grain size Minelco bentonite. It seems to be that all the filling materials and methods used during the test would have high enough dry density average value needed by the current buffer design values for possible gap filling option. If this criteria remains it means for the gap filling and its performance option that the highest dry density values are not necessary to be achieved. These high dry density values require compaction or vibration techniques which could be difficult to perform in the deposition hole environment. Also some of the high dry density values were measured from the mixture fillings which had larger pellets together with finer material. These mixtures did not necessary provide very homogenised or even filling results because material separation was observed between larger size pellets and fine material during installation. These materials could for example during forceful shotcrete installation form separate zones consisting of only one material.
Small scale gap filling tests
0100200300400500600700800900
1000110012001300
Cebog
el,Free
fallin
g 25 m
m
Ibeco
,Free fa
lling 2
5 mm
Ibeco
,Free fa
lling 3
5 mm
Ibeco
,Spra
ying 2
5 mm
Ibeco
,Spra
ying 2
5 mm
Cebog
el,Free
fallin
g 35 m
m
Cebog
el,Spra
ying 2
5 mm
Cebog
el,Spra
ying 2
5 mm
Cebog
el,Spra
ying 3
5 mm
Seos C
+I 65
/35,Free
fallin
g 35 m
m
Minelco
,Sprayin
g 25 m
m
Minelco
,Sprayin
g 25 m
m
Seos C
+I 65/3
5,Spra
ying 2
5 mm
Seos C
+I 65
/35,Free
fallin
g+for
k typ
e vibr
ator 3
5 mm
Seos C
+M 65
/35,Spra
ying 3
5 mm
Seos C
+I 65
/35,S
prayin
g 25 m
m
Seos C
+M 65
/35,Free
fallin
g 25 m
m
Seos C
+M 65
/35,Spra
ying 2
5 mm
Seos C
+M 65
/35,Free
fallin
g 25 m
m
Minelco
,Free fa
lling+
Proctor
hammer
35 m
m
Seos C
+M 65
/35,Free
fallin
g+Proc
tor ha
mmer 25
mm
Minelco
,Free fa
lling+
Proctor
hammer
25 m
m
Minelco
,Free fa
lling+
Proctor
hammer
25 m
m
Dry
den
sity
, kg/
m3
Figure 30. Dry density values from all the small scale gap filling tests.

34
25 mm gap, maximum achieved dry density (free falling/spraying)
800850900950
1000105011001150120012501300
Cebog
el,Free
fallin
g
Ibeco
,Free fa
lling
Ibeco
,Free fa
lling
Ibeco
,Spra
ying
Mixture
C+I 6
5/35,F
ree fa
lling
Ibeco
,Spra
ying
Cebog
el,Free
fallin
g
Cebog
el,Spra
ying
Cebog
el,Spra
ying
Cebog
el,Spra
ying
Minelco
,Free fa
lling
Minelco
,Spra
ying
Minelco
,Spra
ying
Mixture
C+I 6
5/35,S
prayin
g
Mixture
C+M
65/35
,Sprayin
g
Mixture
C+I
65/35
,Spra
ying
Mixture
C+M 65
/35,Free
fallin
g
Mixture
C+M
65/35
,Sprayin
g
Mixture
C+M 65
/35,Free
fallin
g
Mixture
C+M 65
/35,Free
fallin
g+Proc
tor ha
mmer
Minelco
,Free fa
lling+
Proctor
hammer
Minelco
,Free fa
lling+
Proctor
hammer
Dry
den
sity
, kg/
m3
IbecoCebogel
Minelco
Cebogel+Minelco, mixture 65/35Cebogel+Ibeco, mixture 65/35
Cebogel+Minelco, mixture 65/35, compaction
Minelco, compaction
Figure 31. The maximum dry density values from 25 mm gap filling tests.
35 mm gap, maximum achieved dry density (free falling/spraying)
800850900950
1000105011001150120012501300
Cebog
el,Free
fallin
g
Ibeco
,Free fa
lling
Ibeco
,Free fa
lling
Cebog
el,Free
fallin
g
Ibeco
,Spra
ying
Ibeco
,Spra
ying
Cebog
el,Spra
ying
Mixture
C+I
65/35
,Free fa
lling
Cebog
el,Spra
ying
Minelco
,Spra
ying
Minelco
,Spra
ying
Minelco
,Free fa
lling
Mixture
C+I
65/35
,Free fa
lling+
fork t
ype v
ibrato
r
Mixture
C+M 65
/35,Spra
ying
Mixture
C+M 65
/35,Free
fallin
g
Mixture
C+I
65/35
,Spra
ying
Mixture
C+M
65/35
,Sprayin
g
Mixture
C+I
65/35
,Spra
ying
Minelco
,Free fa
lling+
Proctor
hammer
Minelco
,Free fa
lling+
Proctor
hammer
Mixture
C+M 65
/35,Free
fallin
g+for
k typ
e vibr
ator
Mixture
C+M 65
/35,Free
fallin
g
Mixture
C+M 65
/35,Free
fallin
g+vib
rator
Dry
den
sity
, kg/
m3
Ibeco
CebogelMinelco
Cebogel+Minelco, mixture 65/35
Cebogel+Ibeco, mixture 65/35
Cebogel+Minelco, mixture 65/35, compaction
Minelco, compaction
Figure 32. The maximum dry density values from 35 mm gap filling tests.

35
5.4.1 Cebogel QSE pellets Test with Cebogel QSE pellets had dry density values in range of 800-1000 kg/m3 depending on the installation method. When methods are compared against each other the shotcrete spraying provided a higher dry density values than free fall pouring method. Also it was noticed that the shotcrete spraying method gave approximately 5 % higher density when it was performed to a 35 mm wide gap than to a 25 mm gap.
Figure 33. Dry density values from Cebogel QSE pellets free fall pouring and shotcrete spraying tests.
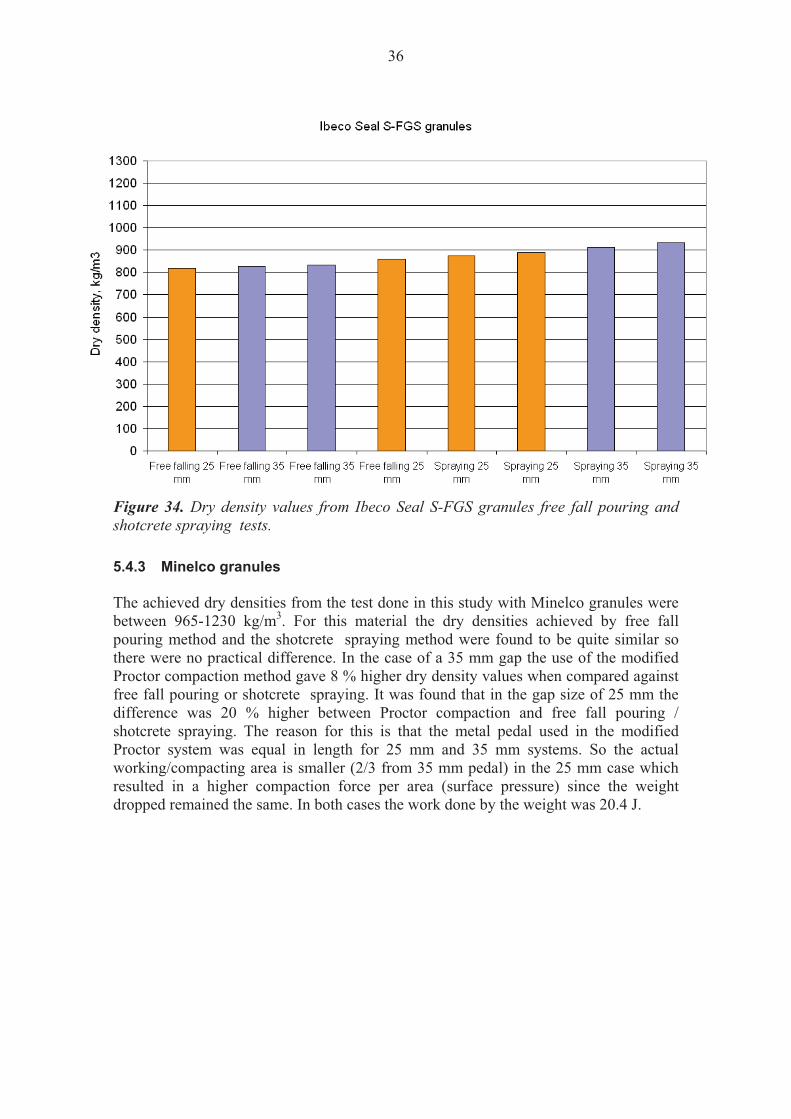
5.4.2 Ibeco Seal S-FGS Tests with Ibeco Seal S-FGS granules had dry density values in range of 820-935 kg/m3 depending on the installation method. When Ibeco Seal S-FGS was sprayed to a 25 mm gap it gave 5 % higher dry density values when compared to the free fall pouring method. In the case of a 35 mm gap the dry density difference was +10 % in favour of shotcrete spraying when again compared to the free fall pouring method.
36
Figure 34. Dry density values from Ibeco Seal S-FGS granules free fall pouring and shotcrete spraying tests.
5.4.3 Minelco granules The achieved dry densities from the test done in this study with Minelco granules were between 965-1230 kg/m3. For this material the dry densities achieved by free fall pouring method and the shotcrete spraying method were found to be quite similar so there were no practical difference. In the case of a 35 mm gap the use of the modified Proctor compaction method gave 8 % higher dry density values when compared against free fall pouring or shotcrete spraying. It was found that in the gap size of 25 mm the difference was 20 % higher between Proctor compaction and free fall pouring / shotcrete spraying. The reason for this is that the metal pedal used in the modified Proctor system was equal in length for 25 mm and 35 mm systems. So the actual working/compacting area is smaller (2/3 from 35 mm pedal) in the 25 mm case which resulted in a higher compaction force per area (surface pressure) since the weight dropped remained the same. In both cases the work done by the weight was 20.4 J.

37
Figure 35. Dry density values from Minelco granules free fall pouring, compaction and shotcrete spraying tests.
5.4.4 Cebogel QSE pellets + Ibeco Seal S-FGS 65/35 mixture The achieved dry densities from the test done in this study with a mixture of Cebogel QSE pellets and Ibeco granules were between 890-1080 kg/m3. With this mixture the shotcrete spraying method produced higher dry density values than free fall pouring method in both gap sizes. Also when the 25 mm gap and 35 mm gap are both filled by shotcrete spraying the 35 mm gap gave about 2.5 % higher dry density values. When shotcrete spraying was used the separation of the two components could be seen in the fillings.

38
Figure 36. Dry density values from Cebogel QSE pellets+ Ibeco Seal S-FGS granules mixture (65/35) free fall pouring, compaction and shotcrete spraying tests.
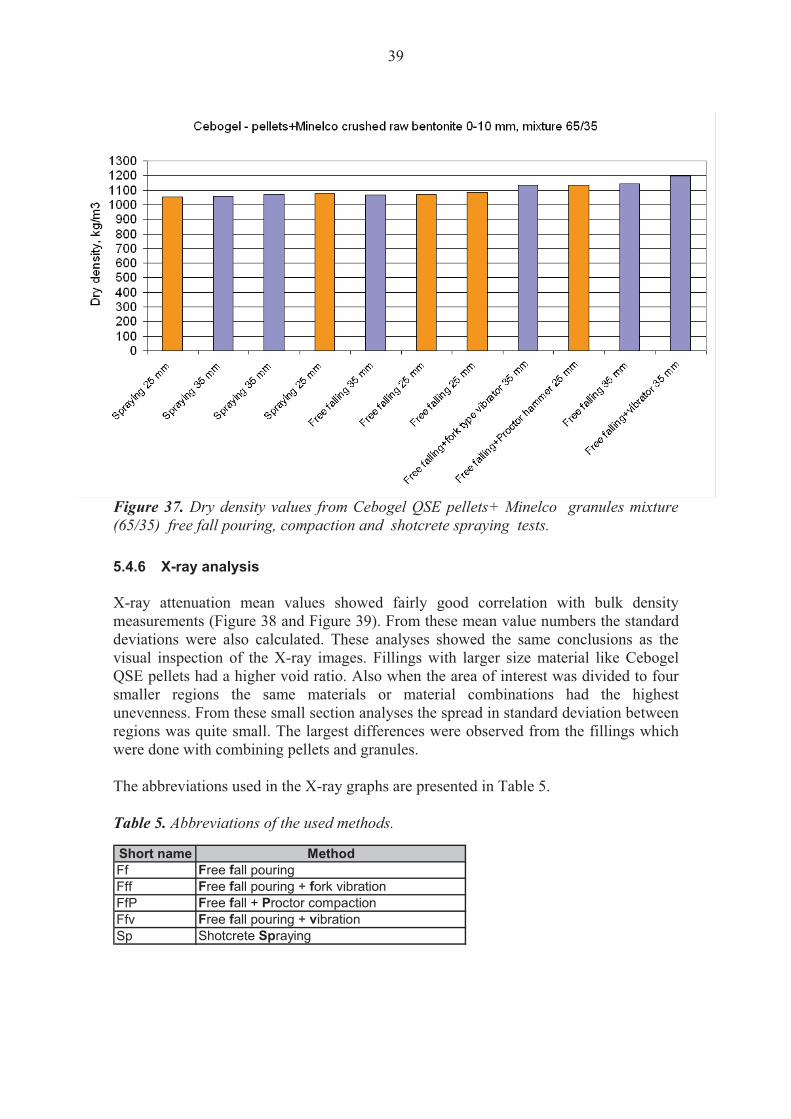
5.4.5 Cebogel QSE pellets + Minelco crushed aggregate 65/35 mixture The achieved dry densities from the test done in this study with a mixture of Cebogel QSE pellets and Minelco crushed aggregate were between 1050-1200 kg/m3. With this mixture both the shotcrete spraying method and the free fall pouring methods produced about the same dry density values. In some case the free fall pouring method was found to result slightly higher values. The highest dry density value was achieved by the combination of layer technique (150 mm layers) and compaction by vibrating. When shotcrete spraying was used the separation of the two components could also be seen in the fillings.
39
Figure 37. Dry density values from Cebogel QSE pellets+ Minelco granules mixture (65/35) free fall pouring, compaction and shotcrete spraying tests.
5.4.6 X-ray analysis X-ray attenuation mean values showed fairly good correlation with bulk density measurements (Figure 38 and Figure 39). From these mean value numbers the standard deviations were also calculated. These analyses showed the same conclusions as the visual inspection of the X-ray images. Fillings with larger size material like Cebogel QSE pellets had a higher void ratio. Also when the area of interest was divided to four smaller regions the same materials or material combinations had the highest unevenness. From these small section analyses the spread in standard deviation between regions was quite small. The largest differences were observed from the fillings which were done with combining pellets and granules. The abbreviations used in the X-ray graphs are presented in Table 5. Table 5. Abbreviations of the used methods.
Short name MethodFf Free fall pouringFff Free fall pouring + fork vibrationFfP Free fall + Proctor compactionFfv Free fall pouring + vibrationSp Shotcrete Spraying

40
35mm gap xray data (mean)
0
10
20
30
40
50
60
70
80
Mix C+M
Ffv
B
Mix C+M
Ffv
A
Minelco
FfP A
Minelco
FfP B
Mix C+M
Fff A
Mix C+M
Fff B
Mix C+M
Ff B
Minelco
Ff B
Minelco
FfP A
Mix C+M
Ff A
Minelco
FfP B
Mix C+I
Fff B
Mix C+M
Ff B
Mix C+I
Fff A
Mix C+M
Ff A
Minelco
Sp B
Minelco
Sp A
Mix C+M
Sp A
Mix C+M
Sp B
Minelco
Ff A
Ibeco
Sp B
2
Cebog
el Sp B
Cebog
el Sp A
Ibeco
Sp A
Ibeco
FfP A
Ibeco
FfP B
Gre
y va
lue
Figure 38. X-ray attenuation values from 35 mm gap fillings.
Bulk density (uncorrected volume) 35 mm gap
0
200
400
600
800
1000
1200
1400
1600
Mix C+M
Ffv
Mix C+M
Fff
Mix C+M
Ff
Minelco
FfP
Minelco
FfP
Mix C+M
Sp
Mix C+I
Sp
Mix C+I
Sp
Mix C+I
Fff
Mix C+M
Ff
Mix C+M
Sp
Cebog
elSp
Minelco
Sp
Minelco
Ff
Mix C+I
Ff
Minelco
Sp
Cebog
el Sp
Ibeco
Sp
Ibeco
Sp
Cebog
el Ff
Ibeco
Ff
Ibeco
Ff
Figure 39. Measured bulk density values from 35 mm gap fillings without the volume corrections.
X-ray images were taken from two positions which were labelled A for upper part and B for lower. This was done to enable the investigation of possible vertical density differences created during installation. It is possible that the material placed first in the gap which forms the lowest part of the fill would have slightly higher density. This could also be only related to certain installation methods, for example to free fall pouring where the falling height could be a factor affecting density. Figure 40 shows the

41
X-ray gray values measured from 25 mm gap fillings for the upper and lower regions of interest. For the approximately 1 m in height gap element used in this test there was no significant density difference between vertical positions which could have been measured. The obtained dry density values seem to be in general a little higher in lower A sections though.
0
10
20
30
40
50
60
70
80
Min
elco
FfP
Mix
C+M
Ff
Mix
C+I F
fIb
eco
Ff
Cebo
gel S
p M
inelc
o Sp
M
ix C+
M F
f M
ix C+
M S
p M
ix C+
I Sp
Cebo
gel S
p Ce
boge
l Ff
Min
elco
FfM
inelc
o Ff
P
Gre
y va
lue
25 Lower (A)25 Upper (B)
Figure 40. X-ray gray values from 25 mm gap tests. There was no significant difference between the density values taken from separate vertical positions A or B.
The standard deviations of the mean values were also calculated from the X-ray images from the same areas of interest (Figure 41). The most homogenised fillings were obtained from Minelco and Ibeco Seal S-FGS materials. Both free fall poured and free fall poured + compacted methods seem to give relatively the same standard deviation results. Also the shotcrete spraying gave the small number but there seems to be some difference between lower A and upper B parts. Free fall poured Ibeco Seal S-FGS gave the same homogeneity numbers as its Minelco counterpart. The highest level of unhomogeneity was found from Cebogel QSE pellet fillings. Both the free falling method and the shotcrete spraying seemed to produce about the same numbers. Also the fillings which were made from Cebogel QSE pellets mixed with Ibeco Seal S-FGS or Minelco had almost as high levels of unhomogeneity.
42
0
0.5
1
1.5
2
2.5
3
3.5
4M
inelc
o Ff
PM
ix C+
M F
fM
ix C+
I Ff
Ibec
o Ff
Ce
boge
l Sp
Min
elco
Sp
Mix
C+M
Ff
Mix
C+M
Sp
Mix
C+I S
p Ce
boge
l Sp
Cebo
gel F
fM
inelc
o Ff
Min
elco
FfP
STD
EV 25 Lower (A)25 Upper (B)
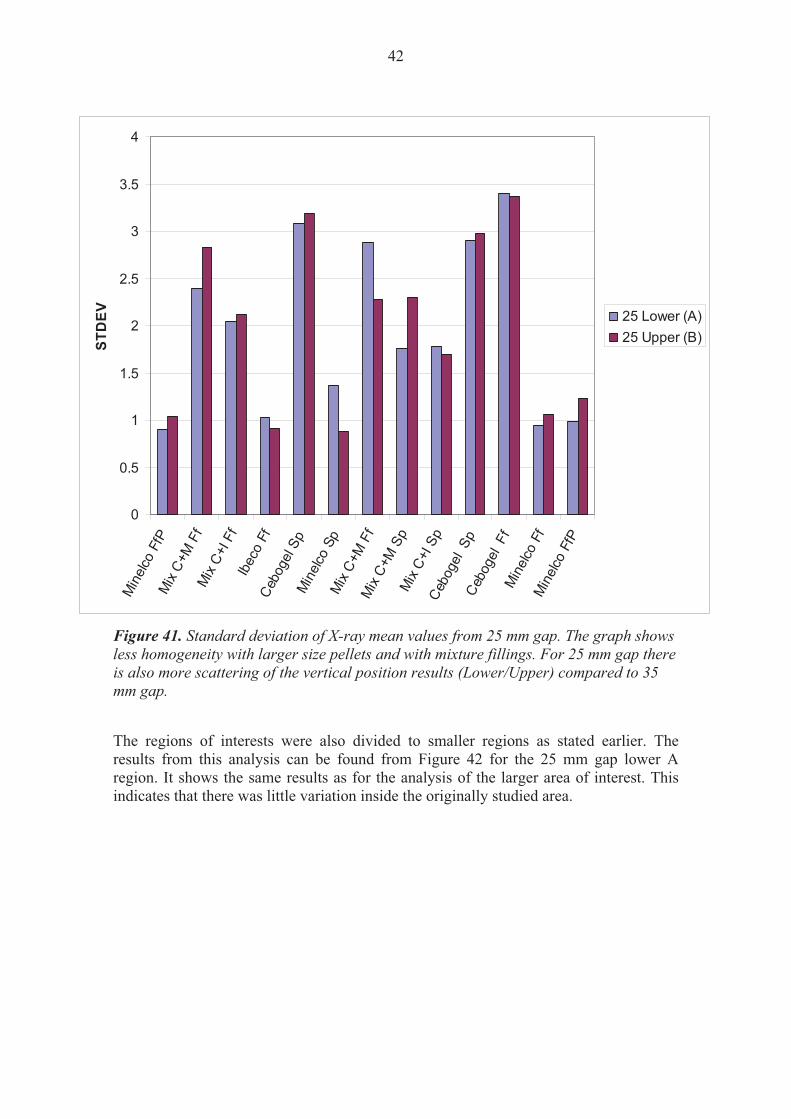
Figure 41. Standard deviation of X-ray mean values from 25 mm gap. The graph shows less homogeneity with larger size pellets and with mixture fillings. For 25 mm gap there is also more scattering of the vertical position results (Lower/Upper) compared to 35 mm gap.
The regions of interests were also divided to smaller regions as stated earlier. The results from this analysis can be found from Figure 42 for the 25 mm gap lower A region. It shows the same results as for the analysis of the larger area of interest. This indicates that there was little variation inside the originally studied area.

43
Figure 42. Standard deviation of X-ray mean values from smaller regions of interest from 25 mm gap lower part (A).
0
0.5
1
1.5
2
2.5
3
3.5
4
Mine
lco F
fPM
ix C+
M F
fM
ix C+
I Ff
Ibec
o Ff
Cebo
gel S
pM
inelco
Sp
Mix
C+M
Ff
Mix
C+M
Sp
Mix
C+I S
p2Ce
boge
l Sp2
Cebo
gel F
fM
inelco
Ff
Mine
lco F
fP
STD
EV
25 B125 B225 B325 B4
Figure 43. Standard deviation of X-ray mean values from smaller regions of interest from 25 mm gap upper part (B).
Figure 43 shows the same information as the previous figure but this time the values were obtained from upper part of the fill. When these graphs are compared there seems to be more deviation of the values with the mixture filling Cebogel QSE + Minelco. This would indicate that the combination is not producing filling of high homogeneity
44
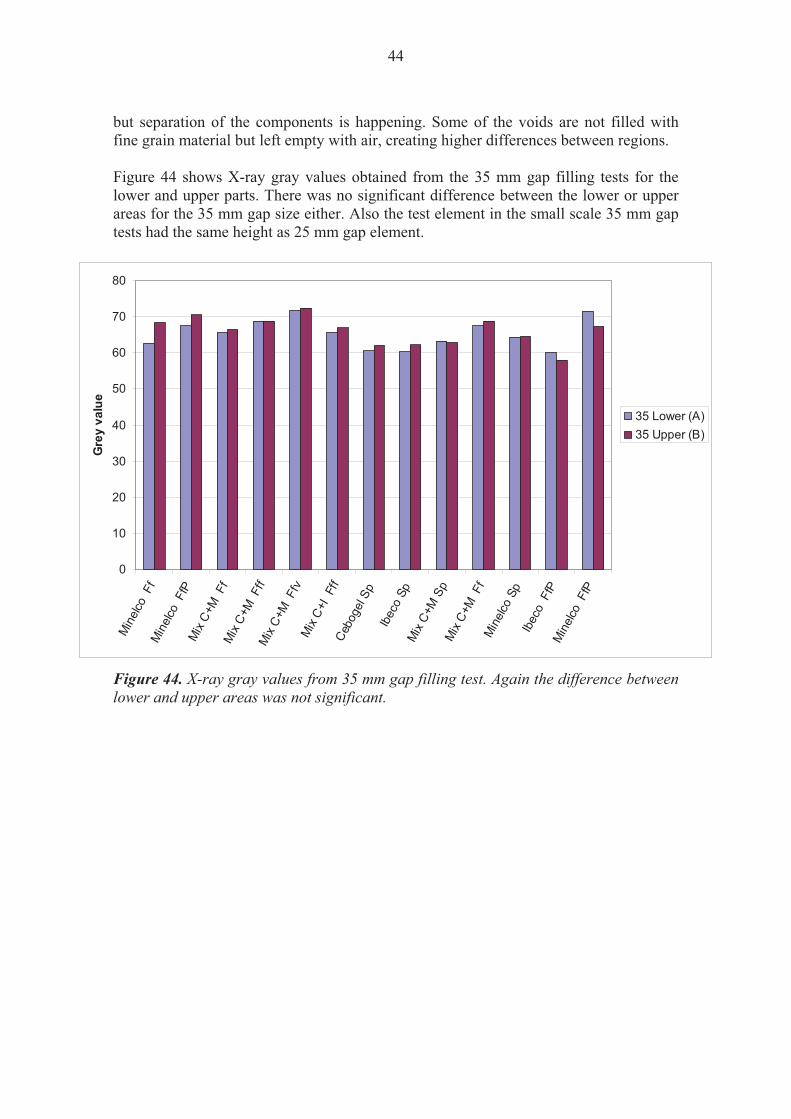
but separation of the components is happening. Some of the voids are not filled with fine grain material but left empty with air, creating higher differences between regions. Figure 44 shows X-ray gray values obtained from the 35 mm gap filling tests for the lower and upper parts. There was no significant difference between the lower or upper areas for the 35 mm gap size either. Also the test element in the small scale 35 mm gap tests had the same height as 25 mm gap element.
0
10
20
30
40
50
60
70
80
Min
elco
Ff
Min
elco
FfP
M
ix C+
M F
f M
ix C+
M F
ff M
ix C+
M F
fv
Mix
C+I
Fff
Cebo
gel S
p Ib
eco
Sp
Mix
C+M
Sp
Mix
C+M
Ff
Min
elco
Sp
Ibec
o F
fP
Min
elco
FfP
Gre
y va
lue
35 Lower (A)35 Upper (B)
Figure 44. X-ray gray values from 35 mm gap filling test. Again the difference between lower and upper areas was not significant.
45
0
0.5
1
1.5
2
2.5
3
3.5
4M
inelc
o F
f M
inelc
o F
fP
Mix
C+M
Ff
Mix
C+M
Fff
Mix
C+M
Ffv
M
ix C+
I Ff
f Ce
boge
l Sp
Ibec
o Sp
M
ix C+
M S
p M
ix C+
M F
f M
inelc
o Sp
Ib
eco
FfP
M
inelc
o F
fP
STD
EV 35 Lower (A)35 Upper (B)
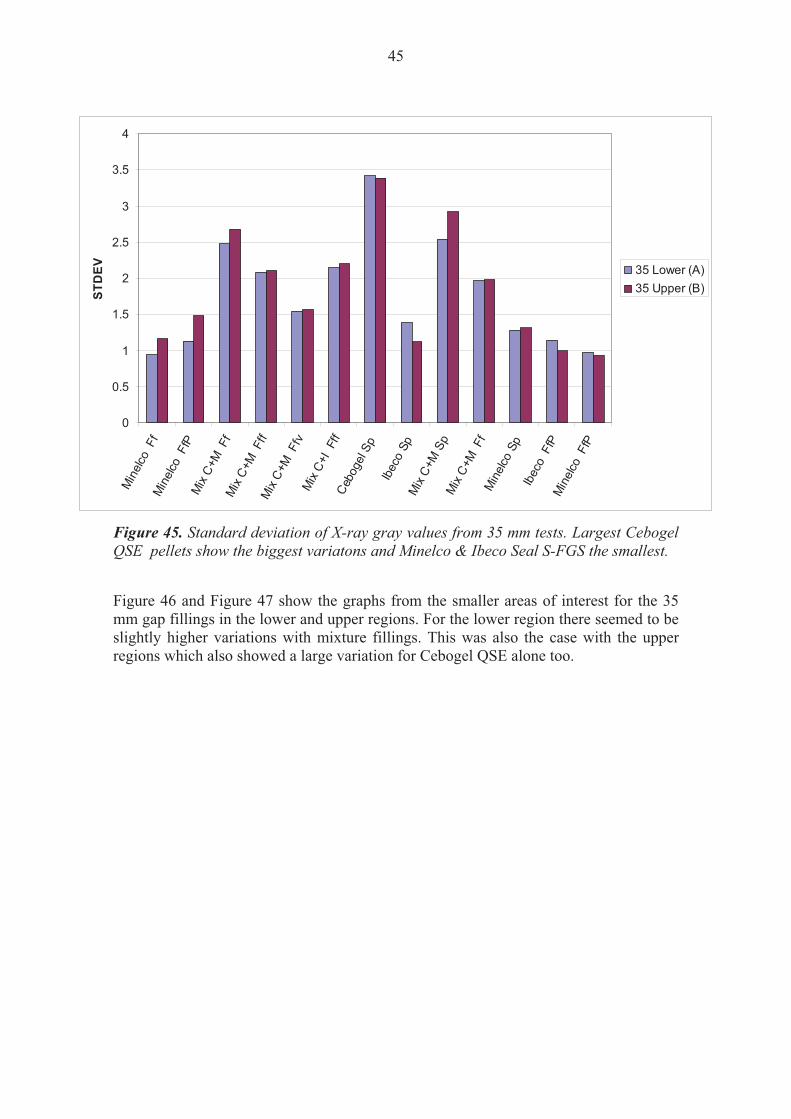
Figure 45. Standard deviation of X-ray gray values from 35 mm tests. Largest Cebogel QSE pellets show the biggest variatons and Minelco & Ibeco Seal S-FGS the smallest.
Figure 46 and Figure 47 show the graphs from the smaller areas of interest for the 35 mm gap fillings in the lower and upper regions. For the lower region there seemed to be slightly higher variations with mixture fillings. This was also the case with the upper regions which also showed a large variation for Cebogel QSE alone too.

46
0
0.5
1
1.5
2
2.5
3
3.5
4M
inelco
Ff
Mix
C+M
Ff
Ibec
o Ff
Mine
lco F
fPM
inelco
FfP
Mix
C+M
Ff
Mix
C+M
Fff
Mix
C+M
Ffv
Mix
C+I F
ffCe
boge
l Sp
Ibec
o Sp
Mix
C+M
Sp
Mine
lco S
p
STD
EV
35 A135 A235 A335 A4
Figure 46. Standard deviation of X-ray mean values from smaller regions of interest from 35 mm gap lower area (A).
0
0.5
1
1.5
2
2.5
3
3.5
4
Min
elco
FfM
ix C+
M F
fIb
eco
Ff
Min
elco
FfP
Min
elco
FfP
Mix
C+M
Ff
Mix
C+M
Fff
Mix
C+M
Ffv
Mix
C+I F
ffCe
boge
l Sp
Min
elco
SpIb
eco
Sp2
Mix
C+M
Sp2
STD
EV
35 B 135 B 235 B 335 B 4
Figure 47. Standard deviation of X-ray values from smaller regions of interest from 35 mm gap upper area (B).

47
This X-ray analysis would suggest that the effects of the filling layer thickness and the installation height to the achieved homogeneity and density should be topics of further studies. Figure 48 and Figure 49 show couple examples of X-ray images. The rest of the X-ray images can be found from the Annexes.
Figure 48. X-ray image of Cebogel QSE pellets and Minelco mixture installed by shotcrete spraying. Void areas with very little or no fine material can be seen. Also spraying has created a pattern of changing density clearly visible. Scale on left were made by lead numbers to show the height in mm.
48
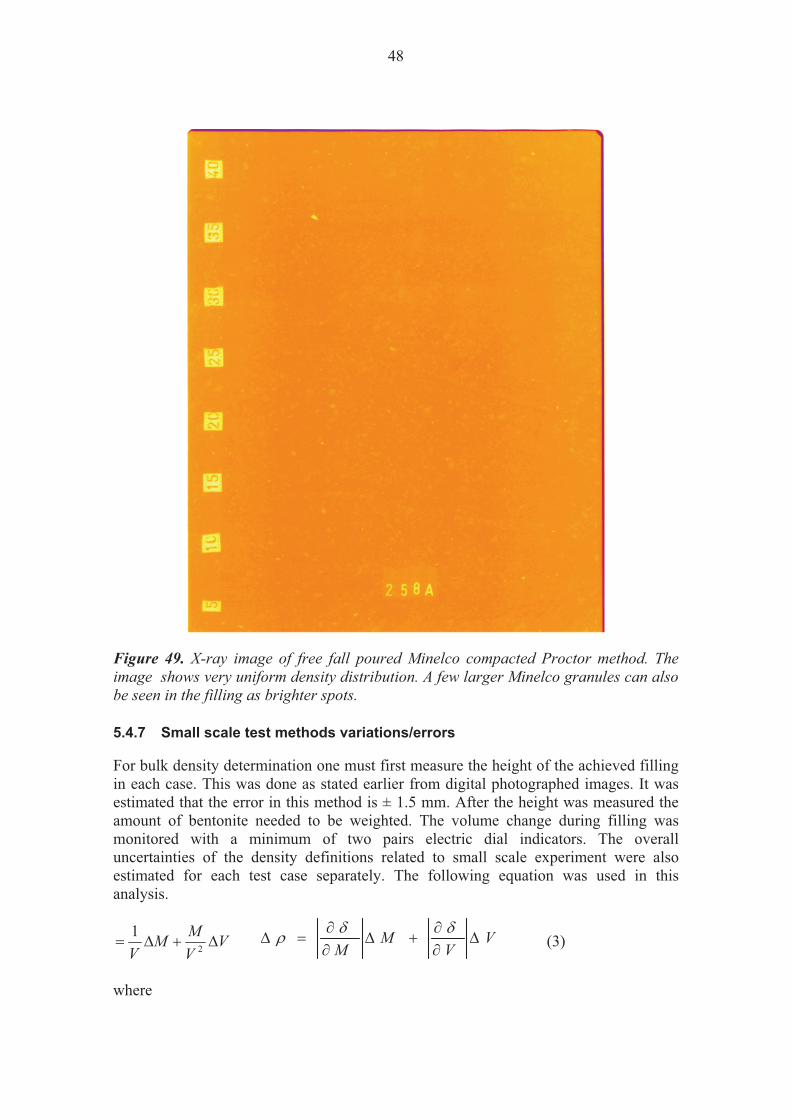
Figure 49. X-ray image of free fall poured Minelco compacted Proctor method. The image shows very uniform density distribution. A few larger Minelco granules can also be seen in the filling as brighter spots.
5.4.7 Small scale test methods variations/errors For bulk density determination one must first measure the height of the achieved filling in each case. This was done as stated earlier from digital photographed images. It was estimated that the error in this method is ± 1.5 mm. After the height was measured the amount of bentonite needed to be weighted. The volume change during filling was monitored with a minimum of two pairs electric dial indicators. The overall uncertainties of the density definitions related to small scale experiment were also estimated for each test case separately. The following equation was used in this analysis.
VVMM
V� � 2
1 (3)
where
VV
MM
���
���
����

49
�M is the error in mass weighing �V is the error in volume V is the total volume M is the total mass. More details of this error analysis can be found from Annex 1. For the 25 mm gap the average error related to gap filling experiments was found to be 4.97% and for the 35 mm gap the average error was found to be 3.64%. In the case of the 25 mm gap filling the uncertainty is equivalent to a dry density changes between 41-57 kg/m3 and for the 35 mm gap filling experiments the equal dry density changes are between 30-47 kg/m3. It should be noted that a thin layer (around 150 mm in height) type of filling was not possible to do when the shotcrete spraying pressure was around 1.25 bars. Lower pressures could not be used since the bentonite material would clog the shotcrete spraying tubes.
5.4.8 Dust It was found that because of dust it was impossible to visually monitor the filling height during shotcrete spraying when Minelco crushed bentonite aggregate was used. Also it almost was the same case when bentonite mixtures or Ibeco Seal S-FGS were used. On the other hand with Cebogel QSE pellets the dust was not a factor and it was possible to visually see how the filling progressed.
5.4.9 Spraying time and filling rate The shotcrete spraying time to an acceptable filling height with the 25 mm gap system was about 1 min 20 sec. With the 35 mm system the time for each filling was found to be around 2 minutes. For the average filling height of 957 mm, the gap system effective volumes were 48 and 67 litres. These numbers give average rate of 2 m3/h when the shotcrete spraying pressure was about 1.25 bars.
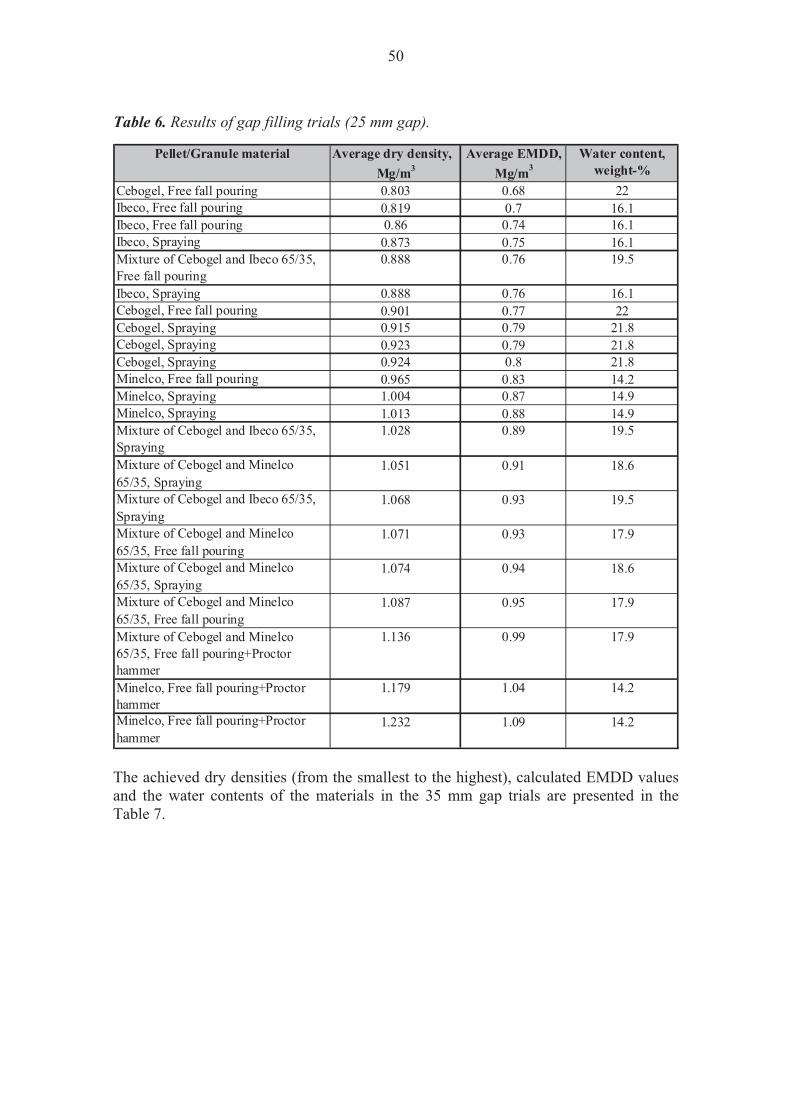
5.4.10 Densities of the small scale tests The achieved dry densities (from the smallest to the highest), calculated EMDD values and the water contents of the materials in the 25 mm gap trials are presented in Table 6.
50
Table 6. Results of gap filling trials (25 mm gap).
Average dry density,Mg/m3
Cebogel, Free fall pouring 0.803 0.68 22Ibeco, Free fall pouring 0.819 0.7 16.1Ibeco, Free fall pouring 0.86 0.74 16.1Ibeco, Spraying 0.873 0.75 16.1Mixture of Cebogel and Ibeco 65/35, Free fall pouring
0.888 0.76 19.5
Ibeco, Spraying 0.888 0.76 16.1Cebogel, Free fall pouring 0.901 0.77 22Cebogel, Spraying 0.915 0.79 21.8Cebogel, Spraying 0.923 0.79 21.8Cebogel, Spraying 0.924 0.8 21.8Minelco, Free fall pouring 0.965 0.83 14.2Minelco, Spraying 1.004 0.87 14.9Minelco, Spraying 1.013 0.88 14.9Mixture of Cebogel and Ibeco 65/35, Spraying
1.028 0.89 19.5
Mixture of Cebogel and Minelco 65/35, Spraying
1.051 0.91 18.6
Mixture of Cebogel and Ibeco 65/35, Spraying
1.068 0.93 19.5
Mixture of Cebogel and Minelco 65/35, Free fall pouring
1.071 0.93 17.9
Mixture of Cebogel and Minelco 65/35, Spraying
1.074 0.94 18.6
Mixture of Cebogel and Minelco 65/35, Free fall pouring
1.087 0.95 17.9
Mixture of Cebogel and Minelco 65/35, Free fall pouring+Proctor hammer
1.136 0.99 17.9
Minelco, Free fall pouring+Proctor hammer
1.179 1.04 14.2
Minelco, Free fall pouring+Proctor hammer
1.232 1.09 14.2
Pellet/Granule material Average EMDD, Mg/m3
Water content, weight-%
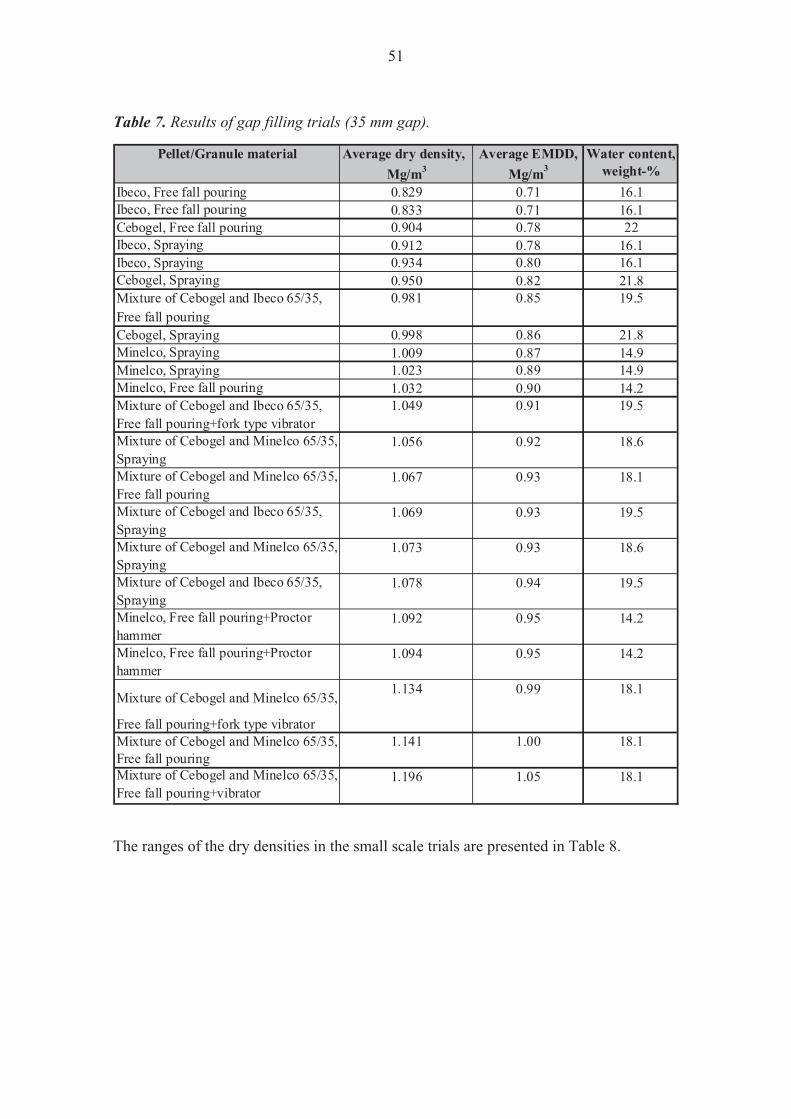
The achieved dry densities (from the smallest to the highest), calculated EMDD values and the water contents of the materials in the 35 mm gap trials are presented in the Table 7.
51
Table 7. Results of gap filling trials (35 mm gap).
Average dry density,Mg/m3
Ibeco, Free fall pouring 0.829 0.71 16.1Ibeco, Free fall pouring 0.833 0.71 16.1Cebogel, Free fall pouring 0.904 0.78 22Ibeco, Spraying 0.912 0.78 16.1Ibeco, Spraying 0.934 0.80 16.1Cebogel, Spraying 0.950 0.82 21.8Mixture of Cebogel and Ibeco 65/35, 0.981 0.85 19.5Free fall pouringCebogel, Spraying 0.998 0.86 21.8Minelco, Spraying 1.009 0.87 14.9Minelco, Spraying 1.023 0.89 14.9Minelco, Free fall pouring 1.032 0.90 14.2Mixture of Cebogel and Ibeco 65/35, Free fall pouring+fork type vibrator
1.049 0.91 19.5
Mixture of Cebogel and Minelco 65/35, Spraying
1.056 0.92 18.6
Mixture of Cebogel and Minelco 65/35, Free fall pouring
1.067 0.93 18.1
Mixture of Cebogel and Ibeco 65/35, Spraying
1.069 0.93 19.5
Mixture of Cebogel and Minelco 65/35, Spraying
1.073 0.93 18.6
Mixture of Cebogel and Ibeco 65/35, Spraying
1.078 0.94 19.5
Minelco, Free fall pouring+Proctor hammer
1.092 0.95 14.2
Minelco, Free fall pouring+Proctor hammer
1.094 0.95 14.2
Mixture of Cebogel and Minelco 65/35, 1.134 0.99 18.1
Free fall pouring+fork type vibratorMixture of Cebogel and Minelco 65/35, Free fall pouring
1.141 1.00 18.1
Mixture of Cebogel and Minelco 65/35, Free fall pouring+vibrator
1.196 1.05 18.1
Pellet/Granule material Average EMDD, Mg/m3
Water content, weight-%
The ranges of the dry densities in the small scale trials are presented in Table 8.

52
Table 8. Dry densities of the gap filling trials.
Material Dry density, kg/m3 Dry density, kg/m3
25 mm gap 35 mm gapCebogel QSE-pellets 803 - 924 818 – 998Minelco granule 965 - 1232 1009 – 1094Ibeco Seal S-FGS 819 - 888 829 – 934Mixture of Cebogel and Minelco 65/35 %
1051 - 1136 1056 - 1196
Mixture of Cebogel and Ibeco 65/35 %
888 - 1068 981 – 1078
53
6 RESULTS OF THE LARGE SCALE GAP FILLING TESTS 6.1 Test methods Two filling methods, free fall pouring and shotcrete spraying, were used in these large scale tests. No dust removal actions were taken so the shotcrete spraying was done without adding any moisture at the nozzle. The selected materials were Cebogel QSE pellets and Ibeco Seal S-FGS granules. First the free fall pouring tests were done for both materials and for both gap sizes of 35 and 50 mm. Then after these experiments the shotcrete spraying tests were conducted. Some of the bentonite raw material was re-used during the test sequence. Samples for moisture content determinations were taken from each test.
6.2 Free fall pouring The bentonite used in the free fall pouring test was weighed before each bentonite batch installation. Each batch was roughly 28 kg in size. The pouring was done manually with the aid of movable metal funnels which were contoured to the cylinder shape of the gap. The height of filling was visually monitored during test experiment so that the top level of the filling would be roughly at the same height around the gap.
6.3 Shotcrete spraying The shotcrete spraying equipment used for the large scale test was the same as in the small scale tests described earlier (see section 5.3). The shotcrete spraying was done first with 35 mm gap for Ibeco Seal S-FGS bentonite. The air pressure was first at the same level as in the small scale test but it proved to be too high. This led to excessive use of bentonite material and a very large amount of dust. During later tests the pressure was readjusted to lower readings (50 kPa) and some wooden plates were placed over the opposite side of the gap to prevent dust scattering from bouncing spray.
6.4 Conclusions from large scale tests These large scale test were done with the full scale size deposition hole diameter. However for practical reasons the actual height of the system was about 1/4 from real case. These results can be roughly thought equivalent to a vertical layer filling of 2 meters at a time.
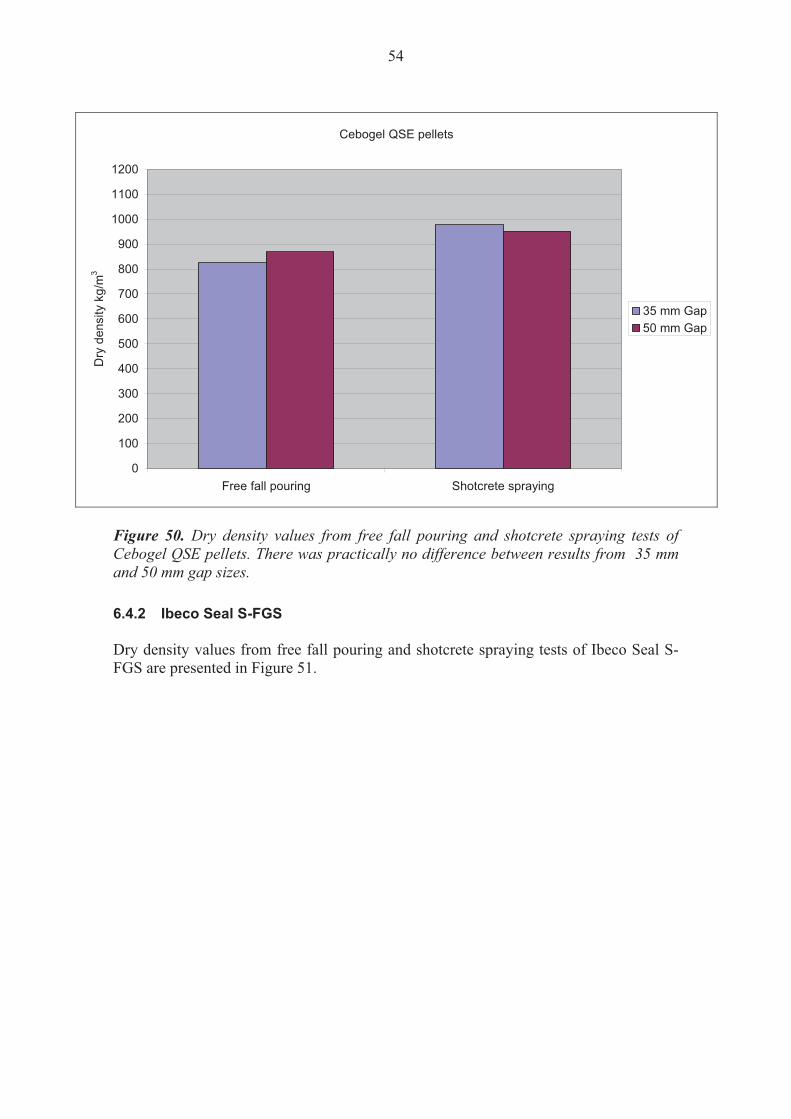
6.4.1 Cebogel QSE pellets The dry density values from the free fall pouring and shotcrete spraying tests of Cebogel QSE pellets are presented in Figure 50.
54
Cebogel QSE pellets
0
100
200
300
400
500
600
700
800
900
1000
1100
1200
Free fall pouring Shotcrete spraying
Dry
den
sity
kg/
m3
35 mm Gap50 mm Gap
Figure 50. Dry density values from free fall pouring and shotcrete spraying tests of Cebogel QSE pellets. There was practically no difference between results from 35 mm and 50 mm gap sizes.
6.4.2 Ibeco Seal S-FGS Dry density values from free fall pouring and shotcrete spraying tests of Ibeco Seal S-FGS are presented in Figure 51.

55
Ibeco Seal S-FGS
0
100
200
300
400
500
600
700
800
900
1000
1100
1200
Free fall pouring Shotcrete spraying
Dry
den
sity
kg/
m3
35 mm Gap50 mm Gap
Figure 51. Dry density values from free fall pouring and shotcrete spraying tests of Ibeco Seal S-FGS. Again there was practically no difference between results from 35 mm and 50 mm gap sizes.
6.4.3 Large scale test methods variations/errors The volumes of the large scale fillings were done with discrete sections as described earlier. For each volume section it could be also calculated the volume not filled by bentonite. When these two volumes are added the sum can be compared to the total volume of the empty gap system. The difference can be used as an error estimate in bentonite filling volume measurement. This includes the errors related to measuring equipment and errors made by operators doing the height measurement. When this error in volume measurement and the error in weighing are combined the total error for bulk density can be defined. The same equation (3) was used as in the small scale test error analysis to calculate density error calculations in the large scale tests. Results of this error analysis can be found from Table 9 and more details in Annex 2.

56
Table 9. Calculated errors for large scale filling test of Cebogel QSE and Ibeco Seal S-FGS.
Material Filling Method Gap [mm] Dry density [kg/m3]
�� [kg/m3]
�� %
Cebogel QSE Free fall pouring 35 826 10 1.3 %Ibeco Seal Free fall pouring 35 837 10 1.2 %Cebogel QSE Shotcrete spraying 35 977 16 1.6 %Ibeco Seal Shotcrete spraying 35 1021 13 1.3 %Cebogel QSE Free fall pouring 50 869 1 0.1 %Ibeco Seal Free fall pouring 50 867 1 0.1 %Cebogel QSE Shotcrete spraying 50 952 7 0.8 %Ibeco Seal Shotcrete spraying 50 948 6 0.6 %
6.4.4 Spraying time and filling rate The shotcrete spraying was performed using pressure about 50 kPa. As stated earlier the pressure in the first test was higher and it was adjusted lower during subsequent tests. The average filling rate was 1.6 m3/h for these tests.
6.4.5 Densities of the large scale tests In these large scale experiments the shotcrete spraying test gave higher dry density values when compared to free fall pouring. Also there seems to be little or no difference in achieved density values between 35 mm and 50 mm gaps. The increase of the gap size by 15 mm was not a significant factor with materials and installation method used in these test. Table 10. Results of gap filling trials (35 mm gap).
Average dry density,Mg/m3
Cebogel, Free fall pouring 0.826 0.70 21.1Ibeco, Free fall pouring 0.837 0.71 15.9Cebogel, Shotcrete spraying 0.977 0.84 20.2Ibeco, Shotcrete spraying 1.021 0.89 14.1
Pellet/Granule material Average EMDD, Mg/m3
Water content, weight-%

57
Table 11. Results of gap filling trials (50 mm gap).
Average dry density,Mg/m3
Cebogel, Free fall pouring 0.866 0.74 21.1Ibeco, Free fall pouring 0.867 0.74 15.9Cebogel, Shotcrete spraying 0.952 0.82 20.2Ibeco, Shotcrete spraying 0.948 0.82 14.1
Pellet/Granule material Average EMDD, Mg/m3
Water content, weight-%

58

59
7 SUMMARY Several different bentonite materials and installation methods were tested in two series of laboratory tests. Small-scale testing scenarios were made with 25 mm and 35 mm gap sizes in a 2m long rectangular test element. Dry densities were measured and the homogeneity of the fillings was evaluated from X-ray images. Based on these tests two materials, Cebogel QSE pellets and Ibeco Seal S-FGS, were chosen for the larger scale tests. The chosen installation methods for the large scale tsts were free fall pouring and shotcrete spraying. With these materials the second set of tests were made with real deposition diameter size elements and with gap widths of 35 mm and 50 mm. The results from the small scale tests suggest that all the filling materials and methods used during the test would have high enough dry density average value needed by the current buffer design options. The dry density values ranged from 800-1200 kg/m3. Lowest values were noted from free fall pouring of largest Cebogel QSE pellets and the highest values were obtained from compacted small grain size Minelco bentonite. The X-ray images and their analysis showed that Minelco and Ibeco Seal S-FGS had the most homogenised results. The largest differences in homogeneities were determined from Cebogel QSE pellets or its combination mixture with finer material. Also when these combinations were used with shotcrete spraying the separation of the particles could be seen. In large scale experiments the shotcrete spraying tests gave the higher dry density values compared to free fall pouring. Also there seemed to be little or no difference in achieved density values between 35 mm and 50 mm gaps. The increase of the gap size by 15 mm was not a significant factor with materials and installation methods used in this test. The dry density values ranged from 800-1000 kg/m3. The highest dry density value was lower than in small scale tests because no compaction methods were used. The error analysis of the experimental methods used in this study showed that the errors related to small scale tests were higher than in large scale tests. The average errors in small scale tests could be as high as 5.0 % and in large scale tests 1.4 %. The difference is related to actual amount of bentonite used in each test setup. The uncertainties of weighing and dimension measurements are roughly the same but in the large tests the actual measured volume is almost eight times bigger than in the small scale tests. The spraying rates for the shotcrete installation method varied between 1.6 – 2.0 m3/h depending on the pressure used. Because of the relatively small size of the gap elements used, the spraying pressure had to be lowered during installations. In the case of much deeper real size deposition hole the situation may be completely different.

60
61
8 CONCLUSIONS AND DISCUSSION Results from the small scale tests showed that compaction and vibration methods gave the highest dry density values but to implement them in a deposition hole environment would require more complicated machinery to be built. The achieved dry density could be made higher with for example vibrating the filling material during installation. It was observed that all tested bentonite materials and installation methods would give approximately high enough dry density values needed for gap filling option of the buffer design. This would indicate that there is no need to target a high dry density filling. The needed dry density value for gap filling material comes directly from the buffer design and must always be discussed together. In this study one material investigated in both small and large scale tests was Cebogel QSE pellet filling. When these pellets are installed without the use of any extra moisture the filling proved to be possible to be artificially wetted uniformly. This may not be the case if for example water is added during pellet installation to prevent dust related issues. This matter needs further studies if the buffer design options include both gap filling and artificial wetting. When Cebogel QSE pellets were installed to a 25 mm gap, unwanted properties were observed in the filling. Overall the amount of unhomogeneity was higher than in larger gaps. In the basic buffer design the 25 mm gap is not meant to be filled but also in case of larger nominal gap size the actual gap width could be as small as 25 mm. The reasons behind this assumption are uneven rock surface, possible misaligned buffer blocks and general tolerances related to deposition hole. The physical dimensions of the Cebogel QSE pellets are not well suited for this application. For example some pellets are too long and create vaulting in small gaps. This is why pellet optimization needs to be included in future research topics. Ibeco Seal S-FGS was chosen to be an example case of a finer grained bentonite type to be studied in large scale tests. This material had proven to give homogeneous fillings in the small scale tests. Minelco crushed bentonite is also a fine bentonite type and in small scale tests it had the same level homogeneity as Ibeco Seal S-FGS. Between these two materials the grain size distribution of Ibeco Seal S-FGS was found to be better suitable because very fine and too coarse particles were removed. This also related to how much dust is released during installation. It should be noted that input from artificial wetting project has shown that Ibeco Seal S-FGS was quite challenging to be wetted uniformly. Thus Ibeco Seal S-FGS could be used in those design options that do not require artificial wetting but the gap width is large enough that filling is needed because of the overall buffer density requirements.

62

63
REFERENCES Ahonen, L., Kivikoski, H., Korkeakoski, P., Laaksonen, R., Tiljander, M., 2008. Quality Assurance of the Bentonite Material. Posiva Working report 2008-33. Dixon, D., Anttila, S., Viitanen, M., Keto, P., 2008. Tests to determine water uptake behaviour of tunnel backfill. R-08-134. SKB 2008. Riikonen, E., 2009. Flow-through and wetting tests of pre-compacted backfill blocks in a quarter-scale test tunnel. Helsinki University of Technology, Master’s thesis,166 p. Hansen, J., Korkiala-Tanttu, L., Keski-Kuha, E., Keto, P., 2010. Deposition Tunnel Backfill Design for a KBS-3V Repository. Posiva Working Report 2009-129. March 2010. 91 p. Wimelius, H. and Pusch, R., 2008. Backfilling of KBS-3V deposition tunnels – Possibilities and Limitations. Swedish Nuclear Fuel and Waste Management Co, SKB, Stockholm. SKB R-08-59. Holt, E., Marjavaara, P., Löija, M., 2011. Artificial wetting of buffer material - small scale. Posiva Working Report 2011-��. Martino, J., Dixon, D., Placement and formulation studies on potential light backfill and gap fill materials for use in repository sealing. Report No. 06819-REP-01300-10011-R00. 2006. Kjartanson, B.H., Dixon, D.A., Kohle, C.L.,2005. Placement of bentonite pellets to fill repository sealing system voids and gaps. Ontario Power Generation, Nuclear Waste Management Division, Technical Report No. 06819-REP-01200-10136-R00. 2005. Kobayashi, I., Sasakura, T., Tanaka, T., Nakajima, M., Toida, M. & Uemoto, K., 2005 Water content adjust method using chilled bentonite and powdered ice, Proc. of annual conference of JSCE (in Japanese). 2005.

64

65
ANNEXES Annex 1. Small scale error analysis
Annex 2. Large scale error analysis
Annex 3. 25 mm gap: Cebogel QSE Pellets: Free fall pouring; Shotcrete spraying
Annex 4. 25 mm gap: Cebogel QSE Pellets + Minelco mixture 65/35: Free fall pouring; Shotcrete spraying
Annex 5. 25 mm gap: Cebogel QSE Pellets + Ibeco mixture 65/35: Free fall pouring; Shotcrete spraying
Annex 6. 25 mm gap: Ibeco Seal: Free fall pouring
Annex 7. 25 mm gap: Minelco: Free fall pouring; Free fall pouring + Proctor; Shotcrete spraying
Annex 8. 25 mm gap: Cebogel QSE Pellets + Ibeco mixture 65/35: Free fall pouring; Shotcrete spraying
Annex 9. 25 mm gap: Cebogel QSE Pellets: Free fall pouring; Shotcrete spraying
Annex 10. 25 mm gap: Cebogel QSE Pellets + Minelco mixture 65/35: Free fall pouring; Shotcrete spraying
Annex 11. 25 mm gap: Minelco: Free fall pouring; 2 x Free fall pouring + Proctor; Shotcrete spraying
Annex 12. 35 mm gap: Cebogel QSE Pellets: Shotcrete spraying
Annex 13. 35 mm gap: Ibeco Seal S-FGS: Free fall pouring; Shotcrete spraying
Annex 14. 35 mm gap: Cebogel QSE Pellets + Ibeco mixture 65/35: Free fall pouring + fork vibration
Annex 15. 35 mm gap: Cebogel QSE Pellets + Minelco mixture 65/35: Free fall pouring; Free fall pouring + Fork vibration; Free fall pouring + vibration; Shotcrete spraying
Annex 16. 35 mm gap: Minelco: Free fall pouring; Free fall pouring + Proctor; Shotcrete spraying
Annex 17. 35 mm gap: Ibeco Seal S-FGS: Free fall pouring; Shotcrete spraying
Annex 18. 35 mm gap: Cebogel QSE Pellets + Minelco mixture 65/35: Free fall pouring; Free fall pouring + Fork vibration; Free fall pouring + vibration; Shotcrete spraying
Annex 19. 35 mm gap: Minelco: Free fall pouring; Free fall pouring + Proctor; Shotcrete spraying

66
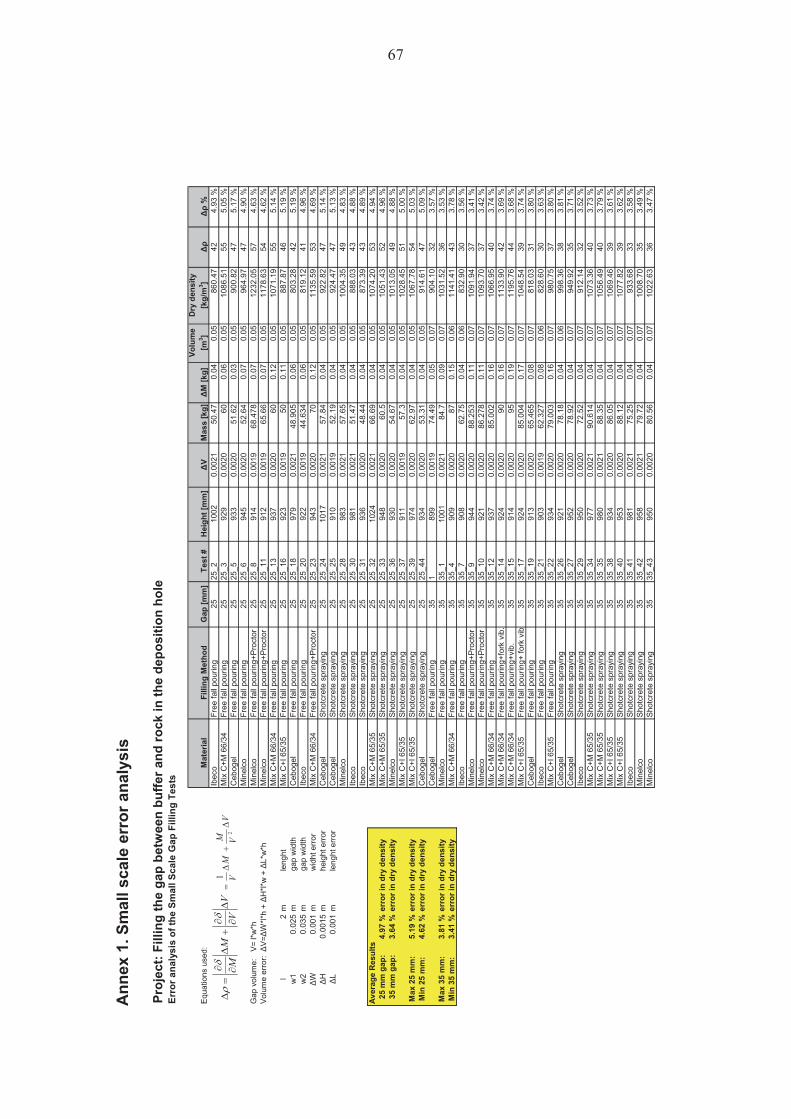
Ann
ex 1
. Sm
all s
cale
err
or a
naly
sis
Proj
ect:
Filli
ng th
e ga
p be
twee
n bu
ffer a
nd ro
ck in
the
depo
sitio
n ho
leEr
ror a
naly
sis
of th
e Sm
all S
cale
Gap
Fill
ing
Test
s
Equa
tions
use
d:M
ater
ial
Filli
ng M
etho
dG
ap [m
m]
Test
#H
eigh
t [m
m]
�V
Mas
s [k
g]�
M [k
g]Vo
lum
e [m
3 ]D
ry d
ensi
ty
[kg/
m3 ]
��
��
%Ib
eco
Free
fall
pour
ing
2525
_210
020.
0021
50.4
70.
040.
0586
0.47
424.
93 %
Mix
C+M
66/
34Fr
ee fa
ll po
urin
g25
25_3
929
0.00
2060
0.06
0.05
1086
.51
555.
05 %
Ceb
ogel
Free
fall
pour
ing
2525
_593
30.
0020
51.6
20.
030.
0590
0.82
475.
17 %
Min
elco
Free
fall
pour
ing
2525
_694
50.
0020
52.6
40.
070.
0596
4.97
474.
90 %
Gap
vol
ume:
V=
l*w
*hM
inel
coFr
ee fa
ll po
urin
g+Pr
octo
r25
25_8
914
0.00
1968
.478
0.07
0.05
1232
.05
574.
63 %
Volu
me
erro
r:�V
=�W
*l*h
+ �H
*l*w
+ �
L*w
*hM
inel
coFr
ee fa
ll po
urin
g+Pr
octo
r25
25_1
191
20.
0019
65.6
60.
070.
0511
78.6
354
4.62
%M
ix C
+M 6
6/34
Free
fall
pour
ing
2525
_13
937
0.00
2060
0.12
0.05
1071
.19
555.
14 %
l2
mle
nght
Mix
C+I
65/
35Fr
ee fa
ll po
urin
g25
25_1
692
30.
0019
500.
110.
0588
7.87
465.
19 %
w1
0.02
5m
gap
wid
thC
ebog
elFr
ee fa
ll po
urin
g25
25_1
897
90.
0021
48.9
050.
060.
0580
3.28
425.
19 %
w2
0.03
5m
gap
wid
thIb
eco
Free
fall
pour
ing
2525
_20
922
0.00
1944
.634
0.06
0.05
819.
1241
4.96
%�W
0.00
1m
wid
ht e
rror
Mix
C+M
66/
34Fr
ee fa
ll po
urin
g+Pr
octo
r25
25_2
394
30.
0020
700.
120.
0511
35.5
953
4.69
%�H
0.00
15m
heig
ht e
rror
Ceb
ogel
Shot
cret
e sp
rayi
ng25
25_2
410
170.
0021
57.8
40.
040.
0592
2.82
475.
14 %
�L0.
001
mle
nght
err
orC
ebog
elSh
otcr
ete
spra
ying
2525
_25
910
0.00
1952
.19
0.04
0.05
924.
4747
5.13
%M
inel
coSh
otcr
ete
spra
ying
2525
_28
983
0.00
2157
.65
0.04
0.05
1004
.35
494.
83 %
Ibec
oSh
otcr
ete
spra
ying
2525
_30
981
0.00
2151
.47
0.04
0.05
888.
0343
4.88
%Ib
eco
Shot
cret
e sp
rayi
ng25
25_3
193
60.
0020
48.4
40.
040.
0587
3.39
434.
89 %
Aver
age
Res
ults
Mix
C+M
65/
35Sh
otcr
ete
spra
ying
2525
_32
1024
0.00
2166
.69
0.04
0.05
1074
.20
534.
94 %
25 m
m g
ap:
4.97
%er
ror i
n dr
y de
nsity
Mix
C+M
65/
35Sh
otcr
ete
spra
ying
2525
_33
948
0.00
2060
.50.
040.
0510
51.4
352
4.96
%35
mm
gap
:3.
64 %
erro
r in
dry
dens
ityM
inel
coSh
otcr
ete
spra
ying
2525
_36
930
0.00
2054
.67
0.04
0.05
1013
.05
494.
88 %
Mix
C+I
65/
35Sh
otcr
ete
spra
ying
2525
_37
911
0.00
1957
.30.
040.
0510
28.4
551
5.00
%M
ax 2
5 m
m:
5.19
%er
ror i
n dr
y de
nsity
Mix
C+I
65/
35Sh
otcr
ete
spra
ying
2525
_39
974
0.00
2062
.97
0.04
0.05
1067
.78
545.
03 %
Min
25
mm
:4.
62 %
erro
r in
dry
dens
ityC
ebog
elSh
otcr
ete
spra
ying
2525
_44
934
0.00
2053
.31
0.04
0.05
914.
6147
5.09
%C
ebog
elFr
ee fa
ll po
urin
g35
189
90.
0019
74.4
90.
050.
0790
4.10
323.
57 %
Max
35
mm
:3.
81 %
erro
r in
dry
dens
ityM
inel
coFr
ee fa
ll po
urin
g35
35_1
1001
0.00
2184
.70.
090.
0710
31.5
236
3.53
%M
in 3
5 m
m:
3.41
%er
ror i
n dr
y de
nsity
Mix
C+M
66/
34Fr
ee fa
ll po
urin
g35
35_4
909
0.00
2087
0.15
0.06
1141
.41
433.
78 %
Ibec
oFr
ee fa
ll po
urin
g35
35_7
908
0.00
2062
.75
0.04
0.06
832.
9030
3.56
%M
inel
coFr
ee fa
ll po
urin
g+Pr
octo
r35
35_9
944
0.00
2088
.253
0.11
0.07
1091
.94
373.
41 %
Min
elco
Free
fall
pour
ing+
Proc
tor
3535
_10
921
0.00
2086
.278
0.11
0.07
1093
.70
373.
42 %
Mix
C+M
66/
34Fr
ee fa
ll po
urin
g35
35_1
293
70.
0020
85.0
020.
160.
0710
66.9
540
3.74
%M
ix C
+M 6
6/34
Free
fall
pour
ing+
fork
vib
.35
35_1
492
40.
0020
900.
160.
0711
33.9
042
3.69
%M
ix C
+M 6
6/34
Free
fall
pour
ing+
vib.
3535
_15
914
0.00
2095
0.19
0.07
1195
.76
443.
68 %
Mix
C+I
65/
35Fr
ee fa
ll po
urin
g+ fo
rk v
ib35
35_1
792
40.
0020
85.0
040.
170.
0710
48.5
439
3.74
%C
ebog
elFr
ee fa
ll po
urin
g35
35_1
991
30.
0020
65.4
650.
080.
0781
8.03
313.
80 %
Ibec
oFr
ee fa
ll po
urin
g35
35_2
190
30.
0019
62.3
270.
080.
0682
8.60
303.
63 %
Mix
C+I
65/
35Fr
ee fa
ll po
urin
g35
35_2
293
40.
0020
79.0
030.
160.
0798
0.75
373.
80 %
Ceb
ogel
Shot
cret
e sp
rayi
ng35
35_2
692
10.
0020
78.1
80.
040.
0699
8.36
383.
81 %
Ceb
ogel
Shot
cret
e sp
rayi
ng35
35_2
795
20.
0020
78.9
20.
040.
0794
9.92
353.
71 %
Ibec
oSh
otcr
ete
spra
ying
3535
_29
950
0.00
2072
.52
0.04
0.07
912.
1432
3.52
%M
ix C
+M 6
5/35
Shot
cret
e sp
rayi
ng35
35_3
497
70.
0021
90.6
140.
040.
0710
73.3
640
3.73
%M
ix C
+M 6
5/35
Shot
cret
e sp
rayi
ng35
35_3
598
00.
0021
88.3
50.
040.
0710
56.4
940
3.79
%M
ix C
+I 6
5/35
Shot
cret
e sp
rayi
ng35
35_3
893
40.
0020
86.0
50.
040.
0710
69.4
639
3.61
%M
ix C
+I 6
5/35
Shot
cret
e sp
rayi
ng35
35_4
095
30.
0020
88.1
20.
040.
0710
77.8
239
3.62
%Ib
eco
Shot
cret
e sp
rayi
ng35
35_4
198
10.
0021
75.2
50.
040.
0793
3.68
333.
58 %
Min
elco
Shot
cret
e sp
rayi
ng35
35_4
295
80.
0021
79.7
20.
040.
0710
08.7
035
3.49
%M
inel
coSh
otcr
ete
spra
ying
3535
_43
950
0.00
2080
.56
0.04
0.07
1022
.63
363.
47 %
VVM
MV
�
�
2
1V
VM
M�
��
���
�
��
�
67

Ann
ex 2
. Lar
ge s
cale
err
or a
naly
sis
Proj
ect:
Filli
ng th
e ga
p be
twee
n bu
ffer a
nd ro
ck in
the
depo
sitio
n ho
leEr
ror a
naly
sis
of th
e La
rge
Scal
e G
ap F
illin
g Te
sts
Equa
tions
use
d:M
ater
ial
Filli
ng M
etho
dG
ap [m
m]
�V
[m3 ]
Mas
s [k
g]�
M [k
g]Vo
lum
e [m
3 ]B
ulk
dens
ity
[kg/
m3 ]
Dry
den
sity
[k
g/m
3 ]�
� [k
g/m
3 ]�
� %
Ceb
ogel
QSE
Free
fall
pour
ing
350.
0037
383
0.32
0.38
310
0082
610
1.3
%Ib
eco
Sea
lFr
ee fa
ll po
urin
g35
0.00
3737
00.
280.
381
970
837
101.
2 %
Ceb
ogel
QSE
Shot
cret
e sp
rayi
ng35
0.00
4042
02.
000.
390
1174
977
161.
6 %
Ibec
o Se
alSh
otcr
ete
spra
ying
350.
0040
306
2.00
0.39
011
6510
2113
1.3
%C
ebog
el Q
SEFr
ee fa
ll po
urin
g50
0.00
0154
60.
440.
519
1052
869
10.
1 %
Aver
age
Res
ults
Ibec
o Se
alFr
ee fa
ll po
urin
g50
0.00
0252
70.
420.
525
1005
867
10.
1 %
35 m
m g
ap:
1.35
%er
ror i
n dr
y de
nsity
Ceb
ogel
QSE
Shot
cret
e sp
rayi
ng50
0.00
1251
82.
000.
453
1144
952
70.
8 %
50 m
m g
ap:
0.41
%er
ror i
n dr
y de
nsity
Ibec
o Se
alSh
otcr
ete
spra
ying
500.
0012
465
2.00
0.54
510
8294
86
0.6
%
Max
35
mm
:1.
64 %
erro
r in
dry
dens
ityM
in 3
5 m
m:
1.20
%er
ror i
n dr
y de
nsity
Max
50
mm
:0.
78 %
erro
r in
dry
dens
ityM
in 5
0 m
m:
0.13
%er
ror i
n dr
y de
nsity
VVM
MV
�
�
2
1V
VM
M�
��
���
�
��
�
68
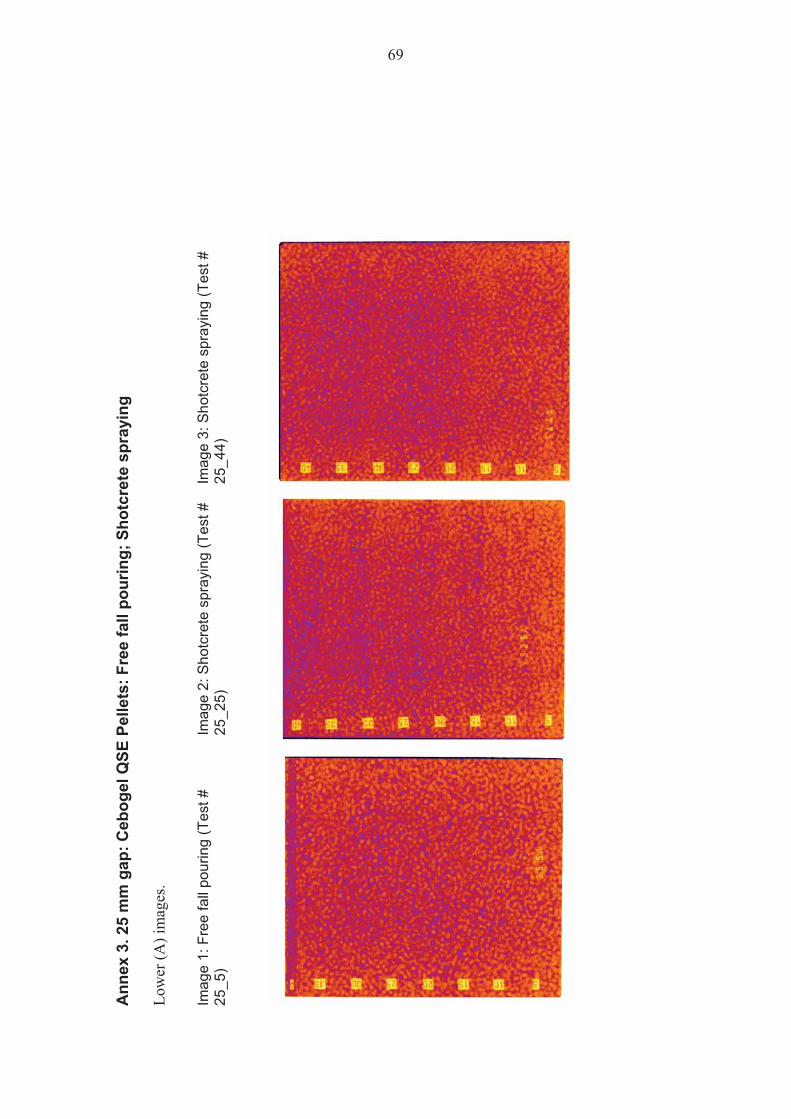
Ann
ex 3
. 25
mm
gap
: Ceb
ogel
QSE
Pel
lets
: Fre
e fa
ll po
urin
g; S
hotc
rete
spr
ayin
g
Low
er (A
) im
ages
. Im
age
1: F
ree
fall
pour
ing
(Tes
t #
25_5
)
Imag
e 2:
Sho
tcre
te s
pray
ing
(Tes
t #
25_2
5)
Imag
e 3:
Sho
tcre
te s
pray
ing
(Tes
t #
25_4
4)
69

Ann
ex 4
. 25
mm
gap
: Ceb
ogel
QSE
Pel
lets
+ M
inel
co m
ixtu
re 6
5/35
: Fre
e fa
ll po
urin
g; S
hotc
rete
spr
ayin
g Lo
wer
(A) i
mag
es.
Imag
e 1:
Fre
e fa
ll po
urin
g (T
est #
25_
3)
Imag
e 2:
Fre
e fa
ll po
urin
g (T
est #
25
_13)
Im
age
3: S
hotc
rete
spr
ayin
g (T
est #
25
_32)
70
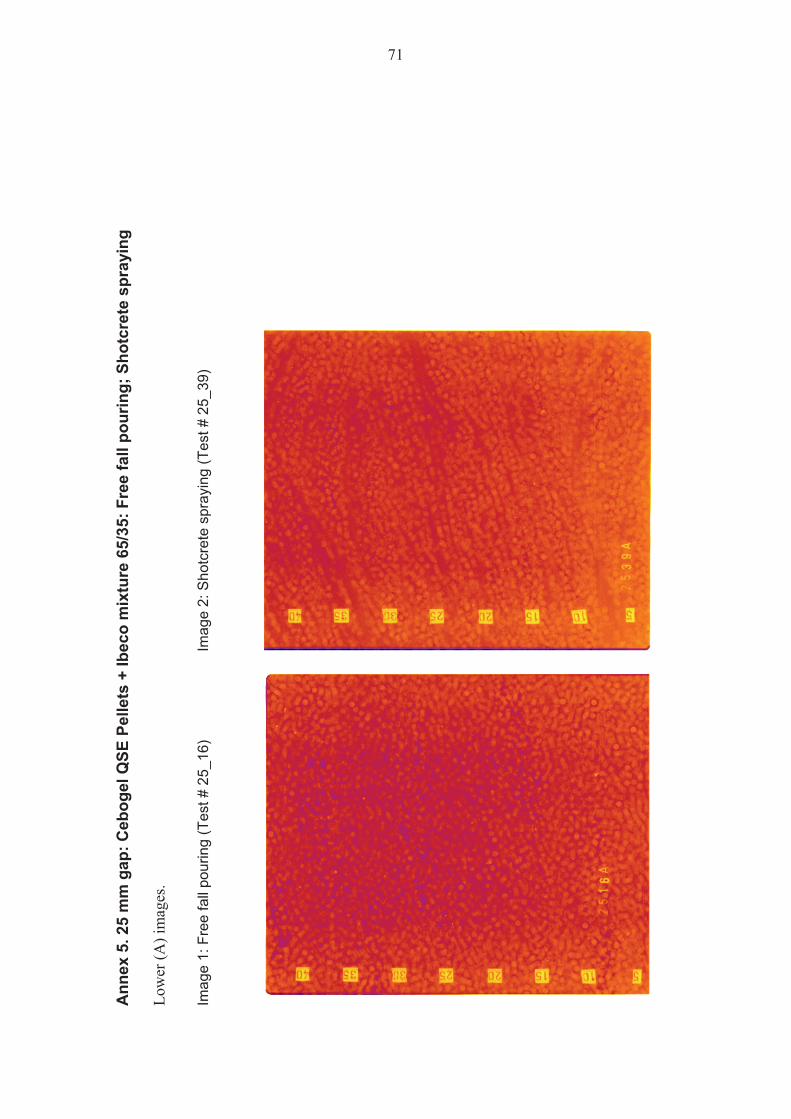
Ann
ex 5
. 25
mm
gap
: Ceb
ogel
QSE
Pel
lets
+ Ib
eco
mix
ture
65/
35: F
ree
fall
pour
ing;
Sho
tcre
te s
pray
ing
Low
er (A
) im
ages
. Im
age
1: F
ree
fall
pour
ing
(Tes
t # 2
5_16
)
Imag
e 2:
Sho
tcre
te s
pray
ing
(Tes
t # 2
5_39
)
71
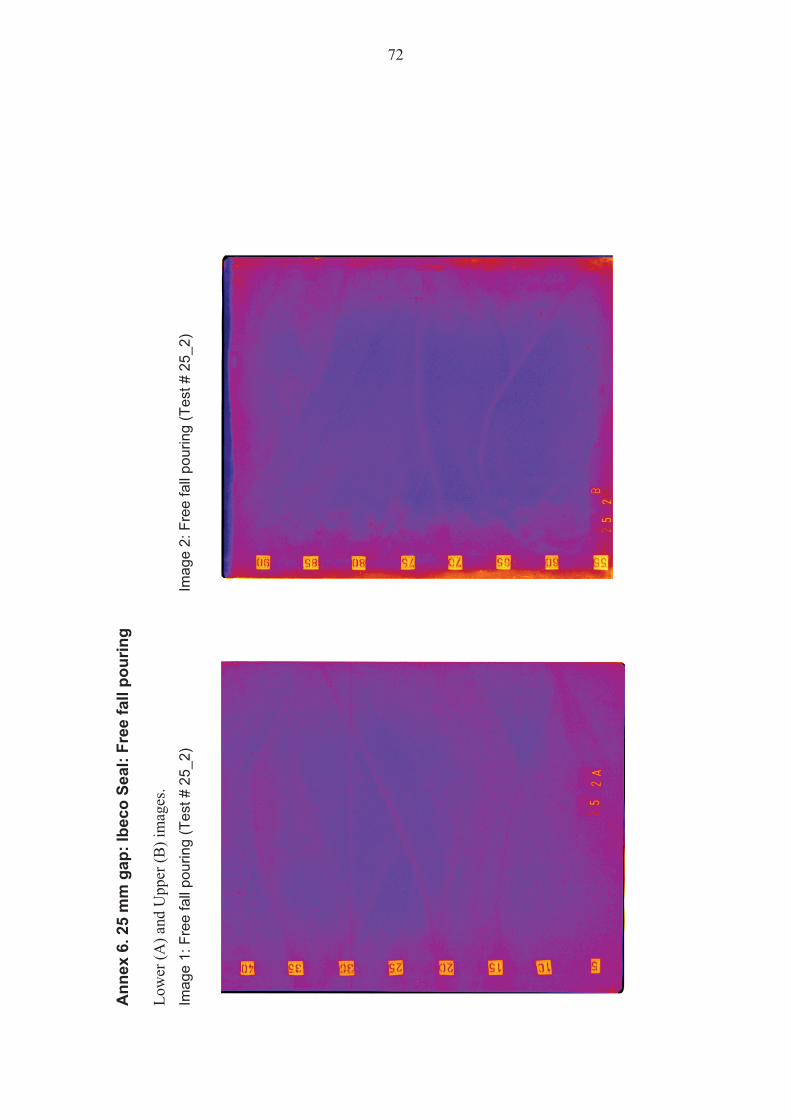
Ann
ex 6
. 25
mm
gap
: Ibe
co S
eal:
Free
fall
pour
ing
Low
er (A
) and
Upp
er (B
) im
ages
. Im
age
1: F
ree
fall
pour
ing
(Tes
t # 2
5_2)
Im
age
2: F
ree
fall
pour
ing
(Tes
t # 2
5_2)
72

Ann
ex 7
. 25
mm
gap
: Min
elco
: Fre
e fa
ll po
urin
g; F
ree
fall
pour
ing
+ Pr
octo
r; S
hotc
rete
spr
ayin
g Lo
wer
(A) i
mag
es.
Imag
e 1:
Fre
e fa
ll po
urin
g (T
est #
25_
6)
Imag
e 2:
Fre
e fa
ll po
urin
g +
Pro
ctor
(Tes
t # 2
5_8)
Im
age
3: F
ree
fall
pour
ing
+ P
roct
or (T
est #
25_
11)
Imag
e 4:
Sho
tcre
te s
pray
ing
(Tes
t #25
_28)
73
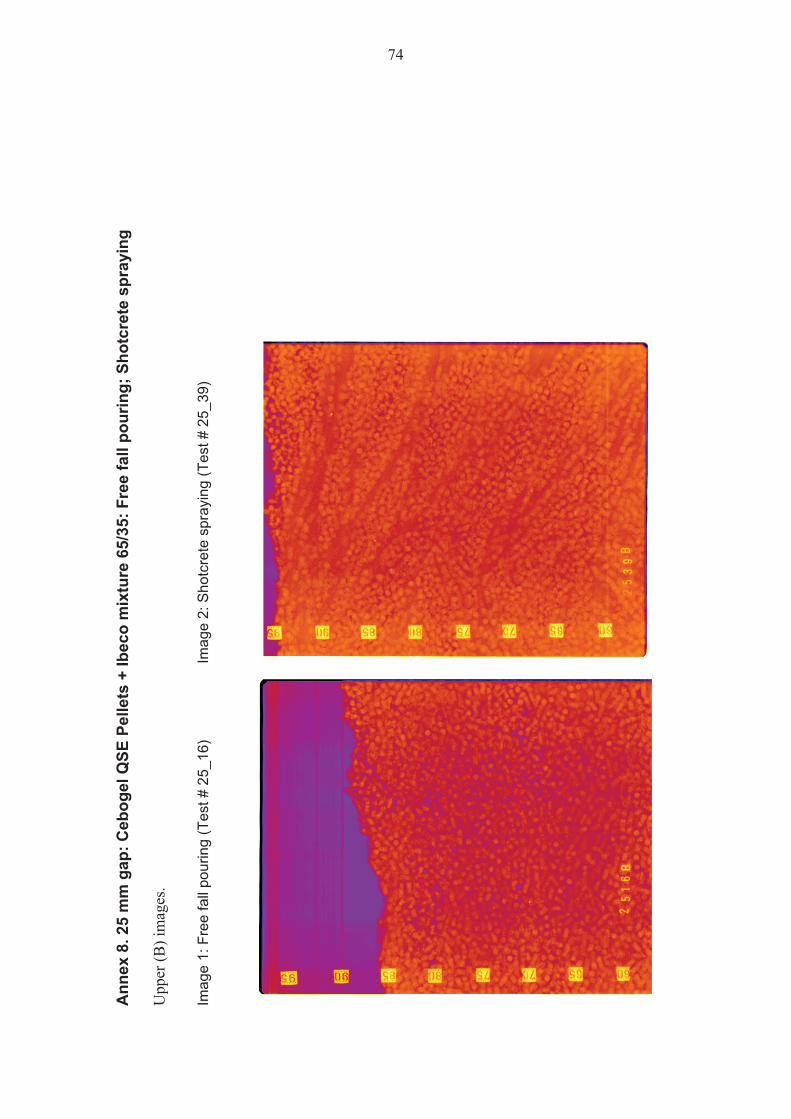
Ann
ex 8
. 25
mm
gap
: Ceb
ogel
QSE
Pel
lets
+ Ib
eco
mix
ture
65/
35: F
ree
fall
pour
ing;
Sho
tcre
te s
pray
ing
Upp
er (B
) im
ages
. Im
age
1: F
ree
fall
pour
ing
(Tes
t # 2
5_16
)
Imag
e 2:
Sho
tcre
te s
pray
ing
(Tes
t # 2
5_39
)
74
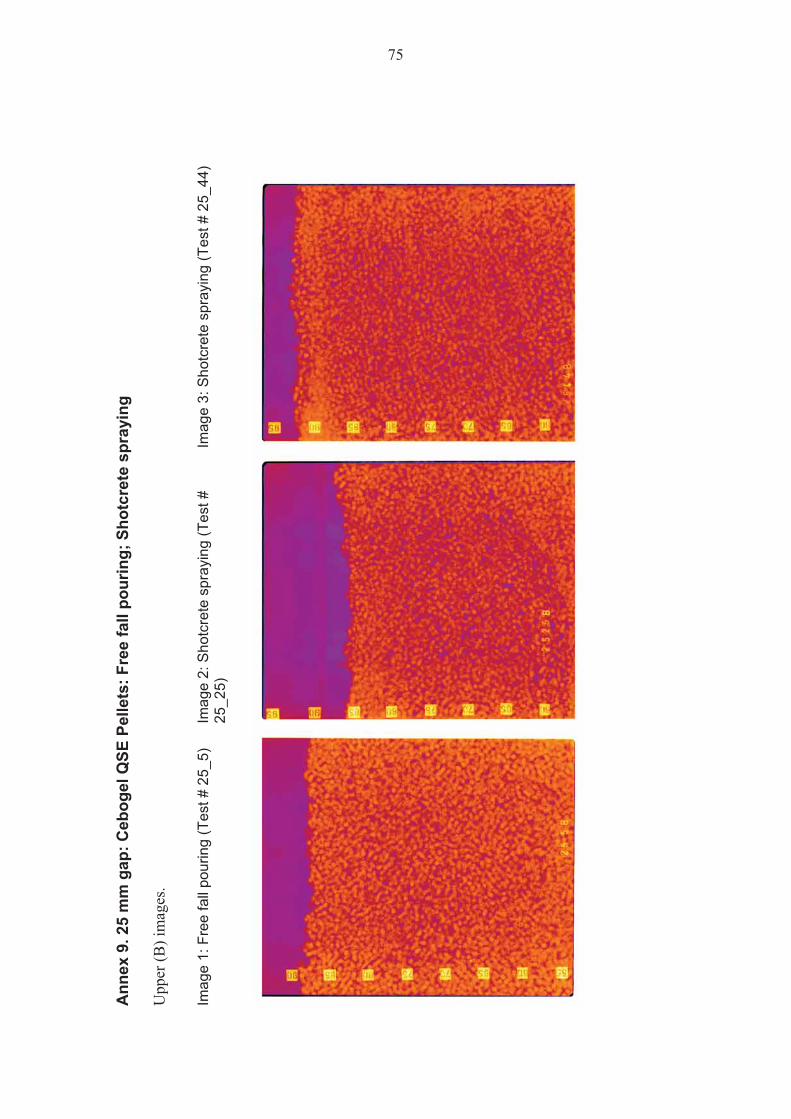
Ann
ex 9
. 25
mm
gap
: Ceb
ogel
QSE
Pel
lets
: Fre
e fa
ll po
urin
g; S
hotc
rete
spr
ayin
g U
pper
(B) i
mag
es.
Imag
e 1:
Fre
e fa
ll po
urin
g (T
est #
25_
5)
Imag
e 2:
Sho
tcre
te s
pray
ing
(Tes
t #
25_2
5)
Imag
e 3:
Sho
tcre
te s
pray
ing
(Tes
t # 2
5_44
)
75

Ann
ex 1
0. 2
5 m
m g
ap: C
ebog
el Q
SE P
elle
ts +
Min
elco
mix
ture
65/
35: F
ree
fall
pour
ing;
Sho
tcre
te s
pray
ing
Upp
er (B
) im
ages
. Im
age
1: F
ree
fall
pour
ing
(Tes
t # 2
5_3)
Imag
e 2:
Fre
e fa
ll po
urin
g (T
est #
25_
13)
Imag
e 3:
Sho
tcre
te s
pray
ing
(Tes
t # 2
5_32
)
76

Ann
ex 1
1. 2
5 m
m g
ap: M
inel
co: F
ree
fall
pour
ing;
2 x
Fre
e fa
ll po
urin
g +
Proc
tor;
Sho
tcre
te s
pray
ing
Upp
er (B
) im
ages
. Im
age
1: F
ree
fall
pour
ing
(Tes
t # 2
5_6)
Im
age
2: F
ree
fall
pour
ing
+ P
roct
or (T
est #
25_
8)
Imag
e 3:
Fre
e fa
ll po
urin
g +
Pro
ctor
(Tes
t # 2
5_11
) Im
age
4: S
hotc
rete
spr
ayin
g (T
est #
25_2
8)
77

Ann
ex 1
2. 3
5 m
m g
ap: C
ebog
el Q
SE P
elle
ts: S
hotc
rete
spr
ayin
g
Low
er (A
) and
Upp
er (B
) im
ages
. Im
age
1: S
hotc
rete
spr
ayin
g (T
est #
35_
27) A
Im
age
2: S
hotc
rete
spr
ayin
g (T
est #
35_
27) B
78
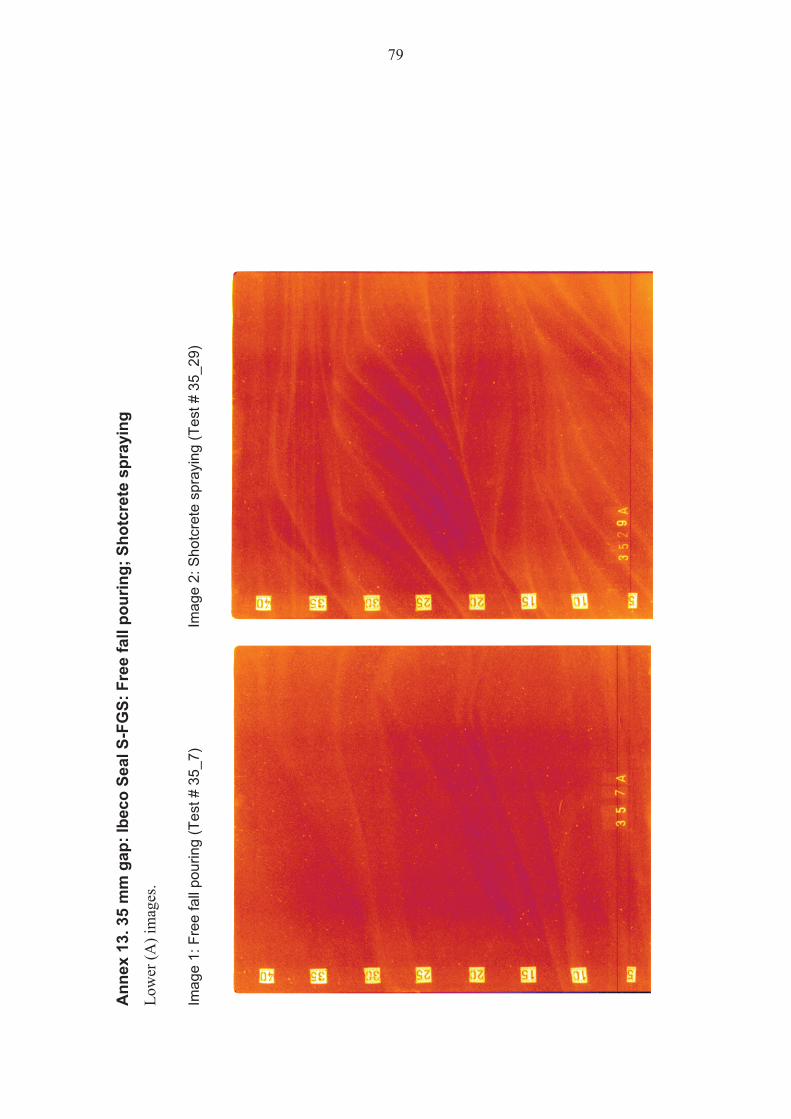
Ann
ex 1
3. 3
5 m
m g
ap: I
beco
Sea
l S-F
GS:
Fre
e fa
ll po
urin
g; S
hotc
rete
spr
ayin
g Lo
wer
(A) i
mag
es.
Imag
e 1:
Fre
e fa
ll po
urin
g (T
est #
35_
7)
Imag
e 2:
Sho
tcre
te s
pray
ing
(Tes
t # 3
5_29
)
79

Ann
ex 1
4. 3
5 m
m g
ap: C
ebog
el Q
SE P
elle
ts +
Ibec
o m
ixtu
re 6
5/35
: Fre
e fa
ll po
urin
g +
fork
vib
ratio
n Lo
wer
(A) a
nd U
pper
(B) i
mag
es.
Imag
e 1:
Fre
e fa
ll po
urin
g +
fork
vib
ratio
n (T
est #
35
_17)
A
Imag
e 2:
Fre
e fa
ll po
urin
g +
fork
vib
ratio
n (T
est #
35
_17)
B
80
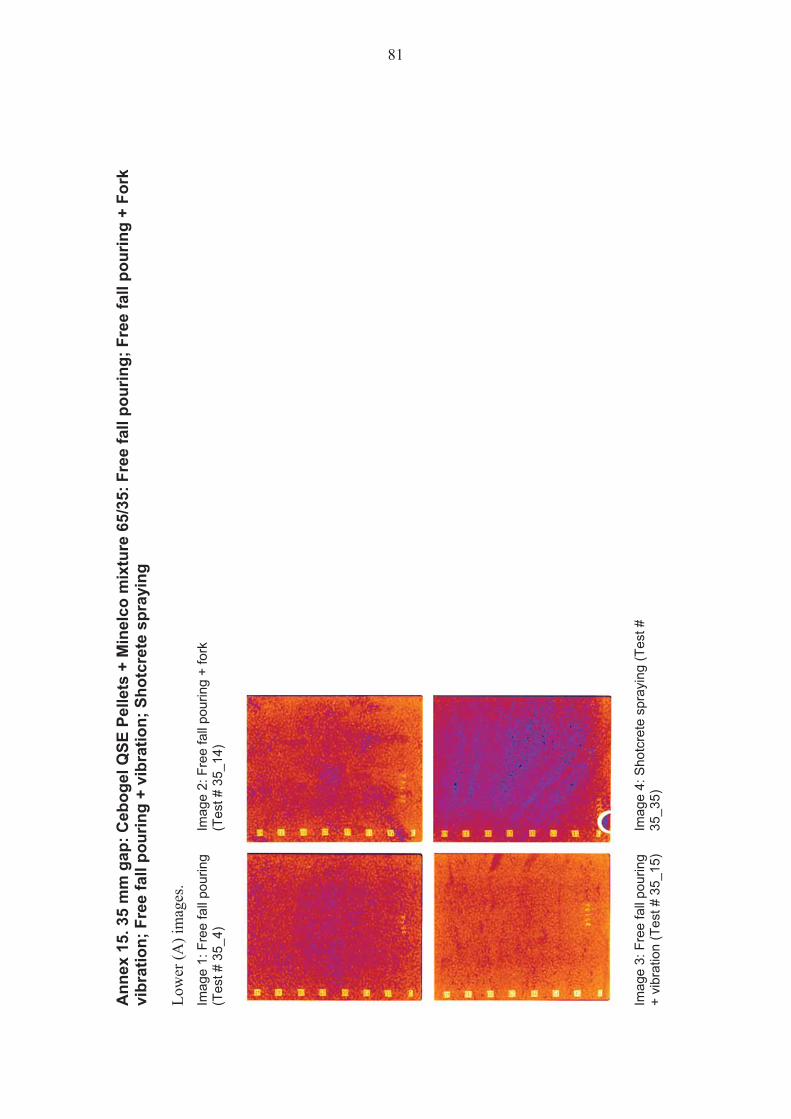
Ann
ex 1
5. 3
5 m
m g
ap: C
ebog
el Q
SE P
elle
ts +
Min
elco
mix
ture
65/
35: F
ree
fall
pour
ing;
Fre
e fa
ll po
urin
g +
Fork
vi
brat
ion;
Fre
e fa
ll po
urin
g +
vibr
atio
n; S
hotc
rete
spr
ayin
g Lo
wer
(A) i
mag
es.
Imag
e 1:
Fre
e fa
ll po
urin
g (T
est #
35_
4)
Imag
e 2:
Fre
e fa
ll po
urin
g +
fork
(T
est #
35_
14)
Imag
e 3:
Fre
e fa
ll po
urin
g +
vibr
atio
n (T
est #
35_
15)
Imag
e 4:
Sho
tcre
te s
pray
ing
(Tes
t #
35_3
5)
81
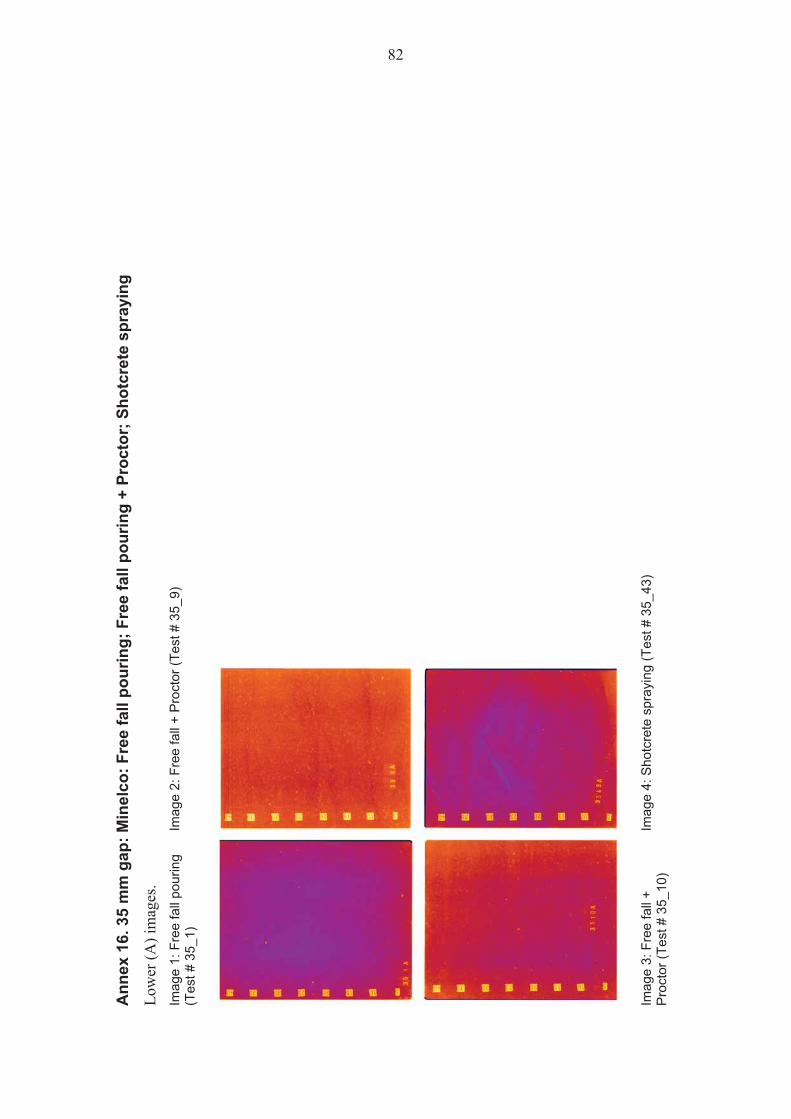
Ann
ex 1
6. 3
5 m
m g
ap: M
inel
co: F
ree
fall
pour
ing;
Fre
e fa
ll po
urin
g +
Proc
tor;
Sho
tcre
te s
pray
ing
Low
er (A
) im
ages
. Im
age
1: F
ree
fall
pour
ing
(Tes
t # 3
5_1)
Im
age
2: F
ree
fall
+ P
roct
or (T
est #
35_
9)
Imag
e 3:
Fre
e fa
ll +
Pro
ctor
(Tes
t # 3
5_10
) Im
age
4: S
hotc
rete
spr
ayin
g (T
est #
35_
43)
82
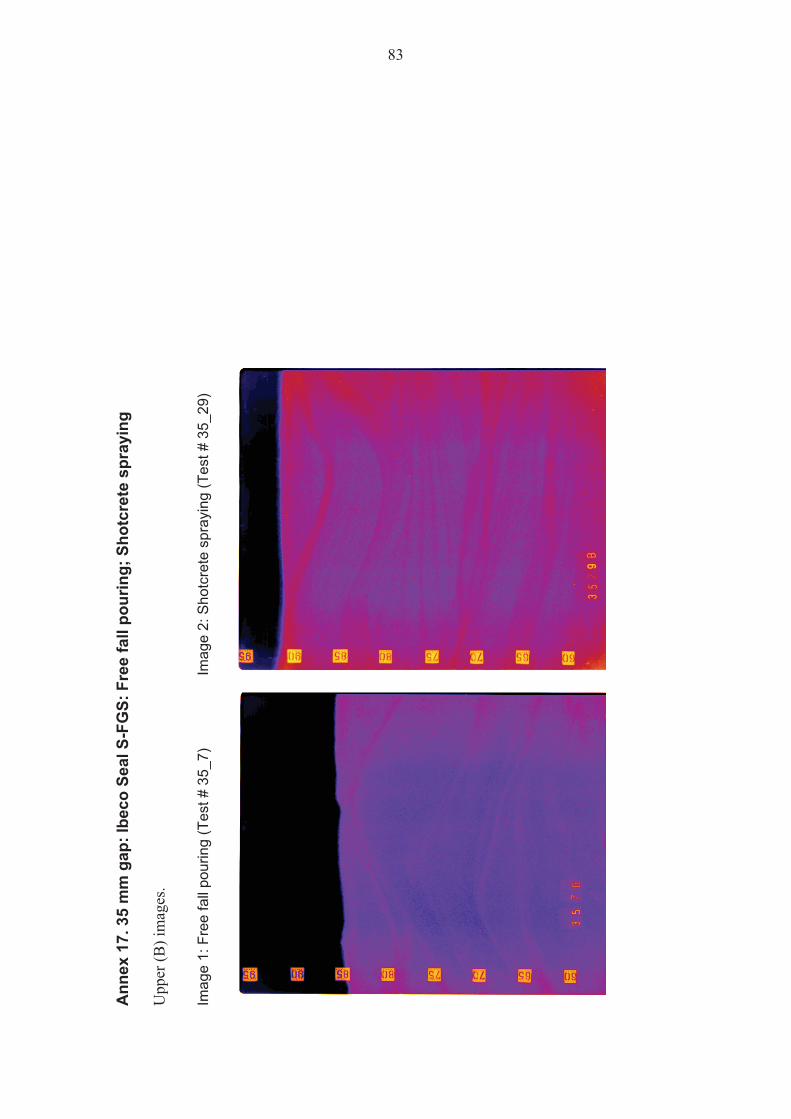
Ann
ex 1
7. 3
5 m
m g
ap: I
beco
Sea
l S-F
GS:
Fre
e fa
ll po
urin
g; S
hotc
rete
spr
ayin
g U
pper
(B) i
mag
es.
Imag
e 1:
Fre
e fa
ll po
urin
g (T
est #
35_
7)
Imag
e 2:
Sho
tcre
te s
pray
ing
(Tes
t # 3
5_29
)
83

Ann
ex 1
8. 3
5 m
m g
ap: C
ebog
el Q
SE P
elle
ts +
Min
elco
mix
ture
65/
35: F
ree
fall
pour
ing;
Fre
e fa
ll po
urin
g +
Fork
vi
brat
ion;
Fre
e fa
ll po
urin
g +
vibr
atio
n; S
hotc
rete
spr
ayin
g U
pper
(B) i
mag
es.
Imag
e 1:
Fre
e fa
ll po
urin
g (T
est #
35_
4)
Imag
e 2:
Fre
e fa
ll po
urin
g +
fork
(Tes
t # 3
5_14
)
Imag
e 3:
Free
fall
pou+
vibr
atio
n (T
est #
35
_15)
Imag
e 4:
Sho
tcre
te s
pray
ing
(Tes
t # 3
5_35
)
84
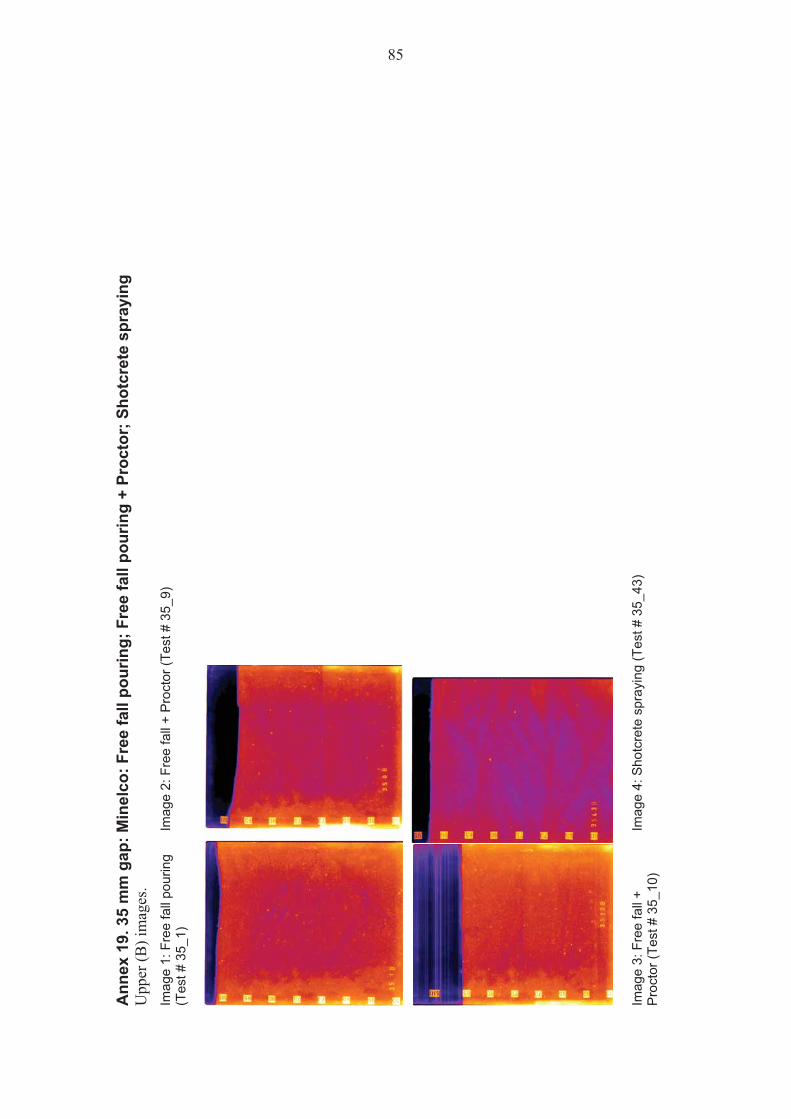
Ann
ex 1
9. 3
5 m
m g
ap: M
inel
co: F
ree
fall
pour
ing;
Fre
e fa
ll po
urin
g +
Proc
tor;
Sho
tcre
te s
pray
ing
Upp
er (B
) im
ages
. Im
age
1: F
ree
fall
pour
ing
(Tes
t # 3
5_1)
Im
age
2: F
ree
fall
+ P
roct
or (T
est #
35_
9)
Imag
e 3:
Fre
e fa
ll +
Pro
ctor
(Tes
t # 3
5_10
) Im
age
4: S
hotc
rete
spr
ayin
g (T
est #
35_
43)
85

86